Embed Size (px)
Citation preview
11th National Convention on Statistics (NCS) EDSA Shangri-La Hotel
October 4-5, 2010
MEASURING THE HAPPINESS OF THE FACULTY OF UNIVERSITY OF THE PHILIPPINES LOS BAÑOS USING A STATISTICAL INDEX
by
Zita C. Villa Juan-Albacea
For additional information, please contact:
Author’s name
Zita C. Villa Juan-Albacea
Designation Director Affiliation Institute of Statistics, University of the Philippines Address University of the Philippines, Los Baños, Laguna Tel. no. +049-5362381 E-mail [email protected]
MEASURING THE HAPPINESS OF THE FACULTY OF UNIVERSITY OF THE PHILIPPINES LOS BAÑOS USING A STATISTICAL INDEX
by
Zita C. Villa Juan – Albacea, PhD1
ABSTRACT This paper attempts to illustrate an application of statistical thinking in assessing a basic human emotion which is happiness. Based on the results of a survey conducted, a UPLB Faculty, at present, is a happy person. A UPLB Faculty finds happiness to be synonymous with constant devotion to God. The other meanings that were chosen to be synonymous with happiness include having good health within the family; excellence in work performance and positive self esteem. The Happiness Index of a UPLB Faculty is predicted by two factors, namely: harmonious relationship within the family, and knowledge and use of information technology. The former having higher contribution than the latter predictor. Thus, it was recommended that to keep the UPLB Faculty happy, a compensation package (monetary or otherwise) should be designed to promote harmonious relationship within the family. Likewise, the university should continue to challenge UPLB Faculty to be abreast with the latest in information technology to keep them happy.
I. Introduction
One of the important resources of the university is its people. A subgroup of this human resource is the faculty. Without the faculty, the university cannot perform its mandate to develop young minds. It is therefore crucial to maintain a significant number of core faculty members in order to attain the university’s aims and aspirations. Building a strong university means keeping a profile of high caliber faculty members. Unfortunately, at present the university is loosing its faculty. Many attributed this to financial reasons. But others say it is not always because of money that a faculty member would choose to stay in the university. The community itself is a good reason to stay.
Programs have to be formulated not only to attract people into the academe but there must also be programs to retain the faculty. It is crucial in human resource management to know more about the people who need to be managed as well as to be developed. Before programs can be formulated, the administration has to understand each component of the university. In particular, the administration must be able know the factors that affect human behavior in the university.
Social scientists in the emerging field of “happiness economics” claim that domestic
policy currently focuses heavily on economic outcomes, which are misleading on what the society values – the pursuit of happiness. The “national happiness” index lands the Philippines near in the middle, while it ranked 84th among 177 countries in the Human Development Index. Despite of the poverty rates and poverty indices such as falling performance in terms of education; distribution of basic services and inferior performance in terms of maternal and infant mortality, Filipinos are still considered as happy people.
With the belief that performance of administration will be judged on their success in
making people happy, and because of the limited information on what makes a person happy, many countries and researchers are now involved in studying “happiness.”
1 Professor, Institute of Statistics, College of Arts and Sciences, University of the Philippines Los Baños, College, Laguna
Page 1 of 13
As happiness index is quickly becoming a recognized barometer for measuring the health and well-being of a community, organization, or country, this paper will focus on the constructed happiness index among the faculty of the university. The main objective is to present the use of a statistical happiness index in an attempt to understand better the behavior of the UPLB Faculty. The university administration can use the happiness index to better understand and consequently manage more efficiently this human resource of the university. The index can be used as a guide in formulating programs and policies concerning the faculty. Other universities can also follow suit to establish a way to better understand their faculty members. This paper aims to present an objective measure of the degree of happiness using statistical index. Specifically, the paper aims to:
1. give a measure of the degree of happiness of UPLB Faculty, 2. use the measure in describing the profile of UPLB Faculty, and 3. discuss the use of the measure in policy recommendations regarding issues
concerning UPLB Faculty like tenure and promotion. II. Happiness Statistical Index
An index number is a measure of the magnitude of a variable at one point relative to its value at another point. Its initial application is in the field of economics measuring the value of a price relative to the price at a different point in time. The index number problem arises when the magnitude of the variable under consideration is non-observable. The variable of interest is measured through other indicators that are said to be measurable.
The statistical theory of index numbers deals with the functional form, or aggregation function which is commonly referred to as the choice of formula problem. It also deals with related practical estimation problems, such as the classification, collection and matching of data, and the compilation and dissemination of the indexes.
Careful selection of the number and types of items to be used is necessary so that the index fluctuations will be truly representative of the fluctuations in the series. The sample used should be representative. After determination of the proper method of data collection it is necessary to find the available sources of the data needed. After this, what follows is the necessity of actually collecting the data.
A sufficient number of items should be used. The degree of relative importance of each constituent item to the purpose of the index must be determined. The designation of the relative importance of each item is known as weighting.
The index number is a statistical device for measuring changes in groups of data. Index construction may be applied to many general conditions such as employment, prices, group health, academic grades, and even the feeling of happiness. Data descriptive of these general conditions fluctuate widely; but such data exhibit nevertheless, definite and measurable general tendencies.
In order to measure the changes in the large number of constantly varying items in the data it is necessary to resort to some relative averaging device that will serve as a yardstick for comparative measurement. The index number is such a device.
The index number measures fluctuations during intervals of time, group differences of geographical position or degree. Thus, it is possible to obtain an index number showing
Page 2 of 13
the relative sales possibilities for a given product in different territories; the academic standing of a group of college students as compared with other groups of students; or to ascertain the relative credit position of a single corporation as compared with many others in the same industry.
The purpose for which the index is used has a definite bearing upon different factors like the choice of the data and the method followed for its construction. Indices are considered useful tools in development planning and policy development because they provide a yardstick for determining the extent of certain social challenges. Thus, the index makes it possible to measure the progress of a particular development strategy or program or policy.
Bhutan’s Gross National Happiness Index (GNHI) started in 1972 as a strategy of development by the King of Bhutan. This index is said to be more important to GNP or GDP of a country since the index intends to measure the (1) promotion of equitable and sustainable socio-economic development; (2) preservation and promotion of cultural values; (3) conservation of natural resources; and (4) establishment of good governance (The Centre of Bhutan Studies, 2006) In Thailand, a personal well-being index was developed commonly referred to as Thai PWI. This index identified “spirituality and religion” as the domain with the highest average score, followed by “standard of living”, “future security”, and “achievement in life”. The Thai PWI was used by policy makers to understand better the subjective well-being of different sub-populations as Thailand is at the transition stage of their political and economic condition (Yiengprugsawan et al., 2009). Another study in Thailand showed that people working at the academe had medium level of happiness. The factors that are said to be associated with their happiness includes, age, income, work experience, family relation, policy and administration, work characteristics, relationship at the workplace, belief and recognition, profession progress, morale, environment at workplace and welfare. However, in predicting happiness at the workplace only the factors: work characteristics, belief and recognition, relationship at the workplace, family relation, and environment at workplace serve as predictors (Malee, et al., 2008) In Peking University a study found that the happiness of Chinese people are associated with good psychological and physical health, harmonious family and stable marriage. Also, good housing condition, social security system and satisfactory work have positive association with their happiness. As an effect, happy people have good sleeping quality (People’s Daily Online, 2006). The University of Western Australia conducted a study on happiness among its students. The results indicated that school work, time management and relationships formed in university were the most important factors that influenced the happiness level of the student (Chan, et al., 2004) The Philippine Gross National Happiness Index (PGNHI), developed by the National Statistical Coordination Board in 2006, is a composite measure of society’s progress using data from national accounts and results of a happiness survey. Based on a non-probability sample of respondents, the most important domains of happiness are family, health and religion. The domain of politics is considered the least important to happiness. The respondents considered love as an important dimension of happiness and so with income but they said that the happiness derived from income is very low. On the other hand, the respondents also finds sex life as not important dimension of happiness but the happiness derived from it is very high. (Virola and Encarnation, 2007)
Page 3 of 13
Ramirez (2008) constructed a happiness index among UPLB undergraduate
students. The 5 factors which were perceived by the students as most synonymous to happiness are : (1) constant devotion to God’s or to one’s faith, (2) harmonious relationship in the family, (3) good health within one’s family, (4) positive self esteem and (5) a tie among high income and financial security, harmonious relationship with friends in the university, and excellent student performance. The constructed happiness index is a function of excellent academic performance, constant devotion to God or to one’s faith and harmonious relationship in the family. Based on this constructed index, UPLB undergraduate students are generally happy.
Petrache (2010) conducted a study to measure happiness of UPLB administrative staff. Using similar procedure of Ramirez (2008), the study found that time management, dedication to God, and high salary and financial security are the factors associated with degree of happiness of administrative staff. It was also concluded that UPLB administrative personnel have high level of happiness. The statistical techniques involved in index construction and applied in the development of a happiness index was studied by Ramirez in 2008 as her master’s thesis. As application, the methodology was used to construct the happiness index of UPLB students. Such methodology in Ramirez’ study was adopted and further refined in this paper. The refined methodology is described below.
In the construction of a happiness index, characteristics of a random sample of the target population have to be measured. Using the random sample of observations the general description of the population as well as their views on happiness can be inferred.
A statistical technique known as principal component analysis (PCA) is used to
reduce the dimensionality of the variables observed in data collection process. These variables were identified using the indicators that were presumed to be related to students’ happiness. There are methods that extends principal components analysis to the situation where the variables are measured in a mixture of scale levels like the categorical principal component analysis or the CATPCA. Thus, if the variables that were identified to measure happiness are of this type (mixture of scale levels) then CATPCA is more appropriate to use.
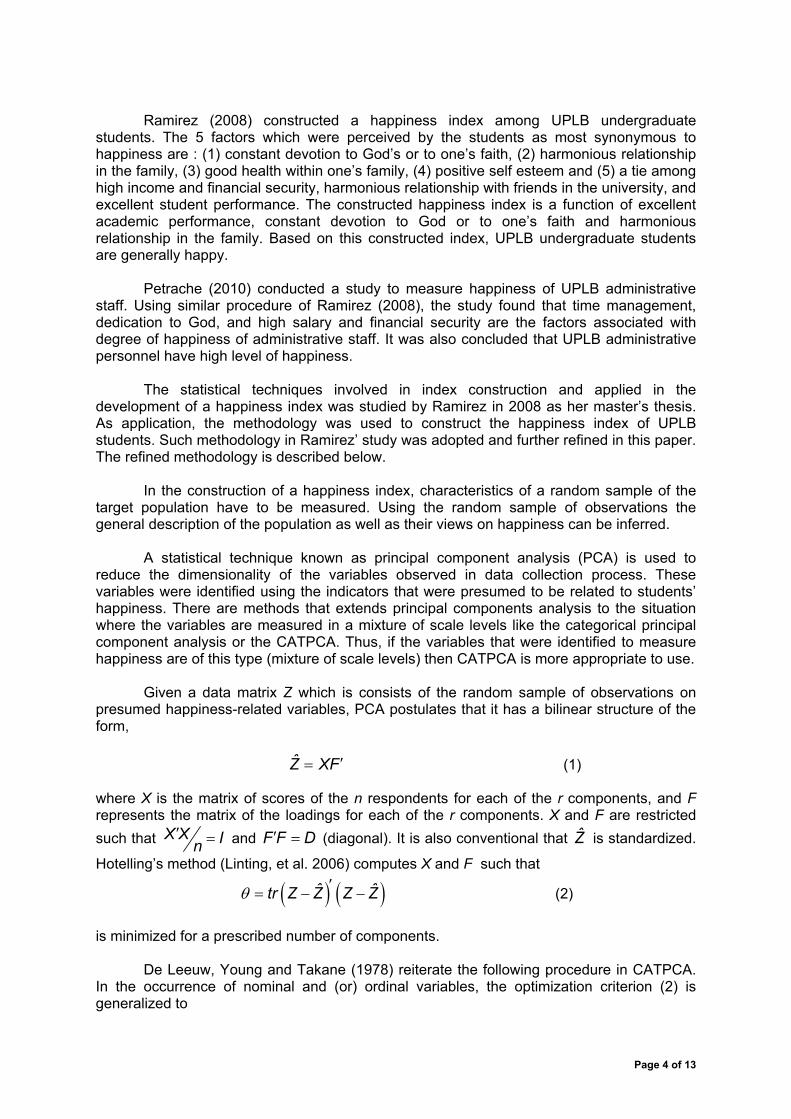
Given a data matrix Z which is consists of the random sample of observations on
presumed happiness-related variables, PCA postulates that it has a bilinear structure of the form,
Z XF ′= (1)
where X is the matrix of scores of the n respondents for each of the r components, and F represents the matrix of the loadings for each of the r components. X and F are restricted such that X X In
′ = and F F (diagonal). It is also conventional that Z is standardized.
Hotelling’s method (Linting, et al. 2006) computes X and F such that
D′ = ˆ
( ) ( )ˆ ˆtr Z Z Z Zθ ′= − − (2)
is minimized for a prescribed number of components.
De Leeuw, Young and Takane (1978) reiterate the following procedure in CATPCA. In the occurrence of nominal and (or) ordinal variables, the optimization criterion (2) is generalized to
Page 4 of 13
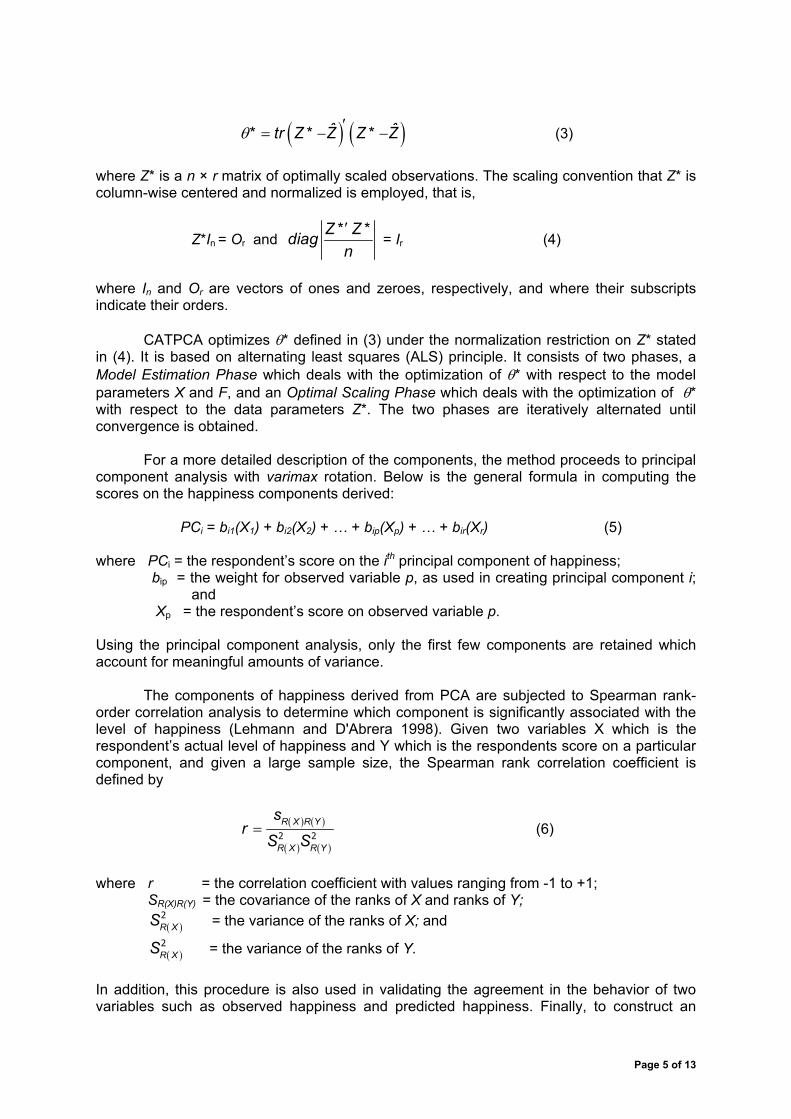
( ) (ˆ ˆ* tr Z * Z Z * Zθ ′= − − ) (3)
where Z* is a n × r matrix of optimally scaled observations. The scaling convention that Z* is column-wise centered and normalized is employed, that is,
Z*In = Or and Z * Z *diag
n′
= Ir (4)
where In and Or are vectors of ones and zeroes, respectively, and where their subscripts indicate their orders.
CATPCA optimizes θ* defined in (3) under the normalization restriction on Z* stated
in (4). It is based on alternating least squares (ALS) principle. It consists of two phases, a Model Estimation Phase which deals with the optimization of θ* with respect to the model parameters X and F, and an Optimal Scaling Phase which deals with the optimization of θ* with respect to the data parameters Z*. The two phases are iteratively alternated until convergence is obtained.
For a more detailed description of the components, the method proceeds to principal
component analysis with varimax rotation. Below is the general formula in computing the scores on the happiness components derived:
PCi = bi1(X1) + bi2(X2) + … + bip(Xp) + … + bir(Xr) (5)
where PCi = the respondent’s score on the ith principal component of happiness;
bip = the weight for observed variable p, as used in creating principal component i; and
Xp = the respondent’s score on observed variable p.
Using the principal component analysis, only the first few components are retained which account for meaningful amounts of variance.
The components of happiness derived from PCA are subjected to Spearman rank-
order correlation analysis to determine which component is significantly associated with the level of happiness (Lehmann and D'Abrera 1998). Given two variables X which is the respondent’s actual level of happiness and Y which is the respondents score on a particular component, and given a large sample size, the Spearman rank correlation coefficient is defined by
( ) ( )
( ) ( )
R X R Y
R X R Y
sr
S S= 2 2 (6)
where r = the correlation coefficient with values ranging from -1 to +1; SR(X)R(Y) = the covariance of the ranks of X and ranks of Y;
2 S = the variance of the ranks of X; and (R X )
S = the variance of the ranks of Y. (R X2
)
In addition, this procedure is also used in validating the agreement in the behavior of two variables such as observed happiness and predicted happiness. Finally, to construct an
Page 5 of 13
index of happiness, the components derived from PCA with varimax rotation are then used as predictors of happiness in the regression analysis. The multiple regression equation takes the form:
Y = b0 + b1X1 + b2X2 + … + brXr (7)
The bi’s are the regression coefficients, representing the change in the happiness level (Y) when the corresponding happiness component changes by 1 unit. The b0 is the constant, representing the level of happiness (Y) will be when all of the component scores (Xi’s) are zero. Cross tabulation of the observed and predicted are constructed to evaluate the agreement between the two. In addition, sensitivity and specificity of the index were also assessed. Sensitivity is a measure of the probability of correctly identifying a happy person while specificity is a measure of the probability of correctly identifying an unhappy person.
III. Application of the Measure as in the Case of UPLB Faculty
A. The Sampled Respondents of the Study
A simple random sample of faculty members was drawn from the list of UPLB Faculty as of February, 2010. This list was obtained from the Human Resource Development Office which is under the Office of the Vice-Chancellor of Administration of UPLB. From the sampled faculty members, information on their definition of happiness, their assessment of happiness-related variables and some of their demographic information were gathered through self-administered questionnaire.
The questionnaire is divided into two parts. The first part dealt on the demographic information and the second part obtained information on happiness. A total of 75 items variables that are related to measure of happiness were included in the questionnaire.
The sampled respondents came from the eight colleges of the university with 51% coming from College of Arts and Sciences (CAS), the biggest college in terms of faculty and student population. Likewise, each academic rank was represented among the sampled respondents with instructors taking the biggest percentage of 44%. Fifty-three percent of the respondents have already experienced to be promoted. It was also noted that each gender was equally represented in the sample while majority of them (59%) are still single. The range of age of the sampled respondents is from 22 to 64 years old. Sixty-six percent of the sampled respondents are not household head and almost the same percentage (61%) does not have a child. Almost 66% of the sampled respondents have annual gross family income at of least PhP250,000. Most of the sampled respondents (67%) belong to households with total number of household members in between 3 and 6. More than 60% of the sampled households owned a residential land, or a house, or a vehicle but only a few of them owned a condominium unit or a farm land other than a residential land. B. Describing the Degree of Happiness of UPLB Faculty
In the study, happiness is defined as a state or emotion or feelings of contentment or satisfaction. This definition is imparted to the respondents through the questionnaire and with this definition, the respondents were asked to rate their degree of happiness that they feel at two different times, labeled as first and second happiness ratings which corresponds to the ratings before and after they give their level of agreement to several statements to determine their feelings on certain issues. The lowest rating is 1 which indicates that the
Page 6 of 13
respondent is very unhappy while 10 as the highest rating indicate that the respondent is very happy.
The reported first and second happiness ratings indicate that none of the UPLB
Faculty are said to be unhappy while the rest have ratings of at least 5 or can be said to be happy. Also, there is no significant difference between the first and second ratings which indicate that their assessment of the statements about certain issues did not make them change significantly their degree of happiness. With this result the first happiness rating was used in the succeeding discussions.
Using the first rating in happiness, only 11% of UPLB Faculty are neutral or gave a
score of 5 or 6 as their degree of happiness. The rest gave a score of at least 7 which indicates that 89% of UPLB Faculty are happy. The distribution of ratings for the degree of happiness is the same across the different colleges, academic rank, whether they have been promoted or not, age groups, employment status, gender, whether they have a child or not, annual gross family income, and number of household members. Observed significant associations were observed between the ratings and civil status of the faculty, and between ratings and whether the faculty is a household head or not. Single faculty member tend to be less happy compared to married faculty member while being a household head makes the faculty member less happy.
Based on the estimated percentage of almost 100%, the UPLB Faculty thinks that
the source of their happiness is of their own-doing while for the source of unhappiness only 56% thinks that it is of their of own-doing. Thirty-two percent thinks that other people are the source of their unhappiness while the rest thinks that both (themselves and others) is a source of their unhappiness.
On the most synonymous with happiness, an estimated 37% of UPLB Faculty thinks
that constant devotion to God ranks as the most synonymous with happiness. As for second and third ranks, it is having good health within the family. Excellence in work performance was mostly ranked 4th while positive self esteem ranked 5th. The factor that is commonly chosen to be included in the top five to be synonymous with happiness is harmonious relationship within the family. This factor was second to constant devotion to God which is chosen by many to be the most synonymous with happiness.
Based on the ratings given by the sampled respondents, the UPLB Faculty are
mostly with positive self esteem. However, some usually feel the need to beat deadlines and also get frustrated. A UPLB Faculty feels that he/she has a good time management A UPLB Faculty also thinks that they are presently residing in a peaceful community but feels the need to transfer in the near future. In terms of community activities, a UPLB Faculty is not usually actively involved. A UPLB Faculty knows and uses gadgets in information technology.
In terms of the family condition of a UPLB Faculty, most of them are in good health
condition and are experiencing harmonious relationship within the family. A UPLB Faculty also needs the support of friends in the university. Although, a UPLB Faculty believes that happiness is synonymous with constant devotion to God, he/she does not involve so much in religious activities and does not study regularly religious teachings. Maybe, it is because the university is non-sectarian as well as it does not discriminate anyone due to his/her religious beliefs.
Recognition in work performance of a UPLB Faculty is usually received in the
university but not outside the university and a UPLB Faculty feels that he/she is performing excellently in his/her work. A UPLB Faculty is in doubt whether his/her income is more than sufficient to his/her needs but he/she agrees that the income he/she receives from the
Page 7 of 13
university is sufficient to meet his/her basic needs. Although, most do not agree that their income can buy everything they wanted.
A UPLB feels that there is a high standard of teaching at the university and that the
campus is clean and beautiful. This makes the faculty member loves his/her work in the university. But the faculty feels that the university facilities are not sufficient and also, he/she doubts if there is enabling environment to do research in the university. Most UPLB Faculty feel safe inside the campus as they believe that there is peace and order inside the campus but they doubt if peace and order is present in the country.
Doing graduate studies and conducting research to gain more knowledge are some
of their reasons why they work in the university. Most UPLB Faculty believe that they do not know everything so they continue to learn while teaching in the university. In terms of the country’s situation, most UPLB Faculty do not agree that the country has good economic condition, high employment rate, high literacy rate and low poverty incidence. In other words, a UPLB Faculty is not happy about the situation in the country.
Out of the 75 items considered in the study, there were only 20 considered in the
construction of the index. These 20 components have satisfied the criteria set by the procedure and has accounted for 86% of the variability in the data set. Further scrutiny of the factor loadings of each of the 20 components lead to consider only 12 and these were given descriptive names.
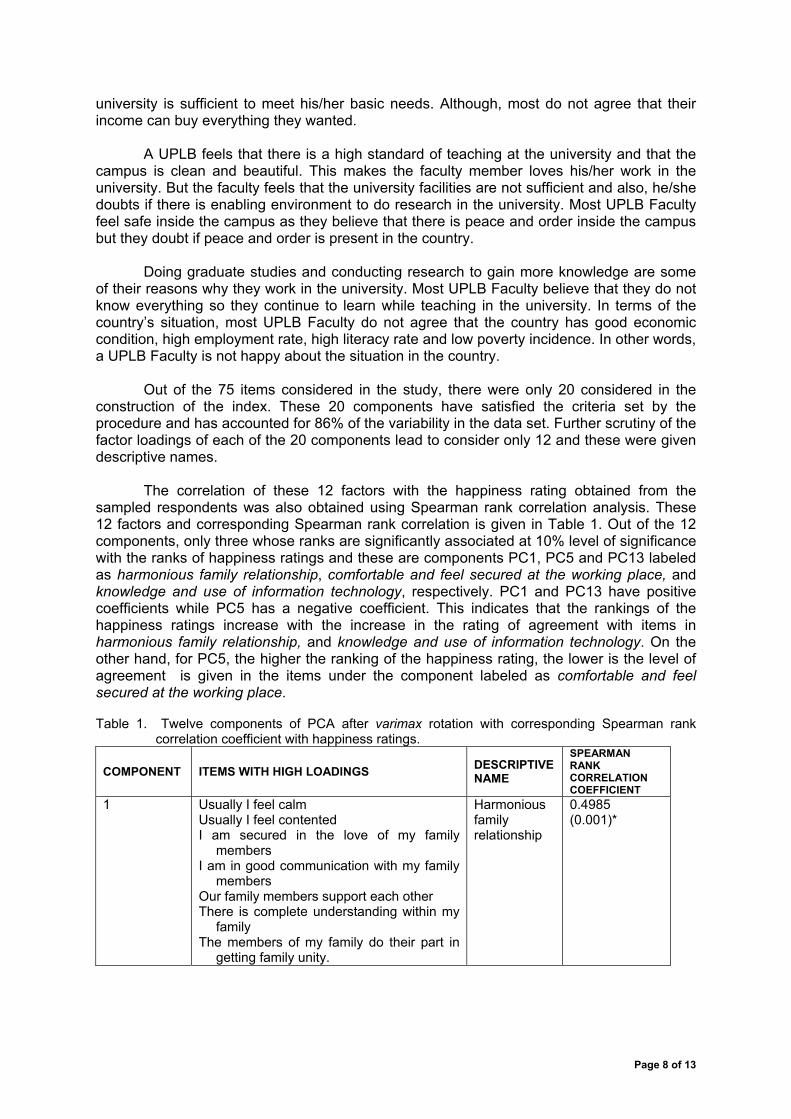
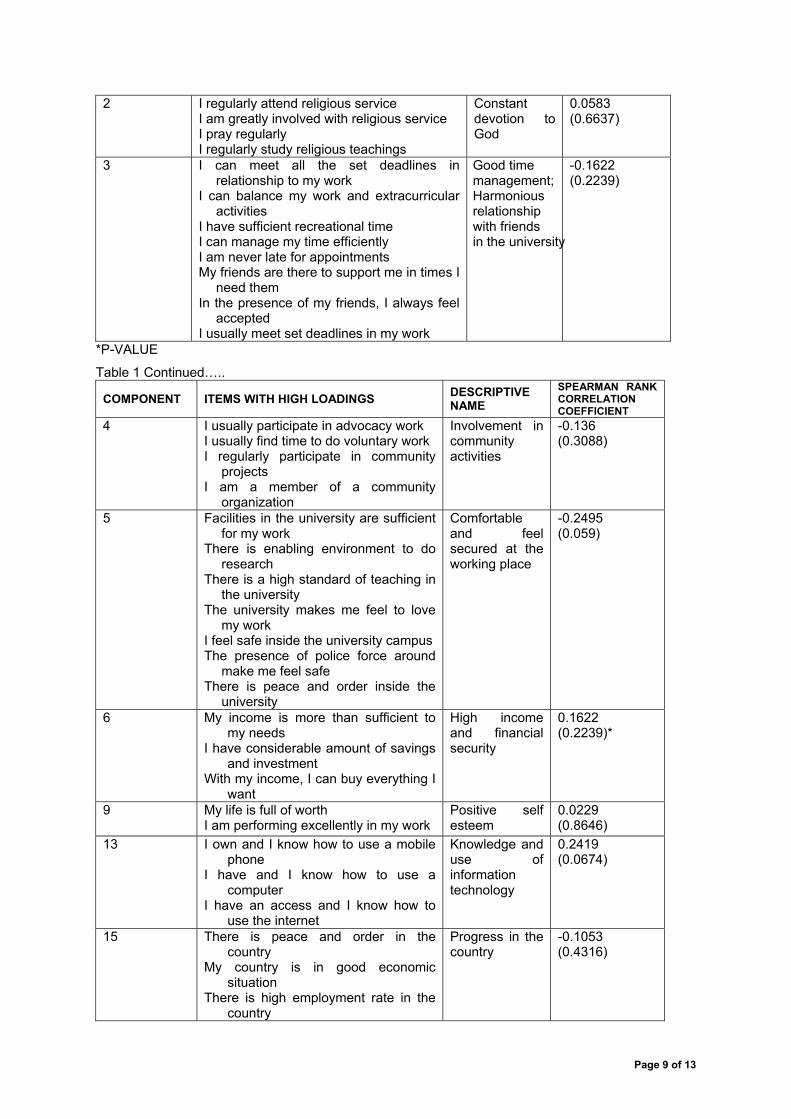
The correlation of these 12 factors with the happiness rating obtained from the
sampled respondents was also obtained using Spearman rank correlation analysis. These 12 factors and corresponding Spearman rank correlation is given in Table 1. Out of the 12 components, only three whose ranks are significantly associated at 10% level of significance with the ranks of happiness ratings and these are components PC1, PC5 and PC13 labeled as harmonious family relationship, comfortable and feel secured at the working place, and knowledge and use of information technology, respectively. PC1 and PC13 have positive coefficients while PC5 has a negative coefficient. This indicates that the rankings of the happiness ratings increase with the increase in the rating of agreement with items in harmonious family relationship, and knowledge and use of information technology. On the other hand, for PC5, the higher the ranking of the happiness rating, the lower is the level of agreement is given in the items under the component labeled as comfortable and feel secured at the working place.
Table 1. Twelve components of PCA after varimax rotation with corresponding Spearman rank
correlation coefficient with happiness ratings.
COMPONENT ITEMS WITH HIGH LOADINGS DESCRIPTIVE NAME
SPEARMAN RANK CORRELATION COEFFICIENT
1 Usually I feel calm Usually I feel contented I am secured in the love of my family
members I am in good communication with my family
members Our family members support each other There is complete understanding within my
family The members of my family do their part in
getting family unity.
Harmonious family relationship
0.4985 (0.001)*
Page 8 of 13
2 I regularly attend religious service I am greatly involved with religious service I pray regularly I regularly study religious teachings
Constant devotion to God
0.0583 (0.6637)
3 I can meet all the set deadlines in relationship to my work
I can balance my work and extracurricular activities
I have sufficient recreational time I can manage my time efficiently I am never late for appointments My friends are there to support me in times I
need them In the presence of my friends, I always feel
accepted I usually meet set deadlines in my work
Good time management; Harmonious relationship with friends in the university
-0.1622 (0.2239)
*P-VALUE
Table 1 Continued…..
COMPONENT ITEMS WITH HIGH LOADINGS DESCRIPTIVE NAME
SPEARMAN RANK CORRELATION COEFFICIENT
4 I usually participate in advocacy work I usually find time to do voluntary work I regularly participate in community
projects I am a member of a community
organization
Involvement in community activities
-0.136 (0.3088)
5
Facilities in the university are sufficient for my work
There is enabling environment to do research
There is a high standard of teaching in the university
The university makes me feel to love my work
I feel safe inside the university campus The presence of police force around
make me feel safe There is peace and order inside the
university
Comfortable and feel secured at the working place
-0.2495 (0.059)
6 My income is more than sufficient to my needs
I have considerable amount of savings and investment
With my income, I can buy everything I want
High income and financial security
0.1622 (0.2239)*
9 My life is full of worth I am performing excellently in my work
Positive self esteem
0.0229 (0.8646)
13
I own and I know how to use a mobile phone
I have and I know how to use a computer
I have an access and I know how to use the internet
Knowledge and use of information technology
0.2419 (0.0674)
15
There is peace and order in the country
My country is in good economic situation
There is high employment rate in the country
Progress in the country
-0.1053 (0.4316)
Page 9 of 13
There is high literacy rate in the country
17 At present no member in my family is smoker
At present no member in my family is alcoholic
Vices of family members
0.1235 (0.3555)
18 I love my physical appearance Physical appearance
0.1155 (0.3879)
19 The place where I reside is clean and beautiful
I have good relationship with the community where I reside
I am comfortable in the community where I reside
Comfortable place of residence
0.0391 (0.7710)
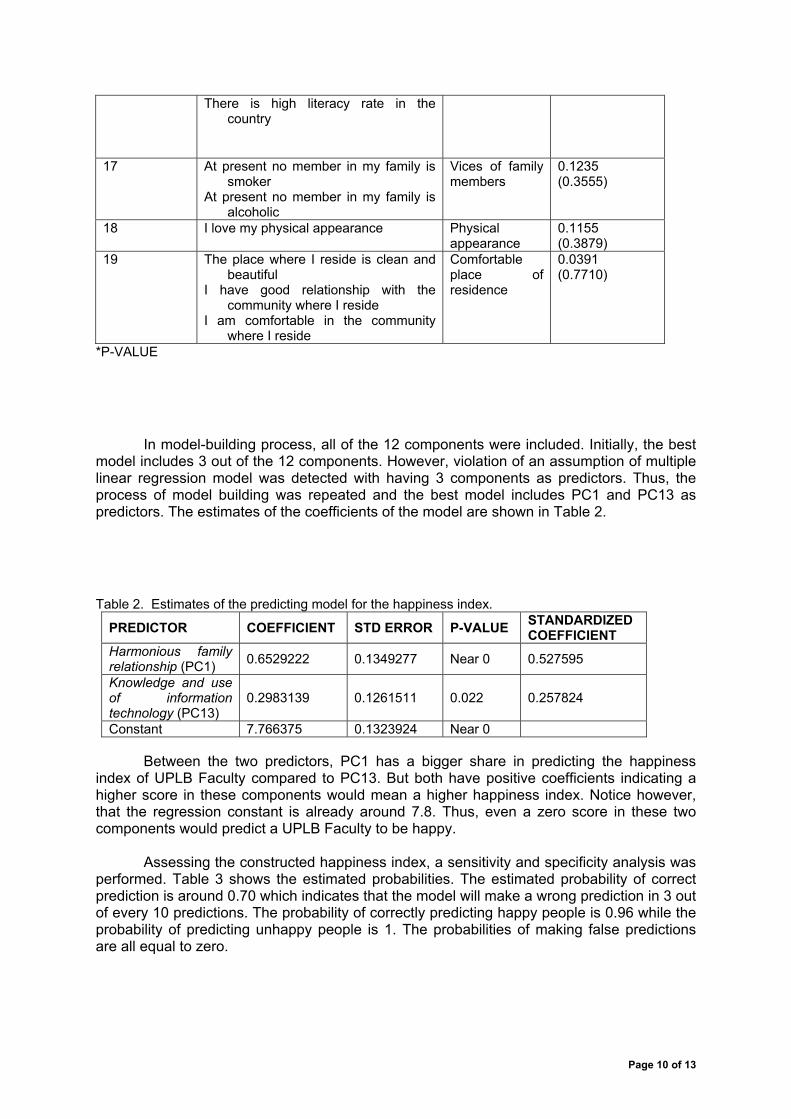
*P-VALUE
In model-building process, all of the 12 components were included. Initially, the best model includes 3 out of the 12 components. However, violation of an assumption of multiple linear regression model was detected with having 3 components as predictors. Thus, the process of model building was repeated and the best model includes PC1 and PC13 as predictors. The estimates of the coefficients of the model are shown in Table 2. Table 2. Estimates of the predicting model for the happiness index.
PREDICTOR COEFFICIENT STD ERROR P-VALUE STANDARDIZED COEFFICIENT
Harmonious family relationship (PC1) 0.6529222 0.1349277 Near 0 0.527595
Knowledge and use of information technology (PC13)
0.2983139 0.1261511 0.022 0.257824
Constant 7.766375 0.1323924 Near 0
Between the two predictors, PC1 has a bigger share in predicting the happiness index of UPLB Faculty compared to PC13. But both have positive coefficients indicating a higher score in these components would mean a higher happiness index. Notice however, that the regression constant is already around 7.8. Thus, even a zero score in these two components would predict a UPLB Faculty to be happy. Assessing the constructed happiness index, a sensitivity and specificity analysis was performed. Table 3 shows the estimated probabilities. The estimated probability of correct prediction is around 0.70 which indicates that the model will make a wrong prediction in 3 out of every 10 predictions. The probability of correctly predicting happy people is 0.96 while the probability of predicting unhappy people is 1. The probabilities of making false predictions are all equal to zero.
Page 10 of 13
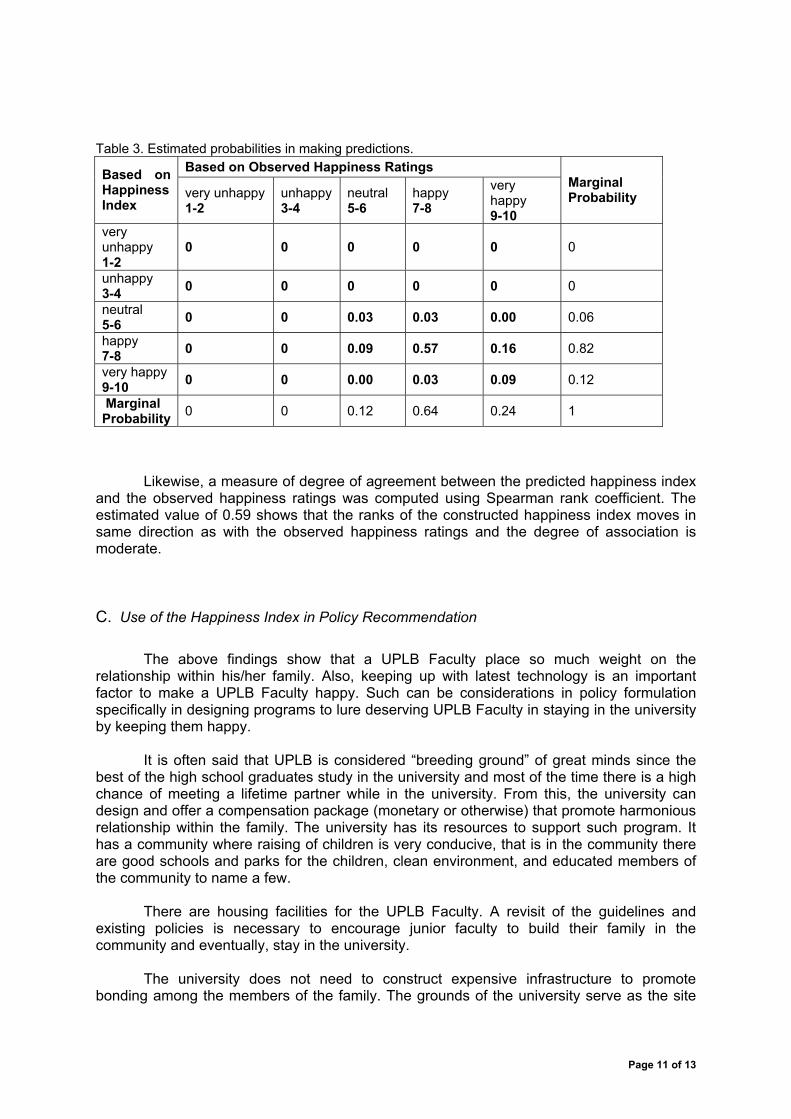
Table 3. Estimated probabilities in making predictions. Based on Observed Happiness Ratings Based on
Happiness Index
very unhappy 1-2
unhappy 3-4
neutral 5-6
happy 7-8
very happy 9-10
Marginal Probability
very unhappy 1-2
0 0 0 0 0 0
unhappy 3-4 0 0 0 0 0 0
neutral 5-6 0 0 0.03 0.03 0.00 0.06
happy 7-8 0 0 0.09 0.57 0.16 0.82
very happy 9-10 0 0 0.00 0.03 0.09 0.12
Marginal Probability 0 0 0.12 0.64 0.24 1
Likewise, a measure of degree of agreement between the predicted happiness index and the observed happiness ratings was computed using Spearman rank coefficient. The estimated value of 0.59 shows that the ranks of the constructed happiness index moves in same direction as with the observed happiness ratings and the degree of association is moderate.
C. Use of the Happiness Index in Policy Recommendation
The above findings show that a UPLB Faculty place so much weight on the
relationship within his/her family. Also, keeping up with latest technology is an important factor to make a UPLB Faculty happy. Such can be considerations in policy formulation specifically in designing programs to lure deserving UPLB Faculty in staying in the university by keeping them happy.
It is often said that UPLB is considered “breeding ground” of great minds since the
best of the high school graduates study in the university and most of the time there is a high chance of meeting a lifetime partner while in the university. From this, the university can design and offer a compensation package (monetary or otherwise) that promote harmonious relationship within the family. The university has its resources to support such program. It has a community where raising of children is very conducive, that is in the community there are good schools and parks for the children, clean environment, and educated members of the community to name a few.
There are housing facilities for the UPLB Faculty. A revisit of the guidelines and
existing policies is necessary to encourage junior faculty to build their family in the community and eventually, stay in the university.
The university does not need to construct expensive infrastructure to promote
bonding among the members of the family. The grounds of the university serve as the site
Page 11 of 13
where family members can do activities together during weekends and it is for free. These activities can build a harmonious relationship within the family
The tuition fee discount for the dependents of UP employees are already in place
and this lessens the stress to head of the family to think of ways to support the education of their children.
What might be lacking in the package is for the health of the family. The health
condition of the family is also a key factor in keeping a faculty member happy. Although it can be said that PhilHeath is already existing, but it is not enough to keep the harmonious relationship within a family and thus, there is a need to do something on this to make a UPLB Faculty happy.
The university should also keep the UPLB Faculty at its toes when it comes to latest in the information technology. Keeping them abreast with the latest technology makes them happy. Hence, the university should always challenge the UPLB Faculty to improve their style of teaching by using latest technology. An example is using multi-media to perfect the teaching in large class environment can be considered as one of the challenges that will keep them happy.
IV. Lessons Learned This paper is an illustration of an application of statistical thinking in assessing a basic human emotion which is happiness. The following are the significant findings of this study:
• At present, a UPLB Faculty can be described to be a happy person. • A UPLB Faculty finds happiness to be synonymous with constant devotion to God.
The other meanings that were chosen to be synonymous with happiness include having good health within the family; excellence in work performance and positive self esteem
• The Happiness Index of a UPLB Faculty is predicted by two factors, namely: harmonious relationship within the family, and knowledge and use of information technology. The former having higher contribution than the latter.
• To keep the UPLB Faculty happy, a compensation package (monetary or otherwise)
should be designed to promote harmonious relationship within the family. Likewise, the university should continue to challenge UPLB Faculty to be abreast with the latest in information technology to keep them happy.
Although the findings of this study have already made significant contributions in different field of studies, there is still need to further explore the possibilities of explaining further human behavior through the use of different statistical techniques.
Page 12 of 13
IV. Literature Cited Albacea, ZVJ 2010 Measuring the Degree of Happiness of UPLB Faculty Using a Statistical
Index, 2010 UPLB Faculty, Students and Staff Professorial Chair Lecture Chan G. and P.W. Miller 2004 Happiness in University Education, Economics
Discussion/Working Papers -4-11 Department of Economics, University of Western Australia
De Leeuw, J.F. Young and Y. Takane. 1978. The Principal Components of Mixed
Measurement Level Multivariate Date: An Alternating Least Squares Method with Optimal Scaling Features. Psychometrika. Vol. 43, No. 2.
Centre of Bhutan Studies 2006 Explanation of Gross National Happiness Index. http://www.
grossnationalhappiness.com Lehmann, E. and H. D'abrera 1998. Nonparametrics: Statistical Methods Based on Ranks,
Rev. Ed. Englewood Cliffs, NJ: Prentice-Hall, pp. 292, 300, and 323. Linting, M., J. Meulman, P. Groenen and A. Van Der Kooij 2006 Nonlinear Principal
Components Analysis: Introduction and Application. Manuscript submitted for publication.
Malee, G., T. Arnanong and P. Apinya 2008 Factors Influencing Happiness in Personnel
Working at Boromarajonani College of Nursing, Bangkok, Thailand, Department of Psychiatric Nursing, Department of Basic Concept Nursing, Bangkok, Thailand
People’s Daily Online 2006 Survey: Top 3 Factors to Happiness Petrache, QFS 2010 “Formulation of Happiness Index Among UPLB Administrative
Personnel”, Unpublished Special Problem, Institute of Statistics, University of the Philippines Los Baños
Ramirez, G.M. 2008. “Construction of Happiness Index Among UPLB Undergraduate
Students”, Unpublished Master’s Thesis, Institute of Statistics, University of the Philippines Los Baños
Virola, R. and J.O. Encarnacion 2007. Measuring Progress of Philippine Society: Gross
National Product or Gross National Happiness? Paper presented during the 10th National Convention on Statistics. National Statistics Coordination Board. Philippines.
Yiengprugsawan, S. Seubsman, S. Khaman, L. Lim and A.C. Sleigh 2009 Personal Well-
being Index in a National Cohort of 87,134 Thai Adults, National Centre for Epidemiology and Population Health, College of Medicine, Biology and Environment, The National University, Canberra, Australia
V. Acknowledgement
The author would like to thank the UPLB Administration for the 2010 UPLB Faculty, Students and Staff Professorial Chair Award which made the feasibility of this study. Of course, the survey will not become a reality if the UPLB Faculty did not cooperate. Hence, the author is very much thankful for their support and cooperation in this undertaking. Lastly, the author would like to thank her INSTAT family for their unending support.
Page 13 of 13