Embed Size (px)
Citation preview

Measuring the Deterioration of Trust on the Dark Web:
Evidence from Operation Bayonet
Scott Lee Chua∗a
aYale-NUS College, Singapore
June 10, 2021
How can we measure trust on illicit darknet market websites? Borrowing from the indus-
trial organization literature, I propose a new empirical strategy that uses vendors’ return
on reputation as a proxy for trust. I use this strategy to quantify the deterioration of trust
on the Dream darknet market in response to Operation Bayonet, a law enforcement opera-
tion. I tease apart the effects of the operation’s first stage, a conventional market takedown,
and its second stage, an impersonation campaign. I find that the latter significantly erodes
marketplace trust while the former does not. This decrease in trust manifests as an increase
in vendors’ returns on reputation. I estimate Operation Bayonet to have increased the dif-
ference in mean revenue between a 5-star and a 4-star vendor by 32.5 percentage points. I
further find that deterioration in buyer trust concentrates darknet sales in the hands of fewer
vendors, raising the barriers to entry and increasing the effectiveness of future anti-vendor
law enforcement operations.
Keywords: darknet markets, trust, reputation, Operation Bayonet
JEL codes: L14, L15, K42, K24
∗Present affiliation: National University of Singapore. Email: [email protected].

1 Introduction
Since 2009, the number of drug abusers worldwide has risen more than 30% to 271 million
– more than thrice as fast as the global population growth rate (United Nations Office on
Drugs and Crime, 2019). A major contributing factor to this extreme growth that is often
overlooked is the rise of online drug trafficking. This trafficking takes place on “darknet
markets” – hidden websites where buyers and vendors can transact anonymously.
The share of global drug transactions that take place on darknet markets is relatively
small, but growing fast. The total estimated revenue of the darknet ecosystem has grown
from $180 million USD in 2013 to $790 million in 2019 (Chainalysis, 2020). Darknet markets
offer drug vendors a “low risk, high traffic, high mark-up” venue to sell their products (Van
Hout & Bingham, 2014). Consequently, consumers can buy drugs more safely and conve-
niently than on the streets (Barratt et al., 2016). But what the consumer finds desirable,
society may not. For instance, fentanyl – a synthetic opioid that is easily overdosed – is 90%
cheaper on the dark web than “street” heroin, its closest substitute (Miller, 2020). Fentanyl
is at the heart of the recent American opioid crisis that ended 47,000 lives in 2017 alone
(Centers for Disease Control and Prevention, 2018).
In response to this criminal innovation, law enforcement agencies have had to adapt. In
2013, the American Federal Bureau of Investigation (FBI) arrested Ross Ulbricht and took
down Silk Road, the darknet market he managed (United States Attorney’s Office, 2015).
In 2014, an international consortium of law enforcement agencies took down nine darknet
markets simultaneously and arrested 17 administrators (Decary-Hetu & Giomonni, 2016).
These operations, however, did not deter so much as displace buyers and vendors, who simply
migrated to one of the many alternative darknet markets (Decary-Hetu & Giomonni, 2016;
Van Buskirk et al., 2014).
In July 2017, a coordinated effort between the FBI and the Dutch National Police saw
the shutdown of two darknet markets within 16 days of each other. On July 4th, the FBI
took down Alphabay, the largest market at the time. 16 days later, the Dutch police took
down Hansa, the second largest. A strongly-worded report by the European Monitoring
Centre for Drugs and Drug Addiction (EMCDDA) questioned the operation’s effectiveness,
noting that the “revenues and trade volumes [of the ecosystem as a whole]. . . do not appear
to have been affected” (Christin & Thomas, 2019).
Revenue and trade volume, however, are not the only metrics by which these operations
can be judged. Because everyone is anonymous on darknet markets, trust between buyers
and vendors is necessary for transactions to occur. An operation that fails to reduce revenue
and trade volume, but manages to erode this trust, can still be considered to have had some
1

positive impact.
This double takedown, called Operation Bayonet, was the first such operation. By the
time the FBI had taken down Alphabay, Hansa was already under the control of the Dutch
police. For a month, they had impersonated the Hansa administrators and interacted di-
rectly with the buyers and vendors on the website. When the Dutch authorities took down
Hansa, they also publicly announced the details of their impersonation, along with its fruits:
unencrypted passwords, IP addresses, and more than 10,000 real-life mailing addresses.
The intention of Operation Bayonet, then, was not just to dismantle most popular web-
sites, but to make users of other still operational markets “believe that sellers. . . have al-
ready been compromised and are feeding information [to law enforcement agencies]” (Popper,
2019). In other words, it sought to damage buyers’ trust in vendors.
In this paper, I take a page from the industrial organization literature and propose
vendors’ returns on reputation as a novel, more meaningful proxy for darknet buyers’ trust.
The mechanism is simple: when trust decreases, buyers would rather transact with reputable
vendors, increasing returns on reputation as a result.
I propose a new empirical strategy to quantify the deterioration of trust on the dark
web arising from law enforcement operations. By exploiting the two-stage nature of Oper-
ation Bayonet, I find that impersonation campaigns significantly erode marketplace trust
and increase vendors’ returns on reputation, whereas conventional takedowns have no such
effect. On Dream, the largest surviving darknet market, I estimate that Operation Bayonet
increased the difference between a 5-star vendor’s mean revenue and a 4-star vendor’s by 32.5
percentage points, and grew the market share of reputable vendors by 41.2%. Higher returns
on reputation favor established vendors and discourage prospective ones, which explains why
Dream’s vendor population stopped growing after Operation Bayonet. All together, these
findings suggest that deterioration in buyer trust concentrates sales in the hands of fewer
vendors and raises barriers to vendor entry, thus increasing the effectiveness of future anti-
vendor law enforcement operations.
The rest of the paper proceeds as follows. Section 2 reviews the literature on reputation
and darknet markets that precede this paper, and outlines my hypotheses in the context of
Operation Bayonet. Section 3 describes my data and empirical strategy. Section 4 discusses
my findings and demonstrates their robustness. Section 5 concludes.
2

2 Background
2.1 Darknet Markets
Darknet markets are part of the “dark web,” which refers to the set of websites that can
neither be accessed using conventional web browsers (e.g., Chrome, Safari) nor found us-
ing conventional search engines (e.g., Google, Bing). Dark websites are only accessible via
the Tor browser, a special software that masks the Internet Protocol addresses of its users,
disguising their identities. While drugs comprise a majority of the products sold on dark-
net markets, other products (weapons, stolen credit cards, stolen identities, etc.) are also
available (Christin, 2013).
The process of buying from a darknet market is broadly similar to buying from “clearnet
markets” like eBay or Amazon. Buyers choose an item from different vendors’ product
listings, pay online, and wait for it to arrive in the mail. But there are three distinct
differences in how transactions occur.
First, all sales take place in cryptocurrency. Usual online payment methods (PayPal,
credit cards) are linked to real-world identities. Cryptocurrencies like Bitcoin or Monero can
be stored in and disbursed from anonymous digital wallets.
Second, buyers almost never pay vendors at the time of purchase. If they did, vendors
could scam them by delivering a lower-quality product, or no product at all. Obviously, dark-
net buyers cannot turn to consumer protection agencies for legal recourse. Instead, buyers
transmit the money to the website administrator for safekeeping (escrow). The amount
is only disbursed to the vendor if the buyer reports having received the product in good
condition. Otherwise, the administrator helps the buyer and vendor resolve their dispute.1
Third, buyers are required to leave reviews for the vendor. A review consists of a numeric
star rating (e.g., 1-star to 5-stars) and a text comment.2 Because of the lengths darknet
markets go to in order to preserve anonymity, vendor feedback matters much more on darknet
markets, because feedback is the clearest signal of vendors’ trustworthiness. This is a crucial
point that warrants elaboration.
On marketplaces that are either legal or online, participants can build trust by disclosing
some aspect of their identities. For example, on a legal and virtual market like eBay, vendors’
real names are hidden from the buyer but known to the administrator. Conversely, on an
illegal, offline market such as a crack house, buyers and vendors meet face-to-face and can
1Clearly, this is an imperfect system that allows buyers to scam vendors, and administrators to scamboth parties. Some newer darknet markets use “multiple-signature” escrow technology, which requires twoof the three parties to sign off any disbursal of funds.
2On markets that do not strictly require this, social norms strongly compel the buyer to do so.
3

identify each other’s appearances, if not their real names (May & Bhardwa, 2016). Darknet
markets are unique in that they are both illegal and online.
A quick thought experiment: imagine you are a buyer on the Dream darknet market,
deciding whether to buy cocaine from @MickeyMouse. It doesn’t matter to you that @Mick-
eyMouse’s profile says “I am not a scammer,” because they might be lying. Neither does
it matter that on a different darknet market, there is a user @M1ckeyMous3 with a perfect
5 star rating, because they might not be the same person. All you really know is that on
Dream, @MickeyMouse has an average rating of 3.5 stars and only 10 previous transactions.
Would you buy from @MickeyMouse? Likely not.
This vignette illustrates how a history of buyer feedback, aggregated and displayed for
all future buyers to see, is the primary signal of a vendor’s reputation. Without an ability
to distinguish between vendors, risk-averse buyers will not transact.
2.2 Literature Review
Returns on Reputation. In this paper, I follow Bar-Isaac & Deb’s definition of reputation
as “a probability distribution interpreted. . . as the likelihood that [an] agent is of one type
rather than another” (2014, p.44). On virtual marketplaces, reputation distinguishes honest
vendors from scammers, and rewards the former with returns of some sort. On a computer
processor auction on eBay, Houser & Wooders (2006) find that the price of the winning
bid increases with the vendor’s positive reviews. Positive returns on reputation have also
been found in the auctions of rare coins (Melnik & Alm, 2002) and comic books (Dewally &
Ederington, 2006).
Such consistent returns on reputation have been harder to pin down in non-auction online
markets. Saastamoinen (2009) and Cai, Jin, Liu, & Zhou (2014) find slightly negative returns
on reputation with regard to price. However, Ye, Xu, Kiang, Wu, & Sun (2013) argue that
returns on reputation may not always manifest as price premiums but rather as volume
premiums, as they find on Taobao.3 Furthermore, returns on reputation may not be the
same across vendors. For instance, Fan, Ju, & Xiao (2016) show that on Taobao, an increase
to an established vendor’s rating raises their revenue – but an increase to a newcomer’s rating
motivates them to cut prices to boost their rating further.
As collecting suitable data was difficult before online marketplaces, the empirical liter-
ature on reputation effects is still young (Tadelis, 2016). But the literature on reputation
in darknet markets is even younger. Hardy & Norgaard (2016) study Silk Road, the most
successful darknet market in the early 2010s, and find a positive effect of vendor feedback
3A Chinese version of eBay.
4

rating on product price per unit. They construct a model where equilibrium prices are deter-
mined by buyers and vendors constantly trying to scam each other, and attempt to use it to
estimate vendors’ discount factors. While their model nicely accounts for vendor scamming
behavior, it relies excessively on an accurate parameterization of the buyer’s reputation,
which is unobservable both to the econometrician and the real-life darknet vendor.
More recently, Espinosa (2019) finds heterogenous but positive returns on reputation
across vendors of different drug types. He studies Hansa, the third largest darknet market
in 2017, before it was taken over by the Dutch police in Operation Bayonet. He also finds
that reputable vendors on average command higher prices per unit.
Espinosa estimates that after law enforcement takes down a darknet market, surviving
markets enjoy a short-term decrease in likelihood of vendor scams, as newly migrated vendors
attempt to build up a reputation from scratch.
All in all, previous studies on reputation effects have primarily been interested in whether
or not such an effect exists, and if so, what its magnitude might be.4 This paper is the first
to consider how returns on reputation might change in response to exogenous events, and
how this variable might be useful from a law-enforcement perspective.
Evaluating Law Enforcement Operations. As illicit drugs are the most popular prod-
uct on darknet markets, evaluating the impact of takedown operations usually falls to
drug/addiction policy analysts. They base their evaluations on metrics well-known to
economists – the demand, supply, and prices of illicit drugs. To summarize a decade’s
worth of findings: after takedowns, sales volumes fall in the short term but continue to rise
in the long term (Christin & Thomas, 2019; Kruithof et al., 2016; Soska & Christin, 2015),
consistent with the well-known inelasticity of addictive drugs; the majority of sellers are dis-
placed to other markets rather than deterred (Decary-Hetu & Giomonni, 2016; Van Buskirk
et al., 2014); consequently, drug prices online neither rise nor fall significantly (Decary-Hetu
& Giomonni, 2016; Miller, 2020).
I believe new metrics are needed to evaluate Operation Bayonet, which represents a shift
in law enforcement agencies’ strategy from taking down darknet administrators, which has
been likened to a game of whack-a-mole (Greenberg, 2018), to eroding the very trust that
underpins these markets. I proceed to describe the details of the operation in the next
section.
4One noteworthy event study is by Cai, Jin, Liu, & Zhou (2014), who find that the introduction ofa centralized feedback system to Eachnet, a Chinese peer-to-peer marketplace, widens the market sharedifferential between reputable and disreputable vendors. No event studies about reputation have been doneon darknet markets.
5

2.3 Operation Bayonet
In 2017, the three largest darknet markets were Alphabay, with 40,000 vendors; Hansa, with
3,600 vendors; and Dream, with 2,000 vendors (Greenberg, 2018). That year, a coalition
of law enforcement agencies, led by the American Federal Bureau of Investigation and the
Dutch National Police, executed Operation Bayonet, which took down Alphabay and Hansa
in quick succession (Department of Justice, 2017).
July 4
Operation Bayonet
Alphabaytakedown
July 20
Hansatakedown
2017
Figure 1: Timeline of events for Operation Bayonet.
The sequence of events is outlined in Figure 1. On July 4, 2017, the FBI took down
Alphabay. In response, vendors and buyers moved to Dream, Hansa, and other markets.
Unbeknownst to them, Hansa’s administrators had already been arrested. The Dutch police
had been running the website since June, collecting passwords, IP addresses, and more than
10,000 mailing addresses of Hansa users (Satter & Bajak, 2017). Sixteen days later, on
July 20, the Dutch Police took down Hansa and publicly released details about Operation
Bayonet. In the aftermath, Dream rose to prominence as the largest surviving darknet
market, capturing more than 85% of total dark web sales (Christin & Thomas, 2019). Hence
this paper focuses on the effect of Operation Bayonet on Dream.5
The two stages of the operation had very different effects on buyers’ trust in vendors.
The first takedown (of Alphabay) was identical to previous ones: authorities shut down the
website, waited a few days, then posted a notice of seizure in its place (Figure 2) worded
similarly to previous notices (Appendix, Figures 8 and 9). The dark web community knew
that previous takedowns had been targeted attacks that resulted in the arrest of market
administrators, not vendors or buyers.6 Hence, we can expect the Alphabay takedown not
to have significantly decreased buyers’ trust in vendors on Dream.
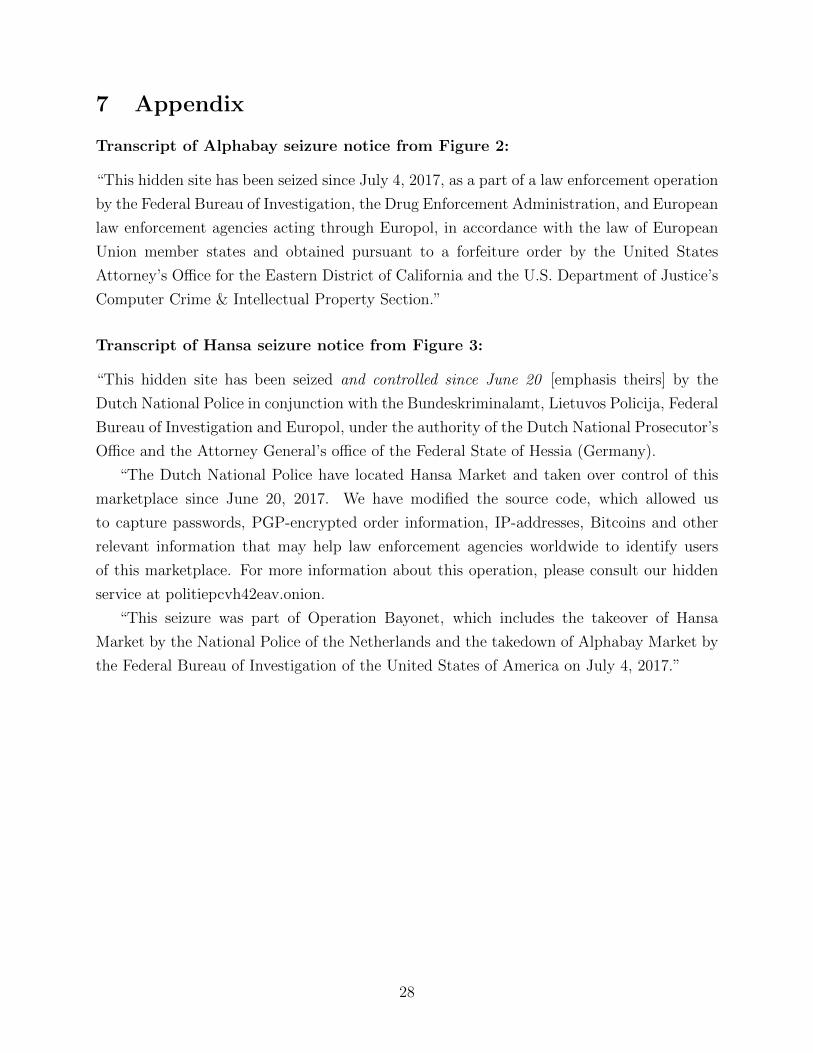
In contrast, the second stage of Bayonet was an unanticipated and unprecedented shock
to the dark web community. As explained in the Hansa seizure notice (Figure 3), law
5Indeed, ElBahrawy et al. (2020) find that, in the wake of a market takedown, displaced vendors andusers nonrandomly migrate to the next largest-volume marketplace — in this case, Dream.
6This is not to say that vendors were never caught. Indeed, between 2011 and 2015, at least 167 vendorswere arrested (Branwen, 2019). However, all of these arrests were due to “operational security” lapses, suchas leaving fingerprints on packages (Caleb, 2019). None were connected to market takedowns.
6

Figure 2: Notice of seizure of Alphabay darknet market. Transcription of text in Appendix.Image from Wikipedia.
enforcement agencies had been secretly impersonating Hansa administrators for a month, and
had already collected potentially identifying information about certain users. Consequently,
there was a wave of vendor fear and distrust across the surviving darknet markets after the
Hansa takedown.
The Hansa takedown had an interesting impact on the Dream market in particular. Over
the next few days, the Dutch police infiltrated 16 Dream vendors’ accounts, locked them out,
and posted their public PGP keys on Twitter (Tai et al., 2019). But as it it turns out, the
affected vendors had simply reused their passwords across Hansa and Dream — an oper-
ational security error on the vendor’s part, rather than a sophisticated infiltration by law
enforcement (Varmazis, 2017). This tipped law enforcement’s hand somewhat, suggesting
that the Hansa data leak compromised some vendors but not others. Consequently, this gen-
erated discussion among Dream buyers about how to distinguish compromised vendors from
still-trustworthy ones. For instance, on a discussion thread entitled “LE [law enforcement]
compromised vendors,” @pinkfluiddude says, “Please assist me establish if a vendor has been
compromised. . . Are there any indicators that I must be on the lookout for?” (Tumblr, 2017).
This anecdote suggests that while the threat of law enforcement impersonation certainly
decreased trust in vendors in general, buyers on Dream still believed that some vendors
are more trustworthy than others. In other words, a vendor’s reputation remains a crucial
7

Figure 3: Notice of seizure of Hansa darknet market. Transcription of text in Appendix.Image from Quartz.com.
mediator of buyer trust that is able to neutralize, or at least allay, fears of impersonation. In
other words, an impersonation campaign has heterogenous effects on buyers’ trust in vendors,
depending on that vendor’s existing stock of reputation.
2.4 Hypothesized Mechanism
My hypothesized mechanism relating buyers’ trust to vendors’ returns on reputation is
straightforward. Consider a stylized darknet market with two types of vendors, reputable
and disreputable. Reputable vendors have high star ratings, are perceived by buyers to
be lower risk (e.g., less likely to be scammers, more likely to uphold operational security
practices), and can command higher prices. Disreputable vendors have low star ratings, are
perceived as higher risk, and must offer lower prices.
Buyers on this market lie on a spectrum of risk aversion. Highly risk-averse buyers prefer
8

to buy at premium prices from reputable vendors, while less risk-averse buyers prefer to pay
the disreputable vendors’ lower prices. In short, a vendor’s star rating (i.e., reputation) is
the information buyers use to trade off between price and risk.
An impersonation campaign causes buyers’ trust in vendors to decrease heterogenously,
i.e., the fall in trust decreases with vendor reputation. Consequently, all buyers reevaluate
their tradeoffs, and some buyers switch from disreputable to reputable vendors. In other
words, buyers concentrate their transactions among fewer, more trusted vendors. As a
result, the difference in sale volumes between reputable and disreputable vendors increases,
whether prices change or not. Hence, every marginal increase in a vendor’s feedback rating
is associated with higher increases in revenue than before.7
This hypothesized mechanism generates four testable predictions to check whether this
buyer-switching mechanism is true:
H1: First, law enforcement operations that do not decrease buyers’ trust in vendors would
not increase vendors’ returns on reputation.
H2: Second, operations that do decrease buyers’ trust in vendors would increase vendors’
returns on reputation.
H3: Third, such an operation (as in H2) would increase the market share of reputable
vendors while decreasing that of disreputable vendors.
H1 and H2 test for a causal link between an impersonation campaign (call this event A) and
an increase in vendors’ returns on reputation (event B). If H1 is true, then without A, B
does not occur. If H2 is true, then if A occurs, B occurs. If both are true, then A is sufficient
for B.
H3 tests the way by which impersonation affects returns on reputation. By examining
vendor market shares, I can check whether my proposed mechanism, buyer-switching be-
havior, actually occurs. I empirically test H1 to H3 by comparing how the two stages of
Operation Bayonet – a conventional takedown and an impersonation campaign – might have
affected Dream market differently.
However, it is plausible that the second stage of Operation Bayonet decreased buyer trust
not because it was an impersonation campaign, but simply because it happened so soon after
the first stage. In order to pinpoint impersonation as the key factor of Operation Bayonet,
I conduct a placebo test:
7Even in the absence of market shocks, the distribution of market share over vendors is already veryunequal on darknet markets: 52.9% of revenue on Alphabay between 2015 and 2016 accrued to a mere 4.88%of vendors (Tzanetakis, 2018).
9

H4: An impersonation campaign would have no effect on a market where participants’
online identities are vetted by others. On that market, vendors’ returns on reputation
would remain unchanged.
To empirically test H4, I briefly examine Operation Bayonet’s effect on the Valhalla
market. Unlike most darknet markets (including Dream, Alphabay, and Hansa) which are
open for anyone to join, Valhalla is unique in that it is closed-door. What that means is new
buyers and vendors can only join Valhalla by the invitation of a current member. Thus, I
find it reasonable to believe that such a market would be more resistant to impersonation
campaigns than Dream. If the second stage of Bayonet had no effect on Valhalla vendors’
returns on reputation, that would further support my hypothesis that impersonation was
truly the key element of Operation Bayonet.
3 Empirical Strategy
3.1 Dream Market Data
I obtain data on the Dream market from cybersecurity researchers Nicolas Christin and
Jeremy Thomas (Carnegie Mellon University, 2019) via the Impact Cybertrust dataset repos-
itory. Using automated web crawlers, the researchers collected transaction-level data from
Dream covering parts of 2017 and 2018. More precisely, the researchers collect vendor
reviews, which is what all darknet market studies use as proxy for transactions. The cor-
respondence between reviews and transactions is one-to-one: buyers are required to leave
feedback, and only buyers are allowed to leave feedback. Each review comprises a star rating
(an integer from 1 to 5), the sale amount, and the date of review. Each review is further
associated with a unique product ID and unique vendor ID.
I aggregate this review data to the vendor level for two reasons. First, a vendor’s rating
is the same across all their products: there is no such thing as a product-specific rating.
On the Dream user interface (Figure 4), the 4.85 star rating on “4 GR PURE Afghan #3
Heroin” clearly refers to the vendor, @dutchglory, not the product itself. Second, the version
of the data obtained from Christin and Thomas had the titles of product listings redacted
for privacy reasons.8 As seen in Figure 4, the quantity of each product listing is written into
its title. Hence, I do not observe quantity in my data, and cannot run item-level regressions
using price per unit as Hardy & Norgaard (2016) and Espinosa (2019) have done. Instead,
I focus on returns on reputation that accrue to vendors’ overall revenue.
8Similarly, vendor usernames were replaced with unique alphanumeric codes.
10
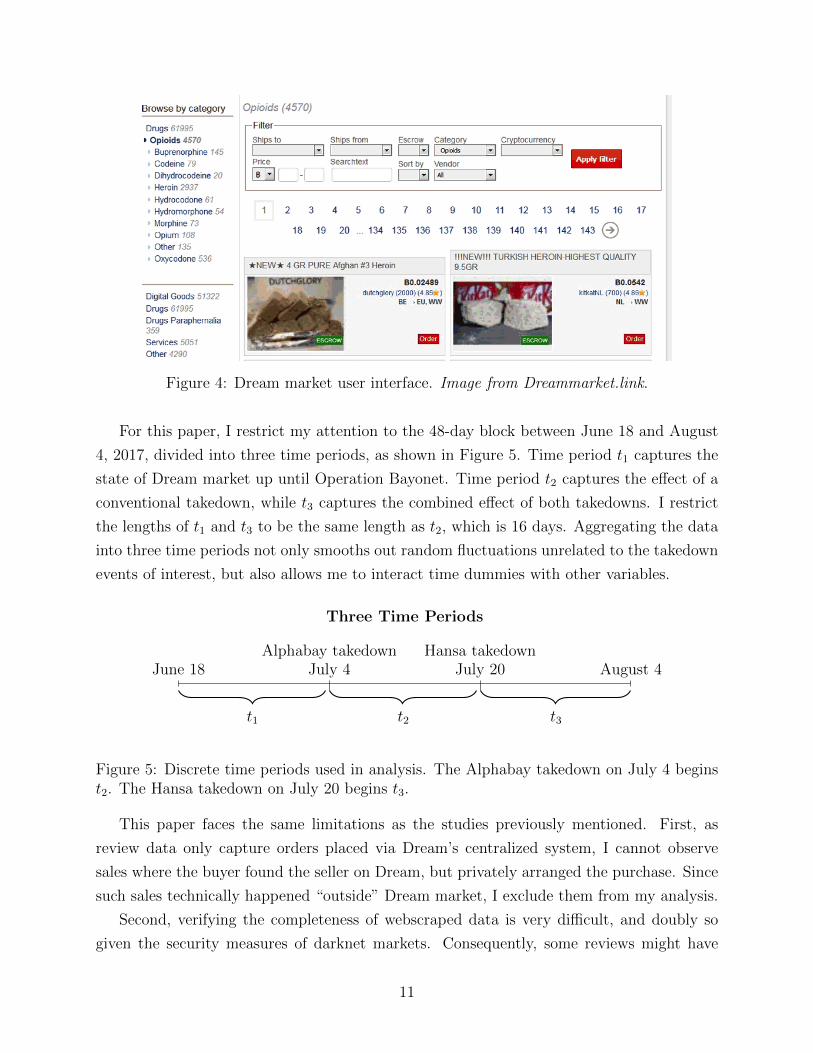
Figure 4: Dream market user interface. Image from Dreammarket.link.
For this paper, I restrict my attention to the 48-day block between June 18 and August
4, 2017, divided into three time periods, as shown in Figure 5. Time period t1 captures the
state of Dream market up until Operation Bayonet. Time period t2 captures the effect of a
conventional takedown, while t3 captures the combined effect of both takedowns. I restrict
the lengths of t1 and t3 to be the same length as t2, which is 16 days. Aggregating the data
into three time periods not only smooths out random fluctuations unrelated to the takedown
events of interest, but also allows me to interact time dummies with other variables.
June 18 July 4
Three Time Periods
Alphabay takedownJuly 20
Hansa takedownAugust 4
t1 t2 t3
Figure 5: Discrete time periods used in analysis. The Alphabay takedown on July 4 beginst2. The Hansa takedown on July 20 begins t3.
This paper faces the same limitations as the studies previously mentioned. First, as
review data only capture orders placed via Dream’s centralized system, I cannot observe
sales where the buyer found the seller on Dream, but privately arranged the purchase. Since
such sales technically happened “outside” Dream market, I exclude them from my analysis.
Second, verifying the completeness of webscraped data is very difficult, and doubly so
given the security measures of darknet markets. Consequently, some reviews might have
11

gone unscraped and unrecorded. However, this measurement error is distributed randomly
across vendors and time periods, and is reduced using computational methods more fully
described in Soska and Christin (2015).
3.2 Estimating Transaction Date
The Dream data contains the date a review was posted, but not the date the transaction
was initiated. I use some heuristics to backdate different kinds of items appropriately, using
other observable item characteristics.
Every product is classified into one of ten categories: eight different families of drugs;
digital goods; or miscellaneous products. I assume that digital goods ship immediately, and
hence backdate their reviews by 1 day.
Every product listing also specifies what country(ies) it ships to and from. Because
packages shipped internationally tend to be more stringently checked for illicit goods than
packages shipped domestically (Decary-Hetu et al., 2016), I assume buyers ship domestically
whenever possible. Due to the relative ease of shipping illicit goods within Europe (Christin
& Thomas, 2019), I consider intra-Europe shipments to be domestic.9
From browsing darknet buyers’ discussion boards on both the clearnet (e.g., Reddit.com,
2019a) and the dark web (e.g., Dread.onion, 2018, 2019), I estimate the average shipping
time as 1 week for domestic orders and 2 weeks for international orders. Additionally, Dream
automatically releases escrow funds to the vendor after 14 days unless the buyer extends the
time period (Reddit.com, 2019c). Hence, I backdate nondigital items that ship domestically
by 7 days, and all other items by 14 days.
Because international shipping times vary more greatly and are more prone to delays, I
rerun my analyses in Section 4 with internationally-shipped items backdated by 16, 18, or
20 days. I find my results hold with significance at 16 and 18 days, and remain qualitatively
similar at 20 days (Appendix, Tables 9 through 11).
3.3 Regression Model
At this point, I have an imbalanced panel (n = 4, 723) of 2,122 vendors observed across three
time periods. Using this data, I can estimate the fixed effects model
yit = γ1at + γ2ht + γ3rit + δ1at · rit + δ2ht · rit + β′Xit + αi + εi (1)
9Aside from Europe, other countries with domestically shipped items include: America, Argentina,Australia, Brazil, Cambodia, Canada, India, New Zealand, Russia, South Africa, Taiwan, and Thailand.
12

indexed by vendor i = 1 . . . 2, 122 and time period t = 1, 2, 3, where:
• yit is some measure of the revenue of vendor i in time period t;
• at is a dummy equal to 1 if t = 2 or 3, and equal to 0 otherwise, such that γ1 captures
the change in vendor revenue due to the Alphabay takedown;
• ht is a dummy equal to 1 if t = 3 and equal to 0 otherwise, such that γ2 captures the
further change in vendor revenue from t2 to t3 due to the Hansa takedown;
• rit is some measure of the reputation of vendor i in time period t. Its coefficient, γ3,
therefore captures vendor returns on reputation;
• at ·rit and ht ·rit are interaction terms that allow vendor returns on reputation to differ
in each time period. Because my time periods are demarcated by takedown events, δ1
can be interpreted as the effect of the Alphabay takedown on these returns, and δ2 the
additional effect of the Hansa takedown;
• Xit is a vector of three time-variant, vendor-specific controls: period transaction count,
historical transaction count, and product diversity;
• αi is a vendor fixed effect, and εit is an error term for unobservables clustered at the
vendor level.
I include a vendor fixed effect (i.e., a categorical variable representing vendor ID) to
absorb the effects of time-invariant vendor characteristics (e.g., a vendor’s historical stock
of reputation before t1, or whether a vendor practices stealth shipping10) without having to
explicitly include them as controls. Even then, errors are still likely serially correlated by
vendor. As I have sufficiently many clusters (i.e., vendors) relative to time periods, I cluster
errors at the vendor level.
The time dummies at and ht are constructed such that they can be interpreted as in-
cremental effects, i.e., returns on reputation are captured by γ3 in t1, γ3 + δ1 in t2, and
γ3 + δ1 + δ2 in t3. I am primarily interested in δ1 and δ2. If my hypothesized buyer-switching
mechanism is true, then by H1 we expect δ1 to be insignificant or nonpositive, and by H2
we expect δ2 to be significant and positive.
13
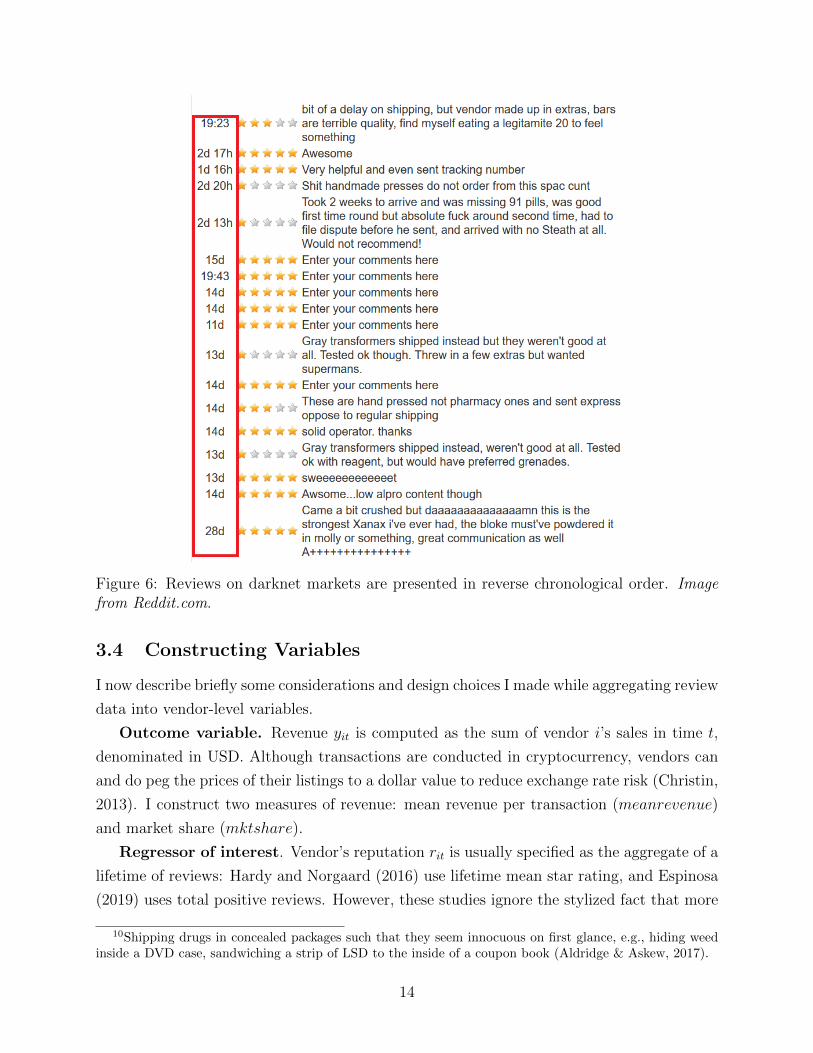
Figure 6: Reviews on darknet markets are presented in reverse chronological order. Imagefrom Reddit.com.
3.4 Constructing Variables
I now describe briefly some considerations and design choices I made while aggregating review
data into vendor-level variables.
Outcome variable. Revenue yit is computed as the sum of vendor i’s sales in time t,
denominated in USD. Although transactions are conducted in cryptocurrency, vendors can
and do peg the prices of their listings to a dollar value to reduce exchange rate risk (Christin,
2013). I construct two measures of revenue: mean revenue per transaction (meanrevenue)
and market share (mktshare).
Regressor of interest. Vendor’s reputation rit is usually specified as the aggregate of a
lifetime of reviews: Hardy and Norgaard (2016) use lifetime mean star rating, and Espinosa
(2019) uses total positive reviews. However, these studies ignore the stylized fact that more
10Shipping drugs in concealed packages such that they seem innocuous on first glance, e.g., hiding weedinside a DVD case, sandwiching a strip of LSD to the inside of a coupon book (Aldridge & Askew, 2017).
14

recent reviews are more salient to buyers (for instance, Reddit.com, 2019b). Simply put, a
4-star vendor with a recent spate of 5-star reviews appears more reputable to buyers than a
4-star vendor with a recent spate of 1-star reviews. Indeed, darknet markets show a vendor’s
detailed review history to buyers in reverse chronological order, as in Figure 6. Hence, I
construct three measures of reputation: meanrating, the mean star rating of a vendor’s
transactions in a given time period t; fivestars, the number of 5-star reviews a vendor
garnered in t; and for robustness, meanuntil, the mean star rating of a vendor’s transactions
up until t.
Controls. Xit is a vector of time-variant controls. It always includes txns, the number of
transactions a vendor made in a given time period, which likely affects both market share and
mean revenue per transaction. Xit optionally includes txnsuntil, the number of transactions
a vendor had made up until the start of time t; and diversity, a Herfindahl-Hirschman index
given by
1 −J∑
j=1
p2j
where pj is the proportion of transactions in time t that belong to product category j of
J . By this index, a vendor selling products of only one category has diversity = 0, and
diversity approaches 1 as the vendor’s product catalog increases in variety. Vendors with
higher product diversity can cater to a wider range of potential buyers, including those who
intend to buy multiple product types, resulting in increased revenue. Alternatively, vendors
with high product diversities might also be fronts for “networks of users with access to many
different sources [of products” with a collectively higher transaction volume capacity (Soska
& Christin, 2015).
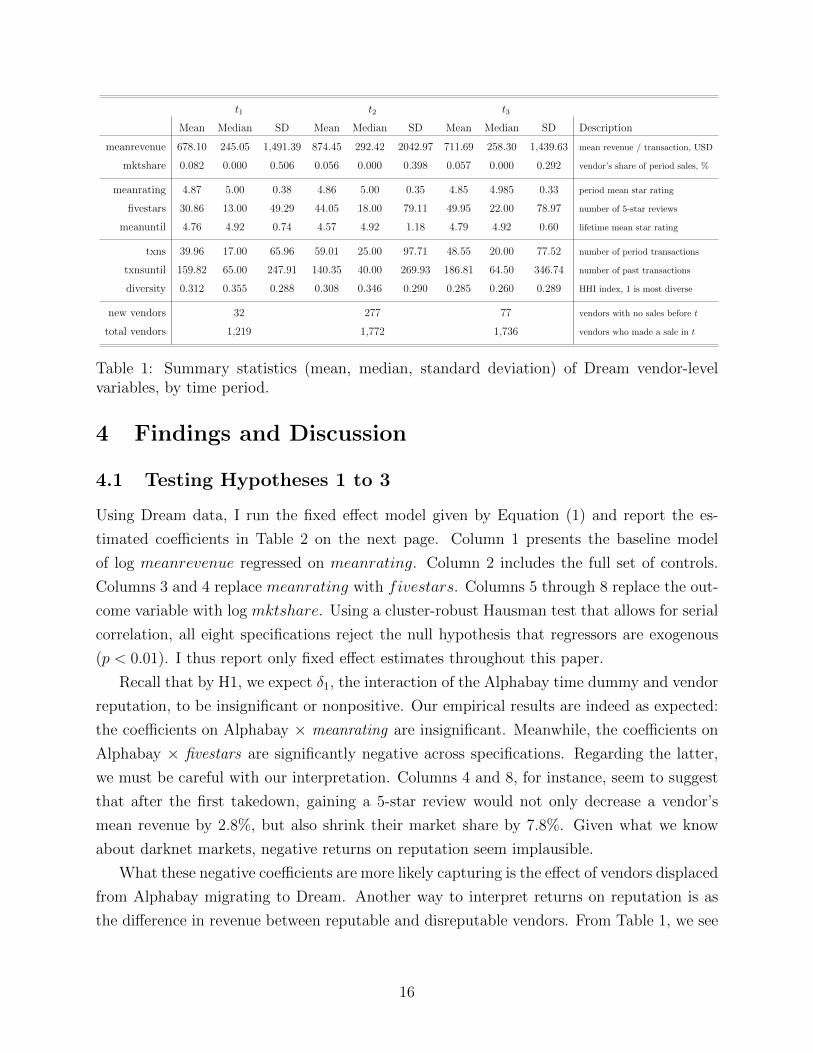
Summary statistics for all variables are presented in Table 1. In particular, observe
how the “usual” law-enforcement metrics – meanrevenue and txns – increase on average
from t1 to t2, consistent with the fact that vendors and buyers displaced by the Alphabay
shutdown migrate to Dream and continue their business. However, both meanrevenue
and txns significantly decrease from t2 to t3 (p < 0.05),11 despite the closure of Hansa that
would have displaced even more vendors and buyers. This suggests that the Hansa takedown
exerted some deterrence effect that the Alphabay takedown did not, at least in the short
term. Previous studies that did not tease apart these two takedowns would have overlooked
this simple but meaningful insight.
11Using two-sample, one-sided t-tests. t-statistic for meanrevenue computed as (711.69 −874.45)/
√2042.972/1772 + 1439.632/1736 = −2.73, and similarly for txns.
15
t1 t2 t3
Mean Median SD Mean Median SD Mean Median SD Description
meanrevenue 678.10 245.05 1,491.39 874.45 292.42 2042.97 711.69 258.30 1,439.63 mean revenue / transaction, USD
mktshare 0.082 0.000 0.506 0.056 0.000 0.398 0.057 0.000 0.292 vendor’s share of period sales, %
meanrating 4.87 5.00 0.38 4.86 5.00 0.35 4.85 4.985 0.33 period mean star rating
fivestars 30.86 13.00 49.29 44.05 18.00 79.11 49.95 22.00 78.97 number of 5-star reviews
meanuntil 4.76 4.92 0.74 4.57 4.92 1.18 4.79 4.92 0.60 lifetime mean star rating
txns 39.96 17.00 65.96 59.01 25.00 97.71 48.55 20.00 77.52 number of period transactions
txnsuntil 159.82 65.00 247.91 140.35 40.00 269.93 186.81 64.50 346.74 number of past transactions
diversity 0.312 0.355 0.288 0.308 0.346 0.290 0.285 0.260 0.289 HHI index, 1 is most diverse
new vendors 32 277 77 vendors with no sales before t
total vendors 1,219 1,772 1,736 vendors who made a sale in t
Table 1: Summary statistics (mean, median, standard deviation) of Dream vendor-levelvariables, by time period.
4 Findings and Discussion
4.1 Testing Hypotheses 1 to 3
Using Dream data, I run the fixed effect model given by Equation (1) and report the es-
timated coefficients in Table 2 on the next page. Column 1 presents the baseline model
of log meanrevenue regressed on meanrating. Column 2 includes the full set of controls.
Columns 3 and 4 replace meanrating with fivestars. Columns 5 through 8 replace the out-
come variable with log mktshare. Using a cluster-robust Hausman test that allows for serial
correlation, all eight specifications reject the null hypothesis that regressors are exogenous
(p < 0.01). I thus report only fixed effect estimates throughout this paper.
Recall that by H1, we expect δ1, the interaction of the Alphabay time dummy and vendor
reputation, to be insignificant or nonpositive. Our empirical results are indeed as expected:
the coefficients on Alphabay × meanrating are insignificant. Meanwhile, the coefficients on
Alphabay × fivestars are significantly negative across specifications. Regarding the latter,
we must be careful with our interpretation. Columns 4 and 8, for instance, seem to suggest
that after the first takedown, gaining a 5-star review would not only decrease a vendor’s
mean revenue by 2.8%, but also shrink their market share by 7.8%. Given what we know
about darknet markets, negative returns on reputation seem implausible.
What these negative coefficients are more likely capturing is the effect of vendors displaced
from Alphabay migrating to Dream. Another way to interpret returns on reputation is as
the difference in revenue between reputable and disreputable vendors. From Table 1, we see
16

Tab
le2:
Fix
edeff
ect
esti
mat
es.
14-d
ayla
gin
inte
rnat
ional
ship
men
ts.
Coeffi
cien
tsof
inte
rest
inbold
.
Log
mea
nre
ven
ue
Log
mkts
har
e
(1)
(2)
(3)
(4)
(5)
(6)
(7)
(8)
mea
nra
tin
g-0
.0058
1-0
.014
30.
0457
0.01
97
(-0.
06)
(-0.
17)
(0.3
0)(0
.16)
Alp
hab
ay×
mean
rati
ng
-0.1
12
-0.0
885
-0.2
07-0
.142
(-1.
01)
(-0.8
8)
(-1.
14)
(-0.
95)
Han
sa×
mean
rati
ng
0.37
7∗∗∗
0.3
25∗∗
0.68
7∗∗∗
0.5
65∗∗
(3.3
2)
(2.8
0)
(3.9
2)(3
.28)
five
star
s0.
0010
80.
0001
760.
0052
3∗
0.00
207
(1.0
5)(0
.18)
(2.4
9)(1
.05)
Alp
hab
ay×
fivest
ars
-0.0
0384∗∗∗
-0.0
0280∗
-0.0
115∗∗∗
-0.0
0780∗∗∗
(-5.
43)
(-2.5
2)
(-7.
23)
(-3.4
0)
Han
sa×
fivest
ars
0.00
255∗∗∗
0.0
0266∗∗∗
0.00
637∗∗∗
0.0
0746∗∗∗
(8.6
1)(3
.38)
(9.4
1)(4
.61)
Alp
hab
ay0.
675
0.55
20.
247∗∗∗
0.21
9∗∗∗
0.30
2-0
.000
903
-0.3
59∗∗∗
-0.4
25∗∗∗
(1.2
4)
(1.1
3)(7
.35)
(6.6
2)(0
.34)
(-0.
01)
(-6.
42)
(-7.
91)
Han
sa-1
.877∗∗∗
-1.5
92∗∗
-0.1
41∗∗∗
-0.1
07∗∗∗
-3.0
03∗∗∗
-2.2
99∗∗
0.09
560.
176∗∗∗
(-3.4
0)(-
2.82
)(-
4.63
)(-
3.64
)(-
3.52
)(-
2.74
)(1
.83)
(3.6
4)
Tra
nsa
ctio
nco
unt
Yes
Yes
Yes
Yes
Yes
Yes
Yes
Yes
Ad
dit
ion
alco
ntr
ols
No
Yes
No
Yes
No
Yes
No
Yes
Ad
just
edR
20.1
61
0.21
10.
186
0.23
10.
244
0.34
10.
309
0.39
3
Ob
serv
ati
on
s472
347
2347
2347
2347
2347
2347
2347
23
tst
atis
tics
inp
aren
thes
es.
Ad
dit
ion
alco
ntr
ols
are
txnsu
ntil
an
ddiversity
.L
ag
inin
tern
ati
on
al
ship
men
tsis
14
day
s.∗p<
0.05
,∗∗
p<
0.0
1,∗∗
∗p<
0.00
1
17
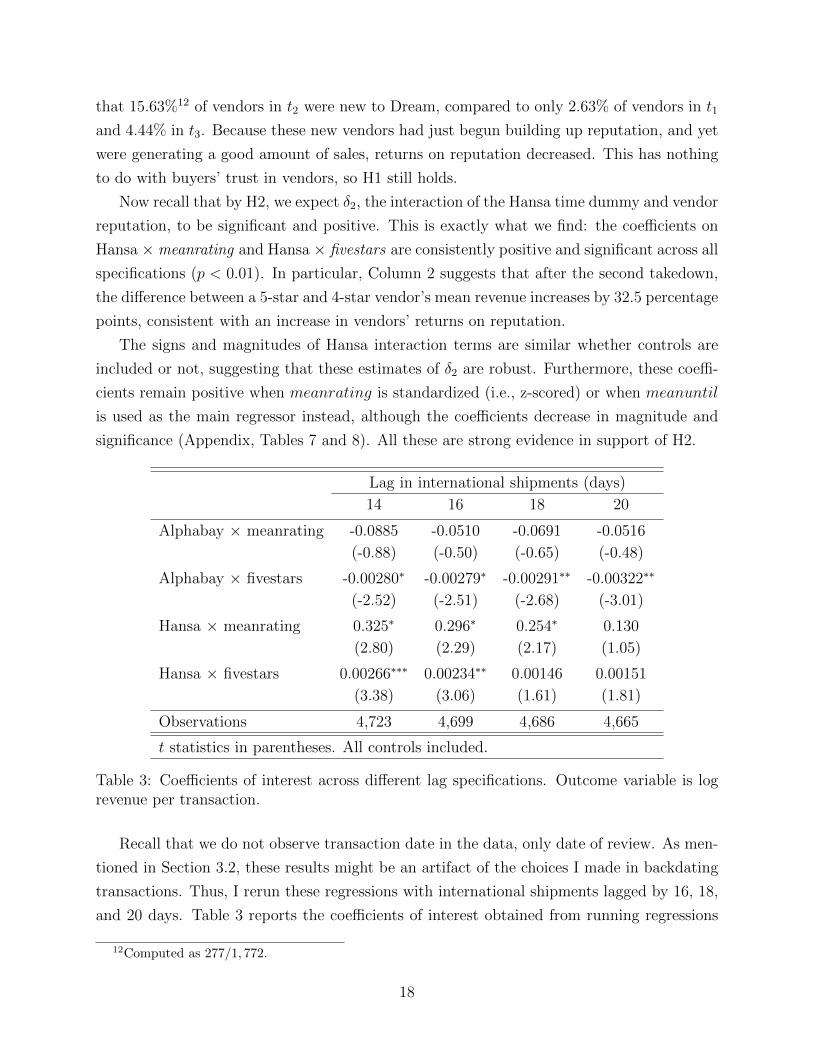
that 15.63%12 of vendors in t2 were new to Dream, compared to only 2.63% of vendors in t1
and 4.44% in t3. Because these new vendors had just begun building up reputation, and yet
were generating a good amount of sales, returns on reputation decreased. This has nothing
to do with buyers’ trust in vendors, so H1 still holds.
Now recall that by H2, we expect δ2, the interaction of the Hansa time dummy and vendor
reputation, to be significant and positive. This is exactly what we find: the coefficients on
Hansa × meanrating and Hansa × fivestars are consistently positive and significant across all
specifications (p < 0.01). In particular, Column 2 suggests that after the second takedown,
the difference between a 5-star and 4-star vendor’s mean revenue increases by 32.5 percentage
points, consistent with an increase in vendors’ returns on reputation.
The signs and magnitudes of Hansa interaction terms are similar whether controls are
included or not, suggesting that these estimates of δ2 are robust. Furthermore, these coeffi-
cients remain positive when meanrating is standardized (i.e., z-scored) or when meanuntil
is used as the main regressor instead, although the coefficients decrease in magnitude and
significance (Appendix, Tables 7 and 8). All these are strong evidence in support of H2.
Lag in international shipments (days)
14 16 18 20
Alphabay × meanrating -0.0885 -0.0510 -0.0691 -0.0516
(-0.88) (-0.50) (-0.65) (-0.48)
Alphabay × fivestars -0.00280∗ -0.00279∗ -0.00291∗∗ -0.00322∗∗
(-2.52) (-2.51) (-2.68) (-3.01)
Hansa × meanrating 0.325∗ 0.296∗ 0.254∗ 0.130
(2.80) (2.29) (2.17) (1.05)
Hansa × fivestars 0.00266∗∗∗ 0.00234∗∗ 0.00146 0.00151
(3.38) (3.06) (1.61) (1.81)
Observations 4,723 4,699 4,686 4,665
t statistics in parentheses. All controls included.
Table 3: Coefficients of interest across different lag specifications. Outcome variable is logrevenue per transaction.
Recall that we do not observe transaction date in the data, only date of review. As men-
tioned in Section 3.2, these results might be an artifact of the choices I made in backdating
transactions. Thus, I rerun these regressions with international shipments lagged by 16, 18,
and 20 days. Table 3 reports the coefficients of interest obtained from running regressions
12Computed as 277/1, 772.
18

Lag % “reputable” t1 t2 t3
14Market 31.12 10.68 15.08
Vendor 63.08 56.66 50.00
16Market 30.46 10.78 15.20
Vendor 63.04 56.73 50.00
18Market 30.81 10.93 14.43
Vendor 63.21 56.69 50.03
20Market 30.34 10.92 14.46
Vendor 63.26 56.71 50.00
Table 4: Market share and vendors’ share of above-median-rated vendors per time period,with various lags in international shipments.
with different lags (with full results in Appendix, Tables 9 to 11). We find the coefficients
have the same signs and similar magnitudes. They suggest that the results we find in support
of H1 and H2 are robust to changes in lag in international shipments.
By H3, we expect reputable vendors’ market share to increase from t2 to t3. To test
H3, I compute the market shares13 and vendor shares14 of reputable vendors in each time
period, where reputable is defined as “having an above-median meanrating.” These shares
are computed under different lag specifications, and summarized in Table 4. We see that
from t1 to t2, reputable vendors’ market share decreases along with the share of vendors who
are reputable, perhaps due to vendors displaced by the Alphabay takedown creating new
accounts on Dream (and bringing their buyers with them).
However, from t2 to t3, we see that reputable vendors’ market share increases, even as the
share of vendors who are reputable continues to decrease. In particular, under our default 14-
day lag, the market share of a reputable vendor increases by 4.4 percentage points, or 41.2%.
This is consistent with H3, and can be explained by our hypothesized mechanism: after trust
in vendors decreases due to the Hansa takedown, some buyers switch over to more reputable
vendors. Thus, in the low-trust environment of t3, reputable vendors are able to capture a
disproportionate amount of market share. This growing “inequality” between reputable and
disreputable vendors is precisely what we expect to see when return on reputation increases.
19

4.2 Testing Hypothesis 4
At this point we have found evidence for H1 to H3, which jointly suggest that the Hansa
takedown decreased buyers’ trust and increased vendors’ returns on reputation whereas the
Alphabay takedown did not. Clearly, the two takedowns had different — indeed, opposite
— effects on the Dream market. Just from the Dream data, however, we cannot technically
attribute the success of the Hansa takedown to the impersonation tactics it used. For exam-
ple, one could argue that the Hansa takedown decreased buyer trust because it happened so
soon after Alphabay, or because it was led by the Dutch police instead of the FBI. Although
our qualitative and anecdotal knowledge about Operation Bayonet (Section 2.3) make us
fairly convinced that the impersonation tactic is the key difference between the two stages,
we would like to show this using data.
Ideally, I would have data on a “placebo” darknet market identical to Dream in every
aspect, but immune to impersonation campaigns. As with Dream, I would estimate Equation
(1) and examine the interaction terms. If the Hansa × meanrating and Hansa × fivestars
terms are still significantly positive, then clearly impersonation is not the driver of returns
on reputation.
Fortunately, the dataset from Carnegie Mellon University also contained review data on
Valhalla, a closed-door darknet market that buyers and vendors can only join by invitation.
In contrast to Dream, which anyone with the Tor browser can join, registering on Valhalla
(whether as buyer or vendor) requires a “referral link” from an existing market participant
(Dreammarket.link, 2018b). Theoretically, the true identity of each participant on Valhalla
would be known by at least one other participant.
Market share (%)
Product Category Dream Valhalla
Cannabis 26.41 30.85
Opioids 8.58 7.77
Ecstasy 9.16 7.17
Stimulants 20.85 14.40
Other Drugs 19.12 26.32
Digital Goods 9.17 4.68
Misc Products 6.71 8.81
Table 5: Market shares by product category in Dream and Valhalla markets.
13Computed as the total revenue of reputable vendors divided by all vendors’ revenue in each time period.14Computed as the number of reputable vendors divided by total number of vendors in each time period.
20

While Valhalla is by no means immune to law enforcement impersonation and infiltration,
its invitation-only mechanism makes it at least appear much more resistant. Although much
smaller than Dream,15 similar products are sold on Valhalla in similar market shares as on
Dream, as shown in Table 5. All in all, I find it reasonable to use Valhalla to test H4.
I proceed to aggregate Valhalla review data to the vendor level the same way I did for
Dream. I end up with an imbalanced panel (n = 314) of 162 vendors observed across t1 to
t3. As seen in Figure 7, Valhalla operates on a thumbs-up/thumbs-down feedback system
only. I thus use thumbsup, the number of positive reviews a vendor garnered in time t, as
proxy for vendor reputation. All other outcome, time, and control variables are constructed
exactly the same way as in Section 3.4. Summary statistics for Valhalla data are relegated
to the Appendix, Table 12.
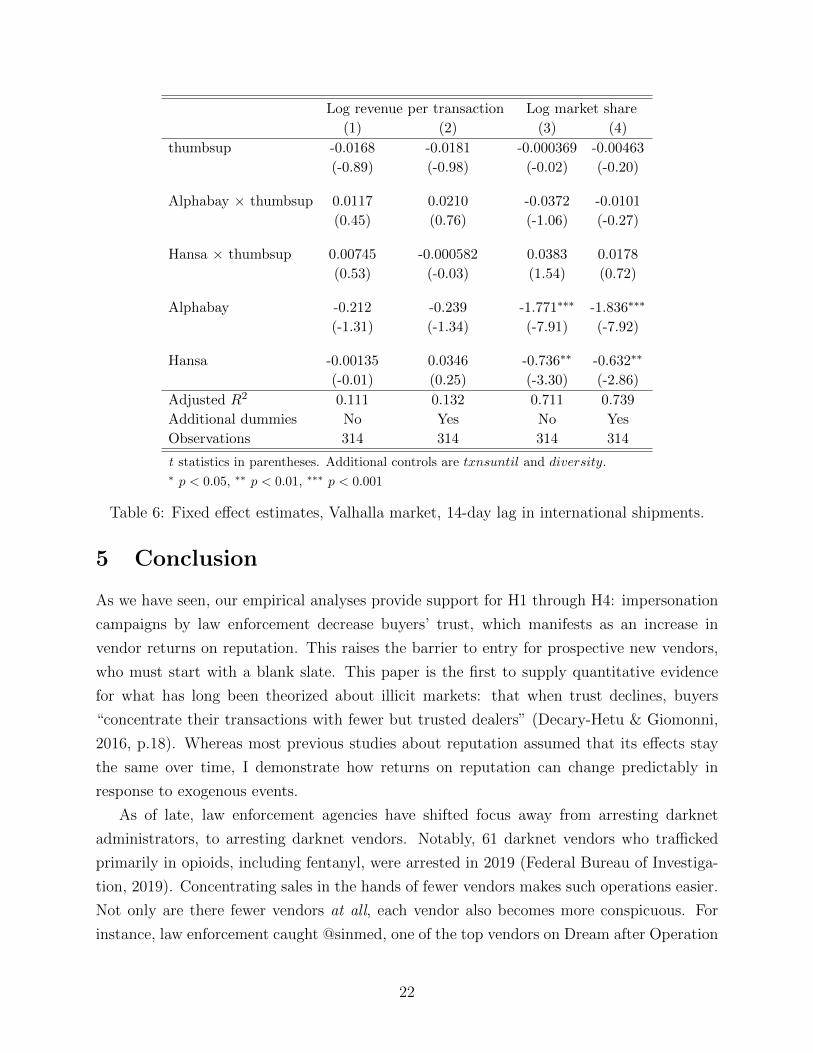
I estimate Equation (1) using Valhalla data and report the coefficients in Table 6 on
the next page. Column 1 presents the baseline model of log meanrevenue per transaction
regressed on thumbsup. Column 2 includes the full set of controls. Columns 3 and 4 replace
the outcome variable with log mktshare.
Looking at Table 6, we find no significance on any of the interaction terms. We also find
that the signs of these terms are inconsistent across specifications, hindering any sensible
interpretation of these coefficients at all. The insignificance of the Hansa × thumbsup term in
particular suggests that the Hansa takedown might not have meaningfully affected vendors’
returns on reputation on an invite-only market. While far from conclusive, the evidence is
at least consistent with H4, and indicative of its plausibility.
Figure 7: Hansa feedback system is thumbs-up/thumbs-down only. Image from Darkwe-blink.com.
15Dream was the largest market that survived Operation Bayonet by far: after Alphabay and Hansawere shut, Dream accounted for 85% of all dark web transactions, while the remaining 15% was split amongfourteen other marketplaces, Valhalla among them (Christin & Thomas, 2019).
21
Log revenue per transaction Log market share
(1) (2) (3) (4)
thumbsup -0.0168 -0.0181 -0.000369 -0.00463
(-0.89) (-0.98) (-0.02) (-0.20)
Alphabay × thumbsup 0.0117 0.0210 -0.0372 -0.0101
(0.45) (0.76) (-1.06) (-0.27)
Hansa × thumbsup 0.00745 -0.000582 0.0383 0.0178
(0.53) (-0.03) (1.54) (0.72)
Alphabay -0.212 -0.239 -1.771∗∗∗ -1.836∗∗∗
(-1.31) (-1.34) (-7.91) (-7.92)
Hansa -0.00135 0.0346 -0.736∗∗ -0.632∗∗
(-0.01) (0.25) (-3.30) (-2.86)
Adjusted R2 0.111 0.132 0.711 0.739
Additional dummies No Yes No Yes
Observations 314 314 314 314
t statistics in parentheses. Additional controls are txnsuntil and diversity.∗ p < 0.05, ∗∗ p < 0.01, ∗∗∗ p < 0.001
Table 6: Fixed effect estimates, Valhalla market, 14-day lag in international shipments.
5 Conclusion
As we have seen, our empirical analyses provide support for H1 through H4: impersonation
campaigns by law enforcement decrease buyers’ trust, which manifests as an increase in
vendor returns on reputation. This raises the barrier to entry for prospective new vendors,
who must start with a blank slate. This paper is the first to supply quantitative evidence
for what has long been theorized about illicit markets: that when trust declines, buyers
“concentrate their transactions with fewer but trusted dealers” (Decary-Hetu & Giomonni,
2016, p.18). Whereas most previous studies about reputation assumed that its effects stay
the same over time, I demonstrate how returns on reputation can change predictably in
response to exogenous events.
As of late, law enforcement agencies have shifted focus away from arresting darknet
administrators, to arresting darknet vendors. Notably, 61 darknet vendors who trafficked
primarily in opioids, including fentanyl, were arrested in 2019 (Federal Bureau of Investiga-
tion, 2019). Concentrating sales in the hands of fewer vendors makes such operations easier.
Not only are there fewer vendors at all, each vendor also becomes more conspicuous. For
instance, law enforcement caught @sinmed, one of the top vendors on Dream after Operation
22

Bayonet, because of his suspicious and increasingly large ATM withdrawals (Barrett, 2019).
Properly investigating the long-run effects of Operation Bayonet requires longitudinal
data on more recent markets – data that do not yet exist, and are technologically challenging
to collect. However, evidence suggests that Bayonet was successful in erecting persistent
barriers to entry. In the four months before Bayonet, the number of Dream vendors increased
from around 1,000 to a peak of 1,700. Over the next year, Dream became the predominant
darknet market and its sales volumes more than doubled – but the number of vendors did
not increase.16 Furthermore, when law enforcement agencies raided Wall Street Market –
the largest surviving market in 2019 after the closure of Dream – it only had one-seventh as
many vendors as Alphabay did in its prime (Popper, 2019).
As anti-vendor operations continue, future works could attempt to replicate these findings
about returns on reputation on newer markets. Darknet markets also raise larger concerns
of social welfare: do they reduce social costs by making drug trafficking safer, or increase
social harm by providing easy access to drugs? Might government funds be better spent
on drug education and demand reduction campaigns rather than expensive law enforcement
operations? Future research could start chipping away at these questions.
16I would have liked to track growth rates of Dream’s vendor population, but incomplete data coveragebetween October 2017 and April 2018 prevents accurate computations.
23
6 References
Aldridge, J., & Askew, R. (2017). Delivery dilemmas: How drug cryptomarket users identify
and seek to reduce their risk of detection by law enforcement. International Journal
of Drug Policy, 41, 101–109.
Barratt, M. J., Ferris, J. A., & Winstock, A. R. (2016). Safer scoring? Cryptomarkets, social
supply, and drug market violence. International Journal of Drug Policy, 35, 24–31.
Barrett, B. (2019). A top dark web drug ring goes down — thanks to ATM withdrawals.
Wired.com. https://www.wired.com/story/sinmed-dark-web-manattan-district-atto
rney-atm-withdrawals/
Branwen, G. (2019). Tor DNM-related arrests, 2011-2015. Gwern.net. https://www.gwern
.net/DNM-arrests
Caleb. (2019). Darkweb vendors and the basic opsec mistakes they keep making. Medium.com.
https://medium.com/@c5/darkweb-vendors-and-the-basic-opsec-mistakes-they-kee
p-making-e54c285a488c
Carnegie Mellon University. (2019). Dream, Traderoute, Berlusconi and Valhalla market-
places, 2017-2018: Anonymized datasets. https://doi.org/10.23721/116/1503878
Centers for Disease Control and Prevention. (2018). Opioid overdose: Understanding the
epidemic. Centers for Disease Control and Prevention. https://www.cdc.gov/drugo
verdose/epidemic/index.html
Chainalysis. (2020). The 2020 State of Crypto Crime. https://go.chainalysis.com/rs/503-
FAP-074/images/2020-Crypto-Crime-Report.pdf
Christin, N. (2013). Traveling the Silk Road: A measurement analysis of a large anonymous
online marketplace. Proceedings of the 22nd International Conference on World Wide
Web, 213–224. https://doi.org/10.1145/2488388.2488408
Christin, N., & Thomas, J. (2019). Analysis of the supply of drugs and new psychoactive
substances by Europe-based vendors via darknet markets in 2017-18. http://www.em
cdda.europa.eu/drugs-library/analysis-supply-drugs-and-new-psychoactive-substan
ces-europe-based-vendors-darknet-markets-2017-18 en
Darkweblink.com. (2019). Conjecture on the Valhalla market. https://www.darkweblink.co
m/wp-content/uploads/2019/04/1.jpeg
Decary-Hetu, D., & Giomonni, L. (2016). Do police crackdowns disrupt drug cryptomarkets?
A longitudinal analysis of the effects of Operation Onymous. Crime, Law, and Social
Change. https://doi.org/10.1007/s10611-016-9644-4
24
Decary-Hetu, D., Paquet-Clouston, M., & Aldridge, J. (2016). Going international? Risk
taking by cryptomarket drug vendors. International Journal of Drug Policy, 35, 69–
76.
Department of Justice. (2017). AlphaBay, the largest online ’dark market,’ shut down. The
United States Department of Justice. https://www.justice.gov/opa/pr/alphabay-lar
gest-online-dark-market-shut-down
Dewally, M., & Ederington, L. (2006). Reputation, certification, warranties, and information
as remedies for seller-buyer informational asymmetries: Lessons from the online comic
book market. The Journal of Business, 79 (2), 693–729.
Dread.onion. (2018). D/DreamMarket/TheRisingBastards official review. http://dreaddite
velidot.onion/post/e6a23388b5084e0de67d/#c-d3d6847ae178fd6b0e
Dread.onion. (2019). D/DreamMarket/Get order cancelled. http://dreadditevelidot.onion
/post/34484141ff16688f4b06/#c-09cab06a66483a2dba
Dreammarket.link. (2018a). Dream Market – the biggest darkweb marketplace 2018. https:
//dreammarket.link/wp-content/uploads/2018/06/Dream-Market-2.png
Dreammarket.link. (2018b). Valhalla Market review 2018. Darknet Markets Link. https://d
arknetmarketslink.com/valhalla-market-review/
ElBahrawy, A., Alessandretti, L., Rusnac, L., Goldsmith, D., Teytelboym, A., & Baronchelli,
A. (2020). Collective dynamics of dark web marketplaces. Scientific Reports, 10 (18827).
Espinosa, R. (2019). Scamming and the reputation of drug dealers on darknet markets.
International Journal of Industrial Organization, 67. https://doi.org/10.1016/j.ijind
org.2019.102523
Federal Bureau of Investigation. (2019). J-CODE announces 61 arrests in its second coordi-
nated law enforcement pperation targeting opioid trafficking on the darknet. Federal
Bureau of Investigation. https://www.fbi.gov/news/pressrel/press-releases/j-code-a
nnounces-61-arrests-in-its-second-coordinated-law-enforcement-operation-targeting
-opioid-trafficking-on-the-darknet
Greenberg, A. (2018). Operation Bayonet: Inside the sting that hijacked and entire dark web
market. Wired.com. https://www.wired.com/story/hansa-dutch-police-sting-operati
on/
Hardy, R. A., & Norgaard, J. R. (2016). Reputation in the internet black market: An em-
pirical and theoretical analysis of the deep web. Journal of Institutional Economics,
12 (3), 515–539.
Kruithof, K., Aldridge, J., Decary-Hetu, D., Sim, M., Dujso, E., & Hoorens, S. (2016). The
role of the ’dark web’ in the trade of illicit drugs. WODC, Ministerie van Veiligheid
en Justitie. https://www.rand.org/pubs/research briefs/RB9925.html
25
May, T., & Bhardwa, B. (2016). Markets and distribution systems: The birth, growth, and
transformation of UK drug markets. In H. H. Brownstein (Ed.), The handbook of
drugs and society (pp. 416–441). John Wiley & Sons, Inc.
Melnik, M. I., & Alm, J. (2002). Does a seller’s ecommerce reputation matter? Evidence
from eBay auctions. The Journal of Industrial Economics, 50 (3), 337–349.
Miller, J. N. (2020). The war on drugs 2.0: Darknet fentanyl’s rise and the effects of regulatory
and law enforcement action. Contemporary Economic Policy, 38 (2), 246–257.
Popper, N. (2019). Dark web drug sellers dodge police crackdowns. The New York Times.
https://www.nytimes.com/2019/06/11/technology/online-dark-web-drug-markets
.html
Quartz.com. (2017). Police had been controlling a major online black market for the past
month, authorities say. https://tinyurl.com/sbqwjgq
Reddit.com. (2019a). R/darknet/How long do packages normally take to ship? (US). https:
//www.reddit.com/r/darknet/comments/c9jz5t/how long do packages normally ta
ke to ship us/
Reddit.com. (2019b). R/darknet/Overview of how to compare vendors (for DnM noobs) [See
comments]. https://www.reddit.com/r/darknet/comments/ai4c3t/overview of how
to compare vendors for dnm noobs/
Reddit.com. (2019c). R/darknet/When does dream auto finalize. https://www.reddit.com
/r/darknet/comments/8kv7gn/when does dream auto finalize/
Saastamoinen, J. (2009). Returns on reputation in retail e-commerce. Journal of Electronic
Commerce Research, 10 (4), 196–219.
Satter, R., & Bajak, F. (2017). Dutch ‘darknet’ drug marketplace shut down. The Portland
Press Herald. https://www.pressherald.com/2017/07/21/dutch-darknet-drug-marke
tplace-shut-down
Soska, K., & Christin, N. (2015). Measuring the longitudinal evolution of the online anony-
mous marketplace ecosystem. Proceedings of the 24th USENIX Security Symposium,
33–48.
Tadelis, S. (2016). Reputation and feedback systems in online platform markets. Annual
Review of Economics, 8, 321–340.
Tai, X., Soska, K., & Christin, N. (2019). Adversarial matching of dark net market vendor
accounts. Association for Computing Machinery: Special Interest Group on Knowledge
Discovery and Data Mining 2019 Conference Proceedings. https://doi.org/10.1145/3
292500.3330763
26

TechCrunch. (2014). Nearly half of the Operation Onymous takedowns were scams or clone
sites. https://techcrunch.com/wp-content/uploads/2014/11/silk-road-seized-3-png.j
peg?w=730&crop=1
Tumblr. (2017). LE compromised vendors. Tumblr.com. https://dream-market-url.tumblr.c
om/post/167732630383/le-compromised-vendors
Tzanetakis, M. (2018). Comparing cryptomarkets for drugs: A characterisation of sellers and
buyers over time. International Journal of Drug Policy, 56, 176–186.
United Nations Office on Drugs and Crime. (2019). World Drug Report 2019. https://wdr
.unodc.org/wdr2019/index.html
United States Attorney’s Office. (2015). Ross Ulbricht, aka Dread Pirate Roberts, sentenced
in Manhattan federal court to life in prison. Federal Bureau of Investigation. https:
//www.fbi.gov/contact-us/field-offices/newyork/news/press-releases/ross-ulbricht-
aka-dread-pirate-roberts-sentenced-in-manhattan-federal-court-to-life-in-prison
Van Buskirk, J., Roxburgh, A., Farrell, M., & Burns, L. (2014). The closure of the Silk Road:
What has this meant for online drug trading? Addiction, 109 (4), 517–518.
Van Hout, M. C., & Bingham, T. (2014). Responsible vendors, intelligent consumers: Silk
Road, the online revolution in drug trading. International Journal of Drug Policy,
25, 183–189.
Varmazis, M. (2017). Dark web criminals caught after reusing passwords. Naked Security.
https://nakedsecurity.sophos.com/2017/07/31/dark-web-criminals-caught-after-reu
sing-passwords/
Wikipedia. (2013). Image placed on original Silk Road after seizure of property by the FBI.
https://en.wikipedia.org/wiki/Silk Road (marketplace)#/media/File:Silk Road Sei
zed.jpg
Wikipedia. (2017). This notice was left on the Tor hidden service after Alphabay raid. https
://en.wikipedia.org/wiki/AlphaBay#/media/File:AlphaBay shutdown notice.png
27
7 Appendix
Transcript of Alphabay seizure notice from Figure 2:
“This hidden site has been seized since July 4, 2017, as a part of a law enforcement operation
by the Federal Bureau of Investigation, the Drug Enforcement Administration, and European
law enforcement agencies acting through Europol, in accordance with the law of European
Union member states and obtained pursuant to a forfeiture order by the United States
Attorney’s Office for the Eastern District of California and the U.S. Department of Justice’s
Computer Crime & Intellectual Property Section.”
Transcript of Hansa seizure notice from Figure 3:
“This hidden site has been seized and controlled since June 20 [emphasis theirs] by the
Dutch National Police in conjunction with the Bundeskriminalamt, Lietuvos Policija, Federal
Bureau of Investigation and Europol, under the authority of the Dutch National Prosecutor’s
Office and the Attorney General’s office of the Federal State of Hessia (Germany).
“The Dutch National Police have located Hansa Market and taken over control of this
marketplace since June 20, 2017. We have modified the source code, which allowed us
to capture passwords, PGP-encrypted order information, IP-addresses, Bitcoins and other
relevant information that may help law enforcement agencies worldwide to identify users
of this marketplace. For more information about this operation, please consult our hidden
service at politiepcvh42eav.onion.
“This seizure was part of Operation Bayonet, which includes the takeover of Hansa
Market by the National Police of the Netherlands and the takedown of Alphabay Market by
the Federal Bureau of Investigation of the United States of America on July 4, 2017.”
28

Figure 8: Notice of seizure from Silk Road takedown, 2013. Image from Wikipedia.
Figure 9: Notice of seizure from Operation Onymous, 2014. Image from TechCrunch.
29

Table 7: Standardized (z-score) mean rating as main regressor.
Log revenue per transaction Log market share
(1) (2) (3) (4)
Std. meanrating -0.00221 -0.00543 0.0173 0.00746
(-0.06) (-0.17) (0.30) (0.16)
Alphabay × std. meanrating -0.0387 -0.0302 -0.0731 -0.0500
(-0.95) (-0.82) (-1.10) (-0.91)
Hansa × std. meanrating 0.126∗∗∗ 0.109∗∗ 0.229∗∗∗ 0.188∗∗
(3.32) (2.81) (3.90) (3.27)
Alphabay 0.129∗∗∗ 0.122∗∗∗ -0.702∗∗∗ -0.702∗∗∗
(4.33) (4.17) (-13.93) (-15.10)
Hansa -0.0477∗ -0.0131 0.334∗∗∗ 0.444∗∗∗
(-2.06) (-0.51) (8.64) (10.46)
Transaction count Yes Yes Yes Yes
Additional controls No Yes No Yes
Adjusted R2 0.161 0.211 0.244 0.341
t statistics in parentheses. 14-day lag in international shipments. ∗ p < 0.05, ∗∗ p < 0.01, ∗∗∗ p < 0.001
Table 8: Historical mean star rating as main regressor.
Log revenue per transaction Log market share
(1) (2) (3) (4)
meanuntil 0.0242 0.0268 0.0383 0.0417
(0.47) (0.54) (0.50) (0.58)
Alphabay × meanuntil -0.213∗∗ -0.175∗∗ -0.452∗∗∗ -0.357∗∗∗
(-3.09) (-2.63) (-4.20) (-3.53)
Hansa × meanuntil 0.190 0.150 0.280 0.202
(1.14) (0.92) (1.04) (0.82)
Alphabay 1.156∗∗∗ 0.968∗∗ 1.476∗∗ 1.019∗
(3.45) (2.97) (2.81) (2.07)
Hansa -0.949 -0.726 -0.983 -0.504
(-1.16) (-0.91) (-0.75) (-0.42)
Transaction count Yes Yes Yes Yes
Additional controls No Yes No Yes
Adjusted R2 0.168 0.215 0.255 0.347
t statistics in parentheses. 14-day lag in international shipments. ∗ p < 0.05, ∗∗ p < 0.01, ∗∗∗ p < 0.001
30

Table 9: 16-day lag in international shipments, all controls included.
Log revenue per transaction Log market share
(1) (2) (3) (4)
meanrating -0.0410 -0.0242
(-0.48) (-0.21)
Alphabay × meanrating -0.0510 -0.113
(-0.50) (-0.76)
Hansa × meanrating 0.296∗ 0.521∗∗
(2.29) (2.91)
fivestars 0.000349 0.00294
(0.33) (1.29)
Alphabay × fivestars -0.00279∗ -0.00804∗∗∗
(-2.51) (-3.51)
Hansa × fivestars 0.00234∗∗ 0.00644∗∗∗
(3.06) (4.06)
Alphabay 0.339 0.184∗∗∗ -0.0879 -0.370∗∗∗
(0.67) (5.42) (-0.12) (-6.71)
Hansa -1.438∗ -0.0910∗∗ -2.080∗ 0.189∗∗∗
(-2.28) (-2.96) (-2.38) (3.79)
Adjusted R2 0.206 0.224 0.346 0.392
Observations 4699 4699 4699 4699
t statistics in parentheses. ∗ p < 0.05, ∗∗ p < 0.01, ∗∗∗ p < 0.001
31

Table 10: 18-day lag in international shipments, all controls included.
Log revenue per transaction Log market share
(1) (2) (3) (4)
meanrating -0.0281 -0.0280
(-0.32) (-0.23)
Alphabay × meanrating -0.0691 -0.0862
(-0.65) (-0.56)
Hansa × meanrating 0.254∗ 0.465∗∗
(2.17) (2.74)
fivestars 0.00137 0.00481
(1.13) (1.70)
Alphabay × fivestars -0.00291∗∗ -0.00818∗∗∗
(-2.68) (-3.67)
Hansa × fivestars 0.00146 0.00439∗
(1.61) (2.14)
Alphabay 0.416 0.164∗∗∗ -0.187 -0.363∗∗∗
(0.80) (4.77) (-0.25) (-6.19)
Hansa -1.234∗ -0.0740∗ -1.870∗ 0.170∗∗∗
(-2.16) (-2.42) (-2.26) (3.42)
Adjusted R2 0.198 0.210 0.351 0.385
Observations 4686 4686 4686 4686
t statistics in parentheses. ∗ p < 0.05, ∗∗ p < 0.01, ∗∗∗ p < 0.001
32

Table 11: 20-day lag in international shipments, all controls included.
Log revenue per transaction Log market share
(1) (2) (3) (4)
meanrating -0.0141 -0.0379
(-0.16) (-0.30)
Alphabay × meanrating -0.0516 -0.0491
(-0.48) (-0.31)
Hansa × meanrating 0.130 0.341
(1.05) (1.89)
fivestars 0.00164 0.00546∗
(1.41) (2.00)
Alphabay × fivestars -0.00322∗∗ -0.00885∗∗∗
(-3.01) (-3.95)
Hansa × fivestars 0.00151 0.00439∗
(1.81) (2.31)
Alphabay 0.331 0.169∗∗∗ -0.367 -0.355∗∗∗
(0.62) (4.89) (-0.48) (-6.06)
Hansa -0.635 -0.0851∗∗ -1.262 0.165∗∗∗
(-1.06) (-2.82) (-1.44) (3.41)
Adjusted R2 0.195 0.211 0.350 0.389
Observations 4665 4665 4665 4665
t statistics in parentheses. ∗ p < 0.05, ∗∗ p < 0.01, ∗∗∗ p < 0.001
Table 12: Summary statistics of Valhalla vendor-level variables, by time period.
t1 t2 t3
Mean SD Mean SD Mean SD
meanrevenue 146.96 319.30 191.65 201.30 288.54 746.79
mktshare (%) 1.282 2.999 0.752 1.329 0.781 2.229
thumbsup 4.70 4.38 5.76 5.23 11.56 12.07
txns 4.00 3.66 10.32 10.37 7.63 10.00
txnsuntil 16.82 8.96 16.75 11.63 27.77 18.29
diversity 0.188 0.258 0.209 0.259 0.203 0.251
new vendors 1 5 1
total vendors 73 133 128
33