Embed Size (px)
Citation preview

ALAN A. AYERS, MBA, MACC
VICE PRESIDENT OF STRATEGY AND EXECUTION
CONCENTRA URGENT CARE
DALLAS, TEXAS
CONTENT ADVISOR,
URGENT CARE ASSOCIATION OF AMERICA
Measuring Patient Flow in Urgent Care

Outline
� Why do we care about measuring patient flow?� Wait Times� Patient Satisfaction� Employee Productivity� Profitability
� Methods of measuring patient flow:� Time-Motion Study� Interruption Sheets� Chart Audits� Direct Observation/Flow Mapping� Cycle-Time Measures� Patient Queuing

Why do we care about patient flow?
1. Long wait times are the #1 complaint of urgent care patients
2. Improved patient flow means shorter wait times and more satisfied patients (who will return and tell others to do the same)
3. Improved patient flow also means increased efficiency and extra capacity which allows for more revenue-generating visits without adding to staffing costs
Measuring Patient Flow
� The key to improving patient flow is understanding how a patient moves through the practice� This allows the practice to identify non-value added tasks that waste time and determine the process that best balances efficiency and quality
� Every practice will have a different patient flow
� Patient flow can be affected by:� Patient acuity� Physician practice style� Layout of the physical facility� Visit scheduling� Seasonality

Time-Motion Study
� Direct and continuous observation of a task using a time keeping device to measure the time to accomplish the task
� Used to reduce the number of motions, distance traveled, or time needed to perform a task� Has its roots in manufacturing but now widely applied in health care
� Any task performed regularly should have the required materials within reach
� Increases employee productivity
� Reduces employee fatigue

Time-Motion Example
� If it takes a front desk employee an average of 15 seconds to retrieve a print-out
� If they print 20 times a day, that is 5 minutes a day spent walking to and from the printer
� At the end of the year, the company will have lost 1,250 minutes or 20.8 hours of that employee’s productivity
� A time-motion study will focus on how to minimize the time lost to repetitive tasks

ProsPros ConsCons
� Illustrates where time is spent/lost
� Improves methods or procedures required by particular jobs
� Reduces time spent on non-value-added tasks by improving process design
� Improves facility layout
� Improves resource utilization
� Requires a second employee to perform the study (thus temporarily sacrificing productivity)
� Focuses on one specific process or person at a time (vs. a systems/process approach)
� Limited sample size in an urgent care setting
Time-Motion Study

Interruption Sheets
� Physicians makes a note any time they are pulled away from treating patients
� Phone calls, signatures on forms, staff questions
� Nurses can also record such interruptions in their work day
Pros
• Allows a practice to quickly identify the most common work interruptions and create work-arounds
• Can be scaled to different levels of detail
• Specific to a particular position
Cons
• Increases the workload on care providers during the sample period
• The more detail captured about interruptions is proportional to the added workload

Chart Audits
� Chart audits are best used to investigate a particular problem or process failure
� First step is to identify a particular topic/focus of an audit
� Only works if the medical record is documenting any useful data pertaining to issue
� May tie to a process evaluation—such as timestamps on patient flow sheets

ProsPros ConsCons
� Can be applied to virtually any aspect of a clinic as long as it is included in the medical record (both clinical and operational)
� Medical records already contain the answer to numerous questions
� Very tedious and time-consuming, particularly for paper charts
� Must have identified a particular focus issue and the chart sample must be representative of that issue
� Best used to investigate only 1 or 2 questions per audit
Chart Audits

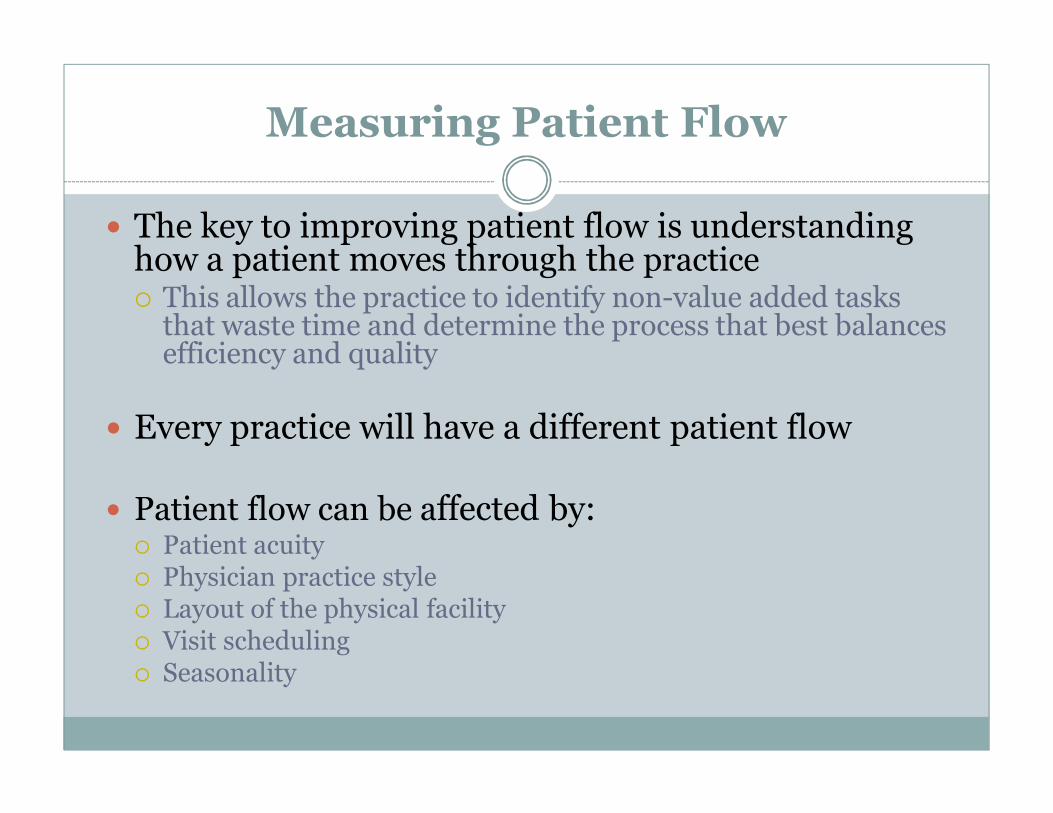
Direct Observation/Flow Mapping
� Understand how patients move through the center
� Document all steps in a process flow chart
� Identify steps where the following exist:� Non-value added activities
� Extended waits
� Interruptions to providers/staff
� Evaluate reasons for disrupted flow

Flow Mapping – Alarm Clock Example
Flow Mapping – Urgent Care Center

Direct Observation/Flow Mapping
� Split your day between the waiting room and observing from a front desk or nurses station� Take the patient’s perspective by sitting in the waiting room incognito among other patients
� Spend time at the front desk or nurses station to see the process from the staff’s view
� Is there a disconnect between how the patients and staff perceive the efficiency of the practice?
� Take detailed notes on the entire visit� What happens around you and what you observe and feel
Direct Observation/Flow Mapping
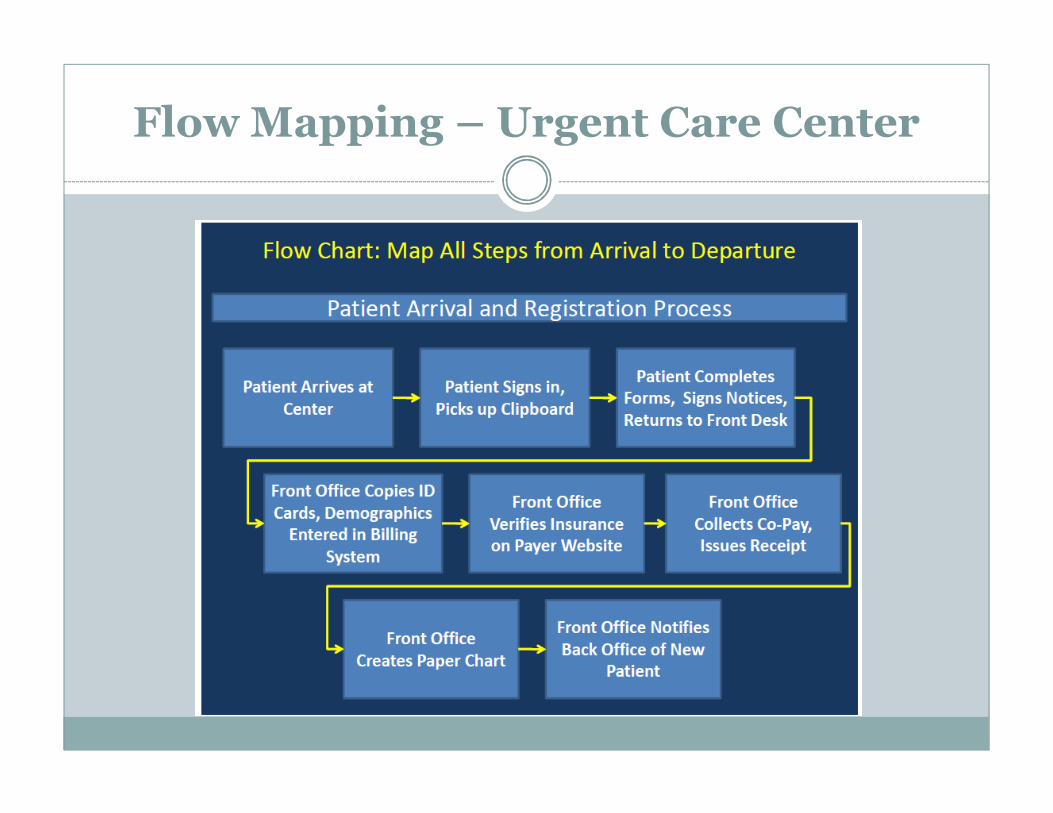
� Things to watch for:� In the waiting room, pay attention to what patients are doing
� Are they browsing magazines? Talking on the phone? Are they complaining to those around them about service or wait times?
� In the back office, pay attention to customer service, paperwork, condition of equipment, repeat work, etc.� Be aware of creating a “Hawthorne Effect”� If possible, spend a couple days—focus the first day on getting to know employees so they’re comfortable and do not feel as though they are being observed
� Differentiate between value-added and non-value-added activities� Bottlenecks, stoppages, unplanned work, number of touches,
handoffs, batching of tasks, rework, duplication of effort

Value is Based on the Patient’s View
� Value Added: Direct contribution to what the patient values� Tasks that cannot be avoided—treat the patient and get paid
� Conducting history and physical, documenting findings in chart, dispensing medications
� Non-Value Added but Essential: Required to allow value-added steps or required by � Recording demographics, verifying insurance, collecting co-pay,
taking vitals, conducting lab tests
� Non-Value Added is Everything Else� Wait times, time in transit, redundancies

Process Re-Engineering
� Consolidate duplicative processes� Repetitive collection of demographics, billing information, vital signs, or patient history
� Identify activities that can be conducted in parallel� Registration or discharge in the exam room
� Identify activities that can occur after the patient leaves� Coding, charge entry for insurance billing

ProsPros ConsCons
� Experience what the patient sees from arrival to exit
� Judge the level of customer service
� Discriminate value-added and non-value-added activities
� Ensure standardized processes
� Identify process redundancies
� May be difficult to get the “average visit” feel
� Labor/time intensiveness limits sample size
� 1 visit/data point could take over an hour to collect
Direct Observation/Flow Mapping

Cycle-Time Measurement
� Essentially the next step after flow mapping
� Requires measuring or charting the time a patient spends in each step of their visit� Most important is to discriminate between waiting time and the
remainder of a visit
� Paper chart and EMR “timestamps” can help in understanding the process and time spent during a patient’s visit to the center
� Allows identification of the longest process steps and potential bottlenecks that can be alleviated through process reengineering or improvement

Cycle-Time Measurement
� Many hospitals are already using their EMR systems to track Key Performance Indicators (KPI’s)
Source: Perfecting Patient Flow, published by the National Association of Public Hospitals and Health Systems

Cycle-Time Measurement
� Potential time periods to be tracked in an urgent care setting:� Time from arrival � Registration finished
� Time from arrival � First seen by physician
� Time from completion of registration � Patient called back and put in exam room
� Time from patient in exam room � First seen by Physician
� Time from the patient first being seen by physician � Check-out finished and patient leaves
� Time from when a patient leaves a room � Room is clean and prepped for the next patient
� The bottom line is that recording more patient touch point � better and more useful data for analysis

Time Tracking Template for Urgent Care

Cycle-Time Measurement Sample
Source: Strategies for Better Patient Flow and Cycle Times, by Leigh Ann Backer
ProsPros ConsCons
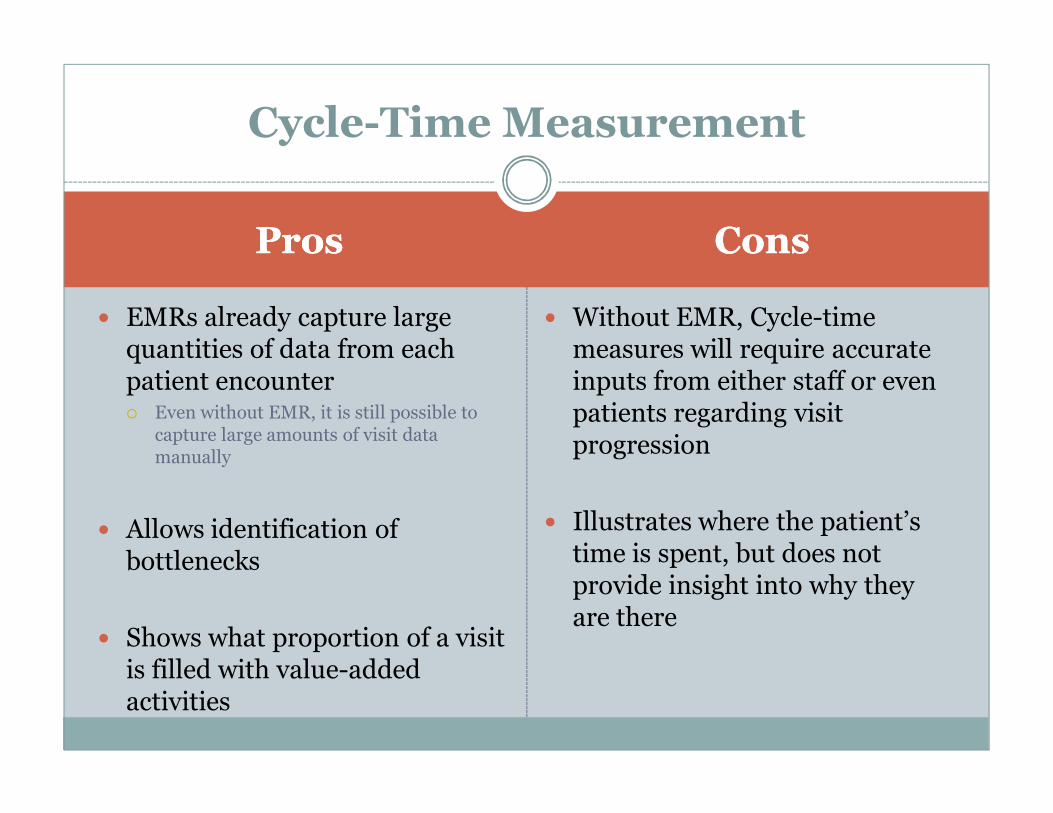
� EMRs already capture large quantities of data from each patient encounter� Even without EMR, it is still possible to
capture large amounts of visit data manually
� Allows identification of bottlenecks
� Shows what proportion of a visit is filled with value-added activities
� Without EMR, Cycle-time measures will require accurate inputs from either staff or even patients regarding visit progression
� Illustrates where the patient’s time is spent, but does not provide insight into why they are there
Cycle-Time Measurement

Patient Queuing
� Push vs. Pull System� A push system will push people as far as they can go until the next resource needed is unavailable. They then wait until that resource becomes available.
� Creates multiple patient queues and multiple wait steps
� Most common type of queuing being done in primary care and urgent care practices
� A pull system waits until the resource is ready to pull a patient through the system.
� More efficient than a push system because there is only one patient queue to manage
� All waiting is done on the front end of the visit
� Much more difficult to do without an automated patient queuing system

Patient Queuing
� Pull systems will always be more efficient than push systems, but a push system can be improved without the purchase of an automated queuing system� This is essentially what a fast track system accomplishes
� This is very similar to express checkout at a grocery store
� Shoppers with <10, 15, 20 items can move through different lines so that they do not have to wait for the shopper with 200 items to checkout
� In urgent care, set up separate queues for different visit types
� Physician vs. non-physician visits
� Radiology vs. no x-ray tech needed
� Just be careful not to create too many different queues to the point where it becomes more of a burden for staff to manage/prioritize

Why do we care about patient flow?
� Patient flow ultimately boils down to where patients and providers spend their time
� Variance in process is inversely proportional to delivery consistency
� Less consistent delivery ultimately leads to longer wait times and dissatisfied patients

Benefits of a Lean Organization
� Customer Satisfaction
� Reduced Cycles
� Better Delivery
� More Capacity
� Better Quality
� Increased Productivity
Before:
After:
Value-Added Time
Non-Value Added Time
Total Visit Time: