Embed Size (px)
Citation preview
Page 1 of 12 BetterCotton.org
Measuring Cotton Consumption: Technical Supplement October 2020
Page 2 of 12 BetterCotton.org
Contents 1. Introduction.............................................................................................................. 3
a. Purpose ............................................................................................................ 3 2. Definitions ............................................................................................................... 3 3. Gathering Data ........................................................................................................ 4
a. Locating Data ................................................................................................... 4 b. Data Completeness .......................................................................................... 5 c. Data Filters .......................................................................................................... 6 d. Additional Data ................................................................................................. 7 e. Missing Data .................................................................................................... 7
4. Calculating Cotton Consumption ............................................................................. 8 a. Data Format ..................................................................................................... 8 b. Cleaning Data................................................................................................... 9 c. Gaps and Assumptions ...................................................................................... 10 d. Secondary Data .............................................................................................. 11 e. Summarising Data .......................................................................................... 11
Page 3 of 12 BetterCotton.org
1. Introduction This document is a Technical Supplement to “Measuring Cotton Consumption: Requirements & Guidance”.
a. Purpose Variability in business models, business processes, product styles, and business software, together with an absence of primary (direct) data on cotton consumption, increases the likelihood that BCI Retailer and Brand Members (‘RB Members’) will measure cotton consumption differently. BCI does not prescribe any specific data management method for measuring cotton fibre consumption. However, this supplement is intended to help RB Members gather and analyse data related to their cotton consumption and to improve the quality and consistency of information submitted to BCI. RB Members are strongly encouraged to document their processes related to measuring cotton consumption, particularly raw data templates and calculation templates, to facilitate consistent measurement year-on-year.
2. Definitions This document uses the same definitions as “Measuring Cotton Consumption: Requirements & Guidance,” with the following additions: Data: Information, facts and statistics collected for reference or analysis. Database: An organized collection of data, stored and accessed electronically. A database differs from a data set as its data is organised and retrieved in a specific format and structure. Databases are commonly used to store data in software systems. Dataset: A collection of data. Enterprise Resource Planning (ERP): It refers to the software and systems an organisation uses to collect, store, manage and interpret data from its business activities and manage its resources. Information Management System: In the context of this document, it collectively describes all software, documents, records and systems used by an RB Member in its day-to-day commercial activities. Purchase Order (PO): A commercial document issued by a buyer to a seller, indicating the type, quantities and agreed prices for products or services that the seller will provide to the buyer. Product Lifecycle Management (PLM): The process of managing complex product information, engineering and manufacturing workflows, and collaboration. PLM software connects people, processes, and data across the entire product lifecycle to a central repository of information.
Page 4 of 12 BetterCotton.org
3. Gathering Data The basic formulae for calculating total cotton consumption are as follows, depending on the primary data starting point (consumer products or fabric used to make them). Using data on consumer products: 𝑷𝑷𝑷𝑷𝑷𝑷𝑷𝑷𝑷𝑷𝑷𝑷𝑷𝑷 𝑪𝑪𝑷𝑷𝑷𝑷𝑷𝑷𝑷𝑷𝑪𝑪 𝑪𝑪𝑷𝑷𝑪𝑪𝑪𝑪𝑷𝑷𝑪𝑪𝑪𝑪𝑷𝑷𝑪𝑪𝑷𝑷𝑪𝑪 = 𝑷𝑷𝑷𝑷𝑷𝑷𝑷𝑷𝑷𝑷𝑷𝑷𝑷𝑷 𝑷𝑷𝑪𝑪𝑪𝑪𝑷𝑷 𝒘𝒘𝒘𝒘𝑪𝑪𝒘𝒘𝒘𝒘𝑷𝑷 ∗𝑼𝑼𝑪𝑪𝑪𝑪𝑷𝑷𝑪𝑪 𝒃𝒃𝑷𝑷𝑷𝑷𝒘𝒘𝒘𝒘𝑷𝑷 𝑷𝑷𝑷𝑷 𝑪𝑪𝑷𝑷𝒔𝒔𝑷𝑷 ∗ % 𝑷𝑷𝒐𝒐 𝑷𝑷𝑷𝑷𝑷𝑷𝑷𝑷𝑷𝑷𝑪𝑪 𝑪𝑪𝑪𝑪 𝑪𝑪𝑷𝑷𝑷𝑷𝑷𝑷𝑷𝑷𝑷𝑷𝑷𝑷 ∗𝑷𝑷𝑷𝑷𝑷𝑷𝑷𝑷𝑷𝑷𝑷𝑷𝑷𝑷 𝑷𝑷𝑷𝑷 𝒐𝒐𝑪𝑪𝒃𝒃𝑷𝑷𝒘𝒘 𝑪𝑪𝑷𝑷𝒔𝒔𝑷𝑷𝑪𝑪𝑪𝑪𝒔𝒔𝑪𝑪𝒘𝒘𝑷𝑷 Using data on fabrics used: 𝑭𝑭𝑭𝑭𝒃𝒃𝑷𝑷𝑪𝑪𝑷𝑷 𝑪𝑪𝑷𝑷𝑷𝑷𝑷𝑷𝑷𝑷𝑪𝑪 𝑪𝑪𝑷𝑷𝑪𝑪𝑪𝑪𝑷𝑷𝑪𝑪𝑪𝑪𝑷𝑷𝑪𝑪𝑷𝑷𝑪𝑪 = 𝑭𝑭𝑭𝑭𝒃𝒃𝑷𝑷𝑪𝑪𝑷𝑷 𝒘𝒘𝒘𝒘𝑪𝑪𝒘𝒘𝒘𝒘𝑷𝑷 ∗ 𝑭𝑭𝑭𝑭𝒃𝒃𝑷𝑷𝑪𝑪𝑷𝑷 𝒔𝒔𝒘𝒘𝑪𝑪𝒘𝒘𝑷𝑷𝒘𝒘 ∗𝑭𝑭𝑭𝑭𝒃𝒃𝑷𝑷𝑪𝑪𝑷𝑷 𝒘𝒘𝑪𝑪𝑷𝑷𝑷𝑷𝒘𝒘 ∗ % 𝑷𝑷𝒐𝒐 𝑷𝑷𝑷𝑷𝑷𝑷𝑷𝑷𝑷𝑷𝑪𝑪 𝑪𝑪𝑪𝑪 𝒐𝒐𝑭𝑭𝒃𝒃𝑷𝑷𝑪𝑪𝑷𝑷 ∗ 𝑭𝑭𝑭𝑭𝒃𝒃𝑷𝑷𝑪𝑪𝑷𝑷 𝑷𝑷𝑷𝑷 𝒐𝒐𝑪𝑪𝒃𝒃𝑷𝑷𝒘𝒘 𝑪𝑪𝑷𝑷𝒔𝒔𝑷𝑷𝑪𝑪𝑪𝑪𝒔𝒔𝑪𝑪𝒘𝒘𝑷𝑷 Depending on the information management system available to RB Members, different data points may be used as a starting point. For example, RB Members may be able to use any or all of the following:
Purchase Orders (POs): A list of all POs raised over a given period, Product Lines: A list of all product lines bought or sold over a given period, or, Fabric Codes: A list of all fabric codes bought over a given period.
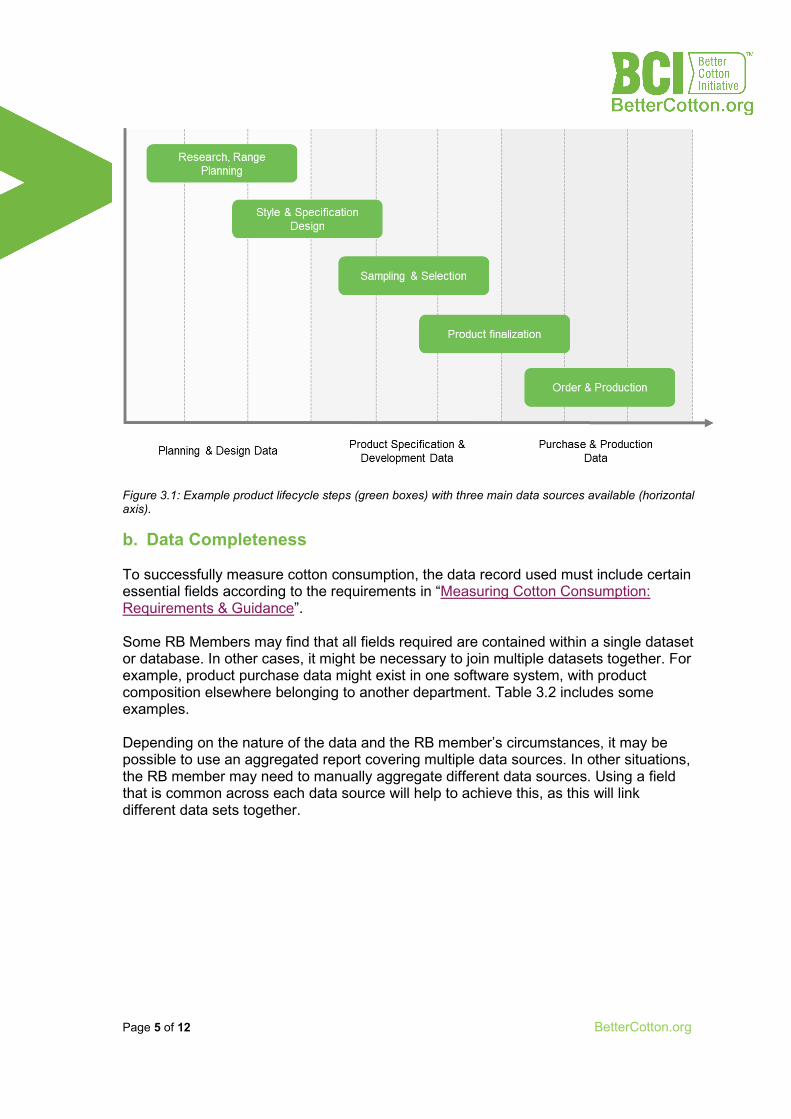
a. Locating Data RB Members’ information management systems, and the data they contain, may be managed by several business functions and spread across different storage locations. Identifying the RB Member’s main commercial processes may be helpful in identifying the software or records required, identifying duplicate datasets, and identifying gaps.
Larger brands tend to use software systems that are designed specifically for managing the lifecycle and purchase and sale of products.
Smaller brands may find spreadsheets, text documents and cloud storage (e.g. OneDrive, Dropbox or Google Drive) as more common ways of organizing their business data.
This supplement does not differentiate between purpose-built systems and collections of spreadsheets, text documents etc., and its guidance is intended to be equally applicable to either.
Page 5 of 12 BetterCotton.org
Figure 3.1: Example product lifecycle steps (green boxes) with three main data sources available (horizontal axis).
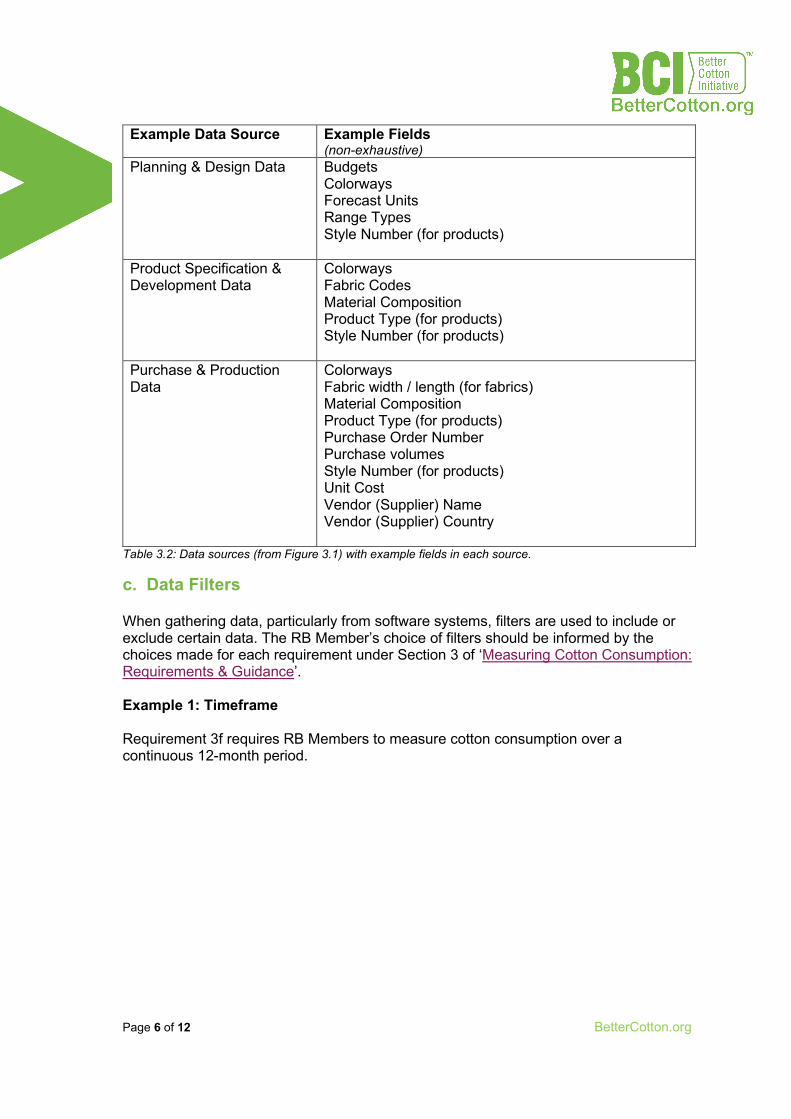
b. Data Completeness To successfully measure cotton consumption, the data record used must include certain essential fields according to the requirements in “Measuring Cotton Consumption: Requirements & Guidance”. Some RB Members may find that all fields required are contained within a single dataset or database. In other cases, it might be necessary to join multiple datasets together. For example, product purchase data might exist in one software system, with product composition elsewhere belonging to another department. Table 3.2 includes some examples. Depending on the nature of the data and the RB member’s circumstances, it may be possible to use an aggregated report covering multiple data sources. In other situations, the RB member may need to manually aggregate different data sources. Using a field that is common across each data source will help to achieve this, as this will link different data sets together.
Page 6 of 12 BetterCotton.org
Example Data Source Example Fields
(non-exhaustive) Planning & Design Data Budgets
Colorways Forecast Units Range Types Style Number (for products)
Product Specification & Development Data
Colorways Fabric Codes Material Composition Product Type (for products) Style Number (for products)
Purchase & Production Data
Colorways Fabric width / length (for fabrics) Material Composition Product Type (for products) Purchase Order Number Purchase volumes Style Number (for products) Unit Cost Vendor (Supplier) Name Vendor (Supplier) Country
Table 3.2: Data sources (from Figure 3.1) with example fields in each source.
c. Data Filters When gathering data, particularly from software systems, filters are used to include or exclude certain data. The RB Member’s choice of filters should be informed by the choices made for each requirement under Section 3 of ‘Measuring Cotton Consumption: Requirements & Guidance’. Example 1: Timeframe Requirement 3f requires RB Members to measure cotton consumption over a continuous 12-month period.
Page 7 of 12 BetterCotton.org
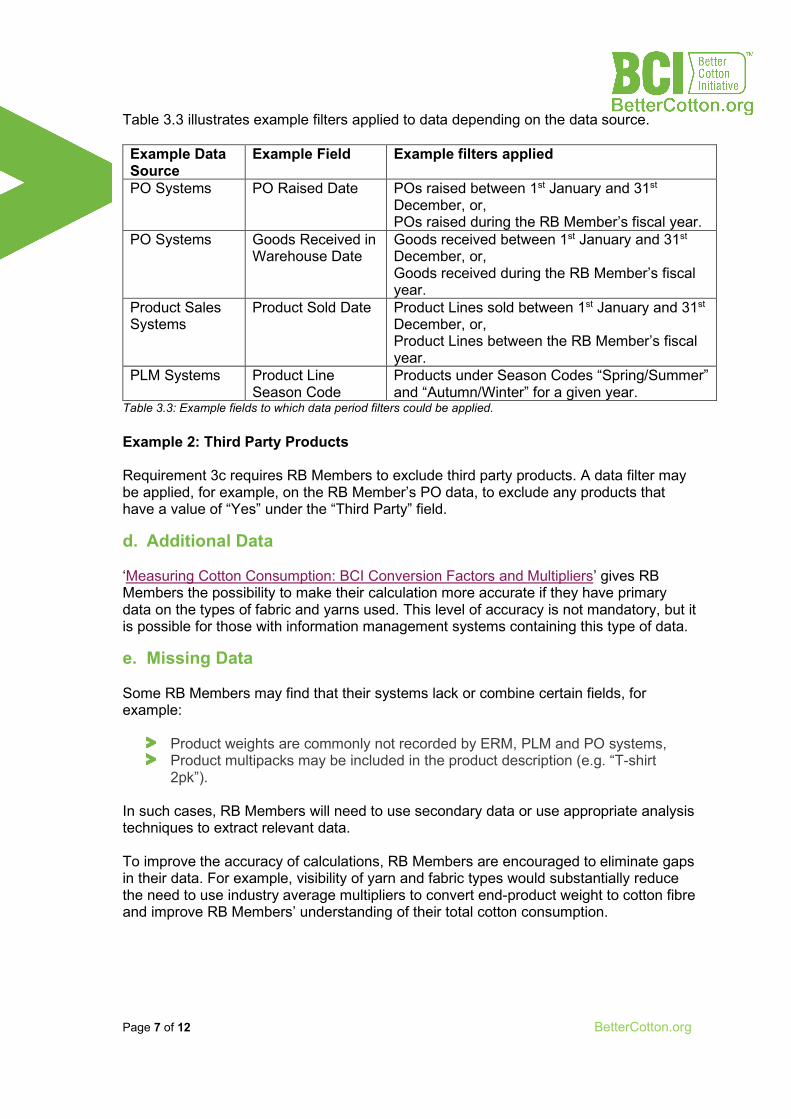
Table 3.3 illustrates example filters applied to data depending on the data source. Example Data Source
Example Field Example filters applied
PO Systems PO Raised Date POs raised between 1st January and 31st December, or, POs raised during the RB Member’s fiscal year.
PO Systems Goods Received in Warehouse Date
Goods received between 1st January and 31st December, or, Goods received during the RB Member’s fiscal year.
Product Sales Systems
Product Sold Date Product Lines sold between 1st January and 31st December, or, Product Lines between the RB Member’s fiscal year.
PLM Systems Product Line Season Code
Products under Season Codes “Spring/Summer” and “Autumn/Winter” for a given year.
Table 3.3: Example fields to which data period filters could be applied. Example 2: Third Party Products Requirement 3c requires RB Members to exclude third party products. A data filter may be applied, for example, on the RB Member’s PO data, to exclude any products that have a value of “Yes” under the “Third Party” field.
d. Additional Data ‘Measuring Cotton Consumption: BCI Conversion Factors and Multipliers’ gives RB Members the possibility to make their calculation more accurate if they have primary data on the types of fabric and yarns used. This level of accuracy is not mandatory, but it is possible for those with information management systems containing this type of data.
e. Missing Data Some RB Members may find that their systems lack or combine certain fields, for example:
Product weights are commonly not recorded by ERM, PLM and PO systems, Product multipacks may be included in the product description (e.g. “T-shirt
2pk”). In such cases, RB Members will need to use secondary data or use appropriate analysis techniques to extract relevant data. To improve the accuracy of calculations, RB Members are encouraged to eliminate gaps in their data. For example, visibility of yarn and fabric types would substantially reduce the need to use industry average multipliers to convert end-product weight to cotton fibre and improve RB Members’ understanding of their total cotton consumption.
Page 8 of 12 BetterCotton.org
4. Calculating Cotton Consumption
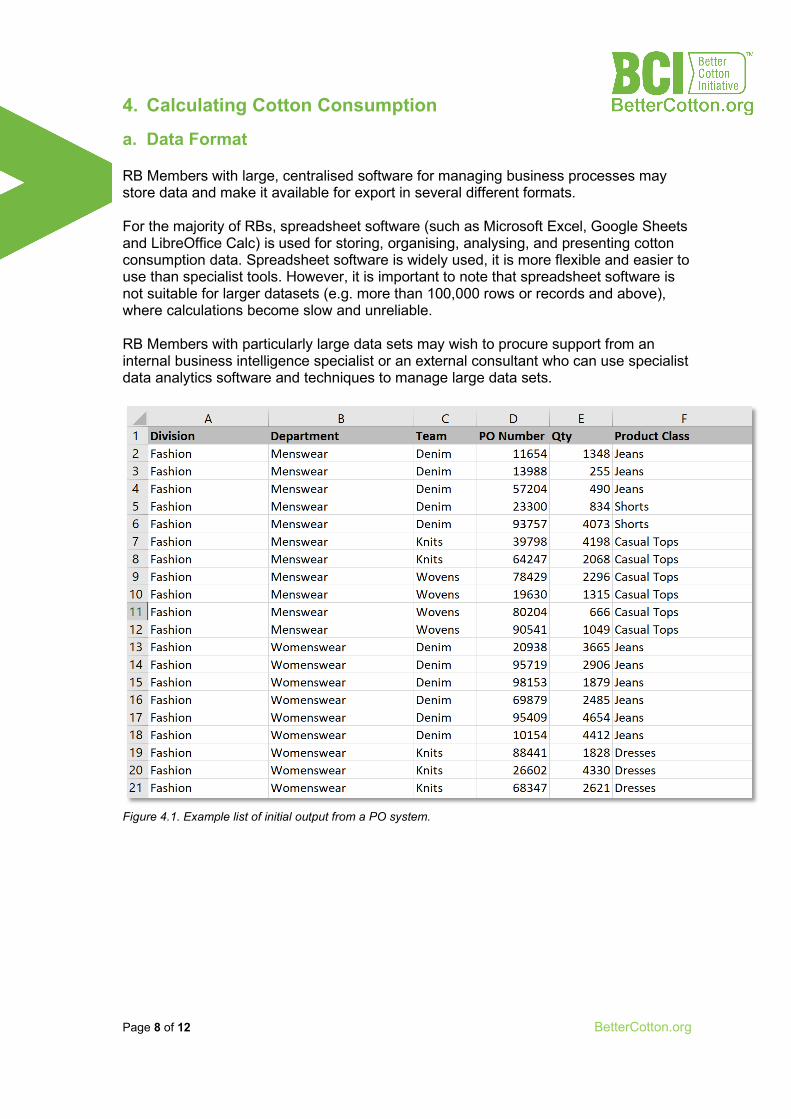
a. Data Format RB Members with large, centralised software for managing business processes may store data and make it available for export in several different formats. For the majority of RBs, spreadsheet software (such as Microsoft Excel, Google Sheets and LibreOffice Calc) is used for storing, organising, analysing, and presenting cotton consumption data. Spreadsheet software is widely used, it is more flexible and easier to use than specialist tools. However, it is important to note that spreadsheet software is not suitable for larger datasets (e.g. more than 100,000 rows or records and above), where calculations become slow and unreliable. RB Members with particularly large data sets may wish to procure support from an internal business intelligence specialist or an external consultant who can use specialist data analytics software and techniques to manage large data sets.
Figure 4.1. Example list of initial output from a PO system.
Page 9 of 12 BetterCotton.org
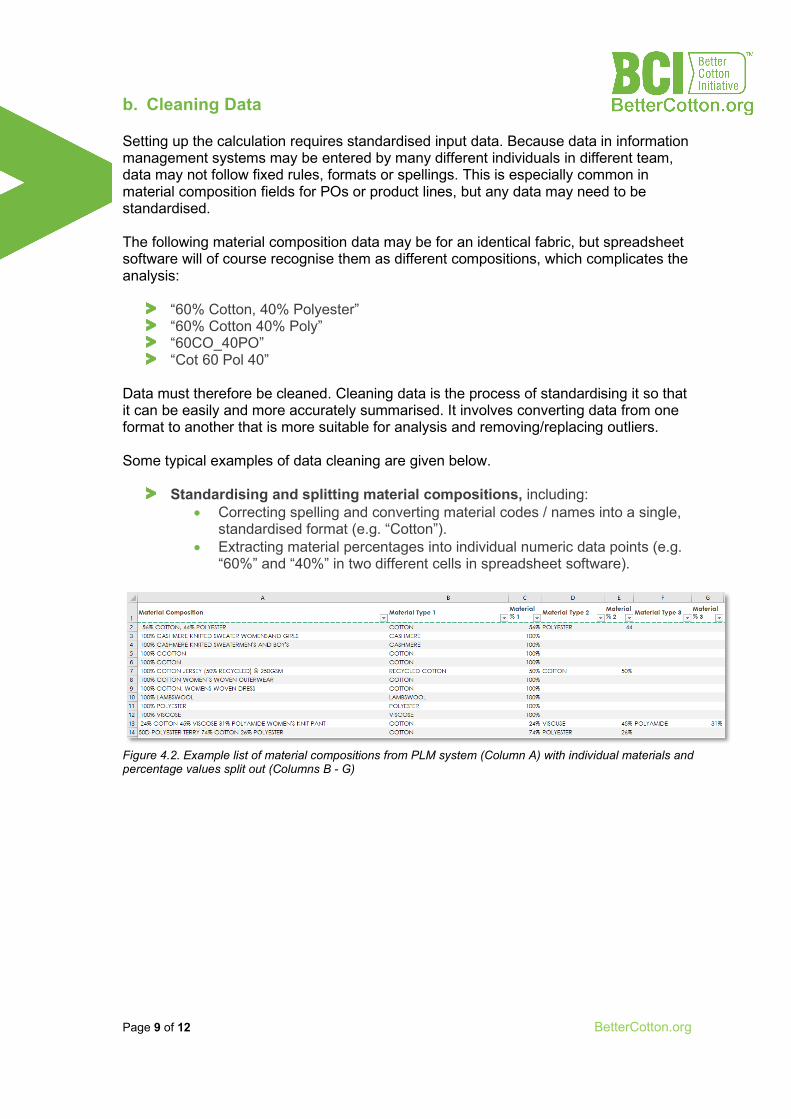
b. Cleaning Data Setting up the calculation requires standardised input data. Because data in information management systems may be entered by many different individuals in different team, data may not follow fixed rules, formats or spellings. This is especially common in material composition fields for POs or product lines, but any data may need to be standardised. The following material composition data may be for an identical fabric, but spreadsheet software will of course recognise them as different compositions, which complicates the analysis:
“60% Cotton, 40% Polyester” “60% Cotton 40% Poly” “60CO_40PO” “Cot 60 Pol 40”
Data must therefore be cleaned. Cleaning data is the process of standardising it so that it can be easily and more accurately summarised. It involves converting data from one format to another that is more suitable for analysis and removing/replacing outliers. Some typical examples of data cleaning are given below.
Standardising and splitting material compositions, including: • Correcting spelling and converting material codes / names into a single,
standardised format (e.g. “Cotton”). • Extracting material percentages into individual numeric data points (e.g.
“60%” and “40%” in two different cells in spreadsheet software).
Figure 4.2. Example list of material compositions from PLM system (Column A) with individual materials and percentage values split out (Columns B - G)
Page 10 of 12 BetterCotton.org
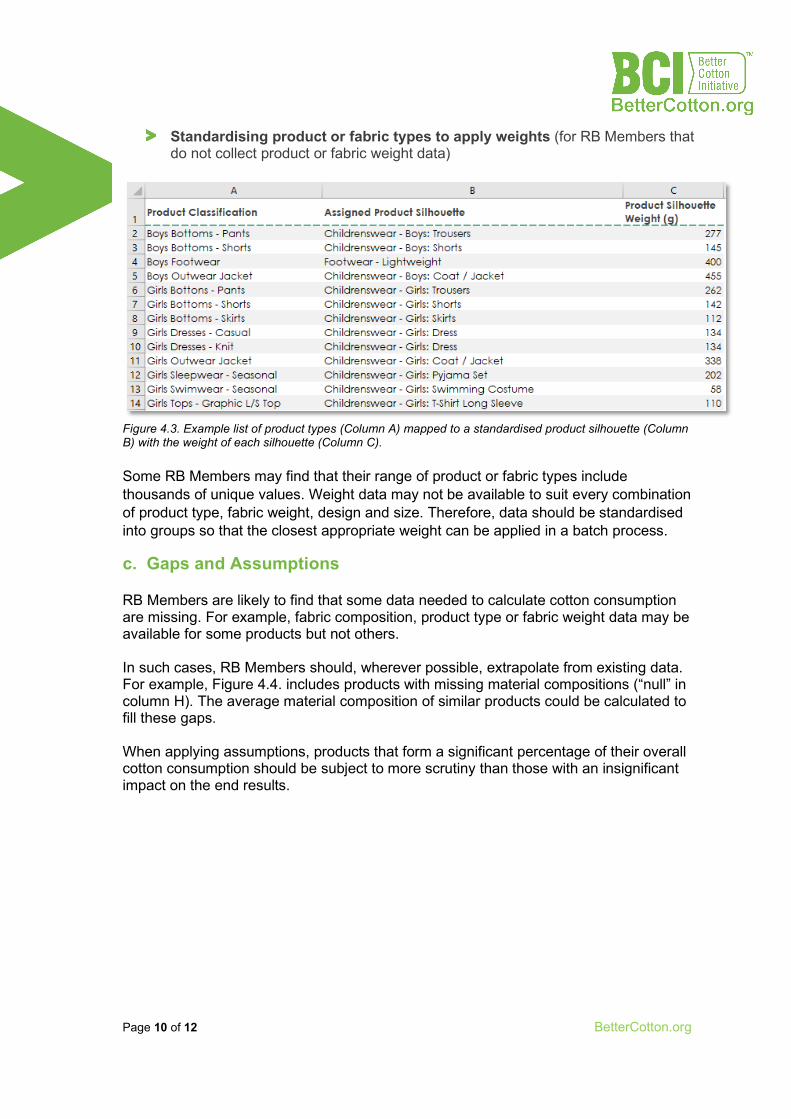
Standardising product or fabric types to apply weights (for RB Members that do not collect product or fabric weight data)
Figure 4.3. Example list of product types (Column A) mapped to a standardised product silhouette (Column B) with the weight of each silhouette (Column C). Some RB Members may find that their range of product or fabric types include thousands of unique values. Weight data may not be available to suit every combination of product type, fabric weight, design and size. Therefore, data should be standardised into groups so that the closest appropriate weight can be applied in a batch process.
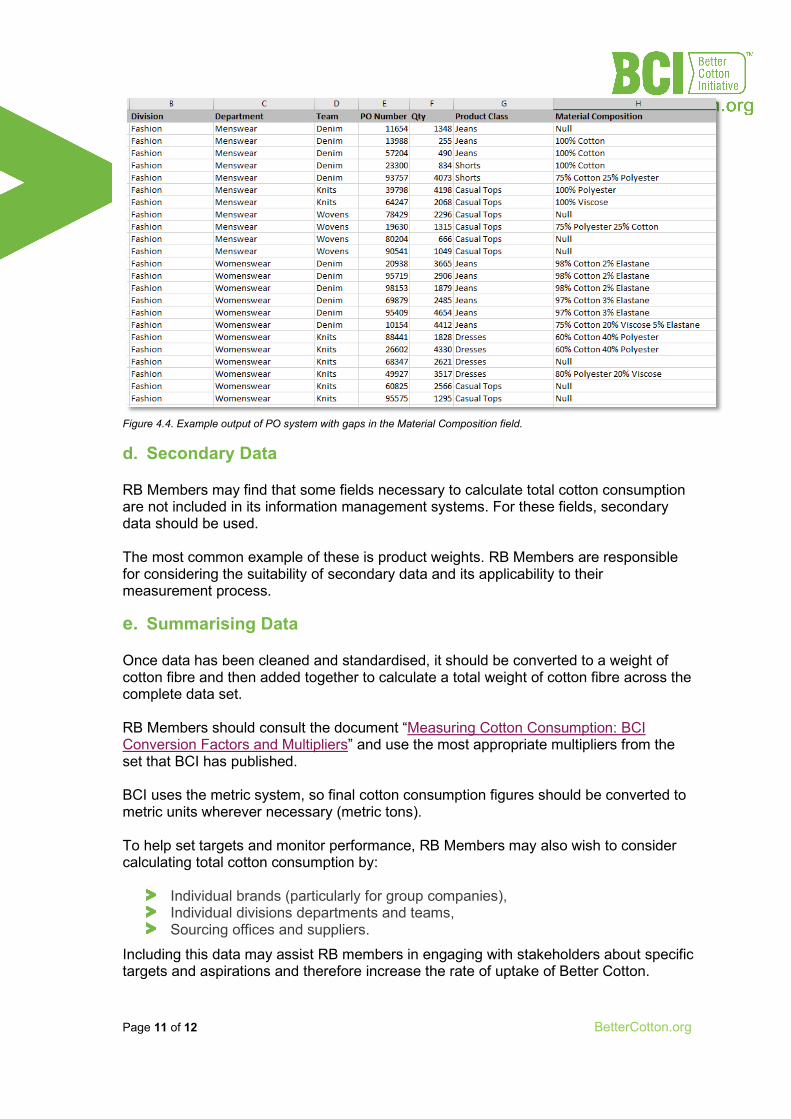
c. Gaps and Assumptions RB Members are likely to find that some data needed to calculate cotton consumption are missing. For example, fabric composition, product type or fabric weight data may be available for some products but not others. In such cases, RB Members should, wherever possible, extrapolate from existing data. For example, Figure 4.4. includes products with missing material compositions (“null” in column H). The average material composition of similar products could be calculated to fill these gaps. When applying assumptions, products that form a significant percentage of their overall cotton consumption should be subject to more scrutiny than those with an insignificant impact on the end results.
Page 11 of 12 BetterCotton.org
Figure 4.4. Example output of PO system with gaps in the Material Composition field.
d. Secondary Data RB Members may find that some fields necessary to calculate total cotton consumption are not included in its information management systems. For these fields, secondary data should be used. The most common example of these is product weights. RB Members are responsible for considering the suitability of secondary data and its applicability to their measurement process.
e. Summarising Data Once data has been cleaned and standardised, it should be converted to a weight of cotton fibre and then added together to calculate a total weight of cotton fibre across the complete data set. RB Members should consult the document “Measuring Cotton Consumption: BCI Conversion Factors and Multipliers” and use the most appropriate multipliers from the set that BCI has published. BCI uses the metric system, so final cotton consumption figures should be converted to metric units wherever necessary (metric tons). To help set targets and monitor performance, RB Members may also wish to consider calculating total cotton consumption by:
Individual brands (particularly for group companies), Individual divisions departments and teams, Sourcing offices and suppliers.
Including this data may assist RB members in engaging with stakeholders about specific targets and aspirations and therefore increase the rate of uptake of Better Cotton.
Page 12 of 12 BetterCotton.org
5. BCI Cotton Calculator Tool If data such as product or fabric weights are not available and RB Members have no way of obtaining such data, BCI offers a Cotton Calculator Tool that can be used as an alternative. The Cotton Calculator Tool offers average product weights for common apparel and home textile products. Using these average product weights is acceptable in cases where primary data is not available within the company, but please note that this will decrease the accuracy of the final calculation.
6. Additional Resources BCI sources
Measuring Cotton Consumption: BCI Conversion Factors and Multipliers. Measuring Cotton Consumption: Requirements & Guidance. BCI Cotton Calculator Tool BCI Annual Cotton Consumption Submission Form.
Further reading
Textile Exchange: Corporate Fiber and Materials Benchmark (CFMB) “Fiber Uptake Calculations & Reporting Best Practices Guide, 2019.”