Embed Size (px)
Citation preview
THIS REPORT CONTAINS ASSESSMENTS OF COMMODITY AND TRADE ISSUES MADE BY
USDA STAFF AND NOT NECESSARILY STATEMENTS OF OFFICIAL U.S. GOVERNMENT
POLICY
Required Report - public distribution
Date: 4/2/2018
GAIN Report Number: IN8033
India
Cotton and Products Annual
Consumption Growth Forecast with Policy Incentives
Approved By:
Adam Branson
Prepared By:
Dhruv Sood
Report Highlights:
FAS India’s 2018/19 cotton production forecast is 28.7 million 480 lb. bales on 11.9 million hectares.
Yields should be higher than last year as state officials are expected to monitor seed to fiber crop
development. Mill consumption is forecast higher than last year at 25 million 480 lb. bales as demand
for cotton yarn is expected to rise with government support for textile exports. With mills having strong
interest in foreign cotton, the import forecast is 1.6 million 480 lb. bales.
Commodities:
Cotton
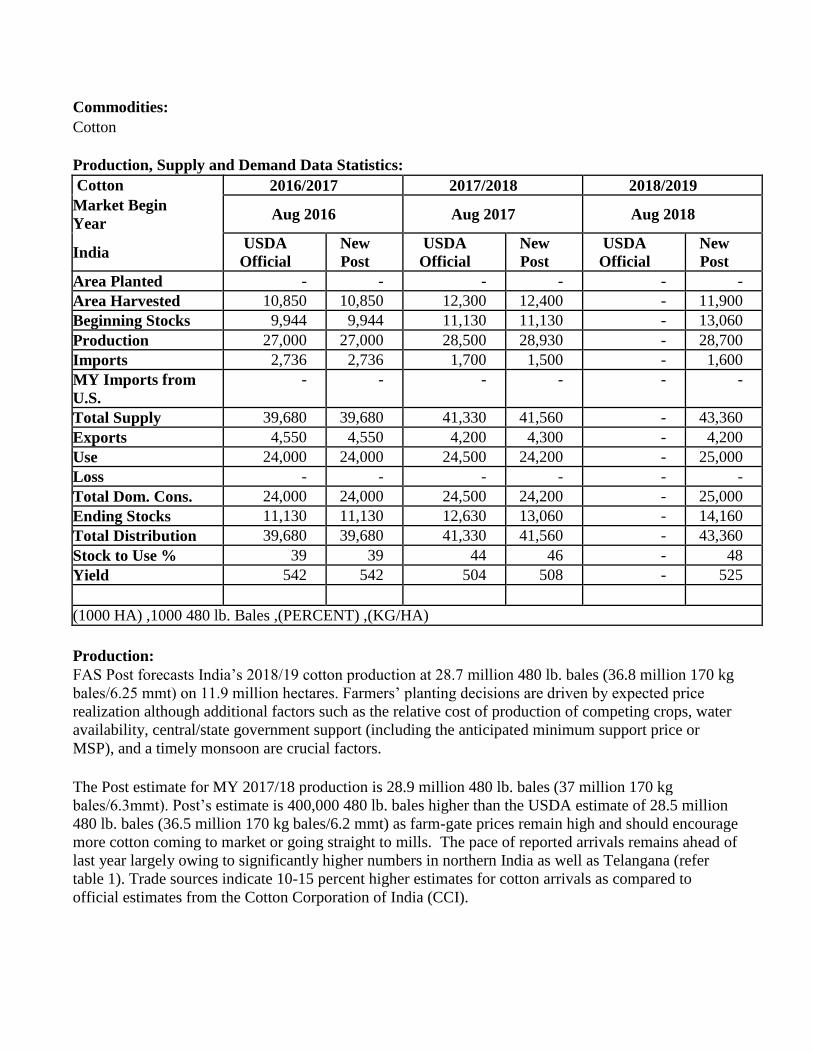
Production, Supply and Demand Data Statistics:
Cotton 2016/2017 2017/2018 2018/2019
Market Begin
Year Aug 2016 Aug 2017 Aug 2018
India USDA
Official New
Post USDA
Official New
Post USDA
Official New
Post
Area Planted - - - - - -
Area Harvested 10,850 10,850 12,300 12,400 - 11,900
Beginning Stocks 9,944 9,944 11,130 11,130 - 13,060
Production 27,000 27,000 28,500 28,930 - 28,700
Imports 2,736 2,736 1,700 1,500 - 1,600
MY Imports from
U.S. - - - - - -
Total Supply 39,680 39,680 41,330 41,560 - 43,360
Exports 4,550 4,550 4,200 4,300 - 4,200
Use 24,000 24,000 24,500 24,200 - 25,000
Loss - - - - - -
Total Dom. Cons. 24,000 24,000 24,500 24,200 - 25,000
Ending Stocks 11,130 11,130 12,630 13,060 - 14,160
Total Distribution 39,680 39,680 41,330 41,560 - 43,360
Stock to Use % 39 39 44 46 - 48
Yield 542 542 504 508 - 525
(1000 HA) ,1000 480 lb. Bales ,(PERCENT) ,(KG/HA)
Production:
FAS Post forecasts India’s 2018/19 cotton production at 28.7 million 480 lb. bales (36.8 million 170 kg
bales/6.25 mmt) on 11.9 million hectares. Farmers’ planting decisions are driven by expected price
realization although additional factors such as the relative cost of production of competing crops, water
availability, central/state government support (including the anticipated minimum support price or
MSP), and a timely monsoon are crucial factors.
The Post estimate for MY 2017/18 production is 28.9 million 480 lb. bales (37 million 170 kg
bales/6.3mmt). Post’s estimate is 400,000 480 lb. bales higher than the USDA estimate of 28.5 million
480 lb. bales (36.5 million 170 kg bales/6.2 mmt) as farm-gate prices remain high and should encourage
more cotton coming to market or going straight to mills. The pace of reported arrivals remains ahead of
last year largely owing to significantly higher numbers in northern India as well as Telangana (refer
table 1). Trade sources indicate 10-15 percent higher estimates for cotton arrivals as compared to
official estimates from the Cotton Corporation of India (CCI).
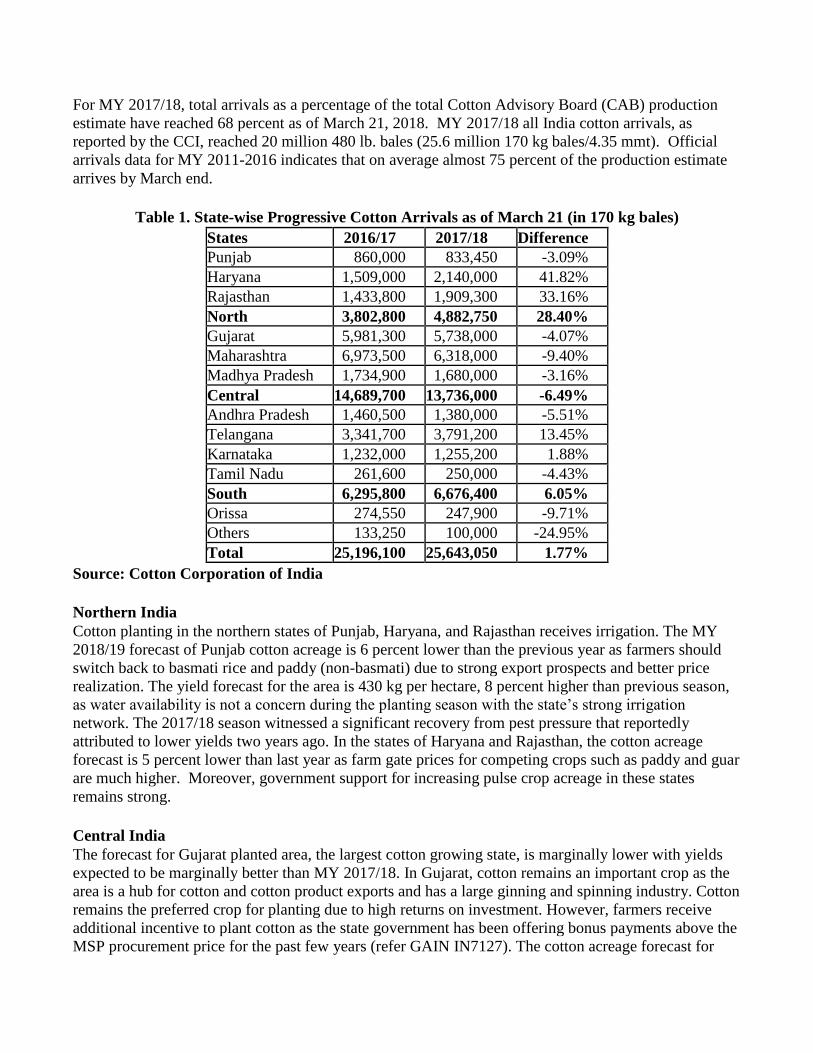
For MY 2017/18, total arrivals as a percentage of the total Cotton Advisory Board (CAB) production
estimate have reached 68 percent as of March 21, 2018. MY 2017/18 all India cotton arrivals, as
reported by the CCI, reached 20 million 480 lb. bales (25.6 million 170 kg bales/4.35 mmt). Official
arrivals data for MY 2011-2016 indicates that on average almost 75 percent of the production estimate
arrives by March end.
Table 1. State-wise Progressive Cotton Arrivals as of March 21 (in 170 kg bales)
States 2016/17 2017/18 Difference Punjab 860,000 833,450 -3.09%
Haryana 1,509,000 2,140,000 41.82%
Rajasthan 1,433,800 1,909,300 33.16%
North 3,802,800 4,882,750 28.40%
Gujarat 5,981,300 5,738,000 -4.07%
Maharashtra 6,973,500 6,318,000 -9.40%
Madhya Pradesh 1,734,900 1,680,000 -3.16%
Central 14,689,700 13,736,000 -6.49% Andhra Pradesh 1,460,500 1,380,000 -5.51%
Telangana 3,341,700 3,791,200 13.45%
Karnataka 1,232,000 1,255,200 1.88%
Tamil Nadu 261,600 250,000 -4.43%
South 6,295,800 6,676,400 6.05%
Orissa 274,550 247,900 -9.71%
Others 133,250 100,000 -24.95%
Total 25,196,100 25,643,050 1.77%
Source: Cotton Corporation of India
Northern India
Cotton planting in the northern states of Punjab, Haryana, and Rajasthan receives irrigation. The MY
2018/19 forecast of Punjab cotton acreage is 6 percent lower than the previous year as farmers should
switch back to basmati rice and paddy (non-basmati) due to strong export prospects and better price
realization. The yield forecast for the area is 430 kg per hectare, 8 percent higher than previous season,
as water availability is not a concern during the planting season with the state’s strong irrigation
network. The 2017/18 season witnessed a significant recovery from pest pressure that reportedly
attributed to lower yields two years ago. In the states of Haryana and Rajasthan, the cotton acreage
forecast is 5 percent lower than last year as farm gate prices for competing crops such as paddy and guar
are much higher. Moreover, government support for increasing pulse crop acreage in these states
remains strong.
Central India
The forecast for Gujarat planted area, the largest cotton growing state, is marginally lower with yields
expected to be marginally better than MY 2017/18. In Gujarat, cotton remains an important crop as the
area is a hub for cotton and cotton product exports and has a large ginning and spinning industry. Cotton
remains the preferred crop for planting due to high returns on investment. However, farmers receive
additional incentive to plant cotton as the state government has been offering bonus payments above the
MSP procurement price for the past few years (refer GAIN IN7127). The cotton acreage forecast for
Maharashtra is lower by 5 percent. Cotton area in central Maharashtra (Marathwada) and Eastern
Maharashtra (Vidarbha) should shift from cotton to soybean and sugar as farmers reportedly suffered
crop losses with pest infestations. While cotton’s relative drought tolerance gives it an edge over
competing crops, reports of pink bollworm infestation in a few districts across the state should prompt
farmers to switch to other crops. A marginal reduction in Madhya Pradesh cotton area is anticipated as
farmers switch to soybeans and pulses as demand from crushers and processors is steady.
As of March 22, the overall water stored in reservoirs in the western states of Gujarat and Maharashtra
was 34 percent of total capacity. At the same time last year, reservoir levels were 39 percent. The ten-
year average capacity level is 37 percent.
Southern India
The combined area forecast for the states of Andhra Pradesh and Telangana for MY 2018/19 is 2.33
million hectares. Combined planted area for the states in MY 2017/18 was 2.46 million. The state
governments of Andhra Pradesh and Telangana have issued notices to curb the supply of illegal
herbicide-tolerant (HT) cotton seed for sowing as well as restrict the use of glyphosate herbicide. It is
expected that a large percentage of area under illegal HT cotton will shift to desi cotton or indigenous
cotton seed species and other crops like pulses (red gram and green gram). The forecast yields in both
states are higher than the three-year average.
As of March 22, the overall water stored in reservoirs for Andhra Pradesh, Telangana, Tamil Nadu,
Karnataka, and Kerala was 21 percent of capacity. At the same time last year, reservoir levels were 16
percent. The ten-year average capacity level is 27 percent.
General Production Outlook – Small Holders Choosing Improved Varieties
Cotton, a predominantly monsoon-season or Kharif crop, is planted from the end of April through
September and harvested in the fall and winter. With the area under Bt cotton and improved varieties
now reaching an estimated 92 percent of total area, prospects for future growth in productivity are
limited as most cotton is grown under rain-fed conditions and on small farms. Cotton plant populations
are relatively low density in India because farmers leave rows large enough to traverse with a bullock
and cultivator for weed control purposes. Lower plant populations are offset to some extent by the
multiple pickings farmers obtain through manual, rather than machine, harvesting.
Researchers are working on production schemes with higher plant populations that could improve
yields. There are an estimated 5.8 million cotton farmers with the average farm size of 1.5 hectares.
Small land holdings seem to limit the ability to adopt capital-intensive production technologies and
infrastructure. Even without changing holdings, yields would likely benefit from improved irrigation,
fertilizer, micronutrients, pests and disease management. Future growth in cotton production is more
likely to come from higher yields rather than area expansion.
India accounts for about one-third of global cotton area. Within India, two-thirds of cotton is produced
in the central cotton growing zone; including, the states of Maharashtra, Madhya Pradesh, Gujarat and
Odisha where much of the crop is rain fed. The northern zone, which consists of the states of Punjab,
Haryana and Rajasthan, produces cotton under irrigated conditions and accounts for about 15 percent of
production. In the south, the states of Andhra Pradesh, Karnataka and Tamil Nadu account for 30
percent of production. The Central and Southern zones typically grow long duration cotton that allows
farmers to reap multiple harvests. While the number of pickings has declined as traditional varieties are
replaced by biotech hybrids, farmers can still manage up to five pickings per plant depending on
weather conditions. In contrast, the irrigated cotton in the northern zone is mostly a short season crop
that fits into a cotton-wheat cropping system.
Various federal and state government agencies and research institutions are engaged in cotton varietal
development, seed distribution, crop surveillance, integrated pest management, extension, and
marketing activities. In 1999, the federal government launched the Technology Mission on Cotton
(TMC) to improve the availability of quality cotton at reasonable prices. The goal of the TMC is to
bring about improvement in the production, productivity and quality of cotton through research,
technology transfer, and improvement in the marketing and raw cotton processing sectors.
Biotech Cotton – Widely Adopted for Medium and Long Staple Cottons
Since its introduction in 2002, Bt cotton has been widely adopted and now accounts for an estimated 92
percent of total cotton area and over 95 percent of India’s cotton production. The Government of India
has approved six biotech cotton events and more than 300 hybrids for cultivation in different agro-
climatic zones. One of the results of the adoption of Bt cotton has been a significant shift in the varietal
profile and share of different types of cotton being produced in India. Most of the Bt hybrids are of
medium and long staple cotton (26 to 32 mm) which has resulted in declining production of short staple
(below 22 mm) and extra-long staple (35 mm and above) cotton. If the current trend continues, the
domestic textile industry may seek to augment their short staple cotton requirements through imports.
Post is aware that GOI research institutes are developing non-Bt biotech cotton for sowing, but, at this
time, it is not approved for commercial use.
MSP Viewed as a Solution to all Cotton Problems
The GOI establishes a MSP for seed cotton. New MSP prices are announced annually and may or may
not precede the start of planting. The CCI, a government-run procurement and distribution company, is
responsible for price support operations in all states. CCI, in addition to buying at MSP and marketing
that cotton through an auction, is active in the market at other times and buys or sells as conditions
dictate. For MSP operations, CCI is assisted occasionally by other federal or state government
marketing organizations (e.g., the Maharashtra State Co-op Cotton Growers Marketing Federation or
Mahacot) to purchase cotton in support of local producers. State officials in Gujarat, too, have added a
premium in the past on top of the MSP to support local producers. With the objective of doubling
farmers’ income by 2022, the GOI reports that it intends to maintain a price stabilization fund to deal
with abrupt price increases in commodities by creating buffer stocks through its state parastatals and
ensuring higher returns for farmers.
On February 1, 2018, the Finance Minister presented the GOI annual budget for IFY 2018/19. The
Minister announced that a MSP valued at 1.5 times the cost of production will be used as a principle for
determining the MSP level for all crops during the upcoming 2018/19 kharif season (fall harvested) for
a number of crops (e.g., rice, maize, cotton, various coarse grains, oilseeds, and pulses). There is no
formal announcement on finalization of the MSP calculation formula which is still under review.
The GOI continues promoting crop diversification across various states by increasing the MSP for food
crops at higher levels of growth than the growth rate for cotton. Also, with reports of pest pressure on
the cotton crop, stakeholders may naturally explore alternatives, but the recent GOI order lowering the
sales price for cotton seed for sowing could incentivize farmers to plant more cotton.
Production, Supply and Demand Data Statistics:
Extra Long Staple Cotton:
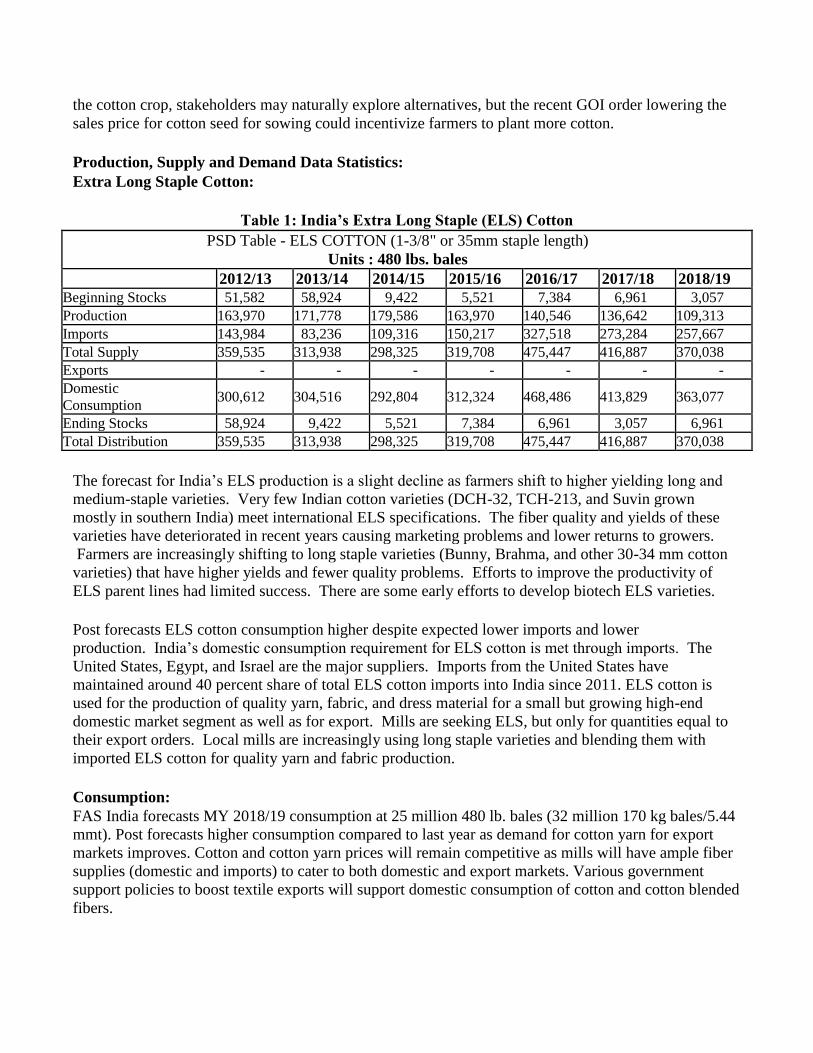
Table 1: India’s Extra Long Staple (ELS) Cotton
PSD Table - ELS COTTON (1-3/8" or 35mm staple length)
Units : 480 lbs. bales
2012/13 2013/14 2014/15 2015/16 2016/17 2017/18 2018/19 Beginning Stocks 51,582 58,924 9,422 5,521 7,384 6,961 3,057
Production 163,970 171,778 179,586 163,970 140,546 136,642 109,313
Imports 143,984 83,236 109,316 150,217 327,518 273,284 257,667
Total Supply 359,535 313,938 298,325 319,708 475,447 416,887 370,038
Exports - - - - - - -
Domestic
Consumption 300,612 304,516 292,804 312,324 468,486 413,829 363,077
Ending Stocks 58,924 9,422 5,521 7,384 6,961 3,057 6,961
Total Distribution 359,535 313,938 298,325 319,708 475,447 416,887 370,038
The forecast for India’s ELS production is a slight decline as farmers shift to higher yielding long and
medium-staple varieties. Very few Indian cotton varieties (DCH-32, TCH-213, and Suvin grown
mostly in southern India) meet international ELS specifications. The fiber quality and yields of these
varieties have deteriorated in recent years causing marketing problems and lower returns to growers.
Farmers are increasingly shifting to long staple varieties (Bunny, Brahma, and other 30-34 mm cotton
varieties) that have higher yields and fewer quality problems. Efforts to improve the productivity of
ELS parent lines had limited success. There are some early efforts to develop biotech ELS varieties.
Post forecasts ELS cotton consumption higher despite expected lower imports and lower
production. India’s domestic consumption requirement for ELS cotton is met through imports. The
United States, Egypt, and Israel are the major suppliers. Imports from the United States have
maintained around 40 percent share of total ELS cotton imports into India since 2011. ELS cotton is
used for the production of quality yarn, fabric, and dress material for a small but growing high-end
domestic market segment as well as for export. Mills are seeking ELS, but only for quantities equal to
their export orders. Local mills are increasingly using long staple varieties and blending them with
imported ELS cotton for quality yarn and fabric production.
Consumption:
FAS India forecasts MY 2018/19 consumption at 25 million 480 lb. bales (32 million 170 kg bales/5.44
mmt). Post forecasts higher consumption compared to last year as demand for cotton yarn for export
markets improves. Cotton and cotton yarn prices will remain competitive as mills will have ample fiber
supplies (domestic and imports) to cater to both domestic and export markets. Various government
support policies to boost textile exports will support domestic consumption of cotton and cotton blended
fibers.
Post’s estimate for MY 2017/18 cotton consumption is 24.2 million 480 bales. Post estimate is 300,000
480 lb. bales lower than the USDA official estimate. The lower consumption is based on the revised
textile consumption data (refer table 4). The textile industry continues to face delays related to
reimbursements for goods and service tax (GST) claims which affects the working capital of small- to
medium-sized mills.
For MY 2017/18, the average monthly cotton consumption is estimated at 1.89 million 480 lb. bales
(2.42 million 170 kg bales/411,934 MT). Data from office of the Textile Commissioner shows per
month cotton consumption for MY 2016/17 averages 1.89 million 480 lb. bales (2.42 million 170 kg
bales/412,152 MT).
Since 2003, India’s has been a net cotton producer as production outpaced consumption and the country
generated a large exportable surplus. Domestic mill consumption was growing for the past few years
with additional capacity added in many cotton-growing states. The growth was championed by
favorable textile policies at the federal and state levels of government. Another trend has been forward
integration by ginners that set up small spinning units to focus on production of cotton and blended
yarns. The fiber share in textile mill consumption is heavily skewed in favor of cotton (73 percent) as
compared to man-made fiber (27 percent) (refer table 13). However, volatile cotton prices, weak
demand, and cheaper man-made fibers are pushing consumption towards more blends and cotton waste.
While the national textile policy discusses fiber neutrality, the GOI has set schemes geared towards
promoting natural fibers. India produced 2.1 MMT of man-made fiber (MMF) and yarn in India fiscal
year (IFY) 2016/17 (Apr/Mar) (refer to tables 9 and 10) while consumption of MMF fiber and yarn in
IFY 2016/17 was 1.7 MMT. Trade indicates there is low capacity utilization in India as demand is low,
but consumption is rising and is expected to reach significant volumes in the next five years as younger
generations are adapting to newer fashion styles.
Competition for cotton from MMF has become more pronounced in recent years with a buildup of
capacity in India. Within the segment of MMF, polyester is by far the most dominant fiber type. Price
volatility and high cotton prices compared to MMF led to a certain level of demand destruction.
Additionally, there is an increase in sales of active wear and functional sportswear. Infrastructure issues,
capital costs, and central and state taxation at the fiber level make MMF a costly option for textile mills
as there are only a few large players operating in the MMF sector.
Trade:
FAS Post forecasts MY 2018/19 exports at 4.2 million 480 lb. bales (5.4 million 170 kg bales/ 914,442
mt). Export prospects for MY 2018/19 seem weak as global demand for cotton from alternate origins is
much higher. While Indian Ex-gin prices have risen by only 7 percent since the beginning of MY
2017/18 and the Cotlook A-Index (FE) has risen by 18 percent, despite being price competitive, Indian
cotton technical and quality parameters affect export prospects.
Bangladesh remained the top cotton export destination, followed by Vietnam, Pakistan, and China.
Preliminary cotton yarn export data shows signs of improvement through December, followed by a
slowdown in January and February. Bangladesh, followed by China, Pakistan, and Portugal were top
export markets for cotton yarn. Bangladesh, Sri Lanka, the United States, and Senegal were the top
destinations for cotton fabric exports.
The FAS Post MY 2018/19 import forecast is 1.6 million 480 lb. bales (2 million 170 kg bales/ 348,359
mt). Even though a large crop is expected, imports will remain strong as mills import for processing and
re-export to cover yarn export commitments. Mills have shown strong preference for cotton from the
United States and Australia followed by some West African cotton in the past two years. Mills indicate
shipments from both the countries will remain strong as long as technical parameters are consistent.
For MY 2017/18, the import estimate is 200,000 480 lb. bales lower than the USDA official estimate at
1.5 million 480 lb. bales (1.9 million 170 kg bales/326,587). Post estimates that import demand will
slow down for the remainder of the marketing year as yarn and fabric exports slow and mills only
import as per their requirements.
Stocks:
Cotton disappearance remains a major issue affecting crop production estimates. The picking,
transportation, and sale of seed cotton are determined on a ‘per kilo’ basis. Stakeholders at nearly every
stage in the fragmented supply chain attempt to increase delivery weight. At the farm level, a hired
laborer or cotton picker may add immature bolls or pick at a time of day when the moisture content is
highest. A recurring phenomenon is that transporters may add additional water/moisture so that s/he
can remove some seed cotton, combine it with other loads, and extend their total volumes and get
additional profit by selling the wet seed cotton to ginners.
In addition, increasingly, sources report that at the ginning and pressing stage, ginners are sourcing seed
cotton directly from farmers and bypassing wholesale market yards to avoid market committee fees.
Consequently, market arrivals are not registered. As such, volumes are unreported and using this
metric of market yard arrivals could lead to lower than expected overall production estimate as arrivals
at fixed dates in comparison to prior years becomes a less reliable tool. In addition, blending of cotton
grades and misreporting of gin and mill stocks are other factors affecting production estimates and
carryover.
Trade sources indicate the official USDA estimate of Indian stock levels is higher in comparison with
the number that they carry for the crop. However, there is no Government of India official breakup or
analysis of stock positions and the market function is subject to a number of influences. According to
the data provided by the Textile Commissioner’s Office (TCO), cotton stocks in MY 2017/18 between
August and January were the highest since MY 2009/10. Stocks accumulated between November and
January were on average 30 percent higher than the same period last year. Mills continue building larger
inventories in anticipation of higher prices as the industry approaches the latter half of the season.
Policy:
The GOI has enacted a variety of trade policies to ensure competitively-priced and adequate supplies of
cotton are available to the textile industry. India’s national fiber policy affirms that cotton exports
should be limited to an exportable surplus. Cotton and cotton yarn exports are allowed under an Open
General License (OGL) without any quantitative restrictions.
Value Addition to Cotton Critical to Indian Economy
The textile and clothing industry is largely cotton-based and is the second largest provider of
employment after agriculture. The industry accounts for 12 percent of total industrial production, 15
percent of total export earnings, two percent of GDP, and provides direct employment to over 45
million people and indirect employment to an additional 55 million people. The “organized” or modern
textile sector accounts for 80 percent of the industry. Domestic demand is supported by a rising
consumer class with greater disposable income that wants readymade garments and home textiles.
Cotton faces competition from India’s large MMF industry.
In MY 2017, the GOI announced a number of schemes and programs to support the textile industry
(refer table 16 for major policy changes). For additional information, see the Ministry of Textiles -
Policies/Schemes/Initiatives
India’s textile industry would benefit from increased value addition by weaving and garment
manufacturing, but the industry continues emphasizing spinning sector expansion. The Indian textile
industry includes both an "organized" sector (large-scale spinning units and composite mills) and an
"unorganized" sector (small-scale spinning units, power looms, handlooms, hosiery units). More than
95 percent of yarn is from the organized sector. The weaving industry is represented more by the
unorganized sector as power looms account for 59 percent of cloth production while hosiery units and
handlooms represent; respectively, 26 percent and 11 percent of total cloth production. The organized
sector weaving mills account for the remaining four percent of cloth production. Cotton and cotton
blend textile exports account for 45 percent of total textile exports. Cotton ready-made garments
account for the major share of cotton textile exports followed by cotton yarn and cotton fabric. Cotton
yarn exports have been on open general license (i.e., not subject to quotas) since April 2011. For
additional information on textile exports and production see table 14 at the end of this report.
Marketing:
India exports medium-to-long staple cotton (25 to 32 mm length) to China, Bangladesh and several
Southeast Asian countries. India likely will continue to import extra-long staple (ELS) and quality long
staple cotton (28-34 mm) with occasional imports of medium or short-staple cotton (below 22 mm)
when international prices are favorable. The United States is the leading supplier of cotton to India over
the past few years. Indian mills importing U.S. Pima and upland cotton recognize its quality and
consistency and are ready to pay a premium over competing origins. However, U.S. cotton faces
competition from suppliers like Egypt and Australia due to occasional freight advantages and shorter
delivery periods. Due to warm weather conditions and cultural traditions, cotton is typically the
preferred fiber in India. However, poly-cotton blends are popular due to their durability and ease of
maintenance.
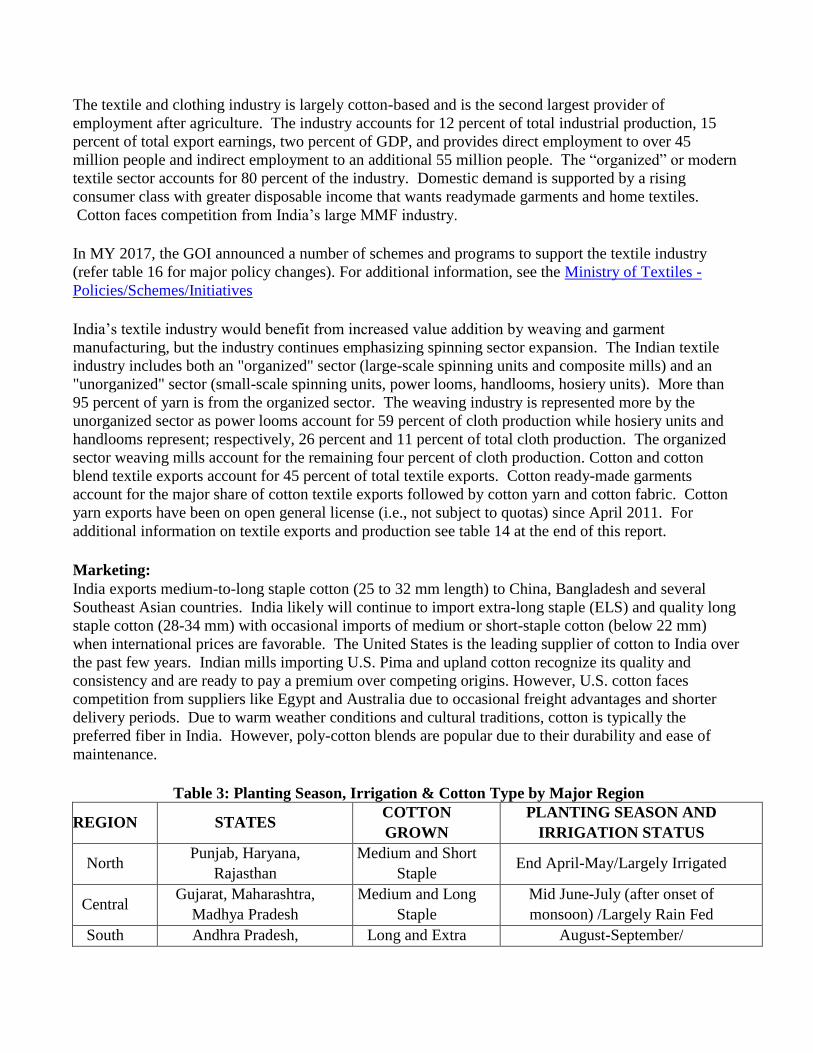
Table 3: Planting Season, Irrigation & Cotton Type by Major Region
REGION STATES COTTON
GROWN
PLANTING SEASON AND
IRRIGATION STATUS
North Punjab, Haryana,
Rajasthan
Medium and Short
Staple End April-May/Largely Irrigated
Central Gujarat, Maharashtra,
Madhya Pradesh
Medium and Long
Staple
Mid June-July (after onset of
monsoon) /Largely Rain Fed
South Andhra Pradesh, Long and Extra August-September/
Karnataka, Tamil Nadu Long Staple Largely Rain Fed
Note: There is a small cotton crop planted in January and February in South India
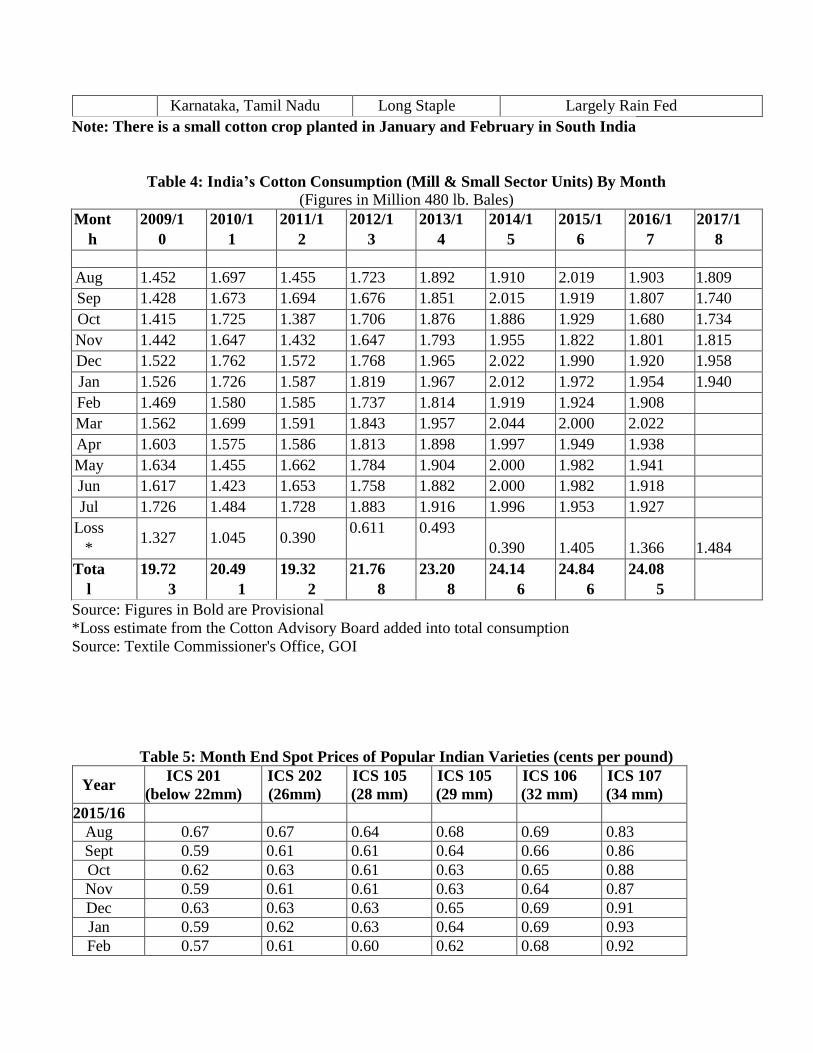
Table 4: India’s Cotton Consumption (Mill & Small Sector Units) By Month (Figures in Million 480 lb. Bales)
Mont
h
2009/1
0
2010/1
1
2011/1
2
2012/1
3
2013/1
4
2014/1
5
2015/1
6
2016/1
7
2017/1
8
Aug 1.452 1.697 1.455 1.723 1.892 1.910 2.019 1.903 1.809
Sep 1.428 1.673 1.694 1.676 1.851 2.015 1.919 1.807 1.740
Oct 1.415 1.725 1.387 1.706 1.876 1.886 1.929 1.680 1.734
Nov 1.442 1.647 1.432 1.647 1.793 1.955 1.822 1.801 1.815
Dec 1.522 1.762 1.572 1.768 1.965 2.022 1.990 1.920 1.958
Jan 1.526 1.726 1.587 1.819 1.967 2.012 1.972 1.954 1.940
Feb 1.469 1.580 1.585 1.737 1.814 1.919 1.924 1.908
Mar 1.562 1.699 1.591 1.843 1.957 2.044 2.000 2.022
Apr 1.603 1.575 1.586 1.813 1.898 1.997 1.949 1.938
May 1.634 1.455 1.662 1.784 1.904 2.000 1.982 1.941
Jun 1.617 1.423 1.653 1.758 1.882 2.000 1.982 1.918
Jul 1.726 1.484 1.728 1.883 1.916 1.996 1.953 1.927
Loss
* 1.327 1.045 0.390
0.611 0.493
0.390 1.405 1.366 1.484
Tota
l
19.72
3
20.49
1
19.32
2
21.76
8
23.20
8
24.14
6
24.84
6
24.08
5
Source: Figures in Bold are Provisional
*Loss estimate from the Cotton Advisory Board added into total consumption Source: Textile Commissioner's Office, GOI
Table 5: Month End Spot Prices of Popular Indian Varieties (cents per pound)
Year ICS 201
(below 22mm)
ICS 202
(26mm)
ICS 105
(28 mm)
ICS 105
(29 mm)
ICS 106
(32 mm)
ICS 107
(34 mm)
2015/16
Aug 0.67 0.67 0.64 0.68 0.69 0.83
Sept 0.59 0.61 0.61 0.64 0.66 0.86
Oct 0.62 0.63 0.61 0.63 0.65 0.88
Nov 0.59 0.61 0.61 0.63 0.64 0.87
Dec 0.63 0.63 0.63 0.65 0.69 0.91
Jan 0.59 0.62 0.63 0.64 0.69 0.93
Feb 0.57 0.61 0.60 0.62 0.68 0.92
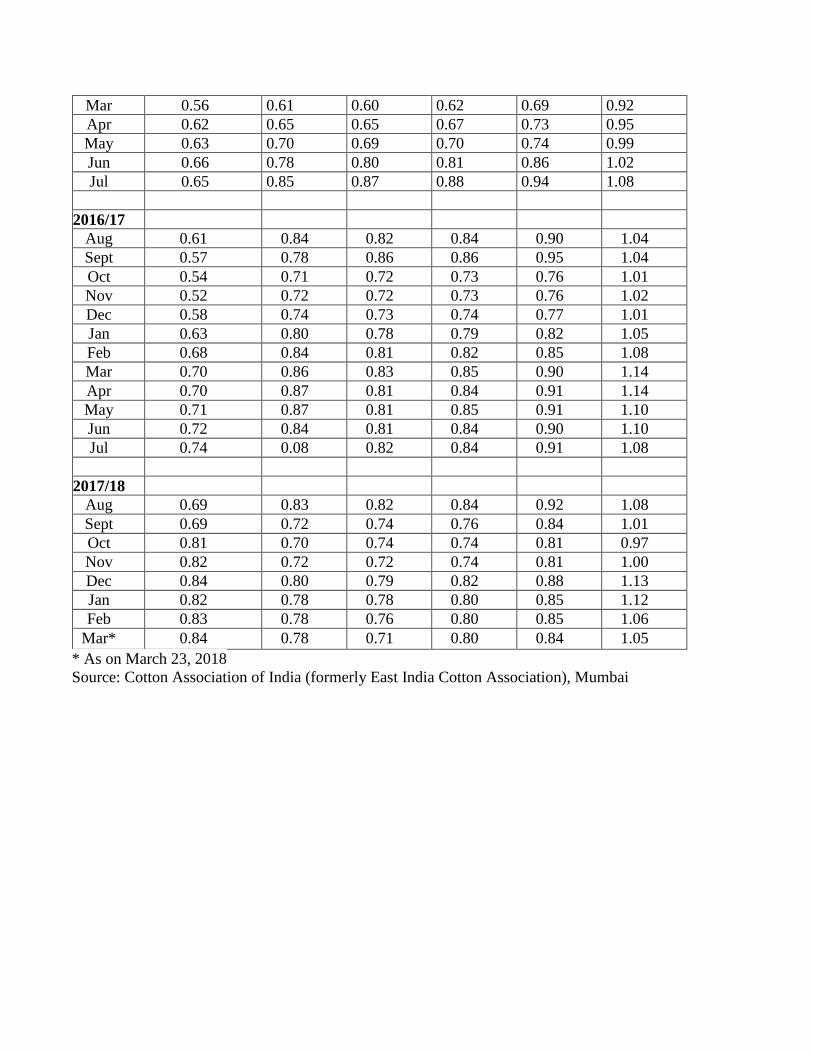
Mar 0.56 0.61 0.60 0.62 0.69 0.92
Apr 0.62 0.65 0.65 0.67 0.73 0.95
May 0.63 0.70 0.69 0.70 0.74 0.99
Jun 0.66 0.78 0.80 0.81 0.86 1.02
Jul 0.65 0.85 0.87 0.88 0.94 1.08
2016/17
Aug 0.61 0.84 0.82 0.84 0.90 1.04
Sept 0.57 0.78 0.86 0.86 0.95 1.04
Oct 0.54 0.71 0.72 0.73 0.76 1.01
Nov 0.52 0.72 0.72 0.73 0.76 1.02
Dec 0.58 0.74 0.73 0.74 0.77 1.01
Jan 0.63 0.80 0.78 0.79 0.82 1.05
Feb 0.68 0.84 0.81 0.82 0.85 1.08
Mar 0.70 0.86 0.83 0.85 0.90 1.14
Apr 0.70 0.87 0.81 0.84 0.91 1.14
May 0.71 0.87 0.81 0.85 0.91 1.10
Jun 0.72 0.84 0.81 0.84 0.90 1.10
Jul 0.74 0.08 0.82 0.84 0.91 1.08
2017/18
Aug 0.69 0.83 0.82 0.84 0.92 1.08
Sept 0.69 0.72 0.74 0.76 0.84 1.01
Oct 0.81 0.70 0.74 0.74 0.81 0.97
Nov 0.82 0.72 0.72 0.74 0.81 1.00
Dec 0.84 0.80 0.79 0.82 0.88 1.13
Jan 0.82 0.78 0.78 0.80 0.85 1.12
Feb 0.83 0.78 0.76 0.80 0.85 1.06
Mar* 0.84 0.78 0.71 0.80 0.84 1.05
* As on March 23, 2018
Source: Cotton Association of India (formerly East India Cotton Association), Mumbai
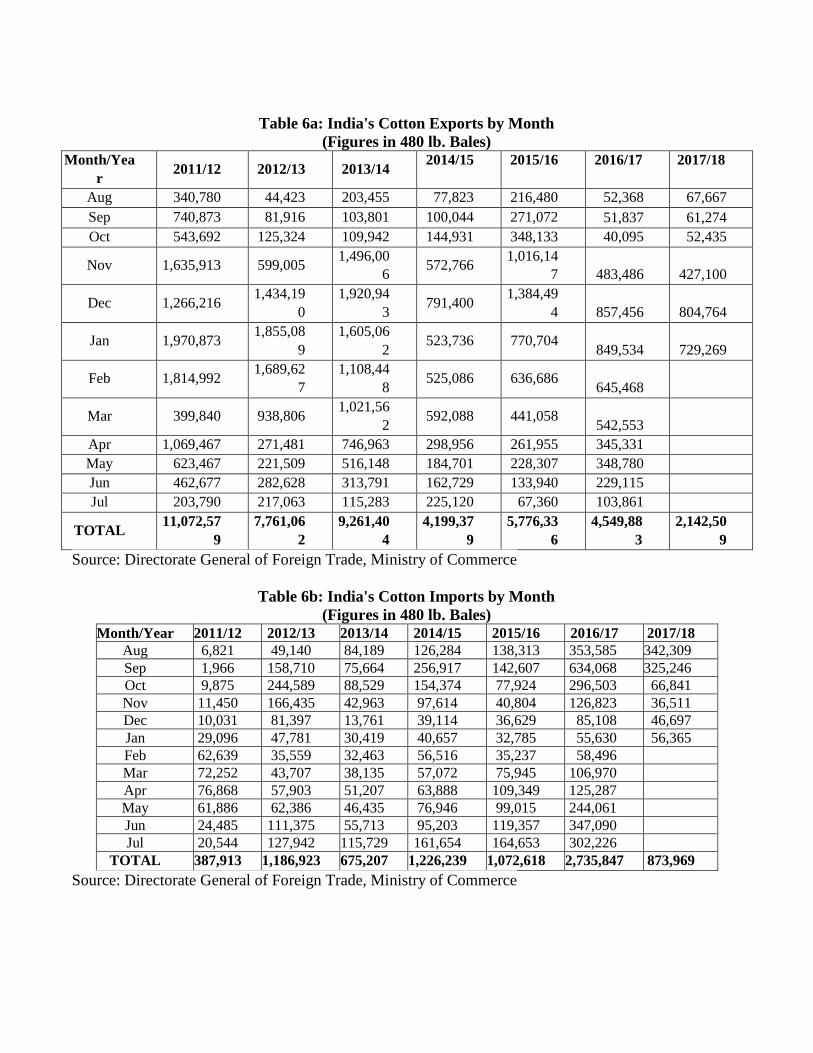
Table 6a: India's Cotton Exports by Month
(Figures in 480 lb. Bales) Month/Yea
r 2011/12 2012/13 2013/14
2014/15 2015/16 2016/17 2017/18
Aug 340,780 44,423 203,455 77,823 216,480 52,368 67,667
Sep 740,873 81,916 103,801 100,044 271,072 51,837 61,274
Oct 543,692 125,324 109,942 144,931 348,133 40,095 52,435
Nov 1,635,913 599,005 1,496,00
6 572,766
1,016,14
7 483,486 427,100
Dec 1,266,216 1,434,19
0
1,920,94
3 791,400
1,384,49
4 857,456 804,764
Jan 1,970,873 1,855,08
9
1,605,06
2 523,736 770,704
849,534 729,269
Feb 1,814,992 1,689,62
7
1,108,44
8 525,086 636,686
645,468
Mar 399,840 938,806 1,021,56
2 592,088 441,058
542,553
Apr 1,069,467 271,481 746,963 298,956 261,955 345,331
May 623,467 221,509 516,148 184,701 228,307 348,780
Jun 462,677 282,628 313,791 162,729 133,940 229,115
Jul 203,790 217,063 115,283 225,120 67,360 103,861
TOTAL 11,072,57
9
7,761,06
2
9,261,40
4
4,199,37
9
5,776,33
6
4,549,88
3
2,142,50
9
Source: Directorate General of Foreign Trade, Ministry of Commerce
Table 6b: India's Cotton Imports by Month
(Figures in 480 lb. Bales) Month/Year 2011/12 2012/13 2013/14 2014/15 2015/16 2016/17 2017/18
Aug 6,821 49,140 84,189 126,284 138,313 353,585 342,309
Sep 1,966 158,710 75,664 256,917 142,607 634,068 325,246
Oct 9,875 244,589 88,529 154,374 77,924 296,503 66,841
Nov 11,450 166,435 42,963 97,614 40,804 126,823 36,511
Dec 10,031 81,397 13,761 39,114 36,629 85,108 46,697
Jan 29,096 47,781 30,419 40,657 32,785 55,630 56,365
Feb 62,639 35,559 32,463 56,516 35,237 58,496
Mar 72,252 43,707 38,135 57,072 75,945 106,970
Apr 76,868 57,903 51,207 63,888 109,349 125,287
May 61,886 62,386 46,435 76,946 99,015 244,061
Jun 24,485 111,375 55,713 95,203 119,357 347,090
Jul 20,544 127,942 115,729 161,654 164,653 302,226
TOTAL 387,913 1,186,923 675,207 1,226,239 1,072,618 2,735,847 873,969
Source: Directorate General of Foreign Trade, Ministry of Commerce

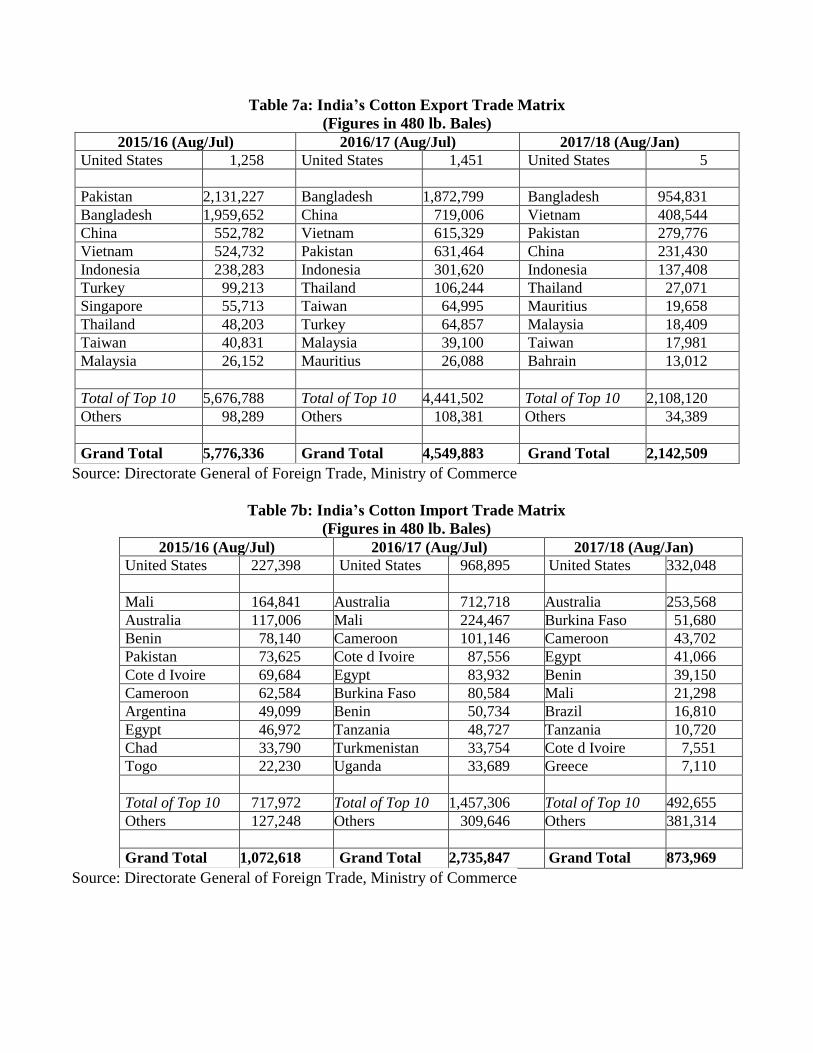
Table 7a: India’s Cotton Export Trade Matrix
(Figures in 480 lb. Bales)
2015/16 (Aug/Jul) 2016/17 (Aug/Jul) 2017/18 (Aug/Jan)
United States 1,258 United States 1,451 United States 5
Pakistan 2,131,227 Bangladesh 1,872,799 Bangladesh 954,831
Bangladesh 1,959,652 China 719,006 Vietnam 408,544
China 552,782 Vietnam 615,329 Pakistan 279,776
Vietnam 524,732 Pakistan 631,464 China 231,430
Indonesia 238,283 Indonesia 301,620 Indonesia 137,408
Turkey 99,213 Thailand 106,244 Thailand 27,071
Singapore 55,713 Taiwan 64,995 Mauritius 19,658
Thailand 48,203 Turkey 64,857 Malaysia 18,409
Taiwan 40,831 Malaysia 39,100 Taiwan 17,981
Malaysia 26,152 Mauritius 26,088 Bahrain 13,012
Total of Top 10 5,676,788 Total of Top 10 4,441,502 Total of Top 10 2,108,120
Others 98,289 Others 108,381 Others 34,389
Grand Total 5,776,336 Grand Total 4,549,883 Grand Total 2,142,509
Source: Directorate General of Foreign Trade, Ministry of Commerce
Table 7b: India’s Cotton Import Trade Matrix
(Figures in 480 lb. Bales)
2015/16 (Aug/Jul) 2016/17 (Aug/Jul) 2017/18 (Aug/Jan)
United States 227,398 United States 968,895 United States 332,048
Mali 164,841 Australia 712,718 Australia 253,568
Australia 117,006 Mali 224,467 Burkina Faso 51,680
Benin 78,140 Cameroon 101,146 Cameroon 43,702
Pakistan 73,625 Cote d Ivoire 87,556 Egypt 41,066
Cote d Ivoire 69,684 Egypt 83,932 Benin 39,150
Cameroon 62,584 Burkina Faso 80,584 Mali 21,298
Argentina 49,099 Benin 50,734 Brazil 16,810
Egypt 46,972 Tanzania 48,727 Tanzania 10,720
Chad 33,790 Turkmenistan 33,754 Cote d Ivoire 7,551
Togo 22,230 Uganda 33,689 Greece 7,110
Total of Top 10 717,972 Total of Top 10 1,457,306 Total of Top 10 492,655
Others 127,248 Others 309,646 Others 381,314
Grand Total 1,072,618 Grand Total 2,735,847 Grand Total 873,969
Source: Directorate General of Foreign Trade, Ministry of Commerce
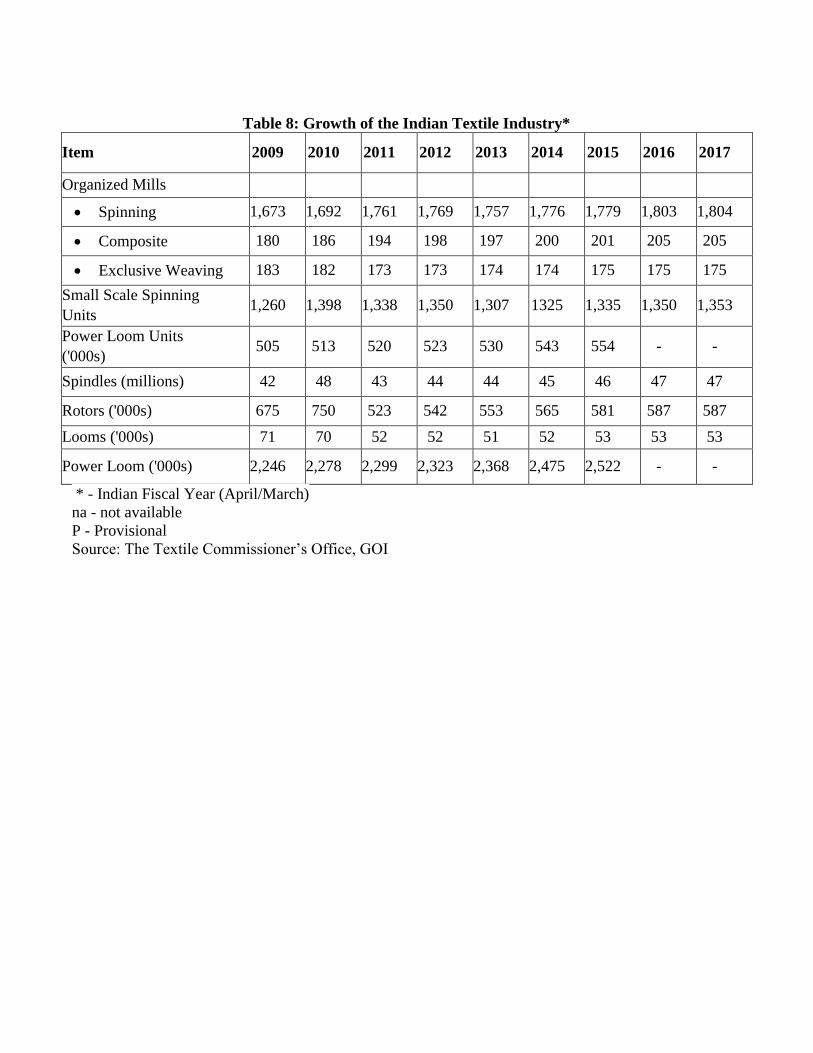
Table 8: Growth of the Indian Textile Industry*
Item 2009 2010 2011 2012 2013 2014 2015 2016 2017
Organized Mills
Spinning 1,673 1,692 1,761 1,769 1,757 1,776 1,779 1,803 1,804
Composite 180 186 194 198 197 200 201 205 205
Exclusive Weaving 183 182 173 173 174 174 175 175 175
Small Scale Spinning
Units 1,260 1,398 1,338 1,350 1,307 1325 1,335 1,350 1,353
Power Loom Units
('000s) 505 513 520 523 530 543 554 - -
Spindles (millions) 42 48 43 44 44 45 46 47 47
Rotors ('000s) 675 750 523 542 553 565 581 587 587
Looms ('000s) 71 70 52 52 51 52 53 53 53
Power Loom ('000s) 2,246 2,278 2,299 2,323 2,368 2,475 2,522 - -
* - Indian Fiscal Year (April/March)
na - not available
P - Provisional
Source: The Textile Commissioner’s Office, GOI
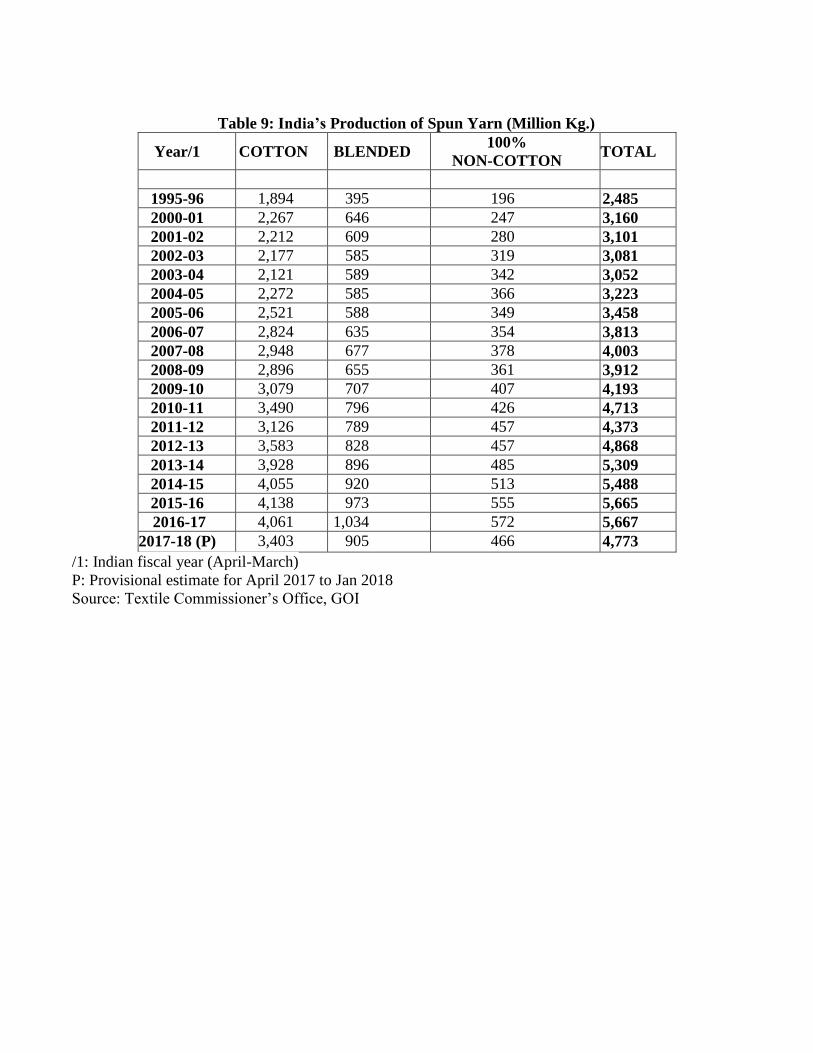
Table 9: India’s Production of Spun Yarn (Million Kg.)
Year/1 COTTON BLENDED 100%
NON-COTTON TOTAL
1995-96 1,894 395 196 2,485
2000-01 2,267 646 247 3,160
2001-02 2,212 609 280 3,101
2002-03 2,177 585 319 3,081
2003-04 2,121 589 342 3,052
2004-05 2,272 585 366 3,223
2005-06 2,521 588 349 3,458
2006-07 2,824 635 354 3,813
2007-08 2,948 677 378 4,003
2008-09 2,896 655 361 3,912
2009-10 3,079 707 407 4,193
2010-11 3,490 796 426 4,713
2011-12 3,126 789 457 4,373
2012-13 3,583 828 457 4,868
2013-14 3,928 896 485 5,309
2014-15 4,055 920 513 5,488
2015-16 4,138 973 555 5,665
2016-17 4,061 1,034 572 5,667
2017-18 (P) 3,403 905 466 4,773
/1: Indian fiscal year (April-March)
P: Provisional estimate for April 2017 to Jan 2018
Source: Textile Commissioner’s Office, GOI
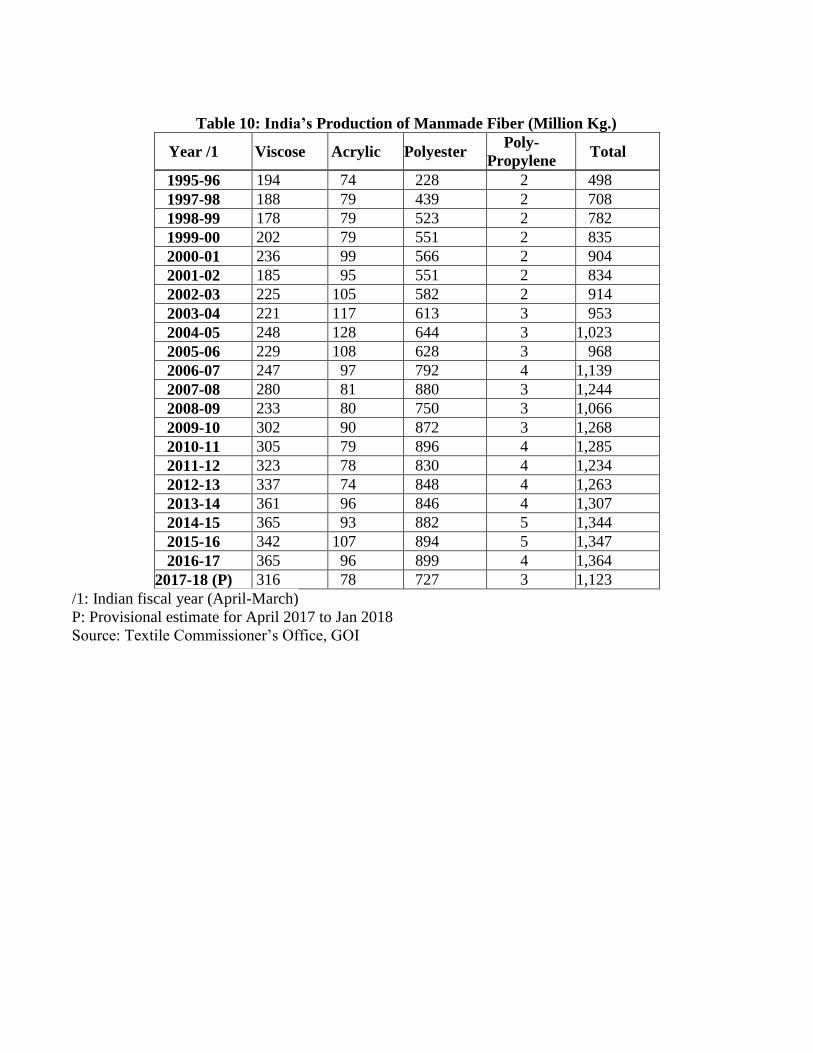
Table 10: India’s Production of Manmade Fiber (Million Kg.)
Year /1 Viscose Acrylic Polyester Poly-
Propylene Total
1995-96 194 74 228 2 498
1997-98 188 79 439 2 708
1998-99 178 79 523 2 782
1999-00 202 79 551 2 835
2000-01 236 99 566 2 904
2001-02 185 95 551 2 834
2002-03 225 105 582 2 914
2003-04 221 117 613 3 953
2004-05 248 128 644 3 1,023
2005-06 229 108 628 3 968
2006-07 247 97 792 4 1,139
2007-08 280 81 880 3 1,244
2008-09 233 80 750 3 1,066
2009-10 302 90 872 3 1,268
2010-11 305 79 896 4 1,285
2011-12 323 78 830 4 1,234
2012-13 337 74 848 4 1,263
2013-14 361 96 846 4 1,307
2014-15 365 93 882 5 1,344
2015-16 342 107 894 5 1,347
2016-17 365 96 899 4 1,364
2017-18 (P) 316 78 727 3 1,123
/1: Indian fiscal year (April-March)
P: Provisional estimate for April 2017 to Jan 2018
Source: Textile Commissioner’s Office, GOI
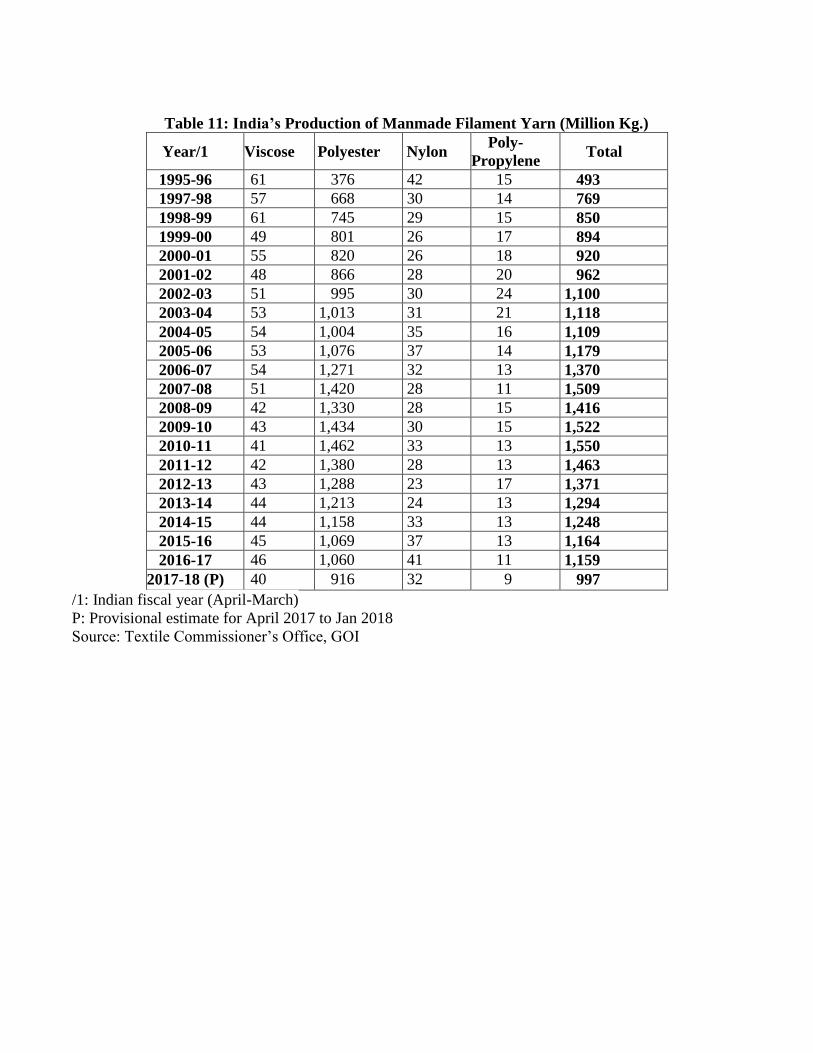
Table 11: India’s Production of Manmade Filament Yarn (Million Kg.)
Year/1 Viscose Polyester Nylon Poly-
Propylene Total
1995-96 61 376 42 15 493
1997-98 57 668 30 14 769
1998-99 61 745 29 15 850
1999-00 49 801 26 17 894
2000-01 55 820 26 18 920
2001-02 48 866 28 20 962
2002-03 51 995 30 24 1,100
2003-04 53 1,013 31 21 1,118
2004-05 54 1,004 35 16 1,109
2005-06 53 1,076 37 14 1,179
2006-07 54 1,271 32 13 1,370
2007-08 51 1,420 28 11 1,509
2008-09 42 1,330 28 15 1,416
2009-10 43 1,434 30 15 1,522
2010-11 41 1,462 33 13 1,550
2011-12 42 1,380 28 13 1,463
2012-13 43 1,288 23 17 1,371
2013-14 44 1,213 24 13 1,294
2014-15 44 1,158 33 13 1,248
2015-16 45 1,069 37 13 1,164
2016-17 46 1,060 41 11 1,159
2017-18 (P) 40 916 32 9 997
/1: Indian fiscal year (April-March)
P: Provisional estimate for April 2017 to Jan 2018
Source: Textile Commissioner’s Office, GOI
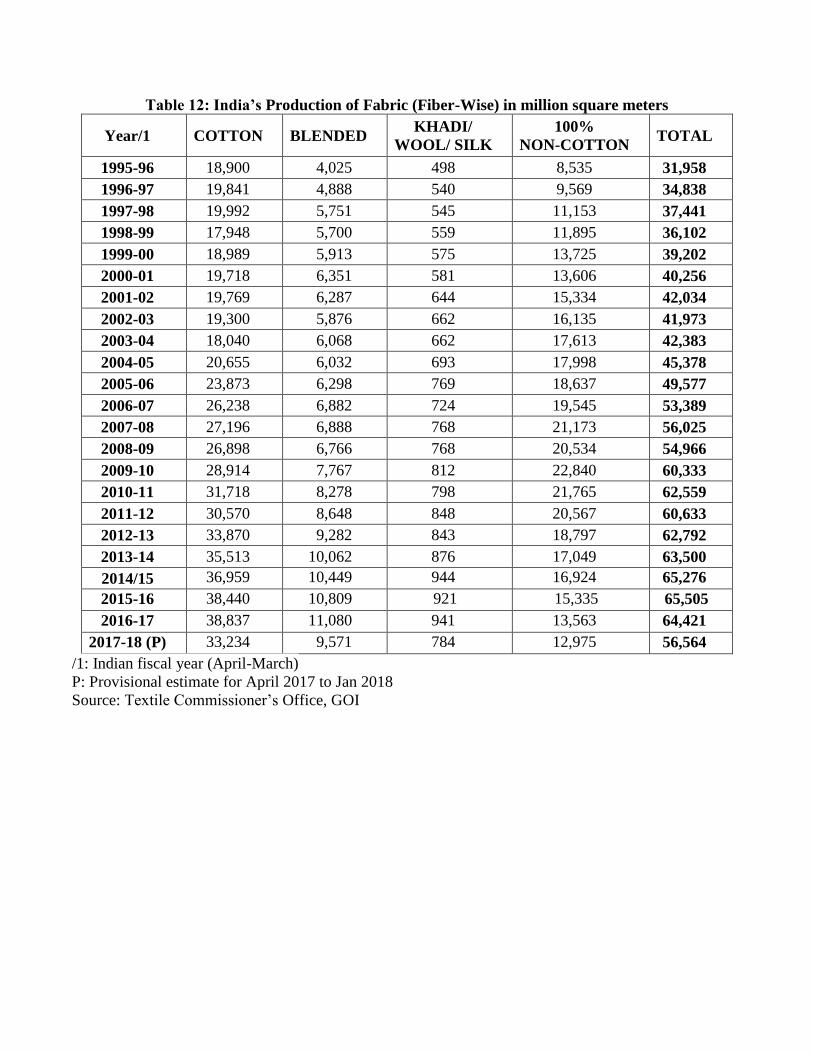
Table 12: India’s Production of Fabric (Fiber-Wise) in million square meters
Year/1 COTTON BLENDED KHADI/
WOOL/ SILK
100%
NON-COTTON TOTAL
1995-96 18,900 4,025 498 8,535 31,958
1996-97 19,841 4,888 540 9,569 34,838
1997-98 19,992 5,751 545 11,153 37,441
1998-99 17,948 5,700 559 11,895 36,102
1999-00 18,989 5,913 575 13,725 39,202
2000-01 19,718 6,351 581 13,606 40,256
2001-02 19,769 6,287 644 15,334 42,034
2002-03 19,300 5,876 662 16,135 41,973
2003-04 18,040 6,068 662 17,613 42,383
2004-05 20,655 6,032 693 17,998 45,378
2005-06 23,873 6,298 769 18,637 49,577
2006-07 26,238 6,882 724 19,545 53,389
2007-08 27,196 6,888 768 21,173 56,025
2008-09 26,898 6,766 768 20,534 54,966
2009-10 28,914 7,767 812 22,840 60,333
2010-11 31,718 8,278 798 21,765 62,559
2011-12 30,570 8,648 848 20,567 60,633
2012-13 33,870 9,282 843 18,797 62,792
2013-14 35,513 10,062 876 17,049 63,500
2014/15 36,959 10,449 944 16,924 65,276
2015-16 38,440 10,809 921 15,335 65,505
2016-17 38,837 11,080 941 13,563 64,421
2017-18 (P) 33,234 9,571 784 12,975 56,564
/1: Indian fiscal year (April-March)
P: Provisional estimate for April 2017 to Jan 2018
Source: Textile Commissioner’s Office, GOI
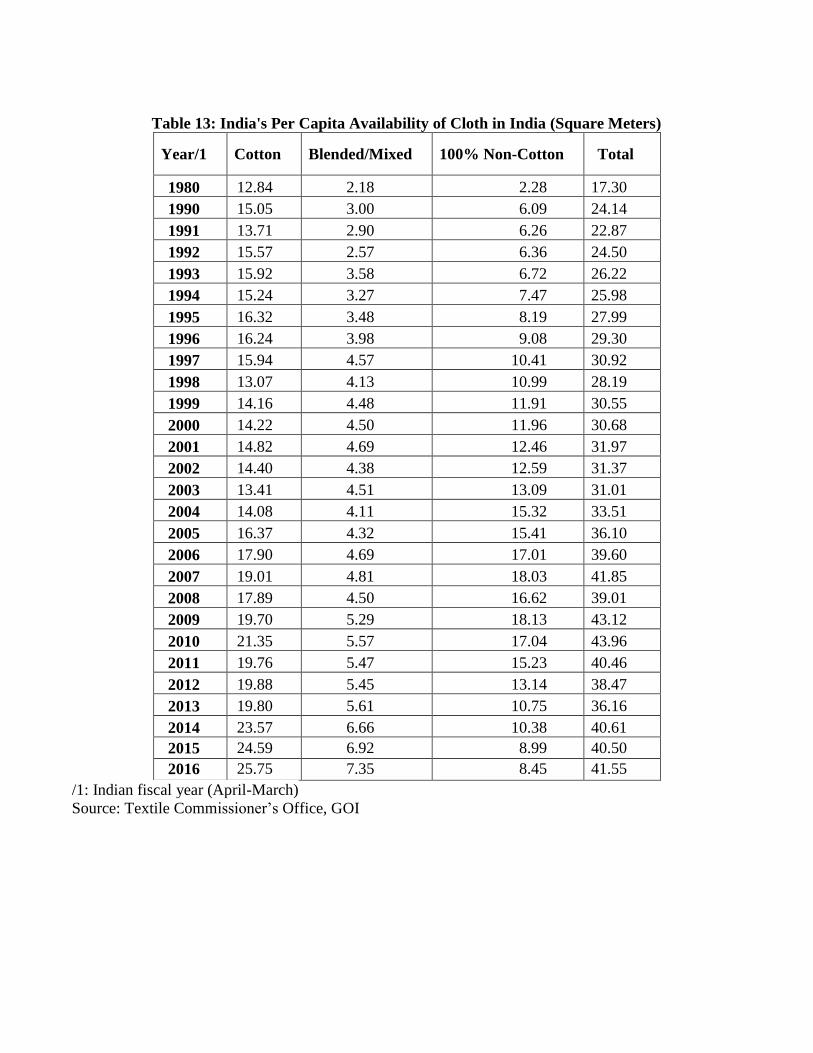
Table 13: India's Per Capita Availability of Cloth in India (Square Meters)
Year/1 Cotton Blended/Mixed 100% Non-Cotton Total
1980 12.84 2.18 2.28 17.30
1990 15.05 3.00 6.09 24.14
1991 13.71 2.90 6.26 22.87
1992 15.57 2.57 6.36 24.50
1993 15.92 3.58 6.72 26.22
1994 15.24 3.27 7.47 25.98
1995 16.32 3.48 8.19 27.99
1996 16.24 3.98 9.08 29.30
1997 15.94 4.57 10.41 30.92
1998 13.07 4.13 10.99 28.19
1999 14.16 4.48 11.91 30.55
2000 14.22 4.50 11.96 30.68
2001 14.82 4.69 12.46 31.97
2002 14.40 4.38 12.59 31.37
2003 13.41 4.51 13.09 31.01
2004 14.08 4.11 15.32 33.51
2005 16.37 4.32 15.41 36.10
2006 17.90 4.69 17.01 39.60
2007 19.01 4.81 18.03 41.85
2008 17.89 4.50 16.62 39.01
2009 19.70 5.29 18.13 43.12
2010 21.35 5.57 17.04 43.96
2011 19.76 5.47 15.23 40.46
2012 19.88 5.45 13.14 38.47
2013 19.80 5.61 10.75 36.16
2014 23.57 6.66 10.38 40.61
2015 24.59 6.92 8.99 40.50
2016 25.75 7.35 8.45 41.55
/1: Indian fiscal year (April-March)
Source: Textile Commissioner’s Office, GOI
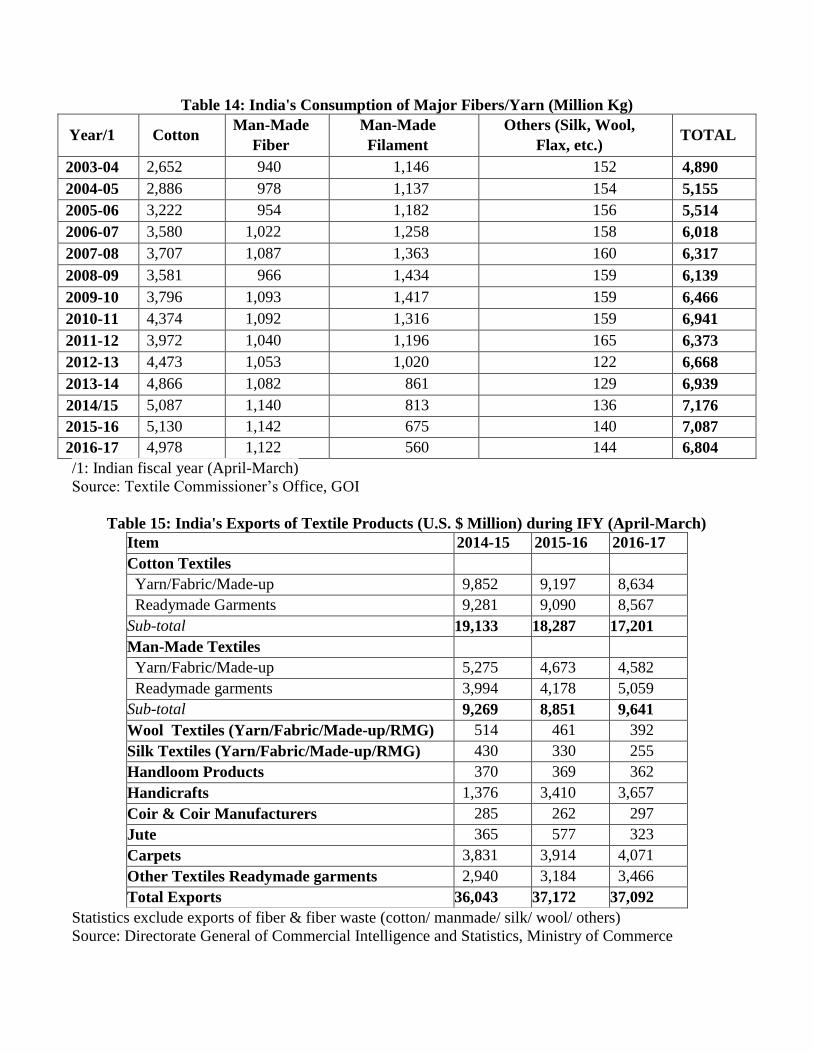
Table 14: India's Consumption of Major Fibers/Yarn (Million Kg)
Year/1 Cotton Man-Made
Fiber
Man-Made
Filament
Others (Silk, Wool,
Flax, etc.) TOTAL
2003-04 2,652 940 1,146 152 4,890
2004-05 2,886 978 1,137 154 5,155
2005-06 3,222 954 1,182 156 5,514
2006-07 3,580 1,022 1,258 158 6,018
2007-08 3,707 1,087 1,363 160 6,317
2008-09 3,581 966 1,434 159 6,139
2009-10 3,796 1,093 1,417 159 6,466
2010-11 4,374 1,092 1,316 159 6,941
2011-12 3,972 1,040 1,196 165 6,373
2012-13 4,473 1,053 1,020 122 6,668
2013-14 4,866 1,082 861 129 6,939
2014/15 5,087 1,140 813 136 7,176
2015-16 5,130 1,142 675 140 7,087
2016-17 4,978 1,122 560 144 6,804
/1: Indian fiscal year (April-March)
Source: Textile Commissioner’s Office, GOI
Table 15: India's Exports of Textile Products (U.S. $ Million) during IFY (April-March)
Item 2014-15 2015-16 2016-17
Cotton Textiles
Yarn/Fabric/Made-up 9,852 9,197 8,634
Readymade Garments 9,281 9,090 8,567
Sub-total 19,133 18,287 17,201
Man-Made Textiles
Yarn/Fabric/Made-up 5,275 4,673 4,582
Readymade garments 3,994 4,178 5,059
Sub-total 9,269 8,851 9,641
Wool Textiles (Yarn/Fabric/Made-up/RMG) 514 461 392
Silk Textiles (Yarn/Fabric/Made-up/RMG) 430 330 255
Handloom Products 370 369 362
Handicrafts 1,376 3,410 3,657
Coir & Coir Manufacturers 285 262 297
Jute 365 577 323
Carpets 3,831 3,914 4,071
Other Textiles Readymade garments 2,940 3,184 3,466
Total Exports 36,043 37,172 37,092
Statistics exclude exports of fiber & fiber waste (cotton/ manmade/ silk/ wool/ others)
Source: Directorate General of Commercial Intelligence and Statistics, Ministry of Commerce
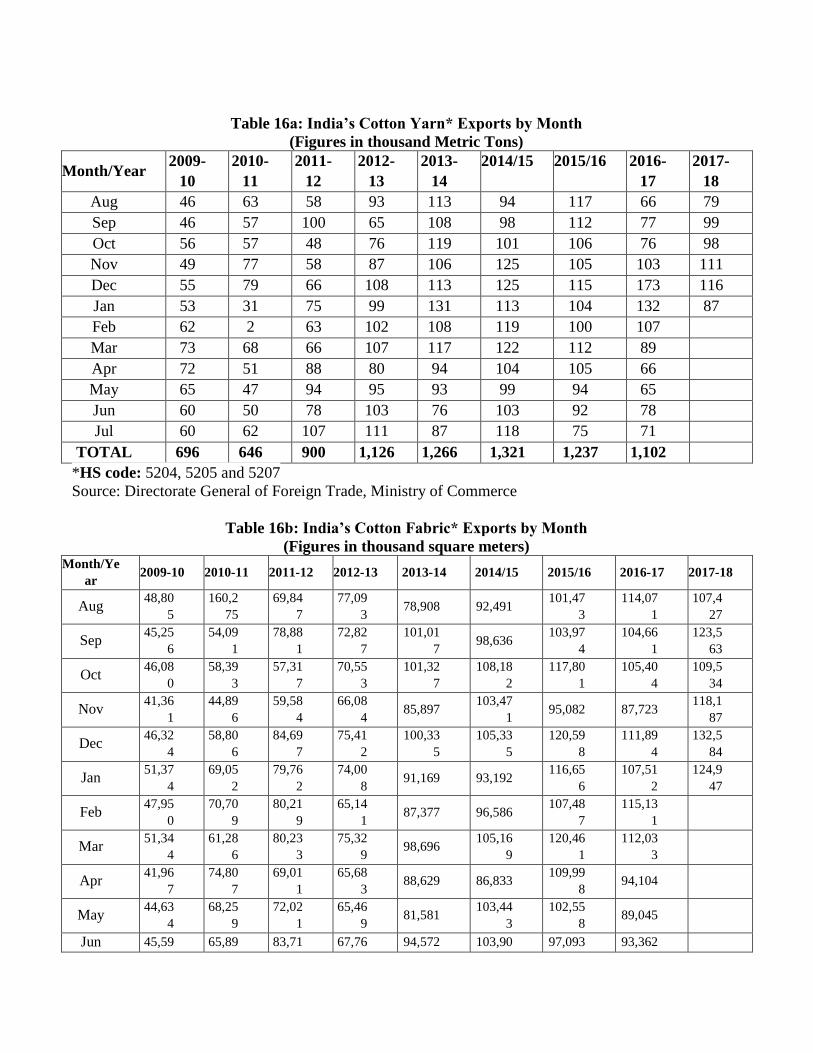
Table 16a: India’s Cotton Yarn* Exports by Month
(Figures in thousand Metric Tons)
Month/Year 2009-
10
2010-
11
2011-
12
2012-
13
2013-
14
2014/15 2015/16 2016-
17
2017-
18
Aug 46 63 58 93 113 94 117 66 79
Sep 46 57 100 65 108 98 112 77 99
Oct 56 57 48 76 119 101 106 76 98
Nov 49 77 58 87 106 125 105 103 111
Dec 55 79 66 108 113 125 115 173 116
Jan 53 31 75 99 131 113 104 132 87
Feb 62 2 63 102 108 119 100 107
Mar 73 68 66 107 117 122 112 89
Apr 72 51 88 80 94 104 105 66
May 65 47 94 95 93 99 94 65
Jun 60 50 78 103 76 103 92 78
Jul 60 62 107 111 87 118 75 71
TOTAL 696 646 900 1,126 1,266 1,321 1,237 1,102
*HS code: 5204, 5205 and 5207
Source: Directorate General of Foreign Trade, Ministry of Commerce
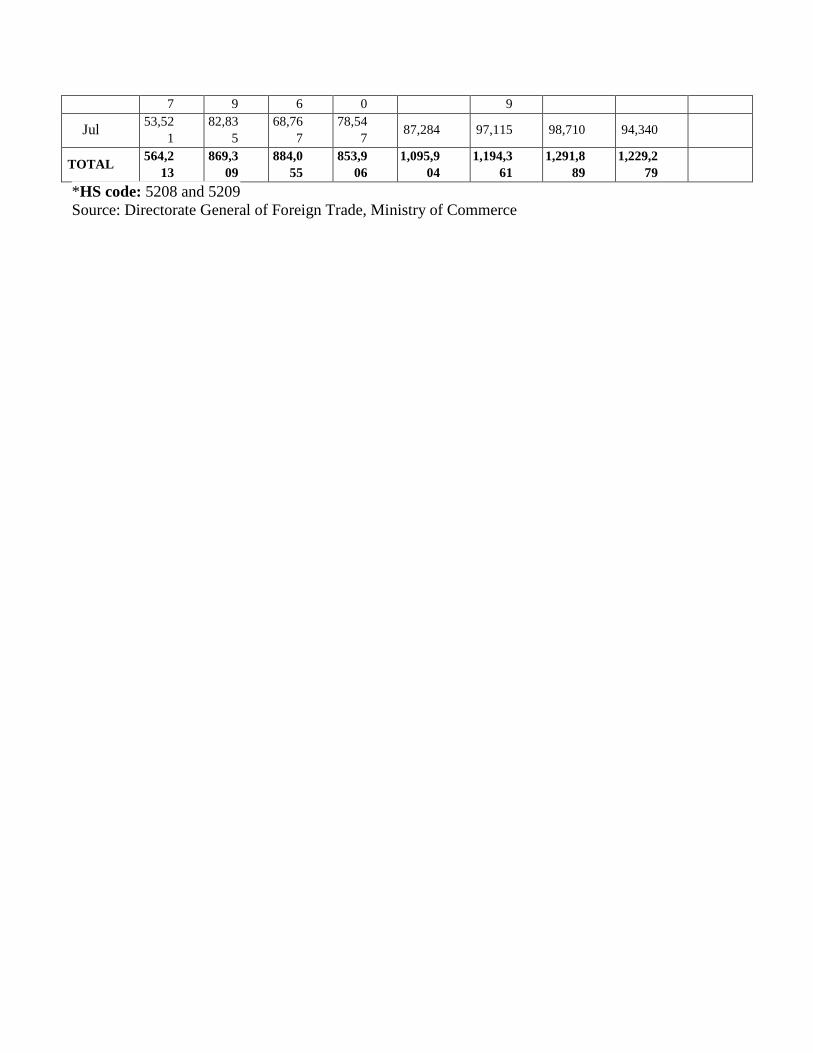
Table 16b: India’s Cotton Fabric* Exports by Month
(Figures in thousand square meters) Month/Ye
ar 2009-10 2010-11 2011-12 2012-13 2013-14 2014/15 2015/16 2016-17 2017-18
Aug 48,80
5
160,2
75
69,84
7
77,09
3 78,908 92,491
101,47
3
114,07
1
107,4
27
Sep 45,25
6
54,09
1
78,88
1
72,82
7
101,01
7 98,636
103,97
4
104,66
1
123,5
63
Oct 46,08
0
58,39
3
57,31
7
70,55
3
101,32
7
108,18
2
117,80
1
105,40
4
109,5
34
Nov 41,36
1
44,89
6
59,58
4
66,08
4 85,897
103,47
1 95,082 87,723
118,1
87
Dec 46,32
4
58,80
6
84,69
7
75,41
2
100,33
5
105,33
5
120,59
8
111,89
4
132,5
84
Jan 51,37
4
69,05
2
79,76
2
74,00
8 91,169 93,192
116,65
6
107,51
2
124,9
47
Feb 47,95
0
70,70
9
80,21
9
65,14
1 87,377 96,586
107,48
7
115,13
1
Mar 51,34
4
61,28
6
80,23
3
75,32
9 98,696
105,16
9
120,46
1
112,03
3
Apr 41,96
7
74,80
7
69,01
1
65,68
3 88,629 86,833
109,99
8 94,104
May 44,63
4
68,25
9
72,02
1
65,46
9 81,581
103,44
3
102,55
8 89,045
Jun 45,59 65,89 83,71 67,76 94,572 103,90 97,093 93,362
7 9 6 0 9
Jul 53,52
1
82,83
5
68,76
7
78,54
7 87,284 97,115 98,710 94,340
TOTAL 564,2
13
869,3
09
884,0
55
853,9
06
1,095,9
04
1,194,3
61
1,291,8
89
1,229,2
79
*HS code: 5208 and 5209
Source: Directorate General of Foreign Trade, Ministry of Commerce
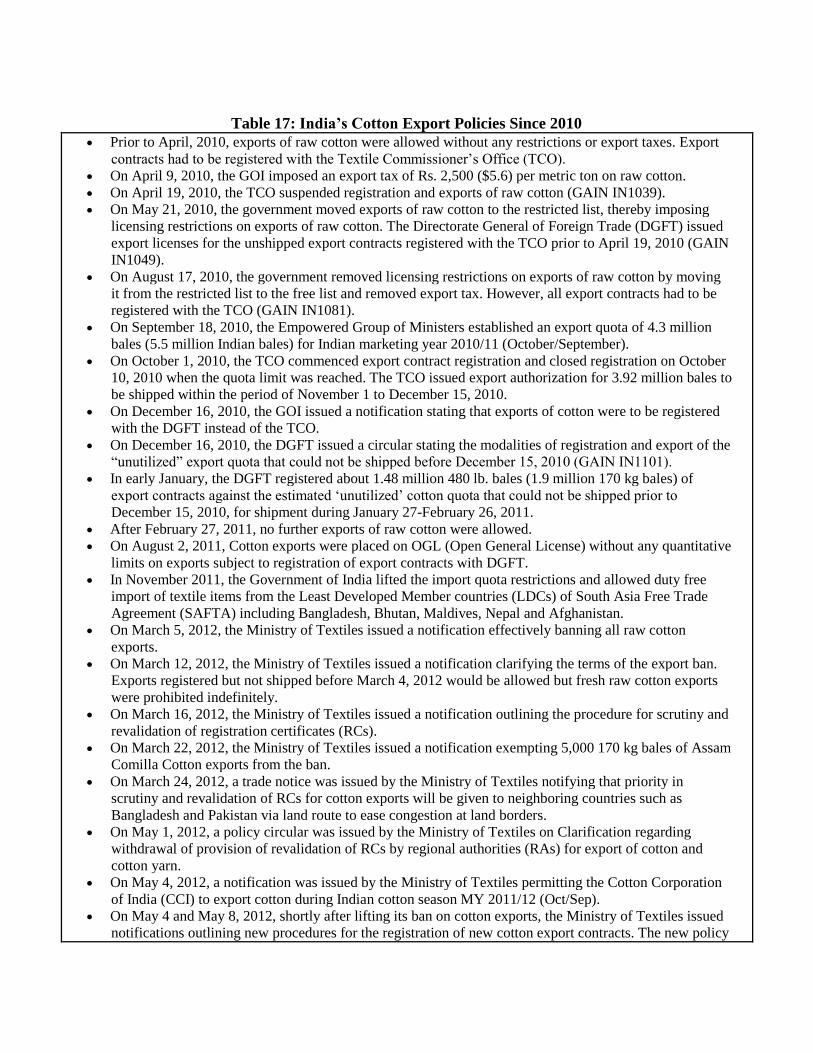
Table 17: India’s Cotton Export Policies Since 2010
Prior to April, 2010, exports of raw cotton were allowed without any restrictions or export taxes. Export
contracts had to be registered with the Textile Commissioner’s Office (TCO).
On April 9, 2010, the GOI imposed an export tax of Rs. 2,500 ($5.6) per metric ton on raw cotton.
On April 19, 2010, the TCO suspended registration and exports of raw cotton (GAIN IN1039).
On May 21, 2010, the government moved exports of raw cotton to the restricted list, thereby imposing
licensing restrictions on exports of raw cotton. The Directorate General of Foreign Trade (DGFT) issued
export licenses for the unshipped export contracts registered with the TCO prior to April 19, 2010 (GAIN
IN1049).
On August 17, 2010, the government removed licensing restrictions on exports of raw cotton by moving
it from the restricted list to the free list and removed export tax. However, all export contracts had to be
registered with the TCO (GAIN IN1081).
On September 18, 2010, the Empowered Group of Ministers established an export quota of 4.3 million
bales (5.5 million Indian bales) for Indian marketing year 2010/11 (October/September).
On October 1, 2010, the TCO commenced export contract registration and closed registration on October
10, 2010 when the quota limit was reached. The TCO issued export authorization for 3.92 million bales to
be shipped within the period of November 1 to December 15, 2010.
On December 16, 2010, the GOI issued a notification stating that exports of cotton were to be registered
with the DGFT instead of the TCO.
On December 16, 2010, the DGFT issued a circular stating the modalities of registration and export of the
“unutilized” export quota that could not be shipped before December 15, 2010 (GAIN IN1101).
In early January, the DGFT registered about 1.48 million 480 lb. bales (1.9 million 170 kg bales) of
export contracts against the estimated ‘unutilized’ cotton quota that could not be shipped prior to
December 15, 2010, for shipment during January 27-February 26, 2011.
After February 27, 2011, no further exports of raw cotton were allowed.
On August 2, 2011, Cotton exports were placed on OGL (Open General License) without any quantitative
limits on exports subject to registration of export contracts with DGFT.
In November 2011, the Government of India lifted the import quota restrictions and allowed duty free
import of textile items from the Least Developed Member countries (LDCs) of South Asia Free Trade
Agreement (SAFTA) including Bangladesh, Bhutan, Maldives, Nepal and Afghanistan.
On March 5, 2012, the Ministry of Textiles issued a notification effectively banning all raw cotton
exports.
On March 12, 2012, the Ministry of Textiles issued a notification clarifying the terms of the export ban.
Exports registered but not shipped before March 4, 2012 would be allowed but fresh raw cotton exports
were prohibited indefinitely.
On March 16, 2012, the Ministry of Textiles issued a notification outlining the procedure for scrutiny and
revalidation of registration certificates (RCs).
On March 22, 2012, the Ministry of Textiles issued a notification exempting 5,000 170 kg bales of Assam
Comilla Cotton exports from the ban.
On March 24, 2012, a trade notice was issued by the Ministry of Textiles notifying that priority in
scrutiny and revalidation of RCs for cotton exports will be given to neighboring countries such as
Bangladesh and Pakistan via land route to ease congestion at land borders.
On May 1, 2012, a policy circular was issued by the Ministry of Textiles on Clarification regarding
withdrawal of provision of revalidation of RCs by regional authorities (RAs) for export of cotton and
cotton yarn.
On May 4, 2012, a notification was issued by the Ministry of Textiles permitting the Cotton Corporation
of India (CCI) to export cotton during Indian cotton season MY 2011/12 (Oct/Sep).
On May 4 and May 8, 2012, shortly after lifting its ban on cotton exports, the Ministry of Textiles issued
notifications outlining new procedures for the registration of new cotton export contracts. The new policy
limited the amount of each RC to 10,000 170 kg bales (1,700 MT) of cotton for established exporters and
to 1,500 170 kg bales for exporters who have not exported previously.
On May 10, 2012, the DGFT issued circular stipulating additional conditions for obtaining cotton RCs.
Exporters were required to notify DGFT by e-mail of their intent to register additional quantities followed
by a hard copy of their application within two working days.
On May 24, 2012, a clarification was issued by DGFT regarding standard weight and tolerance in weight
of 1 Indian bale of cotton which is equivalent to 170 kilograms. The clarification was issued in respect of
exporters exporting cotton bales of non-standard weight. Weight of each bale must be within the
prescribed limit of 170 kg irrespective of the number of non-standard bales shipped.
On October 1, 2012, procedure and conditions for registration of contracts for export of cotton for
2012/13 were announced. The new policy limits the amount of each RC to 10,000 170 kg bales (1,700
MT) of cotton for established exporters and to 1,500 170 kg bales for exporters who have not exported
previously. (GAIN IN2136)
On October 1, 2012, the Ministry of Textiles issued a notification exempting 5,000 170 kg bales of
Assam Comilla Cotton exports from any export restrictions.
On November 30, 2012, DGFT issued a notification modifying procedures and conditions related to
cotton export registration for Indian MY 2012/13 (Oct/Sep). The export policy was amended to allow
registration of cotton exports up to a maximum quantity of 30,000 170 kg bales. Exporters must export 50
percent (15,000 170 kg bales) of a registration before they can register an additional 30,000 170 kg bales.
(GAIN IN2159)
On January 3, 2013, India’s Ministry of Commerce and Industry issued a policy circular modifying
procedures for cotton exports sent via the land route through the Wagah-Atari border to Pakistan for the
2012/13 marketing year. To ease land congestion, Indian exporters have the option to seek a onetime
maximum 30 day extension based on the validity of the registration certificate (RC) to complete any
outstanding commitments due to delays. (GAIN IN3015)
On September 25, 2013 Government of India issued a notification stating withdrawal of any incentives on
exports of cotton, and cotton yarn under the Focus Market Scheme (FMS). (GAIN IN3108)
On October 17, 2013, India’s Ministry of Textiles announced the establishment of a mandatory online
reporting system for ginners and others in the cotton trade aimed at enhancing data collection. (GAIN
IN3126)
On January 3, 2014, India’s Ministry of Commerce and Industry issued a notification amending the
procedure for the issue of registration certificates (RCs) for export of various commodities such as raw
cotton and cotton yarn. The announcement simplifies the export registration process by eliminating the
need for exporters to submit hard copies of the documents when submitting their online export
registration application. (GAIN IN4012)
On January 23, 2014, the Government of India amended a notification that makes cotton yarn eligible for
benefits under the Incremental Export Incentivisation Scheme (IEIS) up to March 31, 2014, the end of the
India fiscal year. The scheme provides a credit of two percent of the FOB value of exports that can be
used to import any goods free of duty up to the value of the credit. (GAIN IN4012)
On February 27, 2014, the Government of India amended a notification adding a number of textile items
including cotton yarn, cotton fabric and bed linen to the Market Linked Focus Product Scheme (MLFPS)
scheme. Here again, the scheme provides a credit of two percent of the FOB value of exports to certain
high priority markets that can be used to import products duty free up to the value of the credit. All
garments covered under Chapters 61 and 62 of the Harmonized Tariff Schedule that are exported to the
United States and European Union are now eligible for program until further notice. (GAIN IN4012)
On March 3, 2014, India’s Ministry of Textiles issued a press note appealing to the cotton trade (cotton
producers, ginners, bale pressers, traders etc.) to voluntarily register their unit/firm with textile
commissioner’s office and file monthly cotton statistics related to ginned and/or pressed cotton
production, consumption/distribution and its trading.
On December 8, 2014, the GOI relaxed the export procedures for cotton and cotton yarn by removing the
requirement for export registration with Directorate General of Foreign Trade (DGFT) to try and stabilize
prices by boosting exports.
On October 29, 2015, the Directorate General of Foreign Trade (DGFT), Ministry of Commerce and
Industry issued a notification extending the two percent export benefit (2 percent of FOB value) effective
immediately under the Merchandise Export from India Scheme (MEIS). The export incentive is available
on a number of textile items under Harmonized Tariff System chapters 50 to 63 to countries classified in
groups A, B & C under the MEIS Schedule.
On November 18, 2015, the Government of India approved the Interest Equalization Scheme (earlier
called Interest Subvention Scheme) for five years effective April 1, 2015. Under the scheme, eligible
exporters can avail a three percent export credit subvention (subsidy on interest rate charged on export
credit).
On December 7, 2015, the Government of India published a cotton seed price control order that fixes the
sale price of cotton seeds for sowing. Though this order aims to ensure that farmers receive a fair,
reasonable, and affordable price, according to information published by the Ministry of Agriculture and
received from industry sources, seed prices account for only 5 to 9 percent of the total cost of cultivation
with greater variability attributed to production style (irrigated/non-irrigated), chemical usage, and
seeding intensity.
On December 30, 2015, the Government of India approved the "Amended Technology Upgrade Fund
Scheme (ATUFS)” Scheme for technological improvements in the textiles industry. The amended
scheme targets employment generation by promoting exports, promoting technical textiles, and supports
the upgrading of looms, and processing in the garment sector.
On March 8, 2016, the Government of India under the cotton seed price control order fixed the all India
maximum sale price of cotton seed by declaring a packet of Bt cotton seed (450 grams of Bt. cotton seed
plus 120 grams refugia) at INR 800 ($12) for Bollgard 2 version of Bt cotton hybrid, and INR 635 ($9.5)
for Bollgard 1 version of Bt cotton hybrid.
On April 1, 2017, the Ministry of Textiles launched a comprehensive subsidy scheme for the power loom
sector. The scheme has several components; including, providing financial assistance for upgrading of
plain looms, credit availability to power loom weavers, interest-free funds for the purchase of yarn at
wholesale prices (GAIN IN7077).
On July 1, 2017, the new goods and services tax (GST) rates announced for cotton (fiber, waste, yarn and
fabric) was set at 5 percent, while GST rates for man-made products (fiber and yarn) were set at 18
percent, and fabric at 5 percent.
On October 23, 2017, the Ministry of Finance published a notification to ease the procedure for merchant
exporters. Merchant exporters can now purchase goods from registered suppliers by paying 0.1 percent
GST and the amount paid as GST will be refunded within 90 days of the export transaction. (GAIN
IN7138)
On November 24, 2017, the Ministry of Textiles published a notification highlighting the schemes for
Remission of State Levies on export of garments and made-ups through a rebate mechanism. The two
schemes have been merged under the Scheme for Rebate of State Levies on Export of Garments and
Made-ups (referred to as the RoSL Scheme). Effective October 1, 2017, the exporter may claim RoSL
rates for export of garments, and made-ups as per the rates notified in the schedule (GAIN IN7138).
On November 24, 2017, the Directorate General of Foreign Trade (DGFT), Ministry of Commerce and
Industry, issued a public notice wherein the incentive rates under the MEIS scheme were increased from
2 percent to 4 percent for the garment and made up sectors (linens, furnishings etc.) (GAIN IN7138).
On December 20, 2017, the Union Cabinet gave its approval for a new skill development scheme
covering the entire textile sector value chain (excluding spinning and weaving in the organized sector),
titled "Scheme for Capacity Building in Textile Sector (SCBTS)" from 2017-18 to 2019-20 with an
outlay of $200 million (Rs. 1300 crore). Refer Press Release
On February 1, 2018, Finance Minister presented the Government of India’s (GOI) annual budget for
Indian Fiscal Year (IFY) 2018/19. The Minister announced that the minimum support price (MSP) valued
at 1.5 times the cost of production will be used as a principle for determining the MSP for all crops during
the upcoming 2018/19 kharif season (fall harvested) for numerous crops (e.g., rice, maize, cotton and

various coarse grains, oilseeds and pulses (GAIN IN8014).
The Ministry of Agriculture and Farmers Welfare published a notification on March 12, 2018, fixing the
maximum sale price for cotton seed for sowing as well as specific trait values that technology providers
assess seed companies for biotech cotton seed used in India. The sales and trait prices were lowered from
the prices set in the March 2016 notification (GAIN IN8024).

Table 18: Area, Production & Yield of Cotton in Major States
(Area 000 ha; Production 000 bales, Yield kg/ha) STATE CAB Estimate FAS Post Estimate FAS Post Forecast
2016/17 2017/18 2018/19
Maharashtra Area 3,800 4,212 4,000
Production 8,275 7,500 7,350
Yield 370 303 312
Gujarat Area 2,405 2,658 2,650
Production 9,180 10,600 10,300
Yield 649 678 661
Madhya Pradesh Area 599 599 580
Production 1,980 1,985 1,950
Yield 562 563 572
Punjab Area 285 385 360
Production 650 900 910
Yield 388 397 430
Haryana Area 570 656 620
Production 1,750 2,000 2,180
Yield 522 518 598
Rajasthan Area 471 503 480
Production 1,540 1,850 1,650
Yield 556 625 584
Andhra Pradesh Area 471 636 580
Production 1,310 1,950 1,800
Yield 473 521 528
Telangana Area 1,409 1,824 1,750
Production 4,740 5,200 5,400
Yield 572 485 525
Karnataka Area 507 565 570
Production 1,690 1,600 1,800
Yield 567 481 537
Tamil Nadu Area 142 148 140
Production 280 350 345
Yield 335 402 419
Others Area 186 195 180
Production 495 550 500
Yield 452 479 472
Loose Production 2,610 2,610 2,610
All-India Area 10,845 12,381* 11,910
Production 34,500 37,095* 36,795
Yield 541 509* 525
*Difference in PSD Post Estimate for area, production and yield is due to rounding.