Embed Size (px)
Citation preview
The water footprint of
cotton consumption
Value of Water
A.K. Chapagain
A.Y. Hoekstra
H.H.G. Savenije
R. Gautam
September 2005
Research Report Series No. 18

The water footprint of cotton consumption
A.K. Chapagain
A.Y. Hoekstra
H.H.G. Savenije
R. Gautam
September 2005
Value of Water Research Report Series No. 18
UNESCO-IHE DelftP.O. Box 30152601 DA DelftThe Netherlands
Contact author:
Arjen HoekstraE-mail [email protected]

Value of Water Research Report Series (Downloadable from http://www.waterfootprint.org) 1. Exploring methods to assess the value of water: A case study on the Zambezi basin.
A.K. Chapagain − February 2000
2. Water value flows: A case study on the Zambezi basin.
A.Y. Hoekstra, H.H.G. Savenije and A.K. Chapagain − March 2000
3. The water value-flow concept.
I.M. Seyam and A.Y. Hoekstra − December 2000
4. The value of irrigation water in Nyanyadzi smallholder irrigation scheme, Zimbabwe.
G.T. Pazvakawambwa and P. van der Zaag – January 2001
5. The economic valuation of water: Principles and methods
J.I. Agudelo – August 2001
6. The economic valuation of water for agriculture: A simple method applied to the eight Zambezi basin countries
J.I. Agudelo and A.Y. Hoekstra – August 2001
7. The value of freshwater wetlands in the Zambezi basin
I.M. Seyam, A.Y. Hoekstra, G.S. Ngabirano and H.H.G. Savenije – August 2001
8. ‘Demand management’ and ‘Water as an economic good’: Paradigms with pitfalls
H.H.G. Savenije and P. van der Zaag – October 2001
9. Why water is not an ordinary economic good
H.H.G. Savenije – October 2001
10. Calculation methods to assess the value of upstream water flows and storage as a function of downstream benefits
I.M. Seyam, A.Y. Hoekstra and H.H.G. Savenije – October 2001
11. Virtual water trade: A quantification of virtual water flows between nations in relation to international crop trade
A.Y. Hoekstra and P.Q. Hung – September 2002
12. Virtual water trade: Proceedings of the international expert meeting on virtual water trade
A.Y. Hoekstra (ed.) – February 2003
13. Virtual water flows between nations in relation to trade in livestock and livestock products
A.K. Chapagain and A.Y. Hoekstra – July 2003
14. The water needed to have the Dutch drink coffee
A.K. Chapagain and A.Y. Hoekstra – August 2003
15. The water needed to have the Dutch drink tea
A.K. Chapagain and A.Y. Hoekstra – August 2003
16. Water footprints of nations
Volume 1: Main Report, Volume 2: Appendices
A.K. Chapagain and A.Y. Hoekstra – November 2004
17. Saving water through global trade
A.K. Chapagain, A.Y. Hoekstra and H.H.G. Savenije – September 2005
18. The water footprint of cotton consumption
A.K. Chapagain, A.Y. Hoekstra, H.H.G. Savenije and R. Gautam – September 2005

Contents
Summary................................................................................................................................. 7
1. Introduction........................................................................................................................ 9
2. Green, blue and dilution water ....................................................................................... 11
3. Virtual water ..................................................................................................................... 13
3.1. General method ....................................................................................................................................... 13
3.2. The virtual water content of seed cotton.................................................................................................. 13
3.3. The virtual water content of cotton products ........................................................................................... 16
4. Impact on the water quality in the cotton producing countries .................................. 19
4.1. Impact due to use of fertilisers in crop production .................................................................................. 19
4.2. Impact due to use of chemicals in the processing stage........................................................................... 20
5. International virtual water flows..................................................................................... 23
6. Water footprints related to consumption of cotton products ..................................... 25
7. Conclusion ....................................................................................................................... 31
References............................................................................................................................ 33

Summary
The consumption of a cotton product is connected to a chain of impacts on the water resources in the countries
where cotton is grown and processed. The aim of this report is to assess the ‘water footprint’ of worldwide
cotton consumption, identifying both the location and the character of the impacts. The study distinguishes
between three types of impact: evaporation of infiltrated rainwater for cotton growth (green water use),
withdrawal of ground- or surface water for irrigation or processing (blue water use) and water pollution during
growth or processing. The latter impact is quantified in terms of the dilution volume necessary to assimilate the
pollution. For the period 1997-2001 the study shows that the worldwide consumption of cotton products requires
256 Gm3 of water per year, out of which about 42% is blue water, 39% green water and 19% dilution water.
Impacts are typically cross-border. About 84% of the water footprint of cotton consumption in the EU25 region
is located outside Europe, with major impacts particularly in India and Uzbekistan. Given the general lack of
proper water pricing mechanisms or other ways of transmitting production-information, cotton consumers have
little incentive to take responsibility for the impacts on remote water systems.

Water footprint of cotton consumption / 9
1. Introduction
Globally, freshwater resources are becoming scarcer due to an increase in population and subsequent increase in
water appropriation and deterioration of water quality. The impact of consumption of people on the global water
resources can be mapped with the concept of the ‘water footprint’, a concept introduced by Hoekstra and Hung
(2002) and subsequently elaborated by Chapagain and Hoekstra (2004). The water footprint of a nation has been
defined as the total volume of freshwater that is used to produce the goods and services consumed by the
inhabitants of the nation. It deviates from earlier indicators of water use in the fact that the water footprint shows
water demand related to consumption within a nation, while the earlier indicators (e.g. total water withdrawal for
the various sectors of economy) show water demand in relation to production within a nation. The current report
focuses on the assessment and analysis of the water footprints of nations insofar related to the consumption of
cotton products. The period 1997-2001 has been taken as the period of analysis.
The water footprint concept is an analogue of the ecological footprint concept which was introduced in the
1990s (Rees, 1992; Wackernagel and Rees, 1996; Wackernagel et al., 1997; 1999). Whereas the ecological
footprint denotes the area (hectares) needed to sustain a population, the water footprint represents the water
volume (cubic metres per year) required.
Earlier water-footprint studies were limited to the quantification of resource use, i.e. the use of groundwater,
surface water and soil water (Hoekstra and Hung, 2002; Chapagain and Hoekstra, 2003a; 2003b; 2004). The
current study extends the water footprint concept through quantifying the impacts of pollution as well. This has
been done by quantifying the dilution water volumes required to dilute waste flows to such extent that the
quality of the water remains below agreed water quality standards. The rationale for including this water
component in the definition of the water footprint is similar to the rationale for including the land area needed
for uptake of anthropogenic carbon dioxide emissions in the definition of the ecological footprint. Land and
water do not function as resource bases only, but as systems for waste assimilation as well. We realise that the
method to translate the impacts of pollution into water requirements as applied in this study can potentially
invoke a similar debate as is being held about the methods applied to translate the impacts of carbon dioxide
emissions into land requirements (see e.g. Van den Bergh and Verbruggen, 1999; Van Kooten and Bulte, 2000).
We would welcome such a debate, because of the societal need for proper natural resources accounting systems
on the one hand and the difficulties in achieving the required scientific rigour in the accounting procedures on
the other hand. The approach introduced in the current study should be seen as a first step; we will reflect in
terms of possible improvements in the conclusions.
Some of the earlier studies on the impacts of cotton production were limited to the impacts in the industrial stage
only (e.g. Ren, 2000), leaving out the impacts in the agricultural stage. Other cotton impact studies use the
method of life cycle analysis and thus include all stages of production, but these studies are focussed on
methodology rather than the quantification of the impacts (e.g. Proto et al., 2000; Seuring, 2004). Earlier studies
that go in the direction of what we aim at in this report are the background studies for the cotton initiative of the
World Wide Fund for Nature (Soth et al., 1999; De Man, 2001). In our study, however, we aim to synthesize the
10 / Water footprint of cotton consumption a
various impacts of cotton on water in one comprehensive indicator, the water footprint, and we introduce the
spatial dimension by showing how water footprints of some nations particularly press in other parts of the world.
Cotton is the most important natural fibre used in the textile industries worldwide. Today, cotton takes up about
40 percent of textile production, while synthetic fibres take up about 55% (Proto et al., 2000; Soth et al., 1999).
During the period 1997-2001, international trade in cotton products constitutes 2 percent of the global
merchandise trade value.
The impacts of cotton production on the environment are easily visible and have different faces. On the one hand
there are the effects of water depletion, on the other hand the effects on water quality. In many of the major
textile processing areas, downstream riparians can see from the river what was the latest colour applied in the
upstream textile industry. The Aral Sea is the most famous example of the effects of water abstractions for
irrigation. In the period 1960-2000, the Aral Sea in Central Asia lost approximately 60% of its area and 80% of
its volume (Glantz 1998; Hall et al., 2001; Pereira et al., 2002; UNEP, 2002; Loh and Wackernagel, 2004) as a
result of the annual abstractions of water from the Amu Darya and the Syr Darya – the rivers which feed the
Aral Sea – to grow cotton in the desert.
About 53 percent of the global cotton field is irrigated, producing 73 percent of the global cotton production
(Soth et al., 1999). Irrigated cotton is mainly grown in the Mediterranean and other warm climatic regions,
where freshwater is already in short supply. Irrigated cotton is mainly located in dry regions: Egypt, Uzbekistan,
and Pakistan. The province Xinjiang of China is entirely irrigated whereas in Pakistan and the North of India a
major portion of the crop water requirements of cotton are met by supplementary irrigation. As a result, in
Pakistan already 31 percent of all irrigation water is drawn from ground water and in China the extensive
freshwater use has caused falling water tables (Soth et al., 1999). Nearly 70 percent of the world’s cotton crop
production is from China, USA, India, Pakistan and Uzbekistan (USDA, 2004). Most of the cotton productions
rely on a furrow irrigation system. Sprinkler and drip systems are also adopted as an irrigated method in water
scarce regions. However, hardly about 0.7 percent of land in the world is irrigated by this method (Postel,
1992).
Water footprint of cotton consumption / 11
2. Green, blue and dilution water From field to end product, cotton passes through a number of distinct production stages with different impacts
on water resources. These stages of production are often carried out at different locations and consumption can
take place at yet another place. For instance, Malaysia does not grow cotton, but imports raw cotton from China,
India and Pakistan for processing in the textile industry and exports cotton clothes to the European market. For
that reason the impacts of consumption of a final cotton product can only be found by tracing the origins of the
product. The relation between the production stages and their impacts on the environment is shown in Figure
2.1.
Resource use
Resource use
Crop production atfield level
Processing of cottonproducts
Environmental impacts
Green waterBlue waterFertilizersPesticides
Blue waterChemicals
Return flows
Resources typesProduction stages
Final cotton product
Pollution of resources
Depletion of resources
Pollution of resources
Depletion of resources
Return flows
Figure 2.1. Impact of cotton production on the natural resources.
Although the chain from cotton growth to final product can take several distinct steps, there are two major
stages: the agricultural stage (cotton production at field level) and the industrial stage (processing of seed cotton
into final cotton products). In the first stage, there are three types of impact: evaporation of infiltrated rainwater
for cotton growth, withdrawal of ground- or surface water for irrigation, and water pollution due to the leaching
of fertilisers and pesticides. Following Falkenmark (1995), we use the term ‘green water use’ for the rainwater
used for plant growth and ‘blue water use’ for the use of ground- and surface water for irrigation. Both green and
blue water use can be quantified in terms of volumes used per year. The impact on water quality is quantified
here and made comparable to the impacts of water use by translating the volumes of emitted chemicals into the
dilution volume necessary to assimilate the pollution. In the industrial stage, there are two major impacts on
water: abstraction of process water from surface or groundwater (blue water use), and pollution of water as a
result of the waste flows from the cotton processing industries. The latter is again translated into a certain
volume of dilution water requirement.

Water footprint of cotton consumption / 13
3. Virtual water
3.1. General method
In order to assess the water footprint of cotton consumption in a country we need to know the use of domestic
water resources for domestic cotton growth or processing and we need to know the water use associated with the
import and export of raw cotton or cotton products. The total water footprint of a country includes two
components: the part of the footprint that falls inside the country (internal water footprint) and the part of the
footprint that presses on other countries in the world (external water footprint). The distinction refers to use of
domestic water resources versus the use of foreign water resources (Chapagain and Hoekstra, 2004).
International trade of commodities brings along international flows of ‘virtual water’ (Hoekstra and Hung,
2005). 'Virtual water' is thereby defined as the volume of water used to produce a commodity (Allan, 1997;
1998). ‘Virtual water’ has also been called ‘embedded water’ and is a similar concept as ‘embodied energy’,
which has been defined as the direct and indirect energy required to produce a good, service or entity
(Herendeen, 2004). In accounting virtual water flows we keep track of which parts of these flows refer to green,
blue and dilution water respectively.
3.2. The virtual water content of seed cotton
The virtual water content of seed cotton (m3/ton) has been calculated as the ratio of the volume of water (m3/ha)
used during the entire period of crop growth to the corresponding crop yield (ton/ha). The volume of water used
to grow crops in the field has two components: effective rainfall (green water) and irrigation water (blue water).
The CROPWAT model (FAO, 2003a) has been used to estimate the effective rainfall and the irrigation
requirements per country. The climate data have been taken from FAO (2003b; 2003c) for the most appropriate
climatic stations (USDA/NOAA, 2005a) located in the major cotton producing regions of each country. The
actual irrigation water use is taken equal to the irrigation requirements as estimated with the CROPWAT model
for those countries where the whole harvesting area is reportedly irrigated. In the countries where only a certain
fraction of the harvesting area is irrigated, the actual irrigation water use is taken equal to this fraction times the
irrigation water requirements.
The ‘green’ virtual water content of the crop (Vg) has been estimated as the ratio of the effective rainfall (Pe) to
the crop yield (Y) (Equation 1). The ‘blue’ virtual water content of the crop (Vb) has been taken equal to the ratio
of the volume of irrigation water used (I) to the crop yield (Y) (Equation 2).
YPV e
g = (1)
YIVb = (2)
The total virtual water content of seed cotton is the sum of the green and blue components, calculated separately
for the fifteen largest cotton-producing countries. These countries contribute nearly 90% of the global cotton
14 / Water footprint of cotton consumption a
production (Table 3.1). For the remaining countries the global average virtual water content of seed cotton has
been assumed. In the fifteen largest cotton-producing countries, the major cotton-producing regions have been
identified (Table 3.2) so that the appropriate climate data could be selected. For regions with more than one
climate station, the data for the relevant stations have been equally weighed assuming that the stations represent
equally sized cotton-producing areas. National average crop water requirements have been calculated on the
basis of the respective share of each region to the national production.
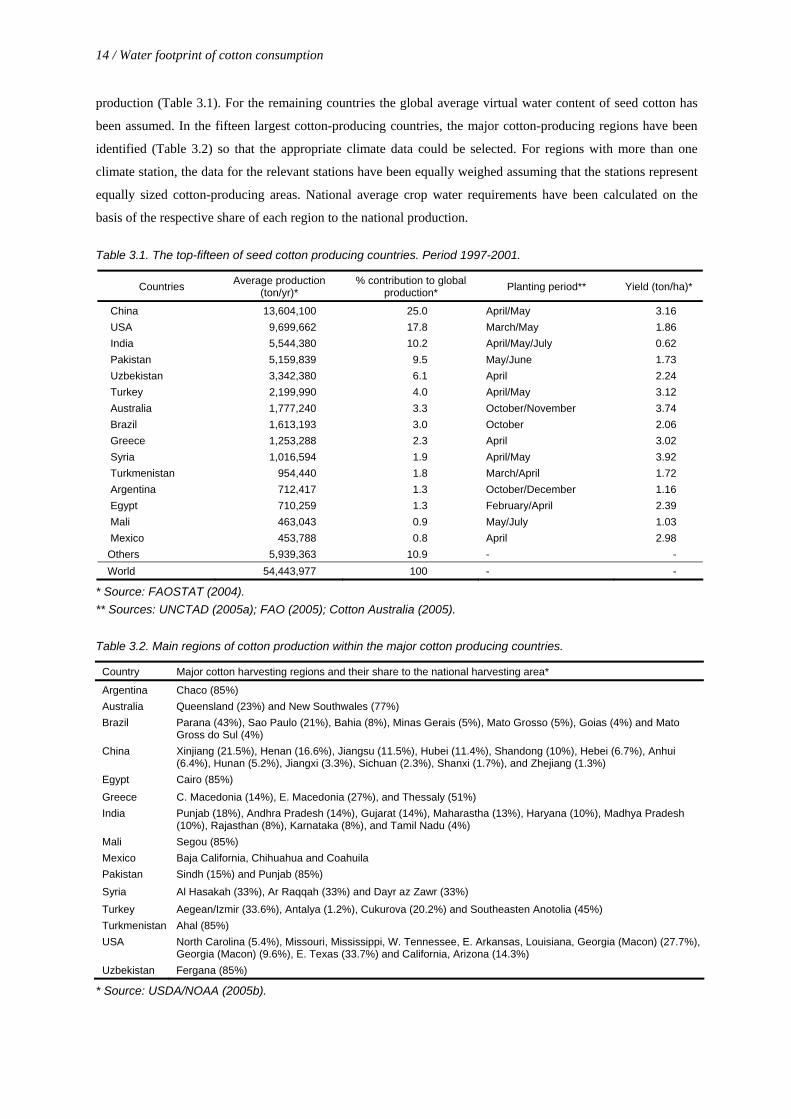
Table 3.1. The top-fifteen of seed cotton producing countries. Period 1997-2001.
Countries Average production (ton/yr)*
% contribution to global production* Planting period** Yield (ton/ha)*
China 13,604,100 25.0 April/May 3.16 USA 9,699,662 17.8 March/May 1.86 India 5,544,380 10.2 April/May/July 0.62 Pakistan 5,159,839 9.5 May/June 1.73 Uzbekistan 3,342,380 6.1 April 2.24 Turkey 2,199,990 4.0 April/May 3.12 Australia 1,777,240 3.3 October/November 3.74 Brazil 1,613,193 3.0 October 2.06 Greece 1,253,288 2.3 April 3.02 Syria 1,016,594 1.9 April/May 3.92 Turkmenistan 954,440 1.8 March/April 1.72 Argentina 712,417 1.3 October/December 1.16 Egypt 710,259 1.3 February/April 2.39 Mali 463,043 0.9 May/July 1.03 Mexico 453,788 0.8 April 2.98 Others 5,939,363 10.9 - - World 54,443,977 100 - -
* Source: FAOSTAT (2004). ** Sources: UNCTAD (2005a); FAO (2005); Cotton Australia (2005).
Table 3.2. Main regions of cotton production within the major cotton producing countries.
Country Major cotton harvesting regions and their share to the national harvesting area*
Argentina Chaco (85%) Australia Queensland (23%) and New Southwales (77%) Brazil Parana (43%), Sao Paulo (21%), Bahia (8%), Minas Gerais (5%), Mato Grosso (5%), Goias (4%) and Mato
Gross do Sul (4%) China Xinjiang (21.5%), Henan (16.6%), Jiangsu (11.5%), Hubei (11.4%), Shandong (10%), Hebei (6.7%), Anhui
(6.4%), Hunan (5.2%), Jiangxi (3.3%), Sichuan (2.3%), Shanxi (1.7%), and Zhejiang (1.3%) Egypt Cairo (85%) Greece C. Macedonia (14%), E. Macedonia (27%), and Thessaly (51%) India Punjab (18%), Andhra Pradesh (14%), Gujarat (14%), Maharastha (13%), Haryana (10%), Madhya Pradesh
(10%), Rajasthan (8%), Karnataka (8%), and Tamil Nadu (4%) Mali Segou (85%) Mexico Baja California, Chihuahua and Coahuila Pakistan Sindh (15%) and Punjab (85%) Syria Al Hasakah (33%), Ar Raqqah (33%) and Dayr az Zawr (33%) Turkey Aegean/Izmir (33.6%), Antalya (1.2%), Cukurova (20.2%) and Southeasten Anotolia (45%) Turkmenistan Ahal (85%) USA North Carolina (5.4%), Missouri, Mississippi, W. Tennessee, E. Arkansas, Louisiana, Georgia (Macon) (27.7%),
Georgia (Macon) (9.6%), E. Texas (33.7%) and California, Arizona (14.3%) Uzbekistan Fergana (85%)
* Source: USDA/NOAA (2005b).
Water footprint of cotton consumption / 15
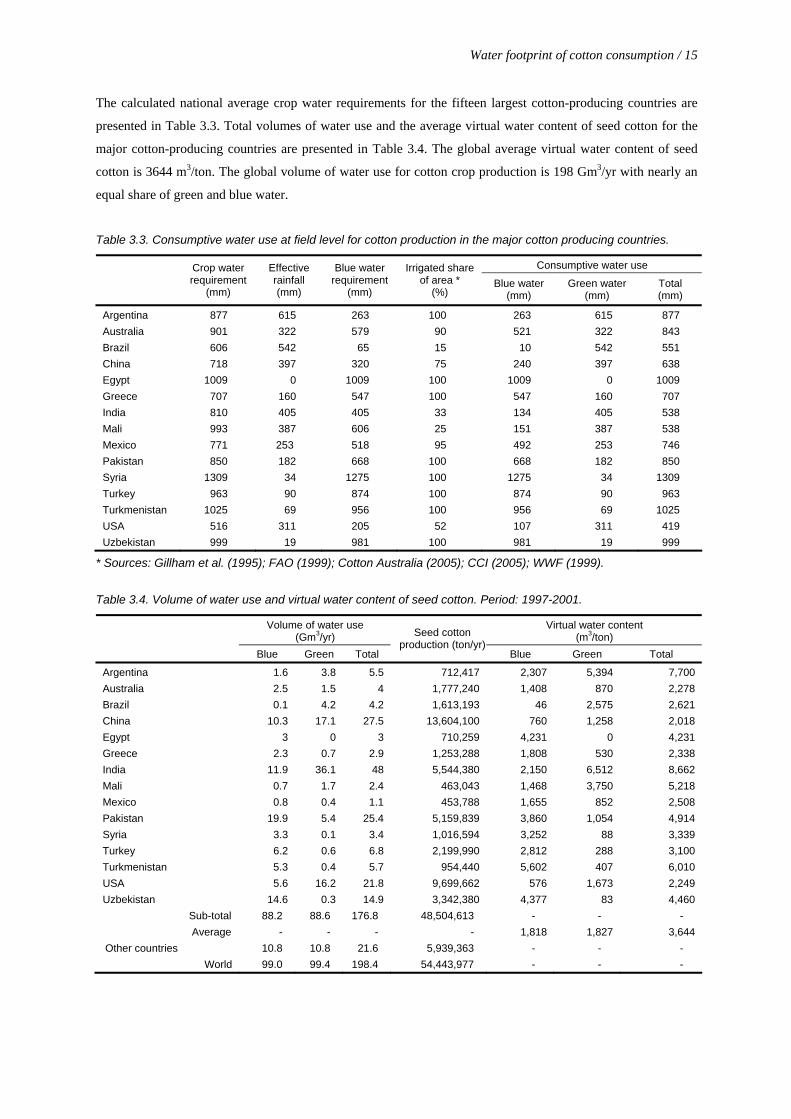
The calculated national average crop water requirements for the fifteen largest cotton-producing countries are
presented in Table 3.3. Total volumes of water use and the average virtual water content of seed cotton for the
major cotton-producing countries are presented in Table 3.4. The global average virtual water content of seed
cotton is 3644 m3/ton. The global volume of water use for cotton crop production is 198 Gm3/yr with nearly an
equal share of green and blue water.
Table 3.3. Consumptive water use at field level for cotton production in the major cotton producing countries.
Consumptive water use
Crop water requirement
(mm)
Effective rainfall (mm)
Blue water requirement
(mm)
Irrigated share of area *
(%) Blue water
(mm) Green water
(mm) Total (mm)
Argentina 877 615 263 100 263 615 877 Australia 901 322 579 90 521 322 843 Brazil 606 542 65 15 10 542 551 China 718 397 320 75 240 397 638 Egypt 1009 0 1009 100 1009 0 1009 Greece 707 160 547 100 547 160 707 India 810 405 405 33 134 405 538 Mali 993 387 606 25 151 387 538 Mexico 771 253 518 95 492 253 746 Pakistan 850 182 668 100 668 182 850 Syria 1309 34 1275 100 1275 34 1309 Turkey 963 90 874 100 874 90 963 Turkmenistan 1025 69 956 100 956 69 1025 USA 516 311 205 52 107 311 419 Uzbekistan 999 19 981 100 981 19 999
* Sources: Gillham et al. (1995); FAO (1999); Cotton Australia (2005); CCI (2005); WWF (1999).
Table 3.4. Volume of water use and virtual water content of seed cotton. Period: 1997-2001.
Volume of water use (Gm3/yr)
Virtual water content (m3/ton)
Blue Green Total
Seed cotton production (ton/yr)
Blue Green Total
Argentina 1.6 3.8 5.5 712,417 2,307 5,394 7,700 Australia 2.5 1.5 4 1,777,240 1,408 870 2,278 Brazil 0.1 4.2 4.2 1,613,193 46 2,575 2,621 China 10.3 17.1 27.5 13,604,100 760 1,258 2,018 Egypt 3 0 3 710,259 4,231 0 4,231 Greece 2.3 0.7 2.9 1,253,288 1,808 530 2,338 India 11.9 36.1 48 5,544,380 2,150 6,512 8,662 Mali 0.7 1.7 2.4 463,043 1,468 3,750 5,218 Mexico 0.8 0.4 1.1 453,788 1,655 852 2,508 Pakistan 19.9 5.4 25.4 5,159,839 3,860 1,054 4,914 Syria 3.3 0.1 3.4 1,016,594 3,252 88 3,339 Turkey 6.2 0.6 6.8 2,199,990 2,812 288 3,100 Turkmenistan 5.3 0.4 5.7 954,440 5,602 407 6,010 USA 5.6 16.2 21.8 9,699,662 576 1,673 2,249 Uzbekistan 14.6 0.3 14.9 3,342,380 4,377 83 4,460
Sub-total 88.2 88.6 176.8 48,504,613 - - - Average - - - - 1,818 1,827 3,644
Other countries 10.8 10.8 21.6 5,939,363 - - - World 99.0 99.4 198.4 54,443,977 - - -
16 / Water footprint of cotton consumption a
The water use for cotton production differs considerably over the countries. Climatic conditions for cotton
production are least attractive in Syria, Egypt, Turkmenistan, Uzbekistan and Turkey because evaporative
demand in all these countries is very high (1000-1300 mm) while effective rainfall is very low (0-100 mm). The
shortage of rain in these countries has been solved by irrigating the full harvesting area. Resulting yields vary
from world-average (Turkmenistan) to very high (Syria, Turkey). Climatic conditions for cotton production are
most attractive in the USA and Brazil. Evaporative demand is low (500-600 mm), so that vast areas can suffice
without irrigation. Yields are a bit above world-average. India and Mali take a particular position by producing
cotton under high evaporative water demand (800-1000 mm), short-falling effective rainfall (400 mm), and
partial irrigation only (between a quarter and a third of the harvesting area), resulting in relatively low overall
yields.
The average virtual water content of seed cotton in the various countries gives a first rough indication of the
relative impacts of the various production systems on water. Cotton from India, Argentina, Turkmenistan, Mali,
Pakistan, Uzbekistan, and Egypt is most water-intensive. Cotton from China and the USA on the other hand is
very water-extensive. Since blue water generally has a much larger opportunity cost than green water, it makes
sense to particularly look at the blue virtual water content of cotton in the various countries. China and the USA
then still show a positive picture in this comparative analysis. Also Brazil comes in a positive light now, due to
the acceptable yields under largely rain-fed conditions. The blue virtual water content and thus the impact per
unit of cotton production are highest in Turkmenistan, Uzbekistan, Egypt, and Pakistan, followed by Syria,
Turkey, Argentina and India.
It is interesting to compare neighbouring countries such as Brazil-Argentina and India-Pakistan. Cotton from
Brazil is preferable over cotton from Argentina from a water resources point of view because growth conditions
are better in Brazil (smaller irrigation requirements) and even despite the fact that the cotton harvesting area in
Argentina is fully irrigated (compared to 15% in Brazil), the yields in Argentina are only half the yield in Brazil.
Similarly, cotton from India is to be preferred over cotton from Pakistan – again from a water resources point of
view only – because the effective rainfall in Pakistan’s cotton harvesting area is low compared to that in India
and the harvesting area in Pakistan is fully irrigated. Although India achieves very low cotton yields per hectare,
the blue water requirements per ton of product are much lower in India compared to Pakistan.
3.3. The virtual water content of cotton products
The different processing steps that transform the cotton plant through various intermediate products to some
final products are shown in Figure 3.1. The virtual water content of seed cotton is attributed to its products
following the methodology as introduced and applied by Chapagain and Hoekstra (2004). That means that the
virtual water content of each processed cotton product has been calculated based on the product fraction (ton of
crop product obtained per ton of primary crop) and the value fraction (the market value of the crop product
divided by the aggregated market value of all crop products derived from one primary crop). The product
fractions have been taken from the commodity trees in FAO (2003d) and UNCTAD (2005b). The value fractions
have been calculated based on the market prices of the various products. The global average market prices of the
cotton products have been calculated from ITC (2004). In calculating the virtual water content of fabric, the
Water footprint of cotton consumption / 17
process water requirements for bleaching, dying and printing have been added (30 m3 per ton for bleaching, 140
m3 per ton for dying and 190 m3 per ton for printing). In the step of finishing there is also additional water
required (140 m3 per ton). The process water requirements have to be understood as rough average estimates,
because the actual water requirements vary considerably among various techniques used (Ren, 2000).
HarvestingCotton plant Seed-cotton
Cotton seed
Cotton lint
Cotton seedcake
Cotton seed oil
Grey fabric
Fabric
Final textile
Cotton linters
Cotton, notcarded or combed
Cotton, carded orcombed (yarn)
Hulling/extraction
Garnetted stock
Carding/Spinning
Yarn waste
Knitting/weaving
Wet processing
Finishing
Cotton seed oil,refined
Ginning
18.063.0
82.035.0
47.016.0
33.051.0
20.010.0
00.107.1
00.100.1
99.095.0
10.005.0
00.100.1
00.100.1
99.095.0
10.005.0
82.035.0
Legend
Value fraction
Product fraction
Figure 3.1. The product tree for cotton, showing the product fraction and value fraction per processing step.
The green and blue virtual water content of different cotton products for the major cotton producing countries is
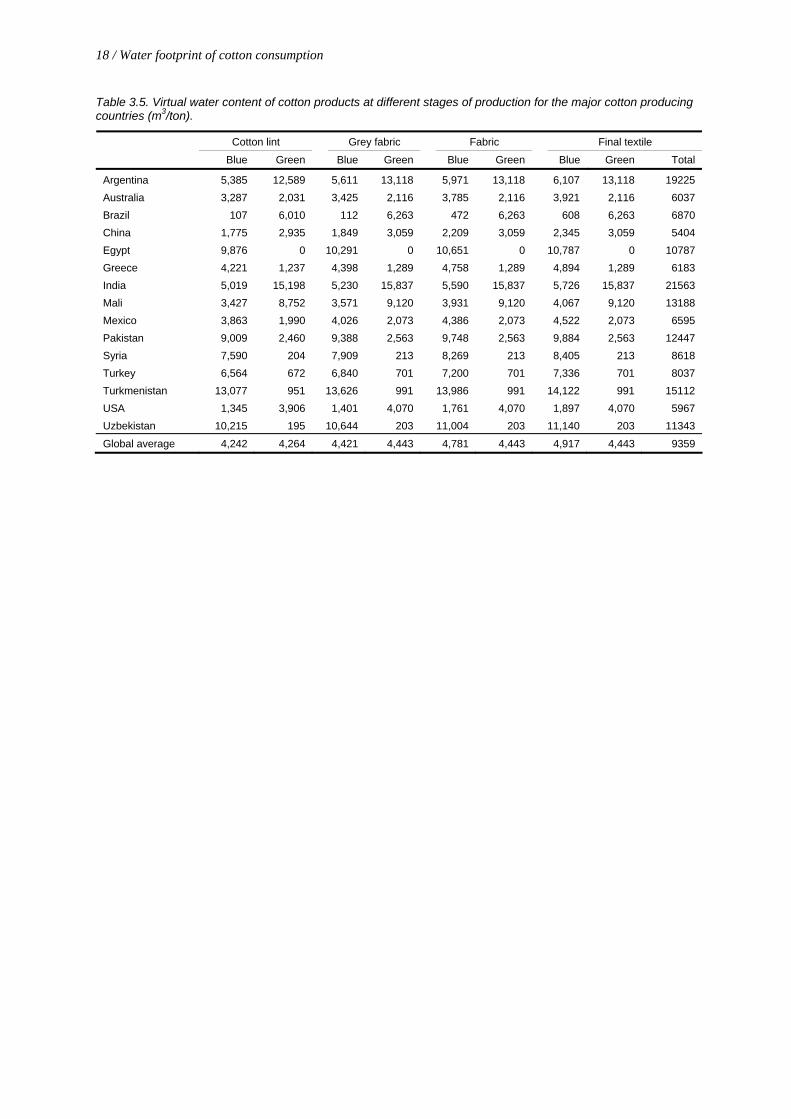
presented in Table 3.5. These water volumes do not yet include the volume of water necessary to dilute the
fertiliser-enriched return flows from the cotton plantations and the polluted return flows from the processing
industries.
18 / Water footprint of cotton consumption a
Table 3.5. Virtual water content of cotton products at different stages of production for the major cotton producing countries (m3/ton).
Cotton lint Grey fabric Fabric Final textile
Blue Green Blue Green Blue Green Blue Green Total
Argentina 5,385 12,589 5,611 13,118 5,971 13,118 6,107 13,118 19225 Australia 3,287 2,031 3,425 2,116 3,785 2,116 3,921 2,116 6037 Brazil 107 6,010 112 6,263 472 6,263 608 6,263 6870 China 1,775 2,935 1,849 3,059 2,209 3,059 2,345 3,059 5404 Egypt 9,876 0 10,291 0 10,651 0 10,787 0 10787 Greece 4,221 1,237 4,398 1,289 4,758 1,289 4,894 1,289 6183 India 5,019 15,198 5,230 15,837 5,590 15,837 5,726 15,837 21563 Mali 3,427 8,752 3,571 9,120 3,931 9,120 4,067 9,120 13188 Mexico 3,863 1,990 4,026 2,073 4,386 2,073 4,522 2,073 6595 Pakistan 9,009 2,460 9,388 2,563 9,748 2,563 9,884 2,563 12447 Syria 7,590 204 7,909 213 8,269 213 8,405 213 8618 Turkey 6,564 672 6,840 701 7,200 701 7,336 701 8037 Turkmenistan 13,077 951 13,626 991 13,986 991 14,122 991 15112 USA 1,345 3,906 1,401 4,070 1,761 4,070 1,897 4,070 5967 Uzbekistan 10,215 195 10,644 203 11,004 203 11,140 203 11343
Global average 4,242 4,264 4,421 4,443 4,781 4,443 4,917 4,443 9359
Water footprint of cotton consumption / 19
4. Impact on the water quality in the cotton producing countries 4.1. Impact due to use of fertilisers in crop production
Cotton production affects water quality both in the stage of growing and the stage of processing. The impact in
the first stage depends upon the amount of fertilizers used and the plant fertilizer uptake rate. The latter depends
on the soil type, available quantity of fertilizer and stage of plant growth. The total quantity of pesticides used, in
almost all cases, gets into either ground water or surface water bodies. Only 2.4 percent of the world’s arable
land is planted with cotton yet cotton accounts for 24 percent of the world’s insecticide market and 11 percent of
the sale of global pesticides (WWF, 2003). The nutrients (nitrogen, phosphorus, potash and other minor
nutrients) and pesticides that leach out of the plant root zone can contaminate groundwater and surface water.
The nitrite ions (NO2-) in blood can inactivate haemoglobin, reducing the oxygen carrying capacity of the blood
and the infants under 3 months are at risk. Nitrates in the drinking water can be harmful as the nitrite ions are
formed in the gastrointestinal tract by the chemical reduction of the nitrate ions. Hence the target of the
regulation is the nitrate intake. In surface waters, fertilizers can stimulate growth of algae and other aquatic
plants, which results in a reduction of dissolved oxygen in the water when dead plant material decomposes (a
process known as eutrophication).
Phosphorus has low mobility in the soil and leaching is generally not a problem. Phosphates can react with other
minerals in the soil forming insoluble compounds and the amount of potassium leached is influenced by the
cation exchange capacity of the soil. Instead, mobility to the roots is the prime limitation to uptake. Potassium
mobility in soils is intermediate between nitrogen and phosphorus, but is not easily leached because it has a
positive charge (K+) which causes it to be attracted to negatively charged soil colloids.
The main nitrogen processes in the soil are immobilisation/mineralization from organic matter,
adsorption/desorption form cation-anion exchange sites on clay and organic matter and the application from
external sources. The nitrogen is lost in various forms such as seed cotton, de-nitrification, leaching,
volatilisation and burning stubble. Nitrogen is most susceptible to leaching because it cannot be retained by the
soil. The nitrate ion, NO3- is not strongly held to clay and organic matter and is subject to movement within the
soil profile. Downward movement of ions (leaching) is a problem in coarse-textured soils (loams and sands). In
clay soils where movement of soil water is slow, nitrate movement is also slow. Greater losses occur from
poorly structured or poorly drained soils compared to well-structured and well drained soils. The loss of
fertilizer N during crop growth is variable and site dependent. Deep drainage and nutrient leaching are
significant under irrigated cotton. During flood irrigation, surface soil high in nitrate is washed into cracks with
the irrigation.
About 60 percent of the total nitrogen applied is removed in the seed cotton (CRC, 2004). Silvertooth et al.
(2001) approximated that out of the total nitrogen applied to 80 percent of it gets recovered in the cotton field.
The residual fraction either goes to the atmosphere by de-nitrification or discharges to the free flowing water
bodies. In the present study, the quantity of N that reaches free flowing water bodies is assumed to be 10 percent
20 / Water footprint of cotton consumption a
of the applied rate assuming a steady state balance at root zone in the long run. The effect of use of pesticides
and herbicides in cotton farming to the environment has not been analysed.
The total volume of water required per ton N is calculated considering the volume of nitrogen leached (ton/ton)
and the permissible limit (ton/m3) in the free flowing surface water bodies. The standard recommended by EPA
(2005) for nitrate in drinking water is 10 milligrams per litre (measured as nitrogen) and has been taken to
calculate the necessary dilution water volume. This is a conservative approach, since natural background
concentration of N in the water used for dilution has been assumed negligible.
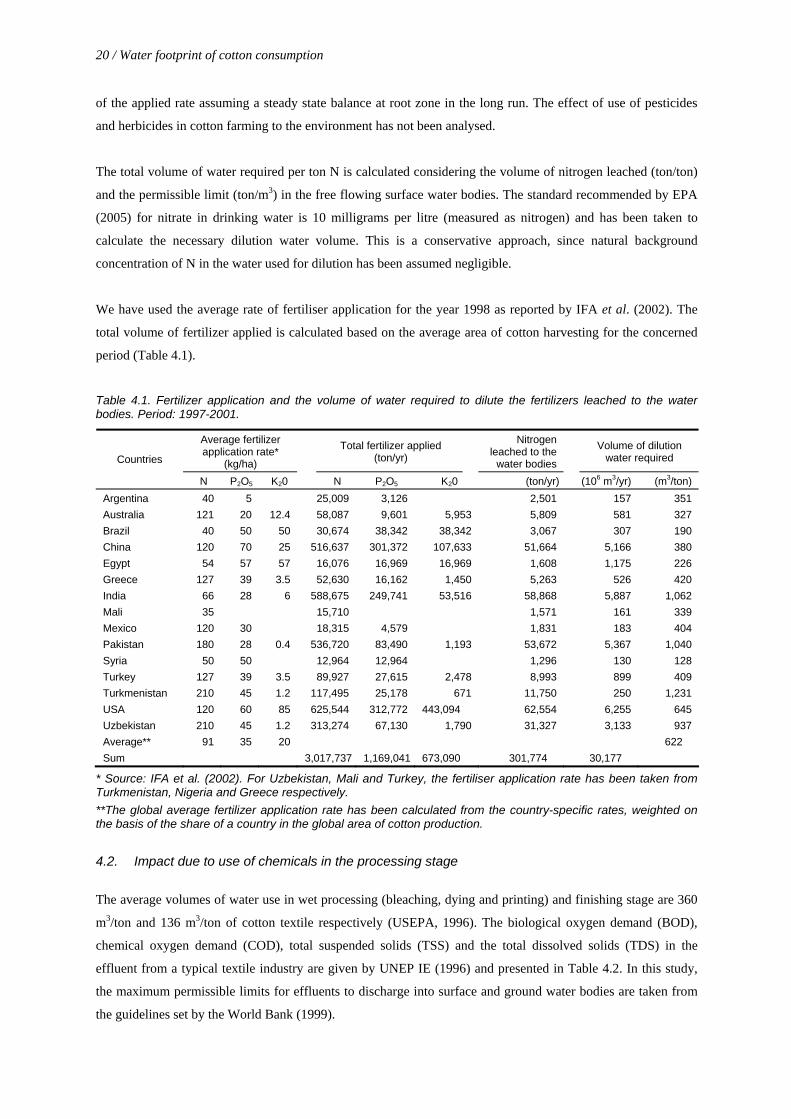
We have used the average rate of fertiliser application for the year 1998 as reported by IFA et al. (2002). The
total volume of fertilizer applied is calculated based on the average area of cotton harvesting for the concerned
period (Table 4.1).
Table 4.1. Fertilizer application and the volume of water required to dilute the fertilizers leached to the water bodies. Period: 1997-2001.
Average fertilizer application rate*
(kg/ha)
Total fertilizer applied (ton/yr)
Nitrogen leached to the
water bodies Volume of dilution
water required Countries
N P2O5 K20 N P2O5 K20 (ton/yr) (106 m3/yr) (m3/ton) Argentina 40 5 25,009 3,126 2,501 157 351 Australia 121 20 12.4 58,087 9,601 5,953 5,809 581 327 Brazil 40 50 50 30,674 38,342 38,342 3,067 307 190 China 120 70 25 516,637 301,372 107,633 51,664 5,166 380 Egypt 54 57 57 16,076 16,969 16,969 1,608 1,175 226 Greece 127 39 3.5 52,630 16,162 1,450 5,263 526 420 India 66 28 6 588,675 249,741 53,516 58,868 5,887 1,062 Mali 35 15,710 1,571 161 339 Mexico 120 30 18,315 4,579 1,831 183 404 Pakistan 180 28 0.4 536,720 83,490 1,193 53,672 5,367 1,040 Syria 50 50 12,964 12,964 1,296 130 128 Turkey 127 39 3.5 89,927 27,615 2,478 8,993 899 409 Turkmenistan 210 45 1.2 117,495 25,178 671 11,750 250 1,231 USA 120 60 85 625,544 312,772 443,094 62,554 6,255 645 Uzbekistan 210 45 1.2 313,274 67,130 1,790 31,327 3,133 937 Average** 91 35 20 622 Sum 3,017,737 1,169,041 673,090 301,774 30,177
* Source: IFA et al. (2002). For Uzbekistan, Mali and Turkey, the fertiliser application rate has been taken from Turkmenistan, Nigeria and Greece respectively. **The global average fertilizer application rate has been calculated from the country-specific rates, weighted on the basis of the share of a country in the global area of cotton production.
4.2. Impact due to use of chemicals in the processing stage
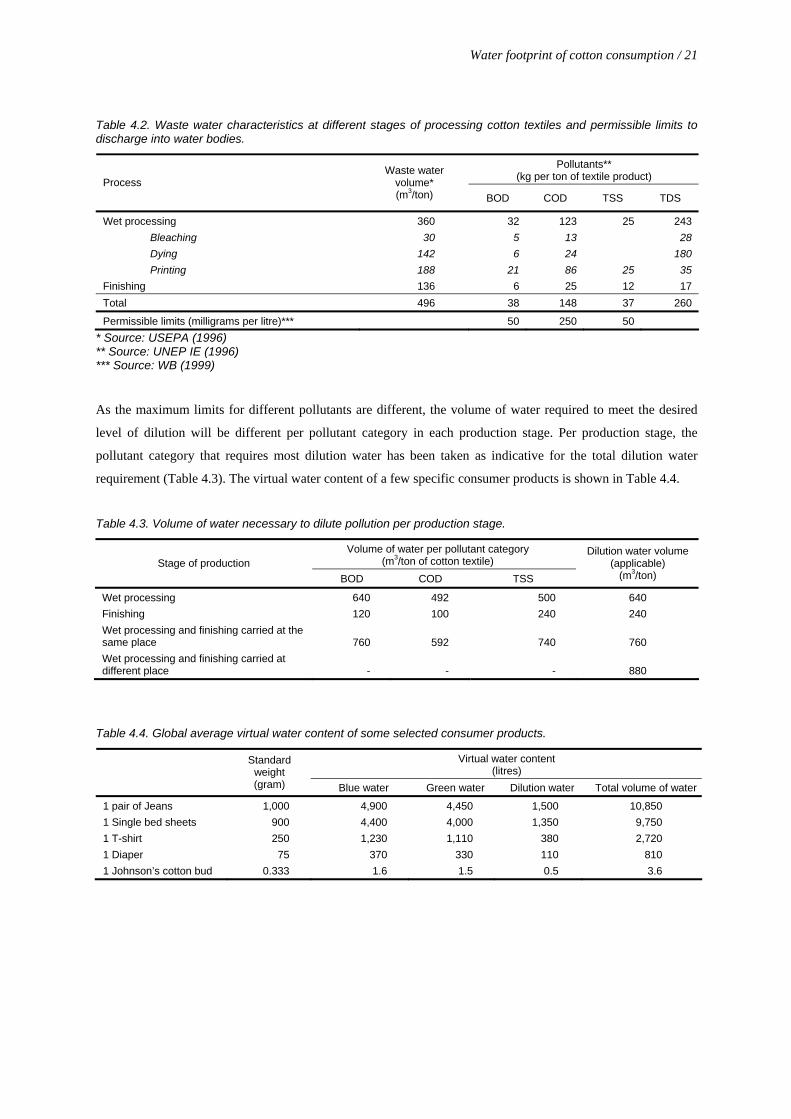
The average volumes of water use in wet processing (bleaching, dying and printing) and finishing stage are 360
m3/ton and 136 m3/ton of cotton textile respectively (USEPA, 1996). The biological oxygen demand (BOD),
chemical oxygen demand (COD), total suspended solids (TSS) and the total dissolved solids (TDS) in the
effluent from a typical textile industry are given by UNEP IE (1996) and presented in Table 4.2. In this study,
the maximum permissible limits for effluents to discharge into surface and ground water bodies are taken from
the guidelines set by the World Bank (1999).
Water footprint of cotton consumption / 21
Table 4.2. Waste water characteristics at different stages of processing cotton textiles and permissible limits to discharge into water bodies.
Pollutants** (kg per ton of textile product) Process
Waste water volume* (m3/ton) BOD COD TSS TDS
Wet processing 360 32 123 25 243 Bleaching 30 5 13 28 Dying 142 6 24 180 Printing 188 21 86 25 35 Finishing 136 6 25 12 17 Total 496 38 148 37 260
Permissible limits (milligrams per litre)*** 50 250 50 * Source: USEPA (1996) ** Source: UNEP IE (1996) *** Source: WB (1999)
As the maximum limits for different pollutants are different, the volume of water required to meet the desired
level of dilution will be different per pollutant category in each production stage. Per production stage, the
pollutant category that requires most dilution water has been taken as indicative for the total dilution water
requirement (Table 4.3). The virtual water content of a few specific consumer products is shown in Table 4.4.
Table 4.3. Volume of water necessary to dilute pollution per production stage.
Volume of water per pollutant category (m3/ton of cotton textile) Stage of production
BOD COD TSS
Dilution water volume (applicable)
(m3/ton)
Wet processing 640 492 500 640 Finishing 120 100 240 240 Wet processing and finishing carried at the same place 760 592 740 760 Wet processing and finishing carried at different place - - - 880
Table 4.4. Global average virtual water content of some selected consumer products.
Virtual water content (litres)
Standard weight (gram) Blue water Green water Dilution water Total volume of water
1 pair of Jeans 1,000 4,900 4,450 1,500 10,850 1 Single bed sheets 900 4,400 4,000 1,350 9,750 1 T-shirt 250 1,230 1,110 380 2,720 1 Diaper 75 370 330 110 810 1 Johnson’s cotton bud 0.333 1.6 1.5 0.5 3.6

Water footprint of cotton consumption / 23
5. International virtual water flows Virtual water flows between nations have been calculated by multiplying commodity trade flows by their
associated total virtual water content:
[ ] [ ] [ cnVcnnTcnnF etieie ,,,,, ×= ] (3)
in which F denotes the virtual water flow (m3/yr) from exporting country ne to importing country ni as a result of
trade in cotton product c; T the commodity trade (ton/yr) from the exporting to the importing country; and Vt the
total virtual water content (m3/ton) of the commodity in the exporting country. We have taken into account the
international trade of cotton products for the complete set of countries from the Personal Computer Trade
Analysis System of the International Trade Centre, produced in collaboration with UNCTAD/WTO. It covers
trade data from 146 reporting countries disaggregated by product and partner countries for the period 1997-2001
(ITC, 2004).
For the calculation of international virtual water flows, all cotton products are considered as reported in the
database of ITC (2004). It includes the complete set of cotton products from the commodity groups 12, 14, 15,
23, 60, 61, 62 and 63. From group 52, only those products with more than 85 percent of cotton in their
composition are considered.
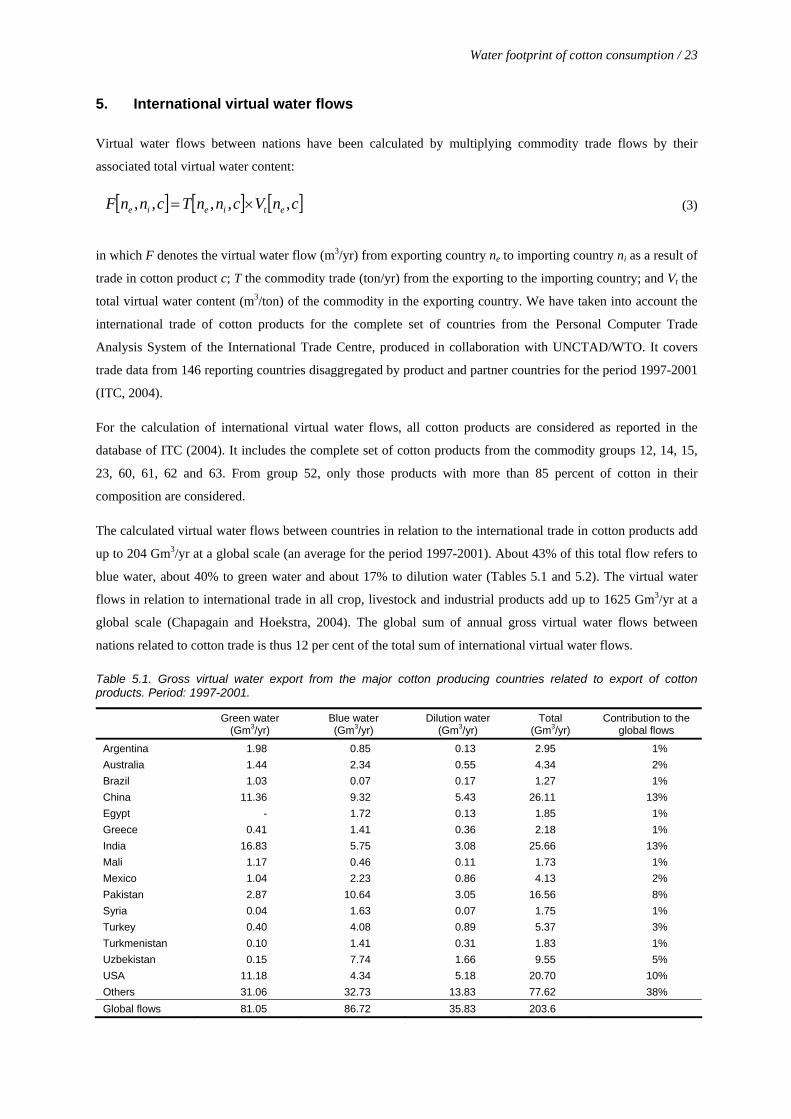
The calculated virtual water flows between countries in relation to the international trade in cotton products add
up to 204 Gm3/yr at a global scale (an average for the period 1997-2001). About 43% of this total flow refers to
blue water, about 40% to green water and about 17% to dilution water (Tables 5.1 and 5.2). The virtual water
flows in relation to international trade in all crop, livestock and industrial products add up to 1625 Gm3/yr at a
global scale (Chapagain and Hoekstra, 2004). The global sum of annual gross virtual water flows between
nations related to cotton trade is thus 12 per cent of the total sum of international virtual water flows.
Table 5.1. Gross virtual water export from the major cotton producing countries related to export of cotton products. Period: 1997-2001.
Green water (Gm3/yr)
Blue water (Gm3/yr)
Dilution water (Gm3/yr)
Total (Gm3/yr)
Contribution to the global flows
Argentina 1.98 0.85 0.13 2.95 1% Australia 1.44 2.34 0.55 4.34 2% Brazil 1.03 0.07 0.17 1.27 1% China 11.36 9.32 5.43 26.11 13% Egypt - 1.72 0.13 1.85 1% Greece 0.41 1.41 0.36 2.18 1% India 16.83 5.75 3.08 25.66 13% Mali 1.17 0.46 0.11 1.73 1% Mexico 1.04 2.23 0.86 4.13 2% Pakistan 2.87 10.64 3.05 16.56 8% Syria 0.04 1.63 0.07 1.75 1% Turkey 0.40 4.08 0.89 5.37 3% Turkmenistan 0.10 1.41 0.31 1.83 1% Uzbekistan 0.15 7.74 1.66 9.55 5% USA 11.18 4.34 5.18 20.70 10% Others 31.06 32.73 13.83 77.62 38% Global flows 81.05 86.72 35.83 203.6
24 / Water footprint of cotton consumption a
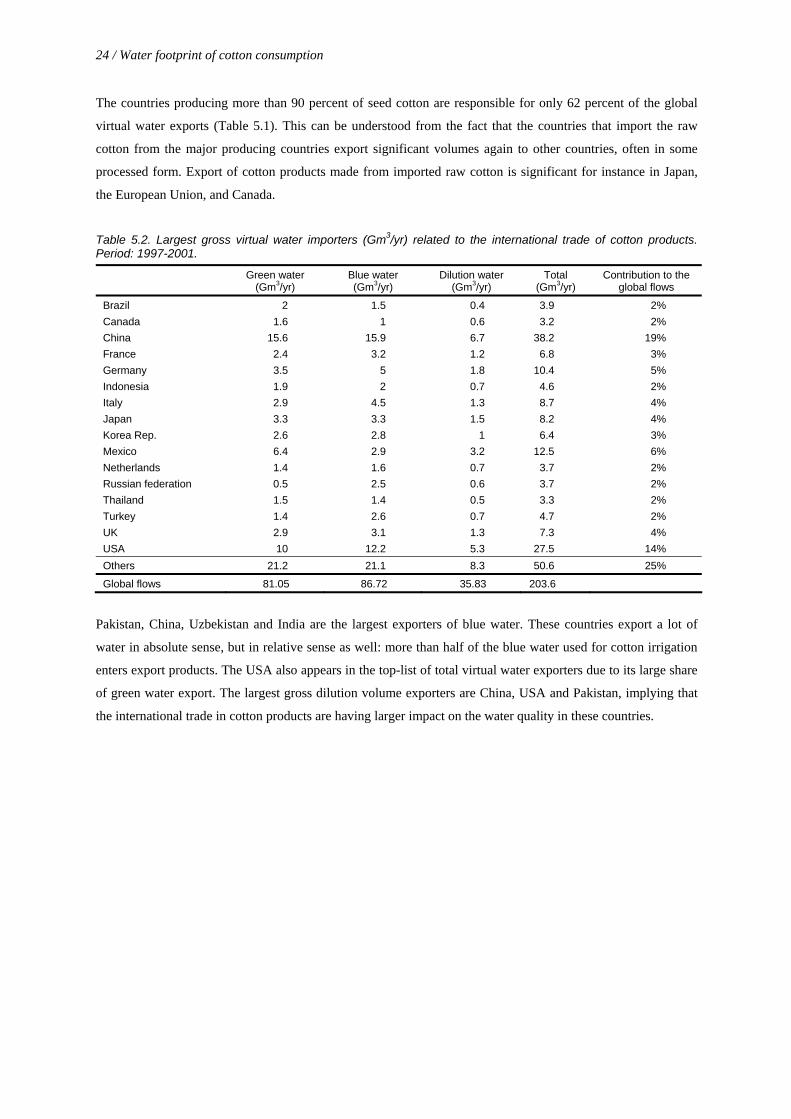
The countries producing more than 90 percent of seed cotton are responsible for only 62 percent of the global
virtual water exports (Table 5.1). This can be understood from the fact that the countries that import the raw
cotton from the major producing countries export significant volumes again to other countries, often in some
processed form. Export of cotton products made from imported raw cotton is significant for instance in Japan,
the European Union, and Canada.
Table 5.2. Largest gross virtual water importers (Gm3/yr) related to the international trade of cotton products. Period: 1997-2001.
Green water (Gm3/yr)
Blue water (Gm3/yr)
Dilution water (Gm3/yr)
Total (Gm3/yr)
Contribution to the global flows
Brazil 2 1.5 0.4 3.9 2% Canada 1.6 1 0.6 3.2 2% China 15.6 15.9 6.7 38.2 19% France 2.4 3.2 1.2 6.8 3% Germany 3.5 5 1.8 10.4 5% Indonesia 1.9 2 0.7 4.6 2% Italy 2.9 4.5 1.3 8.7 4% Japan 3.3 3.3 1.5 8.2 4% Korea Rep. 2.6 2.8 1 6.4 3% Mexico 6.4 2.9 3.2 12.5 6% Netherlands 1.4 1.6 0.7 3.7 2% Russian federation 0.5 2.5 0.6 3.7 2% Thailand 1.5 1.4 0.5 3.3 2% Turkey 1.4 2.6 0.7 4.7 2% UK 2.9 3.1 1.3 7.3 4% USA 10 12.2 5.3 27.5 14% Others 21.2 21.1 8.3 50.6 25%
Global flows 81.05 86.72 35.83 203.6
Pakistan, China, Uzbekistan and India are the largest exporters of blue water. These countries export a lot of
water in absolute sense, but in relative sense as well: more than half of the blue water used for cotton irrigation
enters export products. The USA also appears in the top-list of total virtual water exporters due to its large share
of green water export. The largest gross dilution volume exporters are China, USA and Pakistan, implying that
the international trade in cotton products are having larger impact on the water quality in these countries.
Water footprint of cotton consumption / 25
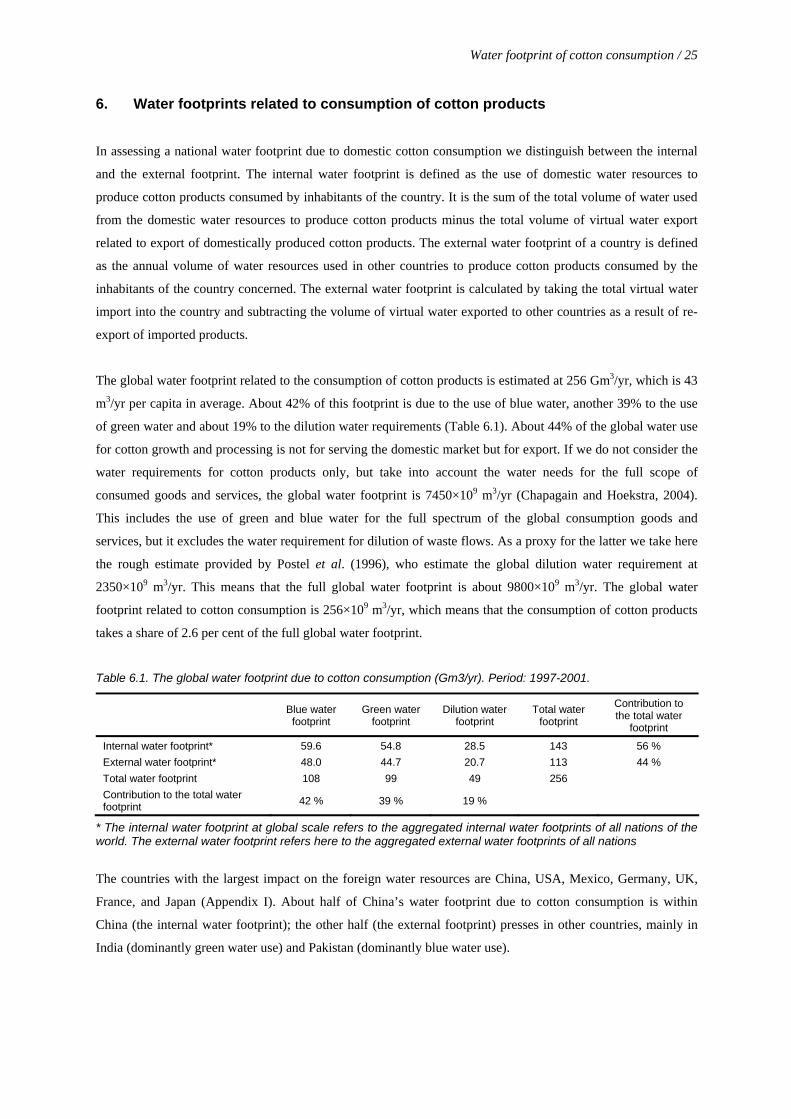
6. Water footprints related to consumption of cotton products
In assessing a national water footprint due to domestic cotton consumption we distinguish between the internal
and the external footprint. The internal water footprint is defined as the use of domestic water resources to
produce cotton products consumed by inhabitants of the country. It is the sum of the total volume of water used
from the domestic water resources to produce cotton products minus the total volume of virtual water export
related to export of domestically produced cotton products. The external water footprint of a country is defined
as the annual volume of water resources used in other countries to produce cotton products consumed by the
inhabitants of the country concerned. The external water footprint is calculated by taking the total virtual water
import into the country and subtracting the volume of virtual water exported to other countries as a result of re-
export of imported products.
The global water footprint related to the consumption of cotton products is estimated at 256 Gm3/yr, which is 43
m3/yr per capita in average. About 42% of this footprint is due to the use of blue water, another 39% to the use
of green water and about 19% to the dilution water requirements (Table 6.1). About 44% of the global water use
for cotton growth and processing is not for serving the domestic market but for export. If we do not consider the
water requirements for cotton products only, but take into account the water needs for the full scope of
consumed goods and services, the global water footprint is 7450×109 m3/yr (Chapagain and Hoekstra, 2004).
This includes the use of green and blue water for the full spectrum of the global consumption goods and
services, but it excludes the water requirement for dilution of waste flows. As a proxy for the latter we take here
the rough estimate provided by Postel et al. (1996), who estimate the global dilution water requirement at
2350×109 m3/yr. This means that the full global water footprint is about 9800×109 m3/yr. The global water
footprint related to cotton consumption is 256×109 m3/yr, which means that the consumption of cotton products
takes a share of 2.6 per cent of the full global water footprint.
Table 6.1. The global water footprint due to cotton consumption (Gm3/yr). Period: 1997-2001.
Blue water footprint
Green water footprint
Dilution water footprint
Total water footprint
Contribution to the total water
footprint
Internal water footprint* 59.6 54.8 28.5 143 56 % External water footprint* 48.0 44.7 20.7 113 44 % Total water footprint 108 99 49 256 Contribution to the total water footprint 42 % 39 % 19 %
* The internal water footprint at global scale refers to the aggregated internal water footprints of all nations of the world. The external water footprint refers here to the aggregated external water footprints of all nations
The countries with the largest impact on the foreign water resources are China, USA, Mexico, Germany, UK,
France, and Japan (Appendix I). About half of China’s water footprint due to cotton consumption is within
China (the internal water footprint); the other half (the external footprint) presses in other countries, mainly in
India (dominantly green water use) and Pakistan (dominantly blue water use).
26 / Water footprint of cotton consumption a
Per country, the water footprint as a result of domestic cotton consumption can be mapped as has been done for
the USA in Figure 6.1. The arrows show the tele-connections between the area of consumption (the USA) and
the areas of impact (notably India, Pakistan, China, Mexico and Dominican Republic). The total water footprint
of an average US citizen due to the consumption of cotton products is 135 m3/yr – more than three times the
global average – out of which about half is from the use of external water resources. If all world citizens would
consume cotton products at the US rate, other factors remaining equal, the global water use would increase by
five per cent [from 9800 to 10300 Gm3/yr], which is quite substantial given that humanity already uses more
than half of the runoff water that is reasonably accessible (Postel et al., 1996).
For proper understanding of the impact map shown in Figure 6.1, it should be observed here that the map shows
the full internal water footprint of the USA plus the external water footprints in other countries insofar easily
traceable. For instance, USA imports several types of cotton products from the EU, that together contain 430
million m3/yr of virtual water, but these cotton products do not fully originate from the EU25. In fact, the EU25
imports raw cotton, grey fabrics and final products from countries such as India, Uzbekistan and Pakistan, then
partly or fully processes these products into final products and ultimately exports to the USA. Out of the 430
million m3/yr of virtual water exported from the EU25 to the USA, only 16% is actually water appropriated
within the EU25; the other 84% refers to water use in countries from which the EU25 imports (e.g. India,
Uzbekistan, Pakistan). For simplicity, we show in the map only the ‘direct’ external footprints (tracing the origin
of imported products only one step back), and not the ‘indirect’ external footprints. Adding the latter would
mean adding for instance an arrow from India to EU25, which then is forwarded to the USA. Doing so for all
indirect external water footprints would create an incomprehensible map. For the same reason, we have shown
only arrows for the largest virtual water flows towards the USA.
The water footprint as a result of cotton consumption in Japan is mapped in Figure 6.2. For their cotton the
Japanese consumers most importantly rely on the water resources of China, Pakistan, India, Australia and the
USA. Japan does not grow cotton, and also does not have a large cotton processing industry. The Japanese water
footprint due to consumption of cotton products is 4.6 Gm3/yr, of which 95 percent presses in other countries.
The cotton products imported from Pakistan put a large pressure on Pakistan’s scarce blue water resources. In
China and even more so in India, cotton is produced with lower inputs of blue water (in relation to the green
water inputs), so that cotton products from China and India put less stress per unit of cotton product on the
scarce blue water resources than in Pakistan.
Figure 6.3 shows the water footprint due to cotton consumption in the twenty-five countries of the European
Union (EU25). 84% of EU’s cotton-related water footprint lies outside the EU. From the map it can be seen that,
for their cotton supply, the European community most heavily depends on the water resources of India. This puts
stress on the water availability for other purposes in India. In India one third of the cotton harvest area is being
irrigated; particularly cotton imports from these irrigated areas have a large opportunity cost, because the
competition for blue water resources is higher than for the green water resources. If we look at the impacts of
European cotton consumption on blue water resources, the impacts are even higher in Uzbekistan than in India.
Uzbekistan uses 14.6 Gm3/yr of blue water to irrigate cotton fields, out of which it exports 3.0 Gm3/yr in virtual
Water footprint of cotton consumption / 27
form to the EU25. The consumers in the EU25 countries thus indirectly (and mostly unconsciously) contribute
for about 20 per cent to the desiccation of the Aral Sea. In terms of pollution, cotton consumption in the EU25
has largest impacts in India, Uzbekistan, Pakistan, Turkey and China. These impacts are partly due to the use of
fertiliser in the cotton fields and partly to the use of chemicals in the cotton processing industries. Cotton
consumption in the EU25 also causes pollution in the region itself, mainly from the processing of imported raw
cotton or grey fabrics into final products.
The three components of a water footprint – green water use, blue water use and dilution water requirement –
affect water systems in different ways. Use of blue water generally affects the environment more than green
water use. Blue water is lost to the atmosphere where otherwise it would have stayed in the ground or river
system where it was taken from. Green water on the other hand would have been evaporated through another
crop or through natural vegetation if it would not have been used for cotton growth. Therefore there should
generally be more concern with the ‘blue water footprint’ than with the ‘green water footprint’. The part of the
water footprint that refers to dilution water requirements deserves attention as well, since pollution is a choice
and not necessary. Waste flows from cotton industries can be treated so that no dilution water would be required
at all. An alternative to treatment of waste flows is reduction of waste flows. With cleaner production
technology, the use of chemicals in cotton industries can be reduced by 30 per cent, with a reduction of the COD
content in the effluent of 60 percent (Visvanathan et al., 2000).
28 / Water footprint of cotton consumption a
Figure 6.1. The impact of consumption of cotton products by US citizens on the world’s water resources (Mm3/yr). Period: 1997-2001.
Water footprint of cotton consumption / 29
Figure 6.2. The impact of consumption of cotton products by Japanese citizens on the world’s water resources (Mm3/yr). Period: 1997-2001.
Figure 6.3. The impact of consumption of cotton products by the people in EU25 on the world’s water resources (Mm3/yr). Period: 1997-2001.
30 / Water footprint of cotton consumption a
Water footprint of cotton consumption / 31
7. Conclusion
The authors believe that a single indicator of sustainability does not exist, because of the variety of facts, values
and uncertainties that play a role in any debate of sustainable development. The water footprint of a nation
should clearly not be seen as the ultimate indicator of sustainability, but rather as a new indicator that can add to
the sustainability debate. It adds to the ecological footprint and the embodied energy concept by taking water as
a central viewpoint as alternative to land or energy. It adds to earlier indicators of water use by taking the
consumer’s perspective on water use instead of the producer’s perspective.
After the introduction of the ecological footprint concept in the 1990s, several scholars have expressed doubts
whether the concept is useful in science or policy making. At the same time we see that the concept attracts
attention and evokes scientific debate. We expect that the water footprint concept leads to a similar dual
response. On the one hand the water footprint does not do else than gathering and presenting known data in a
new format and as such does not add new knowledge. On the other hand, the water footprint adds a new fruitful
perspective on issues such as water scarcity, water dependency, sustainable water use, and the implications of
global trade for water management.
For water managers, water management is a river basin or catchment issue (see for instance the new South
African National Water Act, 1998, and the new European Water Framework Directive, 2000). The water
footprint, showing the use of water in foreign countries, shows that it is not sufficient to stick to that scale. Water
problems in the major cotton producing areas of the world cannot be solved without addressing the global issue
that consumers are not being held responsible for some of the economic costs and ecological impacts, which
remain in the producing areas. The water footprint shows water use from the consumer’s perspective, while
traditional statistics show water use from the producer’s perspective. This makes it possible to compare the
water demand for North American or European citizens with the water demand for people in Africa, India or
China. In the context of equitability and sustainability, this is a more useful comparison than a comparison
between the actual water use in the USA or Europe with the actual water use in an African or Asian country,
simply because the actual water use tells something about production but not about consumption.
The water footprint shows how dependent many nations are on the water resources in other countries. For its
consumption of cotton products, the EU25 is very much dependent on the water resources in other continents,
particularly water in Asia as this study shows, but also for other products there is a strong dependence on water
resources outside Europe (Chapagain and Hoekstra, 2004). This means that water in Europe is scarcer than
current indicators (showing water abstractions within Europe in relation to the available water resources within
Europe) do suggest.
Cotton consumption is responsible for 2.6 per cent of the global water use. As a global average, 44 per cent of
the water use for cotton growth and processing is not for serving the domestic market but for export. This means
that – roughly spoken – nearly half of the water problems in the world related to cotton growth and processing
32 / Water footprint of cotton consumption a
can be attributed to foreign demand for cotton products. By looking at the trade relations, it is possible to track
down the location of the water footprint of a community or, in other words, to link consumption at one place to
the impacts at another place. The study for instance shows that the consumers in the EU25 countries indirectly
contribute for about 20 per cent to the desiccation of the Aral Sea. Visualizing the actual but hidden link
between cotton consumers and the water impacts of cotton production is a relevant issue in the light of the fact
that the economic and environmental externalities of water use are generally not included in the price of the
cotton products paid by the foreign consumers. Including information about the water footprint in product
information, be it in the form of pricing or product labelling, is thus a crucial aspect in policy aimed at the
reduction of negative externalities as water depletion and pollution. Given the global character of the cotton
market, international cooperation in setting the rules for cotton trade is a precondition.
Since each component of the total water footprint includes a certain economic cost and environmental impact, it
would be useful to see which of the costs and impacts are transferred to the consumer. In this study we have not
done a careful examination of that, but there is quite some evidence that the majority of costs and impacts of
water use and pollution caused in agriculture and industry is not translated into the price of products. According
to the World Bank, the economic cost recovery in developing countries in the water sector is about 25 per cent
(Serageldin, 1995). Social and environmental impacts of water use are generally not translated into the price of
products at all, with sometimes an exception for the costs made for wastewater treatment before disposal. Most
of the global waste flows are not treated however. Although a few industrialised countries achieve a wastewater
treatment coverage of nearly 100 per cent, this coverage remains below five per cent in most developing
countries (Eurostat, 2005; Hoekstra, 1998). Besides, the hundred per cent waste coverage in some of the
industrialised countries refers to treatment of concentrated waste flows from households and industries only, but
excludes the diffuse waste flow in agriculture. Given the general lack of proper water pricing mechanisms or
other ways of transmitting production-information, cotton consumers have little incentive to take responsibility
for the impacts on remote water systems.
About one fifth of the global water footprint due to cotton consumption is related to the pollution. This estimate
is based on the assumption that wastewater flows can be translated into a certain water requirement for dilution
based on water quality standards. Implicitly we have assumed here that the majority of waste flows enters
natural water bodies without prior treatment, which is certainly true for leaching of fertilisers in agriculture and
largely true for waste flows from cotton industries. In some of the rich countries, however, there is often
treatment of waste flows from industries before disposal, so that we have got an overestimate of dilution water
requirements here. In case of treatment of waste flows to the extent that the effluents meet water quality
standards, a better estimate for the water requirement would be to consider the actual water use for the treatment
process. Another issue is that we did not account for natural background concentrations in dilution water, so that
we have got a conservative estimate for the required dilution volume. We also have made a conservative
estimate by looking at the dilution volume required for fertilisers, but not at the volume for diluting pesticides
used.
Water footprint of cotton consumption / 33
References
Allan, J.A. (1997) ‘Virtual water: A long term solution for water short Middle Eastern economies?’ Paper
presented at the 1997 British Association Festival of Science, University of Leeds, 9 September 1997.
Allan, J.A. (1998) ‘Virtual water: A strategic resource, global solutions to regional deficits’, Groundwater 36
(4), 545-546.
Chapagain, A.K. and Hoekstra, A.Y. (2003a) ‘Virtual water flows between nations in relation to trade in
livestock and livestock products’, Value of Water Research Report Series No. 13, UNESCO-IHE, Delft, the
Netherlands.
Chapagain, A.K. and Hoekstra, A.Y. (2003b) ‘The water needed to have the Dutch drink coffee’, Value of
Water Research Report Series No. 14, UNESCO-IHE, Delft, the Netherlands.
Chapagain, A.K. and Hoekstra, A.Y. (2004) ‘Water footprints of nations’, Value of Water Research Report
Series No. 16, UNESCO-IHE, Delft, the Netherlands.
Cotton Australia (2005) ‘How to grow a pair of Jeans’, www.cottonaustralia.com.au.
CCI (2005) ‘Regions of US productions’, Cotton Council International.
CRC (2004) ‘NUTRIpak: A practical guide to cotton nutrition’, Australian Cotton Cooperative Research Centre.
De Man, R. (2001) ‘The global cotton and textile chain: Substance flows, actors and co-operation for
sustainability’, A study in the framework of WWF's Freshwater and Cotton Programme, Reinier de Man
Publications, Leiden, the Netherlands.
EPA (2005) ‘List of drinking water contaminants: Ground water and drinking water’, US Environmental
Protection Agency.
Eurostat (2005), Web page of EU Statistical Office, Luxembourg, http://epp.eurostat.cec.eu.int.
Falkenmark, M. (1995) ‘Land-water linkages: a synopsis’ In: Land and Water Integration and River Basin
Management, FAO, Rome, pp. 15-16.
FAO (1999) ‘Irrigation in Asia in Figures’, Water Reports 18, Food and Agriculture Organization, Rome, Italy.
FAO (2003a) ‘CROPWAT model’, Food and Agriculture Organization, Rome, Italy.
FAO (2003b) ‘FAOCLIM: a CD-ROM with world-wide agroclimatic data’, Food and Agriculture Organization,
Rome, Italy.
FAO (2003c) ‘CLIMWAT database’, Food and Agriculture Organization, Rome, Italy.
FAO (2003d) ‘Technical Conversion Factors for Agricultural Commodities’, Food and Agriculture
Organization, Rome, Italy.
34 / Water footprint of cotton consumption a
FAO (2005) ‘Review of global agricultural water use per country’, crop water requirements, Food and
Agriculture Organization, Rome, Italy.
FAOSTAT (2004) Web page of Food and Agriculture Organization, Rome, Italy, http://faostat.fao.org.
Gillham, F.E.M., Bell, T.M., Arin, T., Matthews, T.A., Rumeur, C.L. and Hearn A.B. (1995) ‘Cotton production
prospects for the next decade’, World Bank Technical Paper Number 287, the World Bank, Washington D.C.
Glantz, M. H. (1998) 'Creeping environmental problems in the Aral Sea basin. In: I. Kobori and M. H. Glantz
(eds.) Central Eurasian water crisis: Caspian, Aral and dead seas, United Nations University Press, New York.
Hall, M., Dixon, J., Gulliver, A. and Gibbon, D., (eds.) (2001) ‘Farming systems and poverty: Improving
farmer's livelihoods in a changing world’, FAO and World Bank, Rome and Washington.
Herendeen, R.A. (2004) ‘Energy analysis and EMERGY analysis - A comparison’, Ecol. Model., 178, 227-237.
Hoekstra, A.Y. (1998) ‘Perspectives on water: A model-based exploration of the future’, International Books,
Utrecht, the Netherlands.
Hoekstra, A.Y. and Hung, P.Q. (2002) ‘Virtual water trade: A quantification of virtual water flows between
nations in relation to international crop trade’, Value of Water Research Report Series No. 11, UNESCO-IHE,
Delft, the Netherlands
Hoekstra, A.Y. and Hung, P.Q. (2005) ‘Globalisation of water resources: international virtual water flows in
relation to crop trade’, Global Environ. Chang. 15(1), 45-56.
IFA, IFDC, IPI, PPI and FAO (2002) ‘Fertilizer use by crop’, Food and Agriculture Organization, Rome, Italy.
ITC (2004) ‘PC-TAS version 1997-2001 in HS or SITC’, CD-ROM, International Trade Centre, Geneva.
Loh, J. and Wackernagel, M. (2004) ‘Living planet report 2004’, WWF, Gland, Switzerland.
Pereira, L. S., Cordery, I. and Iacovides, I. (2002) ‘Coping with water scarcity’, International Hydrological
Programme, UNESCO, Paris.
Postel, S. (1992) ‘Last oasis: Facing water scarcity’, W.W Norton & Company, New York.
Postel, S.L., Daily, G.C., and Ehrlich, P.R. (1996) ‘Human appropriation of renewable fresh water’, Science
271, 785-788.
Proto, M., Supino, S., and Malandrino, O. (2000) ‘Cotton: a flow cycle to exploit’, Ind. Crop. Prod. 11(2-3),
173-178.
Rees, W.E. (1992) ‘Ecological footprints and appropriated carrying capacity: what urban economics leaves out’,
Environ. Urban. 4(2), 121-130.
Water footprint of cotton consumption / 35
Ren, X. (2000) ‘Development of environmental performance indicators for textile process and product’, Journal
of Cleaner Production, 8(6), 473-481.
Serageldin, I. (1995) ‘Water resources management: a new policy for a sustainable future’, Wat. Int. 20(1), 15-
21.
Seuring, S. (2004) ‘Integrated chain management and supply chain management: Comparative analysis and
illustrative cases’, Journal of Cleaner Production 12: 1059-1071.
Silvertooth, J.C, Navarro, J.C., Norton, E.R. Galadima, A. (2001) ‘Soil and plant recovery of labeled fertilizer
nitrogen in irrigated cotton’, Arizona Cotton Report, University of Arizona.
Soth, J., Grasser, C., and Salerno, R. (1999) ‘The impact of cotton on fresh water resources and ecosystems: A
preliminary analysis’, WWF, Gland, Switzerland.
UNCTAD (2005a) ‘Planting and harvesting times for cotton, by producing country’,
http://r0.unctad.org/infocomm/anglais/cotton/crop.htm.
UNCTAD, 2005b. Cotton uses, http://r0.unctad.org/infocomm/anglais/cotton/uses.htm
UNEP (2002) ‘Global environment outlook 3: Past, present and future perspectives’, Earthscan Publications,
London.
UNEP IE (1996) ‘Cleaner production in textile wet processing: a workbook for trainers’, United Nations
Environment Programme: Industry and Environment, Paris.
USDA (2004) ‘Cotton: World markets and trade’, http://www.fas.usda.gov/cotton/circular/2004/07/CottonWMT.pdf
USDA/NOAA (2005a) ‘Major world crop areas and climatic profiles’, USDA/NOAA Joint Agricultural
Weather Facility, http://www.usda.gov/agency/oce/waob/mississippi/MajorWorldCropAreas.pdf.
USDA/NOAA (2005b) ‘Cotton - World supply and demand summary’, USDA/NOAA Joint Agricultural
Weather Facility, http://www.tradefutures.cc/education/cotton/worldsd.htm.
USEPA (1996) ‘Best management practices for pollution prevention in the textile industry’, www.e-textile.org.
Van den Bergh, J.C.J.M. and Verbruggen, H. (1999) ‘Spatial sustainability, trade and indicators: An evaluation
of the 'ecological footprint'’, Ecol. Econ. 29, 61-72.
Van Kooten, G.C. and Bulte, E.H. (2000) ‘The ecological footprint: useful science or politics’, Ecol. Econ. 32,
385-389.
Visvanathan, C., Kumar, S. and Han, S. (2000) ‘Cleaner production in textile sector: Asian scenario’, Paper
presented at the ‘National Workshop on Sustainable Industrial Development through Cleaner Production’, 12-13
November, Colombo, Sri Lanka.
36 / Water footprint of cotton consumption a
Wackernagel, M. and Rees, W. (1996) ‘Our ecological footprint: Reducing human impact on the earth’, New
Society Publishers, Gabriola Island, B.C., Canada.
Wackernagel, M., Onisto, L., Linares, A.C., Falfan, I.S.L., Garcia, J.M., Guerrero, I.S., and Guerrero, M.G.S.
(1997) ‘Ecological footprints of nations: How much nature do they use? - How much nature do they have?’
Centre for Sustainability Studies, Universidad Anahuac de Xalapa, Mexico.
Wackernagel, M., Onisto, L., Bello, P., Linares, A.C., Falfan, I.S.L., Garcia, J.M., Guerrero, A.I.S., and
Guerrero, M.G.S. (1999) ‘National natural capital accounting with the ecological footprint concept’, Ecol. Econ.
29, 375-390.
WB (1999) ‘Pollution prevention and abatement handbook 1998: Toward cleaner production’, World Bank,
Washington D.C.
WWF (2003) ‘Thirsty crops: Our food and clothes: Eating up nature and wearing out the environment?’ Living
waters: conserving the source of life, WWF, The Netherlands.
Water footprint of cotton consumption / 37
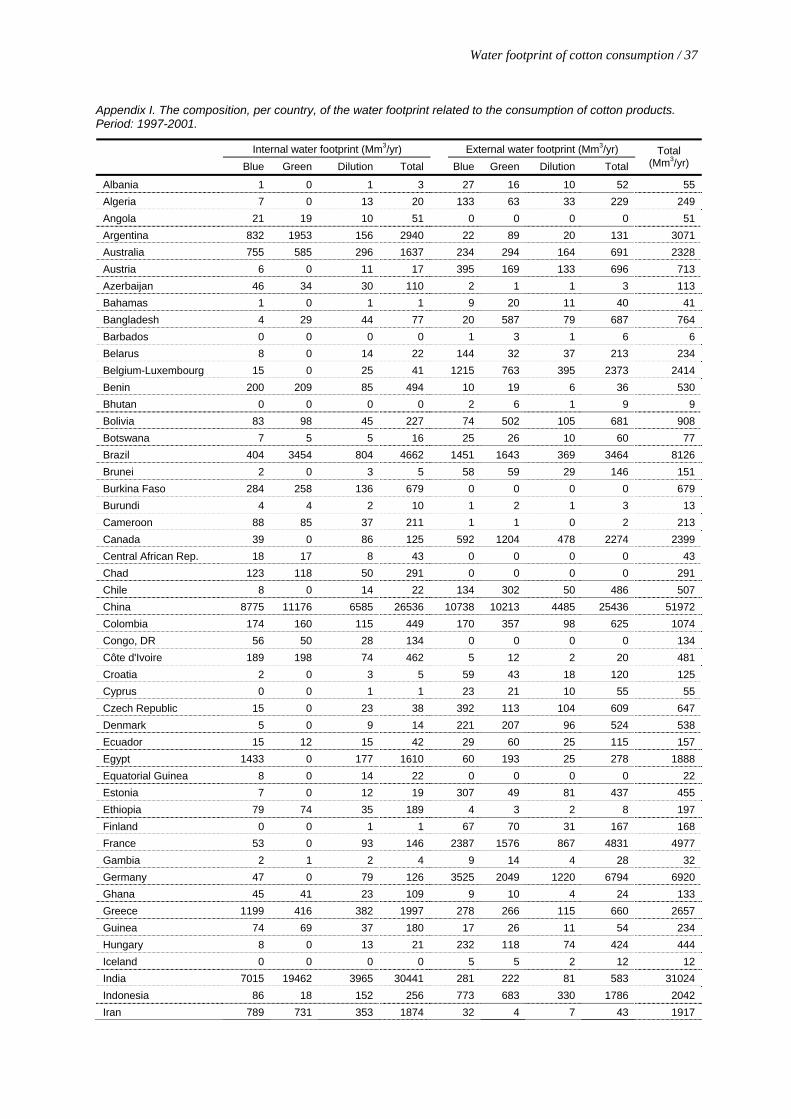
Appendix I. The composition, per country, of the water footprint related to the consumption of cotton products. Period: 1997-2001.
Internal water footprint (Mm3/yr) External water footprint (Mm3/yr)
Blue Green Dilution Total Blue Green Dilution Total Total
(Mm3/yr)
Albania 1 0 1 3 27 16 10 52 55 Algeria 7 0 13 20 133 63 33 229 249 Angola 21 19 10 51 0 0 0 0 51 Argentina 832 1953 156 2940 22 89 20 131 3071 Australia 755 585 296 1637 234 294 164 691 2328 Austria 6 0 11 17 395 169 133 696 713 Azerbaijan 46 34 30 110 2 1 1 3 113 Bahamas 1 0 1 1 9 20 11 40 41 Bangladesh 4 29 44 77 20 587 79 687 764 Barbados 0 0 0 0 1 3 1 6 6 Belarus 8 0 14 22 144 32 37 213 234 Belgium-Luxembourg 15 0 25 41 1215 763 395 2373 2414 Benin 200 209 85 494 10 19 6 36 530 Bhutan 0 0 0 0 2 6 1 9 9 Bolivia 83 98 45 227 74 502 105 681 908 Botswana 7 5 5 16 25 26 10 60 77 Brazil 404 3454 804 4662 1451 1643 369 3464 8126 Brunei 2 0 3 5 58 59 29 146 151 Burkina Faso 284 258 136 679 0 0 0 0 679 Burundi 4 4 2 10 1 2 1 3 13 Cameroon 88 85 37 211 1 1 0 2 213 Canada 39 0 86 125 592 1204 478 2274 2399 Central African Rep. 18 17 8 43 0 0 0 0 43 Chad 123 118 50 291 0 0 0 0 291 Chile 8 0 14 22 134 302 50 486 507 China 8775 11176 6585 26536 10738 10213 4485 25436 51972 Colombia 174 160 115 449 170 357 98 625 1074 Congo, DR 56 50 28 134 0 0 0 0 134 Côte d'Ivoire 189 198 74 462 5 12 2 20 481 Croatia 2 0 3 5 59 43 18 120 125 Cyprus 0 0 1 1 23 21 10 55 55 Czech Republic 15 0 23 38 392 113 104 609 647 Denmark 5 0 9 14 221 207 96 524 538 Ecuador 15 12 15 42 29 60 25 115 157 Egypt 1433 0 177 1610 60 193 25 278 1888 Equatorial Guinea 8 0 14 22 0 0 0 0 22 Estonia 7 0 12 19 307 49 81 437 455 Ethiopia 79 74 35 189 4 3 2 8 197 Finland 0 0 1 1 67 70 31 167 168 France 53 0 93 146 2387 1576 867 4831 4977 Gambia 2 1 2 4 9 14 4 28 32 Germany 47 0 79 126 3525 2049 1220 6794 6920 Ghana 45 41 23 109 9 10 4 24 133 Greece 1199 416 382 1997 278 266 115 660 2657 Guinea 74 69 37 180 17 26 11 54 234 Hungary 8 0 13 21 232 118 74 424 444 Iceland 0 0 0 0 5 5 2 12 12 India 7015 19462 3965 30441 281 222 81 583 31024 Indonesia 86 18 152 256 773 683 330 1786 2042 Iran 789 731 353 1874 32 4 7 43 1917
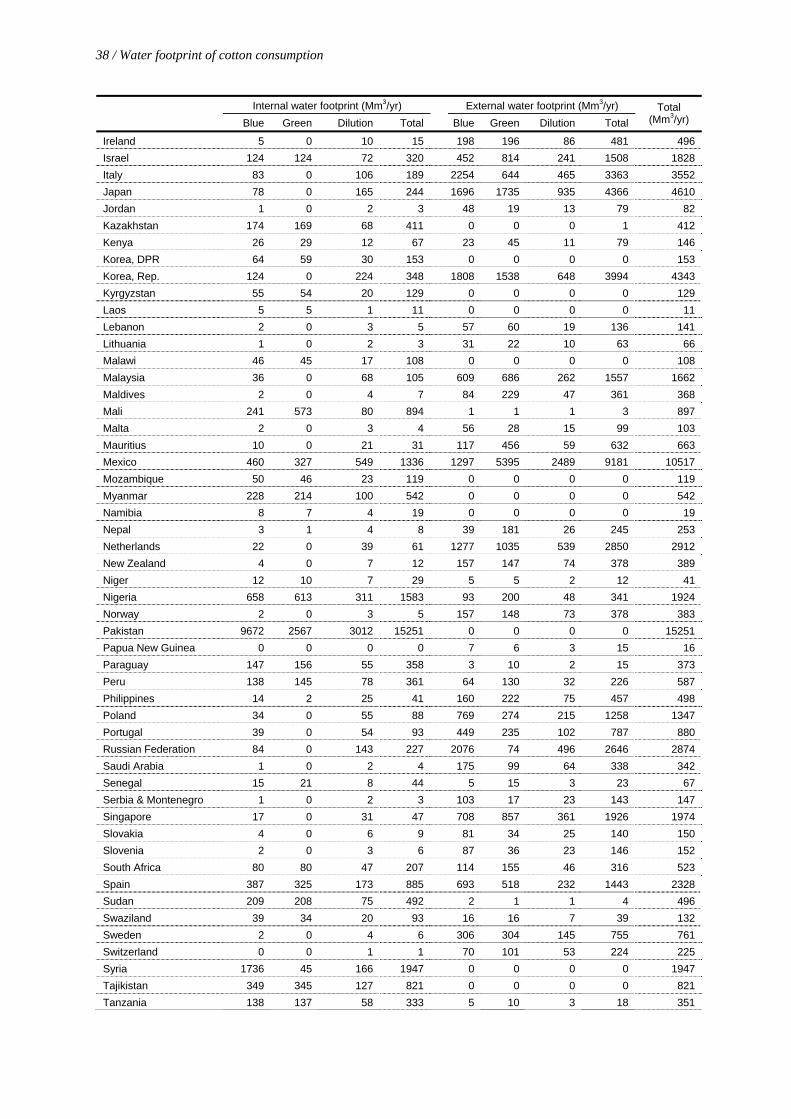
38 / Water footprint of cotton consumption a
Internal water footprint (Mm3/yr) External water footprint (Mm3/yr)
Blue Green Dilution Total Blue Green Dilution Total Total
(Mm3/yr)
Ireland 5 0 10 15 198 196 86 481 496 Israel 124 124 72 320 452 814 241 1508 1828 Italy 83 0 106 189 2254 644 465 3363 3552 Japan 78 0 165 244 1696 1735 935 4366 4610 Jordan 1 0 2 3 48 19 13 79 82 Kazakhstan 174 169 68 411 0 0 0 1 412 Kenya 26 29 12 67 23 45 11 79 146 Korea, DPR 64 59 30 153 0 0 0 0 153 Korea, Rep. 124 0 224 348 1808 1538 648 3994 4343 Kyrgyzstan 55 54 20 129 0 0 0 0 129 Laos 5 5 1 11 0 0 0 0 11 Lebanon 2 0 3 5 57 60 19 136 141 Lithuania 1 0 2 3 31 22 10 63 66 Malawi 46 45 17 108 0 0 0 0 108 Malaysia 36 0 68 105 609 686 262 1557 1662 Maldives 2 0 4 7 84 229 47 361 368 Mali 241 573 80 894 1 1 1 3 897 Malta 2 0 3 4 56 28 15 99 103 Mauritius 10 0 21 31 117 456 59 632 663 Mexico 460 327 549 1336 1297 5395 2489 9181 10517 Mozambique 50 46 23 119 0 0 0 0 119 Myanmar 228 214 100 542 0 0 0 0 542 Namibia 8 7 4 19 0 0 0 0 19 Nepal 3 1 4 8 39 181 26 245 253 Netherlands 22 0 39 61 1277 1035 539 2850 2912 New Zealand 4 0 7 12 157 147 74 378 389 Niger 12 10 7 29 5 5 2 12 41 Nigeria 658 613 311 1583 93 200 48 341 1924 Norway 2 0 3 5 157 148 73 378 383 Pakistan 9672 2567 3012 15251 0 0 0 0 15251 Papua New Guinea 0 0 0 0 7 6 3 15 16 Paraguay 147 156 55 358 3 10 2 15 373 Peru 138 145 78 361 64 130 32 226 587 Philippines 14 2 25 41 160 222 75 457 498 Poland 34 0 55 88 769 274 215 1258 1347 Portugal 39 0 54 93 449 235 102 787 880 Russian Federation 84 0 143 227 2076 74 496 2646 2874 Saudi Arabia 1 0 2 4 175 99 64 338 342 Senegal 15 21 8 44 5 15 3 23 67 Serbia & Montenegro 1 0 2 3 103 17 23 143 147 Singapore 17 0 31 47 708 857 361 1926 1974 Slovakia 4 0 6 9 81 34 25 140 150 Slovenia 2 0 3 6 87 36 23 146 152 South Africa 80 80 47 207 114 155 46 316 523 Spain 387 325 173 885 693 518 232 1443 2328 Sudan 209 208 75 492 2 1 1 4 496 Swaziland 39 34 20 93 16 16 7 39 132 Sweden 2 0 4 6 306 304 145 755 761 Switzerland 0 0 1 1 70 101 53 224 225 Syria 1736 45 166 1947 0 0 0 0 1947 Tajikistan 349 345 127 821 0 0 0 0 821 Tanzania 138 137 58 333 5 10 3 18 351
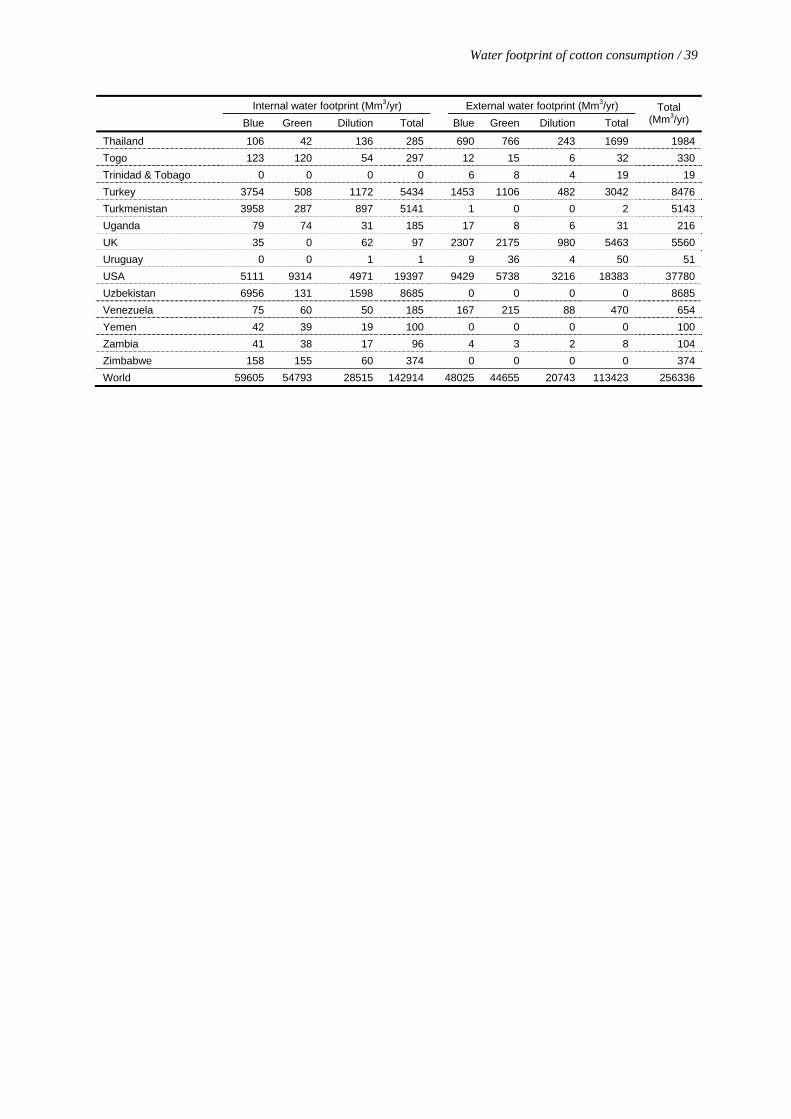
Water footprint of cotton consumption / 39
Internal water footprint (Mm3/yr) External water footprint (Mm3/yr)
Blue Green Dilution Total Blue Green Dilution Total Total
(Mm3/yr)
Thailand 106 42 136 285 690 766 243 1699 1984 Togo 123 120 54 297 12 15 6 32 330 Trinidad & Tobago 0 0 0 0 6 8 4 19 19 Turkey 3754 508 1172 5434 1453 1106 482 3042 8476 Turkmenistan 3958 287 897 5141 1 0 0 2 5143 Uganda 79 74 31 185 17 8 6 31 216 UK 35 0 62 97 2307 2175 980 5463 5560 Uruguay 0 0 1 1 9 36 4 50 51 USA 5111 9314 4971 19397 9429 5738 3216 18383 37780 Uzbekistan 6956 131 1598 8685 0 0 0 0 8685 Venezuela 75 60 50 185 167 215 88 470 654 Yemen 42 39 19 100 0 0 0 0 100 Zambia 41 38 17 96 4 3 2 8 104 Zimbabwe 158 155 60 374 0 0 0 0 374 World 59605 54793 28515 142914 48025 44655 20743 113423 256336


Institute for Governance Studies
University of Twente
UNESCO-IHEP.O. Box 30152601 DA DelftThe Netherlands
Website www.unesco-ihe.orgPhone +31 15 2151715