Embed Size (px)
Citation preview

Presentation at OECD conference on measurability and policy relevance of happiness, April 2-3, Rome (concept 10-3-2007) MEASURES OF GROSS NATIONAL HAPPINESS Ruut Veenhoven Erasmus University Rotterdam, The Netherlands E-mail: [email protected] ABSTRACT Happiness is rising on the political agenda and this calls for measures of how well nations perform in creating great happiness for a great number, analogous to measures of success in creating wealth, such as GDP.
Happiness is defined as subjective enjoyment of one’s life as-a-whole and this can be measured using self-reports. Question on happiness are currently used in large scale surveys of the general population in nations. As a result we have now comparable data on happiness in 95 contemporary nations and time-series of 25 years and longer on 11 developed nations. These data can be aggregated in different ways: If the aim is simply greater happiness for a greater number of citizens, Average happiness (AH) is an appropriate measure. If the focus is on enduring happiness, it is better to combine average happiness with longevity in an index of Happy Life Years (HLY). If the aim is to reduce disparity among citizens a relevant indicator is the Inequality of Happiness (IH) in the nations as measured with the standard deviation. Average and dispersion can also be combined in an index of Inequality-Adjusted Happiness (IAH). Comparison across nations shows sizable differences on all these measures of gross national happiness and these differences correspond with societal characteristics that can be influenced by policy makers, such as freedom and justice. Comparison over time shows major improvement during the last decade. Key words: rule-utilitarianism, policy indicators, happiness, happy life years, inequality of happiness, cross-national, trend
Ruut Veenhoven Gross National Happiness 1

1 INTRODUCTION
Attempts to improve the human lot begin typically with treating compelling miseries, such as hunger and epidemics. When these problems are solved, attention shifts to broader and more positive goals. For that reason there is now rising interest in ‘happiness’. This brings a classic philosophy back on the scene.
Greatest happiness principle Two centuries ago Jeremy Bentham (1789) proposed a new moral principle. He wrote that the goodness of an action should not be judged by the decency of its intentions, but by its consequences on human happiness. He argued that we should aim at the ‘greatest happiness for the greatest number’. Bentham defined happiness in terms of subjective feeling, as ‘the sum of pleasures and pains’. This philosophy is known as ‘Utilitarianism’, because of its emphasis on the utility of behavioral consequences. ‘Happyism’ would have been a better name, since this utility is seen as contribution to happiness.
When applied at the level of individual choice, this theory runs into some difficulties. One problem is that it is often difficult to foresee what the balance of effects on happiness will be. Another problem is that the theory deems well-intended behavior to be a-moral if it happens to pan out adversely. Imagine the case of a loving mother who saves the life of her sick child, a child that grows up to be a criminal; mothers can seldom foresee a child’s future and can hardly be reproached for their unconditional motherly love. The theory is better suited for judging general rules, such as the rule that mothers should care for their sick children. It is fairly evident that adherence to this rule will add to the happiness of a great number. Following such rules is then morally correct, even if consequences might be negative in a particular case. This variant is known as ‘Rule-Utilitarianism’. Application in public policy Rule-Utilitarianism can be used as a moral guide for legislation and has played a role in discussions about property laws and the death penalty. The principle can also be applied to wider issues in public policy; such as the question of what degree of income-inequality we should accept. This variant of the greatest happiness principle has not been very prominent in public policy as yet, at least not explicit. Currently the principle is gaining ground, especially in the UK (Donovan et. al. 2003, Layard 2005).
Happiness can be furthered at two levels; at the level of individuals and at the level of collectivities. At the individual level, happiness can be enhanced by information, training and guidance of individual citizens. This approach is particularly useful in modern nations, where the collective conditions are typically so good that most of the variance in happiness is due to individual differences. At the level of collectivities, happiness can be increased by improving the livability of institutional settings such as schools, work organizations and old age homes. Greater happiness can also be created by improving the livability of society at large, such as by providing a decent standard of living and a climate of trust. Elsewhere I have discussed these options in more detail (Veenhoven 2007)
Ruut Veenhoven Gross National Happiness 2
Need for measurement Attempts to create greater happiness for a greater number require measurement of happiness. Measurement is necessary for assessing whether happiness can be realistically raised, for selecting means for furthering happiness and finally for assessing effectiveness.
The measures of happiness used differ somewhat with the level of intervention. At the individual level we need sensitive measures of happiness of persons, but at the collective level we rather need global aggregates. Plan of this paper In this paper I focus on measures of happiness at the societal level, that is, measures of happiness in nations. These measures inform policy makers about the happiness of the great number. The measures of happiness serve to assess how well the country is doing in creating greater happiness and allow comparison across nations and trough time. As such they are comparable to economic indicators, such as GNP per head that indicate how well the country performs in creating wealth. By analogy I call this measures of ‘Gross National’ happiness1.
As a first step I distinguish happiness from other qualities of life and define the concept (section 2). Next I consider how happiness can be measured and conclude that this can be done using direct questions in survey studies (section 3). I then present four applications of survey data on happiness in nations (section 4). Next I review the findings yielded with these measures, first findings on the degree of happiness in nations (section 5), second findings on trends in happiness over time (section 6) and third findings on the relation with societal characteristics (section 7).
Ruut Veenhoven Gross National Happiness 3

2 WHAT IS ‘HAPPINESS’?
The word 'happiness' is used in various ways. In the widest sense it is an umbrella term
for all that is good. In this meaning it is often used interchangeably with terms like 'wellbeing' or 'quality of life'. Below I will delineate four qualities of life and show that the concept of happiness fits only one of these.
2.1 Four qualities of life Quality-of-life concepts can be sorted using two distinctions, which together provide a fourfold matrix. That classification is discussed in more detail in Veenhoven (2000a). The first distinction is between chances and outcomes, that is, the difference between opportunities for a good life and the good life itself. A second difference is between outer and inner qualities of life, in other words between 'external' and 'internal' features. In the first case the quality is in the environment, in the latter it is in the individual. Lane (1994) made this distinction clear by distinguishing 'quality of society' from 'quality of persons'. The combination of these two dichotomies yields a fourfold matrix. This classification is presented in scheme 1. Scheme 1 Four qualities of life
Outer qualities
Inner qualities
Life chances
Livability of environment
Life-ability of the person
Life results
Utility of life
Satisfaction with life
Livability of the environment The left top quadrant denotes the meaning of good living conditions, shortly called ‘livability’. Ecologists see livability in the natural environment and describe it in terms of pollution, global warming and degradation of nature. Currently, they associate livability typically with preservation of the environment. City planners see livability in the built
Ruut Veenhoven Gross National Happiness 4

environment and associate it with such things as sewer systems, traffic jams and ghetto formation. Here the good life is seen as a fruit of human intervention. In the sociological view, society is central. Livability is associated with the quality of society as a whole and also with the position one has in society. Livability is not what is called happiness here. It is rather a precondition for happiness and not all environmental conditions are equally conducive to happiness. Life-ability of the person The right top quadrant denotes inner life-chances. That is: how well we are equipped to cope with the problems of life. Sen (1992) calls this quality of life variant 'capability'. I prefer the simple term 'life-ability', which contrasts elegantly with 'livability'. The most common depiction of this quality of life is absence of functional defects. This is 'health' in the limited sense, sometimes referred to as 'negative health'. Next to absence of disease, one can consider excellence of function. This is referred to as 'positive health' and associated with energy and resilience. A further step is to evaluate capability in a developmental perspective and to include acquisition of new skills for living. This is commonly denoted by the term 'self-actualization'. From this point of view a middle-aged man is not 'well' if he behaves like an adolescent, even if he functions without problems at this level. Since abilities do not develop along side idleness, this quality of life is close to the 'activity' in Aristotle's concept of eudemonia. Lastly, the term 'art of living' denotes special life-abilities; in most contexts this quality is distinguished from mental health and sometimes even attributed to slightly disturbed persons. Art of living is associated with refined tastes, an ability to enjoy life and an original style of life. Ability to deal with the problems of life will mostly contribute to happiness as defined here, but is not identical. If one is competent in living one has a good chance at happiness, but this endowment does not guarantee an enjoyable outcome. Utility of life The left bottom quadrant represents the notion that a good life must be good for something more than itself. This assumes some higher values. There is no current generic for these external outcomes of life. Gerson (1976: 795) refers to these effects as 'transcendental' conceptions of quality of life. Another appellation is 'meaning of life', which then denotes 'true' significance instead of mere subjective sense of meaning. I prefer the simpler 'utility of life', while admitting that this label may also give rise to misunderstanding. When evaluating the external effects of a life, one can consider its functionality for the environment. In this context, doctors stress how essential a patient's life is to its intimates. At a higher level, quality of life is seen in contributions to society. Historians see quality in the addition an individual can make to human culture, and rate for example the lives of great inventors higher than those of anonymous peasants. Moralists see quality in the preservation of the moral order, and would deem the life of a saint to be better than that of a sinner. As an individual's life can have many environmental effects, the number of such utilities is almost infinite. Apart from its functional utility, life is also judged on its moral or esthetic value. For instance, most of us would attribute more quality to the life of Florence Nightingale than to that of a drunk, even if it appeared in the end that her good works had a negative
Ruut Veenhoven Gross National Happiness 5

result in the end. In moral philosophy this is called 'virtuous living', and is often presented as the essence of 'true’ happiness. Core meaning: Subjective enjoyment of life Finally, the bottom right quadrant represents the inner outcomes of life. That is the quality in the eye of the beholder. As we deal with conscious humans, this quality boils down to subjective enjoyment of life. This is commonly referred to by terms such as 'subjective wellbeing', 'life-satisfaction' and 'happiness' in a limited sense of the word. This is the kind of happiness the utilitarian philosophers had in mind and it is also the kind of happiness addressed here.
2.2 Four kinds of satisfaction
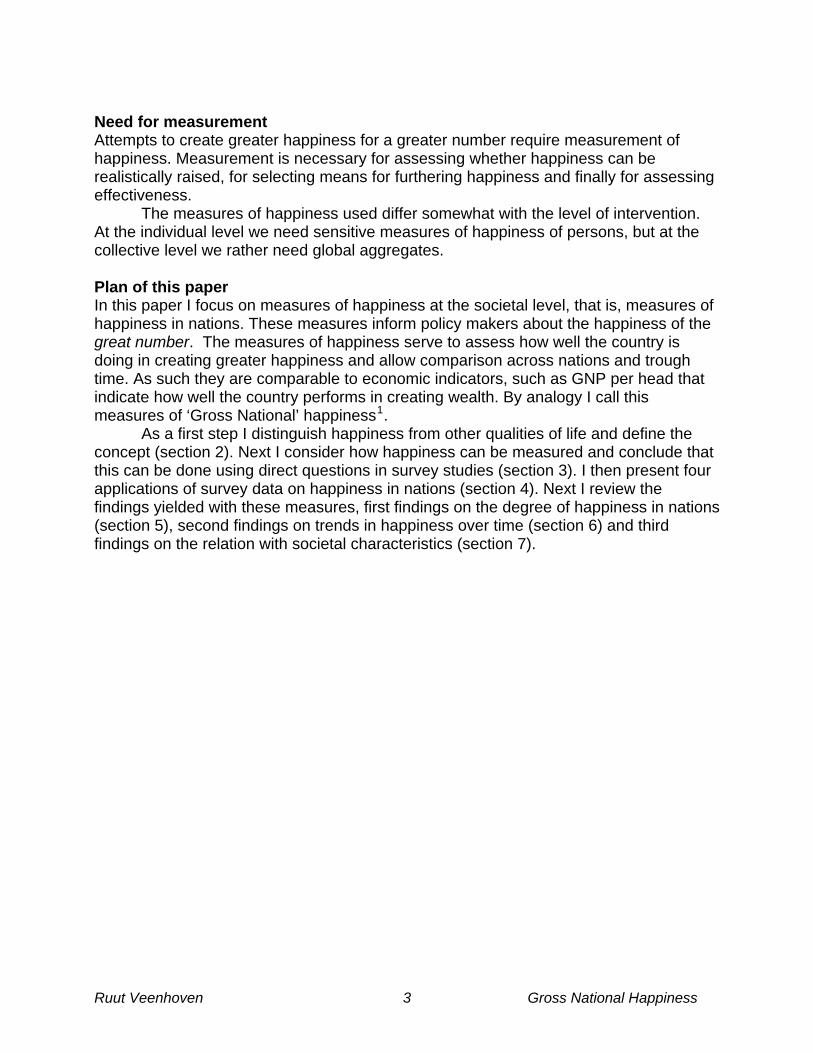
Even when we focus on subjective satisfaction with life, there are still different meanings associated with the word happiness. These meanings can also be charted in a fourfold matrix. In this case, that classification is based on the following dichotomies: Life-aspects versus life-as-a-whole and passing delight versus enduring satisfaction. Appraisals of life can concern aspects, such as marriage or work-life, and one's life-as-a-whole. The word 'happiness' is used in both contexts. Obviously, such appraisals are linked. Enjoyment of aspects of life will typically contribute to the satisfaction with life as a whole (so-called bottom-up effect), and enjoyment of one's life-as-a-whole appears to foster the satisfaction with life-aspects (top-down). Still, these are not identical matters. One can have a happy marriage but still be dissatisfied with life-as-a-whole, or be satisfied with life-as-a-whole in spite of an unhappy marriage. Next, the experience of enjoyment can be short-lived or enduring. Again, the word happiness is used for both phenomena. Sometimes it refers to passing moods and on other occasions to stable satisfaction. Once more, these matters are related but not the same. When combined, these distinctions produce the fourfold matrix presented in scheme 2. The distinction between part and whole is presented vertically, and the distinction between passing and enduring enjoyment horizontally.
Ruut Veenhoven Gross National Happiness 6
Scheme 2 Four kinds of satisfaction
Passing
Enduring
Part of life
Pleasure
Domain satisfaction
Life as a whole
Top experience
Life satisfaction (Happiness)
Instant satisfaction The top-left quadrant represents passing enjoyments of life-aspects. Examples would be delight in a cup of tea at breakfast, the satisfaction of a chore done or the enjoyment of a piece of art. I refer to this category as 'instant-satisfactions'. Kahneman (2000:4) calls it 'instant-utilities'. This quadrant represents hedonistic happiness, especially when the focus is on sensory experience. The concept of happiness used here is broader however. It concerns both overall satisfaction and life-as-a-whole. Though fleeting enjoyment obviously contributes to a positive appreciation of life it is not the whole of it. Domain satisfaction The top right quadrant denotes enduring appreciation of life-aspects, such as marriage satisfaction and job-satisfaction. This is currently referred to as domain-satisfactions. Though domain-satisfactions depend typically on a continuous flow of instant-satisfactions, they have some continuity of their own. For instance, one can remain satisfied with one's marriage even if one has not enjoyed the company of the spouse for quite some time. Domain-satisfactions are often denoted with the term happiness: a happy marriage, happy with one's job, etc. Yet in this chapter the term happiness is used in the broader sense of satisfaction with life-as-a-whole. One would not call a person happy who is satisfied with marriage and job, but still dissatisfied on the whole because his health is failing. It is even possible that someone is satisfied with all the domains one can think of, but nevertheless feels depressed. Top-experience The bottom right quadrant denotes the combination of passing experience and appraisal of life-as-a-whole. That combination occurs typically in top-experiences, which involve short-lived but quite intense feelings and the perception of wholeness. This is the kind of
Ruut Veenhoven Gross National Happiness 7

happiness poet's write about. Again this is not the kind of happiness aimed at here. A moment of bliss is not enduring appreciation of life. In fact such top-experiences even seem detrimental to lasting satisfaction, possibly because of their disorientating effects (Diener et. al. 1989). Core meaning: lasting satisfaction with one's life-as-a-whole Lastly, the bottom-right quadrant represents the combination of enduring satisfaction with life-as-a-whole. This is what I mean with the word happiness. A synonym is 'life-satisfaction'. This is the meaning the utilitarian philosophers had in mind when talking about happiness. When speaking about the 'sum' of pleasures and pains they denoted a balance over time and thus a durable matter.
2.3 Definition of happiness Overall happiness is the degree to which an individual judges the overall quality of his/her own life-as-a-whole favorably. In other words: how much one likes the life one leads. The key terms in this definition may be elucidated as follows. Degree: The word 'happiness' is not used to denote an optimal appreciation of life. It refers to a degree, like the concepts of 'length' or 'weight' it denotes more or less of something. When we say a person is happy, we mean that he or she judges his of her life favorably rather than unfavorably. Individual; The term happiness is used to describe the state of an individual person only; it does not apply to collectivities. Thus, a nation cannot be said to be happy. At best, most of its citizens consider themselves happy. Judges; The word 'happiness' is used where somebody has made an overall judgment about the quality of his or her life. This implies an intellectual activity. Making an overall judgment implies assessing past experiences and estimating future experiences and estimating average quality of life. One consequence of this conceptualization is that the word 'happiness' cannot be used for those who did not make up their mind. One cannot say whether a person is happy or not, if that person is intellectually unable to construct an overall judgment... Overall: The word 'happiness' refers to a judgment, which integrates all the appreciation criteria used. Thus, the idea that one has all one has ever desired does not necessarily make a person happy. Despite all material endowments such a person may feel pain or be depressed. Similarly, the appraisal that one's life is 'exciting' does not necessarily mark oneself as happy either; life may be too exciting to be enjoyable. A Chinese curse says: "May you have interesting times". Life-as-a-whole: We do not use the word 'happiness' to characterize satisfaction with specific aspects of life, such as marriage or work. 'Happiness' refers to satisfaction with life in total.
Ruut Veenhoven Gross National Happiness 8
Own life; The term 'happiness' concerns the evaluation of one's own life, not of life in general. A pessimistic 'Weltanschauung' does not necessarily characterize someone as 'unhappy'. Favorably: Evaluation always embodies appreciation; a conclusion as to whether one likes something or not. The term 'happiness' refers only to judgments concerning this aspect. Happiness judgments concern the dimension extending from appreciation to depreciation, from like to dislike. All humans are capable of appraisals of this kind, though not all humans can generalize all appraisals into a judgment of life-as-a-whole.
2.4 Components of happiness
Humans are capable of evaluating their life in different ways. We have in common with all higher animals that we can appraise our situation affectively. We feel good or bad about particular things and our mood level signals overall adaptation. As in animals these affective appraisals are automatic, but unlike other animals it is known that humans can reflect on this experience. We have an idea of how we have felt over the last year, while a cat does not. Humans can also judge life cognitively by comparing life as it is with notions of how it should be. Most human evaluations are based on both sources of information, that is: intuitive affective appraisal and cognitively guided evaluation. The mix depends mainly on the object. Tangible things such as our income are typically evaluated by comparison; intangible matters such as sexual atractiveness are evaluated by how it feels. In evaluating our life as a whole we can therefore use two sources of information: our affects and our thoughts. We can decide that we feel fine most of the time and we can also judge that life seems to meet our (conscious) demands. These appraisals do not necessarily coincide. We may feel fine generally, but nevertheless be aware that we failed to realize our aspirations. Or we may have surpassed our aspirations, but nevertheless feel miserable. Using the word 'happiness' in both these cases would result in three different kinds of happiness, the overall judgment as described above and these two specific appraisals. Therefore the components are referred to as 'hedonic level of affect' and 'contentment'. To mark the difference with the encompassing judgment I will refer to happiness (the core concept) as overall happiness. Hedonic level of affect Hedonic level of affect is the degree to which various affects that someone experiences are pleasant in character and this reflects typically in ‘mood’. A person's average hedonic level of affect can be assessed over different periods of time: an hour, a week, a year, as well as over a lifetime. The focus here is on 'characteristic' hedonic level. That is so to say: the average over a long time-span such as a month or a year. The concept does not presume subjective awareness of that average level.
Ruut Veenhoven Gross National Happiness 9
Contentment Contentment is the degree to which an individual perceives his/her aspirations are met. The concept presupposes that the individual has developed some conscious wants and has formed an idea about their realization. The factual correctness of this idea is not at stake. The concept concerns the individual's subjective perception. Preponderance of affect It is commonly assumed that the cognitive component dominates the overall judgment of life, e.g. by Easterlin (1984) and Layard (2005). Yet there are strong indications that overall happiness draws on hedonic level of affect in the first place (Veenhoven 2006e).
2.5 Synonyms The above defined concept of ‘overall happiness’ is denoted with different words. In the 1950s the words adjustment and morale were sometimes used in this meaning and since the 1960s the term life-satisfaction came into use for this purpose. In 1984 Ed Diener introduced the term subjective well-being, abbreviated as SWB, and this term is still dominant in psychology.
The term life-satisfaction is mostly used for ‘overall happiness’, but refers in some cases particularly to its cognitive component and is than synonymous with ‘contentment’. In such context, the term happiness is typically used for the affective appraisal of life and then synonymous with ‘hedonic level of affect’.
The term subjective well-being is also used in wider meanings than happiness as defined here. Sometimes the term refers to good mental functioning and then denotes the meaning of life-ability in the top right quadrant of scheme 1. At other occasions the term is used as a generic for all subjective enjoyment and then covers all the quadrants of scheme 2.
Ruut Veenhoven Gross National Happiness 10
3 CAN HAPPINESS BE MEASURED? Measurement has long been understood as `objective' and `external' assessment, analogous to the measurement of blood-pressure by a doctor. By now we know that happiness cannot be measured that way. Steady physiological correlates have not been discovered, and probably never will be. Nor have any overt behaviors been found to be consistently linked to inner enjoyment of life. Like most attitudinal phenomena, happiness is only partially reflected in behavior. Suicidal behavior is an example, though most suicidal persons are unhappy, only a minority of the unhappy behaves suicidal. By definition, happiness is something we have on our mind and consequently we can measure happiness using questions. That is, simply asking people how much they enjoy their life-as-a-whole. Questions on happiness can be posed in various contexts; clinical interviews, life-review questionnaires and survey interviews. The questions can be posed in different ways; directly or indirectly, and by means of single or multiple items.
3.1 Common questions Some common survey questions are presented in Scheme 3. Scheme 3 Some currently used questions about happiness Single questions
• Taking all together, how happy would you say you are: very happy, quite happy, not very happy, not at all happy? (standard item in the World Value Studies)
• How satisfied are you with the life you lead? Very satisfied, fairly satisfied, not very satisfied, not
at all satisfied? (standard item in Euro-barometer surveys)
• Here is a picture of a ladder. Suppose the top of the ladder represents the best possible life for
you and the bottom of the ladder the worst possible life. Where on the ladder do you feel you personally stand at the present time? (0-10 ladder like rating scale) (Cantril's (1965) present life ladder rating)
Multiple questions (summed)
• Same question asked twice: at the beginning and at the end of interview How do you feel about your life-as-a-whole? Delighted, pleased, mostly satisfying, mixed, mostly dissatisfying, unhappy, terrible? (Andrews & Withey's Life 3)
• Five questions, rated on a 1-7 scale ranging from strongly agree to strongly disagree. (Diener's 1985 Satisfaction With Life Scale SWLS2) - In most ways my life is close to ideal. - The conditions of my life are excellent.
Ruut Veenhoven Gross National Happiness 11

- I am satisfied with my life. - So far I have gotten the important things I want in life. - If I could live my life over, I would change almost nothing
3.2 Validity doubts Critics have suggested that responses to questions on happiness actually measure other phenomena. Rather than indicating how much the respondent enjoys life, answers would reflect his normative notions and desires. No notion One of the misgivings is that most people have no opinion at all about their happiness. They would be more aware of how happy they are supposed to be, and report that instead. Though this may happen incidentally, it does not appear to be the rule. Most people know quite well whether or not they enjoy life. Eight out of ten Americans think of it every week. Responses on questions about happiness tend to be prompt. Non-response on these items is low; both absolutely (± 1%) and relatively to other attitudinal questions. `Don't know' responses are infrequent as well. A related assertion is that respondents mix up how happy they actually are, with how happy other people think they are, given their situation. If so, people considered to be well off would typically report to be very happy, and people regarded as disadvantaged should characterize themselves as unhappy. That pattern is observed sometimes, but it is not general. For instance, in The Netherlands good education is seen as a pre-requisite for a good life, but the highly educated appear slightly less happy in comparison to their less educated counterparts. Colored answers Another objection concerns the presence of systematic bias in responses. It is assumed that questions on happiness are interpreted correctly, but that responses are often false. People who are actually dissatisfied with their life would tend to answer that they are quite happy. Both ego-defense and social-desirability would cause such distortions. This bias is seen to manifest itself in over-report of happiness; most people claim to be happy, and most perceive themselves as happier than average. Another indication of bias is seen in the finding that psycho-somatic complaints are not uncommon among the happy. However, these findings allow other interpretations as well. Firstly, the fact that more people say to be happy than unhappy does not imply over-report of happiness. It is quite possible that most people are truly happy (some reasons will be discussed below). Secondly, there are also good reasons why most people think that they are happier than average. One such reason is that most people are like critical scientists and think that unhappiness is the rule. Thirdly, the occurrence of head-aches and worries among the happy does not prove response distortion. Life can be a sore trial some times, but still be satisfying on a balance. The proof of the pudding is in demonstrating the response distortion itself. Some clinical studies have tried to do so by comparing responses to single direct questions with ratings based on depth interviews and projective tests. The results are generally not different from responses to single direct questions posed by an anonymous interviewer.
Ruut Veenhoven Gross National Happiness 12
3.3 Reliability doubts
Though single questions on happiness seem to measure what they are supposed to measure, they measure it rather imprecisely. When the same question is asked twice in an interview, responses are not always identical. Correlations are about +.70. Over a period of a week, test-retest reliability drops to circa +.60. Though responses seldom change from `happy' to `unhappy', switches from `very' to `fairly' are rather common. The difference between response-options is often ambiguous. The respondent's notion about his/her happiness tends to be global. Thus the choice for one answer-category or the next is sometimes haphazard. Because choice is often arbitrary, subtle differences in interrogation can exert considerable effect. Variations in place where the interview is held, characteristics of the interviewer, sequence of questions and precise wording of the key-item can tip the scale to one response or the other. Such effects can occur in different phases of the response process; in the consideration of the answer as well as in the communication of it. Bias in appraisal Though most people have an idea of how much they enjoy life, responding to questions on this matter involves more than just bringing up an earlier judgment from memory. For the most part, memory only indicates a range of happiness. Typically, the matter is re-assessed in an instant judgment. This re-appraisal may be limited to recent change (are there any reasons to be more or less happy than I used to be?), but it can also involve quick re-evaluation of life (what are my blessings and frustrations?). In making such instant judgments, people use various heuristics. These mental simplifications are attended with specific errors. For instance the `availability' heuristic involves orientation on pieces of information that happen to be readily available. If the interviewer is in a wheelchair, the benefit of good health is salient. Respondents in good health will then rate their happiness somewhat higher and the correlation of happiness-ratings with health variables will be more pronounced. Several of these heuristic effects have been demonstrated by Schwarz and Strack (1991). Bias in response Once a respondent has formed a private judgment, the next step is to communicate it. At this stage reports can be biased in various ways as well. One source of bias is inherent to semantics; respondents interpret words differently and some interpretations may be emphasized by earlier questions. For example, questions on happiness are more likely to be interpreted as referring to `contentment' when preceded by questions on success in work, rather than items on mood. Another source of response-bias is found in considerations of self-presentation and social-desirability. Self-rating of happiness tends to be slightly higher in personal interviews than on anonymous questionnaires. However, direct contact with an interviewer does not always inflate happiness reports. If the interviewer is in a wheel-chair, modest self-presentation is encouraged. Much of these biases are random, and balance out in large samples. So in large samples, random error does not affect the accuracy of happiness averages. Yet it does affect correlations, random error 'attenuates' correlations. Random error can be estimated by means of multiple-trait-multiple-method (MTMM) studies, and correlations
Ruut Veenhoven Gross National Happiness 13

can be corrected (disattenuated) on that basis. A first application on satisfaction measures is reported by Saris et. al. (1996). Some biases may be systematic; especially bias produced by technique of interrogation and sequence of questions. Bias of that kind does affect the reliability of distributional data. In principle it does not affect correlations, unless the measure of the correlate is biased in the same way (correlated error). To some extend, systematic error can also be estimated and corrected. See also Saris et al.
3.4 Comparability across nations Average happiness differs markedly across nations. In scheme 5 we will see that Russians score currently 4.1 on a 0-10 scale, while in Sweden the average is 7.9. Does that mean that Russians really take less pleasure in life? Several claims to the contrary have been advanced. Elsewhere I have checked these doubts (Ouweneel & Veenhoven, 1991, Veenhoven 1993b). The results of that inquiry are summarized below. The first objection is that differences in language hinder comparison. Words like `happiness' and `satisfaction' would not have the same connotations in different tongues. Questions using such terms would therefore measure slightly different matters. I checked that hypothesis by comparing the rank orders produced by three kinds of questions on life-satisfaction: a question about `happiness', a question about `satisfaction with life' and a question that invites to a rating between `best- and worst possible life'. The rank orders appeared to be almost identical. I also compared responses on questions on happiness and satisfaction in two bi-lingual countries, and found no evidence for linguistic bias either. A second objection is that responses are differentially distorted by desirability-bias. In countries where happiness ranks high in value, people would be more inclined to overstate their enjoyment of life. I inspected that claim by checking whether reported happiness is indeed higher in countries where hedonic values are most endorsed. This appeared not to be the case. As a second check, I inspected whether reports of general happiness deviate more from feelings in the past few weeks in these countries; the former measure being more vulnerable for desirability distortion than the latter. This appeared not to be the case either. A third claim is that response-styles distort the answers dissimilarly in different countries. For instance, collectivistic orientation would discourage `very' happy responses, because modest self-presentation is more appropriate within that cultural context. I tested this hypothesis by comparing happiness in countries differing in value-collectivism, but found no effect in the predicted direction. The hypothesis failed several other tests as well. A related claim is that happiness is a typical western concept. Unfamiliarity with it in non-western nations would lead to lower scores. If so, we can expect more `don't know' and `no answer' responses in non-western nations. However, that appeared not to be the case.
Ruut Veenhoven Gross National Happiness 14
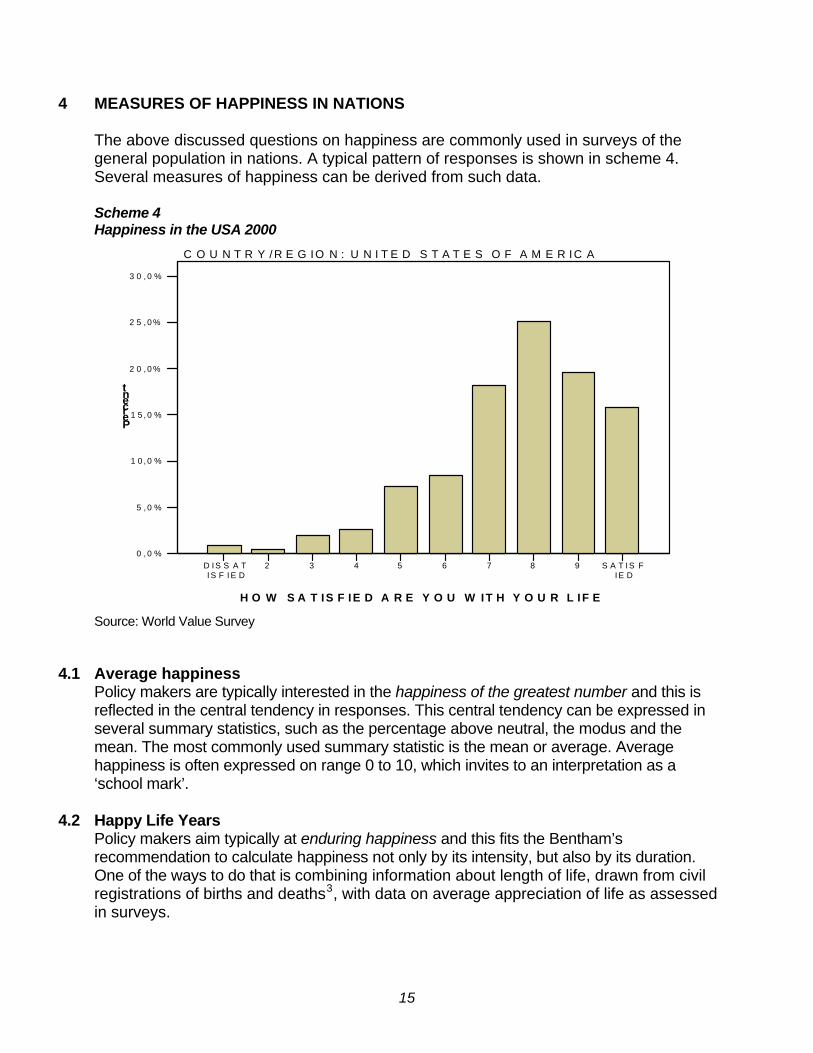
4 MEASURES OF HAPPINESS IN NATIONS The above discussed questions on happiness are commonly used in surveys of the general population in nations. A typical pattern of responses is shown in scheme 4. Several measures of happiness can be derived from such data. Scheme 4 Happiness in the USA 2000
Source: World Value Survey
D I S S A TI S F I E D
2 3 4 5 6 7 8 9 S A T I S FI E D
H O W S A T IS F IE D A R E Y O U W IT H Y O U R L IF E
0 , 0 %
5 , 0 %
1 0 , 0 %
1 5 , 0 %
2 0 , 0 %
2 5 , 0 %
3 0 , 0 %
Percent
C O U N T R Y /R E G IO N : U N I T E D S T A T E S O F A M E R IC A
4.1 Average happiness Policy makers are typically interested in the happiness of the greatest number and this is reflected in the central tendency in responses. This central tendency can be expressed in several summary statistics, such as the percentage above neutral, the modus and the mean. The most commonly used summary statistic is the mean or average. Average happiness is often expressed on range 0 to 10, which invites to an interpretation as a ‘school mark’.
4.2 Happy Life Years Policy makers aim typically at enduring happiness and this fits the Bentham’s recommendation to calculate happiness not only by its intensity, but also by its duration. One of the ways to do that is combining information about length of life, drawn from civil registrations of births and deaths3, with data on average appreciation of life as assessed in surveys.
Ruut Veenhoven Gross National Happiness 15

Computation The following simple formula can be applied:
Happy-Life-Years = Life-expectancy at birth x 0-1 happiness Suppose that life expectancy in a country is 60 years, and that the average score on a 0 to 10-step happiness scale is 5. Converted to a 0-1 scale, the happiness score is than 0,5. The product of 60 and 0,5 is 30. So the number of happy life years is 30 in that country. If life expectancy is also 60 years but average happiness 8, the number of happy life years is 48 (60 x 0,8).
Advantages
This combination of happiness and longevity has the additional advantage that it provides a more complete view on how well people thrive in a country. In simple animals, good adaptation reflects only in survival, in higher animals, good adaptation also reflects in hedonic experience. Negative affect is indicative of poor adaptation and tends to inhibit the organism, while positive affect is indicative of good adaptation and works as a 'go' signal. So, an animal that does not feel good is probably not doing well. This inner experience is no great issue in biology, because we cannot assess how animals feel. Humans are capable of reflecting on their experiences, and can condense positive and negative affects into an overall appraisal of happiness. They are also capable of communicating that appraisal to investigators. Hence in the case of humans we can use the additional sign of good adaptation and assess how long and happy they live. A related advantage of this combination is that it fits common sense: we prefer a long and happy life above a short but happy life or a long but unhappy life. A further advantage is that this measure links up with another more established goal in public policy and is comparable to the DALY4 index.
For these reasons HLY scored highest in a scholarly review of indicators of quality of life in nations (Hagerty et. al. 2001).
4.3 Inequality of happiness High average happiness can go together with considerable inequality in happiness, a majority being very happy at the cost of an unhappy minority. Most policy makers will deem that undesirable, since social equality is still high on the political agenda. Hence there is also demand for information about disparity of happiness in nations, comparable to data about inequalities in income and health.
In this case the focus is not on the central tendency in the distribution of responses on questions about happiness as presented in scheme 3, but on the disparity in the distribution. This can again be expressed in several summary statistics, such as the standard-deviation, the inter-quartile range and the Gini-coefficient. Comparative analysis showed that inequality in happiness can best be quantified using the standard deviation and the Gini-coefficient is not appropriate for this kind of data (Kalmijn & Veenhoven 2005).
4.4 Inequality Adjusted Happiness (IAH) Policy makers will typically aim at both a high level of happiness and a low degree of inequality of happiness. For that reason they need an indicator that marries the utilitarian
Ruut Veenhoven Gross National Happiness 16

wish for greater happiness with the egalitarian call for fairness. One such indicator is the index of ‘Inequality-Adjusted Happiness’ that gives equal weight to both aims (Veenhoven & Kalmijn 2005).
Ruut Veenhoven Gross National Happiness 17
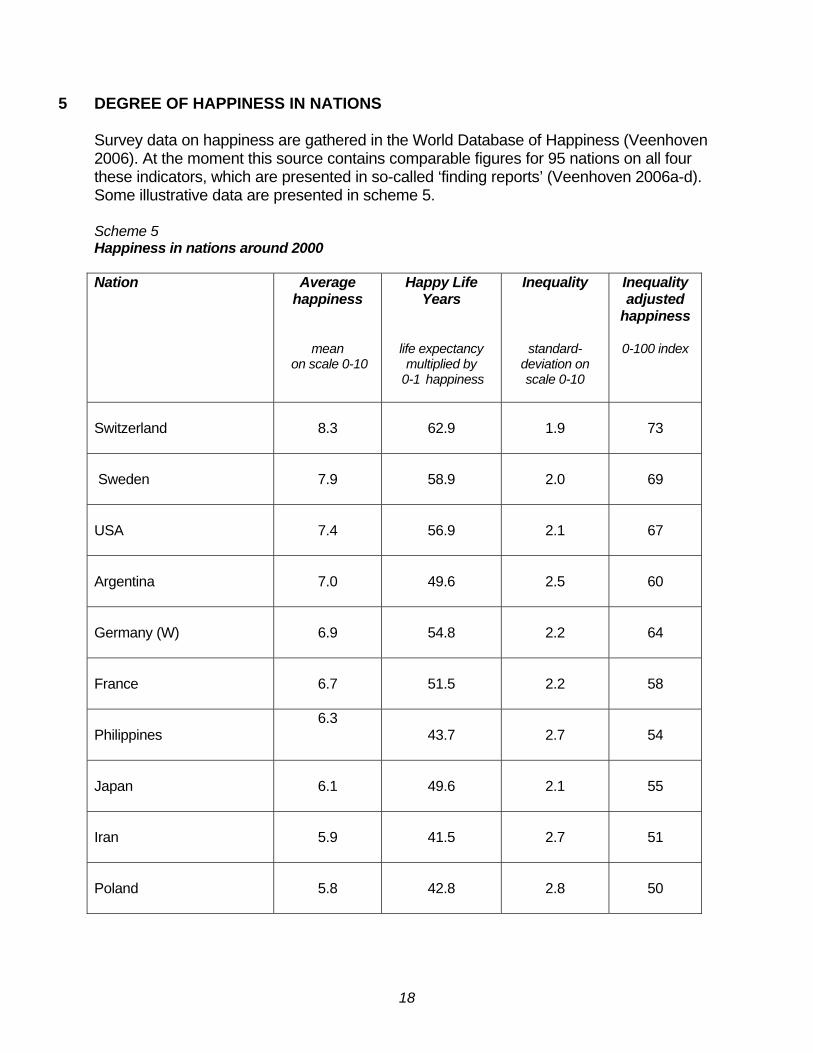
5 DEGREE OF HAPPINESS IN NATIONS Survey data on happiness are gathered in the World Database of Happiness (Veenhoven 2006). At the moment this source contains comparable figures for 95 nations on all four these indicators, which are presented in so-called ‘finding reports’ (Veenhoven 2006a-d). Some illustrative data are presented in scheme 5. Scheme 5 Happiness in nations around 2000 Nation Average
happiness
mean on scale 0-10
Happy Life Years
life expectancy multiplied by
0-1 happiness
Inequality
standard-deviation on scale 0-10
Inequality adjusted
happiness
0-100 index
Switzerland
8.3
62.9
1.9
73
Sweden
7.9
58.9
2.0
69
USA
7.4
56.9
2.1
67
Argentina
7.0
49.6
2.5
60
Germany (W)
6.9
54.8
2.2
64
France
6.7
51.5
2.2
58
Philippines
6.3 43.7
2.7
54
Japan
6.1
49.6
2.1
55
Iran
5.9
41.5
2.7
51
Poland
5.8
42.8
2.8
50
Ruut Veenhoven Gross National Happiness 18
India
4.6
42.8
2.8
48
Russia
4.1
35.7
2.7
35
Zimbabwe
3.3
12.5
3.1
23
Source: World Database of Happiness, Happiness in Nations
5.1 Average Happiness (AH) Scheme 5 presents average happiness in nations on range 0 to 10. The highest score is observed in Switzerland (8,3) and the lowest in Zimbabwe (3,3), so the actual variation on this range is 5 points. Average happiness tends is above neutral in most countries, which means that great happiness for a great number is apparently possible. Still, there are also nations where the average is below 5. One of these is Russia and this score is typical of most former soviet states, probably as a result of the social transformations in this era. Average happiness is also low in several African countries, but not in all. Possibly, average happiness is also below neutral in some of the countries not investigated, in particular in war stricken countries such as Iraq.
5.2 Happy Life Years (HLY) Theoretically, this indicator has a broad variation, HLY is zero if nobody can live in the country, and will be endless if society is ideal and its inhabitants immortal. The practical range is currently 50 years, the highest number of Happy Life Years is observed in Switzerland (62,9) and the lowest in Zimbabwe (12,5). The rank-order of HLY is quite similar to the rank order in average happiness, the rank-order correlation being +. 94. The correlation is not perfect however, in some countries people live long, but are not too happy (e.g. Japan), while in other countries life is short but fairly satisfying (e.g. Nigeria). The rank-order correlation between life-expectancy and average happiness is +.55.
5.3 Inequality of Happiness (IH) The lowest degree of inequality is observed in the Netherlands (SD = 1,5) and the highest in Zimbabwe (3.1). Again the rank-order is similar to the rank-order of average happiness, rs = -. 65
5.4 Inequality Adjusted Happiness (IAH) The variation on this 0 to 100 index is between 73 (Switzerland) and 23 (Zimbabwe). The rank-order of nations is again similar with average happiness, r = +.95
Ruut Veenhoven Gross National Happiness 19

6 TREND OF HAPPINESS IN NATIONS For only 11 of the 95 nations in the World Database of happiness do we have comparable data on 25 years or longer. These nations are: the USA since 1945, Japan since 1958 and for the first nine member states of the European Union since 1973. These data are available in the data file ‘TrendsInNations’ that is part of the World Database of happiness.
6.1 Gradual rise of average happiness in most nations
Trend data on average happiness are plotted in scheme 6, which shows that happiness has risen somewhat in the US and the EU5, but stagnated in Japan.
The observed rise in the US is contrary to current opinion, which holds that Americans have become richer, but no happier. This so-called ‘Easterlin paradox’ pervades the economic discourse on happiness but does not fit the latest data (Veenhoven & Hagerty 2006). This paper presents also indications for rising happiness in several developing nations.
Scheme 6 Trend average happiness in the EU8, Japan and USA
2005200019951990198519801975197019651960195519501945
10
9
8
7
6
5
4
3
2
1
0
USA
EU8
Japan
Actu
al ra
nge
in w
orld
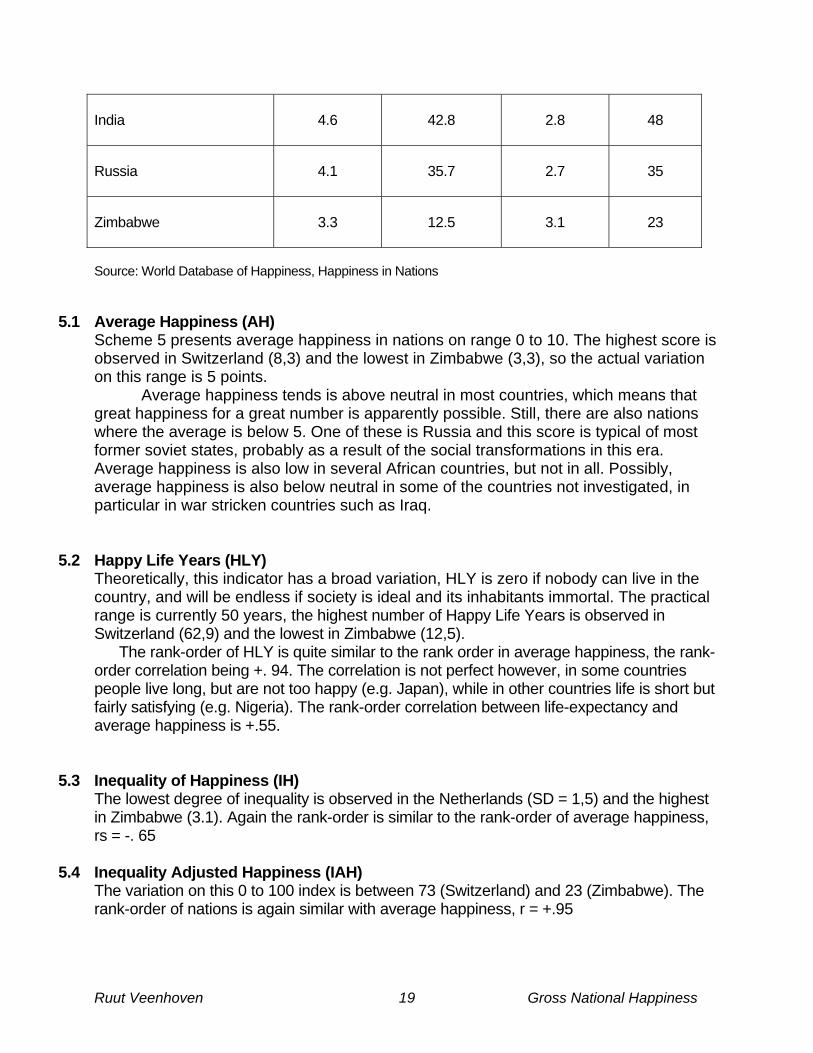
6.2 Spectacular rise of Happy Life Years Life expectancy has also gone up in the last decade, so it is no surprise that the number of Happy Life Years has also increased, as we can see in scheme 7. Still it is surprising to see that the gains are so big, 5,? years in the EU and 4,2 in the USA. More detail on this rise in apparent quality of life is presented elsewhere (Veenhoven 2005a). This growth of Happy Life Years is unprecedented in human history and marks considerable social progress!
Ruut Veenhoven Gross National Happiness 20
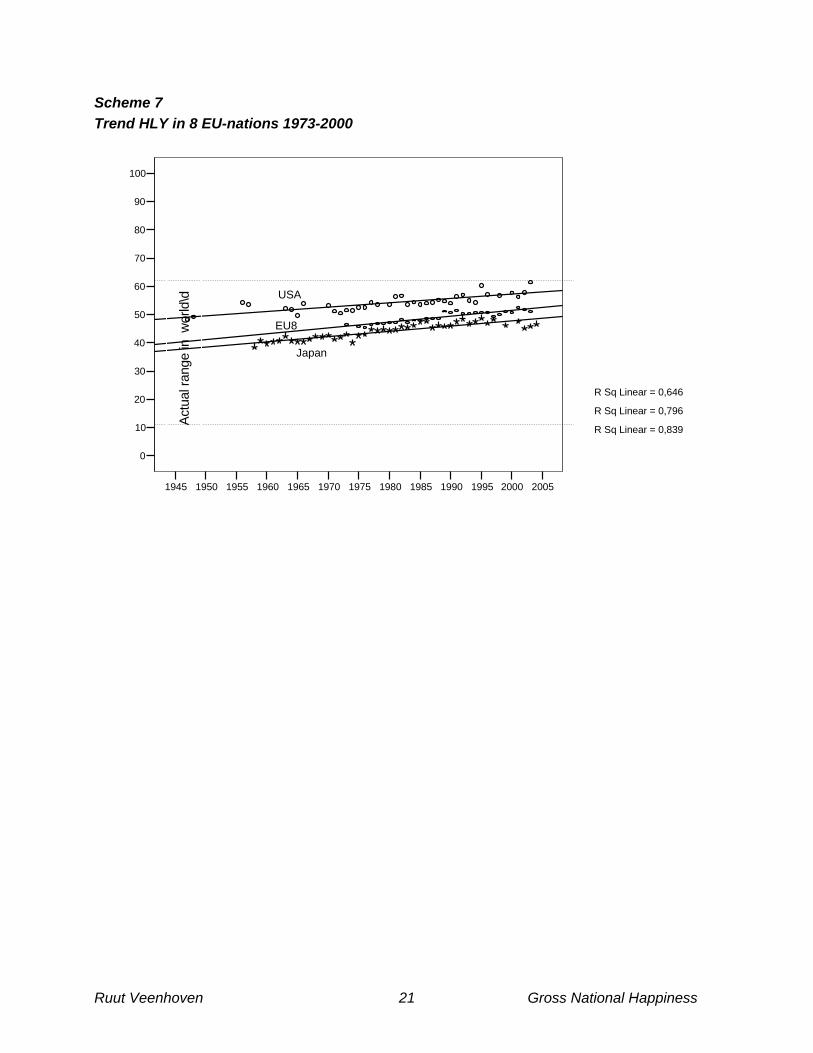
Scheme 7 Trend HLY in 8 EU-nations 1973-2000
2005200019951990198519801975197019651960195519501945
100
90
80
70
60
50
40
30
20
10
0
R Sq Linear = 0,839
R Sq Linear = 0,796
R Sq Linear = 0,646
USA
EU8
Japan
Actu
al ra
nge
in w
orld
\d
Ruut Veenhoven Gross National Happiness 21

6.3 Lessening inequality of happiness in nations There is much concern about ‘new inequalities’ emerging in modern nations. Yet data on dispersion of happiness shown a consistent pattern of diminishing inequality, as presented in scheme 8. This finding is discussed in more detail elsewhere (Veenhoven 2005b)
Scheme 8 Trend in dispersion of life satisfaction in the European Union
20052000199519901985198019751970196519601955
5,04,84,64,44,24,03,83,63,43,23,02,82,62,42,22,01,81,61,41,21,00,80,60,40,20,0
EU8Japan
USA
Act
ual r
ange
in th
e w
orld
6.4 Rising Inequality Adjusted Happiness
Since average happiness has gone up and inequality of happiness has gone down, it is no surprise that the IAH index has gone up. In the USA this rise was 3.5 points on the 0-100 IAH scale and in the EU8 4,3 points
Ruut Veenhoven Gross National Happiness 22
7 DETERMINANTSS OF HAPPINESS IN NATIONS So far the data show that happiness is a realistic goal for public policy. Happiness of a great number is apparently possible, since most people rate their happiness above neutral in most nations. Greater happiness is also possible in most countries of the world. What is possible in countries like Switzerland should also be possible elsewhere.
7.1 Societal correlates of happiness
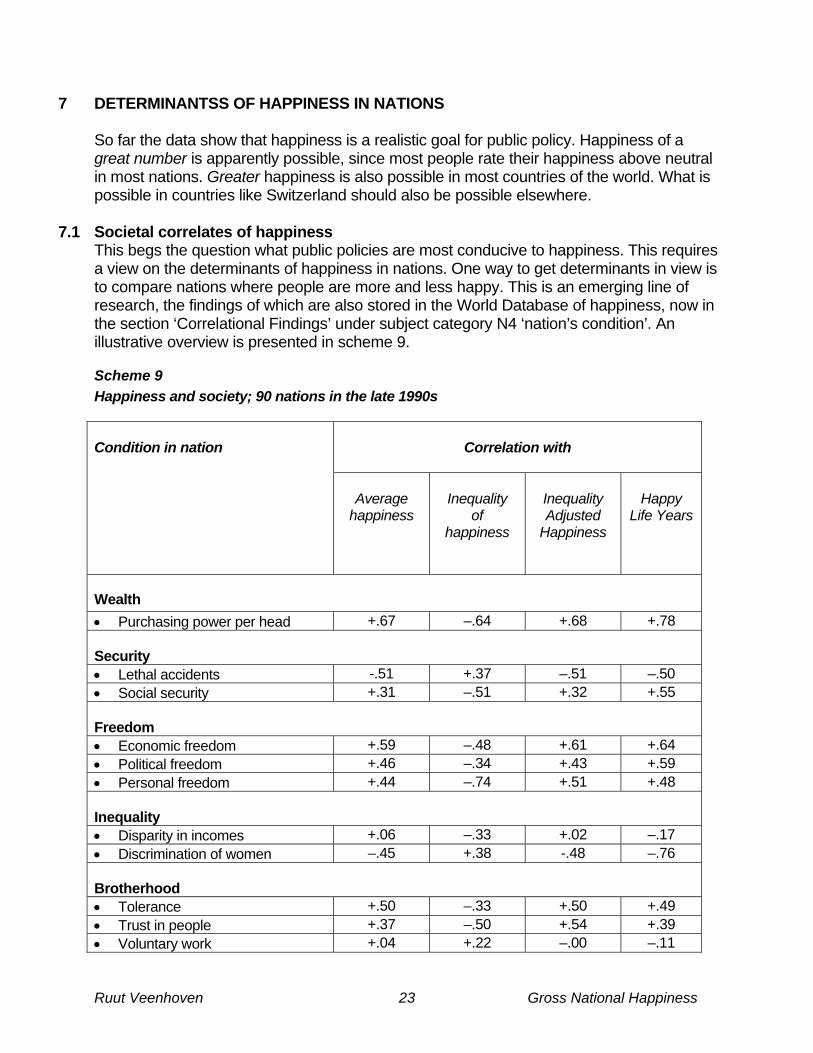
This begs the question what public policies are most conducive to happiness. This requires a view on the determinants of happiness in nations. One way to get determinants in view is to compare nations where people are more and less happy. This is an emerging line of research, the findings of which are also stored in the World Database of happiness, now in the section ‘Correlational Findings’ under subject category N4 ‘nation’s condition’. An illustrative overview is presented in scheme 9.
Scheme 9 Happiness and society; 90 nations in the late 1990s
Correlation with
Condition in nation
Average
happiness
Inequality
of happiness
Inequality Adjusted
Happiness
Happy
Life Years
Wealth • Purchasing power per head +.67 –.64 +.68 +.78 Security • Lethal accidents -.51 +.37 –.51 –.50 • Social security +.31 –.51 +.32 +.55 Freedom • Economic freedom +.59 –.48 +.61 +.64 • Political freedom +.46 –.34 +.43 +.59 • Personal freedom +.44 –.74 +.51 +.48 Inequality • Disparity in incomes +.06 –.33 +.02 –.17 • Discrimination of women –.45 +.38 -.48 –.76 Brotherhood • Tolerance +.50 –.33 +.50 +.49 • Trust in people +.37 –.50 +.54 +.39 • Voluntary work +.04 +.22 –.00 –.11
Ruut Veenhoven Gross National Happiness 23

Justice • Rule of law +.53 –.57 +.56 +.68 • Respect of civil rights +.56 –.44 +.54 +.61 • Corruption –.60 +.65 –.63 –.74 Explained variance: Adjusted R2
83%
71%
85%
87%
Data: World Database of Happiness, States of Nations. Indicators described in appendix. Material affluence Above in scheme 5 we see that average happiness is typically higher in the economically most prosperous nations; the richer the country, the happier its inhabitants. The derived indicators of happiness produce similar relations, positive correlations with HLY and IAH and a negative correlation with Inequality of Happiness. The relationships are curvi-linear; among poor nations the relationship is more pronounced than among affluent countries. When the $20,000 point is passed, the regression line is almost flat, which suggest that the law of diminishing returns applies. A similar pattern has been observed at the individual level: correlations between personal happiness and personal income are strong in poor countries and weak in rich nations. The effect of economic affluence can partly be explained by its effect on prevalence of absolute poverty. Yet, the data show this is not the whole story. Apparently, material welfare provides more gratifications than mere subsistence. Security Happiness is also higher in the nations that provide most safety. In Scheme 9, we see strong relationships with incidence of lethal accidents, which is indicative of wider physical safety. The pattern of correlations is again similar across all four indicators of happiness. This relationship appears to be largely independent of economic affluence. The relationship with state provided social security is less pronounced, and disappears when economic affluence is controlled (Veenhoven 2000b). Freedom People are also happier in the nations that allow most autonomy. In Scheme 9 we see strong relationships with indicators of political freedom, which are largely independent of economic affluence. Correlations with indicators of personal freedom are less strong, but all positive. Again all four indicators of happiness behave similarly. Freedom in society can affect the happiness of citizens in several ways: Political freedom is likely to provide protection against injustice and assault. Personal freedom can make that people choose life-styles that better fit personal needs and capacities. Both effects are likely to result in more rewarding events. Opportunity-to-choose adds to happiness only in publics with a well developed capability-to-choose (Veenhoven 2000c).
Ruut Veenhoven Gross National Happiness 24
Equality It seems rather evident that people live happier in the most egalitarian societies and that the differences in happiness will be smaller. Yet this appears not to apply to income inequality. Income inequality is essentially unrelated to the average happiness of citizens and only modestly related to dispersion of happiness among them. Possible explanations for this counterintuitive result have been discussed by Ott (2005) and Berg (2007). The results are more in line with common sense in the case of gender inequality. Happiness is systematically lower in nations where there is discrimination against women, but the correlations are much abated when wealth of the nation is 'controlled' (ChinHonFoei 2007). Social inequality can affect happiness negatively by the frustrations and limitations it involves. Possibly, some kinds of inequality also involve positive effects, which balance the negative ones. This may be the case with income-inequality. Brotherhood It is also commonly believed that people live happier in a climate of fraternity and that differences in happiness will be smaller in such conditions. This notion is supported in the correlations with ‘tolerance’ and with ‘trust in people’. These correlations are quite sizable and appear to be largely independent of the wealth of the nation. Surprisingly, there is no correlation with ‘voluntary work’. Justice Lastly there are also good reasons to expect that social justice will improve the level of happiness in a nation and will reduce disparities. This expectation is corroborated in strong and consistent correlations with ‘rule of law’, ‘respect for civil rights’ and ‘absence of corruption. ‘Controlling’ for wealth of a nation washes away much of this correlation, but we must realize that this does not necessarily mean that the actual effects are negligible. Explained variance Together, these six societal qualities explain 83% of the differences in Average happiness, 71% of the differences in Inequality of happiness and no less than 87% of the differences in Happy Life Years. This suggests a political agenda.
7.2 Consistency across measures of happiness The measures of happiness presented in this paper are tailored to somewhat different policy aims. Average happiness is an appropriate measure for policies aiming at greater happiness for a greater number, but gains on this measure could be short lived. So when the aim is at enduring happiness the measure of Happy Life Years is more apt. The measure of Inequality of happiness is designed for policies that aim at fairness in the first place and the index of Inequality Adjusted Happiness is tailored to dual purpose policies.
The correlations in scheme 9 inform us about the compatibility of these policy aims. Divergence in correlation denotes incompatibility, e.g. if economic affluence would
Ruut Veenhoven Gross National Happiness 25
correlate more strongly with average happiness than with happy life years. Looking at the data from this perspective we can conclude that most aims are served by the same means. For instance, policies that aim at greater physical security seem to add both to average happiness and happy life years, while reducing inequality of happiness.
There is only one case of divergence in scheme 9. Income inequality in nations is not associated with lover levels of happiness, but does go with greater inequality of happiness.
8 CONCLUSION Happiness is defined as subjective enjoyment of life-as-a-whole. Since this is something people have in mind, it can be measured using direct questions that can be applied in large scale surveys of the general population. Four measures of happiness in nations can be derived from the responses: 1) Average Happiness, 2) Happy Life Years, 3) Inequality of Happiness and 4) Inequality Adjusted Happiness. All four these measures reveal wide differences across nations and considerable gains over time. The pattern of correlation with societal characteristics is highly similar. The findings yielded with these measures show that happiness is a realistic policy aim. Happiness of a great number is apparently possible in modern society and greater happiness as well. It is as yet less clear how that can be achieved; the available data suggest that most gains can be made by policies that focus on freedom and justice. Economic growth is not likely to add much to happiness in affluent nations and neither is reduction of income differences or greater social security.
Ruut Veenhoven Gross National Happiness 26

REFERENCES Andrews, F.M. & Withey, S.B. (1976) Social indicators of well-being New York, U.S.A., Plenum Press Bentham, J. (1789) An introduction into the principles of morals and legislation Berg, M (2007) Inkomensongelijkheid en geluk in landen (Inequality in income and happiness in nations) Mens en maatschappij, vol.82, pp.28-50 Cantril, H. (1965) The pattern of human concern Rutgers University Press ChinHonFoei, S (2006) Gender equality and Happiness in nations Paper presented at Dag van de Sociologie, Tilburg 8-6-2006 Diener, E., Emmons, R.A., Larsen, R.J. & Griffin, S. (1985) The satisfaction with life scale Journal of Personality Assessment, Vol. 49, 71-75 Donovan, N. Halpern, D. & Sergeant, R. (2003) Life Satisfaction: The State of Knowledge and Implications for Government. Discussion Paper, Strategy Unit, Government UK psychology', Russell Sage Foundation, New York, pp. 3-25 Hagerty Hagerty, Michael R.; Vogel, Joachim; Møller, Valerie (Eds.) (2002) Assessing Quality of Life and Living Conditions to Guide National Policy The State of the Art Springer: Social Indicators Research Series , Vol. 11 Kalmijn, W.M. & Veenhoven, R. (2006) Measuring inequality of happiness in nations: In search for proper statistics. Journal of Happiness Studies, Special issue on 'Inequality of Happiness in Nations', vol. 6, pp. 357--396 Lane, R.E. (1994) Quality of life and quality of persons: A new role for government? Political theory, vol. 22, pp. 219-252 Lawton, M.P. (1975) Philadelphia geriatric center morale scale-revision Journal of Gerontology, Vol. 30, 85-89
Ruut Veenhoven Gross National Happiness 27
Ott, J. (2005) Level and equality of happiness in nations: Does greater happiness for a greater number imply greater inequality in happiness? Journal of Happiness Studies, vol. 6, pp. 397-420 Ouweneel, P. & Veenhoven, R. (1990) Cross-National Differences in Happiness: Cultural Bias or Societal Quality? Bleichrodt, N.; Drenth, P.J.; Eds.: "Contemporary Issues in Cross Cultural Psychology, Swets & Zeitlinger, 1990/91, Lisse, Netherlands Saris, W.E., Scherpenzeel, A.C. & VanWijk, T. Validity and Reliability of Subjective Social Indicators Social Indicators Research, 1998, Vol. 45, 173 – 199 Schwarz, N. & Strack, F. (1991) Evaluating One's Life: A Judgment Model of Subjective Well-Being Strack, F.; et al; (Eds.): "Subjective Well-Being", Pergamon, Oxford, UK, 27 - 47 Sen, A: (1992) Capability and wellbeing In: Sen, A. & Nussbaum, M. (Eds.) ‘The quality of life’, Clarendon Press, Oxford, UK, pp. 30-53 Veenhoven, R. (1993) Happiness in nations: Subjective appreciation of life in 56 nations 1946-1992 RISBO, Erasmus University Rotterdam, The Netherlands Veenhoven, R. (2000a) The four qualities of life Journal of Happiness Studies, Vol. 1, pp. 1-39 Veenhoven, R. (2000b) Wellbeing in the welfare state: Level not higher, distribution not more equitable Journal of Comparative Policy Analysis, vol. 2, pp 91-125 Veenhoven, R. (2000c) Freedom and happiness: a comparative study in 44 nations in the early 1990's Published in: Diener, E. & Suh, E.M. (eds) 'Culture and subjective wellbeing', MIT press, Cambridge, MA USA, pp. 257-288 Veenhoven, R. (2005a) Is life getting better? How long and happy do people live in modern society? Published in: European Psychologist, 2005, special section on 'Human development and Well-being', vol. 10, pp. 330-343
Ruut Veenhoven Gross National Happiness 28

Veenhoven, R. (2005b) Return of inequality in modern society? Test by trend in dispersion of life-satisfaction across time and nations Journal of Happiness Studies, Special issue on Inequality of Happiness in Nations', vol. 6, 457-487 Veenhoven, R. 2006 World Database of Happiness, continuous register of scientific research on subjective enjoyment of life Erasmus University Rotterdam, Netherlands Available at: http://worlddatabaseofhappiness.eur.nl Veenhoven, R. 2006a Trend Average Happiness in nations 1946-2004. World Database of Happiness, Trend report 2006-1, Available at: http://worlddatabaseofhappiness.eur.nl/hap_nat/findingreports/2006-1.pdf Veenhoven, R. 2006b Trend Happy Life Years in nations 1946-2004. World Database of Happiness, Happiness in nations, Trend report 2006-2, Available at: http://worlddatabaseofhappiness.eur.nl/hap_nat/findingreports/2006-.pdf Veenhoven, R. 2006c Trend Inequality of happiness in nations 1946-2004. World Database of Happiness, Happiness in nations, Trend report 2006-3 Available at: http://worlddatabaseofhappiness.eur.n/hap_nat/findingreports/2006-3.pdf Veenhoven, R. 2006d Trend Inequality-Adjusted Happiness in nations 1946-2004. World Database of Happiness, Happiness in nations, Trend report 2006-1, Available at: http://worlddatabaseofhappiness.eur.nl/hap_nat/findingreports/2006-4.pdf Veenhoven, R. (2006e) How do we assess how happy we are? Paper presented at conference on ‘New Directions in the Study of Happiness: United States and International Perspectives’, University of Notre Dame, USA, October 22-24 2006 Veenhoven, R. (2007) Healthy happiness: Effects of happiness on physical health and the consequences for preventive health care Accepted for publication in Journal of Happiness Studies, online since March 2, 2007,
Ruut Veenhoven Gross National Happiness 29

Veenhoven, R. & Hagerty, M (2006) Rising happiness in nations,1946-2004. A reply to Easterlin Social Indicators Research, vol. 79, 421-436, DOI 10.1007/s11205-005-5074-x World Database of Happiness See Veenhoven 2006
Ruut Veenhoven Gross National Happiness 30
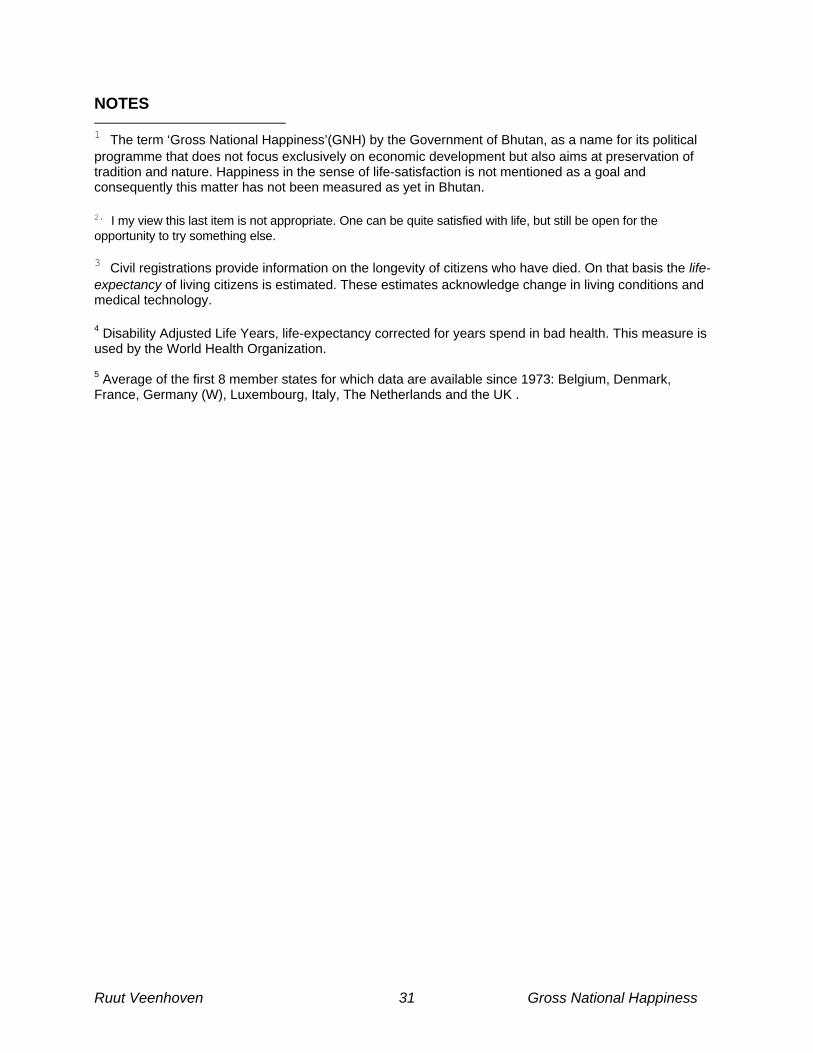
NOTES 1 The term ‘Gross National Happiness’(GNH) by the Government of Bhutan, as a name for its political programme that does not focus exclusively on economic development but also aims at preservation of tradition and nature. Happiness in the sense of life-satisfaction is not mentioned as a goal and consequently this matter has not been measured as yet in Bhutan. 2. I my view this last item is not appropriate. One can be quite satisfied with life, but still be open for the opportunity to try something else. 3 Civil registrations provide information on the longevity of citizens who have died. On that basis the life-expectancy of living citizens is estimated. These estimates acknowledge change in living conditions and medical technology. 4 Disability Adjusted Life Years, life-expectancy corrected for years spend in bad health. This measure is used by the World Health Organization. 5 Average of the first 8 member states for which data are available since 1973: Belgium, Denmark, France, Germany (W), Luxembourg, Italy, The Netherlands and the UK .
Ruut Veenhoven Gross National Happiness 31