Embed Size (px)
Citation preview
Quick Review
Central tendency: Mean, Median, Mode
Shape: Normal, Skewed, Modality
Variability: Standard Deviation, Variance

SAMPLE POPULATION
XX 2 2X XS X XS
X
X n 2
2 ( )
1X
X XS
n
2( )
1X
X XS
n
XN
22 ( )XX
X
N
2( )XX
X
N
Quick Review
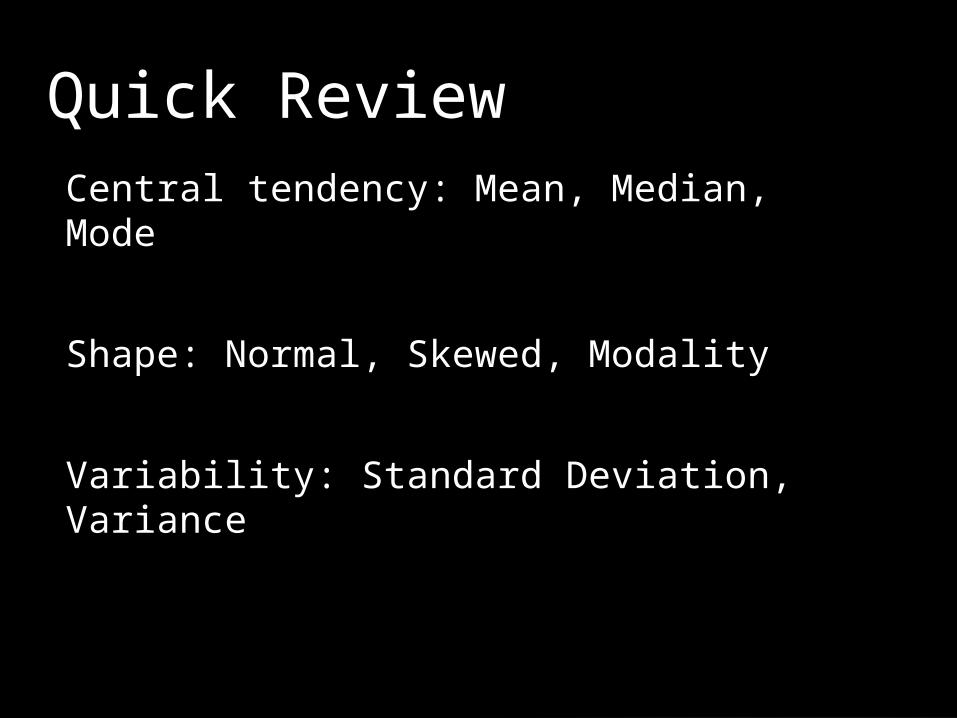
Evaluating scores
Raw score of X:-Measure of absolute
standing- Difficult to interpret
Z-SCORE - Measure of relative
standing
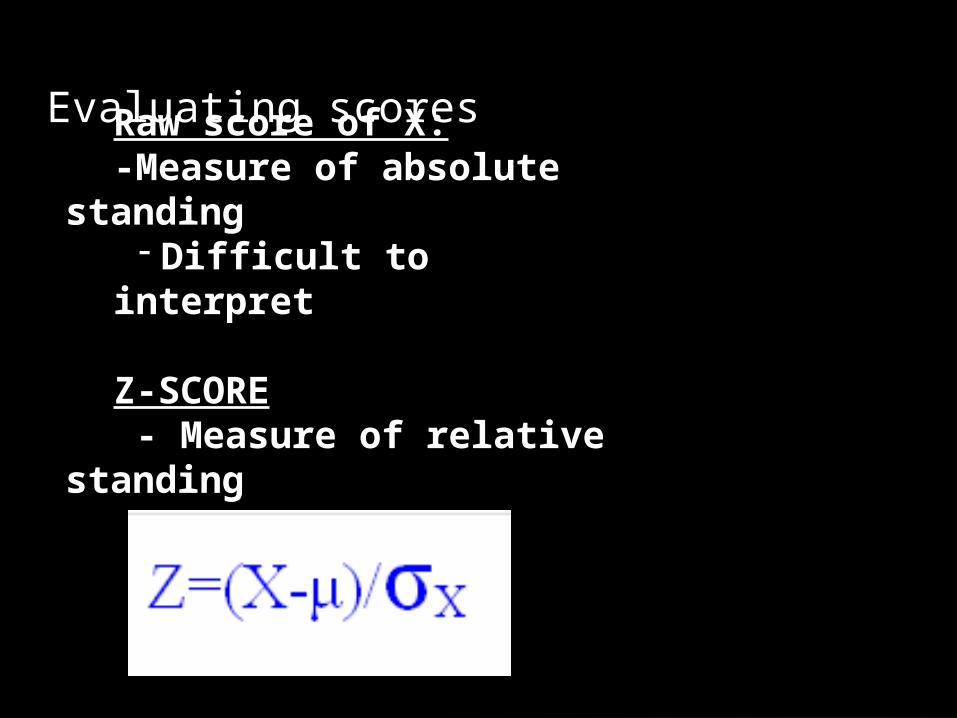
Z-Transformation
- Transforming all raw scores in a distribution does not change the shape of a distribution, it does change the mean and the standard deviation
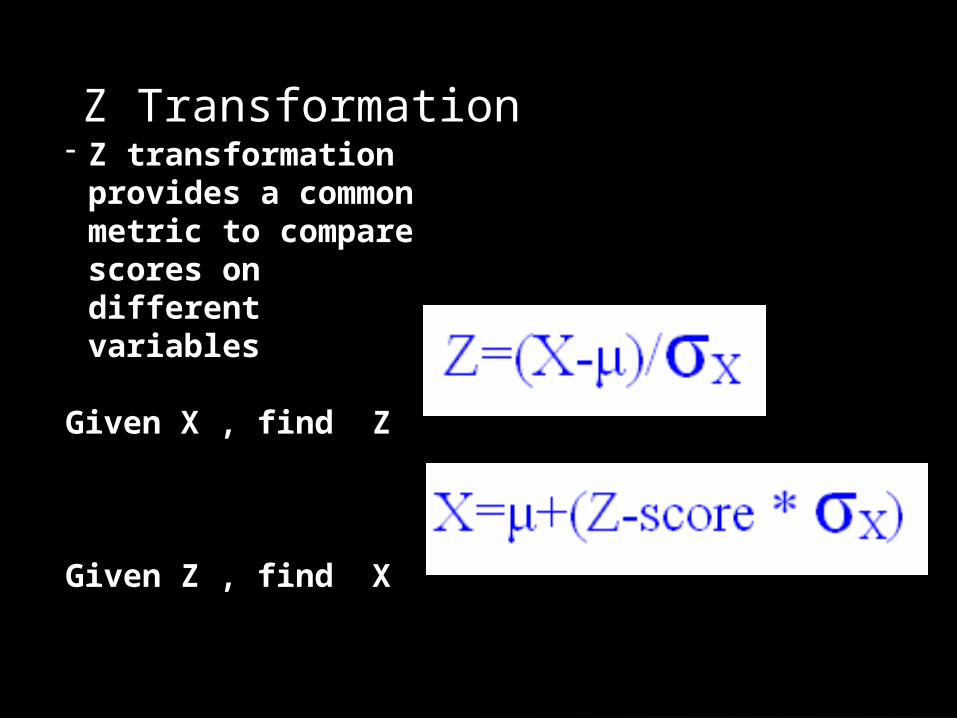
Z Transformation
- Z transformation provides a common metric to compare scores on different variables
Given X , find Z
Given Z , find X
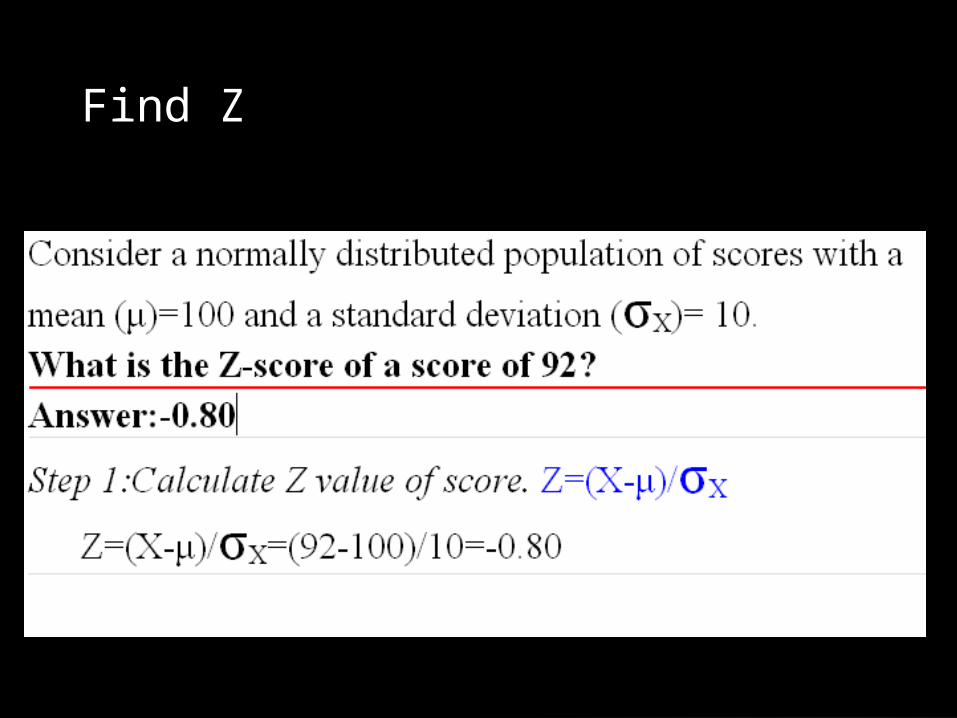
Find Z
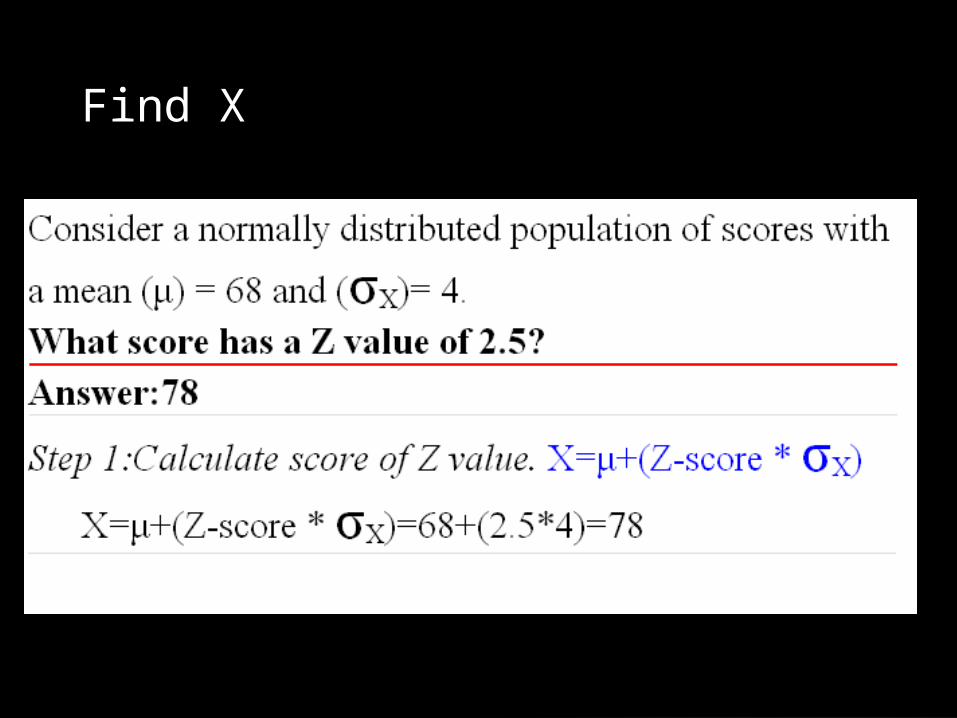
Find X
-Used for testing hypothesis
-Provide a way of determining probability of an obtained sample result (experimental outcome)
-Usually, the probably that experimental result occurred by chance given null distribution
-THEORETICAL PROBABILITY DISTRIBUTIONS (Z, F, T)
The standard normal curve - Bell shaped, symmetrical, unimodal, asymptotic - Mean, Median and mode all equal - Mean = 0, σ2 = 1, σ = 1
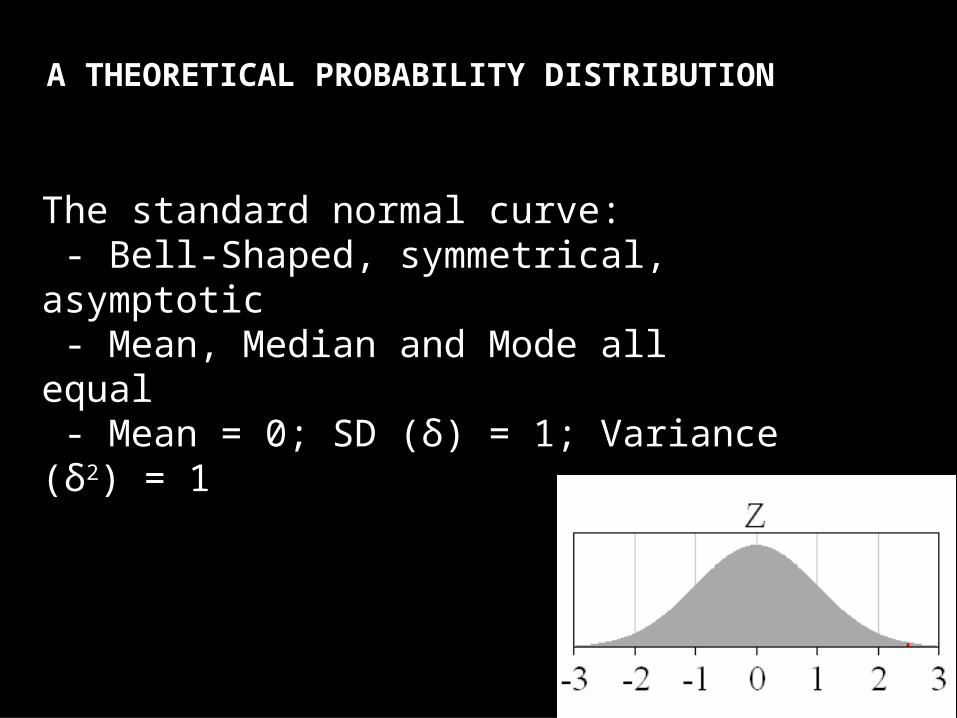
A THEORETICAL PROBABILITY DISTRIBUTION
The standard normal curve: - Bell-Shaped, symmetrical, asymptotic - Mean, Median and Mode all equal - Mean = 0; SD (δ) = 1; Variance (δ2) = 1
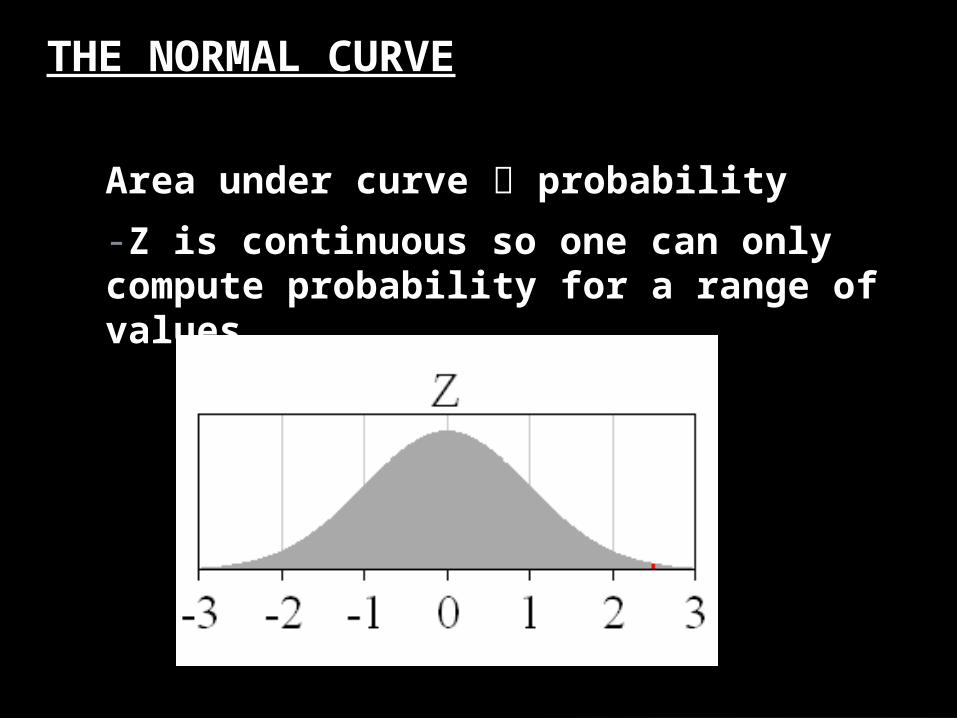
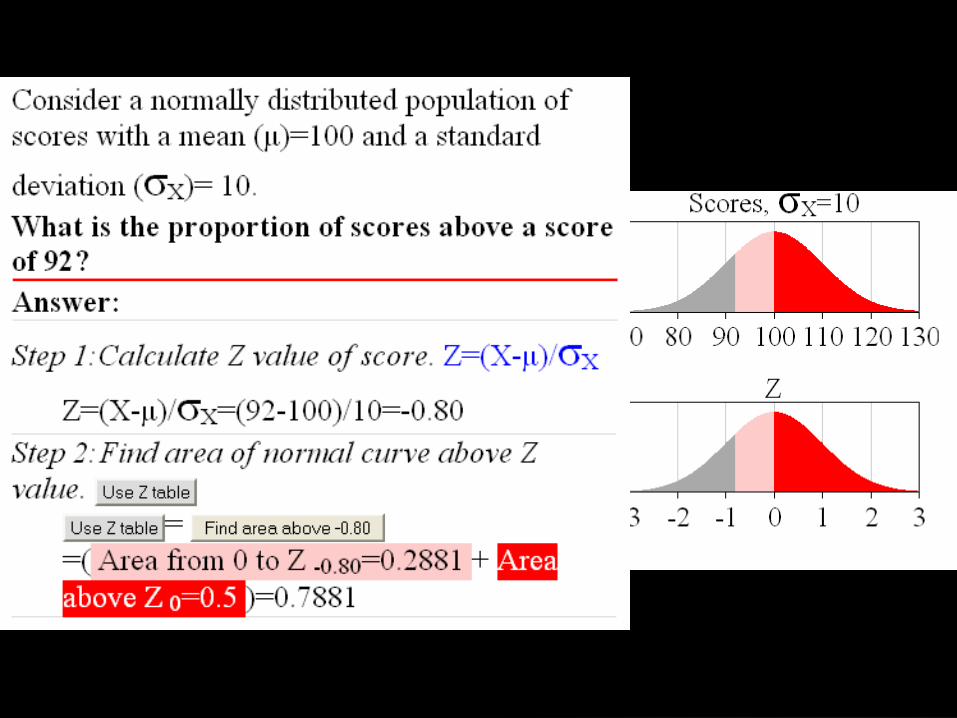
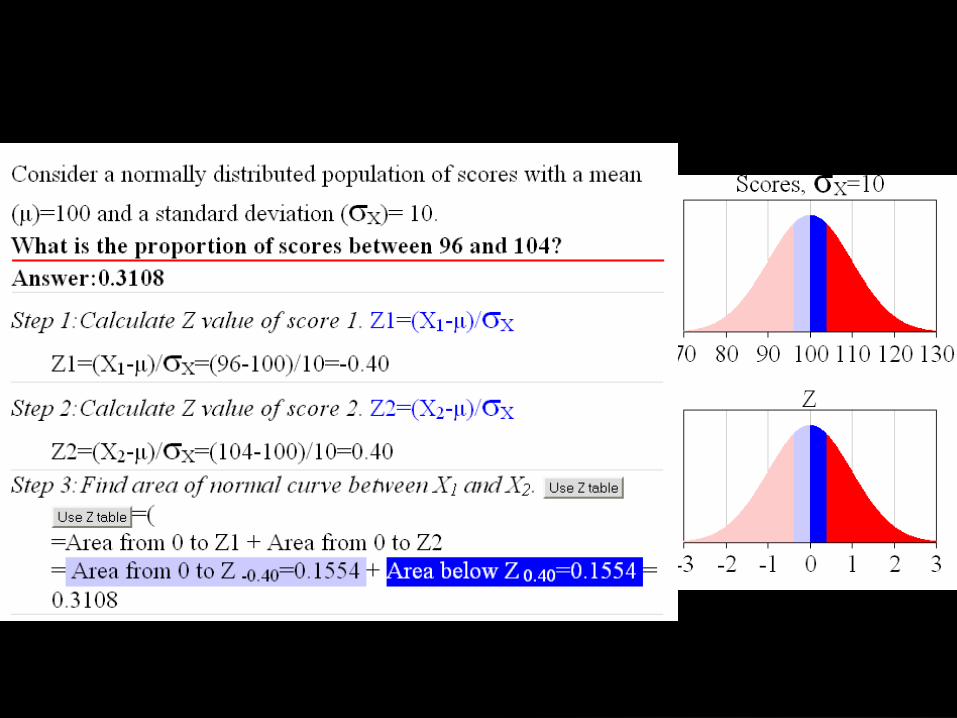
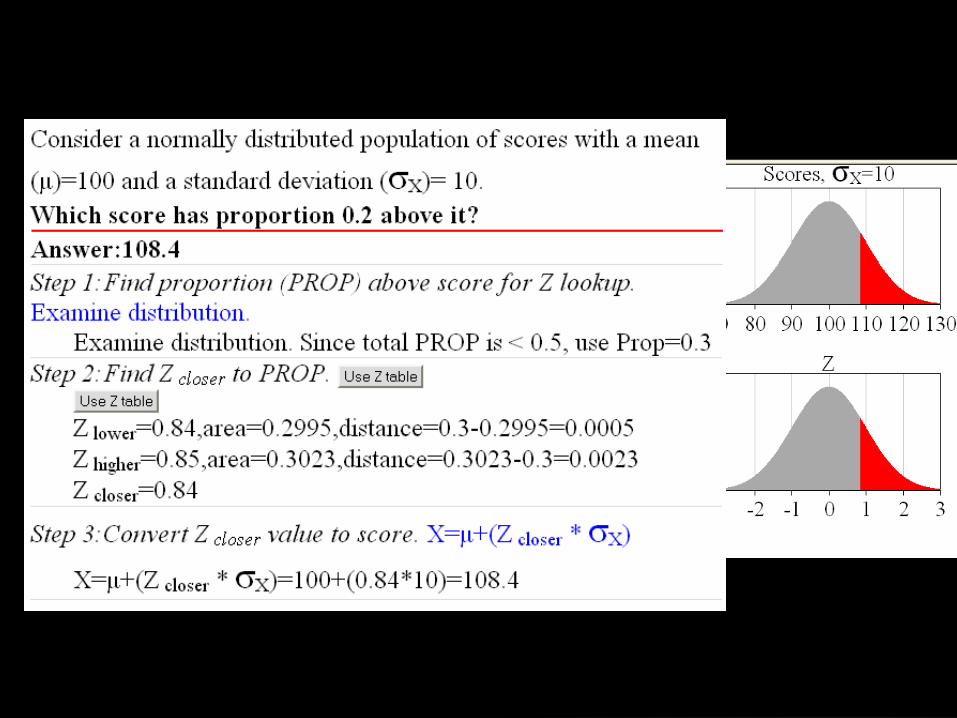
THE NORMAL CURVE
Area under curve probability
-Z is continuous so one can only compute probability for a range of values
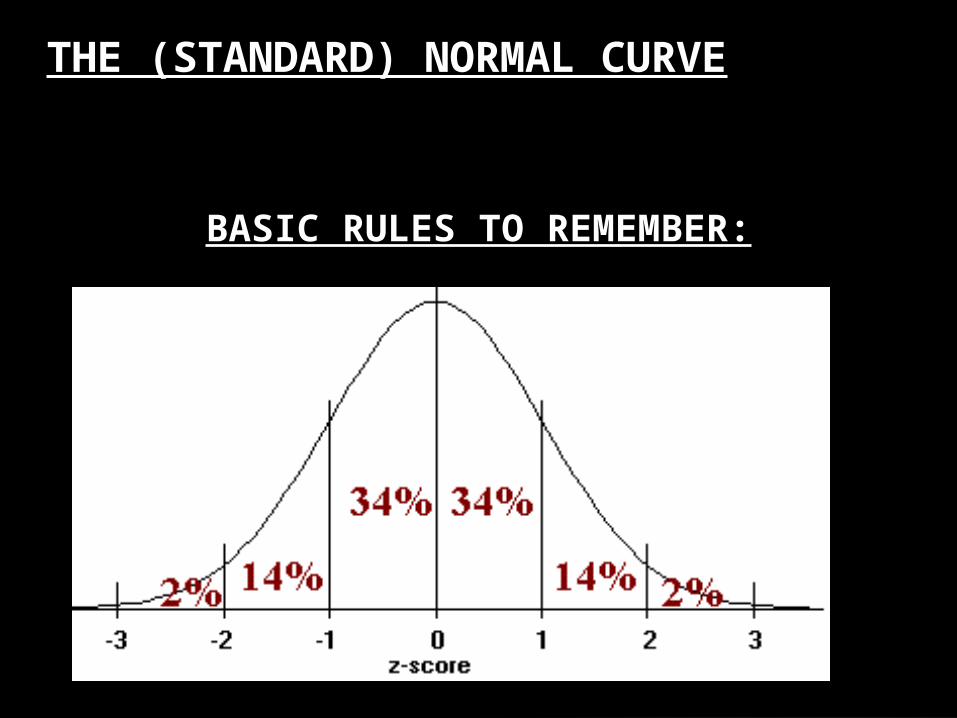
THE (STANDARD) NORMAL CURVE
BASIC RULES TO REMEMBER:
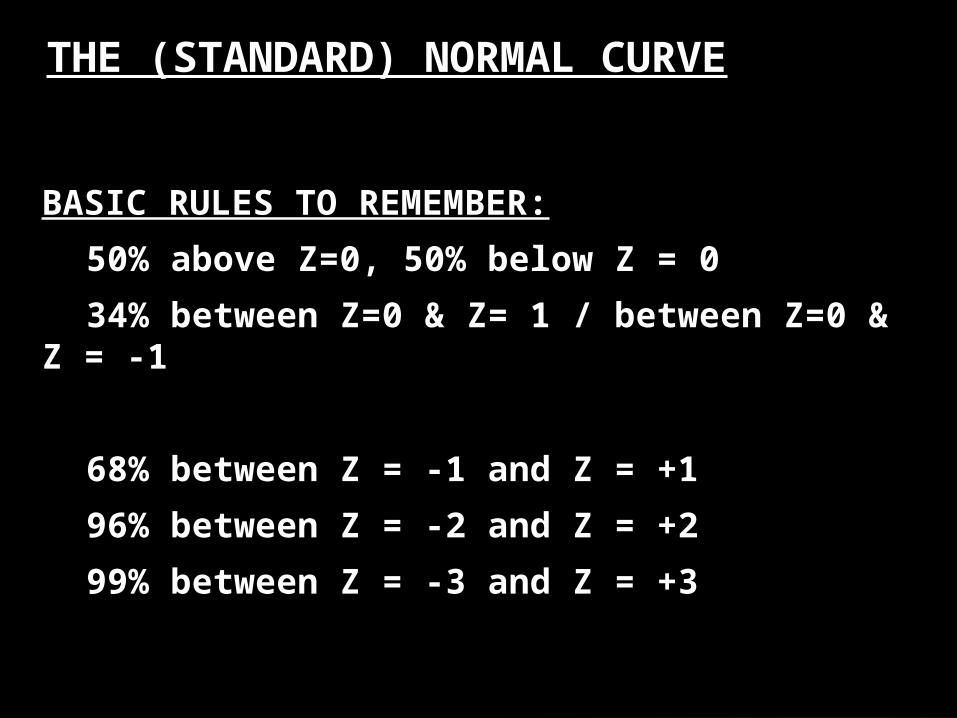
THE (STANDARD) NORMAL CURVE
BASIC RULES TO REMEMBER:
50% above Z=0, 50% below Z = 0
34% between Z=0 & Z= 1 / between Z=0 & Z = -1
68% between Z = -1 and Z = +1
96% between Z = -2 and Z = +2
99% between Z = -3 and Z = +3
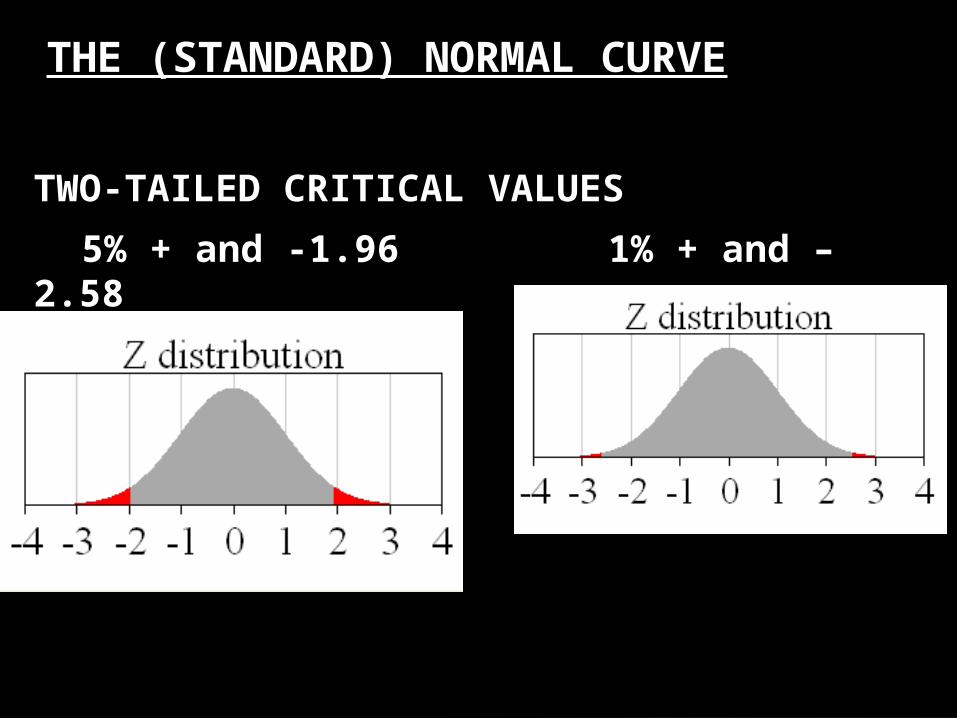
THE (STANDARD) NORMAL CURVE
TWO-TAILED CRITICAL VALUES
5% + and -1.96 1% + and – 2.58
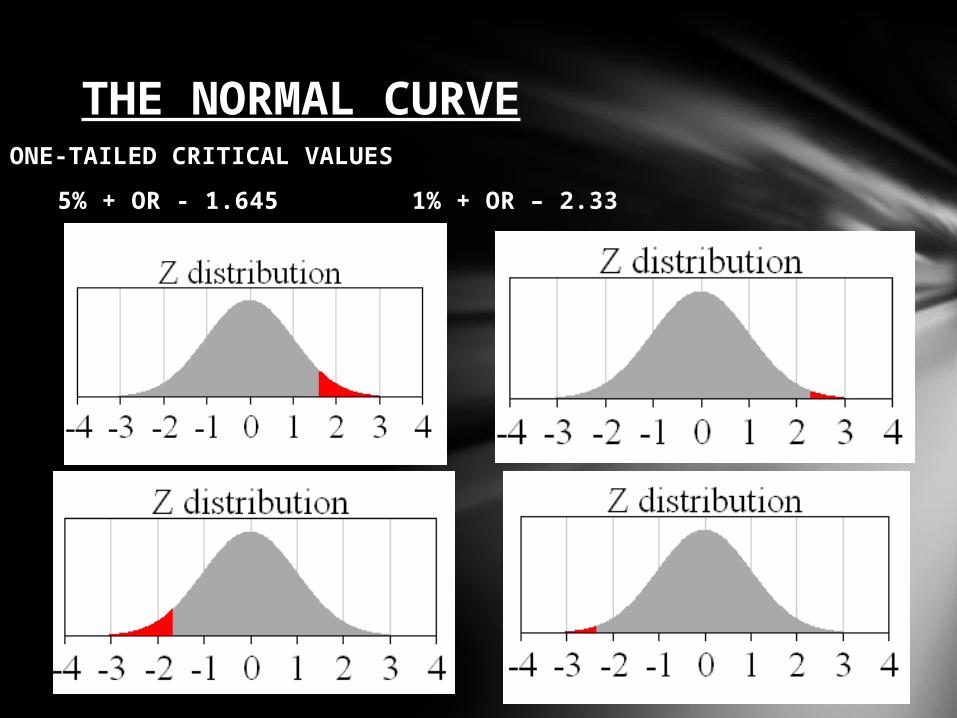
THE NORMAL CURVEONE-TAILED CRITICAL VALUES
5% + OR - 1.645 1% + OR – 2.33