Embed Size (px)
Citation preview
1
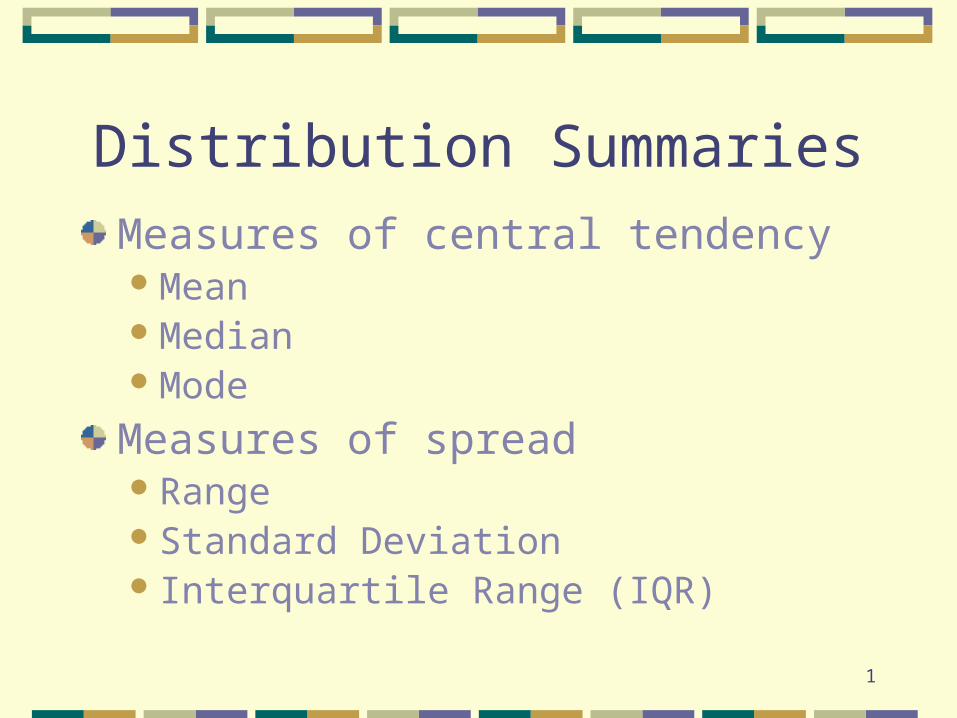
Distribution Summaries
Measures of central tendencyMeanMedianMode
Measures of spreadRangeStandard Deviation Interquartile Range (IQR)
2
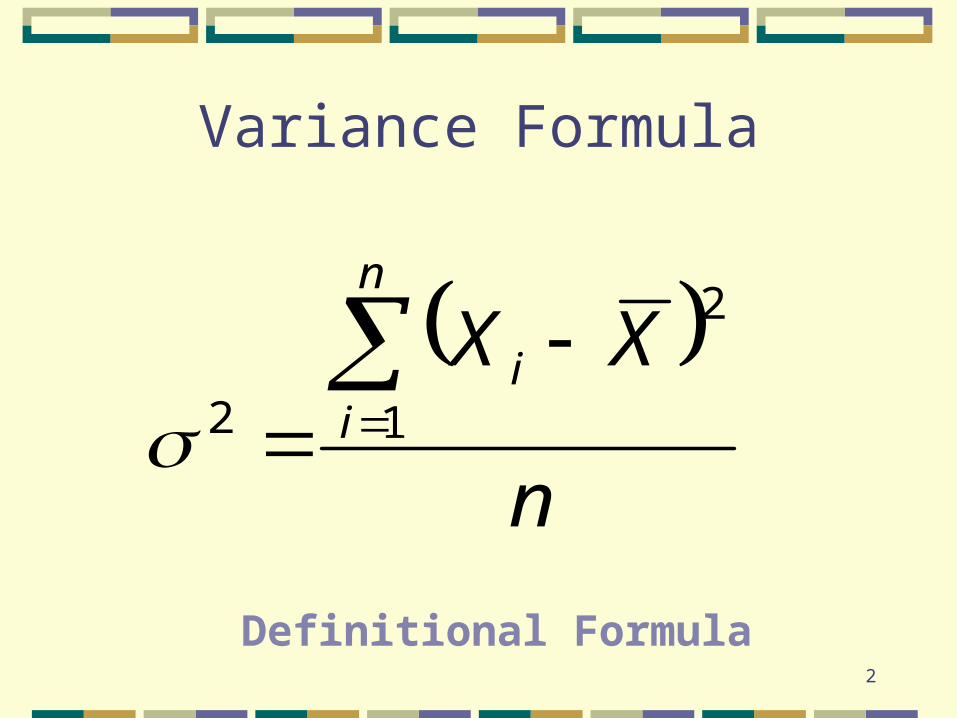
Variance Formula
n
XXn
ii
1
2
2
Definitional Formula
3
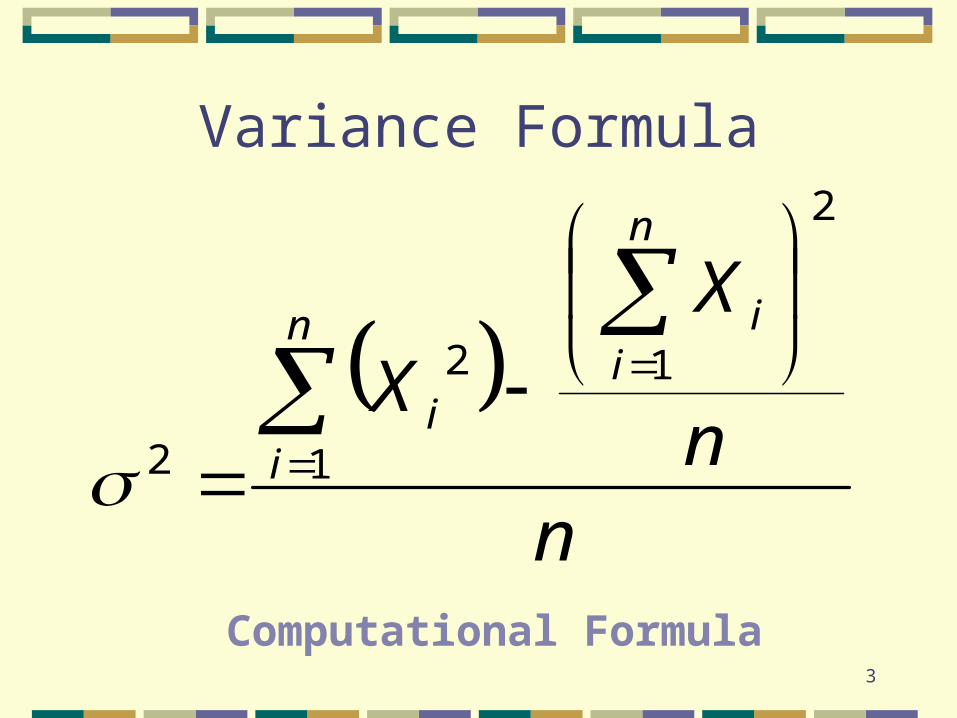
Variance Formula
n
n
X
X
n
iin
ii
2
1
1
2
2
Computational Formula
4
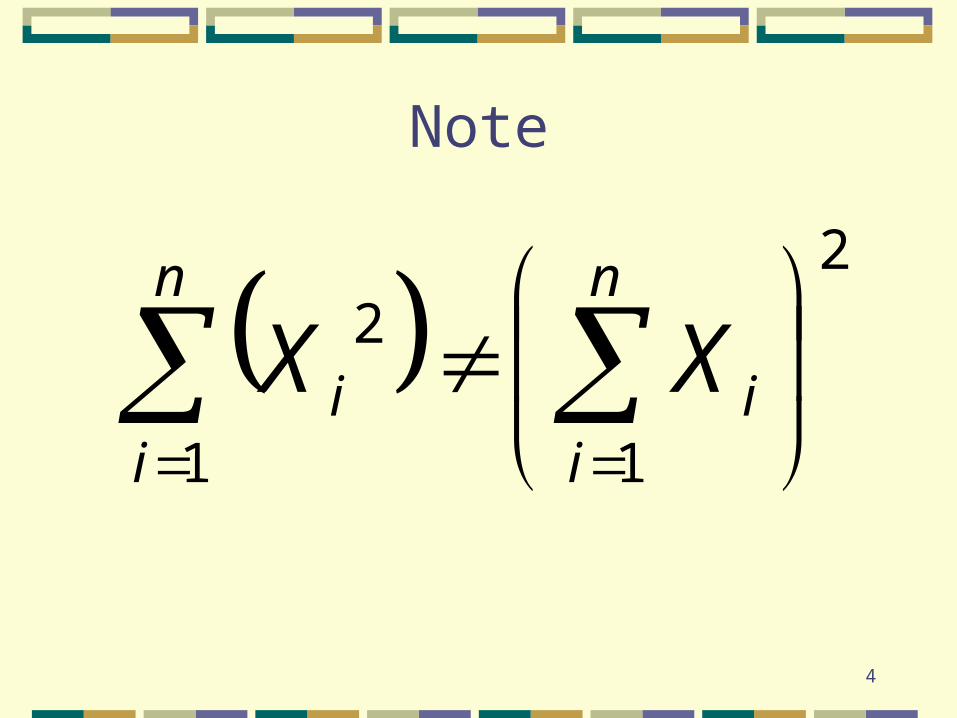
Note
2
11
2
n
ii
n
ii XX
5
Other central tendencies
Median
Mode
6
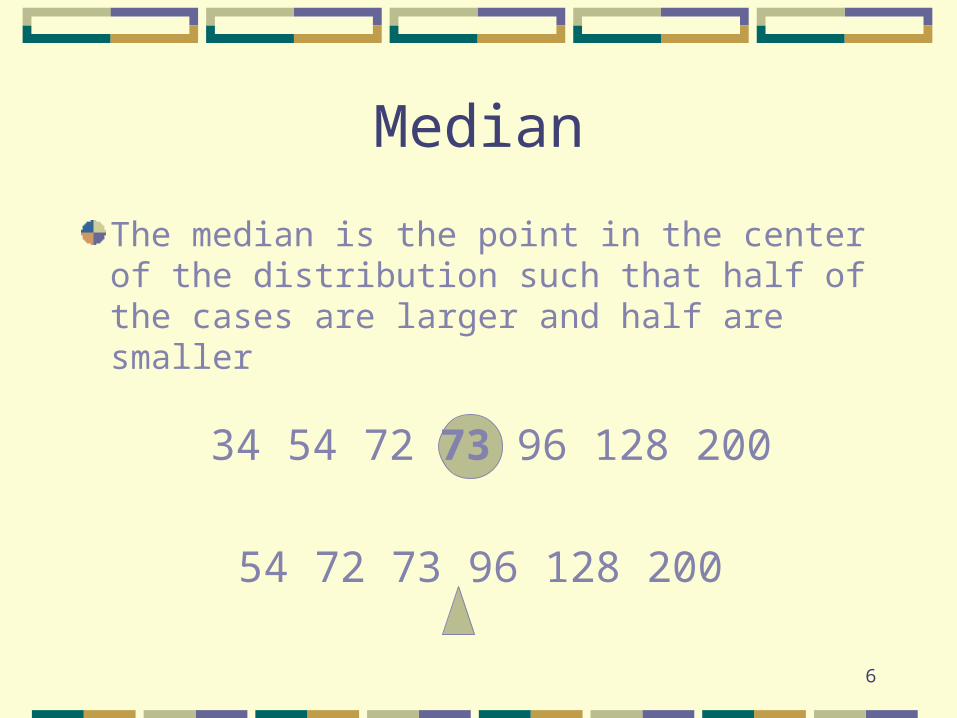
Median
The median is the point in the center of the distribution such that half of the cases are larger and half are smaller
34 54 72 73 96 128 200
54 72 73 96 128 200
7
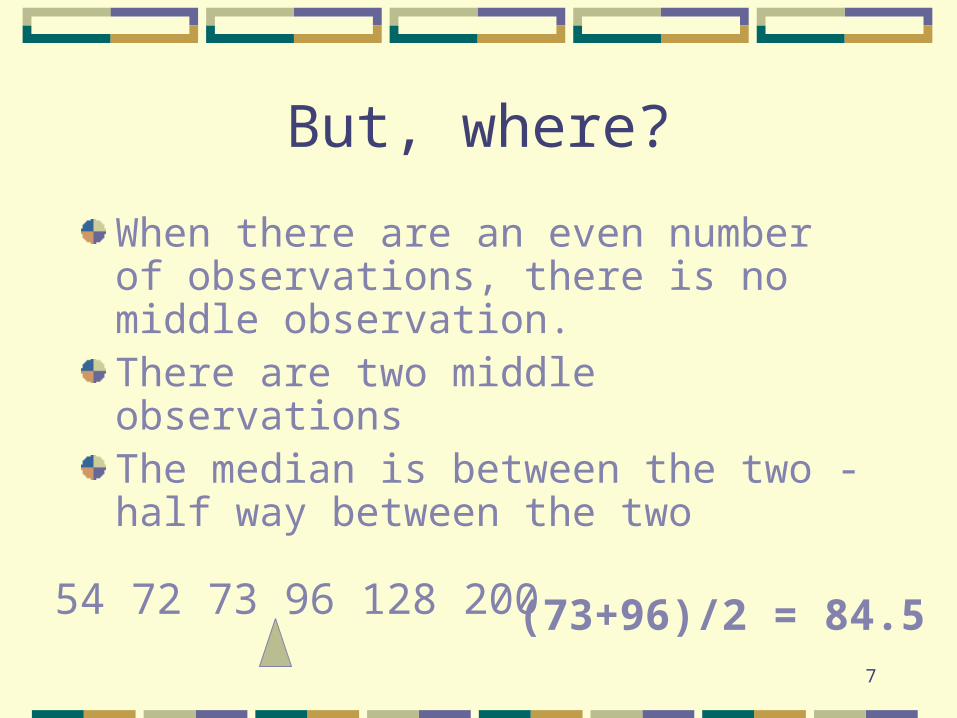
But, where?
When there are an even number of observations, there is no middle observation.There are two middle observationsThe median is between the two - half way between the two
54 72 73 96 128 200 (73+96)/2 = 84.5
8
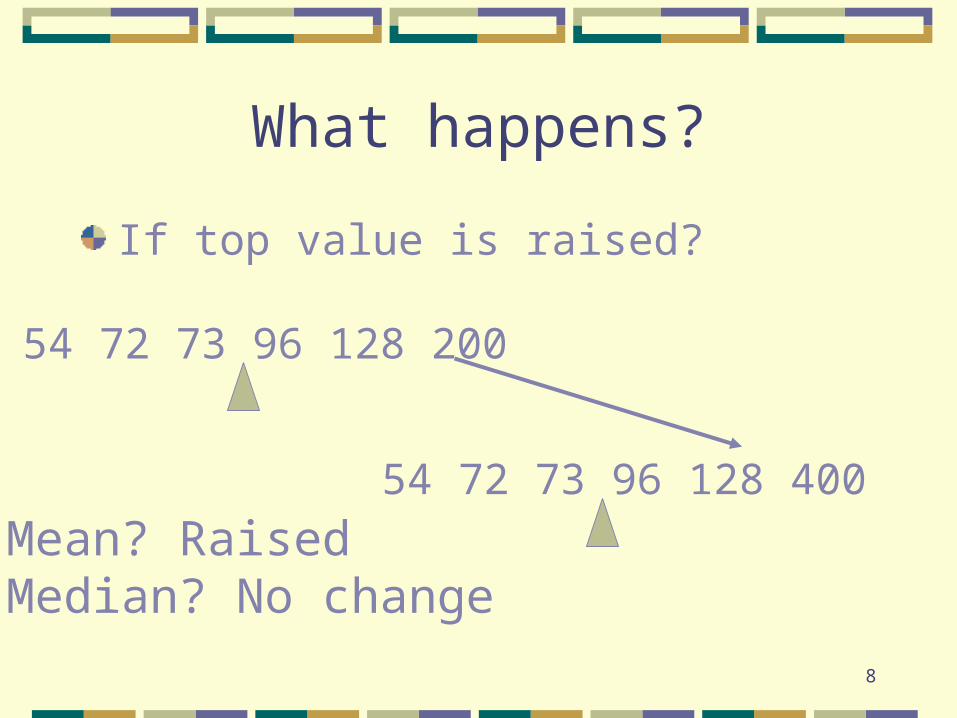
What happens?
If top value is raised?
54 72 73 96 128 200
54 72 73 96 128 400
Mean? RaisedMedian? No change
9
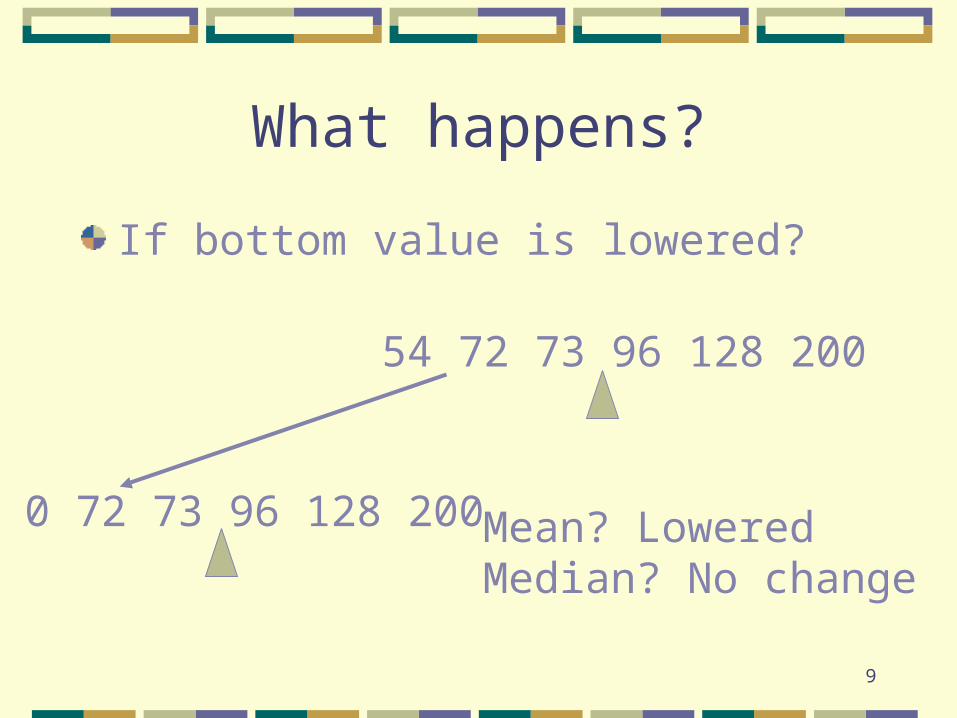
What happens?
If bottom value is lowered?
54 72 73 96 128 200
0 72 73 96 128 200 Mean? LoweredMedian? No change
10
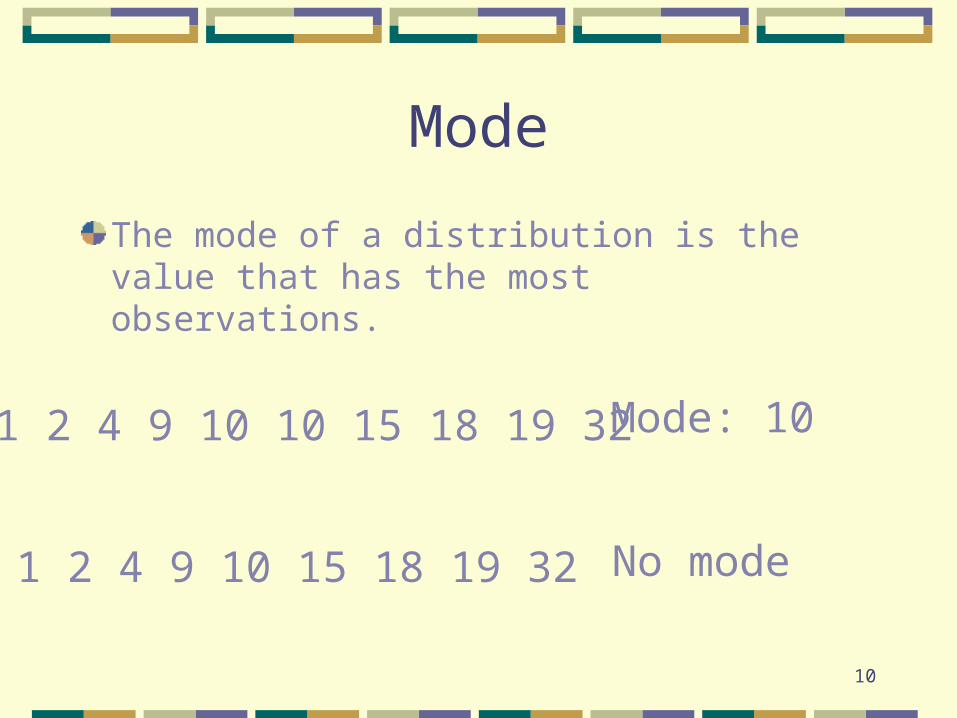
Mode
The mode of a distribution is the value that has the most observations.
1 2 4 9 10 10 15 18 19 32
1 2 4 9 10 15 18 19 32
Mode: 10
No mode
11
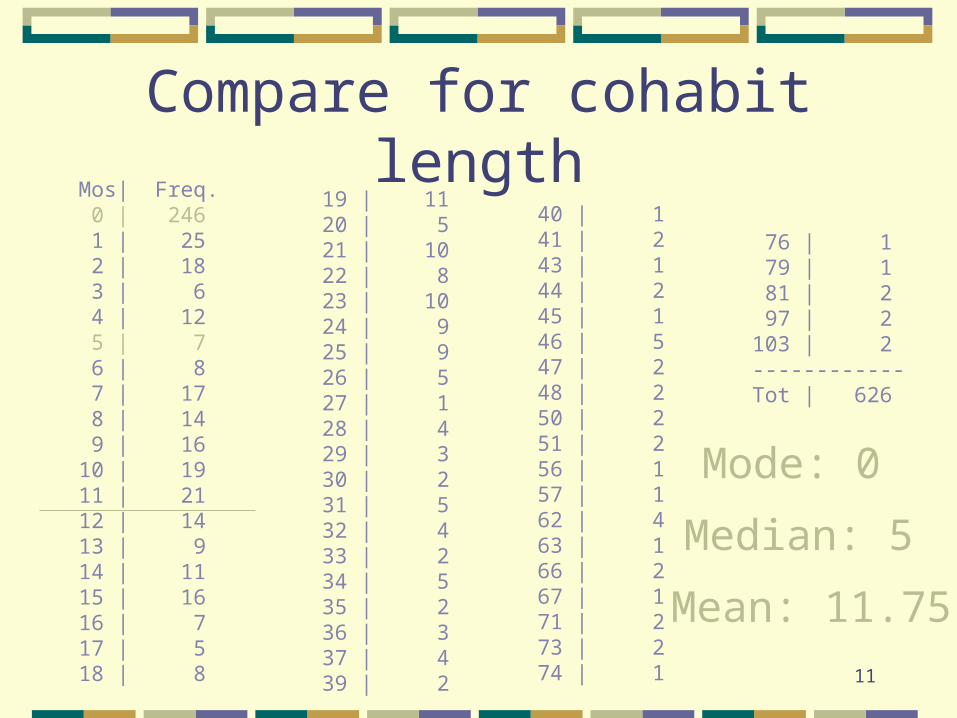
Compare for cohabit length Mos| Freq. 0 | 246 1 | 25 2 | 18 3 | 6 4 | 12 5 | 7 6 | 8 7 | 17 8 | 14 9 | 16 10 | 19 11 | 21 12 | 14 13 | 9 14 | 11 15 | 16 16 | 7 17 | 5 18 | 8
19 | 11 20 | 5 21 | 10 22 | 8 23 | 10 24 | 9 25 | 9 26 | 5 27 | 1 28 | 4 29 | 3 30 | 2 31 | 5 32 | 4 33 | 2 34 | 5 35 | 2 36 | 3 37 | 4 39 | 2
40 | 1 41 | 2 43 | 1 44 | 2 45 | 1 46 | 5 47 | 2 48 | 2 50 | 2 51 | 2 56 | 1 57 | 1 62 | 4 63 | 1 66 | 2 67 | 1 71 | 2 73 | 2 74 | 1
76 | 1 79 | 1 81 | 2 97 | 2 103 | 2 ------------Tot | 626
Mode: 0
Median: 5
Mean: 11.75
12
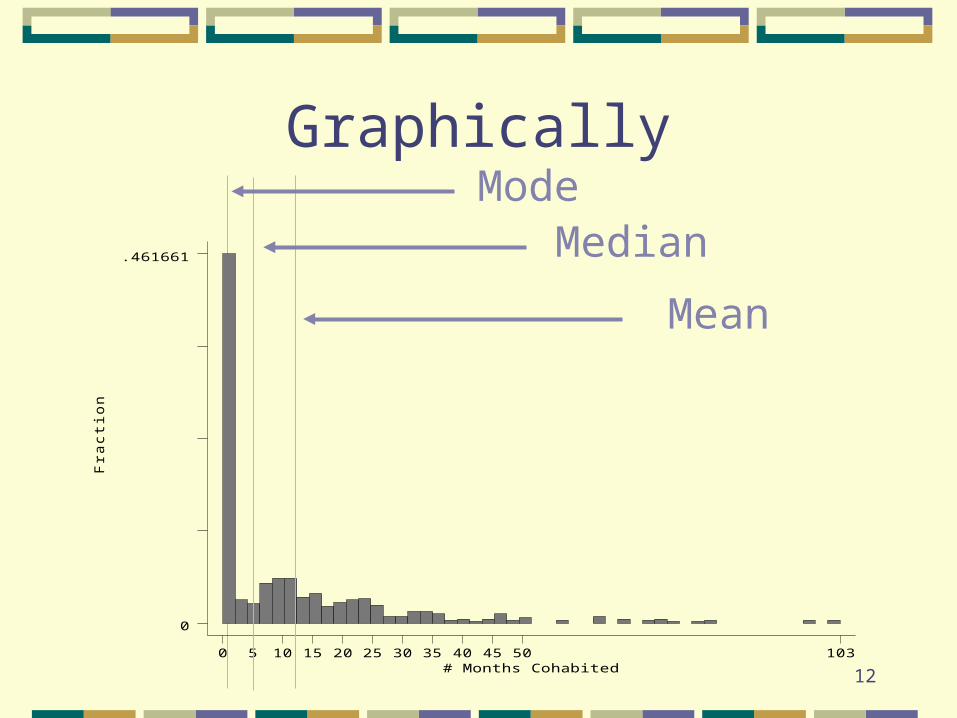
GraphicallyFr
acti
on
# Months Cohabited0 5 10 15 20 25 30 35 40 45 50 103
0
.461661
ModeMedian
Mean
13
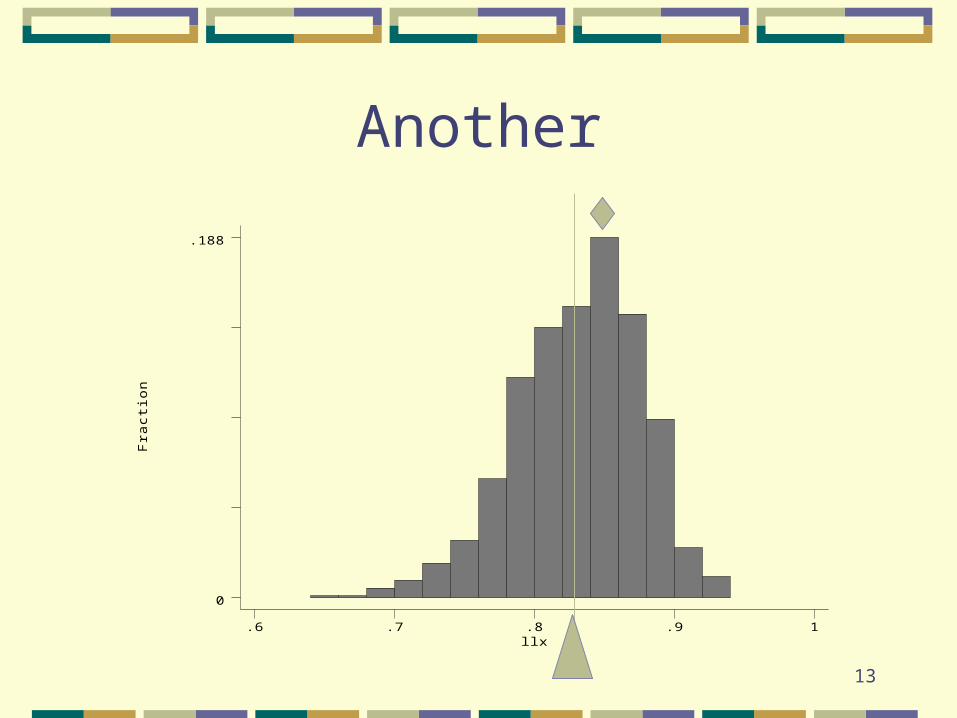
AnotherFr
acti
on
llx.6 .7 .8 .9 1
0
.188
14
Central tendency
Mean: find the “average” value
Median: find the “middle” value
Mode : find the “most common” value
15
Measures of Spread
Range
Variance
Standard deviation
Interquartile range IQR
16
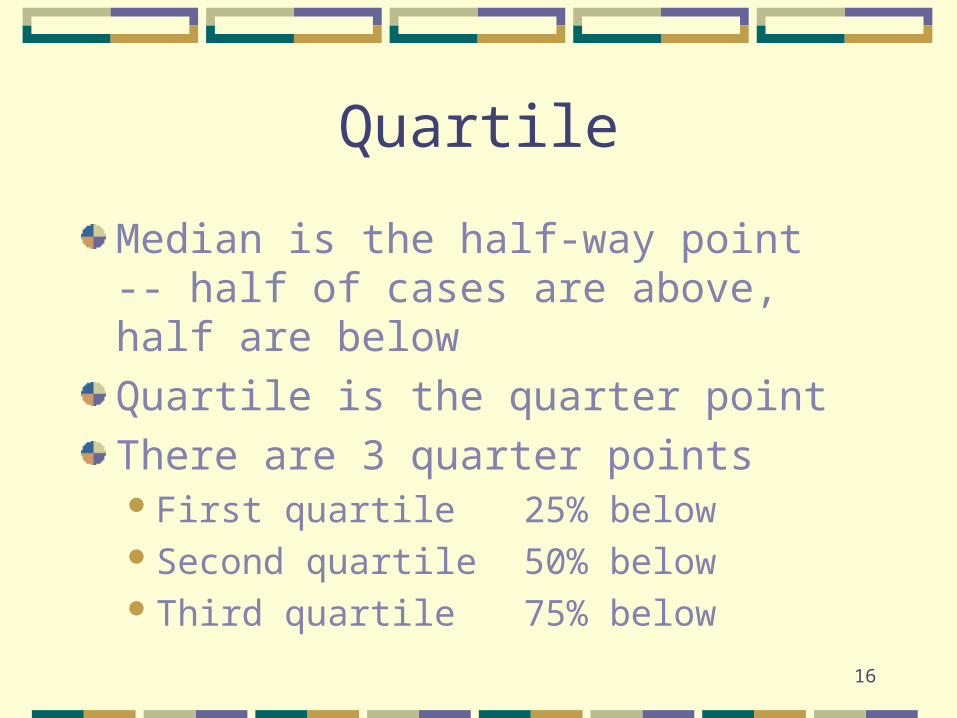
Quartile
Median is the half-way point -- half of cases are above, half are below
Quartile is the quarter point
There are 3 quarter pointsFirst quartile 25% belowSecond quartile 50% belowThird quartile 75% below
17
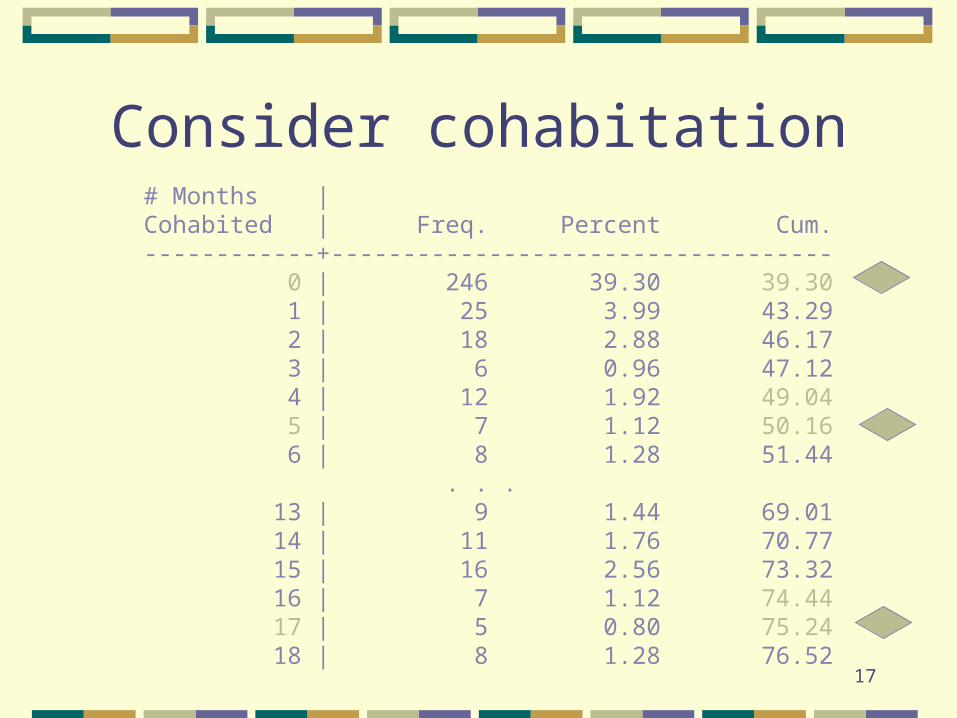
Consider cohabitation# Months |Cohabited | Freq. Percent Cum.------------+----------------------------------- 0 | 246 39.30 39.30 1 | 25 3.99 43.29 2 | 18 2.88 46.17 3 | 6 0.96 47.12 4 | 12 1.92 49.04 5 | 7 1.12 50.16 6 | 8 1.28 51.44 . . . 13 | 9 1.44 69.01 14 | 11 1.76 70.77 15 | 16 2.56 73.32 16 | 7 1.12 74.44 17 | 5 0.80 75.24 18 | 8 1.28 76.52
18
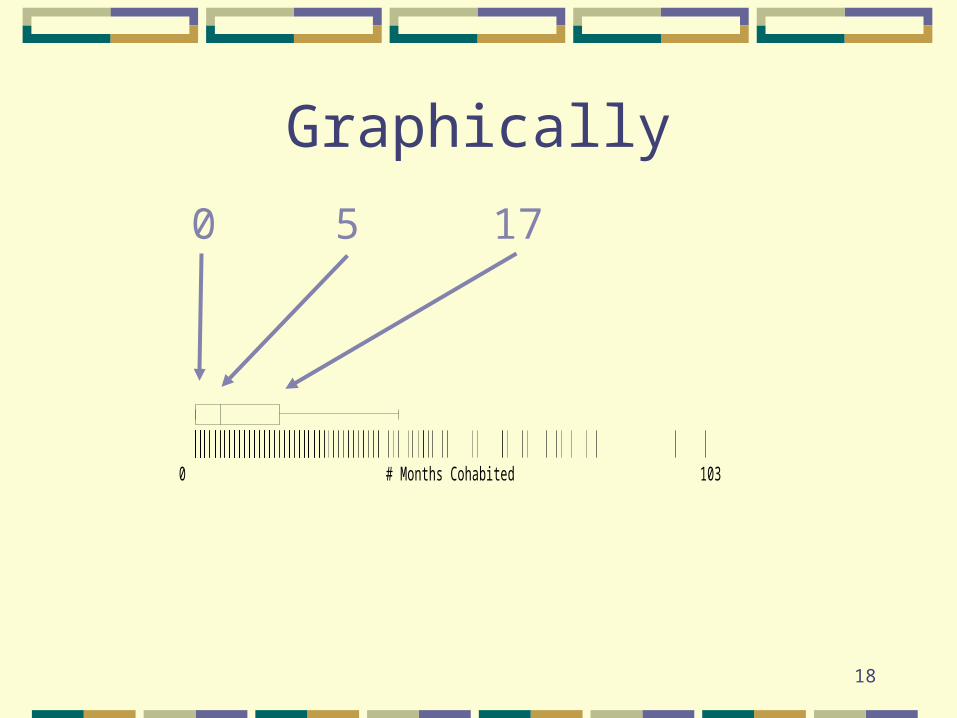
Graphically
# Months Cohabited0 103
0 5 17
19
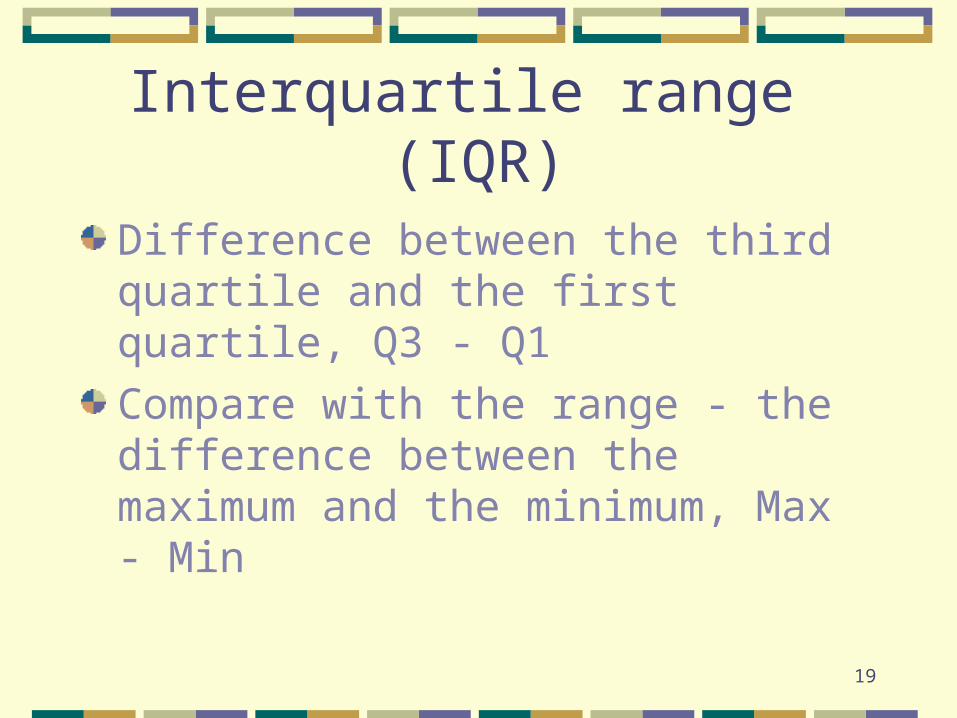
Interquartile range (IQR)
Difference between the third quartile and the first quartile, Q3 - Q1
Compare with the range - the difference between the maximum and the minimum, Max - Min
20
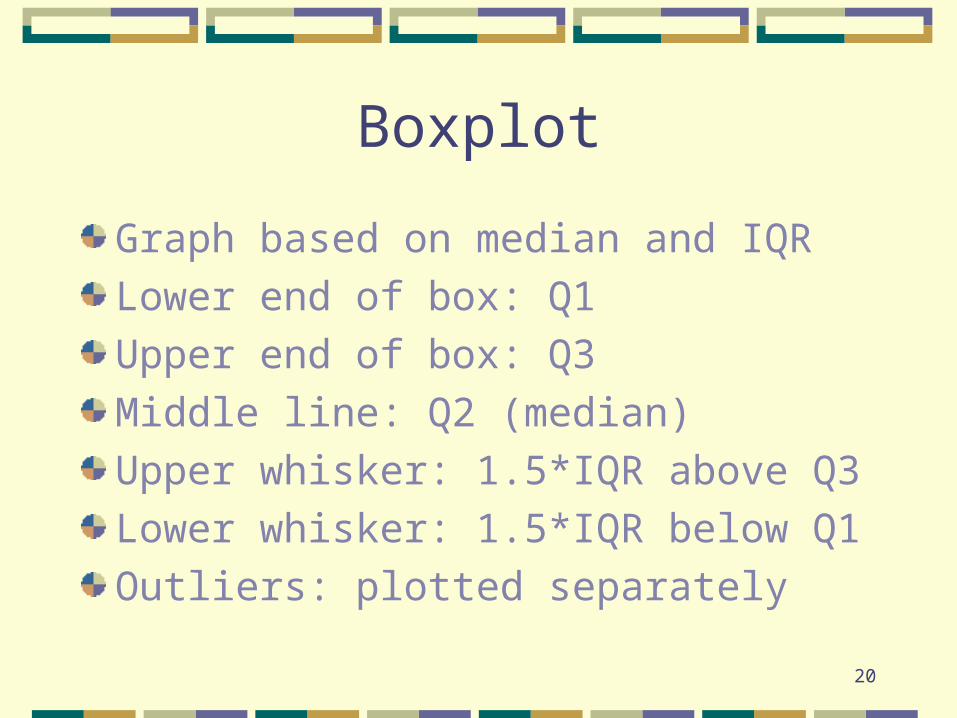
Boxplot
Graph based on median and IQR
Lower end of box: Q1
Upper end of box: Q3
Middle line: Q2 (median)
Upper whisker: 1.5*IQR above Q3
Lower whisker: 1.5*IQR below Q1
Outliers: plotted separately
21
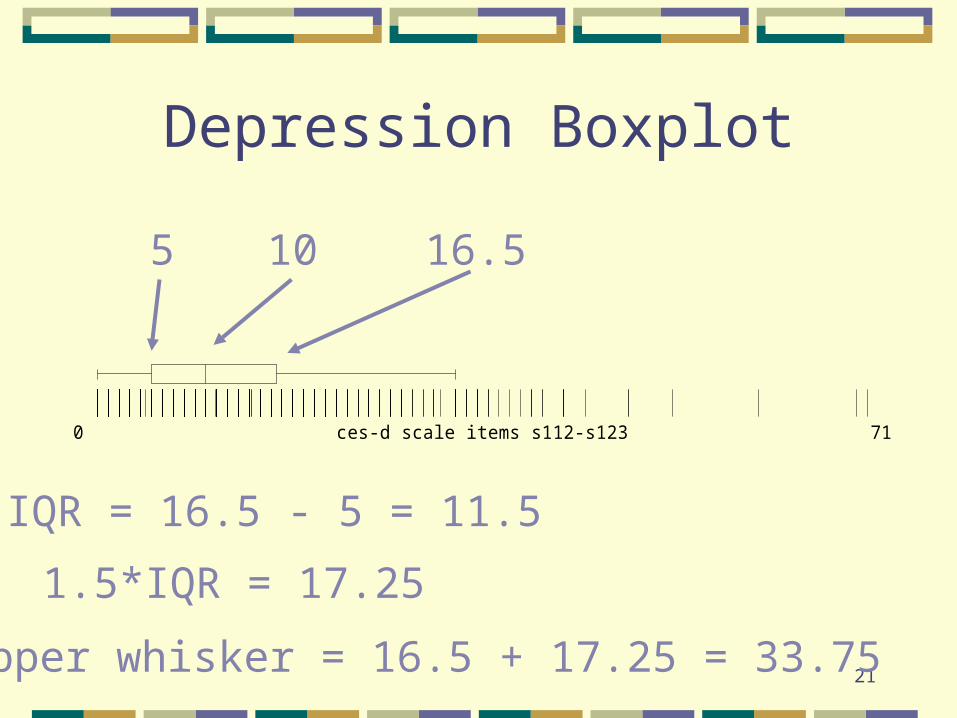
Depression Boxplot
ces-d scale items s112-s1230 71
5 10 16.5
IQR = 16.5 - 5 = 11.5
1.5*IQR = 17.25
Upper whisker = 16.5 + 17.25 = 33.75
22
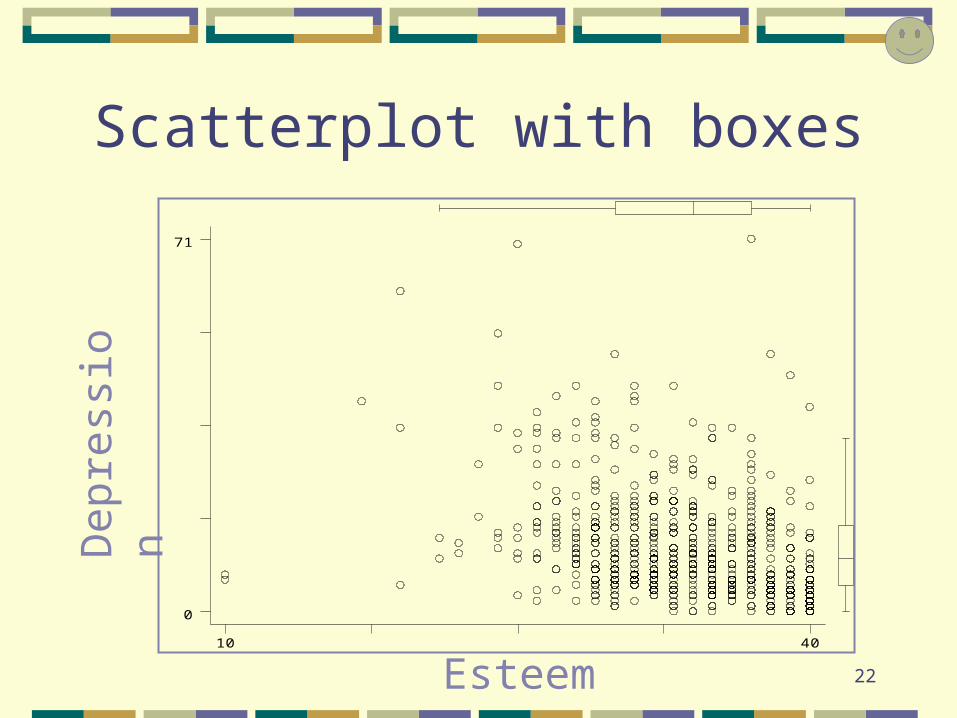
Scatterplot with boxesces-
d s
cale
ite
ms
s112-s
123
Rosenberg self-esteem scale10 40
0
71
Dep
ress
ion
Esteem