Embed Size (px)
Citation preview
MEASUREMENT OF TECHNICAL EFFICTENCY IN PERENIAL CROPS:Case in Rubber Farming in Batang Hari Regency
PENGITKURAN EFISIENSI TEKMS DALAM TANAMAN TAHTINANKasus Pada Usahatani Karet I(abupaten Batanghari
IreXuncilbicd efficiency,pirl crops, rubberLrhg.
IIINODUCTIONhdonesia is the second largestntbber producer in the world after
h accounted for around 26 percentwdd production of 5.50 million tons
|99J. During the peiiod 1980-1993,plantations in lndonesia had
increased in area by an average of
Fln per year, from 2.38 million ha in3 3-23 million ha in 1993. Natural
q4ut of Indonesia mainly comeslb snrallholder sector who in 1993
for 72 percent of total productionpcrcerft of total plantation area. The
and private estates respectively15 percent and 13 percent to total
(A'DF-PNEC, 1995)h terms of production, the
rqistered an overall growth of
By: Aulia Tasman*)
Abstrak
Studi ini bernrjuan mengukur efisiensi teknis dan perubahanteknologi pada usahatani karet dan menguji determinan efiesiesi teknis.Pengumpulan data dilakukan di Kabupaten Batang Hari. Jambi, daripetani yang termasuk kepada kelompok tradisonal dan perkebunanpemerintah. Data cross seclion digunakan untuk mensimulasi perilakudata time series, yang didasarkan kepada potensi tanaman dan usiatanaman. Fungsi produksi translog frontir yang dimodifikasi disusununtuk mengestimasi efi seisnsi teknis.
Efisiensi teknis rata-rata (TE) masing-masingnya adalah 88.0yo, 87.90 dan 88.7 pada kelompok usia l, (7-13 tahun), 2 (14-17tahun) dan 3 (18-30 tahun). Didapat petani yang masing-masingnya29.|yo,27.7oA, dan 30.3% mencapai indeks TE 96% - 100% pada usia| , 2 dan 3. Artinya 69 .7% to 7 | .0o petani kurang efisien. Tapi banyakpetani yang memakai bibit lokal, sehingga diantara kelompok ini adasuatu campuran teknologi yang dapat membingungkan analisis.Program perbaikan efisiensi teknis harus difokuskan kepada petanikelompok 2 dimana didapat sekitar ll %o htng;a 15 % kemngkinanmeningkatkan hasil yang dapat membantu petani memperoleh hasilpotensil dari tanamannya.
3.0o/o per year, from 714,500 tons in 1980to about 1.0 million tons in 1993. On theoverall, production of governrrent estatesslightly increased by an average of 1.1%per year during the same'period, from186,000 tons in 1980 to 211,600 tons ini993. Production from the private estateshad increased at higher rate during the lastfive years, averaging..,,1,.jYo per year,although on the overall, productionincreased by an average of 3.7Yo per year,increasing from 120,000 tons in 1980 to183,000 tons in 1993.
*) Menyelesaikan pendidikan 53 di Filipina denganbidang ekonomi produksi Tahun 1998 . Aktif dalamberbagai penelitian di tingkat 'daerah.
dan Pembangunan, Volume 9, 1998 33

Bv tlpe of producers, the govemmentestates still had the lughest average yieldper hectare of 1,132 kilograms in 1993,reflecting a decline from 1989 to 1993 byaround 2.}oh per year. Yreld of the pnvateestates had
stabilized at around 1,100 kilograms perhectare dunng the last five years. Yield ofsrrrallholder was tl-re lowest at 639kiiograms, with slight improvement from itsfomrer level of 542 kilograms in 1980.Companng the yields among three type of
rubber fanning practices, the smallholderestates have the lowest yield. Severalquestions can therefore be raised such as:
(l) 'v\Ary is there a big difference betrveen theyields of the snrallholder compared to theyields of govemment and privateestates?
(2) What are the dominant factor sources oflower yield of the srnallholders?
(3) What factors determine the level oftechnical efficiency?
(.1) Are there any feasible and efficientsolutions to overcome these problems'?
To answer these problem, the str"rdyrvill be focused in one particular regenciesin Jambi province. The study will conduct acomparative analysis ',o the type of rubberfarrr,rng between the smallholder and thegovernrnent estates in Balang Hari rq,ency,rvhile the pnvate estates is not includedbecause the private estates for rubberplantation does not yet established in thisr€,ency.
This study aints to provideinformation to policy makers to be used infonriulating an appropriate policy. Theexpected set of infomration to be gatheredconsists of the elasticity of factor demand,output supply and production, as rvell aseconomic efficiency by region. Theknowledge of economic efficiency bycommodities is inlbnnation that can be usedfor optimal consolidation and effrcientallocation of existing resources in order tomaximize economic gain in rubber farming.if there is a significant difference of economrc
efficiencv among fanrlng practices. then thegovemment can set up differential extension.
education and training, as well as br-rdget
allocation policies to improve the economrc
effrciency and farmer welfare.Thegeneral objective of tlus research is to
assess the production nrodels in rubber
fanmng and based on the findings- developthe appropnate pohcy in inrprovrng fam.rerwelfare, and to l.neel other govemlrent
ob;ectives such as to increase employment
and farmer incorne. Specific ob.lectives of thisstudy are.
l. to denve the absolute technical efficiencvrelative to the best practice of individual
farmer of the plasma from the govemment
estates and the traditional smallholder
estates.
2. to estimate the average technicalefhciency for the overall fanners.
3. to analyze the nature of technologrcalchange.
4. to offer some appropriate policy'
implications relevance to the researcl.rfindings.
II REVIEW OF LITERATURE ANI)] \ IET[IODOLOGY
2.1 Construction of Life Tinre t\Iatrixof Perenrfal Crops
Precise estrrnation of econonilc paramelersnecessitates availability of data on prices andquantities of inputs and outputs for the enilrelit'e span of perennial crops, wilch in sonrecases exceeds many decades. ]Vloreover, Chand(1994) said that rnany inputs applied toperennial crops in one period affect the outputin following periods also. Any data collectedby conducting survey can cover only sonreyears of the total lifetime of such crops and itis nearly impossible to get data on lifetinreinput use, output and corresponding pricesfrom the farmers growing these crops,especially the farmers who do not keep famrrecords to supply such fast information. Thereare at least two main problems related toperennial crops. First, the consequences ofinputs applied in the initial period cannot be
Jumal ,\{anajemen dan PembangunAn, Volttnrc 9, 1998 34
seen directly for the next periods. Second, it rsdiffrcult to determine precisely the futureinputs and outputs.
Chand (1994) proposed other procedures/methodologies to study the economics ofperennial crops by constructing a lifetimematrix for a given data. The data on quantityand value ofinputs and output are obtained foreach age yearlgroup by dividing the total lifeof perennial crop in homogeneous periods.Based on these quantities, a single value ofeach parameter under study such as yield,return, profitability, etc. is obtained. Theadvantages ofthis approach are:(1) It gives complete information of output and
inputs, and the distribution for total life spanof perennial crop for each producing unitrather than getting a single value for eachvariable.
(2) The implicit restrictive assumption ofprevious approach is that in the past and infuture; the individual has the same value ofvariable and the restrictive assumptions canrelaxed.
(3) The statistical tools which require data onindividuaf observation can be applied.Similarly, the tools of production economicssuch as resource use efficiency, productionfunction analysis, factor share can also beapplied to analyze the production behavior.
(4) Estimates of expected cost of production,rcturn and profit can be obtained tbr individualunits based on total life span. Intuitively theestimates are expected to be more reliablesense compared to those obtained by using theprevious approaches.
The tools of economics as applicablein the case of annual crops cannot be applieddirectly as such in the case of perennial crops
Jumal Manajemen dan Pembangunon, Yolume 9, 1998
until these have been postulated into economicproblems. Precise estimation of economicparameters necessitates availability of data onprices and quantities of inputs and output forthe entire life span of the perennial crops ofmore than three years. Chand (1994) proposedan altemative mahodology to estimateproduction parameters by including someadditional variables in the production fimction.Let:o N the total life of perennial crops. n the units for each age year or age group. Sj the average of sub-sample at the jh year. \r the value of variable at the im sample
unit which belongs to jb year. K; the index for the value of variable for
individual i which is the unit of sub-samplein j the age year,
then the computation of the ratio (index)between the value of variable for the individualand sub-sample average is
Y , ,Ki=+(r)' ^S
where K; indicates that the value of variable Yfor ith unit is K; times the sample average.Thus it can be deduced that ib unit used K;times more input or produced K; times moreoutput compared to the average of the sample.Based on this, the missing values of variablefor ie unit in the past and the future life of theperennial crop can be obtained by rnultiplyingthe average value of eadr sub-sample by K;.The construction of *)e lifetime index is showr,in Table 3.1.
35
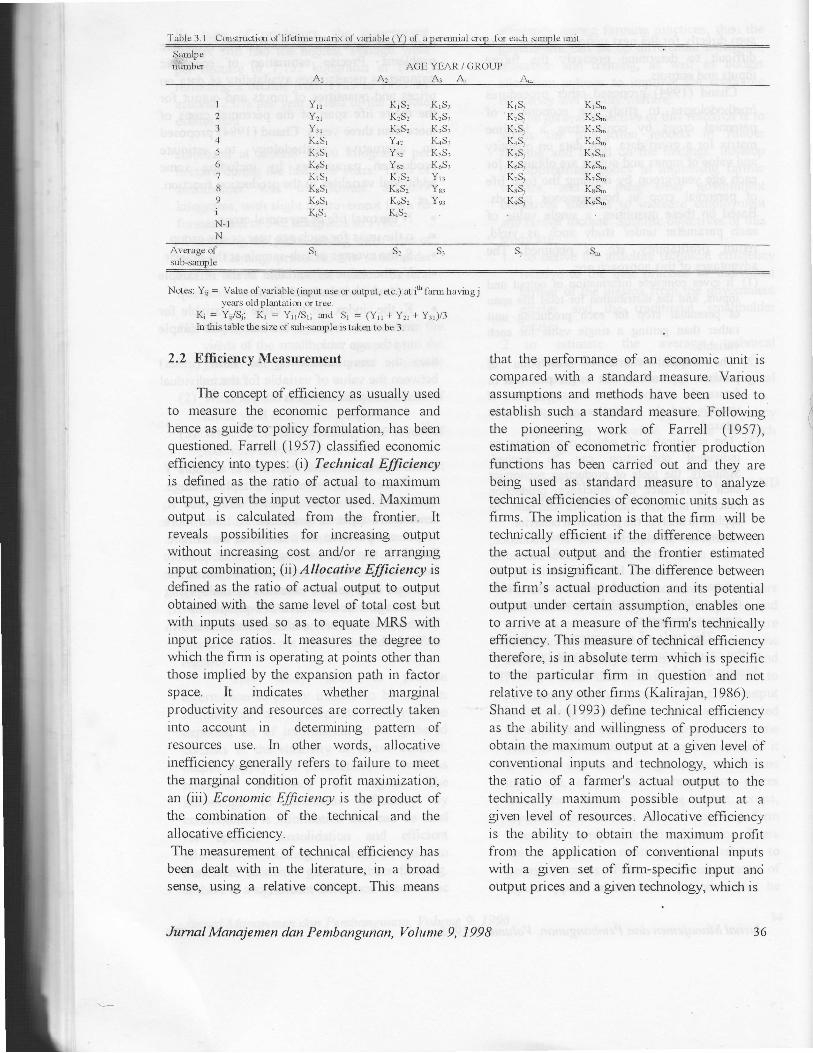
-l'sblc -l.l Ctlrsltclitr: ol hlailre narrr ol'r,mable (Y) tr1 a pclmial otp tirr eact sflple turit
Semlpetiiiurbs AGE YEAR / GITOUP
A.1 A.2 A. A' r\=
6789iN- lN
YrrY:,Y:,K.S,KsS,KoSrKrSlK"SrKgS,K,S,
Kr$K'$K..S.
KoSr
KiS;
KcS'
Kr$
KsSr
Kyg
KrLK:S-KrS-Kr$'K:S-KoS-KrS.KsS-KgS-
K,S: KIS:K:St KrS:KIS: KIS:Yr: KrSrY:: K.S:Yo: KcSrKrS: YrrK.S: Y*..KPS: Y"K;S:
Avcrage r{sub -sarrUr I e
S.
Notc: Y1; = Value of vrriuble (irrput use or output- e{c.) at in larn h:n,ing j
l,ers trld plartati()n 0r trce.
K; : Y; , iS; : K1 = Y11/S1: ard Sr = (Yrr + Y:r + Y1)/- lIn lhis table the size t!'srb-sxmole is take'n to be 3.
2.2 Effrciency Measureneut
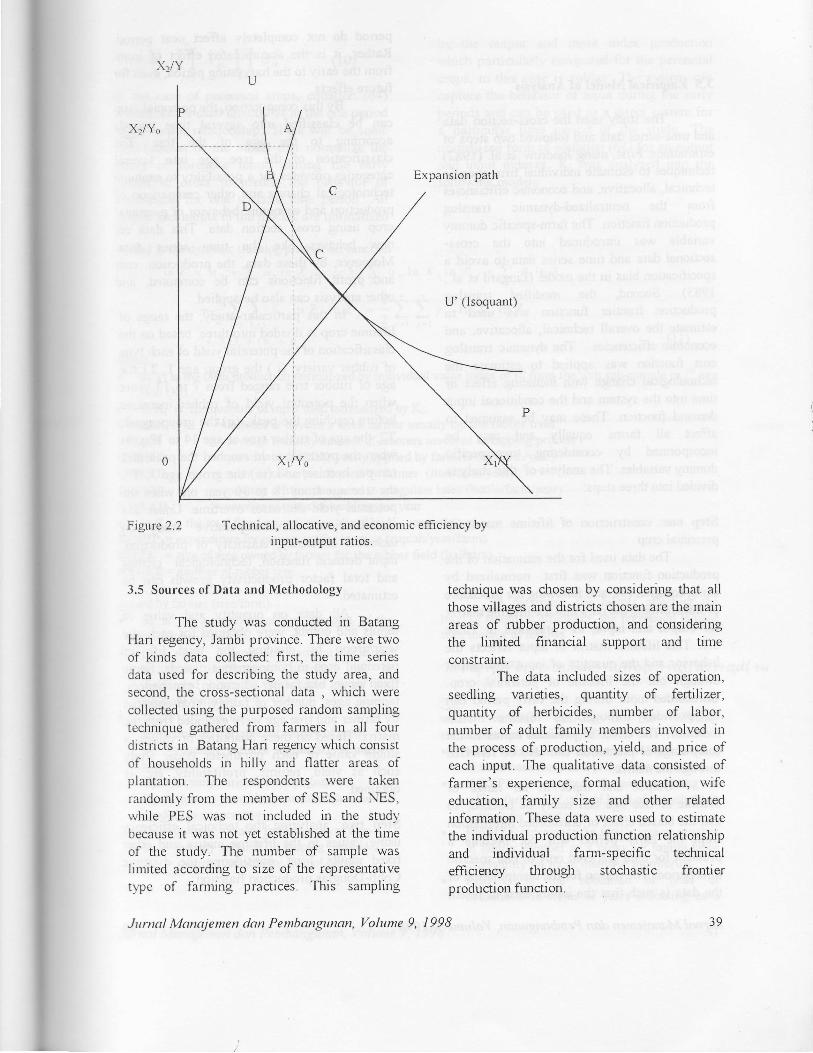
The concept of efficiency as usuaily usedto measure the economic perfonnance andhence as guide to policy fomrulation, has beenquestioned. Farrell (1957) classif,ed econonicefticiency into types: (r) Technicol Eficiencyis defined as the ratio of actual to maximunlolltput, glven the input vector used. IVlaxir-numoutplrt is calculated from the frontier. Itreveals possibilities for increasing outputwithout increasing cost and/or re arranglllginput combination; (i1) Allocotive Eficiency isdefined as the ratio of actual output to outputobtained with the sarne level of toial cost butrvith inputs used so as to equate IVIRS withinput pnce ratios. It measures the degree towtuch the firm is operating at points other thanthose implied by the expansion path in factorspace. lt indicates whether marginalproductivity and resollrces are correctly takeninto accorlnt in detern-rining pattent ofresources use. ln other words, allocativeinefficiency generally refers to failure to ureetthe margrnal condition of profit maxilnization,an (iii) Econonic Elfciency rs the product ofthe combination of the technical and theallocative efficiencyThe measurement of technical efficiency has
been dealt with in the literature. in a broadsense, using a relative concept. TlIs means
that the performance of an econonlic unit iscompared with a standard measure. Variousassllmptions and methods have been used toestablish such a standard measure. Followrngtlre pioneering work of Farrell (1951),estimation of econometnc frontier productionfunctions has been carried out and they arebeing used as standard measure to analyzetechnical efficiencies of economic units such asfirms. The implication is that the firm will beteclm;cally efficient if the difference betweenthe actual output and ihe frontier estimatedoutput is insiglrificant. The difference betweenthe finn's actual production and its potentlaloutput under certain assumption, enables oneto arnve at a measure of thefrrm's techrucallyefficiency. This measure of technical efficiencytherefore, is in absolute ternt which is specificto the particular firm in question and notrelative to any other finls (Kalirajan, 1986).Shand et al. (1993) define technical efficiencyas the ability and wrllingness of prodlrcers toobtain the maxinrun.l olltput at a glven level ofconventional inputs and technology, which isthe ratio of a farmer's actual outpllt to theteclrrucally maxinllrm possible output at agrven level of resources. Allocative efficiencyis the ability to obtain the maximunt profitfronr tire application of conventional inputswith a given set of firm-specific input ancioutprt prices and a glven technology, which is
Jurnal Manajenren dan Pembangunan, Volunte 9, 1998 36
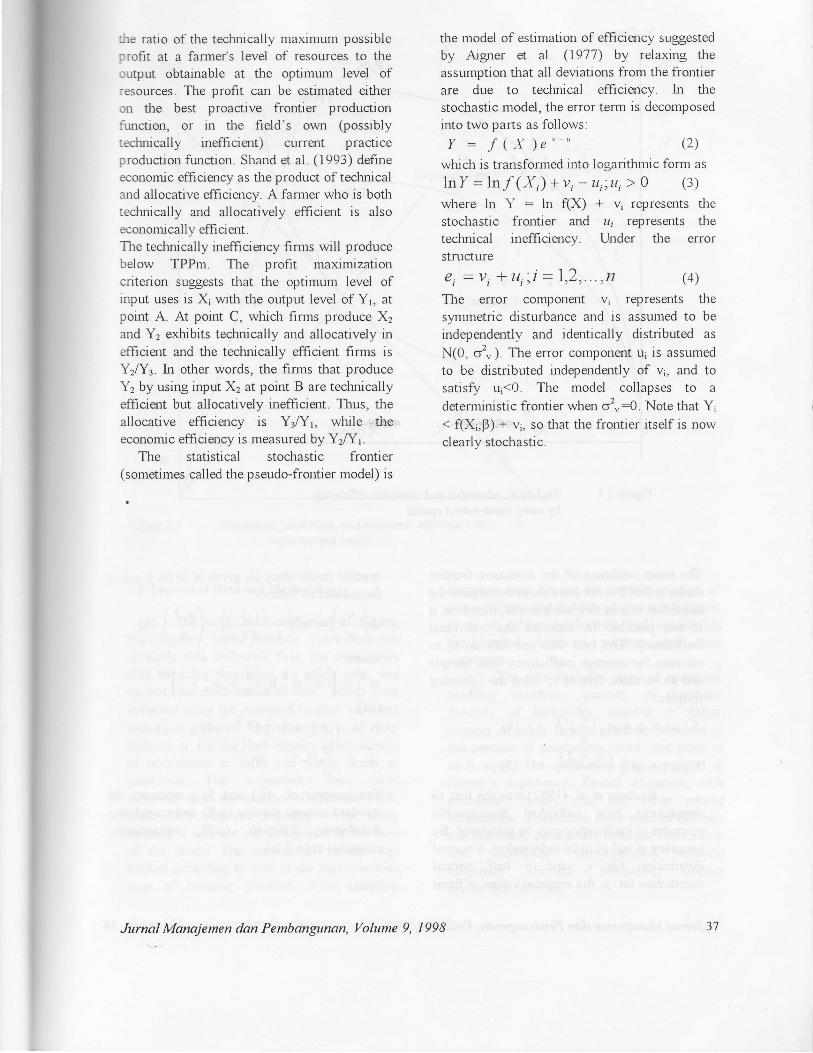
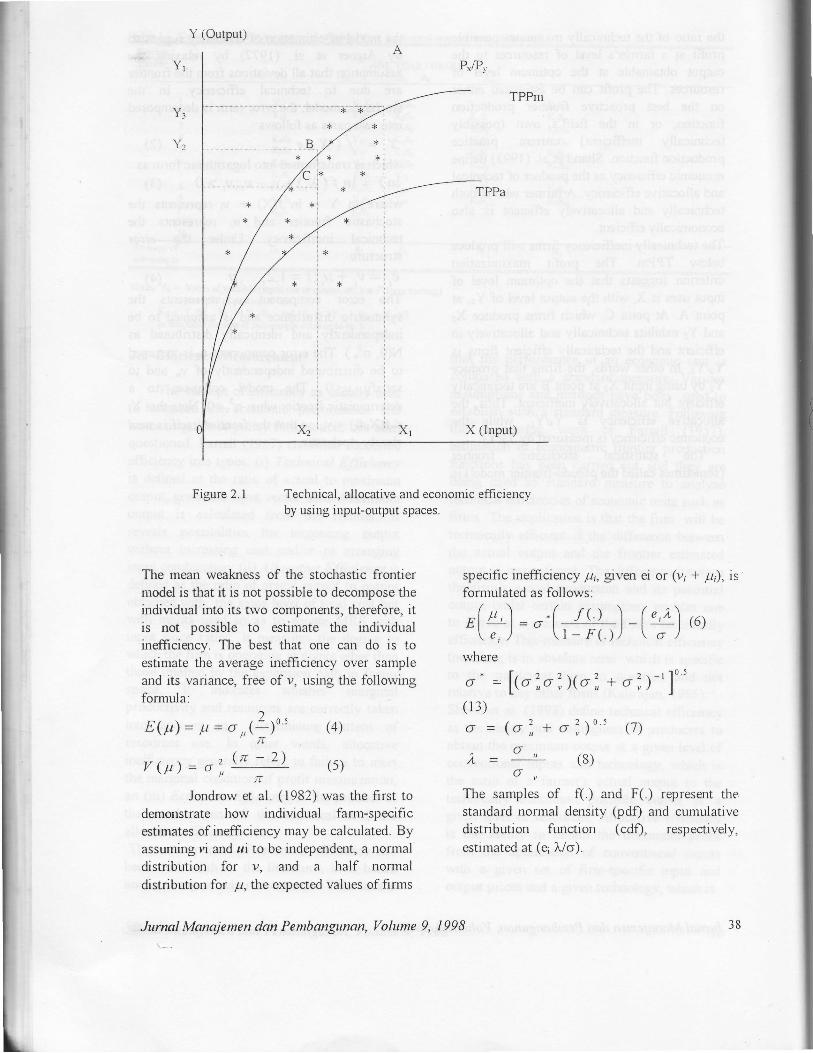
the ratio of the technically maximum possibleprofit at a farme/s level of resources to theouput obtainable at the optimum level ofresources. The profit can be estimated eitheron the best proactive frontier productionfirnction, or in the field's owrr (possiblytechnically inefficient) current practiceproduction function. Shand et al. (1993) defineeconomic effrciency as the product of technicaland allocative effrciency. A fanner who is bothtedrrically and allocatively effrcient is alsoeconomically effrci errt.The technically inefficiency firms will producebelow TPPm. The profit maximizationcriterion suggests that the optimum level ofinput uses is X1 with the output level of Y1, 2tpoint A. At point C, which fimrs produce X2and Yz exhibits technically and allocatively ineffrcient and the technically effrcient firms isYrNt.ln other words, the firms that produceY2 by using input X2 at point B are teclrricallyeffrcient but allocatively inefficient. Thus, theallocative efficiency is YtNs while :.tkeconomic effrciency is measured by YrlYr.
The statistical stochastic frontier(sometimes called the pseudo-frorrtier model) is
Jurnal Manajemen dan Pembangunan, Volume 9, I99B
the model of estimation of efficiency suggestedby Aigner et al. (1977) by relaxing theassumption that all deviations from the frontierare due to techmcal efficiency. In thestochastic model, the error term is decomposedinto two parts as follows.
Y = " f (X)s ' -u (2)
wllch is transformed into logarithmic form as
ln/ = lnf (X,) *vi - Lt i ;ui > o (3)
where ln Y : ln f(X) * vi represents thestochastic frontier and u; represents thetechnical ineffrciency. Under the errorstructure
€i =t i +\ t i ; i =1,2, . . . ,n (4)
The error component v; represents thesymmetric disturbance and is assumed to beindependently and identically distributed as
N(0, o2, ). The error component ui is assumedto be distributed independantly of vi, and tosatisfy ui<O. The model collapses to adaerministic frontier when o2,:9. Note that Yi< flXr;F)-+ v;, So th?t the frontier itself is nowclearlv stochastic.
) t
Y (Output)
The mean weakness of the stochastic frontiermodel is that it is not possible to decompose theindividual into its two components, therefore, itis not possible to estimate the individualinefficiency. The best that one can do is toestimate the average ineffrciency over sampleand its variance, free of v, using the followingformula:
Technical, allocative and economic efficiencyby using input-output spaces.
(4)
(s)
specific inefficiorcy li, given ei or (vi + p), isformulated as follows:
/ \ / . , , \ / a\
El ! - l = o ' [ r \ ' ) | - [ l l l rc>\e,) \ l -F() / \o)
where
o* = f {o: ,o?,)(o?, + 01)- ' lo '(1 3)o = (o?, + o1)ot (7)
)" = ou
(g)ou
The samples of f( ) and F(.) represent the
standard normal density (pdf) and cumulative
distribution function (cdfl, respectively,estimated at (ei 1,/6).
Figure 2.1
Il
)E(t i= l t=o, , ( : - )ot
( t r - 2)Y(p)- o i
Jondrow et al. (1982) was the first todemonstrate how individual farm-specificestimates of ineffrciency may be calculated. Byassuming li and rri to be independent, a normaldistribution for v, and a half normaldistribution for 7t, the expected values of firms
Jurnal Manajemen dan Penftangunan, Volume 9, 1998 38
x2/y
Figtre2.2 Technical, allocative, and economic efficiency byinput-olltput ratios.
3.5 Sources of Data and Methodology
The study was conducted in BatangHari regency, Jambi province. There were twoof kinds data collected: first, the time seriesdata used for describing the study area, andsecond, the cross-sectional data , which werecollected using the puqposed random samplingtechnique gathered from farmers in all fourdistricts in Batang Hari regency which consistof households in hilly and flatter areas ofplantatron. The respondents were takenrandornly frorn the member of SES and NES,while PES was not included in the studybecause it was not yet established at the timeof the study. The number of sample waslimited according to size of the representativetype of famring practices. This sampling
technique was chosen by considering that allthose villages and districts dtosen are the mainareas of rubber production, and consideringthe limited financial support and timeconstraint.
The data included sizes of operation,seedling varieties, quantity of fertilizer,quantity of herbicides, number of labor,number of adult family members involved inthe process of production, yield, and price ofeach input. The qualitative data consisted offarmer's experience, formal education, wifeeducation, family size and other relatedinformation. These data were used to estimatethe individual production function relationslupand individual fann-specific technicaleffrciency through stochastic frontierproduction funaion.
Jurnal Manajenren clan Pembangunan, Volume 9, 1998
3.5 Empirical Nlodel of Analysis
The study used the cross-section dataand tinre-series data and followed two steps ofestimations: First, using Jondrorv et al. (1982)techniques to estimate individual firm specifictechnical, allocative, and economic effi cienciesfrom the neutralized-dynarnic translogproduction function. The famr-specific dummyvanable was introduced into the cross-sectional data and time series data to avoid aspecification bias in the model (Lingard et al.,1983) Second, the modified translogproduction frontier function was used toestimate the overall technical, allocative, andeconomic effrciencies. The dynamic translogcost function was applied to estimate thetechnologcal change with including effect oftime into the system and the conditional inputdemand function. These may be assumed toaffect all farms equally and may beincorporated by considering time.specificdummy vanables. The analysis of this study rsdivided into three steps:
Step one. construction of lifetime rnatrix ofperennial crop
The data used for the es',in-ration of theproduction function was first normalized byusing equation (9), and following the procedureof transforming the data into the lifetime matnxfor output and input, as presented in Table3.1. This lifaime rnatrix of input reflects thebehavior and the quantity of input and outpntthrough out the lifetime of perennial crop.Unrecorded input during the early period canbe provided through the lifetime matrixindicator. The effect of previous inputs in theearly stage of plantation can also be reflectedthrough the matrix.
Output and input in all range ofiifetime of tree age can easily be tracked, sothat the biased effect of unrecorded informationfronr tle early period will not become aproblem for data gathered only in one specifictime period. The reason for the manipulation ofthe data is such that the inputs used in resent
penod do not completeh' affect next period.Ratl-rer, rt is the accurrrulated effect of inputfronr the early to the han esting penod. even forfuture effects.
By this computatron, the perennial cropcan be classified into several tirrre periodsaccording to the age of the tree. Theclassification of the tree age into severalcategories provides for a possibility to exanrinetecl-rnological change and other comparison ofproduction and econonlc behavior of perennialcrop r.rsing cross section data. Thrs data setnow behaves like the time senes data.Moreover, by these data- the production, costand profit functions can be computed, andother analysis can also be applied.
In this particular study, the range oflifetinre crop is divided into three, based on theclassification of the potential yield of each typeof rubber variety: (i ) the group age 1, Tl theage of rubber tree ranged from T to 13 yearswhen the potential yield of rubber increasesbefore reaching the pealg (ii) the group age 2,T2,the age of rubber tree at age 14 to 17 yearwhen the potential yield reached the peak at 2ton per hectare, and (iii) the group age 3, T3,the tree age from 18 to 30 year old when thepotential yield decreases overtime. Under thisclassification, the comparative study ontechnical effrciency, elasticity of production,input demand function, technologrcal changeand total factor productivity growth can beestimated.
All data on quantity and value ofinputs and output, were obtained for each ageyearlgroup by dividing the total life ofperennial crop in homoganeous penods. Somefixed inputs iike farmer education, experiences,tapping ages, number of farruly, area operatedby famrer and tree age were excluded frorn thematrix. Based on these quantities or values, asingle value of each pararneter under studysuch as yield, retums, profitability, etc. rsobtained.
Ste;l two: analyzing the technical effrcrencyusing values in tJre lifetinre matrix and otherfixed inputs. First, considering the dynamicCobb-Douglas production function
I
Jurnal Manajenren dan Penbangunan, Volunre 9, 1998 40