Embed Size (px)
Citation preview
Jurnal Kejuruteraan 29(2) 2017: 113-119
Measurement of Gas Hold up and Mass Transfer in a Bubble Column by Using Electrical Resistance Tomography (ERT)
(Kesan Pencampuran Cecair-Gas di dalam Turus Gelembung Menggunakan Teknik Keberintangan Tomografi Elektrik (ERT))
Nur Tantiyani Ali Othman* & Nur Syamimi WahidFaculty of Engineering & Built Environment, Universiti Kebangsaan Malaysia, Malaysia
ABSTRACT
Gas dispersion performance and gas hold-up in a bubble column was investigated by using electrical resistance tomography (ERT). Experiments were carried out to visualize flow pattern and gas hold-up at different gas velocity, type of impeller and speed of impeller. In this study, cylindrical bubble-column with a diameter of 13.5 cm and a height of 97.5 cm, made of glass that was mounted with four planes of 16 stainless steel electrodes are connected to an ITS P2000 ERT system. The column was equipped with perforated plate consisting of five holes and each has internal diameter of 3.0 mm. The effect of four parameters; gas flowrate, speed of impeller, 2 types of impeller; Rushton and Lightnin impeller, and three types of gas; oxygen, hydrogen and nitrogen gas on the gas dispersion performance in the bubble column were investigated. It was observed that the gas dispersion rate is increased with increasing gas density where the oxygen gas has the highest of dispersion gas rate as compared to the others gas. The gas hold-up was determined from the correlation method to estimate the transition velocity and dispersion of gas in a bubble column. The results showed that with increasing of the superficial gas velocity, the total gas hold-up increases. Besides, the gas hold-up increased due to decreasing of gas density. It can be concluding that the optimum mixing condition was obtained by using Lightnin A320 impeller with the speed rate at 250 rpm.
Keywords: Gas hold up; Electrical resistance tomography; Gas dispersion; Bubble column
INTRODUCTION
Industrial flow processes are complex in nature; often involve a variety of mixing components in a combination of gas, liquid and solid phases. Industrial mixing is a very important process as the quality of the final product will be derived by the quality of the mixing. If mixing process is not properly done, it will lead to a non-homogeneous product which lack in consistency (Williams et al. 1995). Therefore, it requires proper selection in the design to ensure that the result of the mixing is efficient and effective. Bubble column belong to the general class of multiphase reactors which consist of three main categories, namely the trickle bed (fixed or packed bed), fluidized bed and the bubble column. A bubble column is basically a cylindrical vessel with a gas distributor at the bottom. The gas is spurge in the form of bubbles into either a liquid phase or a liquid-solid suspension. Bubble column are generally referred to slurry bubble column reactors when a solid phase exists (Nigar et al. 2004). Hence, bubble column is the best choice for this type of reactor especially for chemical and biochemical field as its advantages in simplicity of the construction and maintenance, low power consumption, minimal space requirements due to the vertical design and effective mixing phase to improve the heat and mass transfer characteristics (Degaleesan et al. 2001; D´ıaz et al. 2007; Mayank et al. 2012 & Giorgio et al. 2017).
However, to get the optimum level and well-mixed process, many mechanical problems were detected. This is
due to difficulties in getting the equipment’s to monitor and measure the mixing (Kim et al. 2006). In other words, in the industrials practices, specifications and design of the mixing tank is based on empiricism and theory. This is because, the theoretical and calculation approaches are limited due to the mixing process itself which is very complex. It can give strength to the dependence of hydrodynamic and transport parameters in the system flow ranges. Hence, one of the effective phases mixing visualization technique is tomography which is a robust and powerful technique to visualize two dimensional (2D) and three dimensional (3D) conductivity image in a bubble column by using various types of sensor, electrodes and multiple planes placed at different distances and the same time free from radiology (Takriff et al. 2000; Kim et al. 2006 & Takriff et al. 2009). Process tomography (PT) technique is a new technique that has developed rapidly in recent years and which has great potential and wide industrial application prospect for direct characteristics analysis for multiphase flows (Warsito et al. 2001 & Beck et al. 1996). Electrical resistance tomography (ERT) is one kind of PT technique and has been proved to be a powerful tool for mapping the concentration and velocity distributions in two-phase flow (Jiang et al. 2007 & Wang et al. 2000).
This study focuses on the application of the ERT on the gas liquid mixing in the bubble column reactor. Experiments were carried out to investigate the gas dispersion performance, visualized the mixing pattern and determine the gas hold-up
Artikel 7.indd 113 16/03/2018 11:28:02
114
at different parameter such as gas velocity, type of impeller and velocities of impeller.
METHODOLOGY
EXPERIMENTAL SET-UP
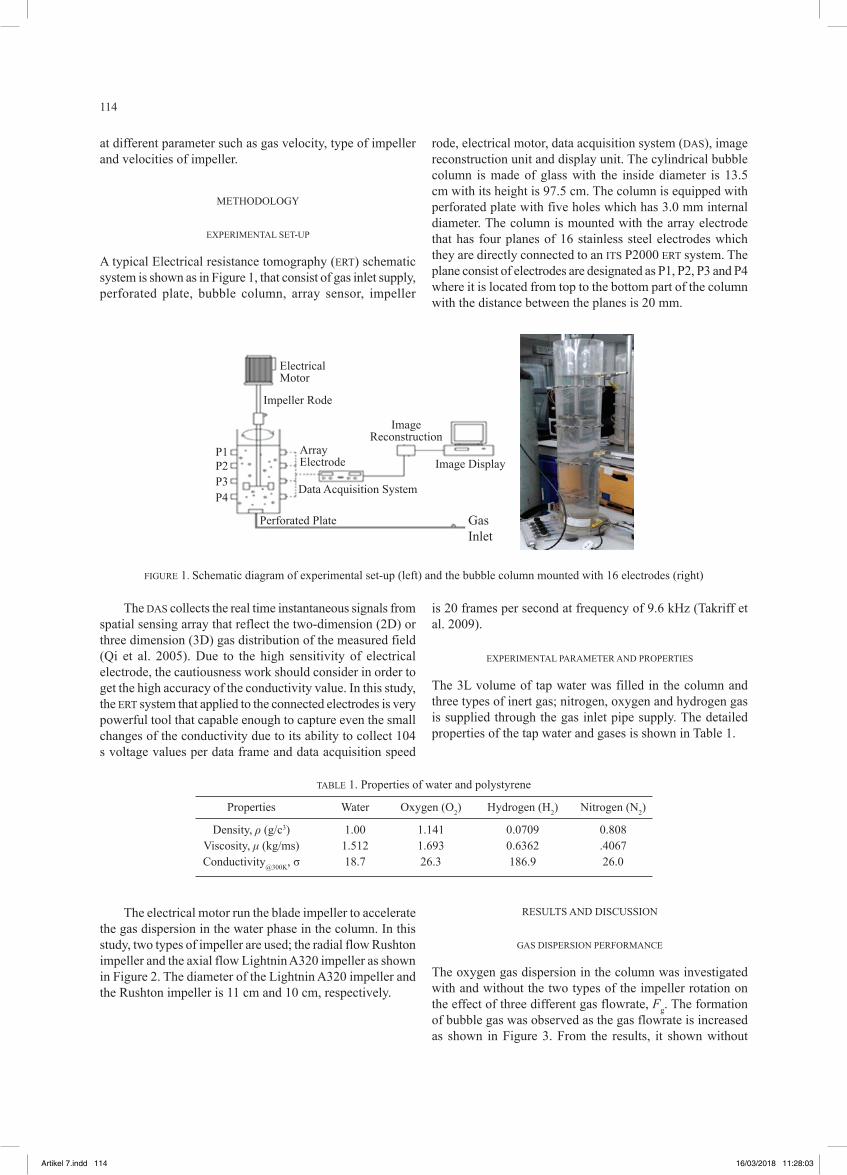
A typical Electrical resistance tomography (ERT) schematic system is shown as in Figure 1, that consist of gas inlet supply, perforated plate, bubble column, array sensor, impeller
rode, electrical motor, data acquisition system (DAS), image reconstruction unit and display unit. The cylindrical bubble column is made of glass with the inside diameter is 13.5 cm with its height is 97.5 cm. The column is equipped with perforated plate with five holes which has 3.0 mm internal diameter. The column is mounted with the array electrode that has four planes of 16 stainless steel electrodes which they are directly connected to an ITS P2000 ERT system. The plane consist of electrodes are designated as P1, P2, P3 and P4 where it is located from top to the bottom part of the column with the distance between the planes is 20 mm.
FIGURE 1. Schematic diagram of experimental set-up (left) and the bubble column mounted with 16 electrodes (right)
Electrical Motor
Impeller Rode
P1P2P3P4
ArrayElectrode
Image Reconstruction
Image Display
Data Acquisition System
Perforated Plate GasInlet
The DAS collects the real time instantaneous signals from spatial sensing array that reflect the two-dimension (2D) or three dimension (3D) gas distribution of the measured field (Qi et al. 2005). Due to the high sensitivity of electrical electrode, the cautiousness work should consider in order to get the high accuracy of the conductivity value. In this study, the ERT system that applied to the connected electrodes is very powerful tool that capable enough to capture even the small changes of the conductivity due to its ability to collect 104 s voltage values per data frame and data acquisition speed
is 20 frames per second at frequency of 9.6 kHz (Takriff et al. 2009).
EXPERIMENTAL PARAMETER AND PROPERTIES
The 3L volume of tap water was filled in the column and three types of inert gas; nitrogen, oxygen and hydrogen gas is supplied through the gas inlet pipe supply. The detailed properties of the tap water and gases is shown in Table 1.
TABLE 1. Properties of water and polystyrene
Properties Water Oxygen (O2) Hydrogen (H2) Nitrogen (N2)
Density, ρ (g/c3) 1.00 1.141 0.0709 0.808 Viscosity, μ (kg/ms) 1.512 1.693 0.6362 .4067 Conductivity@300K, σ 18.7 26.3 186.9 26.0
The electrical motor run the blade impeller to accelerate the gas dispersion in the water phase in the column. In this study, two types of impeller are used; the radial flow Rushton impeller and the axial flow Lightnin A320 impeller as shown in Figure 2. The diameter of the Lightnin A320 impeller and the Rushton impeller is 11 cm and 10 cm, respectively.
RESULTS AND DISCUSSION
GAS DISPERSION PERFORMANCE
The oxygen gas dispersion in the column was investigated with and without the two types of the impeller rotation on the effect of three different gas flowrate, Fg. The formation of bubble gas was observed as the gas flowrate is increased as shown in Figure 3. From the results, it shown without
Artikel 7.indd 114 16/03/2018 11:28:03
115
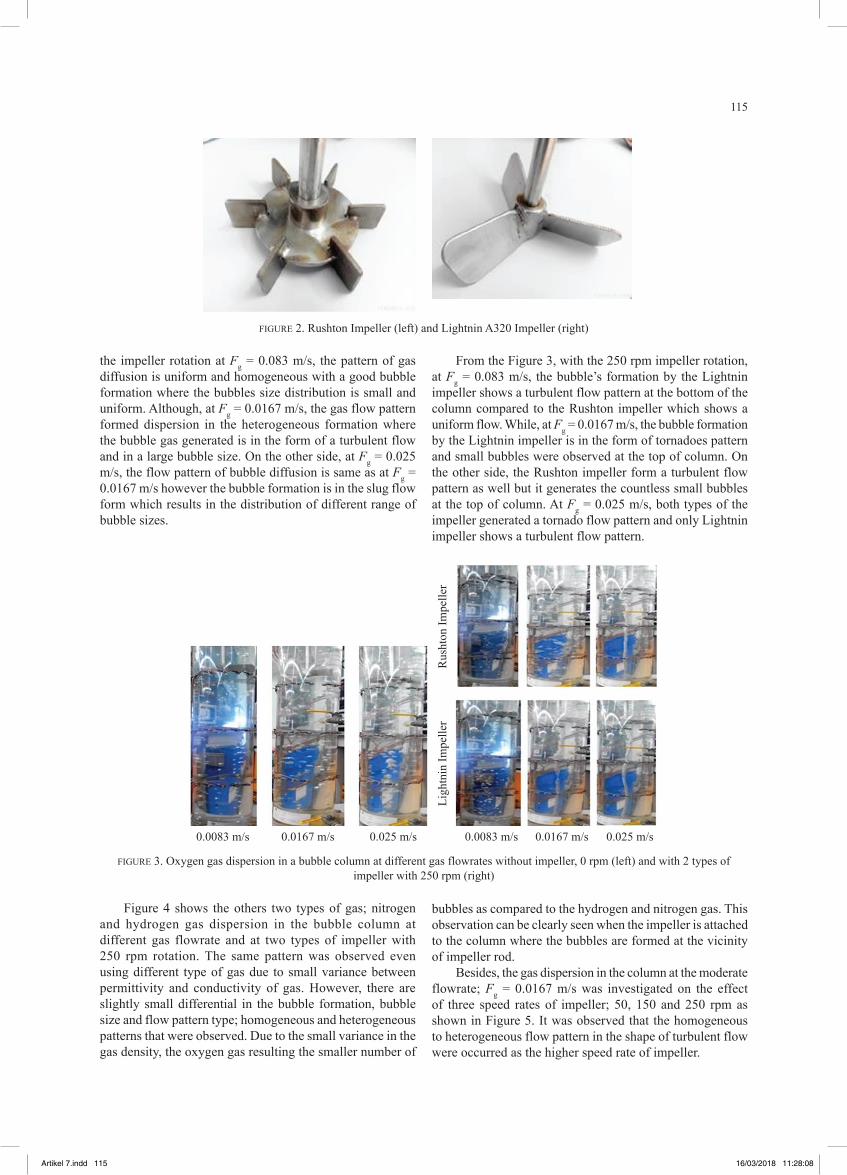
FIGURE 2. Rushton Impeller (left) and Lightnin A320 Impeller (right)
the impeller rotation at Fg = 0.083 m/s, the pattern of gas diffusion is uniform and homogeneous with a good bubble formation where the bubbles size distribution is small and uniform. Although, at Fg = 0.0167 m/s, the gas flow pattern formed dispersion in the heterogeneous formation where the bubble gas generated is in the form of a turbulent flow and in a large bubble size. On the other side, at Fg = 0.025 m/s, the flow pattern of bubble diffusion is same as at Fg = 0.0167 m/s however the bubble formation is in the slug flow form which results in the distribution of different range of bubble sizes.
From the Figure 3, with the 250 rpm impeller rotation, at Fg = 0.083 m/s, the bubble’s formation by the Lightnin impeller shows a turbulent flow pattern at the bottom of the column compared to the Rushton impeller which shows a uniform flow. While, at Fg = 0.0167 m/s, the bubble formation by the Lightnin impeller is in the form of tornadoes pattern and small bubbles were observed at the top of column. On the other side, the Rushton impeller form a turbulent flow pattern as well but it generates the countless small bubbles at the top of column. At Fg = 0.025 m/s, both types of the impeller generated a tornado flow pattern and only Lightnin impeller shows a turbulent flow pattern.
FIGURE 3. Oxygen gas dispersion in a bubble column at different gas flowrates without impeller, 0 rpm (left) and with 2 types of impeller with 250 rpm (right)
0.0083 m/s 0.0167 m/s 0.025 m/s 0.0083 m/s 0.0167 m/s
Ligh
tnin
Impe
ller
Rus
hton
Impe
ller
0.025 m/s
Figure 4 shows the others two types of gas; nitrogen and hydrogen gas dispersion in the bubble column at different gas flowrate and at two types of impeller with 250 rpm rotation. The same pattern was observed even using different type of gas due to small variance between permittivity and conductivity of gas. However, there are slightly small differential in the bubble formation, bubble size and flow pattern type; homogeneous and heterogeneous patterns that were observed. Due to the small variance in the gas density, the oxygen gas resulting the smaller number of
bubbles as compared to the hydrogen and nitrogen gas. This observation can be clearly seen when the impeller is attached to the column where the bubbles are formed at the vicinity of impeller rod.
Besides, the gas dispersion in the column at the moderate flowrate; Fg = 0.0167 m/s was investigated on the effect of three speed rates of impeller; 50, 150 and 250 rpm as shown in Figure 5. It was observed that the homogeneous to heterogeneous flow pattern in the shape of turbulent flow were occurred as the higher speed rate of impeller.
Artikel 7.indd 115 16/03/2018 11:28:08

116
FIGURE 4. Nitrogen and hydrogen gas dispersion in bubble column at different gas flowrate and types of impeller with
250 rpm rotation.
Rus
hton
Impe
ller
Ligh
tnin
Impe
ller
0.0083 m/s 0.0167 m/s 0.025 m/s
FIGURE 5. Gas dispersion in the column at Fg = 0.0167 m/s at three speed rates of impeller; 50, 150 and 250 rpm.
Rus
hton
Impe
ller
Ligh
tnin
Impe
ller
50 rpm 150 rpm 250 rpm
FIGURE 6. Tomography images of oxygen, nitrogen and hydrogen gas dispersion at three different gas flowrates; Fg and two types of impeller at t = 75 s with the impeller rotation is 250 rpm using ERT system.
Ligh
tnin
Impe
ller
Rus
hton
Impe
ller
Pane
l 1Pa
nel 2
Pane
l 3Pa
nel 4
Oxygen gas Nitrogen gas Hydrogen gas
FLOW PATTERN OF GAS DISTRIBUTION
By using ERT system, the tomography image of gases dispersion in the column at time mixing of 75 seconds at three different gas flowrates; Fg are visualized as shown in Figure 6. The bar color range from blue to red color where the red color represents the high conductivity (only water content), the blue represents the low conductivity (only gas content) and the
green color represent the well mixed of gas-liquid dispersion in the bubble column. The array electrodes at four panels; P1, P2, P3 and P4 capture the conductivity value that represent the ability of gas dispersion in the water. In this study, only the gas dispersion at the panel 3 and 4 were discussed in details in order to investigate the effect of impeller rotation on the gas dispersion where the impeller blade located clearly in the area of panel 3 and 4 (refer Figure 1).
Artikel 7.indd 116 16/03/2018 11:28:13
117
Once at impeller speed rotation 250 rpm, different shades of tomography images can be seen for both impellers. It was observed the mixing process of the oxygen gas with tap water in Figure 6 achieved the optimal level for all three gases feed velocity as the Lightnin A3200 impeller is applied (tomography image indicates with yellow and orange color). The gas spreads in all parts of the bubble column compared with the Rushton impeller. This tomography image indicates that for oxygen-tap water mixing, using the Lightnin impeller is more effective than using the Rushton impeller. It is because the shape and design of Lightnin impeller blade which is wider and sharper that help to distributed and spread the homogeneous gas around the column.
The dispersion of nitrogen gas in the column almost reached the optimum level when using both types of the impellers. The Lightning impeller provides the best gas dispersion at 0.025 m/s as compared to the others.Yet, both impellers cannot achieve the best mixing for the hydrogen gas dispersion due to the very low density; ρ = 0.08342 kg/m3, resulting in the longer time required for the dispersion to be occurred.
GAS HOLD-UP
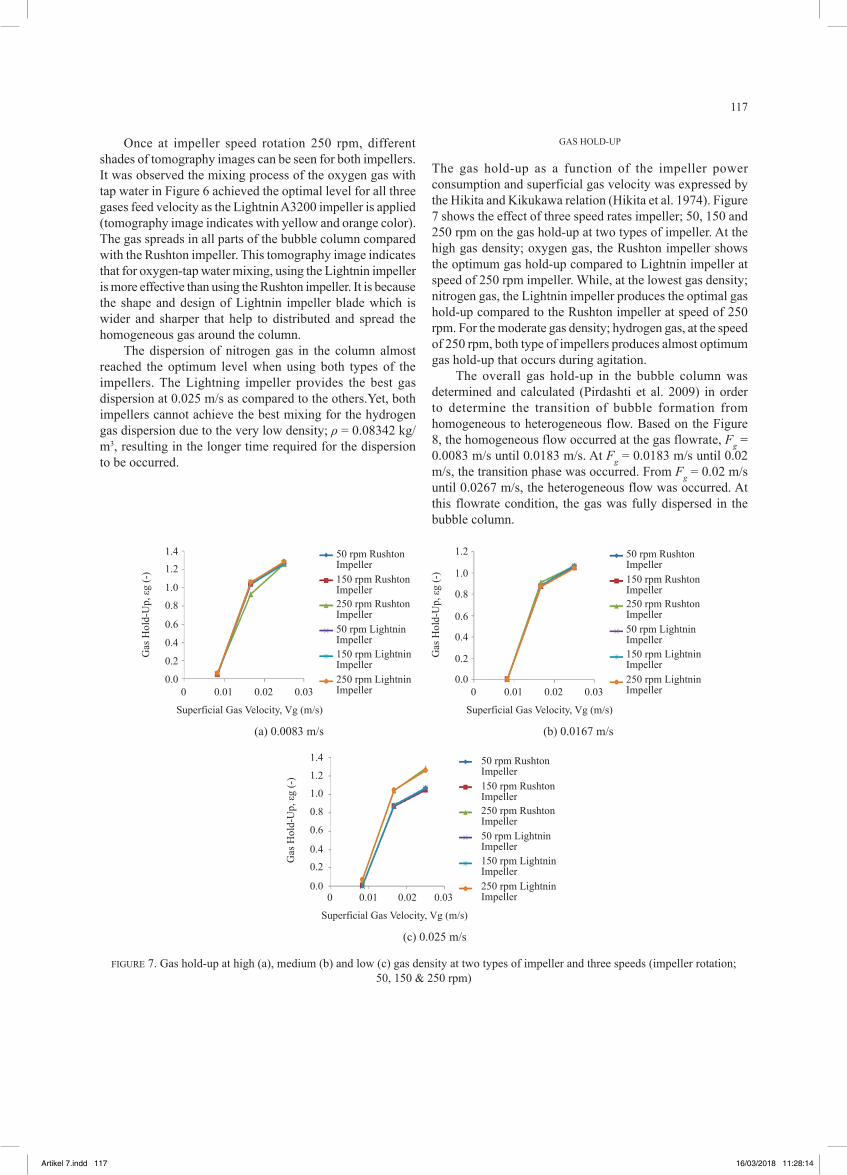
The gas hold-up as a function of the impeller power consumption and superficial gas velocity was expressed by the Hikita and Kikukawa relation (Hikita et al. 1974). Figure 7 shows the effect of three speed rates impeller; 50, 150 and 250 rpm on the gas hold-up at two types of impeller. At the high gas density; oxygen gas, the Rushton impeller shows the optimum gas hold-up compared to Lightnin impeller at speed of 250 rpm impeller. While, at the lowest gas density; nitrogen gas, the Lightnin impeller produces the optimal gas hold-up compared to the Rushton impeller at speed of 250 rpm. For the moderate gas density; hydrogen gas, at the speed of 250 rpm, both type of impellers produces almost optimum gas hold-up that occurs during agitation.
The overall gas hold-up in the bubble column was determined and calculated (Pirdashti et al. 2009) in order to determine the transition of bubble formation from homogeneous to heterogeneous flow. Based on the Figure 8, the homogeneous flow occurred at the gas flowrate, Fg = 0.0083 m/s until 0.0183 m/s. At Fg = 0.0183 m/s until 0.02 m/s, the transition phase was occurred. From Fg = 0.02 m/s until 0.0267 m/s, the heterogeneous flow was occurred. At this flowrate condition, the gas was fully dispersed in the bubble column.
1.4
1.2
1.2
1.01.0
0.80.8
0.60.6
0.4 0.4
0.2 0.2
0.0 0.00 00.01 0.010.02 0.020.03 0.03
50 rpm RushtonImpeller
50 rpm RushtonImpeller
150 rpm RushtonImpeller
150 rpm RushtonImpeller
250 rpm RushtonImpeller
250 rpm RushtonImpeller
50 rpm LightninImpeller
50 rpm LightninImpeller
150 rpm LightninImpeller
150 rpm LightninImpeller
250 rpm LightninImpeller
250 rpm LightninImpeller
Superficial Gas Velocity, Vg (m/s)
(a) 0.0083 m/s (b) 0.0167 m/s
Superficial Gas Velocity, Vg (m/s)
Gas
Hol
d-U
p, ε
g (-
)
Gas
Hol
d-U
p, ε
g (-
)
FIGURE 7. Gas hold-up at high (a), medium (b) and low (c) gas density at two types of impeller and three speeds (impeller rotation; 50, 150 & 250 rpm)
(c) 0.025 m/s
1.2
1.4
1.0
0.8
0.6
0.4
0.2
0.00 0.01 0.02 0.03
50 rpm RushtonImpeller150 rpm RushtonImpeller250 rpm RushtonImpeller50 rpm LightninImpeller150 rpm LightninImpeller250 rpm LightninImpeller
Superficial Gas Velocity, Vg (m/s)
Gas
Hol
d-U
p, ε
g (-
)
Artikel 7.indd 117 16/03/2018 11:28:14

118
FIGURE 9. Optimization condition of mixing time and gas dispersion
Mix
ing
Tim
e (s
)Mixing Tim
e (s)
A: Impeller Velocity (rpm)B: Superficial Gas Velocity (m/s)
CONCLUSION
The gas dispersion performance and the flow pattern in the bubble column were investigated with the effect of gas flowrate, different type of impeller, speed rate of impeller and type of gas. The pattern of mixing profile of the gas
dispersion in the tap water was visualized by the electrical resistance tomography (ERT) system. The result shows the optimum time for the mixing process to occur is at the speed rate of impeller is at 150 rpm and the gas flowrate at Fg = 0.001375 m/s.
FIGURE 8. Overall gas hold-up in the bubble column
0.10.090.080.070.060.050.040.030.020.01
0
0.000
00.0
083
0.010
00.0
1170.0
133
0.015
00.0
167
0.018
30.0
200
0.021
70.0
233
0.025
00.0
267
Superficial Gas Velocity, Vg (m/s)
Gas
Hol
d-U
p, ε
g (-
)
OPTIMUM GAS MIXING CONDITION
The optimum mixing condition and gas dispersion were analyzed using Design-Expert software (DOE++) 10.0.4 Synthesis in ReliaSoft software Launcher 10 (Stat-Ease, Minneapolis, US). In this study, the shape of analysis is 2LF (2 level factorial), quadratic and cubic. As for the type of statistical analysis it is based on the analysis of variance (ANOVA©), response surface plot 3D contour plot and plot
the cube. The resulting graph in three dimensional (3D) was shown in Figure 9. It was illustrating the effect of the relationship of gas flowrate and speed rate of impeller rotation on the gas dispersion and mixing time. It shows the speed rate of impeller and the gas flowrate is in the inversely proportional to the mixing time. From the result, the optimum time for the mixing process to be occurred is when the rate speed of impeller is at 150 rpm and the gas flowrate at Fg = 0.001375 m/s.
Artikel 7.indd 118 16/03/2018 11:28:22
119
ACKNOWLEDGEMENT
The authors are grateful to the Faculty of Engineering and Built Environment UKM, the research grant; DPP-2015-FKAB (Dana Penyelidikan dan Pengurusan) and the GGPM-2014-039 (Dana Penyelidikan Muda), for supported this study.
REFERENCES
Beck, M. S. & Williams, R. A., Meas. 1996. Process tomography: European innovation and applications. Measurement Science Technology 7(3): 215-224.
D´ıaz, M. E., Iranzo, A., Cuadr, D., Barbero, R., Montes, F. J. & Gal´an, M. A. 2007. Numerical simulation of the gas–liquid flow in a laboratory scale bubble column: Influence of bubble size distribution and non-drag forces. Chemical Engineering Journal 139: 363-379.
Degaleesan, S., Dudukovic, M. & Pan, Y. 2001. Experimental study of gas induced liquid-flow structures in bubble columns. AIChE J. 47: 1913-31.
Giorgio, B., Fabio, I., Giorgia, D. G. & Laura, A. P. 2017. Gas holdup and flow regime transition in spidersparger bubble column: Effect of liquid phase properties. Journal of Physics: Conference Series 796: 012041.
Hikita, H. & Kikukawa, H. 1974. Liquid phase mixing in bubble columns, Effect of liquid properties. Chem Eng: 8: 191-197.
Jiang, H., Wang, M. & Williams, R. A. 2007. Measurement of gas holdup profiles in a gas liquid concurrent bubble column using electrical resistance tomography. Chem Eng. J. 130(6): 179-185.
Kim, S., Andre, N. N. & Dyakowski, T. 2006. Measurement of mixing of two miscible liquids in a stirred vessel with electrical resistance tomography. Heat and Mass Transfer 33: 1088-1095.
Mayank, S., Anton, A. K., Edwin, Z., John, V. D. S. & André, B. de H. 2012. Gas holdup, axial dispersion, and mass transfer studies in bubble columns. Ind. Eng. Chem. Res. 51(43): 14268-14278.
Nigar, K., Fahir, B., Kutlu, O. & Ulgena. 2004. Bubble column reactor. Process Biochemistry 40: 2263-2283.
Pirdashti, M. & Kompany, R. 2009. Effects of height to diameter ratio and aeration rate on liquid mixing and hydrodynamic properties in a bubble column. Iranian Journal of Chemical Engineering 6(3): 46-56.
Qi, G. H., Dong, Y. B., Xu, M. M., Wu & Hu, J. 2005. Gas/liquid two phase flow regime identification in horizontal pipe using support vector machines. Proceedings of the 4th International Conference on Machine Learning and Cyberneticsr. Aug. 18-21, Guangzhou. 1746-1751.
Takriff, M. S., Hamzah, A. Z., Kamaruddin, S. K. & Abdullah, J. 2009. Electrical resistance tomography investigation of gas dispersion in gas- liquid mixing in an agitated vessel. Journal of Applied Sciences 9(17): 3110-3115.
Takriff, M. S., Penney, W.R. & Fasano, J.B. 2000. Effect of impeller diameter to vessel diameter ratio on gas holdup. Jurnal Kejuruteraan 12: 75-80.
Wang, M., Dorward, A. & Mann, R. 2000. Measurements of gas-liquid mixing in a stirred vessel using electrical resistance tomography (ERT). Chemical Engineering and Biochemical Engineering Journal 77(4): 93-98.
Warsito, W. & Fan, L. S. 2001. ECT studies of gas-solid fluidized beds of different diameters. Chem. Eng. Sci. 56(11): 6455-6462.
Williams, R. A., Jia, X. & McKee, S.L. 1995. Development of slurry mixing models using resistance tomography. Powder Technol. 87: 21-27.
*Nur Tantiyani Ali OthmanDepartment of Chemical and Process EngineeringFaculty of Engineering & Built EnvironmentUniversiti Kebangsaan Malaysia, Malaysia
Nur Syamimi Wahid Department of Chemical and Process EngineeringFaculty of Engineering & Built EnvironmentUniversiti Kebangsaan Malaysia, Malaysia
*Corresponding author; email: [email protected]
Received Date: 1st August 2017Accepted Date: 28th November 2017In Press date: 15th December 2017Published date: 31st December 2017
Artikel 7.indd 119 16/03/2018 11:28:22

Artikel 7.indd 120 16/03/2018 11:28:22

![Dissolved Gas Flotation – Bubble Benefits.ppt Gas.pdfTitle Microsoft PowerPoint - Dissolved Gas Flotation – Bubble Benefits.ppt [Compatibility Mode] Author Ghanim Created Date](https://img.pdfslide.us/doc/110x75/5e36a195a6c1c809f93fe375/dissolved-gas-flotation-a-bubble-gaspdf-title-microsoft-powerpoint-dissolved.jpg)