Embed Size (px)
Citation preview
OMMI, Vol.4, Issue 3, December 2007 www.ommi.co.uk
Measurement of Damaging Thermal Transients on F-Class Horizontal HRSGs
Michael Pearson, J. Michael Pearson & Associates, Ontario Canada
Robert Anderson, Progress Energy Corporation, USA
Michael (Mike) Pearson
Mechanical engineer working in the fields of power generation equipment design and
operation for 44 years. His experience includes design of major equipment for steam and
power generation, engineering, installation, commissioning - startup and operation of
large power plant units for both conventional coal fired and gas fired F-class combined
cycle plants required to commence regular two-shift operation immediately after plant
take over. Mike currently provides technical consultation services regarding power
generation equipment and systems as President of J. Michael Pearson & Associates.
Robert (Bob) Anderson Bob Anderson is a mechanical engineer working in the fields of power generation plant
maintenance, operation and procurement for 33 years. He is currently Manager of
Combined Cycle Services for Progress Energy Corp - a publicly owned electric utility.
He has served in a wide range of roles, including boiler engineering, steam- and
combustion-turbine maintenance, due diligence assessment, CT-based and conventional
plant management, and corporate-level management. For the last several years, Bob has
volunteered additional time in the professions, serving as Chairman of the US based
HRSG User's Group and chairing HRSG technical meetings in the UK for groups such as
IMechE and ETD.
Notes: 1) This is the edited version of the paper originally presented at: ETD International
Seminar on Cyclic Operation of Heat Recovery Steam Generators (HRSGs), 24
June 2005, London.
2) This Paper should be read in conjunction with the presentation (showing changes
in component temperature in an animated form) that accompanies this paper.
1 Introduction Over the past 10 years, numerous technical papers and journal articles have been
published documenting end-user experience and explaining why some of the common
practices in today’s heat-recovery steam generator (HRSG) industry can cause premature
and substantial pressure parts damage. These detrimental practices—employed by most
of the HRSG manufacturers, combustion turbine (CT) suppliers, and balance-of-plant
designers—include design norms for equipment and piping systems, as well as operating
procedures for plant startup and shutdown.
This unsatisfactory situation is not solely a failing on the part of the designers of the
major equipment and balance of plant. Primary responsibility for this situation arguably
rests collectively with the industry’s owners. Despite many new plants incurring
substantial unforeseen O&M costs to repair very premature damage and/or having been
required to install design modifications during early operation, many owners continue to
be obsessed with lowest installed cost and high thermodynamic efficiency when

OMMI, Vol.4, Issue 3, December 2007 www.ommi.co.uk
2
purchasing new combined cycle units. Many owners presume that design codes will
ensure that HRSGs will have adequate thermal flexibility to survive whatever operating
regime is imposed on the plant without adversely impacting its reliability and durability.
Unfortunately, none of the boiler design codes address some of the more severe sources
of thermal fatigue addressed in this paper.
Since the early 1980s remarkable improvements were achieved in thermal flexibility,
availability and reduction in forced outage rates by some of the extensively cycled
conventional coal and oil fired generating plants. These improvements were driven by
recognition within the ranks of utility purchasers’ that the high costs of unavailability in
high merit generating plant is a substantial O&M cost, and that moderate increases in
installation capital cost paid off very quickly in lower short term and long term O&M
costs. Periods of unavailability and repair costs are expected to be significantly higher
for HRSGs than for repair of equivalent pressure part failures in conventional boilers
since direct access to many pressure parts is severely restricted in horizontal gas path
HRSGs. It is also expected that a significant number of secondary failures in otherwise
sound pressure parts will occur due to the necessity to remove, replace and otherwise
disturb them to gain access to the primary failure site. This will further add to HRSG
unreliability and O&M costs as compared to conventional boilers. Finding the optimum
balance between installed cost and unavailability cost in part requires experienced,
skillful engineering judgment early in a projects development and design. For units
expected to cycle, it is especially short-sighted to utilize the fact that both of these
resources, personnel and time, add cost to “fast track” projects as an excuse for
neglecting to make such crucially important informed judgments.
Many of the publications of the past 10 years provided convincing quantitative data to
support their conclusions and recommendations. Although these publications have raised
awareness and sparked some progress in industry practice, skepticism remains among
those who believe the concerns have been overstated. Operating experience already
indicates the converse, and there are now growing concerns for the medium and long
term durability of many HRSGs when they are cycled.
A recent EPRI presentation *13
highlighted that thermal fatigue has now taken over as the
leading cause of reported tube failures, followed by FAC, corrosion fatigue and then
under deposit corrosion. Many of the reported thermal fatigue and corrosion fatigue
failures occurred on HRSGs that had completed significantly less than 10% of the starts
that a cycled HRSG might be expected to complete. As more units are cycled and
HRSGs begin to accumulate larger numbers of shutdown-startup cycles it is inevitable
that unavailability and difficult–to-access repairs of tubes at header attachment welds will
become substantial O&M problems. Those who choose to take a more proactive
approach than has been the pattern to date towards early diagnosis of potential sources
and locations for thermal fatigue failures in HRSGs, and then modifying the design and
methods of operation during starts and shutdowns to mitigate or eliminate those sources
of cyclic thermal forces and stresses before substantial damage has already accumulated,
will avoid some of these negative consequences.
This paper provides yet more evidence of severe HRSG damage caused by common
industry practices. The paper includes many recommendations for practical design

OMMI, Vol.4, Issue 3, December 2007 www.ommi.co.uk
3
modifications and changes to operating methods during startups and shutdowns that will
mitigate or eliminate the damage. Most have been made before in previous referenced
publications but many owners appear to have decided to defer implementation of
modifications until failures become more frequent. All of the concerns addressed in this
paper relate to thermally induced fatigue failure mechanisms, which cause localized
plasticity damage that cannot be reversed. Thus, by delaying implementation of
modifications until the predicted failures begin to occur, the fatigue life of many tubes
will be close to exhaustion and it will be too late to avoid more widespread tube failures.
Based on extensive tube-temperature measurements made on an “F-class” HRSG, this
study focuses on the severity of the temperature differences and associated thermal-
mechanical forces and stresses that transiently occur during CT/HRSG starts and
shutdowns, and also during certain on-load operating conditions.
The study provides additional data and confirms the severity of several previously
identified sources of thermal-mechanical forces and stresses associated with significant
temperature differences between individual tubes that were designed to operate at similar
temperatures (subsequently referred to as tube-temperature anomalies).
• Thermal stresses caused by row-to-row temperature differences during startups or
stable operation on load, which occur in some designs of horizontal gas path
HRSG in HP superheaters (HPSH) and/or reheaters RH (refer to sections 3.1 and
3.2).
• Condensate migration in HPSHs and RHs, which is difficult or impossible to
detect without attaching thermocouples to many tubes, and is very likely present
during startups in most installed designs of horizontal gas path HRSG (refer to
Section 3.3).
• Thermally driven support load transfer in economizers and preheaters of unvented
design caused by tube-to-tube temperature differences in tubes of the same row
attributed to perpetual flow stagnation over the entire load range caused by
unvented air or vapor blockage of the upper hairpin bends of some tubes (refer to
sections 4.1 and 4.2).
• Transient tube temperatures anomalies at inlet to economizers/preheaters caused
by mal-distribution of feedwater between tubes at low feed flow demand (refer to
sections 4.1 and 4.2).
All of the foregoing problems have been discussed in previous papers and reports, but
further measured temperature transients are provided in this paper to emphasize the
severity of the problems for cycled HRSGs.
An additional source of potentially severe thermal fatigue addressed comprehensively in
this paper has had less coverage in previous papers, but on many F-class HRSGs is
causing even more severe damage to HPSH and RH sections downstream of the HPSH
and RH attemperators than condensate migration:

OMMI, Vol.4, Issue 3, December 2007 www.ommi.co.uk
4
• Severe damage to pipes, headers and tube attachment to headers downstream of
HPSH and RH attemperators caused by overspraying, severe thermal down
shocks and up shocks and over temperature excursions during startups and
shutdowns, (refer to section 3.4)
The paper is unusually long due to the large amount of data presented and the need to
explain the implications of the measured transient tube temperature anomalies. To avoid
an even longer paper the authors have not fully detailed many previously published
issues and recommend that the reader follow these up as necessary via the many
references *1 to 13
. Care has been exercised to put forward well thought out analyses of
the data presented, although in some cases there may be somewhat different possible
interpretations. Data is presented in sufficient quantity and detail such that those
concerned to pursue the issues further can utilize the data to establish boundary
conditions for thermal mechanical analytical modeling, etc. It is hoped that from this
data the interested reader will be able to form an opinion regarding the viability of the
conclusions and recommendations presented, or reach alternative ones that are
consistent with the measured data presented.
Much of the data in this paper is presented in plots that rely on colors to associate TC
locations with recorded temperatures. While black and white reproduction will give
some idea of the issues discussed, viewing of the color plots will be more beneficial.
Animated data are shown in the accompanying Power Point presentation which show the
changes in component temperature with time.
2. Plant Details The plant from which data was collected for this paper is a 2X1 F-Class reheat combined
cycle unit of nominal 500MW capacity located in North America. It is typical of many
combined cycle units built during the last several years in that it utilizes General Electric
7FA combustion turbines, each equipped with a DLE 2.6 combustion system. As is also
typical of this class of unit, each HRSG is equipped with a cascading bypass system in
which HP steam is used to cool the reheaters during startup before being discharged to
the condenser. Unlike many similar units, this unit does not have duct burners installed.
The units rated steam conditions are 1800 psig, 1050°F/1050°F (565°C/565°C). While
the unit is reported to have been specified for routine cyclic duty it exhibits few features
that distinguish it from a unit intended for base load service. One exception is the
addition of an auxiliary boiler capable of establishing condenser vacuum prior to
combustion turbine startup. Like many other units constructed during this time, much of
the equipment and many design features reflect a focus on lowest initial cost and little
concern for longer term operating costs or reliability.
2.1 Combustion Turbine Engine Details While all F-Class combustion turbines place challenging requirements on the design of
HRSGs due to rapid exhaust temperature transients and high exhaust temperatures,
General Electric 7FA and 9FA engines are typically delivered with control programs that
result in exhaust temperature characteristics more severe than engines supplied by some
other OEMs. Control options are available from GE that can mitigate the worst of these
characteristics, however it is not unusual (as in the case of the subject unit) for these
options to be not offered for the initial installation but can be purchased later.

OMMI, Vol.4, Issue 3, December 2007 www.ommi.co.uk
5
2.1.1 Exhaust Temperature Matching (ETM) ETM is an optional control feature of the General Electric 7FA and 9FA gas turbine that
allows the exhaust gas temperature to be lowered when at minimum load from its normal
temperature of about 950°F (510°C) to about 700°F (371°C) during low load operation.
ETM enables the CT exhaust gas temperature to be modulated during startups between
700°F (371°C) and 1,050°F (566°C) to one of a suite of predetermined CT exhaust gas
versus time characteristics in the DCS that most closely matches the initial conditions,
steam to metal temperature limits and heating rates of the ST or HRSG HPSH, whichever
is the more limiting. ETM is also essential during controlled deloading prior to CT
shutdown to lower CT exhaust gas temperature at a predetermined controlled ramp rate
from 1,050°F (566°C) down to about 700°F (371°C) to lower the HPSH header
temperature close to saturation temperature before the CT is shutdown in order to avoid
severe quenching of hot headers when condensate from the air-cooled tubes runs down
into the headers shortly after CT firing ceases. Use of the ETM feature is very important
in HRSGs behind GE F-Class gas turbines if pressure part fatigue lives necessary for
cyclic operation are to be obtained. The subject unit was not originally supplied with
ETM, however the owner purchased this option some months after acceptance of the
plant. It is the authors’ opinion that this feature should be mandatory on GE based F
class cycling plants *8, 12
.
2.1.2 Exhaust Temperature Isothermal Limit The normally installed combustion controls for the 7FA CT cause exhaust gas
temperature to rise from 1,050°F (566°C) at about 45MW up to a peak of 1,200°F
(649°C) with only a small increase in output to about 55 to 60MW. This peak
temperature is referred to as the isothermal limit. Exhaust gas temperature remains at
the isothermal limit until the output exceeds 85 to 90MW after which CT exhaust
temperature gradually reduces as output is increased to baseload. The 9FA exhibits a
similar characteristic, but the isothermal limit is reached somewhat higher in the load
range. This rapid increase to a gas temperature when steam flow remains relatively low,
in conjunction with intrinsically slow response of attemperator temperature control loops
and when spraywater demand is increased very rapidly from zero to close to maximum
attemperator capacity, cause potentially severe fatigue damage to headers and tube
attachment welds to headers of HPSH and RH downstream of the attemperators from
quench cooling by unflashed attemperator spraywater. Rapid increase in CT load can
cause attemperator control instability/overspray with F-Class CTs manufactured by
others, but these exhaust temperature transients are not as aggressive and damaging to the
HRSG as those delivered by the GE 7FA and 9FA machines.
Control program modifications (embedded in a package known as OFE) are available
from General Electric that permits the isothermal limit to be lowered, thereby mitigating
the risk of attemperator instability and/or overspray. However it is relatively rare to see
this option installed due to General Electric’s current practice of bundling this feature in a
package with other optional control features. Were the option of lowering of the
isothermal limit more readily available to owners/operators of GE equipped F-Class
combined cycle plants a significant source of avoidable HRSG fatigue damage could be
mitigated.

OMMI, Vol.4, Issue 3, December 2007 www.ommi.co.uk
6
2.1.3 Recommendations Install and use ETM for temperature matching to the more restrictive of ST or HRSG
initial startup condition 8, 12
.
Modify GE 7FA and GE 9FA CT controls for lower isothermal limit during load
increase.
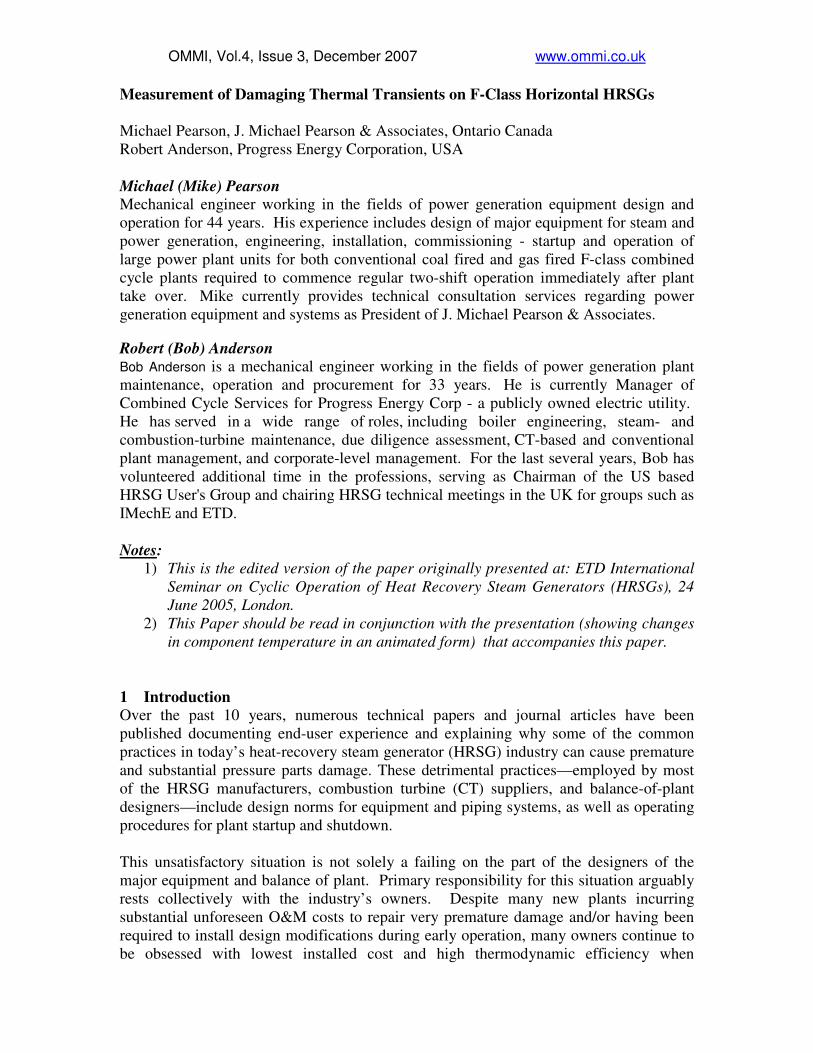
HRSG Arrangement Figure 1 illustrates the tube and header arrangements and disposition of the different
steam and feedwater heating sections of the subject HRSG. The heating surfaces are
assembled into top-supported bundles, each bundle comprising several rows of tubes and
headers. Transversely across the duct, the heating surfaces are split between two
notionally identical bundles. Because heating surfaces in the laterally adjacent tube
bundles are identical, in general TCs were concentrated in the left hand bundles viewed
from CT to stack. The exception is RH2 where, because the RH attemperator is located
on one side of the HRSG, TCs were installed on RH2 tubes in both bundles to investigate
for any tube temperature variations across RH2 caused by possible non-uniform steam
conditions at inlet to the RH2 tubes. Approximately 450 thermocouples were installed on
tubes throughout the HRSG.
OMMI, Vol.4, Issue 3, December 2007 www.ommi.co.uk
7
HRSG Side Elevation Figure 1
3. Thermal Fatigue sources in HPSH and RH sections RH2 is located at the inlet of the HRSG heat transfer section and exposed directly to the
CT exhaust gas, followed by HPSH3, HPSH2, RH1 and HPSH1, respectively, Figure 1.

OMMI, Vol.4, Issue 3, December 2007 www.ommi.co.uk
8
The HPSH comprises three sections. HPSH1 receives saturated steam from the HP drum
and discharges its steam through interconnecting pipes to HPSH2. Secondary
superheating of steam is performed in HPSH2 and then discharged through one of the
parallel-path interconnecting pipes on top of the HRSG, in each of which is located one
of the two HPSH interstage attemperators. The steam then enters HPSH3 for final
superheating before it enters the main steam manifold. The attemperator designated as A
in the associated DCS indications is in the left side interconnecting pipe between the
HPSH2 and HPSH3 sections installed with the temporary TCs, Figure 2.
HPSH2 – HPSH3 Interconnection Piping and Attemperators
Figure 2
OMMI, Vol.4, Issue 3, December 2007 www.ommi.co.uk
9
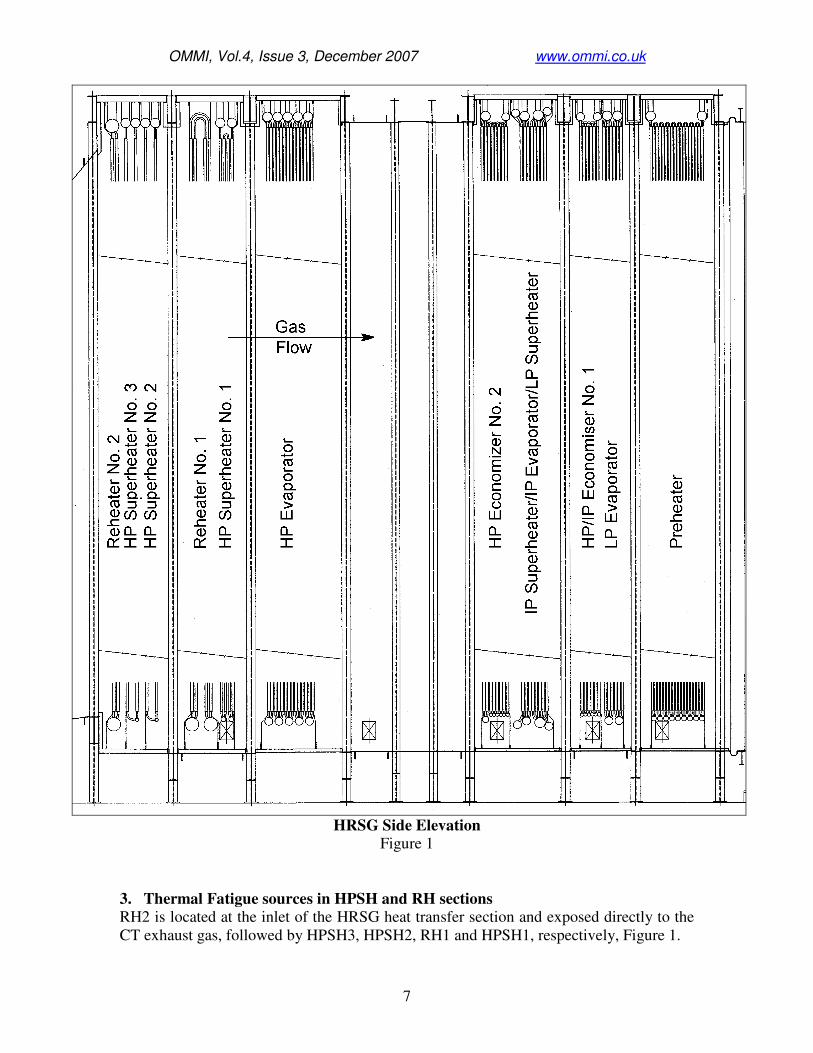
HP Superheater #3 Tubes and Headers Arrangement
Figure 3
HPSH3 and HPSH2 are virtually identical in layout and support. Each comprises two
identical side by side modules, Figure 3. Each module comprises two rows of tubes

OMMI, Vol.4, Issue 3, December 2007 www.ommi.co.uk
10
arranged in series flow with 37 tubes in each row, i.e., 74 tubes per row for the two
modules. Steam enters row 2 tubes from the upper inlet header and passes down straight
tubes attached at top dead center to the lower return header. Steam discharges from the
lower return header into the row 1 upflowing tubes through 90° bends attached at the 9
o’clock position on the return headers. The row 1 tubes discharge into the upper outlet
header to which they are attached at bottom dead center. The tubes of each row are
arranged in-line with those of other tubes in the direction of gas flow through the HRSG.
TCs were installed only on tubes and headers of the left, (A side), module. Each module
is top-supported from rigid supports attached to each of the upper inlet and outlet
headers. Thermal expansion of tubes is accommodated by downward expansion, and
some rotation of the lower return headers. Each module has a single inlet pipe, which in
the left hand module installed with TCs, is opposite tubes 15 and 16 in row 2 on the
steam inlet header. The outlet pipe from the steam outlet header on the left hand module
is opposite tubes 21 and 22 of row 1. There is a single drain point from the center of each
of the two lower headers which interconnect inside the casing below the headers into a
single 2 inch pipe. Just outside the HRSG casing there is a short interconnection between
the 2” drain pipes from HPSH3 and HPSH2. This interconnection pipe provides a means
of condensate migration during startup from the return headers of HPSH2 into the return
headers of HPSH3, which operate at lower pressure than that of HPSH2 whenever there
is a flow of steam through the HPSH
Each HPSH attemperator spray water nozzle is located in the vertical section of the
interconnecting pipe between the outlet header of HPSH2 and the 180° hairpin bend,
Figure 2. Thus, any leakage of spray water when steam flow is low causes the water to
drain back into the HPSH2 outlet header and thence into the tubes below the outlet pipe
branch. However, when overspraying occurs with significant steam flow through the
attemperator, then the unflashed water collects on the extrados of the hairpin bend
causing erosion of the internal surface of the extrados of the 180° bend, and causing the
fine droplets to collect as a film on the pipe surface at the bend from where they are
stripped off as much larger droplets by the turbulent steam flow from the bend. These
enlarged drops of water then quench the HPSH3 inlet header pipe nozzle and the tubes
opposite. When the overspraying is gross, quench cooling of tubes and headers through
to the final outlet headers has been observed on several HRSGs of different design.
The TCs in HPSH3 are located at the bottom of row 1 and row 2 tubes and at the top of
row 1 tubes. There was no access available to install TCs at the top of any row 2 tubes.
The TCs in HPSH2 are located at the bottom of row 1 and at the top and bottom of row 2
tubes, there being no access available to install TCs at the top of any row 2 tubes in
HPSH3 or row 1 tubes in HPSH2. However, the measured steam temperatures before
and after the HPSH attemperators provides an indication of average tube temperature at
outlet of HPSH2 and inlet to HPSH3, respectively.

OMMI, Vol.4, Issue 3, December 2007 www.ommi.co.uk
11
RH1 – RH2 Interconnection Piping and Attemperator
Figure 4
The reheater is comprised of two sections. Primary heating occurs in RH1, which
receives cold reheat (CRH) steam from the HP bypass (during startup) or the steam
turbine and IP superheater during normal operation. RH1 discharges its steam to an
interconnecting manifold in which the RH interstage attemperator is located, Figure 4.
Final heating occurs in RH2 from which it is discharged into the hot reheat steam
manifold. Steam is transferred from four pipes, two on each RH1 bottom outlet header,
through a single “U” shaped manifold to which are also connected the four inlet pipes,
two connected to each of the two lower inlet headers of RH2, Figure 4. The RH
attemperator spraywater injection nozzle is located immediately downstream of and less
than 1 pipe diameter from the outlet of the second 90° small radius bend of the “U”
manifold pipe. The first outlet branch to RH2 inlet on the manifold is located only about
7 pipe diameters downstream of the attemperator.
The U manifold has three drain connections, one at each of the two blind ends and the
third in the short straight spool between the two 90° bends. The manifold was installed
horizontally when cold and thus has no fall towards the drain connections, such that
condensate will pool along the bottom of the long length of manifold between the drains.
When tubes are hot, and during transient heating of the tubes at startup, the RH2 tubes
expand downwards further than those of RH1 and so any condensate that collects in the
bottom of the manifold connected to the RH1 outlet pipes will tend to flow towards the
RH2 section of the U manifold.

OMMI, Vol.4, Issue 3, December 2007 www.ommi.co.uk
12
RH and HPSH drains are all connected to the same blowdown vessel. Although the
blowdown vessel is located in a pit such that the drain pipes have a nominal small fall
from connection on the HRSG to the point of entry on the blowdown vessel, there is
inadequate static head to drive RH drains into the blowdown vessel when there is no
pressure in the RH. Furthermore when HPSH and RH drains are both in continuous
operation, as they all should be throughout the prestart purge until gas temperature has
raised tube metal temperatures above saturation temperature inside the tubes, the large
drain flow from the HPSH may raise the pressure in the blowdown vessel above that in
the RH, in which case there is a risk of reverse flow in the RH drains and of blowing
slugs of condensate from the blowdown vessel into the RH manifold.
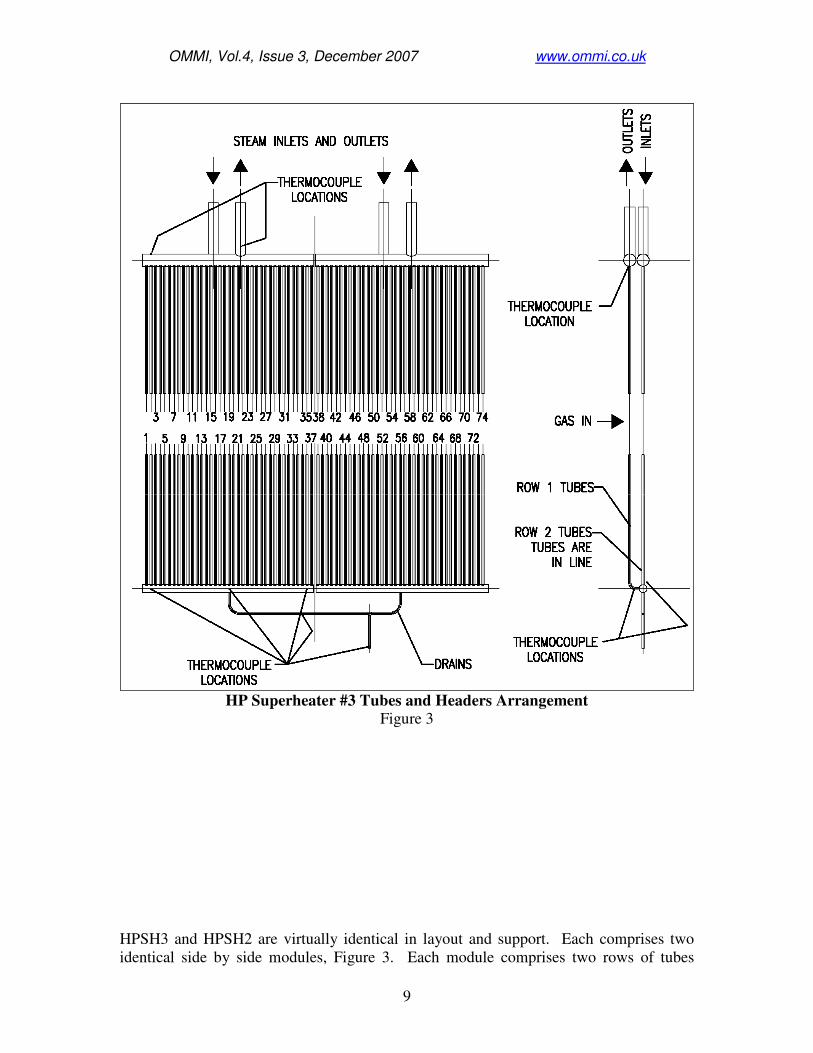
RH2 comprises two rows of parallel-pass tubes, both rows connected to the same lower
inlet header and to the same upper outlet header, Figure 5. The headers and tubes of RH2
are top supported from fixed supports attached to the upper headers. Thermal expansion
of the tubes is accommodated by downward expansion of the RH2 tubes and lower
headers when the temperature of the row 1 and row 2 tubes is virtually the same, as this
design arrangement assumes. Each row has 66 tubes divided equally between the two
bundles. Each of the two lower headers has two inlet pipe branches opposite tubes 9 and
25 in the left hand bundle and tubes 42 and 58 in the right hand bundle. The two upper
outlet headers also each have two outlet pipe branches positioned opposite the same tubes
as the lower header pipe branches.
RH1 has four rows of tubes arranged in two parallel passes with shared bottom inlet
headers, a 180° inverted hairpin bend at the top and shared bottom outlet headers. The
first and last row of RH1 tubes in the gas flow, (respectively rows 1 and 4), have straight
tubes attached at top dead center of the inlet and outlet headers, while the tubes in rows 2
and 3 have a bend attaching them to their respective headers. RH1 is divided into
identical left and right modules, each with its own inlet and outlet header. Each inlet and
outlet header has two pipe nozzles. Both the inlet and outlet pipe nozzles are located
opposite tubes 9 and 25 in the left module and tubes 43 and 60 in the right module,
Figure 6.
OMMI, Vol.4, Issue 3, December 2007 www.ommi.co.uk
13
RH2 Tubes and Headers Arrangement Figure 5

OMMI, Vol.4, Issue 3, December 2007 www.ommi.co.uk
14
Figure 6
The weight of tubes, headers and interconnection pipes are supported by beams under the
upper hairpin bends connecting row 1 to row 4 tubes and row 2 to row 3 tubes. Thermal
expansion of the tubes when hot is accommodated by downward deflection of the lower
headers and interconnecting pipes. Thus any difference in temperature between tubes,
even small tube to tube temperature differences during normal on-load operation, will
unload the hotter tubes and transfer the support load to the coolest tubes. Of particular
concern is the possibility that severe quench cooling of just a few tubes close to the inlet
pipe branches could transiently transfer the weight of the entire RH1 tubes, headers and
interconnecting pipes into just a few of the tubes.
It was not originally intended that RH1 be instrumented with thermocouples (TCs).
However, an inspection of a sister HRSG around the time of TC installation noted
permanent buckling deformation of a few RH1 tubes closest to the inlet pipe nozzles. In
order to investigate the cause of these plastically elongated tubes, a few TCs were

OMMI, Vol.4, Issue 3, December 2007 www.ommi.co.uk
15
installed on RH1 tubes. Thermocouples were attached to the top of tubes 9, 17 and 25 (on
the hairpin bends connecting rows 1 and 4) and to the bottom at the outlet of tubes1, 6, 9,
and 25 (all row 1) with the objective of identifying any condensate migration into the
RH1 inlet and possibly over the top from the RH1 inlet to outlet. The inlet and outlet
branches of RH1 are located opposite tubes 9 and 25 in the left hand module, to which
thermocouple installation was confined. TC installation at the RH1 inlet header is
restricted by difficult access through the aforementioned HPSH2 and HPSH1 tubes;
hence no TCs are installed at the bottom of row 3 or row 4 tubes close to the steam inlet.
3.1.1 Parallel-pass tubes and shared headers not recommended for cycling Whenever row 1 tubes operate with a higher temperature than the row 2 tubes, then the
larger thermal expansion of the row 1 tubes is resisted by the lesser expansion of row 2
tubes resulting in compressive forces in the hotter row 1 tubes and tensile forces in the
somewhat cooler row 2 tubes, Figure 7. With two rows of tubes attached to the same
upper header and the same lower header, it is inevitable that one or both tubes are offset
from the vertical centerline of one or both headers and connected to the header by a bend,
or sometimes by a non-axisymmetric tangent tube connection to the header. The bending
moment at the weld attaching each offset tube to the header, caused by thermally induced
forces in the tubes whenever the two tube rows operate at different temperatures,
substantially increases the peak thermally-induced stress above that which results from
the direct thermally-induced force applied at the header by a straight tube whose
centerline intersects the header centerline. It has been suggested by others that the
headers may rotate in response to temperature differences between rows, thereby
reducing stresses at the weld. This may be partly true in some cases where there are no
bottom guides that resist header rotation and also where only small bore drains are
attached to the lower header. However, it is not likely in this case due to the substantial
rigidity of the RH1 to RH2 interconnecting piping. In fact, it is probable that thermally
generated forces and moments exerted on the headers by large bore external piping result
in additional stresses at the tube to header weld, especially when condensate can pool
along the bottom of hot headers and interconnecting pipes causing them to bow. Patterns
of external oxide spalling at the toe of RH1 tube to outlet header welds, as discussed in
Section 3.6.1, may be partly influenced by these piping loads.

OMMI, Vol.4, Issue 3, December 2007 www.ommi.co.uk
16
Figure 7
RH2 has two tube rows attached to the same upper and lower headers, Figure 5. Row 1
tubes are straight and the row 2 tubes have a bend at each end to connect the tubes to the
headers.
When operating at baseload, the average temperature of row 1 tubes is of the order of
10°F (6°C) higher than that of row 2 tubes. This difference in average temperature
between row 1 and row 2 tubes increases to of the order of 20 to 25°F (11 to 14°C) when
operating at part loads between 85 to 125MW, which is probably too small to be a fatigue
concern, even assuming a stress intensification factor of 4 or 5 from the bending moment
in the offset row 2 tubes.
However, significantly larger temperature differences develop between row 1 and row 2
tubes at every CT startup during acceleration of the CT to speed and synchronization.
Figure 8 plots the individual tube temperatures of RH2 row 1 and row 2 tubes measured
just below the outlet header during a startup on 1-12-03 using CT Exhaust Gas
Temperature Matching (ETM).
The tubes develop a large spread in temperature during the final stages of acceleration to
speed and synchronizing of the CT generator. Figure 9 utilizes the same tube
temperature data but has averaged row 1 and row 2 temperatures. The maximum
difference in average temperature of row 1 and row 2 tubes reaches about 150°F (83°C),
which is a significant concern on the offset row 2 tubes if the units are subjected to
periods of cycling service.
The peak thermal stresses developed in the row 2 tubes at their attachment welds to the
headers is enhanced further by additional transient thermal stresses developed
simultaneously by high tube-to-header temperature differences during each CT startup,
which significantly accelerates the rate of cyclic life expenditure *6, 8, 10
.

OMMI, Vol.4, Issue 3, December 2007 www.ommi.co.uk
17
Figure 8
Figure 9
3.1.2 Recommendation

OMMI, Vol.4, Issue 3, December 2007 www.ommi.co.uk
18
Prohibit the use of more than one row of straight tubes per pair of upper and lower
headers. Ensure all tubes are straight and connected at top and bottom dead center of
upper and lower headers, respectively.
Existing plants with parallel tube rows on one header should avoid cyclic operation. If
cycling is unavoidable analyses should be performed to estimate when fatigue failure will
occur, detailed repair plans with cost estimates formulated and budgets adjusted as
appropriate so that financial impacts can be managed.
3.1.3 Series-pass tubes with shared headers and rigid top supports not
recommended for cycling HPSH3 comprises two series-pass tube rows, Figure 3. Each side by side module
comprises two rows of tubes arranged in series flow with 37 tubes in each row, i.e., 74
tubes per row for the two modules. Steam from the HPSH attemperator enters row 2
tubes from the upper HPSH3 inlet header and passes down straight tubes attached at top
dead center to the lower return header. Steam discharges from the lower return header
into the row 1 upflowing tubes through 90° bends attached at the 9 o’clock position on
the return headers. The row 1 tubes discharge into the upper HPSH3 outlet header to
which they are attached at bottom dead center. The tubes of each row are arranged in-
line with those of other tubes in the direction of gas flow through the HRSG. The steam
inlet branch on the inlet header of the “A” side module of HPSH3 is opposite tubes 15
and 16, and the drain connection on the bottom return header is opposite tube 19. Each
module is top-supported from rigid supports attached to each of the upper inlet and outlet
headers. Thermal expansion of tubes is accommodated by downward expansion, and
some rotation of the lower return headers. The TCs in HPSH3 are located at the bottom
of row 1 and row 2 tubes and at the top of row 1 tubes. There was no access available to
install TCs at the top of any row 2 tubes.
During normal stable operation the row 1 tubes, (gas inlet row), operate at a higher
temperature than the row 2 tubes. The difference in average temperature of row 1 and
row tubes during stable on-load operation varies with load and amount of desuperheating.
At baseload, with little or no desuperheating, the difference in average temperature
between row 1 and row 2 tubes is about 25°F (14°C), which is innocuous.
When at 110 MW with substantial desuperheating, the difference in average temperature
between row 1 and row 2 tubes increases to about 90°F (50°C), which may cause
significant creep fatigue damage at the bend and attachment weld of the row 1 tube to the
lower return header. Thus load cycling between 60% and 100% CT output which causes
the thermal stresses at critical locations to increase as the temperature difference between
row and 2 tubes fluctuates, may expend a significant portion of the creep fatigue life at
the highest localized stress location.
Additional thermal stresses and creep fatigue damage is expended in the same small
localized material at every startup, when larger differences occur between the average
temperatures of row 1 and row 2 tubes. During acceleration of the CT following the
purge, but before a significant cooling flow of HP steam can be established through the
tubes, the HPSH3 row 1 tubes heat up significantly faster than row 2 tubes. Because of
poor access, it was impossible to install any TCs at the top of row 2 tubes in HPSH3, (or
the top of row 1 tubes of HPSH2), thus it was not possible to measure both top and

OMMI, Vol.4, Issue 3, December 2007 www.ommi.co.uk
19
bottom temperatures from which to estimate the average tube temperatures in row 2
tubes. However, based on measurements of top temperatures on other designs of HRSG
and also on the results of dynamic simulation calculations on other HRSGs, it is
anticipated that the peak difference between average temperatures of row 1 and row 2
tubes will likely be between 100 and 130°F (56 to 72°C). The peak average row 1 to row
2 tube temperature difference at each startup occurs simultaneously with the peak tube to
header temperature difference*8, 10
and develop maximum compressive thermal stresses
in the same location at the 6 o’clock position on the attachment weld of row 1 tubes to the
lower header.
Large temperature differences between individual tubes in the same row caused by
condensate migration also occur simultaneously; (refer to Section 3.3). This
simultaneous occurrence of three thermal mechanical stressing mechanisms at the same
location on some tubes significantly increases the cyclic stress range and substantially
increases the rate of expenditure of creep fatigue life at this location. Estimation of cyclic
life at tube attachments to headers must evaluate the total stress range resulting from the
simultaneous occurrence of each of the thermal mechanical loading mechanisms.
3.1.4 Additional secondary thermal cycles caused by row-to-row temperature
transients later in each startup and again during shutdowns
Even larger differences between the average temperature of row 1 and row 2 tubes up to
of the order of 200°F (111°C) have occurred during most of the startup events recorded
and again during most of the recorded shutdowns. These were caused by inappropriate
operating procedures during loading the CT from minimum load to above 50% load at
startups and when deloading the CT below 50% prior to shutdown, (refer to Section 3.4).
Recommended startup and shutdown procedures can be found in References 8 and 10.
The latter higher row 1 to row 2 temperature differences do not occur simultaneously
with the other thermal mechanical mechanisms referred to above. However, they are
additional thermal mechanical cycles and analytical prediction of the cyclic life of the
HPSH3 tubes and tube to header welds needs to summate the cumulative creep fatigue
damage from all of the cyclic thermal mechanical mechanisms, some of which occur
simultaneously and enhance stress range and damage increment, and others that occur at
different moments as significant secondary cycles and add to the cumulative life
expenditure. It is also important to establish the total stress range by establishing where
temperature differences, and hence thermal stresses, reverse in sign and must be added
together to determine the total cyclic stress range. For example, when condensate is
blown forward through the interconnection between drains of HPSH2 into HPSH3, then
those row 1 tubes of HPSH3 close to the drain connection through which the condensate
is blown are transiently chilled to saturation temperature which is significantly lower than
the temperature of the row 2 tubes.
OMMI, Vol.4, Issue 3, December 2007 www.ommi.co.uk
20
Recommendation The replacement of the fixed supports with spring supports at one or both of the outlet
and/or inlet headers of HPSH3 would permit some of the differential thermal expansion
caused by differences in average temperature of the two tube rows of HPSH3 to be
accommodated by the springs. This would reduce cyclic thermal stresses and
significantly reduce the rate of expenditure of cyclic life. Similar action is recommended
for HPSH2 and HPSH1.
3.1.5 Tube-to-tube temperature differences caused by migration forward of
undrained condensate during startups Removal of all condensate from reheaters is particularly difficult to achieve without
careful attention to the detailed design and precise operation during the critical early
startup period. Even during hot starts, there is often little or no pressure in the reheater to
assist the necessarily rapid evacuation of condensate. Reheaters are vulnerable to
condensate collection from condensation in the tubes, from leaking spraywater either
from the HP bypass attemperator or from the RH attemperator, and from potentially
substantial condensate migration from long, poorly drained CRH pipes, and from back
flow from the blowdown vessel when this is shared with HPSH drains and other sources
of flashed HP condensate.
Reheaters are not only more likely then HPSHs to experience significant forward
condensate migration during all starts; reheaters are also subjected to more severely
damaging quench cooling of tubes and headers during each startup than HPSHs.
Condensate in reheaters causes significantly more damaging quenches to tubes and
headers of the RH because saturation, thus condensate temperatures, are significantly
lower in the RH than in the HPSH when condensate migration occurs. Compounding
this, condensate migration occurs somewhat later in the RH than in the HPSH, because
time is required after the HP bypass opens to pressurize the RH. By then gas temperature,
thus uncooled RH tube temperatures, are significantly hotter than they were when the HP
bypass opened and established cooling flow through the HPSH tubes.
Although the HPSH and RH drains incorporate larger drains than earlier designs of
HRSGs several of the previous recommendations to ensure the functional reliability of
HPSH and RH drains to remove all condensate from HPSH and RH before steam flow
and pressure drop through tubes is established were omitted either by the HRSG OEM or
by the EPC contractor. As a result, the presence of significant quantities of condensate in
the headers and tubes of reheaters and superheaters was evident during startups.
Although it is often assumed that there should be no difficulty removing all condensate
from HPSHs when hot with significant HP pressure, this is often not the case, even
though the size of drain connections on the HPSH bottom headers appear to be
adequately sized. The interconnection of drains from different HPSH sections that
operate at different pressure whenever there is steam flow in the HPSH causes some
condensate to blow forward through the drains from primary HPSH sections to secondary
and tertiary HPSHs. This is especially true when several drain pipes of one size are
interconnected into a single drain pipe of the same size to the blowdown vessel, or where
the drain vessel entry is several meters above the drain connections at the low points of
the HPSH.

OMMI, Vol.4, Issue 3, December 2007 www.ommi.co.uk
21
Because few HRSGs have RH/HRSG drain pot/valve systems capable of detecting and
automatically discharging condensate as it forms and shutting off the flow before
superheated steam escapes it is common for operators to manually sequentially cycle
open and shut each of the several drain valves in turn. Without some means of
condensate detection, this practice risks potentially severe damage to the blowdown
vessel from overloading it with high temperature steam. To prevent condensation
migration, it is important to remove all condensate as fast as it collects, and this cannot be
accomplished by blindly cycling open and then shut all of the HPSH and RH drain valves
in turn.
There are three important, and possibly conflicting, requirements to be met during startup
if maximum fatigue life is to be attained from the components in a cycling HRSG.
Firstly, HP drum pressure should be maximized during shutdown and maintained as high
as possible for the restart by thorough isolation. This maximizes the metal temperatures
in HP drum and HPSH headers at the next startup, thereby permitting a shorter duration
restart with significantly lower thermal stresses and fatigue damage than would be the
case with starts from low HP pressure. Secondly, condensate must not be allowed to
accumulate in reheaters and superheaters during the shutdown period, during prestart
purge or during the startup. This avoids “humping” of hot lower headers that may
prevent some condensate from reaching the drains and flooding of tubes with condensate
that will be blown “over the top” when steam flow commences. Thirdly, as mentioned
above, unless the blowdown piping and vessel is designed to receive large quantities of
superheated steam (most are not) they can be severely damaged by exposing them to
temperatures above their respective design temperatures.
Some have suggested that thermocouples attached to drain lines can adequately detect
condensate by monitoring the drain pipe for temperatures indicative of the presence of
condensate versus superheated steam. These signals can then be used to actuate the
appropriate drain valves. While this arrangement may work adequately for units started
only occasionally and where moderate amounts of superheated steam can be tolerated by
the blowdown vessel it is not suitable for cycling service. During the hot shutdown when
HP drum pressure is to be maximized a drain pot will slowly fill with condensate until the
high level probe picks up and opens the drain valves. If the system is properly designed
and tuned, the low level probe will close the drain valves when the pot is near empty and
prevent steam from escaping. Very little drum pressure will be lost. On the other hand, a
TC on the pipe during the hot shutdown will sense condensate as the drain line fills and
open the drain valves. It will not, however, be able to reliably close the drain valves
since no superheat is possible during shutdown and significant HP pressure will be lost.
3.1.6 Condensate migration in RH2 during cold HRSG startup Figure 10 plots the temperature measured at the top of every tube installed with a TC at
their outlet just below the top outlet header during a cold HRSG start performed with the
CT in ETM mode on 1-12-03. Steam flow was established through the reheater at about
08:53 in Figure 10 and the introduction of pressure drop through the RH2 caused large
quantities of condensate in lower manifold pipes and headers to be displaced forward
through some of the tubes and into the RH2 outlet header.
Most of the condensate was displaced through the row 1 tubes as only three tubes of row

OMMI, Vol.4, Issue 3, December 2007 www.ommi.co.uk
22
2 indicated sharp temperature drops at tube outlet when condensate migration occurred.
However it was evident, (from other TC data not presented here), that condensate was
present at the bottom of both row 1 and row 2 tubes during the same period.
To better appreciate the behavior of the condensate through the period when it was being
blown forward, “Time Slice Data” (TSD) was prepared. Figure 11 is a typical TSD plot.
Each TSD page plots on an arrangement drawing of RH2 tubes all RH2 tube
temperatures measured by TC within the same time span of less than 5 seconds of each
other by tube number, row number and position at top or bottom of tube, and plots each
recorded temperature. Also highlighted on the RH2 tube & header symbolic arrangement
drawing are the positions, relative to the numbered tubes, of the inlet and outlet pipe
branches on the bottom inlet and top outlet headers, respectively, and the position of
blind ends of each header.
Figure 10
Sequences of consecutive TSD plots were assembled at short time interval gaps for those
periods when there was considerable instability or fluctuation in tube temperatures. For
the period during the event plotted in Figure 10 when condensate was blown forward, 32
different TSD plots between 08:53 and 09:05 on 1-12-03 were assembled. It is
impractical to include many sequential TSD plots in the printed version of this paper, but
it is planned to include them in an electronic version of the paper to be published later on
the ETD website or available on request from the authors.
Figure 12 incorporates 6 of the sequenced 32 TSD plots for this start event to illustrate
the large and rapid tube temperature fluctuations that occur when intermittently heated by
gas and then chilled by slugs of condensate. Points for consideration relevant to Figs 10,
11 and 12 are:
• The CT was synchronized and loaded to about 17MW at 08:44 hours; CT exhaust gas
OMMI, Vol.4, Issue 3, December 2007 www.ommi.co.uk
23
temperature was fixed and stable at about 700°F (371°C) for several minutes before
steam flow commenced through RH2.
• Prior to establishing a cooling steam flow through the RH2 tubes, the temperatures
recorded at the top and bottom of rows 1 & 2 tubes align in general with reasonable
expectations; i.e., row 1 tube top temperatures somewhat higher than and row 2 tube
top temperatures and similarly row 1 tube bottom temperatures are generally above
row 2 bottom temperature.
• Steam flow was established through the RH when the HRH steam dump control valve
was opened between 08:53:30 and 08:53:45. The HRH steam startup vent remained
closed throughout the startup
• Condensate blown up to the top outlet of tubes and into the outlet headers was most
evident in the tubes closer to each of the four inlet pipe branches on the inlet header.
Condensate blowing forward was initially evident at 08:54:00 in Figure 12 through
row 2 tubes 41, 42 and 43 opposite the 2nd
RH2 inlet pipe branch downstream of the
attemperator and row 1 tube 53 opposite the 1st pipe branch after the attemperator.
Also at 08:54:00 in Figure 12, condensate was just commencing to lower the bottom
temperature of row 2 tubes 24 and 25 opposite the 3rd
pipe branch. By 08:54:15 in
Figure 12 the bottom of tubes 24, 25 and 26 opposite the 3rd
pipe branch were at or
about saturation temperature and condensate first became evident in tube 10 of row 2
and 15 seconds later tubes 7 to 11, opposite the 4th
pipe branch from the blind end of
the reheater interconnecting manifold, were at or close to saturation temperature
either at their top or bottom TC.

OMMI, Vol.4, Issue 3, December 2007 www.ommi.co.uk
24
Figure 11

OMMI, Vol.4, Issue 3, December 2007 www.ommi.co.uk
25
Figure 12

OMMI, Vol.4, Issue 3, December 2007 www.ommi.co.uk
26
Substantial quantities of condensate were blown forward over a period lasting more than
5 minutes. At some time points during the migration of condensate the temperature at the
top of some tubes was chilled by up to 430°F (239°C) below that of the other tubes,
which remained close to the gas temperature of about 700°F (371°C). The average of top
and bottom temperatures in some of the tubes chilled at bottom and top by condensate
was transiently more than 300°F (167°C) below that of adjacent tubes that remained free
of condensate slugs. This develops very damaging thermal stresses, particularly at the
weld attaching the offset row 2 tubes to the headers.
3.3.2 Gross condensate migration in RH2 during a warm, almost hot, restart
without use of ETM to minimize CT exhaust gas temperature Because the CT exhaust gas temperature was about 60°F (33°C) hotter than the minimum
setpoint available when using ETM, the RH2 tubes were heated to a correspondingly
higher temperature before HRH steam flow was established when the HRH dump PCV
opened. This resulted in an even larger and more damaging quench of up to about 500°F
(278°C) at the top of row 1 tubes by condensate, Figure 13. Tube temperature
differences at the bottom of the row 1 tubes varied by up to 250°F (139°C), Figure 14.
Figure 15 contains six TSD plots from the same warm, almost hot, start from an initial
HP drum pressure of 320psig on 3-13-03 using CT ETM with a setpoint for exhaust gas
of 760°F (404°C) when at CT minimum load. The initial pressure in the reheater was
atmospheric but increased quickly after the HP bypass PCV opened when HP pressure
had increase to about 350psig at about 21:43, causing the HRH dump PCV to open at
about 21:46 when reheater pressure reached the setpoint of about 100psig.

OMMI, Vol.4, Issue 3, December 2007 www.ommi.co.uk
27
Figure 13
Figure 14

OMMI, Vol.4, Issue 3, December 2007 www.ommi.co.uk
28
Figure 15
CT firing commenced at 21:32. HPSH and RH drains were cycled open and closed
several times between 21:32 and 21:38. The HP startup vent was cracked open
throughout the startup and the HRH startup vent was 20% open from 21:33 to 22:04.
The HP bypass inlet pressure control valve (PCV) opened at 21:41:30 when HP pressure
reached about 350psig. The HRH bypass PCV opened between 21:45:30 and 21:46:00
when the RH outlet pressure reached 150psig.
Immediately after the HRH bypass PCV opened and steam flow was established through
the RH, condensate was blown through RH2 tubes for a period of about 10 minutes,
Figure 15. Substantial quantities of condensate, initially sub-cooled, progressively
flooded all tubes, commencing with tubes supplied by the 1st inlet pipe (at 21:45:00 in
Figure 15), then those supplied by 2nd
(at 21:46:15), then 3rd
(at 21:17:45), and finally the
4th
inlet pipe, (at 21:48:15 in Figure 15). Prior to this quenching incident, the top of tubes
ranged between 700°F (371°C) and 800°F (427°C). However, between 21:48:00 and
21:48:15 every top and bottom tube with a TC was between 340°F (171°C) and 400°F
(204 °C). During the incident, the temperature difference across the ligament between
OMMI, Vol.4, Issue 3, December 2007 www.ommi.co.uk
29
some adjacent tubeholes through the outlet header was severe, more than 400°F (222°C).
In addition the average of top and bottom temperature of many tubes experienced a
transient tube-to-tube temperature difference of about 240°F (133°C).
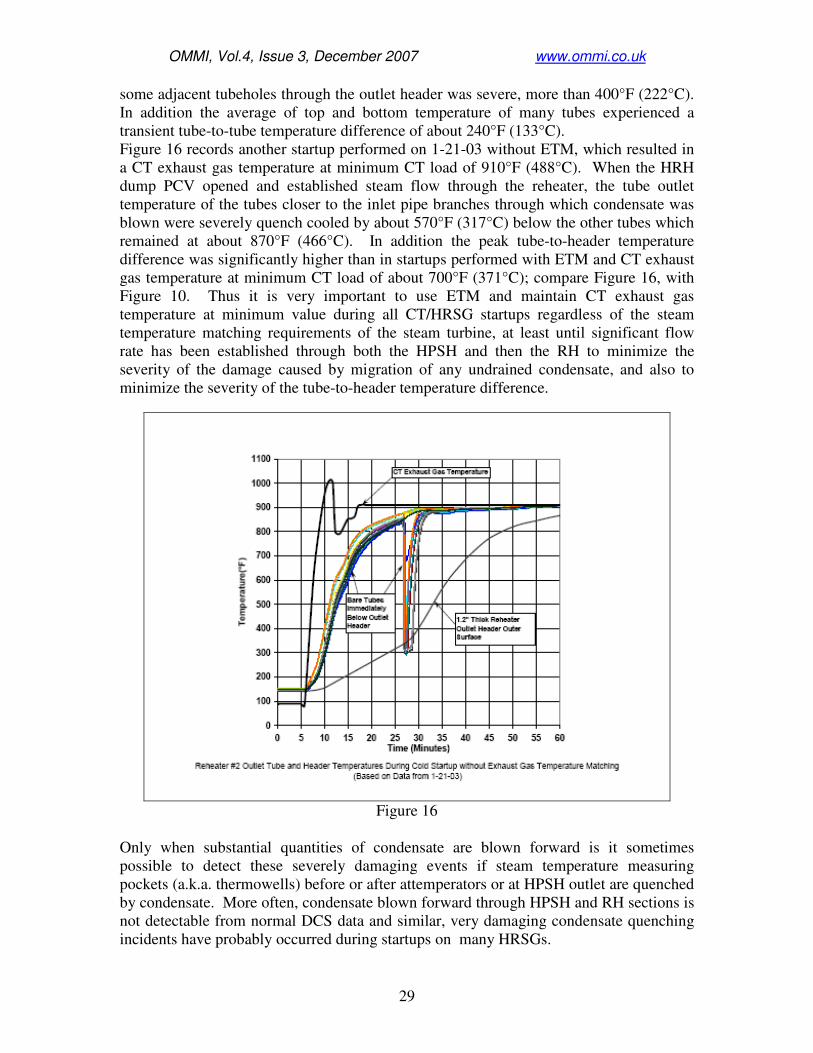
Figure 16 records another startup performed on 1-21-03 without ETM, which resulted in
a CT exhaust gas temperature at minimum CT load of 910°F (488°C). When the HRH
dump PCV opened and established steam flow through the reheater, the tube outlet
temperature of the tubes closer to the inlet pipe branches through which condensate was
blown were severely quench cooled by about 570°F (317°C) below the other tubes which
remained at about 870°F (466°C). In addition the peak tube-to-header temperature
difference was significantly higher than in startups performed with ETM and CT exhaust
gas temperature at minimum CT load of about 700°F (371°C); compare Figure 16, with
Figure 10. Thus it is very important to use ETM and maintain CT exhaust gas
temperature at minimum value during all CT/HRSG startups regardless of the steam
temperature matching requirements of the steam turbine, at least until significant flow
rate has been established through both the HPSH and then the RH to minimize the
severity of the damage caused by migration of any undrained condensate, and also to
minimize the severity of the tube-to-header temperature difference.
Figure 16
Only when substantial quantities of condensate are blown forward is it sometimes
possible to detect these severely damaging events if steam temperature measuring
pockets (a.k.a. thermowells) before or after attemperators or at HPSH outlet are quenched
by condensate. More often, condensate blown forward through HPSH and RH sections is
not detectable from normal DCS data and similar, very damaging condensate quenching
incidents have probably occurred during startups on many HRSGs.

OMMI, Vol.4, Issue 3, December 2007 www.ommi.co.uk
30
In these and most other startups, it is improbable that condensation inside tubes or pipes
of the RH was anything more than a contributor to the large quantity of condensate that
was in the RH for so long after HRH steam flow was established. In tests on this and
other HRSGs, three potential other sources of condensate carry over into the RH during
starts have been identified: -
1) Reverse flow in the RH drains and blowing of slugs of condensate from the
blowdown vessel into the RH interconnection manifold, lower headers and tubes.
HPSH and RH drains need to be open simultaneously during all CT starts. When
HPSH and RH drains are disposed to the same blowdown vessel, the large flow of
HPSH drains sometimes raises the vessel pressure above RH pressure. On most
horizontal gas path HRSGs, even those with the blowdown vessel in a pit beside the
HRSG foundations, there is inadequate static head to quickly drive the RH drains into
the vessel, even when both RH and blowdown vessel are both at atmospheric
pressure.
2) Leakage of attemperator spraywater when intended to be shut off. Interlocks should
ensure that the spraywater block valve cannot be opened unless CT exhaust gas
temperature is above a minimum setpoint temperature below which desuperheating is
never required. Frequent maintenance of attemperator spraywater control and block
valves is essential to maintain tight shutoff capability during CT starts and initial
loading. Installation of “tell tail” drains between the block valve and spraywater
valve, or even better between duplicate master and martyr block valves, enables the
leak tightness of the block valve to be tested during shut down periods.
3) Carryover of condensate from cold reheat pipes into RH1; long, large diameter pipes
condense substantial quantities of vapor during starts. Inadequate drainage
arrangements, such as too small drain lines, reliance on reverse flow of condensate to
drain connections against steam flow direction, inadequate static head and/or
disposed to the same blowdown vessel as HPSH drains, etc. are all too common. The
second source of large amounts of condensate in cold reheat pipes is leakage of HP
bypass attemperation spraywater, due to inadequate protective interlocks, malfunction
and/or inadequate maintenance to preserve tight shutoff.
Bowing of tubes positioned opposite the steam inlet branches on the inlet header of RH1
are strong evidence that condensate has been blown forward from the CRH pipe through
these tubes chilling them below the temperature of the bulk of the tubes heated to gas
temperature before RH steam flow was established. This has been confirmed by a TCs
attached to the top of a few RH1 tubes, Figure 17. The tube opposite one of the inlets
was quenched about 200°F (111°C) below the other tubes after some of the condensate
had already been heated during passage up the first pass of RH1. On many installations
the drainage of CRH pipes is poorly designed. They are usually long and condense
substantial quantities of condensate. Often they are on the same pipe rack as the HP and
HRH steam pipes to the ST and for ease of construction arranged to fall, with minimum
slope, from HRSG end to ST and imprudently rely on back drainage against the normal
direction of steam flow, Figure 18. When forward CRH steam flow from the ST
commences, condensate running slowly back the long pipe to the ST is then rolled up by
the steam into large slugs of condensate and blown into the reheater. On occasions there
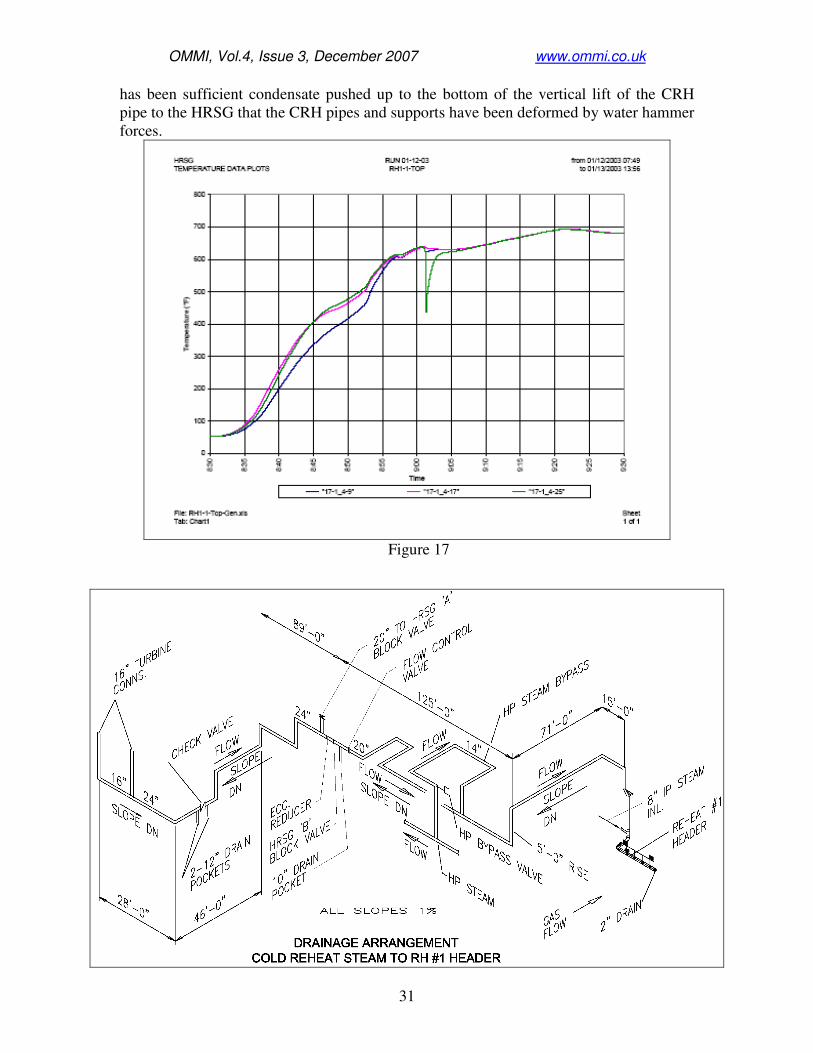
OMMI, Vol.4, Issue 3, December 2007 www.ommi.co.uk
31
has been sufficient condensate pushed up to the bottom of the vertical lift of the CRH
pipe to the HRSG that the CRH pipes and supports have been deformed by water hammer
forces.
Figure 17

OMMI, Vol.4, Issue 3, December 2007 www.ommi.co.uk
32
Figure 18
All of the foregoing potential causes of severely damaging condensate migration in the
RH (and similarly in the HPSH) tubes can be avoided by more diligent design and
improved operating and maintenance practices.
3.1.7 Condensate migration in HPSH during cold HRSG startup using ETM to
minimizes CT exhaust gas temperature Condensate forms in the tubes of all sections of the HPSH when the unit cools during
shutdown and also during the CT/HRSG purge immediately before CT firing
commences. Condensation rates in the finned tubes during the purge period can be very
high. Many HRSGs, even those that made some attempt to improve HPSH and RH
operational drainage arrangements have one or more deficiencies in the design of
condensate removal and disposal systems that make it difficult or impossible to
completely remove all of the condensate from all low points of HPSH or RH during
startups. If condensate is not completely drained from every low point in the HPSH
headers and interconnecting pipes before steam flow, thus pressure drop, is established
through the HPSH (or RH), then any condensate remaining is blown forward from
HPSH1 to HPSH2 and then to HPSH3.
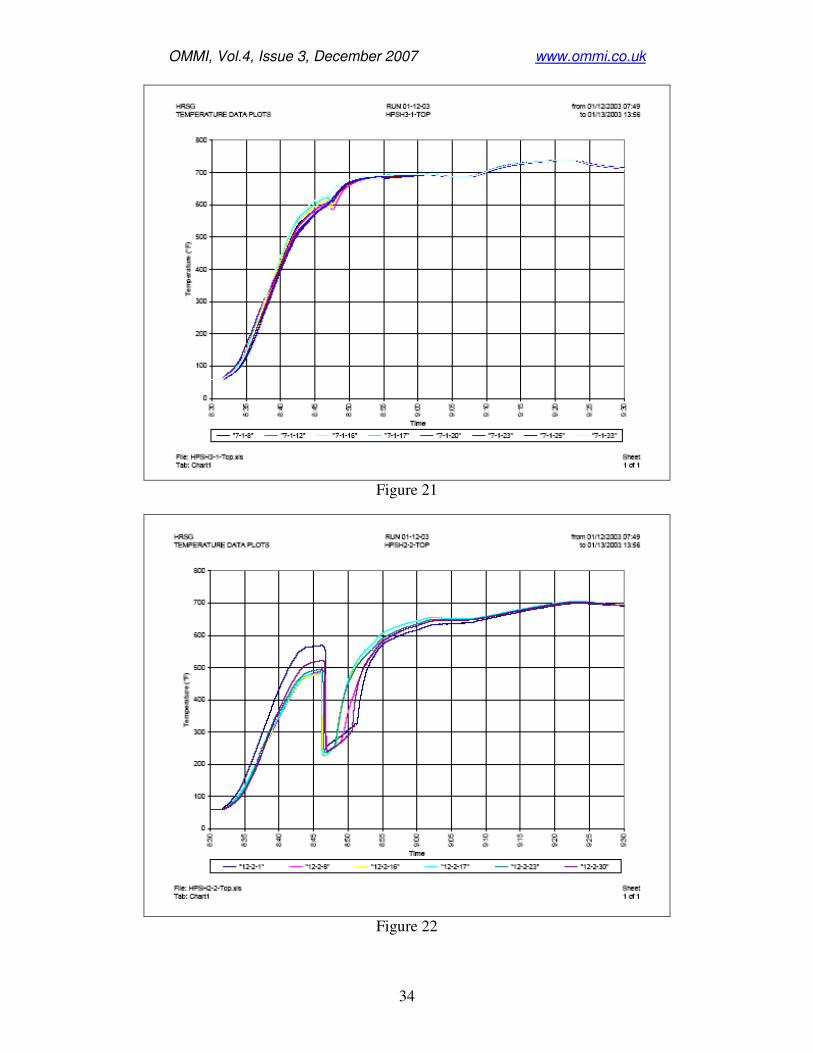
Figures 19, 20, and 21 record the temperature transients measured, (during a cold startup
using exhaust gas temperature matching (ETM) to minimize the CT exhaust gas
temperature), at the bottom of row 2 and row 1 tubes and the top of row 1 tubes,
respectively. Figures 22 and 23 record the temperature transients measured at the top of
row 2 and the bottom of row 1 tubes, respectively. Figures 24 and 25 record the
temperature transients measured at the top 180° bend between rows 2 /3 and the top of
row 1 tubes, respectively. The arrangement of tubes, headers and TCs on HPSH1 is
shown in Figure 26. It is likely that significant condensate was also blown forward from
HPSH2 into HPSH3, either through the interconnection between their drains or from the
top outlet of HPSH2 to the top inlet of HPSH3.

OMMI, Vol.4, Issue 3, December 2007 www.ommi.co.uk
33
Figure 19
Figure 20
OMMI, Vol.4, Issue 3, December 2007 www.ommi.co.uk
34
Figure 21
Figure 22

OMMI, Vol.4, Issue 3, December 2007 www.ommi.co.uk
35
Figure 23
Figure 24

OMMI, Vol.4, Issue 3, December 2007 www.ommi.co.uk
36
Figure 25

OMMI, Vol.4, Issue 3, December 2007 www.ommi.co.uk
37
HPSH1 Tubes and Headers Arrangement
Figure 26
In HPSH3, quench cooling of some tubes at the bottom of row 1 and 2 by up to 300°F
(167°C) below the temperature of other bottom tubes occurred when the HP bypass
opened just after 08:46 hours, establishing significant steam flow, thus pressure drop
through all HPSH sections. The temperatures at the top of row 1 tubes dipped only about
30°F (17°C), indicating that most of the condensate blown up the row 1 tubes had
evaporated in the tubes. All except one of the row 1 tubes with a TC at the bottom were
quenched down to saturation temperature, whereas only one of the row 2 tubes installed
with a tube bottom TC experienced the quench cool. The transient peak difference
between the averages of top and bottom tube temperatures in row 1 tubes was about
165°F (92°C). The peak difference in transient mean temperature of the row 1 tubes
could be even greater or somewhat less than 165°F (92°C), depending on the
indeterminate temperature profile between the bottom and top of each row 1 tube.
Determination of the transient mean temperature of the row 2 tubes in HPSH3 is more
subjective because access precluded the installation of any TCs at the top of either row 2
of HPSH3 or row 1 of HPSH2. Condensate chilling at the bottom of row 2 tubes of

OMMI, Vol.4, Issue 3, December 2007 www.ommi.co.uk
38
HPSH3 was evident in only 1 of the six row 2 tubes with a bottom TC. However, there
was significant chilling at the bottom of all of the five HPSH2 row 1 tubes installed with
a TC through which HP steam flowed up and out before entering at the top of row 2 of
HPSH3.
The foregoing observations suggest that when the HP bypass opened and significant
steam flow and pressure drop was established through the HPSH sections, little or no
condensate was blown forward from the lower return header up the row 1 tubes of
HPSH2 into the inlet of HPSH3. However, considerable quantities of condensate were
blown from HPSH1 into the inlet of HPSH2 when the HP bypass opened, as evidenced
by sudden large temperature quenches at the top and also the bottom of all HPSH2 row 2
tubes installed with a TC, (refer to item 3.3.4, below). The drain pipes from HPSH3 and
HPSH2 have an unvalved interconnecting pipe close to the bottom of the HRSG casing.
It appears that instead of draining to the blowdown vessel a significant portion of the
condensate in the lower return headers of HPSH2 was blown through the drain
interconnecting pipe and in reverse direction through the HPSH3 drain pipe and into the
lower return header of HPSH3, (which would be at lower pressure than that of HPSH2),
and then forward through the upflowing row 1 of HPSH3. This phenomenon has been
observed in tests on other designs of HRSG with TCs which have interconnections
between the drains from different sections of the HPSH that normally operate at different
pressures due to the steam-side pressure drop through successive sections of the HPSH.
Instead of arranging the drain pipes inside the casing to have sufficient flexibility to limit
differential thermal expansion stresses in the pipes to be compatible with limit stresses
when the pipe is heated to gas inlet temperature a piping interconnection is installed just
outside the casing between the HPSH3 and HPSH2 drain pipes to the blowdown vessel to
provide a cooling steam flow through the drain interconnection to lower the drain pipe
temperature inside the casing below the temperature of CT exhaust gas that flows around
baffle plates, under the lower headers and over the stiffly arranged drain pipes.
If this drain cooling arrangement is used a motivated isolating valve should be installed in
the interconnecting pipe between HPSH2 and HPSH3 drain pipes and controls arranged
to interlock the isolating valve shut during startup and automatically re-opened when the
CT load exceeds 20%.
3.3.4 Condensate migration in HPSH during hot/warm HRSG startup using ETM
to minimizes CT exhaust gas temperature Tube temperatures measured at top and bottom tubes of HPSH3, HPSH2 and HPSH1 are
provided in Figures 27 to 34, inclusive, from a warm, almost hot, start from an initial HP
drum pressure of 320psig on 3-13-03 using CT ETM with a setpoint for exhaust gas of
760°F (404°C) when at CT minimum load.

OMMI, Vol.4, Issue 3, December 2007 www.ommi.co.uk
39
Figure 27
Figure 28

OMMI, Vol.4, Issue 3, December 2007 www.ommi.co.uk
40
Figure 29
Figure 30

OMMI, Vol.4, Issue 3, December 2007 www.ommi.co.uk
41
Figure 31
Figure 32

OMMI, Vol.4, Issue 3, December 2007 www.ommi.co.uk
42
Figure 33
Figure 34
OMMI, Vol.4, Issue 3, December 2007 www.ommi.co.uk
43
The presence of significant quantities of condensate at or below HP saturation
temperature in the lower portion of tubes and bottom headers of HPSH1, HPSH2 and
HPSH3, evident throughout the purge and then for almost 10 minutes after the CT fired
and accelerated to synchronous speed, occurred because condensate formed in HPSH
tubes of all three sections during the purge and prior to firing of the CT could not be
continuously removed during the purge and initial period of firing. Instead, condensate
was only partially removed from each HPSH section in turn by sequentially cycling open
and closed one drain valve at a time over a few complete drain open-close cycles. The
HRSG has no condensate drain pots on HPSH or RH drain lines to automate the opening
and closing of fast stroking air operated drain isolation valves that are an essential design
feature to ensure only condensate (and no steam) is discharged to the blowdown vessel.
If all drain HPSH valves on the nominal 2 inch drain lines were opened simultaneously,
HP pressure would rapidly fall. Furthermore, in common with most HRSGs the
blowdown vessel is not capable of safely handling the very large flow rates of HP steam
discharged at high temperature when all drains are opened simultaneously. Therefore it
is necessary to sequentially cycle open and closed each of the separately drained sections
of HPSH and RH in order not to overload the blowdown vessel. This provides
inadequate time to completely remove all condensate from every HPSH and RH section.
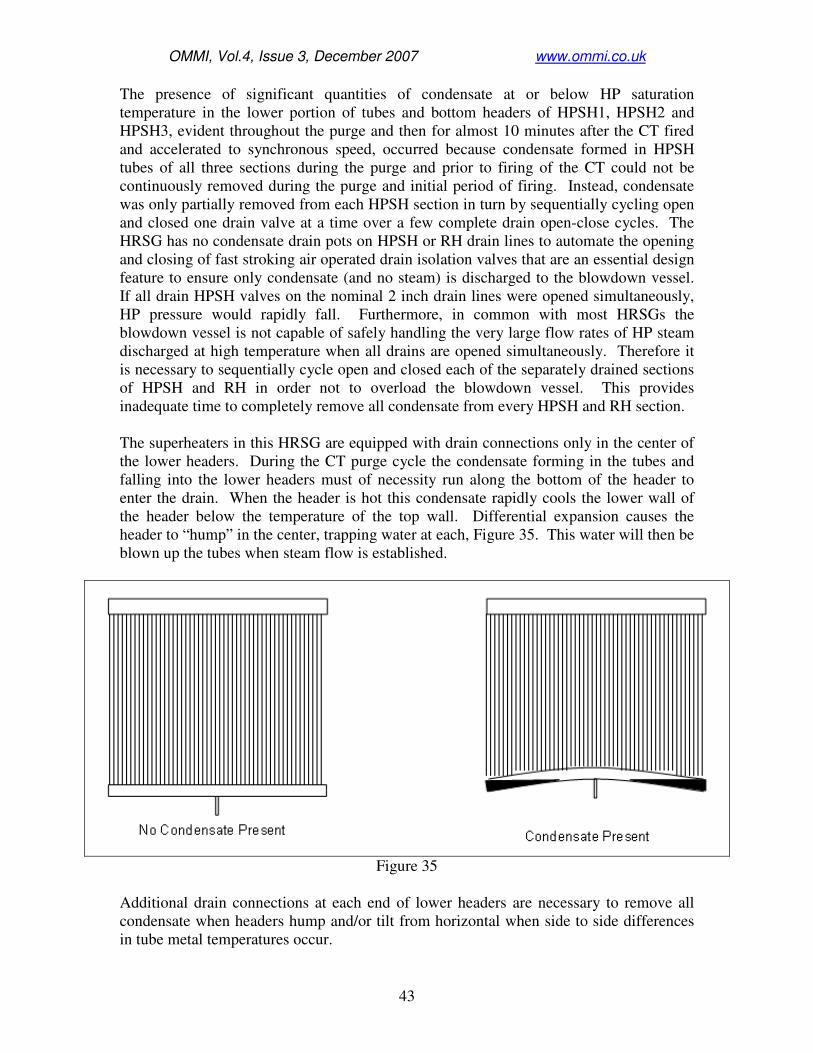
The superheaters in this HRSG are equipped with drain connections only in the center of
the lower headers. During the CT purge cycle the condensate forming in the tubes and
falling into the lower headers must of necessity run along the bottom of the header to
enter the drain. When the header is hot this condensate rapidly cools the lower wall of
the header below the temperature of the top wall. Differential expansion causes the
header to “hump” in the center, trapping water at each, Figure 35. This water will then be
blown up the tubes when steam flow is established.
Figure 35
Additional drain connections at each end of lower headers are necessary to remove all
condensate when headers hump and/or tilt from horizontal when side to side differences
in tube metal temperatures occur.

OMMI, Vol.4, Issue 3, December 2007 www.ommi.co.uk
44
When small diameter intermediate headers are used, as in the subject superheaters, there
is also the issue of condensate being capable of flowing along the length of the header to
a single drain connection at the rate it is forming in the tubes above. Multiple drain
connections may be required to prevent condensate from flooding some tubes, Figure 36.
Figure 36
During the warm/hot start on 3-13-03, at 21:42, when the HP bypass PCV opened,
undrained condensate was blown from the bottom headers of HPSH1, Figure 27, out of
the top of the tubes of some of the row 1 tubes of HPSH1, Figure 28, but had flashed to
steam when it reached the top inlet, (row 2) tubes of HPSH2, Figure 29. Tubes and
headers at the bottom of HPSH2 remained at or below saturation temperature until they
too cleared of condensate between 21:43 and 21:45, Figures 30 and 31. Condensate at or
below saturation temperature also remained in the bottom tubes and header of HPSH3
until after the HP bypass valve opened, particularly in the row 1 tubes, Figure 33, which
are connected to the side of the bottom header. By the time the steam and condensate
mixture reached the top outlet of the row 1 tubes of HPSH3, all condensate had flashed to
steam, Figure 34.
When, during the purge cycle, the gas turbine exhaust air temperature blown through the
superheater/reheater is below the HP drum saturation temperature, large quantities of
condensate form in the finned tubes of each tube row. If this condensate is not removed
as quickly as it forms and floods the lower headers a partial vacuum is formed in the
tubes. This vacuum, along with any pressure developed in the drum, draws/pushes the
condensate up the tubes and over the top *5
, Figure 37.

OMMI, Vol.4, Issue 3, December 2007 www.ommi.co.uk
45
Figure 37
If drains, or drain cooling interconnections, provide a path between headers operating at
even slightly different pressures when steam flow is established, the condensate will
migrate from the lower to the higher pressure superheater, Figure 38.

OMMI, Vol.4, Issue 3, December 2007 www.ommi.co.uk
46
Figure 38
During this warm startup, some significant tube-to-tube temperature differences occurred,
although these were less prevalent than observed in the RH. In HPSH3, a temperature
difference of about 150°F (83°C) occurred between one tube that cleared of condensate
earlier than the remainder. A second, more severe tube temperature anomaly occurred 2
minutes later in another tube (tube #20) which was briefly quenched to saturation
temperature by 300°F (167°C) below the temperature of all other tubes. Tube 20 is the
closest tube with a TC to the drain connection on the bottom header of HPSH3 and it is
probable that the slug of condensate that caused this large quench was probably blown
forward from the bottom header of HPSH2 through the interconnection between the
HPSH2 and HPSH 3 drain pipes.
3.3.5 Recommendations for mitigating/eliminating condensate migration damage Install or modify as much as possible SH and RH drains in accordance with the details
listed in Section 3.3.6 below.
OMMI, Vol.4, Issue 3, December 2007 www.ommi.co.uk
47
Insure non-HRSG piping, such as cold reheat, is properly sloped from steam turbine
towards HRSG and equipped with effective drain pots so that condensation and/or HP
bypass spraywater is removed before it can enter the reheater.
3.3.6 Summary of effective drain system design Condensate must be removed from lower headers at the rate at which it forms if forward
migration is to be prevented when steam flow through the tubes is first established.
Analysis of tube temperature data from several HRSGs of different design and
manufacturer results in the following summary of features necessary to accomplish this.
─ Small diameter headers (like those in the subject SH) require the installation of
multiple drains along their length to facilitate rapid drainage.
─ All headers must have a drain connection immediately adjacent to each end cap to
prevent condensate being trapped as the headers “hump” and tilt from horizontal.
─ Drain piping must be sized to facilitate two phase flow at a rate equal to that at
which condensate forms under all operating conditions. A “near cold” start at 2 to
3 psig HP drum pressure generally sets the minimum drain pipe size for this
condition.
─ Drain pots equipped with conductivity probes to detect high and low liquid level
in the pot are necessary on each header (or series of side by side headers if
multiple modules are used) operating at even slightly different pressure.
─ Drain system conductivity probes must be serviceable with the HRSG
pressurized.
─ Piping from each pot must be routed to the blowdown vessel without
interconnection with other drains.
─ All interconnecting piping between SH/RH must be sloped at a minimum of 1:50
with HRSG cold or hot in the direction of steam flow and be equipped with
effective drain pots at all low points.
─ All drain piping must be continuously sloped at a minimum of 1:50 in cold and
also hot HRSG condition, with no low points, toward the blow down vessel.
─ Automated “master” and “martyr” valves should be arranged in the drain piping
between the pot and blowdown vessel with the martyr valve located immediately
before the blowdown vessel nozzle.
─ DCS logic should use the above conductivity probe “high” “low” signals to
actuate the drain valves so that the master valve opens and closes with minimal
differential pressure across its seat and the martyr valve always experiences the
more sever throttling duty.
─ The martyr valve must be capable of variable preset flow rates depending upon
HP pressure. This can be accomplished by either positioning the valve to
different openings or varying the open time of a fast acting valve based upon
pressure related signals from the DCS.
─ No interconnection of drain pipes from headers (or series of side by side headers
if multiple modules are used) that operate at even slightly different pressure when
there is steam flow through the HPSH or RH can be permitted during startup. If
interconnections are necessary during operation to provide drain line cooling, they
must be equipped with automatic isolation valves that are closed during startup
and open during normal operation.
─ Reheater drains must be routed to an independent reheater blowdown vessel.
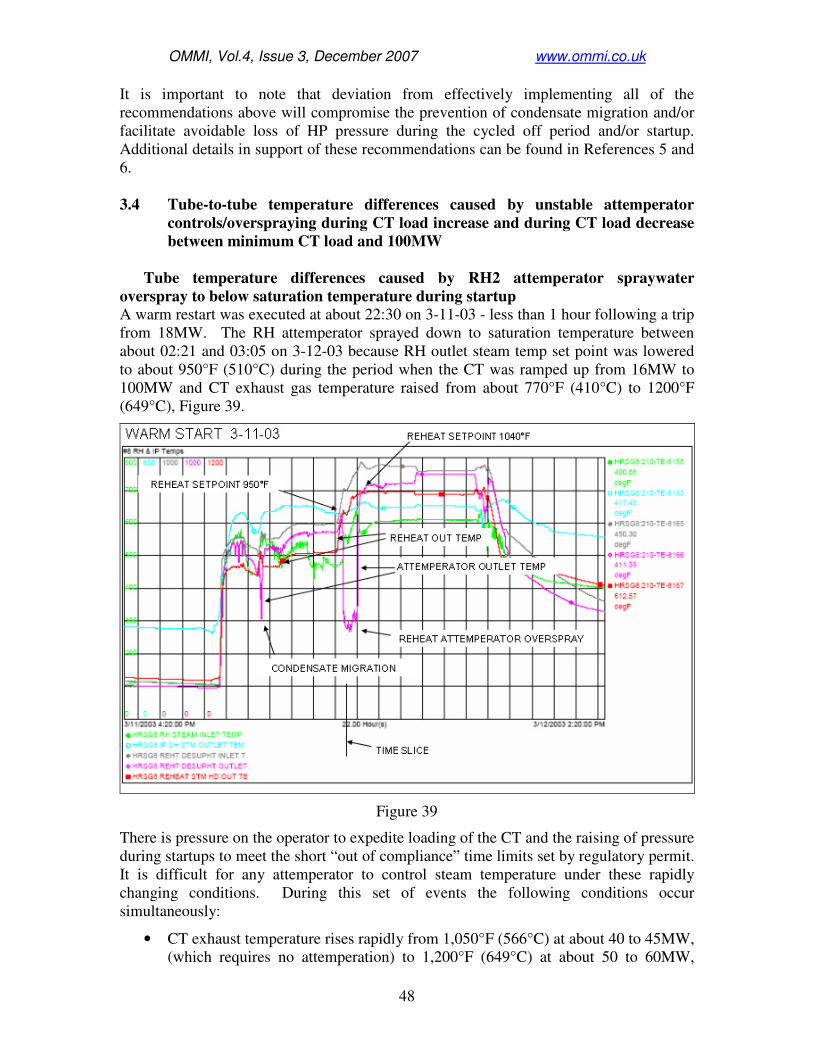
OMMI, Vol.4, Issue 3, December 2007 www.ommi.co.uk
48
It is important to note that deviation from effectively implementing all of the
recommendations above will compromise the prevention of condensate migration and/or
facilitate avoidable loss of HP pressure during the cycled off period and/or startup.
Additional details in support of these recommendations can be found in References 5 and
6.
3.4 Tube-to-tube temperature differences caused by unstable attemperator
controls/overspraying during CT load increase and during CT load decrease
between minimum CT load and 100MW
Tube temperature differences caused by RH2 attemperator spraywater
overspray to below saturation temperature during startup A warm restart was executed at about 22:30 on 3-11-03 - less than 1 hour following a trip
from 18MW. The RH attemperator sprayed down to saturation temperature between
about 02:21 and 03:05 on 3-12-03 because RH outlet steam temp set point was lowered
to about 950°F (510°C) during the period when the CT was ramped up from 16MW to
100MW and CT exhaust gas temperature raised from about 770°F (410°C) to 1200°F
(649°C), Figure 39.
Figure 39
There is pressure on the operator to expedite loading of the CT and the raising of pressure
during startups to meet the short “out of compliance” time limits set by regulatory permit.
It is difficult for any attemperator to control steam temperature under these rapidly
changing conditions. During this set of events the following conditions occur
simultaneously:
• CT exhaust temperature rises rapidly from 1,050°F (566°C) at about 40 to 45MW,
(which requires no attemperation) to 1,200°F (649°C) at about 50 to 60MW,

OMMI, Vol.4, Issue 3, December 2007 www.ommi.co.uk
49
which requires very high attemperation flow rate to limit HPSH and RH outlet
steam temperatures to their design limit temperatures.
• Steam flow is relatively low and further decreased if HP pressure is being
simultaneously raised, since part of the evaporation is required to compress the
volumes occupied by steam in drum, HPSH tubes and piping. Thus temperature
rise through primary and secondary heating sections of the HPSH and RH are
relatively high when CT exhaust gas temperature and flow are both increasing
rapidly.
Under the above conditions RH and HPSH steam outlet temperature usually exceed
design limits for several minutes. While the outlet header experiences some accelerated
creep life consumption, the damage would be insignificant if the duration of the event is
kept short, especially when pressure is low.
The subject RH is equipped with an instantaneous high outlet steam temperature trip
mandated by the jurisdiction’s National Board Inspector. In other jurisdictions,
automatic CT load run backs are mandated. In an effort to avoid this trip or load run
back operators lower the RH outlet steam temperature set point during the CT load
increase transient that takes exhaust gas temperature to its maximum of 1200°F (649°C).
If the attemperator setpoint is lowered too much, an overspray condition is inevitable.
Far more damage is done to the RH (and HPSH) by quenching from the overspray event
than would be caused if the design RH (and HPSH) steam temperature were
intermittently exceeded. This is just one example where poorly thought out regulatory
limits (short startup times, overly conservative high steam temperature trips and/or
automatic CT load run-backs that give no consideration to much more severely damaging
consequences) sometime create a substantially more damaging problem than the one
being solved. Transients like this one are much better handled by automation that
eliminates the need for the operator to attempt to take things into his own hands.
Overspraying (to about 50°F (28°C) below RH saturation temperature of about 350°F
(177°C) according to the permanent thermocouple in the RH interconnecting manifold
downstream of the attemperator water injection nozzle) occurred for about 40 minutes,
Figure 39.
Figure 40 highlights the very poor mixing of the spraywater with steam during
overspraying. A disproportionate amount of attemperation water travels to the blind end
of the manifold and all row 1 and row 2 tubes supplied by steam through the 4th inlet
pipe branch at the blind end of the manifold are at about 350°F (177°C), which is
saturation temperature at the prevailing RH pressure. Some of the tubes supplied with
steam from the three preceding pipe branches off the manifold are at saturation
temperature, but the majority of those tubes measured are between 100 and 270°F (56
and 150°C) above saturation temperature. Tubes at the outlet of RH2 fed from the
branch pipe closest to the attemperator operate at higher temperature than those supplied
by a pipe branch further away from the attemperator. Some tubes are more than 150°F
(83°C) hotter than other adjacent tubes.
HPSH and RH outlet temperature setpoints should not be lowered significantly below
their design value of 1050°F (566°C), as it can result in damaging tube-to-tube
temperature differences when the resulting outlet temperature from either the HPSH or
RH the attemperator is too close to saturation temperature. It also causes very damaging

OMMI, Vol.4, Issue 3, December 2007 www.ommi.co.uk
50
downshocks and upshocks to pipes and headers downstream of the attemperator.
Figure 40
3.4.2 Tube temperature differences caused by RH2 attemperator spraywater
overspray to below saturation temperature during CT deloading prior to
shutdown.
A similarly severe overspray event with very damaging steam temperature downshock-
upshock cycles was recorded during both the startup and shutdown performed on 3-14-
04, Figure 41. Note the sudden drops in RH attemperator outlet temperature. The steam
temperature drop on the left is during startup, similar to that in figure 39, while the steam
temperature drop on the right is during shutdown. This overspray event again occurs
when the gas turbine load transitions the range below 100 MW in which exhaust
temperature is still at the isothermal maximum while the steam flow rate is
simultaneously reducing.
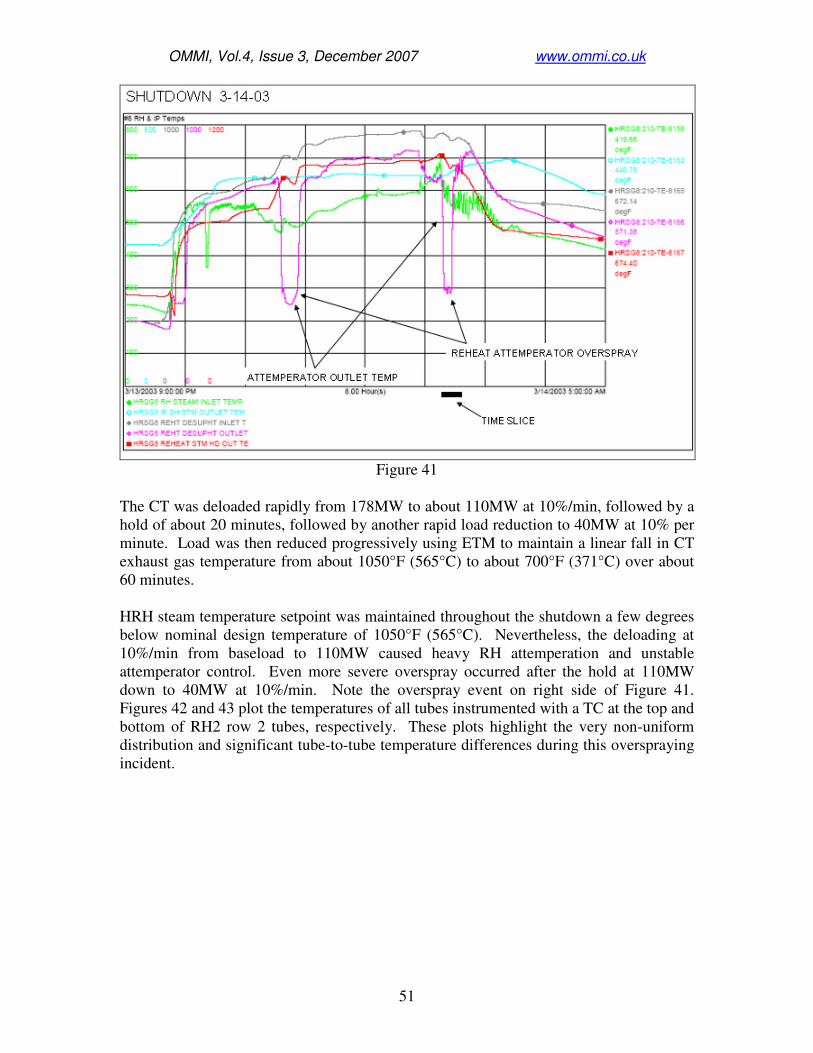
OMMI, Vol.4, Issue 3, December 2007 www.ommi.co.uk
51
Figure 41
The CT was deloaded rapidly from 178MW to about 110MW at 10%/min, followed by a
hold of about 20 minutes, followed by another rapid load reduction to 40MW at 10% per
minute. Load was then reduced progressively using ETM to maintain a linear fall in CT
exhaust gas temperature from about 1050°F (565°C) to about 700°F (371°C) over about
60 minutes.
HRH steam temperature setpoint was maintained throughout the shutdown a few degrees
below nominal design temperature of 1050°F (565°C). Nevertheless, the deloading at
10%/min from baseload to 110MW caused heavy RH attemperation and unstable
attemperator control. Even more severe overspray occurred after the hold at 110MW
down to 40MW at 10%/min. Note the overspray event on right side of Figure 41.
Figures 42 and 43 plot the temperatures of all tubes instrumented with a TC at the top and
bottom of RH2 row 2 tubes, respectively. These plots highlight the very non-uniform
distribution and significant tube-to-tube temperature differences during this overspraying
incident.

OMMI, Vol.4, Issue 3, December 2007 www.ommi.co.uk
52
Figure 42
Figure 43
OMMI, Vol.4, Issue 3, December 2007 www.ommi.co.uk
53
3.4.3 HPSH3 tube temperature differences during load increase ramps at startup
and load decrease ramps prior to shutdown by unstable attemperator
controls/overspraying Gross overspraying of the steam at discharge from the HPSH attemperator, down to or
below saturation temperature, occurred during load ramping between 30MW and
100MW at every startup recorded in March, April and early May, 2003. These events
caused large, severe steam temperature ramps both down, and later up, at the HPSH
attemperator outlet that will lead to premature cracking at the inner surfaces of the
downstream pipes and headers at strain concentrating features. The most vulnerable
locations are the intersection of the inner surfaces of both the inlet pipe nozzles and also
the tubeholes with the bore of the HPSH3 inlet headers. During overspraying incidents,
large temperature differences also occurred between tubes of HPSH3 intended to operate
at closely similar temperatures because unflashed spraywater droplets were concentrated
in tubes positioned closest to the inlet pipe branch on HPSH3. Peak tube to tube
temperature differences up to 150°F (83°C) were measured, which develop potentially
significant damage at the toe of the tube to header attachment welds.
The overspraying was caused by very rapid loading of the CT (between about 30MW and
about 100MW) in conjunction with the practice, during this part of the startup, of
significantly lowering the HPSH3 (and also the RH2) outlet steam temperature set point
below the design setpoint (1,050°F (566°C)) to which the HPSH attemperators endeavor
to control. Simultaneous ramping up of HP pressure during the rapid load increase,
which lowers the HP steam flow rate, contributed to the overspraying problem.
Depending on the position of the attemperator within the HPSH surface; i.e., the
proportion of HPSH heating surface that is downstream of the attemperator, it is possible
that overspraying at HPSH (and RH) attemperators during startups can be avoided or
substantially mitigated. During an earlier startup, commencing about 19.00 hours on 1-
12-03, overspraying did not occur. No data is available from the PI archive (a proprietary
data archive system) for this period. However, from hard copy prints taken at the time
from the DCS historian, it is evident that the procedure adopted for the 1-12-03 startup
differed from that used during all of the startups recorded in March to May, 2003, in two
significant ways. Firstly, a 40 minute period was taken to raise the CT load from 30MW
to about 100MW, such that exhaust gas temperature ramped close to linearly from about
1,040°F (560°C) at 40MW up to 1,200°F (649°C) at about 55MW over a period of about
20 minutes, (i.e., an exhaust gas temperature mean ramp rate of about 8°F
(4.4°C)/minute), and then began to fall again above about 70MW. Secondly, the initial
setpoint selected for HPSH3 outlet steam temperature for attemperation control appeared
to be about 1,000°F (538°C), (significantly higher than used during the later startups, -see
below), which was then ramped up to 1,050°F (566°C) as soon as CT exhaust gas
temperature had started to reduce below 1,200°F (649°C).
The 7FA and 9FA CTs have exhaust gas temperature characteristics that are particularly
challenging to the HRSG HPSH and RH over the range of CT generator outputs between
35 to 40 MW and 90 to 100MW. When loading up the CT during startups through this
relatively low load range, the CT exhaust gas temperature rapidly ramps from about
1,050°F (566°C) at 40 to 45MW, up to 1,200°F (649°C) at about 50 to 55MW. (This
occurs over a load range that is somewhat higher with 9FA CTs). It then remains at

OMMI, Vol.4, Issue 3, December 2007 www.ommi.co.uk
54
about 1,200°F (649°C) until the CT generator output is above about 85 MW after which
it progressively reduces to about 1,150°F (621°C) between 100 and 105MW. During
startups, the HP steam flow is relatively low during the period when gas temperature is
increasing very quickly, especially if HP pressure is being simultaneously ramped up and
a significant portion of the HP evaporation is being utilized to compress the large steam
volume in the drum and HPSH steam spaces.
Attemperator controls usually inhibit the opening of the spraywater temperature control
valve until steam flow rate and/or spraywater demand flow rate exceed the minimum
permissible flow rates. Thus, when attemperation water demand ramps up very quickly,
from zero at 40 to 45MW and 1.050°F (566°C) gas temperature to very high spraywater
flow at 50 to 55MW and 1,200°F (649°C) gas temperature, by the time that demand
exceeds the minimum flow, it is already too late to prevent a significant overshoot above
the steam temperature setpoint.
Furthermore, attemperator controls inevitably have a relatively slow response time
because of the thermal inertia in the temperature measuring instrument in the HPSH3 (or
RH2) outlet pipes that results in a significant time lag between the moment when a
change in steam temperature at the HPSH (or RH) outlet, (which are the set points
condition for respective attemperator control), occurs and when that changed steam
temperature is accurately measured. When gas and thus also steam temperatures are
changing rapidly and by large amounts, not only does the thermal inertia of the
thermowell pocket cause significant errors due to time lag between measured and actual
steam temperature, so too does the time for steam to travel from the point where
spraywater is admitted to the measuring point at HPSH outlet further complicate the
control of HPSH (or RH) outlet steam temperature.
It is imprudent to significantly lower below the design outlet steam temperature the
control setpoints for the HPSH or RH interstage attemperators, especially during the
unstable, unpredictable fluctuations in steam flow, pressure and temperature conditions
that occur during startups, without establishing by a series of trial startups from different
initial conditions that there will always be at least 50°F (28°C), preferably 100°F (56°C)
of superheat at attemperator outlet throughout the reloading process following startup. At
the time the above events occurred no information was displayed to the operator to warn
when the risk of causing severe damage by overspraying to close to or below saturation
temperature is imminent.
It is evident, from the more controlled startup at about 19.00 hours on 1-12-03, that stable
control of HPSH (and RH) outlet steam temperatures to temperature not more than 20 to
40°F (11 to 22°C) lower than their design setpoints of 1,050°F (566°C) can be achieved
during startups by controlling the CT exhaust temperature ramp to a moderate rate that is
compatible with the practical response time of the attemperator controls temperature
measuring element. The risk of high steam temperature excursions can be further
reduced by avoiding simultaneous ramping of HP pressure during the loading period
most critical to control of HPSH and HRH outlet steam temperatures.
In some cases, the HP and/or RH outlet steam temperature setpoints are lowered to
shorten the period of heat soaking of the ST with the CT at minimum load with exhaust
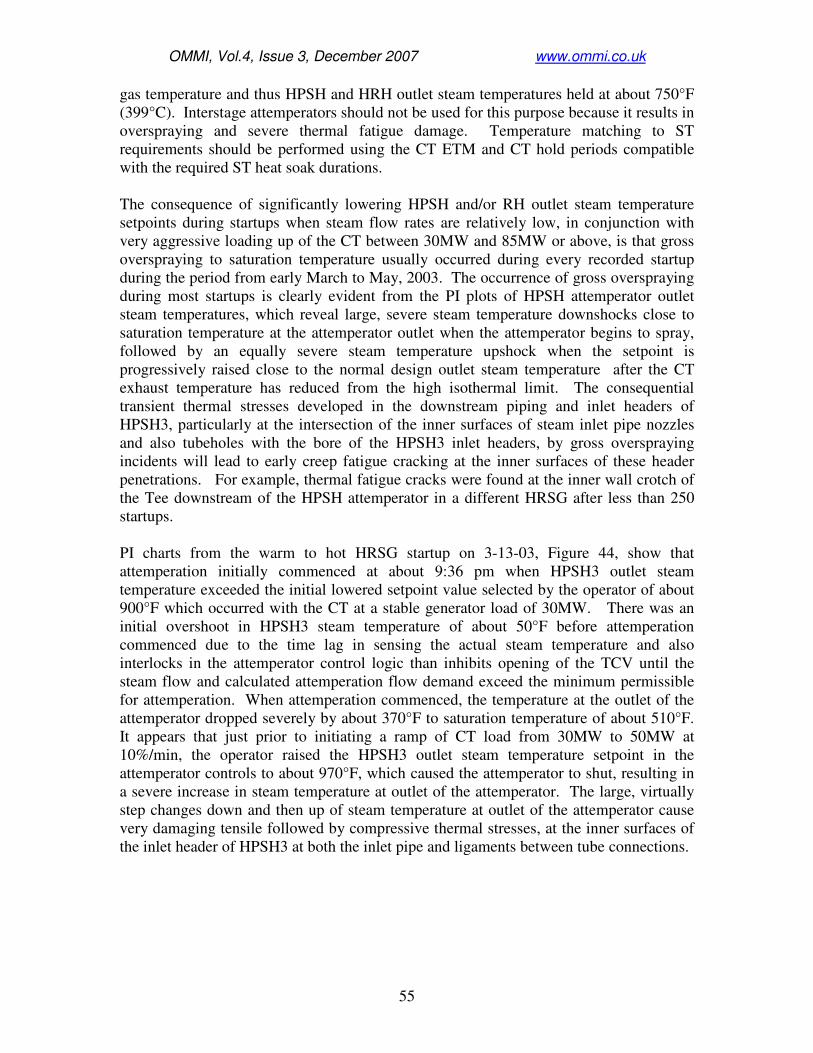
OMMI, Vol.4, Issue 3, December 2007 www.ommi.co.uk
55
gas temperature and thus HPSH and HRH outlet steam temperatures held at about 750°F
(399°C). Interstage attemperators should not be used for this purpose because it results in
overspraying and severe thermal fatigue damage. Temperature matching to ST
requirements should be performed using the CT ETM and CT hold periods compatible
with the required ST heat soak durations.
The consequence of significantly lowering HPSH and/or RH outlet steam temperature
setpoints during startups when steam flow rates are relatively low, in conjunction with
very aggressive loading up of the CT between 30MW and 85MW or above, is that gross
overspraying to saturation temperature usually occurred during every recorded startup
during the period from early March to May, 2003. The occurrence of gross overspraying
during most startups is clearly evident from the PI plots of HPSH attemperator outlet
steam temperatures, which reveal large, severe steam temperature downshocks close to
saturation temperature at the attemperator outlet when the attemperator begins to spray,
followed by an equally severe steam temperature upshock when the setpoint is
progressively raised close to the normal design outlet steam temperature after the CT
exhaust temperature has reduced from the high isothermal limit. The consequential
transient thermal stresses developed in the downstream piping and inlet headers of
HPSH3, particularly at the intersection of the inner surfaces of steam inlet pipe nozzles
and also tubeholes with the bore of the HPSH3 inlet headers, by gross overspraying
incidents will lead to early creep fatigue cracking at the inner surfaces of these header
penetrations. For example, thermal fatigue cracks were found at the inner wall crotch of
the Tee downstream of the HPSH attemperator in a different HRSG after less than 250
startups.
PI charts from the warm to hot HRSG startup on 3-13-03, Figure 44, show that
attemperation initially commenced at about 9:36 pm when HPSH3 outlet steam
temperature exceeded the initial lowered setpoint value selected by the operator of about
900°F which occurred with the CT at a stable generator load of 30MW. There was an
initial overshoot in HPSH3 steam temperature of about 50°F before attemperation
commenced due to the time lag in sensing the actual steam temperature and also
interlocks in the attemperator control logic than inhibits opening of the TCV until the
steam flow and calculated attemperation flow demand exceed the minimum permissible
for attemperation. When attemperation commenced, the temperature at the outlet of the
attemperator dropped severely by about 370°F to saturation temperature of about 510°F.
It appears that just prior to initiating a ramp of CT load from 30MW to 50MW at
10%/min, the operator raised the HPSH3 outlet steam temperature setpoint in the
attemperator controls to about 970°F, which caused the attemperator to shut, resulting in
a severe increase in steam temperature at outlet of the attemperator. The large, virtually
step changes down and then up of steam temperature at outlet of the attemperator cause
very damaging tensile followed by compressive thermal stresses, at the inner surfaces of
the inlet header of HPSH3 at both the inlet pipe and ligaments between tube connections.

OMMI, Vol.4, Issue 3, December 2007 www.ommi.co.uk
56
Figure 44
The CT was then ramped at 10%/min from 50MW to 95MW, which caused CT exhaust
gas temperature to ramp from 1,035°F (557°C) to 1,200°F (649°C) over about 5 minutes.
This resulted in another virtually stepped fall of 370°F (206°C) at the outlet of the
attemperator as the attemperator again sprayed down to saturation temperature.
Overspraying continued until the CT was at stable load of 125MW with exhaust gas
temperature reduced to 1,135°F (613°C) and the HPSH3 outlet steam temperature control
setpoint for the attemperator had been progressively raised manually up to almost
1,000°F (538°C).
What cannot be seen in the PI charts, but is evident from the temporary TCs data, is the
improper practice of overspraying at attemperators also causes large tube to tube
temperature differences in HPSH3 downstream of the attemperator which are likely to
result in premature cracking by fatigue or creep fatigue at the tube to header attachment
welds. Figure 45 plots the transient temperatures at the bottom of the row 1 tubes after
the steam and water droplets mixture has been heated while flowing down the inlet pass
of HPSH3 tubes. Tubes at the bottom of row 1 vary between 540°F (282°C) and 770°F
(410°C). Figure 46 plots, for the same event, the significantly lower variation in tube
temperatures, (between 860°F (460°C) and 930°F (499°C)), at the steam outlet from row
1 tubes after the contents had been further heated in the second pass of the final HPSH.
Although access precluded the installation of TCs at the inlet to the steam inlet row 2
tubes of HPSH3, it is reasonable to conclude that the magnitude of the tube temperature
anomalies at the top of row 1 tubes was significantly greater than in Figure 45. After the
attemperator TCV opened just after 22:35 it appears that those tubes closest to the inlet
pipe branches on the inlet header of HPSH3 were transiently quenched by more than
300°F (167°C) below the tubes more remote from the inlet pipe branches.
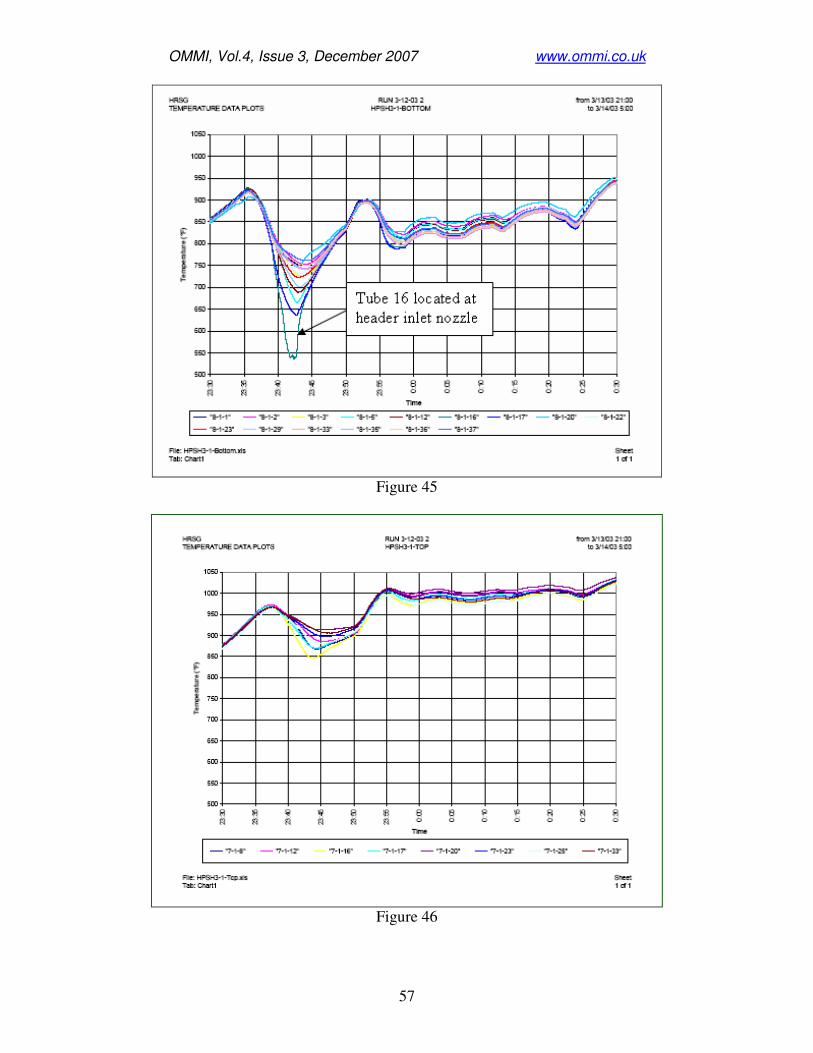
OMMI, Vol.4, Issue 3, December 2007 www.ommi.co.uk
57
Figure 45
Figure 46
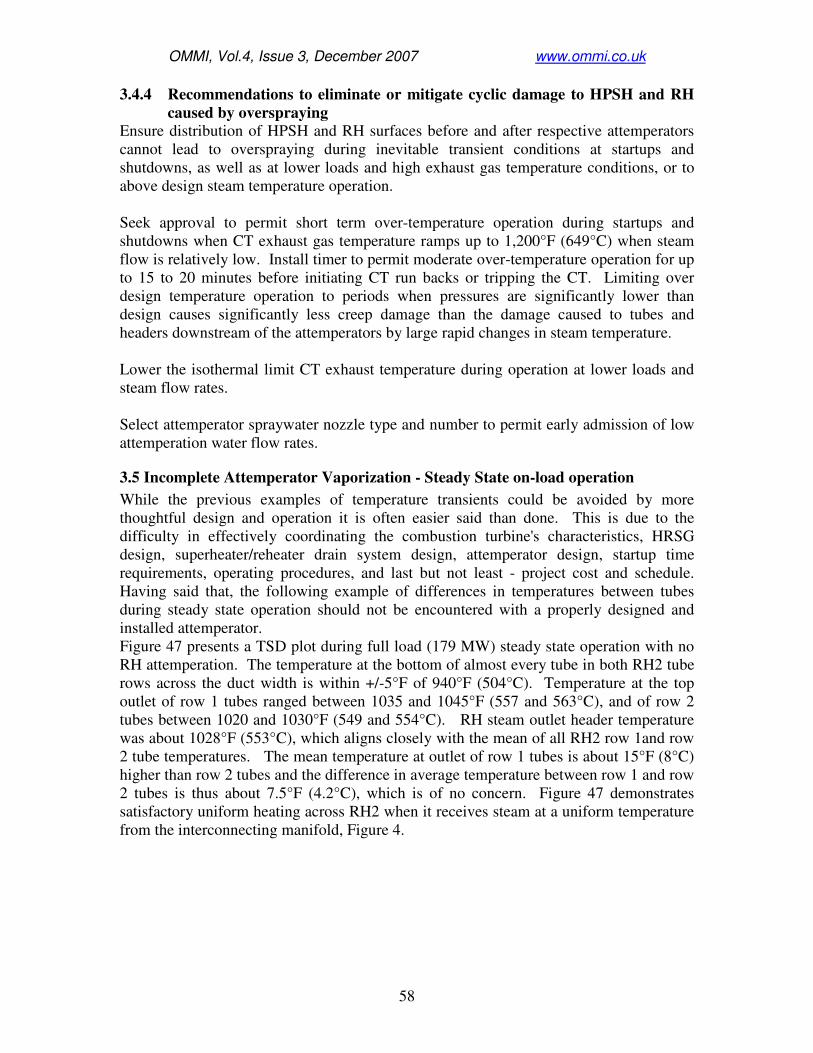
OMMI, Vol.4, Issue 3, December 2007 www.ommi.co.uk
58
3.4.4 Recommendations to eliminate or mitigate cyclic damage to HPSH and RH
caused by overspraying Ensure distribution of HPSH and RH surfaces before and after respective attemperators
cannot lead to overspraying during inevitable transient conditions at startups and
shutdowns, as well as at lower loads and high exhaust gas temperature conditions, or to
above design steam temperature operation.
Seek approval to permit short term over-temperature operation during startups and
shutdowns when CT exhaust gas temperature ramps up to 1,200°F (649°C) when steam
flow is relatively low. Install timer to permit moderate over-temperature operation for up
to 15 to 20 minutes before initiating CT run backs or tripping the CT. Limiting over
design temperature operation to periods when pressures are significantly lower than
design causes significantly less creep damage than the damage caused to tubes and
headers downstream of the attemperators by large rapid changes in steam temperature.
Lower the isothermal limit CT exhaust temperature during operation at lower loads and
steam flow rates.
Select attemperator spraywater nozzle type and number to permit early admission of low
attemperation water flow rates.
3.5 Incomplete Attemperator Vaporization - Steady State on-load operation
While the previous examples of temperature transients could be avoided by more
thoughtful design and operation it is often easier said than done. This is due to the
difficulty in effectively coordinating the combustion turbine's characteristics, HRSG
design, superheater/reheater drain system design, attemperator design, startup time
requirements, operating procedures, and last but not least - project cost and schedule.
Having said that, the following example of differences in temperatures between tubes
during steady state operation should not be encountered with a properly designed and
installed attemperator.
Figure 47 presents a TSD plot during full load (179 MW) steady state operation with no
RH attemperation. The temperature at the bottom of almost every tube in both RH2 tube
rows across the duct width is within +/-5°F of 940°F (504°C). Temperature at the top
outlet of row 1 tubes ranged between 1035 and 1045°F (557 and 563°C), and of row 2
tubes between 1020 and 1030°F (549 and 554°C). RH steam outlet header temperature
was about 1028°F (553°C), which aligns closely with the mean of all RH2 row 1and row
2 tube temperatures. The mean temperature at outlet of row 1 tubes is about 15°F (8°C)
higher than row 2 tubes and the difference in average temperature between row 1 and row
2 tubes is thus about 7.5°F (4.2°C), which is of no concern. Figure 47 demonstrates
satisfactory uniform heating across RH2 when it receives steam at a uniform temperature
from the interconnecting manifold, Figure 4.

OMMI, Vol.4, Issue 3, December 2007 www.ommi.co.uk
59
Figure 47
Figure 48 presents a TSD plot at 04:00 on 3-12-03 during stable operation at 110MW
with HRH header temperature of 1,046°F (563°C) and desuperheating of about 79°F
(44°C). The bottom of all tubes supplied by the 3rd
and 4th
RH2 inlet pipe branches
operate very close to 900°F (482°C), except for three Row 1 tubes that are about 30°F
(17°C) hotter. The bottom of all tubes supplied from the 1st and 2
nd pipe branch
downstream of the attemperator operate at about 745°F (396°C) and about 845°F
(452°C), respectively; i.e., respectively about 155°F (86°C) and 55°F (31°C) lower than
the bottom of the tubes supplied by the two pipe branches furthest from the attemperator.
The variation in temperature at outlet of tubes supplied by the different inlet pipes is
about 20% of the differences measured at the bottom of the tubes.
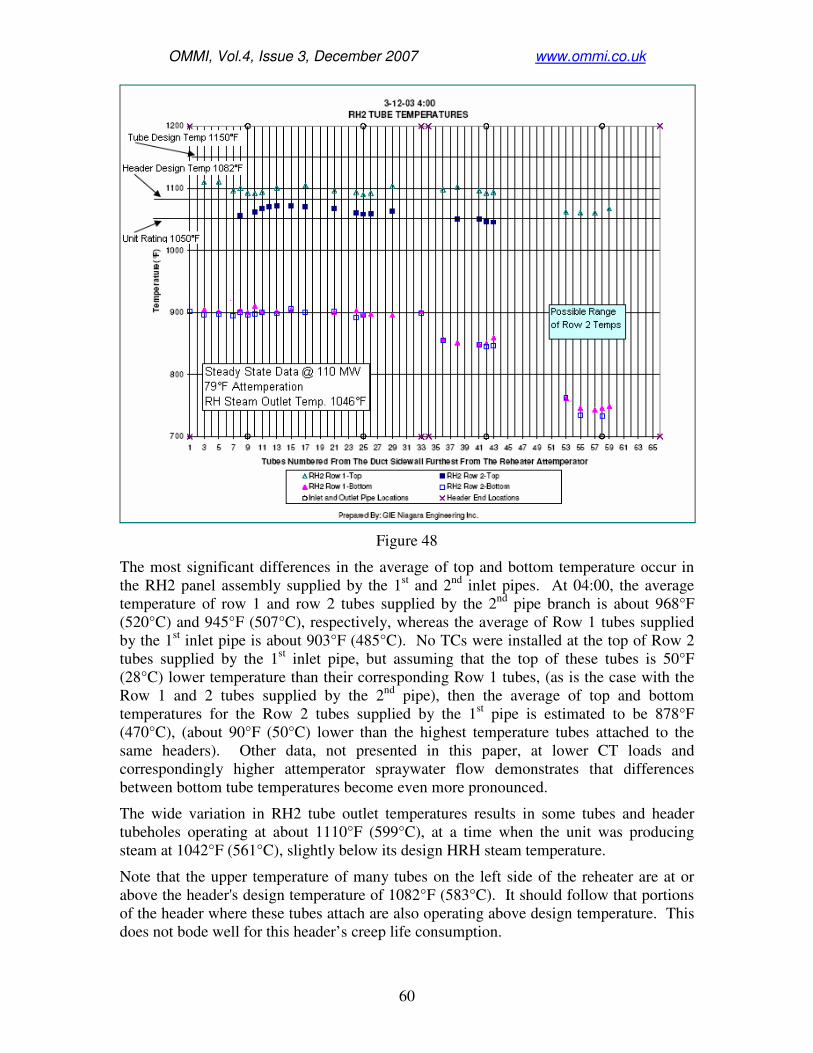
OMMI, Vol.4, Issue 3, December 2007 www.ommi.co.uk
60
Figure 48
The most significant differences in the average of top and bottom temperature occur in
the RH2 panel assembly supplied by the 1st and 2
nd inlet pipes. At 04:00, the average
temperature of row 1 and row 2 tubes supplied by the 2nd
pipe branch is about 968°F
(520°C) and 945°F (507°C), respectively, whereas the average of Row 1 tubes supplied
by the 1st inlet pipe is about 903°F (485°C). No TCs were installed at the top of Row 2
tubes supplied by the 1st inlet pipe, but assuming that the top of these tubes is 50°F
(28°C) lower temperature than their corresponding Row 1 tubes, (as is the case with the
Row 1 and 2 tubes supplied by the 2nd
pipe), then the average of top and bottom
temperatures for the Row 2 tubes supplied by the 1st pipe is estimated to be 878°F
(470°C), (about 90°F (50°C) lower than the highest temperature tubes attached to the
same headers). Other data, not presented in this paper, at lower CT loads and
correspondingly higher attemperator spraywater flow demonstrates that differences
between bottom tube temperatures become even more pronounced.
The wide variation in RH2 tube outlet temperatures results in some tubes and header
tubeholes operating at about 1110°F (599°C), at a time when the unit was producing
steam at 1042°F (561°C), slightly below its design HRH steam temperature.
Note that the upper temperature of many tubes on the left side of the reheater are at or
above the header's design temperature of 1082°F (583°C). It should follow that portions
of the header where these tubes attach are also operating above design temperature. This
does not bode well for this header’s creep life consumption.
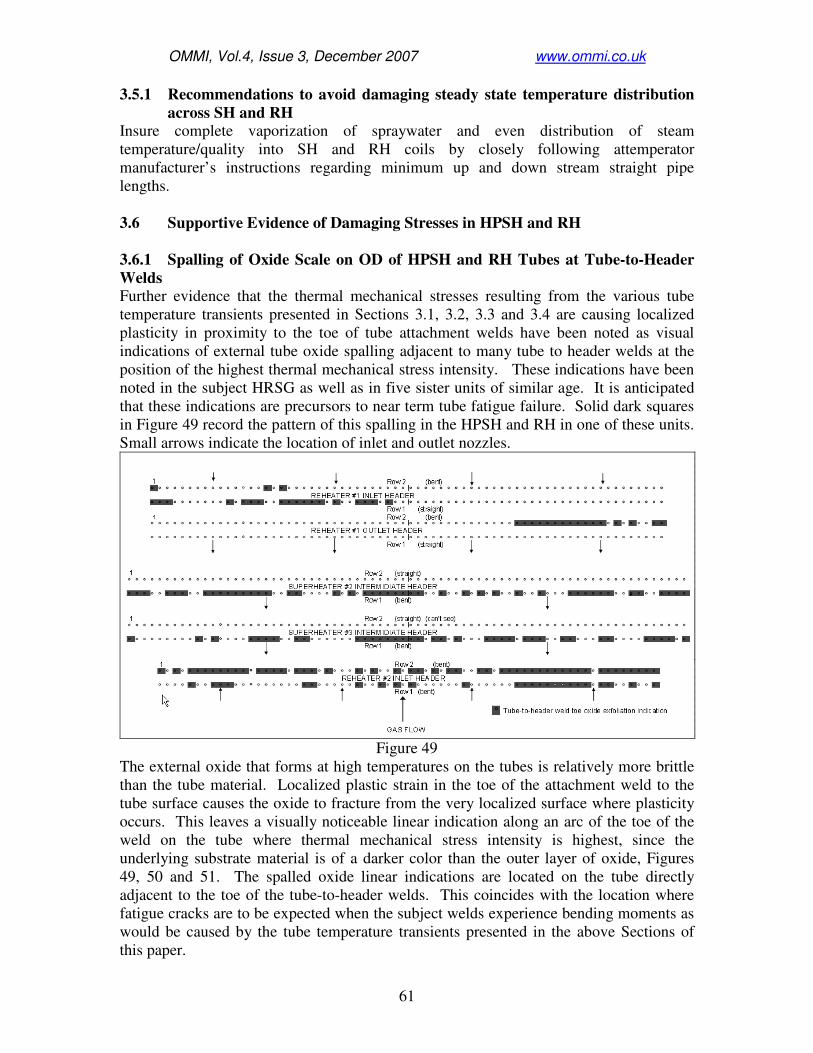
OMMI, Vol.4, Issue 3, December 2007 www.ommi.co.uk
61
3.5.1 Recommendations to avoid damaging steady state temperature distribution
across SH and RH Insure complete vaporization of spraywater and even distribution of steam
temperature/quality into SH and RH coils by closely following attemperator
manufacturer’s instructions regarding minimum up and down stream straight pipe
lengths.
3.6 Supportive Evidence of Damaging Stresses in HPSH and RH
3.6.1 Spalling of Oxide Scale on OD of HPSH and RH Tubes at Tube-to-Header
Welds Further evidence that the thermal mechanical stresses resulting from the various tube
temperature transients presented in Sections 3.1, 3.2, 3.3 and 3.4 are causing localized
plasticity in proximity to the toe of tube attachment welds have been noted as visual
indications of external tube oxide spalling adjacent to many tube to header welds at the
position of the highest thermal mechanical stress intensity. These indications have been
noted in the subject HRSG as well as in five sister units of similar age. It is anticipated
that these indications are precursors to near term tube fatigue failure. Solid dark squares
in Figure 49 record the pattern of this spalling in the HPSH and RH in one of these units.
Small arrows indicate the location of inlet and outlet nozzles.
Figure 49
The external oxide that forms at high temperatures on the tubes is relatively more brittle
than the tube material. Localized plastic strain in the toe of the attachment weld to the
tube surface causes the oxide to fracture from the very localized surface where plasticity
occurs. This leaves a visually noticeable linear indication along an arc of the toe of the
weld on the tube where thermal mechanical stress intensity is highest, since the
underlying substrate material is of a darker color than the outer layer of oxide, Figures
49, 50 and 51. The spalled oxide linear indications are located on the tube directly
adjacent to the toe of the tube-to-header welds. This coincides with the location where
fatigue cracks are to be expected when the subject welds experience bending moments as
would be caused by the tube temperature transients presented in the above Sections of
this paper.
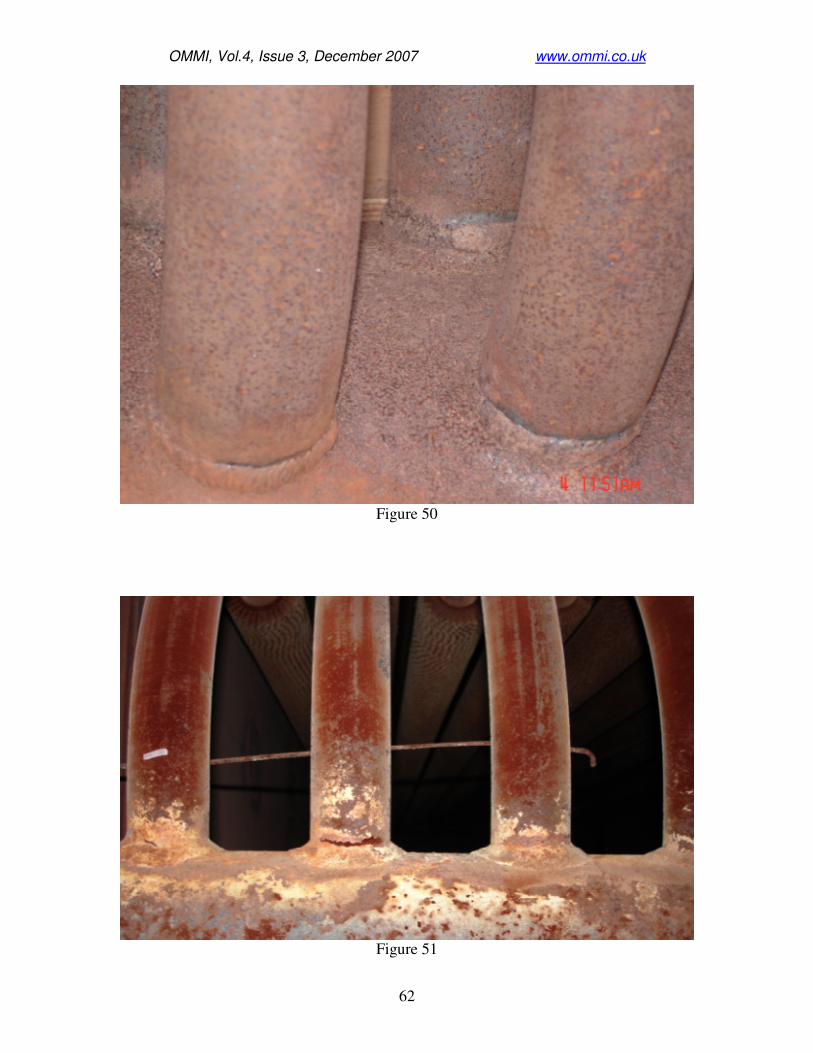
OMMI, Vol.4, Issue 3, December 2007 www.ommi.co.uk
62
Figure 50
Figure 51

OMMI, Vol.4, Issue 3, December 2007 www.ommi.co.uk
63
Figure 52
3.6.2 Superheater/Reheater Failure History
Although the subject 2X1 CC plant has only accumulated 2000 operating hours and 170
starts, it has experienced several SH and RH pressure part failures. One tube-to-header
failure has occurred on Row 1 of the RH1 outlet header and two tube-to-header failures
have occurred on adjacent tubes on Row 1 of the HPSH2 intermediate header, Figure 52.
The failures were manifested as cracks in the tube immediately adjacent to the toe of the
attachment weld. Metallurgical analysis identified thermal fatigue as the failure
mechanism in the HPSH2 failures and creep fatigue in the RH1 failure.
Most recently a through wall crack occurred in one of the inlet nozzles to RH2, Figure
53. The crack was located in the P91 nozzle just above the attachment weld to the RH1
to RH2 interconnection manifold. The failed nozzle is located immediately down stream
of the RH attemperator, Figure 4. Metallurgical analysis identified thermal quenching
(from repeated overspraying during startups and shutdowns) at the internal surface of the
pipe and nozzle as the crack initiation mechanism. However, crack propagation through
the wall was probably driven by thermally induced bending stresses induced during
startups. During hot starts the bottom of the long, stiff horizontal RH2 inlet manifold is
cooled by condensate pooled along the bottom of the much hotter pipe causing the pipe to
want to bow. The bowing is restrained by the short stiff inlet connections to the RH2
inlet headers, which develop a high bending moment at the crack initiation site. It
appears that the thermal mechanical consequences of the predictable presence of
condensate along the bottom of the pipe may not have been considered during pipe stress
analysis.

OMMI, Vol.4, Issue 3, December 2007 www.ommi.co.uk
64
Figure 53
4 Cycling Problems in Economizers and Preheaters
4.1 HP Economizer 2 (HPEC2) design arrangement HPEC2 receives feedwater via HPEC1 from the HP boiler feed pump, which takes its
suction from the LP drum. The feedwater regulator is located before HPEC2 such that
the pressure in the outlet section of HPEC2 is only marginally higher than the prevailing
HP drum pressure, since there is no valve between HPEC2 and HP drum inlet.
HPEC2 consists of 8 rows of tubes (numbered 1 through 8 in the direction of gas flow),
Figure 54. Half of the tubes, (every alternate tube), in each of rows 3 though 8 flow up
while the other half flow down. HPEC2 has an upper inlet header with a top mounted
single pipe inlet nozzle in the center of the header. From this header a single “half row”
of down-flowing tubes (row 8-down) connect to a lower return header at 12:00. Between
each of these down-flowing tubes is an up-flowing tube (row 8-up), also connected at
12:00 to this same header. Tubes in row 8-up have a 180° hairpin bend at the top, on the
other side of which tube row 7-down connects at 12:00 to another lower return header.
This configuration of up and down flowing tubes with a hairpin at the top and shared
return header at the bottom is repeated through to row 3-up. Row 3-up has a hairpin bend
joining it to row 2-down. Half of the row 2 tubes flow down and connect to the forward-
most (gas inlet side) return header via a tube bend near the tube to header weld. There
are two parallel rows of final up flow tubes, (a “full row” of row 1 and a half-row of row
2-up tubes), both connected to the forward most return header and the HPEC2 outlet
header via tube bends on both ends. The outlet header is equipped with a single outlet
pipe nozzle at the center of the header. Two identical side-by-side modules are utilized in
HPEC2. Only the left module is instrumented with TCs. Tubes are in line and each

OMMI, Vol.4, Issue 3, December 2007 www.ommi.co.uk
65
module has 39 tubes in each row; i.e., a total of 78 tubes per row across HPEC2. The
location of TCs is shown on Figure 54.
HPEC2 Tubes and Headers Arrangement
Figure 54
In the cold, as-installed condition, the weight of the lower return headers and tubes and
their water contents is notionally supported at the underside of each upper hairpin bend
by “beams” beneath the intrados of each 180° tube bend. In practice, it is impossible to
align all hairpin bends at the same precise elevation and the few hairpin bends on the
shortest tubes in each row of the cold tubes will support the weight of adjacent tubes with

OMMI, Vol.4, Issue 3, December 2007 www.ommi.co.uk
66
hairpin bends that are not in contact with the support beam even under cold set
conditions.
During operation of the HRSG, the temperature of the feedwater is progressively raised
through each successive row of the 8 tube rows. Under such conditions the tubes in each
row expand thermally, by an amount that is smallest on the coolest row 8 tubes and
progressively increases in each row as feedwater and tube temperatures increase, being
largest on the warmest outlet row 1 tubes. This causes substantial redistribution of
weight from the hotter outlet rows to the hairpin bend rows closest to the feedwater inlet
and to the inlet row of tubes that are attached at each end to relatively stiff headers *10
,
Figure 55. Additional information on hair pin tube type economizers can be found in
Section 5.4 of Reference 7 and Section 7.11.3 of Reference 10.
Figure 55
Since there are no upper headers between the inlet and outlet rows on HPEC2 there is no
means to vent air trapped during filling or steam formed in the HPEC2 tubes during
operation. Air or steam trapped in the 180° hairpin blend will stall flow in that tube.
Those tubes with feedwater flow stagnated by unvented air trapped at the top hairpin
bend will approach gas temperature, further elongating and shedding its support load to
cooler tubes.
The inability to predict the actual load carried by each hairpin bend due to cold alignment
differences between tubes, which or how many tubes may be blocked by steam or air, and
how often some become steam bound, clear and again become steam bound, make it
impossible to determine the stress range and frequency of cyclic loading, hence it is not
possible to accurately determine the fatigue life of these components. For these reasons
some HRSG manufacturers who offered unvented economizer designs have abandoned
them for vented arrangements.

OMMI, Vol.4, Issue 3, December 2007 www.ommi.co.uk
67
The thermal-mechanical mechanisms that develop forces and stresses in tubes and bends
of this type of preheater and economizer design are explained in some detail in Section
7.11.3, pages 7.42 to 7.47, of Reference 10.
4.1.1 Perpetual flow-stagnation in some tubes of HPEC2 over the entire load range
Two examples are provided below from measured tube temperature anomalies caused by
perpetual feedwater flow stagnation in some tubes of most rows of hairpin bends with
unvented airlocks, one following a cold startup on 1-12-03, Figures 56 - 63, and the other
following a hot startup on 3-31-03, Figures 64 - 71. These two examples illustrate
significant tube temperature anomalies in most parts of HPEC2 that are typical of every
recorded event. Although there are slight variations in the extent to which the different
rows within HPEC2 are affected, in general there are two mechanisms that are creating
unacceptable, non-uniform conditions.
Figure 56

OMMI, Vol.4, Issue 3, December 2007 www.ommi.co.uk
68
Figure 57
Figure 58
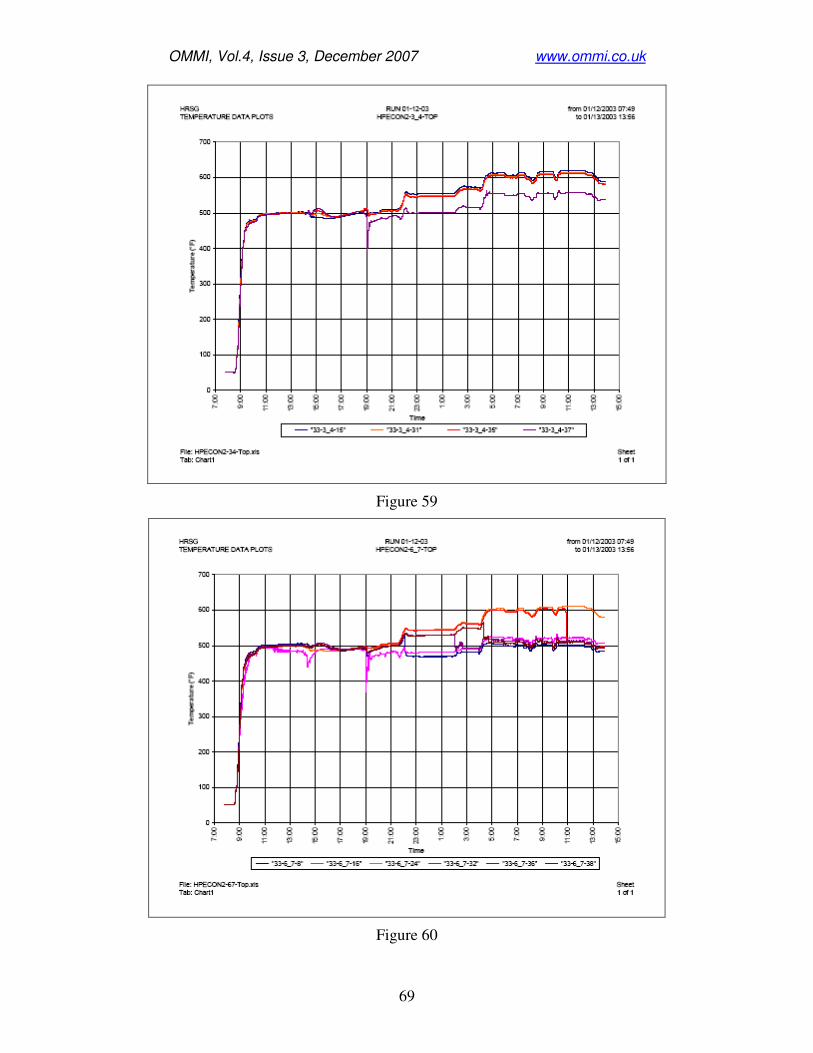
OMMI, Vol.4, Issue 3, December 2007 www.ommi.co.uk
69
Figure 59
Figure 60
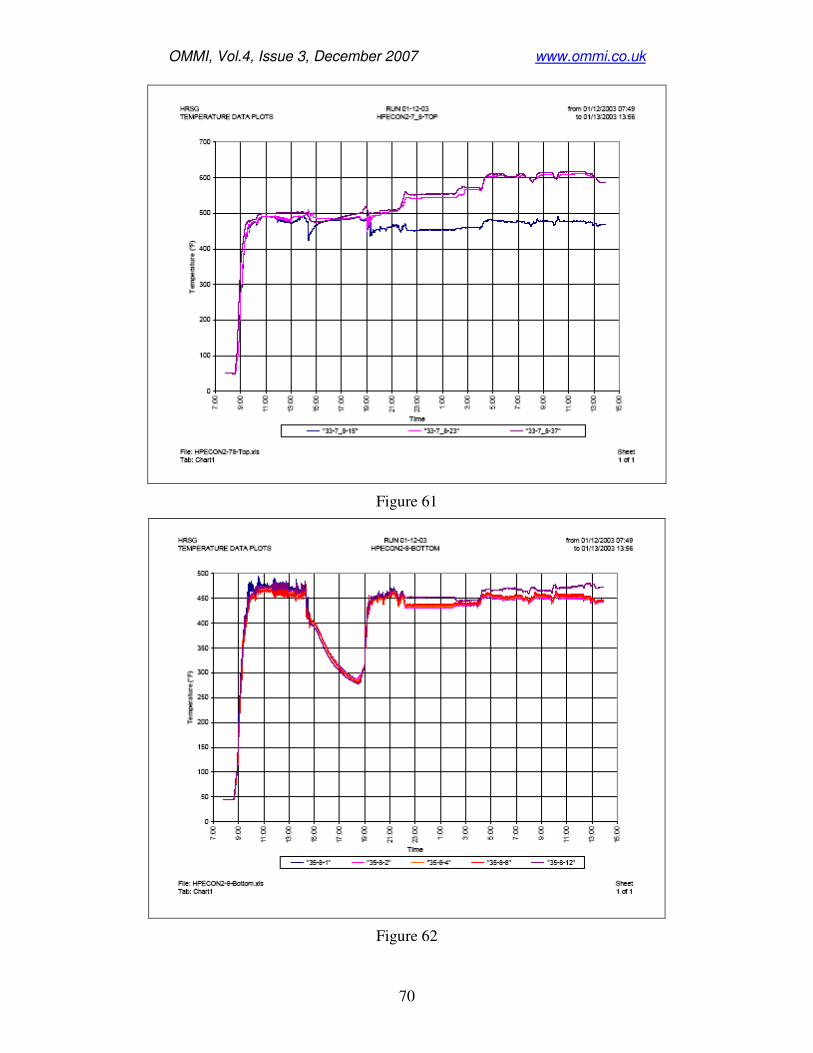
OMMI, Vol.4, Issue 3, December 2007 www.ommi.co.uk
70
Figure 61
Figure 62

OMMI, Vol.4, Issue 3, December 2007 www.ommi.co.uk
71
Figure 63
The first mechanism is flow reversal in some of the feedwater inlet row tubes between
upper HPEC2 inlet header and the lower return, (i.e., in the row 8-down tubes). Flow in
the row 8-down tubes is intended to be always downwards towards the lower return
header. However, a significant number of the row 8-down tubes fitted with TCs indicate
them to be upflowing in the reverse direction. These tubes are carrying back up to the
inlet header partially heated feedwater. For example; in Figures 62 and 63 above, at
03:00 hours on 1-13-03 with the CT steady at 175MW output and HP drum pressure
1,090psig, (saturation temperature of 557°F (292°C)), the feedwater inlet temperature
was about 430°F (221°C), as indicated by the temperature at inlet to those tubes with
downward flow. The temperature at the bottom of the row 8 tubes was between 440 and
450°F (227 and 232°C). Some of the feedwater heated in the first downpass then
recirculated back up other tubes to the inlet header in those tubes with TCs at the top of
row 8 tubes measured at between 530 and 545°F (277 and 285°C). Thus at 03:00hours
on 1-13-03, those tubes with flow in the intended downflow direction had an average
tube temperature of 435 to 440°F (224 to 227°C), whereas adjacent tubes attached to the
same upper and lower headers that had flow reversal and were up-flowing had an average
temperature of about 495°F (257°C); i.e., about 60°F (33°C) hotter than the adjacent
tubes.
The second mechanism causing unacceptable tube temperature anomalies is steam or air-
locking of some tubes at their upper hairpin bends. For example, in Figures 56 - 63,
above, from about 19:00 hours on 1-12-03, when the CT was started until long after
03:00 hours on 1-13-03 when the unit was stabilized at baseload, two of the three TCs
installed on a hairpin bend between the top of row 7 and 8 tubes (the first hairpin in the
direction of intended feed water flow) appear to be steaming. At least one of the three

OMMI, Vol.4, Issue 3, December 2007 www.ommi.co.uk
72
hairpin bends at the top of rows 7 and 8 was steaming throughout. At all operating
conditions up to baseload, one or more tubes with TCs had flow stagnation at the hairpin
bend in every row with TCs attached to some of the hairpin bends. Flow stagnation at the
hairpin bends is indicated when the tube temperature at the bend is close to the gas
temperature, which is about 50°F (28°C) above feedwater temperature at the hottest, row
2-3 bends and increases progressively row by row to about 100°F (56°C) above
feedwater temperature at the row 7-8 hairpin bends.
Figure 64

OMMI, Vol.4, Issue 3, December 2007 www.ommi.co.uk
73
Figure 65
Figure 66
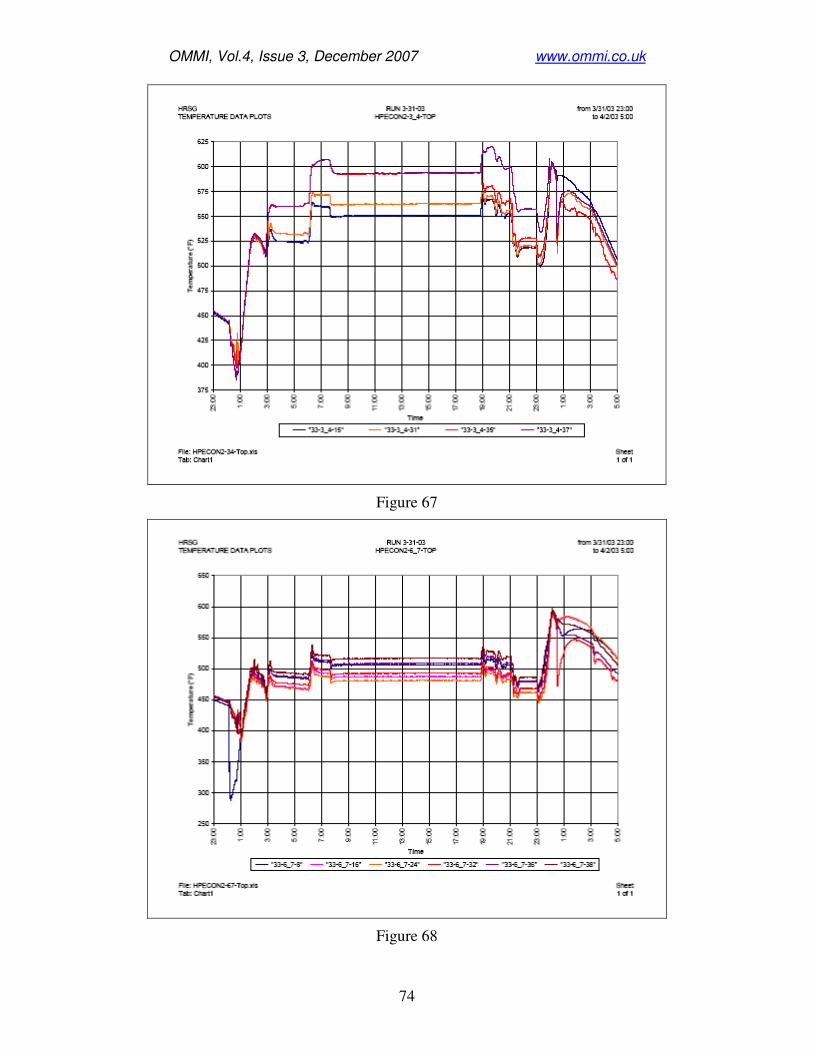
OMMI, Vol.4, Issue 3, December 2007 www.ommi.co.uk
74
Figure 67
Figure 68

OMMI, Vol.4, Issue 3, December 2007 www.ommi.co.uk
75
Figure 69
Figure 70
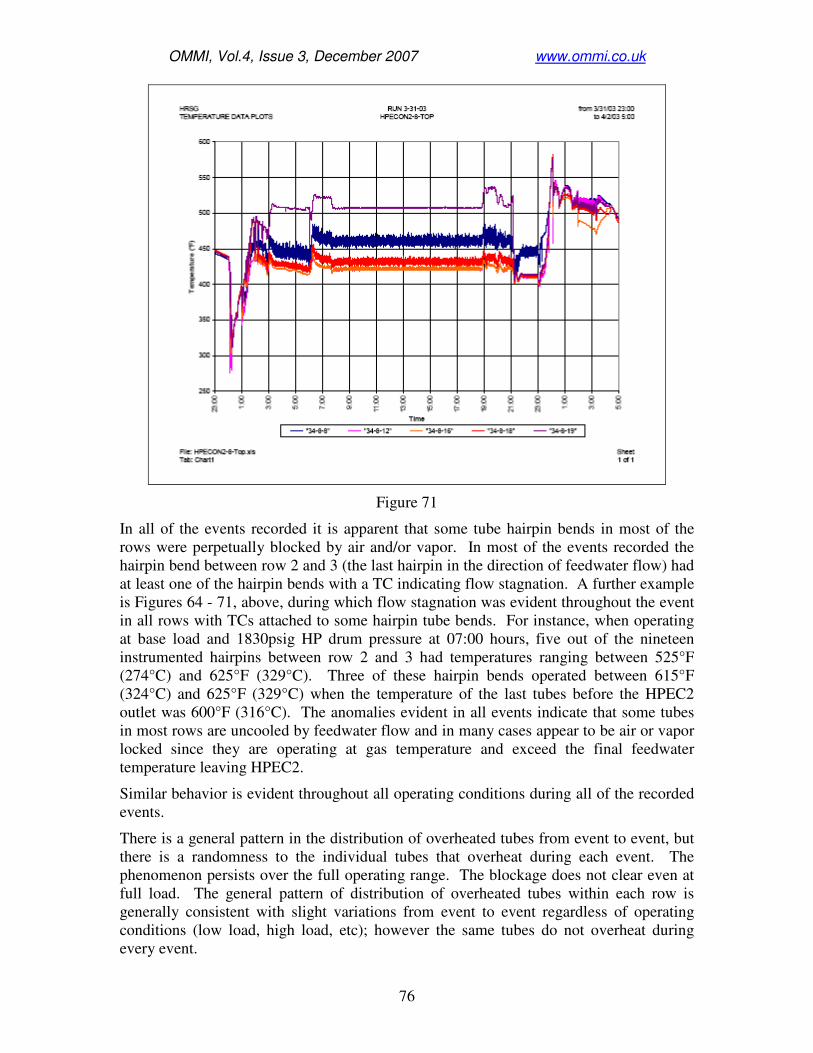
OMMI, Vol.4, Issue 3, December 2007 www.ommi.co.uk
76
Figure 71
In all of the events recorded it is apparent that some tube hairpin bends in most of the
rows were perpetually blocked by air and/or vapor. In most of the events recorded the
hairpin bend between row 2 and 3 (the last hairpin in the direction of feedwater flow) had
at least one of the hairpin bends with a TC indicating flow stagnation. A further example
is Figures 64 - 71, above, during which flow stagnation was evident throughout the event
in all rows with TCs attached to some hairpin tube bends. For instance, when operating
at base load and 1830psig HP drum pressure at 07:00 hours, five out of the nineteen
instrumented hairpins between row 2 and 3 had temperatures ranging between 525°F
(274°C) and 625°F (329°C). Three of these hairpin bends operated between 615°F
(324°C) and 625°F (329°C) when the temperature of the last tubes before the HPEC2
outlet was 600°F (316°C). The anomalies evident in all events indicate that some tubes
in most rows are uncooled by feedwater flow and in many cases appear to be air or vapor
locked since they are operating at gas temperature and exceed the final feedwater
temperature leaving HPEC2.
Similar behavior is evident throughout all operating conditions during all of the recorded
events.
There is a general pattern in the distribution of overheated tubes from event to event, but
there is a randomness to the individual tubes that overheat during each event. The
phenomenon persists over the full operating range. The blockage does not clear even at
full load. The general pattern of distribution of overheated tubes within each row is
generally consistent with slight variations from event to event regardless of operating
conditions (low load, high load, etc); however the same tubes do not overheat during
every event.

OMMI, Vol.4, Issue 3, December 2007 www.ommi.co.uk
77
The pattern may be determined at the time during startup when forward feed flow is
established based upon which tubes happen to have an air and/or vapor plug in them, and
which of these clear spontaneously when feedflow is first initiated and transiently high
feedwater pressures occur before subsiding once forward flow is established. It appears
that tubes that do not clear when feedwater flow is established in the stagnant HPECON2
cannot clear the blockage after feedflow has commenced. Each blocked tube that were to
clear after feedflow is established would result in even lower pressure through the tubes,
insuring blockages remain in place.
The consequences of this behavior is that many of the tubes in every row of HPEC2
relieve themselves of the support load (tubes, headers, piping, water, etc.) they are
intended to carry, hence other tubes in HPEC2 must carry not only their design loads but
those of the overheated tubes*7, Figure 72. Given the random and dynamic nature of the
load transfer it is impossible to perform a meaningful analysis of the component life in
HPEC2.
Another possible consequence of perpetual steaming is water side corrosion of HPEC2
tubes.
Figure 72
4.1.2 HPEC2 tube temperature differences in tube rows closer to feedwater inlet
after CT shutdown
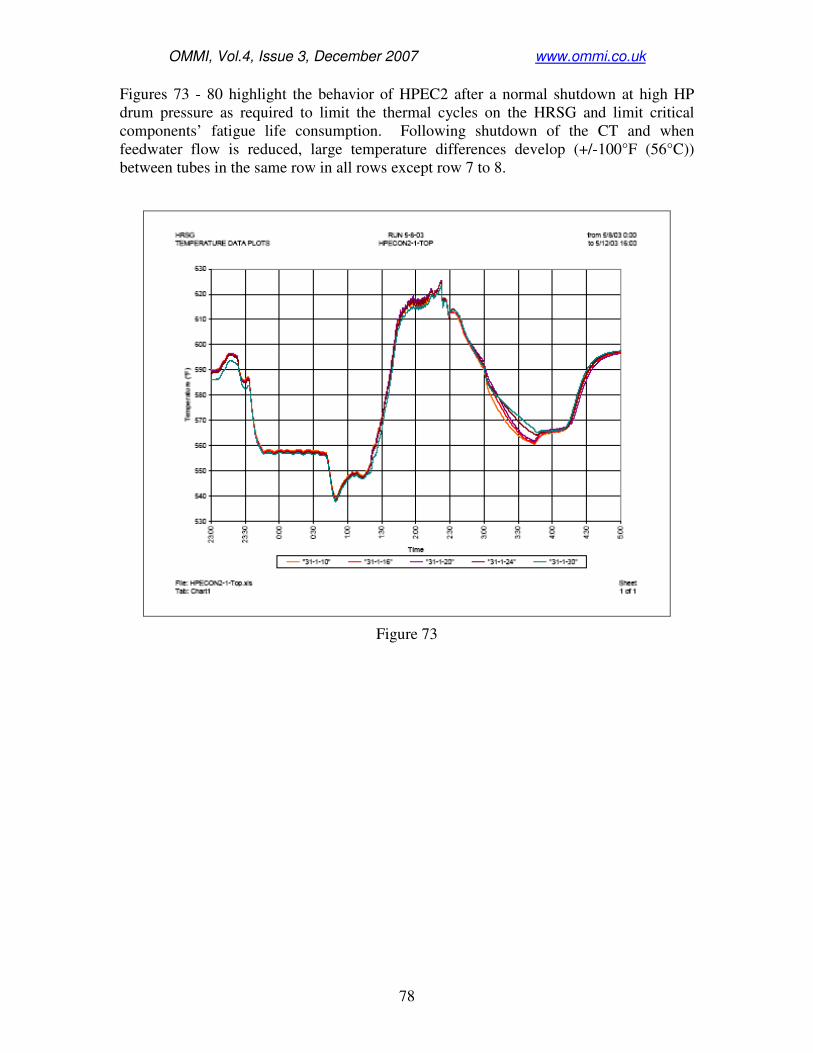
OMMI, Vol.4, Issue 3, December 2007 www.ommi.co.uk
78
Figures 73 - 80 highlight the behavior of HPEC2 after a normal shutdown at high HP
drum pressure as required to limit the thermal cycles on the HRSG and limit critical
components’ fatigue life consumption. Following shutdown of the CT and when
feedwater flow is reduced, large temperature differences develop (+/-100°F (56°C))
between tubes in the same row in all rows except row 7 to 8.
Figure 73
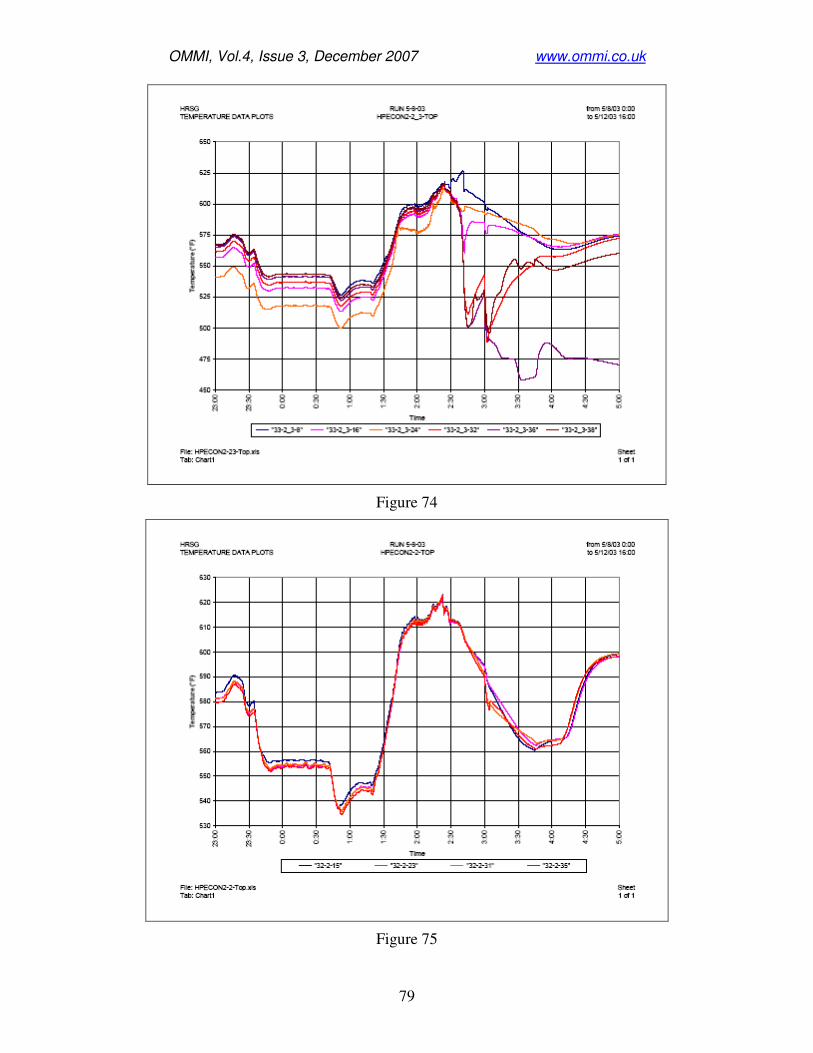
OMMI, Vol.4, Issue 3, December 2007 www.ommi.co.uk
79
Figure 74
Figure 75
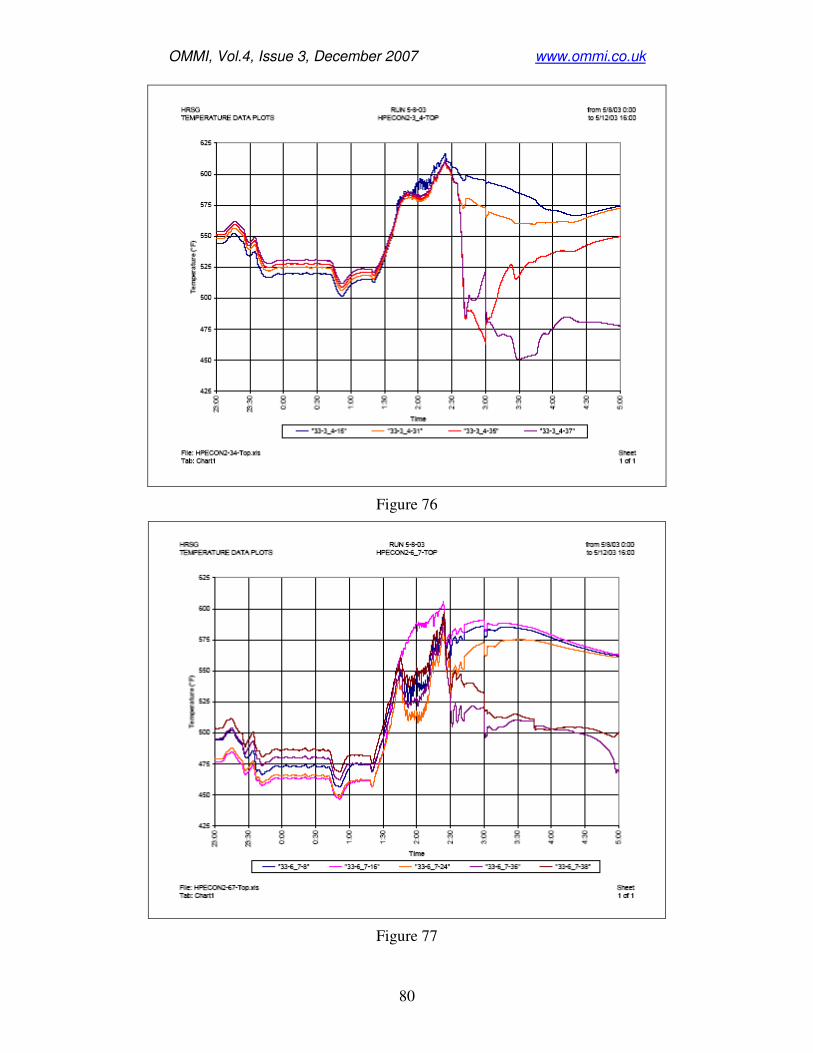
OMMI, Vol.4, Issue 3, December 2007 www.ommi.co.uk
80
Figure 76
Figure 77

OMMI, Vol.4, Issue 3, December 2007 www.ommi.co.uk
81
Figure 78
Figure 79

OMMI, Vol.4, Issue 3, December 2007 www.ommi.co.uk
82
Figure 80
4.1.3 LP Preheater (LPPH) problems
4.2.1 LPPH design arrangement All feedwater destined for the LP, IP and HP evaporators first passes through the LPPH,
and hence it is large relative to the IP and HP economizers. It receives ambient
temperature feedwater, except when the LPPH recirculation pump is in service. This
recirculation system was originally intended for elevation of feedwater temperature
during oil firing and on cold ambient days when inlet feedwater temperature can be lower
than the acid dew point of exhaust gas in the LPPH. The feedwater regulating valve is
located between the LPPH and the LP drum.
The preheater comprises two essentially-identical tube bundles or modules arranged side
by side across the duct, Figure 81. Each preheater module comprises 18 rows of tubes,
each tube row comprising 45 tubes which, in the direction of gas flow, are arranged in-
line with tubes of all other rows. Feedwater enters the upper inlet header of each module
through a single inlet pipe at the midpoint of the header. Feedwater flows down the
feedwater inlet pass of tubes, (designated row 18 counted from the gas inlet side of the
preheater), and discharges into a lower return header. The outlet of row 18 tubes and the
inlet of the next, up flowing pass of tubes, (row 17), are each connected by acute bends to
the same lower return header. Feedwater then passes up row 17 tubes. At the upper end,
each tube of row 17 is connected by a 180° return bend to the inlet of one of the row 16
tubes, through which the feedwater down flows to the next return header to which the
outlet of each row 16 tube and the inlet of each row 15 tube is connected through an acute
bend. There are a series of eight such rows of hairpin tubes which convey the feedwater

OMMI, Vol.4, Issue 3, December 2007 www.ommi.co.uk
83
from one of nine lower return headers through an up flowing inlet pass, through a 180°
tube bend and then though a down flowing outlet tube row to the next return header.
Thermocouples (TCs) were installed at roughly equal tube intervals across each tube row
on about 20 to 25% of the 45 tubes in each of the selected tube rows of one of the two
preheater modules in this HRSG, Figure 1. TCs were installed at the top feedwater inlet
of row 18 tubes and also at the bottom of row 18 tubes. TCs were attached close to the
upper hairpin bends between tube rows 16 & 17, 14 & 15, 10 & 11, 6 & 7, and 2 & 3, and
also at the top feedwater outlet of row 1 tubes.
LPPH Tubes and Headers Arrangement
Figure 81

OMMI, Vol.4, Issue 3, December 2007 www.ommi.co.uk
84
In the cold, as-installed condition, the weight of the lower return headers and tubes and
their water contents is notionally supported at the underside of each upper hairpin bend
by “beams” beneath the intrados of each 180° tube bend. In practice, it is impossible to
align all hairpin bends at the same precise elevation and the few hairpin bends in each
row of cold tubes will support the weight of adjacent tubes with hairpin bends that are not
in contact with the support beam even under cold set conditions.
During operation of the HRSG, the temperature of the feedwater is progressively raised
through each successive row of the 18 tube rows from the preheater inlet feedwater
temperature up to about 325°F (163°C) when operating at design LP drum pressure.
Under such conditions the tubes in each row expand thermally, by an amount that is
smallest on the coolest row 18 tubes, and progressively increases in each row as
feedwater and tube temperatures increase, being largest on the warmest outlet row 1
tubes. This causes substantial redistribution of weight from the hotter outlet rows to the
hairpin bend rows closest to the feedwater inlet and to the inlet row of tubes which are
attached at each end to relatively stiff headers*10
, Figure 55.
In addition, when operating under stable load conditions, the temperature at the upper
hairpin bend in all rows of tubes progressively increases from tubes in the center of the
module which are closest to the inlet pipe branch on the LPPH inlet header towards the
tubes supplied from the ends on the inlet header, Figure 82. Thus in addition to the
weight transfer from hotter rows to cooler rows discussed above, there is an additional
weight transfer from hotter tubes towards the ends of each row to the cooler tubes in the
center of each row, Figure 72.
Figure 82

OMMI, Vol.4, Issue 3, December 2007 www.ommi.co.uk
85
The thermal-mechanical mechanisms that develop forces and stresses in tubes and bends
of this type of preheater and economizer design are explained in some detail in Section
5.4 of Reference 7 and Section 7.11.3, pages 7.42 to 7.47, of Reference 10.
4.2.2 Tube-to-tube element temperature differences caused by poor flow
distribution between tubes and/or flow obstruction by unvented air/vapor at
the top of some hairpin bends
Tube temperatures measured on between 15 and 25% of the tubes across one LPPH
module, - at the top of feedwater outlet row tubes; immediately below the upper hairpin
bends, on every alternate row of hairpin bends; and also and at the top and bottom of
feedwater inlet row tubes, of the tubes are provided in Figures 83 - 90. During this event
following a cold start, the CT was synchronized at about 12:40 hours on 3-30-03,
remained at about 16MW until 16:45 hours, ramped quickly and held at 100MW until
18:35 hours, ramped quickly and held at 174MW until 21:10 hours, then ramped down
quickly to 100MW at 21:10 hours, then remained between 100 and 120 MW until 02:00
hours on 3-31-03 when it was ramped up to 165MW then fluctuated between 140 and
155MW until 03:00 when it was quickly ramped down to 100W and then fluctuated
between 100 and 120MW until about 05:55 hours when the CT tripped.
Figure 83

OMMI, Vol.4, Issue 3, December 2007 www.ommi.co.uk
86
Figure 84
Figure 85

OMMI, Vol.4, Issue 3, December 2007 www.ommi.co.uk
87
Figure 86
Figure 87

OMMI, Vol.4, Issue 3, December 2007 www.ommi.co.uk
88
Figure 88
Figure 89

OMMI, Vol.4, Issue 3, December 2007 www.ommi.co.uk
89
Figure 90
Similar tube temperature plots are also provided for another typical event, Figures 91 -
98. Following an initial start up at about 20:20 hours on 3-11-03, the CT tripped from
a7MW at about 21:45 hours and restarted with block load of 17MW at about 22:35 hours.
Load was raised from 17MW to 100MW from 02:15 to 0245 hours on 3-12-03, raised to
110MW at 03:15 and to 125MW at 04:15 and to 175MW at 05:40 hours. The CT was
deloaded rapidly from 175MW to 110MW at 08:20 and then from 110 MW at about
30MW at 08:45 hours before final deloading and CT shutdown at 09:45 hours.

OMMI, Vol.4, Issue 3, December 2007 www.ommi.co.uk
90
Figure 91
Figure 92

OMMI, Vol.4, Issue 3, December 2007 www.ommi.co.uk
91
Figure 93
Figure 94

OMMI, Vol.4, Issue 3, December 2007 www.ommi.co.uk
92
Figure 95
Figure 96
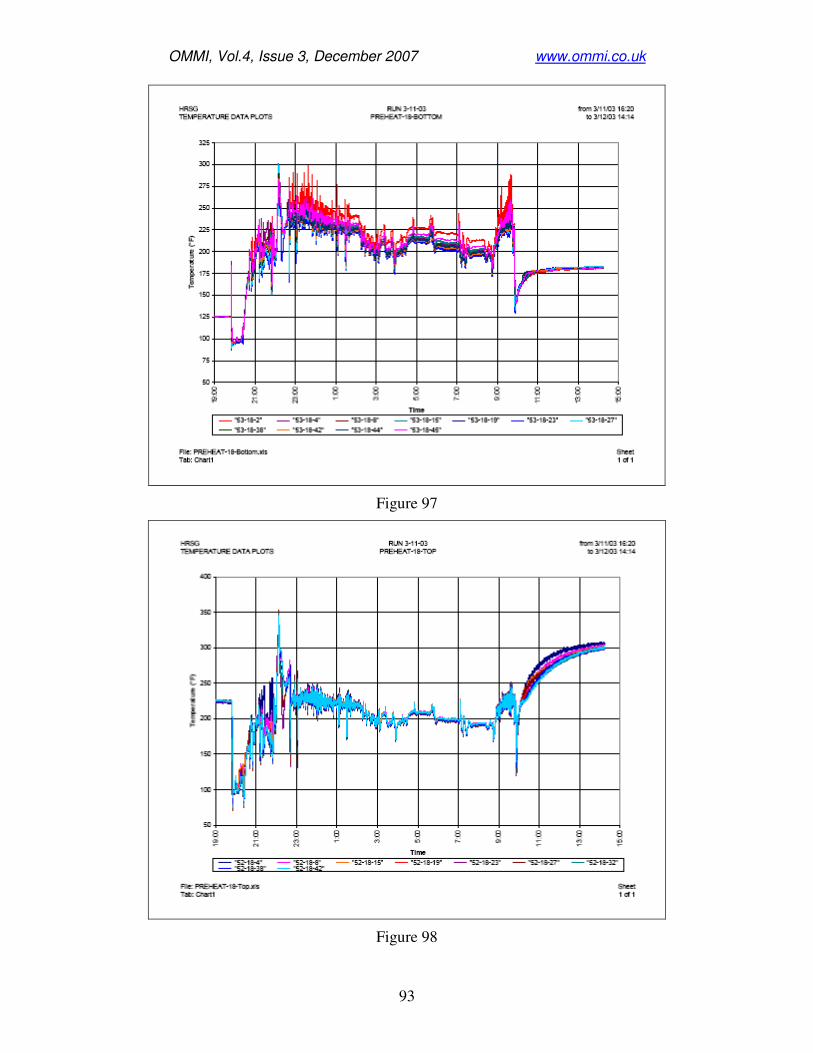
OMMI, Vol.4, Issue 3, December 2007 www.ommi.co.uk
93
Figure 97
Figure 98
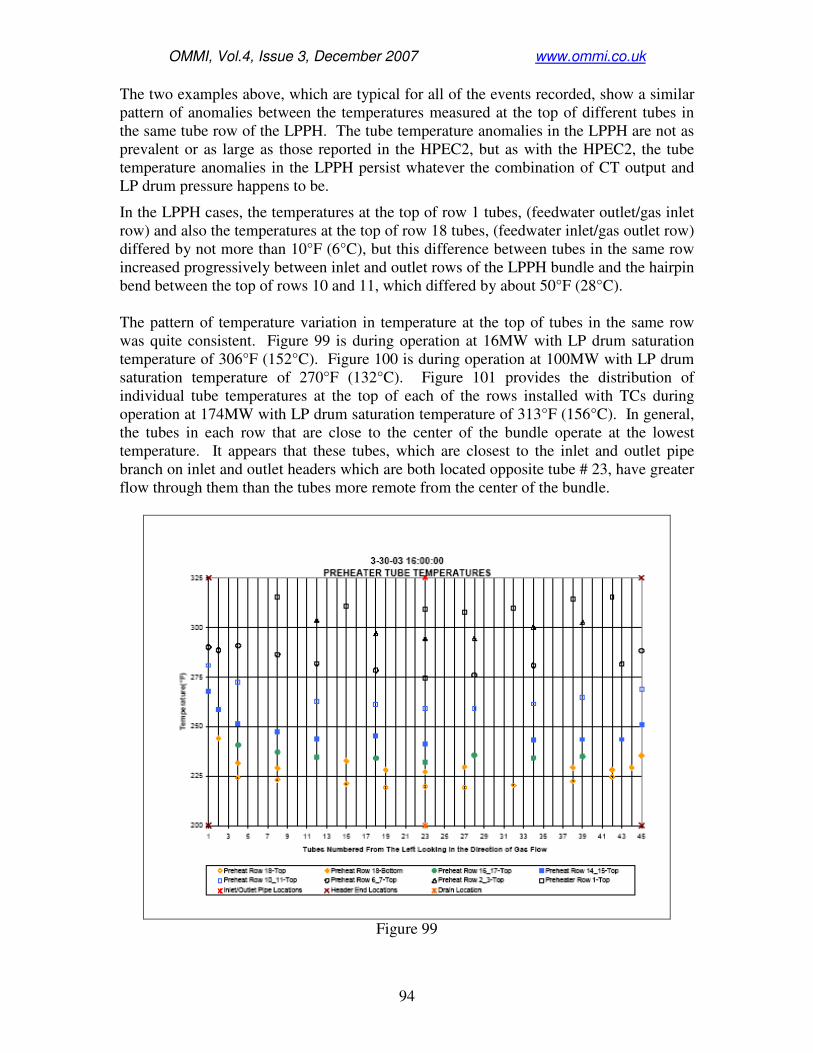
OMMI, Vol.4, Issue 3, December 2007 www.ommi.co.uk
94
The two examples above, which are typical for all of the events recorded, show a similar
pattern of anomalies between the temperatures measured at the top of different tubes in
the same tube row of the LPPH. The tube temperature anomalies in the LPPH are not as
prevalent or as large as those reported in the HPEC2, but as with the HPEC2, the tube
temperature anomalies in the LPPH persist whatever the combination of CT output and
LP drum pressure happens to be.
In the LPPH cases, the temperatures at the top of row 1 tubes, (feedwater outlet/gas inlet
row) and also the temperatures at the top of row 18 tubes, (feedwater inlet/gas outlet row)
differed by not more than 10°F (6°C), but this difference between tubes in the same row
increased progressively between inlet and outlet rows of the LPPH bundle and the hairpin
bend between the top of rows 10 and 11, which differed by about 50°F (28°C).
The pattern of temperature variation in temperature at the top of tubes in the same row
was quite consistent. Figure 99 is during operation at 16MW with LP drum saturation
temperature of 306°F (152°C). Figure 100 is during operation at 100MW with LP drum
saturation temperature of 270°F (132°C). Figure 101 provides the distribution of
individual tube temperatures at the top of each of the rows installed with TCs during
operation at 174MW with LP drum saturation temperature of 313°F (156°C). In general,
the tubes in each row that are close to the center of the bundle operate at the lowest
temperature. It appears that these tubes, which are closest to the inlet and outlet pipe
branch on inlet and outlet headers which are both located opposite tube # 23, have greater
flow through them than the tubes more remote from the center of the bundle.
Figure 99

OMMI, Vol.4, Issue 3, December 2007 www.ommi.co.uk
95
Figure 100
Figure 101

OMMI, Vol.4, Issue 3, December 2007 www.ommi.co.uk
96
The tubes that operate above the temperature of the coolest tube in each row will expand
thermally up and lift off the support beams located beneath the intrados of the upper
hairpin bends, thereby transferring their weight and their contents weight to the coolest
tubes in the row, causing significantly larger stresses in the coolest tubes, especially at
their bends, Figure 72.
The consequences of this behavior is that many of the tubes in every row of LPPH relieve
themselves of the support load (tubes, headers, piping, water, etc.) they are intended to
carry, hence other tubes in LPPH must carry not only their design loads but those of the
overheated tubes.
This phenomenon has been previously identified during testing of another manufacturer’s
design of unvented hairpin economizers. This other unit has experienced many leaks on
the intrados of LPPH hairpin bends in the coldest several rows of the module. Hundreds
of these bends have been replaced with new bends of greater wall thickness in an attempt
to allow the LPPH to tolerate this support load transfer. The HRSG that is the subject of
this paper has not yet experienced LPPH tube failures; however it is about 5 years
younger than the failed LPPH. Given the random and dynamic nature of the load
transfer it is impossible to perform a meaningful analysis of the component life in LPPH
and draw any quantitative conclusion about its future reliability.
4.2.3 Transient temperatures measured in feedwater inlet row tubes of the LPPH
when flow is initiated
Figure 102 plots the calculated average of measured temperatures in each row during the
period from 19:00 hours on 3-11-03 to 05:00hours on 3-13-03. During this period there
was a cool start at about 20:00 on 3-11-03; a trip at 21:46 hours on 3-11-03 and restart
less than one hour later. After a period at baseload there was a normal shutdown between
about 08:00 and 10:00 hours on 3-12-03. The unit then performed a warm to hot start
about 12 hours after the shutdown after 22:00 hours on 3-12-03.

OMMI, Vol.4, Issue 3, December 2007 www.ommi.co.uk
97
Figure 102
During the period at baseload, there was a short period between 05:30 and 05:45 hours
when the LP drum pressure and feedwater temperature at LPPH outlet were at the normal
design operating value. During this period LPPH tube temperatures increased
progressively through the tube rows from about 215°F (102°C) at inlet to the LPPH to
about 325°F (163°C) at LPPH outlet.
Figure 103 expands the time scale for the period during the warm-hot start on 3-12-03
when LP feedwater flow was established and the LPPH experienced significant
temperature differences between tube rows. The temperatures plotted for each
measurement location are the average of all temperatures measured for that location in
the LPPH bundle. CT ignition occurred at 22:36 hours and LP feedwater flow
commenced at 22:39 hours. The minimum mean of row 18 top and bottom temperatures
was about 188°F (87°C) and occurred 3 to 4 minutes after a small LP feedwater flow
commenced, (about 15 seconds before 22:43 hours), when the cool feedwater reached the
bottom of row 18 tubes, pushing ahead of it into the row 17 tubes the hotter water that
had until then been stagnant in the row 18 tubes. At this time point all other tube rows
had cooled barely 5°F (3°C) from 315°F (157°C) to which they had slowly cooled during
the off load period.
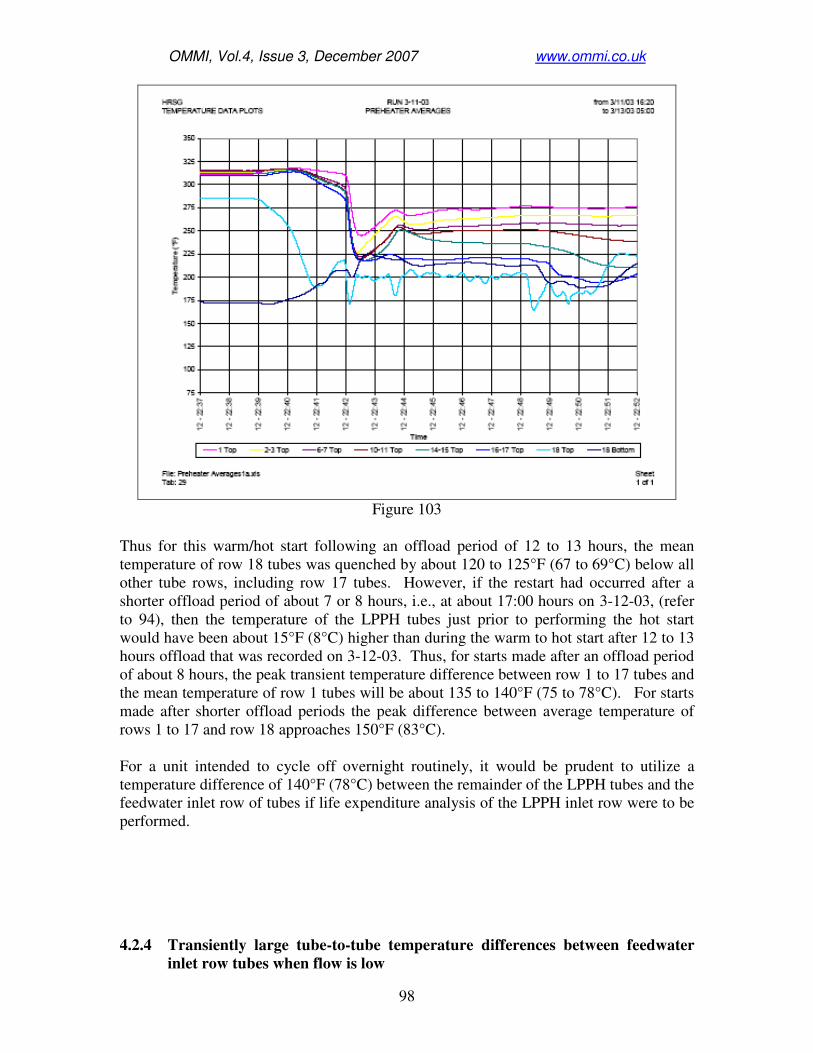
OMMI, Vol.4, Issue 3, December 2007 www.ommi.co.uk
98
Figure 103
Thus for this warm/hot start following an offload period of 12 to 13 hours, the mean
temperature of row 18 tubes was quenched by about 120 to 125°F (67 to 69°C) below all
other tube rows, including row 17 tubes. However, if the restart had occurred after a
shorter offload period of about 7 or 8 hours, i.e., at about 17:00 hours on 3-12-03, (refer
to 94), then the temperature of the LPPH tubes just prior to performing the hot start
would have been about 15°F (8°C) higher than during the warm to hot start after 12 to 13
hours offload that was recorded on 3-12-03. Thus, for starts made after an offload period
of about 8 hours, the peak transient temperature difference between row 1 to 17 tubes and
the mean temperature of row 1 tubes will be about 135 to 140°F (75 to 78°C). For starts
made after shorter offload periods the peak difference between average temperature of
rows 1 to 17 and row 18 approaches 150°F (83°C).
For a unit intended to cycle off overnight routinely, it would be prudent to utilize a
temperature difference of 140°F (78°C) between the remainder of the LPPH tubes and the
feedwater inlet row of tubes if life expenditure analysis of the LPPH inlet row were to be
performed.
4.2.4 Transiently large tube-to-tube temperature differences between feedwater
inlet row tubes when flow is low

OMMI, Vol.4, Issue 3, December 2007 www.ommi.co.uk
99
A fatigue life analysis, as described above, would generally assume that all tubes in each
row of the LPPH remain at all times at the same temperature. However TC data indicates
this is not the case. Large temperature differences were measured, particularly in the
feedwater inlet pass (row 18) tubes during startups and shutdowns when feed flow is low.
Figures 104 and 105 provide the tube temperatures measured in the individual tubes at
top and bottom of the feedwater inlet pass, row 18, tubes. These highlight that when
feedwater flow is low, or when the LP feed pump is on and the flow control notionally
shut but passing, that flow is concentrated through the tubes in the center of the header
which are closest to the top inlet pipe branch. At about 22:42 hours on 3-12-03, the
measured temperature difference between row 18 tubes is about 175°F (97°C) at the top,
Figure 104, and 100°F (56°C) at the bottom, Figure 105. This peak mean temperature
difference between row 18 tubes occurs shortly after the peak average row-to-row
temperature difference when the temperature difference between row 17 and other tube
rows and row 18 tubes still exceeds 100°F (56°C). This phenomenon substantially
enhances the thermal stresses and life expenditure rate in the row 18 tubes closest to the
single feedwater pipe branch in the middle of the LPPH inlet header.
Figure 104
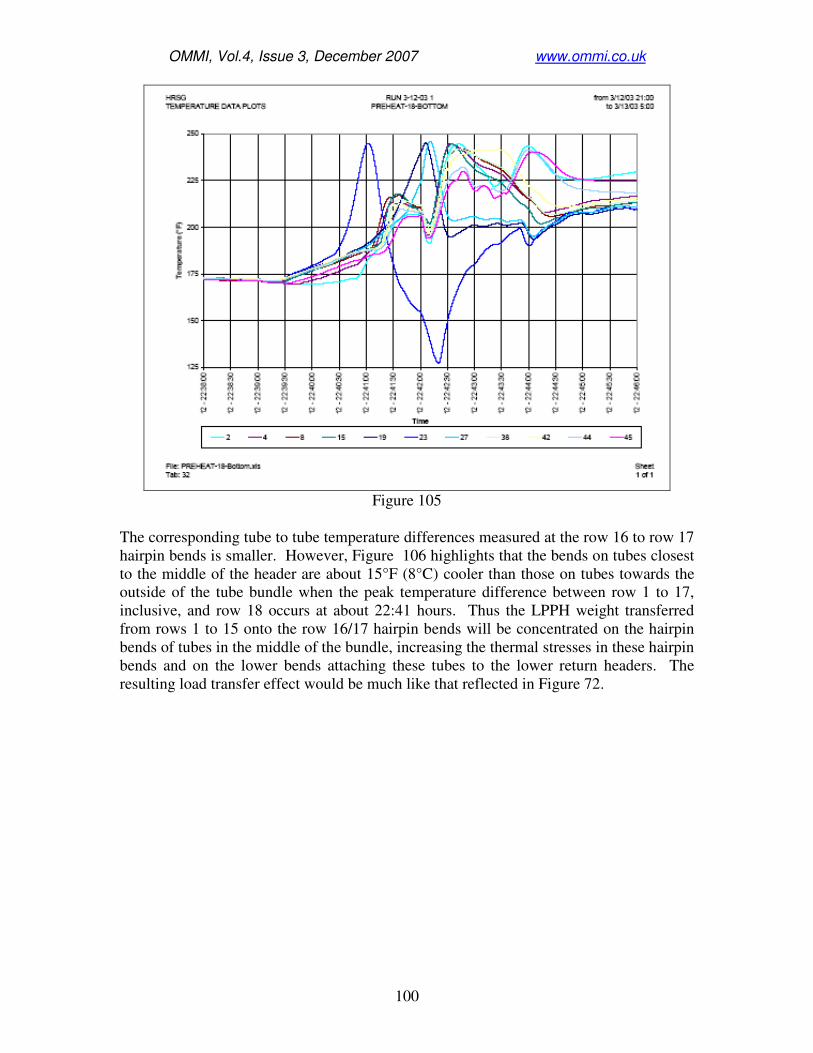
OMMI, Vol.4, Issue 3, December 2007 www.ommi.co.uk
100
Figure 105
The corresponding tube to tube temperature differences measured at the row 16 to row 17
hairpin bends is smaller. However, Figure 106 highlights that the bends on tubes closest
to the middle of the header are about 15°F (8°C) cooler than those on tubes towards the
outside of the tube bundle when the peak temperature difference between row 1 to 17,
inclusive, and row 18 occurs at about 22:41 hours. Thus the LPPH weight transferred
from rows 1 to 15 onto the row 16/17 hairpin bends will be concentrated on the hairpin
bends of tubes in the middle of the bundle, increasing the thermal stresses in these hairpin
bends and on the lower bends attaching these tubes to the lower return headers. The
resulting load transfer effect would be much like that reflected in Figure 72.

OMMI, Vol.4, Issue 3, December 2007 www.ommi.co.uk
101
Figure 106
4.2.5 Stress range significantly increased by reversal of row-to-row tube
temperature differences during some shutdowns It would be typical for an LPPH fatigue life analysis to assume that row to row
temperatures will at all times increase from the feedwater inlet row 18 and in each
subsequent feedwater flow pass. However, following the trip shutdown at about 21:50
hours on 3-11-03, Figure 107, recirculation of hotter feedwater from LPPH outlet to inlet
caused tube temperatures in the feedwater inlet passes to increase quickly such that row
18 tubes were transiently significantly hotter than row 17 tubes, and row 17 tubes hotter
than row 16 tubes, etc. During the transient between about 22:00 and 22:20 hours the
mean temperature of row 18 tubes peaked at close to 100°F (56°C) above row 17 tubes.
The reversal of row to row temperatures causes thermal mechanical forces in the inlet
pass tubes to reverse from normally tensile to compressive. A 100°F (56°C) negative
row 17 to row 18 temperature difference increases by about 70% the thermal-mechanical
stress range calculated by the specified positive temperature difference of 140°F (78°C)
between row 17 and other tube rows and row 18 tubes. An increase of 70% in stress
range increases life expenditure rates by a factor greater than 5. Careful thought should
be given to how, when, or if the LPPH recirculation system is to be operated upon unit
shutdown.
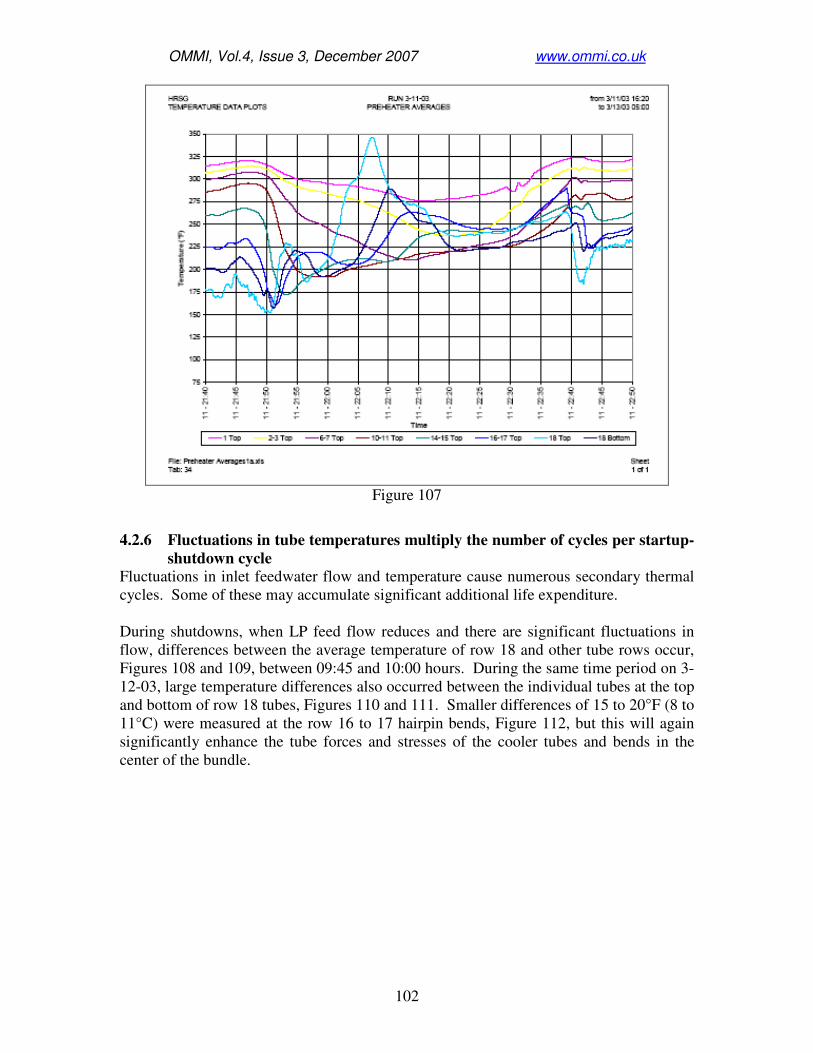
OMMI, Vol.4, Issue 3, December 2007 www.ommi.co.uk
102
Figure 107
4.2.6 Fluctuations in tube temperatures multiply the number of cycles per startup-
shutdown cycle Fluctuations in inlet feedwater flow and temperature cause numerous secondary thermal
cycles. Some of these may accumulate significant additional life expenditure.
During shutdowns, when LP feed flow reduces and there are significant fluctuations in
flow, differences between the average temperature of row 18 and other tube rows occur,
Figures 108 and 109, between 09:45 and 10:00 hours. During the same time period on 3-
12-03, large temperature differences also occurred between the individual tubes at the top
and bottom of row 18 tubes, Figures 110 and 111. Smaller differences of 15 to 20°F (8 to
11°C) were measured at the row 16 to 17 hairpin bends, Figure 112, but this will again
significantly enhance the tube forces and stresses of the cooler tubes and bends in the
center of the bundle.

OMMI, Vol.4, Issue 3, December 2007 www.ommi.co.uk
103
Figure 108
Figure 109

OMMI, Vol.4, Issue 3, December 2007 www.ommi.co.uk
104
Figure 110
Figure 111

OMMI, Vol.4, Issue 3, December 2007 www.ommi.co.uk
105
Figure 112
During operation at startups with minimum CT load and when feedwater flow is low,
flow reversal occurs in some tubes of the notionally down flowing inlet pass (row 18)
tubes. In Figure 113, the temperature at the top inlet to tube 4 operates intermittently at
about 250°F (121°C) while the temperature at inlet to the majority of the other tubes
fluctuates between 150 and 190°F (66 and 88°C). The temperature at the bottom of tube
4, (also in tube 2 that is closer to the end of the header), range between about 190 and
210°F (88 and 99°C), Figure 114, i.e., less than the temperature at the top of tube 4. In
the period of 10 minutes plotted on Figures 113 and 114, on four occasions, upward flow
recirculation in tube 4 (and other tubes more remote from the feed pipe branch on the
inlet header) ceased and down flow was briefly re-established. Although the temperature
range between row 18 tubes during these cycles is relatively low, large numbers of cycles
can accumulate. The phenomenon disappeared when feed water flow exceeded about
30%.
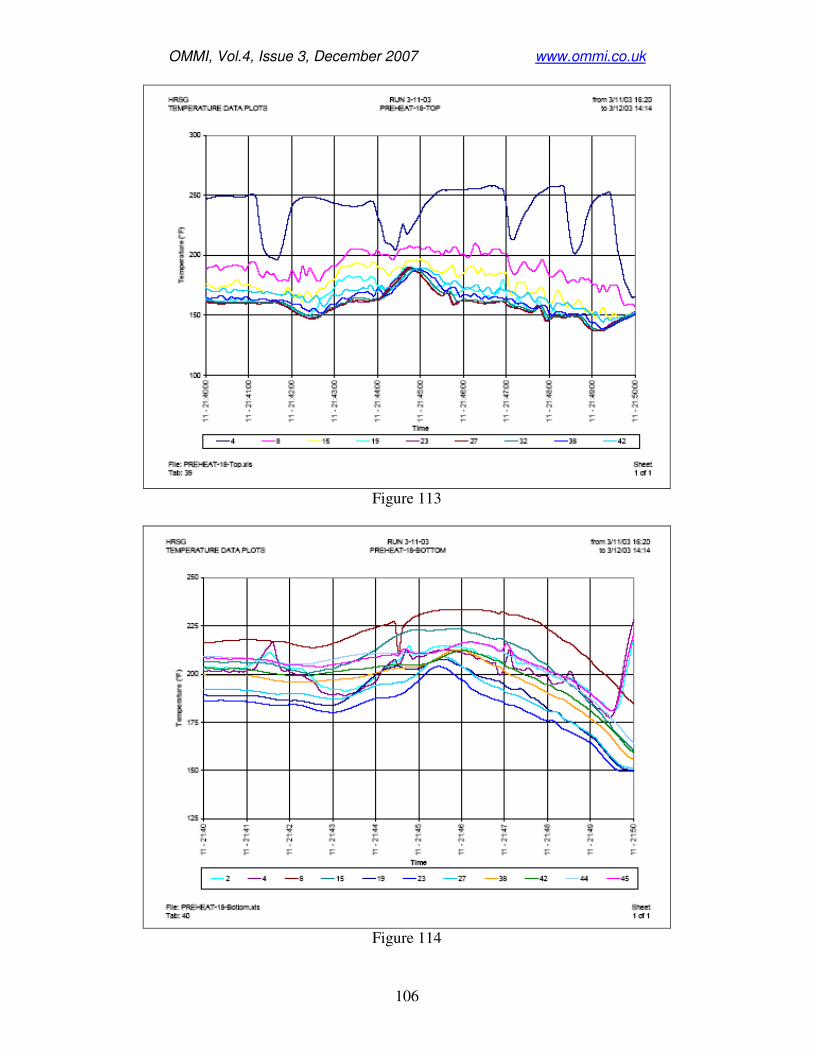
OMMI, Vol.4, Issue 3, December 2007 www.ommi.co.uk
106
Figure 113
Figure 114
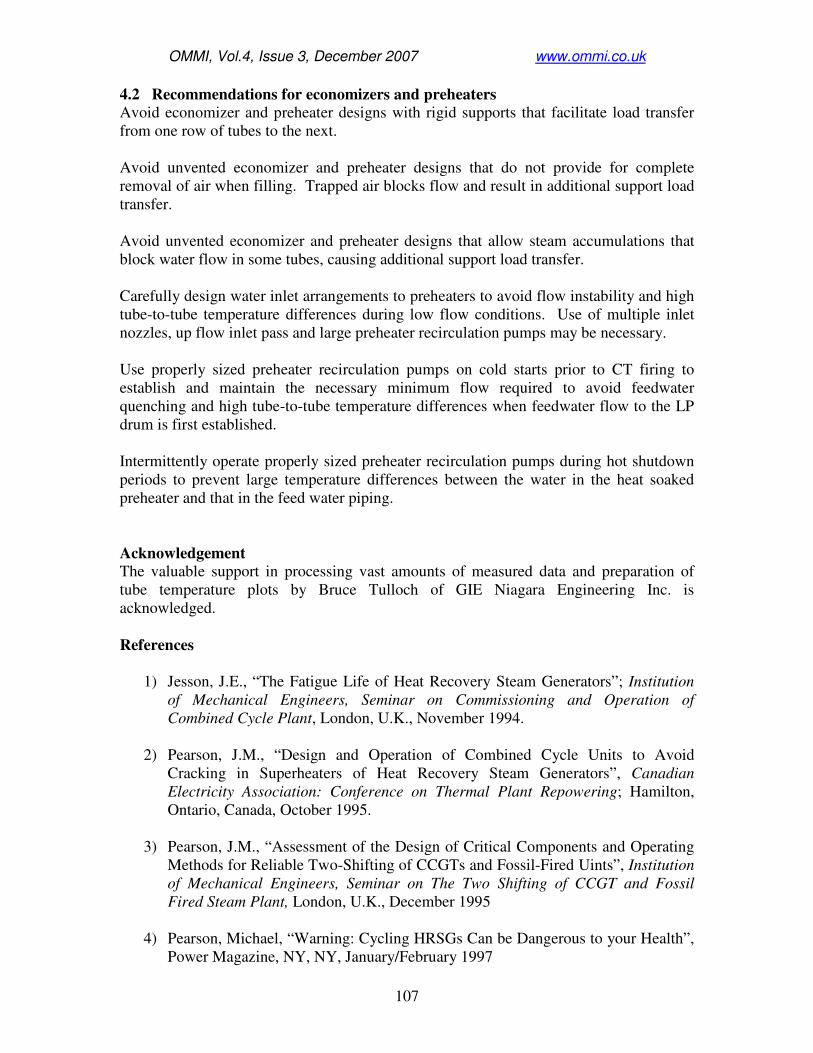
OMMI, Vol.4, Issue 3, December 2007 www.ommi.co.uk
107
4.2 Recommendations for economizers and preheaters Avoid economizer and preheater designs with rigid supports that facilitate load transfer
from one row of tubes to the next.
Avoid unvented economizer and preheater designs that do not provide for complete
removal of air when filling. Trapped air blocks flow and result in additional support load
transfer.
Avoid unvented economizer and preheater designs that allow steam accumulations that
block water flow in some tubes, causing additional support load transfer.
Carefully design water inlet arrangements to preheaters to avoid flow instability and high
tube-to-tube temperature differences during low flow conditions. Use of multiple inlet
nozzles, up flow inlet pass and large preheater recirculation pumps may be necessary.
Use properly sized preheater recirculation pumps on cold starts prior to CT firing to
establish and maintain the necessary minimum flow required to avoid feedwater
quenching and high tube-to-tube temperature differences when feedwater flow to the LP
drum is first established.
Intermittently operate properly sized preheater recirculation pumps during hot shutdown
periods to prevent large temperature differences between the water in the heat soaked
preheater and that in the feed water piping.
Acknowledgement The valuable support in processing vast amounts of measured data and preparation of
tube temperature plots by Bruce Tulloch of GIE Niagara Engineering Inc. is
acknowledged.
References
1) Jesson, J.E., “The Fatigue Life of Heat Recovery Steam Generators”; Institution
of Mechanical Engineers, Seminar on Commissioning and Operation of
Combined Cycle Plant, London, U.K., November 1994.
2) Pearson, J.M., “Design and Operation of Combined Cycle Units to Avoid
Cracking in Superheaters of Heat Recovery Steam Generators”, Canadian
Electricity Association: Conference on Thermal Plant Repowering; Hamilton,
Ontario, Canada, October 1995.
3) Pearson, J.M., “Assessment of the Design of Critical Components and Operating
Methods for Reliable Two-Shifting of CCGTs and Fossil-Fired Uints”, Institution
of Mechanical Engineers, Seminar on The Two Shifting of CCGT and Fossil
Fired Steam Plant, London, U.K., December 1995
4) Pearson, Michael, “Warning: Cycling HRSGs Can be Dangerous to your Health”,
Power Magazine, NY, NY, January/February 1997

OMMI, Vol.4, Issue 3, December 2007 www.ommi.co.uk
108
5) Pearson, J.M., Anderson, R.W., “Reliability and durability of large heat recovery
steam generators”, Proceedings of Institution of Mechanical Engineers, (U.K.),
Volume 213, Part A, pp151-168, October 1998.
6) Pearson, J.M., Anderson, R.W., “Root causes of transient tube temperature
anomalies measured in horizontal gas path HRSGs”, EPRI International
Conference on Boiler and HRSG Tube Failures and Inspections” Phoenix,
Arizona, November, 2001.
7) Dooley, R.B., K.J. Shields, S.R. Paterson, T.A. Kuntz, W.P. McNaughton, and M.
Pearson, “Heat Recovery Steam Generator Tube Failure Manual”, TR-1004503,
EPRI, Palo Alto, CA., 2002.
8) Pearson, J.M., Anderson, R.W., “Influences of HRSG design and operation on the
durability of two-shifted HRSGs”, European Technology Development
Conference on HRSG Technology, London, November, 2003.
9) Dooley, R.B., Paterson, S.R., Pearson, J.M., “HRSG Dependability”, European
Technology Development Conference on HRSG Technology, London, November,
2003.
10) Dooley, R.B., K.J. Shields, S.R. Paterson, T.A. Kuntz, W.P. McNaughton, M.
Pearson, and R. Sirois, “Delivering High Reliability Heat Recovery Steam
Generators”, TR-1004240, EPRI, Palo Alto, CA. 2003.
11) “Guidelines for the Operation & Maintenance of HRSGs”; Copyright 2003 by
HRSG User's Group, USA
12) Anderson, R.W., Pearson, J.M., “Quantifying Thermal Transients in Heat
Recovery Steam Generators”, EPRI: International Conference on Boiler Tube and
HRSG Tube Failures and Inspections; San Diego, CA, November 2004.
13) Dooley, R.B., “Flow-Accelerated Corrosion in HRSGs”, HRSG Users Group
Annual Meeting, Tampa, FL, April 2005.


![Gas Turbine Startup & Shutdown 9fa [Compatibility Mode]](https://img.pdfslide.us/doc/110x75/552d538d5503462c158b4678/gas-turbine-startup-shutdown-9fa-compatibility-mode.jpg)