Embed Size (px)
Citation preview

HIV/AIDS MORBIDITYIN YOUTH AND TEENS
AGES 13-24IN ALL TEXAS COUNTIES
Meagan HattonMedical Geography 4120Dr. Oppong
Image Source-http://www.topnews.in/health/files/aids1.jpg

Introduction
HIV is from the retrovirus family that causes acquired immunodeficiency syndrome, or AIDS, in which the immune system gradually fails and infections become life threatening
The virus targets the T Cells of the Immune System, Reproduces (into “virus factory”), and explodes- spreading the HIV through the entire body This cycle repeats, until are no T
cells left and the infected person is highly susceptible to infections of all sorts
Since discovered, AIDS has killed more than 25 million people worldwide, and in Texas it kills roughly 1,300 every year
Image Source-http://topnews.ae/images/Spread-HIV7.jpg
Image Source-http://www.biology.arizona.edu/immunology/tutorials/aids/graphics/
aids_disease.jpg

Why Should We Bother? HIV/AIDS is a serious pandemic, and a huge threat
in Texas for Black populations and urban areas Much of the literature review stated that Youths and
Teens were unaware of the serious threat of HIV/AIDS due to a lack of education as well as those living in low income households, which also reflect a lack of necessary finance to get tested and treated
The Research was intended to understand the spatial distribution of HIV/AIDS in all (254) Texas counties Among Youths and Teens, Ages 13-24Human Ecology Disease Model Used:
Environment, Genetics, and Human Behavior Variables include : Urban Populations Unsafe Sex
Chlamydia Rates Teen Birth Rates
Level of Education Percent With Less Than a High School Graduate
Degree Percent With a Bachelor’s Degree or Higher
Race/Ethnicity Black, White, and Hispanic
Socioeconomic Factors Median Income Percent of Single-Parent Households Percent of Children Living in Poverty
The Research
Image Source- http://www.gdmaf.org/GDMAF/MetroBall_files/309181_8194-1.jpg

Research Hypotheses1. Race is a predictor of HIV/AIDS prevalence. The
rate of HIV/AIDS is higher in counties with high populations of Black people rather than White or Hispanic people
2. The rate of HIV/AIDS is higher in counties with higher urban populations
3. Unsafe Sex is a predictor. Where there are high rates of Chlamydia and Teen Birth Rates, there will be high rates of HIV/AIDS
4. The rate of HIV/AIDS is higher where there is a higher population of people who received less than a high school graduate degree.
1. And lower where there is a high percentage of those with a Bachelor’s Degree or Higher for every county.
5. Socioeconomic Status is an indicator of HIV/AIDS rates. Where there are high rates, there will also be
1. High Percentages of Children Living in Poverty2. Low Median Family Incomes3. High Percentages of Single-Parent Households
Image Source- http://www.topnews.in/files/aids12.gif

-HIV cases occurred predominantly in metropolitan areas.-The highest rate of HIV cases occupied the Harris, Dallas, Bexar, Travis and Tarrant Counties
-Higher rates of HIV/AIDS exist in East Texas where there is a high population of Blacks
-Higher rates are occurring also in the Northeast, where there are higher urban populations

Blacks comprise 11% of the total populationYet, account for 47.3% of the cases among ages 13-24
There was a positive correlation between the rate of HIV/AIDS and BlacksR Value: .458
Significant at less than 1% Null was rejected
As the Black population increases, so does the rate of HIV/AIDS
-Hispanics comprise 32% of the total population in Texas
- Account for 24.4% of the HIV/AIDS cases among ages 13-24
- There was a negative correlation- R Value: -.136- Significant at 3%- Null was rejected- Weak correlation
- As the Hispanic population increases, the rate of HIV/AIDS decreases

-Whites comprise 52.4% of the total population
- Account for 27.3% of the HIV/AIDS cases among ages 13-24
- There was a negative correlation- Null was rejected- Weak correlation
- R Value: -.135- Significant at 3%
- As the White population increases, the rate of HIV/AIDS decreases

-There was a positive correlation- Moderately Correlated- The null was rejected
- R Value: .535- Significant at Less than 1%
- Statistically Significant
- Where there are high rates of urban populations, there are high rates of HIV/AIDS
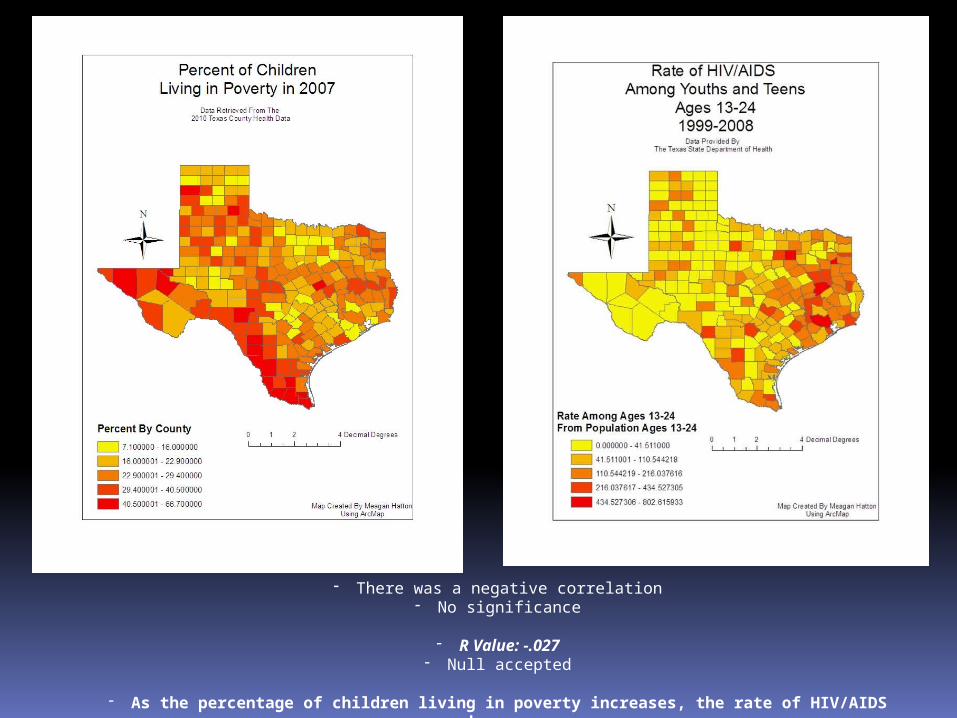
- There was a negative correlation- No significance
- R Value: -.027- Null accepted
- As the percentage of children living in poverty increases, the rate of HIV/AIDS decreases
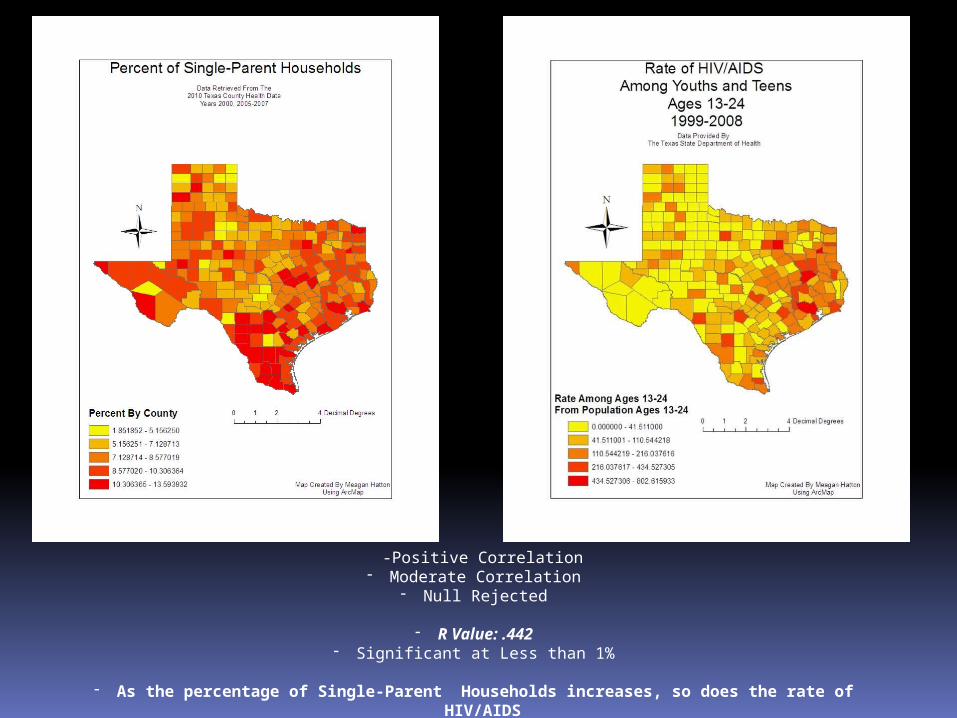
-Positive Correlation- Moderate Correlation
- Null Rejected
- R Value: .442- Significant at Less than 1%
- As the percentage of Single-Parent Households increases, so does the rate of HIV/AIDS
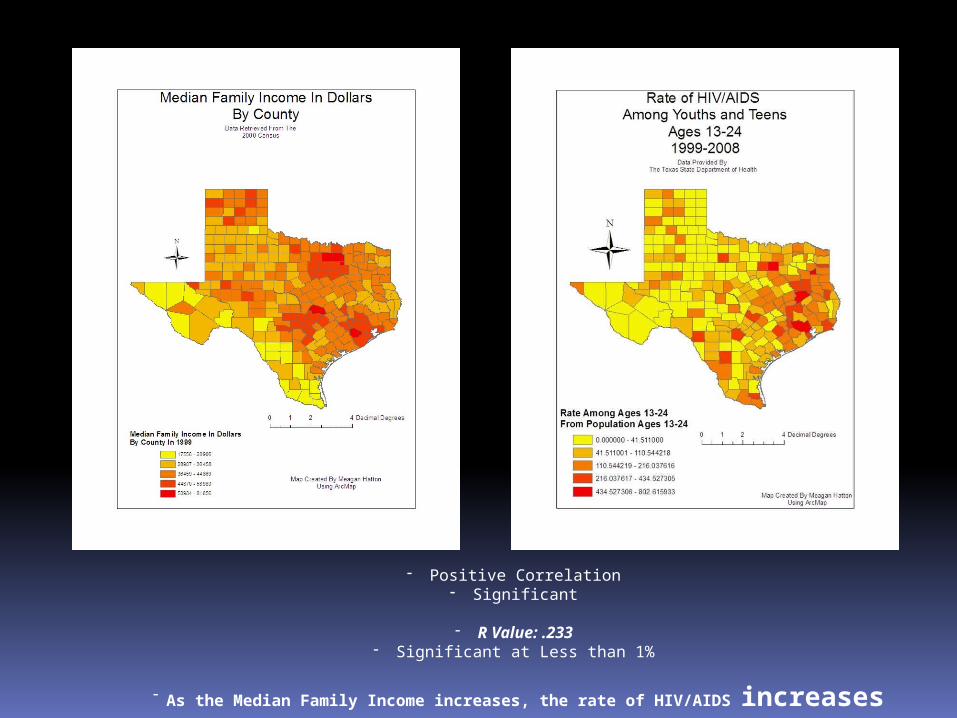
- Positive Correlation- Significant
- R Value: .233- Significant at Less than 1%
- As the Median Family Income increases, the rate of HIV/AIDS increases

-Positive Correlation- No Correlation
- R Value: .039
- Not Statistically Significant
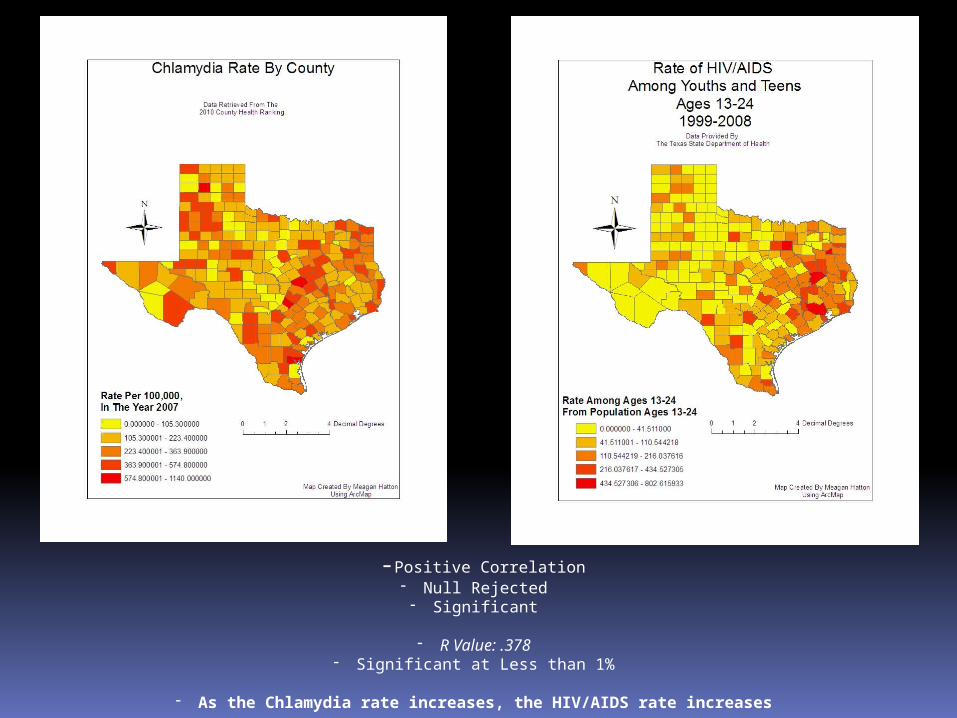
-Positive Correlation- Null Rejected- Significant
- R Value: .378- Significant at Less than 1%
- As the Chlamydia rate increases, the HIV/AIDS rate increases

- Negative Correlation- Weak Correlation
- Null Rejected
- R Value: -.265- Significant at Less than 1%
- As the percentage of those with less than a High School graduate degree increases, the HIV/AIDS rate decreases

- Positive Correlation- Highly Correlated
- Significant- Null Rejected
- R Value: .987- Significant at Less than 1%
- As the percentage of those with a Bachelor’s Degree or higher increases, the rate of HIV/AIDS increases
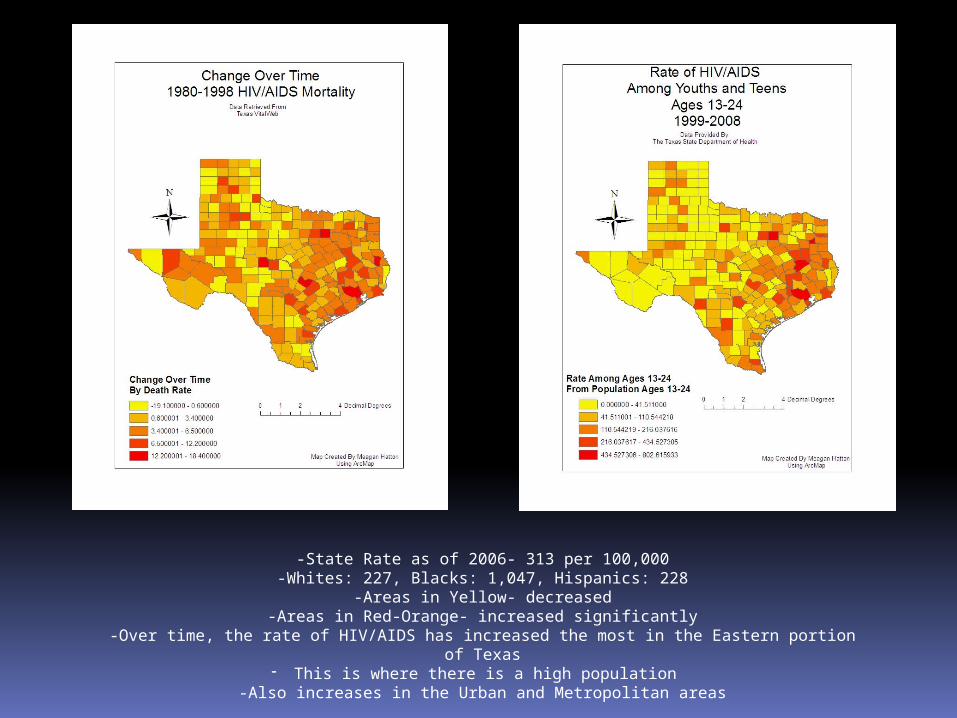
-State Rate as of 2006- 313 per 100,000-Whites: 227, Blacks: 1,047, Hispanics: 228
-Areas in Yellow- decreased-Areas in Red-Orange- increased significantly
-Over time, the rate of HIV/AIDS has increased the most in the Eastern portion of Texas- This is where there is a high population
-Also increases in the Urban and Metropolitan areas
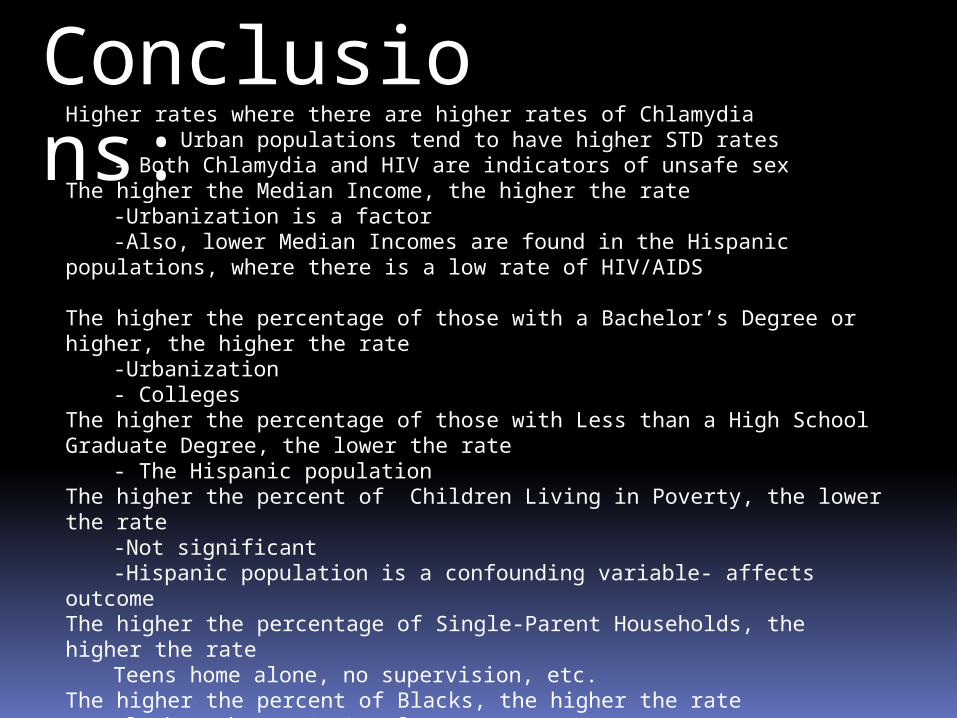
Conclusions:
Higher rates where there are higher rates of Chlamydia - Urban populations tend to have higher STD rates
- Both Chlamydia and HIV are indicators of unsafe sexThe higher the Median Income, the higher the rate
-Urbanization is a factor-Also, lower Median Incomes are found in the Hispanic populations,
where there is a low rate of HIV/AIDS
The higher the percentage of those with a Bachelor’s Degree or higher, the higher the rate
-Urbanization - Colleges
The higher the percentage of those with Less than a High School Graduate Degree, the lower the rate
- The Hispanic populationThe higher the percent of Children Living in Poverty, the lower the rate
-Not significant-Hispanic population is a confounding variable- affects outcome
The higher the percentage of Single-Parent Households, the higher the rateTeens home alone, no supervision, etc.
The higher the percent of Blacks, the higher the rateBlacks make up 47.3% of cases
Teen Births not significant

Further Research-Looking at the access to healthcare
facilities in East Texas
-Education in urban areas and at Universities
-Disregard the Hispanic population?
-STD Awareness Programs
-Mode of Transmission
Image Source-http://www.tapestryhealth.org/teensite/wp-content/uploads/2009/05/web_teenagers400_c1.jpg

Reduce Your Risks!
-Abstinence is the only sure way to not contract HIV in terms of sex-If engaging in sexual activities, always use protection-Know your partner’s HIV/AIDS status- Get tested (Even if you aren’t pregnant)-Talk to your doctor if you feel you are having any symptoms-Don’t share any needles, ever, for any reason-Treat all blood and bodily fluids as if they are infected
Image Source- http://aidemocracy.files.wordpress.com/2009/11/aids_fight4.jpg
Image Source-http://republicofaustin.com/wp-content/uploads/2009/12/aids_front_big.jpg