Embed Size (px)
Citation preview
A map says to you, 'Read me carefully, follow me closely, doubt me not.' It says, 'I am the Earth in the palm of your hand. Without
me, you are alone and lost.’
Beryl Markham (West With the Night, 1946 )
• Map Projections
• Families of Projections
• Computer Cartography
Students often have trouble with geographic names and terms. If you need/want to know how to pronounce something, try this link.
Audio Pronunciation Guide
The site doesn’t list everything but it does have the words with which you’re most likely to have trouble.
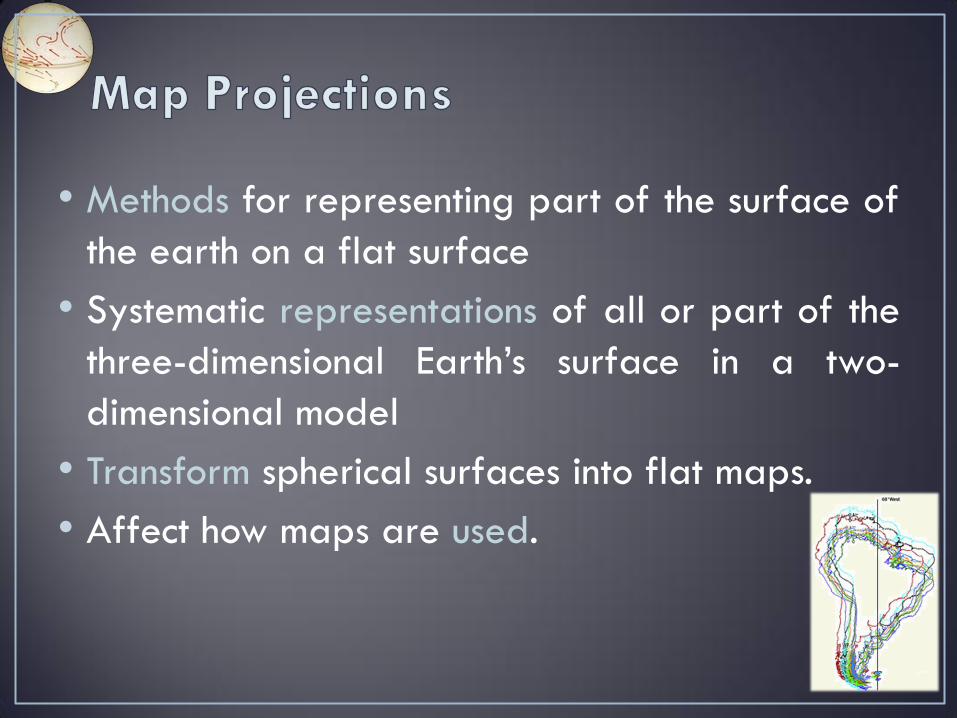
• Methods for representing part of the surface of
the earth on a flat surface
• Systematic representations of all or part of the
three-dimensional Earth’s surface in a two-
dimensional model
• Transform spherical surfaces into flat maps.
• Affect how maps are used.
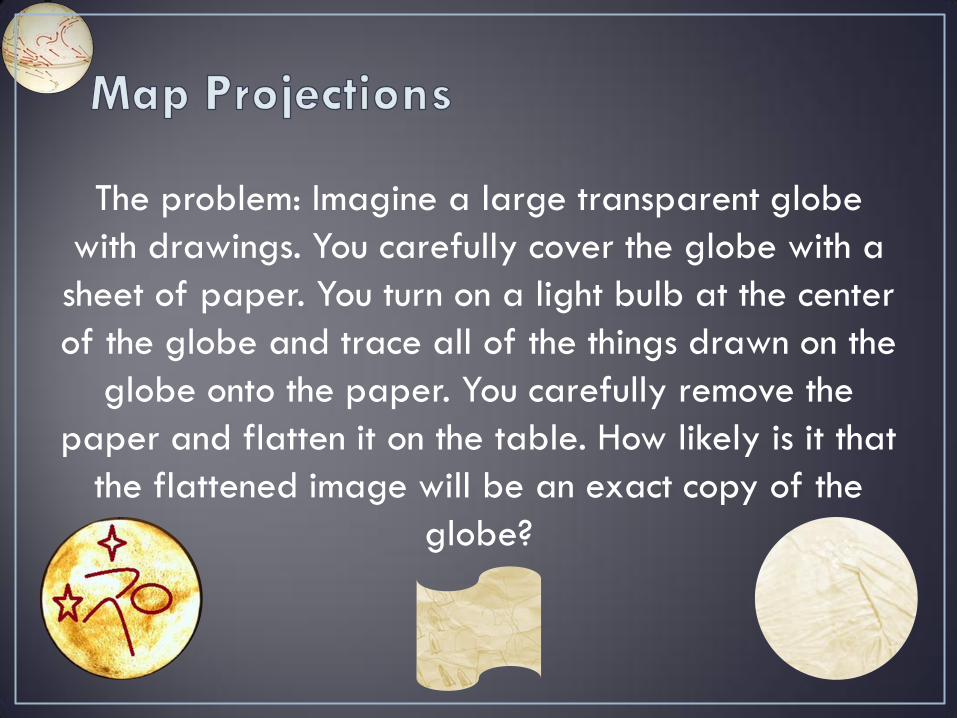
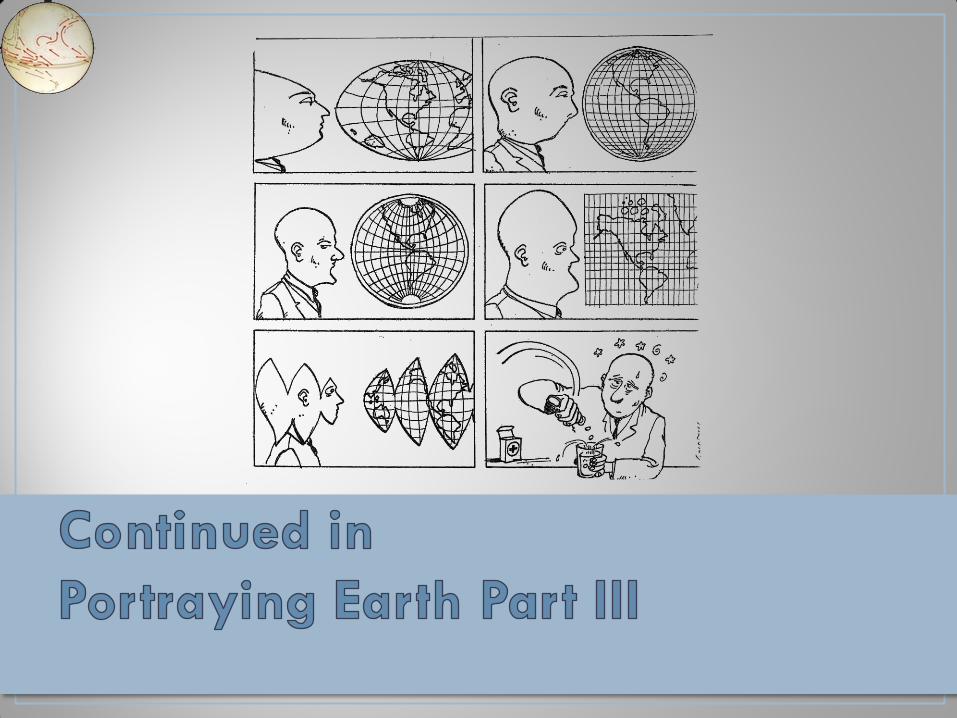
The problem: Imagine a large transparent globe
with drawings. You carefully cover the globe with a
sheet of paper. You turn on a light bulb at the center
of the globe and trace all of the things drawn on the
globe onto the paper. You carefully remove the
paper and flatten it on the table. How likely is it that
the flattened image will be an exact copy of the
globe?
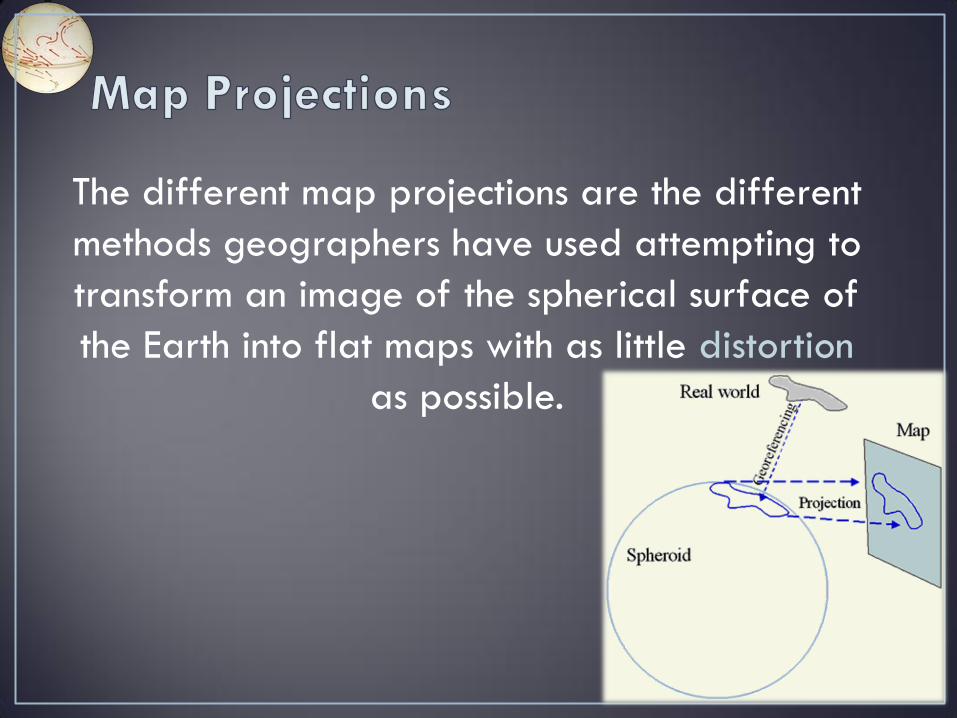
The different map projections are the different
methods geographers have used attempting to
transform an image of the spherical surface of
the Earth into flat maps with as little distortion
as possible.
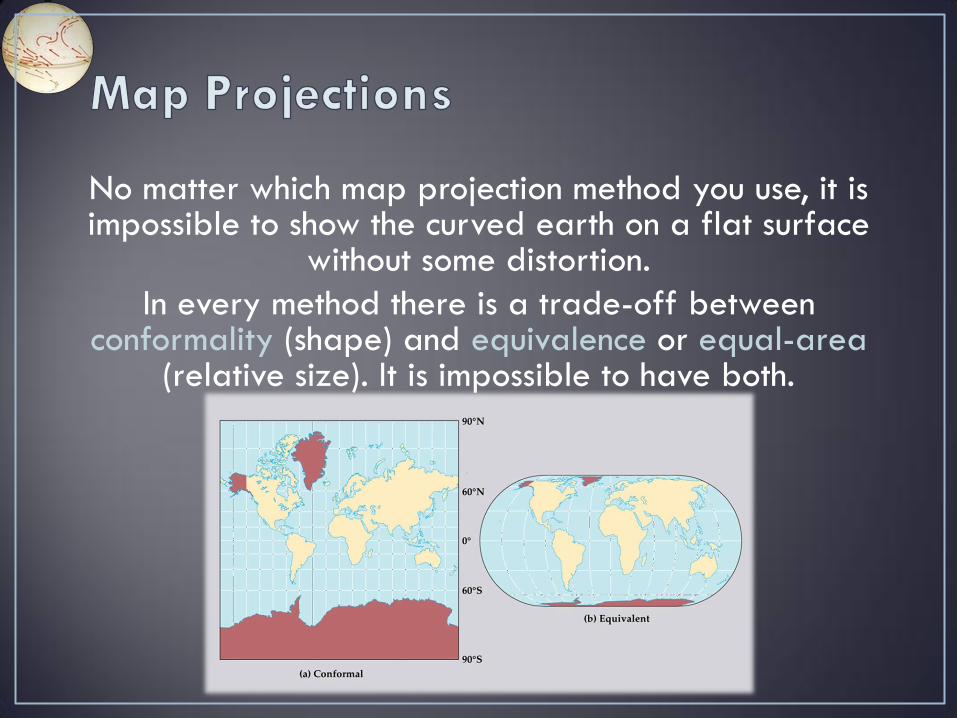
No matter which map projection method you use, it is impossible to show the curved earth on a flat surface
without some distortion.
In every method there is a trade-off between conformality (shape) and equivalence or equal-area
(relative size). It is impossible to have both.
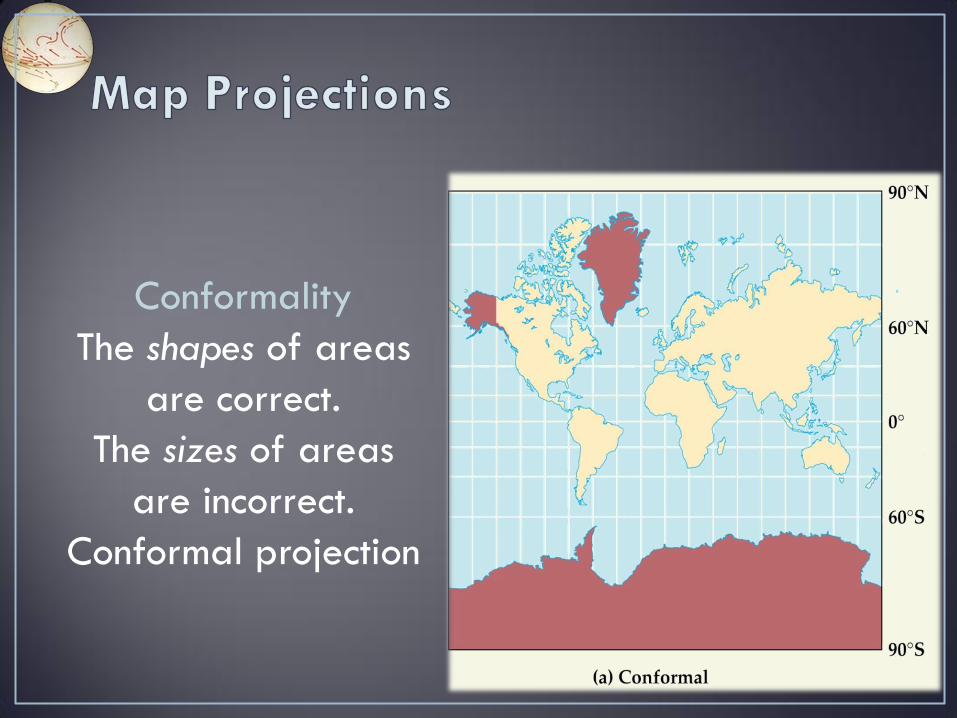
Conformality
The shapes of areas
are correct.
The sizes of areas
are incorrect.
Conformal projection
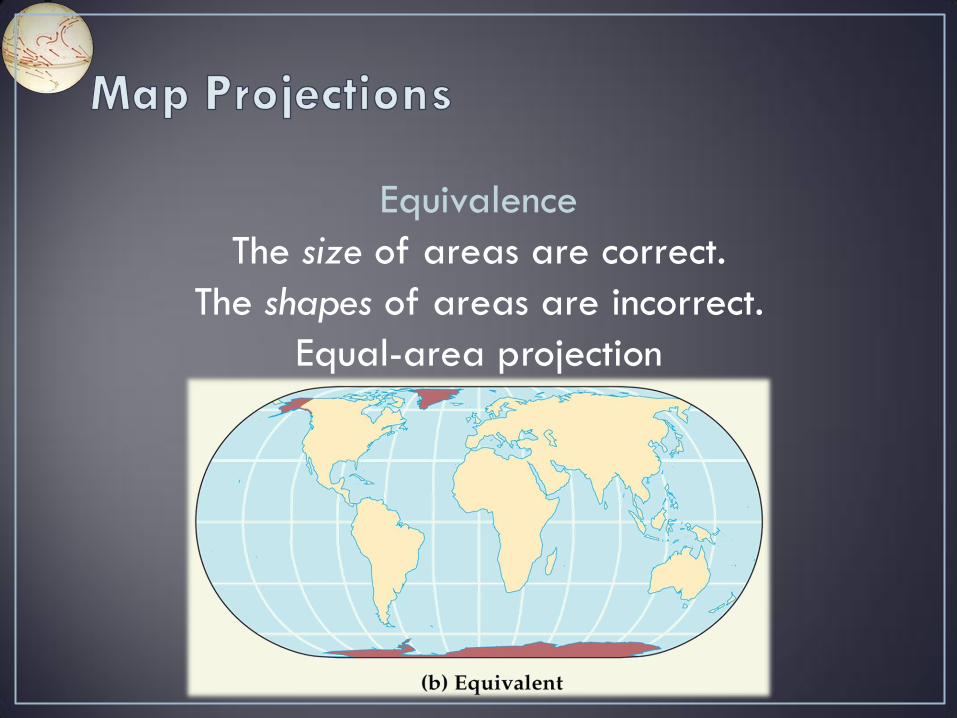
Equivalence
The size of areas are correct.
The shapes of areas are incorrect.
Equal-area projection
A fundamental projection classification is based on the type of projection surface onto which the globe is
conceptually projected. These surfaces are:
cylindrical (eg, Mercator)
conic (eg, Albers)
azimuthal or planar (eg, stereographic).
Many mathematical projections, however, do not neatly fit into any of these three conceptual projection methods.
Hence other peer categories have been described in the literature, such as pseudoconic, pseudocylindrical, pseudoazimuthal, retroazimuthal and polyconic.
Another way to classify projections is according to properties of the model they preserve. Some of the more common categories are:
• Preserving direction (azimuthal or zenithal), a trait possible only from one or two points to every other point
• Preserving shape locally (conformal or orthomorphic)
• Preserving area (equivalent or equal-area)
• Preserving distance (equidistant), a trait possible only between one or two points and every other point
• Preserving shortest route, a trait preserved only by the gnomonic projection
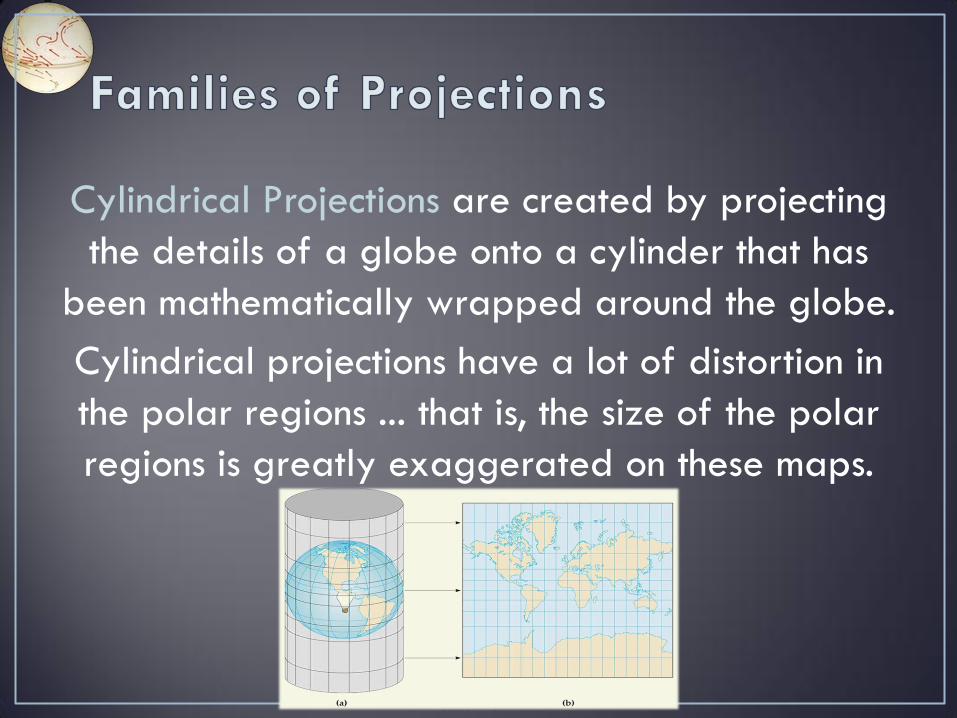
Cylindrical Projections are created by projecting
the details of a globe onto a cylinder that has
been mathematically wrapped around the globe.
Cylindrical projections have a lot of distortion in
the polar regions ... that is, the size of the polar
regions is greatly exaggerated on these maps.
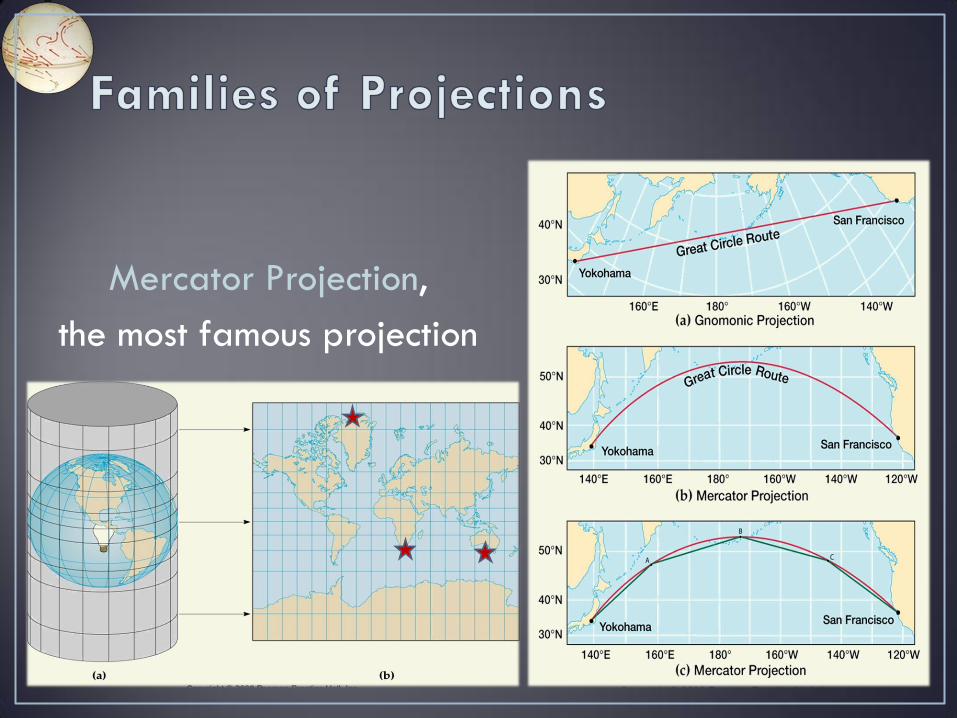
Mercator Projection,
the most famous projection
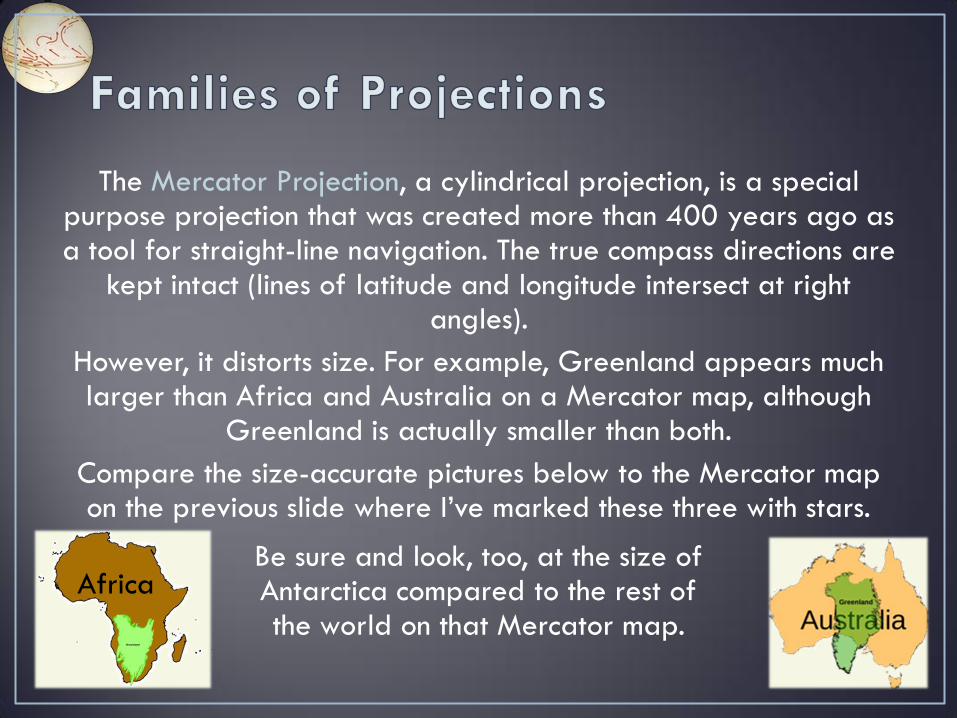
The Mercator Projection, a cylindrical projection, is a special purpose projection that was created more than 400 years ago as a tool for straight-line navigation. The true compass directions are
kept intact (lines of latitude and longitude intersect at right angles).
However, it distorts size. For example, Greenland appears much larger than Africa and Australia on a Mercator map, although
Greenland is actually smaller than both.
Compare the size-accurate pictures below to the Mercator map on the previous slide where I’ve marked these three with stars.
Africa Be sure and look, too, at the size of Antarctica compared to the rest of the world on that Mercator map.
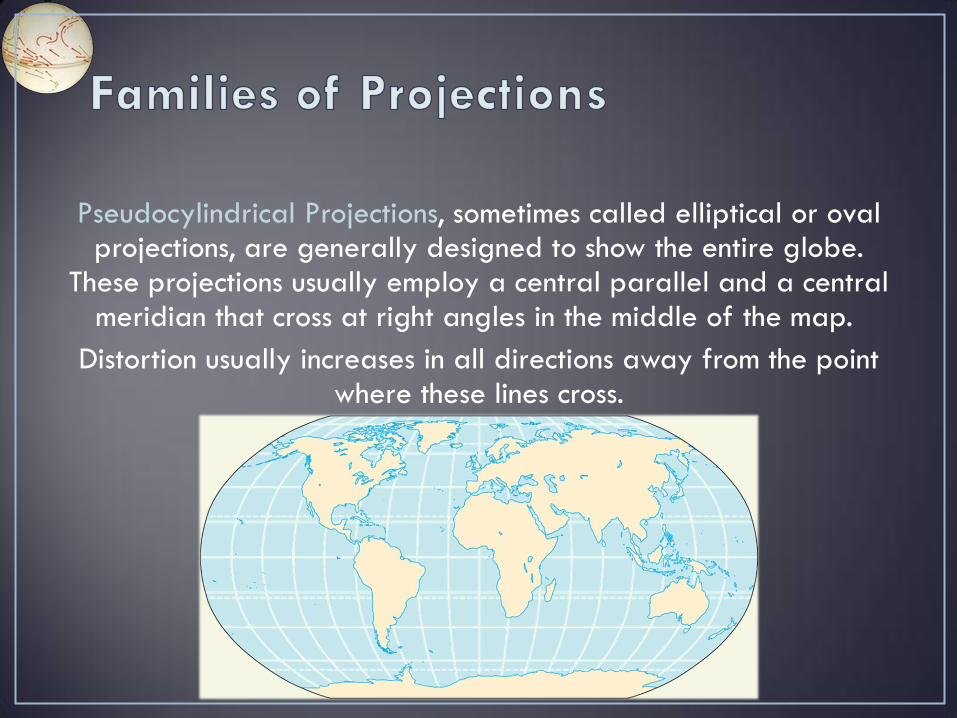
Pseudocylindrical Projections, sometimes called elliptical or oval projections, are generally designed to show the entire globe.
These projections usually employ a central parallel and a central meridian that cross at right angles in the middle of the map.
Distortion usually increases in all directions away from the point where these lines cross.
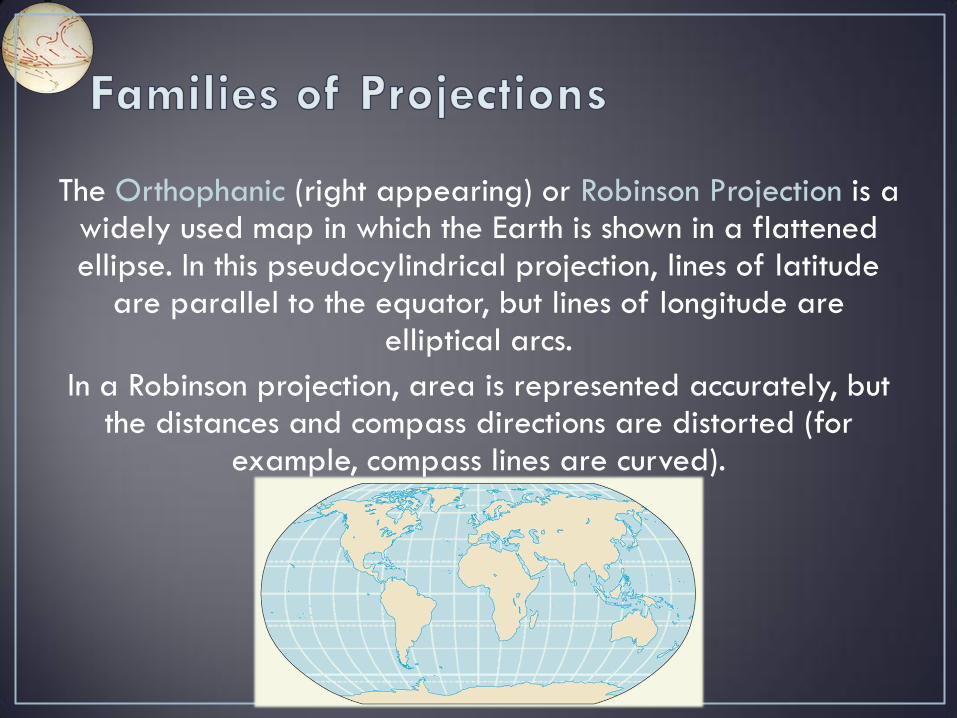
The Orthophanic (right appearing) or Robinson Projection is a widely used map in which the Earth is shown in a flattened ellipse. In this pseudocylindrical projection, lines of latitude
are parallel to the equator, but lines of longitude are elliptical arcs.
In a Robinson projection, area is represented accurately, but the distances and compass directions are distorted (for
example, compass lines are curved).
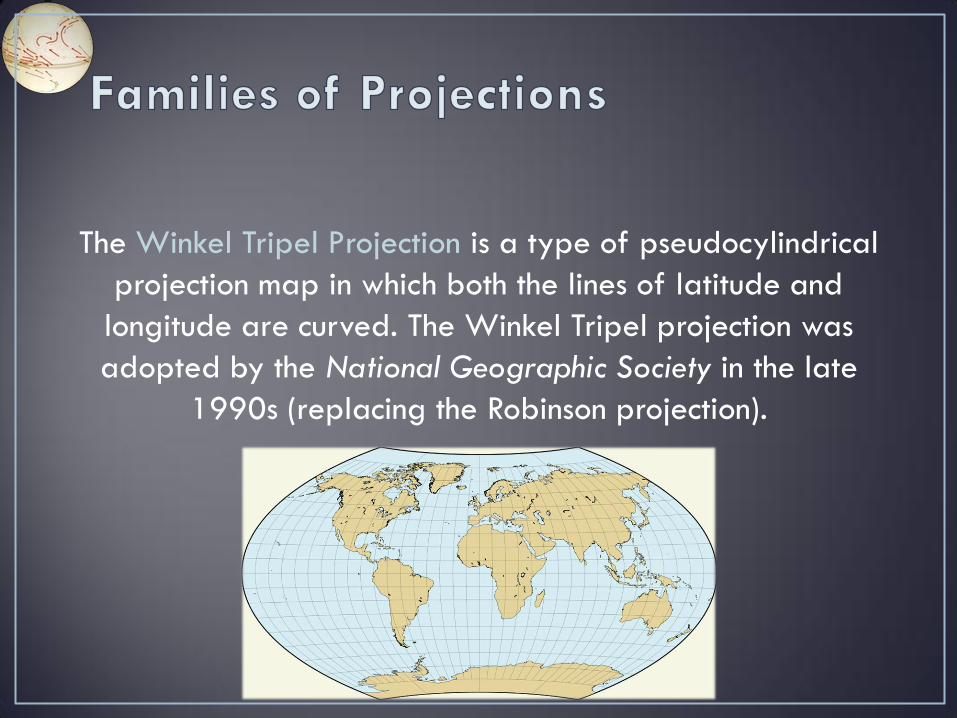
The Winkel Tripel Projection is a type of pseudocylindrical
projection map in which both the lines of latitude and
longitude are curved. The Winkel Tripel projection was
adopted by the National Geographic Society in the late
1990s (replacing the Robinson projection).
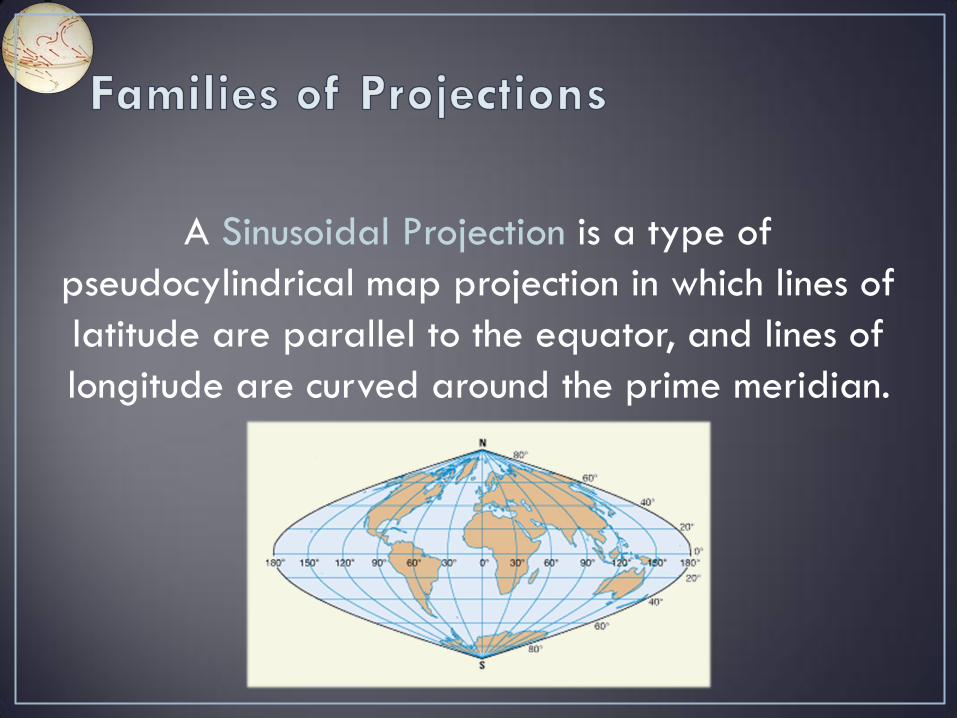
A Sinusoidal Projection is a type of
pseudocylindrical map projection in which lines of
latitude are parallel to the equator, and lines of
longitude are curved around the prime meridian.
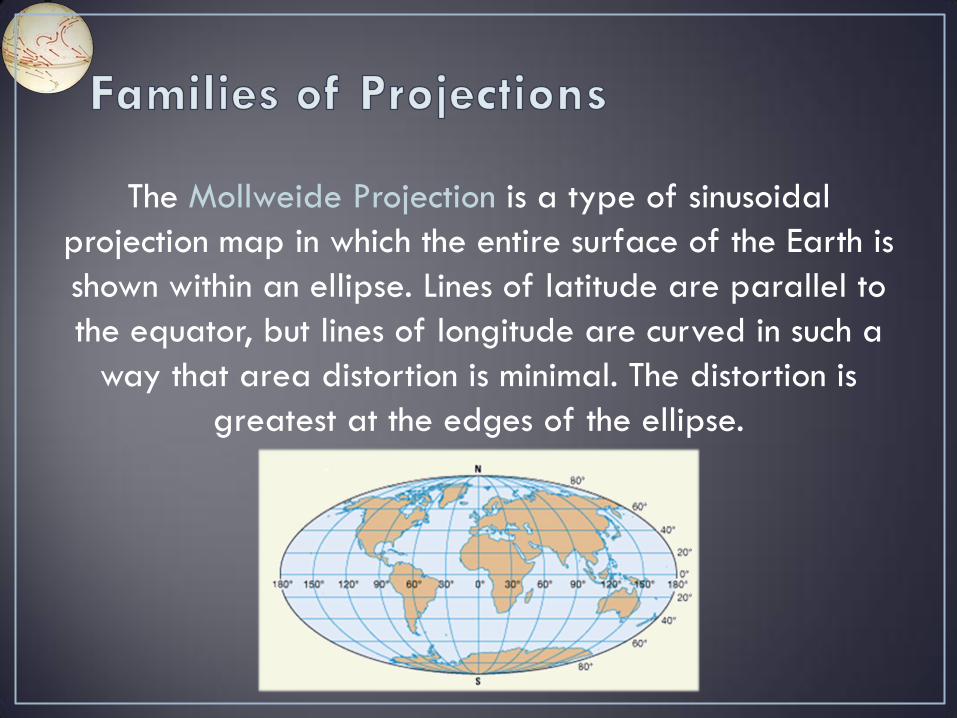
The Mollweide Projection is a type of sinusoidal
projection map in which the entire surface of the Earth is
shown within an ellipse. Lines of latitude are parallel to
the equator, but lines of longitude are curved in such a
way that area distortion is minimal. The distortion is
greatest at the edges of the ellipse.
Other cylindrical projections include the Gall-Peters or Gall orthographic projection, the Behrmann projection, the Lambert cylindrical equal-area projection, the
Equirectangular projection, the Cassini projection, The Gauss-Krüger projection, the Gall stereographic projection, the
Miller projection, the Hobo-Dyer projection and the Central cylindrical projection.
Other pseudocylindrical projections include the Collignon projection, the Eckert II, IV, VI projections, the Ortelius oval
projection, the Goode homolosine projection, the Kavrayskiy VII projection, the Natural Earth projection, the Tobler
hyperelliptical projection, the Wagner VI projection, the Boggs eumorphic projection and the Loximuthal projection.
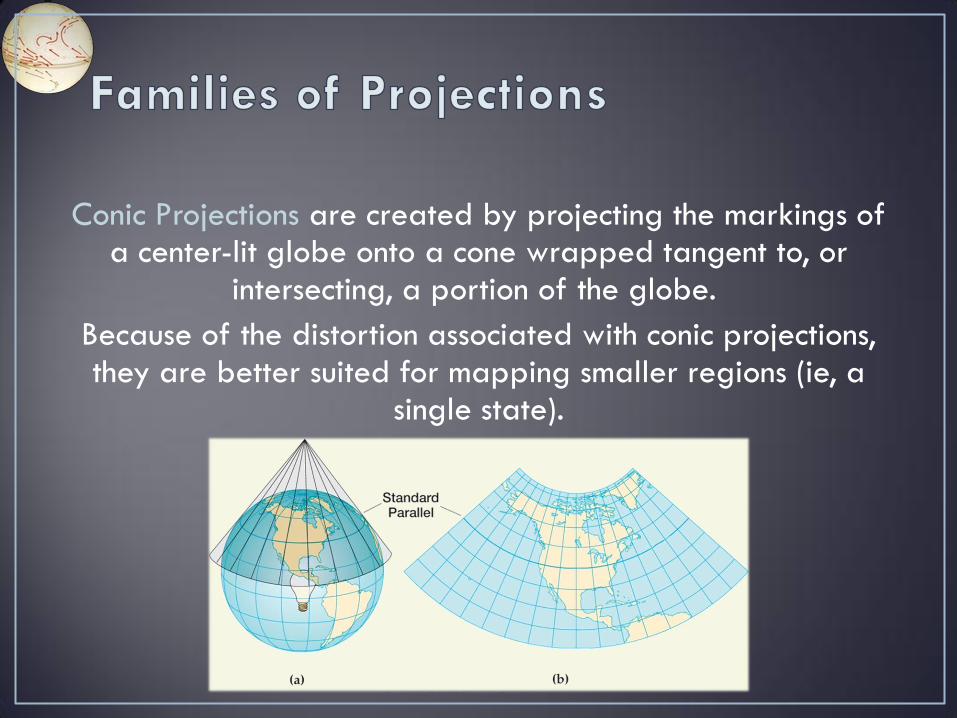
Conic Projections are created by projecting the markings of a center-lit globe onto a cone wrapped tangent to, or
intersecting, a portion of the globe.
Because of the distortion associated with conic projections, they are better suited for mapping smaller regions (ie, a
single state).
The most popular conic projections include the
Equidistant conic projection, the Albers conic
projection and the Lambert conformal conic
projection.
Pseudoconic projections include the Bonne
projection, the Werner cordiform projection, the
Continuous American polyconic projection and the
Bottomley projection.
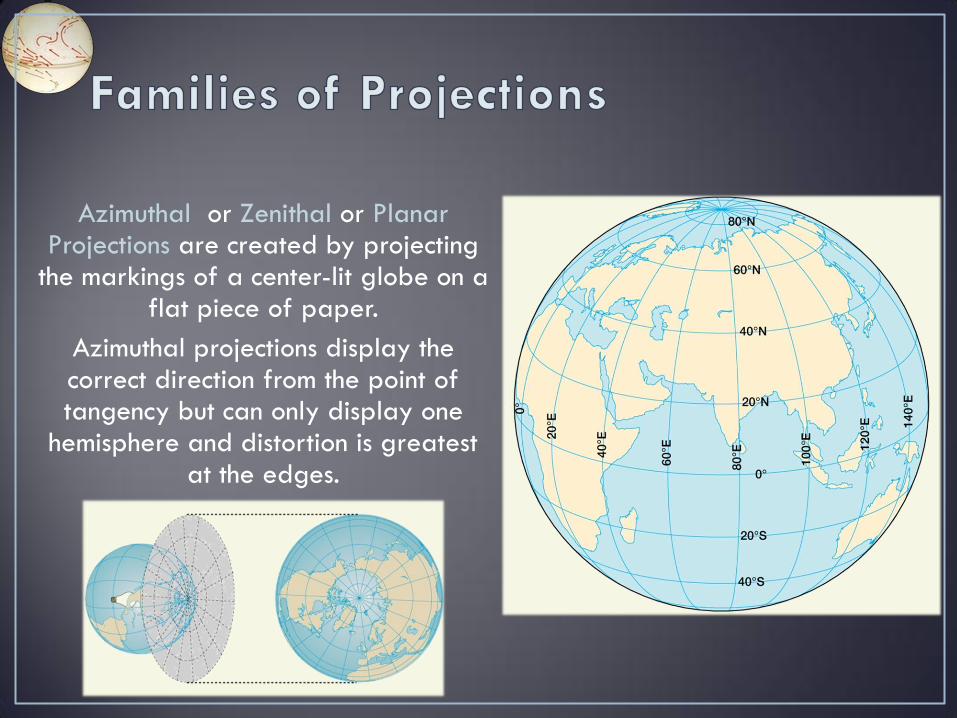
Azimuthal or Zenithal or Planar Projections are created by projecting
the markings of a center-lit globe on a flat piece of paper.
Azimuthal projections display the correct direction from the point of tangency but can only display one
hemisphere and distortion is greatest at the edges.
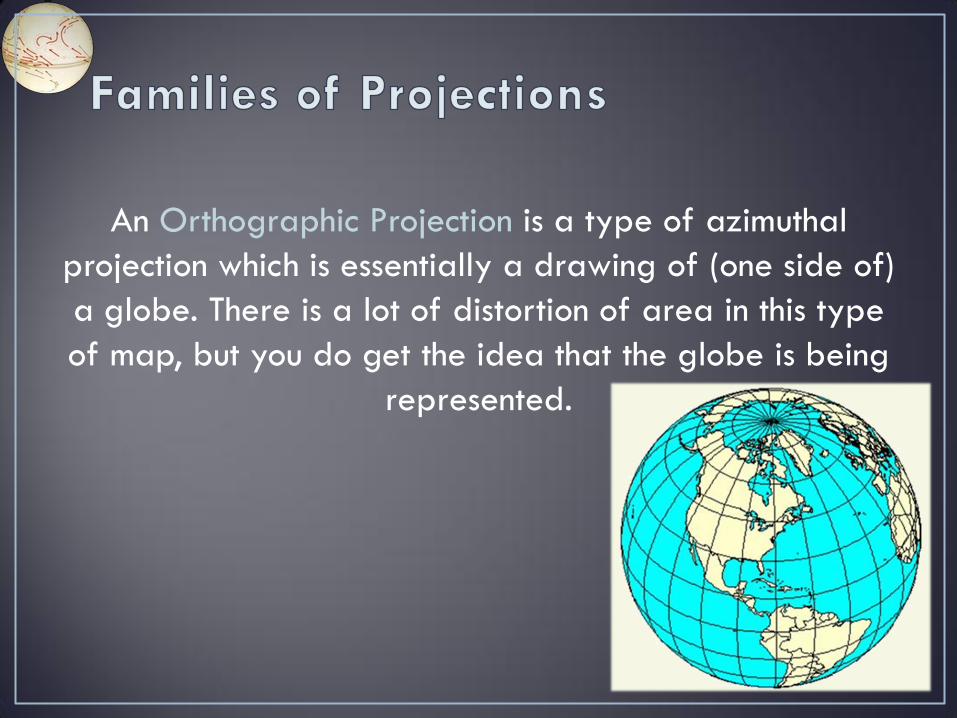
An Orthographic Projection is a type of azimuthal
projection which is essentially a drawing of (one side of)
a globe. There is a lot of distortion of area in this type
of map, but you do get the idea that the globe is being
represented.
Other azimuthal projections include the gnomonic projection, the General Perspective projection, the azimuthal conformal or stereographic projection, the Azimuthal equidistant projection, the Lambert
azimuthal equal-area projection and the Logarithmic azimuthal projection.
Pseudoazimuthal projections include the Aitoff projection and the Hammer projection.
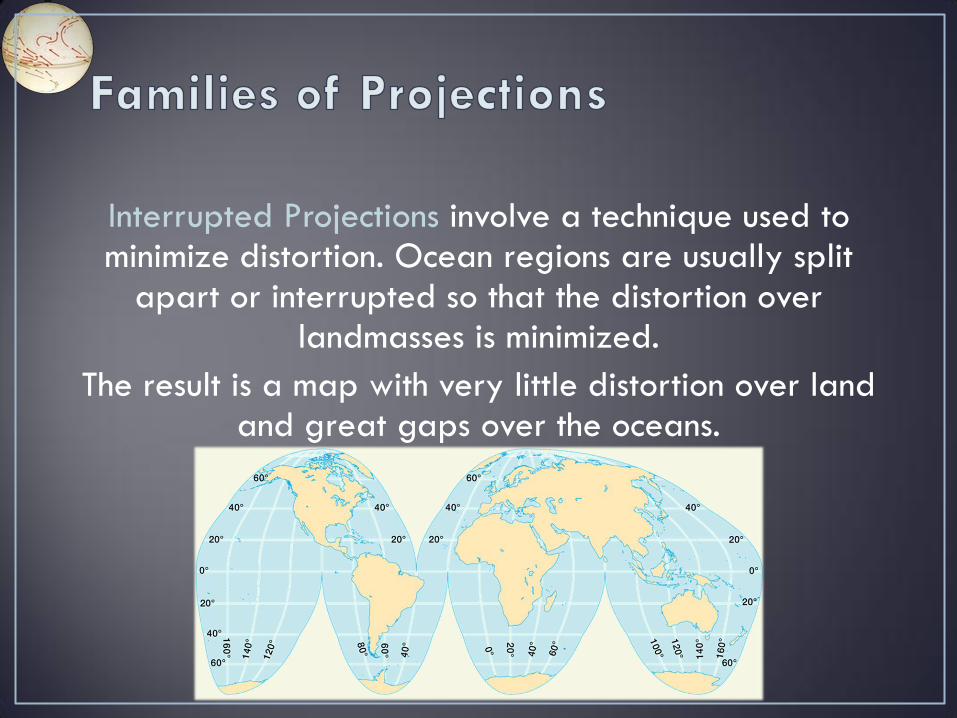
Interrupted Projections involve a technique used to minimize distortion. Ocean regions are usually split
apart or interrupted so that the distortion over landmasses is minimized.
The result is a map with very little distortion over land and great gaps over the oceans.
• Also known as Computer Assisted Cartography (CAC)
• Mainframe computers
• Symap - the Synagraphic Mapping System, a computerized cartographic planning tool
• Desktop computers - thematic mapping: simplified GIS programs, come with maps and some data, spreadsheets, statistical programs
• Incredible improvements
• Demand for skilled cartographers
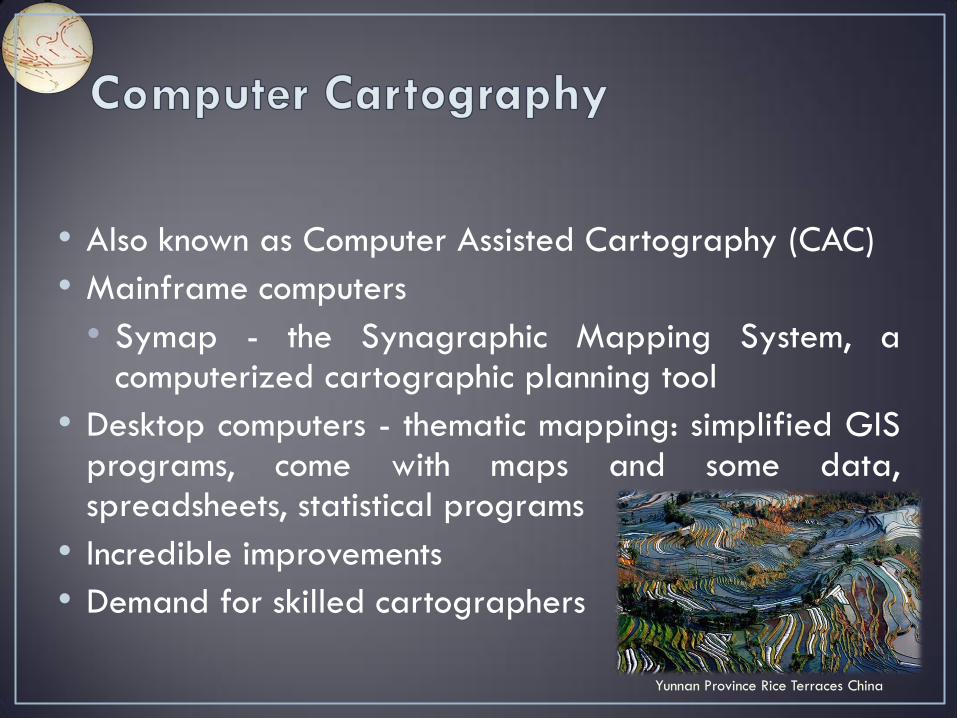
Yunnan Province Rice Terraces China
Advantages of CAC over Hand Cartography
• Easy to modify existing digital base maps to create new maps.
• Can achieve very high levels of accuracy.
• Can store digital maps easier than paper maps.
• Can easily adjust coordinates to their proper location (geocoding).
• Can easily overlay and visually compare geocoded maps to one another.
• Most CAC systems allow some data to be attached to the points, lines and polygons.
• Can allow opportunities for new presentation methods, for example interactive computer maps, CD ROMS, web, public kiosks.
• Can purchase ready made maps in common formats.
Disadvantages of CAC
• Initial map conversion (data capture) cost, for example digitising, scanning, operator assisted scanning
• Finished results are often less attractive than hand-drawn maps.
• Conversion between raster and vector data formats can be difficult and time-consuming.
• Computer software and equipment maintenance and upgrading costs
• Staff training costs can be high.
• Organizational inertia
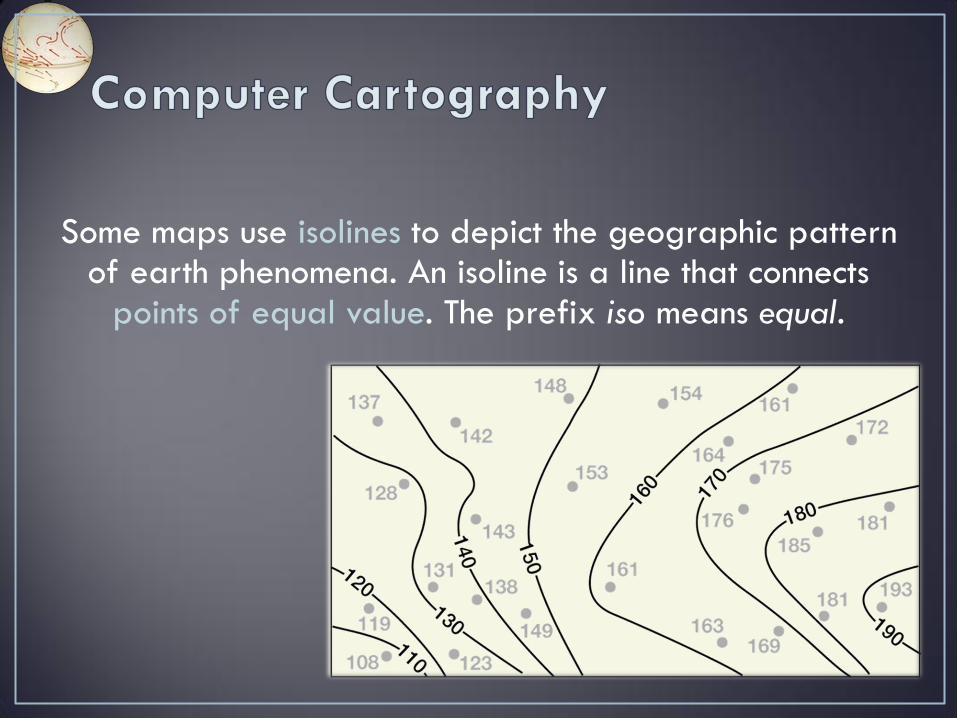
Some maps use isolines to depict the geographic pattern of earth phenomena. An isoline is a line that connects
points of equal value. The prefix iso means equal.
A few rules apply to isolines:
• Two different isolines cannot cross each other. If they did, it would mean two different values are at the same location.
• Values on one side of the isoline are higher or lower than values on the other side.
• Isolines represent continuous surfaces (like a ground surface, ie, it doesn't suddenly disappear).
• The interval between isolines is the same over the entire map (unless otherwise specified).
• Isoline maps of the environment almost always represent an overhead view, looking straight down.
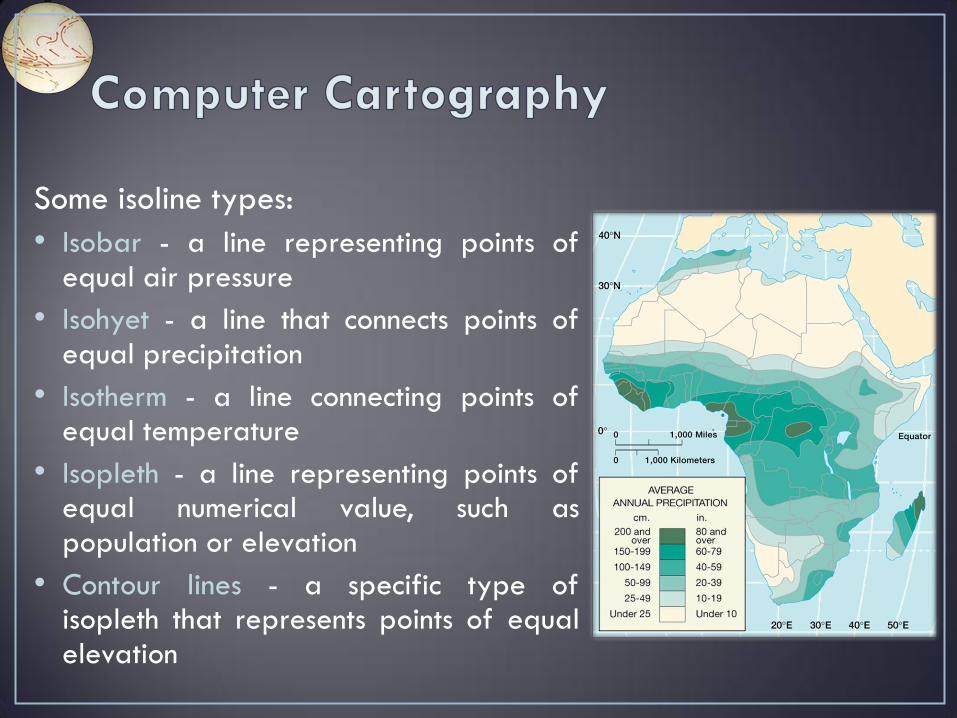
Some isoline types:
• Isobar - a line representing points of equal air pressure
• Isohyet - a line that connects points of equal precipitation
• Isotherm - a line connecting points of equal temperature
• Isopleth - a line representing points of equal numerical value, such as population or elevation
• Contour lines - a specific type of isopleth that represents points of equal elevation
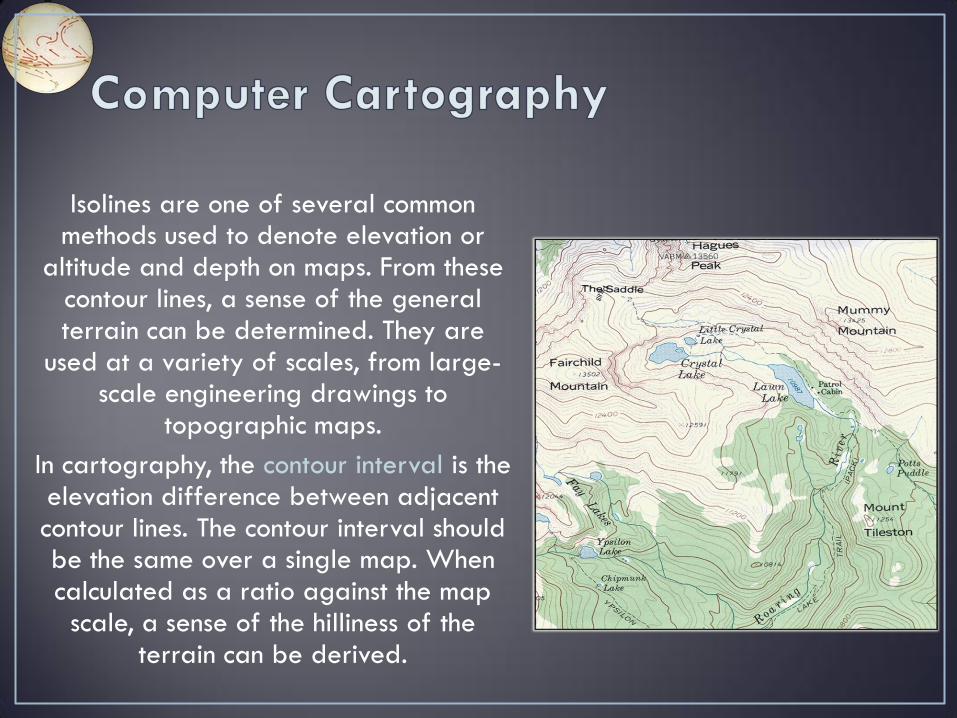
Isolines are one of several common methods used to denote elevation or
altitude and depth on maps. From these contour lines, a sense of the general terrain can be determined. They are
used at a variety of scales, from large-scale engineering drawings to
topographic maps.
In cartography, the contour interval is the elevation difference between adjacent contour lines. The contour interval should be the same over a single map. When calculated as a ratio against the map scale, a sense of the hilliness of the
terrain can be derived.
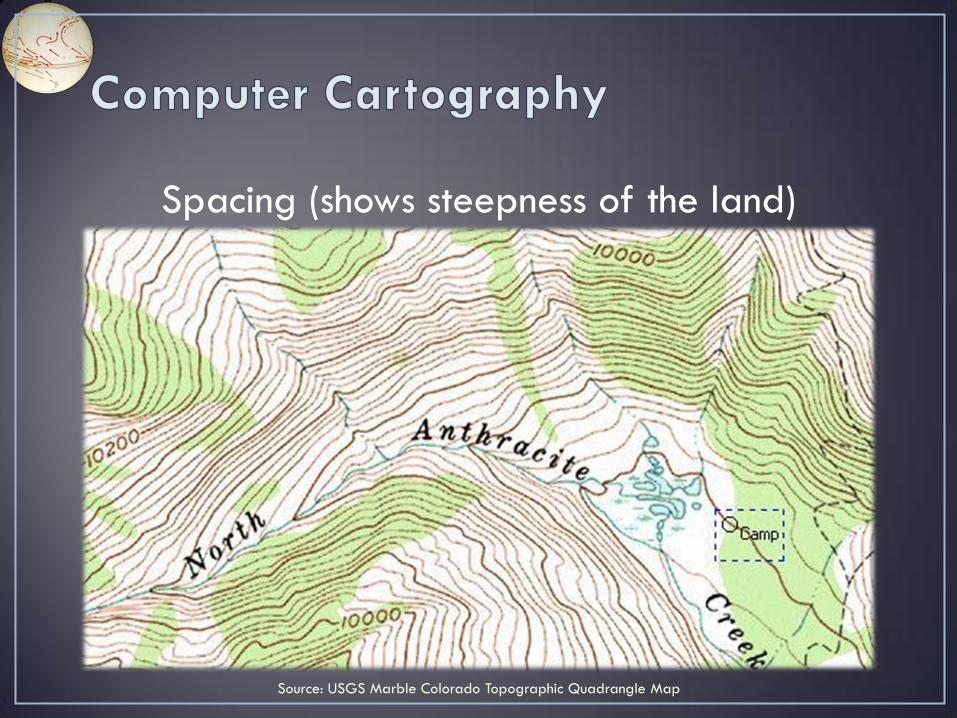
Spacing (shows steepness of the land)
Source: USGS Marble Colorado Topographic Quadrangle Map
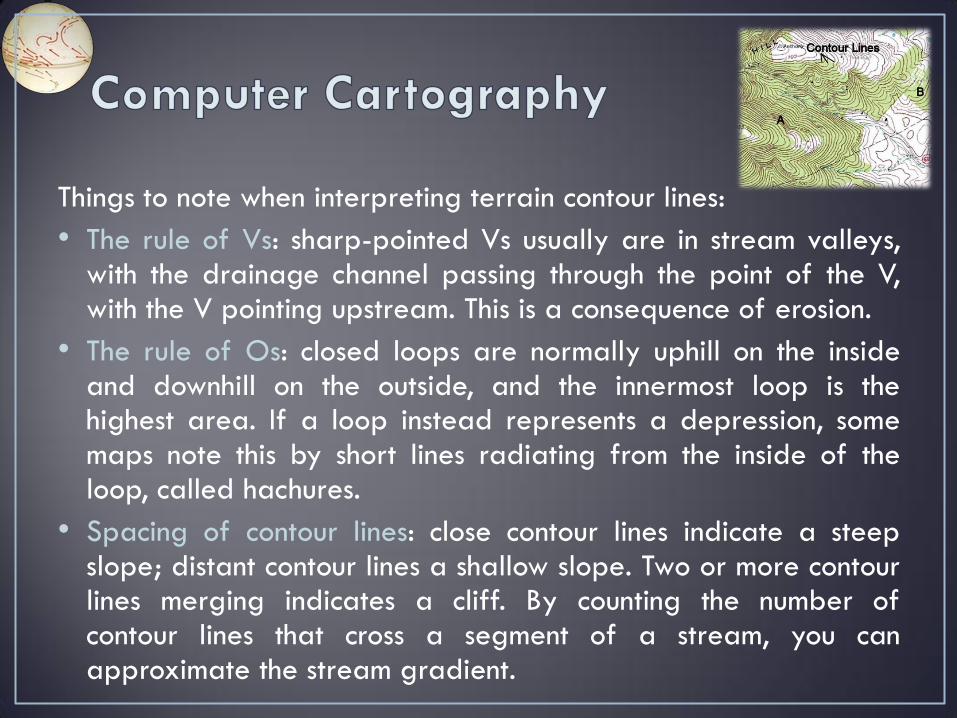
Things to note when interpreting terrain contour lines:
• The rule of Vs: sharp-pointed Vs usually are in stream valleys, with the drainage channel passing through the point of the V, with the V pointing upstream. This is a consequence of erosion.
• The rule of Os: closed loops are normally uphill on the inside and downhill on the outside, and the innermost loop is the highest area. If a loop instead represents a depression, some maps note this by short lines radiating from the inside of the loop, called hachures.
• Spacing of contour lines: close contour lines indicate a steep slope; distant contour lines a shallow slope. Two or more contour lines merging indicates a cliff. By counting the number of contour lines that cross a segment of a stream, you can approximate the stream gradient.
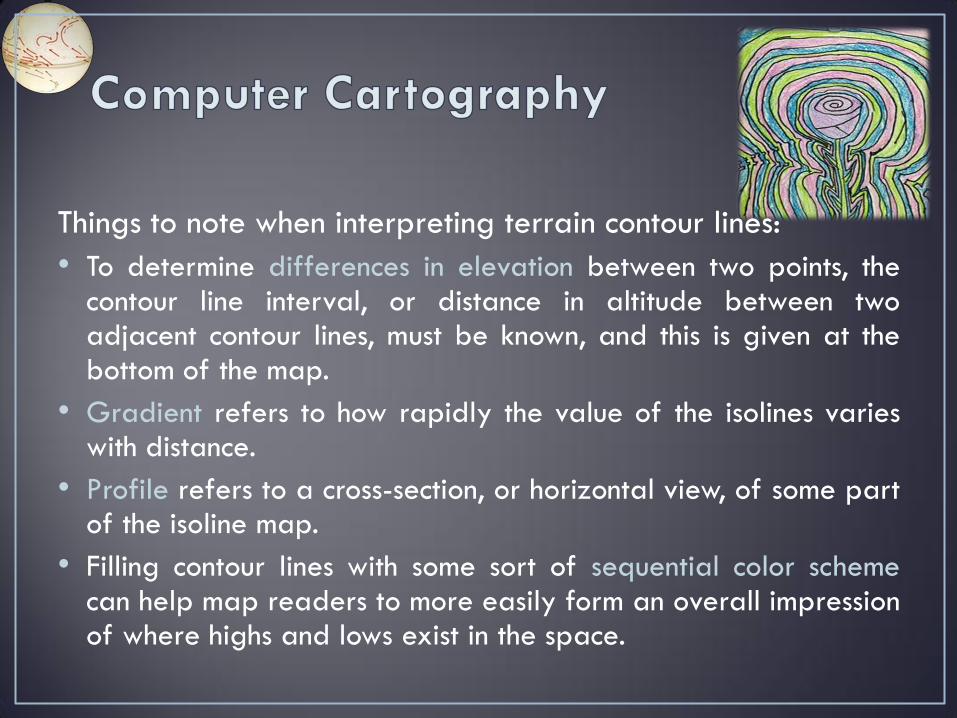
Things to note when interpreting terrain contour lines:
• To determine differences in elevation between two points, the contour line interval, or distance in altitude between two adjacent contour lines, must be known, and this is given at the bottom of the map.
• Gradient refers to how rapidly the value of the isolines varies with distance.
• Profile refers to a cross-section, or horizontal view, of some part of the isoline map.
• Filling contour lines with some sort of sequential color scheme can help map readers to more easily form an overall impression of where highs and lows exist in the space.