Embed Size (px)
Citation preview
Portraying the Earth

A brief history of maps • 2300 BC clay tablets • 1100 BC natural resources and roads • 800 BC rock formations and ocean currents • 384-194 BC Aristotle and Eratosthenes

3
• 100 AD Ptolemy • Roman Empire • Guide to Geography • maps
• 1000 AD al-Idrisi • built upon Ptolemy
• 1400 - 1700 AD • maps of new lands


`
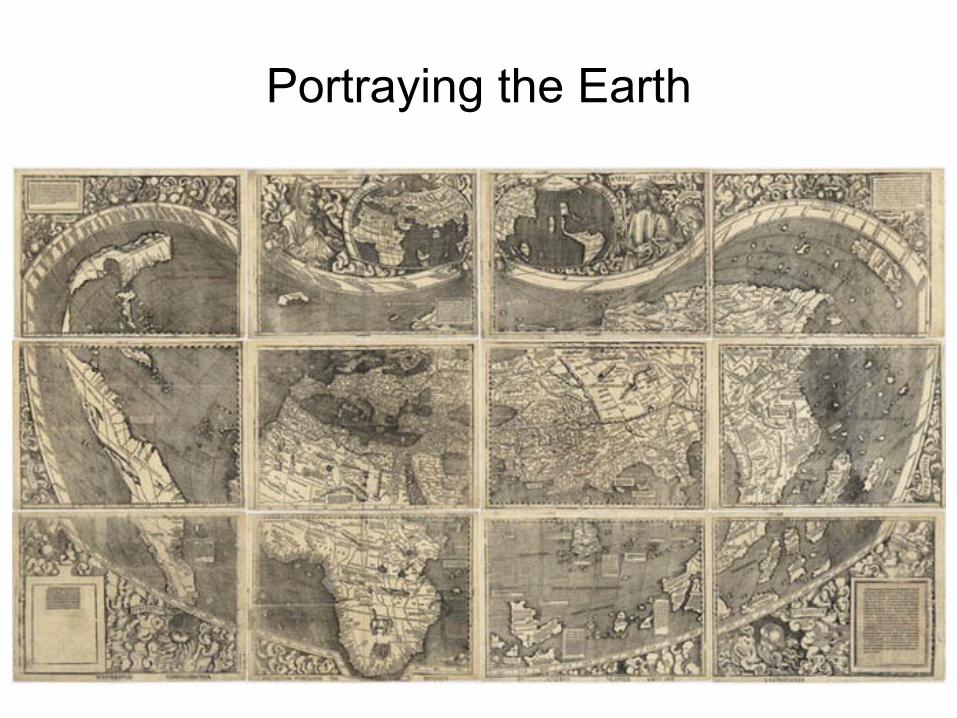
1507 Waldseemuller World Map • Most Expensive map ever sold • Library of Congress

6
Modern Mapping• Aerial Photography • World War 1 • World War 2
• Infrared • Satellites

7
Modern Mapping
• Global Positioning System • Department of Defense • Scientific research • Automobile navigation
• Geographic Information Systems • Computer based • Wealth of information

Maps• Two dimensional representation of the Earth
• Displays the spatial distribution of selected phenomena • Shows distance, direction, size and shape • Maps have limitations

Map Scale• A map is always smaller than the portion of the
Earth it represents • The ratio of the image on a map to the real world
• relates a unit on the map to a similar unit on the ground • Makes it possible to measure distance, area and
compare sizes

Types of Scales• Graphic map scale
• Line marked off for distance • Simple • Remains correct when
enlarging or shrinking map • Fractional map scale
• One unit on the map = X units on the earth
• 1:63,360 • Incorrect when map is resized
• Verbal map scale • Word scale • 1 inch = 125 miles • Incorrect when map is resized

Large Scale vs. Small Scale
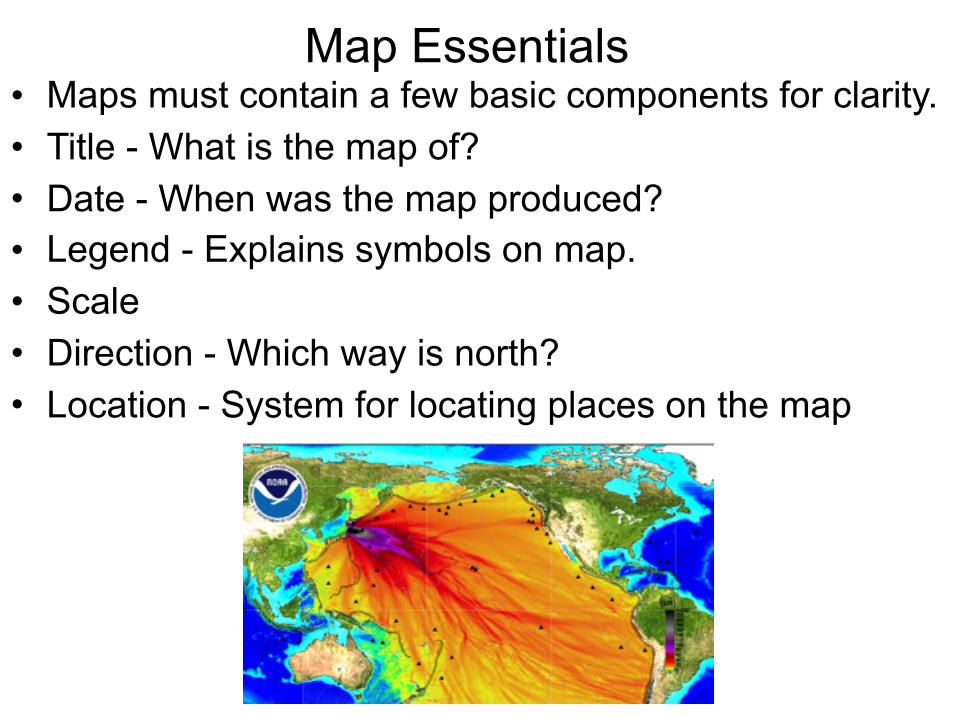
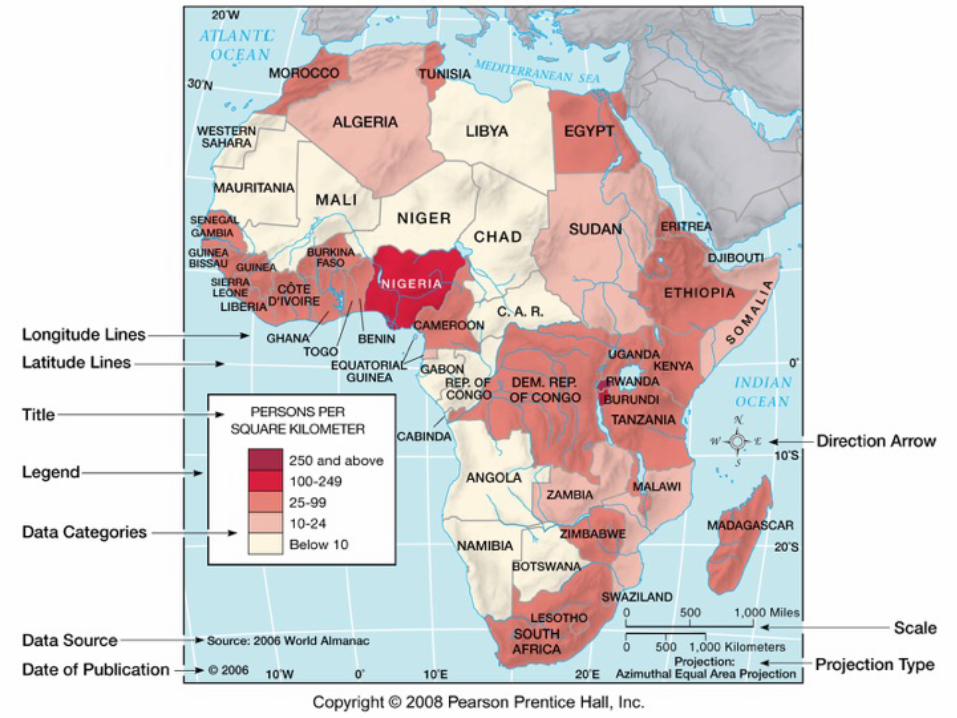
Map Essentials• Maps must contain a few basic components for clarity. • Title - What is the map of? • Date - When was the map produced? • Legend - Explains symbols on map. • Scale • Direction - Which way is north? • Location - System for locating places on the map
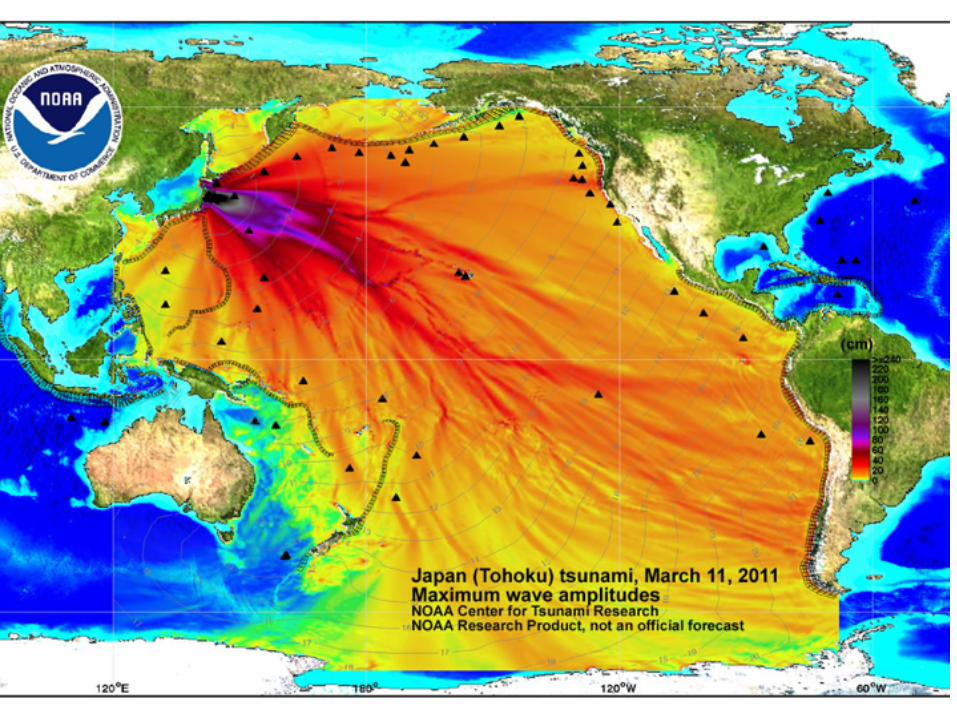
Map Essentials• Maps must contain a few basic components for clarity. • Title - What is the map of? • Date - When was the map produced? • Legend - Explains symbols on map. • Scale • Direction - Which way is north? • Location - System for locating places on the map
02_05.JPG

Map Projections• System to transform the spherical
surface of the earth onto a flat surface
• Conversion from three dimensional globe to two dimensional flat map causes distortion • Distance, direction, area,
shape and proximity • Always some degree of
distortion on flat maps • Less distortion the larger the
scale map

16
• Cylindrical projections • No distortion at center • progressively gets more distorted the further away
• Conical • Uses a cone which meets the earth along a parallel of
latitude • Useful for long east-west map

Mercator: The most famous projection
• 1569 - Gerardus Mercator • Originally navigational chart • Relatively undistorted in low latitudes • Distortion rapidly increases in mid and high
latitudes • Kept shape of land masses in return for distorted
size of land masses • Creates misconceptions

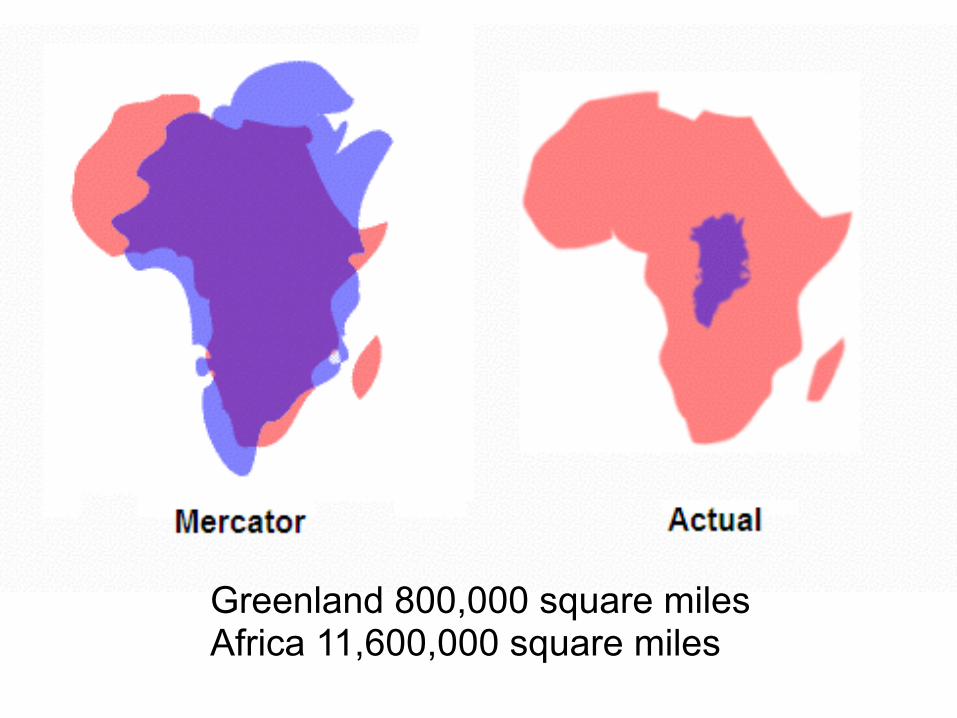
Greenland 800,000 square miles Africa 11,600,000 square miles


Isolines• An isoline is a line that connects points of equal value
• Always closed lines with no ends • Represent gradations in a quantity • Never cross each other • The interval between two isolines is always the same

22
Time Zones• Not a problem for small countries • United States spans 90 degrees of longitude
• 1870 22 time changes from Maine to San Francisco • Standard time zones set at 1884 conference • Daylight Savings Time
• Extend daylight for evening activities to save energy during war time
• Number of days under daylight savings has been extended in the past

23
• Roughly every 15 degrees of longitude is an hour time change