Embed Size (px)
Citation preview

McKEAN COUNTY, PENNSYLVANIA (ALL JURISDICTIONS)
COMMUNITY NAME COMMUNITY NUMBER
ANNIN, TOWNSHIP OF 421850 BRADFORD, CITY OF 420665 BRADFORD, TOWNSHIP OF 422245 CERES, TOWNSHIP OF 421853 CORYDON, TOWNSHIP OF 422473 ELDRED, BOROUGH OF 420666 ELDRED, TOWNSHIP OF 421854 FOSTER, TOWNSHIP OF 421855 HAMILTON, TOWNSHIP OF 421856 HAMLIN, TOWNSHIP OF 421857 KANE, BOROUGH OF* 422714 KEATING, TOWNSHIP OF 420667 LAFAYETTE, TOWNSHIP OF 421858 LEWIS RUN, BOROUGH OF 420669 LIBERTY, TOWNSHIP OF 420668 MOUNT JEWETT, BOROUGH OF* 420670 NORWICH, TOWNSHIP OF 421859 OTTO, TOWNSHIP OF 421860 PORT ALLEGANY, BOROUGH OF 420671 SERGEANT, TOWNSHIP OF 422474 SMETHPORT, BOROUGH OF 420672 WETMORE, TOWNSHIP OF 421861 *Non-floodprone community
McKean County
FLOOD INSURANCE STUDY NUMBER 42083CV000A
McKean County
FLOOD INSURANCE STUDY NUMBER 42083CV000A
PRELIMINARY:
March 31, 2010
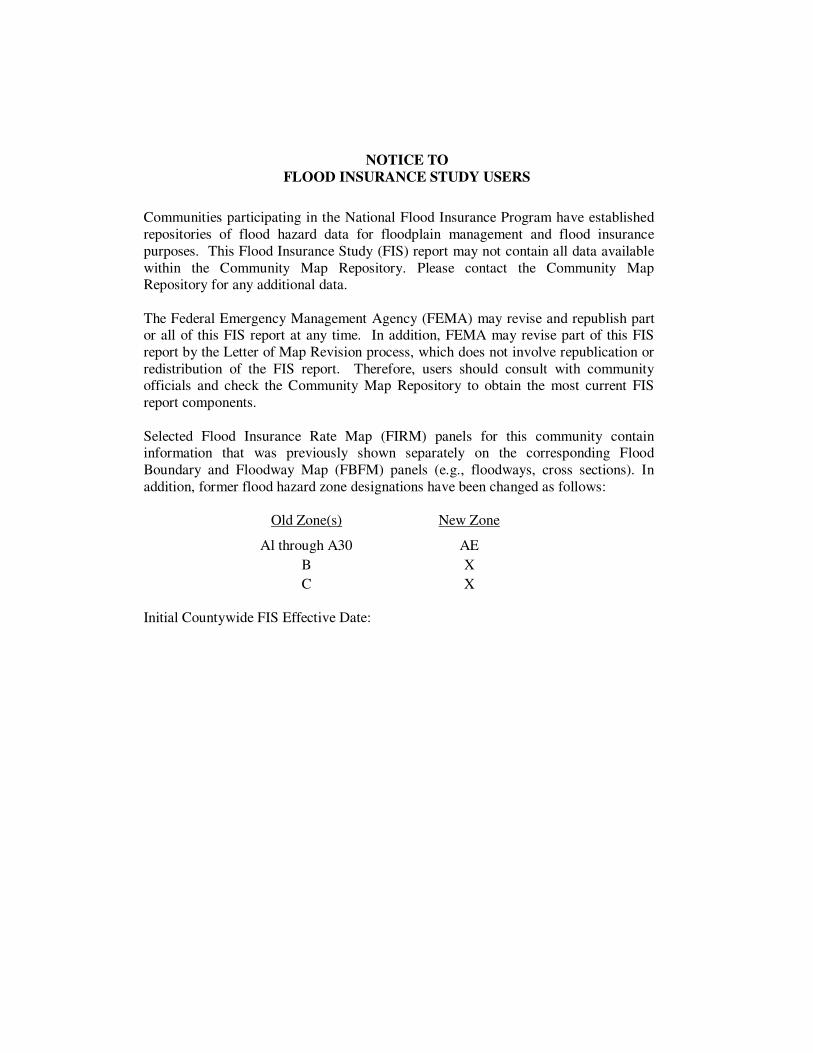
NOTICE TO
FLOOD INSURANCE STUDY USERS
Communities participating in the National Flood Insurance Program have established
repositories of flood hazard data for floodplain management and flood insurance
purposes. This Flood Insurance Study (FIS) report may not contain all data available
within the Community Map Repository. Please contact the Community Map Repository for any additional data.
The Federal Emergency Management Agency (FEMA) may revise and republish part or all of this FIS report at any time. In addition, FEMA may revise part of this FIS
report by the Letter of Map Revision process, which does not involve republication or
redistribution of the FIS report. Therefore, users should consult with community officials and check the Community Map Repository to obtain the most current FIS
report components.
Selected Flood Insurance Rate Map (FIRM) panels for this community contain information that was previously shown separately on the corresponding Flood
Boundary and Floodway Map (FBFM) panels (e.g., floodways, cross sections). In
addition, former flood hazard zone designations have been changed as follows:
Old Zone(s) New Zone
Al through A30 AE
B X
C X
Initial Countywide FIS Effective Date:

Page is Intentionally Left Blank
i
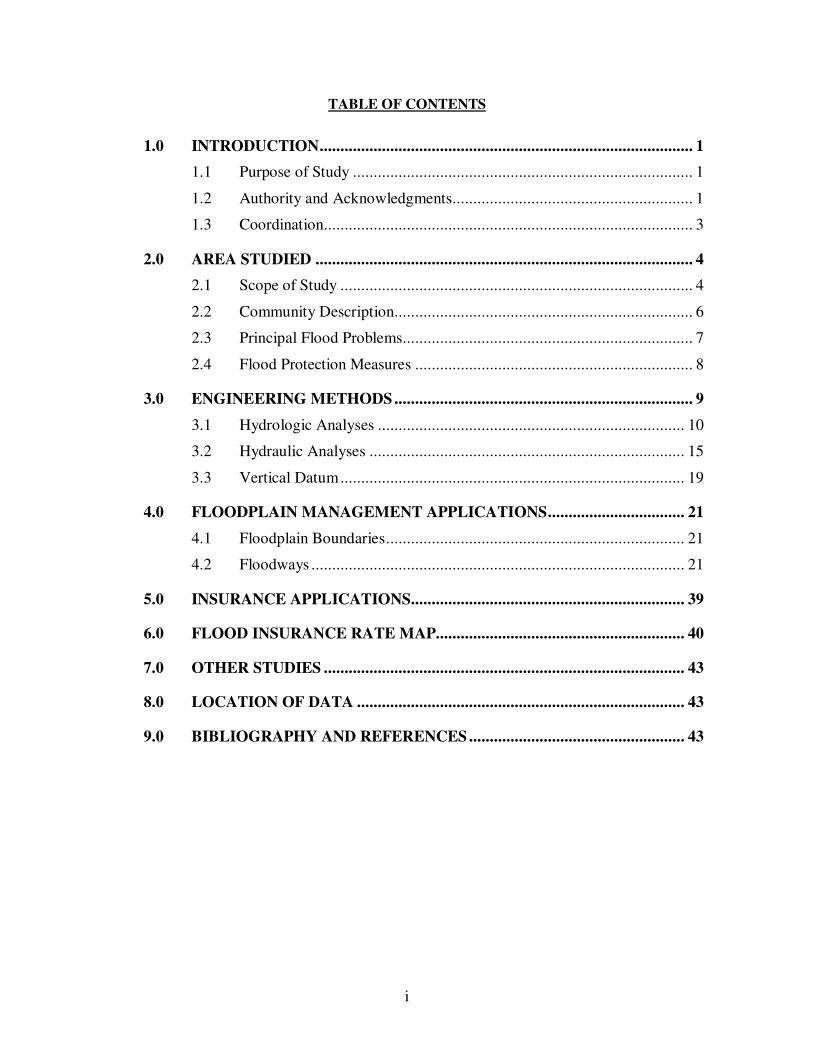
TABLE OF CONTENTS
1.0 INTRODUCTION .......................................................................................... 1
1.1 Purpose of Study .................................................................................. 1
1.2 Authority and Acknowledgments .......................................................... 1
1.3 Coordination......................................................................................... 3
2.0 AREA STUDIED ........................................................................................... 4
2.1 Scope of Study ..................................................................................... 4
2.2 Community Description........................................................................ 6
2.3 Principal Flood Problems...................................................................... 7
2.4 Flood Protection Measures ................................................................... 8
3.0 ENGINEERING METHODS ........................................................................ 9
3.1 Hydrologic Analyses .......................................................................... 10
3.2 Hydraulic Analyses ............................................................................ 15
3.3 Vertical Datum ................................................................................... 19
4.0 FLOODPLAIN MANAGEMENT APPLICATIONS ................................. 21
4.1 Floodplain Boundaries ........................................................................ 21
4.2 Floodways .......................................................................................... 21
5.0 INSURANCE APPLICATIONS.................................................................. 39
6.0 FLOOD INSURANCE RATE MAP............................................................ 40
7.0 OTHER STUDIES ....................................................................................... 43
8.0 LOCATION OF DATA ............................................................................... 43
9.0 BIBLIOGRAPHY AND REFERENCES .................................................... 43
ii
TABLE OF CONTENTS (Continued)
FIGURES
Figure 1 – Floodway Schematic ............................................................................................ 23
TABLES
Table 1 – Initial and Final CCO Meetings ............................................................................... 4
Table 2 – Areas Studied by Detailed Methods ...................................................................... 4-5
Table 3 – Summary of Discharges .................................................................................... 12-15
Table 4 – Manning’s “n” Value Table ................................................................................... 18
Table 5 – Vertical Datum Conversion Values ................................................................... 19-20
Table 6 – Floodway Data ................................................................................................. 24-38
Table 7 – Community Map History .................................................................................. 41-40
EXHIBITS
Exhibit 1 – Flood Profiles
Allegheny River Panels 01-05 Barden Brook Panel 06
Bell Run Panels 07-08
Canfield Creek Panel 09 East Branch Tunungwant Creek Panels 10-13
Foster Brook Panels 14-16
Indian Creek Panel 17 Kendall Creek Panels 18-20
Kings Run Panels 21-22
Knapp Creek Panel 23
Lillibridge Creek Panel 24 Marvin Creek Panel 25
McCrea Run Panel 26
Miller Brook Panel 27 Mix Creek Panel 28
Oswayo Creek Panels 29-32
Potato Creek Panels 33-34 Tunungwant Creek Panels 35-36
West Branch Tunungwant Creek Panels 37-38
Windfall Hollow Panel 39
Exhibit 2 – Flood Insurance Rate Map Index
Flood Insurance Rate Map
1
FLOOD INSURANCE STUDY
MCKEAN COUNTY, PENNSYLVANIA
(ALL JURISDICTIONS)
1.0 INTRODUCTION
1.1 Purpose of Study
This Flood Insurance Study (FIS) report investigates the existence and severity of flood
hazards in the geographic area of McKean County, Pennsylvania including the Boroughs
of Eldred, Kane, Lewis Run, Mount Jewett, Port Allegany, and Smethport; the City of Bradford; and the Townships of Annin, Bradford, Ceres, Corydon, Eldred, Foster,
Hamilton, Hamlin, Keating, Lafayette, Liberty, Norwich, Otto, Sergeant, and Wetmore;
(referred to collectively herein as McKean County), and aids in the administration of the National Flood Insurance Act of 1968 and the Flood Disaster Protection Act of 1973.
This study has developed flood-risk data for various areas of the community that will be
used to establish actuarial flood insurance rates and to assist the community in its efforts
to promote sound floodplain management. Minimum floodplain management requirements for participation in the National Flood Insurance Program (NFIP) are set
forth in the Code of Federal Regulations at 44 CFR, 60.3.
Please note that the Boroughs of Kane and Mount Jewett are non-floodprone.
In some states or communities, floodplain management criteria or regulations may exist that are more restrictive or comprehensive than the minimum Federal requirements. In
such cases, the more restrictive criteria take precedence and the State or other
jurisdictional agency will be able to explain them.
1.2 Authority and Acknowledgments
The sources of authority for this FIS are the National Flood Insurance Act of 1968 and
the Flood Disaster Protection Act of 1973.
This FIS was prepared to include all jurisdictions within McKean County into a
countywide format FIS. Information on the authority and acknowledgements for each of
the previously printed FISs for communities within McKean County was compiled, and is shown below.
Bradford, City of
In the original study, the hydrologic and hydraulic analyses were prepared by Michael Baker, Jr., Inc., for the Federal Insurance
Administration (FIA), under Contract No. H-4816. This work
was completed in January 1980 (Reference 1).
Bradford,
Township of
The hydrologic and hydraulic analyses for this study were
prepared by Michael Baker, Jr., Inc., for the FIA, under Contract
No. H-4816. This work was completed in January 1980 (Reference 2).
2
Ceres,
Township of
The hydrologic and hydraulic analyses for this study were
prepared by GEO-Technical Services, Inc., for the Federal Emergency Management Agency (FEMA), under Inter-Agency
Agreement No. EMW-84-C-1607. This work was completed in
March 1986 (Reference 3).
Eldred,
Borough of
For the original FIS, dated September 3, 1980, the hydrologic
and hydraulic analyses were prepared by L. Robert Kimball &
Associates for the FEMA, under Contract No. H-4554. That work was completed in November 1978 (Reference 4).
For the FIS dated June 4, 1990, the hydraulic analyses for Barden Brook and a portion of the Allegheny River were prepared by
Edwards & Moncrieff for FEMA to incorporate the effects of a
completed Pennsylvania Department of Environmental
Protection (PADEP) (formerly known as the Pennsylvania Department of Environmental Resources) levee, channel
modification, and culvert project along the Allegheny River and
Barden Brook. All material necessary to process this revision was received by FEMA in February 1988 (Reference 4).
Eldred, Township of
The hydrologic and hydraulic analyses for this study were prepared by L. Robert Kimball and Associates for the FIA,
under Contract No. H-4554. This work was completed in
November 1978 (Reference 5). The hydrologic and hydraulic
analyses for the Allegheny River were previously performed by the U.S. Army Corps of Engineers (USACE).
Foster, Township of
The hydrologic and hydraulic analyses for this study were prepared by Michael Baker, Jr., Inc., for the FIA, under Contract
No. H-4816. This work was completed in January 1980
(Reference 6).
Keating,
Township of
The hydrologic and hydraulic analyses for this study were
prepared by Michael Baker, Jr., Inc., for the FIA, under Contract
No. H-3812. This work was completed in February 1977 (Reference 7).
Liberty, Township of
The hydrologic and hydraulic analyses for this study were prepared by Michael Baker, Jr., Inc., Consulting Engineers, for
the FIA, under Contract No. H-3812 (Reference 8).
Port Allegany, Borough of
The hydrologic and hydraulic analyses for this study were performed by Michael Baker, Jr., Inc. for the FIA, under
Contract No. H-3812. This work was completed in January 1977
(Reference 9).
3
Smethport,
Borough of
The hydrologic and hydraulic analyses for this study were
performed by Michael Baker, Jr., Inc., for the FIA, under Contract No. H-3812. This work was completed in
February 1977 (Reference 10).
No previous reports were prepared for the Boroughs of Kane, Lewis Run, and Mount
Jewett; and the Townships of Annin, Corydon, Hamilton, Hamlin, Lafayette, Norwich,
Otto, Sergeant, and Wetmore.
For this countywide FIS, base mapping was prepared for FEMA by GG3, a joint venture
between Gannett Fleming, Inc, Camp Hill, Pennsylvania, and Greenhorne & O’Mara, Inc., Laurel, Maryland under the Joint Venture Contract No. EMP-2003-CO-2606, Task
Order Number 10. This work was completed in September 2009.
For this countywide study, all streams studied by detailed methods were redelineated using LiDAR data flown in 2006. For streams studied with approximate methods, the 1-
percent-annual-chance flood elevations were determined from the regional relationship
between drainage area and flood depth prepared by the U.S. Geological Survey (USGS). This relationship was developed by means of regional regression analyses of basin areas
and the within channel 1-percent-annual-chance flood depths observed at stream gages.
Depths were adjusted on the basis of hydraulic calculations to account for increased depth due to backwater from hydraulic structures, such as bridges and culverts. This
work was performed by Dewberry, under Map Modernization Contract No. HSFE03-07-
D-0037, Task Order HSFE03-08-J-0008, for FEMA.
Base map information shown on this FIRM was provided by PAMAP (Pennsylvania
Statewide Digital Map) Program, Pennsylvania Department of Conservation and
Resources, Bureau of Topographic and Geologic Survey,. The imagery was derived from aerial photography flown at 1-foot ground sample distance in April 2005.
The projection used in the preparation of this map was Pennsylvania State Plane, North
Zone (FIPSZONE 3701). The horizontal datum was North American Datum of 1983 (NAD 83), GRS80 spheroid. Differences in datum, spheroid, projection, or State Plane
zones used in the production of FIRMS for adjacent jurisdictions may result in slight
positional differences in map features across jurisdiction boundaries. These differences do not affect the accuracy of this FIRM.
1.3 Coordination
An initial Consultation Coordination Officer's (CCO) meeting is held typically with
representatives of FEMA, the community, and the study contractor to explain the nature
and purpose of a FIS, and to identify the streams to be studied by detailed methods. A
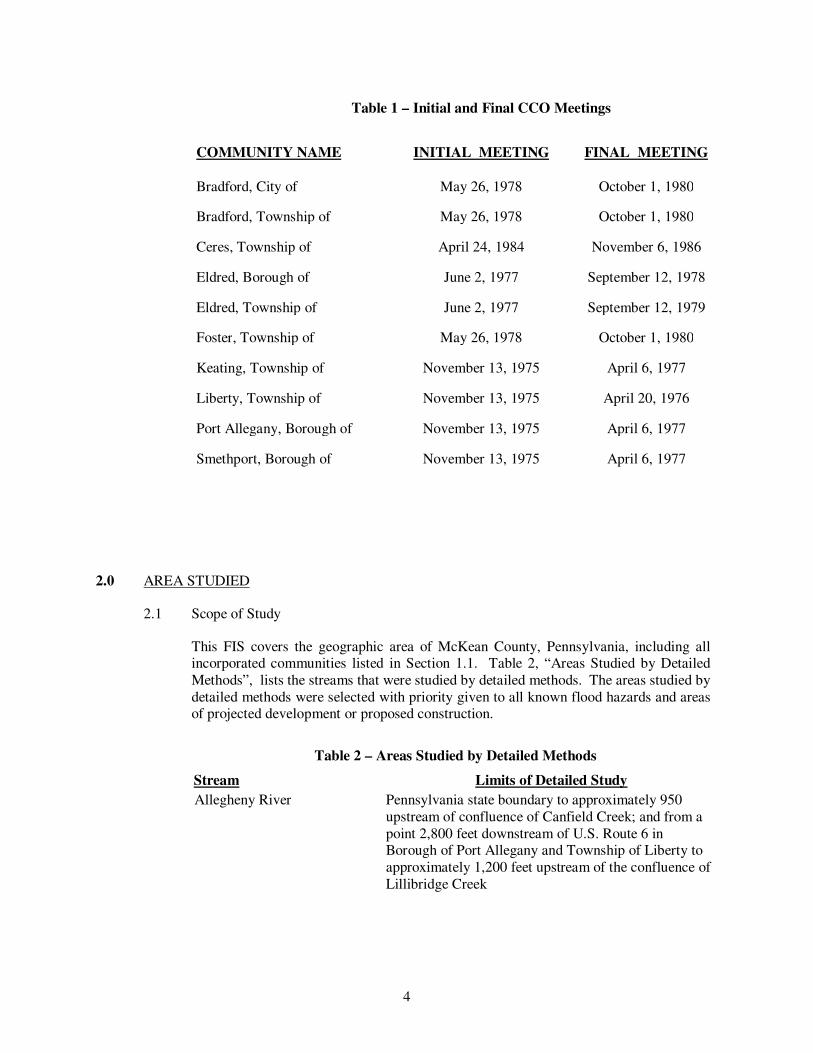
final CCO meeting is held typically with the same representatives to review the results of the study. The initial and final meeting dates for the previous FIS reports for McKean
County and its communities are listed in Table 1, “Initial and Final CCO Meetings.”
4
Table 1 – Initial and Final CCO Meetings
COMMUNITY NAME INITIAL MEETING FINAL MEETING
Bradford, City of May 26, 1978 October 1, 1980
Bradford, Township of May 26, 1978 October 1, 1980
Ceres, Township of April 24, 1984 November 6, 1986
Eldred, Borough of June 2, 1977 September 12, 1978
Eldred, Township of June 2, 1977 September 12, 1979
Foster, Township of May 26, 1978 October 1, 1980
Keating, Township of November 13, 1975 April 6, 1977
Liberty, Township of November 13, 1975 April 20, 1976
Port Allegany, Borough of November 13, 1975 April 6, 1977
Smethport, Borough of November 13, 1975 April 6, 1977
2.0 AREA STUDIED
2.1 Scope of Study
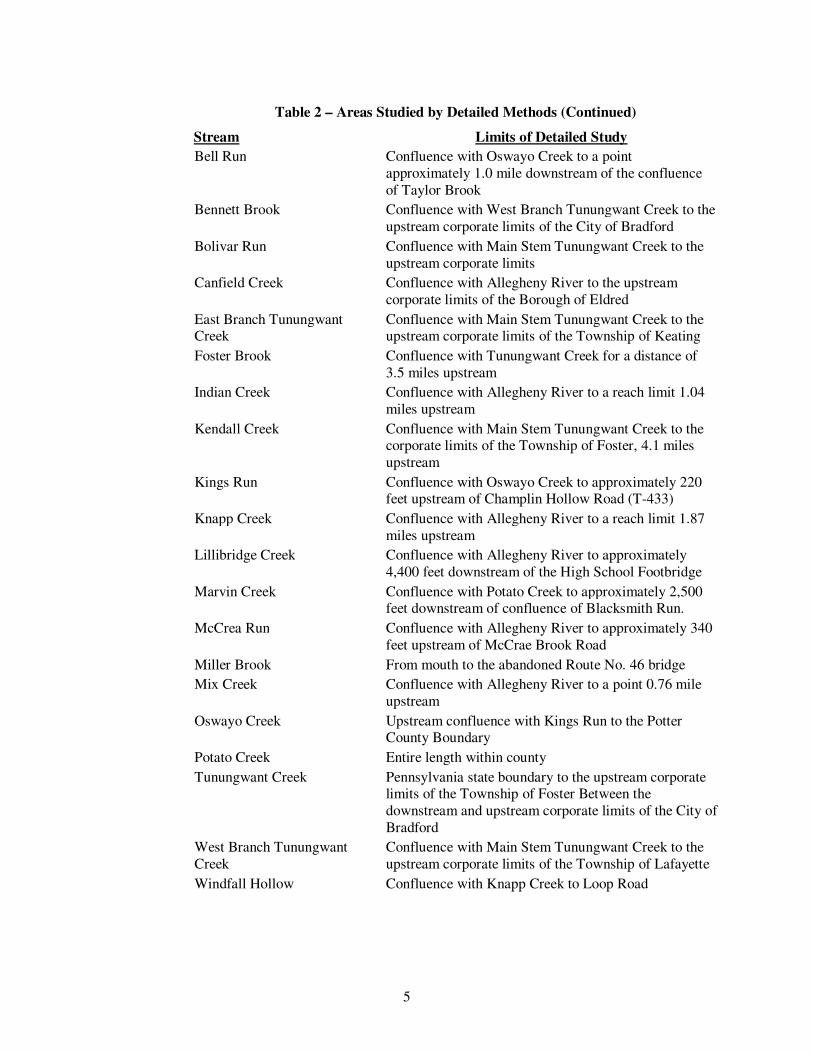
This FIS covers the geographic area of McKean County, Pennsylvania, including all incorporated communities listed in Section 1.1. Table 2, “Areas Studied by Detailed
Methods”, lists the streams that were studied by detailed methods. The areas studied by
detailed methods were selected with priority given to all known flood hazards and areas of projected development or proposed construction.
Table 2 – Areas Studied by Detailed Methods
Stream Limits of Detailed Study
Allegheny River Pennsylvania state boundary to approximately 950
upstream of confluence of Canfield Creek; and from a
point 2,800 feet downstream of U.S. Route 6 in Borough of Port Allegany and Township of Liberty to
approximately 1,200 feet upstream of the confluence of
Lillibridge Creek
5
Table 2 – Areas Studied by Detailed Methods (Continued)
Stream Limits of Detailed Study
Bell Run Confluence with Oswayo Creek to a point
approximately 1.0 mile downstream of the confluence
of Taylor Brook
Bennett Brook Confluence with West Branch Tunungwant Creek to the
upstream corporate limits of the City of Bradford
Bolivar Run Confluence with Main Stem Tunungwant Creek to the
upstream corporate limits
Canfield Creek Confluence with Allegheny River to the upstream
corporate limits of the Borough of Eldred
East Branch Tunungwant Creek
Confluence with Main Stem Tunungwant Creek to the upstream corporate limits of the Township of Keating
Foster Brook Confluence with Tunungwant Creek for a distance of
3.5 miles upstream
Indian Creek Confluence with Allegheny River to a reach limit 1.04
miles upstream
Kendall Creek Confluence with Main Stem Tunungwant Creek to the corporate limits of the Township of Foster, 4.1 miles
upstream
Kings Run Confluence with Oswayo Creek to approximately 220 feet upstream of Champlin Hollow Road (T-433)
Knapp Creek Confluence with Allegheny River to a reach limit 1.87
miles upstream
Lillibridge Creek Confluence with Allegheny River to approximately
4,400 feet downstream of the High School Footbridge
Marvin Creek Confluence with Potato Creek to approximately 2,500 feet downstream of confluence of Blacksmith Run.
McCrea Run Confluence with Allegheny River to approximately 340
feet upstream of McCrae Brook Road
Miller Brook From mouth to the abandoned Route No. 46 bridge
Mix Creek Confluence with Allegheny River to a point 0.76 mile
upstream
Oswayo Creek Upstream confluence with Kings Run to the Potter County Boundary
Potato Creek Entire length within county
Tunungwant Creek Pennsylvania state boundary to the upstream corporate limits of the Township of Foster Between the
downstream and upstream corporate limits of the City of
Bradford
West Branch Tunungwant
Creek
Confluence with Main Stem Tunungwant Creek to the
upstream corporate limits of the Township of Lafayette
Windfall Hollow Confluence with Knapp Creek to Loop Road
6
Approximate analyses were used to study those areas having a low development potential
or minimal flooding hazards. The scope and methods of study were proposed to, and agreed upon, by FEMA and the communities.
2.2 Community Description
McKean County is located in north central Pennsylvania. McKean County is bordered by Cattaraugus County, New York to the north, Allegheny County, New York to the
northeast, Potter County, Pennsylvania to the east, Cameron County, Pennsylvania to the
southeast, Elk County, Pennsylvania to the southwest, and Warren County, Pennsylvania to the west. According to the 2000 census, the population was 45,936 in McKean County
(Reference 11).
McKean County is located in the northern part of the Kanawha Section of the glaciated
Appalachian Plateau. The area is characterized by numerous stream valleys and steeply
sloping hills. Elevations range from about 1,400 to 2,350 feet, with a total relief of about
950 feet (Reference 12). Topography varies from flat flood plains along the major streams to steeply sloping hillsides. The landscape contains long valleys known as
hollows (Reference 13).
The geology of the County is attributed to several groups and ages; shales and
conglomerates from the Cattaraugus Formation of the Upper Devonian Age; the
Pottsville Group of the Pennsylvanian Age; the Pocono Group of the Mississippian Age; and the Oswego, Catskill and Marine Bed formations of the Devonian Age, all
originating in the Paleozoic Era. These groups and formations consist chiefly of gray, red
and brownish shales, sandstone, and conglomerates (References 13 and 14). Soils along
the major streams are typically alluvial silt, sand, and gravel (Reference 2).
The soils in the County are the Pope-PhiloAlbrights Association; Leck Kill-Albrights-
Oquaga Association; Culvers Association; Cookport-Hazelton-Gilpin Association; Cavode-Gilpin-Wharton Association and Gilpin-Hazelton-Ernest Association. The Pope-
Philo-Albrights Association, consists of deep and moderately well-drained soils and
underlain by alluvium and colluvium, borders Potato Creek. The Gilpin-Hazelton-Ernest
Association, consisting of moderately deep and moderately well-drained stony soils borders Marvin Creek (Reference 13). The Oquago and Cattaraugus soils are well-
drained while the Culvers soils are moderately well-drained with some of the minor soils
being poorly-drained.
Vegetation within the County consists of thick stands of weeds, brush, and some timber
which surround the scattered farm lands. Flood plains contain both cultivated fields and wooded areas. Vegetation in watersheds consists of large areas of forest and agricultural
lands which surround the residential, commercial and industrial development in the main
valleys (Reference 2).
The County is subject to maritime and continental air mass movements and has an annual
precipitation of 48.18 inches with the maximum average precipitation occurring in June
(Reference 15). The climate is temperate with annual average low of 13°F in January and annual average high of 80°F in July (Reference 15). McKean County has a temperate
climate with a seasonal temperature variation and is in a region subject to frontal air-mass
activity. The prevailing wind direction is from the west.

7
The area was originally occupied by the Six Nation Indian Confederacy. The Seneca
Indian Tribe occupied the areas of Liberty Township and Port Allegany Borough until 1816. The first white settlers arrived in 1795 and settled at the confluence of Foster
Brook and Kendall Creek with Tunungwant Creek. Originally trading, lumbering,
rafting, and tanning were the most important industries. In the early 1800’s, some of the
County’s early industry consisted of bottling works, lumber products, farm products, and mills. In 1871, oil was discovered and McKean County became the center of the
booming oil industry. From 1877 to 1887, forty percent of all the oil produced in the
world came from the Bradford area of McKean County with peak production of 23,000,000 barrels occurring in 1881 (Reference 13). McKean has a variety of economic
resources such as the University of Pittsburgh campus, a variety of industries that
manufacture such products as butterfly and meter valves, steel couplings, oil and refined products, Zippo lighters, knives and clay products; a variety of glass products, wood
products, agricultural food products, lumbering, variety of industries producing tools,
dyes, metal stampings, children games and toys, seed products, Christmas trees, outdoor
Christmas decorations, salt and pepper, oil refineries, handle works, clay and slate pits, oil and gas wells, and dairy farming.
Development varies according to geographic location. The flood plain along the Allegheny River is occupied by residences, light industry, and local businesses while
development in the flood plain of Lillibridge Creek is residential with only a few
commercial interests present. The flood plains along Tunungwant Creek are occupied by industrial and commercial development with a few small residential areas present.
Development in the flood plains of the East Branch and West Branch Tunungwant Creek
consists primarily of residences and businesses with some industrial and a few small
recreational areas present. Along Kendall Creek development consists of residences, small commercial enterprises, small industries and some undeveloped areas. The hill
areas are mostly residential with some commercial and recreational areas. The valley
areas contain mostly residential and commercial development. The flood plains along Marvin Creek and Potato Creek have moderate development consisting of businesses,
residences and light industries. Some business and residential areas lie along the eastern
edge of the Allegheny River floodplain. Some municipalities are still rural and
undeveloped. The area along the Allegheny River and Knapp Creek is some of the most productive agricultural land in McKean County.
2.3 Principal Flood Problems
McKean County has a long history of flooding dating back to the 1800s. The highest
floods of record occurred in June 1889, May 1894, March 1936, July 1942, May 1946,
April 1947, March 1948, September 1967, and June 1972. Most flooding usually occurs during the months of December through April, with most of the flooding caused by a
combination of heavy rain and snowmelt, however major flooding can occur at any time
of year (Reference 16). Most flooding was a result of Hurricane Agnes, in June 1972,
which caused the waters of the Allegheny to peak at an elevation of 1,445.58 feet, with a discharge of 35,500 cubic feet per second (cfs) at the USGS gaging station located at
river mile 265.07 (Reference 17).
The Allegheny River is the major flooding source in the County. The river has topped its
banks many times in the past. In July 1942, the river and its tributaries flooded causing
extensive damage and erosion in many areas. The 1942 storm, the result of a hurricane, carried a discharge of 43,500 cfs and washed out the newly constructed U. S. Route 6
8
Bridge. The July 1972 flood, which was a result of Hurricane Agnes, caused the closing
of State Route 446 throughout the County. Debris is a major problem along the reaches of the Allegheny River, primarily because the majority of areas are rural and floating
logs, trees and brush are numerous during flood seasons.
Severe flooding from Barden Brook has resulted in almost complete inundation of the business and industrial districts with severe damage to residential areas of Eldred
Borough (Reference 4).
East Branch Tunungwant Creek, Tunungwant Creek, West Branch Tunungwant Creek
and their tributaries flow in somewhat narrow valleys with steep side slopes which are
conducive to rapid runoff, causing water levels to rise rapidly and reach high velocities. Due to the rural location of the larger portion of the watershed, flood damages and
elevations can increase downstream due to ice and floating debris such as trees, brush and
logs which restrict the flow of water through the channel, culverts and bridges. This is
best typified by the flood of April 5, 1947. This disastrous flood was caused by torrential rains and melting snow, which inundated the entire business district as well as most
industries (Reference 1).
Homes located in the low-lying area near Indian Creek and the areas near Barnum Road
were flooded. In a majority of instances roadways were closed (Reference 4).
Since the 1800’s, McKean County suffered flooding from Lillibridge Creek. During the
July 1942, floating debris substantially raised flood waters on Lillibridge Creek
(Reference 9).
McKean County has a history of flooding problems from Marvin Creek and Potato Creek
dating from the 1800’s. Major floods are known to have occurred in June 1889, May
1894, March 1936, July 1942 and June 1972. Marvin Creek and Potato Creek meander through wide flat valleys and have very shallow slopes which cause floodwaters to back
up, move more slowly and spread out creating wider flood plains. Another condition that
aggravates flooding is that much of the timber in the County has been cut off contributing
to runoff problems. Due to the rural locations within the County, flood damages and elevations can increase because of ice and floating debris such as logs, trees and brush.
The steeply sloping hillsides bordering Marvin Creek cause rushing water, produced by
heavy rains, to flood streets, residences, and businesses (References 7 and 10).
Record flooding occurred on Oswayo Creek during Tropical Storm Agnes in June 1972.
Efforts to determine the frequency of the observed floods on Oswayo Creek during Tropical Storm Agnes were compared with long duration gaging stations and were found
to be inconclusive due to the varying amounts of rainfall over the gaged watersheds.
However, rainfall information indicates that Tropical Storm Agnes on the Oswayo Creek
was greater than a 1-percent-annual-chance flood event (Reference 3).
2.4 Flood Protection Measures
After the July 1942 flood, the Commonwealth of Pennsylvania constructed an earth dike extending from a point 800 feet below the West Mill Street Bridge on the Allegheny
River upstream to the railroad bridge on Lillibridge Creek. The dike is sufficient to
contain the 10-percent-annual-chance flood, but is topped by the 2-, 1-, and 0.2-percent-annual-chance floods. The dike was topped by the 1972 flood (Reference 9).

9
In 1943, the Water Power and Resources Board completed dredging and levee construction on Barden Brook (Reference 4). In 1956, the USACE completed a clearing
and snagging project in which the outlet of Barden Brook was realigned for better
drainage into the Allegheny River. In 1988, the PADEP completed a system of
compacted earth levees located along the Allegheny River and the upstream portion of Barden Brook. FEMA specifies that all levees must have a minimum of 3-foot freeboard
against 1-percent-annual-chance flooding to be considered a safe flood protection
structure. These levees meet FEMA's criteria. The completed project utilizes the large potential storage available in the low-lying Allegheny River floodplain by ponding
interior drainage between an existing interior levee along Barden Brook and the new
levee. The project also includes the rechannelization of Barden Brook downstream of the railroad to approximately its original alignment as it existed prior to the USACE project
of 1956. Also, a culvert containing the 1-percent-annual-chance discharge has been
constructed along Barden Brook between the railroad and Bennett Street (Reference 4).
In 1976, the Pennsylvania Department of Transportation completed construction of U.S.
Route 219 through McKean County. In order to complete this construction the channel
of East Branch Tunungwant Creek was relocated, widened, deepened and straightened (Reference 18). In 1963, the USACE completed the Bradford Flood Protection Project
on East Branch Tunungwant Creek, Tunungwant Creek, and West Branch Tunungwant
Creek which consisted of deepening, widening, straightening and lining the channels of these streams through the City of Bradford into the Township of Bradford (References 19
and 20). The channelized portions of East Branch Tunungwant Creek and West Branch
Tunungwant Creek in the Township of Bradford will contain a 2-percent-annual-chance
flood but not a 1-percent-annual-chance flood.
In 1963 and 1968, the Department of Forests and Waters in Pennsylvania completed
channel improvement projects on Marvin Creek and Potato Creek (References 21 and 22). The channel improvement extends from the Mechanic Street Bridge on Marvin
Creek to a point 3,600 feet downstream of the Route 6 Bridge on Potato Creek. The
project is sufficient to contain very low frequency floods but is not adequate for major
flooding.
A flood control levee located on the south bank of Oswayo Creek exists in the Township
of Ceres. This levee does not qualify as a safe flood control measure (Reference 3).
Non-structural measures of flood protection are being utilized to aid in the prevention of
future flood damage. These are in the form of land use regulations adopted from the Code of Federal Regulations, which control building within areas that have a high risk of
flooding (Reference 23).
3.0 ENGINEERING METHODS
For the flooding sources studied by detailed methods in the community, standard hydrologic and
hydraulic study methods were used to determine the flood hazard data required for this study.
Flood events of a magnitude that are expected to be equaled or exceeded once on the average during any 10-, 50-, 100-, or 500-year period (recurrence interval) have been selected as having
special significance for floodplain management and for flood insurance rates. These events,
commonly termed the 10-, 50-, 100-, and 500-year floods, have a 10-, 2-, 1-, and 0.2-percent-
10
annual-chance, respectively, of being equaled or exceeded during any year. Although the
recurrence interval represents the long-term, average period between floods of a specific magnitude, rare floods could occur at short intervals or even within the same year. The risk of
experiencing a rare flood increases when periods greater than 1 year are considered. For
example, the risk of having a flood that equals or exceeds the 1-percent-annual-chance (100-year)
flood in any 50-year period is approximately 40 percent (4 in 10); for any 90-year period, the risk increases to approximately 60 percent (6 in 10). The analyses reported herein reflect flooding
potentials based on conditions existing in the community at the time of completion of this study.
Maps and flood elevations will be amended periodically to reflect future changes.
3.1 Hydrologic Analyses
Hydrologic analyses were carried out to establish the peak discharge-frequency relationships for the flooding source studied in detail affecting the community.
Pre-countywide Analyses
Flood flows for Allegheny River, East Branch Tunungwant Creek, Foster Brook, Kendall
Creek, Tunungwant Creek, and West Branch Tunungwant Creek were developed using
data developed by the log-Pearson Type III method. The flood flows for Lillibridge Creek, Marvin Creek, and Potato Creek were developed from a drainage area versus
discharge curve which was obtained by plotting and fitting a curve to the frequency
curves derived by a log-Pearson Type III analyses (Reference 24).
In the Township of Port Allegany, the frequency analysis for the Allegheny River was
developed by use of a stage frequency relation between the USGS gaging station at
Eldred, Pennsylvania, and the USACE Mill Street gage station. The USGS Eldred gage, located approximately 12 miles northwest of Port Allegany was analyzed by a log-
Pearson Type III analysis for the 52 years of record (References 24, 25, and 26). The
final frequency curve for the Mill Street gage was then derived by the frequency stage relation and the Eldred frequency curve. The stage frequency relation was developed
with the aid of discharge measurements for the June 1972 flood at Route 6.
In the Borough of Eldred, flood flows for the Allegheny River watershed were calculated using a log-Pearson Type III distribution (Reference 24). This method utilizes existing
annual peak flow statistics. These flows were then compared to flows developed by the
PADEP in their Flood Plain Information Report on the Allegheny River (Reference 27). As the calculated flows are comparable to the flows developed by the PADEP, the latter
values were used.
Flood flows for Barden Brook and Canfield Creek watersheds were developed by an
analytical method developed by the Pennsylvania Department of Transportation, a
hydrograph method developed by the Soil Conservation Service (SCS) and a regionalized
flood frequency analysis for ungaged streams developed by Pennsylvania State University (PSU) (References 28, 29, and 30). These flows were then compared with
flows calculated by the regional method described in the report, Floods in Pennsylvania
(Reference 31). This method relates drainage area, channel slope, percent area of storage, and an index of annual excess precipitation to the peak discharge by empirical
equations. The flows for Canfield Creek and for the 10- and 0.2-percent-annual-chance
flood frequency discharges for Barden Brook were determined by this method because this method best considers the characteristics of these watersheds. The flows determined
11
for the 2- and 1-percent-annual-chance flood frequencies were compared to flows
calculated by the PADEP using the SCS Triangular Hydrograph Method (Reference 32). As these values are comparable, the latter flows were used.
Due to the large drainage area of Bell Run (20.7 square miles), the SCS-Type II storm
distribution was used for the entire 24-hour storm duration for the SCS hydrograph method (Reference 29). The results obtained by the PSU IV method were selected for the
hydrologic determinations (Reference 33).
Flood flows for Indian Creek, Knapp Creek, McCrea Run, Miller Brook, Mix Creek, and
Windfall Hollow watersheds were developed by an analytical method developed by the
Pennsylvania Department of Transportation, a hydrograph method developed by the SCS, and PSU III as a regionalized flood-frequency analysis for ungaged stream (References
28, 29, and 30). These flows were then compared with flows calculated by the Regional
Method described in Floods in Pennsylvania (Reference 34). This method relates
drainage area, channel slope, percent area of storage, and an index of annual excess precipitation to the peak discharge by empirical equations. The flows were determined
by this method because this method best considers the characteristics of the watershed.
Bulletin No. 13, the SCS hydrograph method, PSU IV, and the USACE Regression
Equation were used to determine flows for the 10-, 2-, 1-, and 0.2-percent-annual-chance
flood for Kings Run (References 29, 31, and 33). Results of Bulletin No. 13 were slightly lower than the PSU IV method. The peak two hours of the SCS-Type II, 24-hour
storm distribution was used to generate hydrographs for Kings Run drainage basin
(Reference 29). Peak flows derived by the SCS were found to be larger than those
derived by PSU IV. Two-hour storm durations were used for the SCS hydrograph method because of the small (8.0 square mile) drainage area of Kings Run.
The flood flows for Lillibridge Creek, Marvin Creek, and Potato were developed from a drainage area versus discharge curve which was obtained by plotting and fitting a curve
to the frequency curves derived by a log-Pearson Type III analyses (Reference 20).
An independent analysis was made to determine the magnitude and frequency of floods on Oswayo Creek (Reference 35). Due to the extremely short period of record for the
Oswayo Creek gage, the USGS frequency analysis for the gage gave very low flow
values when compared with other methods. Bulletin No. 13 was used to develop discharges, but these were found to be overly conservative (Reference 31). Therefore, an
attempt was made to relate derived cfs values from peak flows at the Shinglehouse gage
with the Allegheny River gage, Kinzua Creek gage, and Brokenstraw Creek gage in the region. The better correlation was obtained with the Brokenstraw Creek gage at
Youngsville, Pennsylvania. From this relationship, and the 10-, 2-, and 1-percent-annual-
chance cfs values, the 0.2-percent-annual-chance flood flow was derived for the
Shinglehouse gage. Flows were then determined for the downstream corporate limits by extrapolating the derived gage results using the following relationship:
Peak Flow ungaged = Peak Flow gaged x (Area ungaged/Area gaged) 0.75
This same area relationship technique was then used to relate the flood frequency
information from the FIS for the Town of Portville, Cattaraugus, New York at the confluence of Oswayo Creek with the Allegheny River to Bell's Brook Run, Kings Run,
Little Genesee Creek, and Bell Run on Oswayo Creek (Reference 35). Output from the
12
Technical Release No. 20 (TR-20) computer program, run by the SCS for this study, was
obtained for two locations (Reference 36). No other values were available without making additional TR-20 runs.
Information received from the USACE pertaining to the Tunungwant Creek watershed
was correlated with discharge-frequency data developed by the log-Pearson Type III method for similar watersheds in order to develop a natural flow drainage area versus
frequency discharge relationship for the Tunungwant Creek watershed (Reference 24).
As a check, flood flows for several ungaged streams in the Tunungwant Creek watershed were developed by a USACE multiple regression method and Water Resources Bulletin
No. 13 (References 31 and 37). Peak discharges for ungaged streams in Pennsylvania are
determined from the regression equations in these methods, which include drainage basin characteristics such as channel slope and drainage area size and shape. The flood flows
developed from these methods were compared to the drainage area versus frequency
discharge relationship for the Tunungwant Creek watershed and were found to be in close
agreement.
Countywide Analyses
No new hydrologic analyses were conducted for detailed studied streams. For all
approximately studied streams, Pennsylvania region III USGS regression equations were
used to estimate flood flows for the 1-percent-annual-chance recurrence interval. Equations were developed utilizing peak flow data from 322 gaging stations within
Pennsylvania and surrounding states. The equation for region III, in which McKeanr
County lies, uses 4 parameters to estimate discharge; drainage area (as determined from
30 meter digital elevation model), mean basin elevation, percent carbonate bedrock, and percent storage.
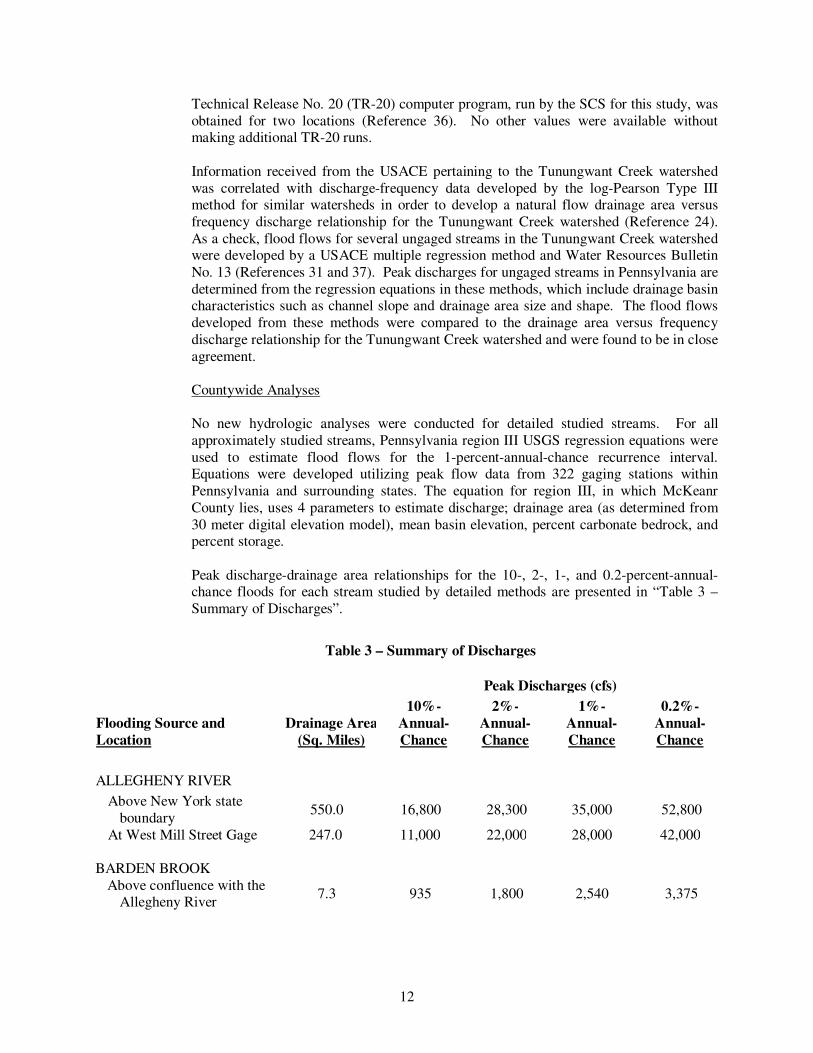
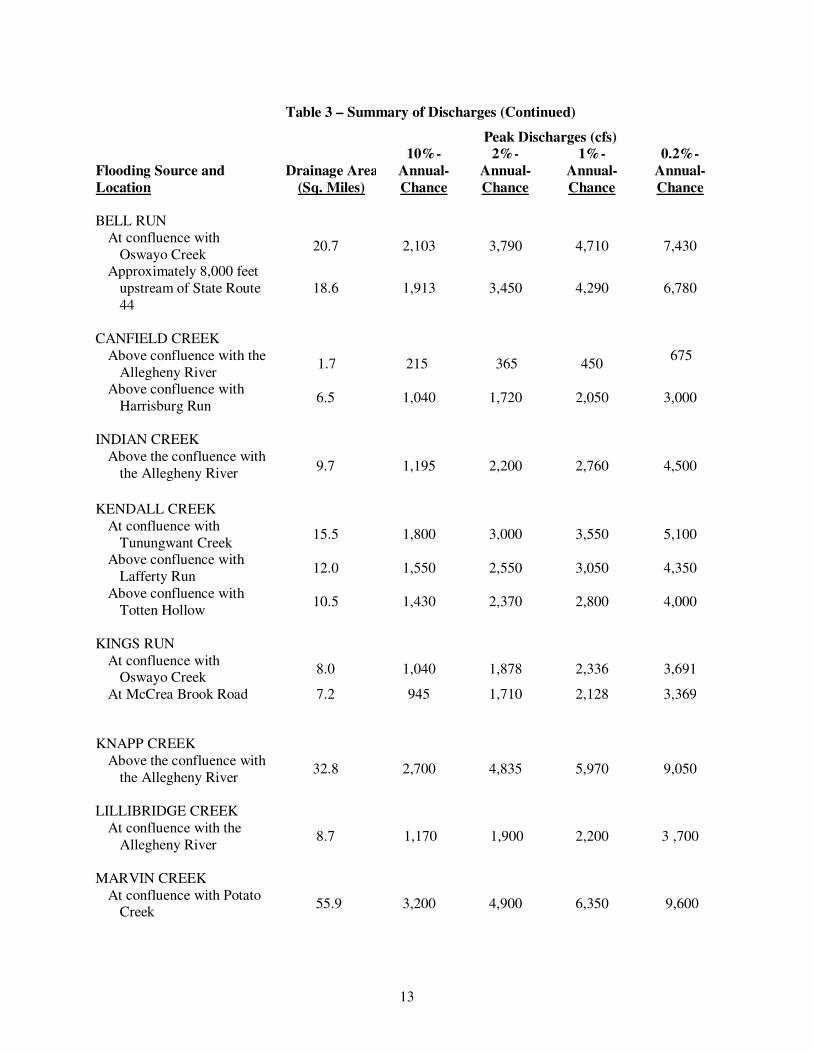
Peak discharge-drainage area relationships for the 10-, 2-, 1-, and 0.2-percent-annual-chance floods for each stream studied by detailed methods are presented in “Table 3 –
Summary of Discharges”.
Table 3 – Summary of Discharges
Peak Discharges (cfs)
Flooding Source and
Location
Drainage Area
(Sq. Miles)
10%-
Annual-
Chance
2%-
Annual-
Chance
1%-
Annual-
Chance
0.2%-
Annual-
Chance
ALLEGHENY RIVER
Above New York state
boundary 550.0 16,800 28,300 35,000 52,800
At West Mill Street Gage 247.0 11,000 22,000 28,000 42,000
BARDEN BROOK
Above confluence with the Allegheny River
7.3 935 1,800 2,540 3,375
13
Table 3 – Summary of Discharges (Continued)
Peak Discharges (cfs)
Flooding Source and
Location
Drainage Area
(Sq. Miles)
10%-
Annual-
Chance
2%-
Annual-
Chance
1%-
Annual-
Chance
0.2%-
Annual-
Chance
BELL RUN
At confluence with
Oswayo Creek 20.7 2,103 3,790 4,710 7,430
Approximately 8,000 feet
upstream of State Route
44
18.6 1,913 3,450 4,290 6,780
CANFIELD CREEK
Above confluence with the
Allegheny River 1.7 215 365 450
675
Above confluence with
Harrisburg Run 6.5 1,040 1,720 2,050 3,000
INDIAN CREEK
Above the confluence with
the Allegheny River 9.7 1,195 2,200 2,760 4,500
KENDALL CREEK
At confluence with
Tunungwant Creek 15.5 1,800 3,000 3,550 5,100
Above confluence with
Lafferty Run 12.0 1,550 2,550 3,050 4,350
Above confluence with
Totten Hollow 10.5 1,430 2,370 2,800 4,000
KINGS RUN
At confluence with Oswayo Creek
8.0 1,040 1,878 2,336 3,691
At McCrea Brook Road 7.2 945 1,710 2,128 3,369
KNAPP CREEK
Above the confluence with
the Allegheny River 32.8 2,700 4,835 5,970 9,050
LILLIBRIDGE CREEK
At confluence with the
Allegheny River 8.7 1,170 1,900 2,200 3 ,700
MARVIN CREEK
At confluence with Potato Creek
55.9 3,200 4,900 6,350 9,600
14
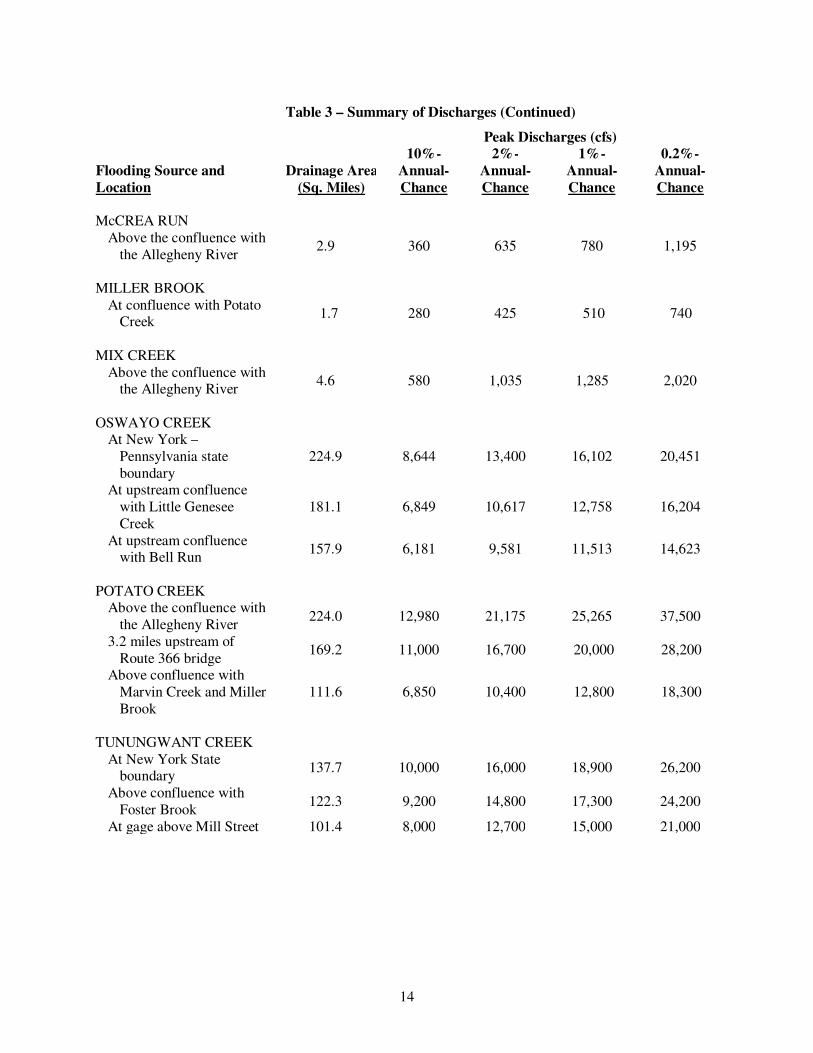
Table 3 – Summary of Discharges (Continued)
Peak Discharges (cfs)
Flooding Source and
Location
Drainage Area
(Sq. Miles)
10%-
Annual-
Chance
2%-
Annual-
Chance
1%-
Annual-
Chance
0.2%-
Annual-
Chance
McCREA RUN
Above the confluence with
the Allegheny River 2.9 360 635 780 1,195
MILLER BROOK
At confluence with Potato Creek
1.7 280 425 510 740
MIX CREEK
Above the confluence with the Allegheny River
4.6 580 1,035 1,285 2,020
OSWAYO CREEK At New York –
Pennsylvania state
boundary
224.9 8,644 13,400 16,102 20,451
At upstream confluence
with Little Genesee
Creek
181.1 6,849 10,617 12,758 16,204
At upstream confluence with Bell Run
157.9 6,181 9,581 11,513 14,623
POTATO CREEK Above the confluence with
the Allegheny River 224.0 12,980 21,175 25,265 37,500
3.2 miles upstream of
Route 366 bridge 169.2 11,000 16,700 20,000 28,200
Above confluence with
Marvin Creek and Miller
Brook
111.6 6,850 10,400 12,800 18,300
TUNUNGWANT CREEK
At New York State boundary
137.7 10,000 16,000 18,900 26,200
Above confluence with
Foster Brook 122.3 9,200 14,800 17,300 24,200
At gage above Mill Street 101.4 8,000 12,700 15,000 21,000
15
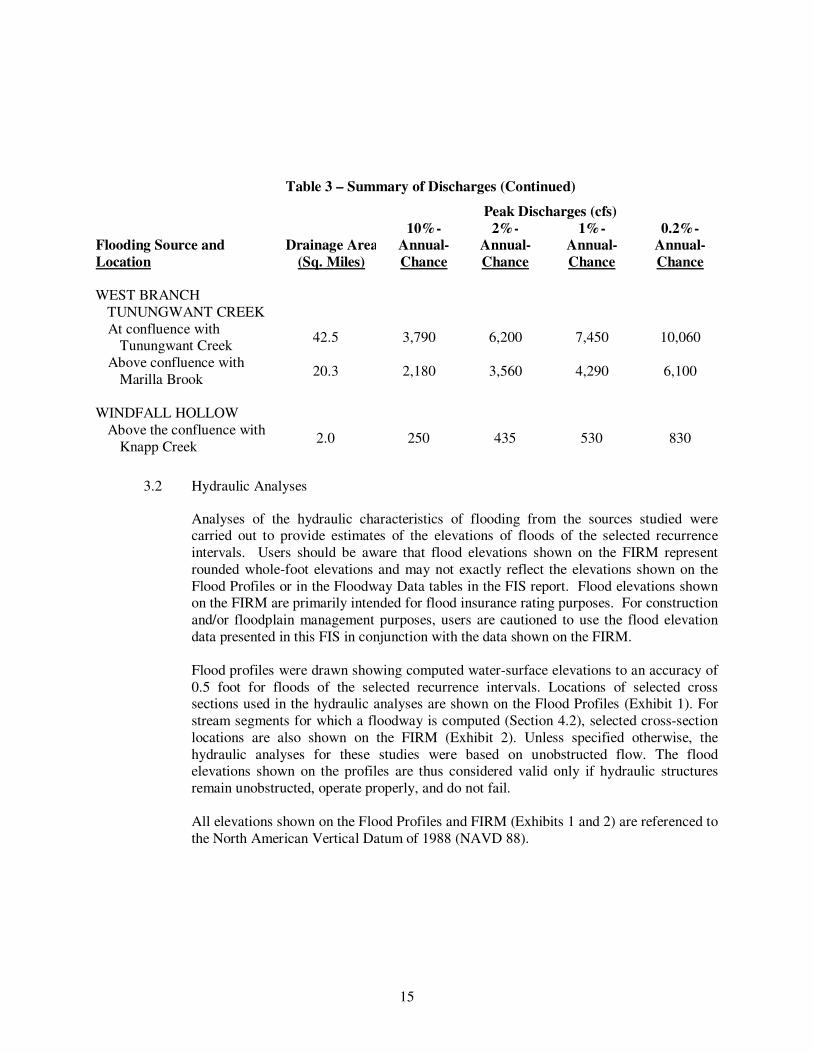
Table 3 – Summary of Discharges (Continued)
Peak Discharges (cfs)
Flooding Source and
Location
Drainage Area
(Sq. Miles)
10%-
Annual-
Chance
2%-
Annual-
Chance
1%-
Annual-
Chance
0.2%-
Annual-
Chance
WEST BRANCH
TUNUNGWANT CREEK
At confluence with Tunungwant Creek
42.5 3,790 6,200 7,450 10,060
Above confluence with
Marilla Brook 20.3 2,180 3,560 4,290 6,100
WINDFALL HOLLOW
Above the confluence with
Knapp Creek 2.0 250 435 530 830
3.2 Hydraulic Analyses
Analyses of the hydraulic characteristics of flooding from the sources studied were carried out to provide estimates of the elevations of floods of the selected recurrence
intervals. Users should be aware that flood elevations shown on the FIRM represent
rounded whole-foot elevations and may not exactly reflect the elevations shown on the
Flood Profiles or in the Floodway Data tables in the FIS report. Flood elevations shown on the FIRM are primarily intended for flood insurance rating purposes. For construction
and/or floodplain management purposes, users are cautioned to use the flood elevation
data presented in this FIS in conjunction with the data shown on the FIRM.
Flood profiles were drawn showing computed water-surface elevations to an accuracy of
0.5 foot for floods of the selected recurrence intervals. Locations of selected cross sections used in the hydraulic analyses are shown on the Flood Profiles (Exhibit 1). For
stream segments for which a floodway is computed (Section 4.2), selected cross-section
locations are also shown on the FIRM (Exhibit 2). Unless specified otherwise, the
hydraulic analyses for these studies were based on unobstructed flow. The flood elevations shown on the profiles are thus considered valid only if hydraulic structures
remain unobstructed, operate properly, and do not fail.
All elevations shown on the Flood Profiles and FIRM (Exhibits 1 and 2) are referenced to
the North American Vertical Datum of 1988 (NAVD 88).
16
Pre-countywide Analyses
Within McKean County, the City of Bradford; the Boroughs of Eldred, Port Allegany,
Smethport; and the Townships of Bradford, Ceres, Eldred, Foster, Keating, and Liberty
have a previously published FIS report. The hydraulic analyses described in those reports
have been compiled and are summarized below.
Water-surface elevations of floods of the selected recurrence intervals along the
Allegheny River, Barden Brook, Bell Run, Canfield Creek, East Branch Tunungwant Creek, Foster Brook, Kendall Creek, Kings Run, Marvin Creek, Miller Brook, Oswayo
Creek, Potato Creek, Tunungwant Creek, and West Branch Tunungwant were computed
through use of the USACE HEC-2 step-backwater computer program (Reference 38).
Due to the similarity in size and character of drainage basins, starting water-surface
elevations for East Branch Tunungwant Creek and West Branch Tunungwant Creek were
established through backwater computations of Tunungwant Creek. It was determined by backwater computations that some flow for the 1- and 0.2-percent-annual-chance floods
on East Branch Tunungwant Creek would pass through the U.S. Route 219 underpass at
Main Street and Elm Street. Therefore, flood flows for the 1- and 0.2-percent-annual-chance floods of East Branch Tunungwant Creek from its confluence with Tunungwant
Creek upstream to the Elm Street Bridge were reduced for this loss, and flows for the 1-
and 0.2-percent-annual-chance floods were increased accordingly on West Branch Tunungwant Creek upstream of its confluence with Tunungwant Creek for approximately
1,100 feet. Due to the similarity in size and character of drainage basins, starting water-
surface elevations for East Branch Tunungwant Creek and West Branch Tunungwant
Creek were established through backwater computations of Tunungwant Creek (Reference 38).
Starting water-surface elevations for the Allegheny River, Barden Brook, Bell Run, Canfield Creek, Foster Brook, Indian Creek, Kendall Creek, Kings Run, Knapp Creek,
Marvin Creek, McCrea Run, Miller Brook, Mix Creek, Potato Creek, Tunungwant Creek,
and Windfall Creek were calculated using the slope/area method. Starting water-surface
elevations for Kendall Creek were determined from backwater computations from Tunungwant Creek. Several slope estimates were used to help determine the
approximate flood boundaries on Potato Creek.
Starting water-surface elevations for Oswayo Creek were obtained from the Town of
Portville FIS (Reference 35).
Cross sections for the backwater analysis of the Allegheny River were obtained from
field survey, the USACE and aerial photographs (Reference 39 and Reference 40). The
flood profiles on the Allegheny River were compared to highwater marks of July 1942
and June 1972 provided by the USACE (Reference 41). It should be noted that the June 1972 flood follows very closely the profile for the 2-percent annual chance recurrence
interval flood. After the July 1942 flood, the Route 6 Bridge was reconstructed at a
higher elevation than previously thus preventing any significant debris problem on the Allegheny River. As a result, the bridges on the Allegheny River are assumed to be
unobstructed.
Cross sections for the backwater analyses of the portion of the Allegheny River within
the Township of Eldred, Barden Brook, Canfield Creek, Indian Creek, Knapp Creek,
17
McCrea Run, Mix Creek, Potato Creek, and Windfall Hollow were obtained from aerial
photographs flown in April 1976, at a scale of 1:12,000 (Reference 40). Data for the below water sections were obtained by field measurement. All bridge and culvert
geometries were field-checked to obtain elevation data and structural geometry.
Cross section data for the backwater analyses of Bell Run, Kings Run and Oswayo Creek were obtained using aerial photographs with the below water sections being obtained by
field measurement (Reference 42). All bridge and culvert geometries were obtained by
field survey.
Cross section and bridge elevation data for the backwater analyses of East Branch
Tunungwant Creek, Tunungwant Creek, and West Branch Tunungwant were obtained from aerial photographs flown in April 1979 with a scale of 1:9,600, the Bradford Flood
Protection Project Plans and field surveys (References 20 and 43). Cross section data for
the backwater analysis of Foster Brook and Kendall Creek were obtained from the same
aerial photography (Reference 43), and the below-water data were obtained from field surveys. All bridges and culverts for Kendall Creek were field surveyed to obtain
structural geometry and elevation data.
All stream cross sections and bridge and culvert geometries along Lillibridge Creek,
Marvin Creek, Miller Brook, and Potato Creek (within the Borough of Smethport) were
field surveyed.
Lillibridge Creek is subject to stream channel erosion due to the nature of the stream
itself and historically it is also subject to debris buildup at its bridges. These factors
cause a substantial increase in flood water levels, therefore in agreement with the USACE's Flood Plain Information (FPI) Report and with the approval of the FIA the
bridges on Lillibridge Creek were assumed to remain in place and to be partially plugged.
The flood elevations as shown on the profiles are considered valid only if hydraulic structures remain obstructed as predicted for Lillibridge Creek.
For the Allegheny River, Barden Brook, Bell Run, Canfield Creek, Indian Creek, Kings
Creek, Knapp Creek, McCrea Run, Mix Creek, Oswayo Creek, Potato Creek (within the Township of Eldred) and Windfall Hollow, roughness coefficients were selected using
engineering judgment and field observations based on tables published by Ven Te Chow
(References 44 and 45).
Channel roughness coefficients (Manning's "n") for the East Branch Tunungwant Creek,
Foster Brook, Marvin Creek, Miller Brook, Potato Creek and West Branch Tunungwant were determined by field investigation and comparison with similar streams (Reference
46). Channel roughness coefficients (Manning's "n") for Tunungwant Creek were
determined by a series of backwater computations using historical flood discharges.
Roughness coefficients, Manning's "n", for Lillibridge Creek and the portion of the
Allegheny River in the Port of Allegany and Township of Liberty, were assigned on the
basis of field investigation, comparison with similar streams, and the FPI report by the USACE (Reference 41).
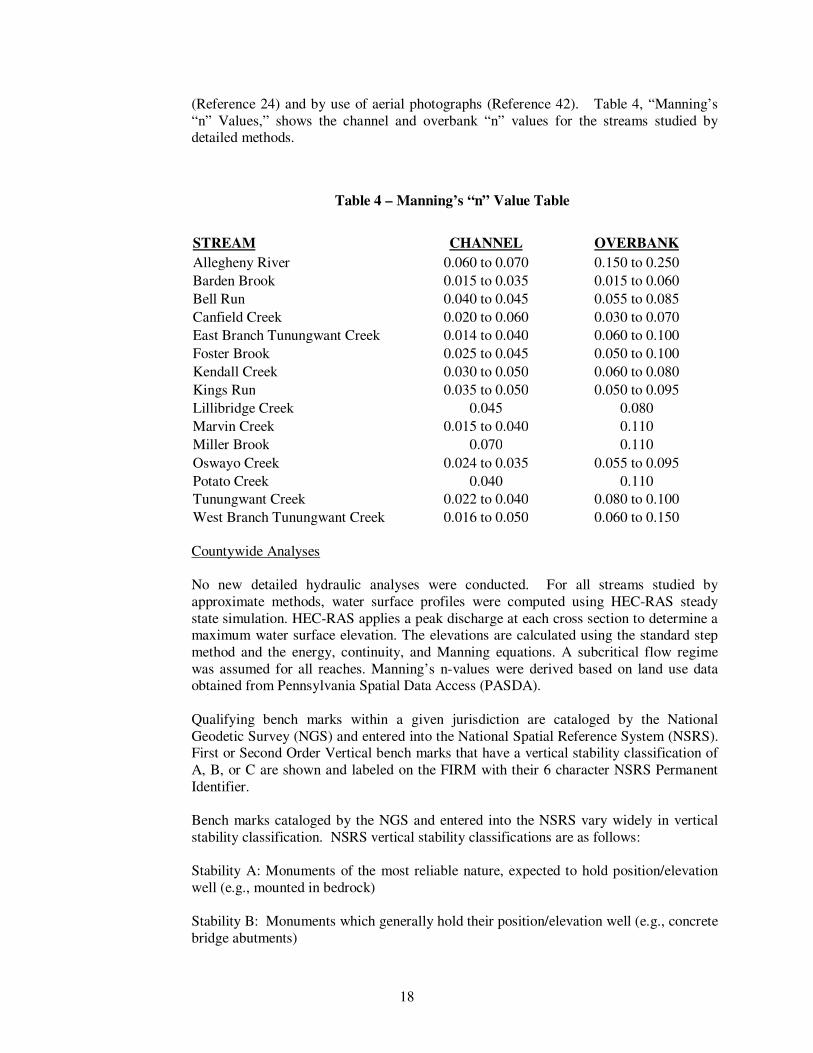
Channel and overbank roughness factors (Manning’s “n”) used in the hydraulic computations were estimated based on field observations at each cross-section and
adjusted with known high-water marks and stream gage rating curves where possible
18
(Reference 24) and by use of aerial photographs (Reference 42). Table 4, “Manning’s
“n” Values,” shows the channel and overbank “n” values for the streams studied by detailed methods.
Table 4 – Manning’s “n” Value Table
STREAM CHANNEL OVERBANK
Allegheny River 0.060 to 0.070 0.150 to 0.250
Barden Brook 0.015 to 0.035 0.015 to 0.060
Bell Run 0.040 to 0.045 0.055 to 0.085
Canfield Creek 0.020 to 0.060 0.030 to 0.070
East Branch Tunungwant Creek 0.014 to 0.040 0.060 to 0.100
Foster Brook 0.025 to 0.045 0.050 to 0.100
Kendall Creek 0.030 to 0.050 0.060 to 0.080
Kings Run 0.035 to 0.050 0.050 to 0.095
Lillibridge Creek 0.045 0.080
Marvin Creek 0.015 to 0.040 0.110
Miller Brook 0.070 0.110
Oswayo Creek 0.024 to 0.035 0.055 to 0.095
Potato Creek 0.040 0.110
Tunungwant Creek 0.022 to 0.040 0.080 to 0.100
West Branch Tunungwant Creek 0.016 to 0.050 0.060 to 0.150
Countywide Analyses
No new detailed hydraulic analyses were conducted. For all streams studied by
approximate methods, water surface profiles were computed using HEC-RAS steady
state simulation. HEC-RAS applies a peak discharge at each cross section to determine a maximum water surface elevation. The elevations are calculated using the standard step
method and the energy, continuity, and Manning equations. A subcritical flow regime
was assumed for all reaches. Manning’s n-values were derived based on land use data obtained from Pennsylvania Spatial Data Access (PASDA).
Qualifying bench marks within a given jurisdiction are cataloged by the National
Geodetic Survey (NGS) and entered into the National Spatial Reference System (NSRS). First or Second Order Vertical bench marks that have a vertical stability classification of
A, B, or C are shown and labeled on the FIRM with their 6 character NSRS Permanent
Identifier.
Bench marks cataloged by the NGS and entered into the NSRS vary widely in vertical
stability classification. NSRS vertical stability classifications are as follows:
Stability A: Monuments of the most reliable nature, expected to hold position/elevation
well (e.g., mounted in bedrock)
Stability B: Monuments which generally hold their position/elevation well (e.g., concrete
bridge abutments)
19
Stability C: Monuments which may be affected by surface ground movements (e.g., concrete mounted below frost line)
Stability D: Mark of questionable or unknown vertical stability (e.g., concrete monument
above frost line, or steel witness post)
In addition to NSRS bench marks, the FIRM may also show vertical control monument
established by a local jurisdiction; these monuments will be shown on the FIRM with the appropriate designations. Local monuments will only be placed on the FIRM if the
community has requested that they be included, and if the monuments meet the
aforementioned NSRS inclusion criteria.
To obtain current elevation, description and/or location information for bench marks
shown on the FIRM for this jurisdiction, please contact the Information Services Branch
of the NGS at (301) 713 3242, or visit their Web site, www.ngs.noaa.gov.
It is important to note that temporary vertical monuments are often established during the
preparation of a flood hazard analysis for the purposes of establishing local vertical control. Although these monuments are not shown on the digital FIRM, they may be
found in the Technical Support Data Notebook associated with this FIS and FIRM.
Interested individuals may contact FEMA to access this data.
3.3 Vertical Datum
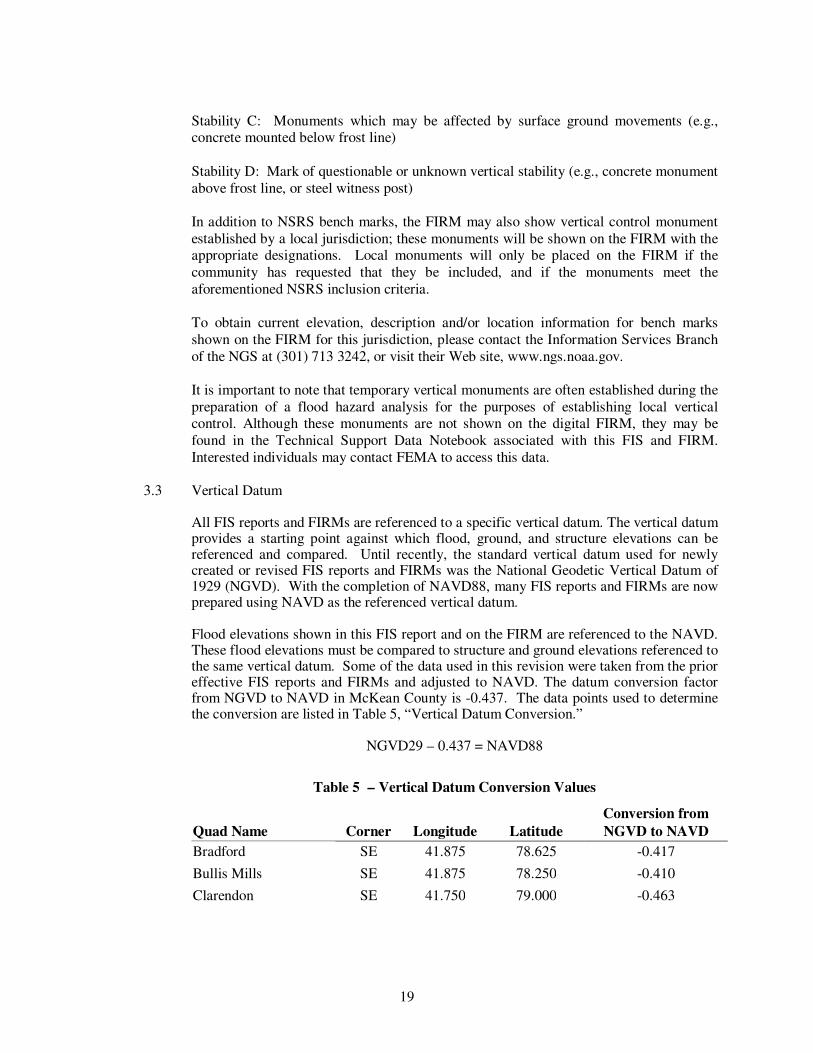
All FIS reports and FIRMs are referenced to a specific vertical datum. The vertical datum provides a starting point against which flood, ground, and structure elevations can be referenced and compared. Until recently, the standard vertical datum used for newly created or revised FIS reports and FIRMs was the National Geodetic Vertical Datum of 1929 (NGVD). With the completion of NAVD88, many FIS reports and FIRMs are now prepared using NAVD as the referenced vertical datum. Flood elevations shown in this FIS report and on the FIRM are referenced to the NAVD. These flood elevations must be compared to structure and ground elevations referenced to the same vertical datum. Some of the data used in this revision were taken from the prior effective FIS reports and FIRMs and adjusted to NAVD. The datum conversion factor from NGVD to NAVD in McKean County is -0.437. The data points used to determine the conversion are listed in Table 5, “Vertical Datum Conversion.”
NGVD29 – 0.437 = NAVD88
Table 5 – Vertical Datum Conversion Values
Quad Name Corner Longitude Latitude
Conversion from
NGVD to NAVD
Bradford SE 41.875 78.625 -0.417
Bullis Mills SE 41.875 78.250 -0.410
Clarendon SE 41.750 79.000 -0.463
20
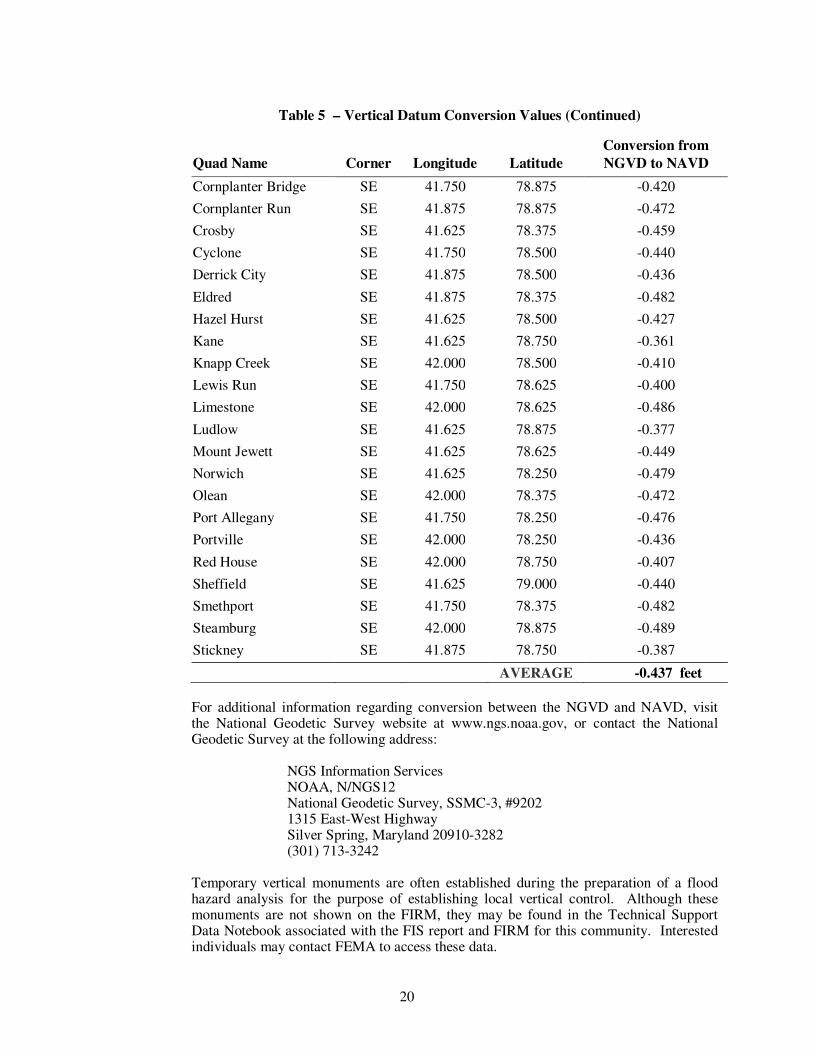
Table 5 – Vertical Datum Conversion Values (Continued)
Quad Name Corner Longitude Latitude
Conversion from
NGVD to NAVD
Cornplanter Bridge SE 41.750 78.875 -0.420
Cornplanter Run SE 41.875 78.875 -0.472
Crosby SE 41.625 78.375 -0.459
Cyclone SE 41.750 78.500 -0.440
Derrick City SE 41.875 78.500 -0.436
Eldred SE 41.875 78.375 -0.482
Hazel Hurst SE 41.625 78.500 -0.427
Kane SE 41.625 78.750 -0.361
Knapp Creek SE 42.000 78.500 -0.410
Lewis Run SE 41.750 78.625 -0.400
Limestone SE 42.000 78.625 -0.486
Ludlow SE 41.625 78.875 -0.377
Mount Jewett SE 41.625 78.625 -0.449
Norwich SE 41.625 78.250 -0.479
Olean SE 42.000 78.375 -0.472
Port Allegany SE 41.750 78.250 -0.476
Portville SE 42.000 78.250 -0.436
Red House SE 42.000 78.750 -0.407
Sheffield SE 41.625 79.000 -0.440
Smethport SE 41.750 78.375 -0.482
Steamburg SE 42.000 78.875 -0.489
Stickney SE 41.875 78.750 -0.387
AVERAGE -0.437 feet
For additional information regarding conversion between the NGVD and NAVD, visit the National Geodetic Survey website at www.ngs.noaa.gov, or contact the National Geodetic Survey at the following address:
NGS Information Services NOAA, N/NGS12 National Geodetic Survey, SSMC-3, #9202 1315 East-West Highway Silver Spring, Maryland 20910-3282 (301) 713-3242
Temporary vertical monuments are often established during the preparation of a flood hazard analysis for the purpose of establishing local vertical control. Although these monuments are not shown on the FIRM, they may be found in the Technical Support Data Notebook associated with the FIS report and FIRM for this community. Interested individuals may contact FEMA to access these data.
21
To obtain current elevation, description, and/or location information for benchmarks shown on this map, please contact the Information Services Branch of the NGS at (301) 713-3242, or visit their website at http://www.ngs.noaa.gov.
4.0 FLOODPLAIN MANAGEMENT APPLICATIONS
The NFIP encourages State and local governments to adopt sound floodplain management programs. Therefore, each FIS provides 1-percent-annual-chance (100-year) flood elevations and delineations of the 1- and 0.2-percent-annual-chance (500-year) floodplain boundaries and 1-percent-annual-chance floodway to assist communities in developing floodplain management measures. This information is presented on the FIRM and in many components of the FIS report, including Flood Profiles and Floodway Data Table. Users should reference the data presented in the FIS report as well as additional information that may be available at the local map repository before making flood elevation and/or floodplain boundary determinations. 4.1 Floodplain Boundaries
To provide a national standard without regional discrimination, the 1-percent-annual-chance flood has been adopted by FEMA as the base flood for floodplain management purposes. The 0.2-percent-annual-chance flood is employed to indicate additional areas of flood risk in the community. For each stream studied by detailed methods, the 1- and 0.2-percent-annual-chance floodplain boundaries have been delineated using the flood elevations determined at each cross section. LiDAR technology were used as the terrain data source for both redelineation of detailed and approximate floodplains in this study. This hi-resolution terrain data allows for more accuracy in floodplain mapping. The data was collected under the PAMAP program for several counties in Pennsylvania in Spring 2006. The 1- and 0.2-percent-annual-chance floodplain boundaries are shown on the FIRM (Exhibit 2). On this map, the 1-percent-annual-chance floodplain boundary corresponds to the boundary of the areas of special flood hazards (Zones A, AE, AH, AO, A99, V and VE), and the 0.2-percent-annual-chance floodplain boundary corresponds to the boundary of areas of moderate flood hazards. In cases where the 1- and 0.2-percent-annual-chance floodplain boundaries are close together, only the 1-percent-annual-chance floodplain boundary has been shown. Small areas within the floodplain boundaries may lie above the flood elevations but cannot be shown due to limitations of the map scale and/or lack of detailed topographic data. For streams studied by approximate methods, only the 1-percent-annual-chance floodplain boundary is shown on the FIRM.
4.2 Floodways
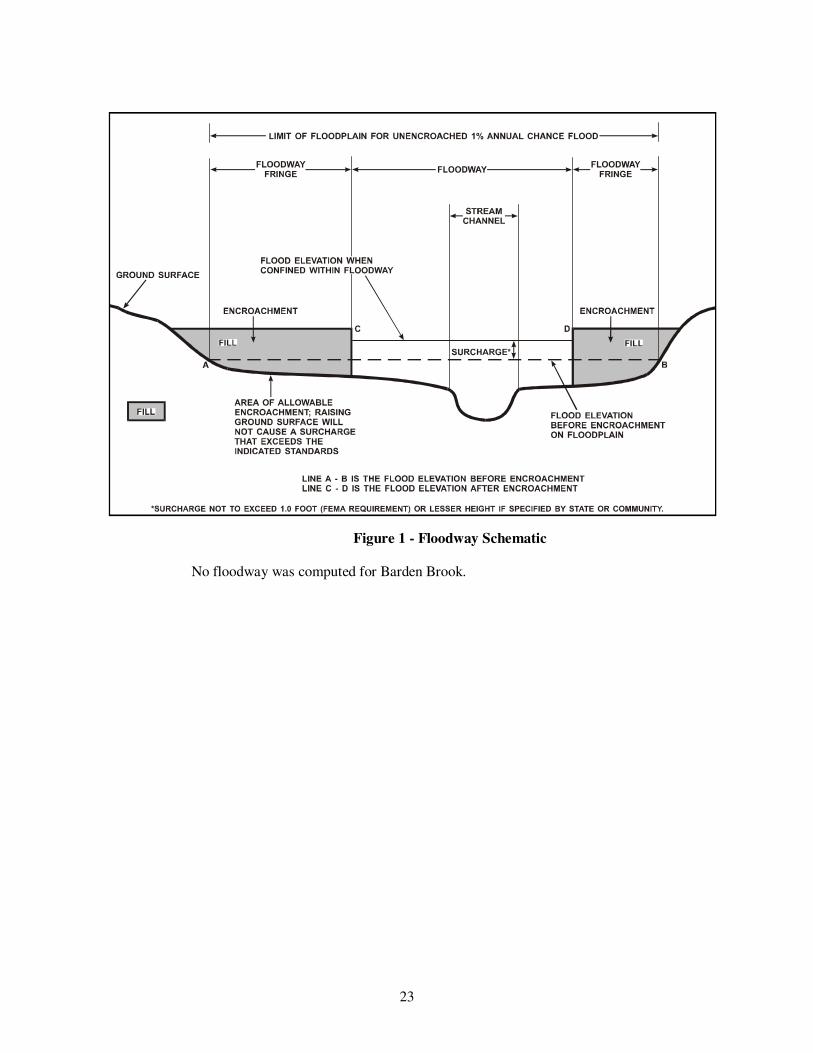
Encroachment on floodplains, such as structures and fill, reduces flood-carrying capacity, increases flood heights and velocities, and increases flood hazards in areas beyond the encroachment itself. One aspect of floodplain management involves balancing the economic gain from floodplain development against the resulting increase in flood hazard. For purposes of the NFIP, a floodway is used as a tool to assist local communities in this aspect of floodplain management. Under this concept, the area of the 1-percent-annual-chance floodplain is divided into a floodway and a floodway fringe. The floodway is the channel of a stream, plus any adjacent floodplain areas, that must be kept free of encroachment so that the 1-percent-annual-chance flood can be carried without

22
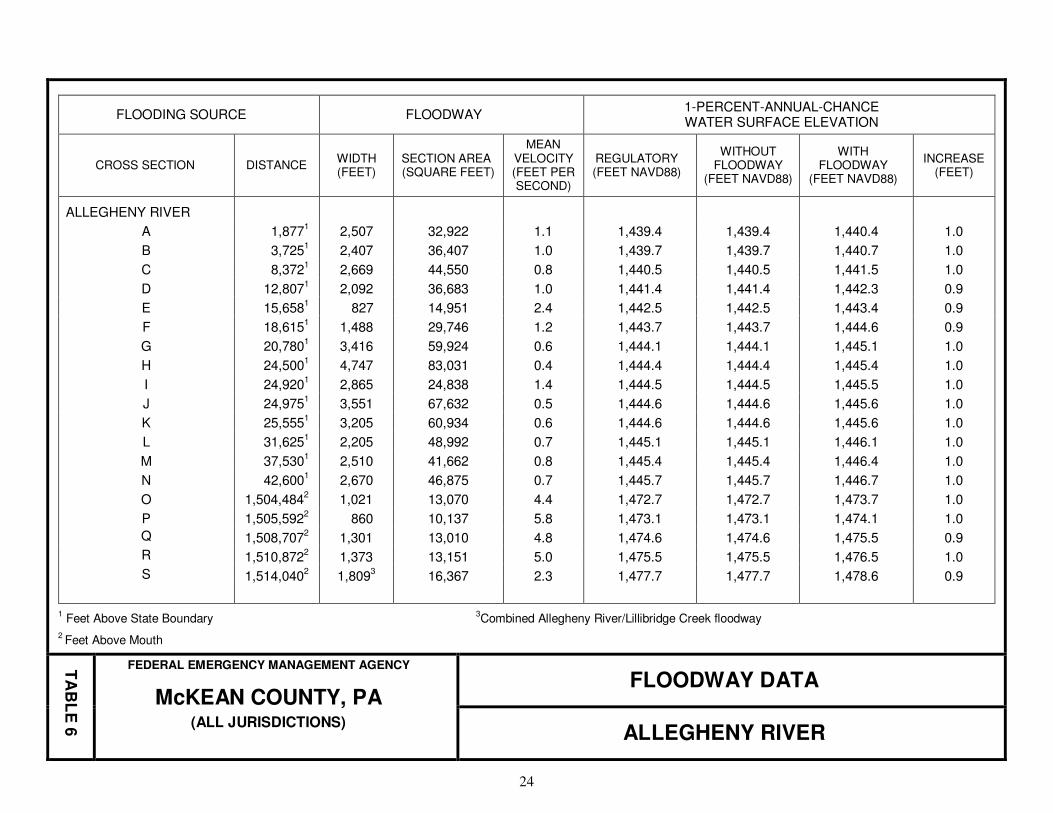
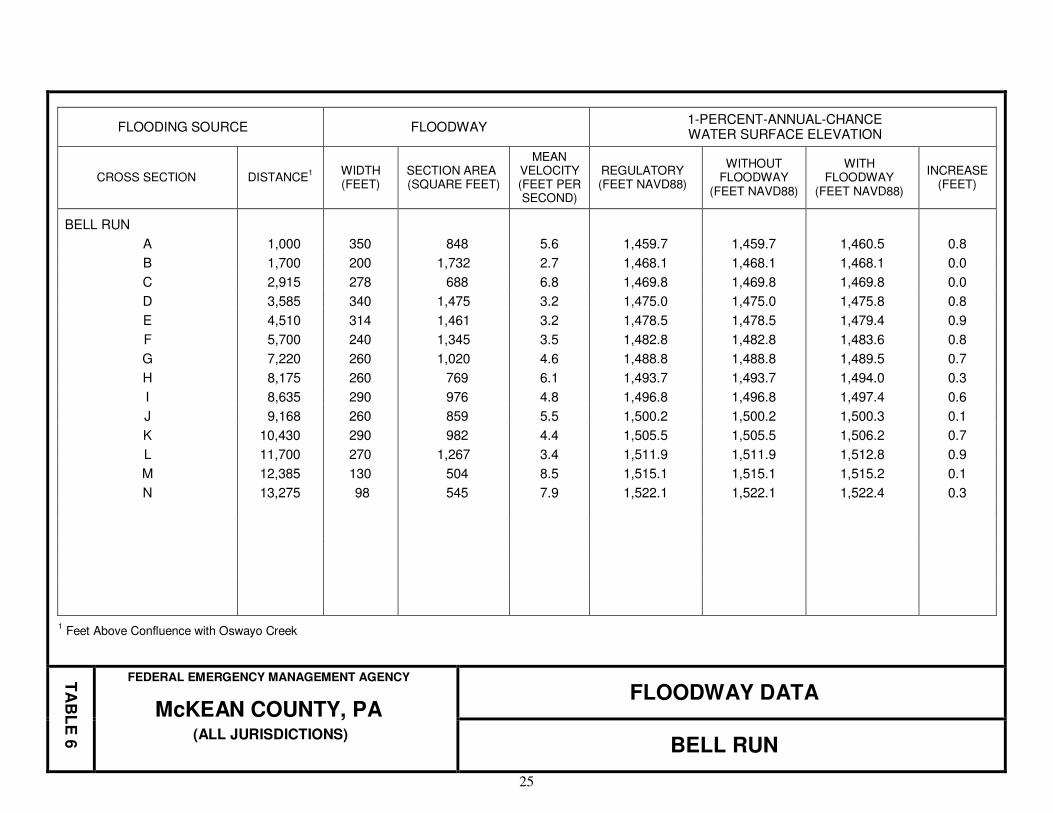
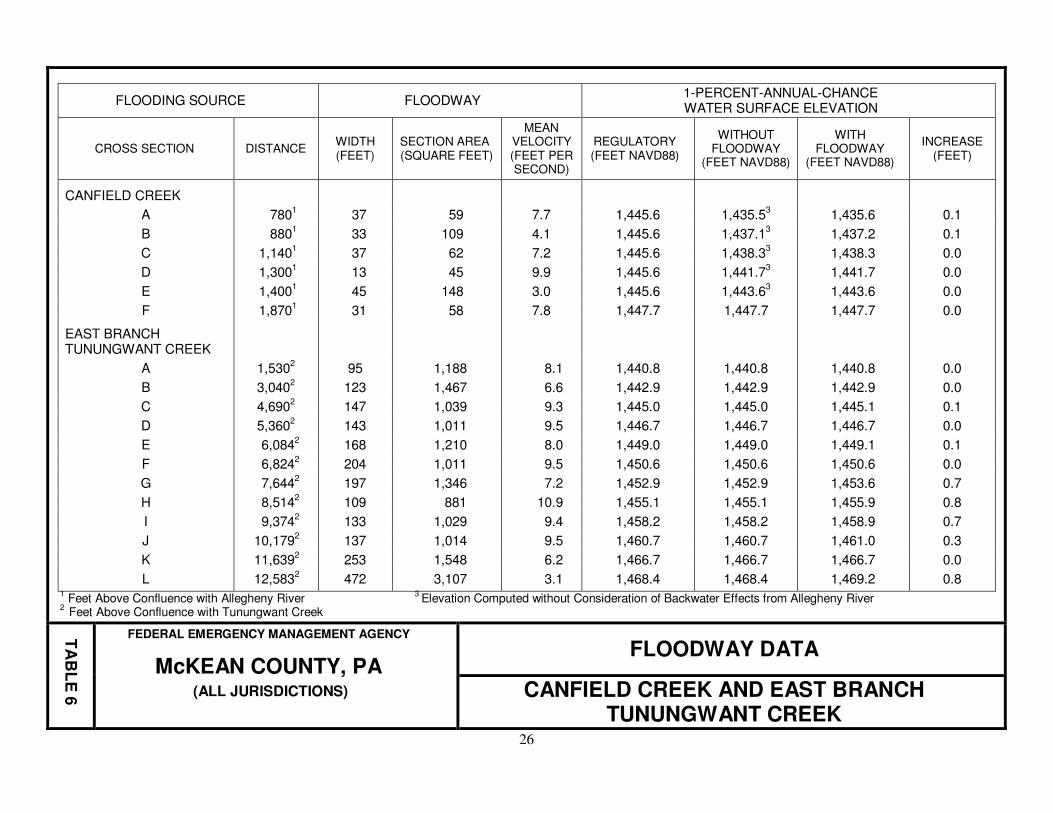
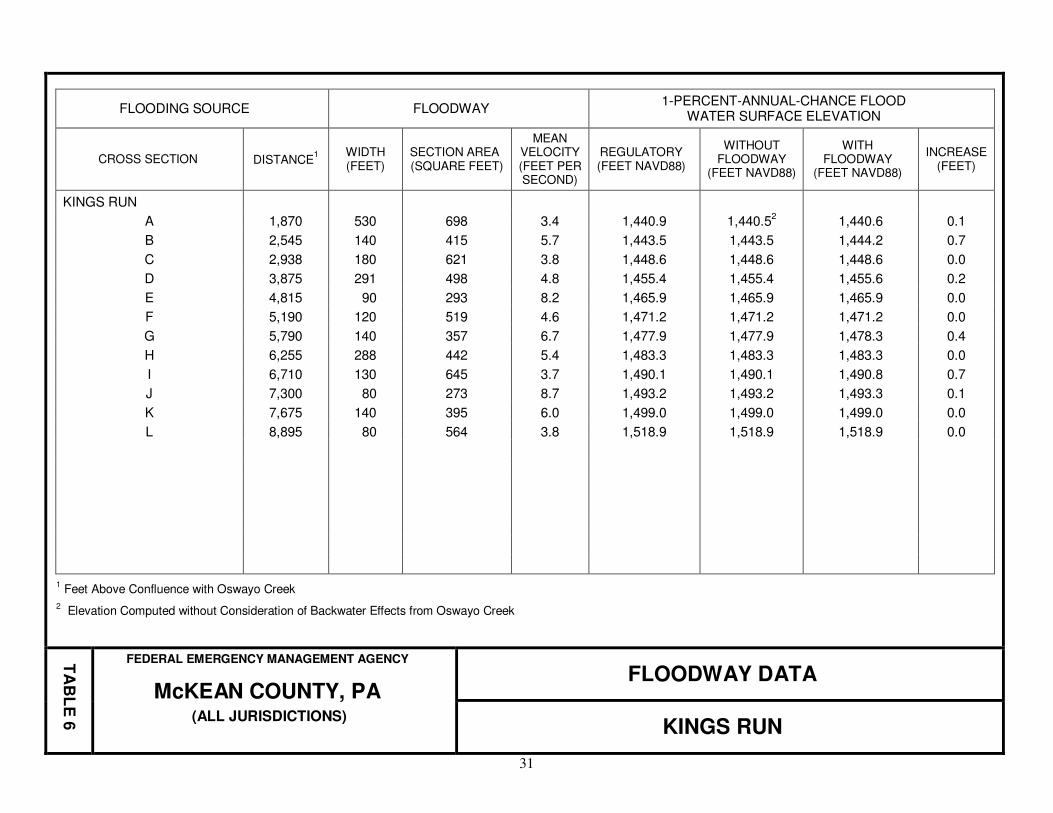
substantial increases in flood heights. Minimum Federal standards limit such increases to 1 foot, provided that hazardous velocities are not produced. The floodways in this study are presented to local agencies as minimum standards that can be adopted directly or that can be used as a basis for additional floodway studies. The floodways presented in this FIS report and on the FIRM were computed for certain stream segments on the basis of equal-conveyance reduction from each side of the floodplain. Floodway widths were computed at cross sections. Between cross sections, the floodway boundaries were interpolated. The results of the floodway computations have been tabulated for selected cross sections (Table 6, Floodway Data). The computed floodways are shown on the FIRM. In cases where the floodway and 1-percent-annual-chance floodplain boundaries are either close together or collinear, only the floodway boundary has been shown.
Near the mouths of streams studied in detail, floodway computations are made without regard to flood elevations on the receiving water body. Therefore, "Without Floodway" elevations presented in Table 6 for certain downstream cross sections of Canfield Creek, Indian Creek, Kings Run, Knapp Creek, Marvin Creek, McCrea Run, Miller Brook, Mix Creek, Oswayo Creek, Potato Creek, and Windfall Hollow are lower than the regulatory flood elevations in that area, which must take into account the 1-percent annual chance flooding due to backwater from other sources. Encroachment into areas subject to inundation by floodwaters having hazardous velocities aggravates the risk of flood damage and heightens potential flood hazards by further increasing velocities. A listing of stream velocities at selected cross sections is provided in Table X, "Floodway Data." To reduce the risk of property damage in areas where the stream velocities are high, the community may wish to restrict development in areas outside the floodway. Along streams where floodways have not been computed, the community must ensure that the cumulative effect of development in the floodplains will not cause more than a 1.0-foot increase in the BFEs at any point within the community. The area between the floodway and 1-percent annual chance floodplain boundaries is termed the floodway fringe. The floodway fringe encompasses the portion of the floodplain that could be completely obstructed without increasing the water-surface elevation of the 1-percent annual chance flood by more than 1.0 foot at any point. Typical relationships between the floodway and the floodway fringe and their significance to floodplain development are shown in Figure 1.
23
Figure 1 - Floodway Schematic
No floodway was computed for Barden Brook.
24
Table 6 – Floodway Data
FLOODING SOURCE FLOODWAY 1-PERCENT-ANNUAL-CHANCE WATER SURFACE ELEVATION
CROSS SECTION DISTANCE WIDTH (FEET)
SECTION AREA (SQUARE FEET)
MEAN VELOCITY (FEET PER SECOND)
REGULATORY (FEET NAVD88)
WITHOUT FLOODWAY
(FEET NAVD88)
WITH FLOODWAY
(FEET NAVD88)
INCREASE (FEET)
ALLEGHENY RIVER
A 1,8771 2,507 32,922 1.1 1,439.4 1,439.4 1,440.4 1.0
B 3,7251 2,407 36,407 1.0 1,439.7 1,439.7 1,440.7 1.0
C 8,3721 2,669 44,550 0.8 1,440.5 1,440.5 1,441.5 1.0
D 12,8071 2,092 36,683 1.0 1,441.4 1,441.4 1,442.3 0.9
E 15,6581 827 14,951 2.4 1,442.5 1,442.5 1,443.4 0.9
F 18,6151 1,488 29,746 1.2 1,443.7 1,443.7 1,444.6 0.9
G 20,7801 3,416 59,924 0.6 1,444.1 1,444.1 1,445.1 1.0
H 24,5001 4,747 83,031 0.4 1,444.4 1,444.4 1,445.4 1.0
I 24,9201 2,865 24,838 1.4 1,444.5 1,444.5 1,445.5 1.0
J 24,9751 3,551 67,632 0.5 1,444.6 1,444.6 1,445.6 1.0
K 25,5551 3,205 60,934 0.6 1,444.6 1,444.6 1,445.6 1.0
L 31,6251 2,205 48,992 0.7 1,445.1 1,445.1 1,446.1 1.0
M 37,5301 2,510 41,662 0.8 1,445.4 1,445.4 1,446.4 1.0
N 42,6001 2,670 46,875 0.7 1,445.7 1,445.7 1,446.7 1.0
O 1,504,4842 1,021 13,070 4.4 1,472.7 1,472.7 1,473.7 1.0
P 1,505,5922 860 10,137 5.8 1,473.1 1,473.1 1,474.1 1.0
Q 1,508,7072 1,301 13,010 4.8 1,474.6 1,474.6 1,475.5 0.9
R 1,510,8722 1,373 13,151 5.0 1,475.5 1,475.5 1,476.5 1.0
S 1,514,0402 1,809
3 16,367 2.3 1,477.7 1,477.7 1,478.6 0.9
1 Feet Above State Boundary
3Combined Allegheny River/Lillibridge Creek floodway
2 Feet Above Mouth
TA
BL
E 6
FEDERAL EMERGENCY MANAGEMENT AGENCY
McKEAN COUNTY, PA (ALL JURISDICTIONS)
FLOODWAY DATA
ALLEGHENY RIVER
25
FLOODING SOURCE FLOODWAY 1-PERCENT-ANNUAL-CHANCE WATER SURFACE ELEVATION
CROSS SECTION DISTANCE1
WIDTH (FEET)
SECTION AREA (SQUARE FEET)
MEAN VELOCITY (FEET PER SECOND)
REGULATORY (FEET NAVD88)
WITHOUT FLOODWAY
(FEET NAVD88)
WITH FLOODWAY
(FEET NAVD88)
INCREASE (FEET)
BELL RUN
A 1,000 350 848 5.6 1,459.7 1,459.7 1,460.5 0.8
B 1,700 200 1,732 2.7 1,468.1 1,468.1 1,468.1 0.0
C 2,915 278 688 6.8 1,469.8 1,469.8 1,469.8 0.0
D 3,585 340 1,475 3.2 1,475.0 1,475.0 1,475.8 0.8
E 4,510 314 1,461 3.2 1,478.5 1,478.5 1,479.4 0.9
F 5,700 240 1,345 3.5 1,482.8 1,482.8 1,483.6 0.8
G 7,220 260 1,020 4.6 1,488.8 1,488.8 1,489.5 0.7
H 8,175 260 769 6.1 1,493.7 1,493.7 1,494.0 0.3
I 8,635 290 976 4.8 1,496.8 1,496.8 1,497.4 0.6
J 9,168 260 859 5.5 1,500.2 1,500.2 1,500.3 0.1
K 10,430 290 982 4.4 1,505.5 1,505.5 1,506.2 0.7
L 11,700 270 1,267 3.4 1,511.9 1,511.9 1,512.8 0.9
M 12,385 130 504 8.5 1,515.1 1,515.1 1,515.2 0.1
N 13,275 98 545 7.9 1,522.1 1,522.1 1,522.4 0.3
1 Feet Above Confluence with Oswayo Creek
TA
BL
E 6
FEDERAL EMERGENCY MANAGEMENT AGENCY
McKEAN COUNTY, PA (ALL JURISDICTIONS)
FLOODWAY DATA
BELL RUN
26
FLOODING SOURCE FLOODWAY 1-PERCENT-ANNUAL-CHANCE WATER SURFACE ELEVATION
CROSS SECTION DISTANCE WIDTH (FEET)
SECTION AREA (SQUARE FEET)
MEAN VELOCITY (FEET PER SECOND)
REGULATORY (FEET NAVD88)
WITHOUT FLOODWAY
(FEET NAVD88)
WITH FLOODWAY
(FEET NAVD88)
INCREASE (FEET)
CANFIELD CREEK
A 7801 37 59 7.7 1,445.6 1,435.5
3 1,435.6 0.1
B 8801 33 109 4.1 1,445.6 1,437.1
3 1,437.2 0.1
C 1,1401 37 62 7.2 1,445.6 1,438.3
3 1,438.3 0.0
D 1,3001 13 45 9.9 1,445.6 1,441.7
3 1,441.7 0.0
E 1,4001 45 148 3.0 1,445.6 1,443.6
3 1,443.6 0.0
F 1,8701 31 58 7.8 1,447.7 1,447.7 1,447.7 0.0
EAST BRANCH TUNUNGWANT CREEK
A 1,5302 95 1,188 8.1 1,440.8 1,440.8 1,440.8 0.0
B 3,0402 123 1,467 6.6 1,442.9 1,442.9 1,442.9 0.0
C 4,6902 147 1,039 9.3 1,445.0 1,445.0 1,445.1 0.1
D 5,3602 143 1,011 9.5 1,446.7 1,446.7 1,446.7 0.0
E 6,0842 168 1,210 8.0 1,449.0 1,449.0 1,449.1 0.1
F 6,8242 204 1,011 9.5 1,450.6 1,450.6 1,450.6 0.0
G 7,6442 197 1,346 7.2 1,452.9 1,452.9 1,453.6 0.7
H 8,5142 109 881 10.9 1,455.1 1,455.1 1,455.9 0.8
I 9,3742 133 1,029 9.4 1,458.2 1,458.2 1,458.9 0.7
J 10,1792 137 1,014 9.5 1,460.7 1,460.7 1,461.0 0.3
K 11,6392 253 1,548 6.2 1,466.7 1,466.7 1,466.7 0.0
L 12,5832 472 3,107 3.1 1,468.4 1,468.4 1,469.2 0.8
1 Feet Above Confluence with Allegheny River
3 Elevation Computed without Consideration of Backwater Effects from Allegheny River
2 Feet Above Confluence with Tunungwant Creek
TA
BL
E 6
FEDERAL EMERGENCY MANAGEMENT AGENCY
McKEAN COUNTY, PA (ALL JURISDICTIONS)
FLOODWAY DATA
CANFIELD CREEK AND EAST BRANCH TUNUNGWANT CREEK
27
FLOODING SOURCE FLOODWAY 1-PERCENT-ANNUAL-CHANCE WATER SURFACE ELEVATION
CROSS SECTION DISTANCE1
WIDTH (FEET)
SECTION AREA
(SQUARE FEET)
MEAN VELOCITY (FEET PER SECOND)
REGULATORY (FEET
NAVD88)
WITHOUT FLOODWAY
(FEET NAVD88)
WITH FLOODWAY
(FEET NAVD88)
INCREASE (FEET)
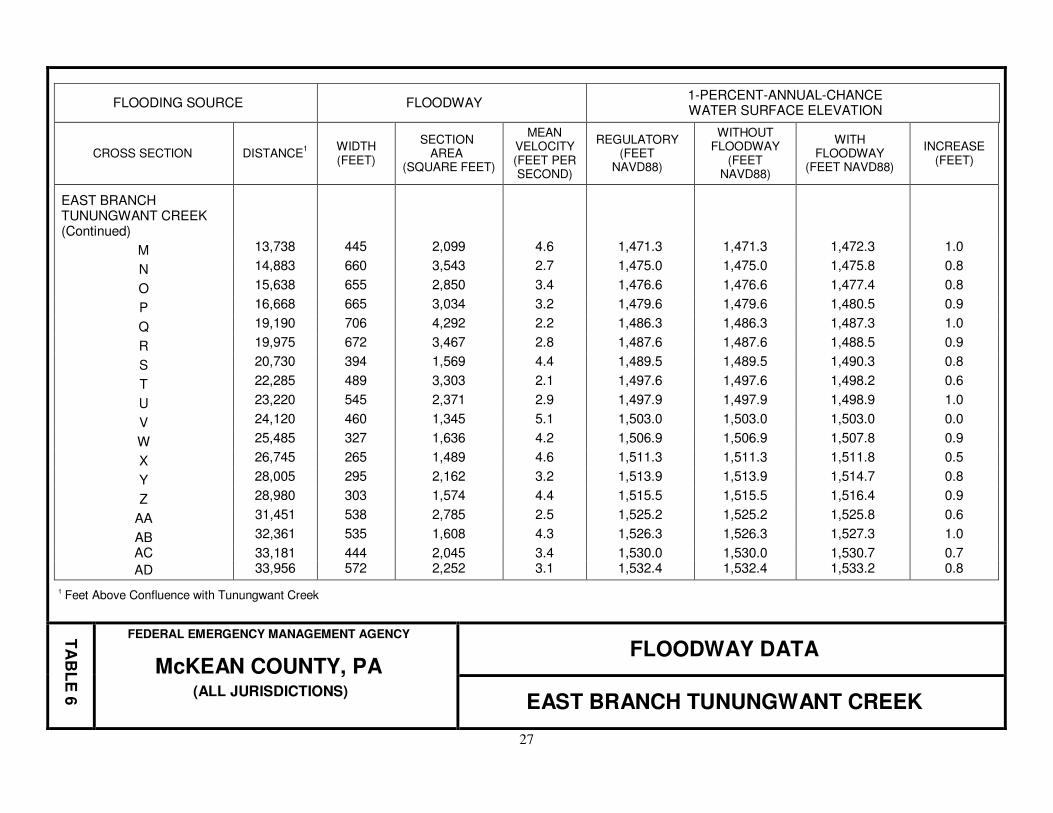
EAST BRANCH TUNUNGWANT CREEK (Continued)
M 13,738 445 2,099 4.6 1,471.3 1,471.3 1,472.3 1.0
N 14,883 660 3,543 2.7 1,475.0 1,475.0 1,475.8 0.8
O 15,638 655 2,850 3.4 1,476.6 1,476.6 1,477.4 0.8
P 16,668 665 3,034 3.2 1,479.6 1,479.6 1,480.5 0.9
Q 19,190 706 4,292 2.2 1,486.3 1,486.3 1,487.3 1.0
R 19,975 672 3,467 2.8 1,487.6 1,487.6 1,488.5 0.9
S 20,730 394 1,569 4.4 1,489.5 1,489.5 1,490.3 0.8
T 22,285 489 3,303 2.1 1,497.6 1,497.6 1,498.2 0.6
U 23,220 545 2,371 2.9 1,497.9 1,497.9 1,498.9 1.0
V 24,120 460 1,345 5.1 1,503.0 1,503.0 1,503.0 0.0
W 25,485 327 1,636 4.2 1,506.9 1,506.9 1,507.8 0.9
X 26,745 265 1,489 4.6 1,511.3 1,511.3 1,511.8 0.5
Y 28,005 295 2,162 3.2 1,513.9 1,513.9 1,514.7 0.8
Z 28,980 303 1,574 4.4 1,515.5 1,515.5 1,516.4 0.9
AA 31,451 538 2,785 2.5 1,525.2 1,525.2 1,525.8 0.6
AB 32,361 535 1,608 4.3 1,526.3 1,526.3 1,527.3 1.0
AC 33,181 444 2,045 3.4 1,530.0 1,530.0 1,530.7 0.7
AD 33,956 572 2,252 3.1 1,532.4 1,532.4 1,533.2 0.8
1 Feet Above Confluence with Tunungwant Creek
TA
BL
E 6
FEDERAL EMERGENCY MANAGEMENT AGENCY
McKEAN COUNTY, PA (ALL JURISDICTIONS)
FLOODWAY DATA
EAST BRANCH TUNUNGWANT CREEK
28
FLOODING SOURCE FLOODWAY 1-PERCENT-ANNUAL-CHANCE WATER SURFACE ELEVATION
CROSS SECTION DISTANCE1
WIDTH (FEET)
SECTION AREA (SQUARE FEET)
MEAN VELOCITY (FEET PER SECOND)
REGULATORY (FEET NAVD88)
WITHOUT FLOODWAY
(FEET NAVD88)
WITH FLOODWAY
(FEET NAVD88)
INCREASE (FEET)
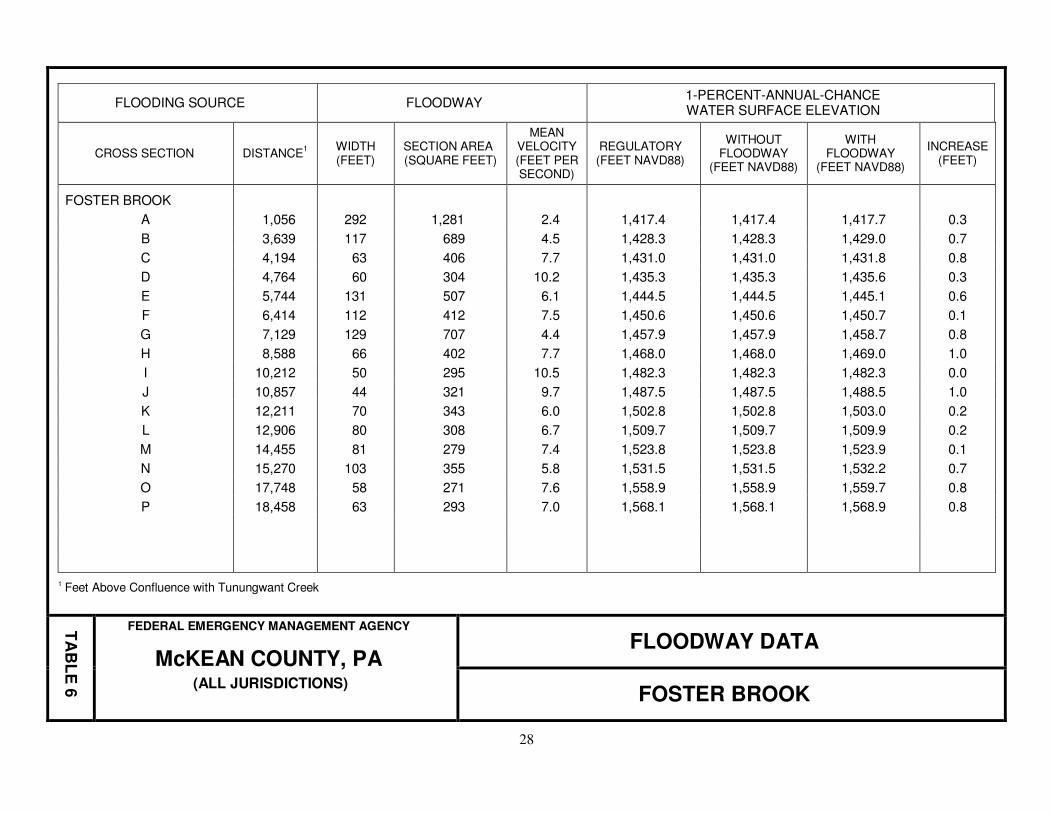
FOSTER BROOK
A 1,056 292 1,281 2.4 1,417.4 1,417.4 1,417.7 0.3
B 3,639 117 689 4.5 1,428.3 1,428.3 1,429.0 0.7
C 4,194 63 406 7.7 1,431.0 1,431.0 1,431.8 0.8
D 4,764 60 304 10.2 1,435.3 1,435.3 1,435.6 0.3
E 5,744 131 507 6.1 1,444.5 1,444.5 1,445.1 0.6
F 6,414 112 412 7.5 1,450.6 1,450.6 1,450.7 0.1
G 7,129 129 707 4.4 1,457.9 1,457.9 1,458.7 0.8
H 8,588 66 402 7.7 1,468.0 1,468.0 1,469.0 1.0
I 10,212 50 295 10.5 1,482.3 1,482.3 1,482.3 0.0
J 10,857 44 321 9.7 1,487.5 1,487.5 1,488.5 1.0
K 12,211 70 343 6.0 1,502.8 1,502.8 1,503.0 0.2
L 12,906 80 308 6.7 1,509.7 1,509.7 1,509.9 0.2
M 14,455 81 279 7.4 1,523.8 1,523.8 1,523.9 0.1
N 15,270 103 355 5.8 1,531.5 1,531.5 1,532.2 0.7
O 17,748 58 271 7.6 1,558.9 1,558.9 1,559.7 0.8
P 18,458 63 293 7.0 1,568.1 1,568.1 1,568.9 0.8
1 Feet Above Confluence with Tunungwant Creek
TA
BL
E 6
FEDERAL EMERGENCY MANAGEMENT AGENCY
McKEAN COUNTY, PA (ALL JURISDICTIONS)
FLOODWAY DATA
FOSTER BROOK
29
FLOODING SOURCE FLOODWAY 1-PERCENT-ANNUAL-CHANCE FLOOD
WATER SURFACE ELEVATION
CROSS SECTION DISTANCE WIDTH (FEET)
SECTION AREA (SQUARE FEET)
MEAN VELOCITY (FEET PER SECOND)
REGULATORY (FEET NAVD88)
WITHOUT FLOODWAY
(FEET NAVD88)
WITH FLOODWAY
(FEET NAVD88)
INCREASE (FEET)
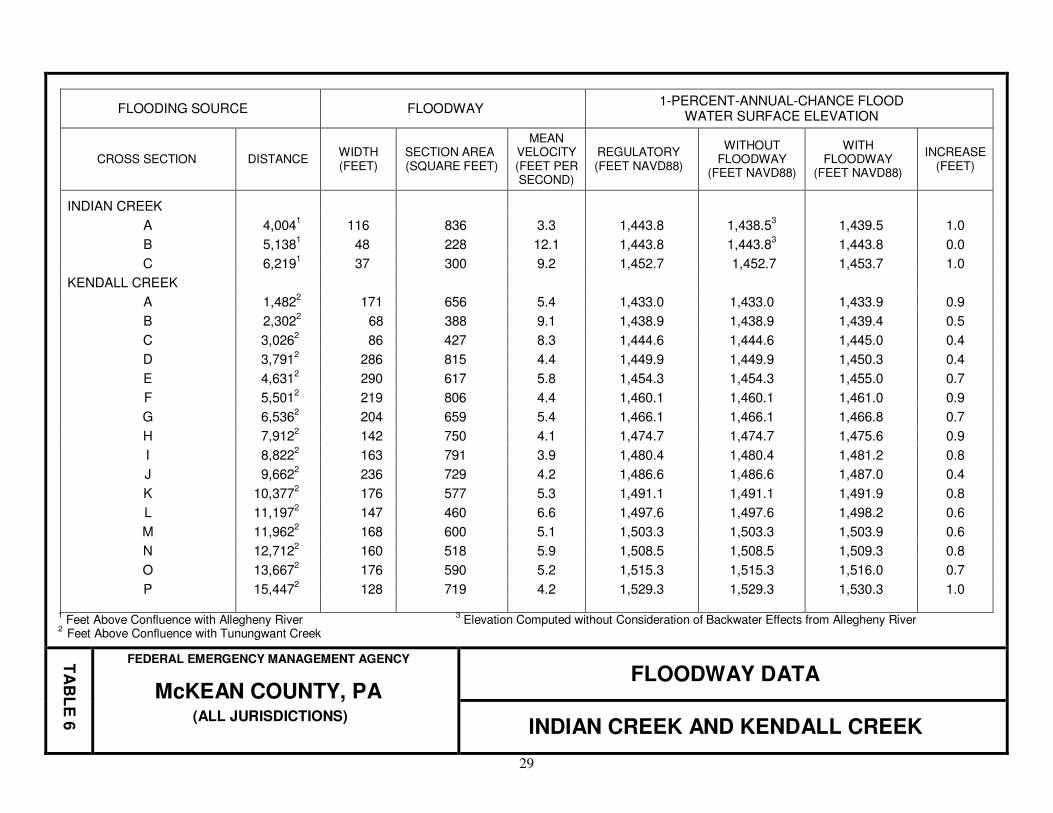
INDIAN CREEK
A 4,0041 116 836 3.3 1,443.8 1,438.5
3 1,439.5 1.0
B 5,1381 48 228 12.1 1,443.8 1,443.8
3 1,443.8 0.0
C 6,2191 37 300 9.2 1,452.7 1,452.7 1,453.7 1.0
KENDALL CREEK
A 1,4822 171 656 5.4 1,433.0 1,433.0 1,433.9 0.9
B 2,3022 68 388 9.1 1,438.9 1,438.9 1,439.4 0.5
C 3,0262 86 427 8.3 1,444.6 1,444.6 1,445.0 0.4
D 3,7912 286 815 4.4 1,449.9 1,449.9 1,450.3 0.4
E 4,6312 290 617 5.8 1,454.3 1,454.3 1,455.0 0.7
F 5,5012 219 806 4.4 1,460.1 1,460.1 1,461.0 0.9
G 6,5362 204 659 5.4 1,466.1 1,466.1 1,466.8 0.7
H 7,9122 142 750 4.1 1,474.7 1,474.7 1,475.6 0.9
I 8,8222 163 791 3.9 1,480.4 1,480.4 1,481.2 0.8
J 9,6622 236 729 4.2 1,486.6 1,486.6 1,487.0 0.4
K 10,3772 176 577 5.3 1,491.1 1,491.1 1,491.9 0.8
L 11,1972 147 460 6.6 1,497.6 1,497.6 1,498.2 0.6
M 11,9622 168 600 5.1 1,503.3 1,503.3 1,503.9 0.6
N 12,7122 160 518 5.9 1,508.5 1,508.5 1,509.3 0.8
O 13,6672 176 590 5.2 1,515.3 1,515.3 1,516.0 0.7
P 15,4472 128 719 4.2 1,529.3 1,529.3 1,530.3 1.0
1 Feet Above Confluence with Allegheny River
3 Elevation Computed without Consideration of Backwater Effects from Allegheny River
2 Feet Above Confluence with Tunungwant Creek
TA
BL
E 6
FEDERAL EMERGENCY MANAGEMENT AGENCY
McKEAN COUNTY, PA (ALL JURISDICTIONS)
FLOODWAY DATA
INDIAN CREEK AND KENDALL CREEK
30
FLOODING SOURCE FLOODWAY 1-PERCENT-ANNUAL-CHANCE FLOOD
WATER SURFACE ELEVATION
CROSS SECTION DISTANCE1
WIDTH (FEET)
SECTION AREA (SQUARE FEET)
MEAN VELOCITY (FEET PER SECOND)
REGULATORY (FEET NAVD88)
WITHOUT FLOODWAY
(FEET NAVD88)
WITH FLOODWAY
(FEET NAVD88)
INCREASE (FEET)
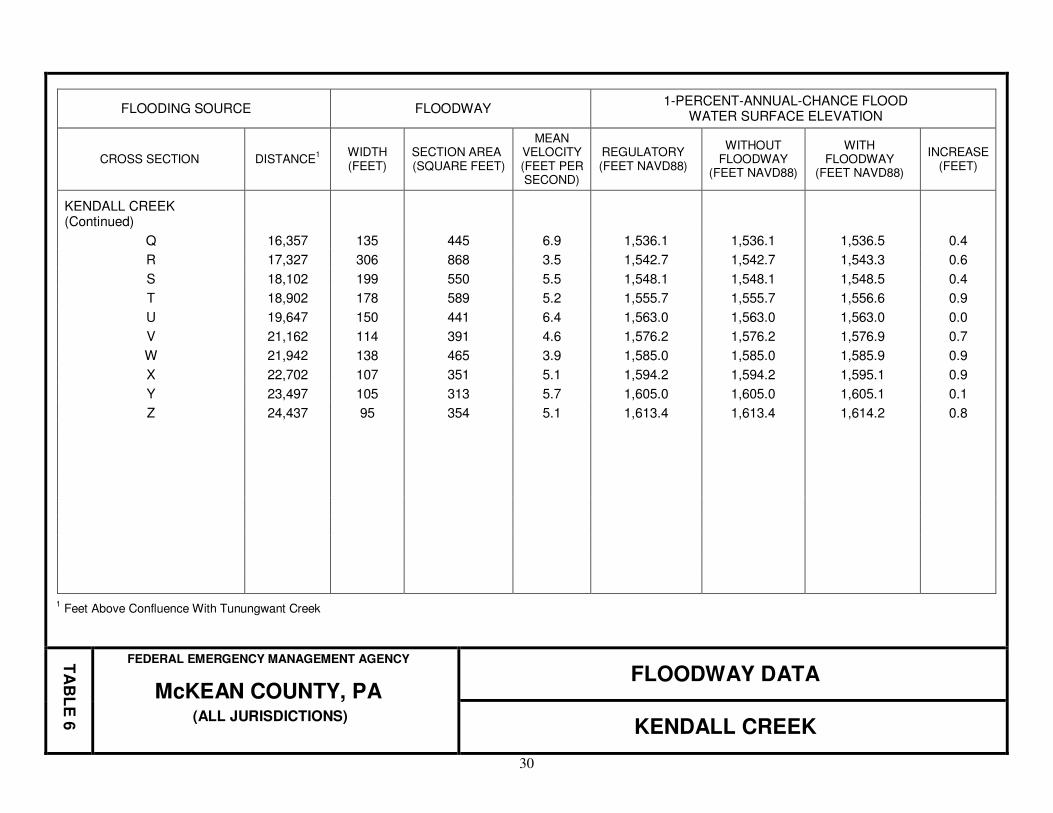
KENDALL CREEK (Continued)
Q 16,357 135 445 6.9 1,536.1 1,536.1 1,536.5 0.4
R 17,327 306 868 3.5 1,542.7 1,542.7 1,543.3 0.6
S 18,102 199 550 5.5 1,548.1 1,548.1 1,548.5 0.4
T 18,902 178 589 5.2 1,555.7 1,555.7 1,556.6 0.9
U 19,647 150 441 6.4 1,563.0 1,563.0 1,563.0 0.0
V 21,162 114 391 4.6 1,576.2 1,576.2 1,576.9 0.7
W 21,942 138 465 3.9 1,585.0 1,585.0 1,585.9 0.9
X 22,702 107 351 5.1 1,594.2 1,594.2 1,595.1 0.9
Y 23,497 105 313 5.7 1,605.0 1,605.0 1,605.1 0.1
Z 24,437 95 354 5.1 1,613.4 1,613.4 1,614.2 0.8
1 Feet Above Confluence With Tunungwant Creek
TA
BL
E 6
FEDERAL EMERGENCY MANAGEMENT AGENCY
McKEAN COUNTY, PA (ALL JURISDICTIONS)
FLOODWAY DATA
KENDALL CREEK
31
FLOODING SOURCE FLOODWAY 1-PERCENT-ANNUAL-CHANCE FLOOD
WATER SURFACE ELEVATION
CROSS SECTION DISTANCE1
WIDTH (FEET)
SECTION AREA (SQUARE FEET)
MEAN VELOCITY (FEET PER SECOND)
REGULATORY (FEET NAVD88)
WITHOUT FLOODWAY
(FEET NAVD88)
WITH FLOODWAY
(FEET NAVD88)
INCREASE (FEET)
KINGS RUN
A 1,870 530 698 3.4 1,440.9 1,440.52 1,440.6 0.1
B 2,545 140 415 5.7 1,443.5 1,443.5 1,444.2 0.7
C 2,938 180 621 3.8 1,448.6 1,448.6 1,448.6 0.0
D 3,875 291 498 4.8 1,455.4 1,455.4 1,455.6 0.2
E 4,815 90 293 8.2 1,465.9 1,465.9 1,465.9 0.0
F 5,190 120 519 4.6 1,471.2 1,471.2 1,471.2 0.0
G 5,790 140 357 6.7 1,477.9 1,477.9 1,478.3 0.4
H 6,255 288 442 5.4 1,483.3 1,483.3 1,483.3 0.0
I 6,710 130 645 3.7 1,490.1 1,490.1 1,490.8 0.7
J 7,300 80 273 8.7 1,493.2 1,493.2 1,493.3 0.1
K 7,675 140 395 6.0 1,499.0 1,499.0 1,499.0 0.0
L 8,895 80 564 3.8 1,518.9 1,518.9 1,518.9 0.0
1 Feet Above Confluence with Oswayo Creek
2 Elevation Computed without Consideration of Backwater Effects from Oswayo Creek
TA
BL
E 6
FEDERAL EMERGENCY MANAGEMENT AGENCY
McKEAN COUNTY, PA (ALL JURISDICTIONS)
FLOODWAY DATA
KINGS RUN
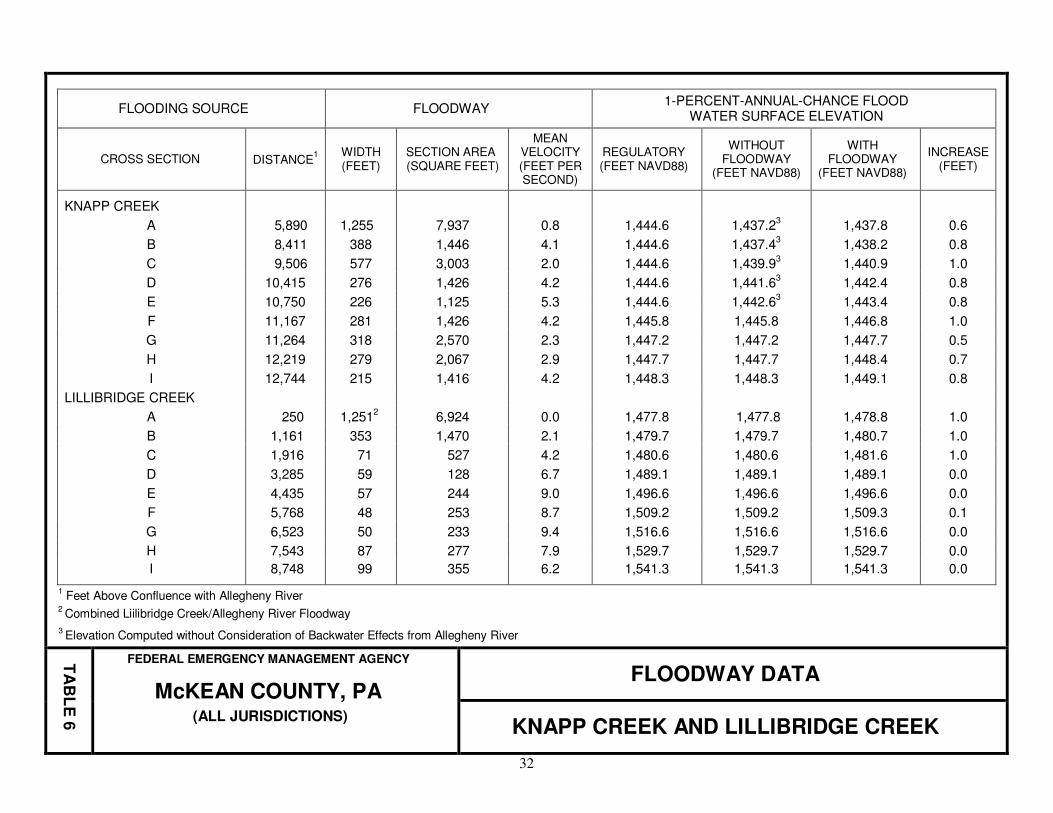
32
FLOODING SOURCE FLOODWAY 1-PERCENT-ANNUAL-CHANCE FLOOD
WATER SURFACE ELEVATION
CROSS SECTION DISTANCE1
WIDTH (FEET)
SECTION AREA (SQUARE FEET)
MEAN VELOCITY (FEET PER SECOND)
REGULATORY (FEET NAVD88)
WITHOUT FLOODWAY
(FEET NAVD88)
WITH FLOODWAY
(FEET NAVD88)
INCREASE (FEET)
KNAPP CREEK
A 5,890 1,255 7,937 0.8 1,444.6 1,437.23 1,437.8 0.6
B 8,411 388 1,446 4.1 1,444.6 1,437.43 1,438.2 0.8
C 9,506 577 3,003 2.0 1,444.6 1,439.93 1,440.9 1.0
D 10,415 276 1,426 4.2 1,444.6 1,441.63 1,442.4 0.8
E 10,750 226 1,125 5.3 1,444.6 1,442.63 1,443.4 0.8
F 11,167 281 1,426 4.2 1,445.8 1,445.8 1,446.8 1.0
G 11,264 318 2,570 2.3 1,447.2 1,447.2 1,447.7 0.5
H 12,219 279 2,067 2.9 1,447.7 1,447.7 1,448.4 0.7
I 12,744 215 1,416 4.2 1,448.3 1,448.3 1,449.1 0.8
LILLIBRIDGE CREEK
A 250 1,2512
6,924 0.0 1,477.8 1,477.8
1,478.8 1.0
B 1,161 353 1,470 2.1 1,479.7 1,479.7 1,480.7 1.0
C 1,916 71 527 4.2 1,480.6 1,480.6 1,481.6 1.0
D 3,285 59 128 6.7 1,489.1 1,489.1 1,489.1 0.0
E 4,435 57 244 9.0 1,496.6 1,496.6 1,496.6 0.0
F 5,768 48 253 8.7 1,509.2 1,509.2 1,509.3 0.1
G 6,523 50 233 9.4 1,516.6 1,516.6 1,516.6 0.0
H 7,543 87 277 7.9 1,529.7 1,529.7 1,529.7 0.0
I 8,748 99 355 6.2 1,541.3 1,541.3 1,541.3 0.0
1 Feet Above Confluence with Allegheny River
2 Combined Liilibridge Creek/Allegheny River Floodway
3 Elevation Computed without Consideration of Backwater Effects from Allegheny River
TA
BL
E 6
FEDERAL EMERGENCY MANAGEMENT AGENCY
McKEAN COUNTY, PA (ALL JURISDICTIONS)
FLOODWAY DATA
KNAPP CREEK AND LILLIBRIDGE CREEK
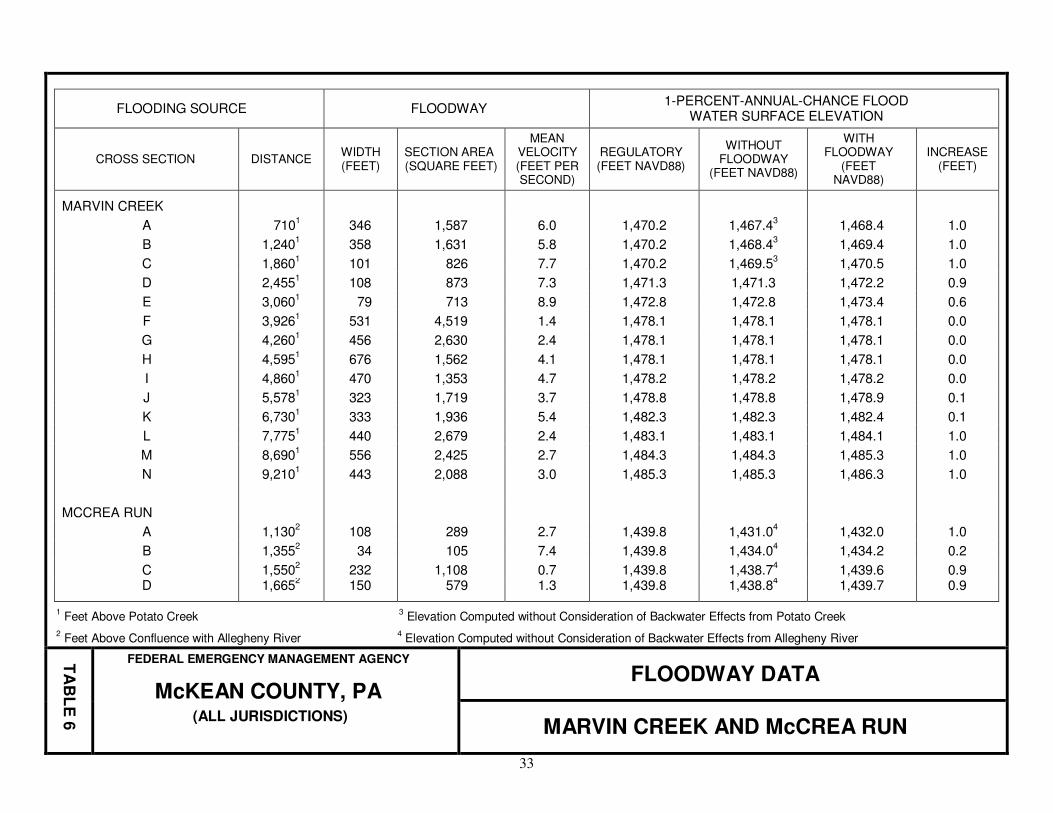
33
FLOODING SOURCE FLOODWAY 1-PERCENT-ANNUAL-CHANCE FLOOD
WATER SURFACE ELEVATION
CROSS SECTION DISTANCE WIDTH (FEET)
SECTION AREA (SQUARE FEET)
MEAN VELOCITY (FEET PER SECOND)
REGULATORY (FEET NAVD88)
WITHOUT FLOODWAY
(FEET NAVD88)
WITH FLOODWAY
(FEET NAVD88)
INCREASE (FEET)
MARVIN CREEK
A 7101 346 1,587 6.0 1,470.2 1,467.4
3 1,468.4 1.0
B 1,2401 358 1,631 5.8 1,470.2 1,468.4
3 1,469.4 1.0
C 1,8601 101 826 7.7 1,470.2 1,469.5
3 1,470.5 1.0
D 2,4551 108 873 7.3 1,471.3 1,471.3 1,472.2 0.9
E 3,0601 79 713 8.9 1,472.8 1,472.8 1,473.4 0.6
F 3,9261 531 4,519 1.4 1,478.1 1,478.1 1,478.1 0.0
G 4,2601 456 2,630 2.4 1,478.1 1,478.1 1,478.1 0.0
H 4,5951 676 1,562 4.1 1,478.1 1,478.1 1,478.1 0.0
I 4,8601 470 1,353 4.7 1,478.2 1,478.2 1,478.2 0.0
J 5,5781 323 1,719 3.7 1,478.8 1,478.8 1,478.9 0.1
K 6,7301 333 1,936 5.4 1,482.3 1,482.3 1,482.4 0.1
L 7,7751 440 2,679 2.4 1,483.1 1,483.1 1,484.1 1.0
M 8,6901 556 2,425 2.7 1,484.3 1,484.3 1,485.3 1.0
N 9,2101 443 2,088 3.0 1,485.3 1,485.3 1,486.3 1.0
MCCREA RUN
A 1,1302 108 289 2.7 1,439.8 1,431.0
4 1,432.0 1.0
B 1,3552 34 105 7.4 1,439.8 1,434.0
4 1,434.2 0.2
C 1,5502 232 1,108 0.7 1,439.8 1,438.7
4 1,439.6 0.9
D 1,6652 150 579 1.3 1,439.8 1,438.8
4 1,439.7 0.9
1 Feet Above Potato Creek
3 Elevation Computed without Consideration of Backwater Effects from Potato Creek
2 Feet Above Confluence with Allegheny River
4 Elevation Computed without Consideration of Backwater Effects from Allegheny River
TA
BL
E 6
FEDERAL EMERGENCY MANAGEMENT AGENCY
McKEAN COUNTY, PA (ALL JURISDICTIONS)
FLOODWAY DATA
MARVIN CREEK AND McCREA RUN

34
FLOODING SOURCE FLOODWAY 1-PERCENT-ANNUAL-CHANCE FLOOD
WATER SURFACE ELEVATION
CROSS SECTION DISTANCE WIDTH (FEET)
SECTION AREA
(SQUARE FEET)
MEAN VELOCITY (FEET PER SECOND)
REGULATORY (FEET NAVD88)
WITHOUT FLOODWAY
(FEET NAVD88)
WITH FLOODWAY
(FEET NAVD88)
INCREASE (FEET)
MCCREA RUN (Continued)
E 2,0851 21 73 10.7 1,442.1 1,442.1 1,442.1 0.0
F 2,7151 21 88 8.8 1,450.8 1,450.8 1,451.1 0.3
G 3,4201 30 82 9.5 1,459.8 1,459.8 1,459.8 0.0
MILLER BROOK
A 3602 48 139 3.7 1,470.4 1,466.2
3 1,466.2 0.0
B 2,0302 20 89 5.7 1,481.4 1,481.4 1,482.0 0.6
C 2,3952 29 103 4.9 1,487.4 1,487.4 1,488.0 0.6
MIX CREEK
A 6401 25 156 8.2 1,443.0 1,430.3
4 1,430.4 0.1
B 7701 277 1,179 1.1 1,443.0 1,431.8
4 1,431.9 0.1
C 1,0201 146 405 3.2 1,443.0 1,432.0
4 1,432.0 0.0
D 1,2911 25 98 13.1 1,443.0 1,433.5
4 1,433.5 0.0
E 1,6151 62 237 5.4 1,443.0 1,434.5
4 1,435.5 1.0
F 1,8871 13 103 12.5 1,443.0 1,440.2
4 1,440.2 0.0
G 2,0301 135 958 1.3 1,443.0 1,441.9
4 1,442.7 0.8
H 2,6301 66 207 6.2 1,443.0 1,442.9
4 1,443.1 0.2
I 3,4351 25 108 11.9 1,450.3 1,450.3 1,450.3 0.0
J 4,2201 16 99 12.9 1,457.3 1,457.3 1,457.8 0.5
1 Feet Above Confluence with Allegheny River
3 Elevation Computed without Consideration of Backwater Effects from Potato Creek
2 Feet Above Confluence with Potato Creek
4 Elevation Computed without Consideration of Backwater Effects from Allegheny River
TA
BL
E 6
FEDERAL EMERGENCY MANAGEMENT AGENCY
McKEAN COUNTY, PA (ALL JURISDICTIONS)
FLOODWAY DATA
McCREA RUN, MILLER BROOK, AND MIX CREEK
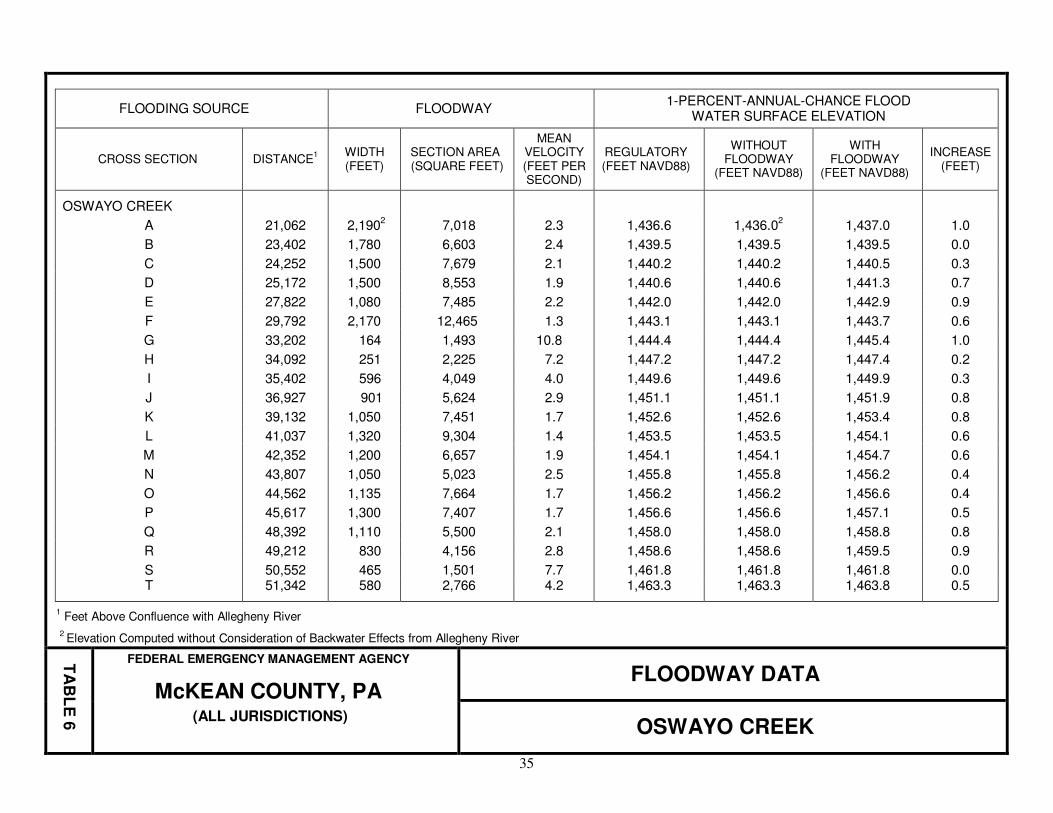
35
FLOODING SOURCE FLOODWAY 1-PERCENT-ANNUAL-CHANCE FLOOD
WATER SURFACE ELEVATION
CROSS SECTION DISTANCE1 WIDTH
(FEET) SECTION AREA (SQUARE FEET)
MEAN VELOCITY (FEET PER SECOND)
REGULATORY (FEET NAVD88)
WITHOUT FLOODWAY
(FEET NAVD88)
WITH FLOODWAY
(FEET NAVD88)
INCREASE (FEET)
OSWAYO CREEK
A 21,062 2,1902 7,018 2.3 1,436.6 1,436.0
2 1,437.0 1.0
B 23,402 1,780 6,603 2.4 1,439.5 1,439.5 1,439.5 0.0
C 24,252 1,500 7,679 2.1 1,440.2 1,440.2 1,440.5 0.3
D 25,172 1,500 8,553 1.9 1,440.6 1,440.6 1,441.3 0.7
E 27,822 1,080 7,485 2.2 1,442.0 1,442.0 1,442.9 0.9
F 29,792 2,170 12,465 1.3 1,443.1 1,443.1 1,443.7 0.6
G 33,202 164 1,493 10.8 1,444.4 1,444.4 1,445.4 1.0
H 34,092 251 2,225 7.2 1,447.2 1,447.2 1,447.4 0.2
I 35,402 596 4,049 4.0 1,449.6 1,449.6 1,449.9 0.3
J 36,927 901 5,624 2.9 1,451.1 1,451.1 1,451.9 0.8
K 39,132 1,050 7,451 1.7 1,452.6 1,452.6 1,453.4 0.8
L 41,037 1,320 9,304 1.4 1,453.5 1,453.5 1,454.1 0.6
M 42,352 1,200 6,657 1.9 1,454.1 1,454.1 1,454.7 0.6
N 43,807 1,050 5,023 2.5 1,455.8 1,455.8 1,456.2 0.4
O 44,562 1,135 7,664 1.7 1,456.2 1,456.2 1,456.6 0.4
P 45,617 1,300 7,407 1.7 1,456.6 1,456.6 1,457.1 0.5
Q 48,392 1,110 5,500 2.1 1,458.0 1,458.0 1,458.8 0.8
R 49,212 830 4,156 2.8 1,458.6 1,458.6 1,459.5 0.9
S 50,552 465 1,501 7.7 1,461.8 1,461.8 1,461.8 0.0 T 51,342 580 2,766 4.2 1,463.3 1,463.3 1,463.8 0.5
1 Feet Above Confluence with Allegheny River
2 Elevation Computed without Consideration of Backwater Effects from Allegheny River
TA
BL
E 6
FEDERAL EMERGENCY MANAGEMENT AGENCY
McKEAN COUNTY, PA (ALL JURISDICTIONS)
FLOODWAY DATA
OSWAYO CREEK

36
FLOODING SOURCE FLOODWAY 1-PERCENT-ANNUAL-CHANCE FLOOD
WATER SURFACE ELEVATION
CROSS SECTION DISTANCE1
WIDTH (FEET)
SECTION AREA (SQUARE FEET)
MEAN VELOCITY (FEET PER SECOND)
REGULATORY (FEET NAVD88)
WITHOUT FLOODWAY
(FEET NAVD88)
WITH FLOODWAY
(FEET NAVD88)
INCREASE (FEET)
OSWAYO CREEK (Continued)
U 52,672 800 3,500 3.3 1,466.0 1,466.0 1,466.2 0.2
V 53,692 700 2,477 4.6 1,467.2 1,467.2 1,467.5 0.3
W 54,912 500 3,679 3.1 1,469.8 1,469.8 1,469.9 0.1
X 55,947 380 3,138 3.7 1,470.1 1,470.1 1,470.1 0.0
POTATO CREEK
A 100 1,963 11,937 2.1 1,447.7 1,439.12 1,440.1 1.0
B 620 2,016 13,151 1.9 1,447.7 1,439.52 1,440.5 1.0
C 2,935 2,119 12,284 2.1 1,447.7 1,440.52 1,441.4 0.9
D 6,600 2,158 14,542 1.7 1,447.7 1,442.52 1,443.4 0.9
E 62,716 1,615 10,673 3.4 1,466.6 1,466.6 1,467.6 1.0
F 63,296 1,765 10,287 3.9 1,467.1 1,467.1 1,468.1 1.0
G 63,966 1,342 8,005 4.8 1,467.7 1,467.7 1,468.7 1.0
H 64,466 927 6,506 5.5 1,468.3 1,468.3 1,469.3 1.0
I 66,161 1,008 7,660 3.1 1,471.7 1,471.7 1,472.4 0.7
J 66,936 987 7,175 3.2 1,472.0 1,472.0 1,472.8 0.8
K 67,876 1,020 5,996 3.9 1,472.5 1,472.5 1,473.4 0.9
L 68,646 890 5,422 4.3 1,473.1 1,473.1 1,474.1 1.0
M 69,386 512 3,654 5.5 1,473.9 1,473.9 1,474.9 1.0
1 Feet Above Confluence with Allegheny River
2 Elevation Computed without Consideration of Backwater Effects from Allegheny River
TA
BL
E 6
FEDERAL EMERGENCY MANAGEMENT AGENCY
McKEAN COUNTY, PA (ALL JURISDICTIONS)
FLOODWAY DATA
OSWAYO CREEK AND POTATO CREEK
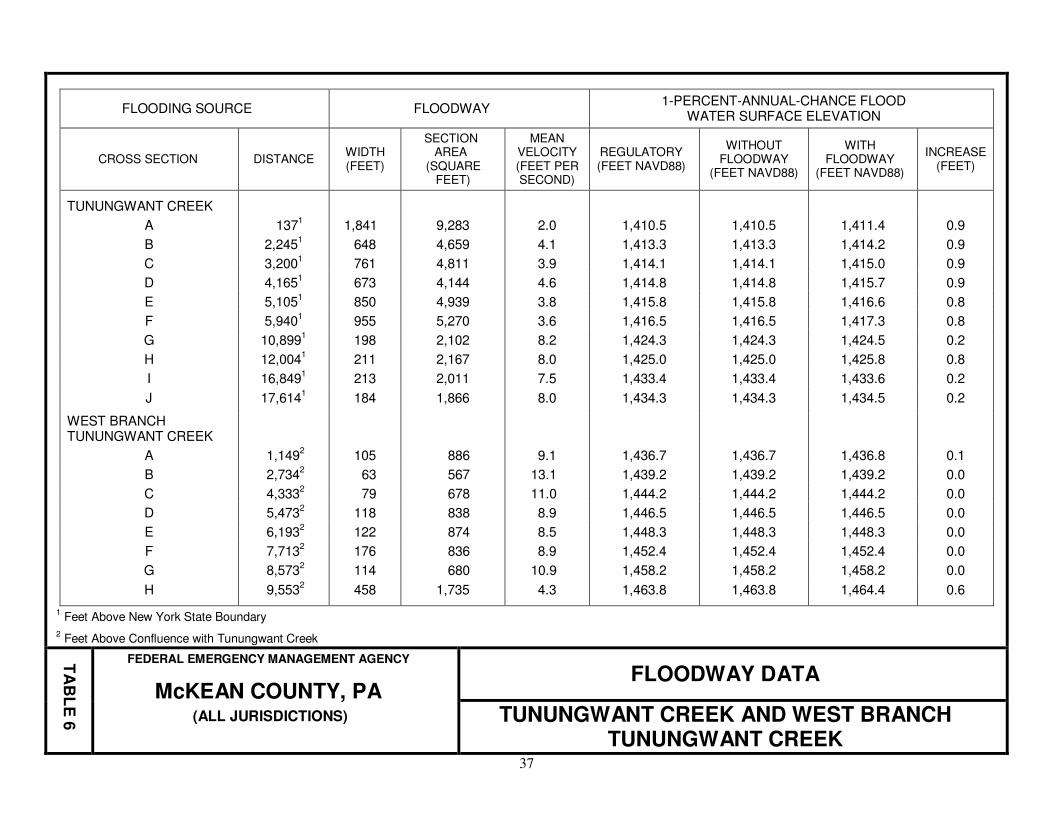
37
FLOODING SOURCE FLOODWAY 1-PERCENT-ANNUAL-CHANCE FLOOD
WATER SURFACE ELEVATION
CROSS SECTION DISTANCE WIDTH (FEET)
SECTION AREA
(SQUARE FEET)
MEAN VELOCITY (FEET PER SECOND)
REGULATORY (FEET NAVD88)
WITHOUT FLOODWAY
(FEET NAVD88)
WITH FLOODWAY
(FEET NAVD88)
INCREASE (FEET)
TUNUNGWANT CREEK
A 1371 1,841 9,283 2.0 1,410.5 1,410.5 1,411.4 0.9
B 2,2451 648 4,659 4.1 1,413.3 1,413.3 1,414.2 0.9
C 3,2001 761 4,811 3.9 1,414.1 1,414.1 1,415.0 0.9
D 4,1651 673 4,144 4.6 1,414.8 1,414.8 1,415.7 0.9
E 5,1051 850 4,939 3.8 1,415.8 1,415.8 1,416.6 0.8
F 5,9401 955 5,270 3.6 1,416.5 1,416.5 1,417.3 0.8
G 10,8991 198 2,102 8.2 1,424.3 1,424.3 1,424.5 0.2
H 12,0041 211 2,167 8.0 1,425.0 1,425.0 1,425.8 0.8
I 16,8491 213 2,011 7.5 1,433.4 1,433.4 1,433.6 0.2
J 17,6141 184 1,866 8.0 1,434.3 1,434.3 1,434.5 0.2
WEST BRANCH TUNUNGWANT CREEK
A 1,1492 105 886 9.1 1,436.7 1,436.7 1,436.8 0.1
B 2,7342 63 567 13.1 1,439.2 1,439.2 1,439.2 0.0
C 4,3332 79 678 11.0 1,444.2 1,444.2 1,444.2 0.0
D 5,4732 118 838 8.9 1,446.5 1,446.5 1,446.5 0.0
E 6,1932 122 874 8.5 1,448.3 1,448.3 1,448.3 0.0
F 7,7132 176 836 8.9 1,452.4 1,452.4 1,452.4 0.0
G 8,5732 114 680 10.9 1,458.2 1,458.2 1,458.2 0.0
H 9,5532 458 1,735 4.3 1,463.8 1,463.8 1,464.4 0.6
1 Feet Above New York State Boundary
2 Feet Above Confluence with Tunungwant Creek
TA
BL
E 6
FEDERAL EMERGENCY MANAGEMENT AGENCY
McKEAN COUNTY, PA (ALL JURISDICTIONS)
FLOODWAY DATA
TUNUNGWANT CREEK AND WEST BRANCH TUNUNGWANT CREEK
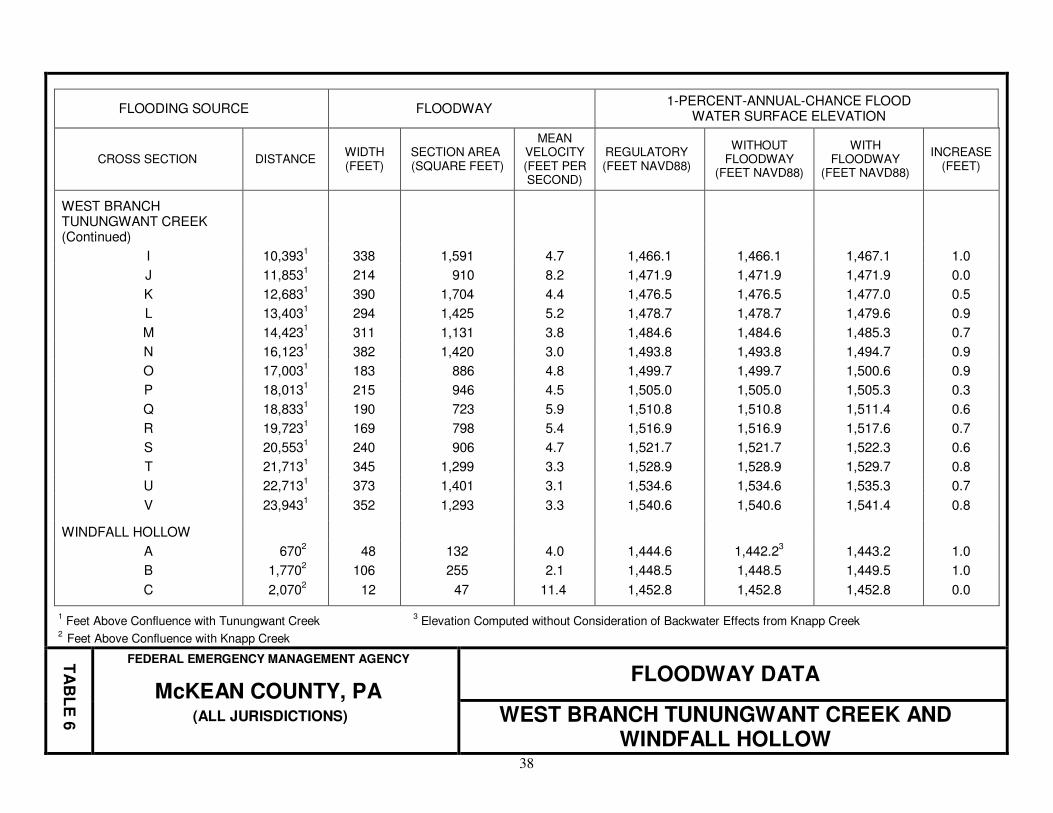
38
FLOODING SOURCE FLOODWAY 1-PERCENT-ANNUAL-CHANCE FLOOD
WATER SURFACE ELEVATION
CROSS SECTION DISTANCE WIDTH (FEET)
SECTION AREA (SQUARE FEET)
MEAN VELOCITY (FEET PER SECOND)
REGULATORY (FEET NAVD88)
WITHOUT FLOODWAY
(FEET NAVD88)
WITH FLOODWAY
(FEET NAVD88)
INCREASE (FEET)
WEST BRANCH TUNUNGWANT CREEK (Continued)
I 10,3931 338 1,591 4.7 1,466.1 1,466.1 1,467.1 1.0
J 11,8531 214 910 8.2 1,471.9 1,471.9 1,471.9 0.0
K 12,6831 390 1,704 4.4 1,476.5 1,476.5 1,477.0 0.5
L 13,4031 294 1,425 5.2 1,478.7 1,478.7 1,479.6 0.9
M 14,4231 311 1,131 3.8 1,484.6 1,484.6 1,485.3 0.7
N 16,1231 382 1,420 3.0 1,493.8 1,493.8 1,494.7 0.9
O 17,0031 183 886 4.8 1,499.7 1,499.7 1,500.6 0.9
P 18,0131 215 946 4.5 1,505.0 1,505.0 1,505.3 0.3
Q 18,8331 190 723 5.9 1,510.8 1,510.8 1,511.4 0.6
R 19,7231 169 798 5.4 1,516.9 1,516.9 1,517.6 0.7
S 20,5531 240 906 4.7 1,521.7 1,521.7 1,522.3 0.6
T 21,7131 345 1,299 3.3 1,528.9 1,528.9 1,529.7 0.8
U 22,7131 373 1,401 3.1 1,534.6 1,534.6 1,535.3 0.7
V 23,9431 352 1,293 3.3 1,540.6 1,540.6 1,541.4 0.8
WINDFALL HOLLOW
A 6702 48 132 4.0 1,444.6 1,442.2
3 1,443.2 1.0
B 1,7702 106 255 2.1 1,448.5 1,448.5 1,449.5 1.0
C 2,0702 12 47 11.4 1,452.8 1,452.8 1,452.8 0.0
1 Feet Above Confluence with Tunungwant Creek
3 Elevation Computed without Consideration of Backwater Effects from Knapp Creek
2 Feet Above Confluence with Knapp Creek
TA
BL
E 6
FEDERAL EMERGENCY MANAGEMENT AGENCY
McKEAN COUNTY, PA (ALL JURISDICTIONS)
FLOODWAY DATA
WEST BRANCH TUNUNGWANT CREEK AND WINDFALL HOLLOW
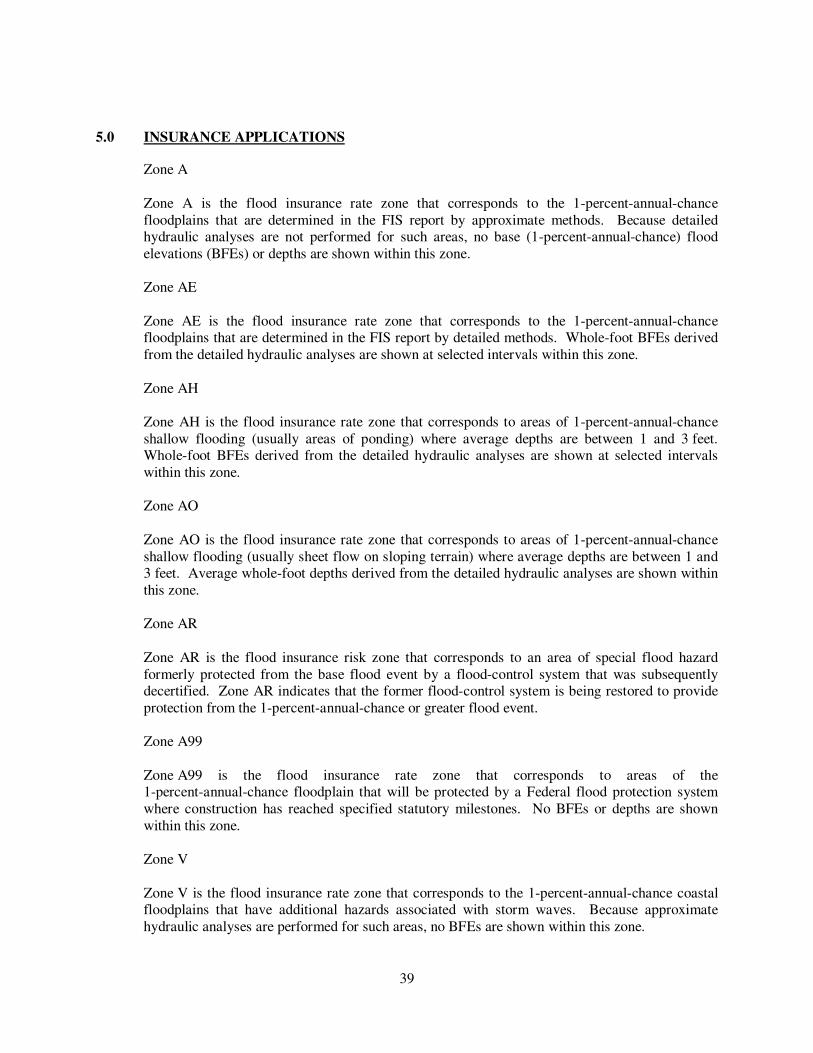
39
5.0 INSURANCE APPLICATIONS
Zone A
Zone A is the flood insurance rate zone that corresponds to the 1-percent-annual-chance
floodplains that are determined in the FIS report by approximate methods. Because detailed hydraulic analyses are not performed for such areas, no base (1-percent-annual-chance) flood
elevations (BFEs) or depths are shown within this zone.
Zone AE
Zone AE is the flood insurance rate zone that corresponds to the 1-percent-annual-chance floodplains that are determined in the FIS report by detailed methods. Whole-foot BFEs derived
from the detailed hydraulic analyses are shown at selected intervals within this zone.
Zone AH
Zone AH is the flood insurance rate zone that corresponds to areas of 1-percent-annual-chance
shallow flooding (usually areas of ponding) where average depths are between 1 and 3 feet. Whole-foot BFEs derived from the detailed hydraulic analyses are shown at selected intervals
within this zone.
Zone AO
Zone AO is the flood insurance rate zone that corresponds to areas of 1-percent-annual-chance
shallow flooding (usually sheet flow on sloping terrain) where average depths are between 1 and 3 feet. Average whole-foot depths derived from the detailed hydraulic analyses are shown within
this zone.
Zone AR
Zone AR is the flood insurance risk zone that corresponds to an area of special flood hazard
formerly protected from the base flood event by a flood-control system that was subsequently decertified. Zone AR indicates that the former flood-control system is being restored to provide
protection from the 1-percent-annual-chance or greater flood event.
Zone A99
Zone A99 is the flood insurance rate zone that corresponds to areas of the 1-percent-annual-chance floodplain that will be protected by a Federal flood protection system
where construction has reached specified statutory milestones. No BFEs or depths are shown
within this zone.
Zone V
Zone V is the flood insurance rate zone that corresponds to the 1-percent-annual-chance coastal floodplains that have additional hazards associated with storm waves. Because approximate
hydraulic analyses are performed for such areas, no BFEs are shown within this zone.
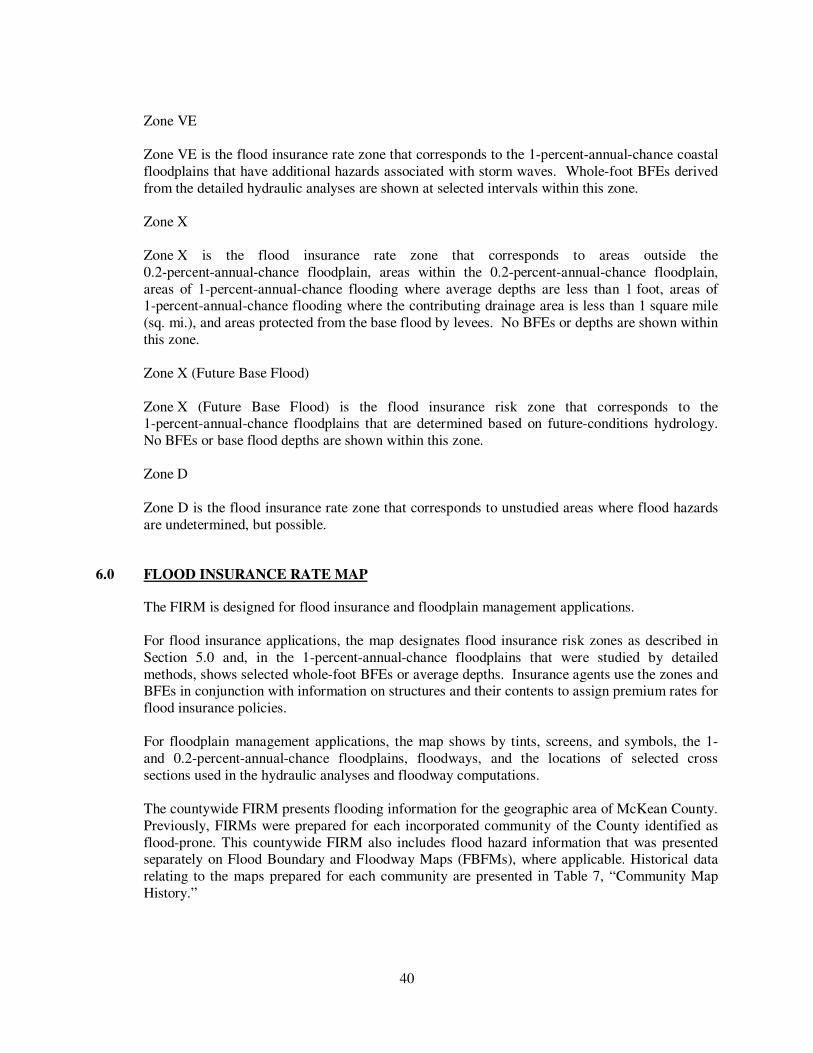
40
Zone VE
Zone VE is the flood insurance rate zone that corresponds to the 1-percent-annual-chance coastal
floodplains that have additional hazards associated with storm waves. Whole-foot BFEs derived
from the detailed hydraulic analyses are shown at selected intervals within this zone.
Zone X
Zone X is the flood insurance rate zone that corresponds to areas outside the
0.2-percent-annual-chance floodplain, areas within the 0.2-percent-annual-chance floodplain,
areas of 1-percent-annual-chance flooding where average depths are less than 1 foot, areas of 1-percent-annual-chance flooding where the contributing drainage area is less than 1 square mile
(sq. mi.), and areas protected from the base flood by levees. No BFEs or depths are shown within
this zone.
Zone X (Future Base Flood)
Zone X (Future Base Flood) is the flood insurance risk zone that corresponds to the 1-percent-annual-chance floodplains that are determined based on future-conditions hydrology.
No BFEs or base flood depths are shown within this zone.
Zone D
Zone D is the flood insurance rate zone that corresponds to unstudied areas where flood hazards
are undetermined, but possible.
6.0 FLOOD INSURANCE RATE MAP
The FIRM is designed for flood insurance and floodplain management applications.
For flood insurance applications, the map designates flood insurance risk zones as described in
Section 5.0 and, in the 1-percent-annual-chance floodplains that were studied by detailed
methods, shows selected whole-foot BFEs or average depths. Insurance agents use the zones and BFEs in conjunction with information on structures and their contents to assign premium rates for
flood insurance policies.
For floodplain management applications, the map shows by tints, screens, and symbols, the 1-
and 0.2-percent-annual-chance floodplains, floodways, and the locations of selected cross
sections used in the hydraulic analyses and floodway computations.
The countywide FIRM presents flooding information for the geographic area of McKean County.
Previously, FIRMs were prepared for each incorporated community of the County identified as
flood-prone. This countywide FIRM also includes flood hazard information that was presented separately on Flood Boundary and Floodway Maps (FBFMs), where applicable. Historical data
relating to the maps prepared for each community are presented in Table 7, “Community Map
History.”
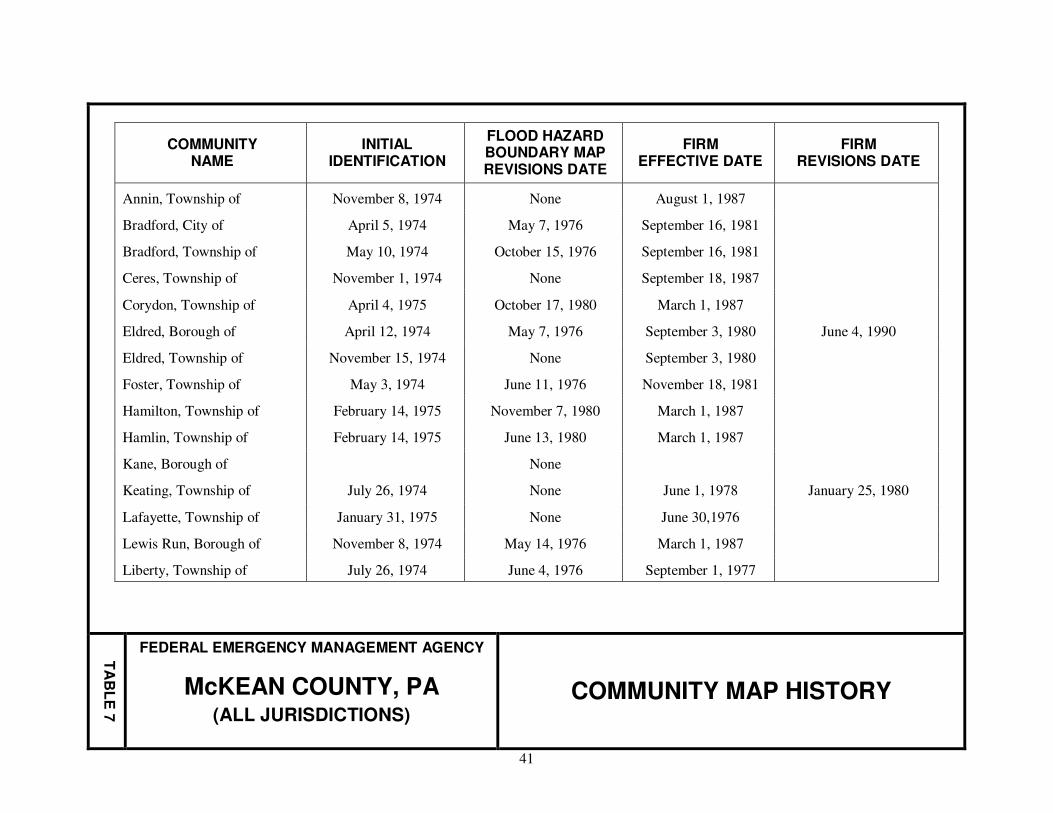
41
Table 27 – Community Map History
COMMUNITY NAME
INITIAL IDENTIFICATION
FLOOD HAZARD BOUNDARY MAP REVISIONS DATE
FIRM EFFECTIVE DATE
FIRM REVISIONS DATE
Annin, Township of November 8, 1974 None August 1, 1987
Bradford, City of April 5, 1974 May 7, 1976 September 16, 1981
Bradford, Township of May 10, 1974 October 15, 1976 September 16, 1981
Ceres, Township of November 1, 1974 None September 18, 1987
Corydon, Township of April 4, 1975 October 17, 1980 March 1, 1987
Eldred, Borough of April 12, 1974 May 7, 1976 September 3, 1980 June 4, 1990
Eldred, Township of November 15, 1974 None September 3, 1980
Foster, Township of May 3, 1974 June 11, 1976 November 18, 1981
Hamilton, Township of February 14, 1975 November 7, 1980 March 1, 1987
Hamlin, Township of February 14, 1975 June 13, 1980 March 1, 1987
Kane, Borough of None
Keating, Township of July 26, 1974 None June 1, 1978 January 25, 1980
Lafayette, Township of January 31, 1975 None June 30,1976
Lewis Run, Borough of November 8, 1974 May 14, 1976 March 1, 1987
Liberty, Township of July 26, 1974 June 4, 1976 September 1, 1977
TA
BL
E 7
FEDERAL EMERGENCY MANAGEMENT AGENCY
McKEAN COUNTY, PA (ALL JURISDICTIONS)
COMMUNITY MAP HISTORY
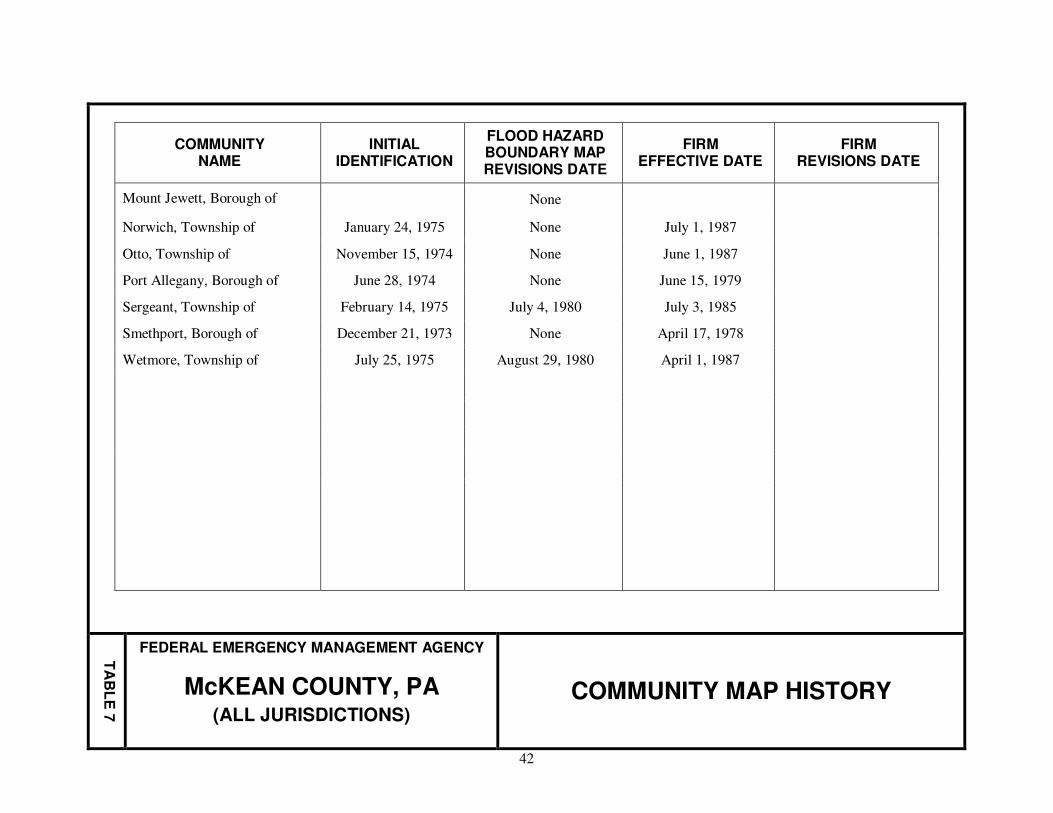
42
COMMUNITY NAME
INITIAL IDENTIFICATION
FLOOD HAZARD BOUNDARY MAP REVISIONS DATE
FIRM EFFECTIVE DATE
FIRM REVISIONS DATE
Mount Jewett, Borough of None
Norwich, Township of January 24, 1975 None July 1, 1987
Otto, Township of November 15, 1974 None June 1, 1987
Port Allegany, Borough of June 28, 1974 None June 15, 1979
Sergeant, Township of February 14, 1975 July 4, 1980 July 3, 1985
Smethport, Borough of December 21, 1973 None April 17, 1978
Wetmore, Township of July 25, 1975 August 29, 1980 April 1, 1987
TA
BL
E 7
FEDERAL EMERGENCY MANAGEMENT AGENCY
McKEAN COUNTY, PA (ALL JURISDICTIONS)
COMMUNITY MAP HISTORY
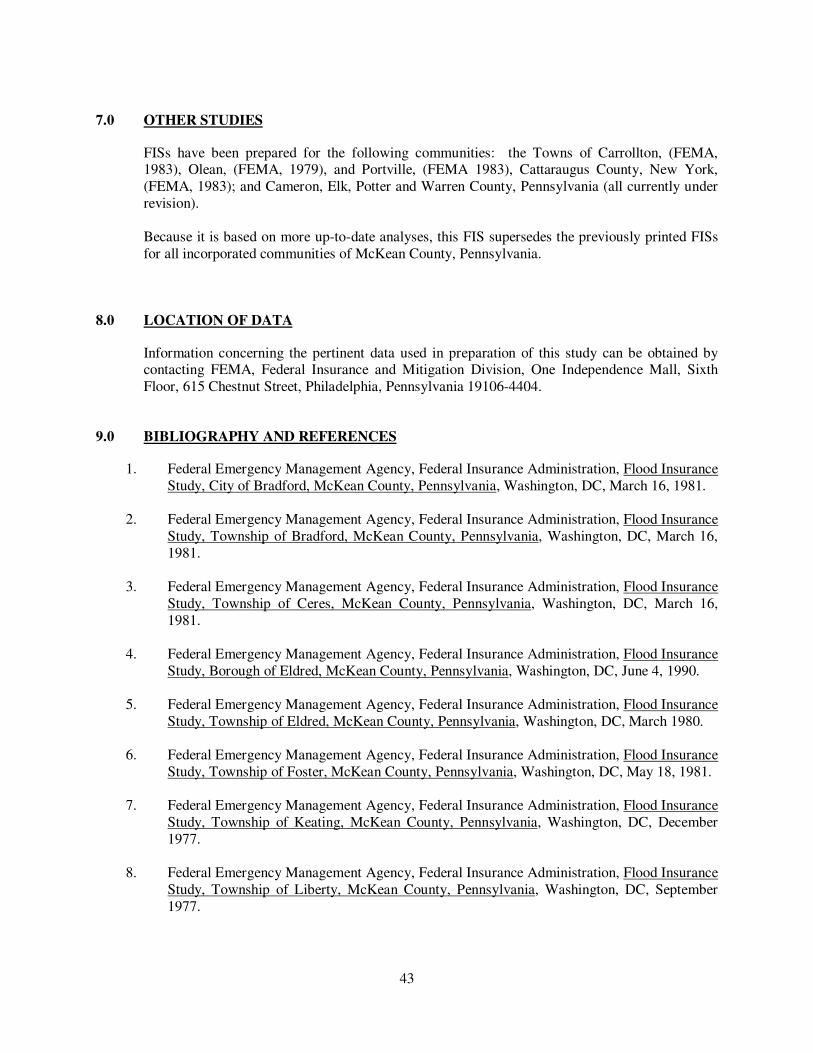
43
7.0 OTHER STUDIES
FISs have been prepared for the following communities: the Towns of Carrollton, (FEMA, 1983), Olean, (FEMA, 1979), and Portville, (FEMA 1983), Cattaraugus County, New York,
(FEMA, 1983); and Cameron, Elk, Potter and Warren County, Pennsylvania (all currently under
revision).
Because it is based on more up-to-date analyses, this FIS supersedes the previously printed FISs
for all incorporated communities of McKean County, Pennsylvania.
8.0 LOCATION OF DATA
Information concerning the pertinent data used in preparation of this study can be obtained by contacting FEMA, Federal Insurance and Mitigation Division, One Independence Mall, Sixth
Floor, 615 Chestnut Street, Philadelphia, Pennsylvania 19106-4404.
9.0 BIBLIOGRAPHY AND REFERENCES
1. Federal Emergency Management Agency, Federal Insurance Administration, Flood Insurance
Study, City of Bradford, McKean County, Pennsylvania, Washington, DC, March 16, 1981.
2. Federal Emergency Management Agency, Federal Insurance Administration, Flood Insurance
Study, Township of Bradford, McKean County, Pennsylvania, Washington, DC, March 16,
1981.
3. Federal Emergency Management Agency, Federal Insurance Administration, Flood Insurance
Study, Township of Ceres, McKean County, Pennsylvania, Washington, DC, March 16,
1981.
4. Federal Emergency Management Agency, Federal Insurance Administration, Flood Insurance
Study, Borough of Eldred, McKean County, Pennsylvania, Washington, DC, June 4, 1990.
5. Federal Emergency Management Agency, Federal Insurance Administration, Flood Insurance
Study, Township of Eldred, McKean County, Pennsylvania, Washington, DC, March 1980.
6. Federal Emergency Management Agency, Federal Insurance Administration, Flood Insurance
Study, Township of Foster, McKean County, Pennsylvania, Washington, DC, May 18, 1981.
7. Federal Emergency Management Agency, Federal Insurance Administration, Flood Insurance
Study, Township of Keating, McKean County, Pennsylvania, Washington, DC, December
1977.
8. Federal Emergency Management Agency, Federal Insurance Administration, Flood Insurance
Study, Township of Liberty, McKean County, Pennsylvania, Washington, DC, September
1977.
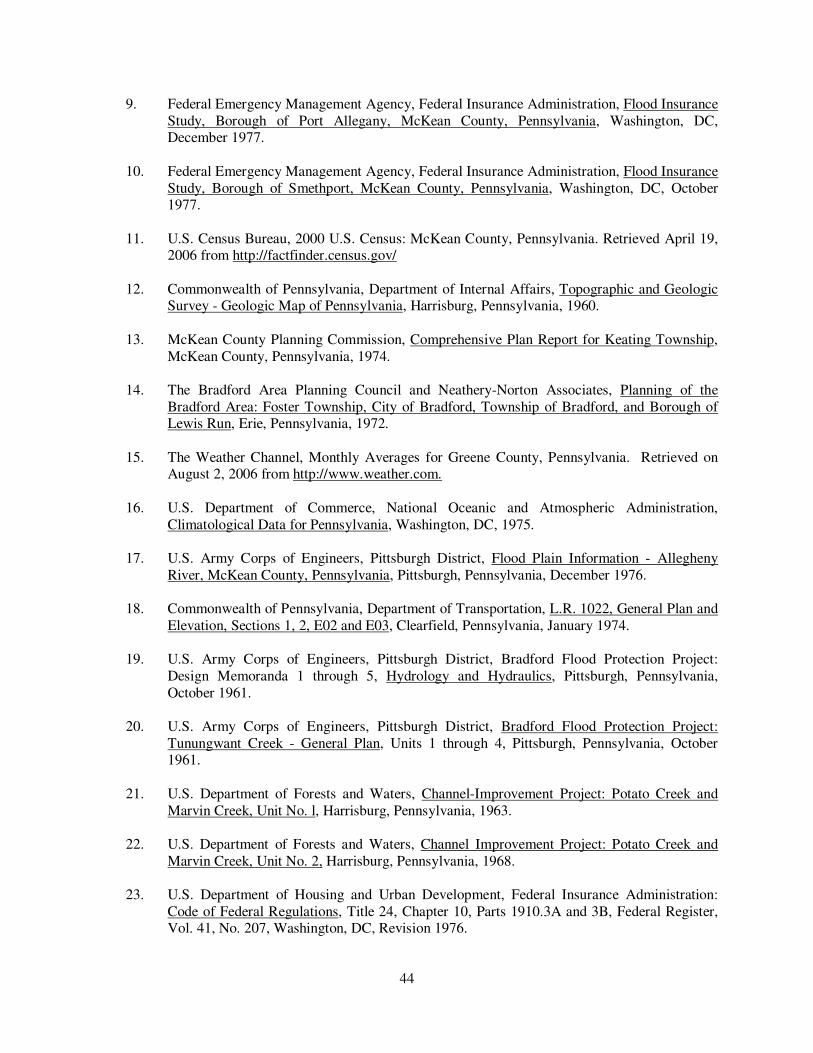
44
9. Federal Emergency Management Agency, Federal Insurance Administration, Flood Insurance
Study, Borough of Port Allegany, McKean County, Pennsylvania, Washington, DC, December 1977.
10. Federal Emergency Management Agency, Federal Insurance Administration, Flood Insurance
Study, Borough of Smethport, McKean County, Pennsylvania, Washington, DC, October 1977.
11. U.S. Census Bureau, 2000 U.S. Census: McKean County, Pennsylvania. Retrieved April 19, 2006 from http://factfinder.census.gov/
12. Commonwealth of Pennsylvania, Department of Internal Affairs, Topographic and Geologic Survey - Geologic Map of Pennsylvania, Harrisburg, Pennsylvania, 1960.
13. McKean County Planning Commission, Comprehensive Plan Report for Keating Township,
McKean County, Pennsylvania, 1974.
14. The Bradford Area Planning Council and Neathery-Norton Associates, Planning of the
Bradford Area: Foster Township, City of Bradford, Township of Bradford, and Borough of Lewis Run, Erie, Pennsylvania, 1972.
15. The Weather Channel, Monthly Averages for Greene County, Pennsylvania. Retrieved on August 2, 2006 from http://www.weather.com.
16. U.S. Department of Commerce, National Oceanic and Atmospheric Administration,
Climatological Data for Pennsylvania, Washington, DC, 1975.
17. U.S. Army Corps of Engineers, Pittsburgh District, Flood Plain Information - Allegheny
River, McKean County, Pennsylvania, Pittsburgh, Pennsylvania, December 1976.
18. Commonwealth of Pennsylvania, Department of Transportation, L.R. 1022, General Plan and
Elevation, Sections 1, 2, E02 and E03, Clearfield, Pennsylvania, January 1974.
19. U.S. Army Corps of Engineers, Pittsburgh District, Bradford Flood Protection Project:
Design Memoranda 1 through 5, Hydrology and Hydraulics, Pittsburgh, Pennsylvania,
October 1961.
20. U.S. Army Corps of Engineers, Pittsburgh District, Bradford Flood Protection Project:
Tunungwant Creek - General Plan, Units 1 through 4, Pittsburgh, Pennsylvania, October 1961.
21. U.S. Department of Forests and Waters, Channel-Improvement Project: Potato Creek and
Marvin Creek, Unit No. l, Harrisburg, Pennsylvania, 1963.
22. U.S. Department of Forests and Waters, Channel Improvement Project: Potato Creek and
Marvin Creek, Unit No. 2, Harrisburg, Pennsylvania, 1968.
23. U.S. Department of Housing and Urban Development, Federal Insurance Administration:
Code of Federal Regulations, Title 24, Chapter 10, Parts 1910.3A and 3B, Federal Register, Vol. 41, No. 207, Washington, DC, Revision 1976.

45
24. U.S. Department of the Interior, Geological Survey, Office of Water Data Collection,
Interagency Advisory Committee on Water Data and Water Resources Council, Guidelines for Determining Flood Flow Frequency: Bulletin No. 17, Washington, DC, 1976.
25. U.S. Department of the Interior, Geological Survey, Magnitude and Frequency of Floods in
the United States, Part 3-A. Ohio River Basin Except Cumberland and Tennessee River Basins, Water Supply Paper 1575, Washington, DC, 1950.
26. U.S. Department of the Interior, Geological Survey, Water Resources Data for Pennsylvania, Part 1, Surface Water Records, Harrisburg, Pennsylvania, 1951-1975.
27. Commonwealth of Pennsylvania, Department of Environmental Resources, Flood Plain Information: Allegheny River, McKean County, Pennsylvania, Harrisburg, Pennsylvania,
December 1976.
28. Commonwealth of Pennsylvania, Department of Transportation, Design Manual, Part 2, Chapter 12, Division 2, Harrisburg, Pennsylvania, December 1971.
29. U.S. Department of Agriculture, Soil Conservation Service, National Engineering Handbook: Section 4 Hydrology, Washington, DC, August 1972.
30. Kerr, R. L., King, Y. P., McGinnis, D. F., Reich, B. M. and White, E. L., The Pennsylvania State University, Institute for Research on Land and Water Resources, PSU III Flood Peak
Frequency Design Manual, University Park, Pennsylvania, 1971.
31. Flippo Jr., Herbert N., Commonwealth of Pennsylvania Department of Environmental Resources, Water Resources Bulletin No. 13, Floods in Pennsylvania, A Manual for
Estimation of their Magnitude and Frequency, Harrisburg, Pennsylvania, October 1977.
32. U.S. Department of the Interior, Bureau of Reclamation, Design of Small Dams, Second
Edition, Washington, DC, 1973.
33. Aron, Dert et al., Commonwealth of Pennsylvania Department of Transportation, Procedure PSU IV for Estimating Design Flood Peaks on Ungaged Pennsylvania Watersheds,
Harrisburg, Pennsylvania, April 1981.
34. Commonwealth of Pennsylvania, Department of Environmental Resources, Floods in
Pennsylvania, Harrisburg, Pennsylvania, October 1977.
35. Federal Emergency Management Agency, Flood Insurance Study: Town of Portville,
Cattaraugus County, New York, Washington, DC, July 18, 1983.
36. U.S. Department of Agriculture, Soil Conservation Service, Technical Release No. 20: Computer Program, Project Formulation, and Hydrology, Washington, DC, 1965.
37. U.S. Army Corps of Engineers, Flow Frequency Determination of Ungaged Streams in the Upper Ohio River Basin, Pittsburgh, Pennsylvania, April 1977.
38. U. S. Army Corps of Engineers, Hydrologic Engineering Center, HEC-2 Water Surface Profiles Generalized Computer Program, Davis, California, October 1973.
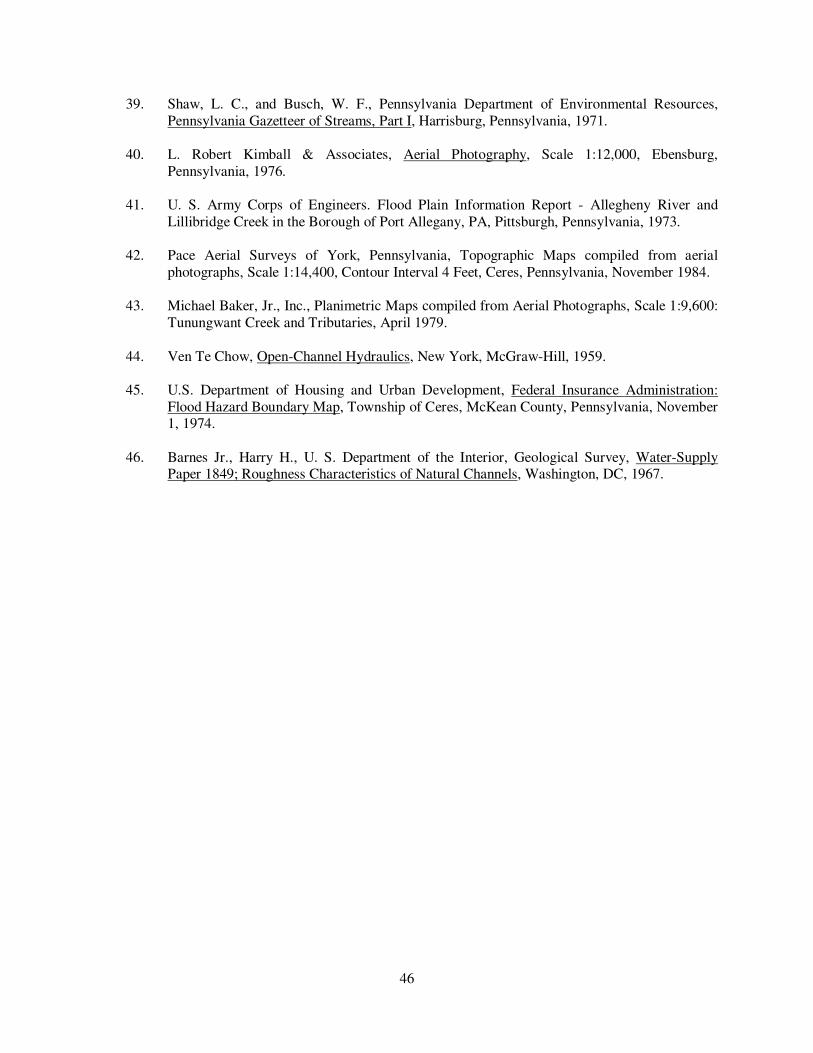
46
39. Shaw, L. C., and Busch, W. F., Pennsylvania Department of Environmental Resources,
Pennsylvania Gazetteer of Streams, Part I, Harrisburg, Pennsylvania, 1971.
40. L. Robert Kimball & Associates, Aerial Photography, Scale 1:12,000, Ebensburg,
Pennsylvania, 1976.
41. U. S. Army Corps of Engineers. Flood Plain Information Report - Allegheny River and
Lillibridge Creek in the Borough of Port Allegany, PA, Pittsburgh, Pennsylvania, 1973.
42. Pace Aerial Surveys of York, Pennsylvania, Topographic Maps compiled from aerial
photographs, Scale 1:14,400, Contour Interval 4 Feet, Ceres, Pennsylvania, November 1984.
43. Michael Baker, Jr., Inc., Planimetric Maps compiled from Aerial Photographs, Scale 1:9,600:
Tunungwant Creek and Tributaries, April 1979.
44. Ven Te Chow, Open-Channel Hydraulics, New York, McGraw-Hill, 1959.
45. U.S. Department of Housing and Urban Development, Federal Insurance Administration:
Flood Hazard Boundary Map, Township of Ceres, McKean County, Pennsylvania, November 1, 1974.
46. Barnes Jr., Harry H., U. S. Department of the Interior, Geological Survey, Water-Supply Paper 1849; Roughness Characteristics of Natural Channels, Washington, DC, 1967.
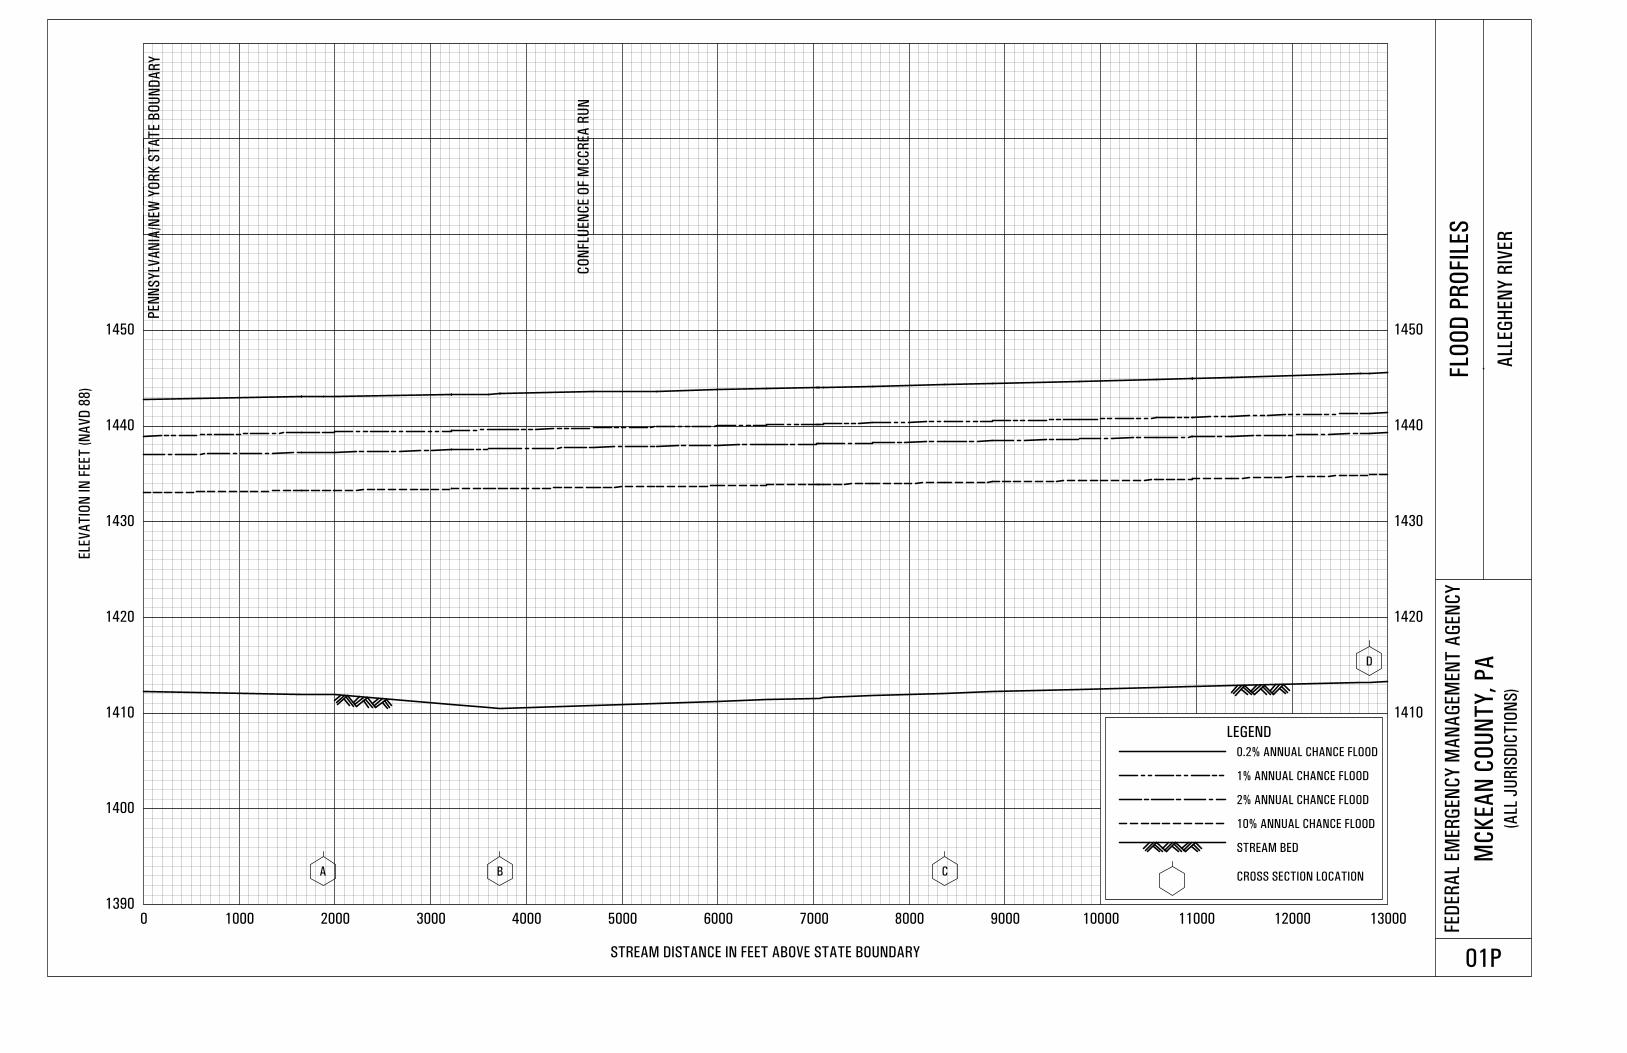
1390
1400
1410 1410
1420 1420
1430 1430
1440 1440
1450 1450
0 1000 2000 3000 4000 5000 6000 7000 8000 9000 10000 11000 12000 13000
ELE
VA
TIO
N IN
FEET
(N
AV
D 8
8)
STREAM DISTANCE IN FEET ABOVE STATE BOUNDARY
FED
ER
AL
EM
ER
GEN
CY
MA
NA
GEM
EN
T A
GEN
CY
MC
KEA
N C
OU
NT
Y,
PA
(ALL
JU
RIS
DIC
TIO
NS
)
FLO
OD
PR
OFIL
ES
ALL
EG
HEN
Y R
IVER
01P
A B C
D
PEN
NS
YLV
AN
IA/N
EW
YO
RK
ST
AT
E B
OU
ND
AR
Y
CO
NFL
UEN
CE O
F M
CC
REA
RU
N
LEGEND
0.2% ANNUAL CHANCE FLOOD
1% ANNUAL CHANCE FLOOD
2% ANNUAL CHANCE FLOOD
10% ANNUAL CHANCE FLOOD
STREAM BED
CROSS SECTION LOCATION
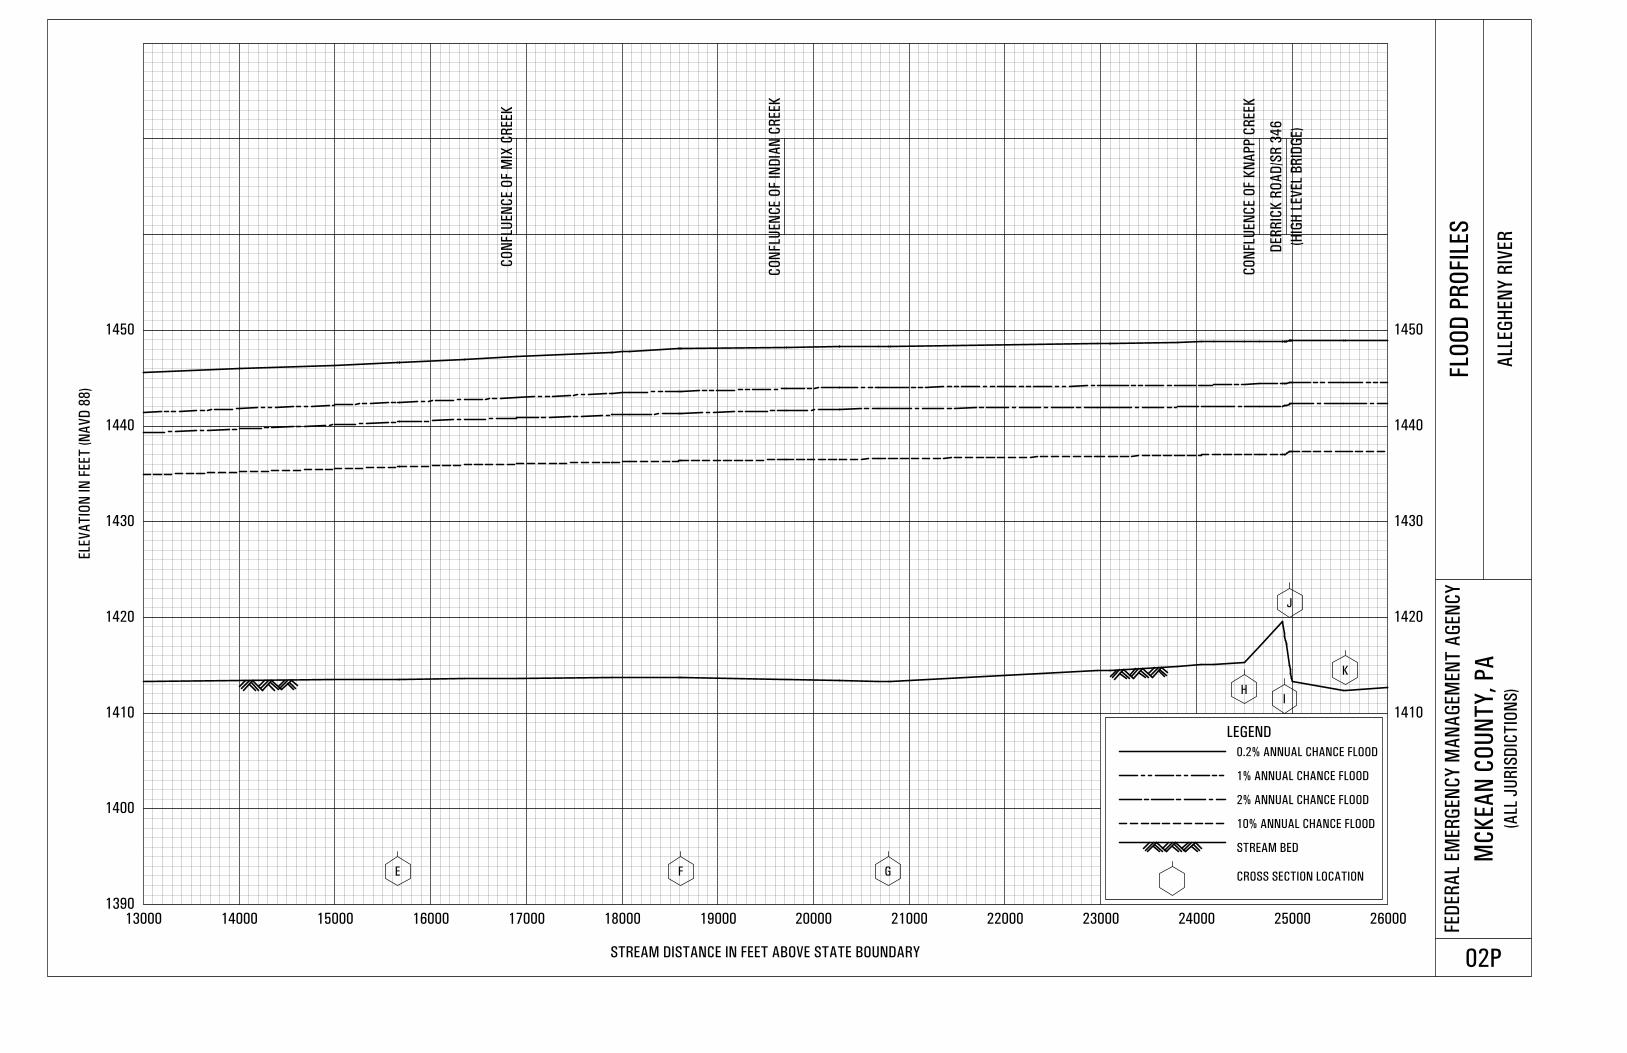
1390
1400
1410 1410
1420 1420
1430 1430
1440 1440
1450 1450
13000 14000 15000 16000 17000 18000 19000 20000 21000 22000 23000 24000 25000 26000
ELE
VA
TIO
N IN
FEET
(N
AV
D 8
8)
STREAM DISTANCE IN FEET ABOVE STATE BOUNDARY
FED
ER
AL
EM
ER
GEN
CY
MA
NA
GEM
EN
T A
GEN
CY
MC
KEA
N C
OU
NT
Y,
PA
(ALL
JU
RIS
DIC
TIO
NS
)
FLO
OD
PR
OFIL
ES
ALL
EG
HEN
Y R
IVER
02P
E F G
HI
J
K
CO
NFLU
EN
CE O
F M
IX C
REEK
CO
NFLU
EN
CE O
F IN
DIA
N C
REEK
CO
NFL
UEN
CE O
F K
NA
PP
CR
EEK
DER
RIC
K R
OA
D/S
R 3
46
LEGEND
0.2% ANNUAL CHANCE FLOOD
1% ANNUAL CHANCE FLOOD
2% ANNUAL CHANCE FLOOD
10% ANNUAL CHANCE FLOOD
STREAM BED
CROSS SECTION LOCATION
(HIG
H L
EV
EL
BR
IDG
E)
1390
1400
1410 1410
1420 1420
1430 1430
1440 1440
1450 1450
26000 27000 28000 29000 30000 31000 32000 33000 34000 35000 36000 37000 38000 39000
ELE
VA
TIO
N IN
FEET
(N
AV
D 8
8)
STREAM DISTANCE IN FEET ABOVE STATE BOUNDARY
FED
ER
AL
EM
ER
GEN
CY
MA
NA
GEM
EN
T A
GEN
CY
MC
KEA
N C
OU
NT
Y,
PA
(ALL
JU
RIS
DIC
TIO
NS
)
FLO
OD
PR
OFIL
ES
ALL
EG
HEN
Y R
IVER
03P
L
M
LEGEND
0.2% ANNUAL CHANCE FLOOD
1% ANNUAL CHANCE FLOOD
2% ANNUAL CHANCE FLOOD
10% ANNUAL CHANCE FLOOD
STREAM BED
CROSS SECTION LOCATION
CO
NFL
UEN
CE O
F B
AR
DEN
BR
OO
K
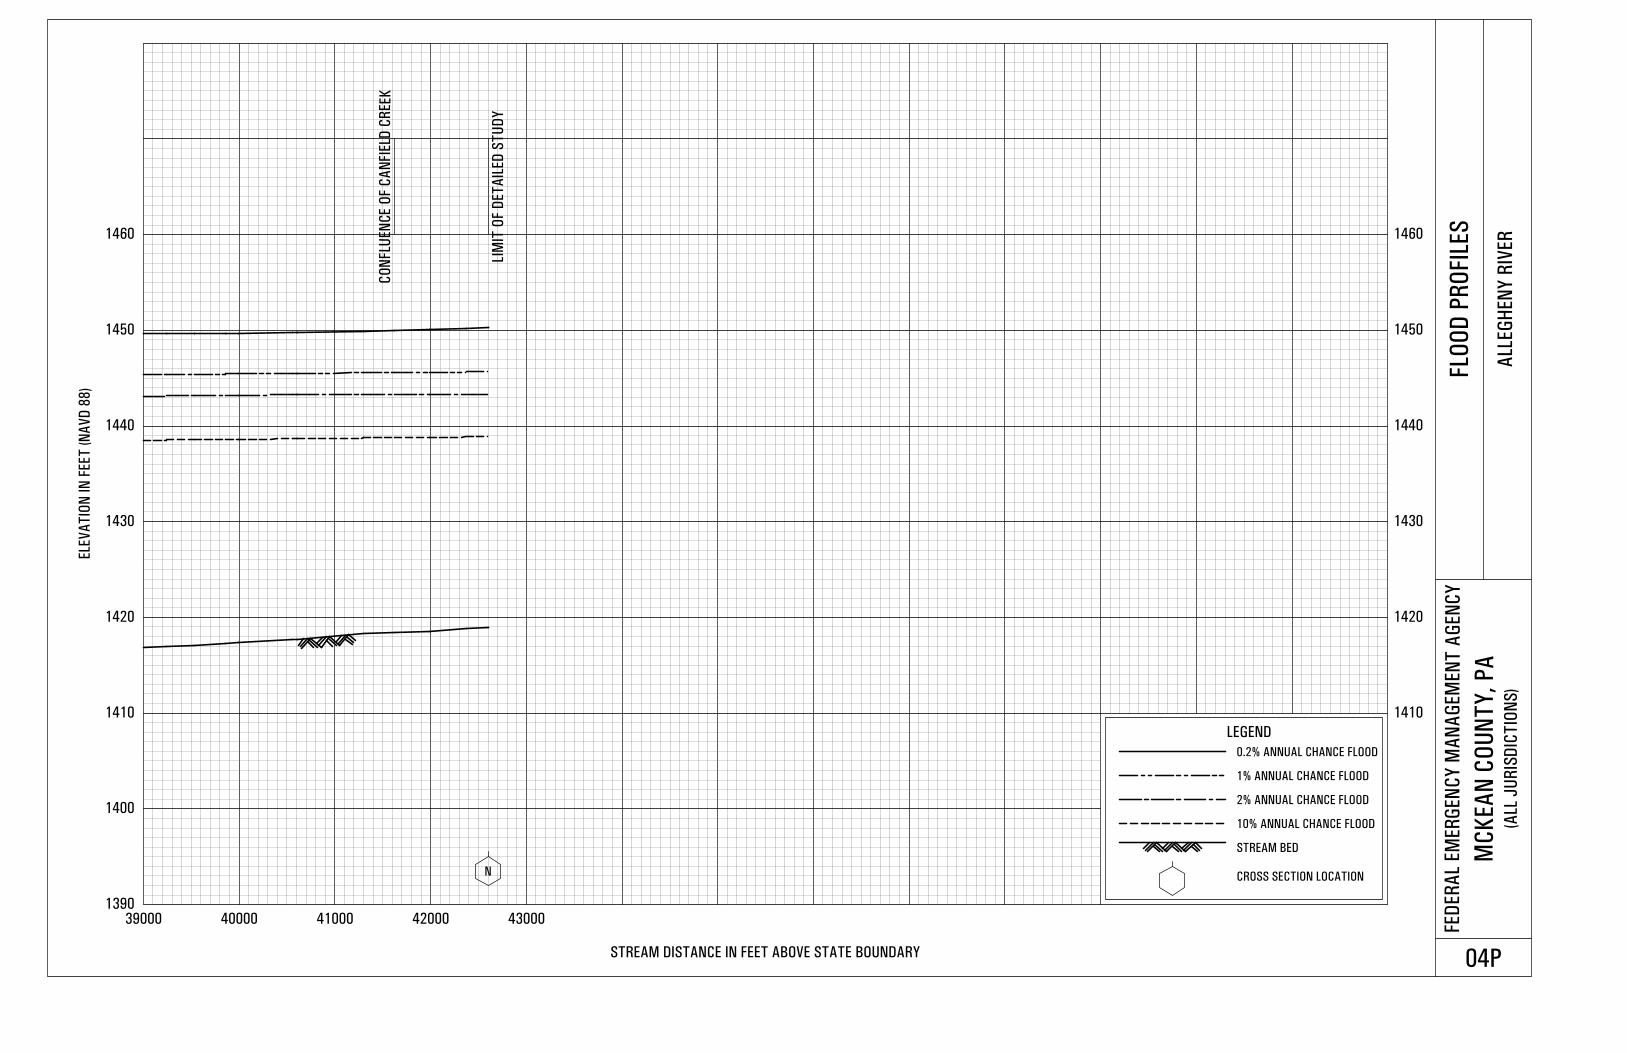
1390
1400
1410 1410
1420 1420
1430 1430
1440 1440
1450 1450
1460 1460
39000 40000 41000 42000 43000
ELE
VA
TIO
N IN
FEET
(N
AV
D 8
8)
STREAM DISTANCE IN FEET ABOVE STATE BOUNDARY
FED
ER
AL
EM
ER
GEN
CY
MA
NA
GEM
EN
T A
GEN
CY
MC
KEA
N C
OU
NT
Y,
PA
(ALL
JU
RIS
DIC
TIO
NS
)
FLO
OD
PR
OFIL
ES
ALL
EG
HEN
Y R
IVER
04P
N
CO
NFLU
EN
CE O
F C
AN
FIE
LD C
REEK
LIM
IT O
F D
ET
AIL
ED
ST
UD
Y
LEGEND
0.2% ANNUAL CHANCE FLOOD
1% ANNUAL CHANCE FLOOD
2% ANNUAL CHANCE FLOOD
10% ANNUAL CHANCE FLOOD
STREAM BED
CROSS SECTION LOCATION
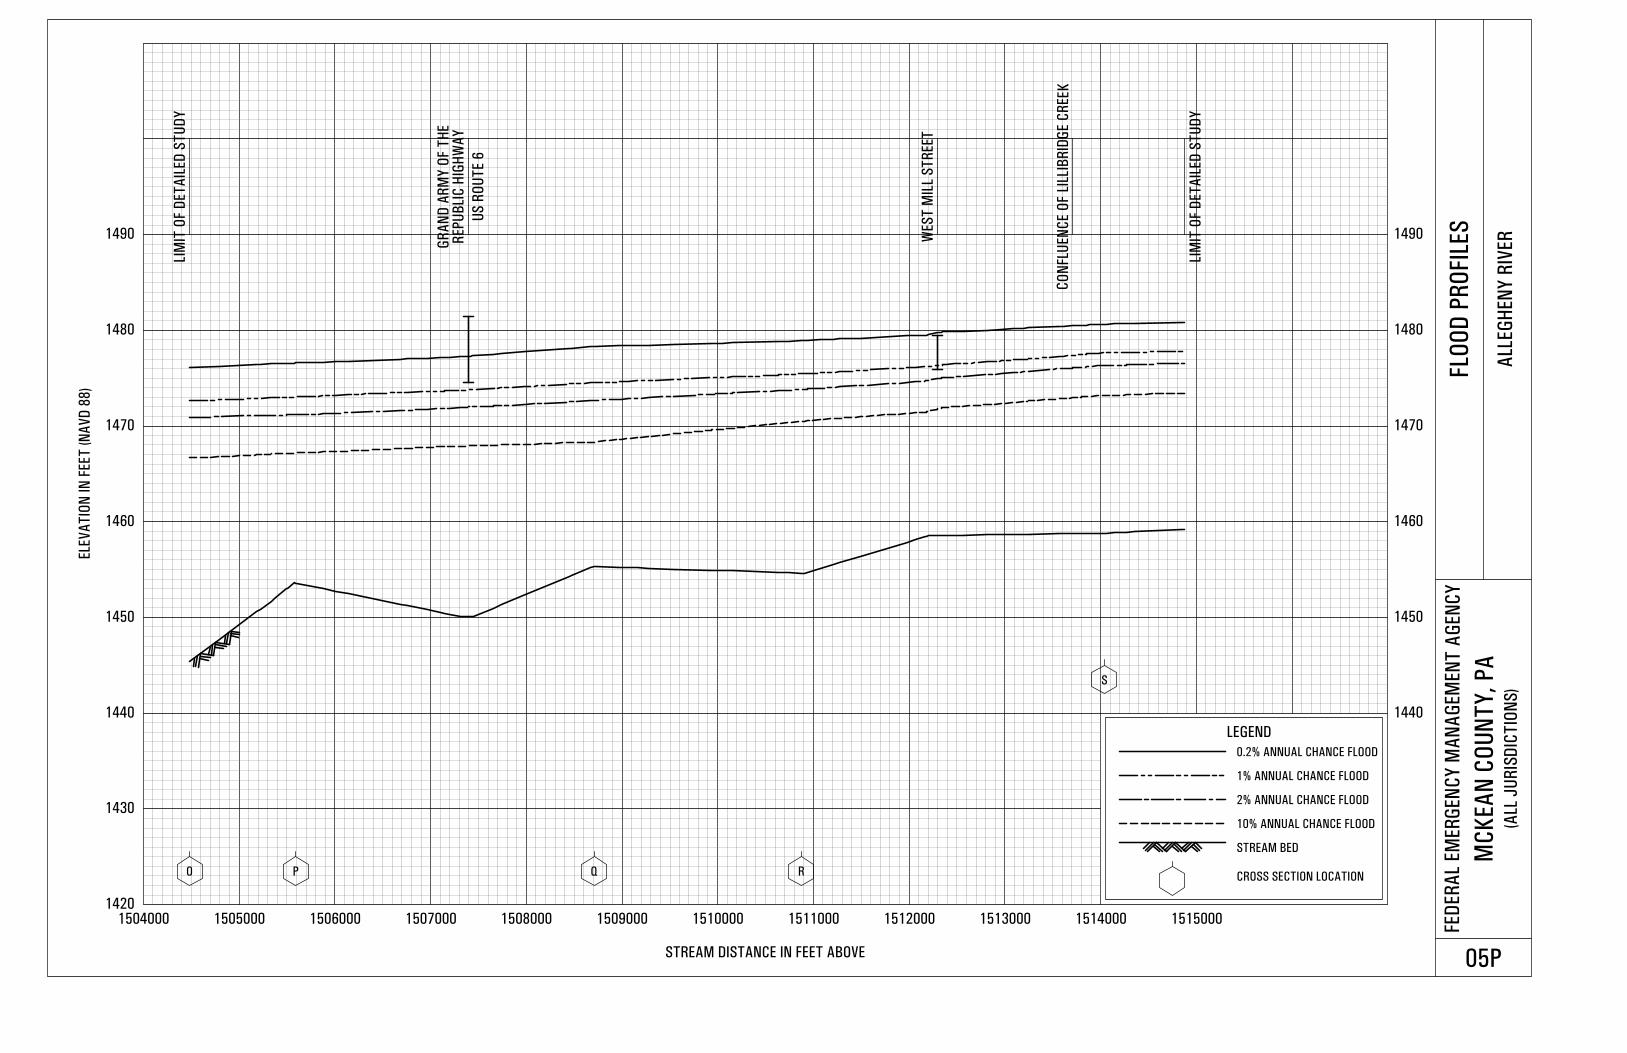
1420
1430
1440 1440
1450 1450
1460 1460
1470 1470
1480 1480
1490 1490
1504000 1505000 1506000 1507000 1508000 1509000 1510000 1511000 1512000 1513000 1514000 1515000
ELE
VA
TIO
N IN
FEET
(N
AV
D 8
8)
STREAM DISTANCE IN FEET ABOVE
FED
ER
AL
EM
ER
GEN
CY
MA
NA
GEM
EN
T A
GEN
CY
MC
KEA
N C
OU
NT
Y,
PA
(ALL
JU
RIS
DIC
TIO
NS
)
FLO
OD
PR
OFIL
ES
ALL
EG
HEN
Y R
IVER
05P
O P Q R
S
CO
NFL
UEN
CE O
F LI
LLIB
RID
GE C
REEK
LIM
IT O
F D
ET
AIL
ED
ST
UD
Y
REP
UB
LIC
HIG
HW
AY
WES
T M
ILL
ST
REET
LEGEND
0.2% ANNUAL CHANCE FLOOD
1% ANNUAL CHANCE FLOOD
2% ANNUAL CHANCE FLOOD
10% ANNUAL CHANCE FLOOD
STREAM BED
CROSS SECTION LOCATION
LIM
IT O
F D
ET
AIL
ED
ST
UD
Y
US
RO
UT
E 6
GR
AN
D A
RM
Y O
F T
HE
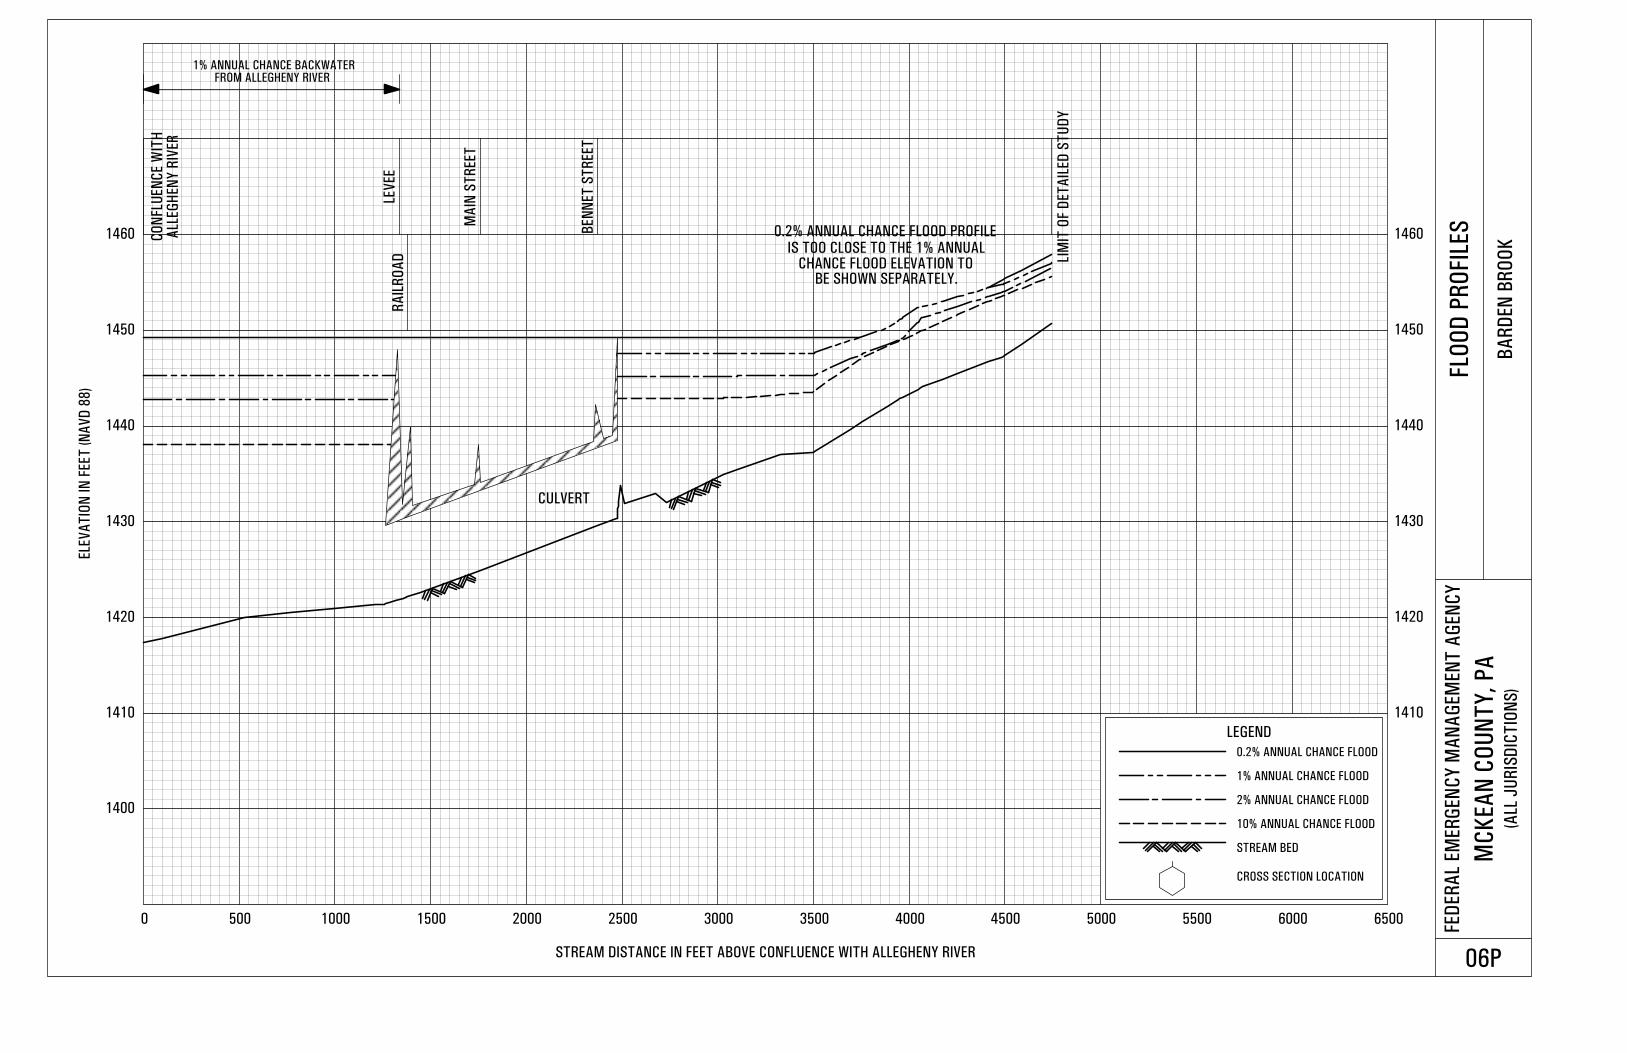
1400
1410 1410
1420 1420
1430 1430
1440 1440
1450 1450
1460 1460
0 500 1000 1500 2000 2500 3000 3500 4000 4500 5000 5500 6000 6500
ELE
VA
TIO
N IN
FEET
(N
AV
D 8
8)
STREAM DISTANCE IN FEET ABOVE CONFLUENCE WITH ALLEGHENY RIVER
FED
ER
AL
EM
ER
GEN
CY
MA
NA
GEM
EN
T A
GEN
CY
MC
KEA
N C
OU
NT
Y,
PA
(ALL
JU
RIS
DIC
TIO
NS
)
FLO
OD
PR
OFIL
ES
BA
RD
EN
BR
OO
K
06P
CO
NFL
UEN
CE W
ITH
LEV
EE
RA
ILR
OA
D
MA
IN S
TR
EET
BEN
NET
ST
REET
LIM
IT O
F D
ET
AIL
ED
ST
UD
Y
LEGEND
0.2% ANNUAL CHANCE FLOOD
1% ANNUAL CHANCE FLOOD
2% ANNUAL CHANCE FLOOD
10% ANNUAL CHANCE FLOOD
STREAM BED
CROSS SECTION LOCATION
CULVERT
ALL
EG
HEN
Y R
IVER
0.2% ANNUAL CHANCE FLOOD PROFILE
IS TOO CLOSE TO THE 1% ANNUALCHANCE FLOOD ELEVATION TO
BE SHOWN SEPARATELY.
FROM ALLEGHENY RIVER1% ANNUAL CHANCE BACKWATER
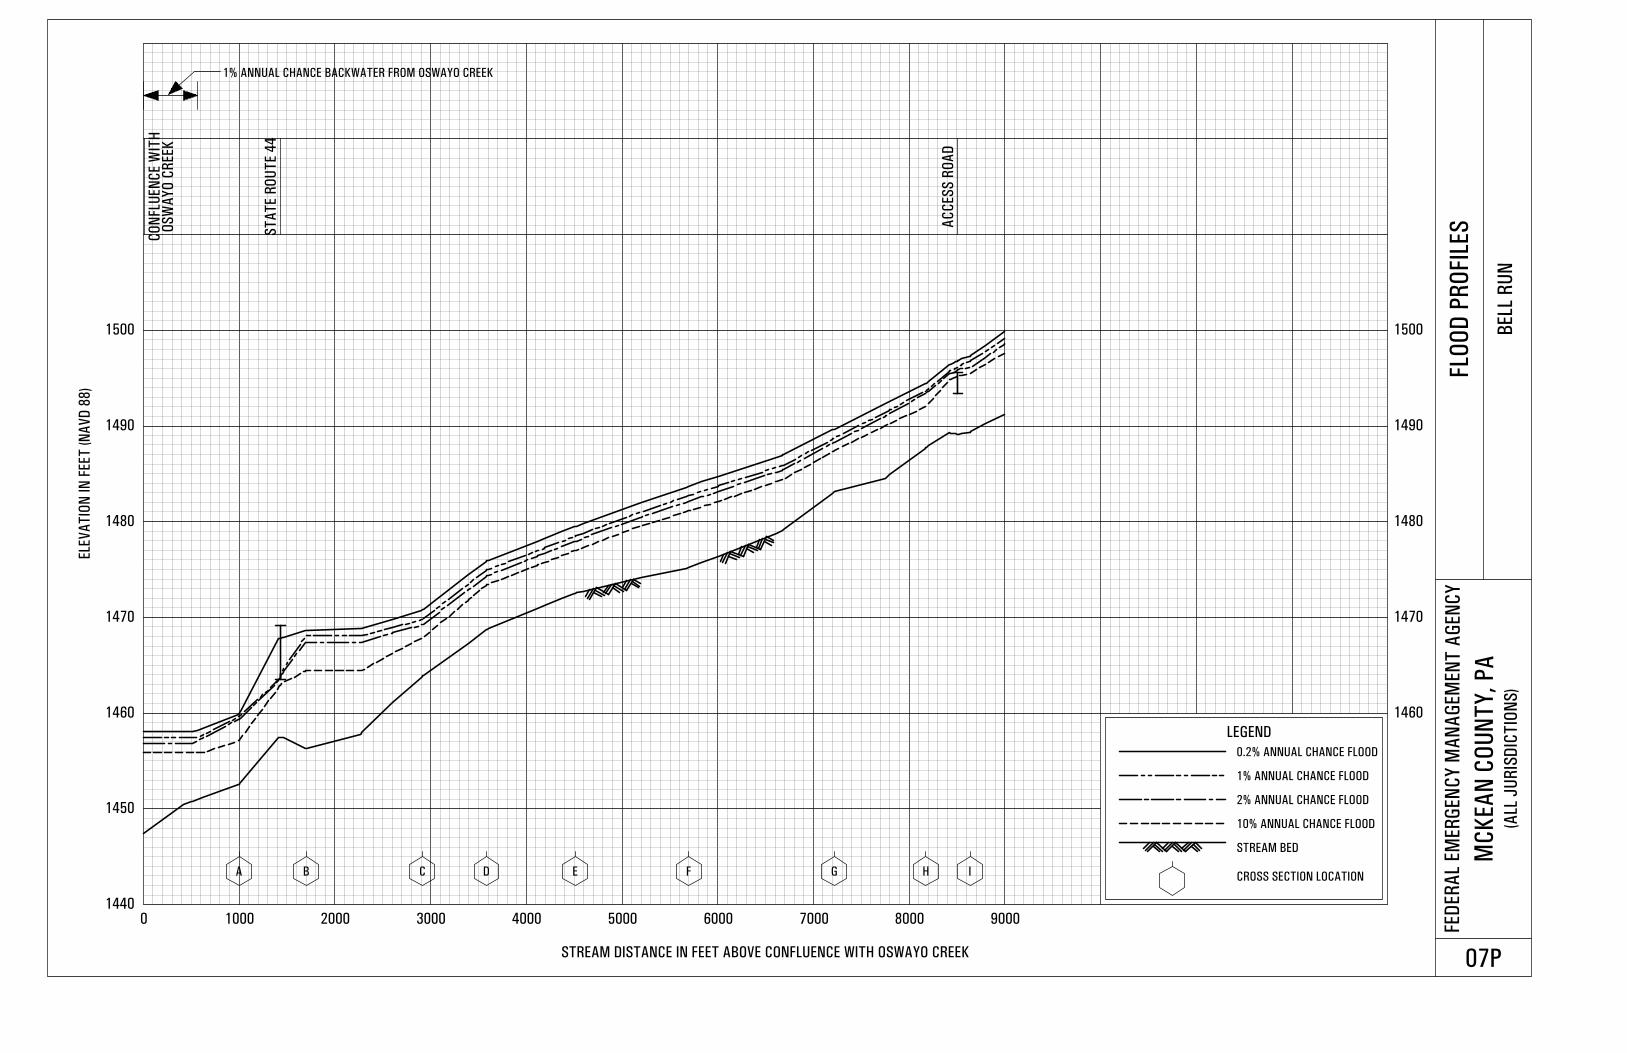
1440
1450
1460 1460
1470 1470
1480 1480
1490 1490
1500 1500
0 1000 2000 3000 4000 5000 6000 7000 8000 9000
ELE
VA
TIO
N IN
FEET
(N
AV
D 8
8)
STREAM DISTANCE IN FEET ABOVE CONFLUENCE WITH OSWAYO CREEK
FED
ER
AL
EM
ER
GEN
CY
MA
NA
GEM
EN
T A
GEN
CY
MC
KEA
N C
OU
NT
Y,
PA
(ALL
JU
RIS
DIC
TIO
NS
)
FLO
OD
PR
OFIL
ES
BELL
RU
N
07P
A B C D E F G H I
CO
NFL
UEN
CE W
ITH
ST
AT
E R
OU
TE 4
4
AC
CES
S R
OA
D
LEGEND
0.2% ANNUAL CHANCE FLOOD
1% ANNUAL CHANCE FLOOD
2% ANNUAL CHANCE FLOOD
10% ANNUAL CHANCE FLOOD
STREAM BED
CROSS SECTION LOCATION
1% ANNUAL CHANCE BACKWATER FROM OSWAYO CREEK
OS
WA
YO
CR
EEK
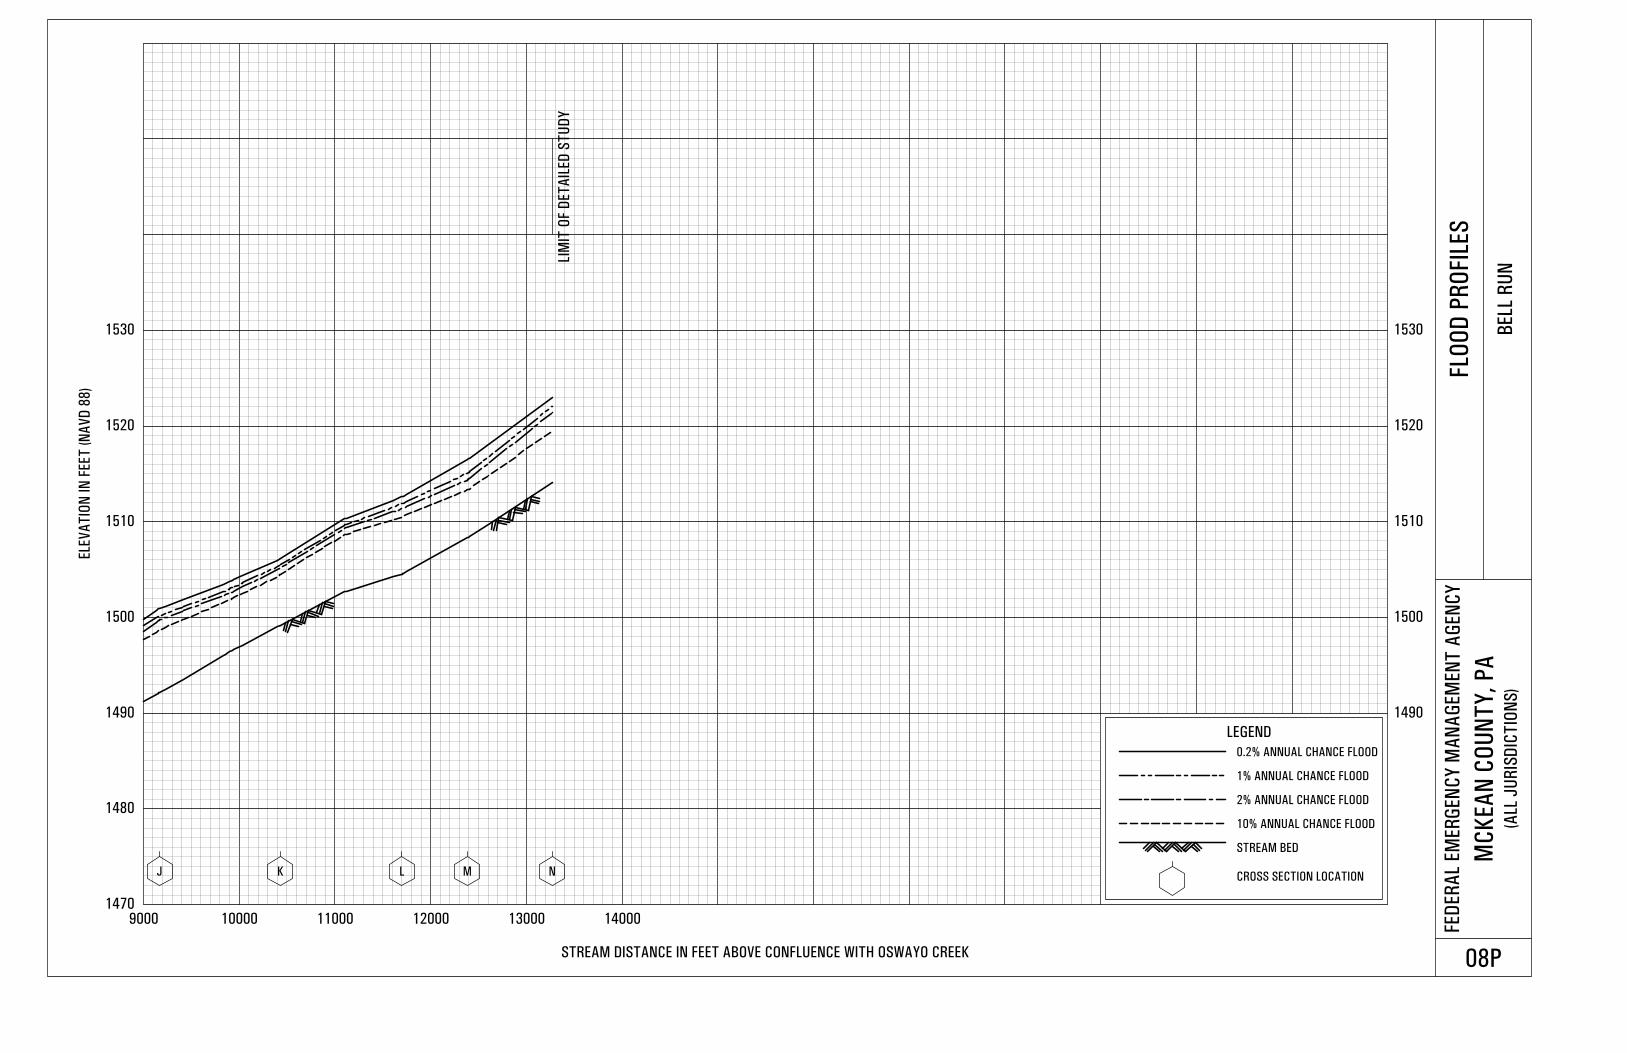
1470
1480
1490 1490
1500 1500
1510 1510
1520 1520
1530 1530
9000 10000 11000 12000 13000 14000
ELE
VA
TIO
N IN
FEET
(N
AV
D 8
8)
STREAM DISTANCE IN FEET ABOVE CONFLUENCE WITH OSWAYO CREEK
FED
ER
AL
EM
ER
GEN
CY
MA
NA
GEM
EN
T A
GEN
CY
MC
KEA
N C
OU
NT
Y,
PA
(ALL
JU
RIS
DIC
TIO
NS
)
FLO
OD
PR
OFIL
ES
BELL
RU
N
08P
J K L M N
LIM
IT O
F D
ET
AIL
ED
ST
UD
Y
LEGEND
0.2% ANNUAL CHANCE FLOOD
1% ANNUAL CHANCE FLOOD
2% ANNUAL CHANCE FLOOD
10% ANNUAL CHANCE FLOOD
STREAM BED
CROSS SECTION LOCATION
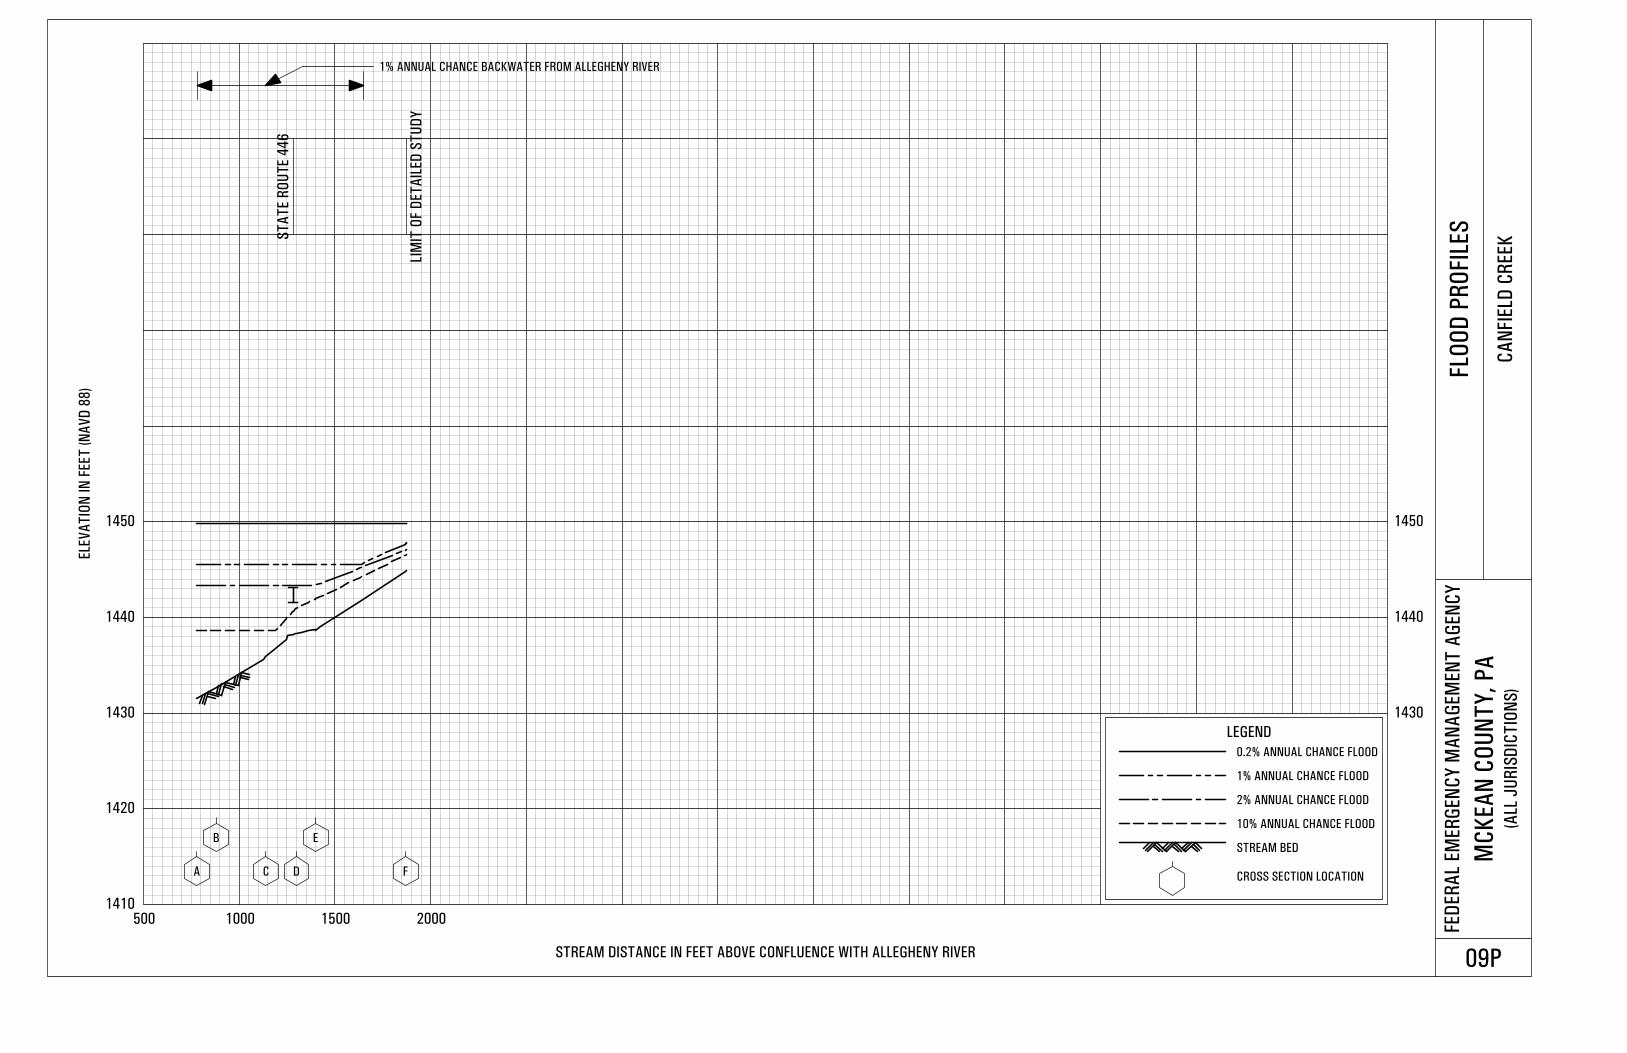
1410
1420
1430 1430
1440 1440
1450 1450
500 1000 1500 2000
ELE
VA
TIO
N IN
FEET
(N
AV
D 8
8)
STREAM DISTANCE IN FEET ABOVE CONFLUENCE WITH ALLEGHENY RIVER
FED
ER
AL
EM
ER
GEN
CY
MA
NA
GEM
EN
T A
GEN
CY
MC
KEA
N C
OU
NT
Y,
PA
(ALL
JU
RIS
DIC
TIO
NS
)
FLO
OD
PR
OFIL
ES
CA
NFIE
LD C
REEK
09P
A
B
C D
E
F
LIM
IT O
F D
ET
AIL
ED
ST
UD
Y
ST
AT
E R
OU
TE 4
46
LEGEND
0.2% ANNUAL CHANCE FLOOD
1% ANNUAL CHANCE FLOOD
2% ANNUAL CHANCE FLOOD
10% ANNUAL CHANCE FLOOD
STREAM BED
CROSS SECTION LOCATION
1% ANNUAL CHANCE BACKWATER FROM ALLEGHENY RIVER
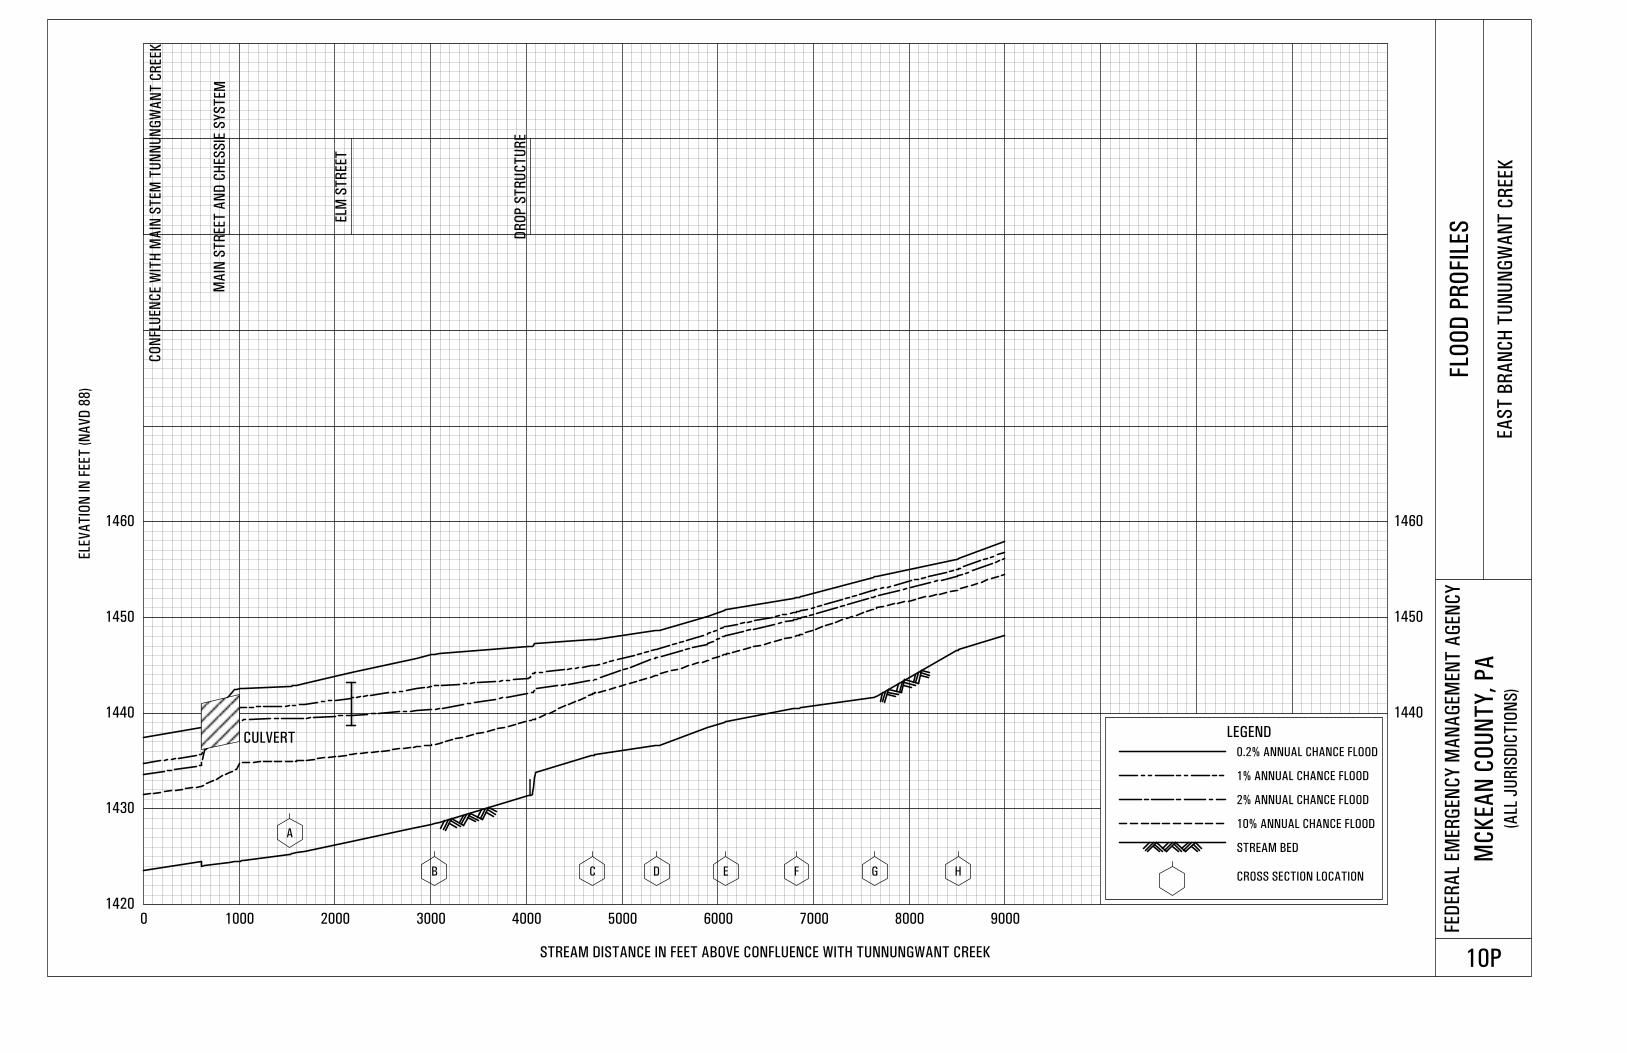
1420
1430
1440 1440
1450 1450
1460 1460
0 1000 2000 3000 4000 5000 6000 7000 8000 9000
ELE
VA
TIO
N IN
FEET
(N
AV
D 8
8)
STREAM DISTANCE IN FEET ABOVE CONFLUENCE WITH TUNNUNGWANT CREEK
FED
ER
AL
EM
ER
GEN
CY
MA
NA
GEM
EN
T A
GEN
CY
MC
KEA
N C
OU
NT
Y,
PA
(ALL
JU
RIS
DIC
TIO
NS
)
FLO
OD
PR
OFIL
ES
EA
ST
BR
AN
CH
TU
NU
NG
WA
NT
CR
EEK
10P
A
B C D E F G H
MA
IN S
TR
EET
AN
D C
HES
SIE
SY
ST
EM
ELM
ST
REET
DR
OP
ST
RU
CT
UR
E
LEGEND
0.2% ANNUAL CHANCE FLOOD
1% ANNUAL CHANCE FLOOD
2% ANNUAL CHANCE FLOOD
10% ANNUAL CHANCE FLOOD
STREAM BED
CROSS SECTION LOCATION
CO
NFL
UEN
CE W
ITH
MA
IN S
TEM
TU
NN
UN
GW
AN
T C
REEK
CULVERT
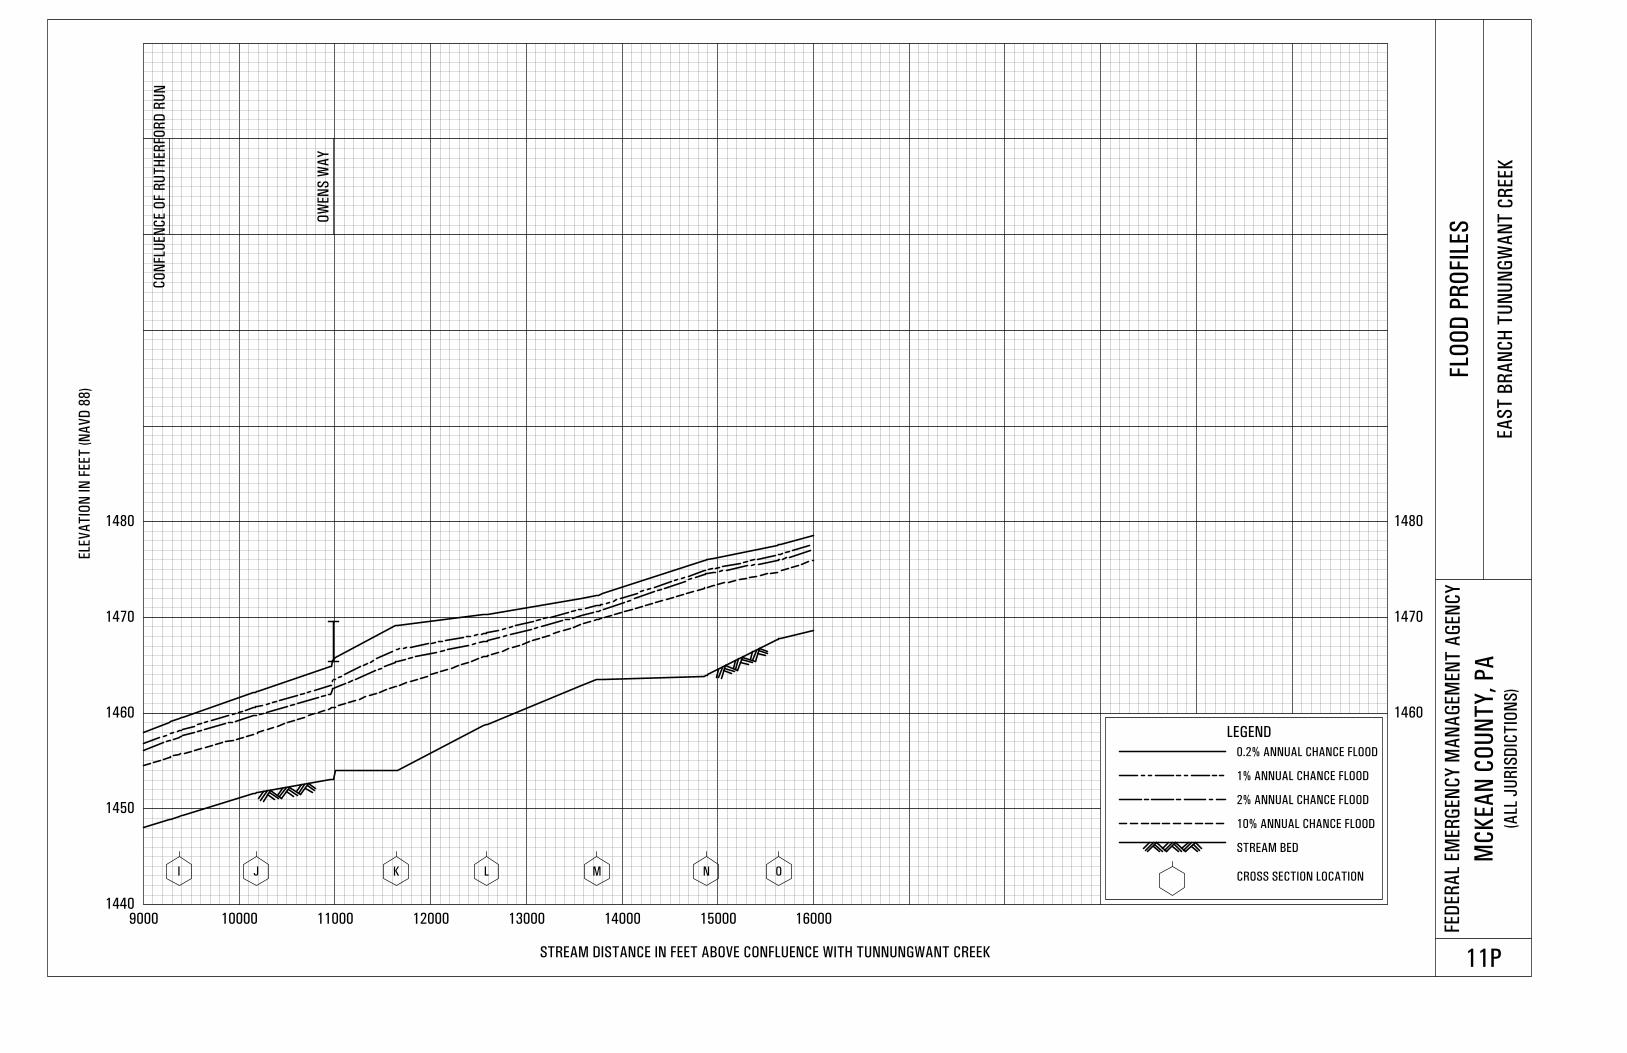
1440
1450
1460 1460
1470 1470
1480 1480
9000 10000 11000 12000 13000 14000 15000 16000
ELE
VA
TIO
N IN
FEET
(N
AV
D 8
8)
STREAM DISTANCE IN FEET ABOVE CONFLUENCE WITH TUNNUNGWANT CREEK
FED
ER
AL
EM
ER
GEN
CY
MA
NA
GEM
EN
T A
GEN
CY
MC
KEA
N C
OU
NT
Y,
PA
(ALL
JU
RIS
DIC
TIO
NS
)
FLO
OD
PR
OFIL
ES
EA
ST
BR
AN
CH
TU
NU
NG
WA
NT
CR
EEK
11P
I J K L M N O
CO
NFL
UEN
CE O
F R
UT
HER
FOR
D R
UN
OW
EN
S W
AY
LEGEND
0.2% ANNUAL CHANCE FLOOD
1% ANNUAL CHANCE FLOOD
2% ANNUAL CHANCE FLOOD
10% ANNUAL CHANCE FLOOD
STREAM BED
CROSS SECTION LOCATION
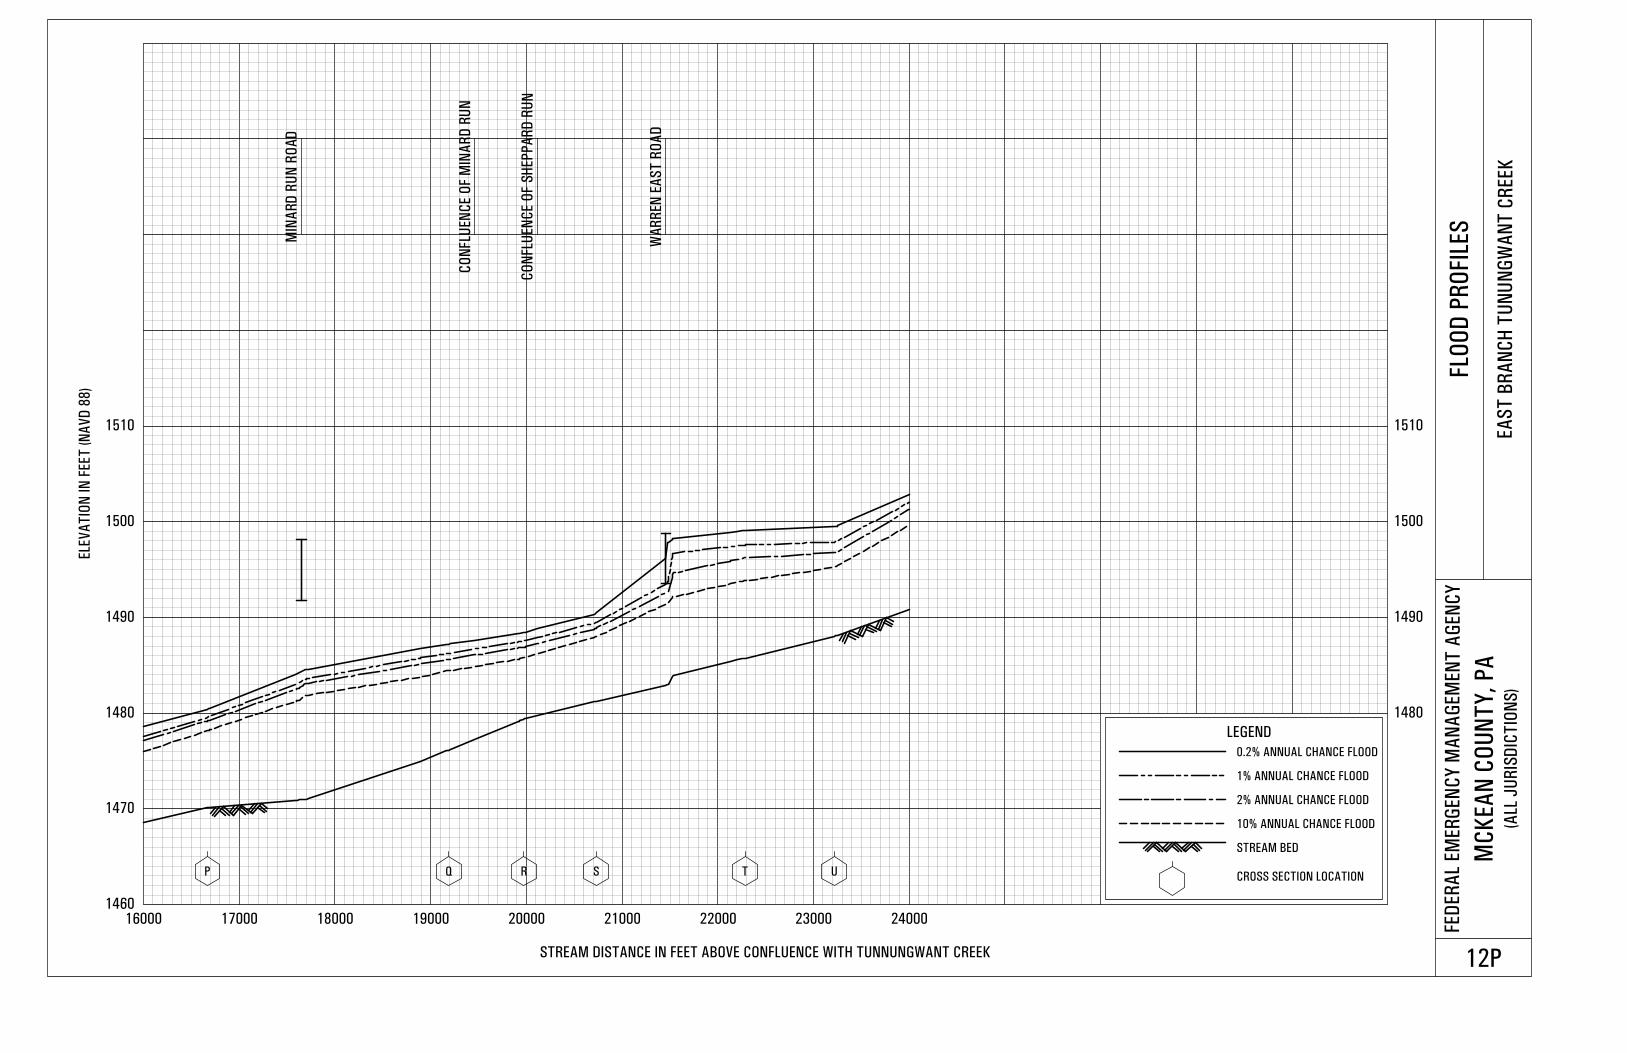
1460
1470
1480 1480
1490 1490
1500 1500
1510 1510
16000 17000 18000 19000 20000 21000 22000 23000 24000
ELE
VA
TIO
N IN
FEET
(N
AV
D 8
8)
STREAM DISTANCE IN FEET ABOVE CONFLUENCE WITH TUNNUNGWANT CREEK
FED
ER
AL
EM
ER
GEN
CY
MA
NA
GEM
EN
T A
GEN
CY
MC
KEA
N C
OU
NT
Y,
PA
(ALL
JU
RIS
DIC
TIO
NS
)
FLO
OD
PR
OFIL
ES
EA
ST
BR
AN
CH
TU
NU
NG
WA
NT
CR
EEK
12P
P Q R S T U
CO
NFLU
EN
CE O
F M
INA
RD
RU
N
CO
NFL
UEN
CE O
F S
HEP
PA
RD
RU
N
MIN
AR
D R
UN
RO
AD
WA
RR
EN
EA
ST
RO
AD
LEGEND
0.2% ANNUAL CHANCE FLOOD
1% ANNUAL CHANCE FLOOD
2% ANNUAL CHANCE FLOOD
10% ANNUAL CHANCE FLOOD
STREAM BED
CROSS SECTION LOCATION
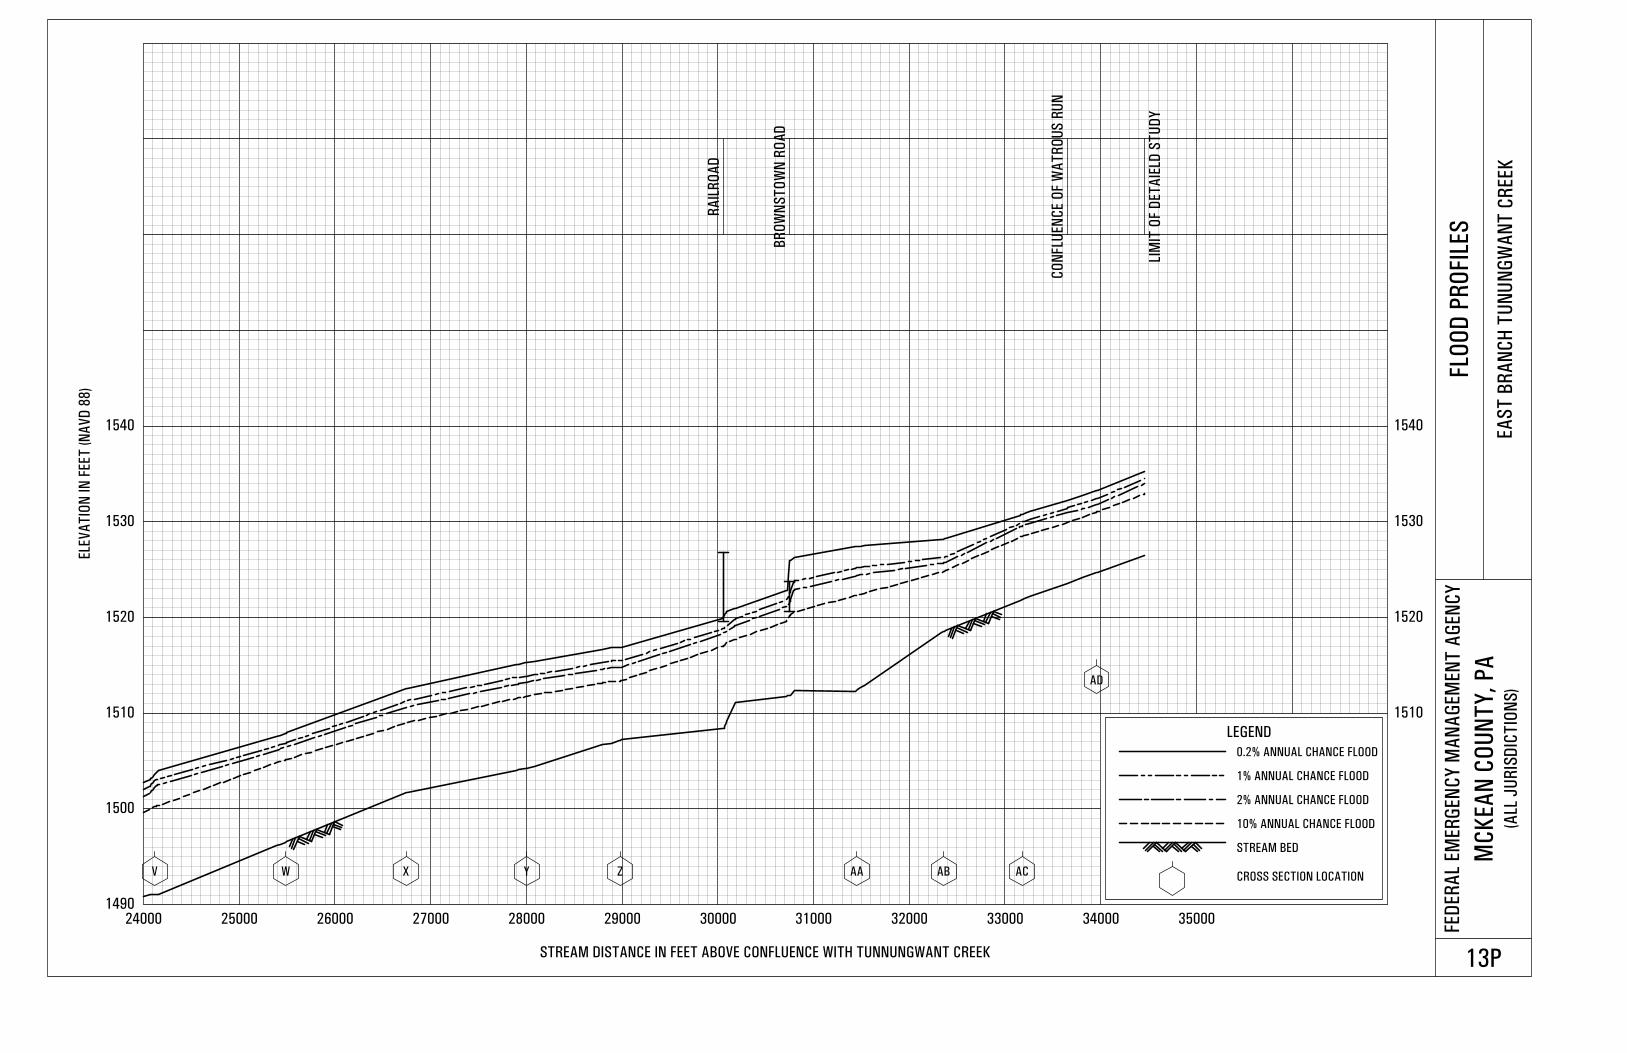
1490
1500
1510 1510
1520 1520
1530 1530
1540 1540
24000 25000 26000 27000 28000 29000 30000 31000 32000 33000 34000 35000
ELE
VA
TIO
N IN
FEET
(N
AV
D 8
8)
STREAM DISTANCE IN FEET ABOVE CONFLUENCE WITH TUNNUNGWANT CREEK
FED
ER
AL
EM
ER
GEN
CY
MA
NA
GEM
EN
T A
GEN
CY
MC
KEA
N C
OU
NT
Y,
PA
(ALL
JU
RIS
DIC
TIO
NS
)
FLO
OD
PR
OFIL
ES
EA
ST
BR
AN
CH
TU
NU
NG
WA
NT
CR
EEK
13P
V W X Y Z AA AB AC
AD
CO
NFLU
EN
CE O
F W
AT
RO
US
RU
N
LIM
IT O
F D
ET
AIE
LD S
TU
DY
RA
ILR
OA
D
BR
OW
NS
TO
WN
RO
AD
LEGEND
0.2% ANNUAL CHANCE FLOOD
1% ANNUAL CHANCE FLOOD
2% ANNUAL CHANCE FLOOD
10% ANNUAL CHANCE FLOOD
STREAM BED
CROSS SECTION LOCATION
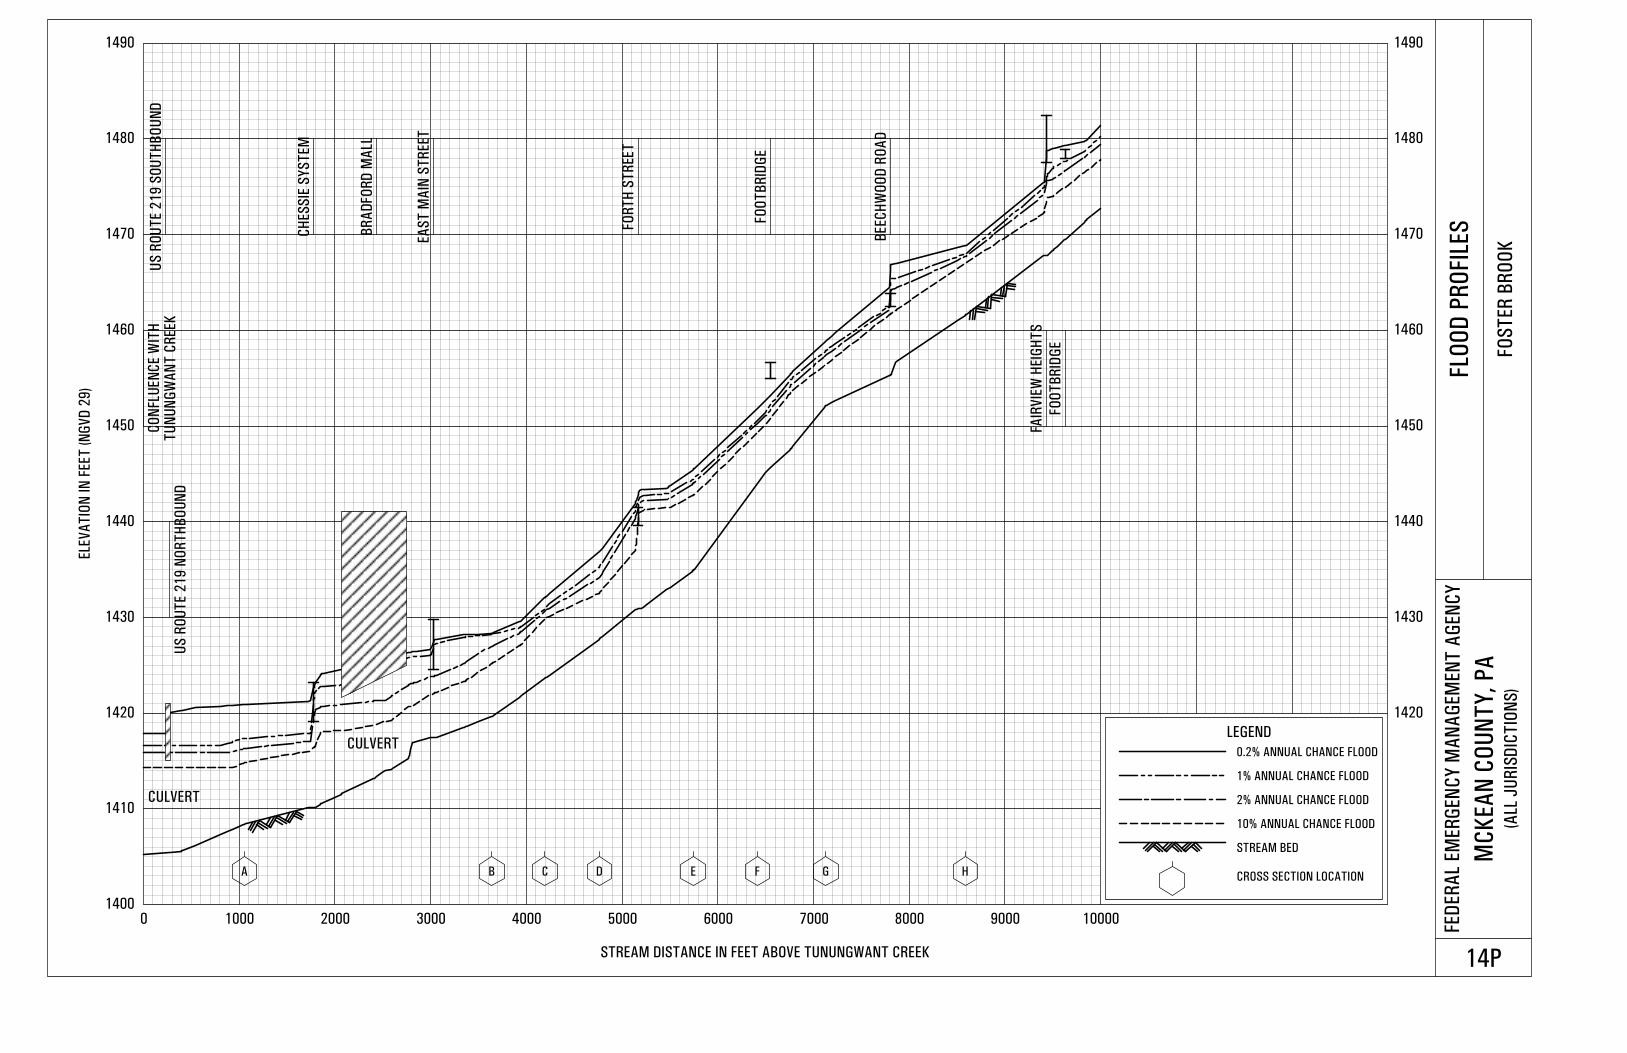
1400
1410
1420 1420
1430 1430
1440 1440
1450 1450
1460 1460
1470 1470
1480 1480
1490 1490
0 1000 2000 3000 4000 5000 6000 7000 8000 9000 10000
ELE
VA
TIO
N IN
FEET
(N
GV
D 2
9)
STREAM DISTANCE IN FEET ABOVE TUNUNGWANT CREEK
FED
ER
AL
EM
ER
GEN
CY
MA
NA
GEM
EN
T A
GEN
CY
MC
KEA
N C
OU
NT
Y,
PA
(ALL
JU
RIS
DIC
TIO
NS
)
FLO
OD
PR
OFIL
ES
FO
ST
ER
BR
OO
K
14P
A B C D E F G H
CO
NFL
UEN
CE W
ITH
US
RO
UT
E 2
19
SO
UT
HB
OU
ND
US
RO
UT
E 2
19
NO
RT
HB
OU
ND
BR
AD
FO
RD
MA
LL
CH
ES
SIE
SY
ST
EM
EA
ST
MA
IN S
TR
EET
FO
RT
H S
TR
EET
FO
OT
BR
IDG
E
BEEC
HW
OO
D R
OA
D
FAIR
VIE
W H
EIG
HT
S
FO
OT
BR
IDG
E
LEGEND
0.2% ANNUAL CHANCE FLOOD
1% ANNUAL CHANCE FLOOD
2% ANNUAL CHANCE FLOOD
10% ANNUAL CHANCE FLOOD
STREAM BED
CROSS SECTION LOCATION
CULVERT
TU
NU
NG
WA
NT
CR
EEK
CULVERT
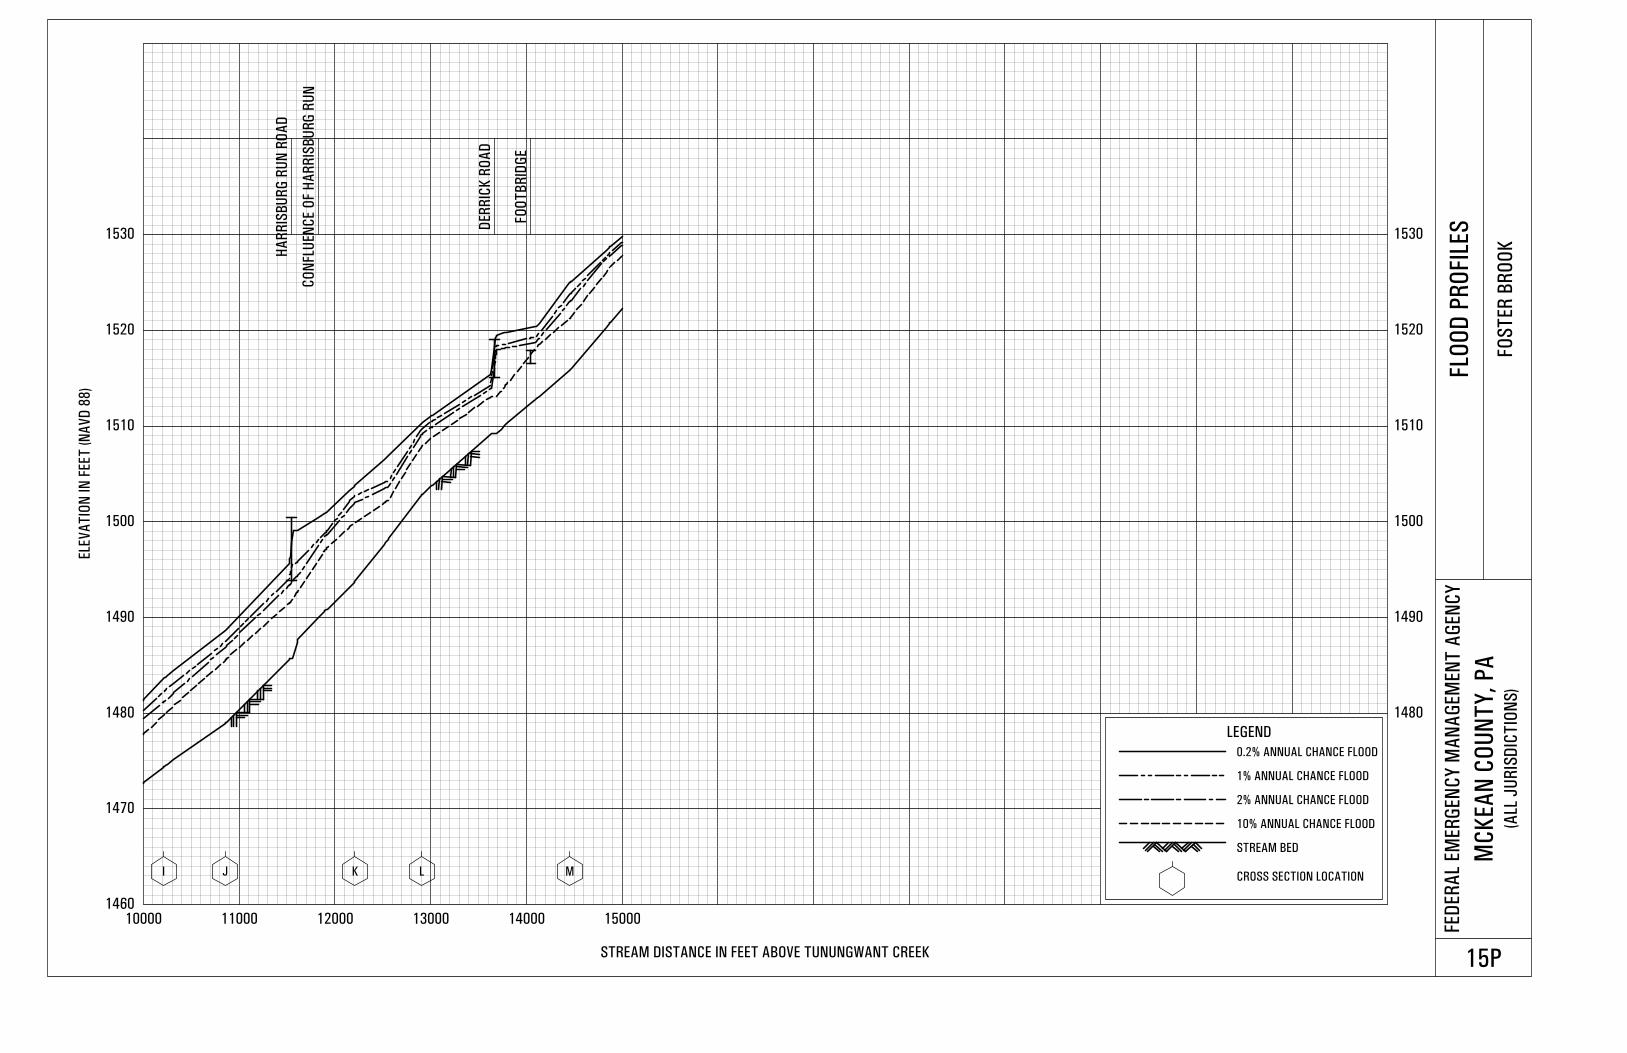
1460
1470
1480 1480
1490 1490
1500 1500
1510 1510
1520 1520
1530 1530
10000 11000 12000 13000 14000 15000
ELE
VA
TIO
N IN
FEET
(N
AV
D 8
8)
STREAM DISTANCE IN FEET ABOVE TUNUNGWANT CREEK
FED
ER
AL
EM
ER
GEN
CY
MA
NA
GEM
EN
T A
GEN
CY
MC
KEA
N C
OU
NT
Y,
PA
(ALL
JU
RIS
DIC
TIO
NS
)
FLO
OD
PR
OFIL
ES
FO
ST
ER
BR
OO
K
15P
I J K L M
CO
NFL
UEN
CE O
F H
AR
RIS
BU
RG
RU
N
HA
RR
ISB
UR
G R
UN
RO
AD
DER
RIC
K R
OA
D
FO
OT
BR
IDG
E
LEGEND
0.2% ANNUAL CHANCE FLOOD
1% ANNUAL CHANCE FLOOD
2% ANNUAL CHANCE FLOOD
10% ANNUAL CHANCE FLOOD
STREAM BED
CROSS SECTION LOCATION
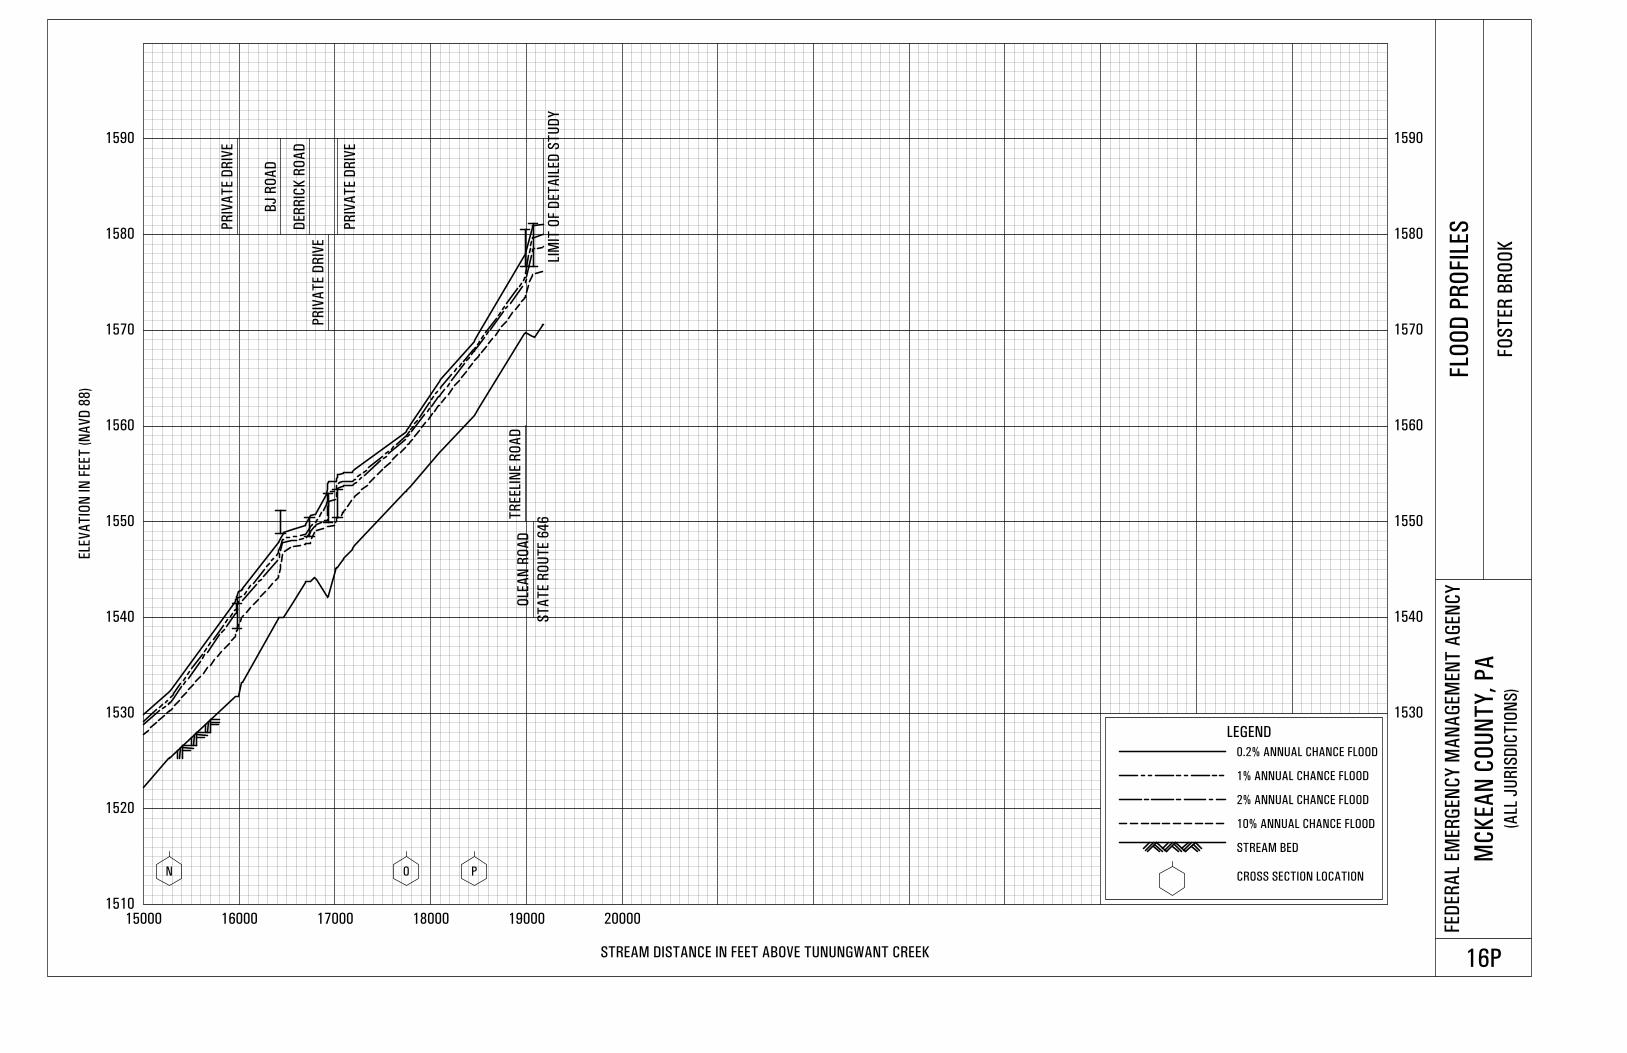
1510
1520
1530 1530
1540 1540
1550 1550
1560 1560
1570 1570
1580 1580
1590 1590
15000 16000 17000 18000 19000 20000
ELE
VA
TIO
N IN
FEET
(N
AV
D 8
8)
STREAM DISTANCE IN FEET ABOVE TUNUNGWANT CREEK
FED
ER
AL
EM
ER
GEN
CY
MA
NA
GEM
EN
T A
GEN
CY
MC
KEA
N C
OU
NT
Y,
PA
(ALL
JU
RIS
DIC
TIO
NS
)
FLO
OD
PR
OFIL
ES
FO
ST
ER
BR
OO
K
16P
N O P
LIM
IT O
F D
ET
AIL
ED
ST
UD
Y
PR
IVA
TE D
RIV
E
BJ R
OA
D
DER
RIC
K R
OA
D
PR
IVA
TE D
RIV
E
PR
IVA
TE D
RIV
E
TR
EELI
NE R
OA
D
ST
AT
E R
OU
TE 6
46
LEGEND
0.2% ANNUAL CHANCE FLOOD
1% ANNUAL CHANCE FLOOD
2% ANNUAL CHANCE FLOOD
10% ANNUAL CHANCE FLOOD
STREAM BED
CROSS SECTION LOCATION
OLE
AN
RO
AD
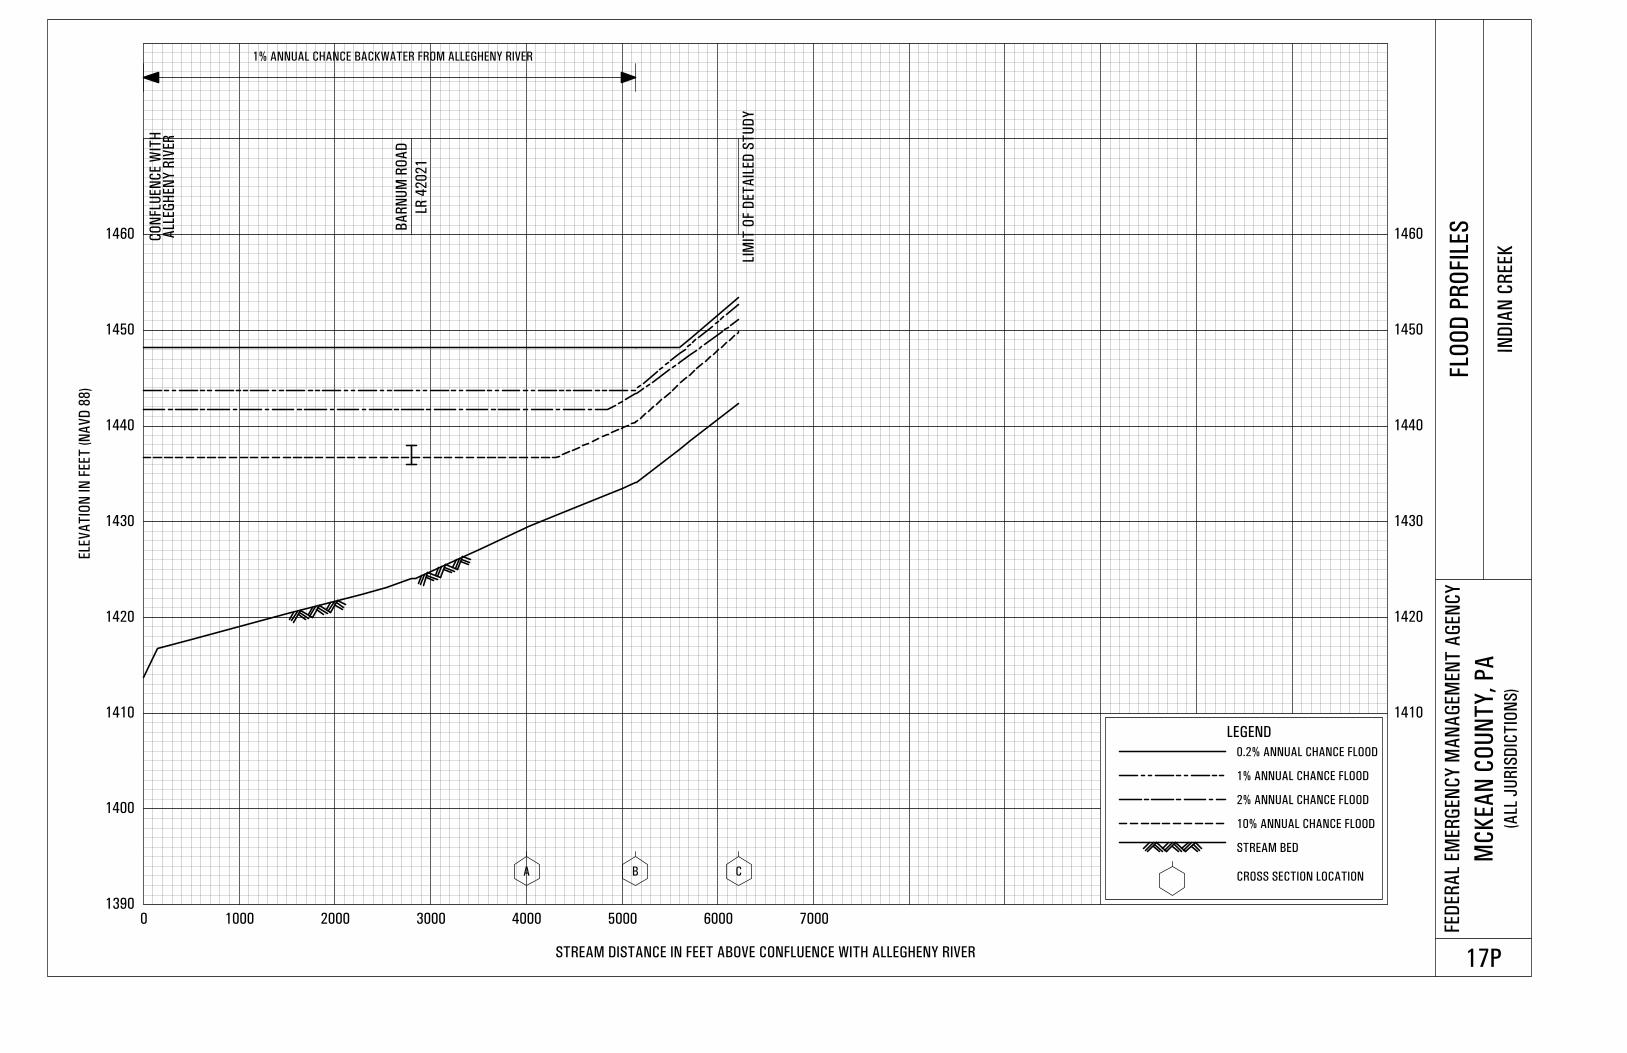
1390
1400
1410 1410
1420 1420
1430 1430
1440 1440
1450 1450
1460 1460
0 1000 2000 3000 4000 5000 6000 7000
ELE
VA
TIO
N IN
FEET
(N
AV
D 8
8)
STREAM DISTANCE IN FEET ABOVE CONFLUENCE WITH ALLEGHENY RIVER
FED
ER
AL
EM
ER
GEN
CY
MA
NA
GEM
EN
T A
GEN
CY
MC
KEA
N C
OU
NT
Y,
PA
(ALL
JU
RIS
DIC
TIO
NS
)
FLO
OD
PR
OFIL
ES
IND
IAN
CR
EEK
17P
A B C
CO
NFL
UEN
CE W
ITH
LIM
IT O
F D
ET
AIL
ED
ST
UD
Y
BA
RN
UM
RO
AD
LEGEND
0.2% ANNUAL CHANCE FLOOD
1% ANNUAL CHANCE FLOOD
2% ANNUAL CHANCE FLOOD
10% ANNUAL CHANCE FLOOD
STREAM BED
CROSS SECTION LOCATION
LR 4
20
21
ALL
EG
HEN
Y R
IVER
1% ANNUAL CHANCE BACKWATER FROM ALLEGHENY RIVER
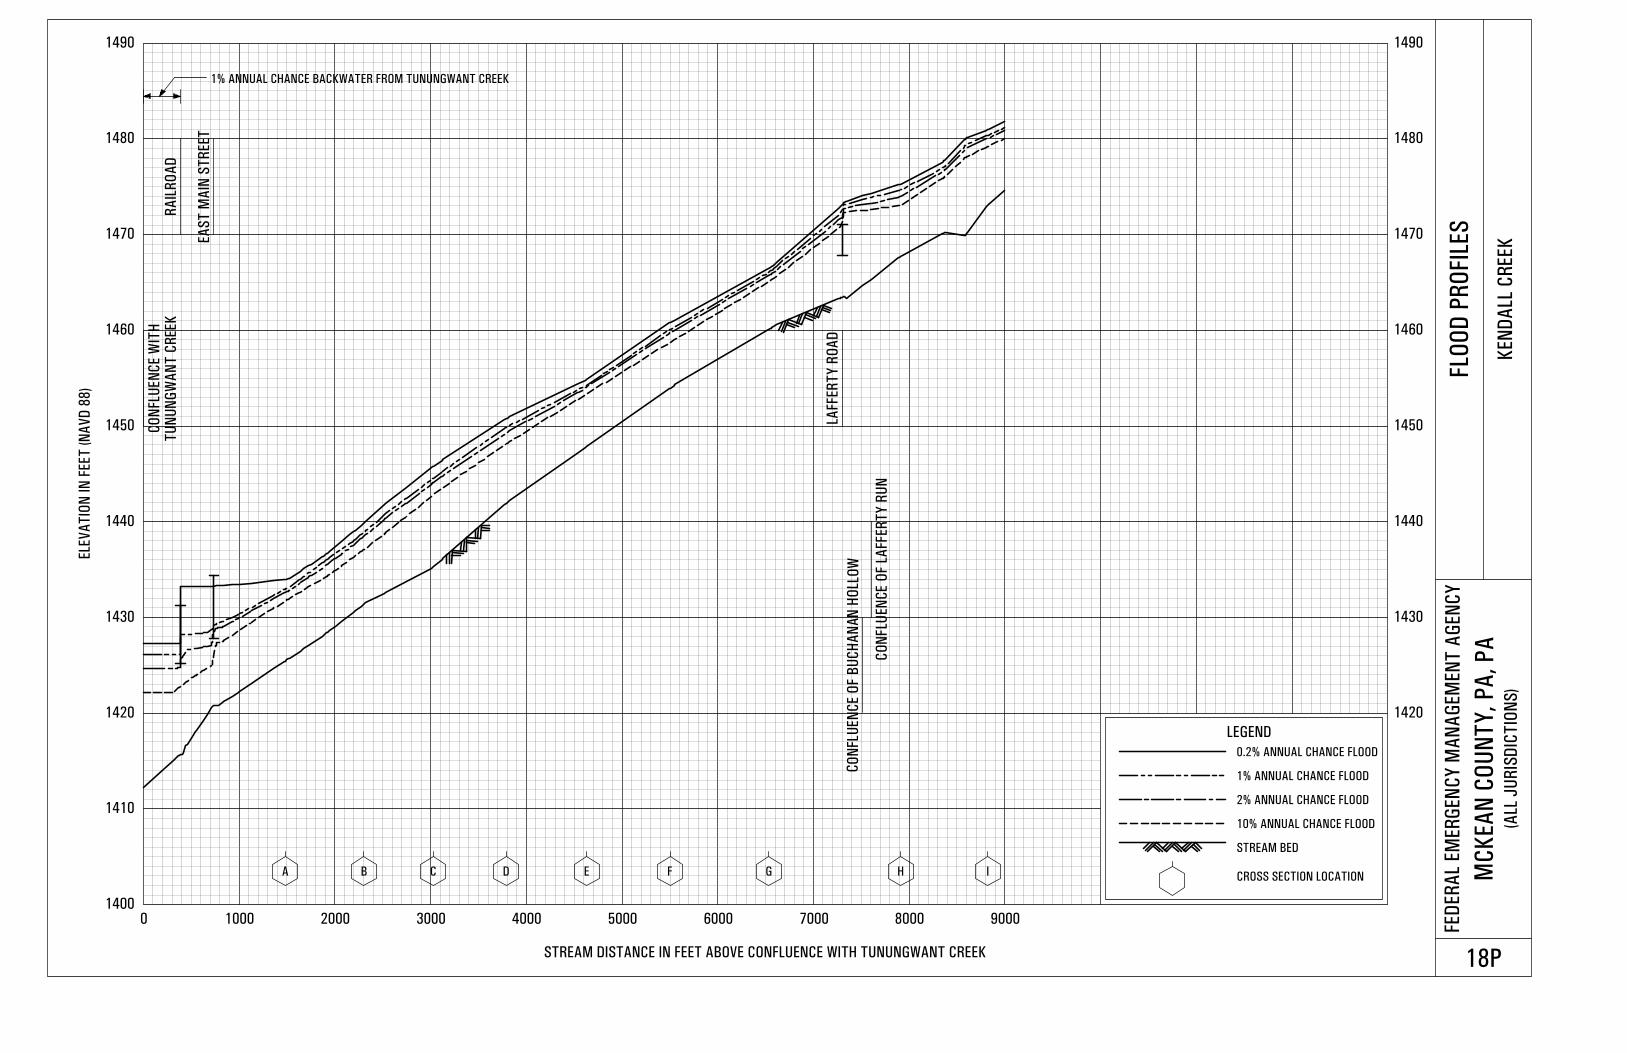
1400
1410
1420 1420
1430 1430
1440 1440
1450 1450
1460 1460
1470 1470
1480 1480
1490 1490
0 1000 2000 3000 4000 5000 6000 7000 8000 9000
ELE
VA
TIO
N IN
FEET
(N
AV
D 8
8)
STREAM DISTANCE IN FEET ABOVE CONFLUENCE WITH TUNUNGWANT CREEK
FED
ER
AL
EM
ER
GEN
CY
MA
NA
GEM
EN
T A
GEN
CY
MC
KEA
N C
OU
NT
Y,
PA
, P
A(A
LL J
UR
ISD
ICT
ION
S)
FLO
OD
PR
OFIL
ES
KEN
DA
LL C
REEK
18P
A B C D E F G H I
TU
NU
NG
WA
NT
CR
EEK
CO
NFL
UEN
CE O
F B
UC
HA
NA
N H
OL L
OW
CO
NFLU
EN
CE O
F LA
FFER
TY
RU
N
RA
ILR
OA
D
EA
ST
MA
IN S
TR
EET
LAFF
ER
TY
RO
AD
LEGEND
0.2% ANNUAL CHANCE FLOOD
1% ANNUAL CHANCE FLOOD
2% ANNUAL CHANCE FLOOD
10% ANNUAL CHANCE FLOOD
STREAM BED
CROSS SECTION LOCATION
CO
NFL
UEN
CE W
ITH
1% ANNUAL CHANCE BACKWATER FROM TUNUNGWANT CREEK
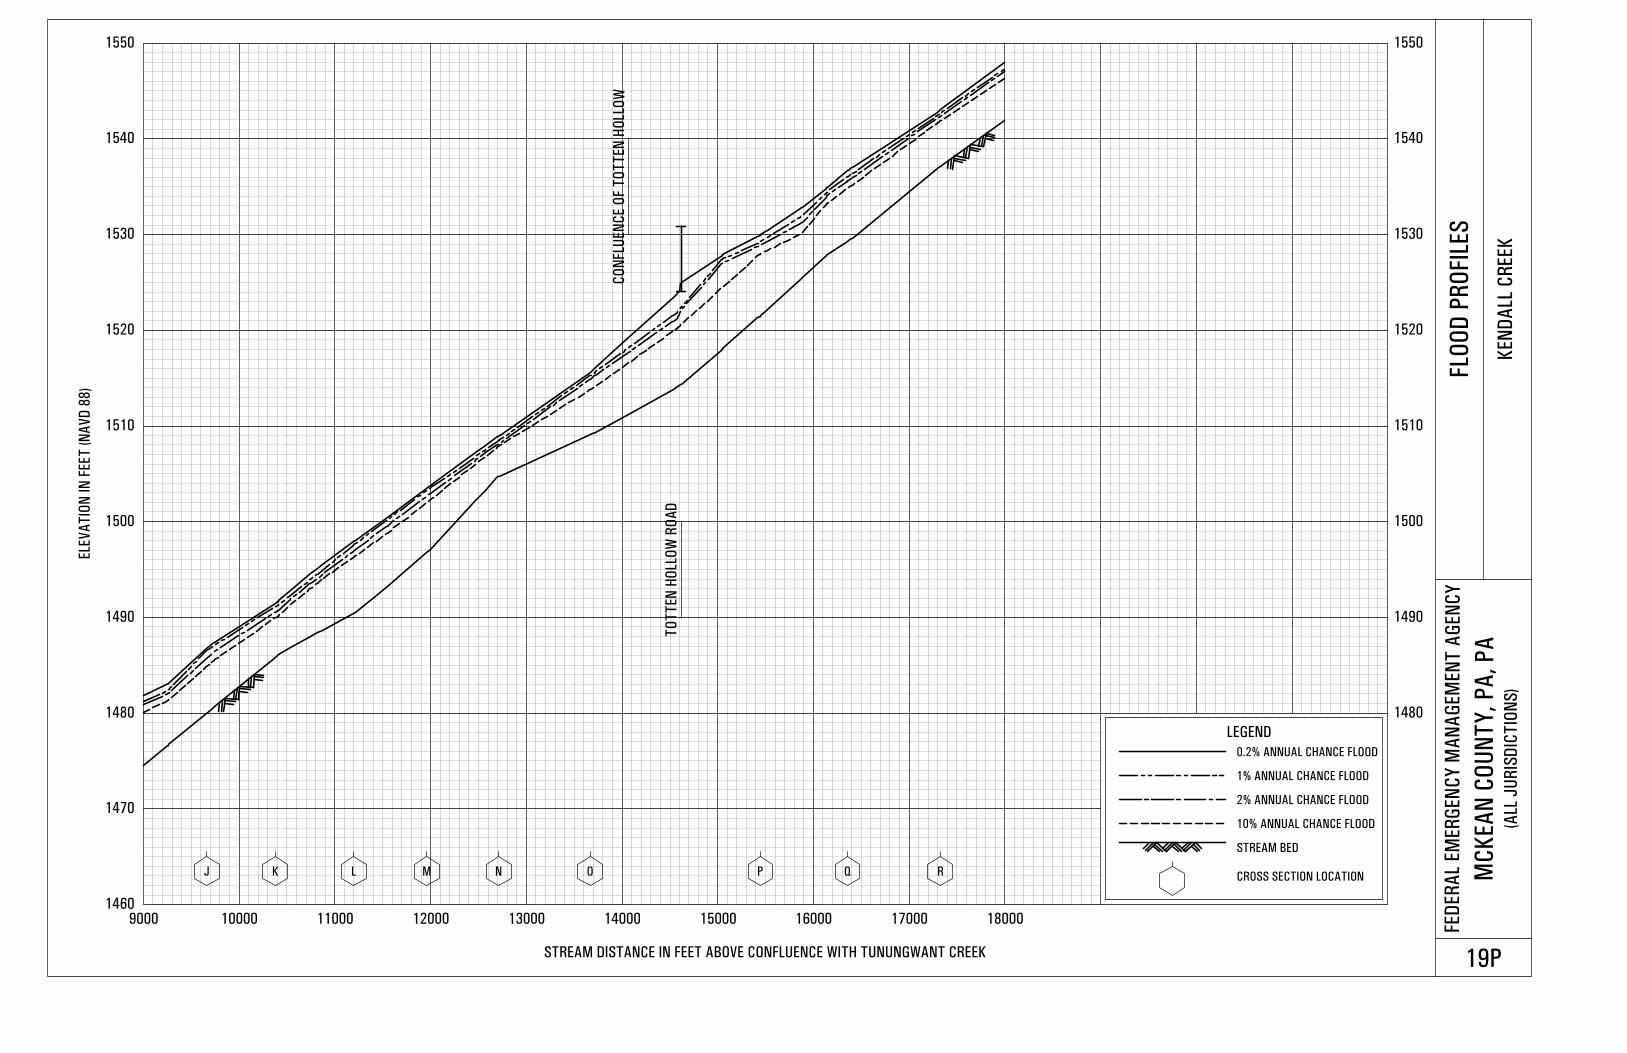
1460
1470
1480 1480
1490 1490
1500 1500
1510 1510
1520 1520
1530 1530
1540 1540
1550 1550
9000 10000 11000 12000 13000 14000 15000 16000 17000 18000
ELE
VA
TIO
N IN
FEET
(N
AV
D 8
8)
STREAM DISTANCE IN FEET ABOVE CONFLUENCE WITH TUNUNGWANT CREEK
FED
ER
AL
EM
ER
GEN
CY
MA
NA
GEM
EN
T A
GEN
CY
MC
KEA
N C
OU
NT
Y,
PA
, P
A(A
LL J
UR
ISD
ICT
ION
S)
FLO
OD
PR
OFIL
ES
KEN
DA
LL C
REEK
19P
J K L M N O P Q R
CO
NFLU
EN
CE O
F T
OT
TEN
HO
LLO
W
TO
TT
EN
HO
LLO
W R
OA
D
LEGEND
0.2% ANNUAL CHANCE FLOOD
1% ANNUAL CHANCE FLOOD
2% ANNUAL CHANCE FLOOD
10% ANNUAL CHANCE FLOOD
STREAM BED
CROSS SECTION LOCATION
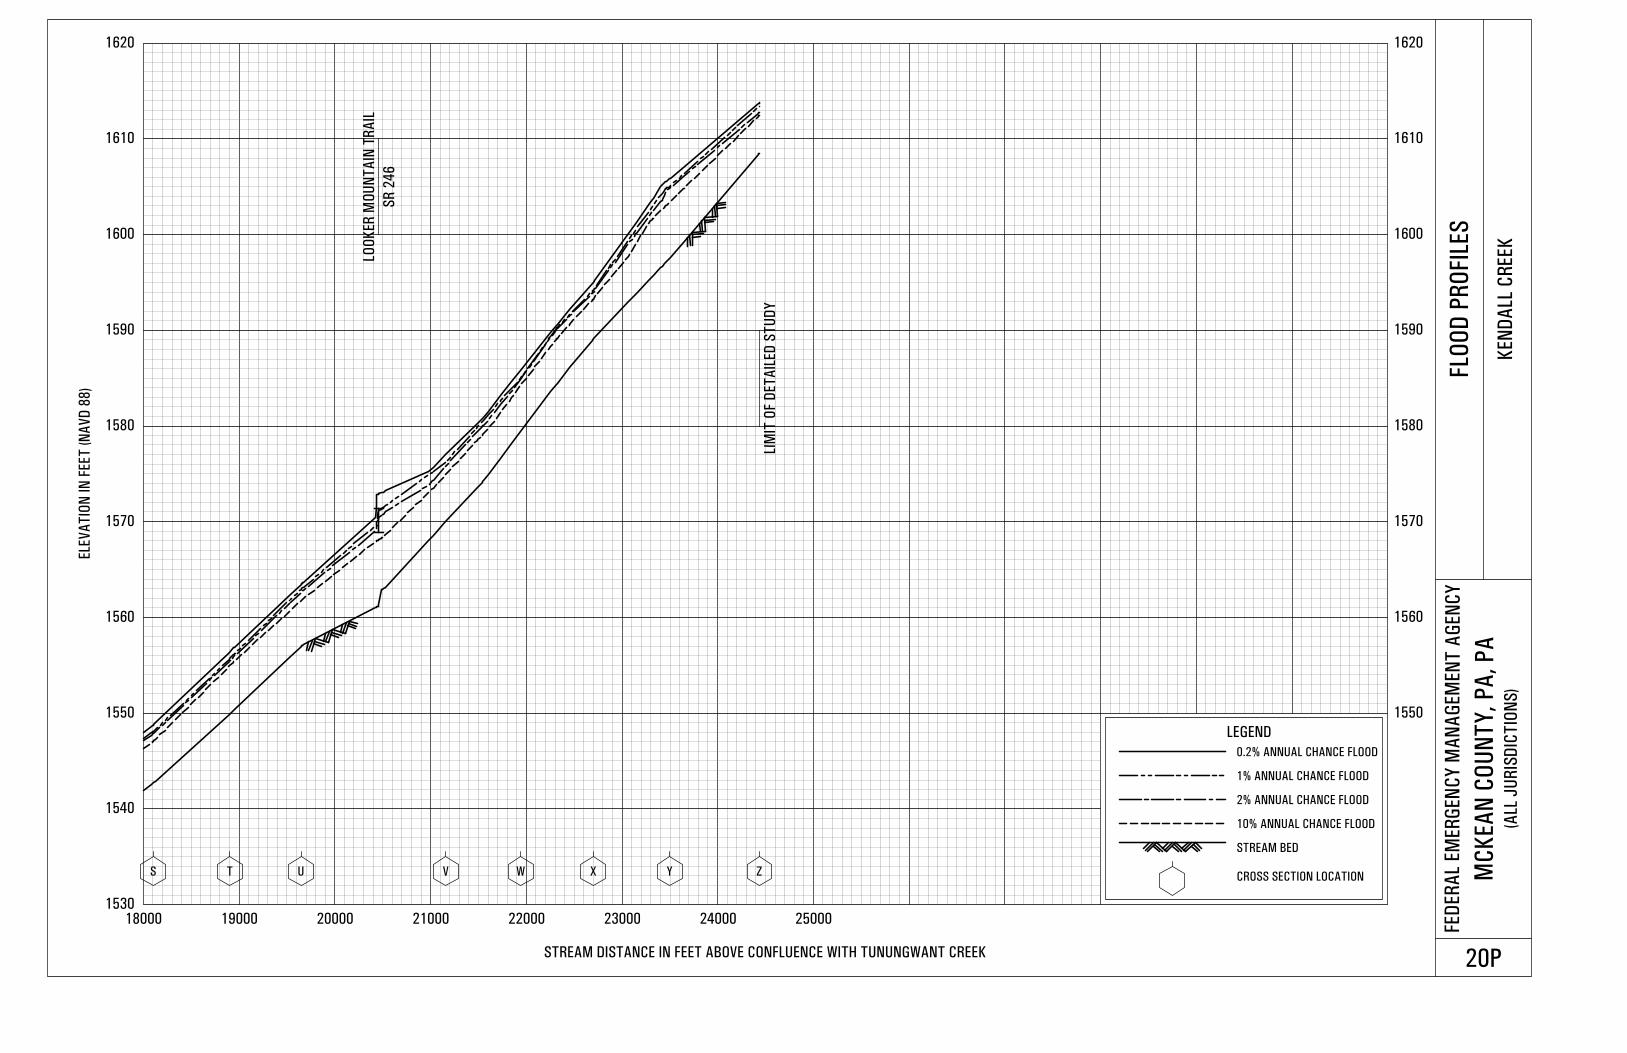
1530
1540
1550 1550
1560 1560
1570 1570
1580 1580
1590 1590
1600 1600
1610 1610
1620 1620
18000 19000 20000 21000 22000 23000 24000 25000
ELE
VA
TIO
N IN
FEET
(N
AV
D 8
8)
STREAM DISTANCE IN FEET ABOVE CONFLUENCE WITH TUNUNGWANT CREEK
FED
ER
AL
EM
ER
GEN
CY
MA
NA
GEM
EN
T A
GEN
CY
MC
KEA
N C
OU
NT
Y,
PA
, P
A(A
LL J
UR
ISD
ICT
ION
S)
FLO
OD
PR
OFIL
ES
KEN
DA
LL C
REEK
20P
S T U V W X Y Z
LIM
IT O
F D
ET
AIL
ED
ST
UD
Y
LOO
KER
MO
UN
TA
IN T
RA
IL
LEGEND
0.2% ANNUAL CHANCE FLOOD
1% ANNUAL CHANCE FLOOD
2% ANNUAL CHANCE FLOOD
10% ANNUAL CHANCE FLOOD
STREAM BED
CROSS SECTION LOCATION
SR
24
6
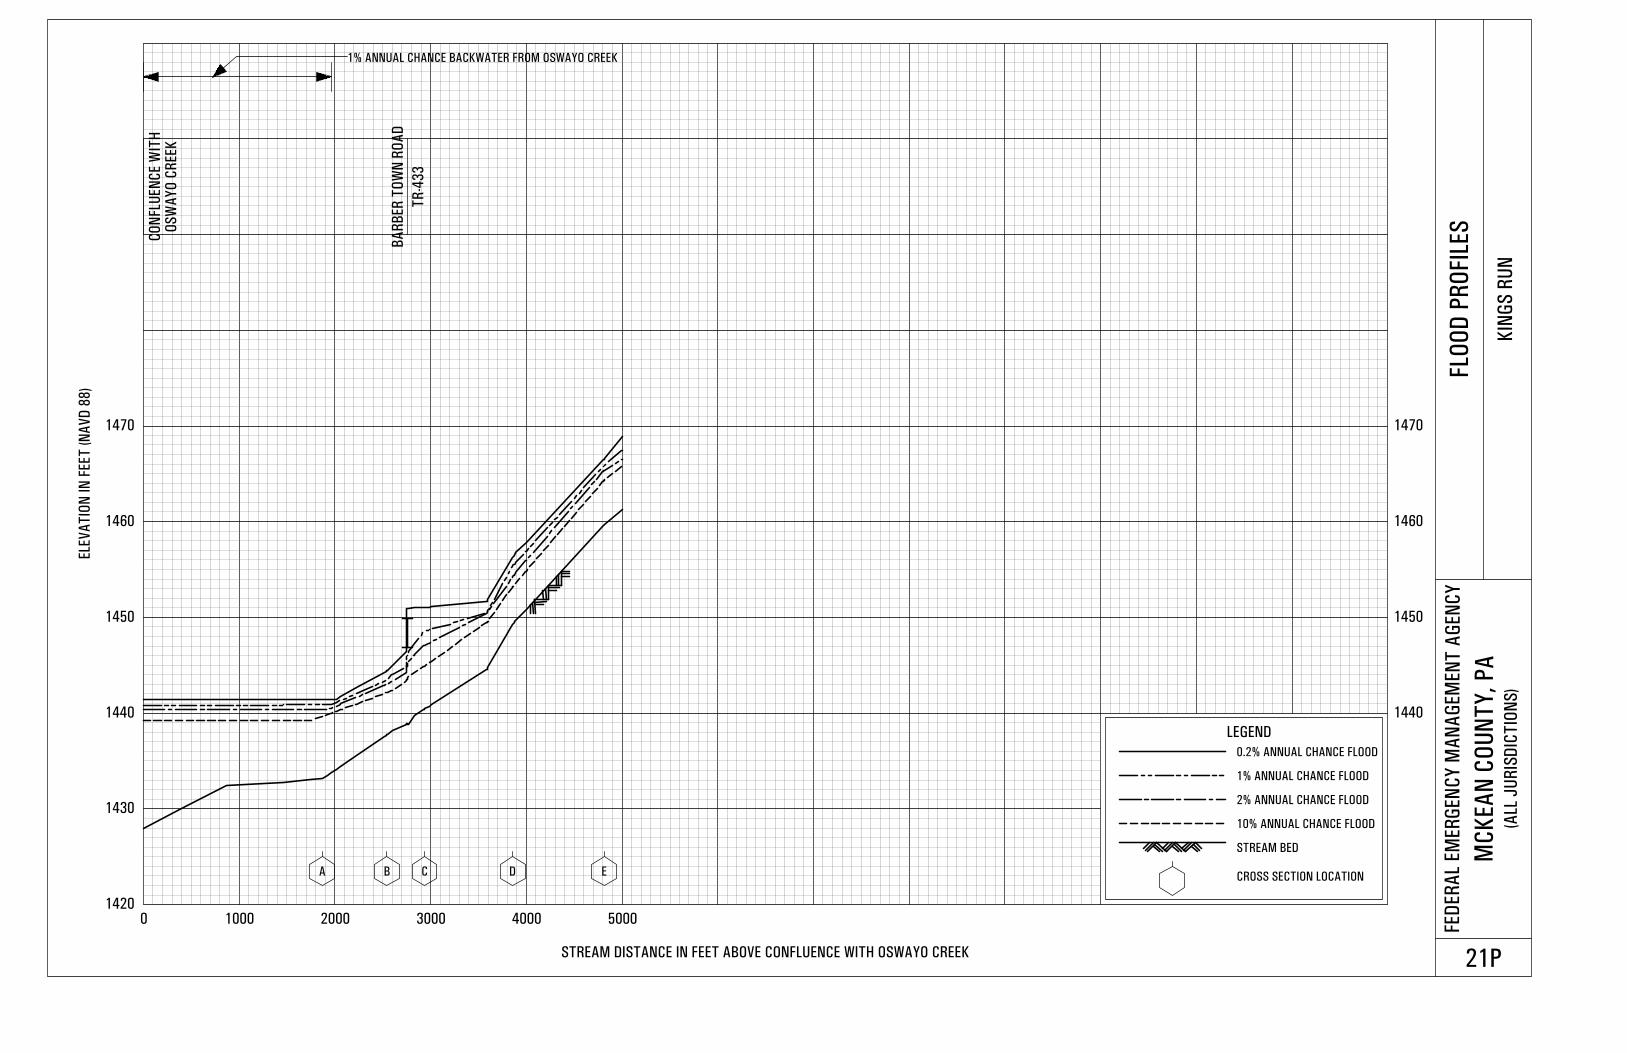
1420
1430
1440 1440
1450 1450
1460 1460
1470 1470
0 1000 2000 3000 4000 5000
ELE
VA
TIO
N IN
FEET
(N
AV
D 8
8)
STREAM DISTANCE IN FEET ABOVE CONFLUENCE WITH OSWAYO CREEK
FED
ER
AL
EM
ER
GEN
CY
MA
NA
GEM
EN
T A
GEN
CY
MC
KEA
N C
OU
NT
Y,
PA
(ALL
JU
RIS
DIC
TIO
NS
)
FLO
OD
PR
OFIL
ES
KIN
GS
RU
N
21P
A B C D E
CO
NFL
UEN
CE W
ITH
BA
RB
ER
TO
WN
RO
AD
LEGEND
0.2% ANNUAL CHANCE FLOOD
1% ANNUAL CHANCE FLOOD
2% ANNUAL CHANCE FLOOD
10% ANNUAL CHANCE FLOOD
STREAM BED
CROSS SECTION LOCATION
OS
WA
YO
CR
EEK
1% ANNUAL CHANCE BACKWATER FROM OSWAYO CREEK
TR
-43
3
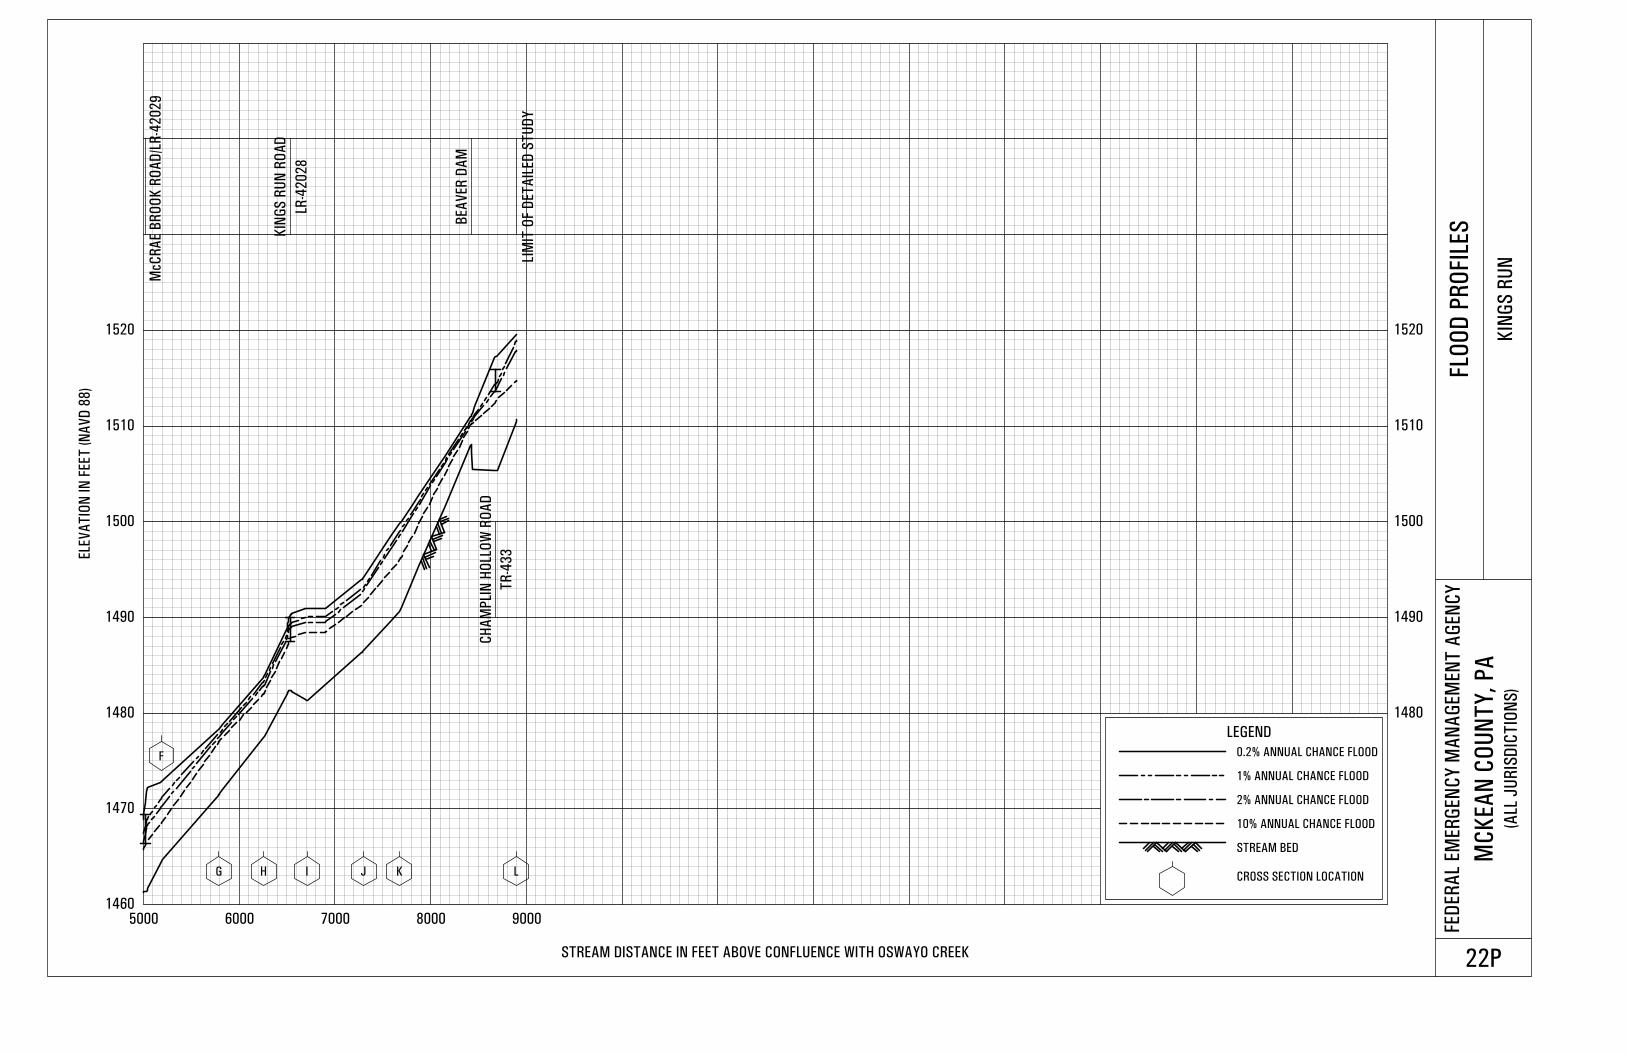
1460
1470
1480 1480
1490 1490
1500 1500
1510 1510
1520 1520
5000 6000 7000 8000 9000
ELE
VA
TIO
N IN
FEET
(N
AV
D 8
8)
STREAM DISTANCE IN FEET ABOVE CONFLUENCE WITH OSWAYO CREEK
FED
ER
AL
EM
ER
GEN
CY
MA
NA
GEM
EN
T A
GEN
CY
MC
KEA
N C
OU
NT
Y,
PA
(ALL
JU
RIS
DIC
TIO
NS
)
FLO
OD
PR
OFIL
ES
KIN
GS
RU
N
22P
F
G H I J K L
BEA
VER
DA
M
LIM
IT O
F D
ET
AIL
ED
ST
UD
Y
McC
RA
E B
RO
OK
RO
AD
/LR
-42
02
9
KIN
GS
RU
N R
OA
D
CH
AM
PLI
N H
OLL
OW
RO
AD
LEGEND
0.2% ANNUAL CHANCE FLOOD
1% ANNUAL CHANCE FLOOD
2% ANNUAL CHANCE FLOOD
10% ANNUAL CHANCE FLOOD
STREAM BED
CROSS SECTION LOCATION
LR-4
20
28
TR
-43
3
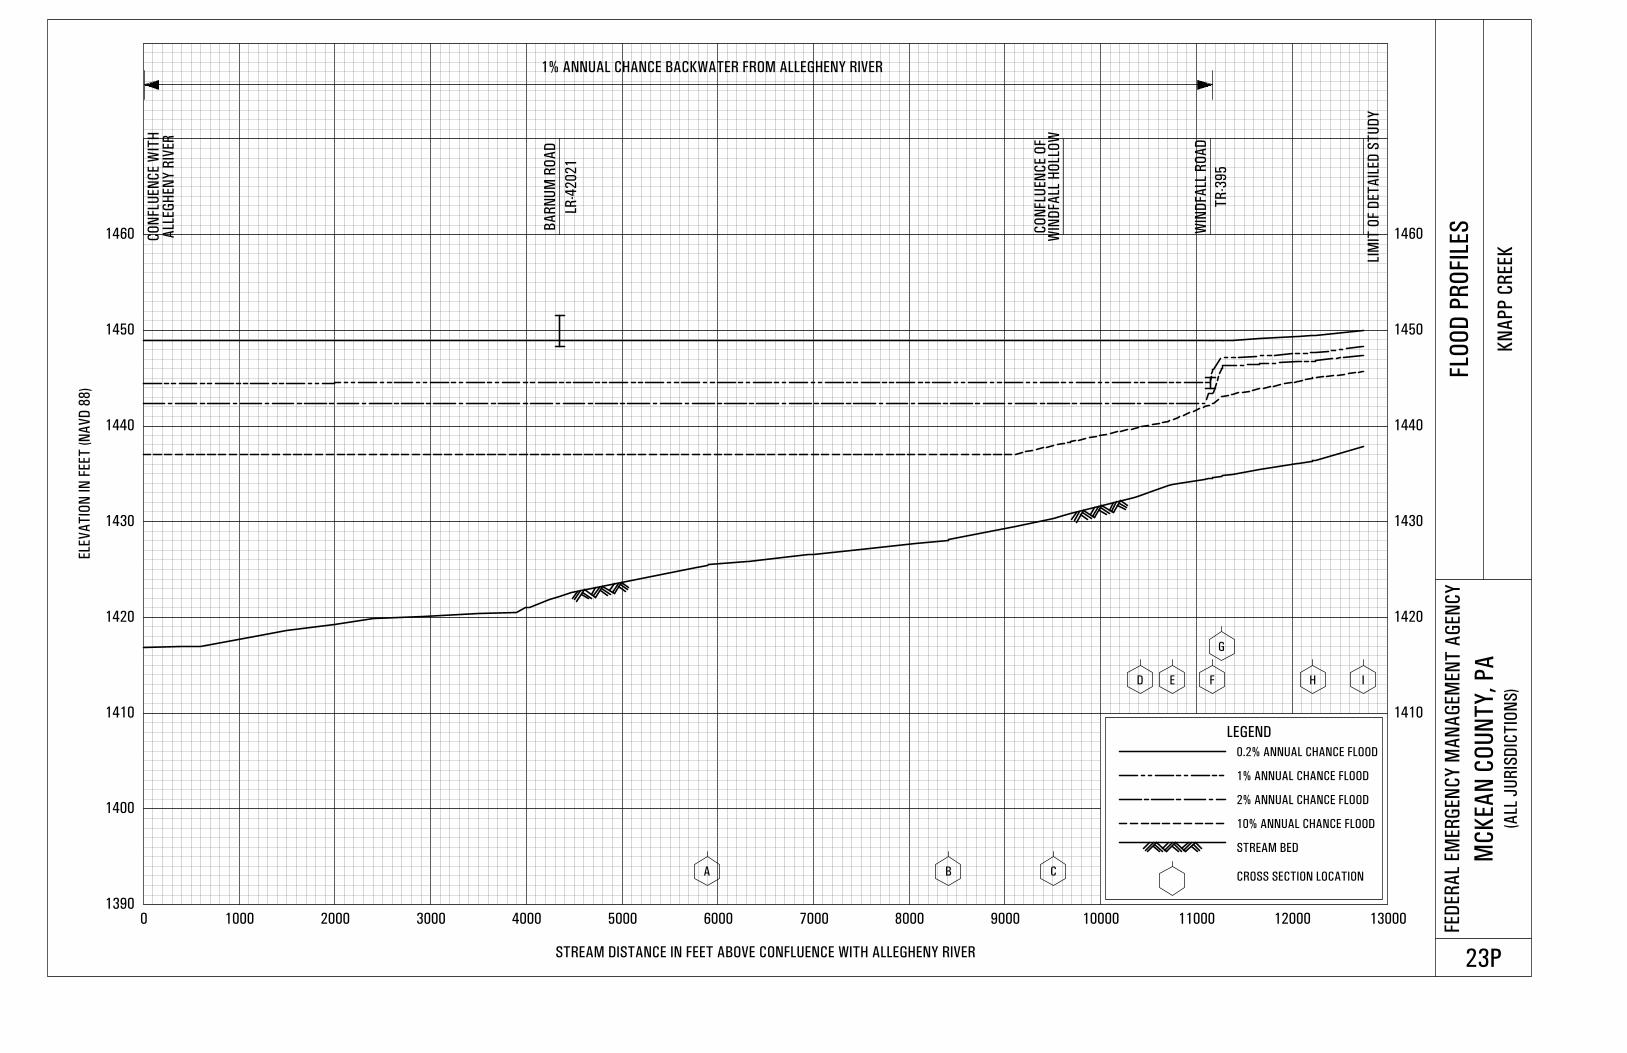
1390
1400
1410 1410
1420 1420
1430 1430
1440 1440
1450 1450
1460 1460
0 1000 2000 3000 4000 5000 6000 7000 8000 9000 10000 11000 12000 13000
ELE
VA
TIO
N IN
FEET
(N
AV
D 8
8)
STREAM DISTANCE IN FEET ABOVE CONFLUENCE WITH ALLEGHENY RIVER
FED
ER
AL
EM
ER
GEN
CY
MA
NA
GEM
EN
T A
GEN
CY
MC
KEA
N C
OU
NT
Y,
PA
(ALL
JU
RIS
DIC
TIO
NS
)
FLO
OD
PR
OFIL
ES
KN
AP
P C
REEK
23P
A B C
D E F
G
H I
CO
NFL
UEN
CE W
ITH
WIN
DFA
LL H
OLL
OW
LIM
IT O
F D
ET
AIL
ED
ST
UD
Y
BA
RN
UM
RO
AD
WIN
DFA
LL R
OA
D
LEGEND
0.2% ANNUAL CHANCE FLOOD
1% ANNUAL CHANCE FLOOD
2% ANNUAL CHANCE FLOOD
10% ANNUAL CHANCE FLOOD
STREAM BED
CROSS SECTION LOCATION
1% ANNUAL CHANCE BACKWATER FROM ALLEGHENY RIVER
ALL
EG
HEN
Y R
IVER
CO
NFLU
EN
CE O
F
TR
-39
5
LR-4
20
21
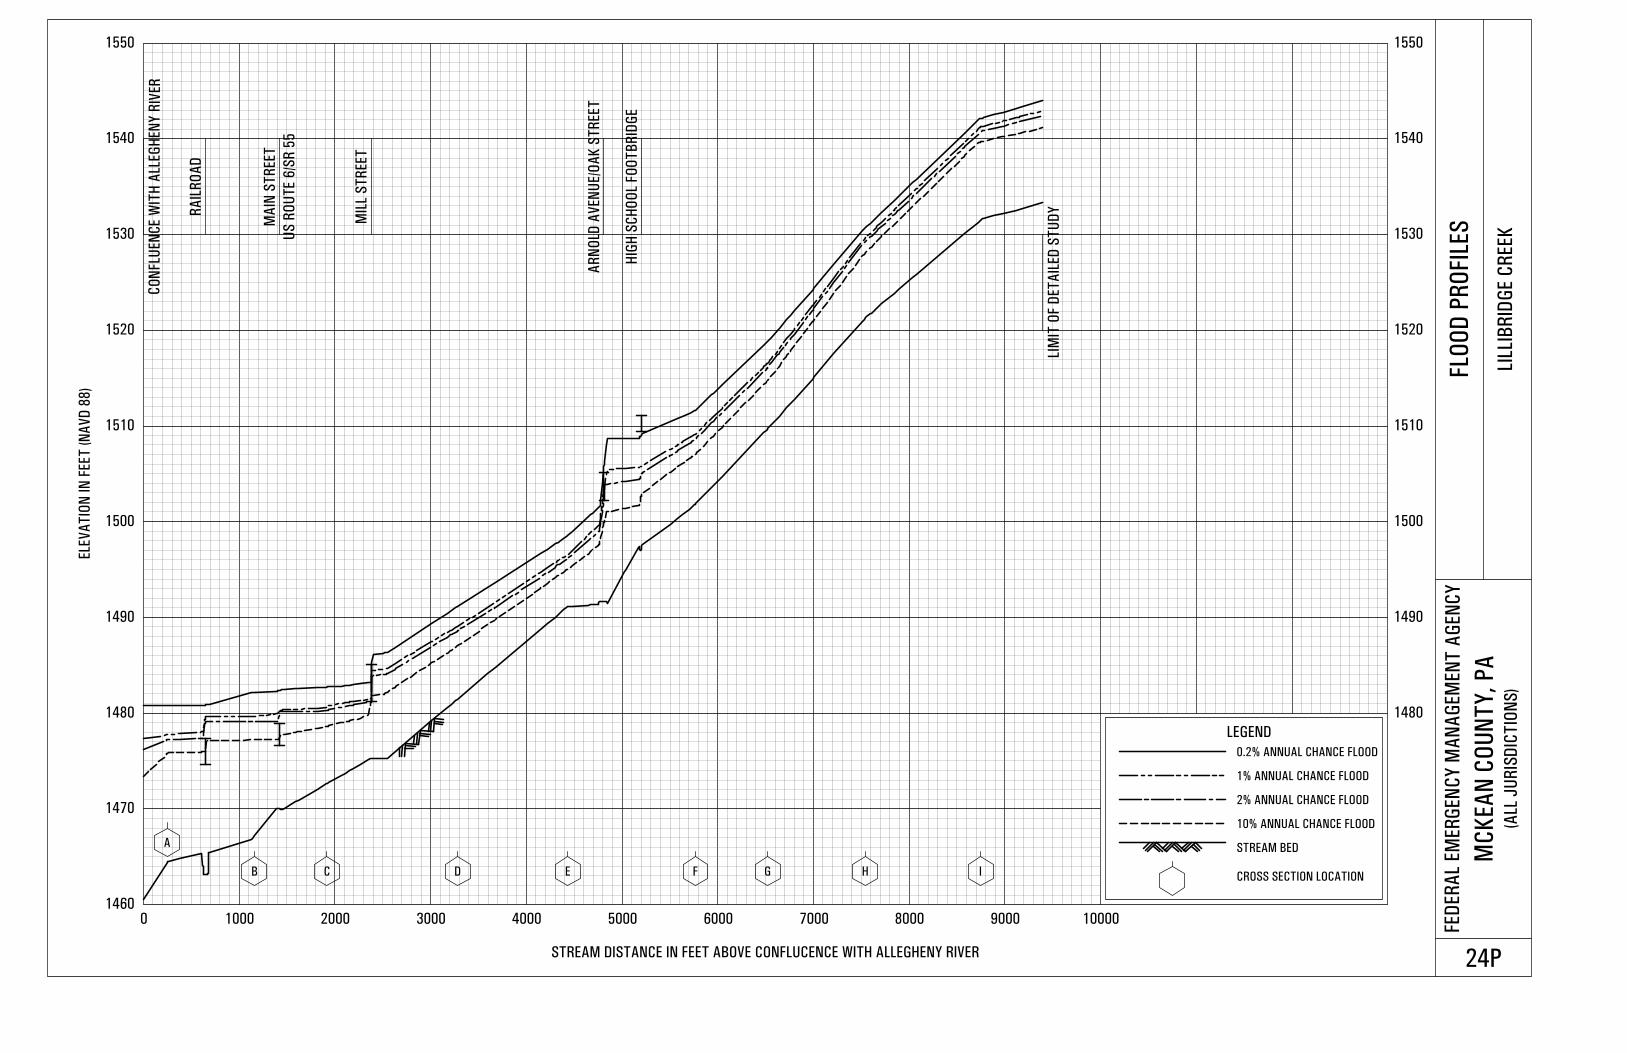
1460
1470
1480 1480
1490 1490
1500 1500
1510 1510
1520 1520
1530 1530
1540 1540
1550 1550
0 1000 2000 3000 4000 5000 6000 7000 8000 9000 10000
ELE
VA
TIO
N IN
FEET
(N
AV
D 8
8)
STREAM DISTANCE IN FEET ABOVE CONFLUCENCE WITH ALLEGHENY RIVER
FED
ER
AL
EM
ER
GEN
CY
MA
NA
GEM
EN
T A
GEN
CY
MC
KEA
N C
OU
NT
Y,
PA
(ALL
JU
RIS
DIC
TIO
NS
)
FLO
OD
PR
OFIL
ES
LILL
IBR
IDG
E C
REEK
24P
A
B C D E F G H I
CO
NFLU
EN
CE W
ITH
ALL
EG
HEN
Y R
IVER
LIM
IT O
F D
ET
AIL
ED
ST
UD
YRA
ILR
OA
D
MA
IN S
TR
EET
MIL
L S
TR
EET
AR
NO
LD A
VEN
UE/O
AK
ST
REET
HIG
H S
CH
OO
L FO
OT
BR
IDG
E
LEGEND
0.2% ANNUAL CHANCE FLOOD
1% ANNUAL CHANCE FLOOD
2% ANNUAL CHANCE FLOOD
10% ANNUAL CHANCE FLOOD
STREAM BED
CROSS SECTION LOCATION
US
RO
UT
E 6
/SR
55
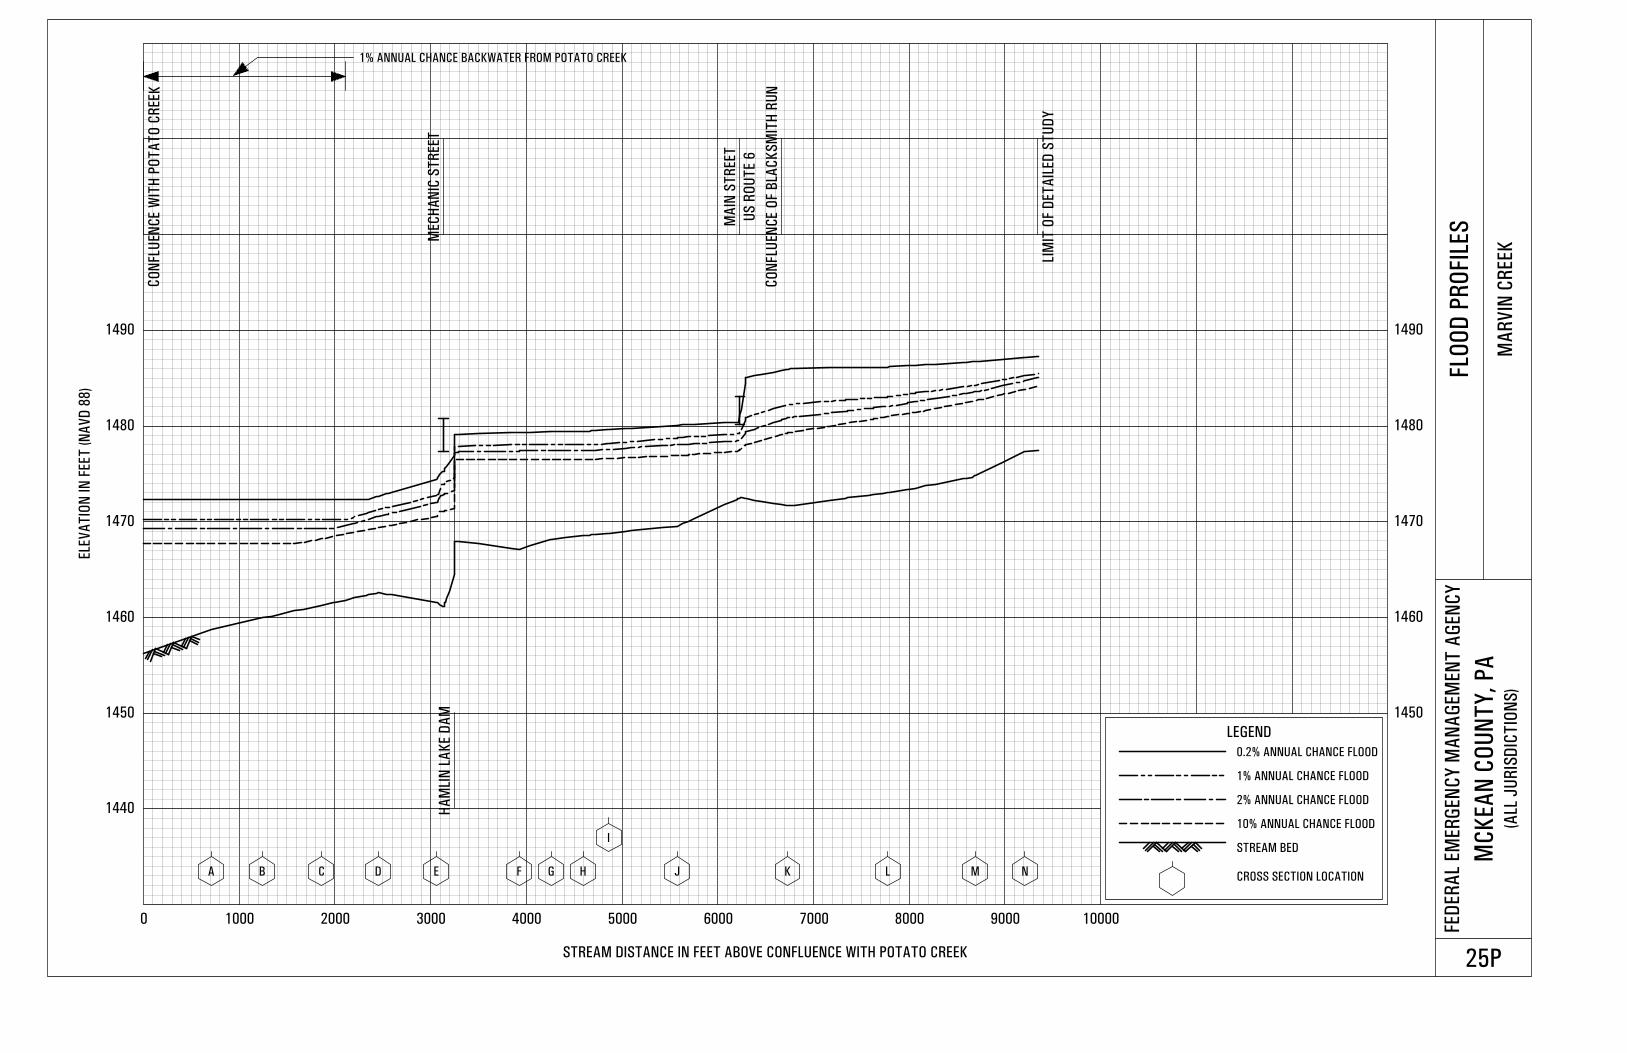
1440
1450 1450
1460 1460
1470 1470
1480 1480
1490 1490
0 1000 2000 3000 4000 5000 6000 7000 8000 9000 10000
ELE
VA
TIO
N IN
FEET
(N
AV
D 8
8)
STREAM DISTANCE IN FEET ABOVE CONFLUENCE WITH POTATO CREEK
FED
ER
AL
EM
ER
GEN
CY
MA
NA
GEM
EN
T A
GEN
CY
MC
KEA
N C
OU
NT
Y,
PA
(ALL
JU
RIS
DIC
TIO
NS
)
FLO
OD
PR
OFIL
ES
MA
RV
IN C
REEK
25P
A B C D E F G H
I
J K L M N
CO
NFL
UEN
CE W
ITH
PO
TA
TO
CR
EEK
CO
NFLU
EN
CE O
F B
LAC
KS
MIT
H R
UN
LIM
IT O
F D
ET
AIL
ED
ST
UD
Y
MEC
HA
NIC
ST
REET
HA
MLI
N L
AK
E D
AM
MA
IN S
TR
EET
LEGEND
0.2% ANNUAL CHANCE FLOOD
1% ANNUAL CHANCE FLOOD
2% ANNUAL CHANCE FLOOD
10% ANNUAL CHANCE FLOOD
STREAM BED
CROSS SECTION LOCATION
1% ANNUAL CHANCE BACKWATER FROM POTATO CREEK
US
RO
UT
E 6
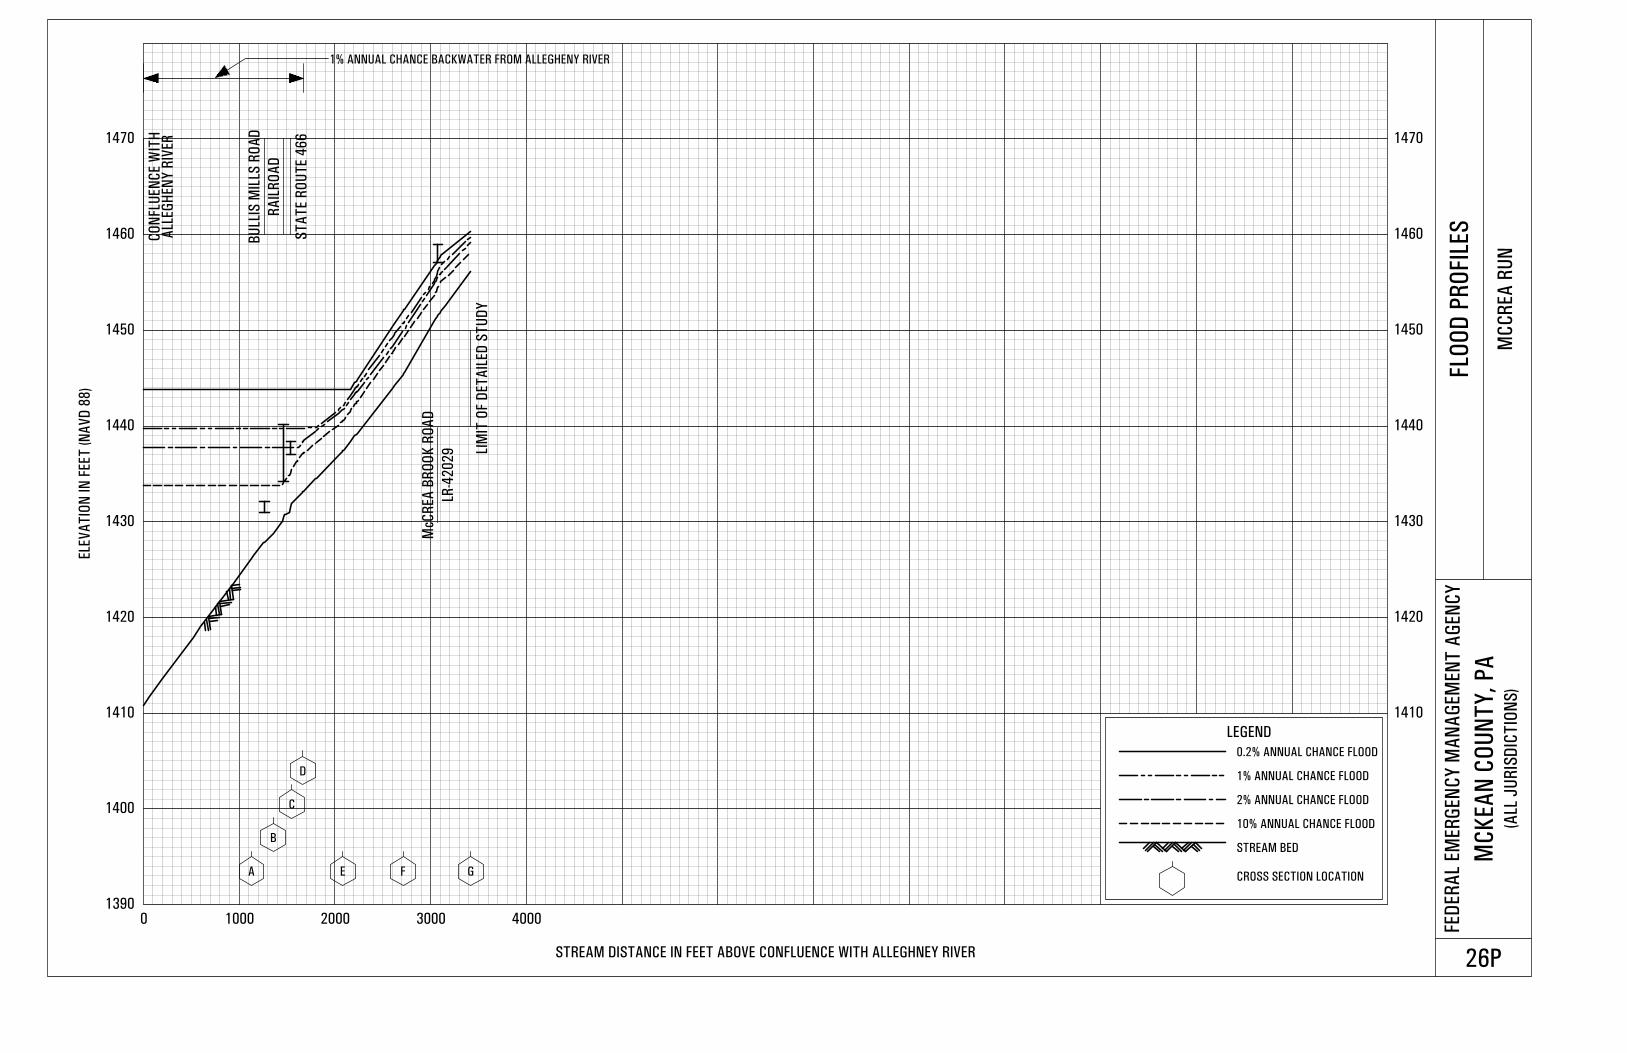
1390
1400
1410 1410
1420 1420
1430 1430
1440 1440
1450 1450
1460 1460
1470 1470
0 1000 2000 3000 4000
ELE
VA
TIO
N IN
FEET
(N
AV
D 8
8)
STREAM DISTANCE IN FEET ABOVE CONFLUENCE WITH ALLEGHNEY RIVER
FED
ER
AL
EM
ER
GEN
CY
MA
NA
GEM
EN
T A
GEN
CY
MC
KEA
N C
OU
NT
Y,
PA
(ALL
JU
RIS
DIC
TIO
NS
)
FLO
OD
PR
OFIL
ES
MC
CR
EA
RU
N
26P
A
B
C
D
E F G
CO
NFL
UEN
CE W
ITH
LIM
IT O
F D
ET
AIL
ED
ST
UD
Y
BU
LLIS
MIL
LS R
OA
D
RA
ILR
OA
D
ST
AT
E R
OU
TE 4
66
McC
REA
BR
OO
K R
OA
D
LEGEND
0.2% ANNUAL CHANCE FLOOD
1% ANNUAL CHANCE FLOOD
2% ANNUAL CHANCE FLOOD
10% ANNUAL CHANCE FLOOD
STREAM BED
CROSS SECTION LOCATION
1% ANNUAL CHANCE BACKWATER FROM ALLEGHENY RIVER
ALL
EG
HEN
Y R
IVER
LR-4
20
29

1430
1440
1450 1450
1460 1460
1470 1470
1480 1480
1490 1490
1500 1500
1510 1510
1520
0 500 1000 1500 2000 2500 3000 3500
ELE
VA
TIO
N IN
FEET
(N
AV
D 8
8)
STREAM DISTANCE IN FEET ABOVE CONFLUENCE WITH POTATO CREEK
FED
ER
AL
EM
ER
GEN
CY
MA
NA
GEM
EN
T A
GEN
CY
MC
KEA
N C
OU
NT
Y,
PA
(ALL
JU
RIS
DIC
TIO
NS
)
FLO
OD
PR
OFIL
ES
MIL
LER
BR
OO
K
27P
A B C
CO
NFL
UEN
CE W
ITH
LIM
IT O
F D
ET
AIL
ED
ST
UD
Y
RA
ILR
OA
D (A
BA
ND
ON
ED
)
DELT
A D
RIV
E
PR
IVA
TE B
RID
GE
PR
IVA
TE B
RID
GE
ST
AT
E R
OU
TE 4
6S
R 4
6 B
RID
GE (
AB
AN
DO
NED
)LEGEND
0.2% ANNUAL CHANCE FLOOD
1% ANNUAL CHANCE FLOOD
2% ANNUAL CHANCE FLOOD
10% ANNUAL CHANCE FLOOD
STREAM BED
CROSS SECTION LOCATION
1% ANNUAL CHANCE BACKWATER FROM POTATO CREEK
PO
TA
TO
CR
EEK
CULVERT
1520
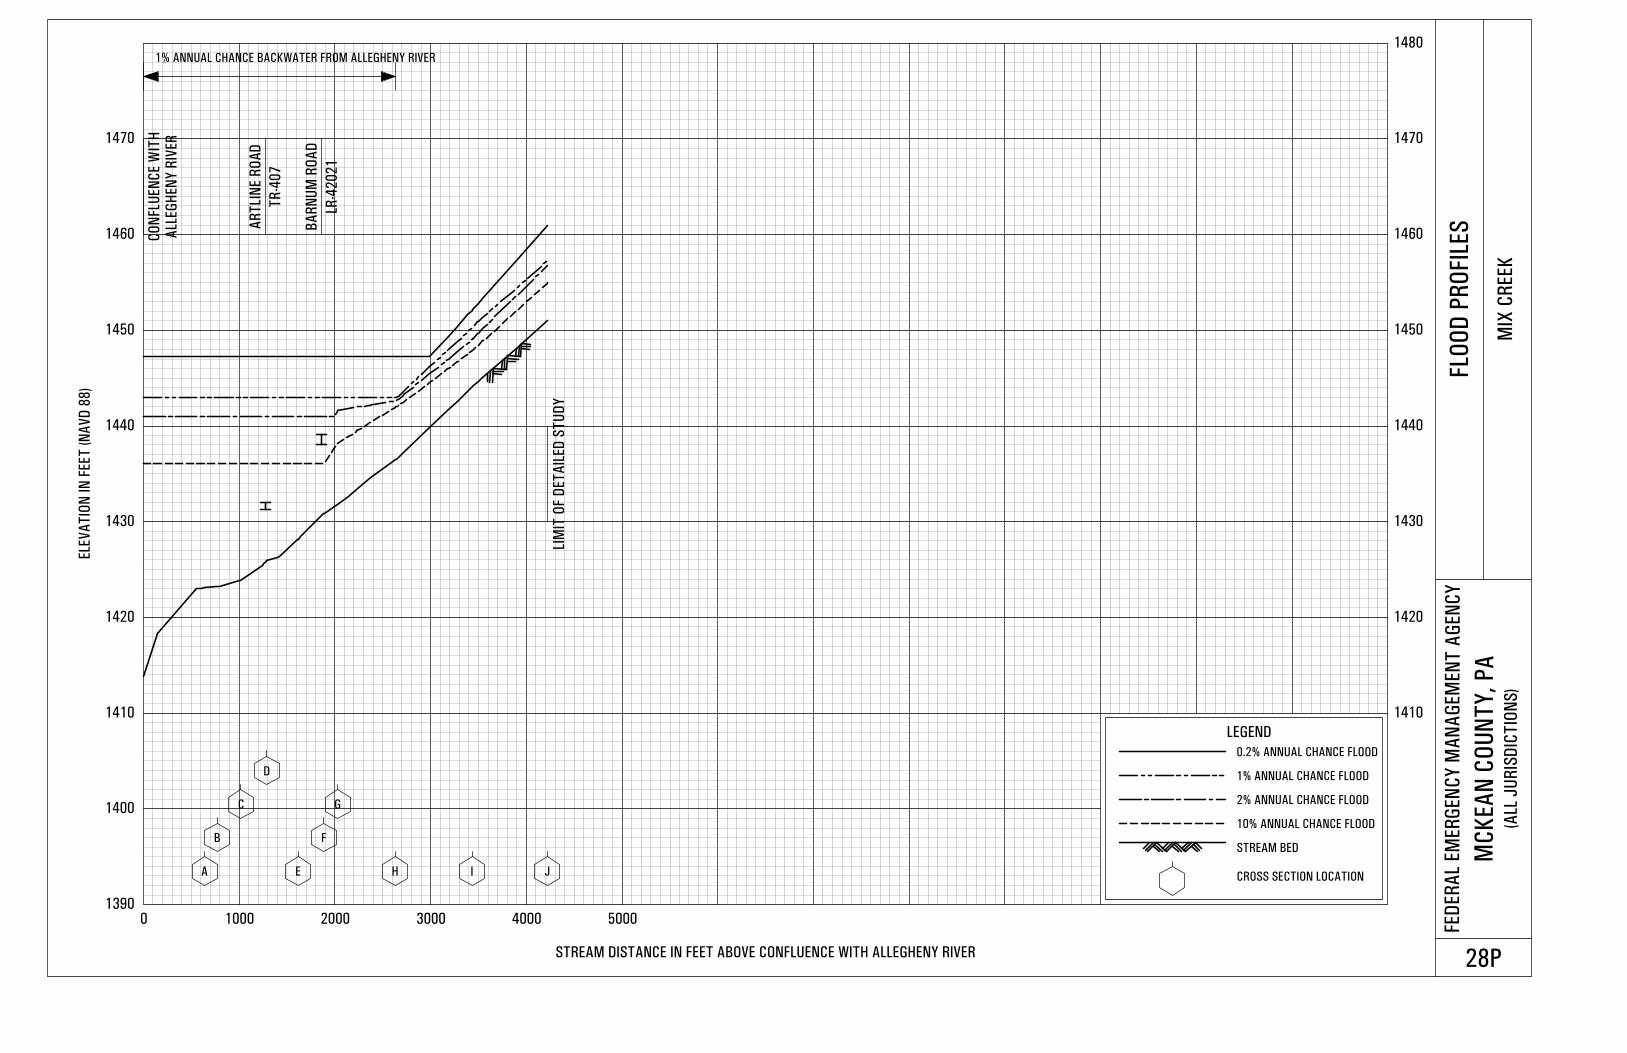
1390
1400
1410 1410
1420 1420
1430 1430
1440 1440
1450 1450
1460 1460
1470 1470
1480
0 1000 2000 3000 4000 5000
ELE
VA
TIO
N IN
FEET
(N
AV
D 8
8)
STREAM DISTANCE IN FEET ABOVE CONFLUENCE WITH ALLEGHENY RIVER
FED
ER
AL
EM
ER
GEN
CY
MA
NA
GEM
EN
T A
GEN
CY
MC
KEA
N C
OU
NT
Y,
PA
(ALL
JU
RIS
DIC
TIO
NS
)
FLO
OD
PR
OFIL
ES
MIX
CR
EEK
28P
A
B
C
D
E
F
G
H I J
CO
NFL
UEN
CE W
ITH
LIM
IT O
F D
ET
AIL
ED
ST
UD
Y
AR
TLI
NE R
OA
D
BA
RN
UM
RO
AD
LEGEND
0.2% ANNUAL CHANCE FLOOD
1% ANNUAL CHANCE FLOOD
2% ANNUAL CHANCE FLOOD
10% ANNUAL CHANCE FLOOD
STREAM BED
CROSS SECTION LOCATION
1% ANNUAL CHANCE BACKWATER FROM ALLEGHENY RIVER
ALL
EG
HEN
Y R
IVER
TR
-40
7
LR-4
20
21
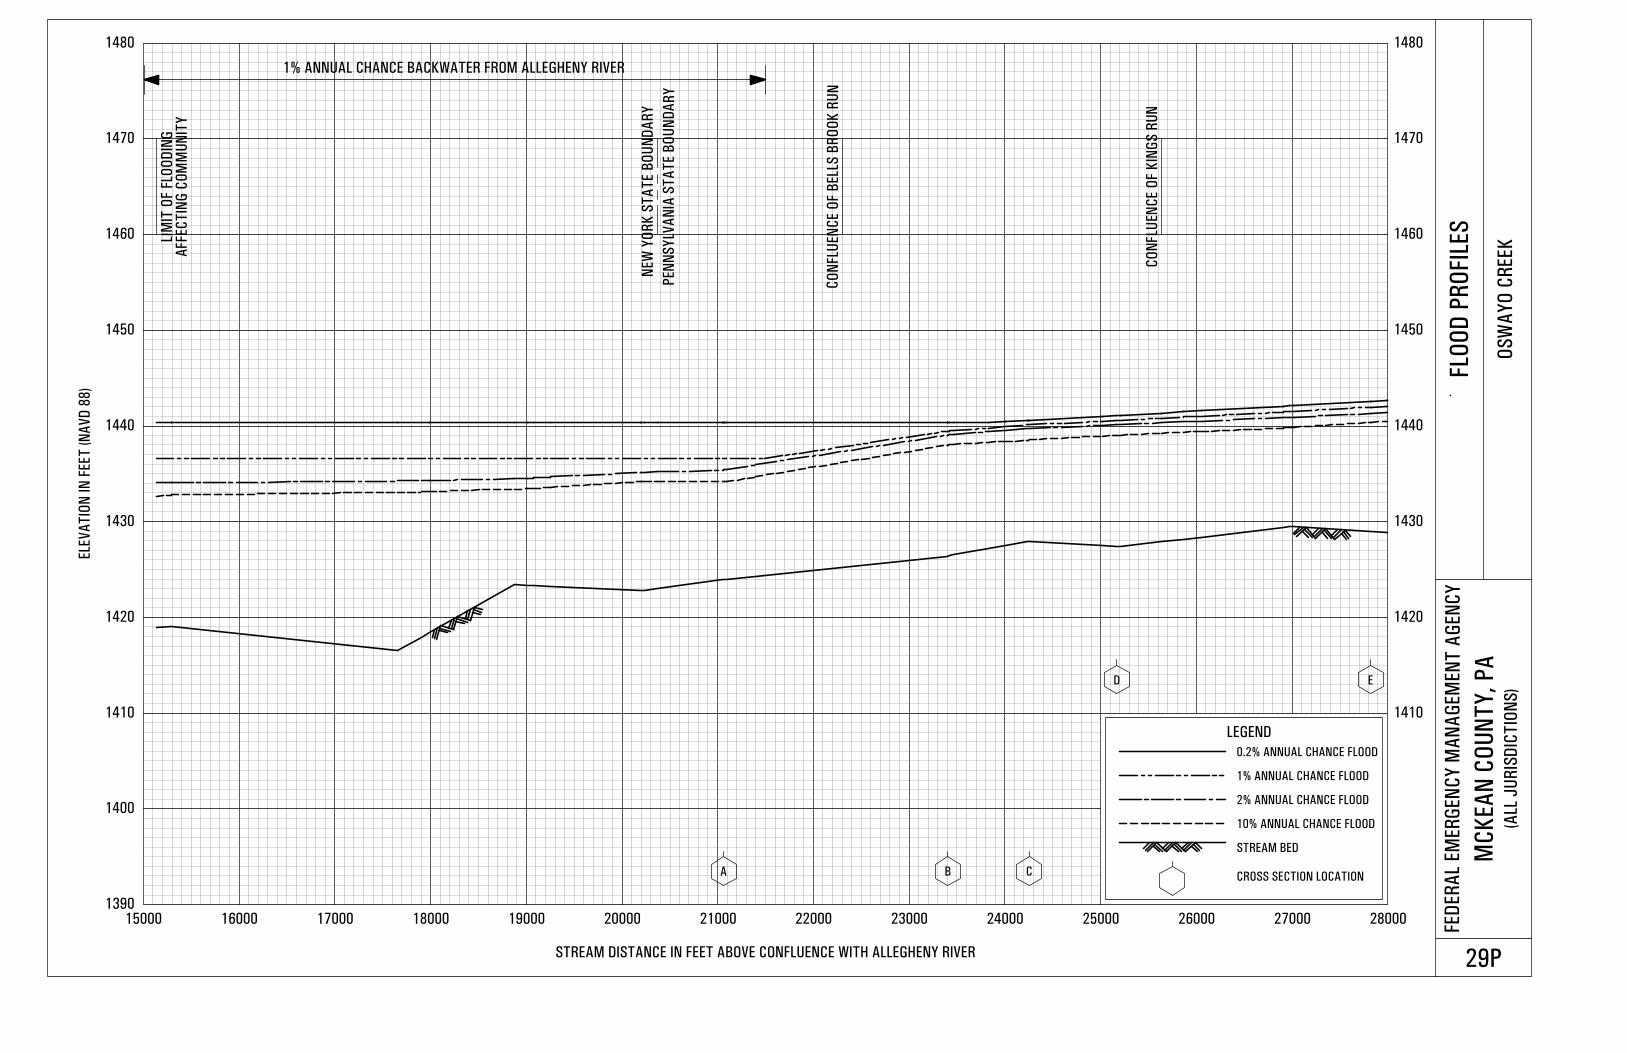
1390
1400
1410 1410
1420 1420
1430 1430
1440 1440
1450 1450
1460 1460
1470 1470
1480 1480
15000 16000 17000 18000 19000 20000 21000 22000 23000 24000 25000 26000 27000 28000
ELE
VA
TIO
N IN
FEET
(N
AV
D 8
8)
STREAM DISTANCE IN FEET ABOVE CONFLUENCE WITH ALLEGHENY RIVER
FED
ER
AL
EM
ER
GEN
CY
MA
NA
GEM
EN
T A
GEN
CY
MC
KEA
N C
OU
NT
Y,
PA
(ALL
JU
RIS
DIC
TIO
NS
)
FLO
OD
PR
OFIL
ES
OS
WA
YO
CR
EEK
29P
A B C
D E
LIM
IT O
F FL
OO
DIN
G
NEW
YO
RK
ST
AT
E B
OU
ND
AR
Y
CO
NFLU
EN
CE O
F K
ING
S R
UN
LEGEND
0.2% ANNUAL CHANCE FLOOD
1% ANNUAL CHANCE FLOOD
2% ANNUAL CHANCE FLOOD
10% ANNUAL CHANCE FLOOD
STREAM BED
CROSS SECTION LOCATION
AFFE
CT
ING
CO
MM
UN
ITY
1% ANNUAL CHANCE BACKWATER FROM ALLEGHENY RIVER
PEN
NS
YLV
AN
IA S
TA
TE B
OU
ND
AR
Y
CO
NFL
UEN
CE O
F B
ELL
S B
RO
OK
RU
N
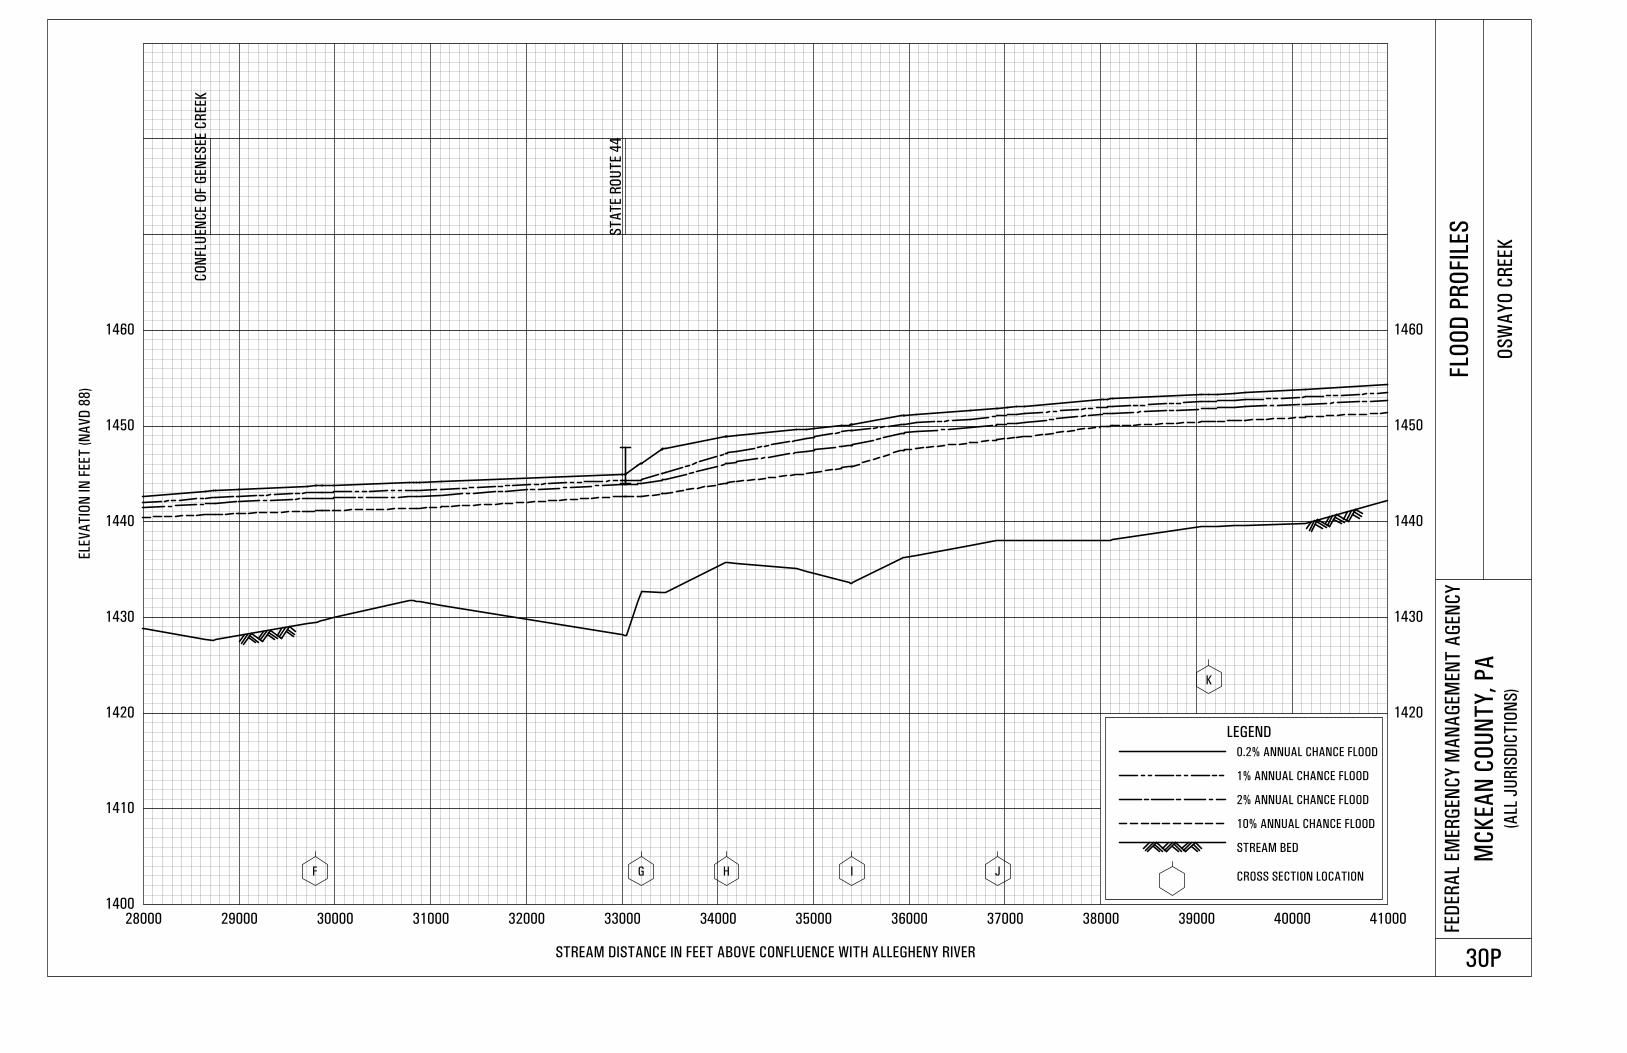
1400
1410
1420 1420
1430 1430
1440 1440
1450 1450
1460 1460
28000 29000 30000 31000 32000 33000 34000 35000 36000 37000 38000 39000 40000 41000
ELE
VA
TIO
N IN
FEET
(N
AV
D 8
8)
STREAM DISTANCE IN FEET ABOVE CONFLUENCE WITH ALLEGHENY RIVER
FED
ER
AL
EM
ER
GEN
CY
MA
NA
GEM
EN
T A
GEN
CY
MC
KEA
N C
OU
NT
Y,
PA
(ALL
JU
RIS
DIC
TIO
NS
)
FLO
OD
PR
OFIL
ES
OS
WA
YO
CR
EEK
30P
F G H I J
K
ST
AT
E R
OU
TE 4
4
LEGEND
0.2% ANNUAL CHANCE FLOOD
1% ANNUAL CHANCE FLOOD
2% ANNUAL CHANCE FLOOD
10% ANNUAL CHANCE FLOOD
STREAM BED
CROSS SECTION LOCATION
CO
NFL
UEN
CE O
F G
EN
ES
EE C
REEK
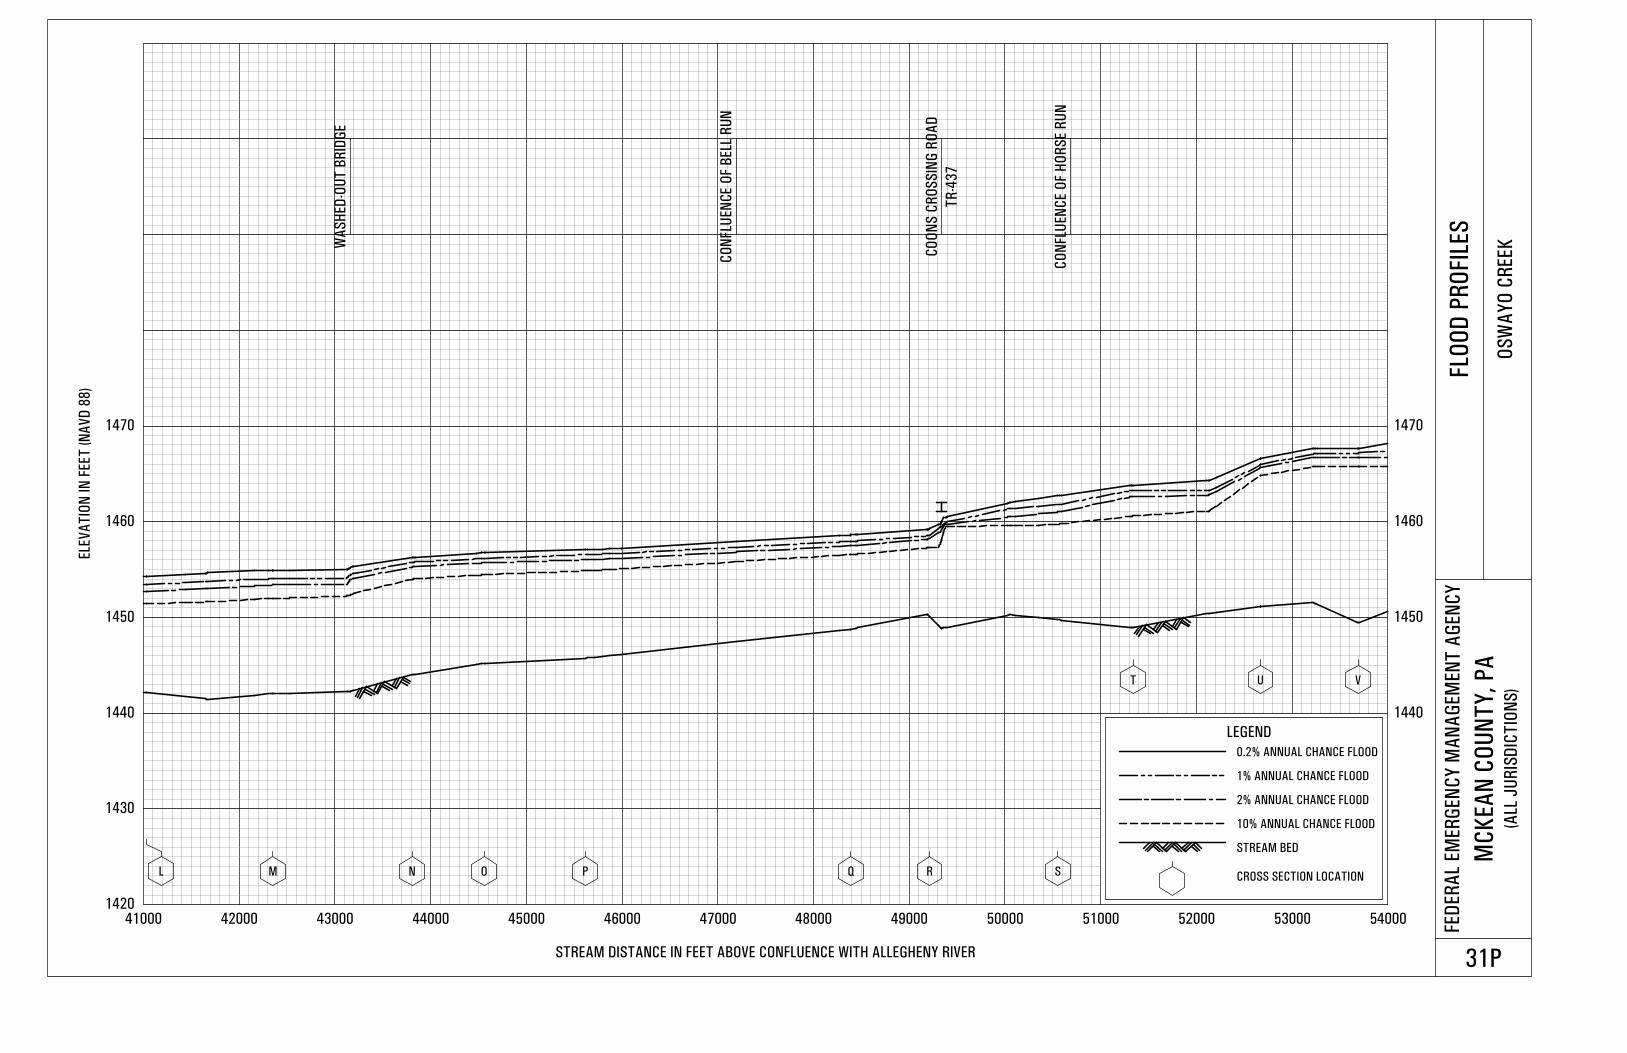
1420
1430
1440 1440
1450 1450
1460 1460
1470 1470
41000 42000 43000 44000 45000 46000 47000 48000 49000 50000 51000 52000 53000 54000
ELE
VA
TIO
N IN
FEET
(N
AV
D 8
8)
STREAM DISTANCE IN FEET ABOVE CONFLUENCE WITH ALLEGHENY RIVER
FED
ER
AL
EM
ER
GEN
CY
MA
NA
GEM
EN
T A
GEN
CY
MC
KEA
N C
OU
NT
Y,
PA
(ALL
JU
RIS
DIC
TIO
NS
)
FLO
OD
PR
OFIL
ES
OS
WA
YO
CR
EEK
31P
L M N O P Q R S
T U V
WA
SH
ED
-OU
T B
RID
GE
CO
NFLU
EN
CE O
F B
ELL
RU
N
CO
ON
S C
RO
SS
ING
RO
AD
LEGEND
0.2% ANNUAL CHANCE FLOOD
1% ANNUAL CHANCE FLOOD
2% ANNUAL CHANCE FLOOD
10% ANNUAL CHANCE FLOOD
STREAM BED
CROSS SECTION LOCATION
TR
-43
7
CO
NFL
UEN
CE O
F H
OR
SE R
UN
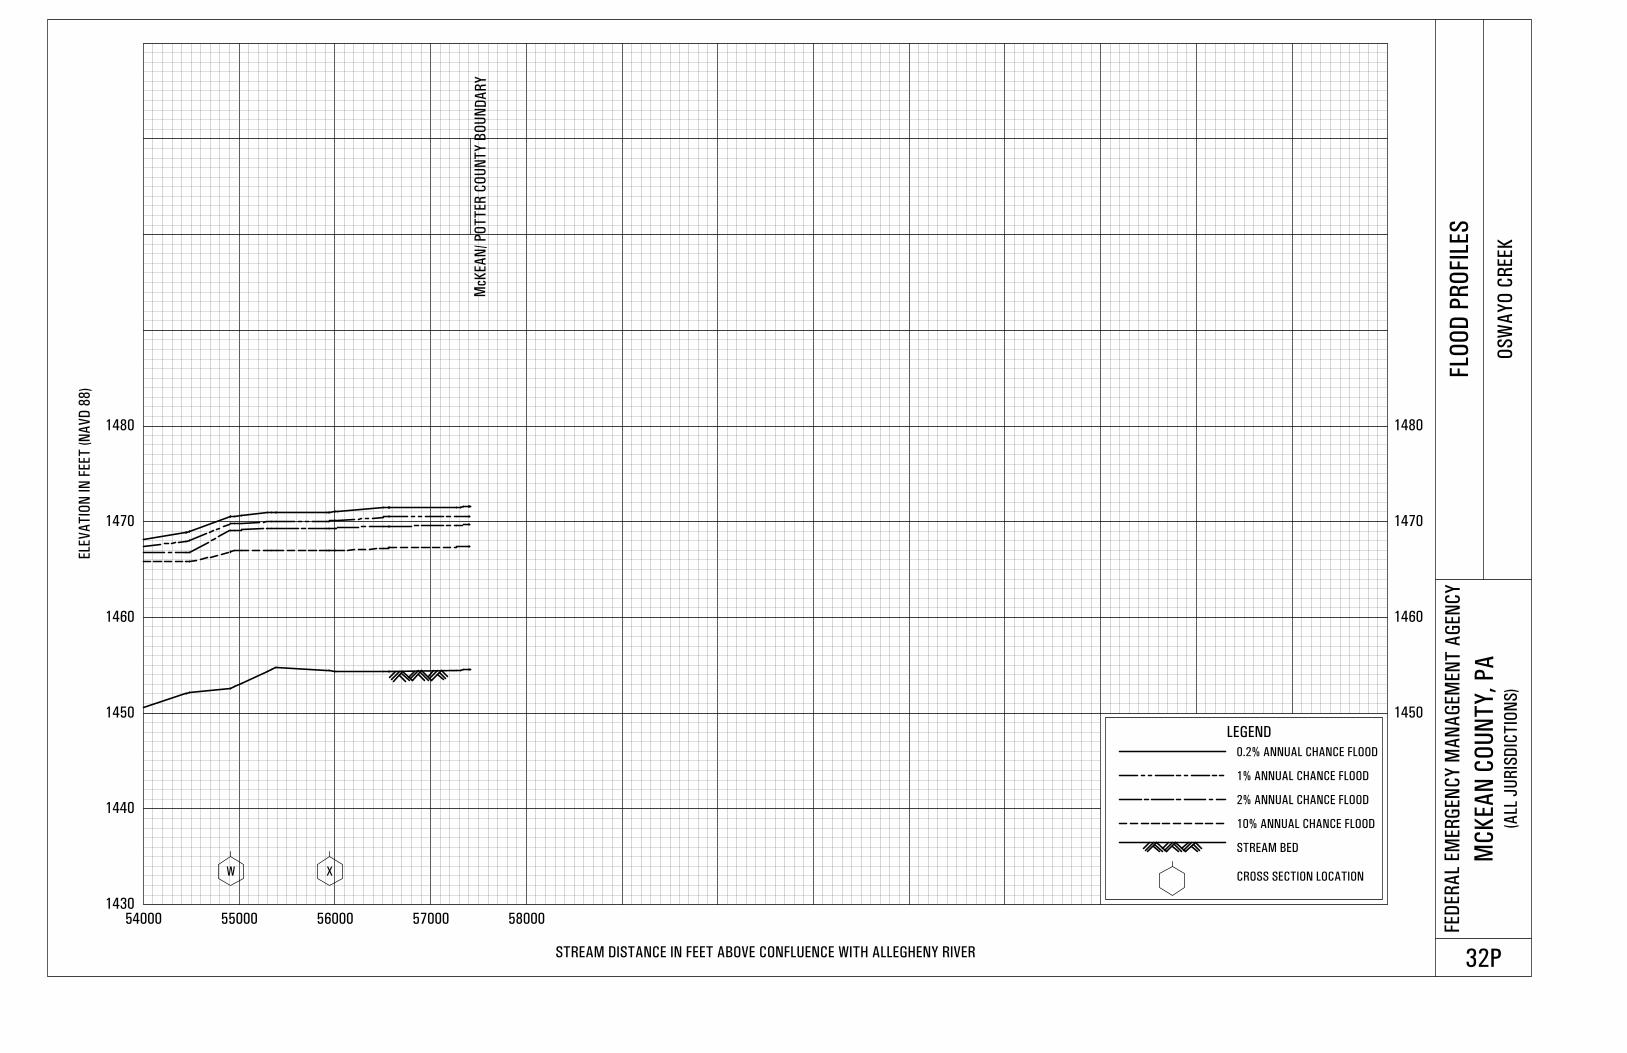
1430
1440
1450 1450
1460 1460
1470 1470
1480 1480
54000 55000 56000 57000 58000
ELE
VA
TIO
N IN
FEET
(N
AV
D 8
8)
STREAM DISTANCE IN FEET ABOVE CONFLUENCE WITH ALLEGHENY RIVER
FED
ER
AL
EM
ER
GEN
CY
MA
NA
GEM
EN
T A
GEN
CY
MC
KEA
N C
OU
NT
Y,
PA
(ALL
JU
RIS
DIC
TIO
NS
)
FLO
OD
PR
OFIL
ES
OS
WA
YO
CR
EEK
32P
W X
McK
EA
N/ P
OT
TER
CO
UN
TY
BO
UN
DA
RY
LEGEND
0.2% ANNUAL CHANCE FLOOD
1% ANNUAL CHANCE FLOOD
2% ANNUAL CHANCE FLOOD
10% ANNUAL CHANCE FLOOD
STREAM BED
CROSS SECTION LOCATION
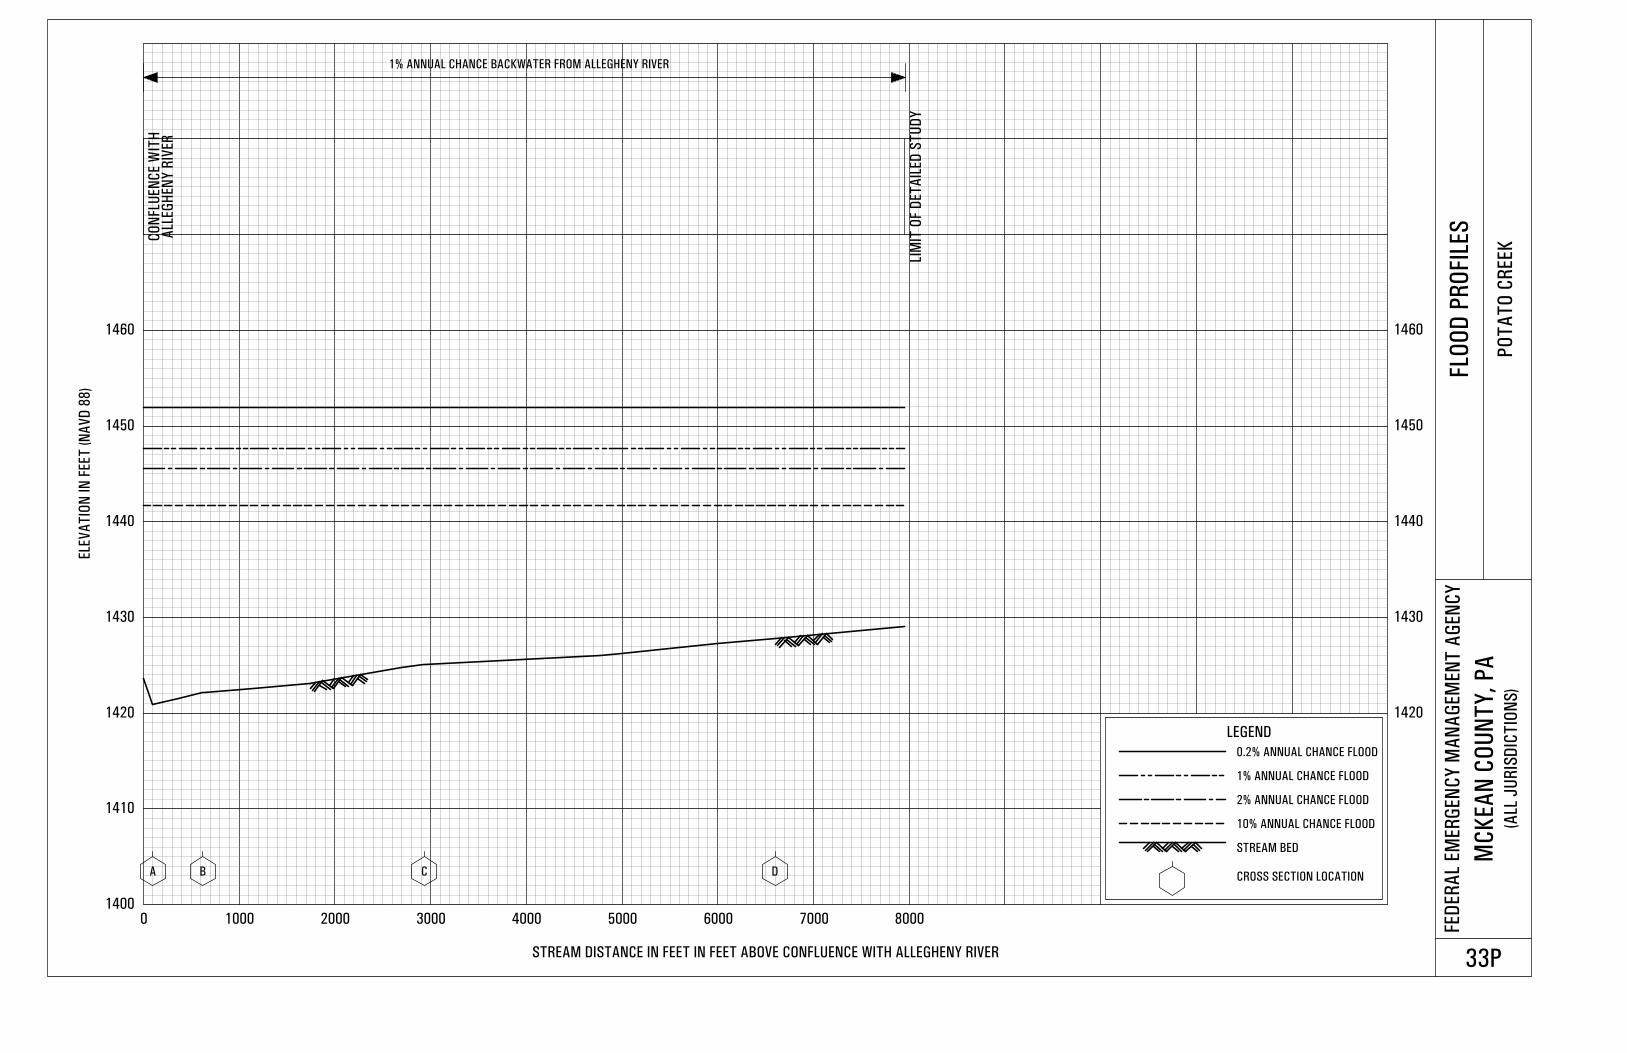
1400
1410
1420 1420
1430 1430
1440 1440
1450 1450
1460 1460
0 1000 2000 3000 4000 5000 6000 7000 8000
ELE
VA
TIO
N IN
FEET
(N
AV
D 8
8)
STREAM DISTANCE IN FEET IN FEET ABOVE CONFLUENCE WITH ALLEGHENY RIVER
FED
ER
AL
EM
ER
GEN
CY
MA
NA
GEM
EN
T A
GEN
CY
MC
KEA
N C
OU
NT
Y,
PA
(ALL
JU
RIS
DIC
TIO
NS
)
FLO
OD
PR
OFIL
ES
PO
TA
TO
CR
EEK
33P
A B C D
CO
NFL
UEN
CE W
ITH
LEGEND
0.2% ANNUAL CHANCE FLOOD
1% ANNUAL CHANCE FLOOD
2% ANNUAL CHANCE FLOOD
10% ANNUAL CHANCE FLOOD
STREAM BED
CROSS SECTION LOCATION
ALL
EG
HEN
Y R
IVER
LIM
IT O
F D
ET
AIL
ED
ST
UD
Y
1% ANNUAL CHANCE BACKWATER FROM ALLEGHENY RIVER
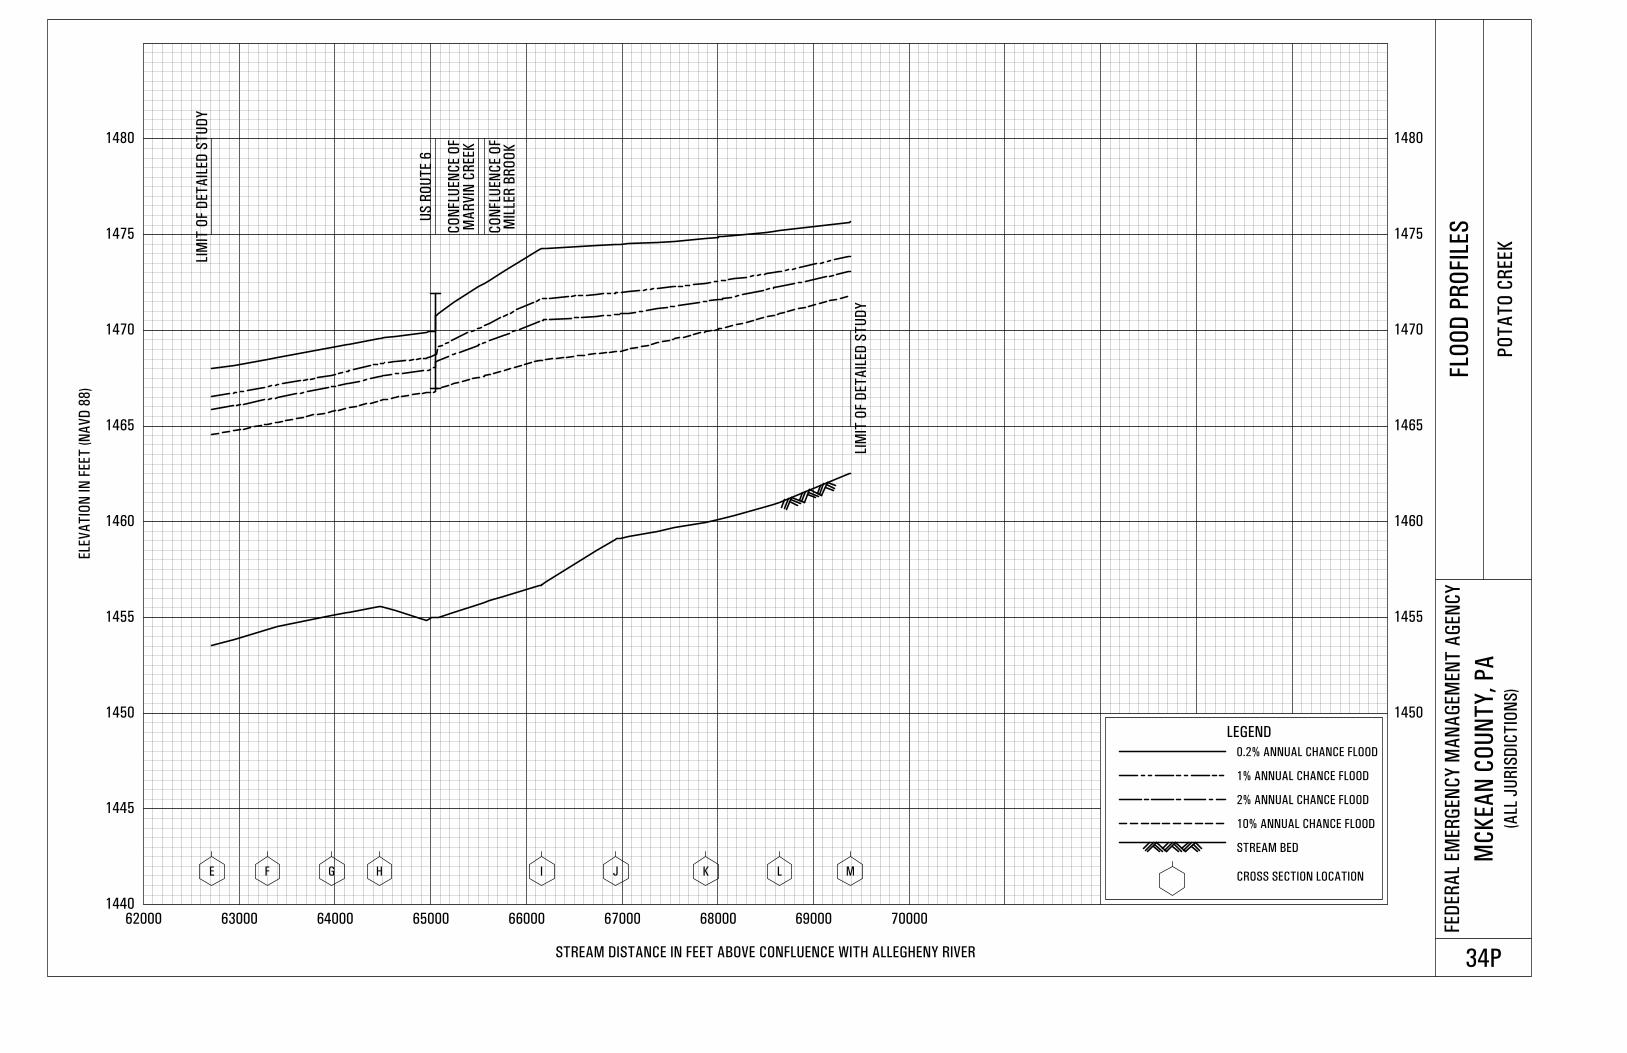
1440
1445
1450 1450
1455 1455
1460 1460
1465 1465
1470 1470
1475 1475
1480 1480
62000 63000 64000 65000 66000 67000 68000 69000 70000
ELE
VA
TIO
N IN
FEET
(N
AV
D 8
8)
STREAM DISTANCE IN FEET ABOVE CONFLUENCE WITH ALLEGHENY RIVER
FED
ER
AL
EM
ER
GEN
CY
MA
NA
GEM
EN
T A
GEN
CY
MC
KEA
N C
OU
NT
Y,
PA
(ALL
JU
RIS
DIC
TIO
NS
)
FLO
OD
PR
OFIL
ES
PO
TA
TO
CR
EEK
34P
E F G H I J K L M
LIM
IT O
F D
ET
AIL
ED
ST
UD
Y
MA
RV
IN C
REEK
CO
NFLU
EN
CE O
F
LIM
IT O
F D
ET
AIL
ED
ST
UD
Y
US
RO
UT
E 6
LEGEND
0.2% ANNUAL CHANCE FLOOD
1% ANNUAL CHANCE FLOOD
2% ANNUAL CHANCE FLOOD
10% ANNUAL CHANCE FLOOD
STREAM BED
CROSS SECTION LOCATION
CO
NFLU
EN
CE O
F
MIL
LER
BR
OO
K
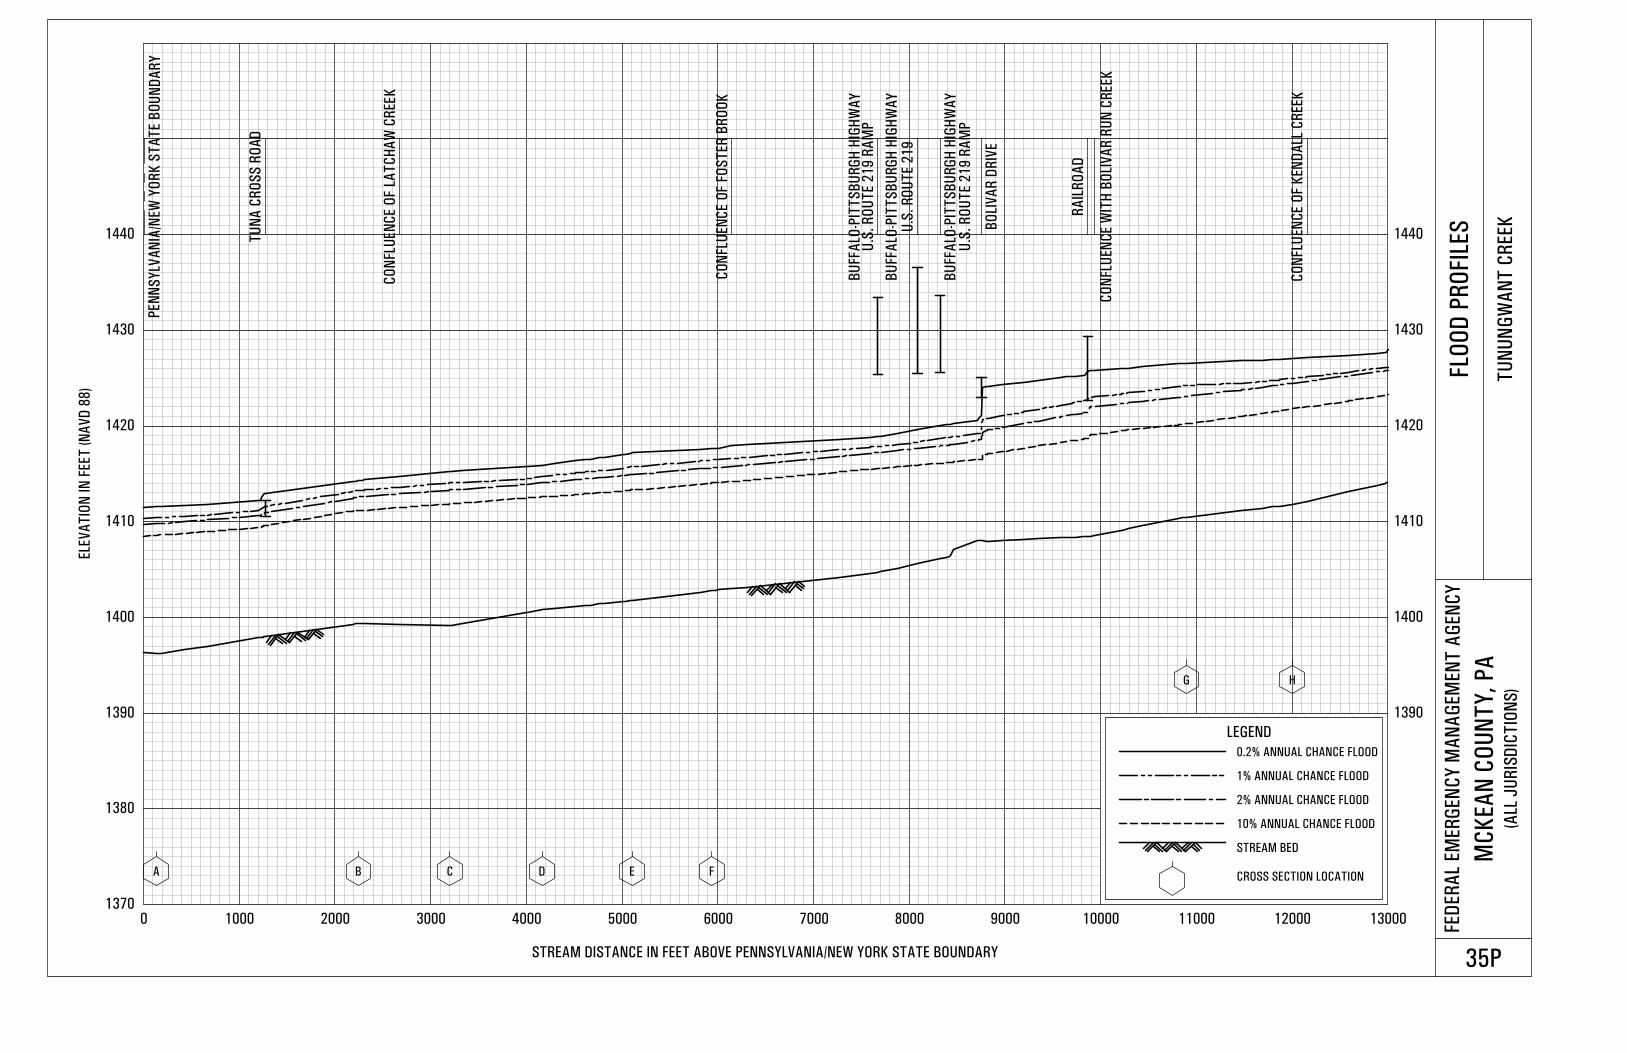
1370
1380
1390 1390
1400 1400
1410 1410
1420 1420
1430 1430
1440 1440
0 1000 2000 3000 4000 5000 6000 7000 8000 9000 10000 11000 12000 13000
ELE
VA
TIO
N IN
FEET
(N
AV
D 8
8)
STREAM DISTANCE IN FEET ABOVE PENNSYLVANIA/NEW YORK STATE BOUNDARY
FED
ER
AL
EM
ER
GEN
CY
MA
NA
GEM
EN
T A
GEN
CY
MC
KEA
N C
OU
NT
Y,
PA
(ALL
JU
RIS
DIC
TIO
NS
)
FLO
OD
PR
OFIL
ES
TU
NU
NG
WA
NT
CR
EEK
35P
A B C D E F
G H
PEN
NS
YLV
AN
IA/N
EW
YO
RK
ST
AT
E B
OU
ND
AR
Y
CO
NFL
UEN
CE O
F L
AT
CH
AW
CR
EEK
CO
NFL
UEN
CE O
F F
OS
TER
BR
OO
K
CO
NFL
UEN
CE W
ITH
BO
LIV
AR
RU
N C
REEK
CO
NFLU
EN
CE O
F K
EN
DA
LL C
REEK
TU
NA
CR
OS
S R
OA
D
U.S
. R
OU
TE 2
19
RA
MP
U.S
. R
OU
TE 2
19
U.S
. R
OU
TE 2
19
RA
MP
BO
LIV
AR
DR
IVE
RA
ILR
OA
D
LEGEND
0.2% ANNUAL CHANCE FLOOD
1% ANNUAL CHANCE FLOOD
2% ANNUAL CHANCE FLOOD
10% ANNUAL CHANCE FLOOD
STREAM BED
CROSS SECTION LOCATION
BU
FFA
LO-P
ITT
SB
UR
GH
HIG
HW
AY
BU
FFA
LO-P
ITT
SB
UR
GH
HIG
HW
AY
BU
FFA
LO-P
ITT
SB
UR
GH
HIG
HW
AY
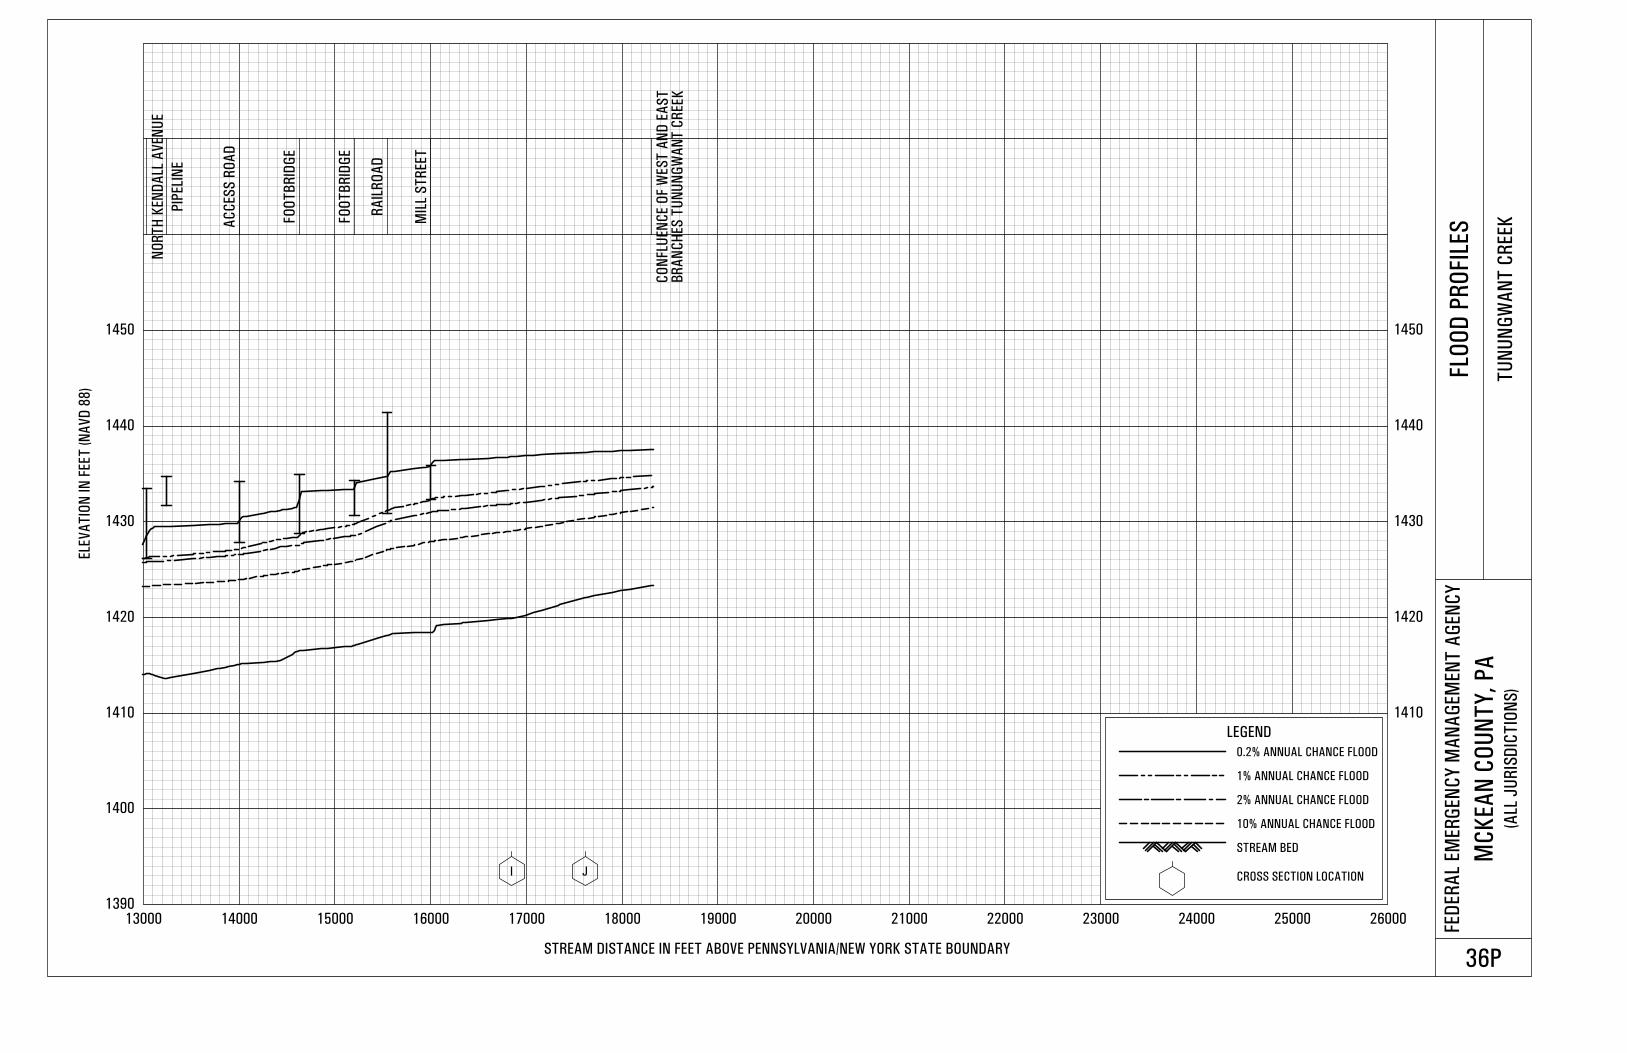
1390
1400
1410 1410
1420 1420
1430 1430
1440 1440
1450 1450
13000 14000 15000 16000 17000 18000 19000 20000 21000 22000 23000 24000 25000 26000
ELE
VA
TIO
N IN
FEET
(N
AV
D 8
8)
FED
ER
AL
EM
ER
GEN
CY
MA
NA
GEM
EN
T A
GEN
CY
MC
KEA
N C
OU
NT
Y,
PA
(ALL
JU
RIS
DIC
TIO
NS
)
FLO
OD
PR
OFIL
ES
TU
NU
NG
WA
NT
CR
EEK
36P
I J
BR
AN
CH
ES
TU
NU
NG
WA
NT
CR
EEK
NO
RT
H K
EN
DA
LL A
VEN
UE
PIP
ELI
NE
AC
CES
S R
OA
D
FO
OT
BR
IDG
E
FO
OT
BR
IDG
E
RA
ILR
OA
D
MIL
L S
TR
EET
LEGEND
0.2% ANNUAL CHANCE FLOOD
1% ANNUAL CHANCE FLOOD
2% ANNUAL CHANCE FLOOD
10% ANNUAL CHANCE FLOOD
STREAM BED
CROSS SECTION LOCATION
STREAM DISTANCE IN FEET ABOVE PENNSYLVANIA/NEW YORK STATE BOUNDARY
CO
NFL
UEN
CE O
F W
ES
T A
ND
EA
ST
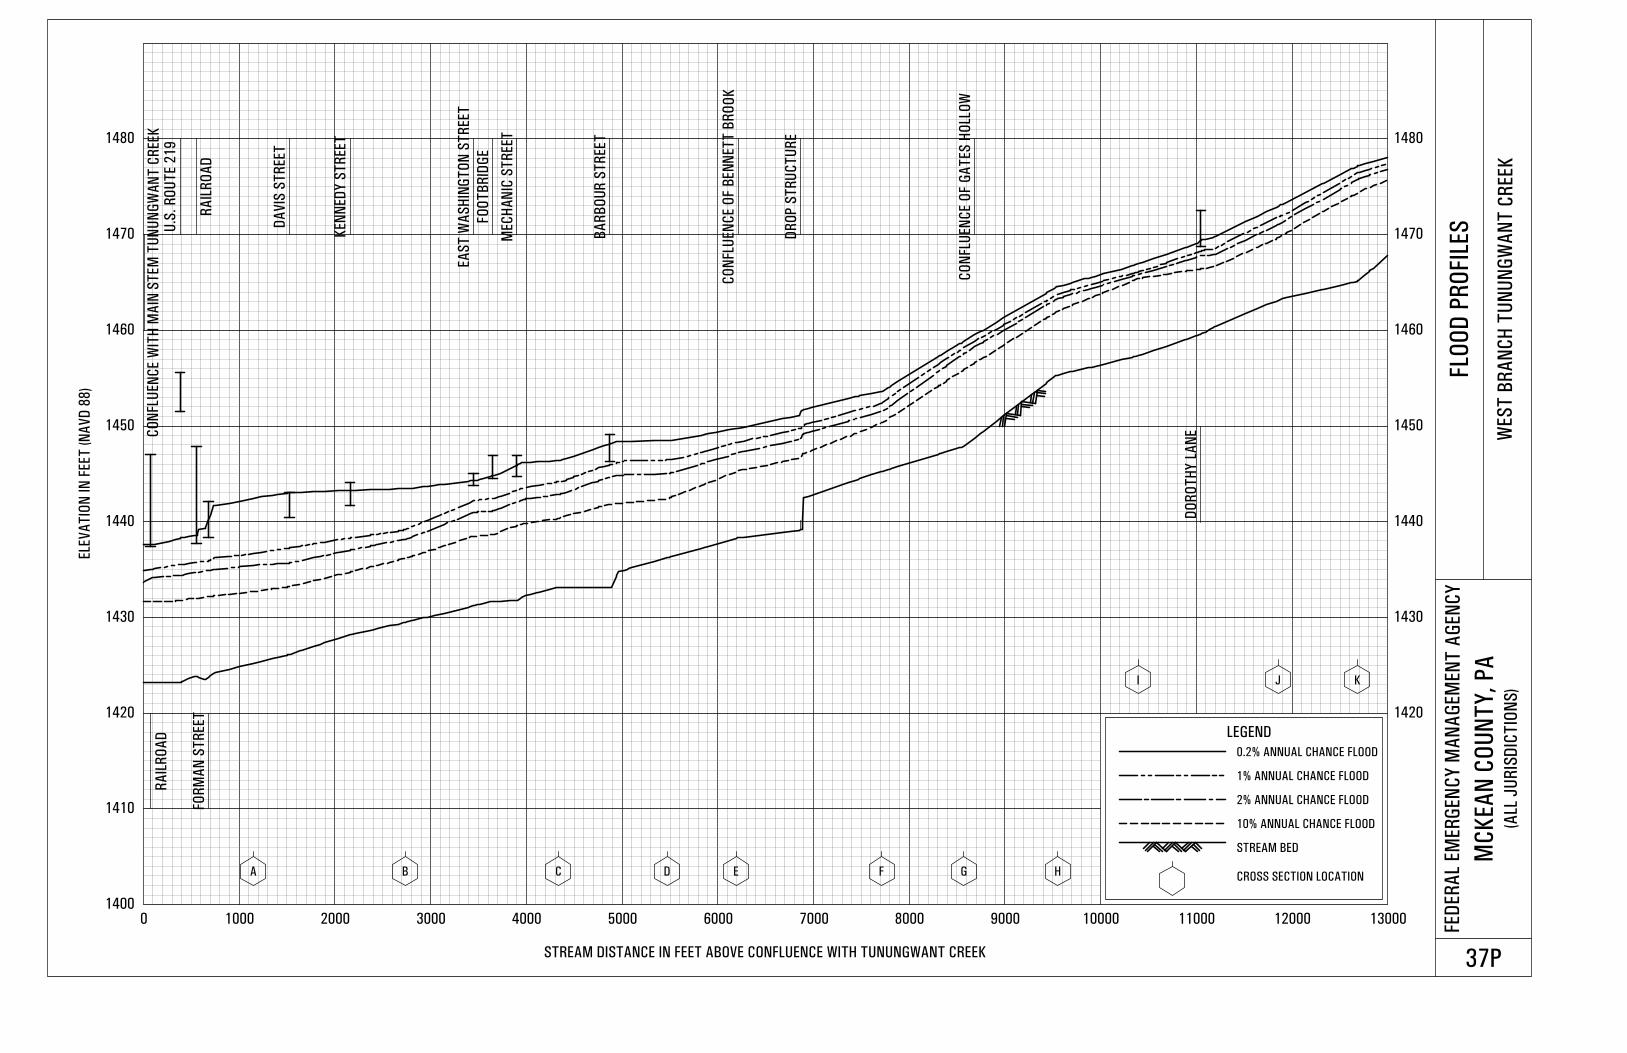
1400
1410
1420 1420
1430 1430
1440 1440
1450 1450
1460 1460
1470 1470
1480 1480
0 1000 2000 3000 4000 5000 6000 7000 8000 9000 10000 11000 12000 13000
ELE
VA
TIO
N IN
FEET
(N
AV
D 8
8)
STREAM DISTANCE IN FEET ABOVE CONFLUENCE WITH TUNUNGWANT CREEK
FED
ER
AL
EM
ER
GEN
CY
MA
NA
GEM
EN
T A
GEN
CY
MC
KEA
N C
OU
NT
Y,
PA
(ALL
JU
RIS
DIC
TIO
NS
)
FLO
OD
PR
OFIL
ES
WES
T B
RA
NC
H T
UN
UN
GW
AN
T C
REEK
37P
A B C D E F G H
I J K
CO
NFL
UEN
CE W
ITH
MA
IN S
TEM
TU
NU
NG
WA
NT
CR
EEK
CO
NFL
UEN
CE O
F G
AT
ES
HO
LLO
W
RA
ILR
OA
DU
.S.
RO
UT
E 2
19
RA
ILR
OA
DFO
RM
AN
ST
REET
DA
VIS
ST
REET
KEN
NED
Y S
TR
EET
EA
ST
WA
SH
ING
TO
N S
TR
EET
FO
OT
BR
IDG
E
MEC
HA
NIC
ST
REET
BA
RB
OU
R S
TR
EET
DR
OP
ST
RU
CT
UR
E
DO
RO
TH
Y L
AN
E
LEGEND
0.2% ANNUAL CHANCE FLOOD
1% ANNUAL CHANCE FLOOD
2% ANNUAL CHANCE FLOOD
10% ANNUAL CHANCE FLOOD
STREAM BED
CROSS SECTION LOCATION
CO
NFL
UEN
CE O
F B
EN
NET
T B
RO
OK
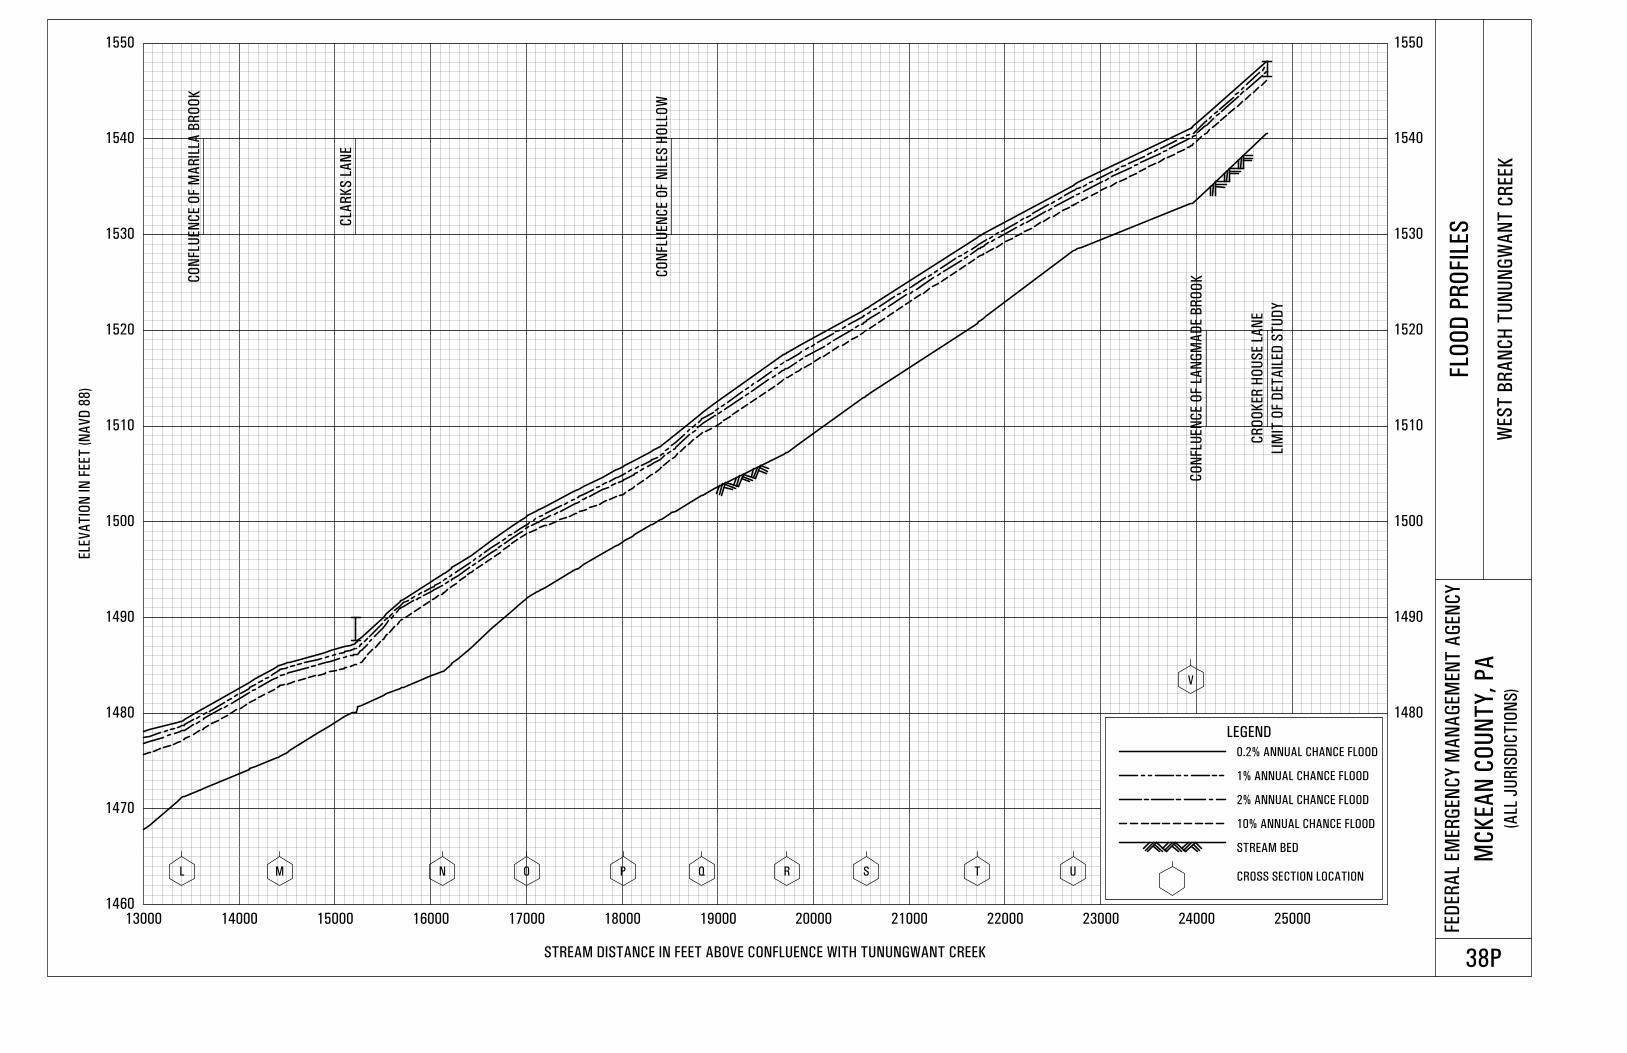
1460
1470
1480 1480
1490 1490
1500 1500
1510 1510
1520 1520
1530 1530
1540 1540
1550 1550
13000 14000 15000 16000 17000 18000 19000 20000 21000 22000 23000 24000 25000
ELE
VA
TIO
N IN
FEET
(N
AV
D 8
8)
STREAM DISTANCE IN FEET ABOVE CONFLUENCE WITH TUNUNGWANT CREEK
FED
ER
AL
EM
ER
GEN
CY
MA
NA
GEM
EN
T A
GEN
CY
MC
KEA
N C
OU
NT
Y,
PA
(ALL
JU
RIS
DIC
TIO
NS
)
FLO
OD
PR
OFIL
ES
WES
T B
RA
NC
H T
UN
UN
GW
AN
T C
REEK
38P
L M N O P Q R S T U
V
CO
NFL
UEN
CE O
F M
AR
ILLA
BR
OO
K
CO
NFL
UEN
CE O
F N
ILES
HO
LLO
W
CO
NFL
UEN
CE O
F L
AN
GM
AD
E B
RO
OK
CLA
RK
S L
AN
E
CR
OO
KER
HO
US
E L
AN
E
LEGEND
0.2% ANNUAL CHANCE FLOOD
1% ANNUAL CHANCE FLOOD
2% ANNUAL CHANCE FLOOD
10% ANNUAL CHANCE FLOOD
STREAM BED
CROSS SECTION LOCATION
LIM
IT O
F D
ET
AIL
ED
ST
UD
Y
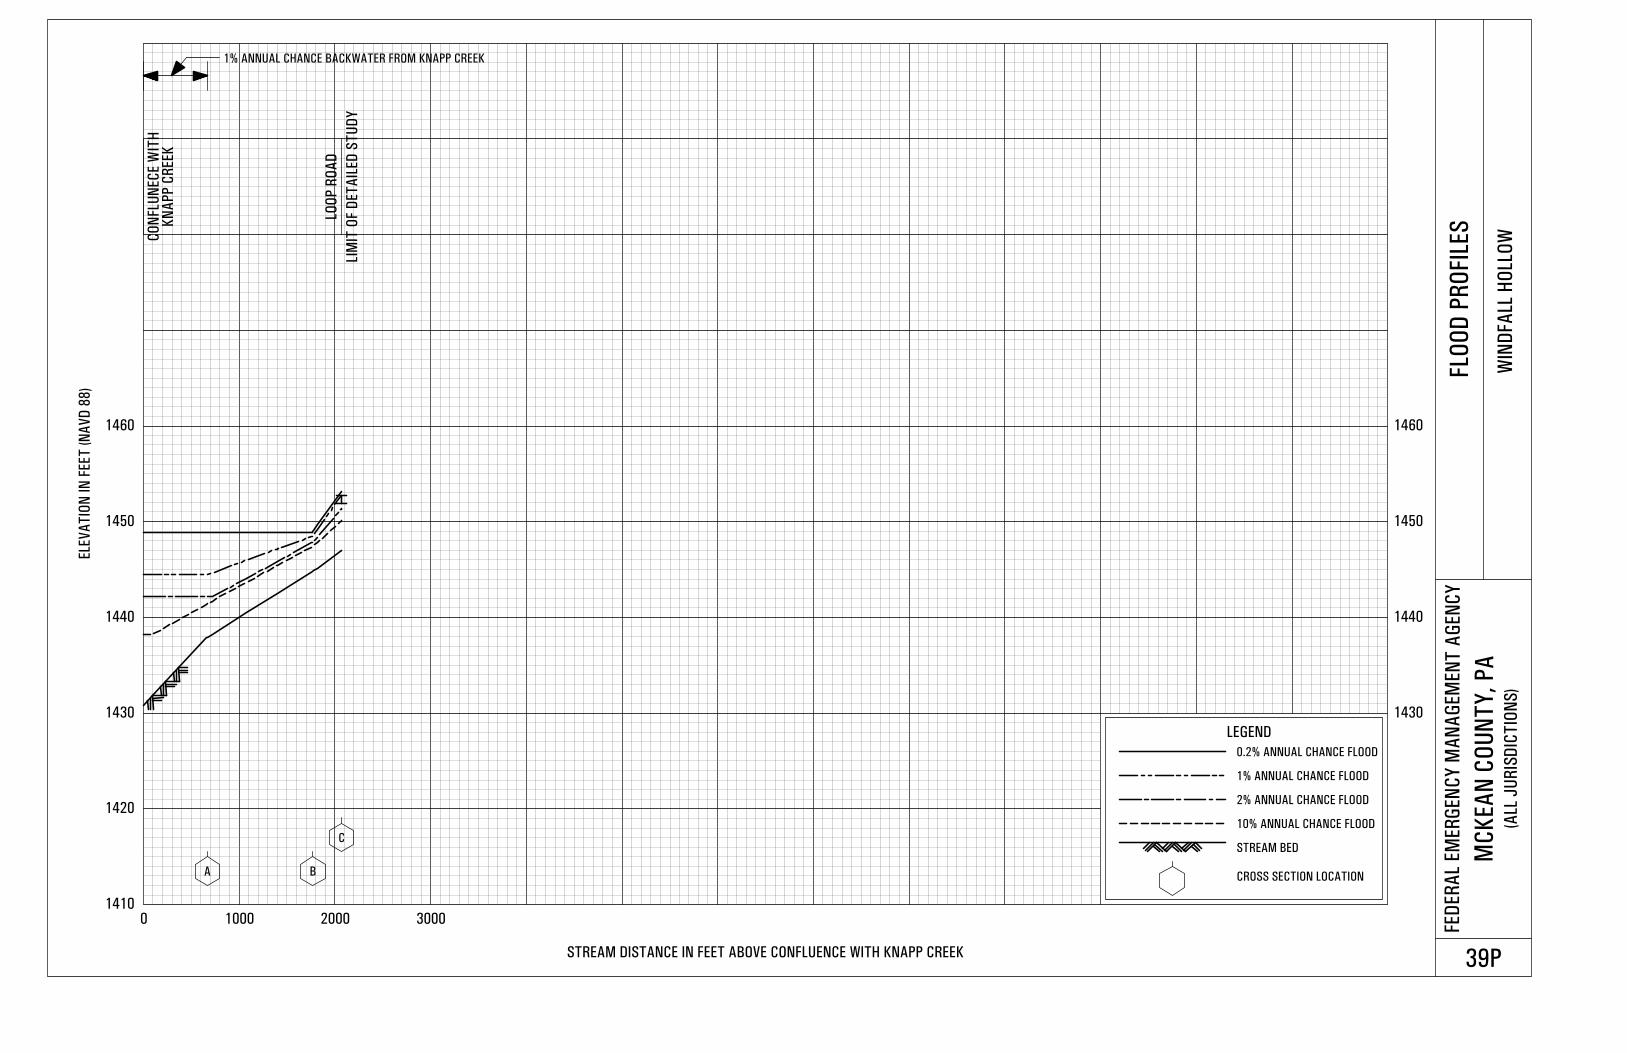
1410
1420
1430 1430
1440 1440
1450 1450
1460 1460
0 1000 2000 3000
ELE
VA
TIO
N IN
FEET
(N
AV
D 8
8)
STREAM DISTANCE IN FEET ABOVE CONFLUENCE WITH KNAPP CREEK
FED
ER
AL
EM
ER
GEN
CY
MA
NA
GEM
EN
T A
GEN
CY
MC
KEA
N C
OU
NT
Y,
PA
(ALL
JU
RIS
DIC
TIO
NS
)
FLO
OD
PR
OFIL
ES
WIN
DFA
LL H
OLL
OW
39P
A B
C
CO
NFL
UN
EC
E W
ITH
LIM
IT O
F D
ET
AIL
ED
ST
UD
Y
LEGEND
0.2% ANNUAL CHANCE FLOOD
1% ANNUAL CHANCE FLOOD
2% ANNUAL CHANCE FLOOD
10% ANNUAL CHANCE FLOOD
STREAM BED
CROSS SECTION LOCATION
KN
AP
P C
REEK
LOO
P R
OA
D
1% ANNUAL CHANCE BACKWATER FROM KNAPP CREEK