Embed Size (px)
Citation preview
MayorCraig Morgan
Mayor Pro-TemRene Flores
CouncilmembersMichelle Ly
Matthew BakerFrank Ortega
Kristin StevensHilda Montgomery
City ManagerLaurie Hadley
City AttorneyStephan L. Sheets
CITY OF ROUND ROCK 221 East Main Street, Round Rock, Texas 78664[P] 512.218.5400 · [F] 512.671.2808 · roundrocktexas.gov
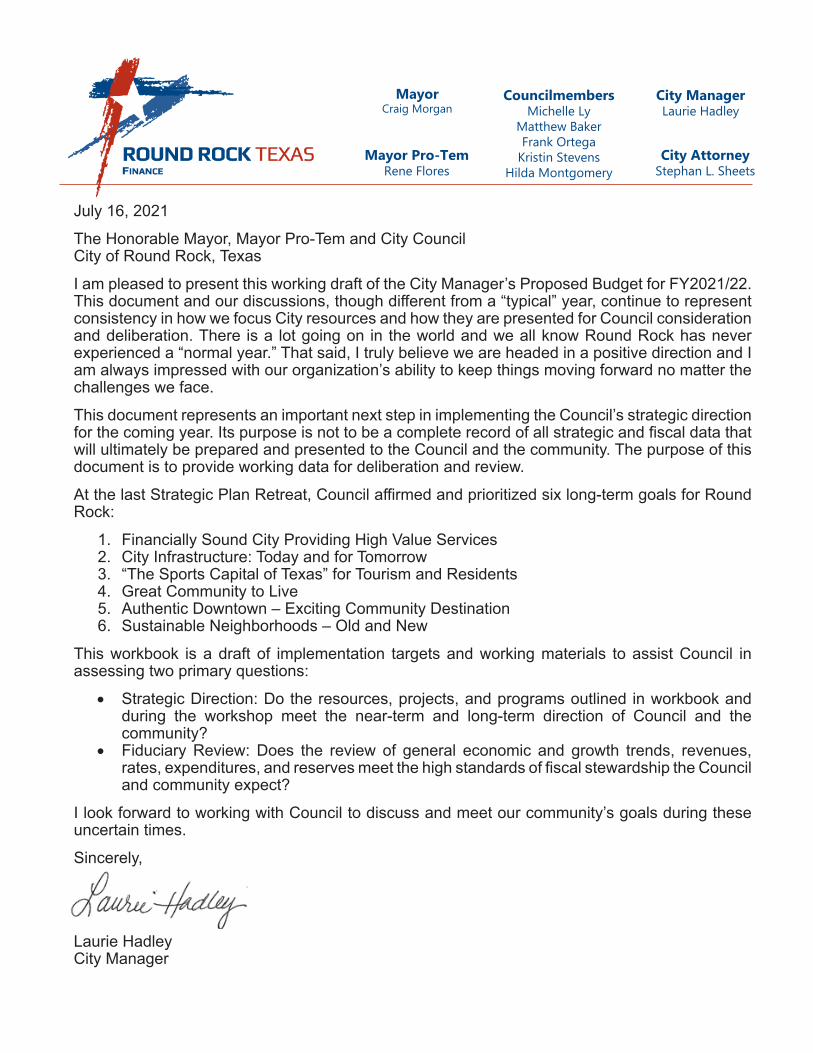
July 16, 2021
The Honorable Mayor, Mayor Pro-Tem and City Council City of Round Rock, Texas
I am pleased to present this working draft of the City Manager’s Proposed Budget for FY2021/22. This document and our discussions, though different from a “typical” year, continue to represent consistency in how we focus City resources and how they are presented for Council consideration and deliberation. There is a lot going on in the world and we all know Round Rock has never experienced a “normal year.” That said, I truly believe we are headed in a positive direction and I am always impressed with our organization’s ability to keep things moving forward no matter the challenges we face.
This document represents an important next step in implementing the Council’s strategic direction for the coming year. Its purpose is not to be a complete record of all strategic and fiscal data that will ultimately be prepared and presented to the Council and the community. The purpose of this document is to provide working data for deliberation and review.
At the last Strategic Plan Retreat, Council affirmed and prioritized six long-term goals for Round Rock:
1. Financially Sound City Providing High Value Services2. City Infrastructure: Today and for Tomorrow3. “The Sports Capital of Texas” for Tourism and Residents4. Great Community to Live5. Authentic Downtown – Exciting Community Destination6. Sustainable Neighborhoods – Old and New
This workbook is a draft of implementation targets and working materials to assist Council in assessing two primary questions:
• Strategic Direction: Do the resources, projects, and programs outlined in workbook and during the workshop meet the near-term and long-term direction of Council and the community?
• Fiduciary Review: Does the review of general economic and growth trends, revenues, rates, expenditures, and reserves meet the high standards of fiscal stewardship the Council and community expect?
I look forward to working with Council to discuss and meet our community’s goals during these uncertain times.
Sincerely,
Laurie Hadley City Manager
FY 2021-2022 Budget DRAFT - For d iscuss ion purposes on lyFY 2021-2022 Budget DRAFT - For d iscuss ion purposes on ly 2
Tax RateProposed
FY 2022Adopted FY 2021
Property Tax Rate $0.415000 $0.439000No New Revenue (Effective) Tax Rate $0.404903 $0.425550No New Revenue (Effective) M&O Tax Rate $0.405279 $0.446087Voter Approval (Rollback) Tax Rate $0.448976 $0.460650Debt Rate $0.136482 $0.142692
Preliminary
F Y 2022 P R O P O S E D B U D G E T
City of Round Rock Proposed BudgetFor the Fiscal Year
October 1, 2021 to September 30, 2022
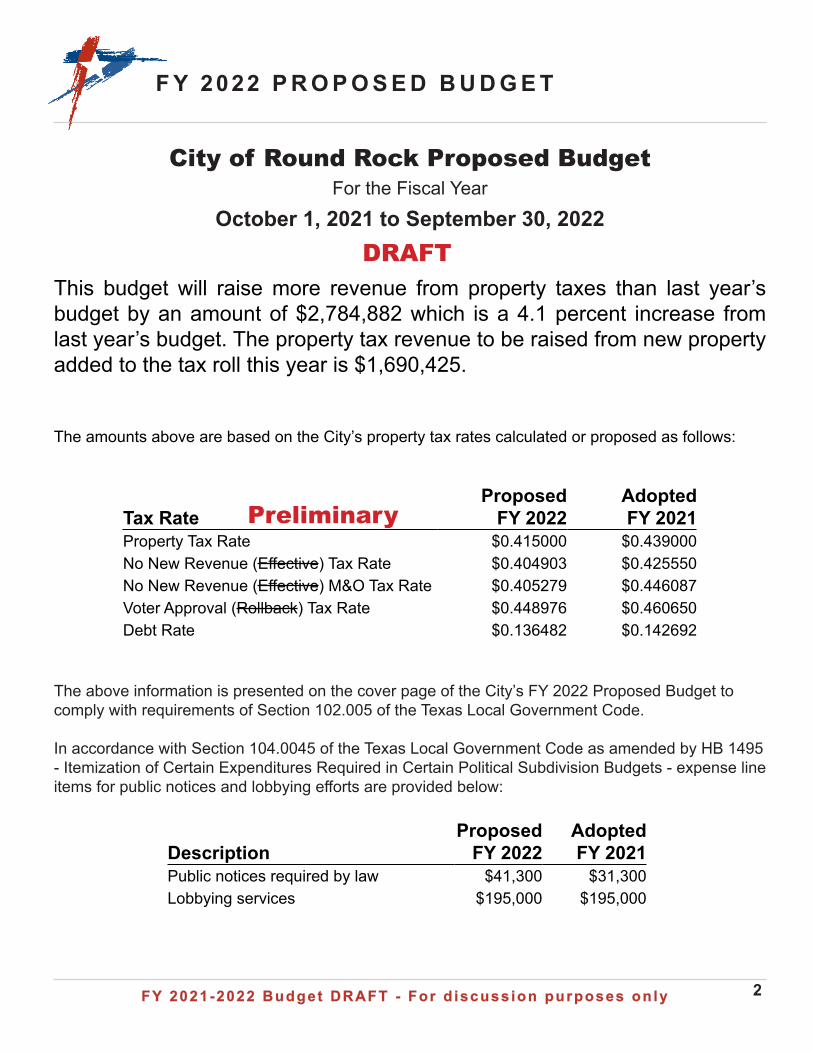
This budget will raise more revenue from property taxes than last year’s budget by an amount of $2,784,882 which is a 4.1 percent increase from last year’s budget. The property tax revenue to be raised from new property added to the tax roll this year is $1,690,425.
The amounts above are based on the City’s property tax rates calculated or proposed as follows:
The above information is presented on the cover page of the City’s FY 2022 Proposed Budget to comply with requirements of Section 102.005 of the Texas Local Government Code.
In accordance with Section 104.0045 of the Texas Local Government Code as amended by HB 1495 - Itemization of Certain Expenditures Required in Certain Political Subdivision Budgets - expense line items for public notices and lobbying efforts are provided below:
DescriptionProposed
FY 2022Adopted FY 2021
Public notices required by law $41,300 $31,300Lobbying services $195,000 $195,000
DRAFT
FY 2021-2022 Budget DRAFT - For d iscuss ion purposes on lyFY 2021-2022 Budget DRAFT - For d iscuss ion purposes on ly 3
I N T R O D U C T I O N & S U M M A RY B Y G O A L S
• City Manager’s Letter.........................................................................................1
• Introduction................................................................................................4
• Focus for 2021/22.............................................................................................5
• Proposed Budget by the Numbers....................................................................6
• Budget Proposal by Council Goal
◦ Financially Sound City..................................................................................8
◦ City Infrastructure..........................................................................................9
◦ “Sports Capital of Texas” for Tourism and Residents................................10
◦ Great Community to Live............................................................................11
◦ Authentic Downtown - Exciting Community Destination.............................13
◦ Sustainable Neighborhoods - Old and New................................................14
• Proposed Additions - General Fund................................................................16
• Proposed Additions - Cost Components by Department................................17
• GSFC Proposed Uses....................................................................................19
• Operating Budget Cost Increases..................................................................20
• Proposed American Rescue Plan Act (ARPA) Allocation Plan........................21
• Upcoming Issues / Policy Discussion...............................................................22
FY 2021-2022 Budget DRAFT - For d iscuss ion purposes on lyFY 2021-2022 Budget DRAFT - For d iscuss ion purposes on ly 4
I N T R O D U C T I O N
• Comprehensive water strategy• Mental health team• Williamson County & Cities Health District
y Future structure & services• Strategic land acquisition• Current library facility and site - direction• City Hall long-term plan• Solid waste services: evaluate single provider for commercial• The District: zoning and adjusted development agreement• Downtown nightlife: city regulation review• Bond election 2023: timing & direction
y Second recreation center: needs assessment y Other projects
• Building toward the Future - meeting Council goals• Completing what we’ve started
y Downtown Parking Garagey Northeast Downtown Improvementsy 2013 voter approved bond projects
° New Library ° Heritage Trail East, Lake Creek Trail, and Heritage Trail West
y Year 4 of 5-year Roadway Expansion plan° Greenlawn Blvd Improvements° University Blvd Widening° University East and others
y Economic Development and Redevelopmenty Finalize 5-year utility financial plans and rate recommendations
• Meeting demands of growth• Operations & maintenance of existing City facilities and programs• Legislative and legal advocacy on sales tax rules
Focus for 2021/22:
Council retreat policy priorities addressed, including:
Note: Many of these are under staff review and
reporting for further Council direction. Funding will be in
future years.
FY 2021-2022 Budget DRAFT - For d iscuss ion purposes on lyFY 2021-2022 Budget DRAFT - For d iscuss ion purposes on ly 5
F O C U S F O R 2021 /22
• Budget Linkage y Align budget with Council goals and shift back to pre-pandemic growth patterns y Proposed year in context of five-year outlook and needs
• Budget Process y Collaborative executive team review with City Manager y Ongoing operating needs and one-time requirements addressed
• Broad Viewy Big picture of all City resources and usesy Community Investment Program (CIP) overview
• Council goals and strategic direction - 2021 Policy Agenda• Growth – additions needed to maintain service levels
y Projected population growth – 120,478 to 123,490 by year end or 2.50% y Development demands rising and will continue to increase with The District and
The Depot moving forward along with large residential neighborhoods in the northeast quadrant
• Competitive employee compensation and benefits• Maintenance of parks, facilities, and streets• Compliance with financial policies
Focus on an accurate, efficient, and transparent budget process
Budget Drivers
FY 2021-2022 Budget DRAFT - For d iscuss ion purposes on lyFY 2021-2022 Budget DRAFT - For d iscuss ion purposes on ly 6
P R O P O S E D B U D G E T B Y T H E N U M B E R S
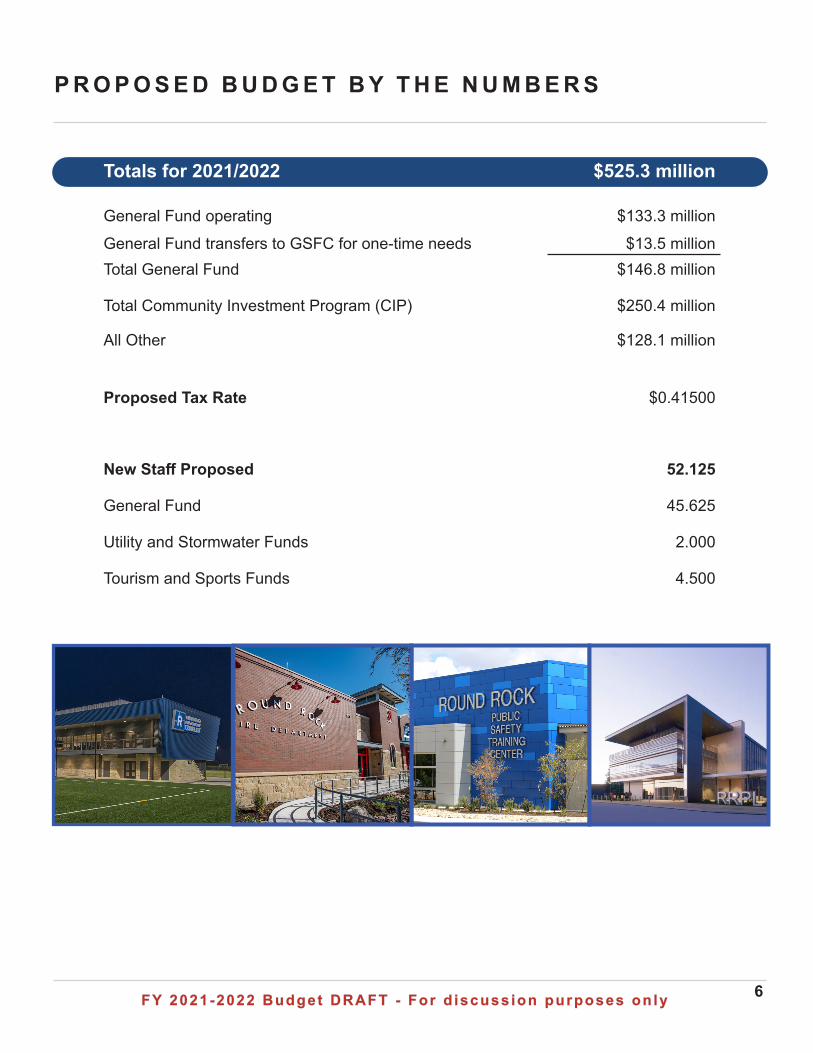
Totals for 2021/2022 $525.3 million
General Fund operating $133.3 million
General Fund transfers to GSFC for one-time needs $13.5 millionTotal General Fund $146.8 million
Total Community Investment Program (CIP) $250.4 million
All Other $128.1 million
Proposed Tax Rate $0.41500
New Staff Proposed 52.125
General Fund 45.625
Utility and Stormwater Funds 2.000
Tourism and Sports Funds 4.500
FY 2021-2022 Budget DRAFT - For d iscuss ion purposes on lyFY 2021-2022 Budget DRAFT - For d iscuss ion purposes on ly
P R O P O S A L B Y G O A L
FY 2021-2022 Budget DRAFT - For d iscuss ion purposes on lyFY 2021-2022 Budget DRAFT - For d iscuss ion purposes on ly 8
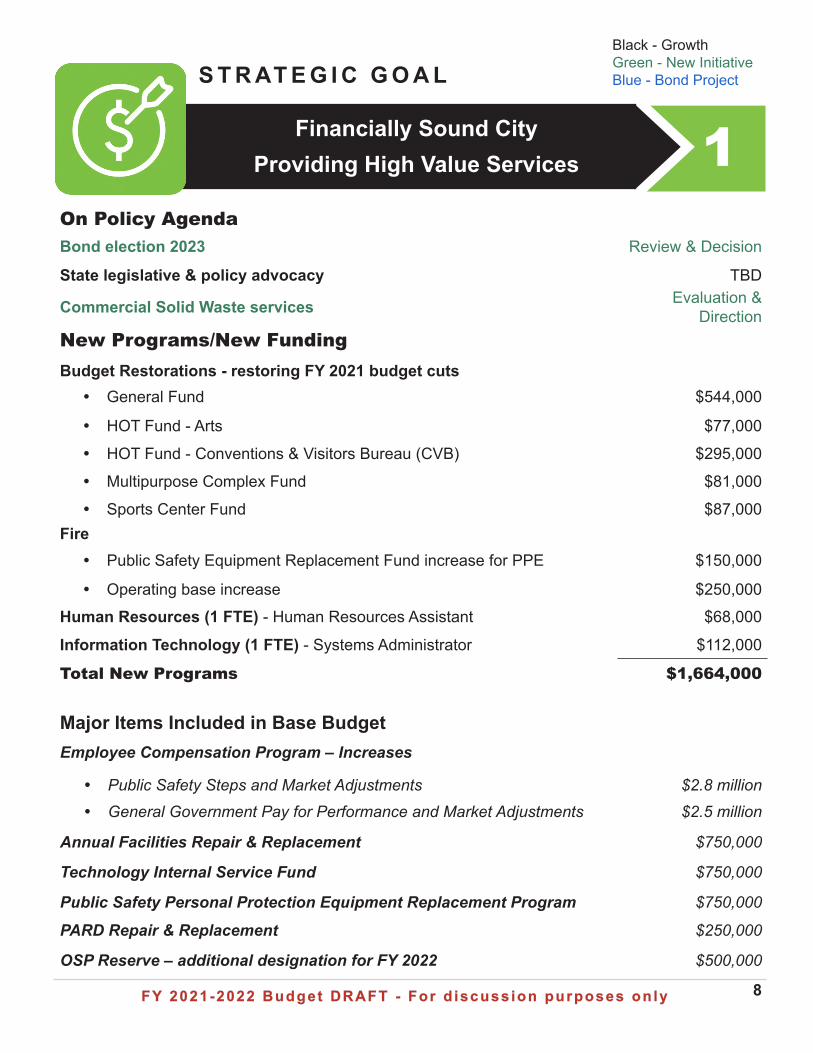
On Policy AgendaBond election 2023 Review & Decision
State legislative & policy advocacy TBD
Commercial Solid Waste services Evaluation & Direction
New Programs/New FundingBudget Restorations - restoring FY 2021 budget cuts
y General Fund $544,000
y HOT Fund - Arts $77,000
y HOT Fund - Conventions & Visitors Bureau (CVB) $295,000
y Multipurpose Complex Fund $81,000
y Sports Center Fund $87,000Fire
y Public Safety Equipment Replacement Fund increase for PPE $150,000
y Operating base increase $250,000
Human Resources (1 FTE) - Human Resources Assistant $68,000
Information Technology (1 FTE) - Systems Administrator $112,000
Total New Programs $1,664,000
Major Items Included in Base BudgetEmployee Compensation Program – Increases
y Public Safety Steps and Market Adjustments $2.8 million
y General Government Pay for Performance and Market Adjustments $2.5 million
Annual Facilities Repair & Replacement $750,000
Technology Internal Service Fund $750,000
Public Safety Personal Protection Equipment Replacement Program $750,000
PARD Repair & Replacement $250,000
OSP Reserve – additional designation for FY 2022 $500,000
S T R AT E G I C G O A L
1Financially Sound CityProviding High Value Services
Black - GrowthGreen - New InitiativeBlue - Bond Project
FY 2021-2022 Budget DRAFT - For d iscuss ion purposes on lyFY 2021-2022 Budget DRAFT - For d iscuss ion purposes on ly 9
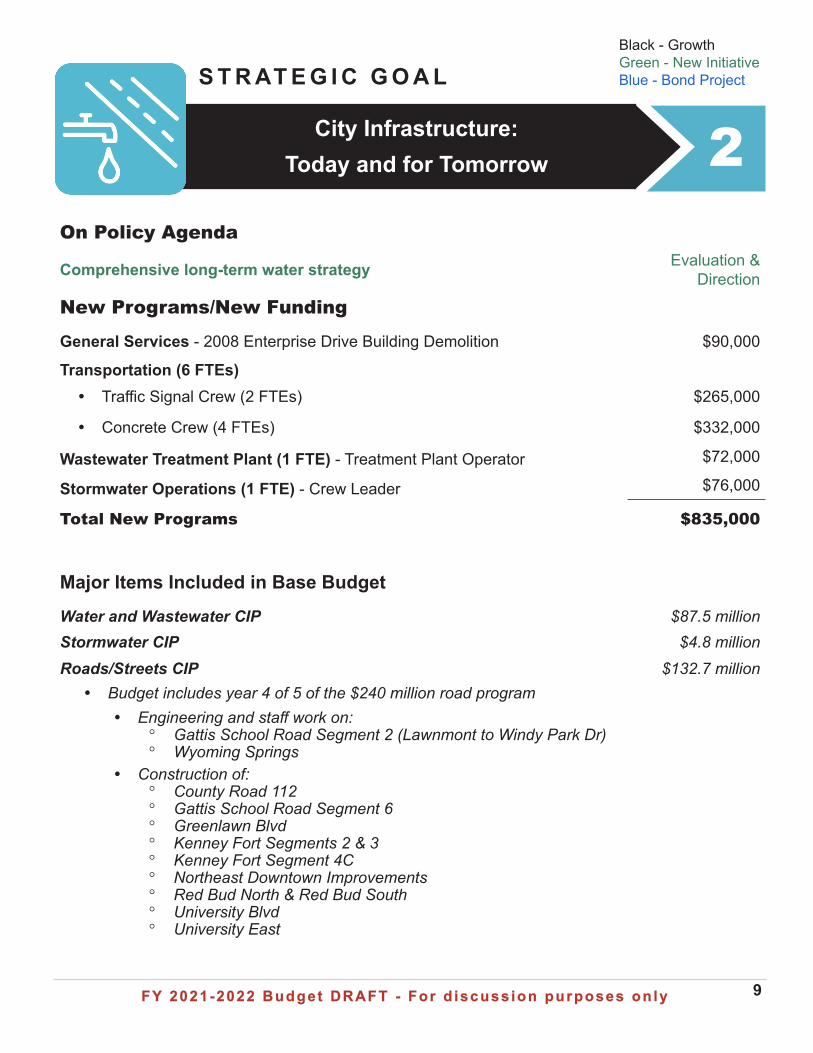
On Policy Agenda
Comprehensive long-term water strategy Evaluation & Direction
New Programs/New Funding
General Services - 2008 Enterprise Drive Building Demolition $90,000
Transportation (6 FTEs) y Traffic Signal Crew (2 FTEs) $265,000
y Concrete Crew (4 FTEs) $332,000
Wastewater Treatment Plant (1 FTE) - Treatment Plant Operator $72,000
Stormwater Operations (1 FTE) - Crew Leader $76,000
Total New Programs $835,000
Major Items Included in Base BudgetWater and Wastewater CIP $87.5 millionStormwater CIP $4.8 million
Roads/Streets CIP $132.7 million y Budget includes year 4 of 5 of the $240 million road program
y Engineering and staff work on: ° Gattis School Road Segment 2 (Lawnmont to Windy Park Dr) ° Wyoming Springs
y Construction of: ° County Road 112 ° Gattis School Road Segment 6 ° Greenlawn Blvd ° Kenney Fort Segments 2 & 3 ° Kenney Fort Segment 4C ° Northeast Downtown Improvements ° Red Bud North & Red Bud South ° University Blvd ° University East
S T R AT E G I C G O A L
2City Infrastructure:Today and for Tomorrow
Black - GrowthGreen - New InitiativeBlue - Bond Project
FY 2021-2022 Budget DRAFT - For d iscuss ion purposes on lyFY 2021-2022 Budget DRAFT - For d iscuss ion purposes on ly 10
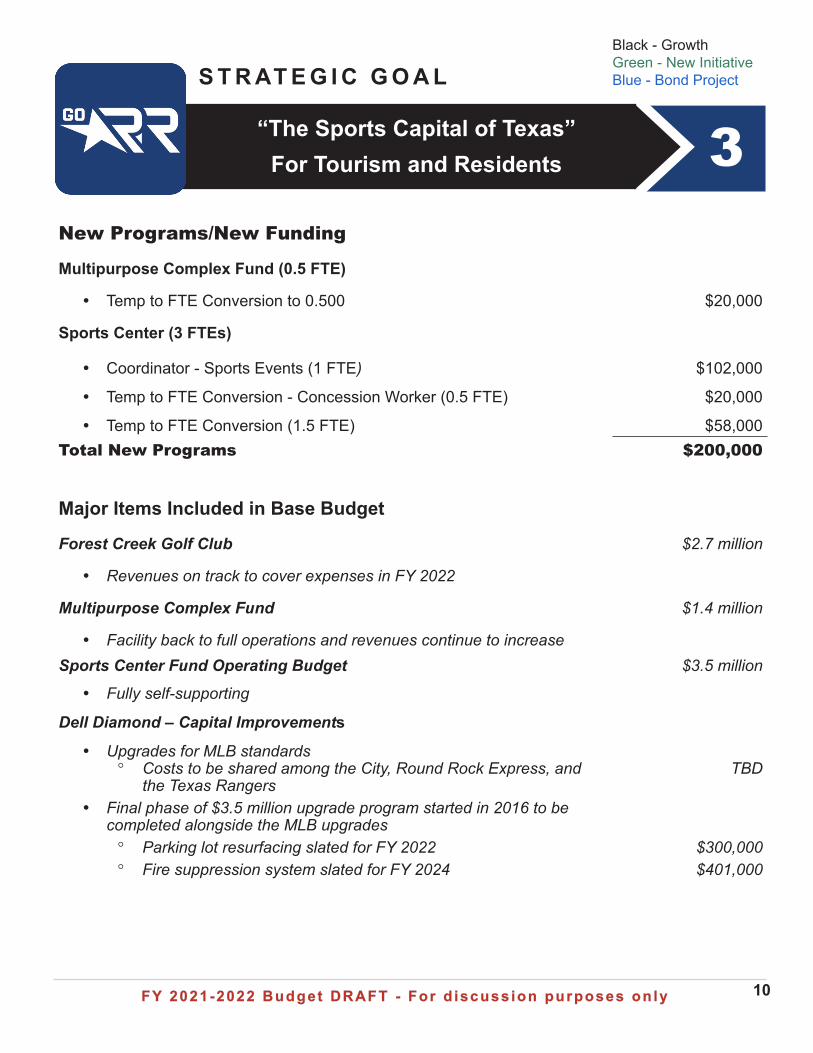
New Programs/New Funding
Multipurpose Complex Fund (0.5 FTE)
y Temp to FTE Conversion to 0.500 $20,000
Sports Center (3 FTEs)
y Coordinator - Sports Events (1 FTE) $102,000
y Temp to FTE Conversion - Concession Worker (0.5 FTE) $20,000
y Temp to FTE Conversion (1.5 FTE) $58,000Total New Programs $200,000
Major Items Included in Base Budget
Forest Creek Golf Club $2.7 million
y Revenues on track to cover expenses in FY 2022
Multipurpose Complex Fund $1.4 million
y Facility back to full operations and revenues continue to increaseSports Center Fund Operating Budget
y Fully self-supporting
$3.5 million
Dell Diamond – Capital Improvements
y Upgrades for MLB standards ° Costs to be shared among the City, Round Rock Express, and
the Texas RangersTBD
y Final phase of $3.5 million upgrade program started in 2016 to be completed alongside the MLB upgrades ° Parking lot resurfacing slated for FY 2022 $300,000 ° Fire suppression system slated for FY 2024 $401,000
S T R AT E G I C G O A L
3“The Sports Capital of Texas”For Tourism and Residents
Black - GrowthGreen - New InitiativeBlue - Bond Project
FY 2021-2022 Budget DRAFT - For d iscuss ion purposes on lyFY 2021-2022 Budget DRAFT - For d iscuss ion purposes on ly 11
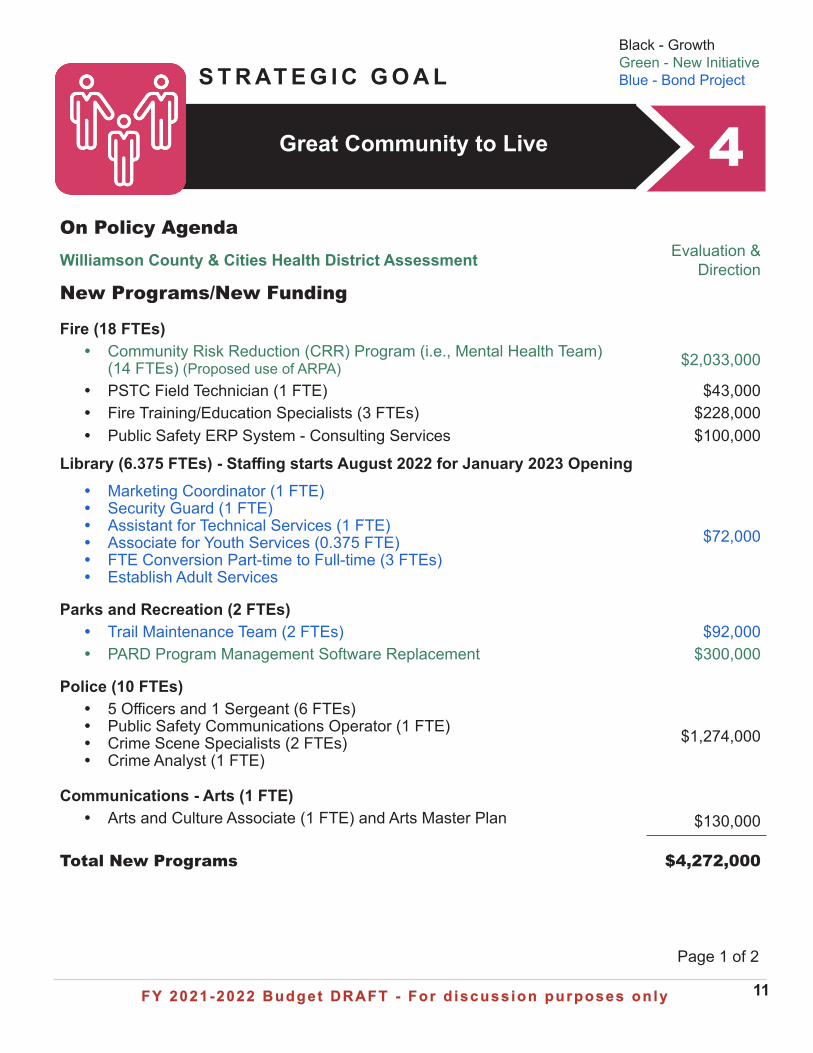
On Policy AgendaWilliamson County & Cities Health District Assessment Evaluation &
DirectionNew Programs/New Funding
Fire (18 FTEs) y Community Risk Reduction (CRR) Program (i.e., Mental Health Team)
(14 FTEs) (Proposed use of ARPA) $2,033,000
y PSTC Field Technician (1 FTE) $43,000 y Fire Training/Education Specialists (3 FTEs) $228,000 y Public Safety ERP System - Consulting Services $100,000
Library (6.375 FTEs) - Staffing starts August 2022 for January 2023 Opening y Marketing Coordinator (1 FTE) y Security Guard (1 FTE) y Assistant for Technical Services (1 FTE) y Associate for Youth Services (0.375 FTE) y FTE Conversion Part-time to Full-time (3 FTEs) y Establish Adult Services
$72,000
Parks and Recreation (2 FTEs) y Trail Maintenance Team (2 FTEs) $92,000 y PARD Program Management Software Replacement $300,000
Police (10 FTEs) y 5 Officers and 1 Sergeant (6 FTEs) y Public Safety Communications Operator (1 FTE) y Crime Scene Specialists (2 FTEs) y Crime Analyst (1 FTE)
$1,274,000
Communications - Arts (1 FTE) y Arts and Culture Associate (1 FTE) and Arts Master Plan $130,000
Total New Programs $4,272,000
S T R AT E G I C G O A L
4Great Community to Live
Page 1 of 2
Black - GrowthGreen - New InitiativeBlue - Bond Project
FY 2021-2022 Budget DRAFT - For d iscuss ion purposes on lyFY 2021-2022 Budget DRAFT - For d iscuss ion purposes on ly 12
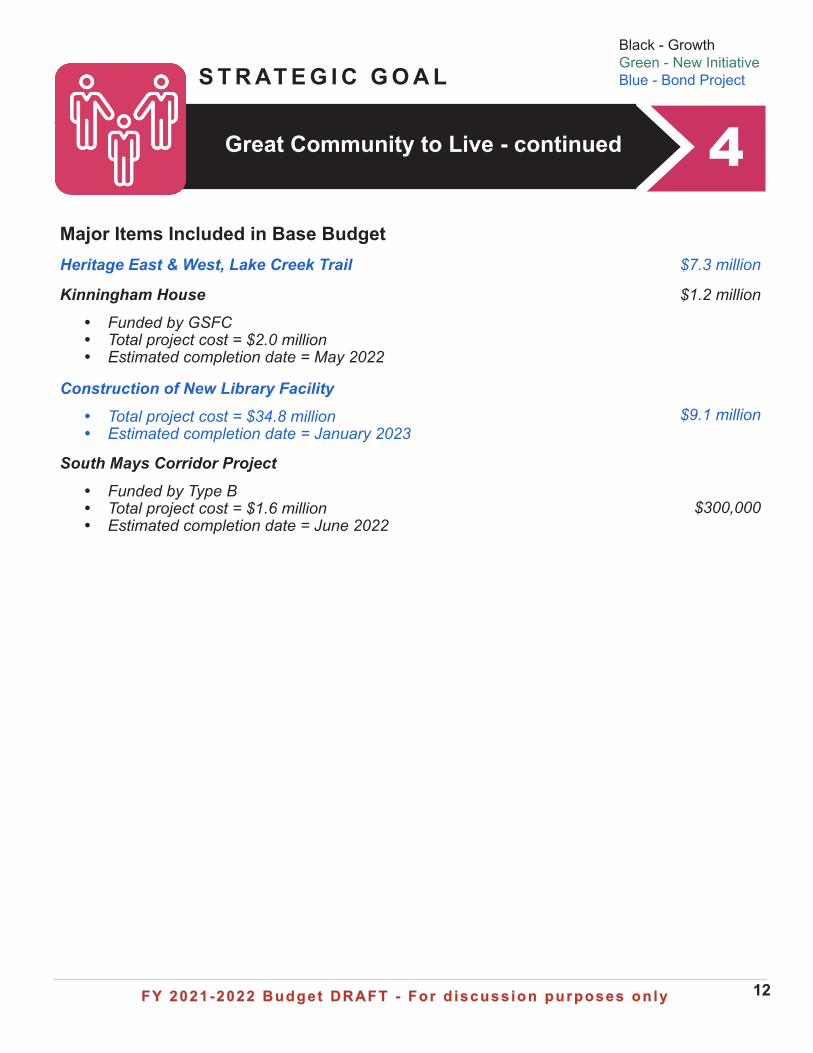
Major Items Included in Base BudgetHeritage East & West, Lake Creek Trail $7.3 million
Kinningham House
y Funded by GSFC y Total project cost = $2.0 million y Estimated completion date = May 2022
$1.2 million
Construction of New Library Facility
y Total project cost = $34.8 million y Estimated completion date = January 2023
$9.1 million
South Mays Corridor Project
y Funded by Type B y Total project cost = $1.6 million y Estimated completion date = June 2022
$300,000
S T R AT E G I C G O A L
4Great Community to Live - continued
Black - GrowthGreen - New InitiativeBlue - Bond Project
FY 2021-2022 Budget DRAFT - For d iscuss ion purposes on lyFY 2021-2022 Budget DRAFT - For d iscuss ion purposes on ly 13
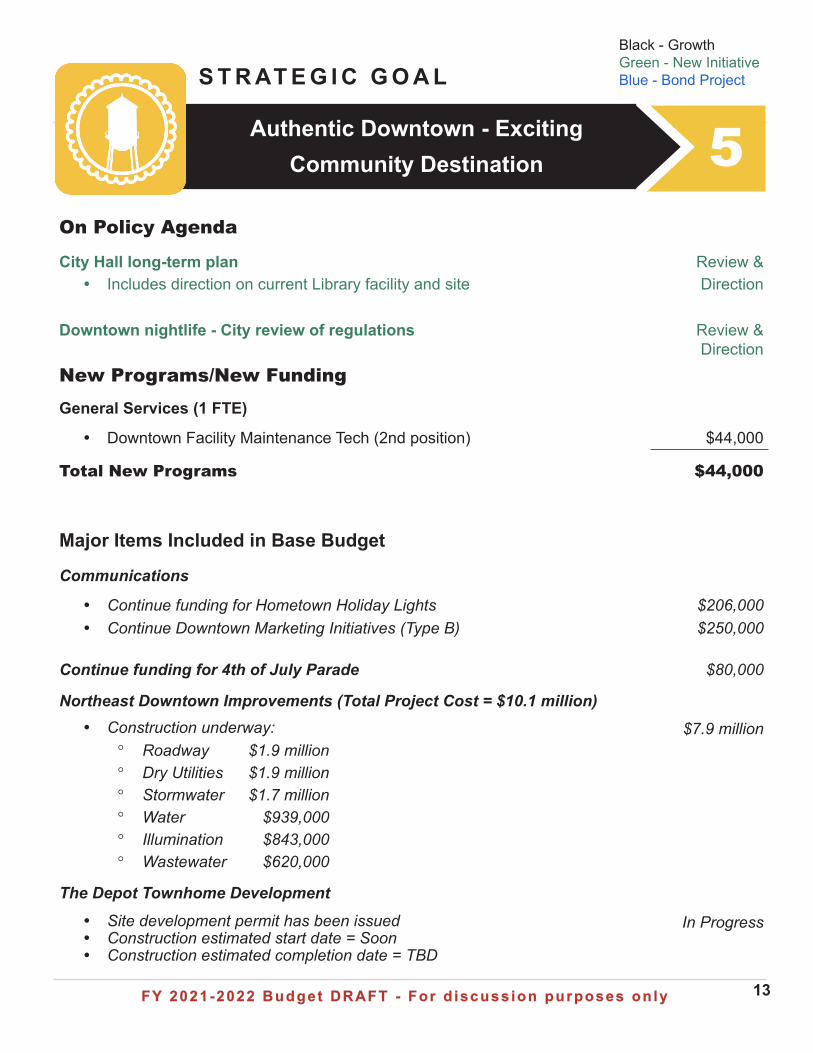
On Policy Agenda
City Hall long-term plan Review & y Includes direction on current Library facility and site Direction
Downtown nightlife - City review of regulations Review & Direction
New Programs/New FundingGeneral Services (1 FTE)
y Downtown Facility Maintenance Tech (2nd position) $44,000
Total New Programs $44,000
Major Items Included in Base Budget
Communications
y Continue funding for Hometown Holiday Lights $206,000 y Continue Downtown Marketing Initiatives (Type B) $250,000
Continue funding for 4th of July Parade $80,000
Northeast Downtown Improvements (Total Project Cost = $10.1 million) y Construction underway:
° Roadway $1.9 million ° Dry Utilities $1.9 million ° Stormwater $1.7 million ° Water $939,000 ° Illumination $843,000 ° Wastewater $620,000
$7.9 million
The Depot Townhome Development
y Site development permit has been issued y Construction estimated start date = Soon y Construction estimated completion date = TBD
In Progress
S T R AT E G I C G O A L
5Authentic Downtown - ExcitingCommunity Destination
Black - GrowthGreen - New InitiativeBlue - Bond Project
FY 2021-2022 Budget DRAFT - For d iscuss ion purposes on lyFY 2021-2022 Budget DRAFT - For d iscuss ion purposes on ly 14
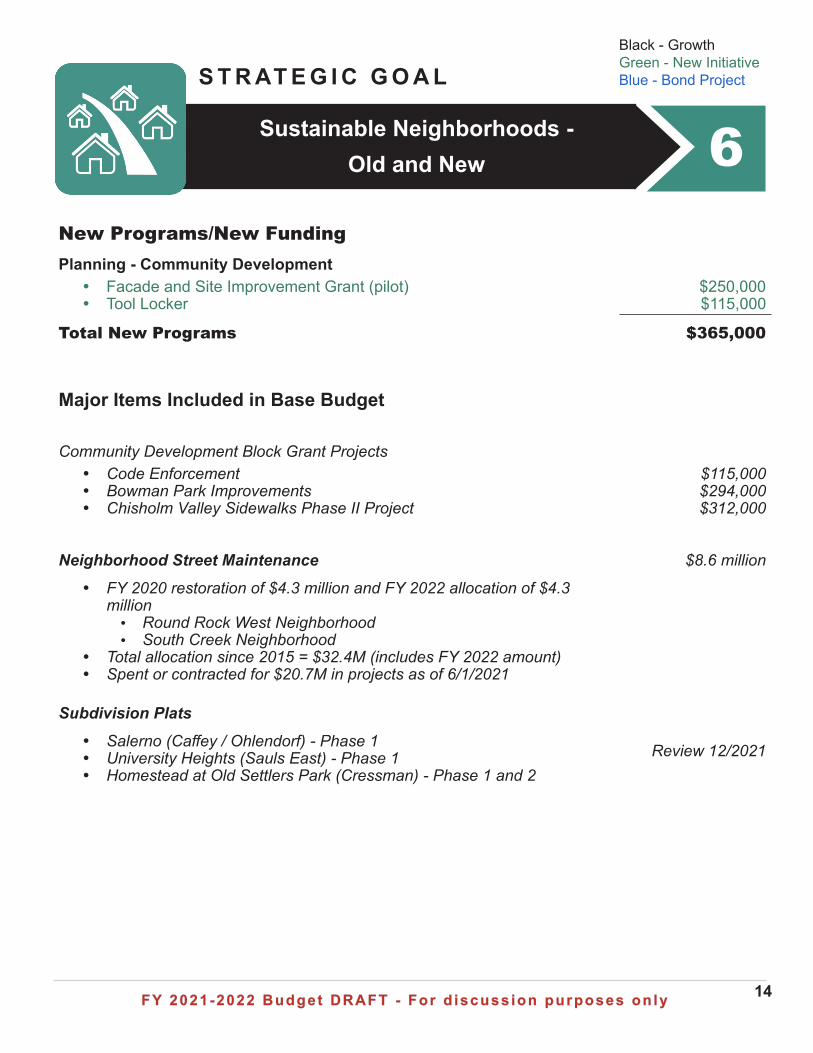
6New Programs/New FundingPlanning - Community Development
y Facade and Site Improvement Grant (pilot) $250,000 y Tool Locker $115,000
Total New Programs $365,000
Major Items Included in Base Budget
Community Development Block Grant Projects y Code Enforcement y Bowman Park Improvements y Chisholm Valley Sidewalks Phase II Project
$115,000$294,000$312,000
Neighborhood Street Maintenance
y FY 2020 restoration of $4.3 million and FY 2022 allocation of $4.3 million• Round Rock West Neighborhood • South Creek Neighborhood
y Total allocation since 2015 = $32.4M (includes FY 2022 amount) y Spent or contracted for $20.7M in projects as of 6/1/2021
$8.6 million
Subdivision Plats
y Salerno (Caffey / Ohlendorf) - Phase 1 y University Heights (Sauls East) - Phase 1 y Homestead at Old Settlers Park (Cressman) - Phase 1 and 2
Review 12/2021
S T R AT E G I C G O A L
6Sustainable Neighborhoods - Old and New
Black - GrowthGreen - New InitiativeBlue - Bond Project
FY 2021-2022 Budget DRAFT - For d iscuss ion purposes on lyFY 2021-2022 Budget DRAFT - For d iscuss ion purposes on ly
P R O P O S E D A D D I T I O N S
FY 2021-2022 Budget DRAFT - For d iscuss ion purposes on lyFY 2021-2022 Budget DRAFT - For d iscuss ion purposes on ly 16
P R O P O S E D A D D I T I O N S - G E N E R A L F U N D
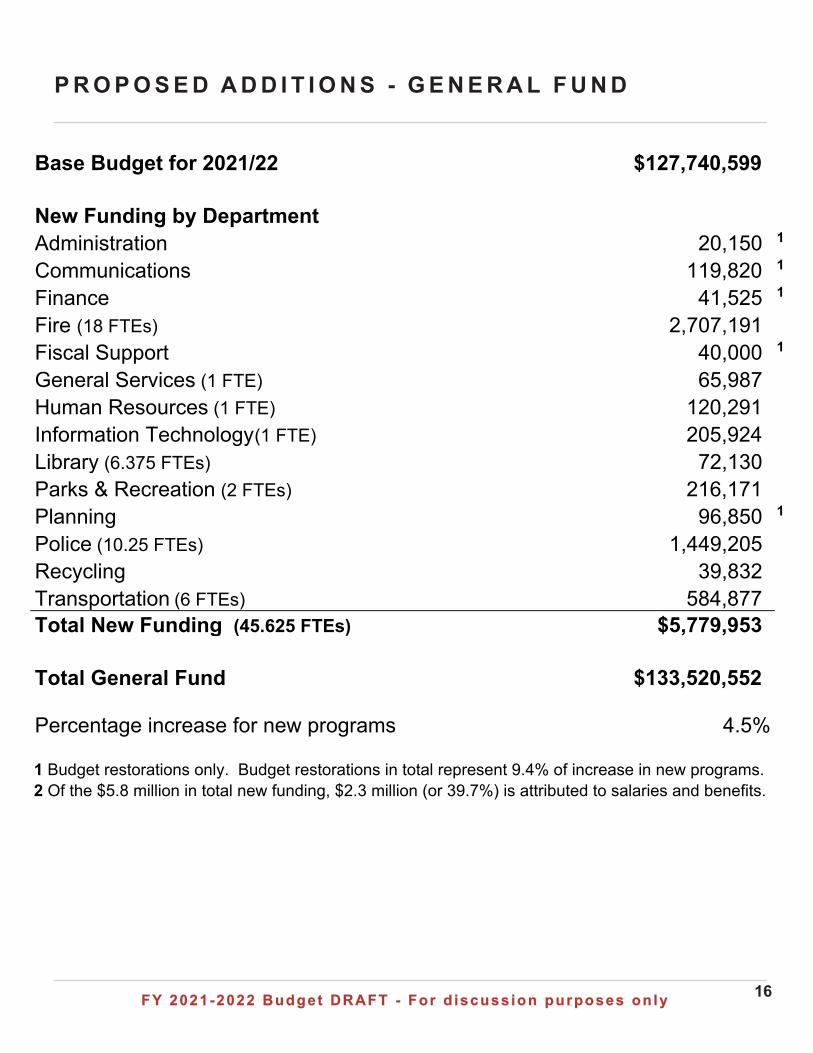
Base Budget for 2021/22 $127,740,599
New Funding by DepartmentAdministration 20,150 1
Communications 119,820 1
Finance 41,525 1
Fire (18 FTEs) 2,707,191Fiscal Support 40,000 1
General Services (1 FTE) 65,987Human Resources (1 FTE) 120,291Information Technology (1 FTE) 205,924Library (6.375 FTEs) 72,130Parks & Recreation (2 FTEs) 216,171Planning 96,850 1
Police (10.25 FTEs) 1,449,205Recycling 39,832Transportation (6 FTEs) 584,877Total New Funding (45.625 FTEs) $5,779,953
Total General Fund $133,520,552
Percentage increase for new programs 4.5%
1 Budget restorations only. Budget restorations in total represent 9.4% of increase in new programs.2 Of the $5.8 million in total new funding, $2.3 million (or 39.7%) is attributed to salaries and benefits.
FY 2021-2022 Budget DRAFT - For d iscuss ion purposes on lyFY 2021-2022 Budget DRAFT - For d iscuss ion purposes on ly 17
P R O P O S E D A D D I T I O N S - C O S T C O M P O N E N T S B Y D E PA R T M E N T
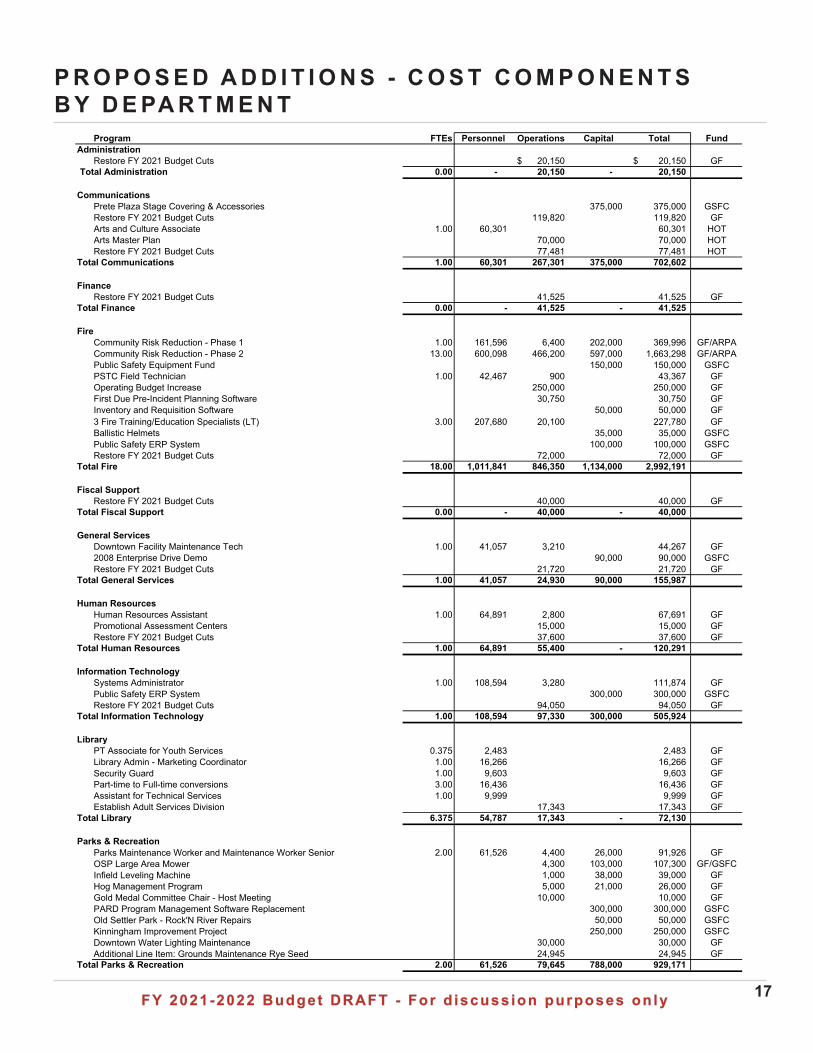
Program FTEs Personnel Operations Capital Total FundAdministration
Restore FY 2021 Budget Cuts 20,150$ 20,150$ GFTotal Administration 0.00 - 20,150 - 20,150
CommunicationsPrete Plaza Stage Covering & Accessories 375,000 375,000 GSFCRestore FY 2021 Budget Cuts 119,820 119,820 GFArts and Culture Associate 1.00 60,301 60,301 HOTArts Master Plan 70,000 70,000 HOTRestore FY 2021 Budget Cuts 77,481 77,481 HOT
Total Communications 1.00 60,301 267,301 375,000 702,602
FinanceRestore FY 2021 Budget Cuts 41,525 41,525 GF
Total Finance 0.00 - 41,525 - 41,525
FireCommunity Risk Reduction - Phase 1 1.00 161,596 6,400 202,000 369,996 GF/ARPACommunity Risk Reduction - Phase 2 13.00 600,098 466,200 597,000 1,663,298 GF/ARPAPublic Safety Equipment Fund 150,000 150,000 GSFCPSTC Field Technician 1.00 42,467 900 43,367 GFOperating Budget Increase 250,000 250,000 GFFirst Due Pre-Incident Planning Software 30,750 30,750 GFInventory and Requisition Software 50,000 50,000 GF3 Fire Training/Education Specialists (LT) 3.00 207,680 20,100 227,780 GFBallistic Helmets 35,000 35,000 GSFCPublic Safety ERP System 100,000 100,000 GSFCRestore FY 2021 Budget Cuts 72,000 72,000 GF
Total Fire 18.00 1,011,841 846,350 1,134,000 2,992,191
Fiscal SupportRestore FY 2021 Budget Cuts 40,000 40,000 GF
Total Fiscal Support 0.00 - 40,000 - 40,000
General ServicesDowntown Facility Maintenance Tech 1.00 41,057 3,210 44,267 GF2008 Enterprise Drive Demo 90,000 90,000 GSFCRestore FY 2021 Budget Cuts 21,720 21,720 GF
Total General Services 1.00 41,057 24,930 90,000 155,987
Human ResourcesHuman Resources Assistant 1.00 64,891 2,800 67,691 GFPromotional Assessment Centers 15,000 15,000 GFRestore FY 2021 Budget Cuts 37,600 37,600 GF
Total Human Resources 1.00 64,891 55,400 - 120,291
Information TechnologySystems Administrator 1.00 108,594 3,280 111,874 GFPublic Safety ERP System 300,000 300,000 GSFCRestore FY 2021 Budget Cuts 94,050 94,050 GF
Total Information Technology 1.00 108,594 97,330 300,000 505,924
LibraryPT Associate for Youth Services 0.375 2,483 2,483 GFLibrary Admin - Marketing Coordinator 1.00 16,266 16,266 GFSecurity Guard 1.00 9,603 9,603 GFPart-time to Full-time conversions 3.00 16,436 16,436 GFAssistant for Technical Services 1.00 9,999 9,999 GFEstablish Adult Services Division 17,343 17,343 GF
Total Library 6.375 54,787 17,343 - 72,130
Parks & RecreationParks Maintenance Worker and Maintenance Worker Senior 2.00 61,526 4,400 26,000 91,926 GFOSP Large Area Mower 4,300 103,000 107,300 GF/GSFCInfield Leveling Machine 1,000 38,000 39,000 GFHog Management Program 5,000 21,000 26,000 GFGold Medal Committee Chair - Host Meeting 10,000 10,000 GFPARD Program Management Software Replacement 300,000 300,000 GSFCOld Settler Park - Rock'N River Repairs 50,000 50,000 GSFCKinningham Improvement Project 250,000 250,000 GSFCDowntown Water Lighting Maintenance 30,000 30,000 GFAdditional Line Item: Grounds Maintenance Rye Seed 24,945 24,945 GF
Total Parks & Recreation 2.00 61,526 79,645 788,000 929,171
FY 2021-2022 Budget DRAFT - For d iscuss ion purposes on lyFY 2021-2022 Budget DRAFT - For d iscuss ion purposes on ly 18
P R O P O S E D A D D I T I O N S - C O S T C O M P O N E N T S B Y D E PA R T M E N T
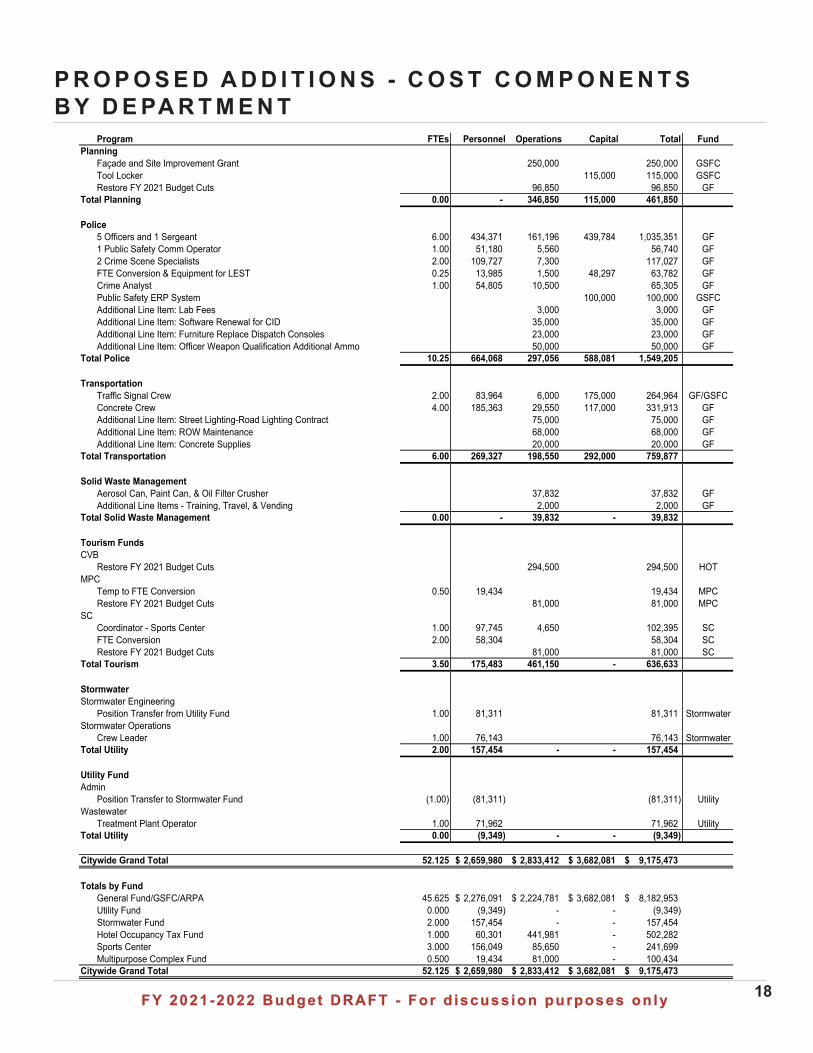
Program FTEs Personnel Operations Capital Total FundPlanning
Façade and Site Improvement Grant 250,000 250,000 GSFCTool Locker 115,000 115,000 GSFCRestore FY 2021 Budget Cuts 96,850 96,850 GF
Total Planning 0.00 - 346,850 115,000 461,850
Police5 Officers and 1 Sergeant 6.00 434,371 161,196 439,784 1,035,351 GF1 Public Safety Comm Operator 1.00 51,180 5,560 56,740 GF2 Crime Scene Specialists 2.00 109,727 7,300 117,027 GFFTE Conversion & Equipment for LEST 0.25 13,985 1,500 48,297 63,782 GFCrime Analyst 1.00 54,805 10,500 65,305 GFPublic Safety ERP System 100,000 100,000 GSFCAdditional Line Item: Lab Fees 3,000 3,000 GFAdditional Line Item: Software Renewal for CID 35,000 35,000 GFAdditional Line Item: Furniture Replace Dispatch Consoles 23,000 23,000 GFAdditional Line Item: Officer Weapon Qualification Additional Ammo 50,000 50,000 GF
Total Police 10.25 664,068 297,056 588,081 1,549,205
TransportationTraffic Signal Crew 2.00 83,964 6,000 175,000 264,964 GF/GSFCConcrete Crew 4.00 185,363 29,550 117,000 331,913 GFAdditional Line Item: Street Lighting-Road Lighting Contract 75,000 75,000 GFAdditional Line Item: ROW Maintenance 68,000 68,000 GFAdditional Line Item: Concrete Supplies 20,000 20,000 GF
Total Transportation 6.00 269,327 198,550 292,000 759,877
Solid Waste ManagementAerosol Can, Paint Can, & Oil Filter Crusher 37,832 37,832 GFAdditional Line Items - Training, Travel, & Vending 2,000 2,000 GF
Total Solid Waste Management 0.00 - 39,832 - 39,832
Tourism FundsCVB
Restore FY 2021 Budget Cuts 294,500 294,500 HOTMPC
Temp to FTE Conversion 0.50 19,434 19,434 MPCRestore FY 2021 Budget Cuts 81,000 81,000 MPC
SCCoordinator - Sports Center 1.00 97,745 4,650 102,395 SCFTE Conversion 2.00 58,304 58,304 SCRestore FY 2021 Budget Cuts 81,000 81,000 SC
Total Tourism 3.50 175,483 461,150 - 636,633
StormwaterStormwater Engineering
Position Transfer from Utility Fund 1.00 81,311 81,311 StormwaterStormwater Operations
Crew Leader 1.00 76,143 76,143 StormwaterTotal Utility 2.00 157,454 - - 157,454
Utility FundAdmin
Position Transfer to Stormwater Fund (1.00) (81,311) (81,311) UtilityWastewater
Treatment Plant Operator 1.00 71,962 71,962 UtilityTotal Utility 0.00 (9,349) - - (9,349)
Citywide Grand Total 52.125 2,659,980$ 2,833,412$ 3,682,081$ 9,175,473$
Totals by FundGeneral Fund/GSFC/ARPA 45.625 2,276,091$ 2,224,781$ 3,682,081$ 8,182,953$ Utility Fund 0.000 (9,349) - - (9,349) Stormwater Fund 2.000 157,454 - - 157,454 Hotel Occupancy Tax Fund 1.000 60,301 441,981 - 502,282 Sports Center 3.000 156,049 85,650 - 241,699 Multipurpose Complex Fund 0.500 19,434 81,000 - 100,434
Citywide Grand Total 52.125 2,659,980$ 2,833,412$ 3,682,081$ 9,175,473$
FY 2021-2022 Budget DRAFT - For d iscuss ion purposes on lyFY 2021-2022 Budget DRAFT - For d iscuss ion purposes on ly 19
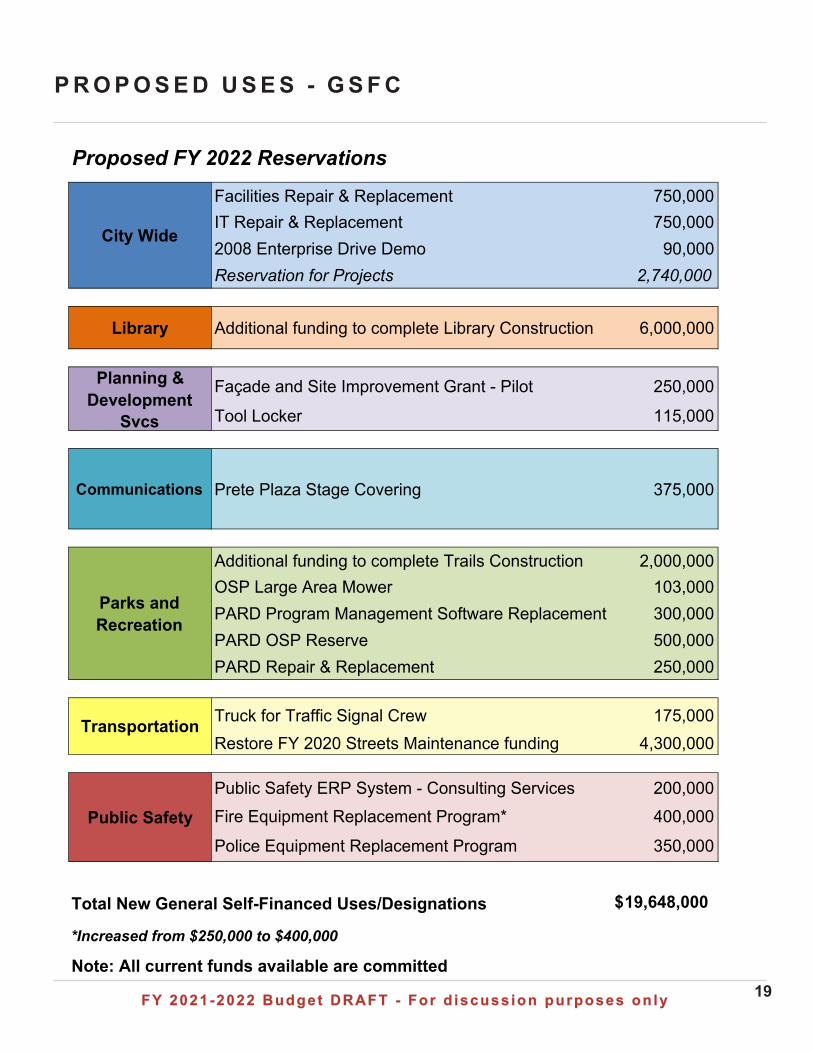
P R O P O S E D U S E S - G S F C
Proposed FY 2022 Reservations
Facilities Repair & Replacement 750,000IT Repair & Replacement 750,0002008 Enterprise Drive Demo 90,000Reservation for Projects 2,740,000
Library Additional funding to complete Library Construction 6,000,000
Façade and Site Improvement Grant - Pilot 250,000
Tool Locker 115,000
Communications Prete Plaza Stage Covering 375,000
Additional funding to complete Trails Construction 2,000,000OSP Large Area Mower 103,000PARD Program Management Software Replacement 300,000PARD OSP Reserve 500,000PARD Repair & Replacement 250,000
Truck for Traffic Signal Crew 175,000Restore FY 2020 Streets Maintenance funding 4,300,000
Public Safety ERP System - Consulting Services 200,000Fire Equipment Replacement Program* 400,000
Police Equipment Replacement Program 350,000
Total New General Self-Financed Uses/Designations 19,648,000$
*Increased from $250,000 to $400,000
Note: All current funds available are committed
Transportation
Public Safety
City Wide
Planning & Development
Svcs
Parks and Recreation
FY 2021-2022 Budget DRAFT - For d iscuss ion purposes on lyFY 2021-2022 Budget DRAFT - For d iscuss ion purposes on ly 20
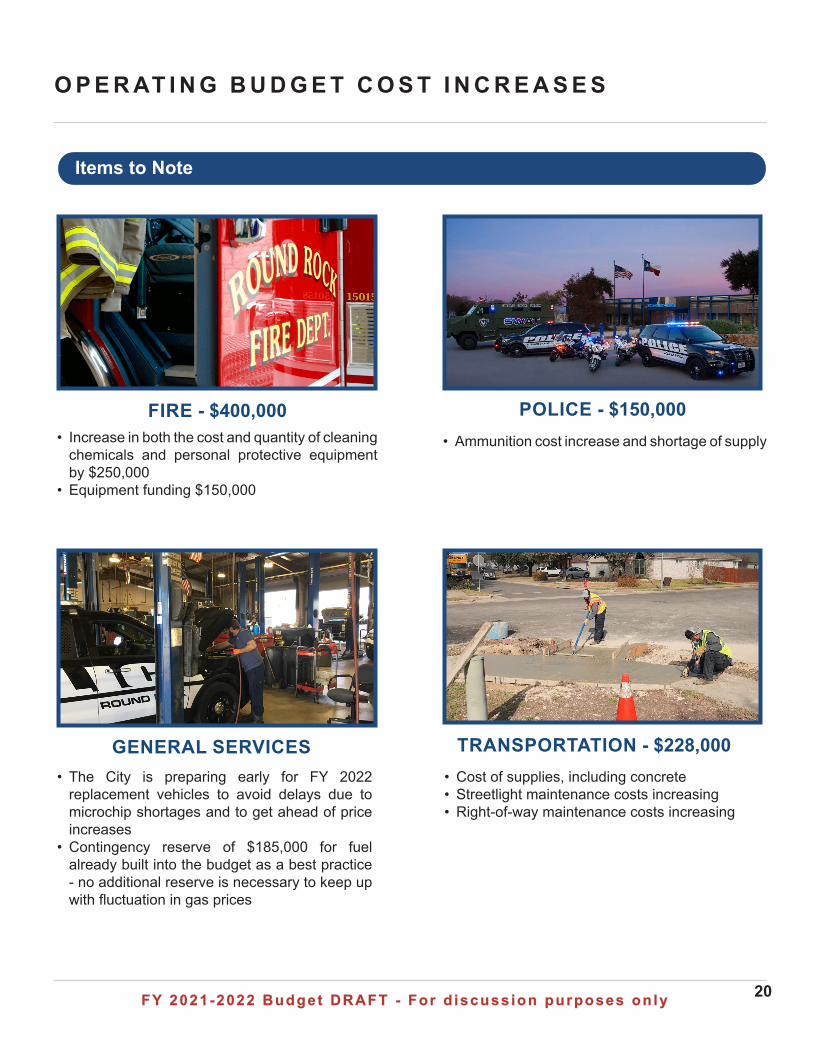
O P E R AT I N G B U D G E T C O S T I N C R E A S E S
Items to Note
GENERAL SERVICES
POLICE - $150,000FIRE - $400,000• Increase in both the cost and quantity of cleaning
chemicals and personal protective equipment by $250,000
• Equipment funding $150,000
TRANSPORTATION - $228,000
• Ammunition cost increase and shortage of supply
• The City is preparing early for FY 2022 replacement vehicles to avoid delays due to microchip shortages and to get ahead of price increases
• Contingency reserve of $185,000 for fuel already built into the budget as a best practice - no additional reserve is necessary to keep up with fluctuation in gas prices
• Cost of supplies, including concrete• Streetlight maintenance costs increasing• Right-of-way maintenance costs increasing
FY 2021-2022 Budget DRAFT - For d iscuss ion purposes on lyFY 2021-2022 Budget DRAFT - For d iscuss ion purposes on ly 21
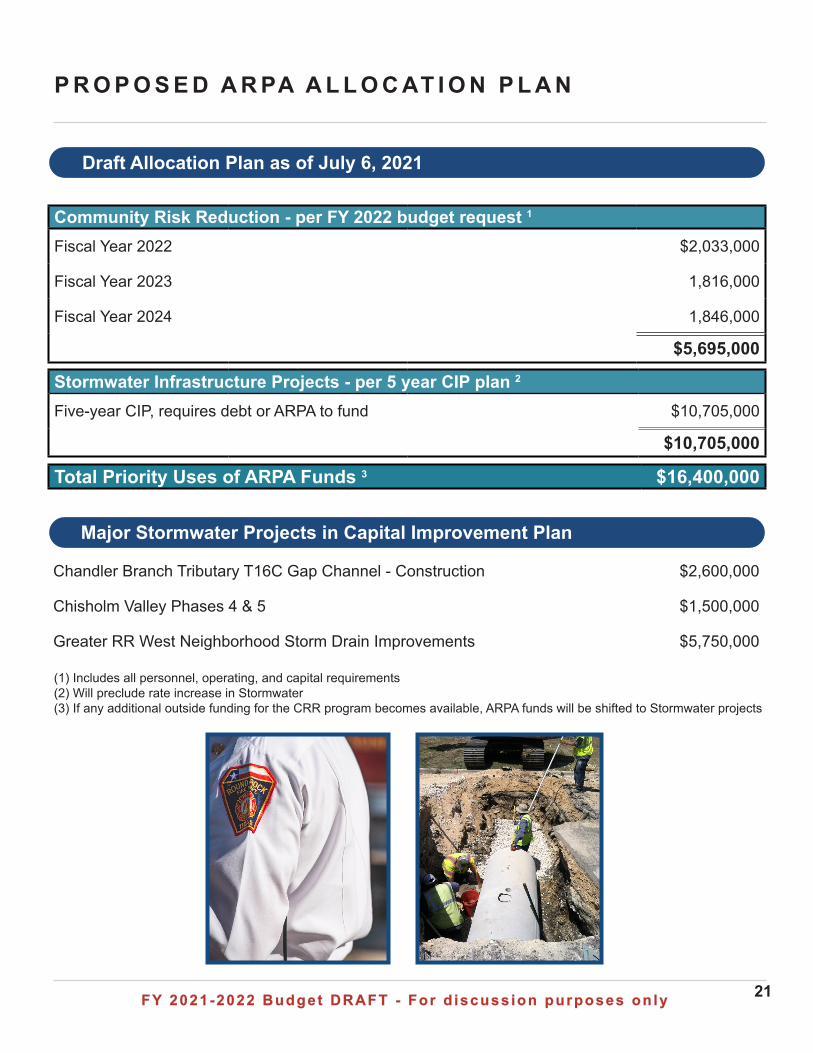
P R O P O S E D A R PA A L L O C AT I O N P L A N
Draft Allocation Plan as of July 6, 2021
Community Risk Reduction - per FY 2022 budget request 1
Fiscal Year 2022 $2,033,000
Fiscal Year 2023 1,816,000
Fiscal Year 2024 1,846,000
$5,695,000
Stormwater Infrastructure Projects - per 5 year CIP plan 2
Five-year CIP, requires debt or ARPA to fund $10,705,000
$10,705,000
Total Priority Uses of ARPA Funds 3 $16,400,000
Chandler Branch Tributary T16C Gap Channel - Construction $2,600,000
Chisholm Valley Phases 4 & 5 $1,500,000
Greater RR West Neighborhood Storm Drain Improvements $5,750,000
Major Stormwater Projects in Capital Improvement Plan
(1) Includes all personnel, operating, and capital requirements(2) Will preclude rate increase in Stormwater(3) If any additional outside funding for the CRR program becomes available, ARPA funds will be shifted to Stormwater projects
FY 2021-2022 Budget DRAFT - For d iscuss ion purposes on lyFY 2021-2022 Budget DRAFT - For d iscuss ion purposes on ly 22
U P C O M I N G I S S U E S / P O L I C Y D I S C U S S I O N
Water, Wastewater, and Stormwater Rates• No retail increases for FY 2022• Wholesale customer rate will need review, agreement, and adjustments• Review with Council in October/November with new rates in effect January 2022
Multipurpose Complex• Funding of $3 - $4 million needed by FY 2026 to replace turf on artificial fields
Dell Diamond• Capital improvements required to meet MLB standards• Cost estimate expected in July 2021• Cost sharing among Round Rock Express, Texas Rangers, and the City to be negotiated
Sports Center• Repayment to GSFC of $990,820 in FY 2022 • Projecting loan to GSFC will be paid off by FY 2026 - total amount owed is $7.24 million
HOT Fund - Policy Recommendation• Designate HOT funds for historical preservation• Annual operating set aside - 3% or $135,000 in FY 2022• One-time designation of fund balance in FY 2022 - 10% or $300,000
Dell Sales Tax• Proposed policy to further limit General Fund reliance on Dell sales tax revenue
◦ Reduce from 20% in FY 2021 to 15% by FY 2024
See detailed information on page 48 in the Financial Summaries section of the workbook.
Upcoming Issues
Proposed Financial Policy Changes
23FY 2021-2022 Budget DRAFT - For d iscuss ion purposes on lyFY 2021-2022 Budget DRAFT - For d iscuss ion purposes on ly
G R O W T H T R E N D SG R O W T H T R E N D S
• Population.......................................................................................................24
• City Cost Increases.........................................................................................25
• Percentage of Taxable Value..........................................................................26
• Parcels.............................................................................................................27
• Utility Customers.............................................................................................28
• 5-Year General Fund Forecast
◦ Revenue Projections..................................................................................30
◦ Property Tax Projections............................................................................31
◦ Sales Tax Projections.................................................................................32
◦ Expense Projections..................................................................................33
FY 2021-2022 Budget DRAFT - For d iscuss ion purposes on lyFY 2021-2022 Budget DRAFT - For d iscuss ion purposes on ly 24
P O P U L AT I O N
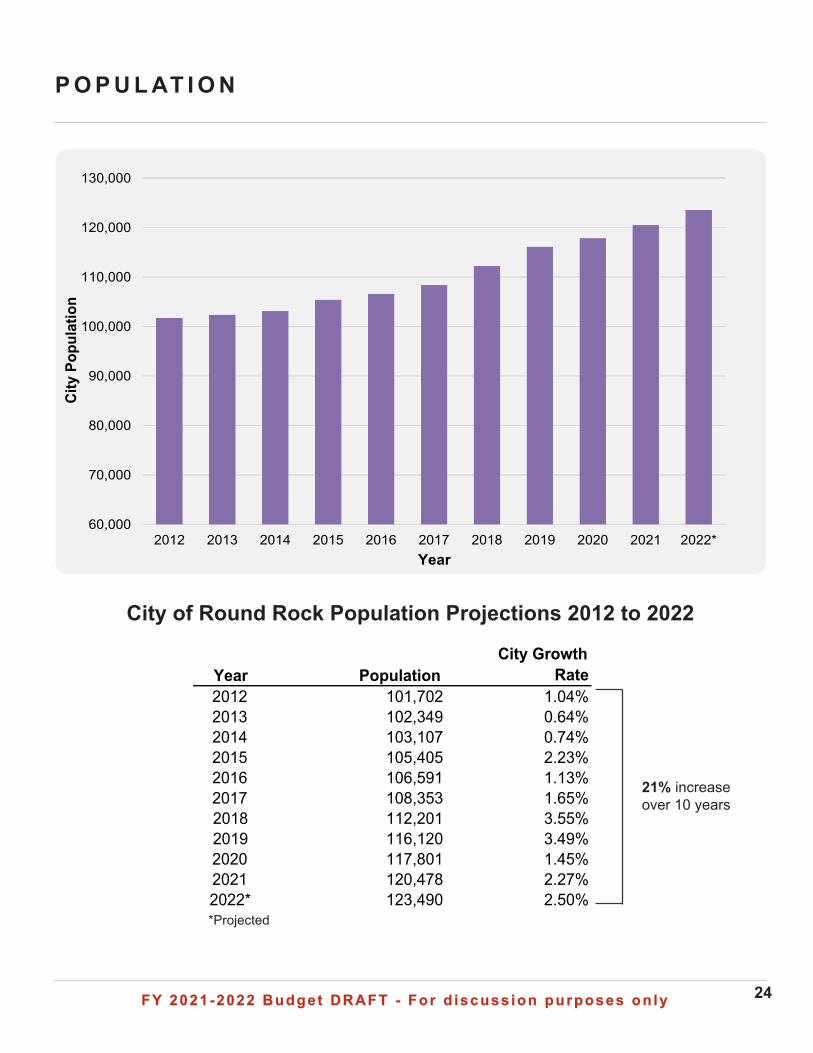
City of Round Rock Population Projections 2012 to 2022
*Projected
21% increase over 10 years
Year PopulationCity Growth
Rate2012 101,702 1.04%2013 102,349 0.64%2014 103,107 0.74%2015 105,405 2.23%2016 106,591 1.13%2017 108,353 1.65%2018 112,201 3.55%2019 116,120 3.49%2020 117,801 1.45%2021 120,478 2.27%2022* 123,490 2.50%
60,000
70,000
80,000
90,000
100,000
110,000
120,000
130,000
2012 2013 2014 2015 2016 2017 2018 2019 2020 2021 2022*
City
Pop
ulat
ion
Year
FY 2021-2022 Budget DRAFT - For d iscuss ion purposes on lyFY 2021-2022 Budget DRAFT - For d iscuss ion purposes on ly 25
C I T Y C O S T I N C R E A S E S O V E R 10 Y E A R S
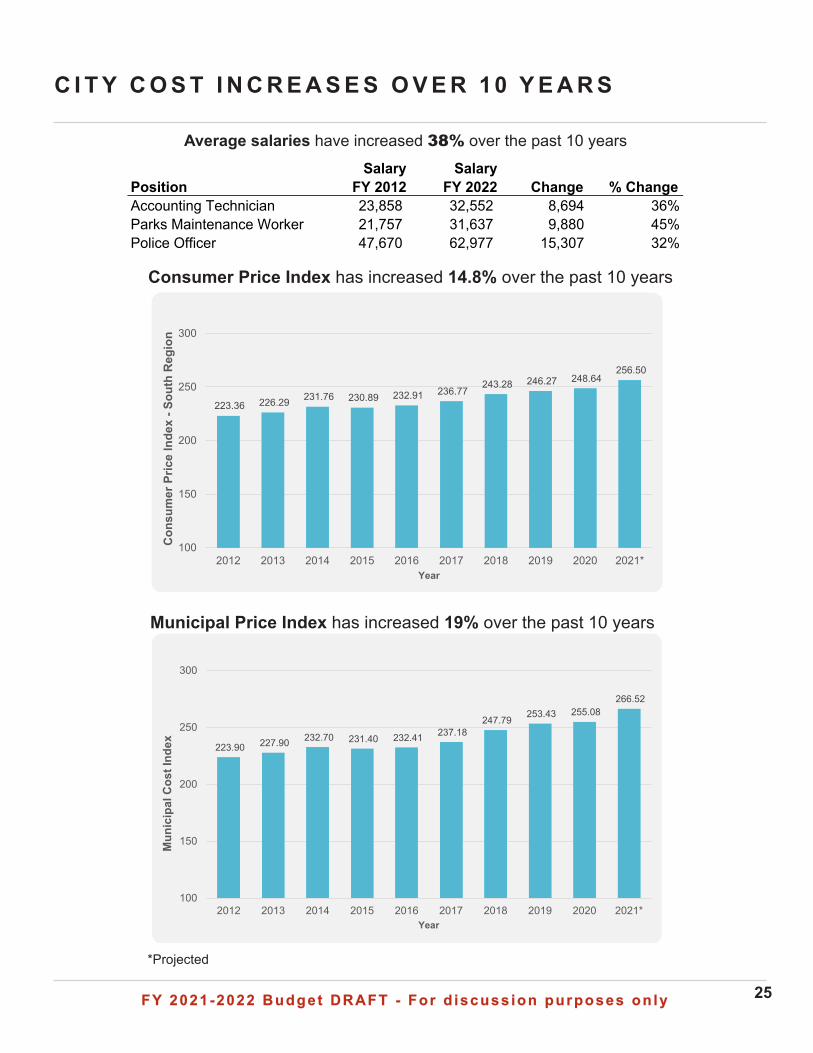
Consumer Price Index has increased 14.8% over the past 10 years
Average salaries have increased 38% over the past 10 years
Municipal Price Index has increased 19% over the past 10 years
Position Salary
FY 2012 Salary
FY 2022 Change % ChangeAccounting Technician 23,858 32,552 8,694 36%Parks Maintenance Worker 21,757 31,637 9,880 45%Police Officer 47,670 62,977 15,307 32%
223.36 226.29 231.76 230.89 232.91 236.77 243.28 246.27 248.64
256.50
100
150
200
250
300
2012 2013 2014 2015 2016 2017 2018 2019 2020 2021*
Con
sum
er P
rice
Inde
x -S
outh
Reg
ion
Year
223.90 227.90 232.70 231.40 232.41 237.18 247.79 253.43 255.08
266.52
100
150
200
250
300
2012 2013 2014 2015 2016 2017 2018 2019 2020 2021*
Mun
icip
al C
ost I
ndex
Year
*Projected
FY 2021-2022 Budget DRAFT - For d iscuss ion purposes on lyFY 2021-2022 Budget DRAFT - For d iscuss ion purposes on ly 26
G E N E R A L F U N D A S % O F T O TA L TA X A B L E VA L U E
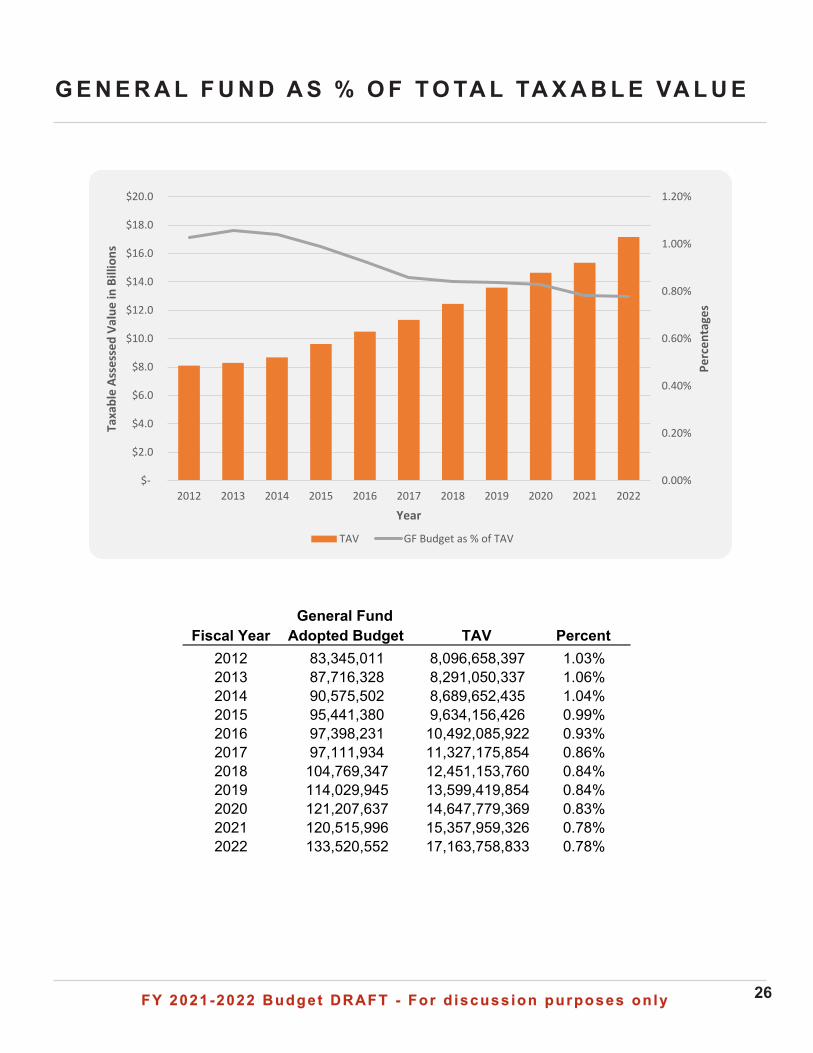
Fiscal YearGeneral Fund
Adopted Budget TAV Percent2012 83,345,011 8,096,658,397 1.03%2013 87,716,328 8,291,050,337 1.06%2014 90,575,502 8,689,652,435 1.04%2015 95,441,380 9,634,156,426 0.99%2016 97,398,231 10,492,085,922 0.93%2017 97,111,934 11,327,175,854 0.86%2018 104,769,347 12,451,153,760 0.84%2019 114,029,945 13,599,419,854 0.84%2020 121,207,637 14,647,779,369 0.83%2021 120,515,996 15,357,959,326 0.78%2022 133,520,552 17,163,758,833 0.78%
0.00%
0.20%
0.40%
0.60%
0.80%
1.00%
1.20%
$-
$2.0
$4.0
$6.0
$8.0
$10.0
$12.0
$14.0
$16.0
$18.0
$20.0
2012 2013 2014 2015 2016 2017 2018 2019 2020 2021 2022
Perc
enta
ges
Taxa
ble
Asse
ssed
Val
ue in
Bill
ions
Year
TAV GF Budget as % of TAV
FY 2021-2022 Budget DRAFT - For d iscuss ion purposes on lyFY 2021-2022 Budget DRAFT - For d iscuss ion purposes on ly 27
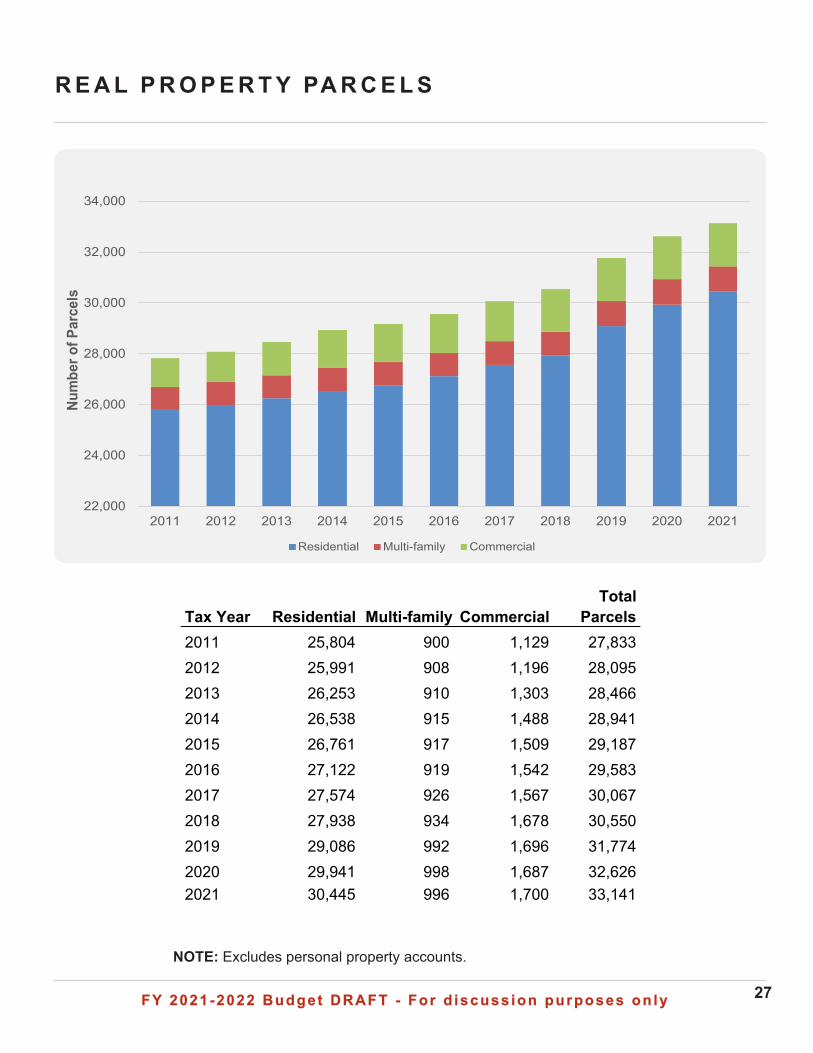
R E A L P R O P E R T Y PA R C E L S
NOTE: Excludes personal property accounts.
Tax Year Residential Multi-family CommercialTotal
Parcels2011 25,804 900 1,129 27,8332012 25,991 908 1,196 28,0952013 26,253 910 1,303 28,4662014 26,538 915 1,488 28,9412015 26,761 917 1,509 29,1872016 27,122 919 1,542 29,5832017 27,574 926 1,567 30,0672018 27,938 934 1,678 30,5502019 29,086 992 1,696 31,7742020 29,941 998 1,687 32,6262021 30,445 996 1,700 33,141
22,000
24,000
26,000
28,000
30,000
32,000
34,000
2011 2012 2013 2014 2015 2016 2017 2018 2019 2020 2021
Num
ber o
f Par
cels
Residential Multi-family Commercial
FY 2021-2022 Budget DRAFT - For d iscuss ion purposes on lyFY 2021-2022 Budget DRAFT - For d iscuss ion purposes on ly 28
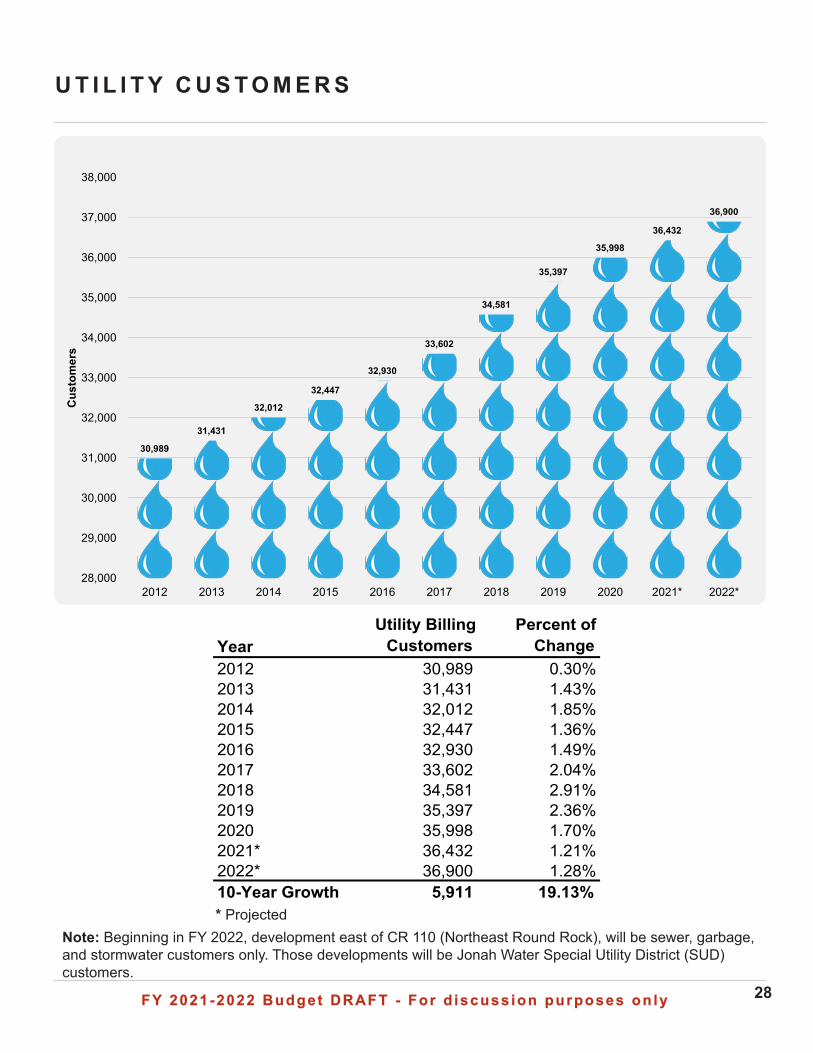
U T I L I T Y C U S T O M E R S
* ProjectedNote: Beginning in FY 2022, development east of CR 110 (Northeast Round Rock), will be sewer, garbage, and stormwater customers only. Those developments will be Jonah Water Special Utility District (SUD) customers.
YearUtility Billing
CustomersPercent of
Change2012 30,989 0.30%2013 31,431 1.43%2014 32,012 1.85%2015 32,447 1.36%2016 32,930 1.49%2017 33,602 2.04%2018 34,581 2.91%2019 35,397 2.36%2020 35,998 1.70%2021* 36,432 1.21%2022* 36,900 1.28%10-Year Growth 5,911 19.13%
30,989
31,431
32,012
32,447
32,930
33,602
34,581
35,397
35,998
36,432
36,900
28,000
29,000
30,000
31,000
32,000
33,000
34,000
35,000
36,000
37,000
38,000
2012 2013 2014 2015 2016 2017 2018 2019 2020 2021* 2022*
Cus
tom
ers
FY 2021-2022 Budget DRAFT - For d iscuss ion purposes on lyFY 2021-2022 Budget DRAFT - For d iscuss ion purposes on ly
5-YEAR GENERAL FUND FORECAST
FY 2021-2022 Budget DRAFT - For d iscuss ion purposes on lyFY 2021-2022 Budget DRAFT - For d iscuss ion purposes on ly 30
$0
$20
$40
$60
$80
$100
$120
$140
$160
$180
FY 2019 FY 2020 FY 2021 FY 2022 FY 2023 FY 2024 FY 2025 FY 2026
Mill
ions
Sales Tax
Property Taxes
Other Revenues
35%
17%
6%
43%
40%
14%
5%
41%
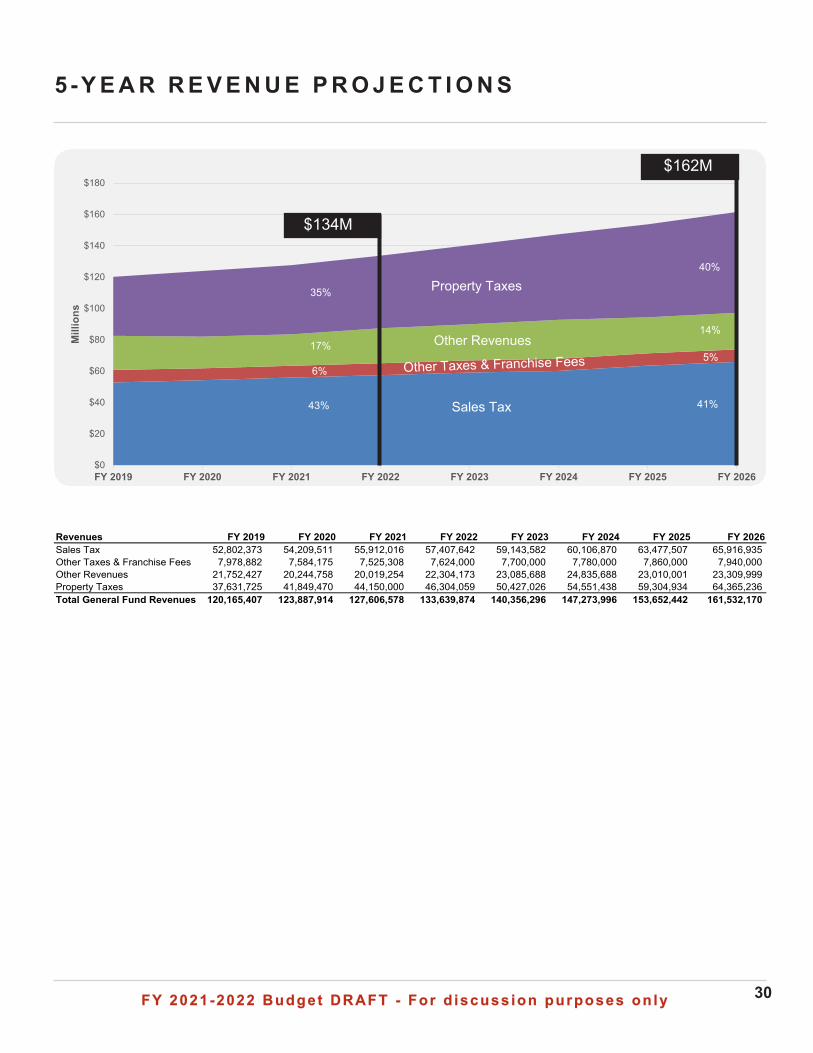
5- Y E A R R E V E N U E P R O J E C T I O N S
$134M
$162M
Revenues FY 2019 FY 2020 FY 2021 FY 2022 FY 2023 FY 2024 FY 2025 FY 2026Sales Tax 52,802,373 54,209,511 55,912,016 57,407,642 59,143,582 60,106,870 63,477,507 65,916,935 Other Taxes & Franchise Fees 7,978,882 7,584,175 7,525,308 7,624,000 7,700,000 7,780,000 7,860,000 7,940,000 Other Revenues 21,752,427 20,244,758 20,019,254 22,304,173 23,085,688 24,835,688 23,010,001 23,309,999 Property Taxes 37,631,725 41,849,470 44,150,000 46,304,059 50,427,026 54,551,438 59,304,934 64,365,236 Total General Fund Revenues 120,165,407 123,887,914 127,606,578 133,639,874 140,356,296 147,273,996 153,652,442 161,532,170
FY 2021-2022 Budget DRAFT - For d iscuss ion purposes on lyFY 2021-2022 Budget DRAFT - For d iscuss ion purposes on ly 31
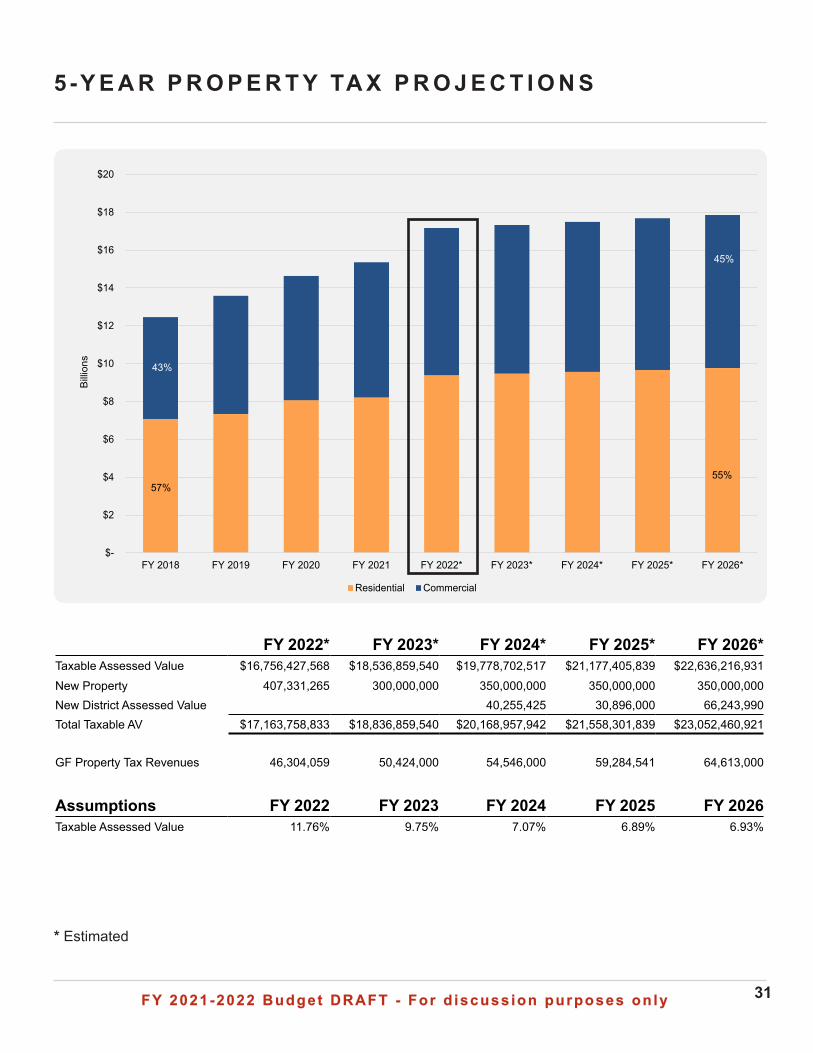
5- Y E A R P R O P E R T Y TA X P R O J E C T I O N S
FY 2022* FY 2023* FY 2024* FY 2025* FY 2026*Taxable Assessed Value $16,756,427,568 $18,536,859,540 $19,778,702,517 $21,177,405,839 $22,636,216,931New Property 407,331,265 300,000,000 350,000,000 350,000,000 350,000,000New District Assessed Value 40,255,425 30,896,000 66,243,990Total Taxable AV $17,163,758,833 $18,836,859,540 $20,168,957,942 $21,558,301,839 $23,052,460,921
GF Property Tax Revenues 46,304,059 50,424,000 54,546,000 59,284,541 64,613,000
Assumptions FY 2022 FY 2023 FY 2024 FY 2025 FY 2026Taxable Assessed Value 11.76% 9.75% 7.07% 6.89% 6.93%
$-
$2
$4
$6
$8
$10
$12
$14
$16
$18
$20
FY 2018 FY 2019 FY 2020 FY 2021 FY 2022* FY 2023* FY 2024* FY 2025* FY 2026*
Billi
ons
Residential Commercial
43%
57%
45%
55%
* Estimated
FY 2021-2022 Budget DRAFT - For d iscuss ion purposes on lyFY 2021-2022 Budget DRAFT - For d iscuss ion purposes on ly 32
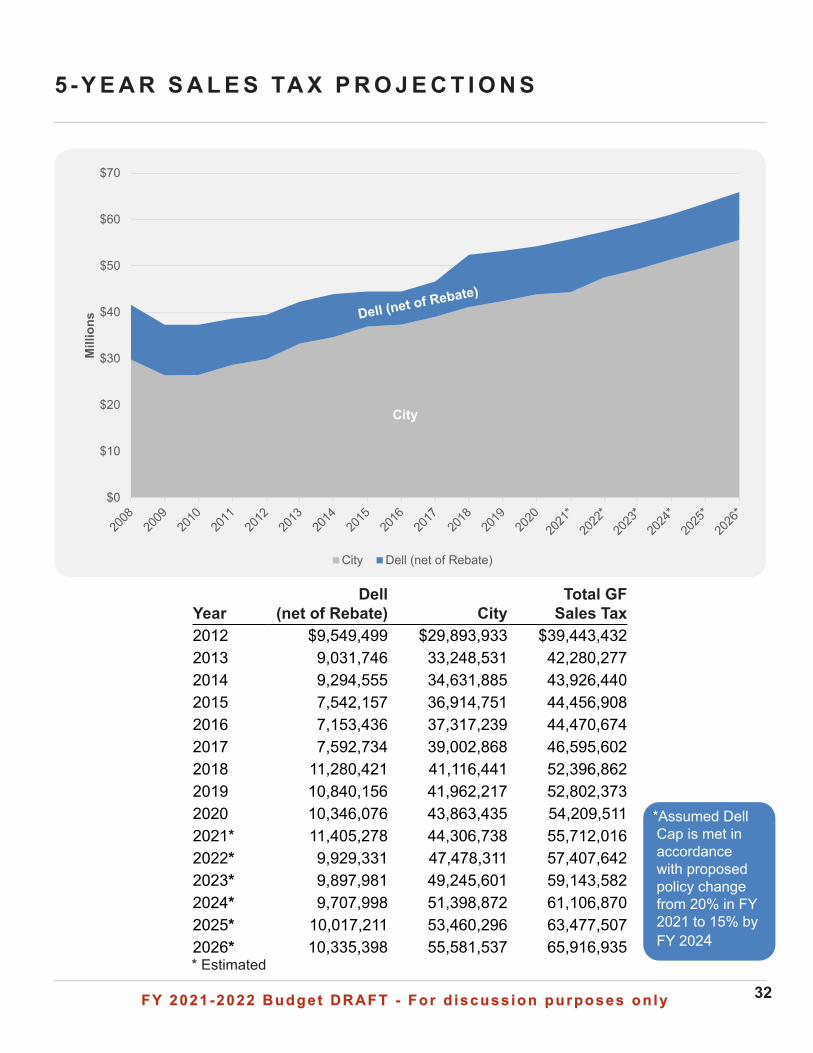
5- Y E A R S A L E S TA X P R O J E C T I O N S
YearDell
(net of Rebate) CityTotal GF
Sales Tax2012 $9,549,499 $29,893,933 $39,443,4322013 9,031,746 33,248,531 42,280,2772014 9,294,555 34,631,885 43,926,4402015 7,542,157 36,914,751 44,456,9082016 7,153,436 37,317,239 44,470,6742017 7,592,734 39,002,868 46,595,6022018 11,280,421 41,116,441 52,396,8622019 10,840,156 41,962,217 52,802,3732020 10,346,076 43,863,435 54,209,5112021* 11,405,278 44,306,738 55,712,0162022* 9,929,331 47,478,311 57,407,6422023* 9,897,981 49,245,601 59,143,5822024* 9,707,998 51,398,872 61,106,8702025* 10,017,211 53,460,296 63,477,5072026* 10,335,398 55,581,537 65,916,935
*Assumed Dell Cap is met in accordance with proposed policy change from 20% in FY 2021 to 15% by FY 2024
$0
$10
$20
$30
$40
$50
$60
$70
Mill
ions
City Dell (net of Rebate)
City
* Estimated
FY 2021-2022 Budget DRAFT - For d iscuss ion purposes on lyFY 2021-2022 Budget DRAFT - For d iscuss ion purposes on ly 33
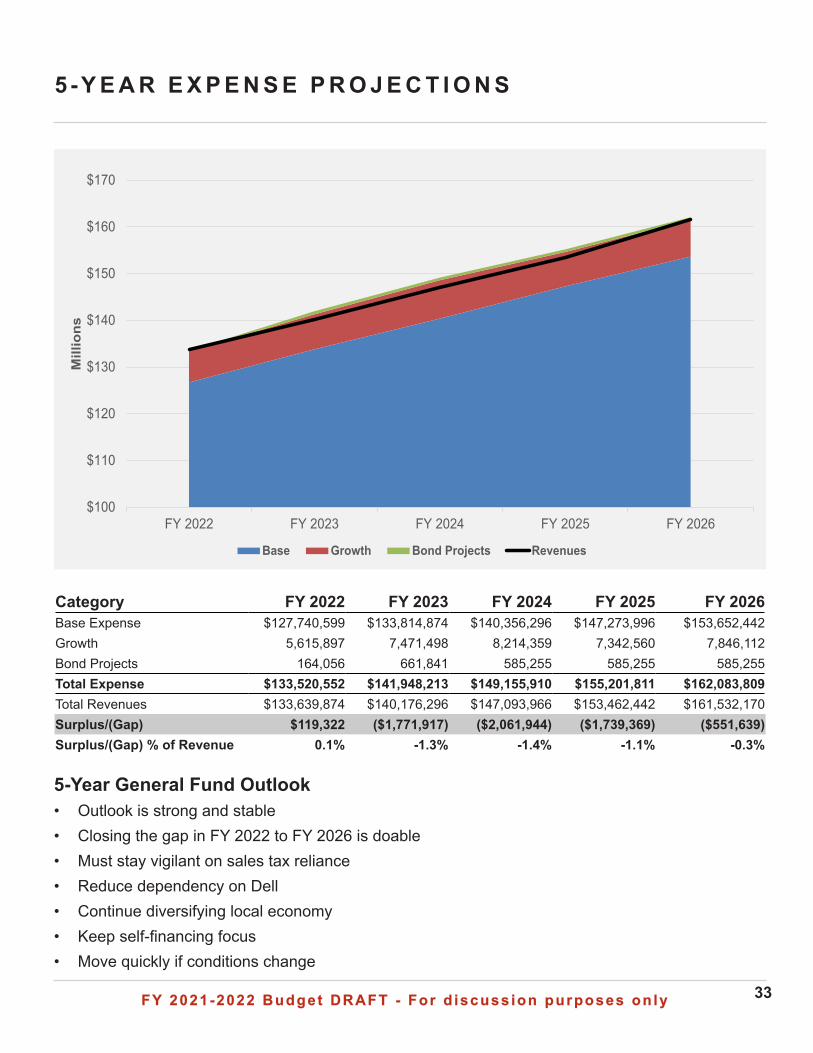
5- Y E A R E X P E N S E P R O J E C T I O N S
$100
$110
$120
$130
$140
$150
$160
$170
FY 2022 FY 2023 FY 2024 FY 2025 FY 2026
Mill
ions
Base Growth Bond Projects Revenues
Category FY 2022 FY 2023 FY 2024 FY 2025 FY 2026Base Expense $127,740,599 $133,814,874 $140,356,296 $147,273,996 $153,652,442Growth 5,615,897 7,471,498 8,214,359 7,342,560 7,846,112Bond Projects 164,056 661,841 585,255 585,255 585,255Total Expense $133,520,552 $141,948,213 $149,155,910 $155,201,811 $162,083,809Total Revenues $133,639,874 $140,176,296 $147,093,966 $153,462,442 $161,532,170Surplus/(Gap) $119,322 ($1,771,917) ($2,061,944) ($1,739,369) ($551,639)Surplus/(Gap) % of Revenue 0.1% -1.3% -1.4% -1.1% -0.3%
5-Year General Fund Outlook• Outlook is strong and stable• Closing the gap in FY 2022 to FY 2026 is doable• Must stay vigilant on sales tax reliance• Reduce dependency on Dell• Continue diversifying local economy• Keep self-financing focus• Move quickly if conditions change
34FY 2021-2022 Budget Dra f t - For D iscuss ion purposes on ly
F I N A N C I A L S U M M A R I E S & S C H E D U L E SF I N A N C I A L S U M M A R I E S & S C H E D U L E S
• All Funds Summaries ◦ Summary by Source....................................................................................35
◦ Summary by Fund......................................................................................36
◦ Summary by Use........................................................................................37
◦ All Funds Schedule.....................................................................................38• General Fund
◦ Revenues and Expenses............................................................................40
◦ General Fund Schedule..............................................................................41
◦ General Fund Budget Trend.......................................................................42
◦ Revenues by Major Category......................................................................43
◦ Revenues by Detailed Category..................................................................44
◦ 10 Year Revenue History.............................................................................46
◦ Sales Tax Review........................................................................................47
◦ Sales Tax Proposed Dell Poicy....................................................................48
• Water and Wastewater
◦ Utilities Fund Schedule...............................................................................50
◦ Utilities Fund Revenues..............................................................................51
• Stormwater Fund Schedule............................................................................52
• HOT Fund Schedule........................................................................................53
• Sports Center Fund Schedule.........................................................................54
• Multipurpose Complex Fund Schedule...........................................................55 • Summary of Special Revenue Funds..............................................................56
• Type B Fund Schedule....................................................................................57
• Type B 5-Year Plan..........................................................................................58
FY 2021-2022 Budget DRAFT - For d iscuss ion purposes on lyFY 2021-2022 Budget DRAFT - For d iscuss ion purposes on ly 35
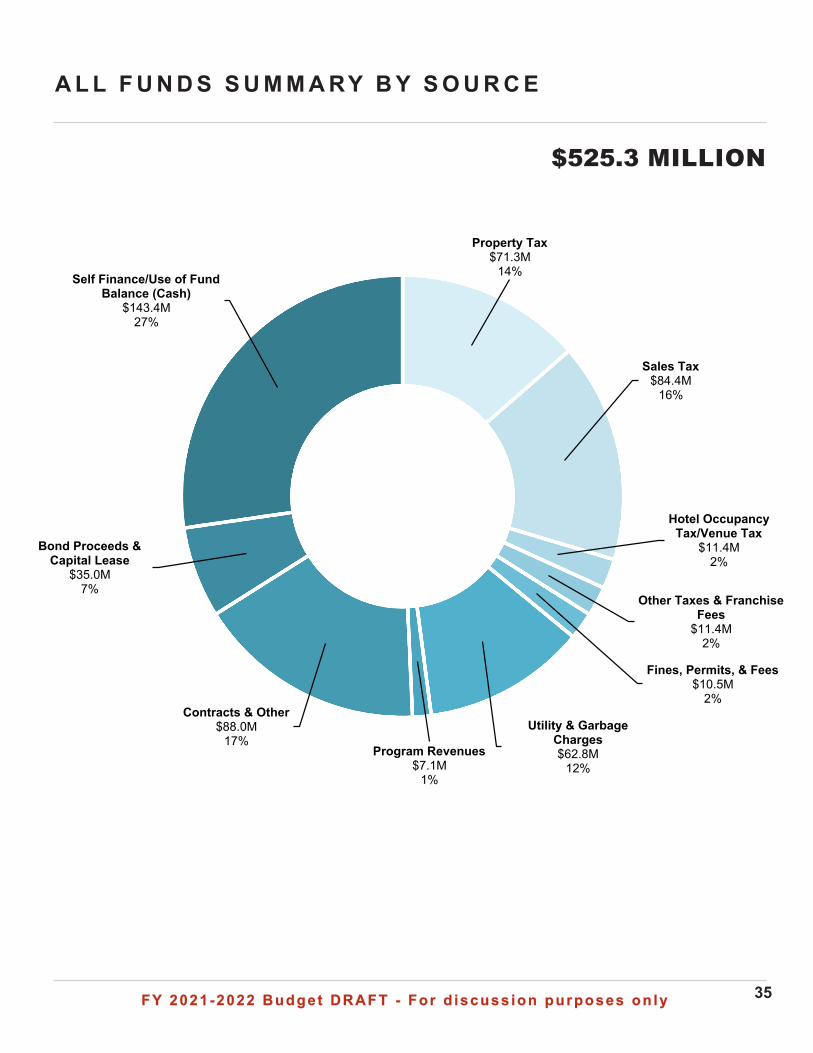
A L L F U N D S S U M M A RY B Y S O U R C E
$525.3 MILLION
Property Tax$71.3M
14%
Sales Tax$84.4M
16%
Hotel Occupancy Tax/Venue Tax
$11.4M2%
Other Taxes & Franchise Fees
$11.4M2%
Fines, Permits, & Fees$10.5M
2%
Utility & Garbage Charges$62.8M
12%Program Revenues
$7.1M1%
Contracts & Other$88.0M
17%
Bond Proceeds & Capital Lease
$35.0M7%
Self Finance/Use of Fund Balance (Cash)
$143.4M27%
FY 2021-2022 Budget DRAFT - For d iscuss ion purposes on lyFY 2021-2022 Budget DRAFT - For d iscuss ion purposes on ly 36
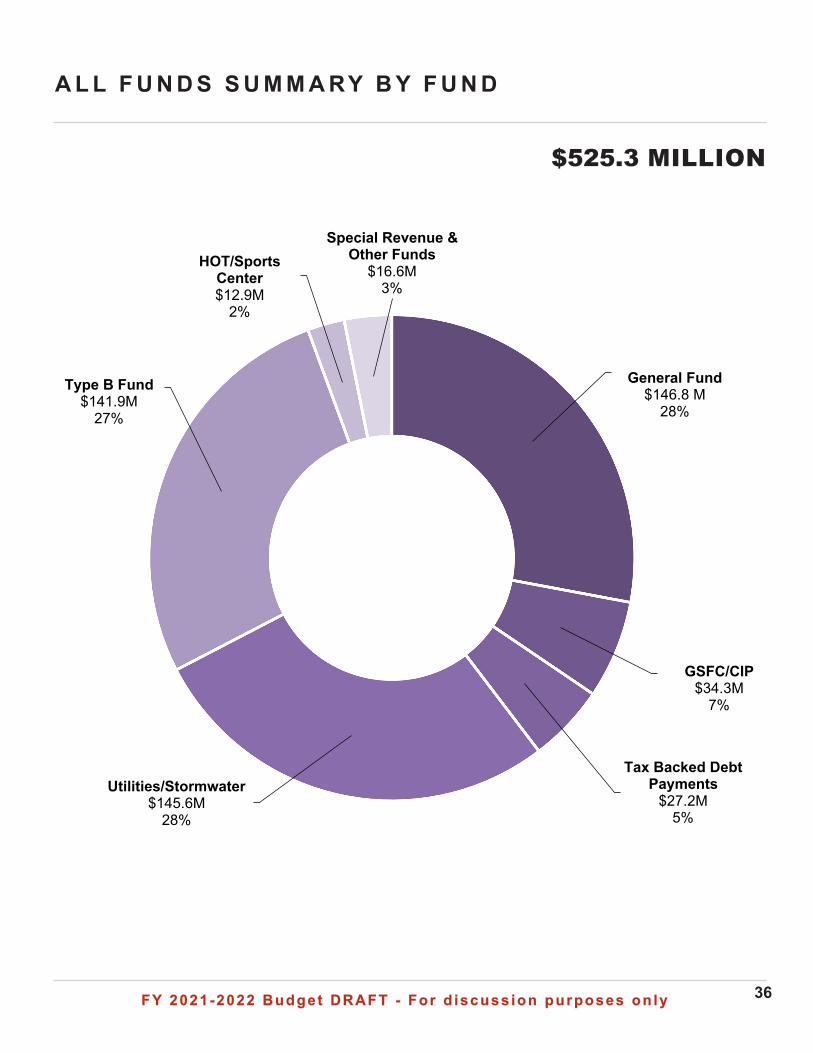
A L L F U N D S S U M M A RY B Y F U N D
$525.3 MILLION
General Fund$146.8 M
28%
GSFC/CIP$34.3M
7%
Tax Backed Debt Payments
$27.2M5%
Utilities/Stormwater$145.6M
28%
Type B Fund$141.9M
27%
HOT/Sports Center$12.9M
2%
Special Revenue & Other Funds
$16.6M3%
FY 2021-2022 Budget DRAFT - For d iscuss ion purposes on lyFY 2021-2022 Budget DRAFT - For d iscuss ion purposes on ly 37
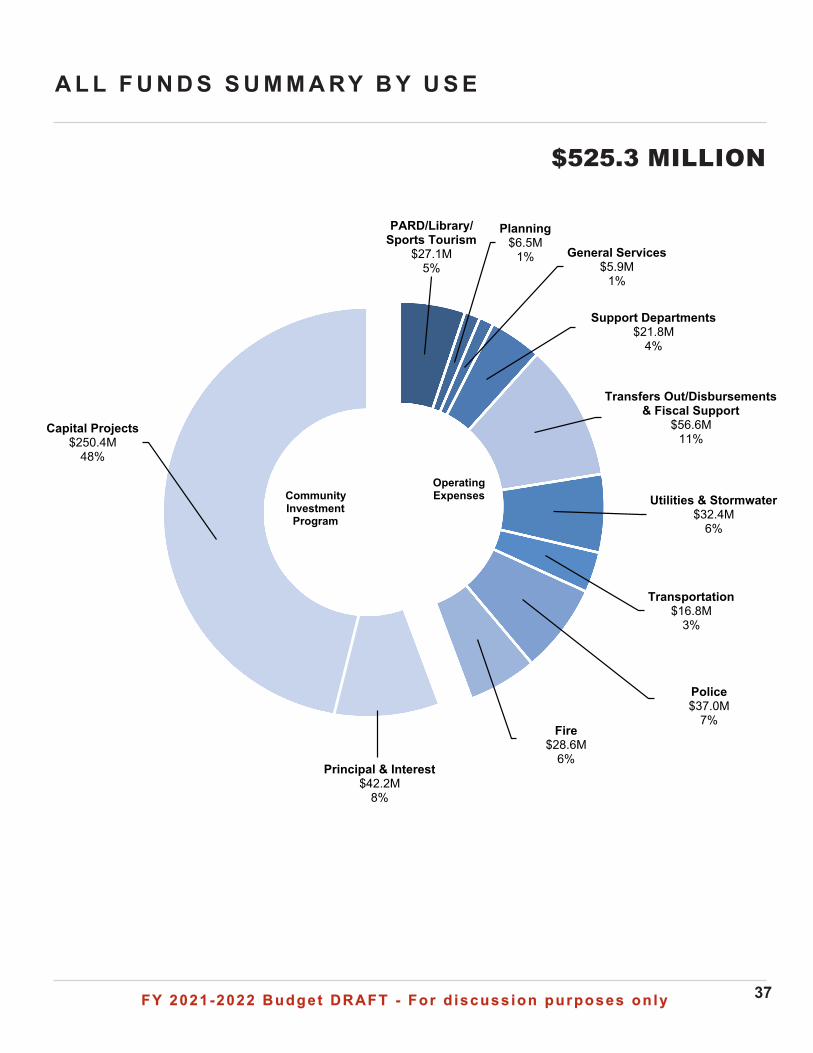
A L L F U N D S S U M M A RY B Y U S E
$525.3 MILLION
PARD/Library/Sports Tourism
$27.1M5%
Planning$6.5M
1% General Services$5.9M
1%
Support Departments$21.8M
4%
Transfers Out/Disbursements & Fiscal Support
$56.6M11%
Utilities & Stormwater$32.4M
6%
Transportation$16.8M
3%
Police$37.0M
7%Fire
$28.6M6%
Capital Projects$250.4M
48%
Community Investment
Program
OperatingExpenses
Principal & Interest$42.2M
8%
FY 2021-2022 Budget DRAFT - For d iscuss ion purposes on lyFY 2021-2022 Budget DRAFT - For d iscuss ion purposes on ly 38
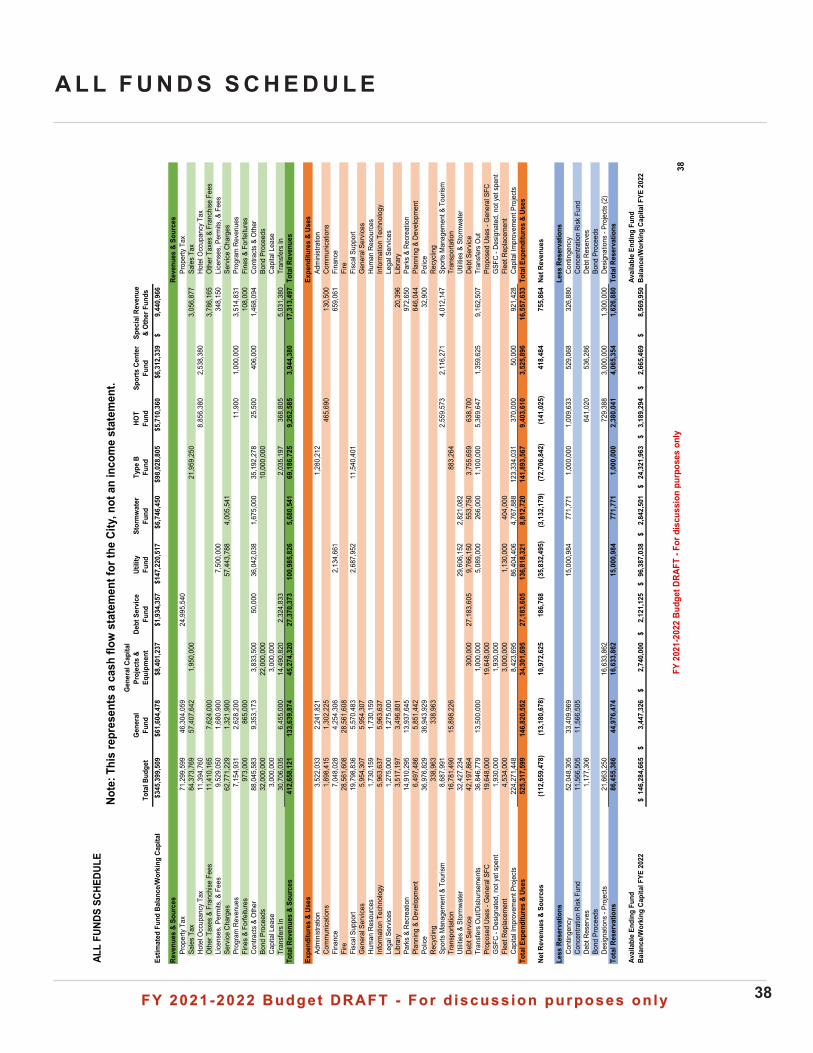
A L L F U N D S S C H E D U L EAL
L FU
NDS
SCHE
DULE
Note
: Thi
s re
pres
ents
a c
ash
flow
sta
tem
ent f
or th
e Ci
ty, n
ot a
n in
com
e st
atem
ent.
Tota
l Bud
get
Gen
eral
Fund
Gen
eral
Cap
ital
Proj
ects
&
Equi
pmen
tDe
bt S
ervi
ce
Fund
Utili
ty
Fu
ndSt
orm
wat
er
Fu
ndTy
pe B
Fund
HOT
Fund
Spor
ts C
ente
r
Fu
ndSp
ecia
l Rev
enue
&
Oth
er F
unds
Estim
ated
Fun
d Ba
lanc
e/W
orki
ng C
apita
l$3
45,3
99,5
09$6
1,60
4,47
8$8
,401
,237
$1,9
34,3
57$1
47,2
20,5
17$6
,746
,450
$98,
028,
805
$5,7
10,3
60$6
,312
,339
9,44
0,96
6$
Reve
nues
& S
ourc
esRe
venu
es &
Sou
rces
Prop
erty
Tax
71,
299,
599
46,
304,
059
24,
995,
540
Prop
erty
Tax
Sale
s Ta
x 8
4,37
3,76
9 5
7,40
7,64
2 1
,950
,000
21,
959,
250
3,0
56,8
77Sa
les
Tax
Hote
l Occ
upan
cy T
ax 1
1,39
4,76
0 8
,856
,380
2,5
38,3
80Ho
tel O
ccup
ancy
Tax
Oth
er T
axes
& F
ranc
hise
Fee
s 1
1,41
0,16
5 7
,624
,000
3,7
86,1
65O
ther
Tax
es &
Fra
nchi
se F
ees
Lice
nses
, Per
mits
, & F
ees
9,5
29,0
50 1
,680
,900
7,5
00,0
00 3
48,1
50Li
cens
es, P
erm
its, &
Fee
sSe
rvice
Cha
rges
62,
771,
229
1,3
21,9
00 5
7,44
3,78
8 4
,005
,541
Serv
ice C
harg
esPr
ogra
m R
even
ues
7,1
54,9
31 2
,628
,200
11,
900
1,0
00,0
00 3
,514
,831
Prog
ram
Rev
enue
sFi
nes
& Fo
rfeitu
res
973
,000
865
,000
108
,000
Fine
s &
Forfe
iture
sCo
ntra
cts
& O
ther
88,
045,
583
9,3
53,1
73 3
,833
,500
50,
000
36,
042,
038
1,6
75,0
00 3
5,19
2,27
8 2
5,50
0 4
06,0
00 1
,468
,094
Cont
ract
s &
Oth
erBo
nd P
roce
eds
32,
000,
000
22,
000,
000
10,
000,
000
Bond
Pro
ceed
sCa
pita
l Lea
se 3
,000
,000
3,0
00,0
00Ca
pita
l Lea
seTr
ansf
ers
In 3
0,70
6,03
5 6
,455
,000
14,
490,
820
2,3
24,8
33 2
,035
,197
368
,805
5,0
31,3
80Tr
ansf
ers
InTo
tal R
even
ues
& So
urce
s 4
12,6
58,1
21 1
33,6
39,8
74 4
5,27
4,32
0 2
7,37
0,37
3 1
00,9
85,8
26 5
,680
,541
69,
186,
725
9,2
62,5
85 3
,944
,380
17,
313,
497
Tota
l Rev
enue
s
Expe
nditu
res
& Us
esEx
pend
iture
s &
Uses
Adm
inist
ratio
n 3
,522
,033
2,2
41,8
21 1
,280
,212
Adm
inist
ratio
nCo
mm
unica
tions
1,8
98,4
15 1
,302
,225
465
,690
130
,500
Com
mun
icatio
nsFi
nanc
e 7
,048
,028
4,2
54,3
06 2
,134
,661
659
,061
Fina
nce
Fire
28,
561,
608
28,
561,
608
Fire
Fisc
al S
uppo
rt 1
9,79
8,83
6 5
,570
,483
2,6
87,9
52 1
1,54
0,40
1Fi
scal
Sup
port
Gen
eral
Ser
vices
5,9
54,3
07 5
,954
,307
Gen
eral
Ser
vices
Hum
an R
esou
rces
1,7
30,1
59 1
,730
,159
Hum
an R
esou
rces
Info
rmat
ion
Tech
nolo
gy 5
,963
,637
5,9
63,6
37In
form
atio
n Te
chno
logy
Lega
l Ser
vices
1,2
75,0
00 1
,275
,000
Lega
l Ser
vices
Libr
ary
3,5
17,1
97 3
,496
,801
20,
396
Libr
ary
Park
s &
Recr
eatio
n 1
4,91
0,29
5 1
3,93
7,64
5 9
72,6
50Pa
rks
& Re
crea
tion
Plan
ning
& D
evel
opm
ent
6,4
97,4
86 5
,851
,442
646
,044
Plan
ning
& D
evel
opm
ent
Polic
e 3
6,97
6,82
9 3
6,94
3,92
9 3
2,90
0Po
lice
Recy
cling
338
,963
338
,963
Recy
cling
Spor
ts M
anag
emen
t & T
ouris
m 8
,687
,991
2,5
59,5
73 2
,116
,271
4,0
12,1
47Sp
orts
Man
agem
ent &
Tou
rism
Tran
spor
tatio
n 1
6,78
1,49
0 1
5,89
8,22
6 8
83,2
64Tr
ansp
orta
tion
Utilit
ies
& St
orm
wate
r 3
2,42
7,23
4 2
9,60
6,15
2 2
,821
,082
Utilit
ies
& St
orm
wate
rDe
bt S
ervic
e 4
2,19
7,86
4 3
00,0
00 2
7,18
3,60
5 9
,766
,150
553
,750
3,7
55,6
59 6
38,7
00De
bt S
ervic
eTr
ansf
ers
Out
/Disb
urse
men
ts 3
6,84
6,77
9 1
3,50
0,00
0 1
,000
,000
5,0
89,0
00 2
66,0
00 1
,100
,000
5,3
69,6
47 1
,359
,625
9,1
62,5
07Tr
ansf
ers
Out
Prop
osed
Use
s - G
ener
al S
FC 1
9,64
8,00
0 1
9,64
8,00
0Pr
opos
ed U
ses
- Gen
eral
SFC
GSF
C - D
esig
nate
d, n
ot y
et s
pent
1,9
30,0
00 1
,930
,000
GSF
C - D
esig
nate
d, n
ot y
et s
pent
Flee
t Rep
lace
men
t 4
,534
,000
3,0
00,0
00 1
,130
,000
404
,000
Flee
t Rep
lace
men
tCa
pita
l Im
prov
emen
t Pro
ject
s 2
24,2
71,4
48 8
,423
,695
86,
404,
406
4,7
67,8
88 1
23,3
34,0
31 3
70,0
00 5
0,00
0 9
21,4
28Ca
pita
l Im
prov
emen
t Pro
ject
sTo
tal E
xpen
ditu
res
& Us
es 5
25,3
17,5
99 1
46,8
20,5
52 3
4,30
1,69
5 2
7,18
3,60
5 1
36,8
18,3
21 8
,812
,720
141
,893
,567
9,4
03,6
10 3
,525
,896
16,
557,
633
Tota
l Exp
endi
ture
s &
Uses
Net R
even
ues
& So
urce
s (1
12,6
59,4
78)
(13,
180,
678)
10,
972,
625
186
,768
(35,
832,
495)
(3,1
32,1
79)
(72,
706,
842)
(141
,025
) 4
18,4
84 7
55,8
64Ne
t Rev
enue
s
Less
Res
erva
tions
Less
Res
erva
tions
Cont
inge
ncy
52,
048,
305
33,
409,
969
15,
000,
984
771
,771
1,0
00,0
00 1
,009
,633
529
,068
326
,880
Cont
inge
ncy
Conc
entra
tion
Risk
Fun
d 1
1,56
6,50
5 1
1,56
6,50
5Co
ncen
tratio
n Ri
sk F
und
Debt
Res
erve
s 1
,177
,306
641
,020
536
,286
Debt
Res
erve
sBo
nd P
roce
eds
Bond
Pro
ceed
sDe
signa
tions
- Pr
ojec
ts 2
1,66
3,25
0 1
6,63
3,86
2 7
29,3
88 3
,000
,000
1,3
00,0
00De
signa
tions
- Pr
ojec
ts (2
)To
tal R
eser
vatio
ns 8
6,45
5,36
6 4
4,97
6,47
4 1
6,63
3,86
2 1
5,00
0,98
4 7
71,7
71 1
,000
,000
2,3
80,0
41 4
,065
,354
1,6
26,8
80To
tal R
eser
vatio
ns
Avai
labl
e En
ding
Fun
dAv
aila
ble
Endi
ng F
und
Bala
nce/
Wor
king
Cap
ital F
YE 2
022
146,
284,
665
$
3,44
7,32
6$
2,
740,
000
$
2,12
1,12
5$
96,3
87,0
38$
2,
842,
501
$
24
,321
,963
$
3,18
9,29
4$
2,66
5,46
9$
8,56
9,95
0$
Ba
lanc
e/W
orki
ng C
apita
l FYE
202
2
FY 2
021-
2022
Bud
get D
RAFT
- Fo
r dis
cuss
ion
purp
oses
onl
y38
FY 2021-2022 Budget DRAFT - For d iscuss ion purposes on lyFY 2021-2022 Budget DRAFT - For d iscuss ion purposes on ly
G E N E R A L F U N D
FY 2021-2022 Budget DRAFT - For d iscuss ion purposes on lyFY 2021-2022 Budget DRAFT - For d iscuss ion purposes on ly 40
G E N E R A L F U N D R E V E N U E S & E X P E N S E S
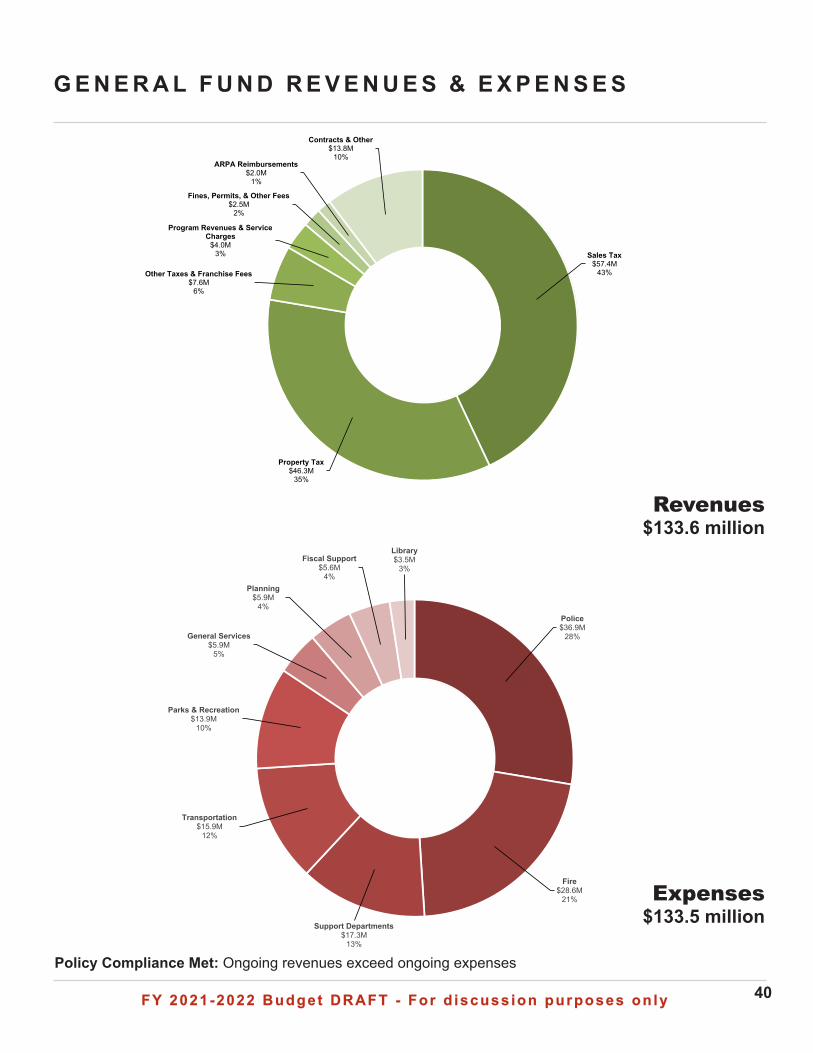
Revenues$133.6 million
Expenses$133.5 million
Policy Compliance Met: Ongoing revenues exceed ongoing expenses
Sales Tax$57.4M
43%
Property Tax$46.3M
35%
Other Taxes & Franchise Fees$7.6M
6%
Program Revenues & Service Charges
$4.0M3%
Fines, Permits, & Other Fees$2.5M
2%
ARPA Reimbursements$2.0M
1%
Contracts & Other$13.8M
10%
Police$36.9M
28%
Fire$28.6M
21%
Support Departments$17.3M
13%
Transportation$15.9M
12%
Parks & Recreation$13.9M
10%
General Services$5.9M
5%
Planning$5.9M
4%
Fiscal Support$5.6M
4%
Library$3.5M
3%
FY 2021-2022 Budget DRAFT - For d iscuss ion purposes on lyFY 2021-2022 Budget DRAFT - For d iscuss ion purposes on ly 41
G E N E R A L F U N D S C H E D U L E
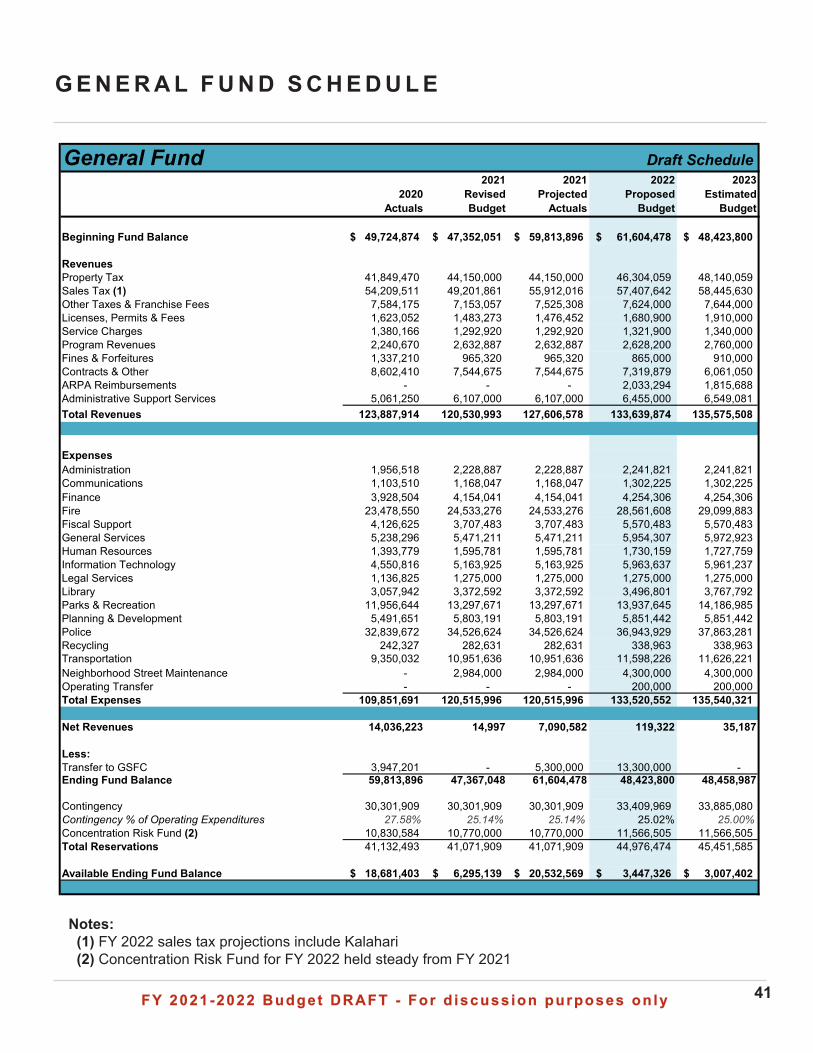
Notes: (1) FY 2022 sales tax projections include Kalahari (2) Concentration Risk Fund for FY 2022 held steady from FY 2021
7/15/2021
General Fund Draft Schedule
2020 Actuals
2021Revised Budget
2021Projected
Actuals
2022Proposed
Budget
2023Estimated
Budget
Beginning Fund Balance 49,724,874$ 47,352,051$ 59,813,896$ 61,604,478$ 48,423,800$
RevenuesProperty Tax 41,849,470 44,150,000 44,150,000 46,304,059 48,140,059 Sales Tax (1) 54,209,511 49,201,861 55,912,016 57,407,642 58,445,630 Other Taxes & Franchise Fees 7,584,175 7,153,057 7,525,308 7,624,000 7,644,000 Licenses, Permits & Fees 1,623,052 1,483,273 1,476,452 1,680,900 1,910,000 Service Charges 1,380,166 1,292,920 1,292,920 1,321,900 1,340,000 Program Revenues 2,240,670 2,632,887 2,632,887 2,628,200 2,760,000 Fines & Forfeitures 1,337,210 965,320 965,320 865,000 910,000 Contracts & Other 8,602,410 7,544,675 7,544,675 7,319,879 6,061,050 ARPA Reimbursements - - - 2,033,294 1,815,688 Administrative Support Services 5,061,250 6,107,000 6,107,000 6,455,000 6,549,081 Total Revenues 123,887,914 120,530,993 127,606,578 133,639,874 135,575,508
ExpensesAdministration 1,956,518 2,228,887 2,228,887 2,241,821 2,241,821 Communications 1,103,510 1,168,047 1,168,047 1,302,225 1,302,225 Finance 3,928,504 4,154,041 4,154,041 4,254,306 4,254,306 Fire 23,478,550 24,533,276 24,533,276 28,561,608 29,099,883 Fiscal Support 4,126,625 3,707,483 3,707,483 5,570,483 5,570,483 General Services 5,238,296 5,471,211 5,471,211 5,954,307 5,972,923 Human Resources 1,393,779 1,595,781 1,595,781 1,730,159 1,727,759 Information Technology 4,550,816 5,163,925 5,163,925 5,963,637 5,961,237 Legal Services 1,136,825 1,275,000 1,275,000 1,275,000 1,275,000 Library 3,057,942 3,372,592 3,372,592 3,496,801 3,767,792 Parks & Recreation 11,956,644 13,297,671 13,297,671 13,937,645 14,186,985 Planning & Development 5,491,651 5,803,191 5,803,191 5,851,442 5,851,442 Police 32,839,672 34,526,624 34,526,624 36,943,929 37,863,281 Recycling 242,327 282,631 282,631 338,963 338,963 Transportation 9,350,032 10,951,636 10,951,636 11,598,226 11,626,221 Neighborhood Street Maintenance - 2,984,000 2,984,000 4,300,000 4,300,000 Operating Transfer - - - 200,000 200,000 Total Expenses 109,851,691 120,515,996 120,515,996 133,520,552 135,540,321
Net Revenues 14,036,223 14,997 7,090,582 119,322 35,187
Less:Transfer to GSFC 3,947,201 - 5,300,000 13,300,000 - Ending Fund Balance 59,813,896 47,367,048 61,604,478 48,423,800 48,458,987
Contingency 30,301,909 30,301,909 30,301,909 33,409,969 33,885,080 Contingency % of Operating Expenditures 27.58% 25.14% 25.14% 25.02% 25.00%Concentration Risk Fund (2) 10,830,584 10,770,000 10,770,000 11,566,505 11,566,505 Total Reservations 41,132,493 41,071,909 41,071,909 44,976,474 45,451,585
Available Ending Fund Balance 18,681,403$ 6,295,139$ 20,532,569$ 3,447,326$ 3,007,402$
Notes:(1) FY 2022 sales tax projections include Kalahari.(2) Concentration Risk Fund for FY 2022 held steady from FY 2021.
Z:\Budget\FY 22\Fund Schedules\General Fund\General Fund FY22
FY 2021-2022 Budget DRAFT - For d iscuss ion purposes on lyFY 2021-2022 Budget DRAFT - For d iscuss ion purposes on ly 42
G E N E R A L F U N D B U D G E T T R E N D
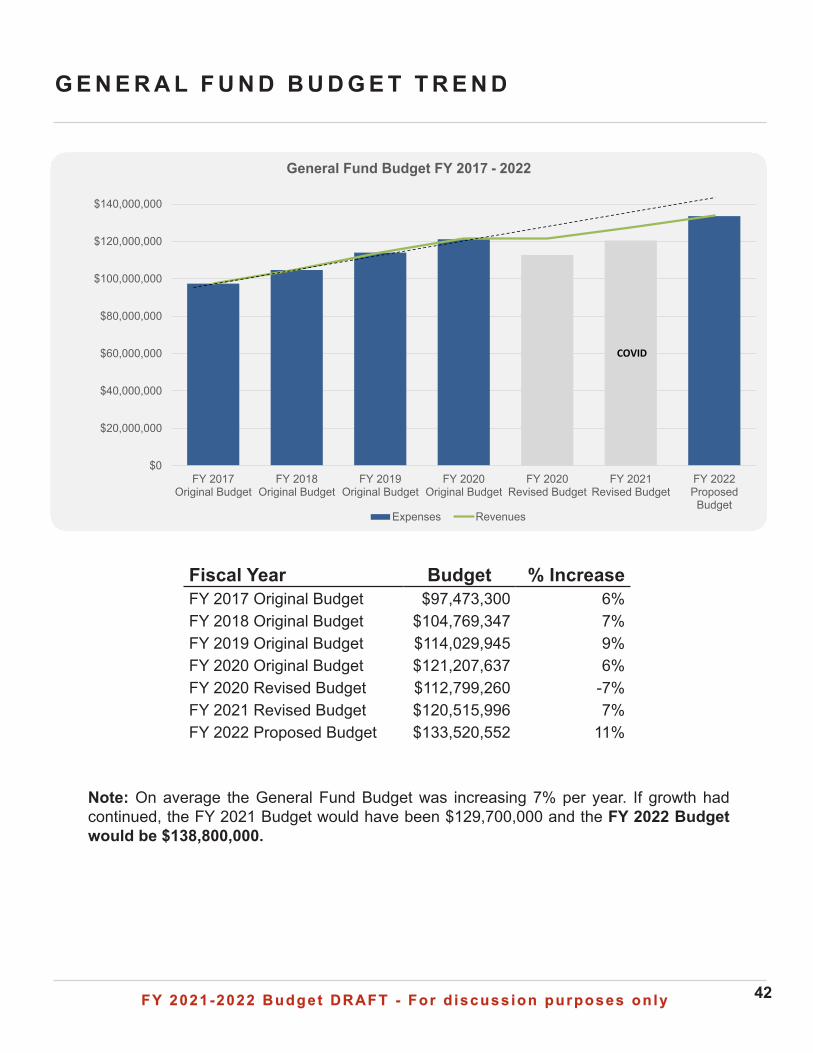
Fiscal Year Budget % IncreaseFY 2017 Original Budget $97,473,300 6%FY 2018 Original Budget $104,769,347 7% FY 2019 Original Budget $114,029,945 9%FY 2020 Original Budget $121,207,637 6%FY 2020 Revised Budget $112,799,260 -7%FY 2021 Revised Budget $120,515,996 7%FY 2022 Proposed Budget $133,520,552 11%
Note: On average the General Fund Budget was increasing 7% per year. If growth had continued, the FY 2021 Budget would have been $129,700,000 and the FY 2022 Budget would be $138,800,000.
$0
$20,000,000
$40,000,000
$60,000,000
$80,000,000
$100,000,000
$120,000,000
$140,000,000
FY 2017Original Budget
FY 2018Original Budget
FY 2019Original Budget
FY 2020Original Budget
FY 2020Revised Budget
FY 2021Revised Budget
FY 2022ProposedBudget
General Fund Budget FY 2017 - 2022
Expenses Revenues
COVID
FY 2021-2022 Budget DRAFT - For d iscuss ion purposes on lyFY 2021-2022 Budget DRAFT - For d iscuss ion purposes on ly 43
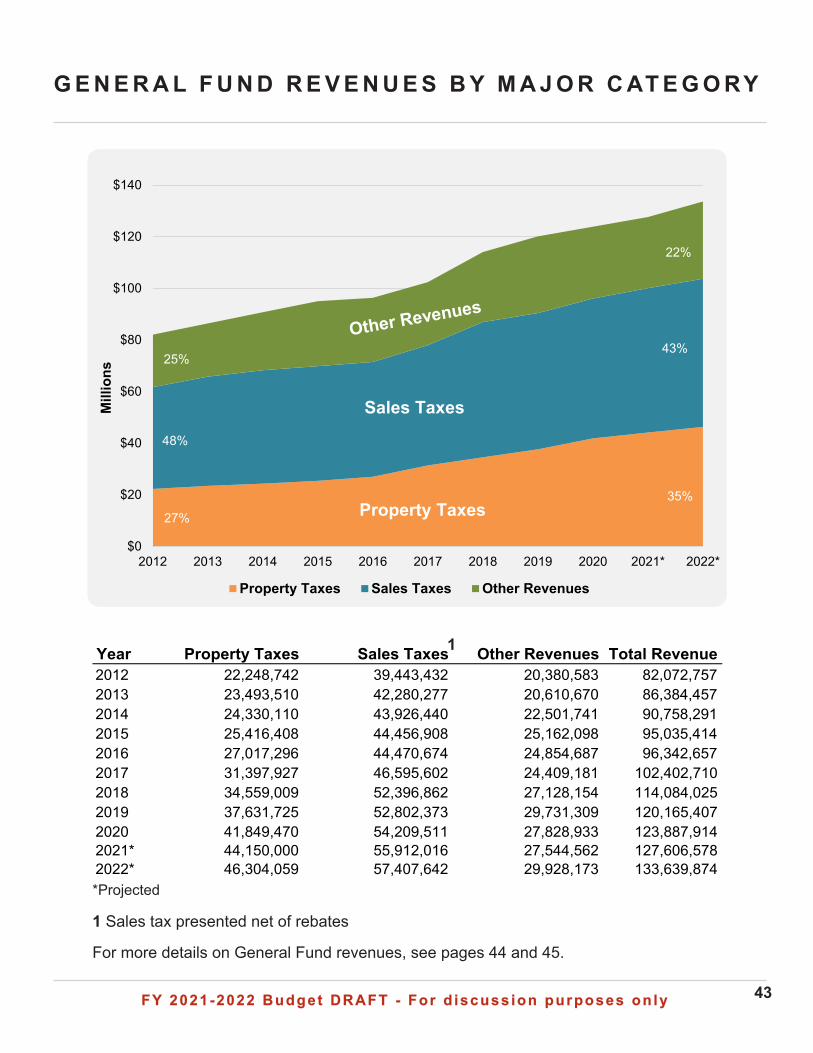
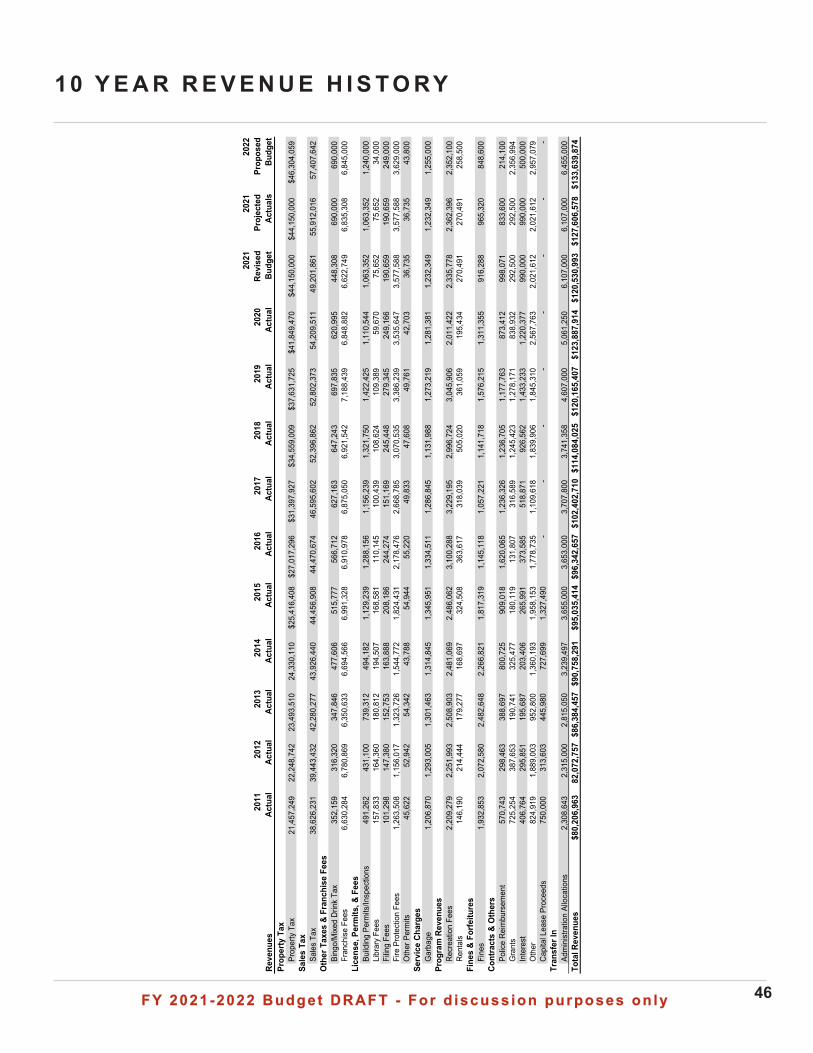
Year Property Taxes Sales Taxes Other Revenues Total Revenue2012 22,248,742 39,443,432 20,380,583 82,072,757 2013 23,493,510 42,280,277 20,610,670 86,384,457 2014 24,330,110 43,926,440 22,501,741 90,758,291 2015 25,416,408 44,456,908 25,162,098 95,035,414 2016 27,017,296 44,470,674 24,854,687 96,342,657 2017 31,397,927 46,595,602 24,409,181 102,402,710 2018 34,559,009 52,396,862 27,128,154 114,084,025 2019 37,631,725 52,802,373 29,731,309 120,165,407 2020 41,849,470 54,209,511 27,828,933 123,887,914 2021* 44,150,000 55,912,016 27,544,562 127,606,578 2022* 46,304,059 57,407,642 29,928,173 133,639,874
G E N E R A L F U N D R E V E N U E S B Y M A J O R C AT E G O RY
$0
$20
$40
$60
$80
$100
$120
$140
2012 2013 2014 2015 2016 2017 2018 2019 2020 2021* 2022*
Mill
ions
Property Taxes Sales Taxes Other Revenues
Property Taxes
Sales Taxes
48%
27%
25%
22%
35%
43%
1 Sales tax presented net of rebates
For more details on General Fund revenues, see pages 44 and 45.
1
*Projected
FY 2021-2022 Budget DRAFT - For d iscuss ion purposes on lyFY 2021-2022 Budget DRAFT - For d iscuss ion purposes on ly 44
Revenues2019
Actual2020
Actual
2021 Revised Budget
2021 Projected
Actuals
2022 Proposed
BudgetProperty Tax
Property Tax $37,631,725 $41,849,470 $44,150,000 $44,150,000 $46,304,059Sales Tax
Sales Tax 52,802,373 54,209,511 49,201,861 55,912,016 57,407,642 Other Taxes & Franchise Fees
Bingo/Mixed Drink Tax 697,835 620,995 448,308 690,000 690,000 Franchise Fees 7,188,439 6,848,882 6,622,749 6,835,308 6,845,000
License, Permits, & FeesBuilding Permits/Inspections 1,422,425 1,110,544 1,063,352 1,063,352 1,240,000 Library Fees 109,389 59,670 75,652 75,652 34,000 Filing Fees 279,345 249,166 190,659 190,659 249,000 Fire Protection Fees 3,386,239 3,535,647 3,577,588 3,577,588 3,629,000 Other Permits 49,761 42,703 36,735 36,735 43,800
Service ChargesGarbage 1,273,219 1,281,381 1,232,349 1,232,349 1,255,000
Program RevenuesRecreation Fees 3,045,906 2,011,422 2,335,778 2,362,396 2,352,100 Rentals 361,059 195,434 270,491 270,491 258,500
Fines & ForfeituresFines 1,576,215 1,311,355 916,288 965,320 848,600
Contracts & OthersPolice Reimbursement 1,177,763 873,412 998,071 833,600 214,100 Grants 1,278,171 838,932 292,500 292,500 2,356,994 Interest 1,433,233 1,220,377 990,000 990,000 500,000 Other 1,845,310 2,567,763 2,021,612 2,021,612 2,957,079 Capital Lease Proceeds - - - - -
Transfer InAdministration Allocations 4,607,000 5,061,250 6,107,000 6,107,000 6,455,000
Total Revenues $120,165,407 $123,887,914 $120,530,993 $127,606,578 $133,639,874
GENERAL FUND REVENUES BY DETAILED CATEGORY
GENERAL FUND REVENUE CHANGES
4
2
6
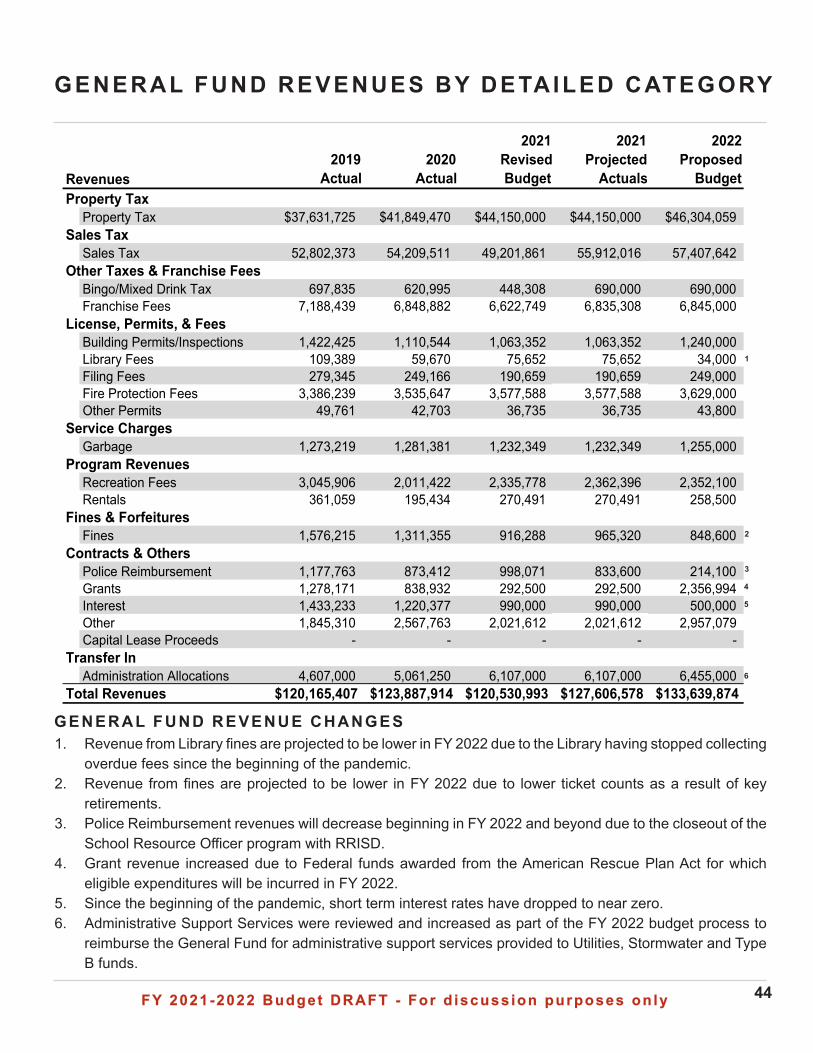
1. Revenue from Library fines are projected to be lower in FY 2022 due to the Library having stopped collecting overdue fees since the beginning of the pandemic.
2. Revenue from fines are projected to be lower in FY 2022 due to lower ticket counts as a result of key retirements.
3. Police Reimbursement revenues will decrease beginning in FY 2022 and beyond due to the closeout of the School Resource Officer program with RRISD.
4. Grant revenue increased due to Federal funds awarded from the American Rescue Plan Act for which eligible expenditures will be incurred in FY 2022.
5. Since the beginning of the pandemic, short term interest rates have dropped to near zero. 6. Administrative Support Services were reviewed and increased as part of the FY 2022 budget process to
reimburse the General Fund for administrative support services provided to Utilities, Stormwater and Type B funds.
1
5
3
FY 2021-2022 Budget DRAFT - For d iscuss ion purposes on lyFY 2021-2022 Budget DRAFT - For d iscuss ion purposes on ly 45
GENERAL FUND REVENUES BY DETAILED CATEGORY
GENERAL FUND REVENUE DEFIN IT IONS
Property Tax – Revenues are higher in FY 2022 primarily due to the no-new-revenue rate. The proposed tax rate is increasing 2.5% to $0.415 per $100 to pay for debt costs. See further discussion of property tax rates and valuations under the Property Valuations & Taxes tab.
Sales Tax – Sales tax revenues reflect 1.5% of the 2.0% local option taxes collected by the City. For FY 2020 and beyond, projections were adjusted downward to further limit General Fund reliance on Dell sales tax revenues, from 20% in FY 2021 to 15% by FY 2024.
Other Taxes & Franchise Fees – Other Taxes collected include, mixed drink tax, bingo tax and penalty & interest fees from current and delinquent property tax. Franchise fees collected from electricity, gas, and telecommunications grow modestly with the general population growth. These fees are based on gross revenues; therefore, mild weather can reduce fees received from electric and gas providers. For FY 2020 and beyond, Franchise Fees decreased due to the impacts of SB 1152, because companies pay the higher fee between communications and cablevision instead of both as it was historically.
Licenses, Permits & Fees – These include planning and development related revenues, beer & liquor licenses and animal control licenses. Fire Protection Fees offset the City’s cost of providing fire protection services to Emergency Service District #9.
Service Charges – Garbage and brush hauling revenues reflect the net fee from Round Rock Refuse. Average residential customers pay $20.97 with tax per month for garbage with the City retaining 14.3% or $3.00. Lot clearing service charges are collected when City employees remove a nuisance and charge the owner.
Program Revenues – Recreation fees are program revenues for all PARD programs, rentals, leagues, and the Clay Madsen Recreation Center.
Fines & Forfeitures – Include Library fines and fees for overdue and lost library materials and Police Department fines for citations issued for traffic violations, City ordinance violations, and other provisions of state law.
Contracts & Other – Other revenues include sale of assets, capitalized lease proceeds, donations and contributions, insurance and grant reimbursements, police reimbursements, and other miscellaneous small revenue categories. Police Reimbursements includes overtime reimbursements.
Administrative Support Services – Administrative Support Services are transfers from the Utility Fund, Stormwater Fund, and Type B Fund to reimburse the General Fund for their allocated share of administrative support costs. The cost allocations are reviewed annually and are based on a generally accepted cost allocation methodology.
FY 2021-2022 Budget DRAFT - For d iscuss ion purposes on lyFY 2021-2022 Budget DRAFT - For d iscuss ion purposes on ly 46
10 Y E A R R E V E N U E H I S T O RY
Reve
nues
2011
Ac
tual
2012
Actu
al20
13
Ac
tual
2014
Actu
al20
15
Actu
al20
16
Ac
tual
2017
Actu
al20
18
Ac
tual
2019
Actu
al20
20
Actu
al
2021
Revi
sed
Budg
et
2021
Proj
ecte
d Ac
tual
s
2022
Prop
osed
Bu
dget
Prop
erty
Tax
Prop
erty
Tax
21,4
57,2
49
22,2
48,7
42
23
,493
,510
24
,330
,110
$2
5,41
6,40
8$2
7,01
7,29
6$3
1,39
7,92
7$3
4,55
9,00
9$3
7,63
1,72
5$4
1,84
9,47
0$4
4,15
0,00
0$4
4,15
0,00
0$4
6,30
4,05
9Sa
les
Tax
Sale
s Ta
x38
,626
,231
39
,443
,432
42,2
80,2
77
43,9
26,4
40
44,4
56,9
08
44
,470
,674
46
,595
,602
52,3
96,8
62
52
,802
,373
54,2
09,5
11
49
,201
,861
55,9
12,0
16
57
,407
,642
Oth
er T
axes
& F
ranc
hise
Fee
sBi
ngo/
Mixe
d Dr
ink
Tax
352,
159
316,
320
34
7,84
6
477,
606
51
5,77
7
56
6,71
2
627,
163
647,
243
697,
835
620,
995
448,
308
690,
000
690,
000
Fran
chise
Fee
s6,
630,
284
6,
780,
869
6,35
0,63
3
6,
694,
566
6,99
1,32
8
6,91
0,97
8
6,
875,
050
6,
921,
542
7,
188,
439
6,
848,
882
6,
622,
749
6,
835,
308
6,
845,
000
Li
cens
e, P
erm
its, &
Fee
sBu
ildin
g Pe
rmits
/Insp
ectio
ns49
1,26
2
43
1,10
0
739,
312
49
4,18
2
1,12
9,23
9
1,28
8,15
6
1,
156,
239
1,
321,
750
1,
422,
425
1,
110,
544
1,
063,
352
1,
063,
352
1,
240,
000
Li
brar
y Fe
es15
7,83
3
16
4,36
0
180,
812
19
4,50
7
168,
581
110,
145
10
0,43
9
10
8,62
4
10
9,38
9
59
,670
75
,652
75
,652
34
,000
Fi
ling
Fees
101,
298
147,
380
15
2,75
3
163,
888
20
8,18
6
24
4,27
4
151,
169
245,
448
279,
345
249,
166
190,
659
190,
659
249,
000
Fire
Pro
tect
ion
Fees
1,26
3,50
8
1,15
6,01
7
1,
323,
726
1,54
4,77
2
1,
824,
431
2,
178,
476
2,66
8,78
5
3,07
0,53
5
3,38
6,23
9
3,53
5,64
7
3,57
7,58
8
3,57
7,58
8
3,62
9,00
0
Oth
er P
erm
its45
,622
52
,942
54,3
42
43
,788
54,9
44
55
,220
49,8
33
47
,608
49,7
61
42,7
03
36,7
35
36,7
35
43,8
00
Serv
ice
Char
ges
Gar
bage
1,20
6,87
0
1,29
3,00
5
1,
301,
463
1,31
4,84
5
1,
345,
951
1,
334,
511
1,28
6,84
5
1,13
1,98
8
1,27
3,21
9
1,28
1,38
1
1,23
2,34
9
1,23
2,34
9
1,25
5,00
0
Prog
ram
Rev
enue
sRe
crea
tion
Fees
2,20
9,27
9
2,25
1,99
3
2,
508,
903
2,48
1,06
9
2,
486,
062
3,
100,
288
3,22
9,19
5
2,99
6,72
4
3,04
5,90
6
2,01
1,42
2
2,33
5,77
8
2,36
2,39
6
2,35
2,10
0
Rent
als
146,
190
214,
444
17
9,27
7
168,
697
32
4,50
8
36
3,61
7
318,
039
505,
020
361,
059
195,
434
270,
491
270,
491
258,
500
Fine
s &
Forfe
iture
sFi
nes
1,93
2,85
3
2,07
2,58
0
2,
482,
648
2,26
6,82
1
1,
817,
319
1,
145,
118
1,05
7,22
1
1,14
1,71
8
1,57
6,21
5
1,31
1,35
5
916,
288
965,
320
848,
600
Cont
ract
s &
Oth
ers
Polic
e Re
imbu
rsem
ent
570,
743
298,
463
38
8,69
7
800,
725
90
9,01
8
1,
620,
065
1,23
6,32
6
1,23
6,70
5
1,17
7,76
3
873,
412
998,
071
833,
600
214,
100
Gra
nts
725,
254
387,
653
19
0,74
1
325,
477
18
0,11
9
13
1,80
7
316,
589
1,24
5,42
3
1,27
8,17
1
838,
932
292,
500
292,
500
2,35
6,99
4
Inte
rest
406,
764
295,
851
19
5,68
7
203,
406
26
5,99
1
37
3,58
5
518,
871
926,
562
1,43
3,23
3
1,22
0,37
7
990,
000
990,
000
500,
000
Oth
er82
4,91
9
1,
889,
003
952,
800
1,
360,
193
1,95
8,15
3
1,77
8,73
5
1,
109,
618
1,
839,
906
1,
845,
310
2,
567,
763
2,
021,
612
2,
021,
612
2,
957,
079
Ca
pita
l Lea
se P
roce
eds
750,
000
313,
603
44
5,98
0
727,
699
1,
327,
490
-
-
-
-
-
-
-
-
Tran
sfer
InAd
min
istra
tion
Allo
catio
ns2,
308,
643
2,
315,
000
2,81
5,05
0
3,
239,
497
3,65
5,00
0
3,65
3,00
0
3,
707,
800
3,
741,
358
4,
607,
000
5,
061,
250
6,
107,
000
6,
107,
000
6,
455,
000
To
tal R
even
ues
$80,
206,
963
82,0
72,7
57
$86,
384,
457
$90,
758,
291
$95,
035,
414
$96,
342,
657
$102
,402
,710
$114
,084
,025
$120
,165
,407
$123
,887
,914
$120
,530
,993
$127
,606
,578
$133
,639
,874
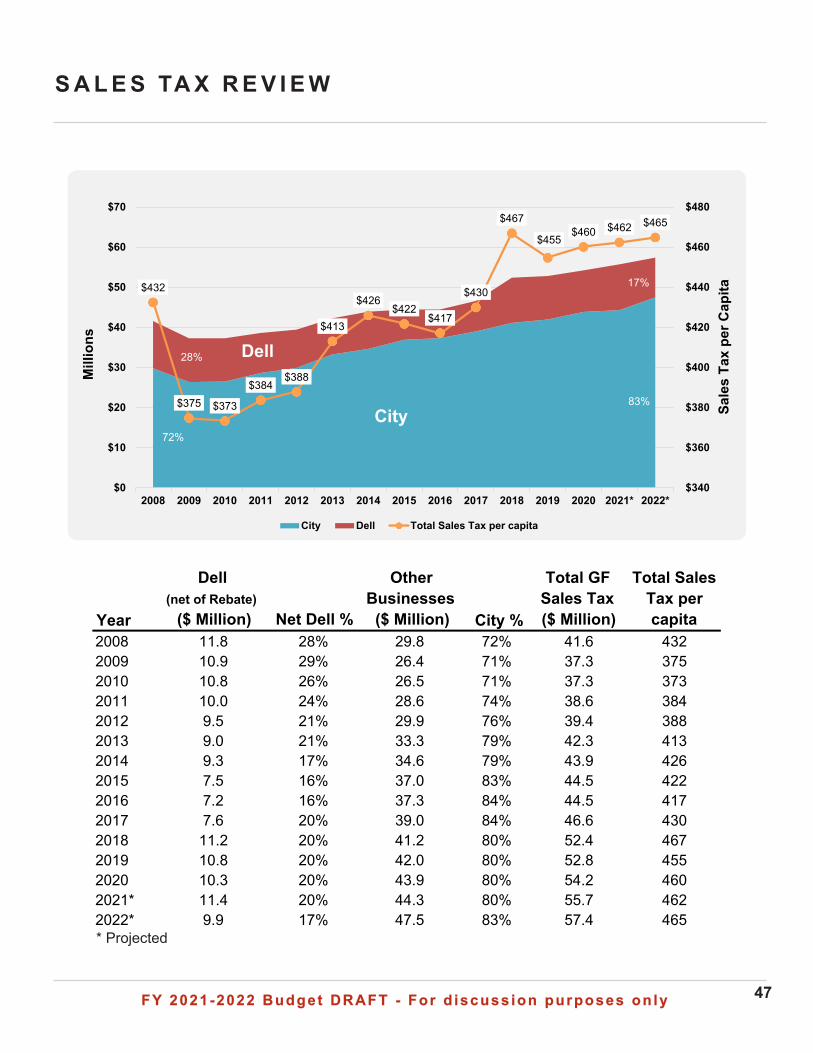
FY 2021-2022 Budget DRAFT - For d iscuss ion purposes on lyFY 2021-2022 Budget DRAFT - For d iscuss ion purposes on ly 47
S A L E S TA X R E V I E W
$432
$375 $373
$384$388
$413
$426$422
$417
$430
$467
$455$460 $462 $465
$340
$360
$380
$400
$420
$440
$460
$480
$0
$10
$20
$30
$40
$50
$60
$70
2008 2009 2010 2011 2012 2013 2014 2015 2016 2017 2018 2019 2020 2021* 2022*
Sale
s Ta
x pe
r Cap
ita
Mill
ions
City Dell Total Sales Tax per capita
City
Dell28%
17%
72%
83%
* Projected
Year
Dell (net of Rebate)
($ Million) Net Dell %
Other Businesses
($ Million) City %
Total GF Sales Tax ($ Million)
Total Sales Tax per capita
2008 11.8 28% 29.8 72% 41.6 4322009 10.9 29% 26.4 71% 37.3 3752010 10.8 26% 26.5 71% 37.3 3732011 10.0 24% 28.6 74% 38.6 3842012 9.5 21% 29.9 76% 39.4 3882013 9.0 21% 33.3 79% 42.3 4132014 9.3 17% 34.6 79% 43.9 4262015 7.5 16% 37.0 83% 44.5 4222016 7.2 16% 37.3 84% 44.5 4172017 7.6 20% 39.0 84% 46.6 4302018 11.2 20% 41.2 80% 52.4 4672019 10.8 20% 42.0 80% 52.8 4552020 10.3 20% 43.9 80% 54.2 4602021* 11.4 20% 44.3 80% 55.7 4622022* 9.9 17% 47.5 83% 57.4 465
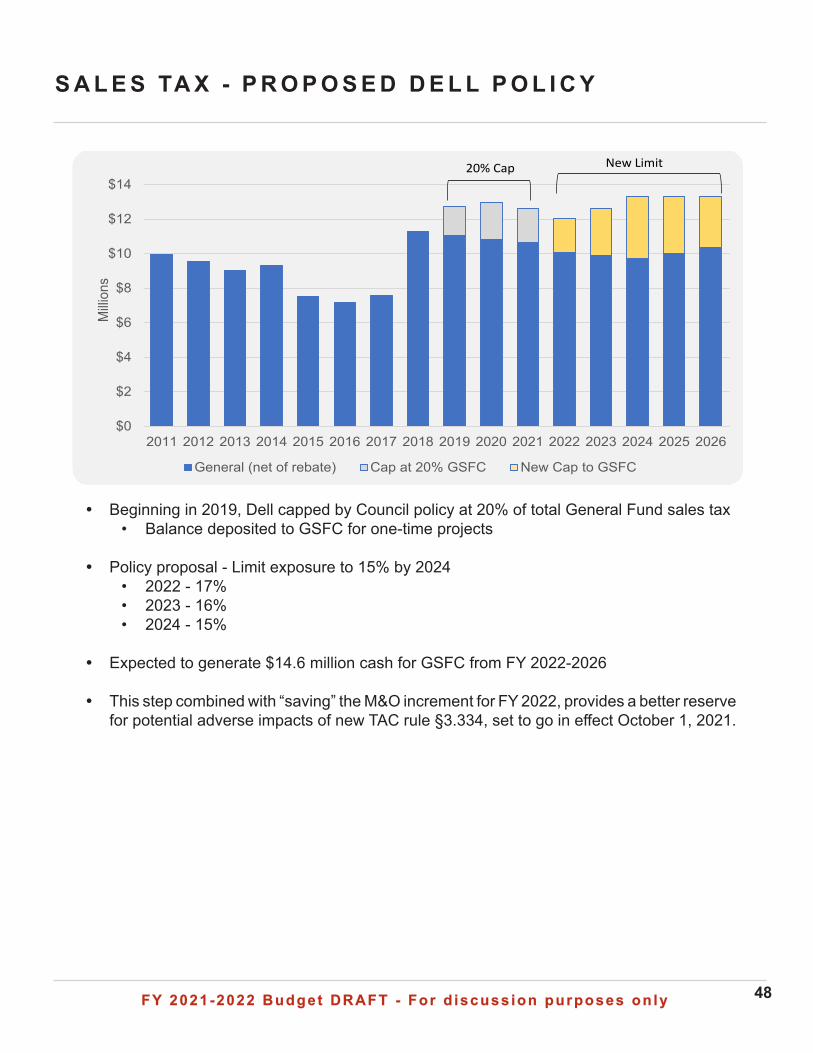
FY 2021-2022 Budget DRAFT - For d iscuss ion purposes on lyFY 2021-2022 Budget DRAFT - For d iscuss ion purposes on ly 48
S A L E S TA X - P R O P O S E D D E L L P O L I C Y
$0
$2
$4
$6
$8
$10
$12
$14
2011 2012 2013 2014 2015 2016 2017 2018 2019 2020 2021 2022 2023 2024 2025 2026
Milli
ons
General (net of rebate) Cap at 20% GSFC New Cap to GSFC
20% Cap New Limit
y Beginning in 2019, Dell capped by Council policy at 20% of total General Fund sales tax• Balance deposited to GSFC for one-time projects
y Policy proposal - Limit exposure to 15% by 2024• 2022 - 17%• 2023 - 16%• 2024 - 15%
y Expected to generate $14.6 million cash for GSFC from FY 2022-2026
y This step combined with “saving” the M&O increment for FY 2022, provides a better reserve for potential adverse impacts of new TAC rule §3.334, set to go in effect October 1, 2021.
FY 2021-2022 Budget DRAFT - For d iscuss ion purposes on lyFY 2021-2022 Budget DRAFT - For d iscuss ion purposes on ly
O T H E R F U N D S
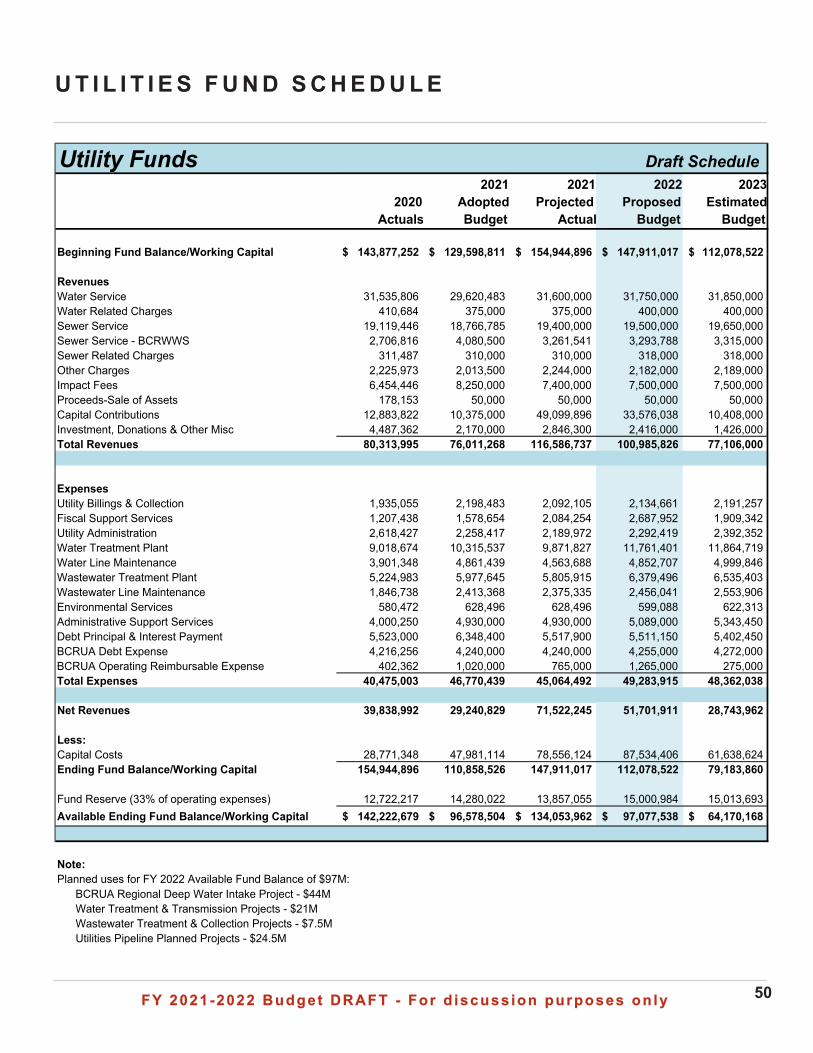
FY 2021-2022 Budget DRAFT - For d iscuss ion purposes on lyFY 2021-2022 Budget DRAFT - For d iscuss ion purposes on ly 50
U T I L I T I E S F U N D S C H E D U L E
Utility Funds Draft Schedule
2020 Actuals
2021Adopted Budget
2021Projected
Actual
2022Proposed
Budget
2023Estimated
Budget
Beginning Fund Balance/Working Capital 143,877,252$ 129,598,811$ 154,944,896$ 147,911,017$ 112,078,522$
RevenuesWater Service 31,535,806 29,620,483 31,600,000 31,750,000 31,850,000 Water Related Charges 410,684 375,000 375,000 400,000 400,000 Sewer Service 19,119,446 18,766,785 19,400,000 19,500,000 19,650,000 Sewer Service - BCRWWS 2,706,816 4,080,500 3,261,541 3,293,788 3,315,000 Sewer Related Charges 311,487 310,000 310,000 318,000 318,000 Other Charges 2,225,973 2,013,500 2,244,000 2,182,000 2,189,000 Impact Fees 6,454,446 8,250,000 7,400,000 7,500,000 7,500,000 Proceeds-Sale of Assets 178,153 50,000 50,000 50,000 50,000 Capital Contributions 12,883,822 10,375,000 49,099,896 33,576,038 10,408,000 Investment, Donations & Other Misc 4,487,362 2,170,000 2,846,300 2,416,000 1,426,000 Total Revenues 80,313,995 76,011,268 116,586,737 100,985,826 77,106,000
ExpensesUtility Billings & Collection 1,935,055 2,198,483 2,092,105 2,134,661 2,191,257 Fiscal Support Services 1,207,438 1,578,654 2,084,254 2,687,952 1,909,342 Utility Administration 2,618,427 2,258,417 2,189,972 2,292,419 2,392,352 Water Treatment Plant 9,018,674 10,315,537 9,871,827 11,761,401 11,864,719 Water Line Maintenance 3,901,348 4,861,439 4,563,688 4,852,707 4,999,846 Wastewater Treatment Plant 5,224,983 5,977,645 5,805,915 6,379,496 6,535,403 Wastewater Line Maintenance 1,846,738 2,413,368 2,375,335 2,456,041 2,553,906 Environmental Services 580,472 628,496 628,496 599,088 622,313 Administrative Support Services 4,000,250 4,930,000 4,930,000 5,089,000 5,343,450 Debt Principal & Interest Payment 5,523,000 6,348,400 5,517,900 5,511,150 5,402,450 BCRUA Debt Expense 4,216,256 4,240,000 4,240,000 4,255,000 4,272,000 BCRUA Operating Reimbursable Expense 402,362 1,020,000 765,000 1,265,000 275,000 Total Expenses 40,475,003 46,770,439 45,064,492 49,283,915 48,362,038
Net Revenues 39,838,992 29,240,829 71,522,245 51,701,911 28,743,962
Less:Capital Costs 28,771,348 47,981,114 78,556,124 87,534,406 61,638,624 Ending Fund Balance/Working Capital 154,944,896 110,858,526 147,911,017 112,078,522 79,183,860
Fund Reserve (33% of operating expenses) 12,722,217 14,280,022 13,857,055 15,000,984 15,013,693 Available Ending Fund Balance/Working Capital 142,222,679$ 96,578,504$ 134,053,962$ 97,077,538$ 64,170,168$
Note:Planned uses for FY 2022 Available Fund Balance of $97M:
Utilities Pipeline Planned Projects - $24.5M
BCRUA Regional Deep Water Intake Project - $44M Water Treatment & Transmission Projects - $21M Wastewater Treatment & Collection Projects - $7.5M
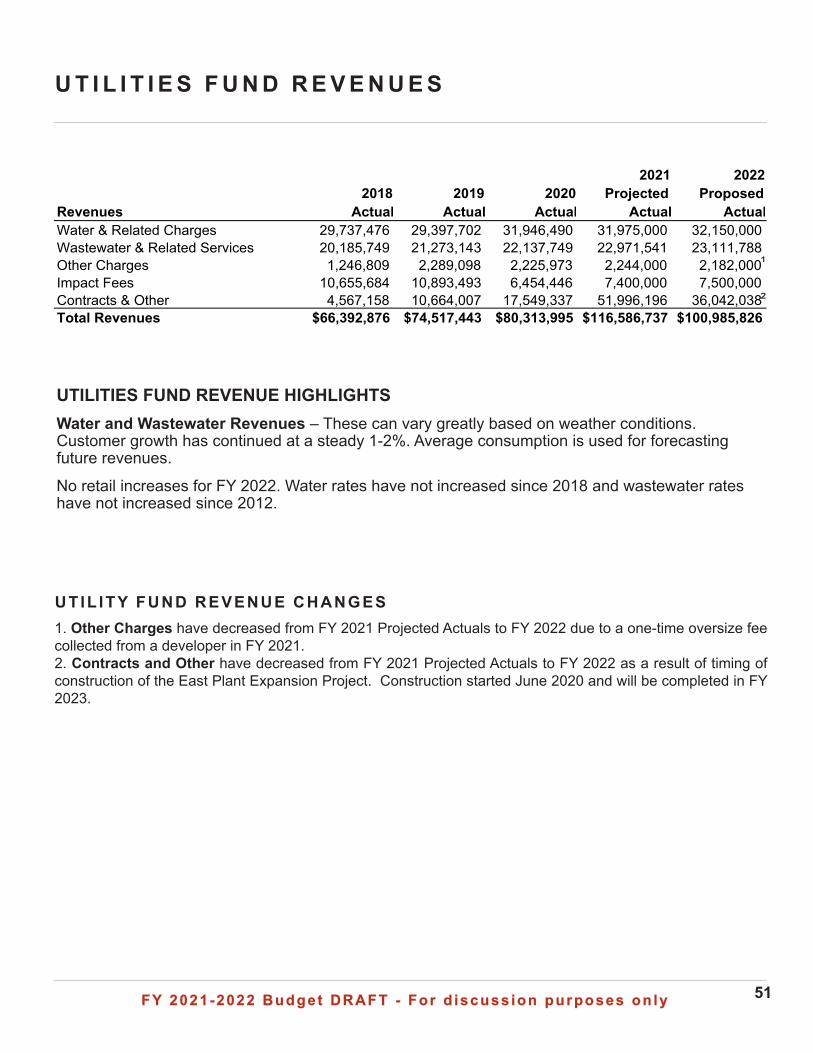
FY 2021-2022 Budget DRAFT - For d iscuss ion purposes on lyFY 2021-2022 Budget DRAFT - For d iscuss ion purposes on ly 51
Revenues2018
Actual2019
Actual2020
Actual
2021 Projected
Actual
2022 Proposed
ActualWater & Related Charges 29,737,476 29,397,702 31,946,490 31,975,000 32,150,000 Wastewater & Related Services 20,185,749 21,273,143 22,137,749 22,971,541 23,111,788 Other Charges 1,246,809 2,289,098 2,225,973 2,244,000 2,182,000 Impact Fees 10,655,684 10,893,493 6,454,446 7,400,000 7,500,000 Contracts & Other 4,567,158 10,664,007 17,549,337 51,996,196 36,042,038 Total Revenues $66,392,876 $74,517,443 $80,313,995 $116,586,737 $100,985,826
U T I L I T I E S F U N D R E V E N U E S
UTILITIES FUND REVENUE HIGHLIGHTSWater and Wastewater Revenues – These can vary greatly based on weather conditions. Customer growth has continued at a steady 1-2%. Average consumption is used for forecasting future revenues.
No retail increases for FY 2022. Water rates have not increased since 2018 and wastewater rates have not increased since 2012.
¹
UTIL ITY FUND REVENUE CHANGES1. Other Charges have decreased from FY 2021 Projected Actuals to FY 2022 due to a one-time oversize fee collected from a developer in FY 2021. 2. Contracts and Other have decreased from FY 2021 Projected Actuals to FY 2022 as a result of timing of construction of the East Plant Expansion Project. Construction started June 2020 and will be completed in FY 2023.
²
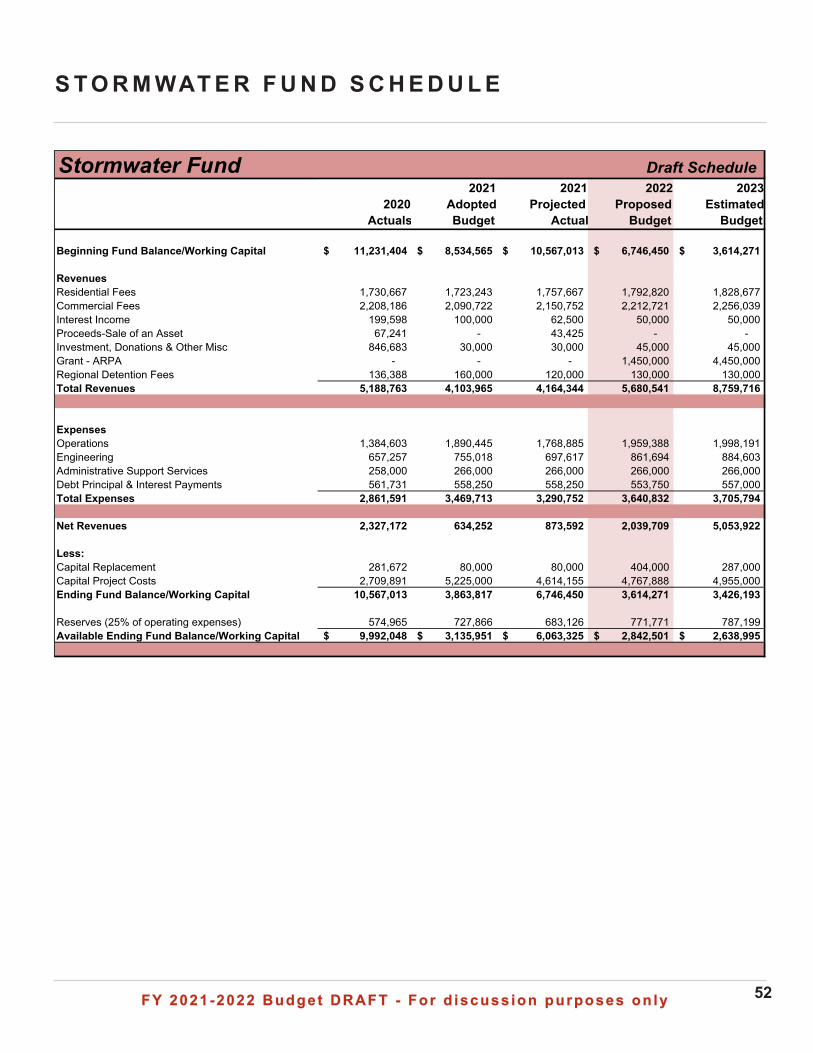
FY 2021-2022 Budget DRAFT - For d iscuss ion purposes on lyFY 2021-2022 Budget DRAFT - For d iscuss ion purposes on ly 52
S T O R M WAT E R F U N D S C H E D U L E
Stormwater Fund Draft Schedule
2020 Actuals
2021Adopted Budget
2021Projected
Actual
2022Proposed
Budget
2023Estimated
Budget
Beginning Fund Balance/Working Capital 11,231,404$ 8,534,565$ 10,567,013$ 6,746,450$ 3,614,271$
RevenuesResidential Fees 1,730,667 1,723,243 1,757,667 1,792,820 1,828,677 Commercial Fees 2,208,186 2,090,722 2,150,752 2,212,721 2,256,039 Interest Income 199,598 100,000 62,500 50,000 50,000 Proceeds-Sale of an Asset 67,241 - 43,425 - - Investment, Donations & Other Misc 846,683 30,000 30,000 45,000 45,000 Grant - ARPA - - - 1,450,000 4,450,000 Regional Detention Fees 136,388 160,000 120,000 130,000 130,000 Total Revenues 5,188,763 4,103,965 4,164,344 5,680,541 8,759,716
ExpensesOperations 1,384,603 1,890,445 1,768,885 1,959,388 1,998,191 Engineering 657,257 755,018 697,617 861,694 884,603 Administrative Support Services 258,000 266,000 266,000 266,000 266,000 Debt Principal & Interest Payments 561,731 558,250 558,250 553,750 557,000 Total Expenses 2,861,591 3,469,713 3,290,752 3,640,832 3,705,794
Net Revenues 2,327,172 634,252 873,592 2,039,709 5,053,922
Less:Capital Replacement 281,672 80,000 80,000 404,000 287,000 Capital Project Costs 2,709,891 5,225,000 4,614,155 4,767,888 4,955,000 Ending Fund Balance/Working Capital 10,567,013 3,863,817 6,746,450 3,614,271 3,426,193
Reserves (25% of operating expenses) 574,965 727,866 683,126 771,771 787,199 Available Ending Fund Balance/Working Capital 9,992,048$ 3,135,951$ 6,063,325$ 2,842,501$ 2,638,995$
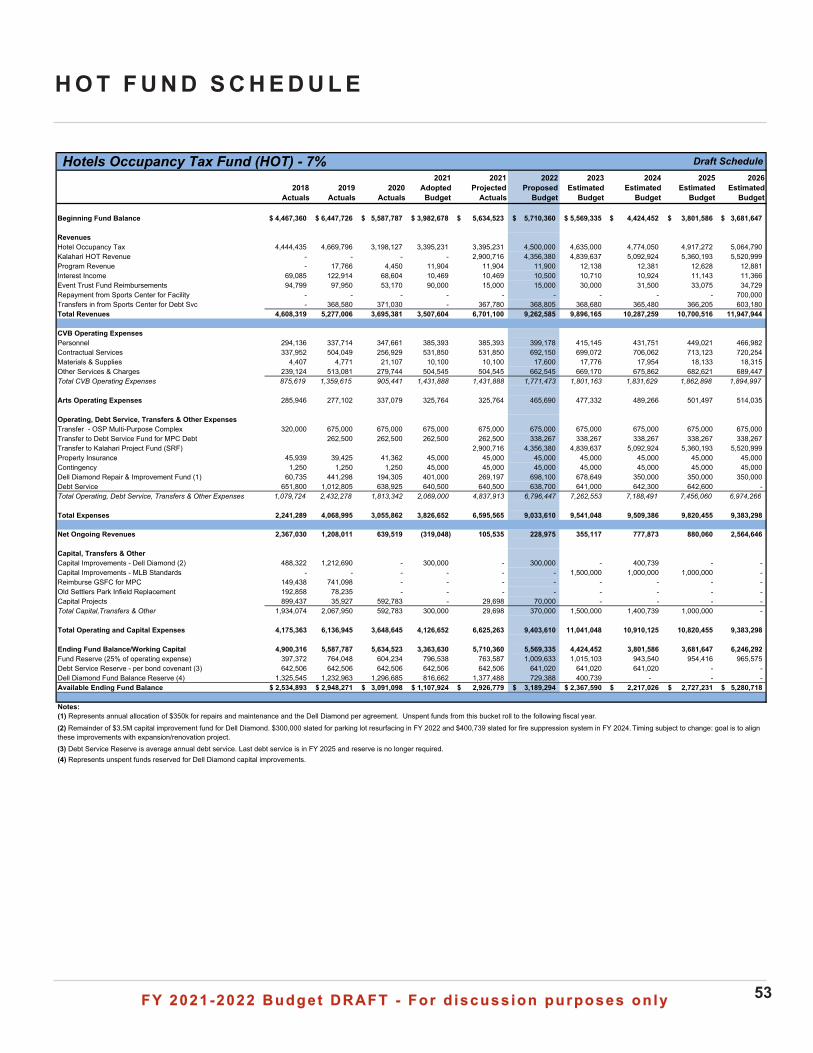
FY 2021-2022 Budget DRAFT - For d iscuss ion purposes on lyFY 2021-2022 Budget DRAFT - For d iscuss ion purposes on ly 53
H O T F U N D S C H E D U L E
Hotels Occupancy Tax Fund (HOT) - 7% 2018
Actuals2019
Actuals2020
Actuals
2021 Adopted
Budget
2021 Projected
Actuals
2022 Proposed
Budget
2023 Estimated
Budget
2024 Estimated
Budget
2025 Estimated
Budget
2026 Estimated
Budget
Beginning Fund Balance 4,467,360$ 6,447,726$ 5,587,787$ 3,982,678$ 5,634,523$ 5,710,360$ 5,569,335$ 4,424,452$ 3,801,586$ 3,681,647$
RevenuesHotel Occupancy Tax 4,444,435 4,669,796 3,198,127 3,395,231 3,395,231 4,500,000 4,635,000 4,774,050 4,917,272 5,064,790 Kalahari HOT Revenue - - - - 2,900,716 4,356,380 4,839,637 5,092,924 5,360,193 5,520,999 Program Revenue - 17,766 4,450 11,904 11,904 11,900 12,138 12,381 12,628 12,881 Interest Income 69,085 122,914 68,604 10,469 10,469 10,500 10,710 10,924 11,143 11,366 Event Trust Fund Reimbursements 94,799 97,950 53,170 90,000 15,000 15,000 30,000 31,500 33,075 34,729 Repayment from Sports Center for Facility - - - - - - - - - 700,000 Transfers in from Sports Center for Debt Svc - 368,580 371,030 - 367,780 368,805 368,680 365,480 366,205 603,180 Total Revenues 4,608,319 5,277,006 3,695,381 3,507,604 6,701,100 9,262,585 9,896,165 10,287,259 10,700,516 11,947,944
CVB Operating ExpensesPersonnel 294,136 337,714 347,661 385,393 385,393 399,178 415,145 431,751 449,021 466,982 Contractual Services 337,952 504,049 256,929 531,850 531,850 692,150 699,072 706,062 713,123 720,254 Materials & Supplies 4,407 4,771 21,107 10,100 10,100 17,600 17,776 17,954 18,133 18,315 Other Services & Charges 239,124 513,081 279,744 504,545 504,545 662,545 669,170 675,862 682,621 689,447 Total CVB Operating Expenses 875,619 1,359,615 905,441 1,431,888 1,431,888 1,771,473 1,801,163 1,831,629 1,862,898 1,894,997
Arts Operating Expenses 285,946 277,102 337,079 325,764 325,764 465,690 477,332 489,266 501,497 514,035
Operating, Debt Service, Transfers & Other ExpensesTransfer - OSP Multi-Purpose Complex 320,000 675,000 675,000 675,000 675,000 675,000 675,000 675,000 675,000 675,000Transfer to Debt Service Fund for MPC Debt 262,500 262,500 262,500 262,500 338,267 338,267 338,267 338,267 338,267Transfer to Kalahari Project Fund (SRF) 2,900,716 4,356,380 4,839,637 5,092,924 5,360,193 5,520,999 Property Insurance 45,939 39,425 41,362 45,000 45,000 45,000 45,000 45,000 45,000 45,000Contingency 1,250 1,250 1,250 45,000 45,000 45,000 45,000 45,000 45,000 45,000Dell Diamond Repair & Improvement Fund (1) 60,735 441,298 194,305 401,000 269,197 698,100 678,649 350,000 350,000 350,000Debt Service 651,800 1,012,805 638,925 640,500 640,500 638,700 641,000 642,300 642,600 - Total Operating, Debt Service, Transfers & Other Expenses 1,079,724 2,432,278 1,813,342 2,069,000 4,837,913 6,796,447 7,262,553 7,188,491 7,456,060 6,974,266
Total Expenses 2,241,289 4,068,995 3,055,862 3,826,652 6,595,565 9,033,610 9,541,048 9,509,386 9,820,455 9,383,298
Net Ongoing Revenues 2,367,030 1,208,011 639,519 (319,048) 105,535 228,975 355,117 777,873 880,060 2,564,646
Capital, Transfers & OtherCapital Improvements - Dell Diamond (2) 488,322 1,212,690 - 300,000 - 300,000 - 400,739 - - Capital Improvements - MLB Standards - - - - - - 1,500,000 1,000,000 1,000,000 - Reimburse GSFC for MPC 149,438 741,098 - - - - - - - - Old Settlers Park Infield Replacement 192,858 78,235 - - - - - - - - Capital Projects 899,437 35,927 592,783 - 29,698 70,000 - - - - Total Capital,Transfers & Other 1,934,074 2,067,950 592,783 300,000 29,698 370,000 1,500,000 1,400,739 1,000,000 -
Total Operating and Capital Expenses 4,175,363 6,136,945 3,648,645 4,126,652 6,625,263 9,403,610 11,041,048 10,910,125 10,820,455 9,383,298
Ending Fund Balance/Working Capital 4,900,316 5,587,787 5,634,523 3,363,630 5,710,360 5,569,335 4,424,452 3,801,586 3,681,647 6,246,292Fund Reserve (25% of operating expense) 397,372 764,048 604,234 796,538 763,587 1,009,633 1,015,103 943,540 954,416 965,575Debt Service Reserve - per bond covenant (3) 642,506 642,506 642,506 642,506 642,506 641,020 641,020 641,020 - - Dell Diamond Fund Balance Reserve (4) 1,325,545 1,232,963 1,296,685 816,662 1,377,488 729,388 400,739 - - - Available Ending Fund Balance 2,534,893$ 2,948,271$ 3,091,098$ 1,107,924$ 2,926,779$ 3,189,294$ 2,367,590$ 2,217,026$ 2,727,231$ 5,280,718$
Notes:(1) Represents annual allocation of $350k for repairs and maintenance and the Dell Diamond per agreement. Unspent funds from this bucket roll to the following fiscal year.
(4) Represents unspent funds reserved for Dell Diamond capital improvements.
Draft Schedule
(2) Remainder of $3.5M capital improvement fund for Dell Diamond. $300,000 slated for parking lot resurfacing in FY 2022 and $400,739 slated for fire suppression system in FY 2024. Timing subject to change: goal is to align these improvements with expansion/renovation project.(3) Debt Service Reserve is average annual debt service. Last debt service is in FY 2025 and reserve is no longer required.
Z:\Budget\FY 22\Fund Schedules\HOT Fund Schedule\HOT Fund Schedule
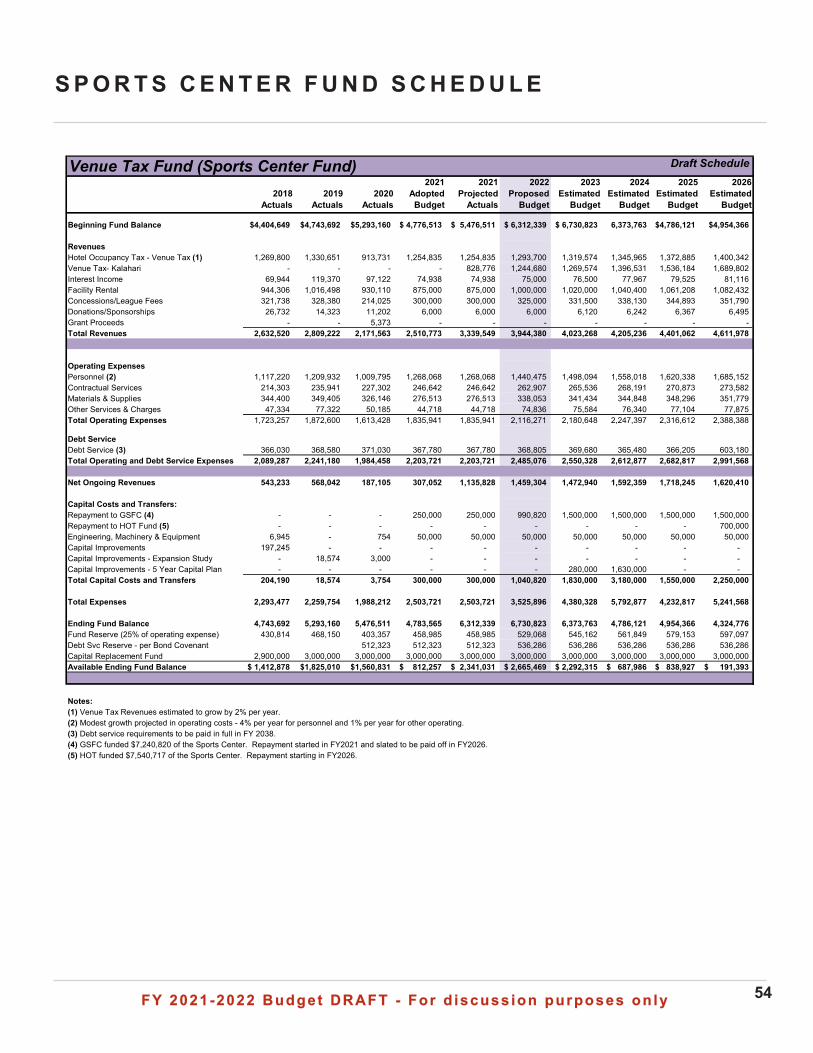
FY 2021-2022 Budget DRAFT - For d iscuss ion purposes on lyFY 2021-2022 Budget DRAFT - For d iscuss ion purposes on ly 54
S P O R T S C E N T E R F U N D S C H E D U L E
Venue Tax Fund (Sports Center Fund) Draft Schedule
2018 Actuals
2019 Actuals
2020 Actuals
2021 Adopted
Budget
2021 Projected
Actuals
2022 Proposed
Budget
2023 Estimated
Budget
2024 Estimated
Budget
2025 Estimated
Budget
2026Estimated
Budget
Beginning Fund Balance $4,404,649 $4,743,692 5,293,160$ 4,776,513$ 5,476,511$ 6,312,339$ 6,730,823$ 6,373,763 $4,786,121 $4,954,366
RevenuesHotel Occupancy Tax - Venue Tax (1) 1,269,800 1,330,651 913,731 1,254,835 1,254,835 1,293,700 1,319,574 1,345,965 1,372,885 1,400,342Venue Tax- Kalahari - - - - 828,776 1,244,680 1,269,574 1,396,531 1,536,184 1,689,802Interest Income 69,944 119,370 97,122 74,938 74,938 75,000 76,500 77,967 79,525 81,116Facility Rental 944,306 1,016,498 930,110 875,000 875,000 1,000,000 1,020,000 1,040,400 1,061,208 1,082,432Concessions/League Fees 321,738 328,380 214,025 300,000 300,000 325,000 331,500 338,130 344,893 351,790Donations/Sponsorships 26,732 14,323 11,202 6,000 6,000 6,000 6,120 6,242 6,367 6,495Grant Proceeds - - 5,373 - - - - - - - Total Revenues 2,632,520 2,809,222 2,171,563 2,510,773 3,339,549 3,944,380 4,023,268 4,205,236 4,401,062 4,611,978
Operating ExpensesPersonnel (2) 1,117,220 1,209,932 1,009,795 1,268,068 1,268,068 1,440,475 1,498,094 1,558,018 1,620,338 1,685,152Contractual Services 214,303 235,941 227,302 246,642 246,642 262,907 265,536 268,191 270,873 273,582Materials & Supplies 344,400 349,405 326,146 276,513 276,513 338,053 341,434 344,848 348,296 351,779Other Services & Charges 47,334 77,322 50,185 44,718 44,718 74,836 75,584 76,340 77,104 77,875Total Operating Expenses 1,723,257 1,872,600 1,613,428 1,835,941 1,835,941 2,116,271 2,180,648 2,247,397 2,316,612 2,388,388
Debt ServiceDebt Service (3) 366,030 368,580 371,030 367,780 367,780 368,805 369,680 365,480 366,205 603,180Total Operating and Debt Service Expenses 2,089,287 2,241,180 1,984,458 2,203,721 2,203,721 2,485,076 2,550,328 2,612,877 2,682,817 2,991,568
Net Ongoing Revenues 543,233 568,042 187,105 307,052 1,135,828 1,459,304 1,472,940 1,592,359 1,718,245 1,620,410
Capital Costs and Transfers:Repayment to GSFC (4) - - - 250,000 250,000 990,820 1,500,000 1,500,000 1,500,000 1,500,000Repayment to HOT Fund (5) - - - - - - - - - 700,000Engineering, Machinery & Equipment 6,945 - 754 50,000 50,000 50,000 50,000 50,000 50,000 50,000Capital Improvements 197,245 - - - - - - - - - Capital Improvements - Expansion Study - 18,574 3,000 - - - - - - - Capital Improvements - 5 Year Capital Plan - - - - - - 280,000 1,630,000 - - Total Capital Costs and Transfers 204,190 18,574 3,754 300,000 300,000 1,040,820 1,830,000 3,180,000 1,550,000 2,250,000
Total Expenses 2,293,477 2,259,754 1,988,212 2,503,721 2,503,721 3,525,896 4,380,328 5,792,877 4,232,817 5,241,568
Ending Fund Balance 4,743,692 5,293,160 5,476,511 4,783,565 6,312,339 6,730,823 6,373,763 4,786,121 4,954,366 4,324,776Fund Reserve (25% of operating expense) 430,814 468,150 403,357 458,985 458,985 529,068 545,162 561,849 579,153 597,097Debt Svc Reserve - per Bond Covenant 512,323 512,323 512,323 536,286 536,286 536,286 536,286 536,286Capital Replacement Fund 2,900,000 3,000,000 3,000,000 3,000,000 3,000,000 3,000,000 3,000,000 3,000,000 3,000,000 3,000,000Available Ending Fund Balance 1,412,878$ 1,825,010$ 1,560,831$ 812,257$ 2,341,031$ 2,665,469$ 2,292,315$ 687,986$ 838,927$ 191,393$
Notes:(1) Venue Tax Revenues estimated to grow by 2% per year.(2) Modest growth projected in operating costs - 4% per year for personnel and 1% per year for other operating.(3) Debt service requirements to be paid in full in FY 2038.(4) GSFC funded $7,240,820 of the Sports Center. Repayment started in FY2021 and slated to be paid off in FY2026. (5) HOT funded $7,540,717 of the Sports Center. Repayment starting in FY2026.
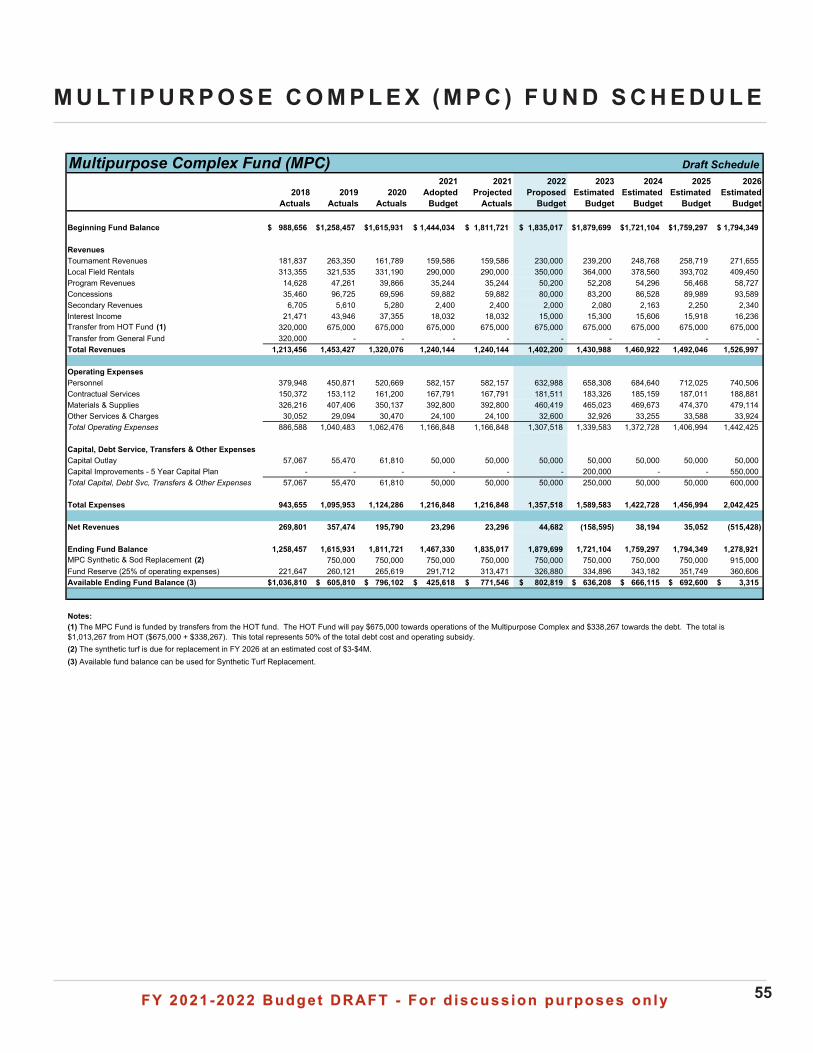
FY 2021-2022 Budget DRAFT - For d iscuss ion purposes on lyFY 2021-2022 Budget DRAFT - For d iscuss ion purposes on ly 55
M U LT I P U R P O S E C O M P L E X ( M P C ) F U N D S C H E D U L E
Multipurpose Complex Fund (MPC) Draft Schedule
2018 Actuals
2019 Actuals
2020 Actuals
2021 Adopted
Budget
2021 Projected
Actuals
2022 Proposed
Budget
2023 Estimated
Budget
2024 Estimated
Budget
2025 Estimated
Budget
2026 Estimated
Budget
Beginning Fund Balance 988,656$ 1,258,457$ 1,615,931$ 1,444,034$ 1,811,721$ 1,835,017$ 1,879,699$ 1,721,104$ 1,759,297$ 1,794,349$
RevenuesTournament Revenues 181,837 263,350 161,789 159,586 159,586 230,000 239,200 248,768 258,719 271,655 Local Field Rentals 313,355 321,535 331,190 290,000 290,000 350,000 364,000 378,560 393,702 409,450 Program Revenues 14,628 47,261 39,866 35,244 35,244 50,200 52,208 54,296 56,468 58,727 Concessions 35,460 96,725 69,596 59,882 59,882 80,000 83,200 86,528 89,989 93,589 Secondary Revenues 6,705 5,610 5,280 2,400 2,400 2,000 2,080 2,163 2,250 2,340 Interest Income 21,471 43,946 37,355 18,032 18,032 15,000 15,300 15,606 15,918 16,236 Transfer from HOT Fund (1) 320,000 675,000 675,000 675,000 675,000 675,000 675,000 675,000 675,000 675,000 Transfer from General Fund 320,000 - - - - - - - - - Total Revenues 1,213,456 1,453,427 1,320,076 1,240,144 1,240,144 1,402,200 1,430,988 1,460,922 1,492,046 1,526,997
Operating ExpensesPersonnel 379,948 450,871 520,669 582,157 582,157 632,988 658,308 684,640 712,025 740,506Contractual Services 150,372 153,112 161,200 167,791 167,791 181,511 183,326 185,159 187,011 188,881Materials & Supplies 326,216 407,406 350,137 392,800 392,800 460,419 465,023 469,673 474,370 479,114Other Services & Charges 30,052 29,094 30,470 24,100 24,100 32,600 32,926 33,255 33,588 33,924Total Operating Expenses 886,588 1,040,483 1,062,476 1,166,848 1,166,848 1,307,518 1,339,583 1,372,728 1,406,994 1,442,425
Capital, Debt Service, Transfers & Other ExpensesCapital Outlay 57,067 55,470 61,810 50,000 50,000 50,000 50,000 50,000 50,000 50,000Capital Improvements - 5 Year Capital Plan - - - - - - 200,000 - - 550,000 Total Capital, Debt Svc, Transfers & Other Expenses 57,067 55,470 61,810 50,000 50,000 50,000 250,000 50,000 50,000 600,000
Total Expenses 943,655 1,095,953 1,124,286 1,216,848 1,216,848 1,357,518 1,589,583 1,422,728 1,456,994 2,042,425
Net Revenues 269,801 357,474 195,790 23,296 23,296 44,682 (158,595) 38,194 35,052 (515,428)
Ending Fund Balance 1,258,457 1,615,931 1,811,721 1,467,330 1,835,017 1,879,699 1,721,104 1,759,297 1,794,349 1,278,921MPC Synthetic & Sod Replacement (2) 750,000 750,000 750,000 750,000 750,000 750,000 750,000 750,000 915,000Fund Reserve (25% of operating expenses) 221,647 260,121 265,619 291,712 313,471 326,880 334,896 343,182 351,749 360,606 Available Ending Fund Balance (3) 1,036,810$ 605,810$ 796,102$ 425,618$ 771,546$ 802,819$ 636,208$ 666,115$ 692,600$ 3,315$
Notes:(1) The MPC Fund is funded by transfers from the HOT fund. The HOT Fund will pay $675,000 towards operations of the Multipurpose Complex and $338,267 towards the debt. The total is $1,013,267 from HOT ($675,000 + $338,267). This total represents 50% of the total debt cost and operating subsidy. (2) The synthetic turf is due for replacement in FY 2026 at an estimated cost of $3-$4M. (3) Available fund balance can be used for Synthetic Turf Replacement.
Z:\Budget\FY 22\Fund Schedules\MPC Fund Schedule\Multipurpose FC Fund Schedule
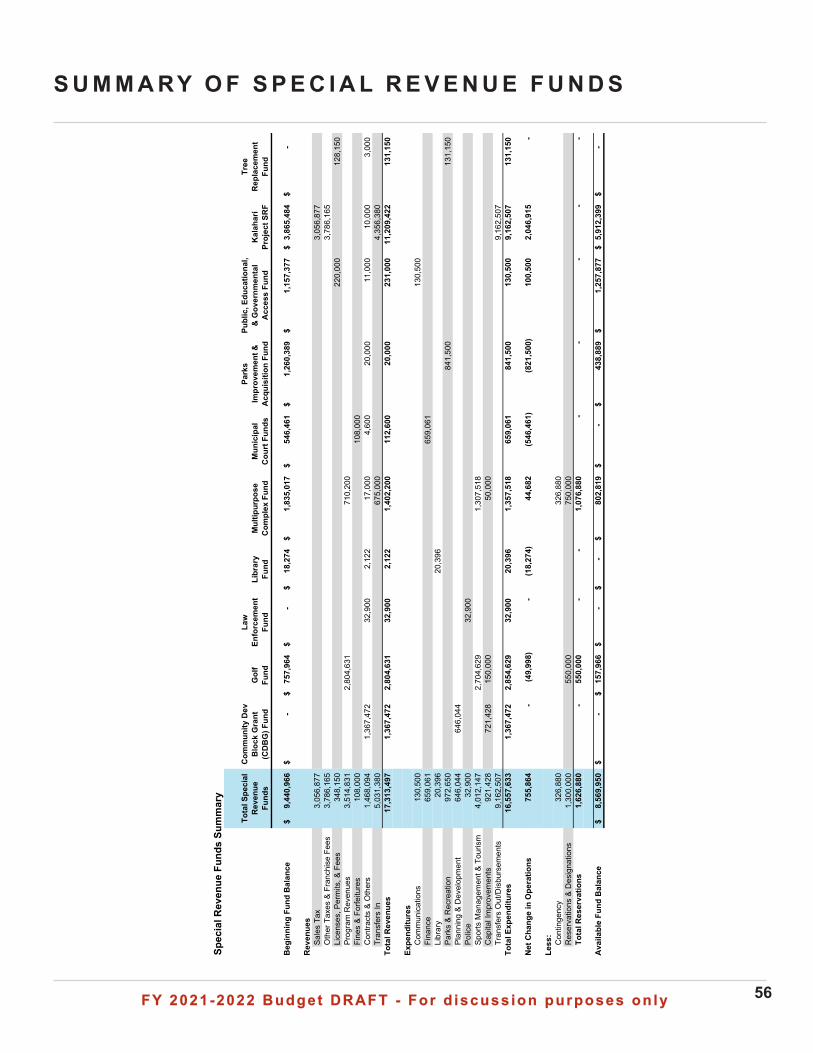
FY 2021-2022 Budget DRAFT - For d iscuss ion purposes on lyFY 2021-2022 Budget DRAFT - For d iscuss ion purposes on ly 56
S U M M A RY O F S P E C I A L R E V E N U E F U N D S
Spec
ial R
even
ue F
unds
Sum
mar
y
Tota
l Spe
cial
R
even
ue
Fund
s
Com
mun
ity D
ev
Blo
ck G
rant
(C
DB
G) F
und
Gol
f
Fu
nd
Law
En
forc
emen
t Fu
ndLi
brar
y Fu
ndM
ultip
urpo
se
Com
plex
Fun
dM
unic
ipal
C
ourt
Fun
ds
Park
s Im
prov
emen
t &
Acq
uisi
tion
Fund
Publ
ic, E
duca
tiona
l, &
Gov
ernm
enta
l A
cces
s Fu
ndK
alah
ari
Proj
ect S
RF
Tree
R
epla
cem
ent
Fund
Beg
inni
ng F
und
Bal
ance
9,44
0,96
6$
-$
75
7,96
4$
-
$
18,2
74$
1,83
5,01
7$
546,
461
$
1,26
0,38
9$
1,15
7,37
7$
3,
865,
484
$
-$
Rev
enue
sSa
les
Tax
3,05
6,87
7
3,05
6,87
7
O
ther
Tax
es &
Fra
nchi
se F
ees
3,78
6,16
5
3,78
6,16
5
Li
cens
es, P
erm
its, &
Fee
s34
8,15
0
22
0,00
0
128,
150
Pr
ogra
m R
even
ues
3,51
4,83
1
2,80
4,63
1
710,
200
Fine
s &
Forfe
iture
s10
8,00
0
10
8,00
0
C
ontra
cts
& O
ther
s1,
468,
094
1,
367,
472
32,9
00
2,
122
17,0
00
4,
600
20
,000
11
,000
10,0
00
3,
000
Tran
sfer
s In
5,03
1,38
0
675,
000
4,35
6,38
0
To
tal R
even
ues
17,3
13,4
97
1,
367,
472
2,80
4,63
1
32,9
00
2,
122
1,40
2,20
0
112,
600
20,0
00
231,
000
11
,209
,422
13
1,15
0
Expe
nditu
res
Com
mun
icat
ions
130,
500
130,
500
Fi
nanc
e65
9,06
1
65
9,06
1
Li
brar
y20
,396
20,3
96
Park
s &
Rec
reat
ion
972,
650
841,
500
131,
150
Pl
anni
ng &
Dev
elop
men
t64
6,04
4
64
6,04
4
Polic
e32
,900
32,9
00
Sp
orts
Man
agem
ent &
Tou
rism
4,01
2,14
7
2,70
4,62
9
1,30
7,51
8
Cap
ital I
mpr
ovem
ents
921,
428
721,
428
15
0,00
0
50
,000
Tran
sfer
s O
ut/D
isbu
rsem
ents
9,16
2,50
7
9,16
2,50
7
To
tal E
xpen
ditu
res
16,5
57,6
33
1,
367,
472
2,85
4,62
9
32,9
00
20
,396
1,
357,
518
65
9,06
1
84
1,50
0
13
0,50
0
9,16
2,50
7
13
1,15
0
Net
Cha
nge
in O
pera
tions
755,
864
-
(49,
998)
-
(1
8,27
4)
44,6
82
(5
46,4
61)
(821
,500
)
10
0,50
0
2,04
6,91
5
-
Less
:C
ontin
genc
y32
6,88
0
32
6,88
0
R
eser
vatio
ns &
Des
igna
tions
1,30
0,00
0
550,
000
750,
000
Tota
l Res
erva
tions
1,62
6,88
0
-
550,
000
-
-
1,
076,
880
-
-
-
-
-
Ava
ilabl
e Fu
nd B
alan
ce8,
569,
950
$
-
$
157,
966
$
-$
-
$
80
2,81
9$
-
$
43
8,88
9$
1,
257,
877
$
5,91
2,39
9$
-
$
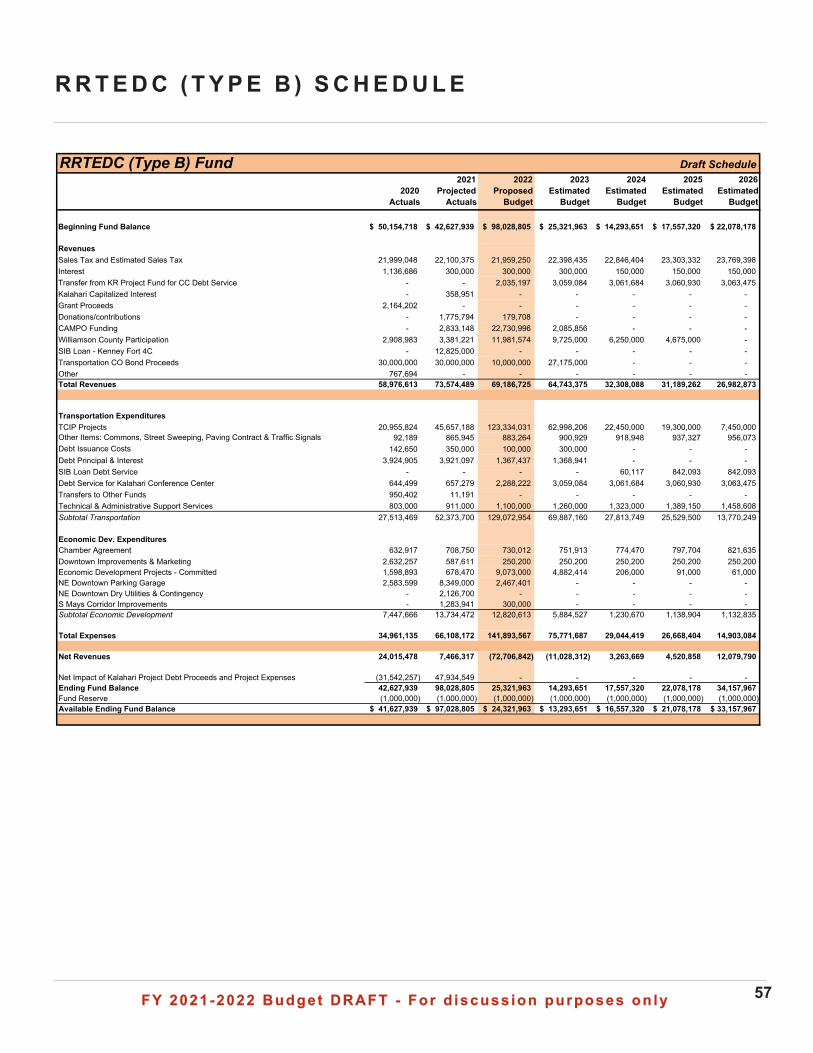
FY 2021-2022 Budget DRAFT - For d iscuss ion purposes on lyFY 2021-2022 Budget DRAFT - For d iscuss ion purposes on ly 57
R R T E D C ( T Y P E B ) S C H E D U L E
RRTEDC (Type B) Fund Draft Schedule
2020 Actuals
2021 Projected
Actuals
2022 Proposed
Budget
2023 Estimated
Budget
2024 Estimated
Budget
2025 Estimated
Budget
2026 Estimated
Budget
Beginning Fund Balance 50,154,718$ 42,627,939$ 98,028,805$ 25,321,963$ 14,293,651$ 17,557,320$ 22,078,178$
RevenuesSales Tax and Estimated Sales Tax 21,999,048 22,100,375 21,959,250 22,398,435 22,846,404 23,303,332 23,769,398Interest 1,136,686 300,000 300,000 300,000 150,000 150,000 150,000Transfer from KR Project Fund for CC Debt Service - - 2,035,197 3,059,084 3,061,684 3,060,930 3,063,475Kalahari Capitalized Interest - 358,951 - - - - - Grant Proceeds 2,164,202 - - - - - - Donations/contributions - 1,775,794 179,708 - - - - CAMPO Funding - 2,833,148 22,730,996 2,085,856 - - - Williamson County Participation 2,908,983 3,381,221 11,981,574 9,725,000 6,250,000 4,675,000 - SIB Loan - Kenney Fort 4C - 12,825,000 - - - - - Transportation CO Bond Proceeds 30,000,000 30,000,000 10,000,000 27,175,000 - - - Other 767,694 - - - - - - Total Revenues 58,976,613 73,574,489 69,186,725 64,743,375 32,308,088 31,189,262 26,982,873
Transportation ExpendituresTCIP Projects 20,955,824 45,657,188 123,334,031 62,998,206 22,450,000 19,300,000 7,450,000Other Items: Commons, Street Sweeping, Paving Contract & Traffic Signals 92,189 865,945 883,264 900,929 918,948 937,327 956,073Debt Issuance Costs 142,650 350,000 100,000 300,000 - - - Debt Principal & Interest 3,924,905 3,921,097 1,367,437 1,368,941 - - - SIB Loan Debt Service - - - - 60,117 842,093 842,093Debt Service for Kalahari Conference Center 644,499 657,279 2,288,222 3,059,084 3,061,684 3,060,930 3,063,475Transfers to Other Funds 950,402 11,191 - - - - - Technical & Administrative Support Services 803,000 911,000 1,100,000 1,260,000 1,323,000 1,389,150 1,458,608Subtotal Transportation 27,513,469 52,373,700 129,072,954 69,887,160 27,813,749 25,529,500 13,770,249
Economic Dev. ExpendituresChamber Agreement 632,917 708,750 730,012 751,913 774,470 797,704 821,635Downtown Improvements & Marketing 2,632,257 587,611 250,200 250,200 250,200 250,200 250,200Economic Development Projects - Committed 1,598,893 678,470 9,073,000 4,882,414 206,000 91,000 61,000NE Downtown Parking Garage 2,583,599 8,349,000 2,467,401 - - - - NE Downtown Dry Utilities & Contingency - 2,126,700 - - - - - S Mays Corridor Improvements - 1,283,941 300,000 - - - - Subtotal Economic Development 7,447,666 13,734,472 12,820,613 5,884,527 1,230,670 1,138,904 1,132,835
Total Expenses 34,961,135 66,108,172 141,893,567 75,771,687 29,044,419 26,668,404 14,903,084
Net Revenues 24,015,478 7,466,317 (72,706,842) (11,028,312) 3,263,669 4,520,858 12,079,790
Net Impact of Kalahari Project Debt Proceeds and Project Expenses (31,542,257) 47,934,549 - - - - - Ending Fund Balance 42,627,939 98,028,805 25,321,963 14,293,651 17,557,320 22,078,178 34,157,967Fund Reserve (1,000,000) (1,000,000) (1,000,000) (1,000,000) (1,000,000) (1,000,000) (1,000,000)Available Ending Fund Balance 41,627,939$ 97,028,805$ 24,321,963$ 13,293,651$ 16,557,320$ 21,078,178$ 33,157,967$
Z:\Budget\FY 22\Fund Schedules\Type B\Type B FY22 Fund Schedule
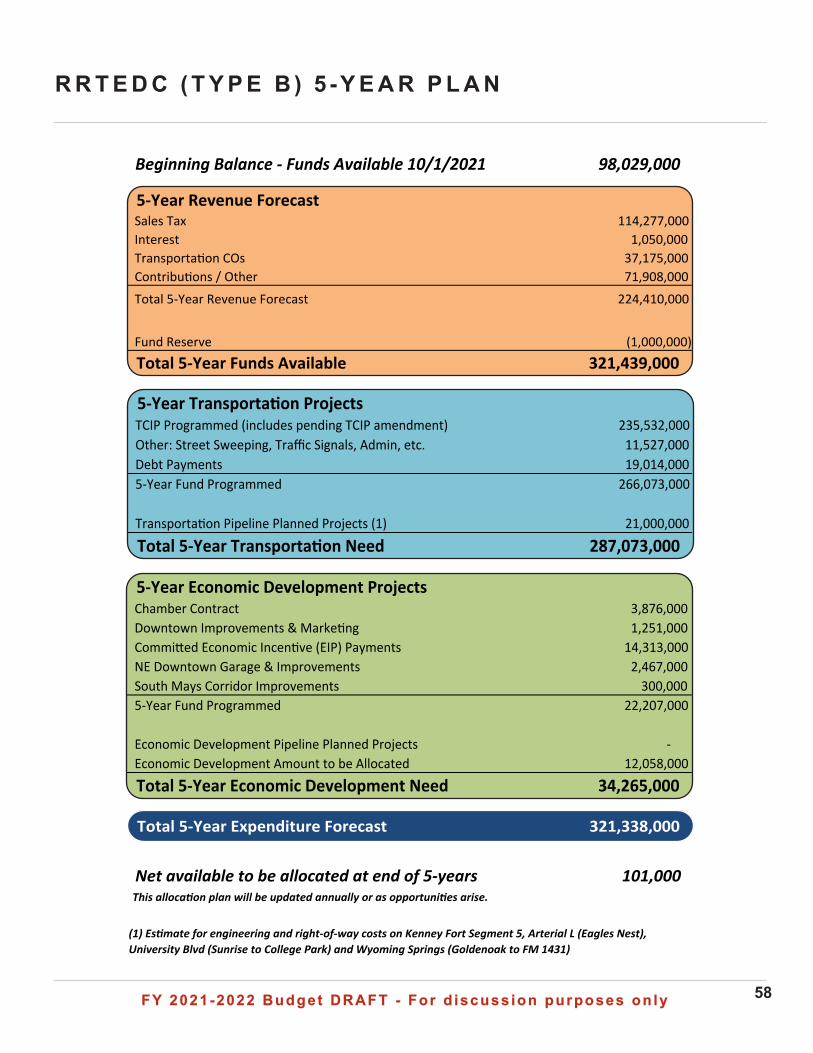
FY 2021-2022 Budget DRAFT - For d iscuss ion purposes on lyFY 2021-2022 Budget DRAFT - For d iscuss ion purposes on ly 58
5-Year Transporta�on ProjectsTCIP Programmed (includes pending TCIP amendment) 235,532,000 Other: Street Sweeping, Traffic Signals, Admin, etc. 11,527,000 Debt Payments 19,014,000 5-Year Fund Programmed 266,073,000
Transporta�on Pipeline Planned Projects (1) 21,000,000
Total 5-Year Transporta�on Need 287,073,000
R R T E D C ( T Y P E B ) 5 - Y E A R P L A N
Total 5-Year Expenditure Forecast 321,338,000
5-Year Economic Development ProjectsChamber Contract 3,876,000 Downtown Improvements & Marke�ng 1,251,000 Commi�ed Economic Incen�ve (EIP) Payments 14,313,000 NE Downtown Garage & Improvements 2,467,000 South Mays Corridor Improvements 300,000 5-Year Fund Programmed 22,207,000
Economic Development Pipeline Planned Projects - Economic Development Amount to be Allocated 12,058,000
Total 5-Year Economic Development Need 34,265,000
5-Year Revenue ForecastSales Tax 114,277,000 Interest 1,050,000 Transporta�on COs 37,175,000 Contribu�ons / Other 71,908,000
Total 5-Year Revenue Forecast 224,410,000
Fund Reserve (1,000,000)
Total 5-Year Funds Available 321,439,000
Beginning Balance - Funds Available 10/1/2021 98,029,000
Net available to be allocated at end of 5-years 101,000 This allocation plan will be updated annually or as opportunities arise.
(1) Estimate for engineering and right-of-way costs on Kenney Fort Segment 5, Arterial L (Eagles Nest), University Blvd (Sunrise to College Park) and Wyoming Springs (Goldenoak to FM 1431)
FY 2021-2022 Budget DRAFT - For d iscuss ion purposes on lyFY 2021-2022 Budget DRAFT - For d iscuss ion purposes on ly 59
P R O P E R T Y VA L U E S & TA X E S
• Proposed Property Tax Rate...........................................................................60
• Property Tax Facts..........................................................................................61
• FY 2022 Property Tax Revenue Comparisons...............................................62
• Property Tax and Value Summary..................................................................63
• Property Tax Value Infographic.......................................................................64
• Property Tax in Monthly Budget......................................................................65
• Assessed Values & Property Tax Rate History...............................................66
• Median Residential Home Value History........................................................67
• Benchmarking - Tax Rates..............................................................................68
• Taxable Assessed Value by Property Tax - Benchmarking.............................71
• Demographics - Benchmarking.......................................................................72
• Senate Bill 2 Changes....................................................................................73
• No New Revenue Infographic........................................................................75
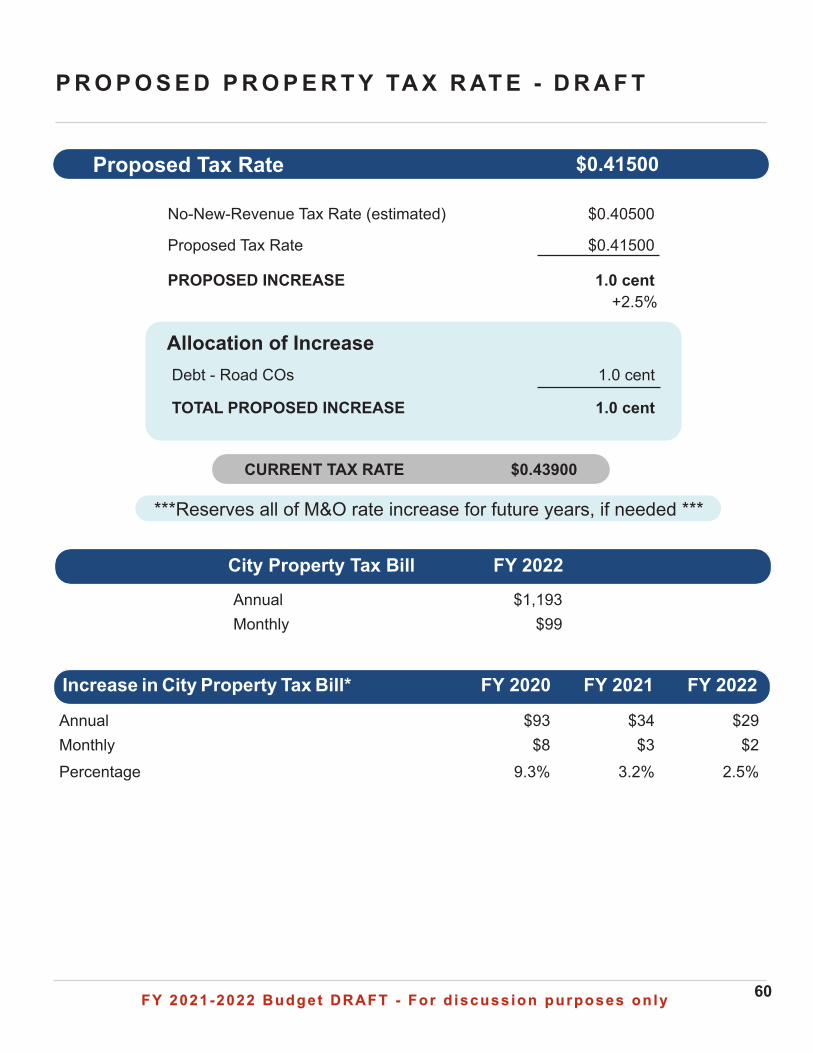
FY 2021-2022 Budget DRAFT - For d iscuss ion purposes on lyFY 2021-2022 Budget DRAFT - For d iscuss ion purposes on ly 60
P R O P O S E D P R O P E R T Y TA X R AT E - D R A F T
No-New-Revenue Tax Rate (estimated) $0.40500
Proposed Tax Rate $0.41500
PROPOSED INCREASE 1.0 cent +2.5%
Debt - Road COs 1.0 cent
TOTAL PROPOSED INCREASE 1.0 cent
Allocation of Increase
CURRENT TAX RATE $0.43900
Proposed Tax Rate $0.41500
***Reserves all of M&O rate increase for future years, if needed ***
Increase in City Property Tax Bill*
Annual $93 $34 $29Monthly $8 $3 $2Percentage 9.3% 3.2% 2.5%
Increase in City Property Tax Bill*
City Property Tax Bill
FY 2020 FY 2021 FY 2022
Annual $1,193Monthly $99
FY 2022
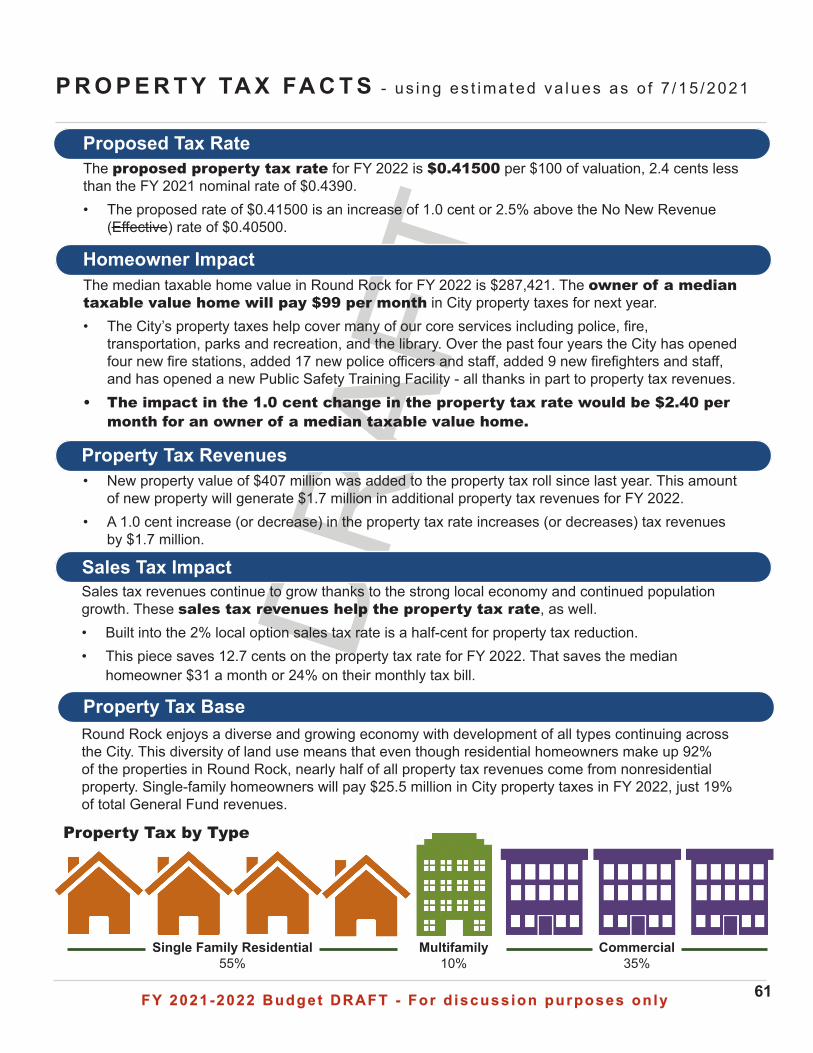
FY 2021-2022 Budget DRAFT - For d iscuss ion purposes on lyFY 2021-2022 Budget DRAFT - For d iscuss ion purposes on ly 61
DR
AFT
P R O P E R T Y TA X FA C T S - us ing es t ima ted va lues as o f 7 /15 /2021
Proposed Tax Rate The proposed property tax rate for FY 2022 is $0.41500 per $100 of valuation, 2.4 cents less than the FY 2021 nominal rate of $0.4390.• The proposed rate of $0.41500 is an increase of 1.0 cent or 2.5% above the No New Revenue
(Effective) rate of $0.40500.
Homeowner ImpactThe median taxable home value in Round Rock for FY 2022 is $287,421. The owner of a median taxable value home will pay $99 per month in City property taxes for next year.• The City’s property taxes help cover many of our core services including police, fire,
transportation, parks and recreation, and the library. Over the past four years the City has opened four new fire stations, added 17 new police officers and staff, added 9 new firefighters and staff, and has opened a new Public Safety Training Facility - all thanks in part to property tax revenues.
• The impact in the 1.0 cent change in the property tax rate would be $2.40 per month for an owner of a median taxable value home.
Property Tax Revenues• New property value of $407 million was added to the property tax roll since last year. This amount
of new property will generate $1.7 million in additional property tax revenues for FY 2022.• A 1.0 cent increase (or decrease) in the property tax rate increases (or decreases) tax revenues
by $1.7 million.
Sales Tax ImpactSales tax revenues continue to grow thanks to the strong local economy and continued population growth. These sales tax revenues help the property tax rate, as well.• Built into the 2% local option sales tax rate is a half-cent for property tax reduction.• This piece saves 12.7 cents on the property tax rate for FY 2022. That saves the median
homeowner $31 a month or 24% on their monthly tax bill.
Property Tax BaseRound Rock enjoys a diverse and growing economy with development of all types continuing across the City. This diversity of land use means that even though residential homeowners make up 92% of the properties in Round Rock, nearly half of all property tax revenues come from nonresidential property. Single-family homeowners will pay $25.5 million in City property taxes in FY 2022, just 19% of total General Fund revenues.
Property Tax by Type
Single Family Residential 55%
Multifamily10%
Commercial 35%
Property Tax by Type
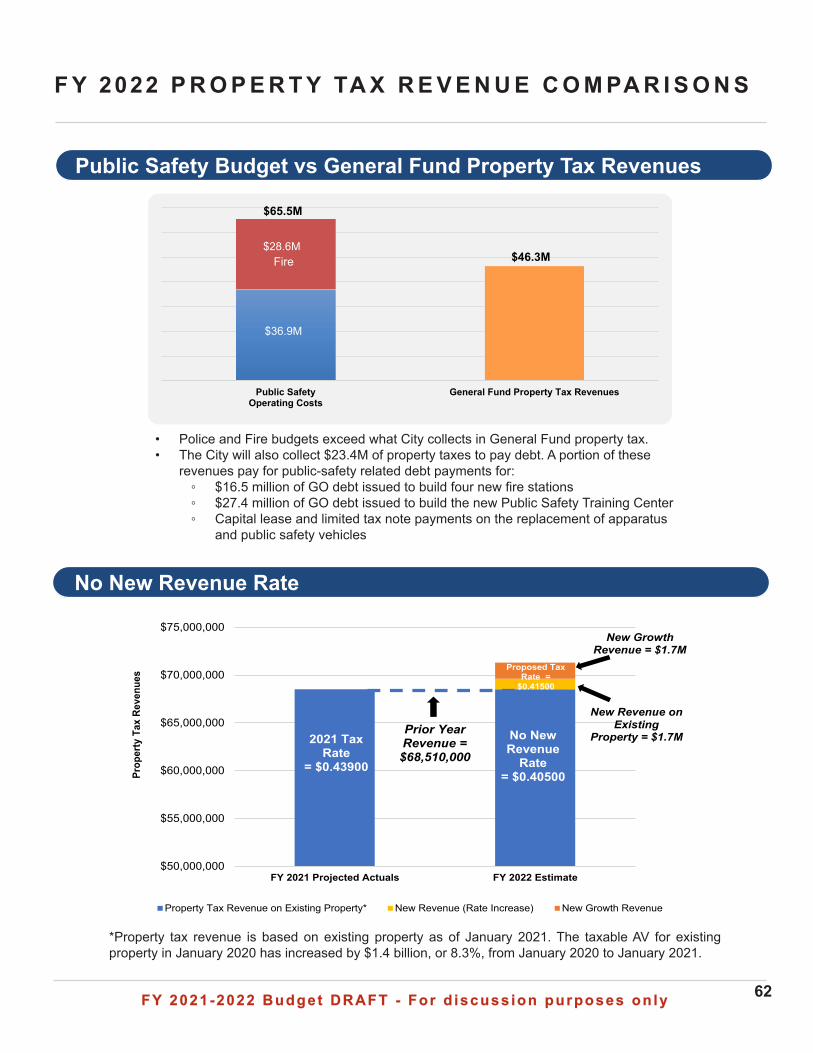
FY 2021-2022 Budget DRAFT - For d iscuss ion purposes on lyFY 2021-2022 Budget DRAFT - For d iscuss ion purposes on ly 62
F Y 2022 P R O P E R T Y TA X R E V E N U E C O M PA R I S O N S
• Police and Fire budgets exceed what City collects in General Fund property tax. • The City will also collect $23.4M of property taxes to pay debt. A portion of these
revenues pay for public-safety related debt payments for: ◦ $16.5 million of GO debt issued to build four new fire stations ◦ $27.4 million of GO debt issued to build the new Public Safety Training Center ◦ Capital lease and limited tax note payments on the replacement of apparatus
and public safety vehicles
$50,000,000
$55,000,000
$60,000,000
$65,000,000
$70,000,000
$75,000,000
FY 2021 Projected Actuals FY 2022 Estimate
Prop
erty
Tax
Rev
enue
s
Property Tax Revenue on Existing Property* New Revenue (Rate Increase) New Growth Revenue
No New Revenue
Rate = $0.40500
Prior Year Revenue = $68,510,000
2021 Tax Rate
= $0.43900
Proposed Tax Rate =
$0.41500
New Growth Revenue = $1.7M
New Revenue on Existing
Property = $1.7M
No New Revenue Rate
*Property tax revenue is based on existing property as of January 2021. The taxable AV for existing property in January 2020 has increased by $1.4 billion, or 8.3%, from January 2020 to January 2021.
Public Safety Budget vs General Fund Property Tax Revenues
Public SafetyOperating Costs
General Fund Property Tax Revenues
$46.3M
$65.5M
$28.6M
$36.9M
Fire
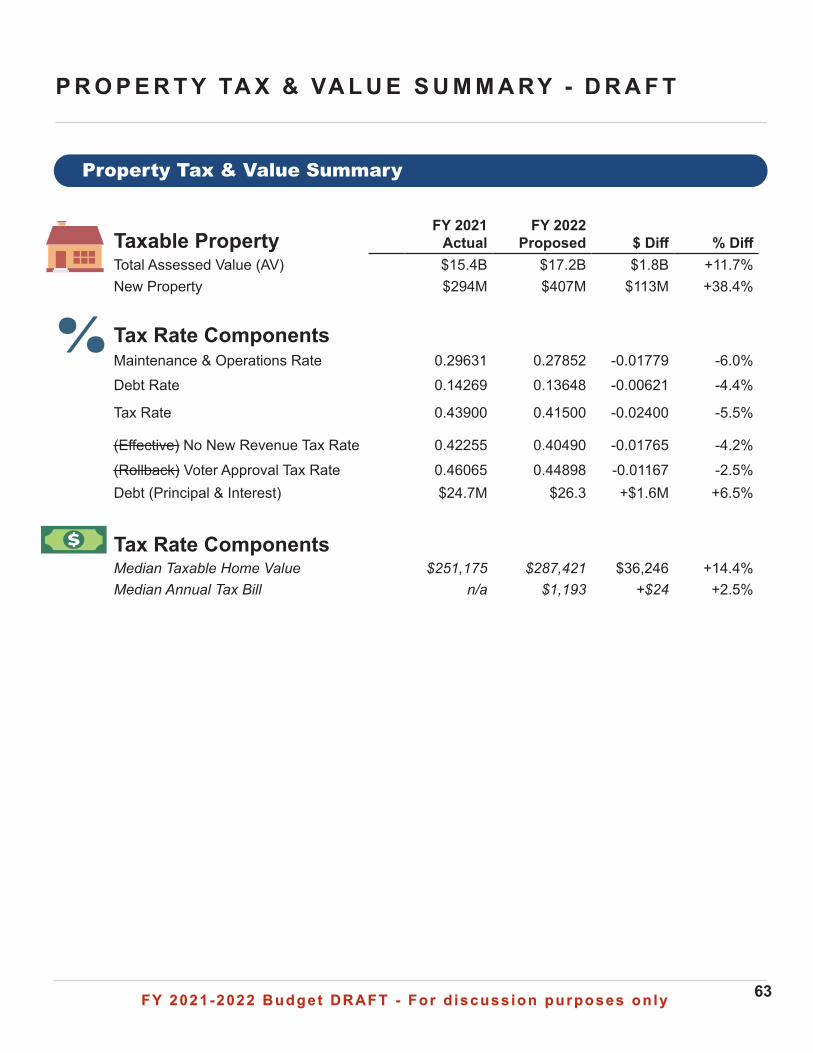
FY 2021-2022 Budget DRAFT - For d iscuss ion purposes on lyFY 2021-2022 Budget DRAFT - For d iscuss ion purposes on ly 63
Taxable PropertyFY 2021
Actual FY 2022
Proposed $ Diff % DiffTotal Assessed Value (AV) $15.4B $17.2B $1.8B +11.7%New Property $294M $407M $113M +38.4%
Tax Rate ComponentsMaintenance & Operations Rate 0.29631 0.27852 -0.01779 -6.0%Debt Rate 0.14269 0.13648 -0.00621 -4.4%
Tax Rate 0.43900 0.41500 -0.02400 -5.5%
(Effective) No New Revenue Tax Rate 0.42255 0.40490 -0.01765 -4.2%(Rollback) Voter Approval Tax Rate 0.46065 0.44898 -0.01167 -2.5%Debt (Principal & Interest) $24.7M $26.3 +$1.6M +6.5%
Tax Rate ComponentsMedian Taxable Home Value $251,175 $287,421 $36,246 +14.4%Median Annual Tax Bill n/a $1,193 +$24 +2.5%
P R O P E R T Y TA X & VA L U E S U M M A RY - D R A F T
Property Tax & Value Summary
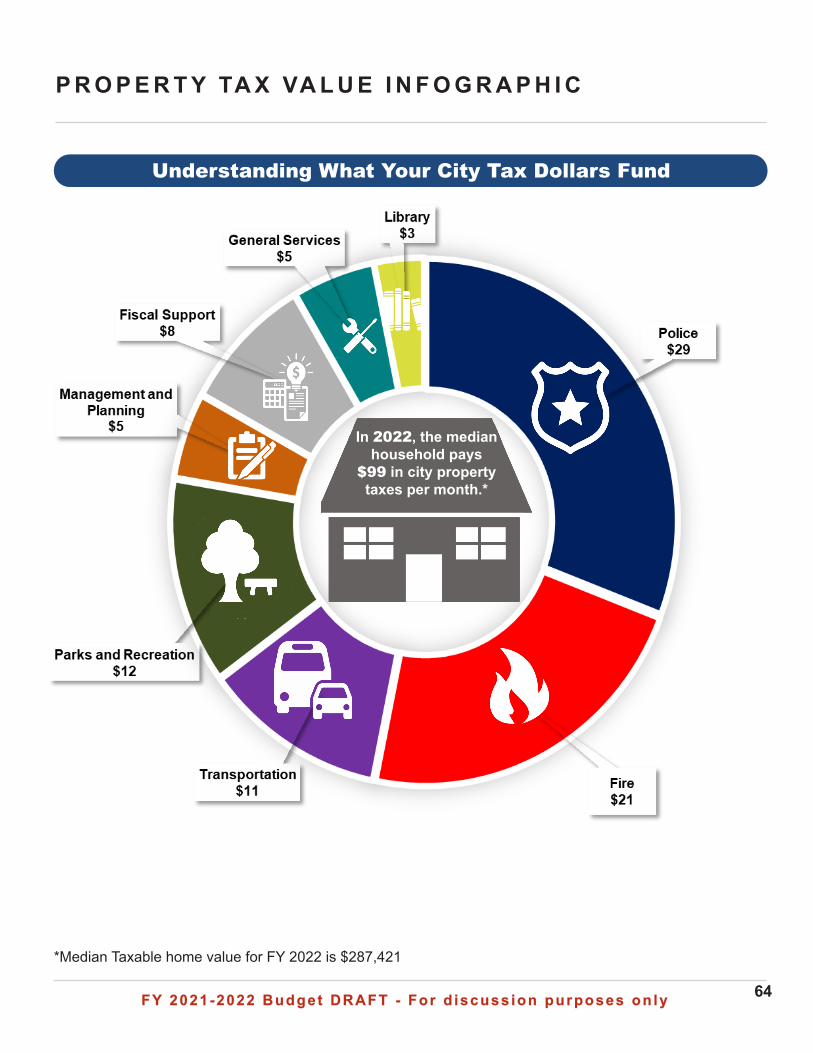
FY 2021-2022 Budget DRAFT - For d iscuss ion purposes on lyFY 2021-2022 Budget DRAFT - For d iscuss ion purposes on ly 64
P R O P E R T Y TA X VA L U E I N F O G R A P H I C
Understanding What Your City Tax Dollars Fund
*Median Taxable home value for FY 2022 is $287,421
In 2022, the median household pays
$99 in city property taxes per month.*
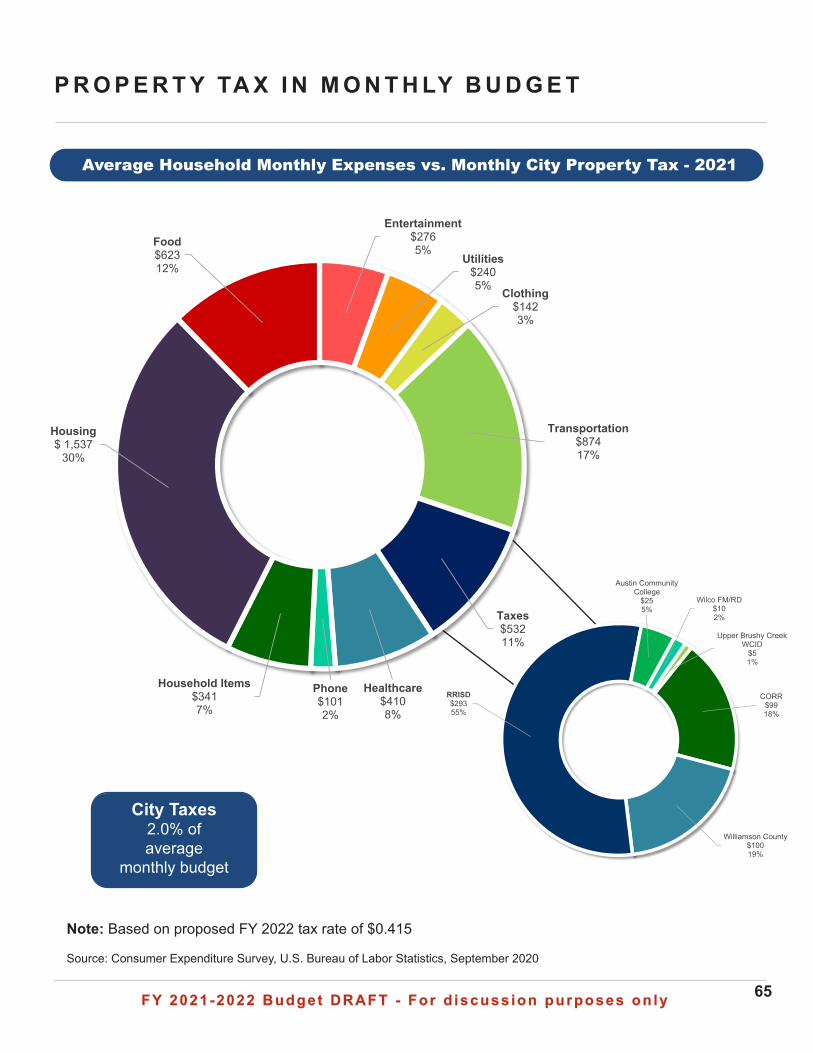
FY 2021-2022 Budget DRAFT - For d iscuss ion purposes on lyFY 2021-2022 Budget DRAFT - For d iscuss ion purposes on ly 65
P R O P E R T Y TA X I N M O N T H LY B U D G E T
Average Household Monthly Expenses vs. Monthly City Property Tax - 2021
City Taxes2.0% of average
monthly budget
Source: Consumer Expenditure Survey, U.S. Bureau of Labor Statistics, September 2020
Note: Based on proposed FY 2022 tax rate of $0.415
CORR$9918%
Williamson County $10019%
RRISD$29355%
Austin Community College
$255%
Wilco FM/RD$102%
Upper Brushy Creek WCID
$51%
Entertainment$276 5%
Utilities$240 5% Clothing
$142 3%
Transportation$87417%
Taxes$53211%
Healthcare$4108%
Phone$1012%
Household Items$3417%
Housing$ 1,537
30%
Food$62312%
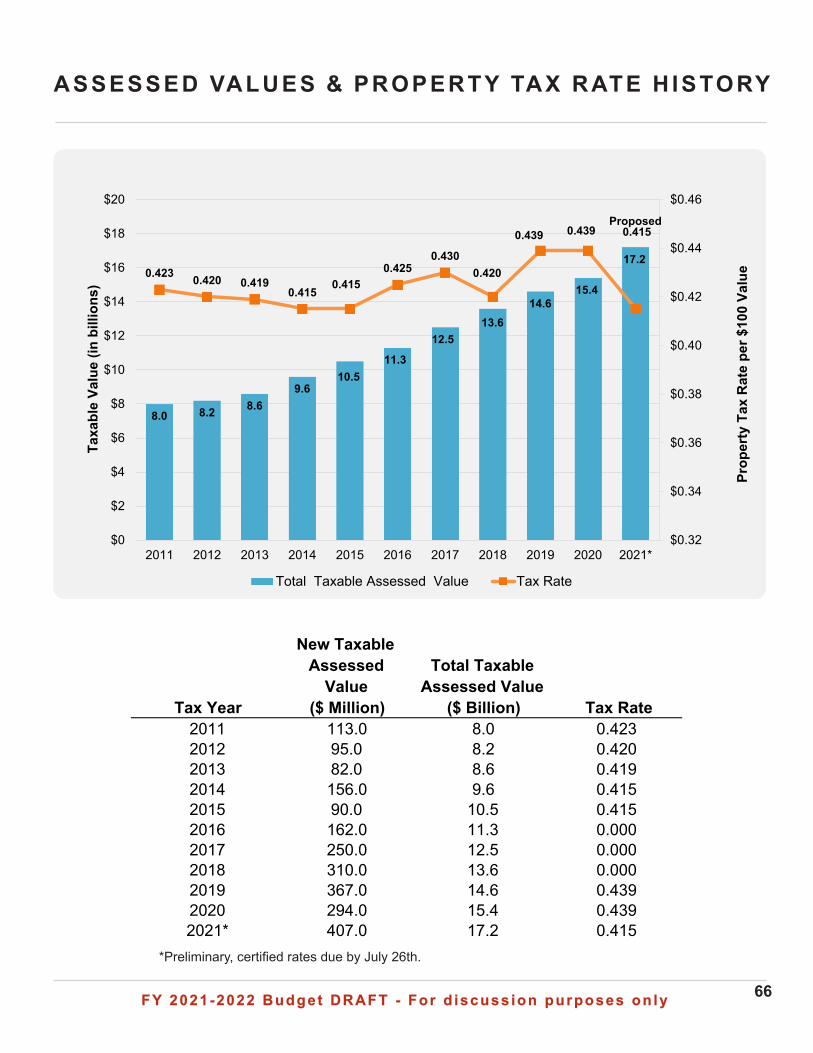
FY 2021-2022 Budget DRAFT - For d iscuss ion purposes on lyFY 2021-2022 Budget DRAFT - For d iscuss ion purposes on ly 66
ASSESSED VALUES & PROPERTY TAX RATE H ISTORY
8.0 8.2 8.69.6
10.511.3
12.513.6
14.615.4
17.20.423 0.420 0.419
0.415 0.4150.425
0.4300.420
0.439 0.439 0.415
$0.32
$0.34
$0.36
$0.38
$0.40
$0.42
$0.44
$0.46
$0
$2
$4
$6
$8
$10
$12
$14
$16
$18
$20
2011 2012 2013 2014 2015 2016 2017 2018 2019 2020 2021*
Prop
erty
Tax
Rat
e pe
r $10
0 Va
lue
Taxa
ble
Valu
e (in
bill
ions
)
Total Taxable Assessed Value Tax Rate
Proposed
*Preliminary, certified rates due by July 26th.
Tax Year
New Taxable Assessed
Value ($ Million)
Total Taxable Assessed Value
($ Billion) Tax Rate2011 113.0 8.0 0.4232012 95.0 8.2 0.4202013 82.0 8.6 0.4192014 156.0 9.6 0.4152015 90.0 10.5 0.4152016 162.0 11.3 0.0002017 250.0 12.5 0.0002018 310.0 13.6 0.0002019 367.0 14.6 0.4392020 294.0 15.4 0.4392021* 407.0 17.2 0.415
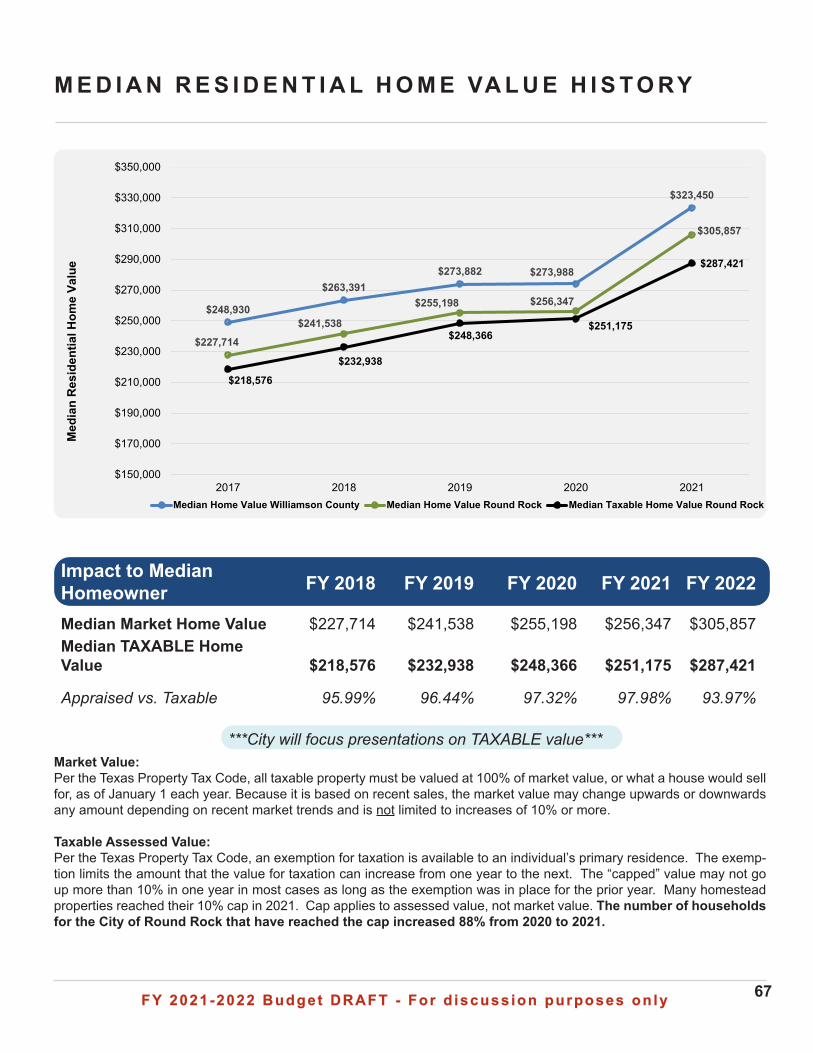
FY 2021-2022 Budget DRAFT - For d iscuss ion purposes on lyFY 2021-2022 Budget DRAFT - For d iscuss ion purposes on ly 67
Impact to Median Homeowner FY 2018 FY 2019 FY 2020 FY 2021 FY 2022
Median Market Home Value $227,714 $241,538 $255,198 $256,347 $305,857Median TAXABLE Home Value $218,576 $232,938 $248,366 $251,175 $287,421
Appraised vs. Taxable 95.99% 96.44% 97.32% 97.98% 93.97%
***City will focus presentations on TAXABLE value***
M E D I A N R E S I D E N T I A L H O M E VA L U E H I S T O RY
Market Value:Per the Texas Property Tax Code, all taxable property must be valued at 100% of market value, or what a house would sell for, as of January 1 each year. Because it is based on recent sales, the market value may change upwards or downwards any amount depending on recent market trends and is not limited to increases of 10% or more.
Taxable Assessed Value:Per the Texas Property Tax Code, an exemption for taxation is available to an individual’s primary residence. The exemp-tion limits the amount that the value for taxation can increase from one year to the next. The “capped” value may not go up more than 10% in one year in most cases as long as the exemption was in place for the prior year. Many homestead properties reached their 10% cap in 2021. Cap applies to assessed value, not market value. The number of households for the City of Round Rock that have reached the cap increased 88% from 2020 to 2021.
$248,930
$263,391$273,882 $273,988
$323,450
$227,714$241,538
$255,198 $256,347
$305,857
$218,576
$232,938
$248,366$251,175
$287,421
$150,000
$170,000
$190,000
$210,000
$230,000
$250,000
$270,000
$290,000
$310,000
$330,000
$350,000
2017 2018 2019 2020 2021
Med
ian
Res
iden
tial H
ome
Valu
e
Median Home Value Williamson County Median Home Value Round Rock Median Taxable Home Value Round Rock
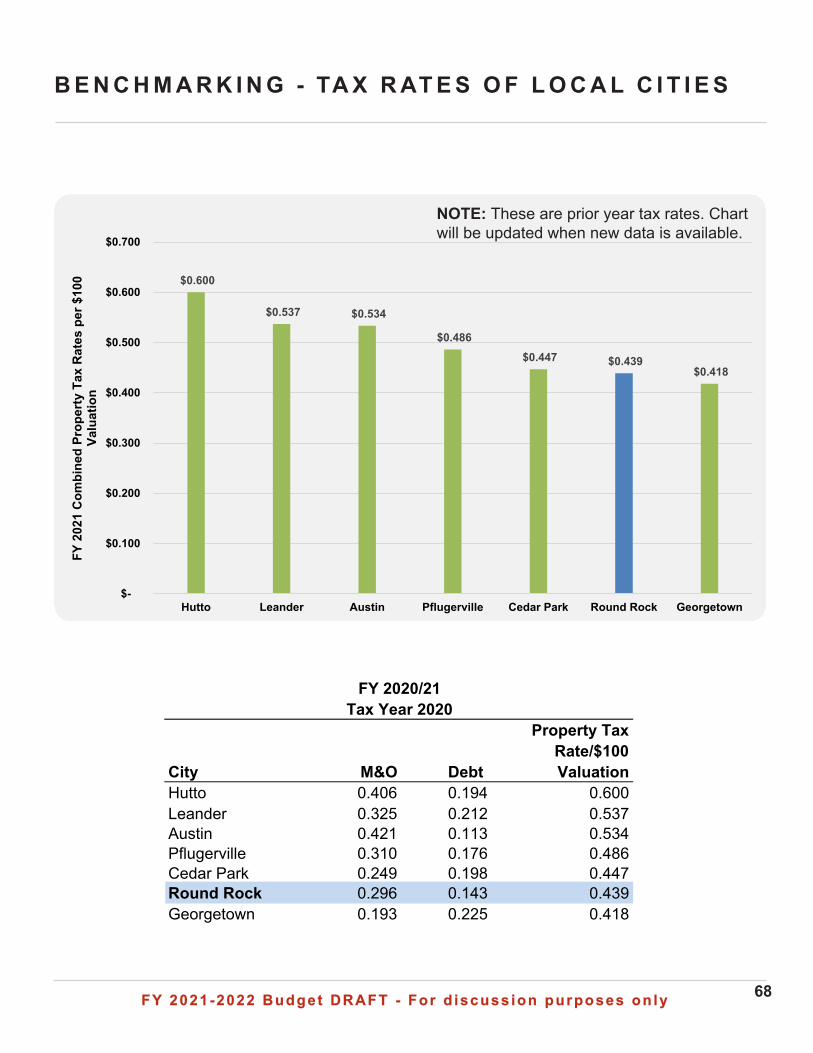
FY 2021-2022 Budget DRAFT - For d iscuss ion purposes on lyFY 2021-2022 Budget DRAFT - For d iscuss ion purposes on ly 68
B E N C H M A R K I N G - TA X R AT E S O F L O C A L C I T I E S
$0.600
$0.537 $0.534
$0.486 $0.447 $0.439
$0.418
$-
$0.100
$0.200
$0.300
$0.400
$0.500
$0.600
$0.700
Hutto Leander Austin Pflugerville Cedar Park Round Rock Georgetown
FY 2
021
Com
bine
d Pr
oper
ty T
ax R
ates
per
$10
0 Va
luat
ion
NOTE: These are prior year tax rates. Chart will be updated when new data is available.
City M&O Debt
Property Tax Rate/$100 Valuation
Hutto 0.406 0.194 0.600Leander 0.325 0.212 0.537Austin 0.421 0.113 0.534Pflugerville 0.310 0.176 0.486Cedar Park 0.249 0.198 0.447Round Rock 0.296 0.143 0.439Georgetown 0.193 0.225 0.418
FY 2020/21Tax Year 2020
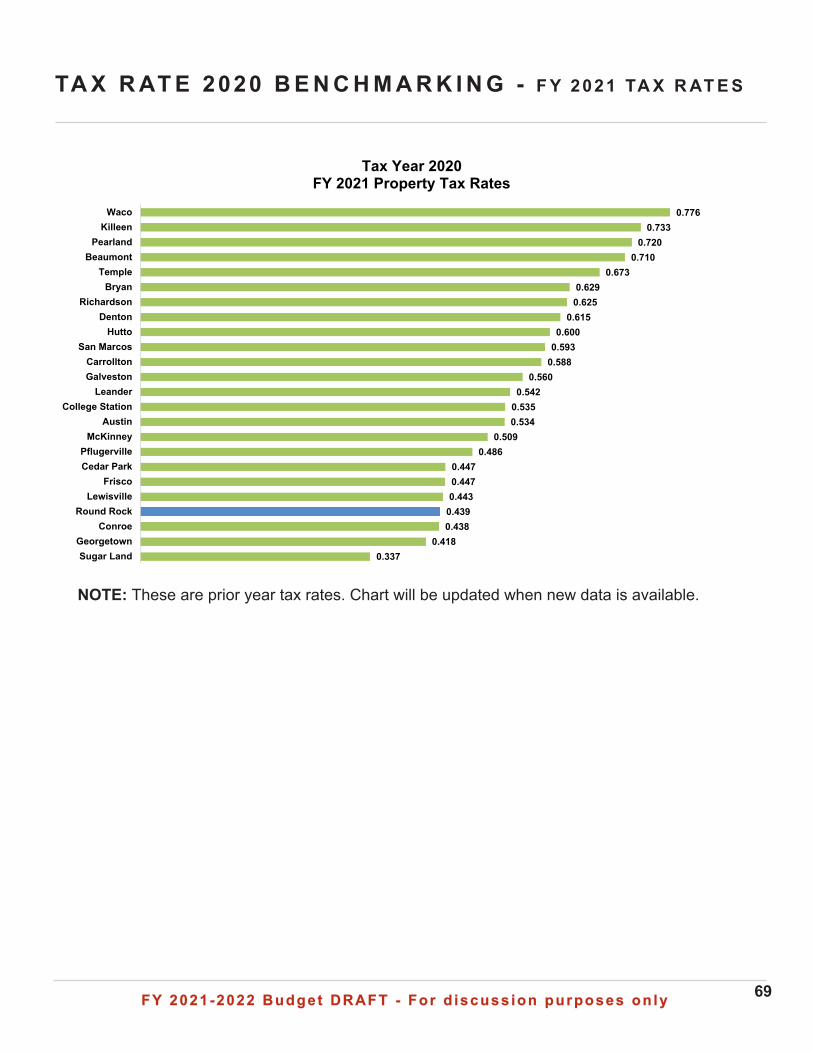
FY 2021-2022 Budget DRAFT - For d iscuss ion purposes on lyFY 2021-2022 Budget DRAFT - For d iscuss ion purposes on ly 69
TA X R AT E 2020 B E N C H M A R K I N G - F Y 2021 TA X R AT E S
NOTE: These are prior year tax rates. Chart will be updated when new data is available.
0.3370.418
0.4380.4390.4430.4470.447
0.4860.509
0.5340.5350.542
0.5600.5880.5930.600
0.6150.6250.629
0.6730.710
0.7200.733
0.776
Sugar LandGeorgetown
ConroeRound Rock
LewisvilleFrisco
Cedar ParkPflugerville
McKinneyAustin
College StationLeander
GalvestonCarrollton
San MarcosHutto
DentonRichardson
BryanTemple
BeaumontPearland
KilleenWaco
Tax Year 2020FY 2021 Property Tax Rates
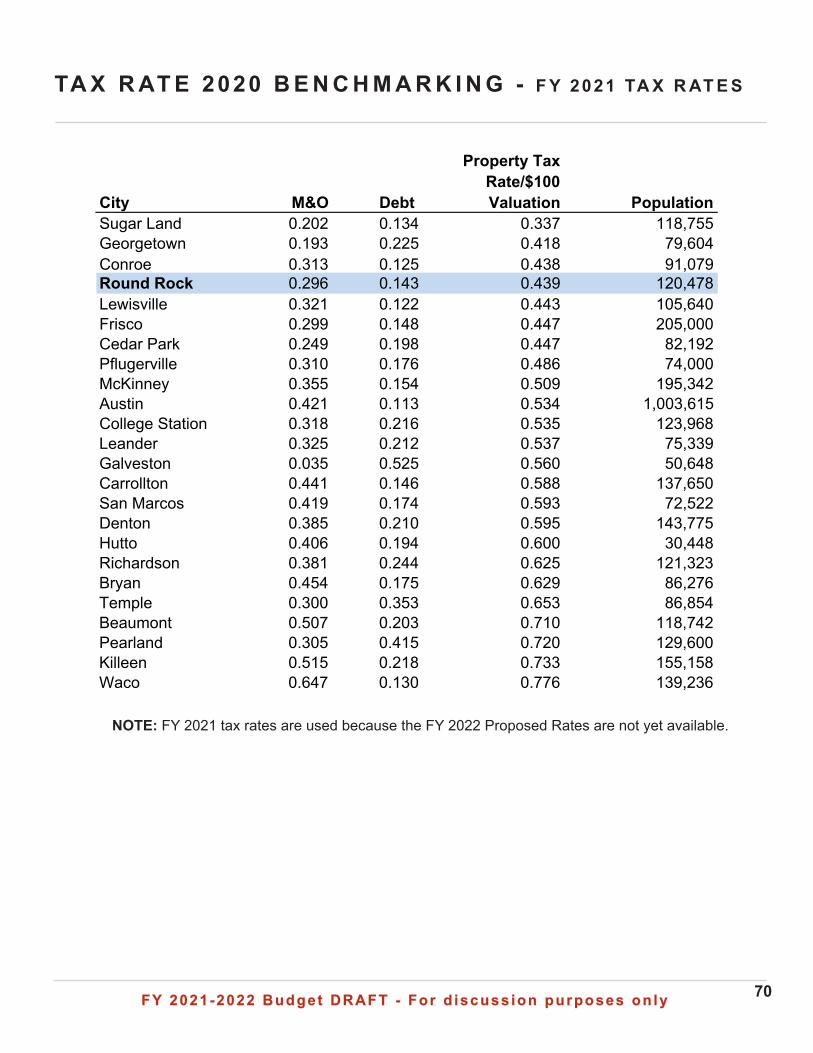
FY 2021-2022 Budget DRAFT - For d iscuss ion purposes on lyFY 2021-2022 Budget DRAFT - For d iscuss ion purposes on ly 70
TA X R AT E 2020 B E N C H M A R K I N G - F Y 2021 TA X R AT E S
NOTE: FY 2021 tax rates are used because the FY 2022 Proposed Rates are not yet available.
City M&O Debt
Property Tax Rate/$100 Valuation Population
Sugar Land 0.202 0.134 0.337 118,755Georgetown 0.193 0.225 0.418 79,604Conroe 0.313 0.125 0.438 91,079Round Rock 0.296 0.143 0.439 120,478Lewisville 0.321 0.122 0.443 105,640Frisco 0.299 0.148 0.447 205,000Cedar Park 0.249 0.198 0.447 82,192Pflugerville 0.310 0.176 0.486 74,000McKinney 0.355 0.154 0.509 195,342Austin 0.421 0.113 0.534 1,003,615College Station 0.318 0.216 0.535 123,968Leander 0.325 0.212 0.537 75,339Galveston 0.035 0.525 0.560 50,648Carrollton 0.441 0.146 0.588 137,650San Marcos 0.419 0.174 0.593 72,522Denton 0.385 0.210 0.595 143,775Hutto 0.406 0.194 0.600 30,448Richardson 0.381 0.244 0.625 121,323Bryan 0.454 0.175 0.629 86,276Temple 0.300 0.353 0.653 86,854Beaumont 0.507 0.203 0.710 118,742Pearland 0.305 0.415 0.720 129,600Killeen 0.515 0.218 0.733 155,158Waco 0.647 0.130 0.776 139,236
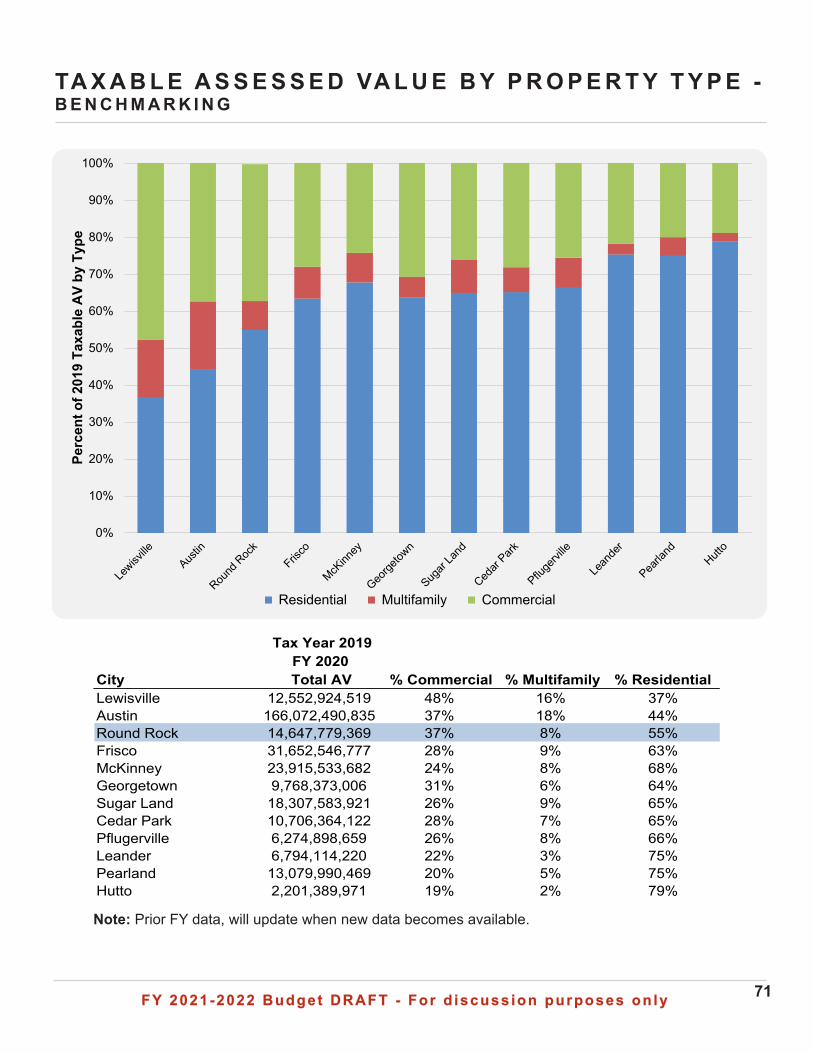
FY 2021-2022 Budget DRAFT - For d iscuss ion purposes on lyFY 2021-2022 Budget DRAFT - For d iscuss ion purposes on ly 71
TA X A B L E A S S E S S E D VA L U E B Y P R O P E R T Y T Y P E -B E N C H M A R K I N G
0%
10%
20%
30%
40%
50%
60%
70%
80%
90%
100%
Perc
ent o
f 201
9 Ta
xabl
e AV
by
Type
Residential Multifamily Commercial
Note: Prior FY data, will update when new data becomes available.
City
Tax Year 2019 FY 2020Total AV % Commercial % Multifamily % Residential
Lewisville 12,552,924,519 48% 16% 37%Austin 166,072,490,835 37% 18% 44%Round Rock 14,647,779,369 37% 8% 55%Frisco 31,652,546,777 28% 9% 63%McKinney 23,915,533,682 24% 8% 68%Georgetown 9,768,373,006 31% 6% 64%Sugar Land 18,307,583,921 26% 9% 65%Cedar Park 10,706,364,122 28% 7% 65%Pflugerville 6,274,898,659 26% 8% 66%Leander 6,794,114,220 22% 3% 75%Pearland 13,079,990,469 20% 5% 75%Hutto 2,201,389,971 19% 2% 79%
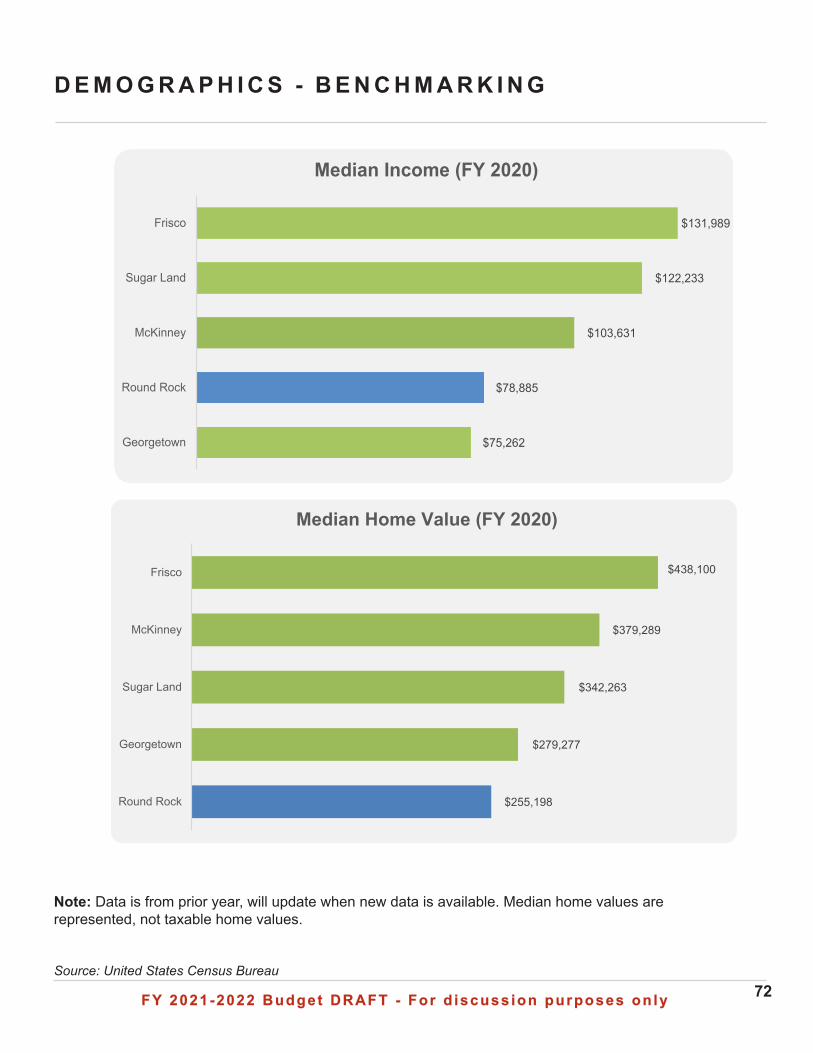
FY 2021-2022 Budget DRAFT - For d iscuss ion purposes on lyFY 2021-2022 Budget DRAFT - For d iscuss ion purposes on ly 72
D E M O G R A P H I C S - B E N C H M A R K I N G
$75,262
$78,885
$103,631
$122,233
$131,989
Georgetown
Round Rock
McKinney
Sugar Land
Frisco
Median Income (FY 2020)
$255,198
$279,277
$342,263
$379,289
$438,100
Round Rock
Georgetown
Sugar Land
McKinney
Frisco
Median Home Value (FY 2020)
Note: Data is from prior year, will update when new data is available. Median home values are represented, not taxable home values.
Source: United States Census Bureau
FY 2021-2022 Budget DRAFT - For d iscuss ion purposes on lyFY 2021-2022 Budget DRAFT - For d iscuss ion purposes on ly 73
S E N AT E B I L L 2 C H A N G E S - E F F E C T I V E B E G I N N I N G F Y 2021
New Terminology• “Effective Tax Rate” is now “No New Revenue Rate”
• “Rollback Rate” is now “Voter Approval Rate”
Changes in Timing• Property Tax Public Hearing: now only one required
• Adopting a tax rate that exceeds the Voter Approval Rate yields a very narrow timing window.
• If a city adopts a rate exceeding the voter approval tax rate, it must do so not later than the 78th day before the November uniform election date - August 16, 2021
• Adopting a tax rate that does not exceed the Voter Approval Rate doesn’t change the deadline at all.
• The City is required to adopt a rate by September 15th based on our contract with Williamson County Tax Office.
Notice Requirements• Now by August 7, information must be posted on the City’s website
• No New Revenue rate and Voter Approval rate
• Estimated amount of available fund balance for General Fund and Debt Service Fund
• Schedule of the City’s debt obligations
• New notice language is provided within SB2
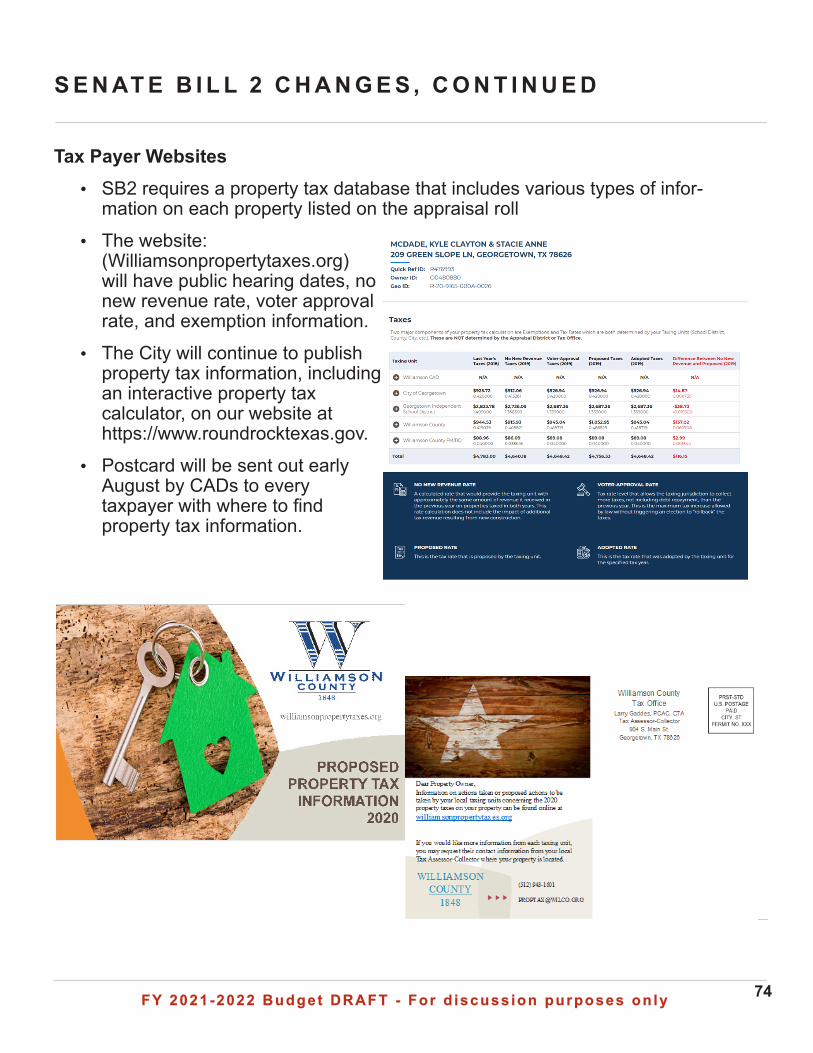
FY 2021-2022 Budget DRAFT - For d iscuss ion purposes on lyFY 2021-2022 Budget DRAFT - For d iscuss ion purposes on ly 74
S E N AT E B I L L 2 C H A N G E S , C O N T I N U E D
Tax Payer Websites• SB2 requires a property tax database that includes various types of infor-
mation on each property listed on the appraisal roll
• The website: (Williamsonpropertytaxes.org) will have public hearing dates, no new revenue rate, voter approval rate, and exemption information.
• The City will continue to publish property tax information, including an interactive property tax calculator, on our website at https://www.roundrocktexas.gov.
• Postcard will be sent out early August by CADs to every taxpayer with where to find property tax information.
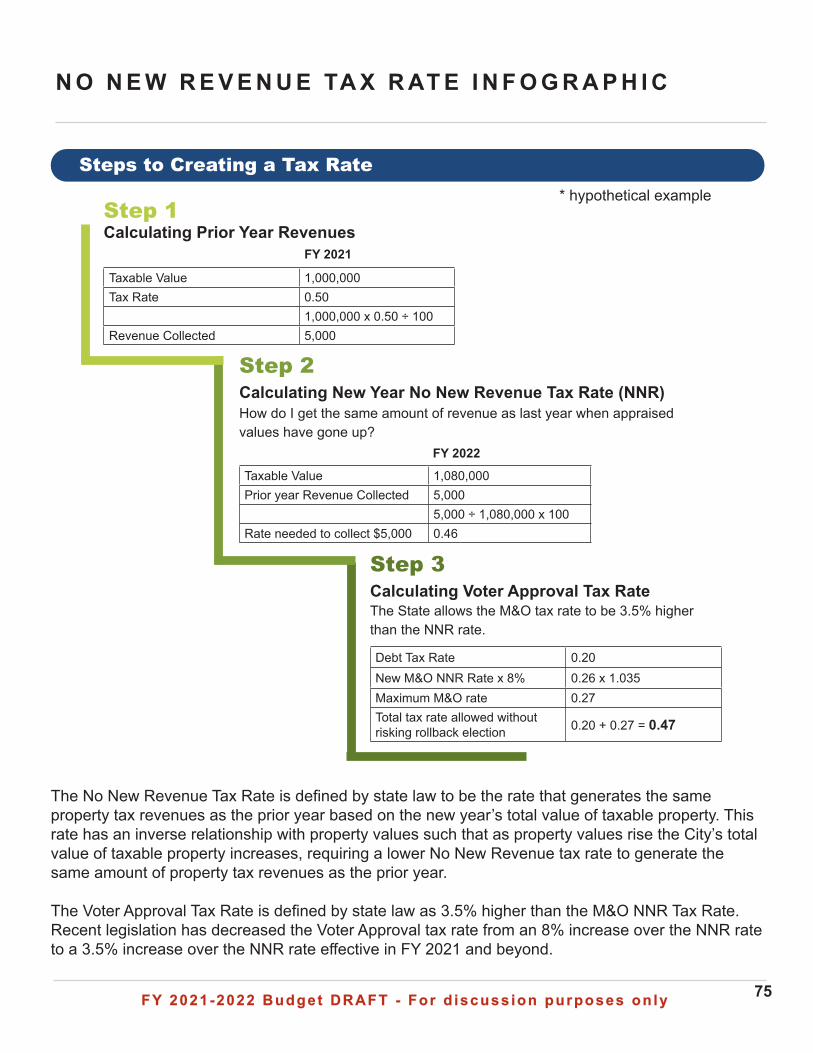
FY 2021-2022 Budget DRAFT - For d iscuss ion purposes on lyFY 2021-2022 Budget DRAFT - For d iscuss ion purposes on ly 75
N O N E W R E V E N U E TA X R AT E I N F O G R A P H I C
Steps to Creating a Tax Rate
The No New Revenue Tax Rate is defined by state law to be the rate that generates the same property tax revenues as the prior year based on the new year’s total value of taxable property. This rate has an inverse relationship with property values such that as property values rise the City’s total value of taxable property increases, requiring a lower No New Revenue tax rate to generate the same amount of property tax revenues as the prior year.
The Voter Approval Tax Rate is defined by state law as 3.5% higher than the M&O NNR Tax Rate. Recent legislation has decreased the Voter Approval tax rate from an 8% increase over the NNR rate to a 3.5% increase over the NNR rate effective in FY 2021 and beyond.
Debt Tax Rate 0.20New M&O NNR Rate x 8% 0.26 x 1.035Maximum M&O rate 0.27Total tax rate allowed without risking rollback election 0.20 + 0.27 = 0.47
FY 2021
Taxable Value 1,000,000Tax Rate 0.50
1,000,000 x 0.50 ÷ 100Revenue Collected 5,000
Step 1Calculating Prior Year Revenues
Taxable Value 1,080,000Prior year Revenue Collected 5,000
5,000 ÷ 1,080,000 x 100Rate needed to collect $5,000 0.46
Step 2Calculating New Year No New Revenue Tax Rate (NNR)How do I get the same amount of revenue as last year when appraised values have gone up?
FY 2022
Step 3Calculating Voter Approval Tax RateThe State allows the M&O tax rate to be 3.5% higher than the NNR rate.
* hypothetical example
FY 2021-2022 Budget DRAFT - For d iscuss ion purposes on lyFY 2021-2022 Budget DRAFT - For d iscuss ion purposes on ly 76
P E R S O N N E L & B E N E F I T S
• Compensation & Benefit Highlights.................................................................77
• Summary of New Positions.............................................................................78
• Summary of FTEs by Function........................................................................80
• FTE 10 Year History by Department................................................................81
• Citizens Served per Employee........................................................................82
• Citizens Served per Employee for Select Departments..................................83
• Benchmarking - 2 Year Increase in FTEs.......................................................84
• Details - 2 Year Increase in FTEs for Cities....................................................85
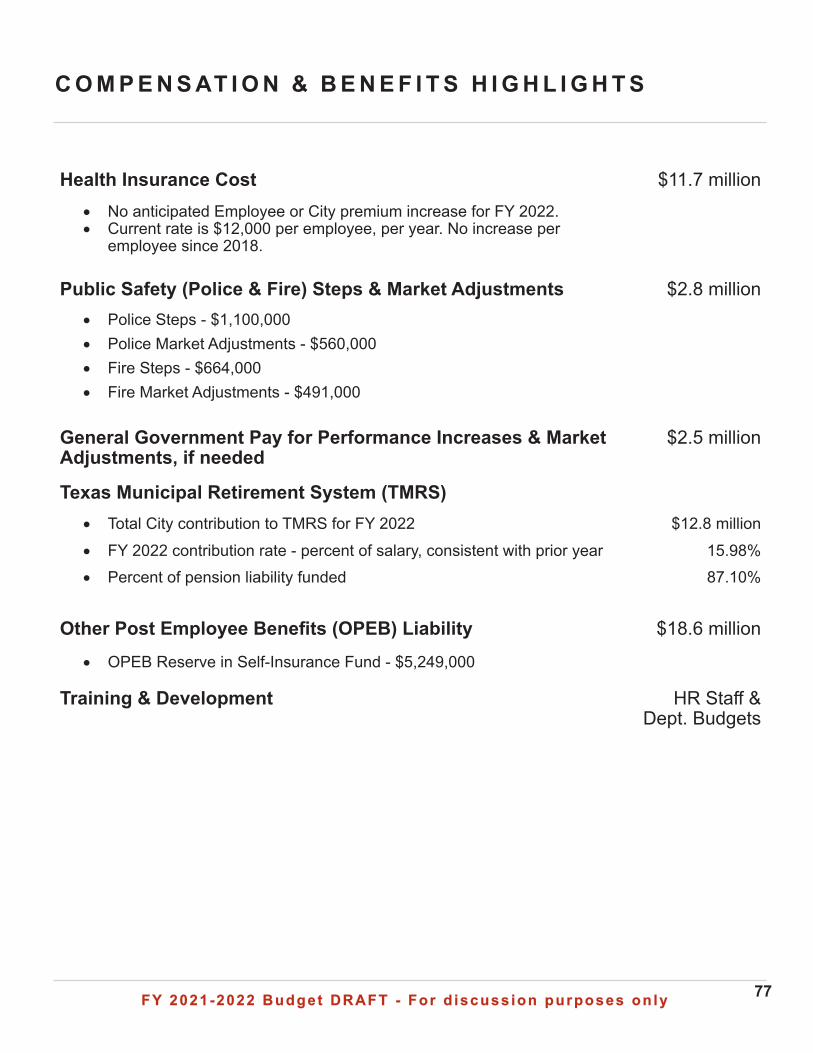
FY 2021-2022 Budget DRAFT - For d iscuss ion purposes on lyFY 2021-2022 Budget DRAFT - For d iscuss ion purposes on ly 77
C O M P E N S AT I O N & B E N E F I T S H I G H L I G H T S
Health Insurance Cost $11.7 million• No anticipated Employee or City premium increase for FY 2022.• Current rate is $12,000 per employee, per year. No increase per
employee since 2018.
Public Safety (Police & Fire) Steps & Market Adjustments $2.8 million• Police Steps - $1,100,000• Police Market Adjustments - $560,000• Fire Steps - $664,000• Fire Market Adjustments - $491,000
General Government Pay for Performance Increases & Market Adjustments, if needed
$2.5 million
Texas Municipal Retirement System (TMRS)• Total City contribution to TMRS for FY 2022 $12.8 million• FY 2022 contribution rate - percent of salary, consistent with prior year 15.98%• Percent of pension liability funded 87.10%
Other Post Employee Benefits (OPEB) Liability $18.6 million
• OPEB Reserve in Self-Insurance Fund - $5,249,000
Training & Development HR Staff & Dept. Budgets
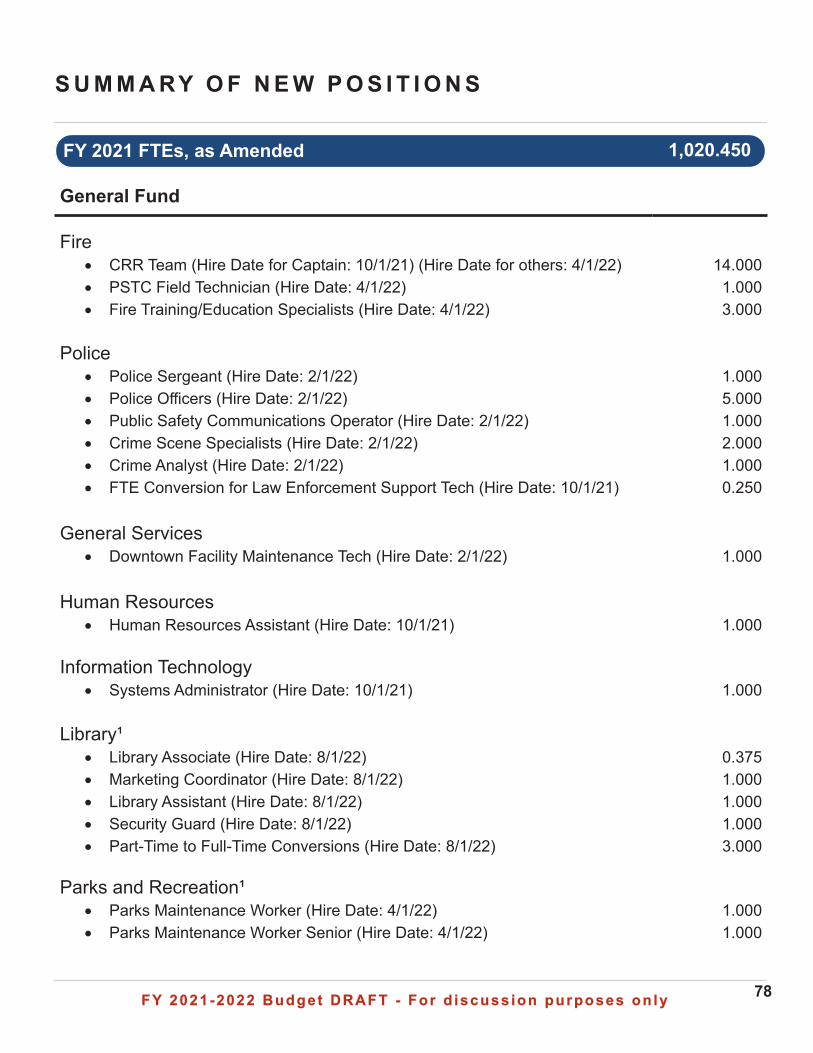
FY 2021-2022 Budget DRAFT - For d iscuss ion purposes on lyFY 2021-2022 Budget DRAFT - For d iscuss ion purposes on ly 78
S U M M A RY O F N E W P O S I T I O N S
General Fund
Fire• CRR Team (Hire Date for Captain: 10/1/21) (Hire Date for others: 4/1/22) 14.000• PSTC Field Technician (Hire Date: 4/1/22) 1.000• Fire Training/Education Specialists (Hire Date: 4/1/22) 3.000
Police• Police Sergeant (Hire Date: 2/1/22) 1.000• Police Officers (Hire Date: 2/1/22) 5.000• Public Safety Communications Operator (Hire Date: 2/1/22) 1.000• Crime Scene Specialists (Hire Date: 2/1/22) 2.000• Crime Analyst (Hire Date: 2/1/22) 1.000• FTE Conversion for Law Enforcement Support Tech (Hire Date: 10/1/21) 0.250
General Services• Downtown Facility Maintenance Tech (Hire Date: 2/1/22) 1.000
Human Resources• Human Resources Assistant (Hire Date: 10/1/21) 1.000
Information Technology• Systems Administrator (Hire Date: 10/1/21) 1.000
Library¹• Library Associate (Hire Date: 8/1/22) 0.375• Marketing Coordinator (Hire Date: 8/1/22) 1.000• Library Assistant (Hire Date: 8/1/22) 1.000• Security Guard (Hire Date: 8/1/22) 1.000• Part-Time to Full-Time Conversions (Hire Date: 8/1/22) 3.000
Parks and Recreation¹• Parks Maintenance Worker (Hire Date: 4/1/22) 1.000• Parks Maintenance Worker Senior (Hire Date: 4/1/22) 1.000
FY 2021 FTEs, as Amended 1,020.450
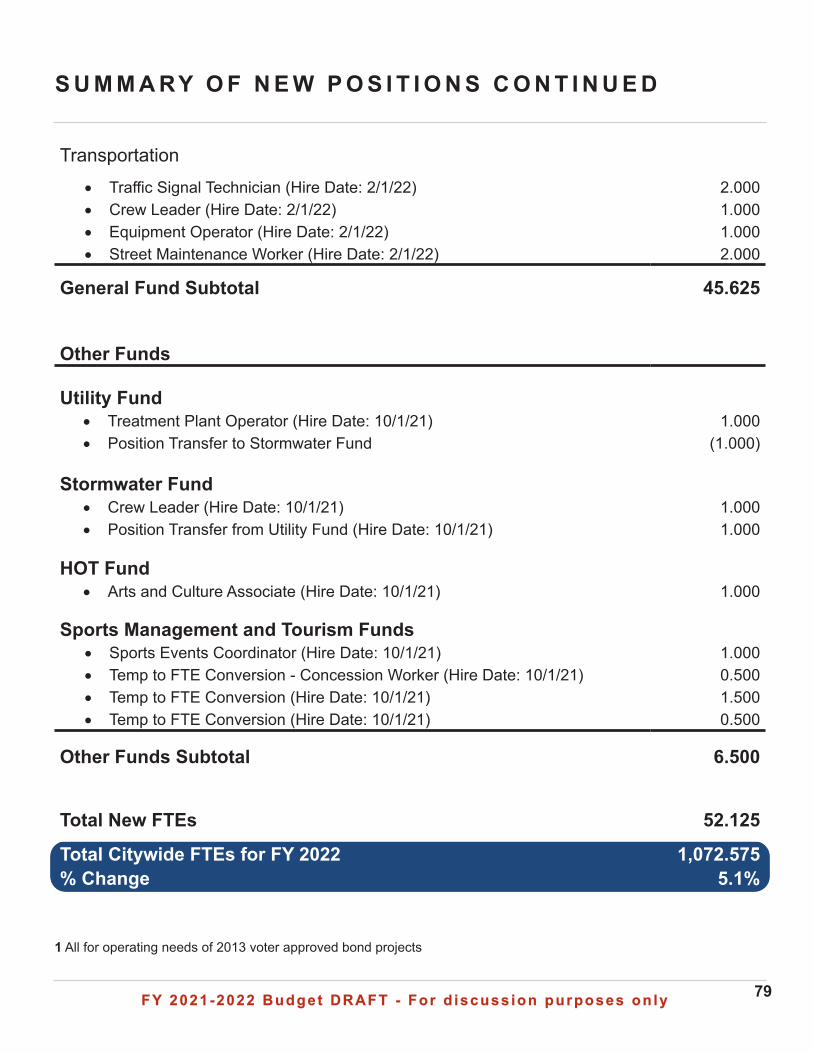
FY 2021-2022 Budget DRAFT - For d iscuss ion purposes on lyFY 2021-2022 Budget DRAFT - For d iscuss ion purposes on ly 79
S U M M A RY O F N E W P O S I T I O N S C O N T I N U E D
Transportation• Traffic Signal Technician (Hire Date: 2/1/22) 2.000• Crew Leader (Hire Date: 2/1/22) 1.000• Equipment Operator (Hire Date: 2/1/22) 1.000• Street Maintenance Worker (Hire Date: 2/1/22) 2.000
General Fund Subtotal 45.625
Other Funds
Utility Fund• Treatment Plant Operator (Hire Date: 10/1/21) 1.000• Position Transfer to Stormwater Fund (1.000)
Stormwater Fund• Crew Leader (Hire Date: 10/1/21) 1.000• Position Transfer from Utility Fund (Hire Date: 10/1/21) 1.000
HOT Fund • Arts and Culture Associate (Hire Date: 10/1/21) 1.000
Sports Management and Tourism Funds • Sports Events Coordinator (Hire Date: 10/1/21) 1.000• Temp to FTE Conversion - Concession Worker (Hire Date: 10/1/21) 0.500• Temp to FTE Conversion (Hire Date: 10/1/21) 1.500• Temp to FTE Conversion (Hire Date: 10/1/21) 0.500
Other Funds Subtotal 6.500
Total New FTEs 52.125
Total Citywide FTEs for FY 2022 1,072.575% Change 5.1%
1 All for operating needs of 2013 voter approved bond projects
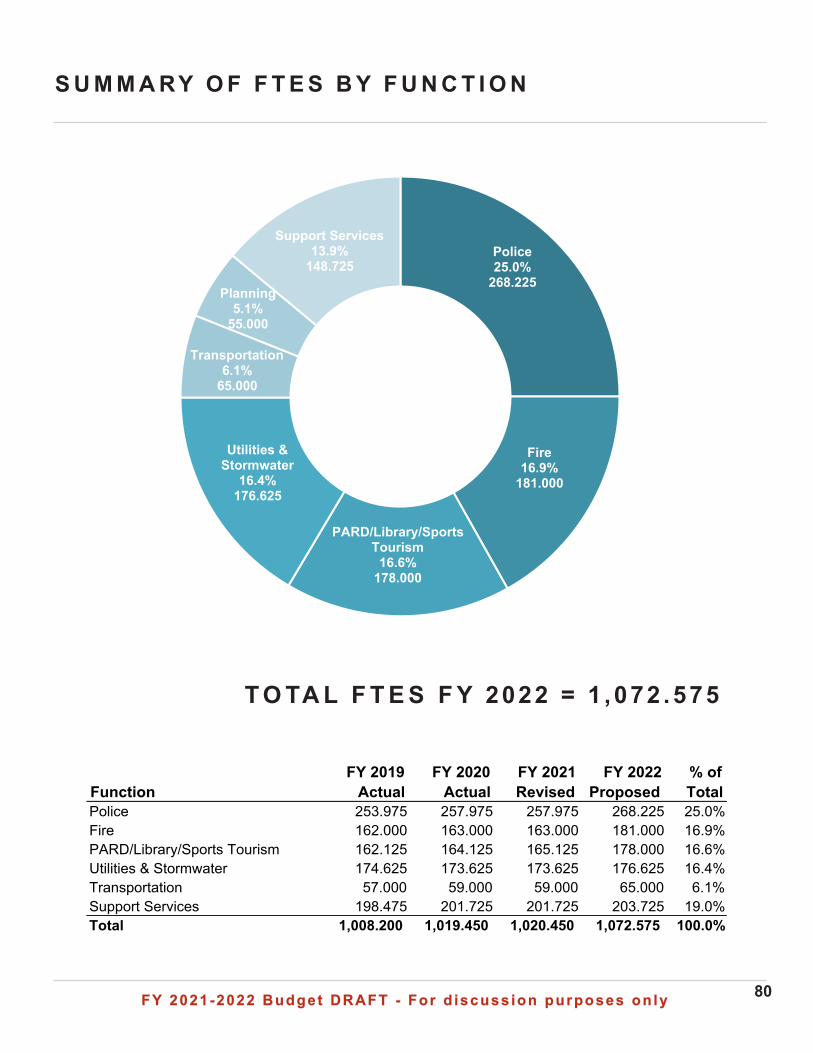
FY 2021-2022 Budget DRAFT - For d iscuss ion purposes on lyFY 2021-2022 Budget DRAFT - For d iscuss ion purposes on ly 80
S U M M A RY O F F T E S B Y F U N C T I O N
FunctionFY 2019
ActualFY 2020
ActualFY 2021 Revised
FY 2022 Proposed
% of Total
Police 253.975 257.975 257.975 268.225 25.0%Fire 162.000 163.000 163.000 181.000 16.9%PARD/Library/Sports Tourism 162.125 164.125 165.125 178.000 16.6%Utilities & Stormwater 174.625 173.625 173.625 176.625 16.4%Transportation 57.000 59.000 59.000 65.000 6.1%Support Services 198.475 201.725 201.725 203.725 19.0%Total 1,008.200 1,019.450 1,020.450 1,072.575 100.0%
T O TA L F T E S F Y 2022 = 1 ,072 .575
Police25.0%
268.225
Fire16.9%
181.000
PARD/Library/Sports Tourism
16.6%178.000
Utilities & Stormwater
16.4%176.625
Transportation6.1%
65.000
Planning5.1%
55.000
Support Services13.9%
148.725
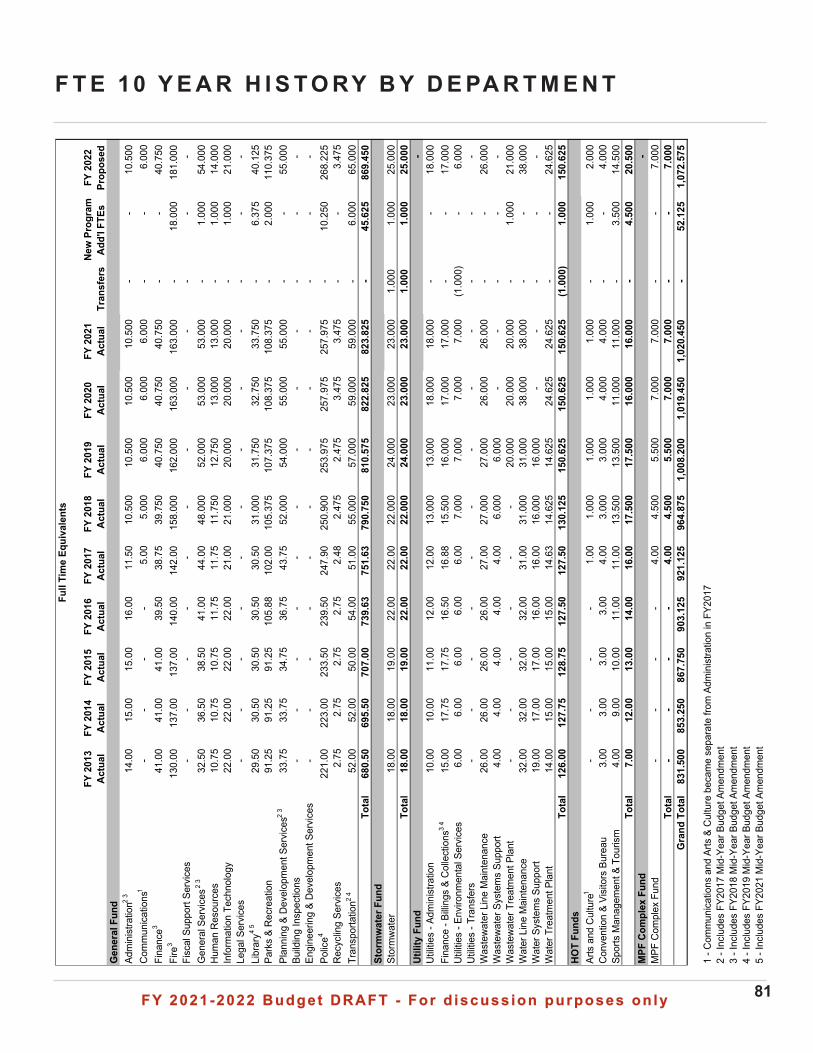
FY 2021-2022 Budget DRAFT - For d iscuss ion purposes on lyFY 2021-2022 Budget DRAFT - For d iscuss ion purposes on ly 81
F T E 10 Y E A R H I S T O RY B Y D E PA R T M E N TFY
201
3FY
201
4FY
201
5FY
201
6FY
201
7 F
Y 20
18
FY
2019
F
Y 20
20
FY
2021
Ne
w P
rogr
amFY
202
2Ac
tual
Actu
alAc
tual
Actu
alAc
tual
Act
ual
Act
ual
Act
ual
Act
ual
Tran
sfer
sAd
d'l F
TEs
Prop
osed
Gen
eral
Fun
dAd
min
istra
tion2
314
.00
15.0
0
15
.00
16.0
0
11
.50
10.5
00
10
.500
10
.500
10
.500
-
-
10
.500
C
omm
unic
atio
ns1
-
-
-
-
5.00
5.
000
6.00
0
6.00
0
6.
000
-
-
6.
000
Fi
nanc
e341
.00
41.0
0
41
.00
39.5
0
38
.75
39.7
50
40
.750
40
.750
40
.750
-
-
40
.750
Fi
re3
130.
00
13
7.00
137.
00
14
0.00
142.
00
15
8.00
0
162.
000
163.
000
163.
000
-
18
.000
181.
000
Fisc
al S
uppo
rt Se
rvic
es-
-
-
-
-
-
-
-
-
-
-
-
Gen
eral
Ser
vice
s2 3
32.5
0
36
.50
38.5
0
41
.00
44.0
0
48
.000
52.0
00
53.0
00
53.0
00
-
1.
000
54
.000
H
uman
Res
ourc
es10
.75
10.7
5
10
.75
11.7
5
11
.75
11.7
50
12
.750
13
.000
13
.000
-
1.00
0
14.0
00
Info
rmat
ion
Tech
nolo
gy22
.00
22.0
0
22
.00
22.0
0
21
.00
21.0
00
20
.000
20
.000
20
.000
-
1.00
0
21.0
00
Lega
l Ser
vice
s-
-
-
-
-
-
-
-
-
-
-
-
Libr
ary4
529
.50
30.5
0
30
.50
30.5
0
30
.50
31.0
00
31
.750
32
.750
33
.750
-
6.37
5
40.1
25
Park
s &
Rec
reat
ion
91.2
5
91
.25
91.2
5
10
5.88
102.
00
10
5.37
5
107.
375
108.
375
108.
375
-
2.
000
11
0.37
5
Pl
anni
ng &
Dev
elop
men
t Ser
vice
s2 3
33.7
5
33
.75
34.7
5
36
.75
43.7
5
52
.000
54.0
00
55.0
00
55.0
00
-
-
55.0
00
Build
ing
Insp
ectio
ns-
-
-
-
-
-
-
-
-
-
-
-
Engi
neer
ing
& D
evel
opm
ent S
ervi
ces
-
-
-
-
-
-
-
-
-
-
-
-
Po
lice4
221.
00
22
3.00
233.
50
23
9.50
247.
90
25
0.90
0
253.
975
257.
975
257.
975
-
10
.250
268.
225
Rec
yclin
g Se
rvic
es2.
75
2.75
2.
75
2.75
2.
48
2.47
5
2.
475
3.
475
3.47
5
-
-
3.47
5
Tran
spor
tatio
n2 4
52.0
0
52
.00
50.0
0
54
.00
51.0
0
55
.000
57.0
00
59.0
00
59.0
00
-
6.
000
65
.000
To
tal
680.
50
69
5.50
707.
00
73
9.63
751.
63
79
0.75
0
810.
575
822.
825
823.
825
-
45
.625
869.
450
St
orm
wat
er F
und
Stor
mw
ater
18.0
0
18
.00
19.0
0
22
.00
22.0
0
22
.000
24.0
00
23.0
00
23.0
00
1.00
0
1.
000
25
.000
To
tal
18.0
0
18
.00
19.0
0
22
.00
22.0
0
22
.000
24.0
00
23.0
00
23.0
00
1.00
0
1.
000
25
.000
Ut
ility
Fun
d-
Util
ities
- Ad
min
istra
tion
10.0
0
10
.00
11.0
0
12
.00
12.0
0
13
.000
13.0
00
18.0
00
18.0
00
-
-
18.0
00
Fina
nce
- Billi
ngs
& C
olle
ctio
ns3
415
.00
17.7
5
17
.75
16.5
0
16
.88
15.5
00
16
.000
17
.000
17
.000
-
-
17
.000
U
tiliti
es -
Envi
ronm
enta
l Ser
vice
s6.
00
6.00
6.
00
6.00
6.
00
7.00
0
7.
000
7.
000
7.00
0
(1.0
00)
-
6.
000
U
tiliti
es -
Tran
sfer
s-
-
-
-
-
-
-
-
-
-
-
-
Was
tew
ater
Lin
e M
aint
enan
ce
26.0
0
26
.00
26.0
0
26
.00
27.0
0
27
.000
27.0
00
26.0
00
26.0
00
-
-
26.0
00
Was
tew
ater
Sys
tem
s Su
ppor
t 4.
00
4.00
4.
00
4.00
4.
00
6.00
0
6.
000
-
-
-
-
-
Was
tew
ater
Tre
atm
ent P
lant
-
-
-
-
-
-
20
.000
20
.000
20
.000
-
1.00
0
21.0
00
Wat
er L
ine
Mai
nten
ance
32
.00
32.0
0
32
.00
32.0
0
31
.00
31.0
00
31
.000
38
.000
38
.000
-
-
38
.000
W
ater
Sys
tem
s Su
ppor
t 19
.00
17.0
0
17
.00
16.0
0
16
.00
16.0
00
16
.000
-
-
-
-
-
Wat
er T
reat
men
t Pla
nt
14.0
0
15
.00
15.0
0
15
.00
14.6
3
14
.625
14.6
25
24.6
25
24.6
25
-
-
24.6
25
Tota
l12
6.00
127.
75
12
8.75
127.
50
12
7.50
130.
125
15
0.62
5
15
0.62
5
15
0.62
5
(1
.000
)
1.
000
15
0.62
5
HO
T Fu
nds
Arts
and
Cul
ture
1-
-
-
-
1.
00
1.00
0
1.
000
1.
000
1.00
0
-
1.
000
2.
000
C
onve
ntio
n &
Visi
tors
Bur
eau
3.00
3.
00
3.00
3.
00
4.00
3.
000
3.00
0
4.00
0
4.
000
-
-
4.
000
Sp
orts
Man
agem
ent &
Tou
rism
4.00
9.
00
10.0
0
11
.00
11.0
0
13
.500
13.5
00
11.0
00
11.0
00
-
3.
500
14
.500
To
tal
7.00
12
.00
13.0
0
14
.00
16.0
0
17
.500
17.5
00
16.0
00
16.0
00
-
4.
500
20
.500
M
PF C
ompl
ex F
und
-
M
PF C
ompl
ex F
und
-
-
-
-
4.00
4.
500
5.50
0
7.00
0
7.
000
-
-
7.
000
To
tal
-
-
-
-
4.00
4.
500
5.50
0
7.00
0
7.
000
-
-
7.
000
G
rand
Tot
al83
1.50
0
853.
250
86
7.75
0
903.
125
92
1.12
5
964.
875
1,
008.
200
1,
019.
450
1,
020.
450
-
52.1
25
1,
072.
575
1 - C
omm
unic
atio
ns a
nd A
rts &
Cul
ture
bec
ame
sepa
rate
from
Adm
inis
tratio
n in
FY2
017
2 - I
nclu
des
FY20
17 M
id-Y
ear B
udge
t Am
endm
ent
3 - I
nclu
des
FY20
18 M
id-Y
ear B
udge
t Am
endm
ent
4 - I
nclu
des
FY20
19 M
id-Y
ear B
udge
t Am
endm
ent
5 - I
nclu
des
FY20
21 M
id-Y
ear B
udge
t Am
endm
ent
Full
Tim
e Eq
uiva
lent
s
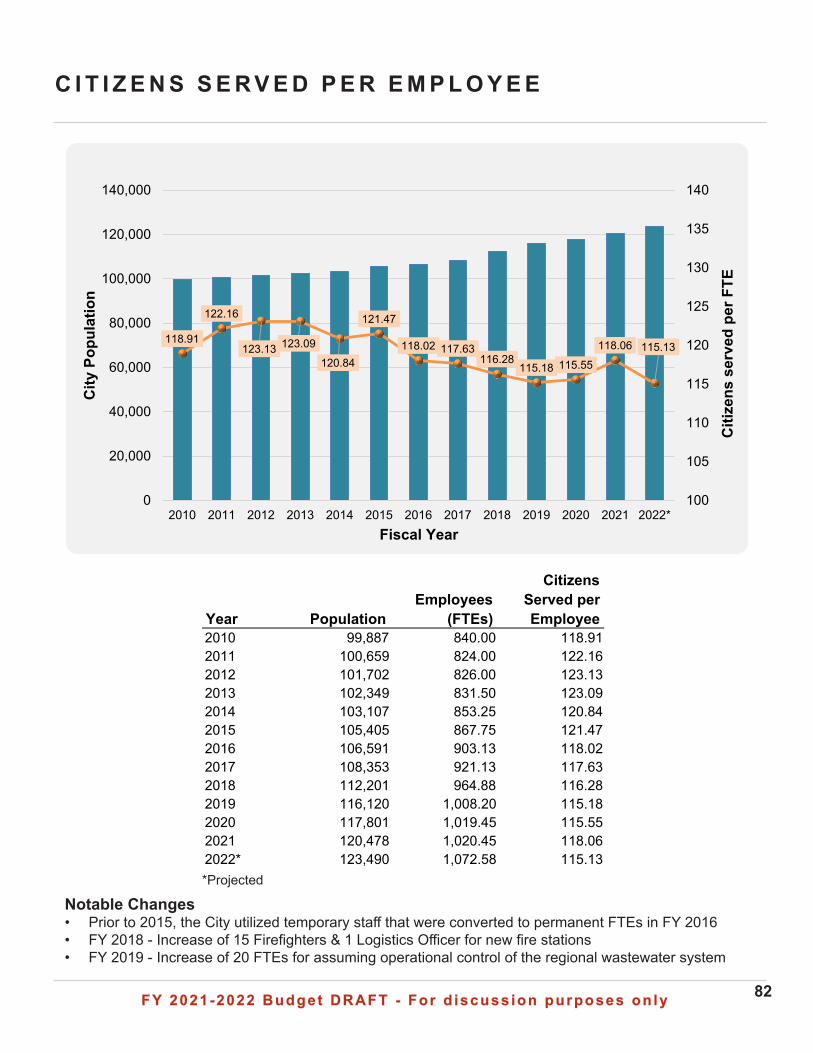
FY 2021-2022 Budget DRAFT - For d iscuss ion purposes on lyFY 2021-2022 Budget DRAFT - For d iscuss ion purposes on ly 82
C I T I Z E N S S E R V E D P E R E M P L O Y E E
Notable Changes• Prior to 2015, the City utilized temporary staff that were converted to permanent FTEs in FY 2016• FY 2018 - Increase of 15 Firefighters & 1 Logistics Officer for new fire stations• FY 2019 - Increase of 20 FTEs for assuming operational control of the regional wastewater system
Year PopulationEmployees
(FTEs)
Citizens Served per Employee
2010 99,887 840.00 118.912011 100,659 824.00 122.162012 101,702 826.00 123.132013 102,349 831.50 123.092014 103,107 853.25 120.842015 105,405 867.75 121.472016 106,591 903.13 118.022017 108,353 921.13 117.632018 112,201 964.88 116.282019 116,120 1,008.20 115.182020 117,801 1,019.45 115.552021 120,478 1,020.45 118.062022* 123,490 1,072.58 115.13
118.91
122.16
123.13 123.09
120.84
121.47
118.02 117.63116.28
115.18 115.55
118.06 115.13
100
105
110
115
120
125
130
135
140
0
20,000
40,000
60,000
80,000
100,000
120,000
140,000
2010 2011 2012 2013 2014 2015 2016 2017 2018 2019 2020 2021 2022*
Citi
zens
ser
ved
per F
TE
City
Pop
ulat
ion
Fiscal Year
*Projected
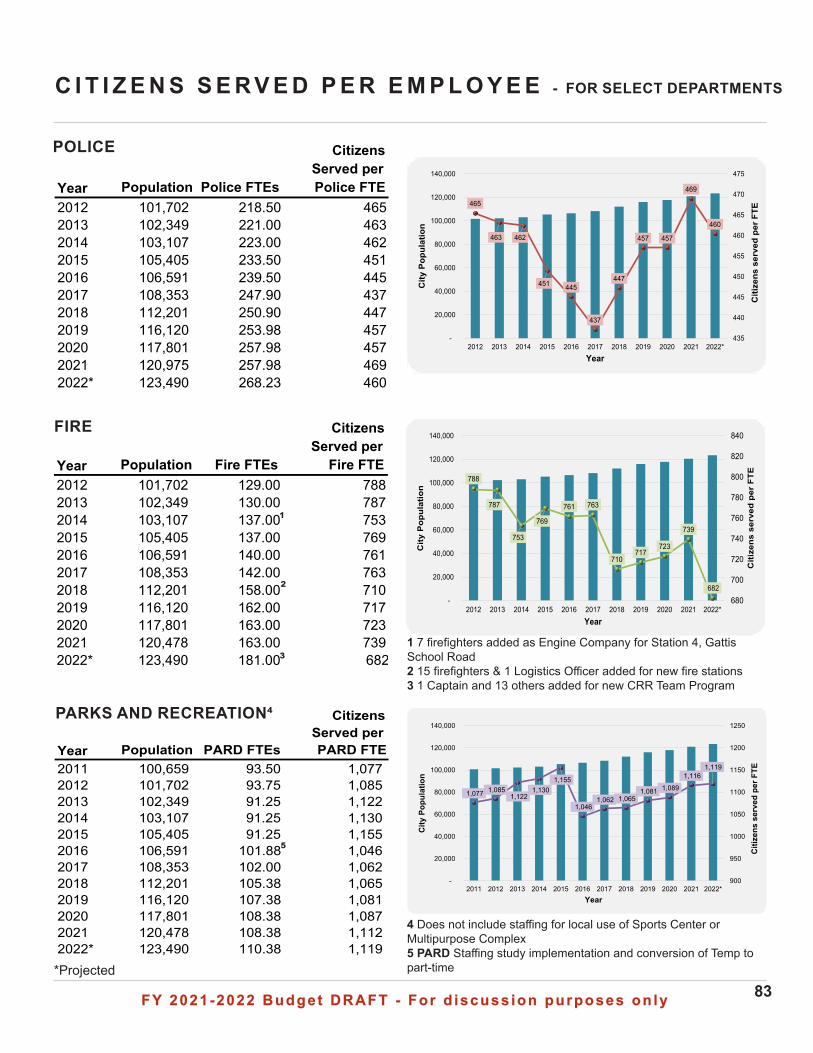
FY 2021-2022 Budget DRAFT - For d iscuss ion purposes on lyFY 2021-2022 Budget DRAFT - For d iscuss ion purposes on ly 83
Year Population Police FTEs
Citizens Served per Police FTE
2012 101,702 218.50 4652013 102,349 221.00 4632014 103,107 223.00 4622015 105,405 233.50 4512016 106,591 239.50 4452017 108,353 247.90 4372018 112,201 250.90 4472019 116,120 253.98 4572020 117,801 257.98 4572021 120,975 257.98 4692022* 123,490 268.23 460
C I T I Z E N S S E R V E D P E R E M P L O Y E E - FOR SELECT DEPARTMENTS
POLICE
Year Population PARD FTEs
Citizens Served per PARD FTE
2011 100,659 93.50 1,077 2012 101,702 93.75 1,085 2013 102,349 91.25 1,122 2014 103,107 91.25 1,130 2015 105,405 91.25 1,155 2016 106,591 101.88 1,046 2017 108,353 102.00 1,062 2018 112,201 105.38 1,065 2019 116,120 107.38 1,081 2020 117,801 108.38 1,087 2021 120,478 108.38 1,112 2022* 123,490 110.38 1,119
PARKS AND RECREATION⁴
⁵
Year Population Fire FTEs
Citizens Served per
Fire FTE2012 101,702 129.00 7882013 102,349 130.00 7872014 103,107 137.00 7532015 105,405 137.00 7692016 106,591 140.00 7612017 108,353 142.00 7632018 112,201 158.00 7102019 116,120 162.00 7172020 117,801 163.00 7232021 120,478 163.00 7392022* 123,490 181.00 682
FIRE
²
¹
1 7 firefighters added as Engine Company for Station 4, Gattis School Road2 15 firefighters & 1 Logistics Officer added for new fire stations3 1 Captain and 13 others added for new CRR Team Program
465
463 462
451 445
437
447
457 457
469
460
435
440
445
450
455
460
465
470
475
-
20,000
40,000
60,000
80,000
100,000
120,000
140,000
2012 2013 2014 2015 2016 2017 2018 2019 2020 2021 2022*
Citi
zens
ser
ved
per F
TE
City
Pop
ulat
ion
Year
788
787
753
769
761 763
710717
723
739
682 680
700
720
740
760
780
800
820
840
-
20,000
40,000
60,000
80,000
100,000
120,000
140,000
2012 2013 2014 2015 2016 2017 2018 2019 2020 2021 2022*
Citi
zens
ser
ved
per
FTE
City
Pop
ulat
ion
Year
1,077 1,085 1,122
1,130 1,155
1,046 1,062 1,065
1,081 1,089
1,116 1,119
900
950
1000
1050
1100
1150
1200
1250
-
20,000
40,000
60,000
80,000
100,000
120,000
140,000
2011 2012 2013 2014 2015 2016 2017 2018 2019 2020 2021 2022*
Citi
zens
ser
ved
per F
TE
City
Pop
ulat
ion
Year
4 Does not include staffing for local use of Sports Center or Multipurpose Complex5 PARD Staffing study implementation and conversion of Temp to part-time*Projected
³
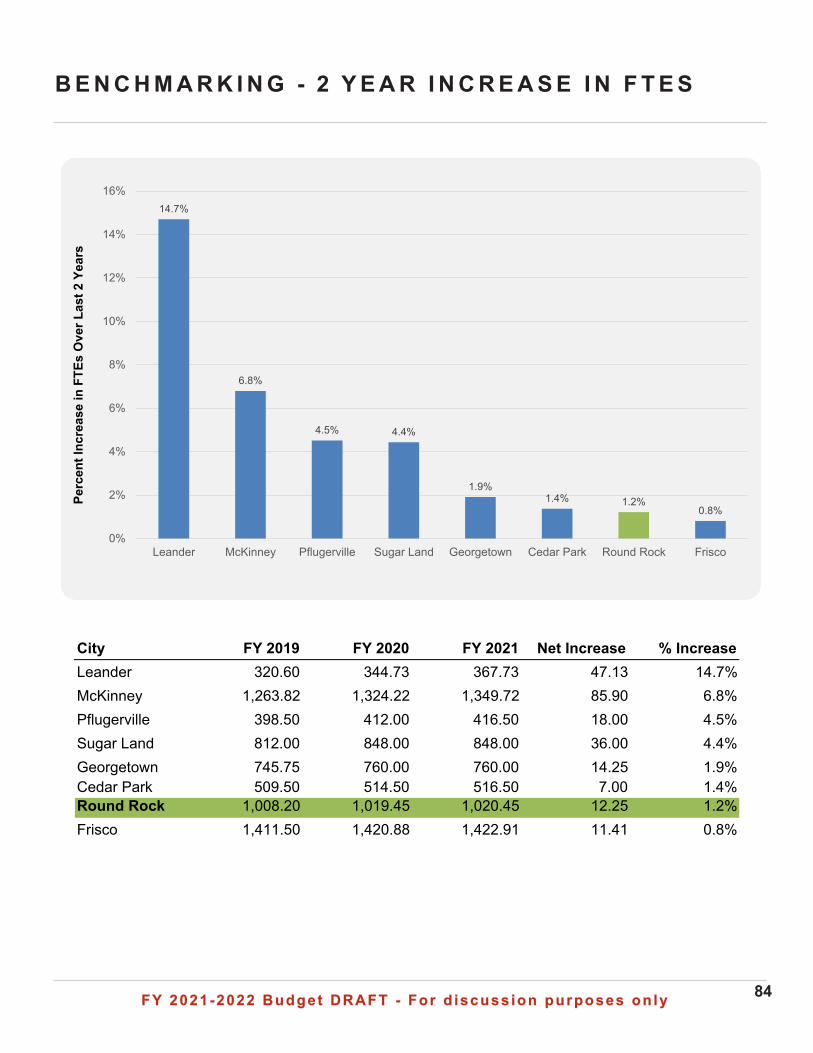
FY 2021-2022 Budget DRAFT - For d iscuss ion purposes on lyFY 2021-2022 Budget DRAFT - For d iscuss ion purposes on ly 84
B E N C H M A R K I N G - 2 Y E A R I N C R E A S E I N F T E S
14.7%
6.8%
4.5% 4.4%
1.9%1.4% 1.2%
0.8%
0%
2%
4%
6%
8%
10%
12%
14%
16%
Leander McKinney Pflugerville Sugar Land Georgetown Cedar Park Round Rock Frisco
Perc
ent I
ncre
ase
in F
TEs
Ove
r Las
t 2 Y
ears
City FY 2019 FY 2020 FY 2021 Net Increase % IncreaseLeander 320.60 344.73 367.73 47.13 14.7%McKinney 1,263.82 1,324.22 1,349.72 85.90 6.8%Pflugerville 398.50 412.00 416.50 18.00 4.5%Sugar Land 812.00 848.00 848.00 36.00 4.4%Georgetown 745.75 760.00 760.00 14.25 1.9%Cedar Park 509.50 514.50 516.50 7.00 1.4%Round Rock 1,008.20 1,019.45 1,020.45 12.25 1.2%Frisco 1,411.50 1,420.88 1,422.91 11.41 0.8%
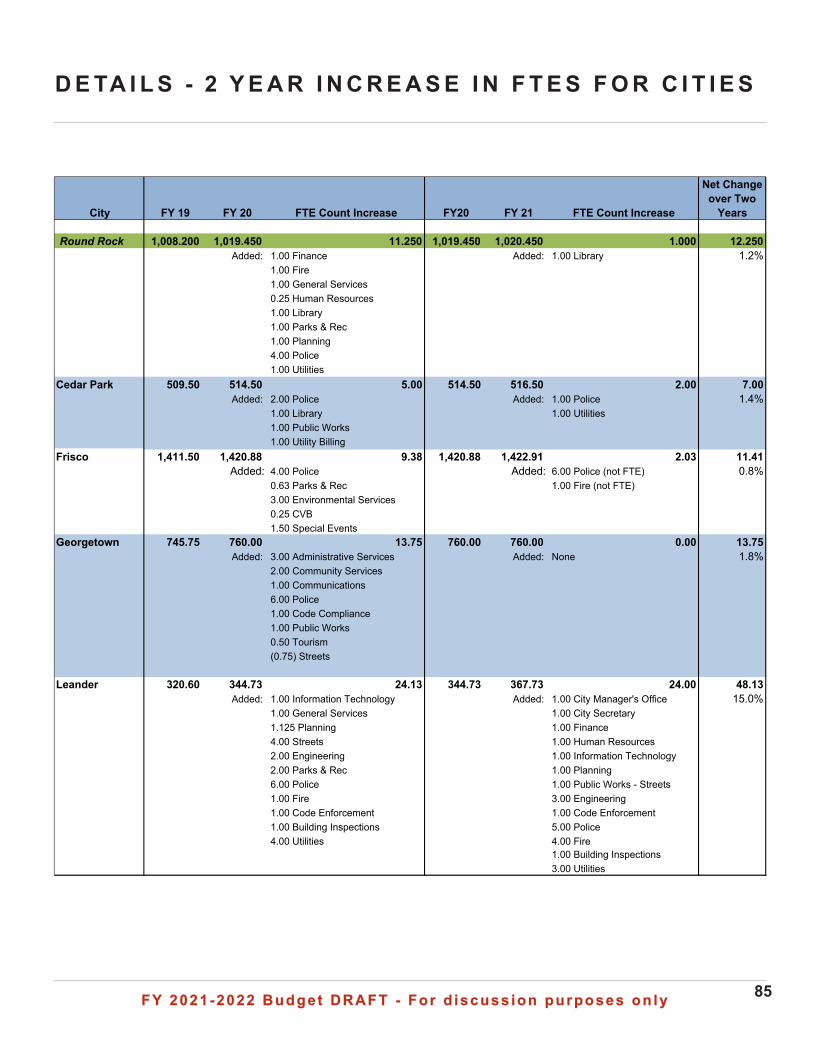
FY 2021-2022 Budget DRAFT - For d iscuss ion purposes on lyFY 2021-2022 Budget DRAFT - For d iscuss ion purposes on ly 85
D E TA I L S - 2 Y E A R I N C R E A S E I N F T E S F O R C I T I E S
City FY 19 FY 20 FTE Count Increase FY20 FY 21 FTE Count Increase
Net Change over Two
Years
Round Rock 1,008.200 1,019.450 11.250 1,019.450 1,020.450 1.000 12.250Added: 1.00 Finance Added: 1.00 Library 1.2%
1.00 Fire1.00 General Services0.25 Human Resources1.00 Library 1.00 Parks & Rec1.00 Planning4.00 Police1.00 Utilities
Cedar Park 509.50 514.50 5.00 514.50 516.50 2.00 7.00Added: 2.00 Police Added: 1.00 Police 1.4%
1.00 Library 1.00 Utilities1.00 Public Works1.00 Utility Billing
Frisco 1,411.50 1,420.88 9.38 1,420.88 1,422.91 2.03 11.41Added: 4.00 Police Added: 6.00 Police (not FTE) 0.8%
0.63 Parks & Rec 1.00 Fire (not FTE)3.00 Environmental Services0.25 CVB1.50 Special Events
Georgetown 745.75 760.00 13.75 760.00 760.00 0.00 13.75Added: 3.00 Administrative Services Added: None 1.8%
2.00 Community Services1.00 Communications6.00 Police1.00 Code Compliance1.00 Public Works0.50 Tourism(0.75) Streets
Leander 320.60 344.73 24.13 344.73 367.73 24.00 48.13Added: 1.00 Information Technology Added: 1.00 City Manager's Office 15.0%
1.00 General Services 1.00 City Secretary1.125 Planning 1.00 Finance4.00 Streets 1.00 Human Resources2.00 Engineering 1.00 Information Technology2.00 Parks & Rec 1.00 Planning6.00 Police 1.00 Public Works - Streets1.00 Fire 3.00 Engineering1.00 Code Enforcement 1.00 Code Enforcement1.00 Building Inspections 5.00 Police4.00 Utilities 4.00 Fire
1.00 Building Inspections3.00 Utilities
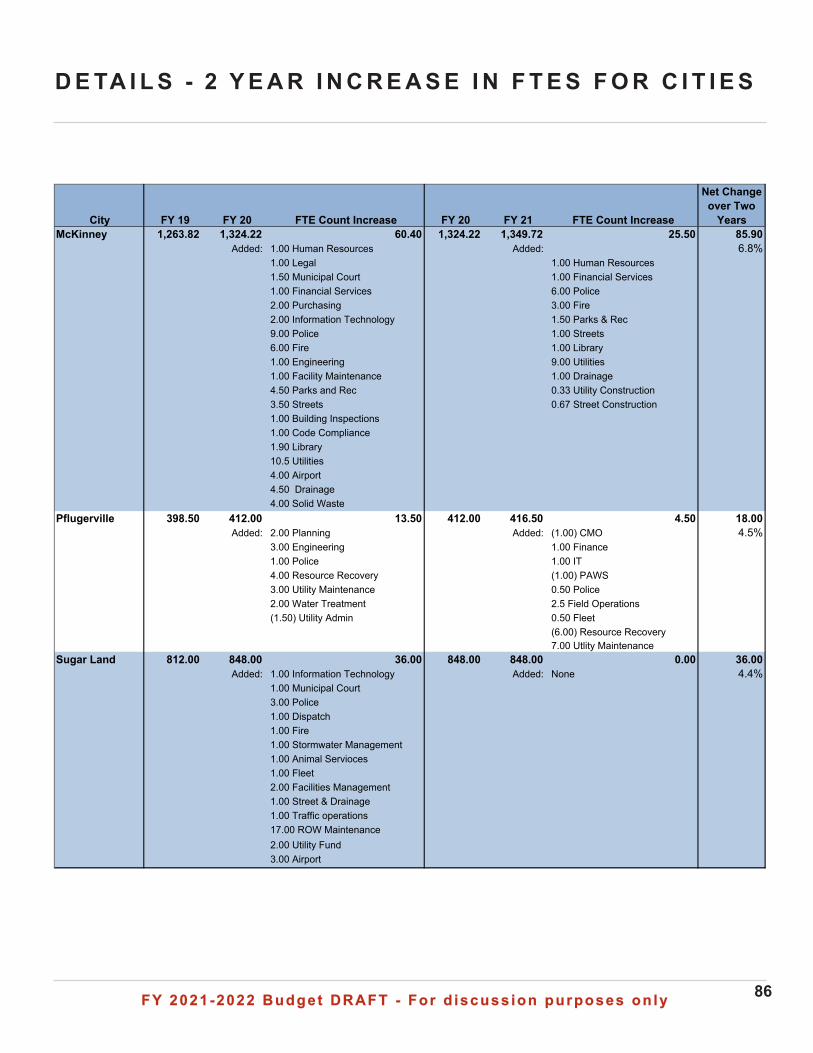
FY 2021-2022 Budget DRAFT - For d iscuss ion purposes on lyFY 2021-2022 Budget DRAFT - For d iscuss ion purposes on ly 86
D E TA I L S - 2 Y E A R I N C R E A S E I N F T E S F O R C I T I E S
City FY 19 FY 20 FTE Count Increase FY 20 FY 21 FTE Count Increase
Net Change over Two
YearsMcKinney 1,263.82 1,324.22 60.40 1,324.22 1,349.72 25.50 85.90
Added: 1.00 Human Resources Added: 6.8%1.00 Legal 1.00 Human Resources1.50 Municipal Court 1.00 Financial Services1.00 Financial Services 6.00 Police2.00 Purchasing 3.00 Fire2.00 Information Technology 1.50 Parks & Rec 9.00 Police 1.00 Streets6.00 Fire 1.00 Library1.00 Engineering 9.00 Utilities1.00 Facility Maintenance 1.00 Drainage4.50 Parks and Rec 0.33 Utility Construction3.50 Streets 0.67 Street Construction1.00 Building Inspections1.00 Code Compliance1.90 Library10.5 Utilities4.00 Airport4.50 Drainage4.00 Solid Waste
Pflugerville 398.50 412.00 13.50 412.00 416.50 4.50 18.00Added: 2.00 Planning Added: (1.00) CMO 4.5%
3.00 Engineering 1.00 Finance1.00 Police 1.00 IT4.00 Resource Recovery (1.00) PAWS3.00 Utility Maintenance 0.50 Police2.00 Water Treatment 2.5 Field Operations(1.50) Utility Admin 0.50 Fleet
(6.00) Resource Recovery7.00 Utlity Maintenance
Sugar Land 812.00 848.00 36.00 848.00 848.00 0.00 36.00Added: 1.00 Information Technology Added: None 4.4%
1.00 Municipal Court3.00 Police1.00 Dispatch1.00 Fire1.00 Stormwater Management1.00 Animal Servioces1.00 Fleet2.00 Facilities Management1.00 Street & Drainage1.00 Traffic operations17.00 ROW Maintenance2.00 Utility Fund3.00 Airport
FY 2021-2022 Budget DRAFT - For d iscuss ion purposes on lyFY 2021-2022 Budget DRAFT - For d iscuss ion purposes on ly 87
C O M M U N I T Y I N V E S T M E N T P R O G R A M
• 5 Year CIP by Use..........................................................................................88
• 5 Year CIP by Source......................................................................................89
• Major CIP Projects..........................................................................................90
• Projects & Funding Sources by Department...................................................91
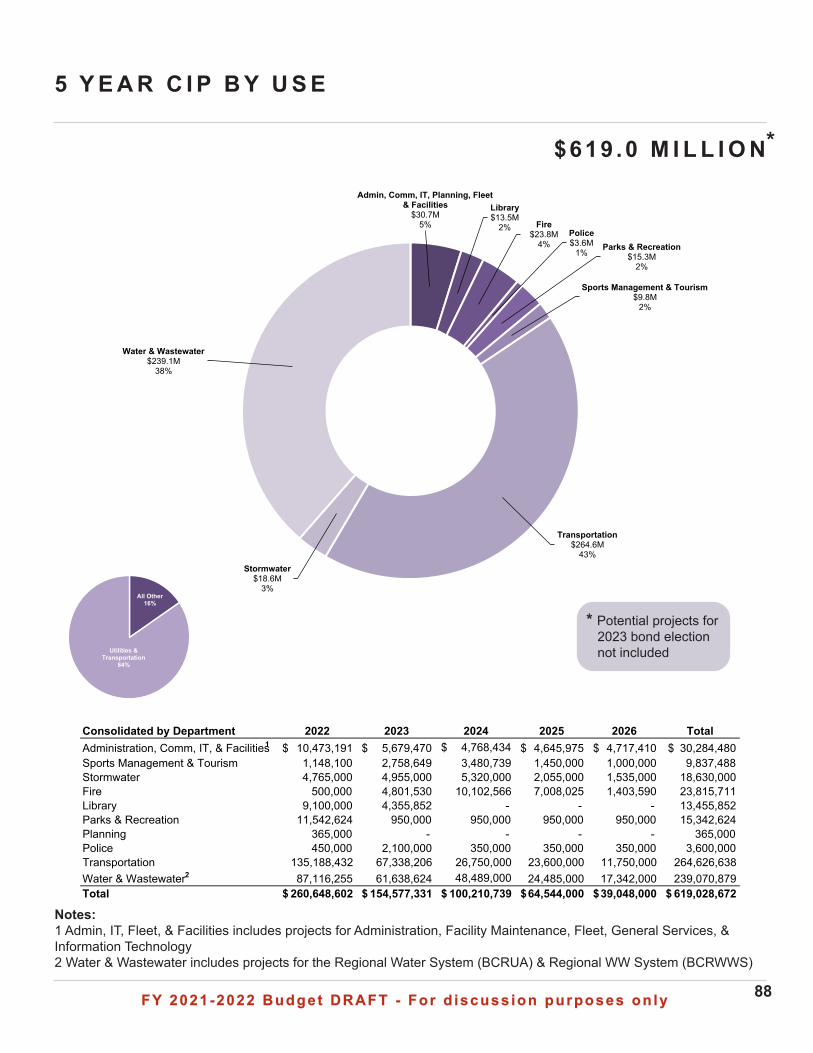
FY 2021-2022 Budget DRAFT - For d iscuss ion purposes on lyFY 2021-2022 Budget DRAFT - For d iscuss ion purposes on ly 88
Admin, Comm, IT, Planning, Fleet & Facilities
$30.7M5%
Library$13.5M
2% Fire$23.8M
4%Police$3.6M
1%Parks & Recreation
$15.3M2%
Sports Management & Tourism$9.8M
2%
Transportation$264.6M
43%Stormwater
$18.6M3%
Water & Wastewater$239.1M
38%
5 Y E A R C I P B Y U S E
$619 .0 M I L L I O N
Notes:1 Admin, IT, Fleet, & Facilities includes projects for Administration, Facility Maintenance, Fleet, General Services, & Information Technology2 Water & Wastewater includes projects for the Regional Water System (BCRUA) & Regional WW System (BCRWWS)
Consolidated by Department 2022 2023 2024 2025 2026 TotalAdministration, Comm, IT, & Facilities1 10,473,191$ 5,679,470$ 4,768,434$ 4,645,975$ 4,717,410$ 30,284,480$ Sports Management & Tourism 1,148,100 2,758,649 3,480,739 1,450,000 1,000,000 9,837,488 Stormwater 4,765,000 4,955,000 5,320,000 2,055,000 1,535,000 18,630,000 Fire 500,000 4,801,530 10,102,566 7,008,025 1,403,590 23,815,711 Library 9,100,000 4,355,852 - - - 13,455,852 Parks & Recreation 11,542,624 950,000 950,000 950,000 950,000 15,342,624 Planning 365,000 - - - - 365,000 Police 450,000 2,100,000 350,000 350,000 350,000 3,600,000 Transportation 135,188,432 67,338,206 26,750,000 23,600,000 11,750,000 264,626,638 Water & Wastewater2 87,116,255 61,638,624 48,489,000 24,485,000 17,342,000 239,070,879 Total 260,648,602$ 154,577,331$ 100,210,739$ 64,544,000$ 39,048,000$ 619,028,672$
All Other16%
Utilities & Transportation
84%
*
* Potential projects for 2023 bond election not included
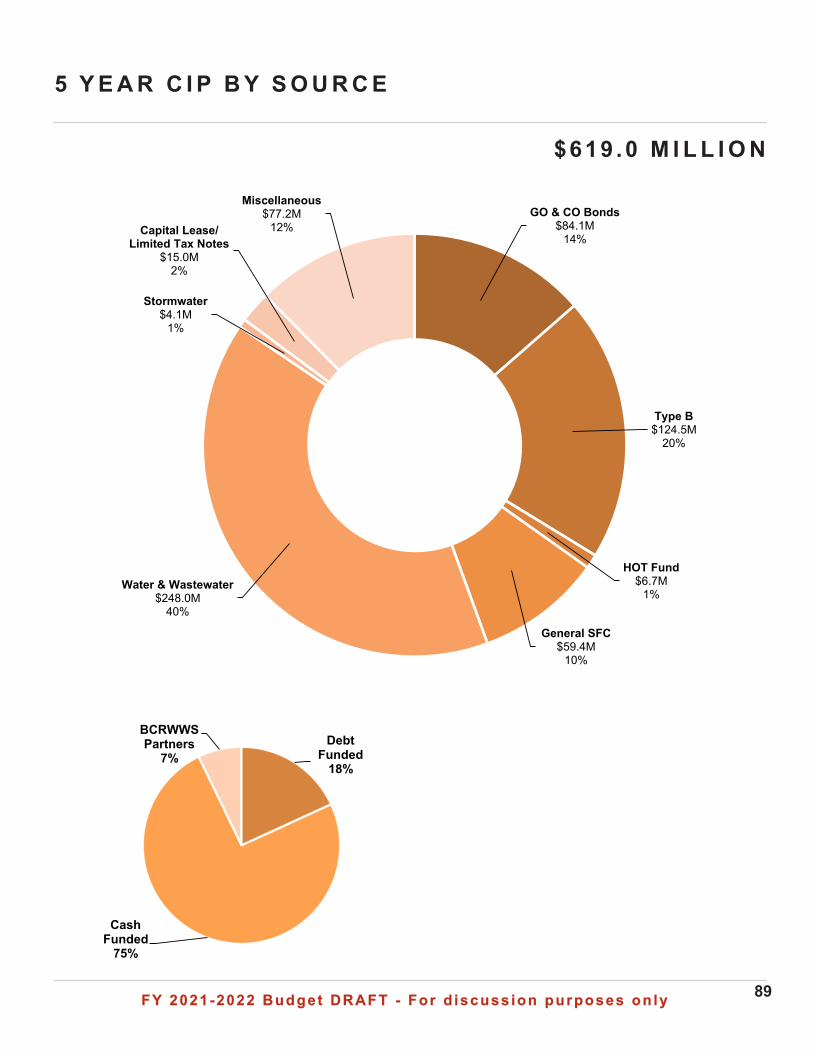
FY 2021-2022 Budget DRAFT - For d iscuss ion purposes on lyFY 2021-2022 Budget DRAFT - For d iscuss ion purposes on ly 89
5 Y E A R C I P B Y S O U R C E
$619 .0 M I L L I O N
GO & CO Bonds$84.1M
14%
Type B$124.5M
20%
HOT Fund$6.7M
1%
General SFC$59.4M
10%
Water & Wastewater$248.0M
40%
Stormwater$4.1M
1%
Capital Lease/Limited Tax Notes
$15.0M2%
Miscellaneous$77.2M
12%
Debt Funded
18%
Cash Funded
75%
BCRWWS Partners
7%
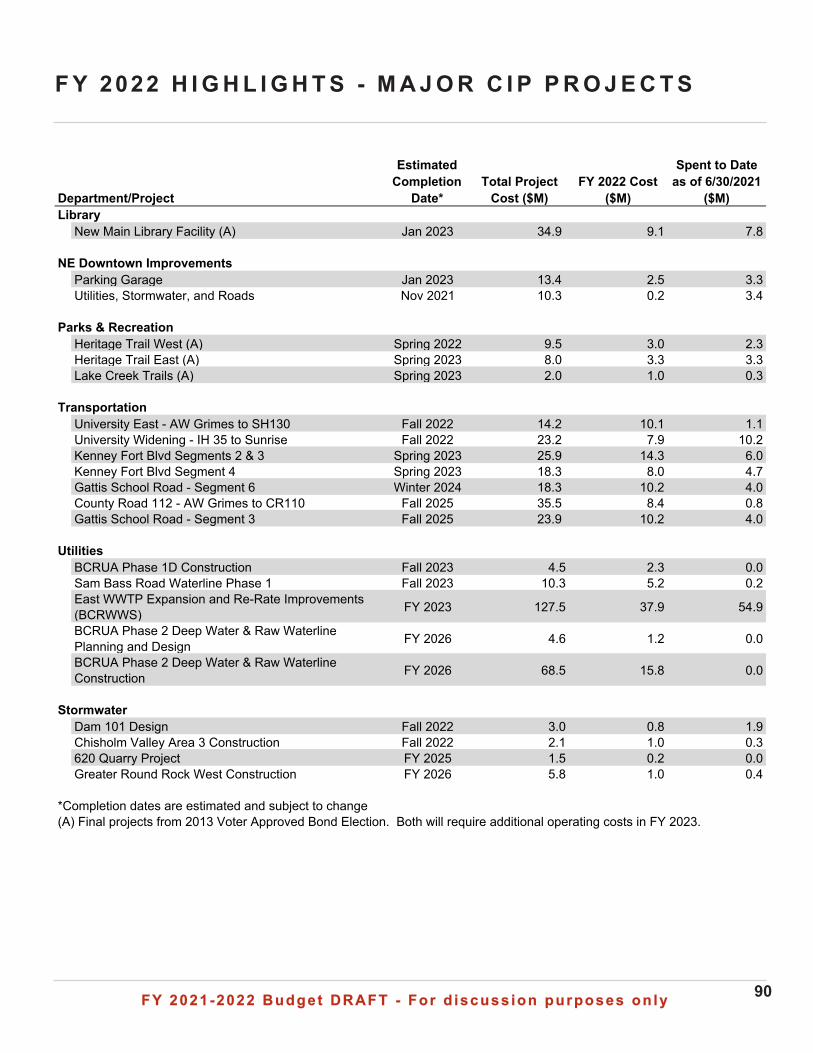
FY 2021-2022 Budget DRAFT - For d iscuss ion purposes on lyFY 2021-2022 Budget DRAFT - For d iscuss ion purposes on ly 90
F Y 2022 H I G H L I G H T S - M A J O R C I P P R O J E C T S
Department/Project
Estimated Completion
Date*Total Project
Cost ($M)FY 2022 Cost
($M)
Spent to Date as of 6/30/2021
($M)Library
New Main Library Facility (A) Jan 2023 34.9 9.1 7.8
NE Downtown ImprovementsParking Garage Jan 2023 13.4 2.5 3.3Utilities, Stormwater, and Roads Nov 2021 10.3 0.2 3.4
Parks & RecreationHeritage Trail West (A) Spring 2022 9.5 3.0 2.3Heritage Trail East (A) Spring 2023 8.0 3.3 3.3Lake Creek Trails (A) Spring 2023 2.0 1.0 0.3
TransportationUniversity East - AW Grimes to SH130 Fall 2022 14.2 10.1 1.1University Widening - IH 35 to Sunrise Fall 2022 23.2 7.9 10.2Kenney Fort Blvd Segments 2 & 3 Spring 2023 25.9 14.3 6.0Kenney Fort Blvd Segment 4 Spring 2023 18.3 8.0 4.7Gattis School Road - Segment 6 Winter 2024 18.3 10.2 4.0County Road 112 - AW Grimes to CR110 Fall 2025 35.5 8.4 0.8Gattis School Road - Segment 3 Fall 2025 23.9 10.2 4.0
UtilitiesBCRUA Phase 1D Construction Fall 2023 4.5 2.3 0.0Sam Bass Road Waterline Phase 1 Fall 2023 10.3 5.2 0.2East WWTP Expansion and Re-Rate Improvements (BCRWWS) FY 2023 127.5 37.9 54.9
BCRUA Phase 2 Deep Water & Raw Waterline Planning and Design FY 2026 4.6 1.2 0.0
BCRUA Phase 2 Deep Water & Raw Waterline Construction FY 2026 68.5 15.8 0.0
StormwaterDam 101 Design Fall 2022 3.0 0.8 1.9Chisholm Valley Area 3 Construction Fall 2022 2.1 1.0 0.3620 Quarry Project FY 2025 1.5 0.2 0.0Greater Round Rock West Construction FY 2026 5.8 1.0 0.4
*Completion dates are estimated and subject to change(A) Final projects from 2013 Voter Approved Bond Election. Both will require additional operating costs in FY 2023.
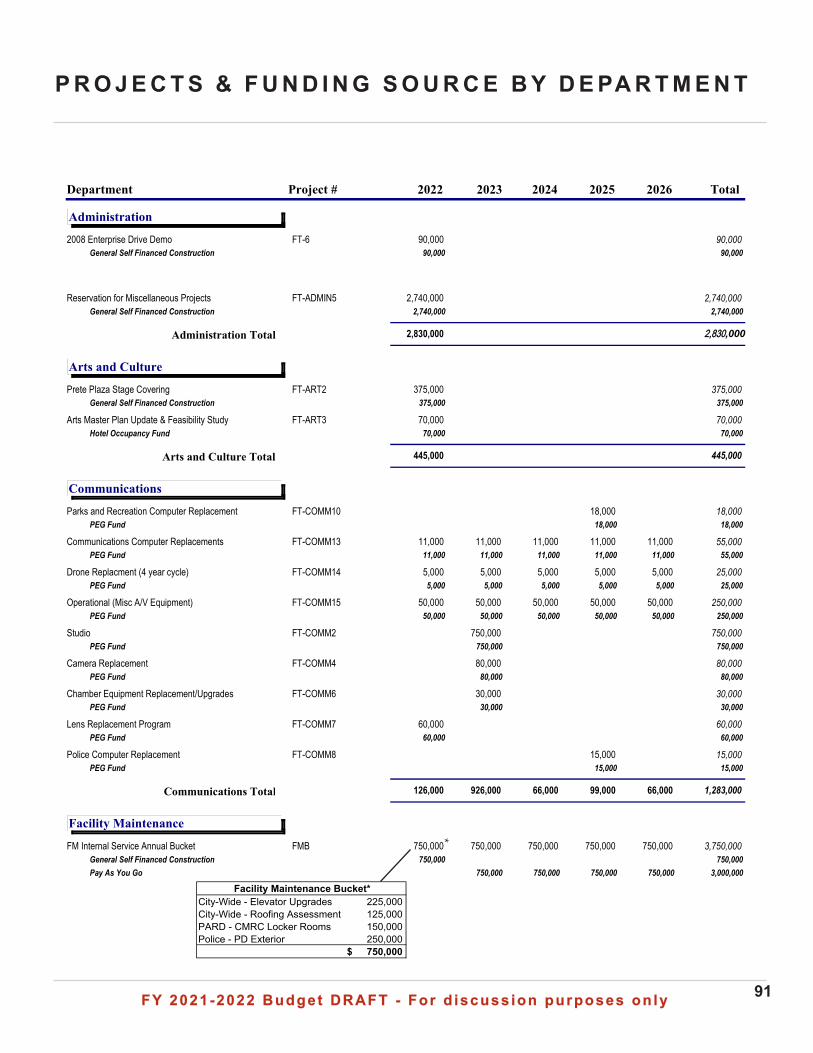
FY 2021-2022 Budget DRAFT - For d iscuss ion purposes on lyFY 2021-2022 Budget DRAFT - For d iscuss ion purposes on ly 91
P R O J E C T S & F U N D I N G S O U R C E B Y D E PA R T M E N T
Total2022 2023 2024 2025 2026Department Project #
AdministrationFT-6 90,00090,0002008 Enterprise Drive Demo
General Self Financed Construction 90,000 90,000
FT-ADMIN5 2,740,0002,740,000Reservation for Miscellaneous ProjectsGeneral Self Financed Construction 2,740,000 2,740,000
22,,883300,0002,830,000Administration Total
Arts and CultureFT-ART2 375,000375,000Prete Plaza Stage Covering
General Self Financed Construction 375,000 375,000
FT-ART3 70,00070,000Arts Master Plan Update & Feasibility StudyHotel Occupancy Fund 70,000 70,000
445,000445,000Arts and Culture Total
CommunicationsFT-COMM10 18,00018,000Parks and Recreation Computer Replacement
PEG Fund 18,000 18,000
FT-COMM13 55,00011,000 11,000 11,000 11,000 11,000Communications Computer ReplacementsPEG Fund 11,000 11,000 11,000 11,000 11,000 55,000
FT-COMM14 25,0005,000 5,000 5,000 5,000 5,000Drone Replacment (4 year cycle)PEG Fund 5,000 5,000 5,000 5,000 5,000 25,000
FT-COMM15 250,00050,000 50,000 50,000 50,000 50,000Operational (Misc A/V Equipment)PEG Fund 50,000 50,000 50,000 50,000 50,000 250,000
FT-COMM2 750,000750,000StudioPEG Fund 750,000 750,000
FT-COMM4 80,00080,000Camera ReplacementPEG Fund 80,000 80,000
FT-COMM6 30,00030,000Chamber Equipment Replacement/UpgradesPEG Fund 30,000 30,000
FT-COMM7 60,00060,000Lens Replacement ProgramPEG Fund 60,000 60,000
FT-COMM8 15,00015,000Police Computer ReplacementPEG Fund 15,000 15,000
1,283,000126,000 926,000 66,000 99,000 66,000Communications Total
Facility Maintenance
FMB 3,750,000750,000 750,000 750,000 750,000 750,000FM Internal Service Annual BucketGeneral Self Financed Construction 750,000 750,000Pay As You Go 750,000 750,000 750,000 750,000 3,000,000
City-Wide - Elevator Upgrades 225,000 City-Wide - Roofing Assessment 125,000 PARD - CMRC Locker Rooms 150,000 Police - PD Exterior 250,000
750,000$
Facility Maintenance Bucket*
*
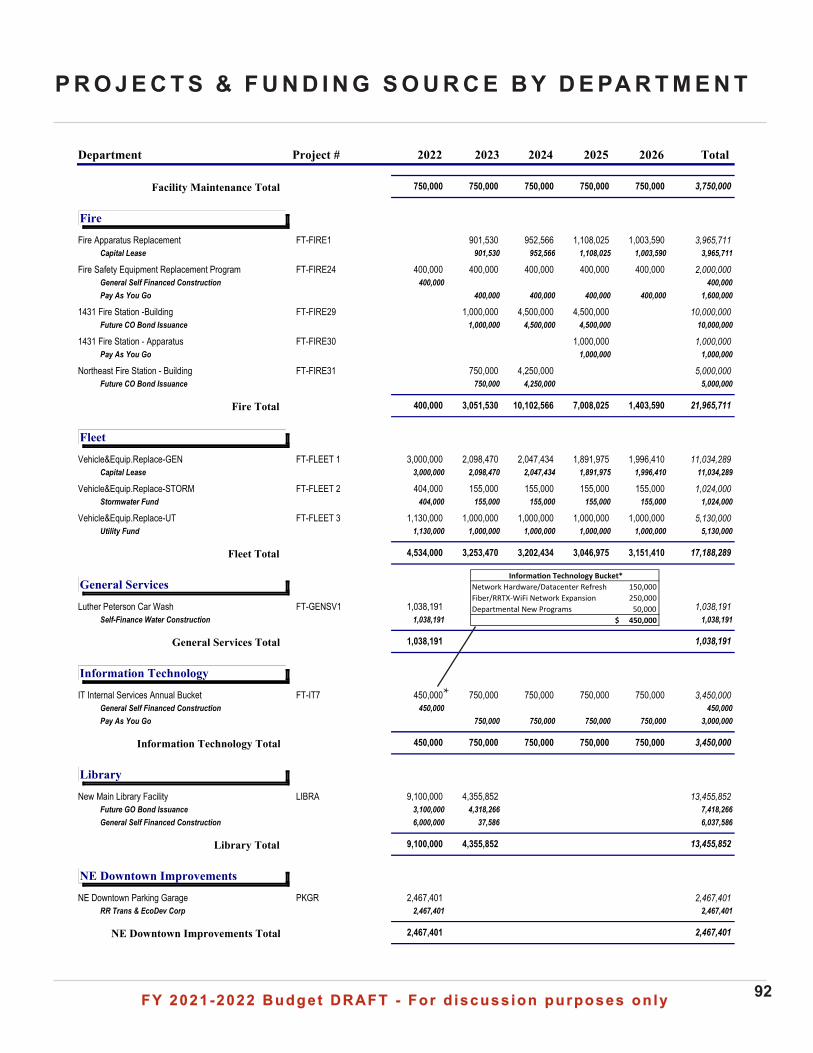
FY 2021-2022 Budget DRAFT - For d iscuss ion purposes on lyFY 2021-2022 Budget DRAFT - For d iscuss ion purposes on ly 92
P R O J E C T S & F U N D I N G S O U R C E B Y D E PA R T M E N T
Total2022 2023 2024 2025 2026Department Project #
3,750,000750,000 750,000 750,000 750,000 750,000Facility Maintenance Total
FireFT-FIRE1 3,965,711901,530 952,566 1,108,025 1,003,590Fire Apparatus Replacement
Capital Lease 901,530 952,566 1,108,025 1,003,590 3,965,711
FT-FIRE24 2,000,000400,000 400,000 400,000 400,000 400,000Fire Safety Equipment Replacement ProgramGeneral Self Financed Construction 400,000 400,000Pay As You Go 400,000 400,000 400,000 400,000 1,600,000
FT-FIRE29 10,000,0001,000,000 4,500,000 4,500,0001431 Fire Station -BuildingFuture CO Bond Issuance 1,000,000 4,500,000 4,500,000 10,000,000
FT-FIRE30 1,000,0001,000,0001431 Fire Station - ApparatusPay As You Go 1,000,000 1,000,000
FT-FIRE31 5,000,000750,000 4,250,000Northeast Fire Station - BuildingFuture CO Bond Issuance 750,000 4,250,000 5,000,000
21,965,711400,000 3,051,530 10,102,566 7,008,025 1,403,590Fire Total
Fleet
FT-FLEET 1 11,034,2893,000,000 2,098,470 2,047,434 1,891,975 1,996,410Vehicle&Equip.Replace-GENCapital Lease 3,000,000 2,098,470 2,047,434 1,891,975 1,996,410 11,034,289
FT-FLEET 2 1,024,000404,000 155,000 155,000 155,000 155,000Vehicle&Equip.Replace-STORMStormwater Fund 404,000 155,000 155,000 155,000 155,000 1,024,000
FT-FLEET 3 5,130,0001,130,000 1,000,000 1,000,000 1,000,000 1,000,000Vehicle&Equip.Replace-UTUtility Fund 1,130,000 1,000,000 1,000,000 1,000,000 1,000,000 5,130,000
17,188,2894,534,000 3,253,470 3,202,434 3,046,975 3,151,410Fleet Total
General Services
FT-GENSV1 1,038,1911,038,191Luther Peterson Car WashSelf-Finance Water Construction 1,038,191 1,038,191
1,038,1911,038,191General Services Total
Information TechnologyFT-IT7 3,450,000450,000 750,000 750,000 750,000 750,000IT Internal Services Annual Bucket
General Self Financed Construction 450,000 450,000Pay As You Go 750,000 750,000 750,000 750,000 3,000,000
3,450,000450,000 750,000 750,000 750,000 750,000Information Technology Total
LibraryLIBRA 13,455,8529,100,000 4,355,852New Main Library Facility
Future GO Bond Issuance 3,100,000 4,318,266 7,418,266General Self Financed Construction 6,000,000 37,586 6,037,586
13,455,8529,100,000 4,355,852Library Total
NE Downtown ImprovementsPKGR 2,467,4012,467,401NE Downtown Parking Garage
RR Trans & EcoDev Corp 2,467,401 2,467,401
2,467,4012,467,401NE Downtown Improvements Total
Network Hardware/Datacenter Refresh 150,000 Fiber/RRTX-WiFi Network Expansion 250,000 Departmental New Programs 50,000
450,000$
Informa�on Technology Bucket*
*
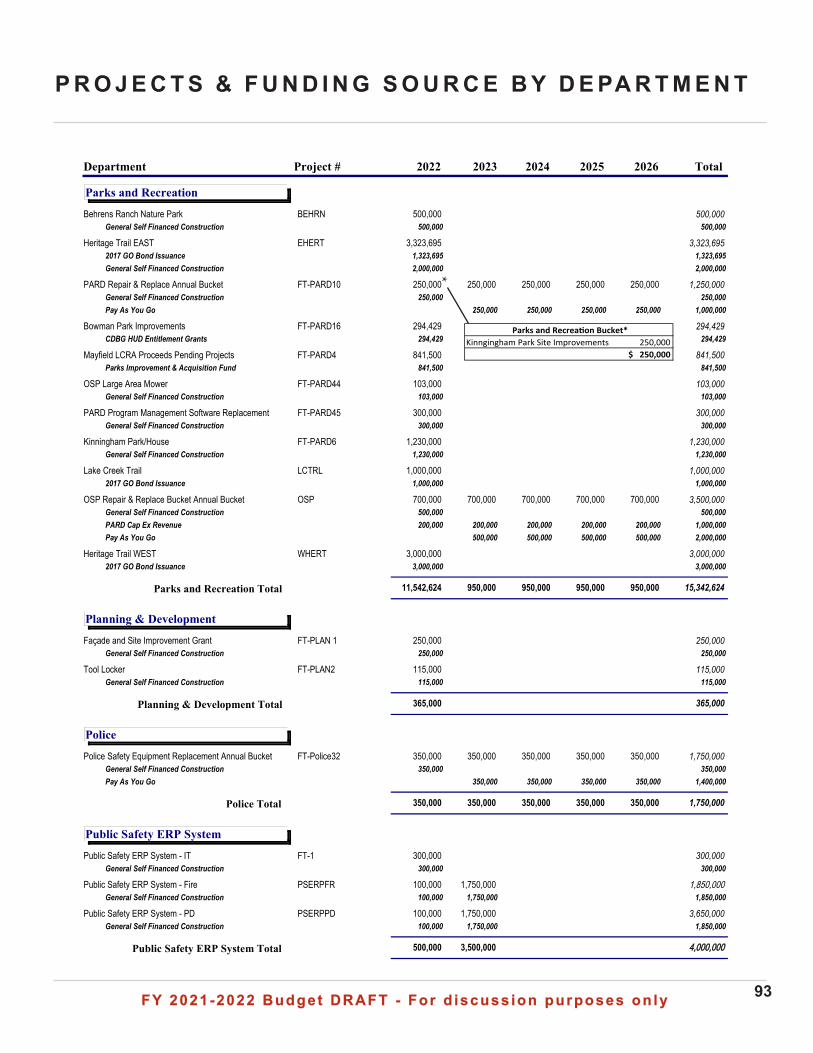
FY 2021-2022 Budget DRAFT - For d iscuss ion purposes on lyFY 2021-2022 Budget DRAFT - For d iscuss ion purposes on ly 93
P R O J E C T S & F U N D I N G S O U R C E B Y D E PA R T M E N T
Total2022 2023 2024 2025 2026Department Project #
Parks and RecreationBEHRN 500,000500,000Behrens Ranch Nature Park
General Self Financed Construction 500,000 500,000
EHERT 3,323,6953,323,695Heritage Trail EAST2017 GO Bond Issuance 1,323,695 1,323,695General Self Financed Construction 2,000,000 2,000,000
FT-PARD10 1,250,000250,000 250,000 250,000 250,000 250,000PARD Repair & Replace Annual BucketGeneral Self Financed Construction 250,000 250,000Pay As You Go 250,000 250,000 250,000 250,000 1,000,000
FT-PARD16 294,429294,429Bowman Park ImprovementsCDBG HUD Entitlement Grants 294,429 294,429
FT-PARD4 841,500841,500Mayfield LCRA Proceeds Pending ProjectsParks Improvement & Acquisition Fund 841,500 841,500
FT-PARD44 103,000103,000OSP Large Area MowerGeneral Self Financed Construction 103,000 103,000
FT-PARD45 300,000300,000PARD Program Management Software ReplacementGeneral Self Financed Construction 300,000 300,000
FT-PARD6 1,230,0001,230,000Kinningham Park/HouseGeneral Self Financed Construction 1,230,000 1,230,000
LCTRL 1,000,0001,000,000Lake Creek Trail2017 GO Bond Issuance 1,000,000 1,000,000
OSP 3,500,000700,000 700,000 700,000 700,000 700,000OSP Repair & Replace Bucket Annual BucketGeneral Self Financed Construction 500,000 500,000PARD Cap Ex Revenue 200,000 200,000 200,000 200,000 200,000 1,000,000Pay As You Go 500,000 500,000 500,000 500,000 2,000,000
WHERT 3,000,0003,000,000Heritage Trail WEST2017 GO Bond Issuance 3,000,000 3,000,000
15,342,62411,542,624 950,000 950,000 950,000 950,000Parks and Recreation Total
Planning & DevelopmentFT-PLAN 1 250,000250,000Façade and Site Improvement Grant
General Self Financed Construction 250,000 250,000
FT-PLAN2 115,000115,000Tool LockerGeneral Self Financed Construction 115,000 115,000
365,000365,000Planning & Development Total
PoliceFT-Police32 1,750,000350,000 350,000 350,000 350,000 350,000Police Safety Equipment Replacement Annual Bucket
General Self Financed Construction 350,000 350,000Pay As You Go 350,000 350,000 350,000 350,000 1,400,000
1,750,000350,000 350,000 350,000 350,000 350,000Police Total
Public Safety ERP SystemFT-1 300,000300,000Public Safety ERP System - IT
General Self Financed Construction 300,000 300,000
PSERPFR 1,850,000100,000 1,750,000Public Safety ERP System - FireGeneral Self Financed Construction 100,000 1,750,000 1,850,000
PSERPPD 3,650,000100,000 1,750,000Public Safety ERP System - PDGeneral Self Financed Construction 100,000 1,750,000 1,850,000
44,,000000,,000000500,000 3,500,000Public Safety ERP System Total
Kinngingham Park Site Improvements 250,000 250,000$
Parks and Recrea�on Bucket*
*
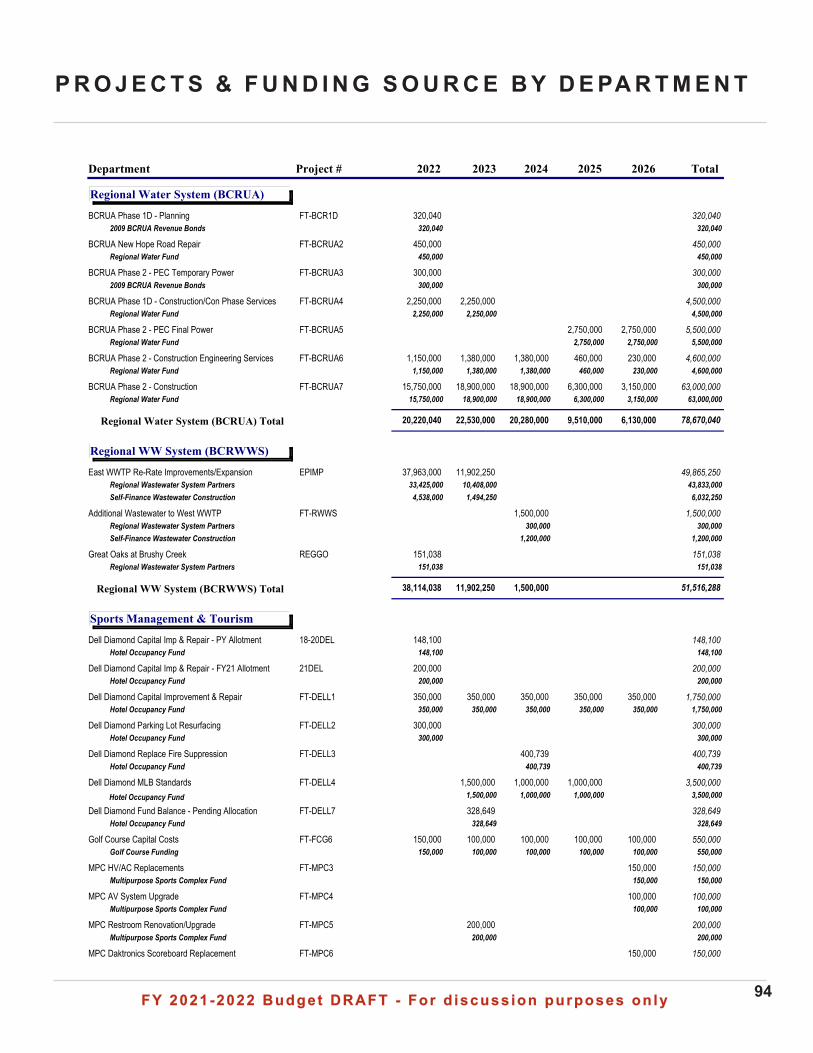
FY 2021-2022 Budget DRAFT - For d iscuss ion purposes on lyFY 2021-2022 Budget DRAFT - For d iscuss ion purposes on ly 94
P R O J E C T S & F U N D I N G S O U R C E B Y D E PA R T M E N T
Total2022 2023 2024 2025 2026Department Project #
Regional Water System (BCRUA)FT-BCR1D 320,040320,040BCRUA Phase 1D - Planning
2009 BCRUA Revenue Bonds 320,040 320,040
FT-BCRUA2 450,000450,000BCRUA New Hope Road RepairRegional Water Fund 450,000 450,000
FT-BCRUA3 300,000300,000BCRUA Phase 2 - PEC Temporary Power2009 BCRUA Revenue Bonds 300,000 300,000
FT-BCRUA4 4,500,0002,250,000 2,250,000BCRUA Phase 1D - Construction/Con Phase ServicesRegional Water Fund 2,250,000 2,250,000 4,500,000
FT-BCRUA5 5,500,0002,750,000 2,750,000BCRUA Phase 2 - PEC Final PowerRegional Water Fund 2,750,000 2,750,000 5,500,000
FT-BCRUA6 4,600,0001,150,000 1,380,000 1,380,000 460,000 230,000BCRUA Phase 2 - Construction Engineering ServicesRegional Water Fund 1,150,000 1,380,000 1,380,000 460,000 230,000 4,600,000
FT-BCRUA7 63,000,00015,750,000 18,900,000 18,900,000 6,300,000 3,150,000BCRUA Phase 2 - ConstructionRegional Water Fund 15,750,000 18,900,000 18,900,000 6,300,000 3,150,000 63,000,000
78,670,04020,220,040 22,530,000 20,280,000 9,510,000 6,130,000Regional Water System (BCRUA) Total
Regional WW System (BCRWWS)EPIMP 49,865,25037,963,000 11,902,250East WWTP Re-Rate Improvements/Expansion
Regional Wastewater System Partners 33,425,000 10,408,000 43,833,000Self-Finance Wastewater Construction 4,538,000 1,494,250 6,032,250
FT-RWWS 1,500,0001,500,000Additional Wastewater to West WWTPRegional Wastewater System Partners 300,000 300,000Self-Finance Wastewater Construction 1,200,000 1,200,000
REGGO 151,038151,038Great Oaks at Brushy CreekRegional Wastewater System Partners 151,038 151,038
51,516,28838,114,038 11,902,250 1,500,000Regional WW System (BCRWWS) Total
Sports Management & Tourism18-20DEL 148,100148,100Dell Diamond Capital Imp & Repair - PY Allotment
Hotel Occupancy Fund 148,100 148,100
21DEL 200,000200,000Dell Diamond Capital Imp & Repair - FY21 AllotmentHotel Occupancy Fund 200,000 200,000
FT-DELL1 1,750,000350,000 350,000 350,000 350,000 350,000Dell Diamond Capital Improvement & RepairHotel Occupancy Fund 350,000 350,000 350,000 350,000 350,000 1,750,000
FT-DELL2 300,000300,000Dell Diamond Parking Lot ResurfacingHotel Occupancy Fund 300,000 300,000
FT-DELL3 400,739400,739Dell Diamond Replace Fire SuppressionHotel Occupancy Fund 400,739 400,739
FT-DELL4 3,500,0001,500,000 1,000,000 1,000,000Dell Diamond MLB Standards1,500,000 1,000,000 1,000,000 3,500,000
FT-DELL7 328,649328,649Dell Diamond Fund Balance - Pending AllocationHotel Occupancy Fund 328,649 328,649
FT-FCG6 550,000150,000 100,000 100,000 100,000 100,000Golf Course Capital CostsGolf Course Funding 150,000 100,000 100,000 100,000 100,000 550,000
FT-MPC3 150,000150,000MPC HV/AC ReplacementsMultipurpose Sports Complex Fund 150,000 150,000
FT-MPC4 100,000100,000MPC AV System UpgradeMultipurpose Sports Complex Fund 100,000 100,000
FT-MPC5 200,000200,000MPC Restroom Renovation/UpgradeMultipurpose Sports Complex Fund 200,000 200,000
FT-MPC6 150,000150,000MPC Daktronics Scoreboard Replacement
Hotel Occupancy Fund
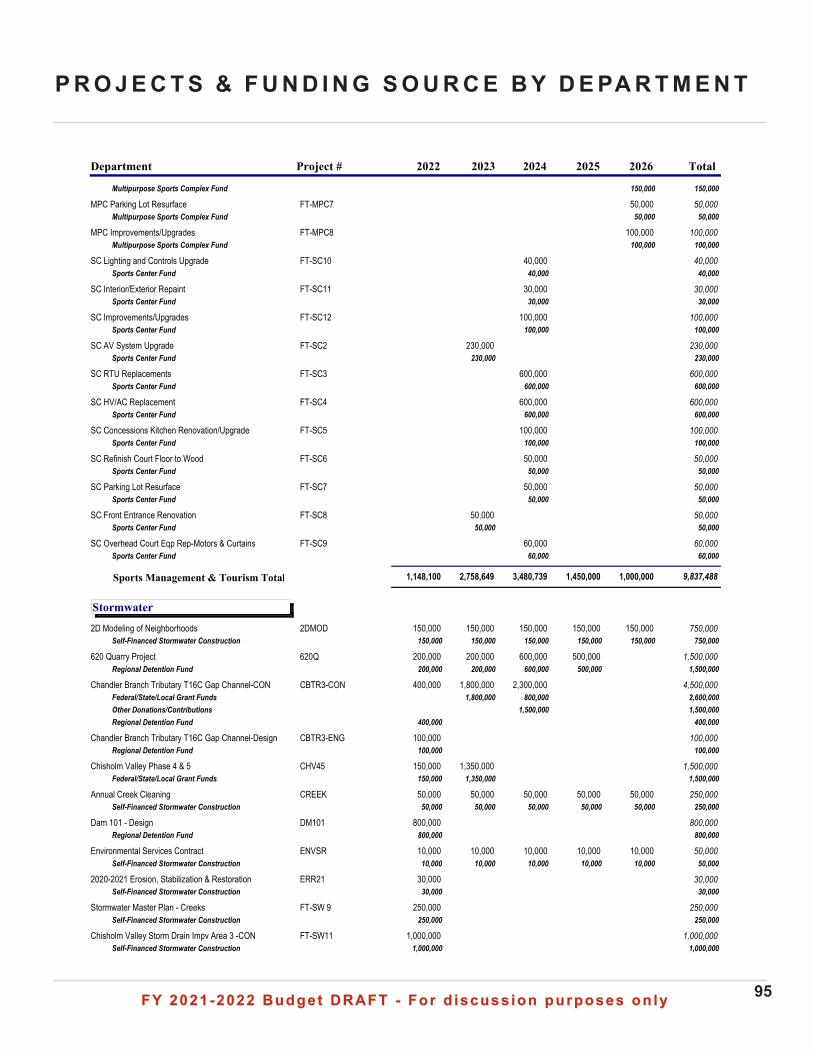
FY 2021-2022 Budget DRAFT - For d iscuss ion purposes on lyFY 2021-2022 Budget DRAFT - For d iscuss ion purposes on ly 95
P R O J E C T S & F U N D I N G S O U R C E B Y D E PA R T M E N T
Total2022 2023 2024 2025 2026Department Project #
Multipurpose Sports Complex Fund 150,000 150,000
FT-MPC7 50,00050,000MPC Parking Lot ResurfaceMultipurpose Sports Complex Fund 50,000 50,000
FT-MPC8 100,000100,000MPC Improvements/UpgradesMultipurpose Sports Complex Fund 100,000 100,000
FT-SC10 40,00040,000SC Lighting and Controls UpgradeSports Center Fund 40,000 40,000
FT-SC11 30,00030,000SC Interior/Exterior RepaintSports Center Fund 30,000 30,000
FT-SC12 100,000100,000SC Improvements/UpgradesSports Center Fund 100,000 100,000
FT-SC2 230,000230,000SC AV System UpgradeSports Center Fund 230,000 230,000
FT-SC3 600,000600,000SC RTU ReplacementsSports Center Fund 600,000 600,000
FT-SC4 600,000600,000SC HV/AC ReplacementSports Center Fund 600,000 600,000
FT-SC5 100,000100,000SC Concessions Kitchen Renovation/UpgradeSports Center Fund 100,000 100,000
FT-SC6 50,00050,000SC Refinish Court Floor to WoodSports Center Fund 50,000 50,000
FT-SC7 50,00050,000SC Parking Lot ResurfaceSports Center Fund 50,000 50,000
FT-SC8 50,00050,000SC Front Entrance RenovationSports Center Fund 50,000 50,000
FT-SC9 60,00060,000SC Overhead Court Eqp Rep-Motors & CurtainsSports Center Fund 60,000 60,000
9,837,4881,148,100 2,758,649 3,480,739 1,450,000 1,000,000Sports Management & Tourism Total
Stormwater2DMOD 750,000150,000 150,000 150,000 150,000 150,0002D Modeling of Neighborhoods
Self-Financed Stormwater Construction 150,000 150,000 150,000 150,000 150,000 750,000
620Q 1,500,000200,000 200,000 600,000 500,000620 Quarry ProjectRegional Detention Fund 200,000 200,000 600,000 500,000 1,500,000
CBTR3-CON 4,500,000400,000 1,800,000 2,300,000Chandler Branch Tributary T16C Gap Channel-CONFederal/State/Local Grant Funds 1,800,000 800,000 2,600,000Other Donations/Contributions 1,500,000 1,500,000Regional Detention Fund 400,000 400,000
CBTR3-ENG 100,000100,000Chandler Branch Tributary T16C Gap Channel-DesignRegional Detention Fund 100,000 100,000
CHV45 1,500,000150,000 1,350,000Chisholm Valley Phase 4 & 5Federal/State/Local Grant Funds 150,000 1,350,000 1,500,000
CREEK 250,00050,000 50,000 50,000 50,000 50,000Annual Creek CleaningSelf-Financed Stormwater Construction 50,000 50,000 50,000 50,000 50,000 250,000
DM101 800,000800,000Dam 101 - DesignRegional Detention Fund 800,000 800,000
ENVSR 50,00010,000 10,000 10,000 10,000 10,000Environmental Services ContractSelf-Financed Stormwater Construction 10,000 10,000 10,000 10,000 10,000 50,000
ERR21 30,00030,0002020-2021 Erosion, Stabilization & RestorationSelf-Financed Stormwater Construction 30,000 30,000
FT-SW 9 250,000250,000Stormwater Master Plan - CreeksSelf-Financed Stormwater Construction 250,000 250,000
FT-SW11 1,000,0001,000,000Chisholm Valley Storm Drain Impv Area 3 -CONSelf-Financed Stormwater Construction 1,000,000 1,000,000
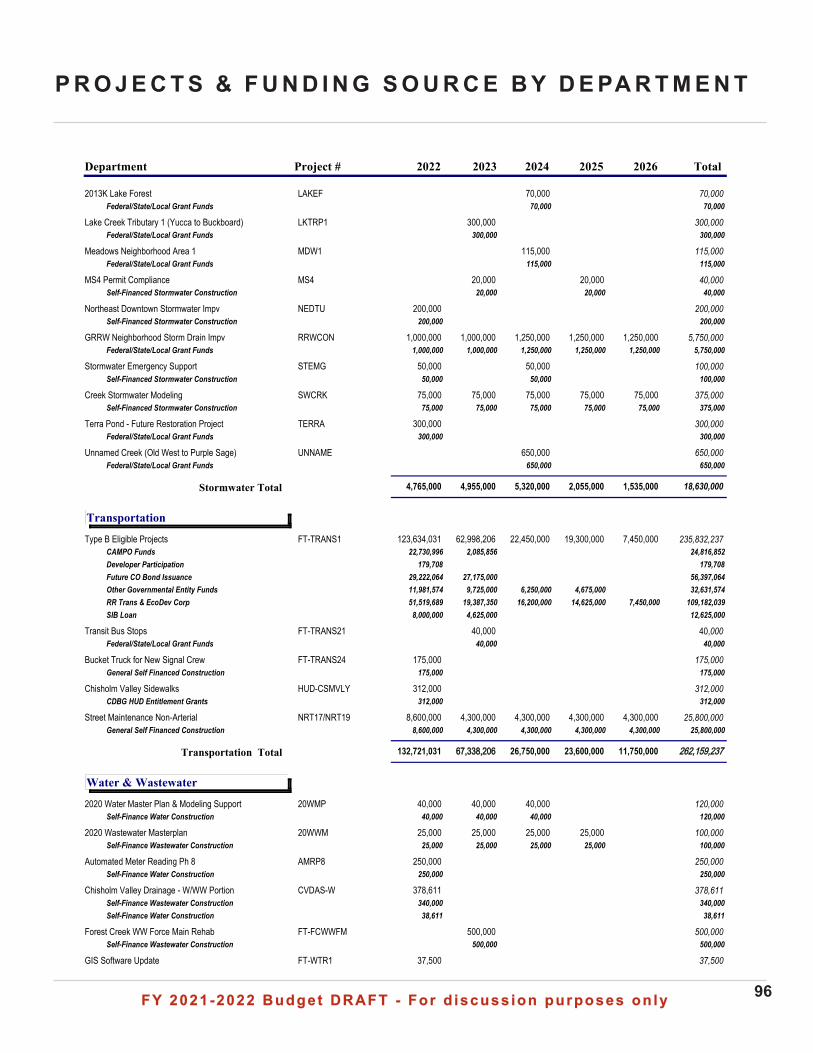
FY 2021-2022 Budget DRAFT - For d iscuss ion purposes on lyFY 2021-2022 Budget DRAFT - For d iscuss ion purposes on ly 96
P R O J E C T S & F U N D I N G S O U R C E B Y D E PA R T M E N T
Total2022 2023 2024 2025 2026Department Project #
LAKEF 70,00070,0002013K Lake ForestFederal/State/Local Grant Funds 70,000 70,000
LKTRP1 300,000300,000Lake Creek Tributary 1 (Yucca to Buckboard)Federal/State/Local Grant Funds 300,000 300,000
MDW1 115,000115,000Meadows Neighborhood Area 1Federal/State/Local Grant Funds 115,000 115,000
MS4 40,00020,000 20,000MS4 Permit ComplianceSelf-Financed Stormwater Construction 20,000 20,000 40,000
NEDTU 200,000200,000Northeast Downtown Stormwater ImpvSelf-Financed Stormwater Construction 200,000 200,000
RRWCON 5,750,0001,000,000 1,000,000 1,250,000 1,250,000 1,250,000GRRW Neighborhood Storm Drain ImpvFederal/State/Local Grant Funds 1,000,000 1,000,000 1,250,000 1,250,000 1,250,000 5,750,000
STEMG 100,00050,000 50,000Stormwater Emergency SupportSelf-Financed Stormwater Construction 50,000 50,000 100,000
SWCRK 375,00075,000 75,000 75,000 75,000 75,000Creek Stormwater ModelingSelf-Financed Stormwater Construction 75,000 75,000 75,000 75,000 75,000 375,000
TERRA 300,000300,000Terra Pond - Future Restoration ProjectFederal/State/Local Grant Funds 300,000 300,000
UNNAME 650,000650,000Unnamed Creek (Old West to Purple Sage)Federal/State/Local Grant Funds 650,000 650,000
18,630,0004,765,000 4,955,000 5,320,000 2,055,000 1,535,000Stormwater Total
Transportation FT-TRANS1 235,832,237123,634,031 62,998,206 22,450,000 19,300,000 7,450,000Type B Eligible Projects
CAMPO Funds 22,730,996 2,085,856 24,816,852Developer Participation 179,708 179,708Future CO Bond Issuance 29,222,064 27,175,000 56,397,064Other Governmental Entity Funds 11,981,574 9,725,000 6,250,000 4,675,000 32,631,574RR Trans & EcoDev Corp 51,519,689 19,387,350 16,200,000 14,625,000 7,450,000 109,182,039SIB Loan 8,000,000 4,625,000 12,625,000
FT-TRANS21 40,00040,000Transit Bus StopsFederal/State/Local Grant Funds 40,000 40,000
FT-TRANS24 175,000175,000Bucket Truck for New Signal CrewGeneral Self Financed Construction 175,000 175,000
HUD-CSMVLY 312,000312,000Chisholm Valley SidewalksCDBG HUD Entitlement Grants 312,000 312,000
NRT17/NRT19 25,800,0008,600,000 4,300,000 4,300,000 4,300,000 4,300,000Street Maintenance Non-ArterialGeneral Self Financed Construction 8,600,000 4,300,000 4,300,000 4,300,000 4,300,000 25,800,000
226622,,115599,,223377132,721,031 6677,,333388,,220066 26,750,000 23,600,000 11,750,000Transportation Total
Water & Wastewater20WMP 120,00040,000 40,000 40,0002020 Water Master Plan & Modeling Support
Self-Finance Water Construction 40,000 40,000 40,000 120,000
20WWM 100,00025,000 25,000 25,000 25,0002020 Wastewater MasterplanSelf-Finance Wastewater Construction 25,000 25,000 25,000 25,000 100,000
AMRP8 250,000250,000Automated Meter Reading Ph 8Self-Finance Water Construction 250,000 250,000
CVDAS-W 378,611378,611Chisholm Valley Drainage - W/WW PortionSelf-Finance Wastewater Construction 340,000 340,000Self-Finance Water Construction 38,611 38,611
FT-FCWWFM 500,000500,000Forest Creek WW Force Main RehabSelf-Finance Wastewater Construction 500,000 500,000
FT-WTR1 37,50037,500GIS Software Update
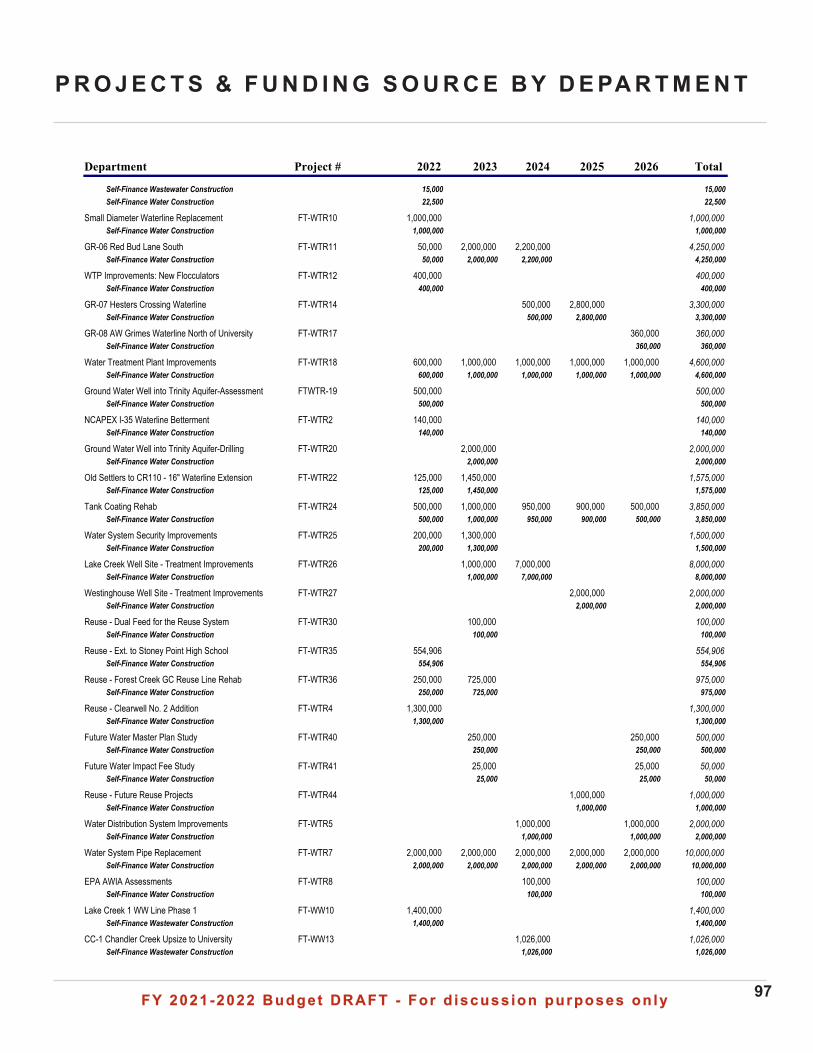
FY 2021-2022 Budget DRAFT - For d iscuss ion purposes on lyFY 2021-2022 Budget DRAFT - For d iscuss ion purposes on ly 97
P R O J E C T S & F U N D I N G S O U R C E B Y D E PA R T M E N T
Total2022 2023 2024 2025 2026Department Project #
Self-Finance Wastewater Construction 15,000 15,000Self-Finance Water Construction 22,500 22,500
FT-WTR10 1,000,0001,000,000Small Diameter Waterline ReplacementSelf-Finance Water Construction 1,000,000 1,000,000
FT-WTR11 4,250,00050,000 2,000,000 2,200,000GR-06 Red Bud Lane SouthSelf-Finance Water Construction 50,000 2,000,000 2,200,000 4,250,000
FT-WTR12 400,000400,000WTP Improvements: New FlocculatorsSelf-Finance Water Construction 400,000 400,000
FT-WTR14 3,300,000500,000 2,800,000GR-07 Hesters Crossing WaterlineSelf-Finance Water Construction 500,000 2,800,000 3,300,000
FT-WTR17 360,000360,000GR-08 AW Grimes Waterline North of UniversitySelf-Finance Water Construction 360,000 360,000
FT-WTR18 4,600,000600,000 1,000,000 1,000,000 1,000,000 1,000,000Water Treatment Plant ImprovementsSelf-Finance Water Construction 600,000 1,000,000 1,000,000 1,000,000 1,000,000 4,600,000
FTWTR-19 500,000500,000Ground Water Well into Trinity Aquifer-AssessmentSelf-Finance Water Construction 500,000 500,000
FT-WTR2 140,000140,000NCAPEX I-35 Waterline BettermentSelf-Finance Water Construction 140,000 140,000
FT-WTR20 2,000,0002,000,000Ground Water Well into Trinity Aquifer-DrillingSelf-Finance Water Construction 2,000,000 2,000,000
FT-WTR22 1,575,000125,000 1,450,000Old Settlers to CR110 - 16" Waterline ExtensionSelf-Finance Water Construction 125,000 1,450,000 1,575,000
FT-WTR24 3,850,000500,000 1,000,000 950,000 900,000 500,000Tank Coating RehabSelf-Finance Water Construction 500,000 1,000,000 950,000 900,000 500,000 3,850,000
FT-WTR25 1,500,000200,000 1,300,000Water System Security ImprovementsSelf-Finance Water Construction 200,000 1,300,000 1,500,000
FT-WTR26 8,000,0001,000,000 7,000,000Lake Creek Well Site - Treatment ImprovementsSelf-Finance Water Construction 1,000,000 7,000,000 8,000,000
FT-WTR27 2,000,0002,000,000Westinghouse Well Site - Treatment ImprovementsSelf-Finance Water Construction 2,000,000 2,000,000
FT-WTR30 100,000100,000Reuse - Dual Feed for the Reuse SystemSelf-Finance Water Construction 100,000 100,000
FT-WTR35 554,906554,906Reuse - Ext. to Stoney Point High SchoolSelf-Finance Water Construction 554,906 554,906
FT-WTR36 975,000250,000 725,000Reuse - Forest Creek GC Reuse Line RehabSelf-Finance Water Construction 250,000 725,000 975,000
FT-WTR4 1,300,0001,300,000Reuse - Clearwell No. 2 AdditionSelf-Finance Water Construction 1,300,000 1,300,000
FT-WTR40 500,000250,000 250,000Future Water Master Plan StudySelf-Finance Water Construction 250,000 250,000 500,000
FT-WTR41 50,00025,000 25,000Future Water Impact Fee StudySelf-Finance Water Construction 25,000 25,000 50,000
FT-WTR44 1,000,0001,000,000Reuse - Future Reuse ProjectsSelf-Finance Water Construction 1,000,000 1,000,000
FT-WTR5 2,000,0001,000,000 1,000,000Water Distribution System ImprovementsSelf-Finance Water Construction 1,000,000 1,000,000 2,000,000
FT-WTR7 10,000,0002,000,000 2,000,000 2,000,000 2,000,000 2,000,000Water System Pipe ReplacementSelf-Finance Water Construction 2,000,000 2,000,000 2,000,000 2,000,000 2,000,000 10,000,000
FT-WTR8 100,000100,000EPA AWIA AssessmentsSelf-Finance Water Construction 100,000 100,000
FT-WW10 1,400,0001,400,000Lake Creek 1 WW Line Phase 1Self-Finance Wastewater Construction 1,400,000 1,400,000
FT-WW13 1,026,0001,026,000CC-1 Chandler Creek Upsize to UniversitySelf-Finance Wastewater Construction 1,026,000 1,026,000
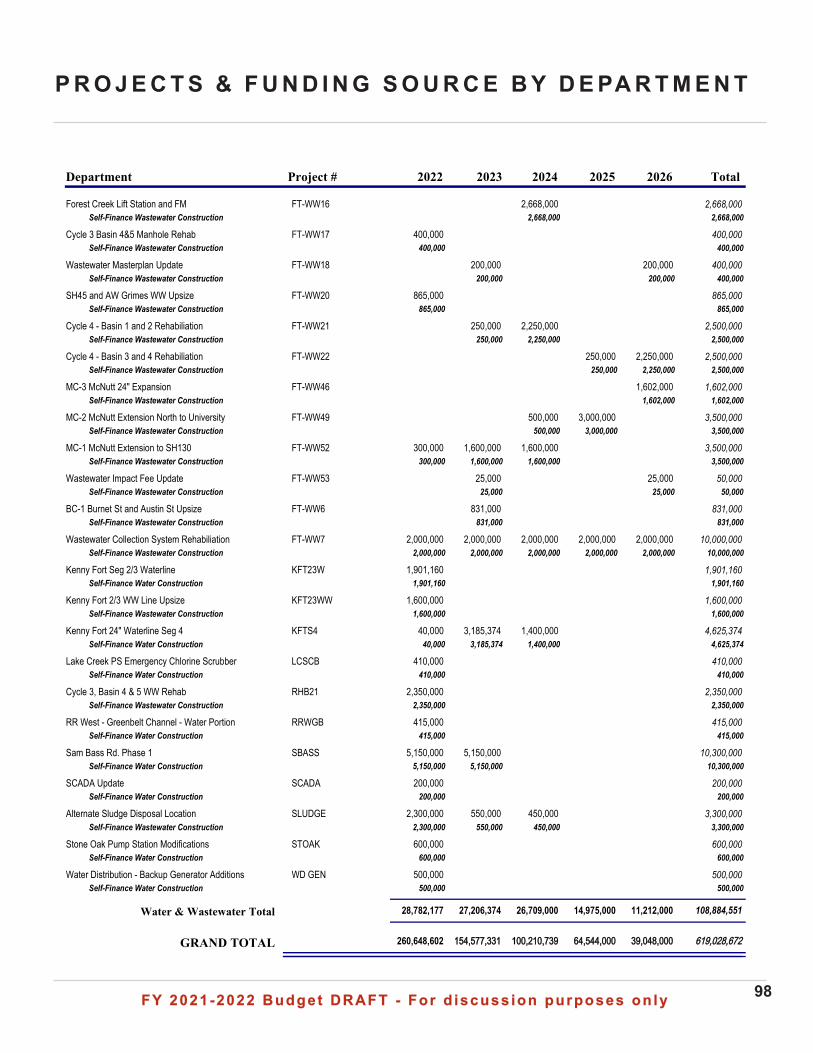
FY 2021-2022 Budget DRAFT - For d iscuss ion purposes on lyFY 2021-2022 Budget DRAFT - For d iscuss ion purposes on ly 98
P R O J E C T S & F U N D I N G S O U R C E B Y D E PA R T M E N T
Total2022 2023 2024 2025 2026Department Project #
FT-WW16 2,668,0002,668,000Forest Creek Lift Station and FMSelf-Finance Wastewater Construction 2,668,000 2,668,000
FT-WW17 400,000400,000Cycle 3 Basin 4&5 Manhole RehabSelf-Finance Wastewater Construction 400,000 400,000
FT-WW18 400,000200,000 200,000Wastewater Masterplan UpdateSelf-Finance Wastewater Construction 200,000 200,000 400,000
FT-WW20 865,000865,000SH45 and AW Grimes WW UpsizeSelf-Finance Wastewater Construction 865,000 865,000
FT-WW21 2,500,000250,000 2,250,000Cycle 4 - Basin 1 and 2 RehabiliationSelf-Finance Wastewater Construction 250,000 2,250,000 2,500,000
FT-WW22 2,500,000250,000 2,250,000Cycle 4 - Basin 3 and 4 RehabiliationSelf-Finance Wastewater Construction 250,000 2,250,000 2,500,000
FT-WW46 1,602,0001,602,000MC-3 McNutt 24" ExpansionSelf-Finance Wastewater Construction 1,602,000 1,602,000
FT-WW49 3,500,000500,000 3,000,000MC-2 McNutt Extension North to UniversitySelf-Finance Wastewater Construction 500,000 3,000,000 3,500,000
FT-WW52 3,500,000300,000 1,600,000 1,600,000MC-1 McNutt Extension to SH130Self-Finance Wastewater Construction 300,000 1,600,000 1,600,000 3,500,000
FT-WW53 50,00025,000 25,000Wastewater Impact Fee UpdateSelf-Finance Wastewater Construction 25,000 25,000 50,000
FT-WW6 831,000831,000BC-1 Burnet St and Austin St UpsizeSelf-Finance Wastewater Construction 831,000 831,000
FT-WW7 10,000,0002,000,000 2,000,000 2,000,000 2,000,000 2,000,000Wastewater Collection System RehabiliationSelf-Finance Wastewater Construction 2,000,000 2,000,000 2,000,000 2,000,000 2,000,000 10,000,000
KFT23W 1,901,1601,901,160Kenny Fort Seg 2/3 WaterlineSelf-Finance Water Construction 1,901,160 1,901,160
KFT23WW 1,600,0001,600,000Kenny Fort 2/3 WW Line UpsizeSelf-Finance Wastewater Construction 1,600,000 1,600,000
KFTS4 4,625,37440,000 3,185,374 1,400,000Kenny Fort 24" Waterline Seg 4Self-Finance Water Construction 40,000 3,185,374 1,400,000 4,625,374
LCSCB 410,000410,000Lake Creek PS Emergency Chlorine ScrubberSelf-Finance Water Construction 410,000 410,000
RHB21 2,350,0002,350,000Cycle 3, Basin 4 & 5 WW RehabSelf-Finance Wastewater Construction 2,350,000 2,350,000
RRWGB 415,000415,000RR West - Greenbelt Channel - Water PortionSelf-Finance Water Construction 415,000 415,000
SBASS 10,300,0005,150,000 5,150,000Sam Bass Rd. Phase 1Self-Finance Water Construction 5,150,000 5,150,000 10,300,000
SCADA 200,000200,000SCADA UpdateSelf-Finance Water Construction 200,000 200,000
SLUDGE 3,300,0002,300,000 550,000 450,000Alternate Sludge Disposal LocationSelf-Finance Wastewater Construction 2,300,000 550,000 450,000 3,300,000
STOAK 600,000600,000Stone Oak Pump Station ModificationsSelf-Finance Water Construction 600,000 600,000
WD GEN 500,000500,000Water Distribution - Backup Generator AdditionsSelf-Finance Water Construction 500,000 500,000
108,884,55128,782,177 27,206,374 26,709,000 14,975,000 11,212,000Water & Wastewater Total
GRAND TOTAL 661199,,002288,,667722260,648,602 115544,,557777,,333311 10000,,221100,,773399 6644,,554444,,000000 3399,,004488,,000000
FY 2021-2022 Budget DRAFT - For d iscuss ion purposes on lyFY 2021-2022 Budget DRAFT - For d iscuss ion purposes on ly 99
D E B T
• Debt Outstanding by Type............................................................................100
• Current Bond Ratings Tables .......................................................................101
• Bond Issuances and Authorizations .............................................................102
• GO Bond Project Status Report....................................................................103
• Debt Refunding.............................................................................................104
• Amortization by Type
◦ Ad Valorem Tax-Backed Debt Payment..............................................106
◦ Type B ..................................................................................................107
◦ HOT ......................................................................................................108
◦ Water & Wastewater ...........................................................................109
◦ Stormwater.........................................................................................110
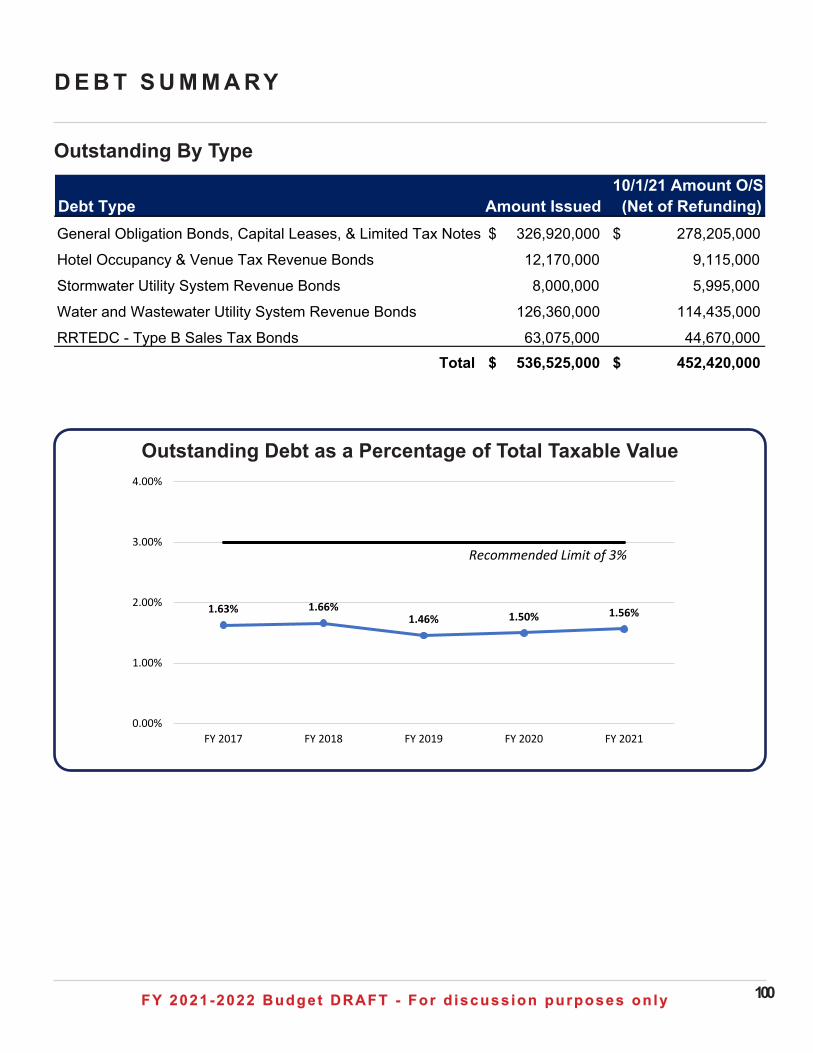
FY 2021-2022 Budget DRAFT - For d iscuss ion purposes on lyFY 2021-2022 Budget DRAFT - For d iscuss ion purposes on ly 100
D E B T S U M M A RY
Outstanding By Type
Debt Type Amount Issued 10/1/21 Amount O/S
(Net of Refunding)General Obligation Bonds, Capital Leases, & Limited Tax Notes 326,920,000$ 278,205,000$
Hotel Occupancy & Venue Tax Revenue Bonds 12,170,000 9,115,000
Stormwater Utility System Revenue Bonds 8,000,000 5,995,000
Water and Wastewater Utility System Revenue Bonds 126,360,000 114,435,000
RRTEDC - Type B Sales Tax Bonds 63,075,000 44,670,000 Total 536,525,000$ 452,420,000$
1.63% 1.66%1.46% 1.50% 1.56%
0.00%
1.00%
2.00%
3.00%
4.00%
FY 2017 FY 2018 FY 2019 FY 2020 FY 2021
Recommended Limit of 3%
Outstanding Debt as a Percentage of Total Taxable Value
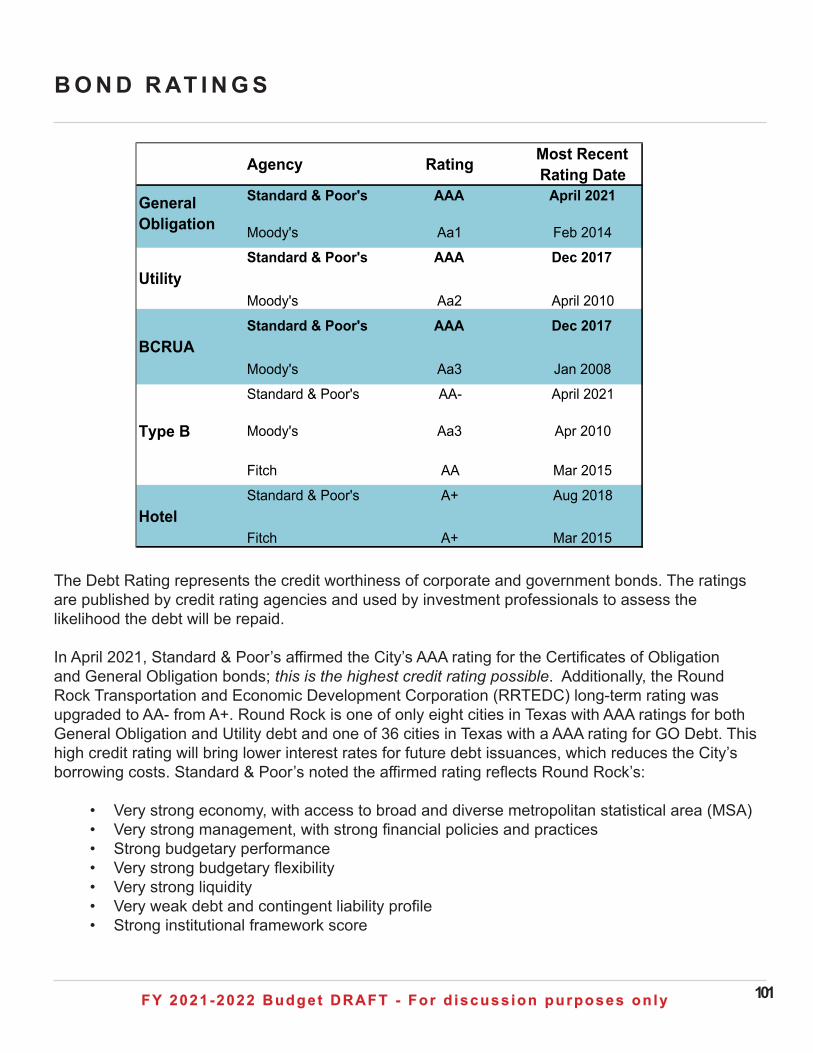
FY 2021-2022 Budget DRAFT - For d iscuss ion purposes on lyFY 2021-2022 Budget DRAFT - For d iscuss ion purposes on ly 101
B O N D R AT I N G S
The Debt Rating represents the credit worthiness of corporate and government bonds. The ratings are published by credit rating agencies and used by investment professionals to assess the likelihood the debt will be repaid.
In April 2021, Standard & Poor’s affirmed the City’s AAA rating for the Certificates of Obligation and General Obligation bonds; this is the highest credit rating possible. Additionally, the Round Rock Transportation and Economic Development Corporation (RRTEDC) long-term rating was upgraded to AA- from A+. Round Rock is one of only eight cities in Texas with AAA ratings for both General Obligation and Utility debt and one of 36 cities in Texas with a AAA rating for GO Debt. This high credit rating will bring lower interest rates for future debt issuances, which reduces the City’s borrowing costs. Standard & Poor’s noted the affirmed rating reflects Round Rock’s:
• Very strong economy, with access to broad and diverse metropolitan statistical area (MSA)• Very strong management, with strong financial policies and practices• Strong budgetary performance• Very strong budgetary flexibility• Very strong liquidity • Very weak debt and contingent liability profile• Strong institutional framework score
Agency Rating Most Recent Rating Date
Standard & Poor's AAA April 2021
Moody's Aa1 Feb 2014
Standard & Poor's AAA Dec 2017
Moody's Aa2 April 2010
Standard & Poor's AAA Dec 2017
Moody's Aa3 Jan 2008
Standard & Poor's AA- April 2021
Moody's Aa3 Apr 2010
Fitch AA Mar 2015
Standard & Poor's A+ Aug 2018
Fitch A+ Mar 2015
General Obligation
Utility
BCRUA
Type B
Hotel
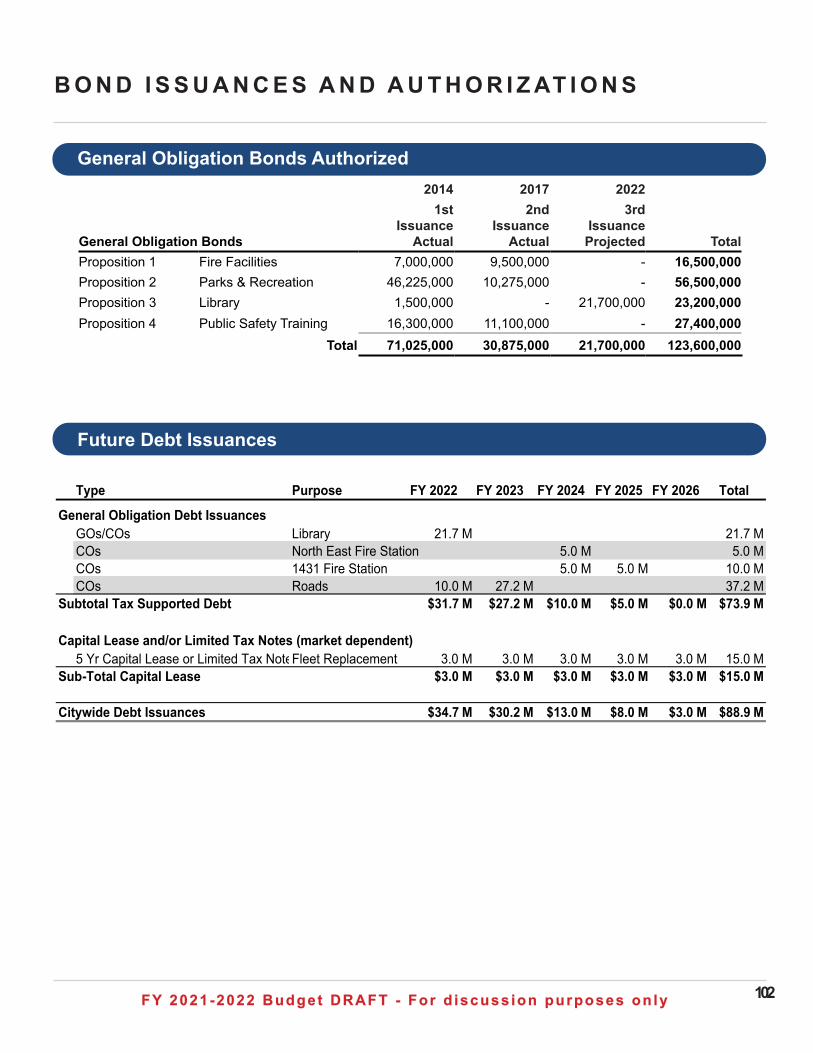
FY 2021-2022 Budget DRAFT - For d iscuss ion purposes on lyFY 2021-2022 Budget DRAFT - For d iscuss ion purposes on ly 102
2014 2017 2022
General Obligation Bonds
1st Issuance
Actual
2nd Issuance
Actual
3rd Issuance Projected Total
Proposition 1 Fire Facilities 7,000,000 9,500,000 - 16,500,000 Proposition 2 Parks & Recreation 46,225,000 10,275,000 - 56,500,000 Proposition 3 Library 1,500,000 - 21,700,000 23,200,000 Proposition 4 Public Safety Training 16,300,000 11,100,000 - 27,400,000
Total 71,025,000 30,875,000 21,700,000 123,600,000
B O N D I S S U A N C E S A N D A U T H O R I Z AT I O N S
General Obligation Bonds Authorized
Future Debt Issuances
Type Purpose FY 2022 FY 2023 FY 2024 FY 2025 FY 2026 Total
General Obligation Debt IssuancesGOs/COs Library 21.7 M 21.7 MCOs North East Fire Station 5.0 M 5.0 MCOs 1431 Fire Station 5.0 M 5.0 M 10.0 MCOs Roads 10.0 M 27.2 M 37.2 M
Subtotal Tax Supported Debt $31.7 M $27.2 M $10.0 M $5.0 M $0.0 M $73.9 M
Capital Lease and/or Limited Tax Notes (market dependent)5 Yr Capital Lease or Limited Tax NotesFleet Replacement 3.0 M 3.0 M 3.0 M 3.0 M 3.0 M 15.0 M
Sub-Total Capital Lease $3.0 M $3.0 M $3.0 M $3.0 M $3.0 M $15.0 M
Citywide Debt Issuances $34.7 M $30.2 M $13.0 M $8.0 M $3.0 M $88.9 M
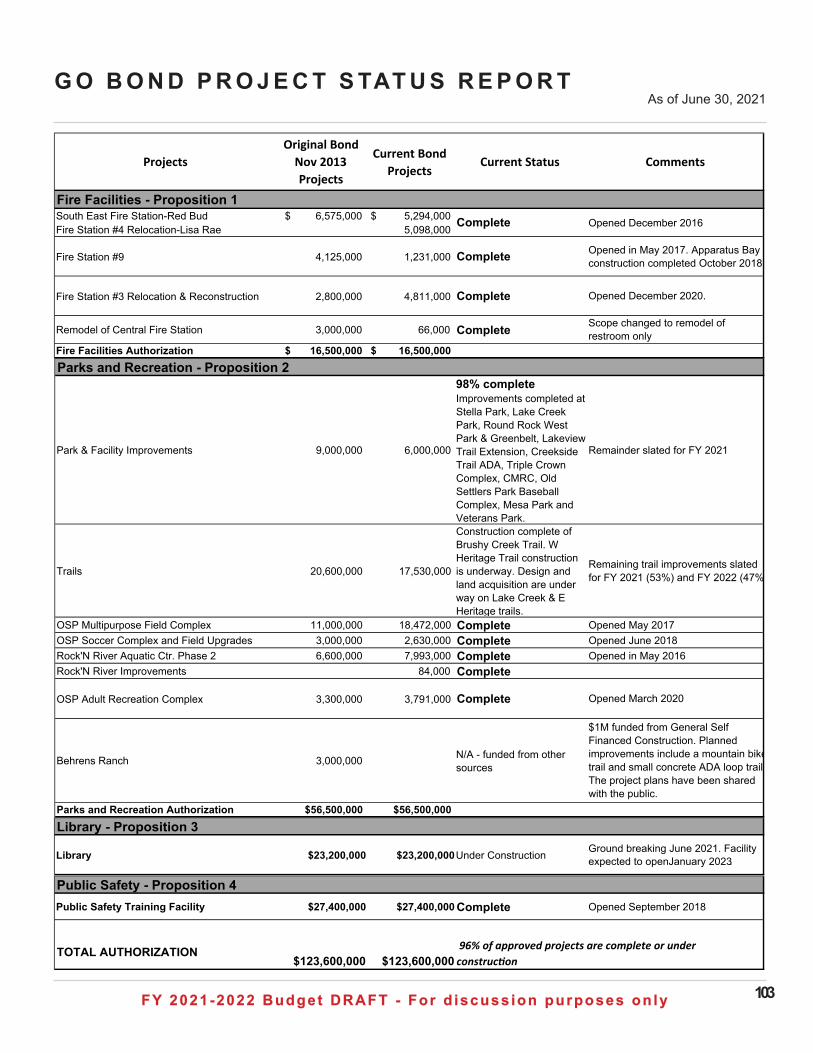
FY 2021-2022 Budget DRAFT - For d iscuss ion purposes on lyFY 2021-2022 Budget DRAFT - For d iscuss ion purposes on ly 103
G O B O N D P R O J E C T S TAT U S R E P O R TAs of June 30, 2021
South East Fire Station-Red Bud 6,575,000$ 5,294,000$ Fire Station #4 Relocation-Lisa Rae 5,098,000
Fire Station #9 4,125,000 1,231,000 Complete
Fire Station #3 Relocation & Reconstruction 2,800,000 4,811,000 Complete
Remodel of Central Fire Station 3,000,000 66,000 CompleteFire Facilities Authorization 16,500,000$ 16,500,000$
ProjectsOriginal Bond
Nov 2013 Projects
Current Bond Projects
Current Status Comments
Fire Facilities - Proposition 1Complete Opened December 2016
Opened in May 2017. Apparatus Bay construction completed October 2018.
Opened December 2020.
Scope changed to remodel of restroom only
Park & Facility Improvements 9,000,000 6,000,000
98% completeImprovements completed at Stella Park, Lake Creek Park, Round Rock West Park & Greenbelt, Lakeview Trail Extension, Creekside Trail ADA, Triple Crown Complex, CMRC, Old Settlers Park Baseball Complex, Mesa Park and Veterans Park.
Trails 20,600,000 17,530,000
Construction complete of Brushy Creek Trail. W Heritage Trail construction is underway. Design and land acquisition are under way on Lake Creek & E Heritage trails.
OSP Multipurpose Field Complex 11,000,000 18,472,000 CompleteOSP Soccer Complex and Field Upgrades 3,000,000 2,630,000 CompleteRock'N River Aquatic Ctr. Phase 2 6,600,000 7,993,000 CompleteRock'N River Improvements 84,000 Complete
OSP Adult Recreation Complex 3,300,000 3,791,000 Complete
Behrens Ranch 3,000,000 N/A - funded from other sources
Parks and Recreation Authorization $56,500,000 $56,500,000
$1M funded from General Self Financed Construction. Planned improvements include a mountain bike trail and small concrete ADA loop trail. The project plans have been shared with the public.
Parks and Recreation - Proposition 2
Remainder slated for FY 2021
Remaining trail improvements slated for FY 2021 (53%) and FY 2022 (47%)
Opened May 2017Opened June 2018Opened in May 2016
Opened March 2020
Library $23,200,000 $23,200,000Under Construction
Library - Proposition 3Ground breaking June 2021. Facility expected to open January 2023.
Public Safety Training Facility $27,400,000 $27,400,000 Complete
TOTAL AUTHORIZATION$123,600,000 $123,600,000
96% of approved projects are complete or under construction
Public Safety - Proposition 4Opened September 2018
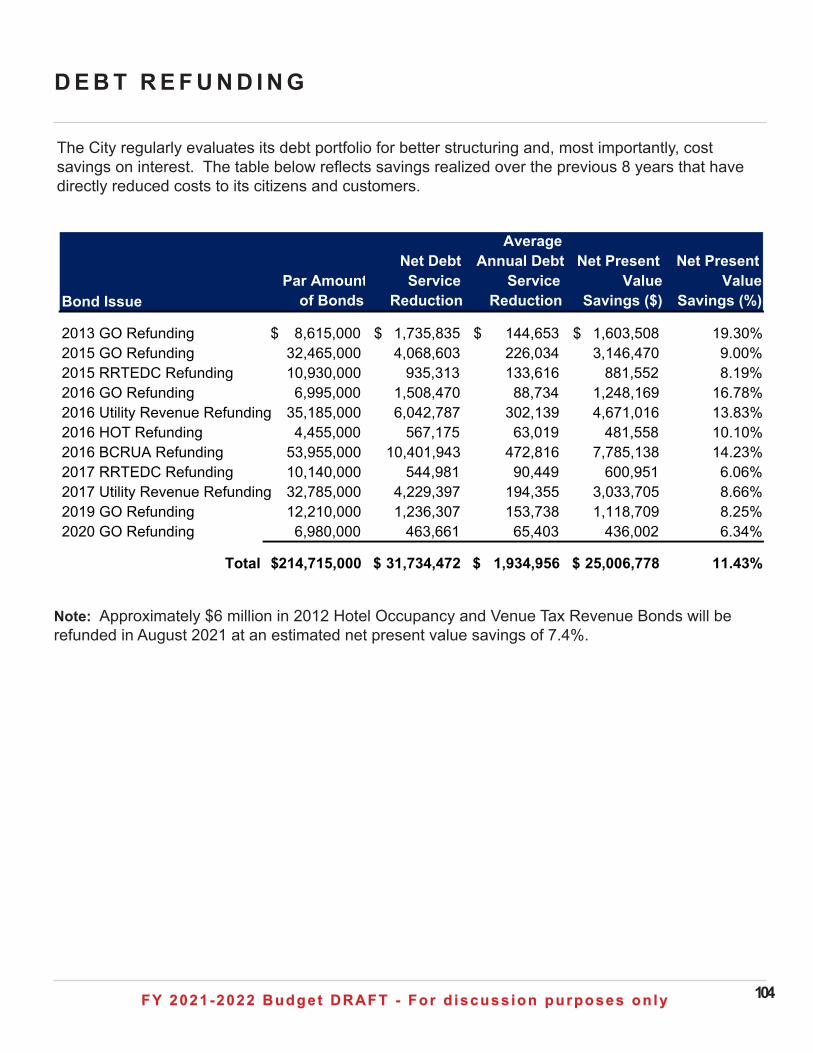
FY 2021-2022 Budget DRAFT - For d iscuss ion purposes on lyFY 2021-2022 Budget DRAFT - For d iscuss ion purposes on ly 104
D E B T R E F U N D I N G
Bond IssuePar Amount
of Bonds
Net Debt Service
Reduction
Average Annual Debt
Service Reduction
Net Present Value
Savings ($)
Net Present Value
Savings (%)
2013 GO Refunding 8,615,000$ 1,735,835$ 144,653$ 1,603,508$ 19.30%2015 GO Refunding 32,465,000 4,068,603 226,034 3,146,470 9.00%2015 RRTEDC Refunding 10,930,000 935,313 133,616 881,552 8.19%2016 GO Refunding 6,995,000 1,508,470 88,734 1,248,169 16.78%2016 Utility Revenue Refunding 35,185,000 6,042,787 302,139 4,671,016 13.83%2016 HOT Refunding 4,455,000 567,175 63,019 481,558 10.10%2016 BCRUA Refunding 53,955,000 10,401,943 472,816 7,785,138 14.23%2017 RRTEDC Refunding 10,140,000 544,981 90,449 600,951 6.06%2017 Utility Revenue Refunding 32,785,000 4,229,397 194,355 3,033,705 8.66%2019 GO Refunding 12,210,000 1,236,307 153,738 1,118,709 8.25%2020 GO Refunding 6,980,000 463,661 65,403 436,002 6.34%
Total 214,715,000$ 31,734,472$ 1,934,956$ 25,006,778$ 11.43%
The City regularly evaluates its debt portfolio for better structuring and, most importantly, cost savings on interest. The table below reflects savings realized over the previous 8 years that have directly reduced costs to its citizens and customers. y
Note: Approximately $6 million in 2012 Hotel Occupancy and Venue Tax Revenue Bonds will be refunded in August 2021 at an estimated net present value savings of 7.4%. y
FY 2021-2022 Budget DRAFT - For d iscuss ion purposes on lyFY 2021-2022 Budget DRAFT - For d iscuss ion purposes on ly
A M O R T I Z AT I O N B Y T Y P E
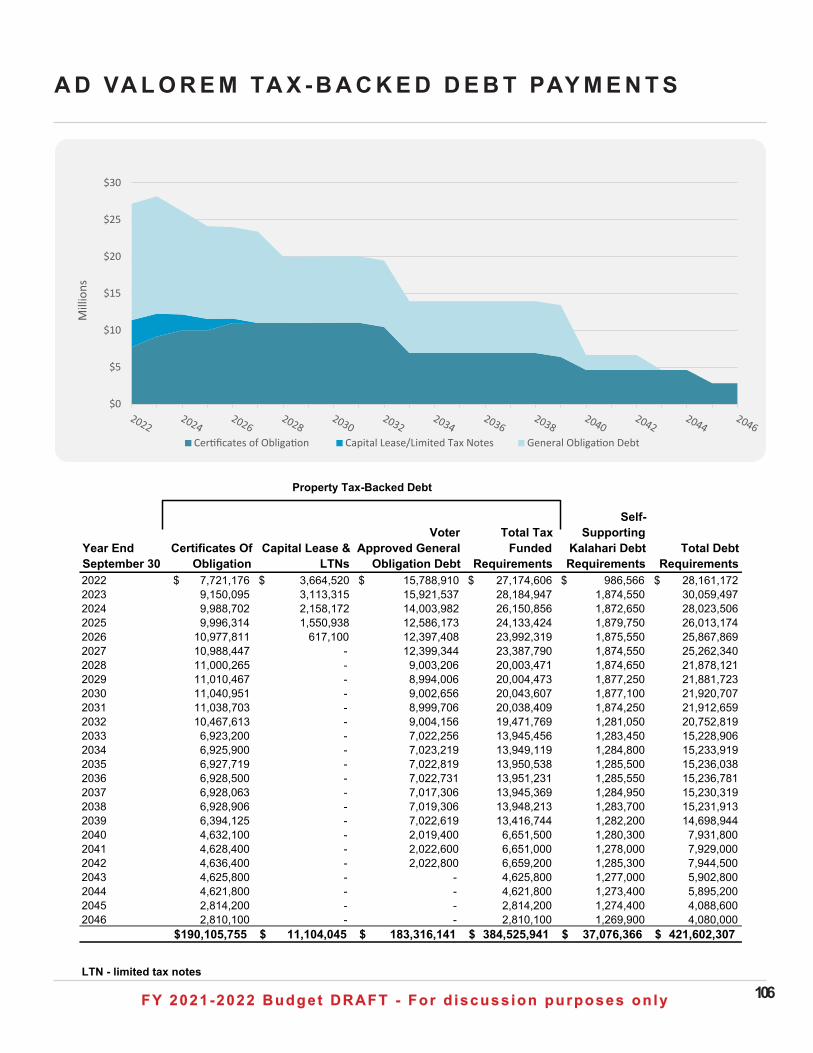
FY 2021-2022 Budget DRAFT - For d iscuss ion purposes on lyFY 2021-2022 Budget DRAFT - For d iscuss ion purposes on ly 106
A D VA L O R E M TA X - B A C K E D D E B T PAY M E N T S
Year End September 30
Certificates Of Obligation
Capital Lease & LTNs
Voter Approved General
Obligation Debt
Total Tax Funded
Requirements
Self-Supporting
Kalahari Debt Requirements
Total Debt Requirements
2022 7,721,176$ 3,664,520$ 15,788,910$ 27,174,606$ 986,566$ 28,161,172$ 2023 9,150,095 3,113,315 15,921,537 28,184,947 1,874,550 30,059,497 2024 9,988,702 2,158,172 14,003,982 26,150,856 1,872,650 28,023,506 2025 9,996,314 1,550,938 12,586,173 24,133,424 1,879,750 26,013,174 2026 10,977,811 617,100 12,397,408 23,992,319 1,875,550 25,867,869 2027 10,988,447 - 12,399,344 23,387,790 1,874,550 25,262,340 2028 11,000,265 - 9,003,206 20,003,471 1,874,650 21,878,121 2029 11,010,467 - 8,994,006 20,004,473 1,877,250 21,881,723 2030 11,040,951 - 9,002,656 20,043,607 1,877,100 21,920,707 2031 11,038,703 - 8,999,706 20,038,409 1,874,250 21,912,659 2032 10,467,613 - 9,004,156 19,471,769 1,281,050 20,752,819 2033 6,923,200 - 7,022,256 13,945,456 1,283,450 15,228,906 2034 6,925,900 - 7,023,219 13,949,119 1,284,800 15,233,919 2035 6,927,719 - 7,022,819 13,950,538 1,285,500 15,236,038 2036 6,928,500 - 7,022,731 13,951,231 1,285,550 15,236,781 2037 6,928,063 - 7,017,306 13,945,369 1,284,950 15,230,319 2038 6,928,906 - 7,019,306 13,948,213 1,283,700 15,231,913 2039 6,394,125 - 7,022,619 13,416,744 1,282,200 14,698,944 2040 4,632,100 - 2,019,400 6,651,500 1,280,300 7,931,800 2041 4,628,400 - 2,022,600 6,651,000 1,278,000 7,929,000 2042 4,636,400 - 2,022,800 6,659,200 1,285,300 7,944,500 2043 4,625,800 - - 4,625,800 1,277,000 5,902,800 2044 4,621,800 - - 4,621,800 1,273,400 5,895,200 2045 2,814,200 - - 2,814,200 1,274,400 4,088,600 2046 2,810,100 - - 2,810,100 1,269,900 4,080,000
190,105,755$ 11,104,045$ 183,316,141$ 384,525,941$ 37,076,366$ 421,602,307$
LTN - limited tax notes
Property Tax-Backed Debt
$0
$5
$10
$15
$20
$25
$30
Mill
ions
Cer�ficates of Obliga�on Capital Lease/Limited Tax Notes General Obliga�on Debt
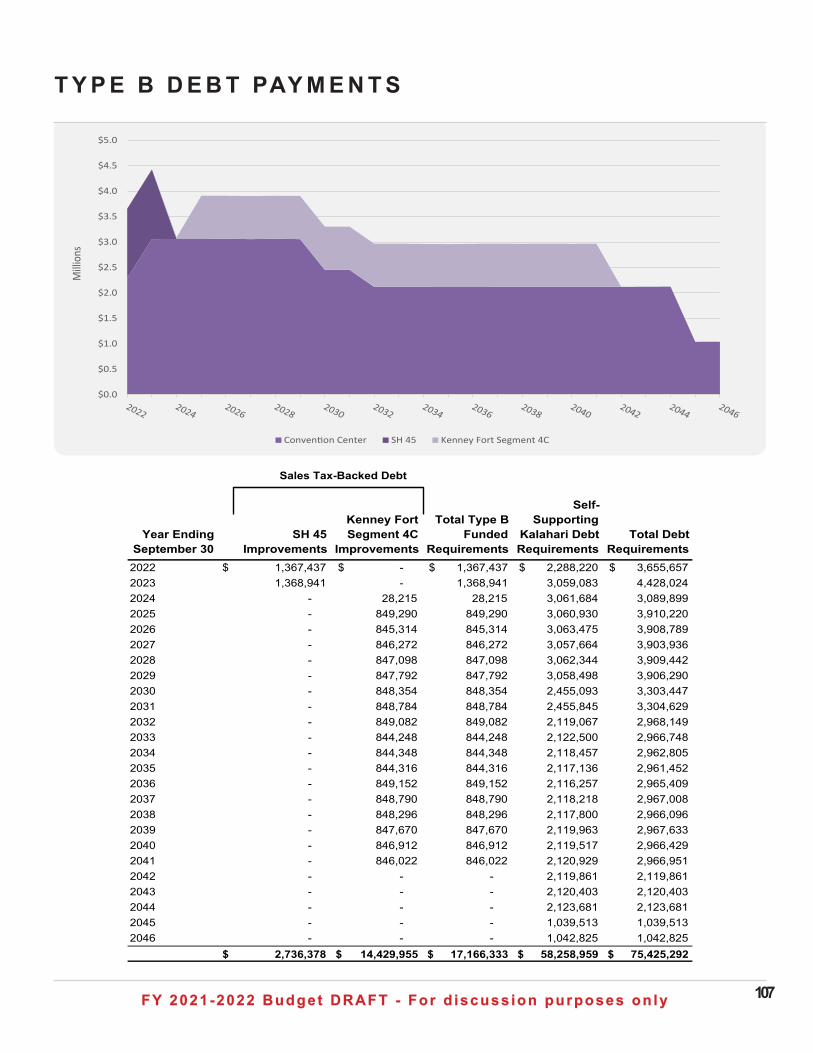
FY 2021-2022 Budget DRAFT - For d iscuss ion purposes on lyFY 2021-2022 Budget DRAFT - For d iscuss ion purposes on ly 107
T Y P E B D E B T PAY M E N T S
$0.0
$0.5
$1.0
$1.5
$2.0
$2.5
$3.0
$3.5
$4.0
$4.5
$5.0
Milli
ons
Conven�on Center SH 45 Kenney Fort Segment 4C
Year Ending September 30
SH 45 Improvements
Kenney Fort Segment 4C
Improvements
Total Type B Funded
Requirements
Self-Supporting
Kalahari Debt Requirements
Total Debt Requirements
2022 1,367,437$ -$ 1,367,437$ 2,288,220$ 3,655,657$ 2023 1,368,941 - 1,368,941 3,059,083 4,428,024 2024 - 28,215 28,215 3,061,684 3,089,899 2025 - 849,290 849,290 3,060,930 3,910,220 2026 - 845,314 845,314 3,063,475 3,908,789 2027 - 846,272 846,272 3,057,664 3,903,936 2028 - 847,098 847,098 3,062,344 3,909,442 2029 - 847,792 847,792 3,058,498 3,906,290 2030 - 848,354 848,354 2,455,093 3,303,447 2031 - 848,784 848,784 2,455,845 3,304,629 2032 - 849,082 849,082 2,119,067 2,968,149 2033 - 844,248 844,248 2,122,500 2,966,748 2034 - 844,348 844,348 2,118,457 2,962,805 2035 - 844,316 844,316 2,117,136 2,961,452 2036 - 849,152 849,152 2,116,257 2,965,409 2037 - 848,790 848,790 2,118,218 2,967,008 2038 - 848,296 848,296 2,117,800 2,966,096 2039 - 847,670 847,670 2,119,963 2,967,633 2040 - 846,912 846,912 2,119,517 2,966,429 2041 - 846,022 846,022 2,120,929 2,966,951 2042 - - - 2,119,861 2,119,861 2043 - - - 2,120,403 2,120,403 2044 - - - 2,123,681 2,123,681 2045 - - - 1,039,513 1,039,513 2046 - - - 1,042,825 1,042,825
2,736,378$ 14,429,955$ 17,166,333$ 58,258,959$ 75,425,292$
Sales Tax-Backed Debt
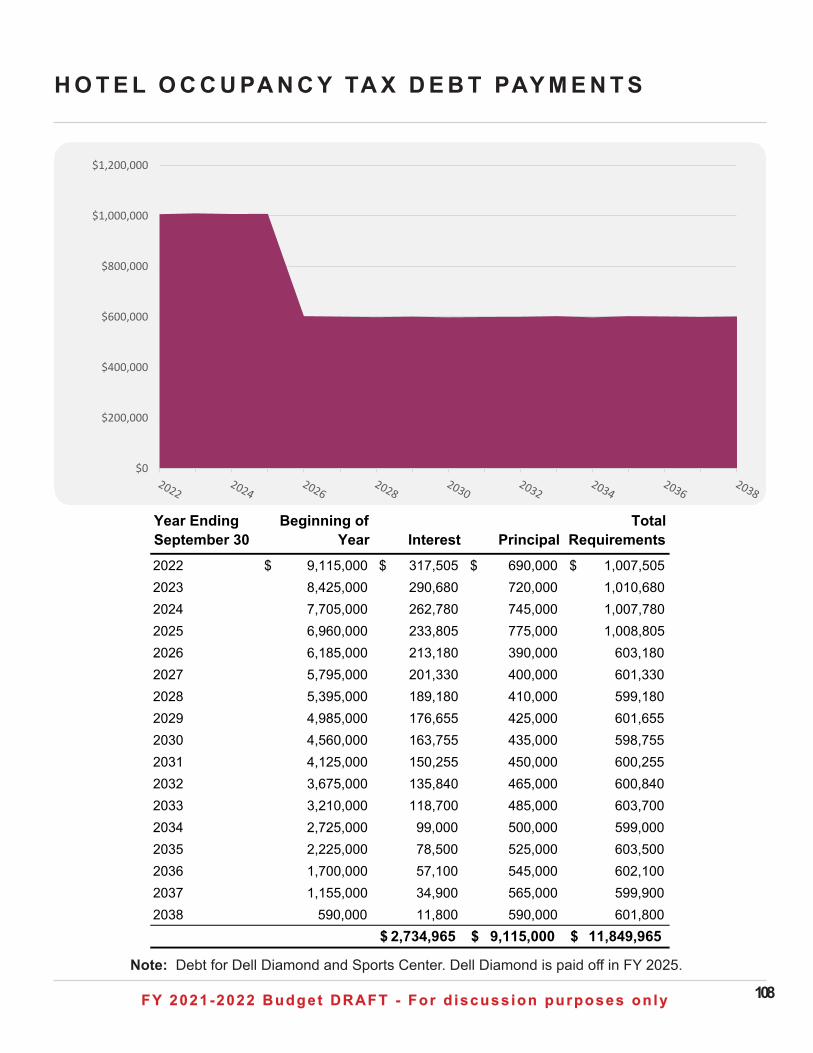
FY 2021-2022 Budget DRAFT - For d iscuss ion purposes on lyFY 2021-2022 Budget DRAFT - For d iscuss ion purposes on ly 108
H O T E L O C C U PA N C Y TA X D E B T PAY M E N T S
Year Ending September 30
Outstanding Beginning of
Year Interest PrincipalTotal
Requirements2022 9,115,000$ 317,505$ 690,000$ 1,007,505$ 2023 8,425,000 290,680 720,000 1,010,680 2024 7,705,000 262,780 745,000 1,007,780 2025 6,960,000 233,805 775,000 1,008,805 2026 6,185,000 213,180 390,000 603,180 2027 5,795,000 201,330 400,000 601,330 2028 5,395,000 189,180 410,000 599,180 2029 4,985,000 176,655 425,000 601,655 2030 4,560,000 163,755 435,000 598,755 2031 4,125,000 150,255 450,000 600,255 2032 3,675,000 135,840 465,000 600,840 2033 3,210,000 118,700 485,000 603,700 2034 2,725,000 99,000 500,000 599,000 2035 2,225,000 78,500 525,000 603,500 2036 1,700,000 57,100 545,000 602,100 2037 1,155,000 34,900 565,000 599,900 2038 590,000 11,800 590,000 601,800
2,734,965$ 9,115,000$ 11,849,965$
Note: Debt for Dell Diamond and Sports Center. Dell Diamond is paid off in FY 2025.
$0
$200,000
$400,000
$600,000
$800,000
$1,000,000
$1,200,000
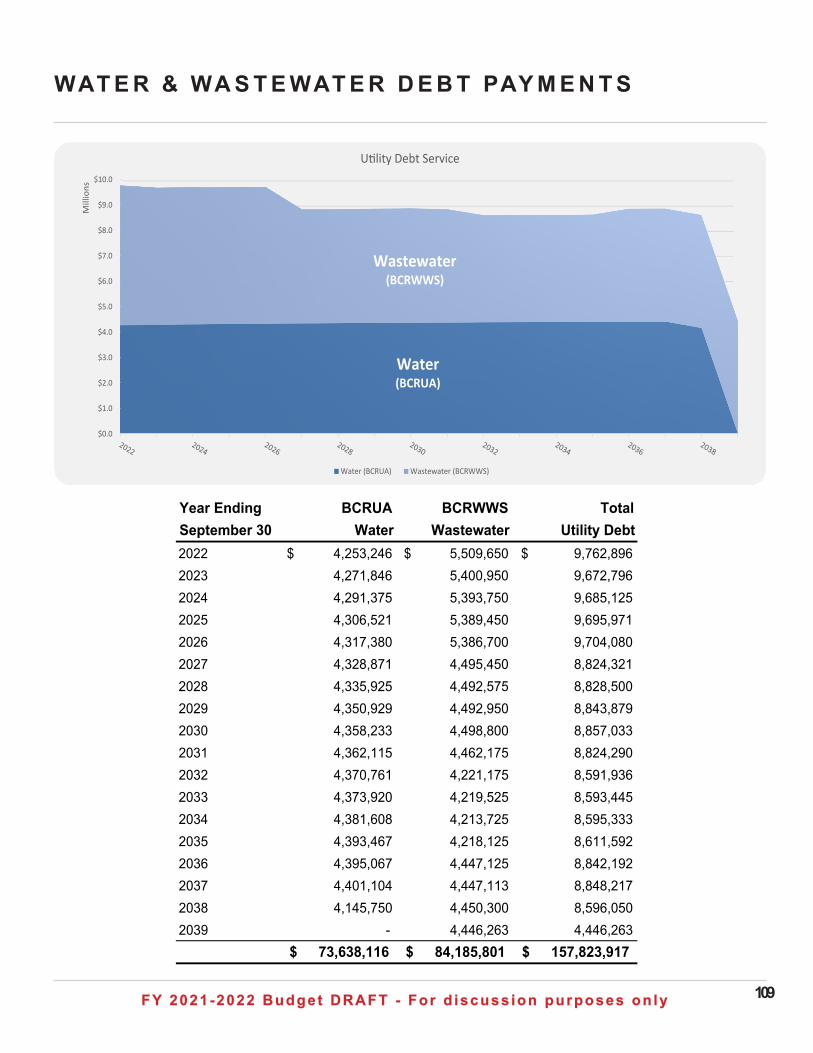
FY 2021-2022 Budget DRAFT - For d iscuss ion purposes on lyFY 2021-2022 Budget DRAFT - For d iscuss ion purposes on ly 109
$0.0
$1.0
$2.0
$3.0
$4.0
$5.0
$6.0
$7.0
$8.0
$9.0
$10.0
Mill
ions
U�lity Debt Service
Water (BCRUA) Wastewater (BCRWWS)
Water(BCRUA)
Wastewater(BCRWWS)
WAT E R & WA S T E WAT E R D E B T PAY M E N T S
Year Ending BCRUA BCRWWS TotalSeptember 30 Water Wastewater Utility Debt2022 4,253,246$ 5,509,650$ 9,762,896$ 2023 4,271,846 5,400,950 9,672,796 2024 4,291,375 5,393,750 9,685,125 2025 4,306,521 5,389,450 9,695,971 2026 4,317,380 5,386,700 9,704,080 2027 4,328,871 4,495,450 8,824,321 2028 4,335,925 4,492,575 8,828,500 2029 4,350,929 4,492,950 8,843,879 2030 4,358,233 4,498,800 8,857,033 2031 4,362,115 4,462,175 8,824,290 2032 4,370,761 4,221,175 8,591,936 2033 4,373,920 4,219,525 8,593,445 2034 4,381,608 4,213,725 8,595,333 2035 4,393,467 4,218,125 8,611,592 2036 4,395,067 4,447,125 8,842,192 2037 4,401,104 4,447,113 8,848,217 2038 4,145,750 4,450,300 8,596,050 2039 - 4,446,263 4,446,263
73,638,116$ 84,185,801$ 157,823,917$
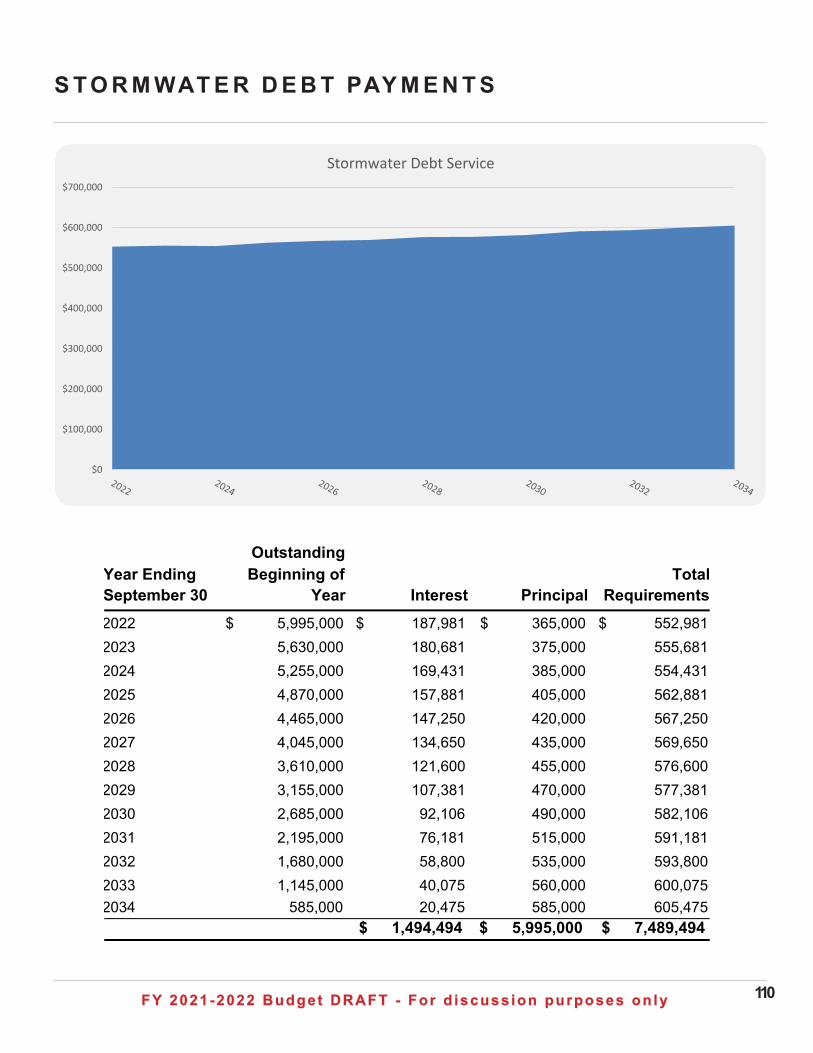
FY 2021-2022 Budget DRAFT - For d iscuss ion purposes on lyFY 2021-2022 Budget DRAFT - For d iscuss ion purposes on ly 110
S T O R M WAT E R D E B T PAY M E N T S
OutstandingYear Ending September 30
Outstanding Beginning of
Year Interest PrincipalTotal
Requirements2022 5,995,000$ 187,981$ 365,000$ 552,981$ 2023 5,630,000 180,681 375,000 555,681 2024 5,255,000 169,431 385,000 554,431 2025 4,870,000 157,881 405,000 562,881 2026 4,465,000 147,250 420,000 567,250 2027 4,045,000 134,650 435,000 569,650 2028 3,610,000 121,600 455,000 576,600 2029 3,155,000 107,381 470,000 577,381 2030 2,685,000 92,106 490,000 582,106 2031 2,195,000 76,181 515,000 591,181 2032 1,680,000 58,800 535,000 593,800 2033 1,145,000 40,075 560,000 600,075 2034 585,000 20,475 585,000 605,475
1,494,494$ 5,995,000$ 7,489,494$
$0
$100,000
$200,000
$300,000
$400,000
$500,000
$600,000
$700,000
Stormwater Debt Service
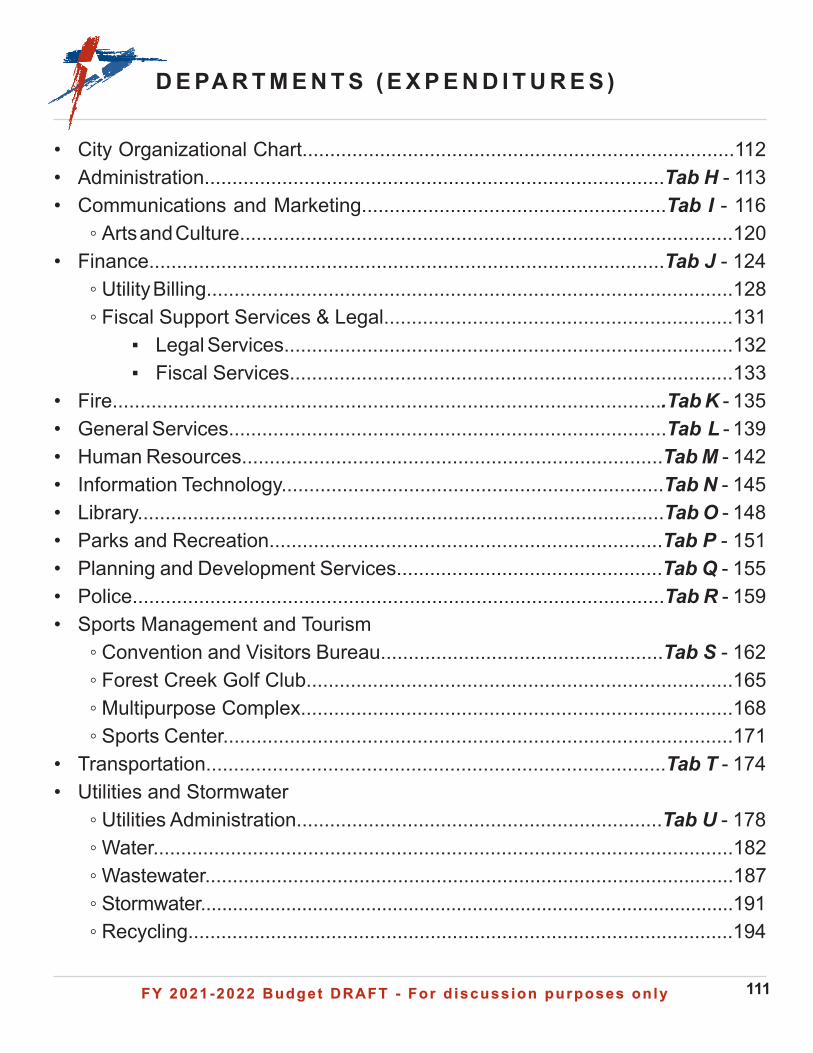
FY 2021-2022 Budget DRAFT - For d iscuss ion purposes on lyFY 2021-2022 Budget DRAFT - For d iscuss ion purposes on ly 111
D E PA R T M E N T S ( E X P E N D I T U R E S )
• City Organizational Chart..............................................................................112• Administration...................................................................................Tab H - 113• Communications and Marketing.......................................................Tab I - 116
◦ Arts and Culture.........................................................................................120• Finance.............................................................................................Tab J - 124
◦ Utility Billing...............................................................................................128 ◦ Fiscal Support Services & Legal...............................................................131
▪ Legal Services.................................................................................132 ▪ Fiscal Services................................................................................133
• Fire....................................................................................................Tab K - 135• General Services...............................................................................Tab L - 139• Human Resources............................................................................Tab M - 142• Information Technology.....................................................................Tab N - 145• Library...............................................................................................Tab O - 148• Parks and Recreation.......................................................................Tab P - 151• Planning and Development Services................................................Tab Q - 155• Police................................................................................................Tab R - 159• Sports Management and Tourism
◦ Convention and Visitors Bureau...................................................Tab S - 162 ◦ Forest Creek Golf Club.............................................................................165 ◦ Multipurpose Complex..............................................................................168 ◦ Sports Center............................................................................................171
• Transportation...................................................................................Tab T - 174• Utilities and Stormwater
◦ Utilities Administration..................................................................Tab U - 178 ◦ Water.........................................................................................................182 ◦ Wastewater................................................................................................187 ◦ Stormwater....................................................................................................191 ◦ Recycling...................................................................................................194
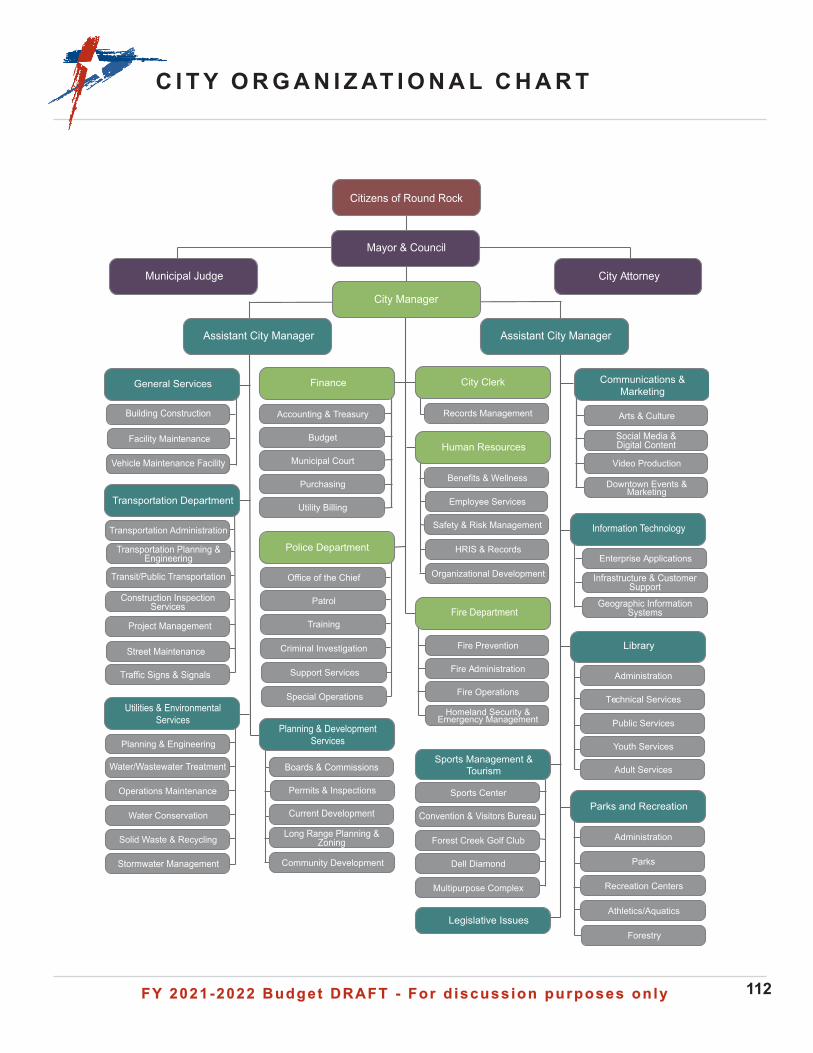
FY 2021-2022 Budget DRAFT - For d iscuss ion purposes on lyFY 2021-2022 Budget DRAFT - For d iscuss ion purposes on ly 112
C I T Y O R G A N I Z AT I O N A L C H A R T
Citizens of Round Rock
Mayor & Council
PurchasingCity Manager
Municipal Judge City Attorney
Assistant City ManagerAssistant City Manager
Utilities & Environmental Services
Planning & Development Services
Information Technology
Police Department
FinanceOffice of the Chief
Patrol
Training
Criminal Investigation
Records Management
City Clerk
Fire Department
FinanceFire Prevention
Fire Administration
Fire Operations
Homeland Security & Emergency Management
Human Resources
FinanceBenefits & Wellness
Employee Services
Safety & Risk Management
Library
Finance
Administration
Technical Services
Public Services
Youth Services
Arts & Culture
Video Production
Downtown Events & Marketing
FinancePermits & Inspections
Parks
Recreation Centers
Athletics/Aquatics
Forestry
General Services
FinanceFacility Maintenance
FinancePlanning & Engineering
Operations Maintenance
Water Conservation
Solid Waste & Recycling
Transportation Department
Transportation Administration
Sports Management & Tourism
Legislative Issues
Finance
Sports Center
Forest Creek Golf Club
Dell Diamond
Adult Services
Enterprise Applications
Social Media & Digital Content
Convention & Visitors Bureau
Water/Wastewater Treatment
Stormwater Management
Transportation Planning & Engineering
Transit/Public Transportation
Construction Inspection Services
Vehicle Maintenance Facility
Building Construction
Long Range Planning & Zoning
Current Development
Boards & Commissions
Geographic Information Systems
Infrastructure & Customer Support
Utility Billing
Accounting & Treasury
Budget
Municipal Court
Purchasing
Communications & Marketing
Parks and Recreation
Community Development
HRIS & Records
Multipurpose Complex
Organizational Development
Administration
Support Services
Special Operations
Project Management
Street Maintenance
Traffic Signs & Signals
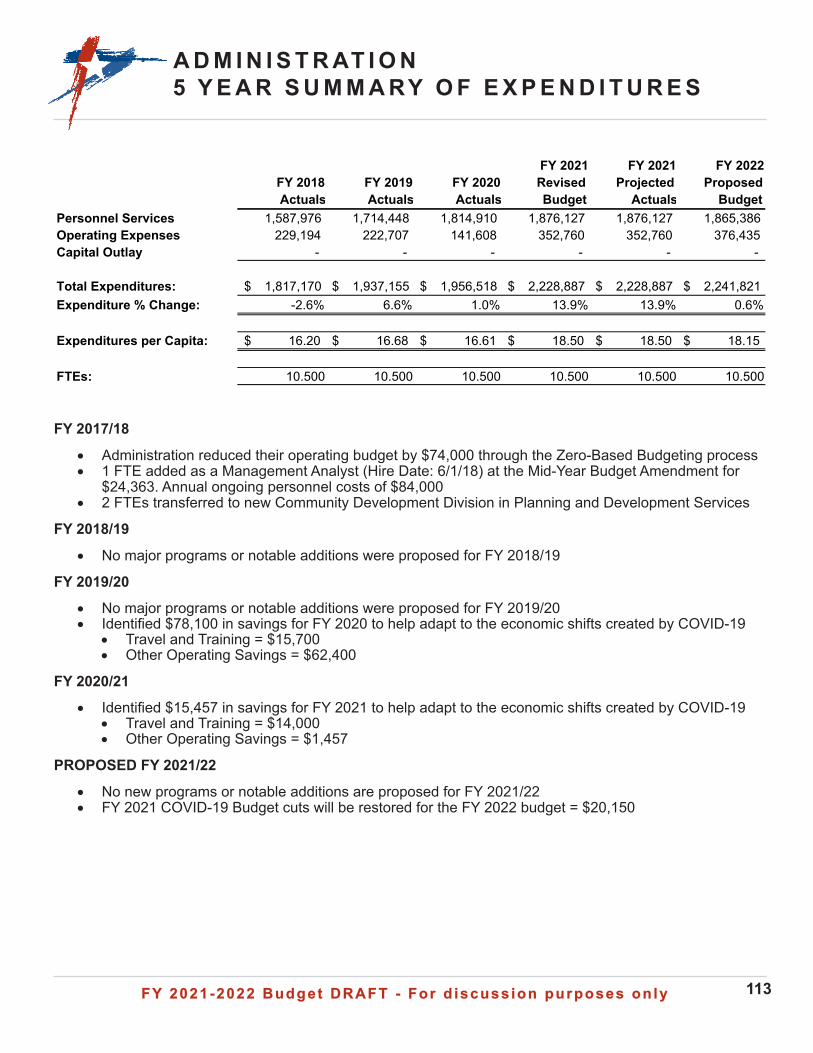
FY 2021-2022 Budget DRAFT - For d iscuss ion purposes on lyFY 2021-2022 Budget DRAFT - For d iscuss ion purposes on ly 113
A D M I N I S T R AT I O N5 Y E A R S U M M A RY O F E X P E N D I T U R E S
FY 2017/18
• Administration reduced their operating budget by $74,000 through the Zero-Based Budgeting process• 1 FTE added as a Management Analyst (Hire Date: 6/1/18) at the Mid-Year Budget Amendment for
$24,363. Annual ongoing personnel costs of $84,000• 2 FTEs transferred to new Community Development Division in Planning and Development Services
FY 2018/19
• No major programs or notable additions were proposed for FY 2018/19
FY 2019/20
• No major programs or notable additions were proposed for FY 2019/20• Identified $78,100 in savings for FY 2020 to help adapt to the economic shifts created by COVID-19
• Travel and Training = $15,700• Other Operating Savings = $62,400
FY 2020/21
• Identified $15,457 in savings for FY 2021 to help adapt to the economic shifts created by COVID-19• Travel and Training = $14,000• Other Operating Savings = $1,457
PROPOSED FY 2021/22
• No new programs or notable additions are proposed for FY 2021/22• FY 2021 COVID-19 Budget cuts will be restored for the FY 2022 budget = $20,150
FY 2018 Actuals
FY 2019 Actuals
FY 2020 Actuals
FY 2021 Revised Budget
FY 2021 Projected
Actuals
FY 2022 Proposed
BudgetPersonnel Services 1,587,976 1,714,448 1,814,910 1,876,127 1,876,127 1,865,386 Operating Expenses 229,194 222,707 141,608 352,760 352,760 376,435 Capital Outlay - - - - - -
Total Expenditures: 1,817,170$ 1,937,155$ 1,956,518$ 2,228,887$ 2,228,887$ 2,241,821$ Expenditure % Change: -2.6% 6.6% 1.0% 13.9% 13.9% 0.6%
Expenditures per Capita: 16.20$ 16.68$ 16.61$ 18.50$ 18.50$ 18.15$
FTEs: 10.500 10.500 10.500 10.500 10.500 10.500
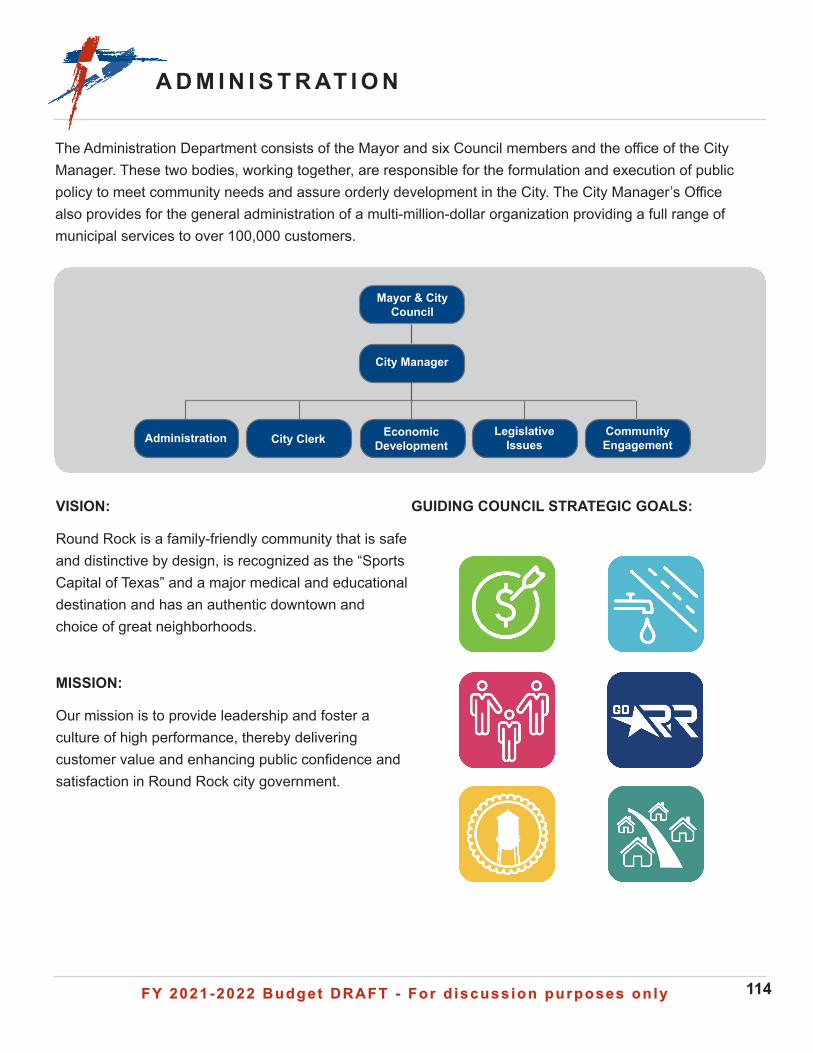
FY 2021-2022 Budget DRAFT - For d iscuss ion purposes on lyFY 2021-2022 Budget DRAFT - For d iscuss ion purposes on ly 114
A D M I N I S T R AT I O N
The Administration Department consists of the Mayor and six Council members and the office of the City Manager. These two bodies, working together, are responsible for the formulation and execution of public policy to meet community needs and assure orderly development in the City. The City Manager’s Office also provides for the general administration of a multi-million-dollar organization providing a full range of municipal services to over 100,000 customers.
VISION:
Round Rock is a family-friendly community that is safe and distinctive by design, is recognized as the “Sports Capital of Texas” and a major medical and educational destination and has an authentic downtown and choice of great neighborhoods.
MISSION:
Our mission is to provide leadership and foster a culture of high performance, thereby delivering customer value and enhancing public confidence and satisfaction in Round Rock city government.
GUIDING COUNCIL STRATEGIC GOALS:
Administration City Clerk Economic Development
Legislative Issues
Community Engagement
Mayor & City Council
City Manager
FY 2021-2022 Budget DRAFT - For d iscuss ion purposes on lyFY 2021-2022 Budget DRAFT - For d iscuss ion purposes on ly 115
A D M I N I S R AT I O N
FY 2023 OVERVIEW AND BEYOND:
• Continue to monitor legislation regarding destination based sales tax and how changes could potentially affect the City of Round Rock.
• Plan for a potential Bond Election 2023. • Continue discussions on the Redevelopment
Strategy for various areas throughout the City.
FY 2021 HIGHLIGHTS:
• Continued with the distribution of CDBG funds to the Round Rock community and the local serving center during the COVID-19 pandemic.
• The District, a mixed-use development, continued making progress with the approval of the Planned Unit Development (PUD) zoning.
FY 2022 OVERVIEW & SIGNIFICANT CHANGES:.
NEW PROGRAMS FOR FY 2022:
• No new programs were requested
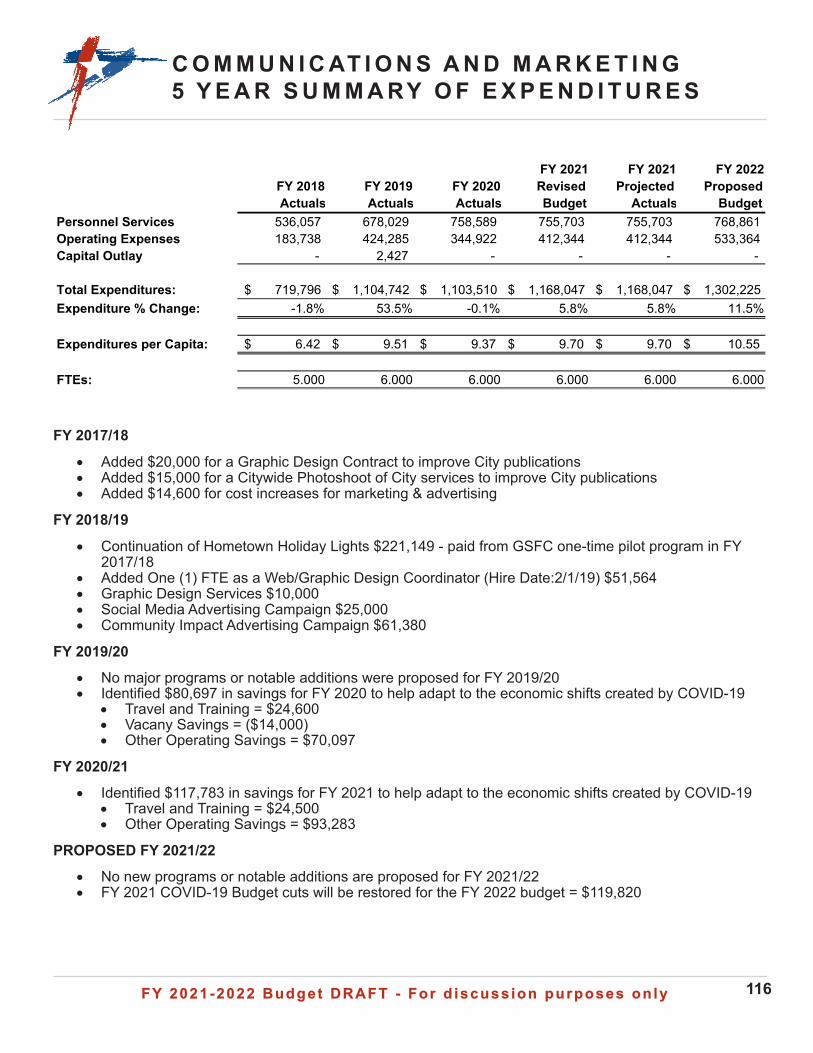
FY 2021-2022 Budget DRAFT - For d iscuss ion purposes on lyFY 2021-2022 Budget DRAFT - For d iscuss ion purposes on ly 116
C O M M U N I C AT I O N S A N D M A R K E T I N G5 Y E A R S U M M A RY O F E X P E N D I T U R E S
FY 2017/18
• Added $20,000 for a Graphic Design Contract to improve City publications• Added $15,000 for a Citywide Photoshoot of City services to improve City publications• Added $14,600 for cost increases for marketing & advertising
FY 2018/19
• Continuation of Hometown Holiday Lights $221,149 - paid from GSFC one-time pilot program in FY 2017/18
• Added One (1) FTE as a Web/Graphic Design Coordinator (Hire Date:2/1/19) $51,564• Graphic Design Services $10,000• Social Media Advertising Campaign $25,000• Community Impact Advertising Campaign $61,380
FY 2019/20• No major programs or notable additions were proposed for FY 2019/20• Identified $80,697 in savings for FY 2020 to help adapt to the economic shifts created by COVID-19
• Travel and Training = $24,600• Vacany Savings = ($14,000)• Other Operating Savings = $70,097
FY 2020/21
• Identified $117,783 in savings for FY 2021 to help adapt to the economic shifts created by COVID-19• Travel and Training = $24,500• Other Operating Savings = $93,283
PROPOSED FY 2021/22• No new programs or notable additions are proposed for FY 2021/22• FY 2021 COVID-19 Budget cuts will be restored for the FY 2022 budget = $119,820
FY 2018 Actuals
FY 2019 Actuals
FY 2020 Actuals
FY 2021 Revised Budget
FY 2021 Projected
Actuals
FY 2022 Proposed
BudgetPersonnel Services 536,057 678,029 758,589 755,703 755,703 768,861 Operating Expenses 183,738 424,285 344,922 412,344 412,344 533,364 Capital Outlay - 2,427 - - - -
Total Expenditures: 719,796$ 1,104,742$ 1,103,510$ 1,168,047$ 1,168,047$ 1,302,225$ Expenditure % Change: -1.8% 53.5% -0.1% 5.8% 5.8% 11.5%
Expenditures per Capita: 6.42$ 9.51$ 9.37$ 9.70$ 9.70$ 10.55$
FTEs: 5.000 6.000 6.000 6.000 6.000 6.000
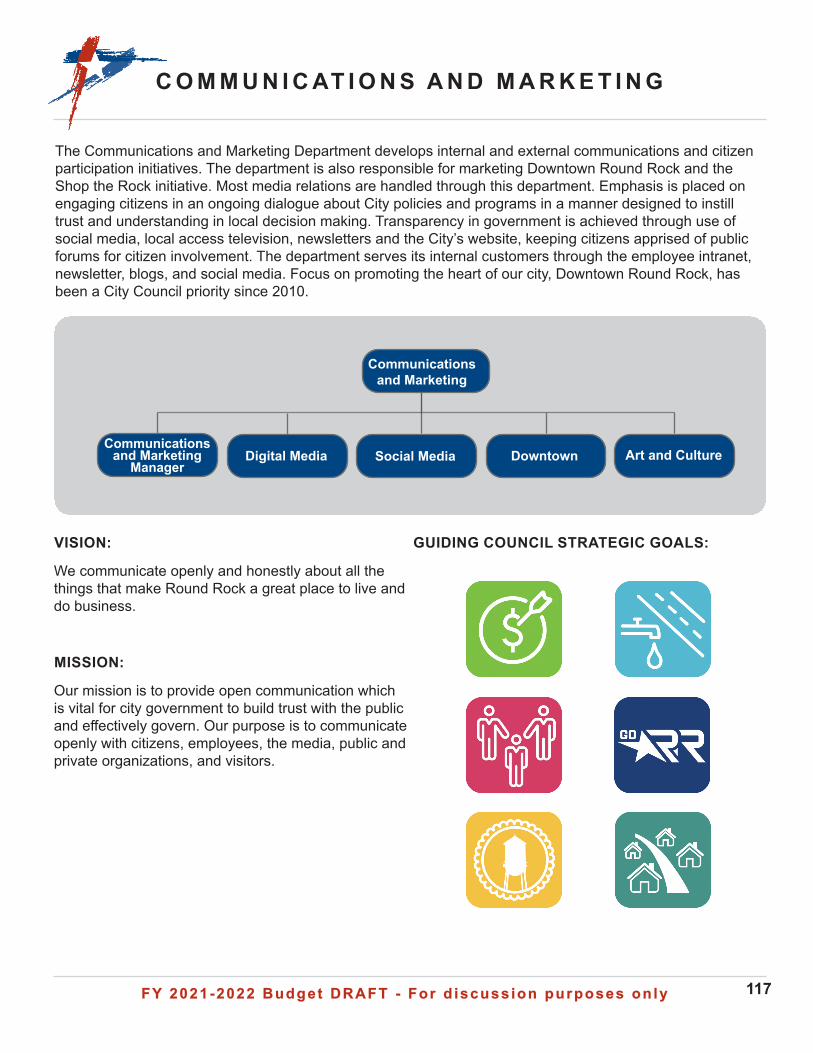
FY 2021-2022 Budget DRAFT - For d iscuss ion purposes on lyFY 2021-2022 Budget DRAFT - For d iscuss ion purposes on ly 117
C O M M U N I C AT I O N S A N D M A R K E T I N G
Digital Media Social Media Downtown Art and Culture
Communications and Marketing
Communications and Marketing
Manager
The Communications and Marketing Department develops internal and external communications and citizen participation initiatives. The department is also responsible for marketing Downtown Round Rock and the Shop the Rock initiative. Most media relations are handled through this department. Emphasis is placed on engaging citizens in an ongoing dialogue about City policies and programs in a manner designed to instill trust and understanding in local decision making. Transparency in government is achieved through use of social media, local access television, newsletters and the City’s website, keeping citizens apprised of public forums for citizen involvement. The department serves its internal customers through the employee intranet, newsletter, blogs, and social media. Focus on promoting the heart of our city, Downtown Round Rock, has been a City Council priority since 2010.
VISION:
We communicate openly and honestly about all the things that make Round Rock a great place to live and do business.
MISSION:
Our mission is to provide open communication which is vital for city government to build trust with the public and effectively govern. Our purpose is to communicate openly with citizens, employees, the media, public and private organizations, and visitors.
GUIDING COUNCIL STRATEGIC GOALS:
FY 2021-2022 Budget DRAFT - For d iscuss ion purposes on lyFY 2021-2022 Budget DRAFT - For d iscuss ion purposes on ly 118
C O M M U N I C AT I O N S A N D M A R K E T I N G
FY 2022 OVERVIEW & SIGNIFICANT CHANGES:
• Assist Arts and Culture with public input and outreach for a new Arts Master Plan
NEW PROGRAMS FOR FY 2022:
• No new programs were requested
FY 2023 OVERVIEW & BEYOND:
• Continue to create dynamic, compelling content on available platforms, be they print or digital, on critical issues like capital needs (i.e. bonds), transportation challenges, budget and tax.
• Build and enhance the Downtown brand as the area grows and evolves.
• Increased focus on advertising in digital media as a potential avenue to disseminate messaging.
FY 2021 HIGHLIGHTS::
• Continued making enhancements to the City’s digital presence, including a redesign to roundrocktexas.gov
• Provided essential information during Winter Storm Uri, including 34 Facebook posts that receives a total of 1,998,418 impressions and 174,492 engagements (likes, comments, and shares)
• Continued Driving Progress campaign to push information to residents about the City’s five-year transportation plan
• Completed first phase of a production studio using PEG funds for expanded and varied video programming as the digital communications landscape continues to evolve
• Working with IT and Administration Departments, implemented Zoom integration to allow for recording of City meetings with remote participation
• Led communications efforts throughout COVID-19 pandemic. Created 129 posts on Facebook that had a total of 7,458,325 impressions and 766,178 engagements (likes, comments, and shares)
• Supported communication with downtown stakeholders throughout COVID-19
• Implemented curbside pickup signage in Downtown.
• Purchased and placed new furniture in Downtown parklets
• Conducted biennial City-wode survey and created a recap video
• Assisted Transportation Department with virtual public input process for several road projects, and Parks and Recreation Deaprtment with recreational center assessment
• Partnered on branding project with Library marketing team as the Department sprepares to move into its new facility
• Maintained a comprehensive web hub in response to COVID-19
• Promoted opening if Kalahri Resorts and Conventions in Round Rock, with 14,189,780 impressions and 1,943,095 engagements (likes, comments, and shares) across eight Facebook posts
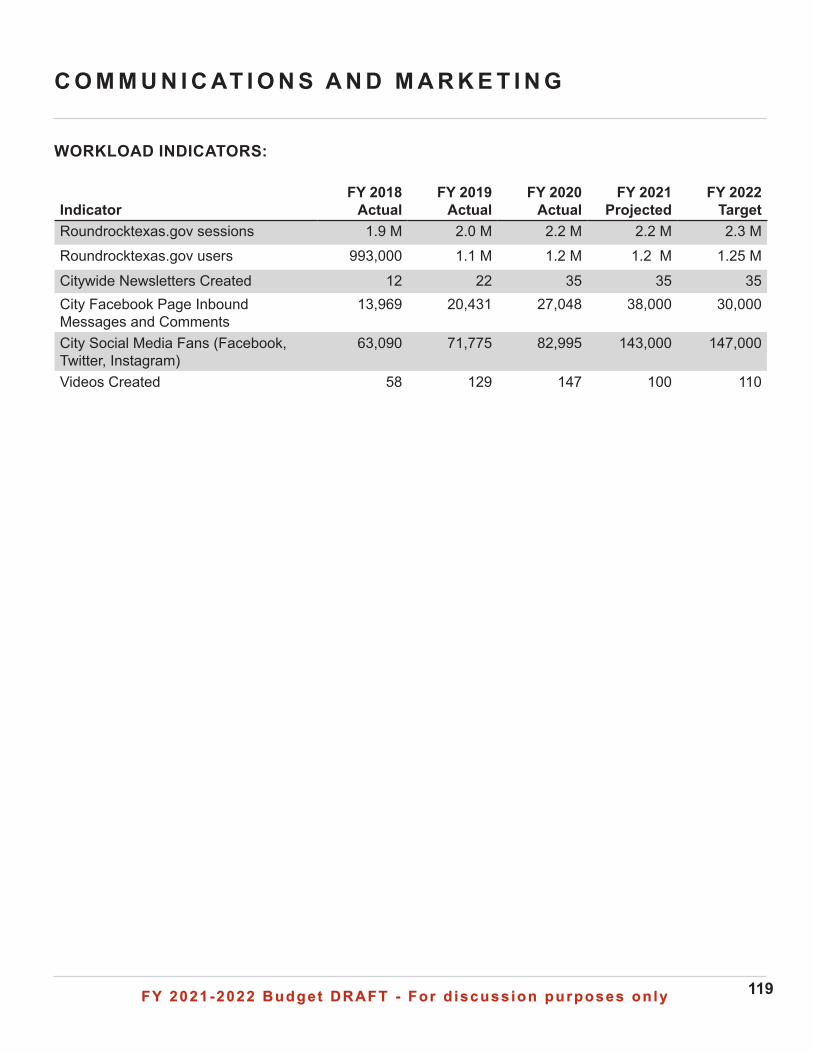
FY 2021-2022 Budget DRAFT - For d iscuss ion purposes on lyFY 2021-2022 Budget DRAFT - For d iscuss ion purposes on ly 119
C O M M U N I C AT I O N S A N D M A R K E T I N G
WORKLOAD INDICATORS:
IndicatorFY 2018 Actual
FY 2019Actual
FY 2020 Actual
FY 2021Projected
FY 2022Target
Roundrocktexas.gov sessions 1.9 M 2.0 M 2.2 M 2.2 M 2.3 MRoundrocktexas.gov users 993,000 1.1 M 1.2 M 1.2 M 1.25 M
Citywide Newsletters Created 12 22 35 35 35City Facebook Page Inbound Messages and Comments
13,969 20,431 27,048 38,000 30,000
City Social Media Fans (Facebook, Twitter, Instagram)
63,090 71,775 82,995 143,000 147,000
Videos Created 58 129 147 100 110
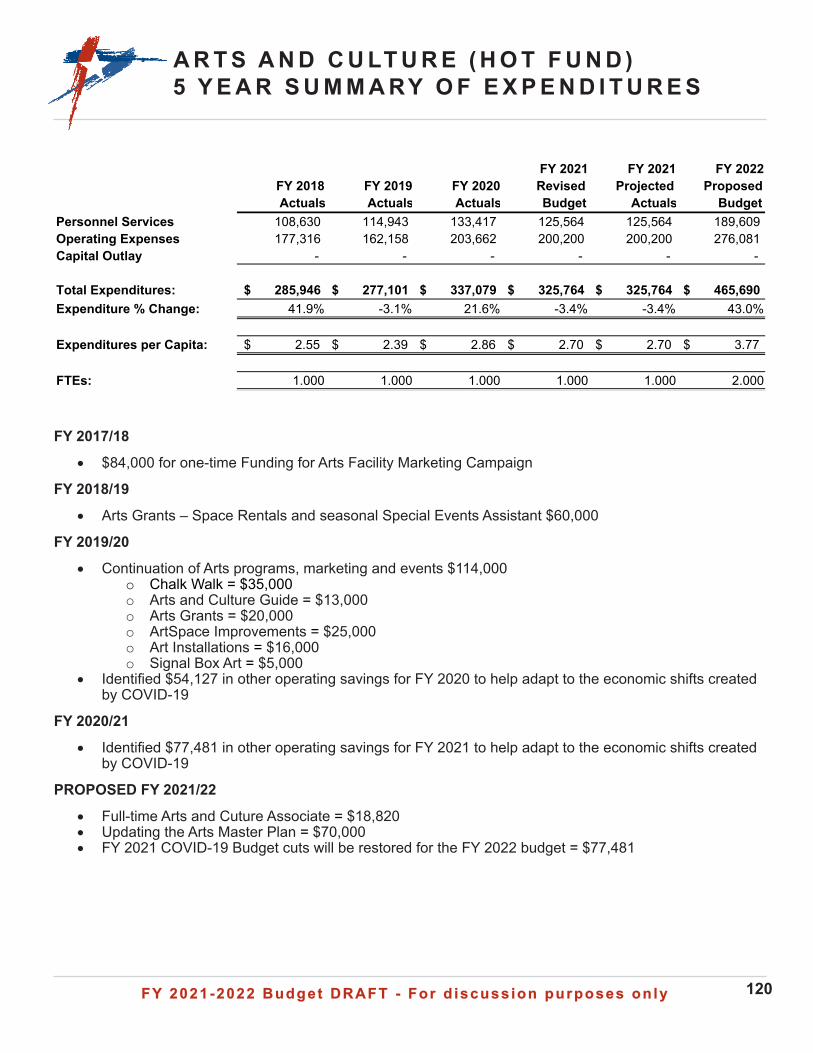
FY 2021-2022 Budget DRAFT - For d iscuss ion purposes on lyFY 2021-2022 Budget DRAFT - For d iscuss ion purposes on ly 120
A R T S A N D C U LT U R E ( H O T F U N D )5 Y E A R S U M M A RY O F E X P E N D I T U R E S
FY 2017/18
• $84,000 for one-time Funding for Arts Facility Marketing Campaign
FY 2018/19
• Arts Grants – Space Rentals and seasonal Special Events Assistant $60,000
FY 2019/20
• Continuation of Arts programs, marketing and events $114,000o Chalk Walk = $35,000o Arts and Culture Guide = $13,000o Arts Grants = $20,000o ArtSpace Improvements = $25,000o Art Installations = $16,000o Signal Box Art = $5,000
• Identified $54,127 in other operating savings for FY 2020 to help adapt to the economic shifts created by COVID-19
FY 2020/21
• Identified $77,481 in other operating savings for FY 2021 to help adapt to the economic shifts created by COVID-19
PROPOSED FY 2021/22
• Full-time Arts and Cuture Associate = $18,820• Updating the Arts Master Plan = $70,000• FY 2021 COVID-19 Budget cuts will be restored for the FY 2022 budget = $77,481
FY 2018 Actuals
FY 2019 Actuals
FY 2020 Actuals
FY 2021 Revised Budget
FY 2021 Projected
Actuals
FY 2022 Proposed
BudgetPersonnel Services 108,630 114,943 133,417 125,564 125,564 189,609 Operating Expenses 177,316 162,158 203,662 200,200 200,200 276,081 Capital Outlay - - - - - -
Total Expenditures: 285,946$ 277,101$ 337,079$ 325,764$ 325,764$ 465,690$ Expenditure % Change: 41.9% -3.1% 21.6% -3.4% -3.4% 43.0%
Expenditures per Capita: 2.55$ 2.39$ 2.86$ 2.70$ 2.70$ 3.77$
FTEs: 1.000 1.000 1.000 1.000 1.000 2.000
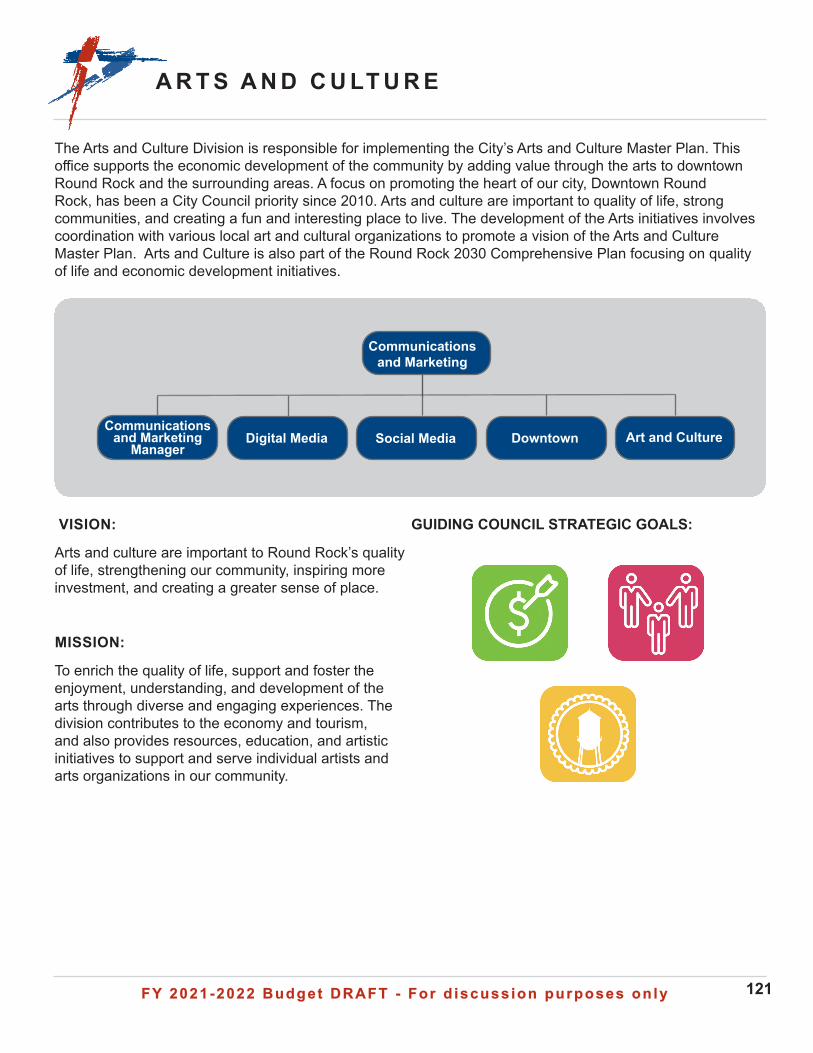
FY 2021-2022 Budget DRAFT - For d iscuss ion purposes on lyFY 2021-2022 Budget DRAFT - For d iscuss ion purposes on ly 121
A R T S A N D C U LT U R E
Digital Media Social Media Downtown Art and Culture
Communications and Marketing
Communications and Marketing
Manager
The Arts and Culture Division is responsible for implementing the City’s Arts and Culture Master Plan. This office supports the economic development of the community by adding value through the arts to downtown Round Rock and the surrounding areas. A focus on promoting the heart of our city, Downtown Round Rock, has been a City Council priority since 2010. Arts and culture are important to quality of life, strong communities, and creating a fun and interesting place to live. The development of the Arts initiatives involves coordination with various local art and cultural organizations to promote a vision of the Arts and Culture Master Plan. Arts and Culture is also part of the Round Rock 2030 Comprehensive Plan focusing on quality of life and economic development initiatives.
VISION:
Arts and culture are important to Round Rock’s quality of life, strengthening our community, inspiring more investment, and creating a greater sense of place.
MISSION:
To enrich the quality of life, support and foster the enjoyment, understanding, and development of the arts through diverse and engaging experiences. The division contributes to the economy and tourism, and also provides resources, education, and artistic initiatives to support and serve individual artists and arts organizations in our community.
GUIDING COUNCIL STRATEGIC GOALS:
FY 2021-2022 Budget DRAFT - For d iscuss ion purposes on lyFY 2021-2022 Budget DRAFT - For d iscuss ion purposes on ly 122
A R T S A N D C U LT U R E
NEW PROGRAMS FOR FY 2022:
• Converted a partime to a fulltime Arts and Culture Associate
• Focus on the Arts and Culture Master Plan update to provide the City with a road map for arts growth and investment for the coming years.
FY 2023 OVERVIEW AND BEYOND:
• Arts and Culture will review the Arts and Culture Master Plan, update key compnenets and follow suggestions that align with the City’s 2030 Plan. Might include a small perfromance space.
FY 2021 HIGHLIGHTS:
• Awarded grants to 10 different arts organizations.
• Round Rock became certified as a Texas Music Friendly Community from the Texas Music Office/Office of the Governor.
• Music on Main restarted with a kick-off concert by Dale Watson and the series was extended through June 2021 with a Fall Series.
• The Downtowner Gallery had a record breaking increase of visitors with more art sold than ever in its 10-year history.
• Chalk Walk Arts Festival returns to Dell Diamond
• Showcasing of artists in City Council Chambers
• Continued placement of art sculptures in Downtown
• Upkeep of web pages and calendar• Grew our social media presence.
FY 2022 OVERVIEW & SIGNIFICANT CHANGES:
• Will produce 80-plus arts and culture events per year
• Will continue to administer Arts and Culture grants
• Continue emphasis on increasing social media efforts
• Work with community arts groups and businesses to bounce back from a non-existent year due to COVID-19 protocols
• Continuation of partnership with Round Rock ISD Fine Arts.
• Each year over 250,000 people attend an arts related event in Round Rock making a local economic impact of over $7.8 million.
• Providing more arts events and developing more supporters of the arts to our family-oriented community.
• Reinstating crowd favorites like Chalk Walk Arts Festival, Downtowner gallery artist receptions and expanding Beaujolais Nights in Downtown Round Rock.
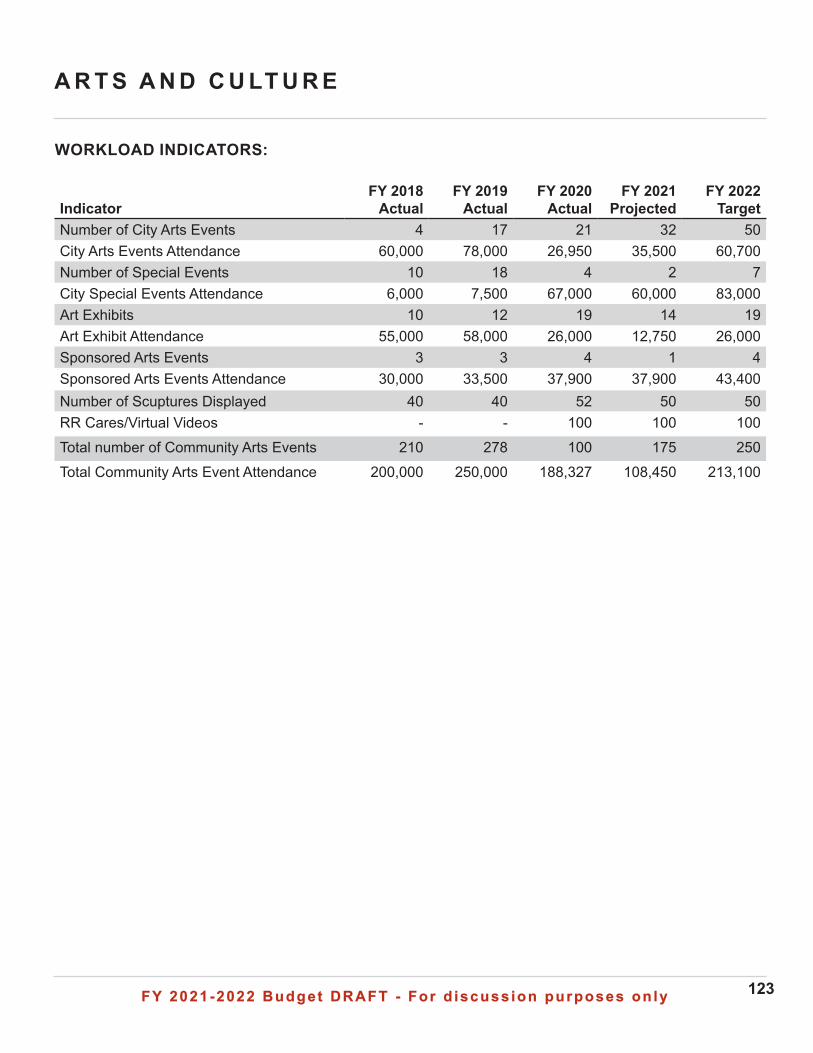
FY 2021-2022 Budget DRAFT - For d iscuss ion purposes on lyFY 2021-2022 Budget DRAFT - For d iscuss ion purposes on ly 123
A R T S A N D C U LT U R E
IndicatorFY 2018 Actual
FY 2019Actual
FY 2020 Actual
FY 2021 Projected
FY 2022 Target
Number of City Arts Events 4 17 21 32 50City Arts Events Attendance 60,000 78,000 26,950 35,500 60,700Number of Special Events 10 18 4 2 7City Special Events Attendance 6,000 7,500 67,000 60,000 83,000Art Exhibits 10 12 19 14 19Art Exhibit Attendance 55,000 58,000 26,000 12,750 26,000Sponsored Arts Events 3 3 4 1 4Sponsored Arts Events Attendance 30,000 33,500 37,900 37,900 43,400Number of Scuptures Displayed 40 40 52 50 50RR Cares/Virtual Videos - - 100 100 100Total number of Community Arts Events 210 278 100 175 250Total Community Arts Event Attendance 200,000 250,000 188,327 108,450 213,100
WORKLOAD INDICATORS:
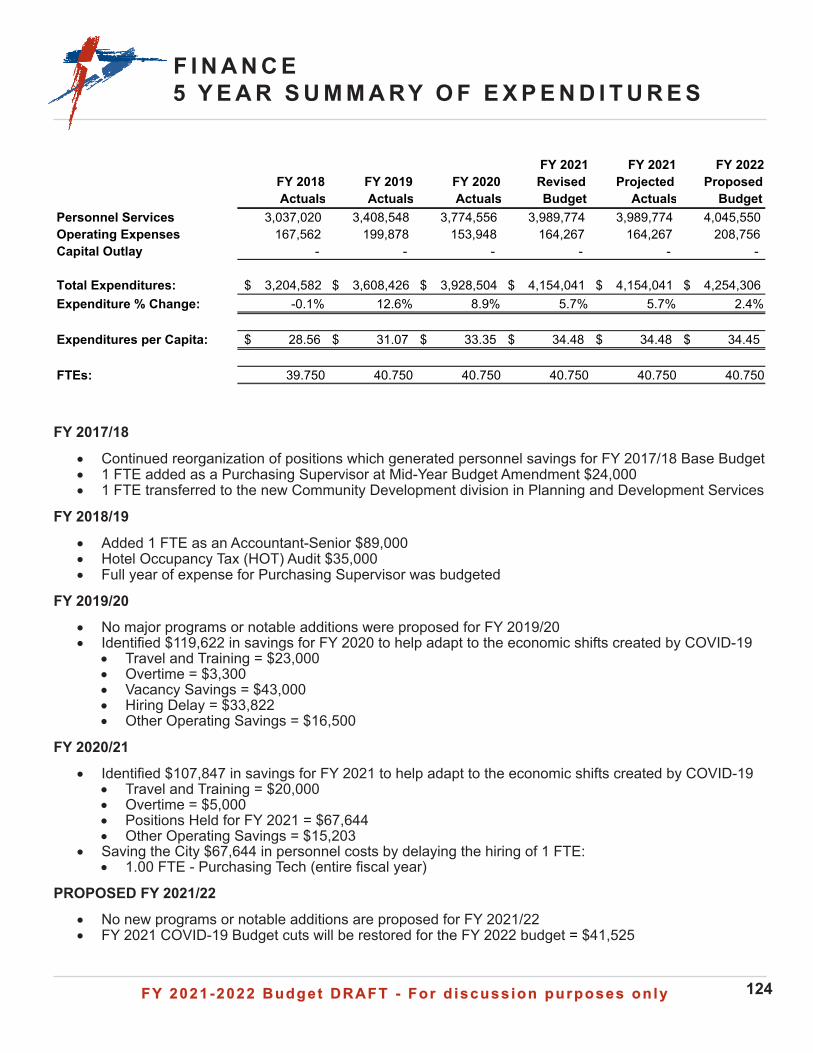
FY 2021-2022 Budget DRAFT - For d iscuss ion purposes on lyFY 2021-2022 Budget DRAFT - For d iscuss ion purposes on ly 124
F I N A N C E5 Y E A R S U M M A RY O F E X P E N D I T U R E S
FY 2017/18
• Continued reorganization of positions which generated personnel savings for FY 2017/18 Base Budget• 1 FTE added as a Purchasing Supervisor at Mid-Year Budget Amendment $24,000• 1 FTE transferred to the new Community Development division in Planning and Development Services
FY 2018/19
• Added 1 FTE as an Accountant-Senior $89,000 • Hotel Occupancy Tax (HOT) Audit $35,000• Full year of expense for Purchasing Supervisor was budgeted
FY 2019/20• No major programs or notable additions were proposed for FY 2019/20• Identified $119,622 in savings for FY 2020 to help adapt to the economic shifts created by COVID-19
• Travel and Training = $23,000• Overtime = $3,300• Vacancy Savings = $43,000• Hiring Delay = $33,822• Other Operating Savings = $16,500
FY 2020/21
• Identified $107,847 in savings for FY 2021 to help adapt to the economic shifts created by COVID-19• Travel and Training = $20,000• Overtime = $5,000• Positions Held for FY 2021 = $67,644• Other Operating Savings = $15,203
• Saving the City $67,644 in personnel costs by delaying the hiring of 1 FTE:• 1.00 FTE - Purchasing Tech (entire fiscal year)
PROPOSED FY 2021/22• No new programs or notable additions are proposed for FY 2021/22• FY 2021 COVID-19 Budget cuts will be restored for the FY 2022 budget = $41,525
FY 2018 Actuals
FY 2019 Actuals
FY 2020 Actuals
FY 2021 Revised Budget
FY 2021 Projected
Actuals
FY 2022 Proposed
BudgetPersonnel Services 3,037,020 3,408,548 3,774,556 3,989,774 3,989,774 4,045,550 Operating Expenses 167,562 199,878 153,948 164,267 164,267 208,756 Capital Outlay - - - - - -
Total Expenditures: 3,204,582$ 3,608,426$ 3,928,504$ 4,154,041$ 4,154,041$ 4,254,306$ Expenditure % Change: -0.1% 12.6% 8.9% 5.7% 5.7% 2.4%
Expenditures per Capita: 28.56$ 31.07$ 33.35$ 34.48$ 34.48$ 34.45$
FTEs: 39.750 40.750 40.750 40.750 40.750 40.750
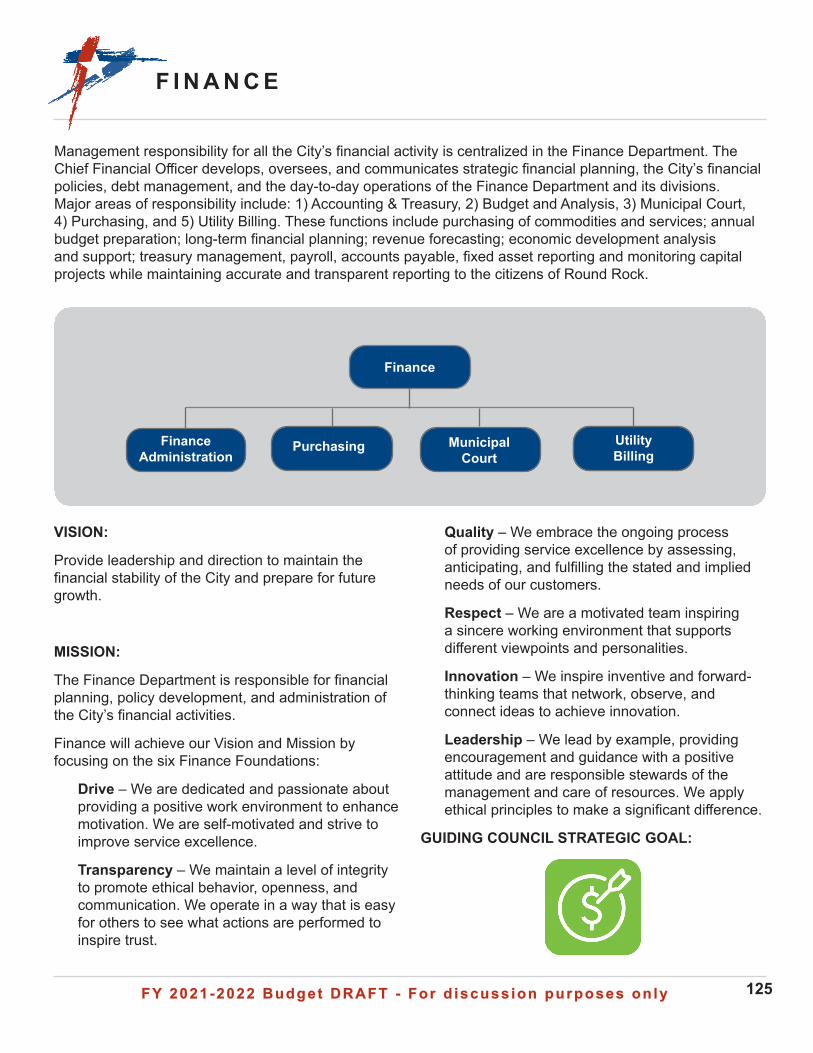
FY 2021-2022 Budget DRAFT - For d iscuss ion purposes on lyFY 2021-2022 Budget DRAFT - For d iscuss ion purposes on ly 125
F I N A N C E
Finance Administration
Purchasing
Finance
Utility Billing
MunicipalCourt
Management responsibility for all the City’s financial activity is centralized in the Finance Department. The Chief Financial Officer develops, oversees, and communicates strategic financial planning, the City’s financial policies, debt management, and the day-to-day operations of the Finance Department and its divisions. Major areas of responsibility include: 1) Accounting & Treasury, 2) Budget and Analysis, 3) Municipal Court, 4) Purchasing, and 5) Utility Billing. These functions include purchasing of commodities and services; annual budget preparation; long-term financial planning; revenue forecasting; economic development analysis and support; treasury management, payroll, accounts payable, fixed asset reporting and monitoring capital projects while maintaining accurate and transparent reporting to the citizens of Round Rock.
VISION:
Provide leadership and direction to maintain the financial stability of the City and prepare for future growth.
MISSION:
The Finance Department is responsible for financial planning, policy development, and administration of the City’s financial activities.
Finance will achieve our Vision and Mission by focusing on the six Finance Foundations:
Drive – We are dedicated and passionate about providing a positive work environment to enhance motivation. We are self-motivated and strive to improve service excellence.
Transparency – We maintain a level of integrity to promote ethical behavior, openness, and communication. We operate in a way that is easy for others to see what actions are performed to inspire trust.
Quality – We embrace the ongoing process of providing service excellence by assessing, anticipating, and fulfilling the stated and implied needs of our customers.
Respect – We are a motivated team inspiring a sincere working environment that supports different viewpoints and personalities.
Innovation – We inspire inventive and forward-thinking teams that network, observe, and connect ideas to achieve innovation.
Leadership – We lead by example, providing encouragement and guidance with a positive attitude and are responsible stewards of the management and care of resources. We apply ethical principles to make a significant difference.
GUIDING COUNCIL STRATEGIC GOAL:
FY 2021-2022 Budget DRAFT - For d iscuss ion purposes on lyFY 2021-2022 Budget DRAFT - For d iscuss ion purposes on ly 126
F I N A N C E
FY 2022 OVERVIEW AND SIGNIFICANTCHANGES:
• Issue Certificates of Obligation for year 4 of 5-year Roadway Expansion program
• Issue final $21.7 million of 2013 voter approved bonds for new downtown Library
• Complete utility rate models and recommendations to Council and wholesale customers
• Monitor and manage spend of American Rescue Plan Act (ARPA) federal funding
• Develop financial strategies and options for future projects and priorities for a potential FY 2023 bond election
• Update City financial plan & model as economic and financial conditions change
• Implement Statement No. 87 of the Governmental Accounting Standards Board related to improving accounting and financial reporting for leases
• Expand internal efficiencies by deploying electronic signatures for contracting and implementing electronic bid module for solicitations
NEW PROGRAMS FOR FY 2022:
• No new programs were requested
FY 2023 OVERVIEW AND BEYOND:
• Continue to proactively monitor and manage long-term financial stability for the City
FY 2021 HIGHLIGHTS:
• Successfully managed City financial status during pandemic-related economic uncertainty and recovery
• Awarded the fifth & final transparency star – Contracts & Procurement – from the Texas Comptroller of Public Accounts.
• Conducted 5 bond sales for City and Kalahari projects, including receiving upgrade from S&P on Type B Sales Tax Revenue Bonds to AA- from A+
• Awarded the Triple Crown by the Government Finance Officers Association which recognized the City for receiving all three GFOA awards for fiscal year 2019 - the Certificate of Achievement for Excellence in Financial Reporting Award, Distinguished Budget Presentation Award, and the Popular Annual Financial Reporting Award
• Conducted hotel occupancy tax audits on hotels and short-term rentals to help ensure the City is receiving the correct level of tourism-related revenues
• Transitioned Court to paperless case files and dockets
• Adapted Finance operations and services during the pandemic to continue to serve internal and external customers in a timely and seamless fashion
• Implemented state rebates and incentive monitoring for Kalahari agreement
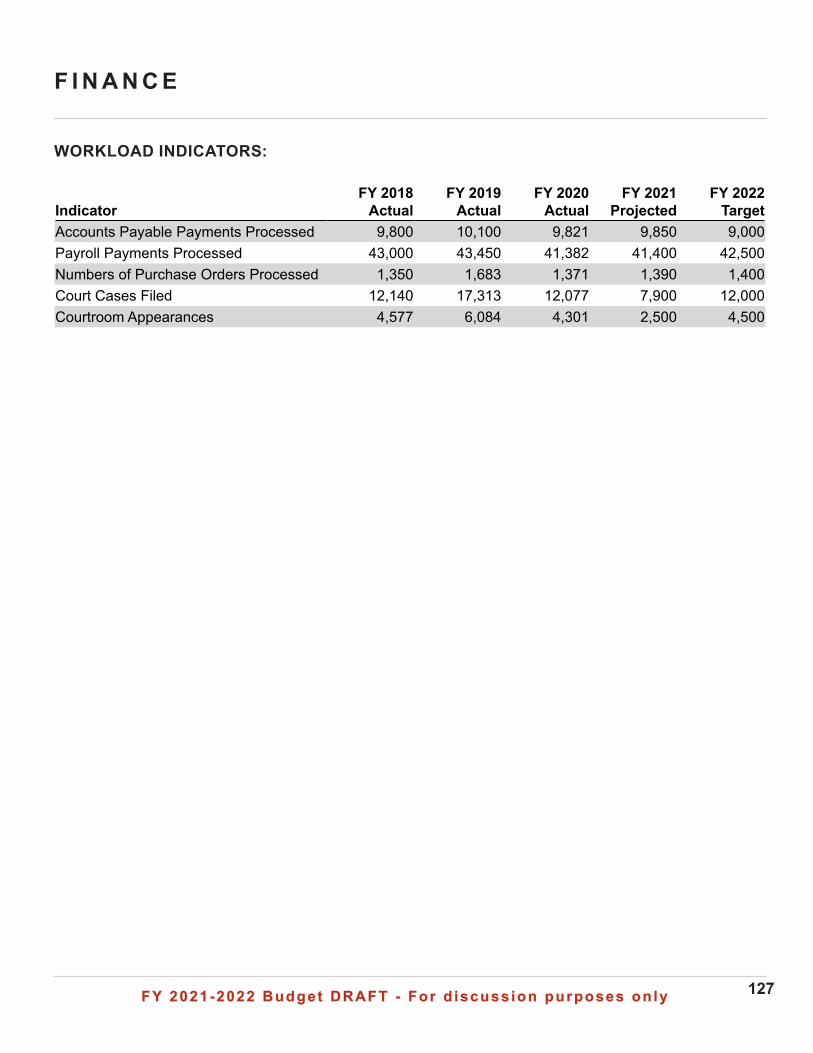
FY 2021-2022 Budget DRAFT - For d iscuss ion purposes on lyFY 2021-2022 Budget DRAFT - For d iscuss ion purposes on ly 127
F I N A N C E
Indicator FY 2018
Actual FY 2019
Actual FY 2020
Actual FY 2021
Projected FY 2022
Target Accounts Payable Payments Processed 9,800 10,100 9,821 9,850 9,000 Payroll Payments Processed 43,000 43,450 41,382 41,400 42,500Numbers of Purchase Orders Processed 1,350 1,683 1,371 1,390 1,400 Court Cases Filed 12,140 17,313 12,077 7,900 12,000 Courtroom Appearances 4,577 6,084 4,301 2,500 4,500
WORKLOAD INDICATORS:
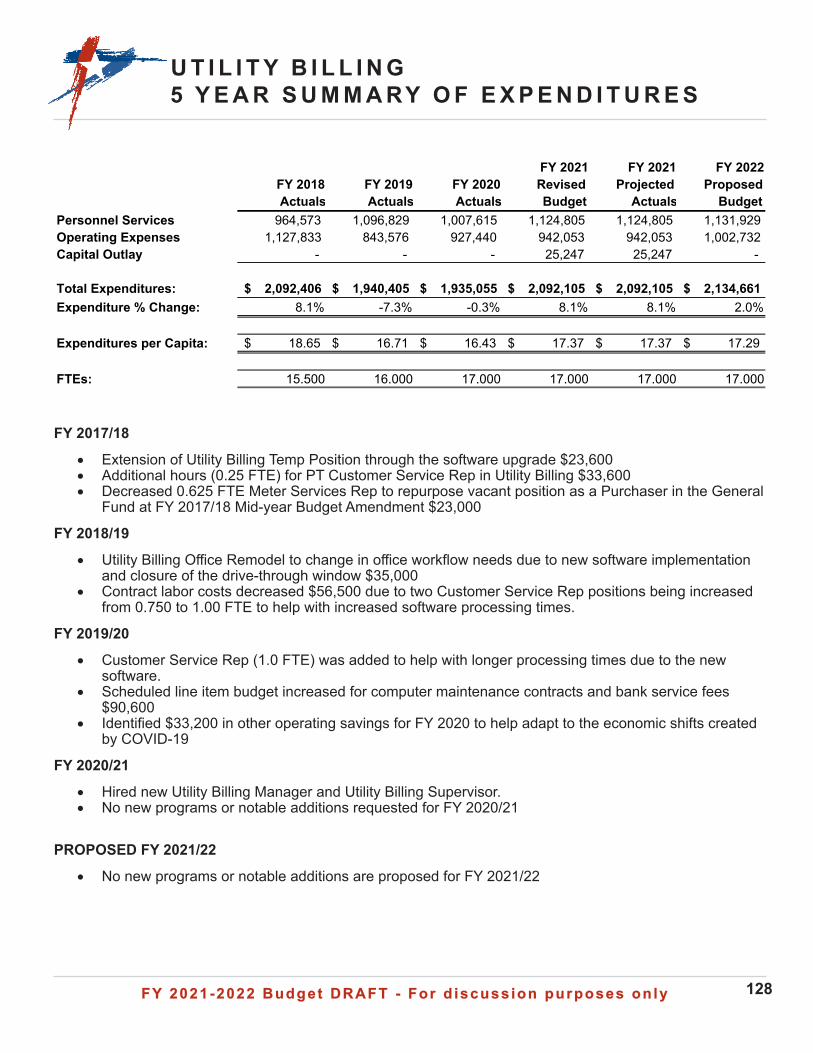
FY 2021-2022 Budget DRAFT - For d iscuss ion purposes on lyFY 2021-2022 Budget DRAFT - For d iscuss ion purposes on ly 128
U T I L I T Y B I L L I N G5 Y E A R S U M M A RY O F E X P E N D I T U R E S
FY 2017/18
• Extension of Utility Billing Temp Position through the software upgrade $23,600 • Additional hours (0.25 FTE) for PT Customer Service Rep in Utility Billing $33,600 • Decreased 0.625 FTE Meter Services Rep to repurpose vacant position as a Purchaser in the General
Fund at FY 2017/18 Mid-year Budget Amendment $23,000
FY 2018/19
• Utility Billing Office Remodel to change in office workflow needs due to new software implementation and closure of the drive-through window $35,000
• Contract labor costs decreased $56,500 due to two Customer Service Rep positions being increased from 0.750 to 1.00 FTE to help with increased software processing times.
FY 2019/20
• Customer Service Rep (1.0 FTE) was added to help with longer processing times due to the new software.
• Scheduled line item budget increased for computer maintenance contracts and bank service fees $90,600
• Identified $33,200 in other operating savings for FY 2020 to help adapt to the economic shifts created by COVID-19
FY 2020/21
• Hired new Utility Billing Manager and Utility Billing Supervisor.• No new programs or notable additions requested for FY 2020/21
PROPOSED FY 2021/22
• No new programs or notable additions are proposed for FY 2021/22
FY 2018 Actuals
FY 2019 Actuals
FY 2020 Actuals
FY 2021 Revised Budget
FY 2021 Projected
Actuals
FY 2022 Proposed
BudgetPersonnel Services 964,573 1,096,829 1,007,615 1,124,805 1,124,805 1,131,929 Operating Expenses 1,127,833 843,576 927,440 942,053 942,053 1,002,732 Capital Outlay - - - 25,247 25,247 -
Total Expenditures: 2,092,406$ 1,940,405$ 1,935,055$ 2,092,105$ 2,092,105$ 2,134,661$ Expenditure % Change: 8.1% -7.3% -0.3% 8.1% 8.1% 2.0%
Expenditures per Capita: 18.65$ 16.71$ 16.43$ 17.37$ 17.37$ 17.29$
FTEs: 15.500 16.000 17.000 17.000 17.000 17.000
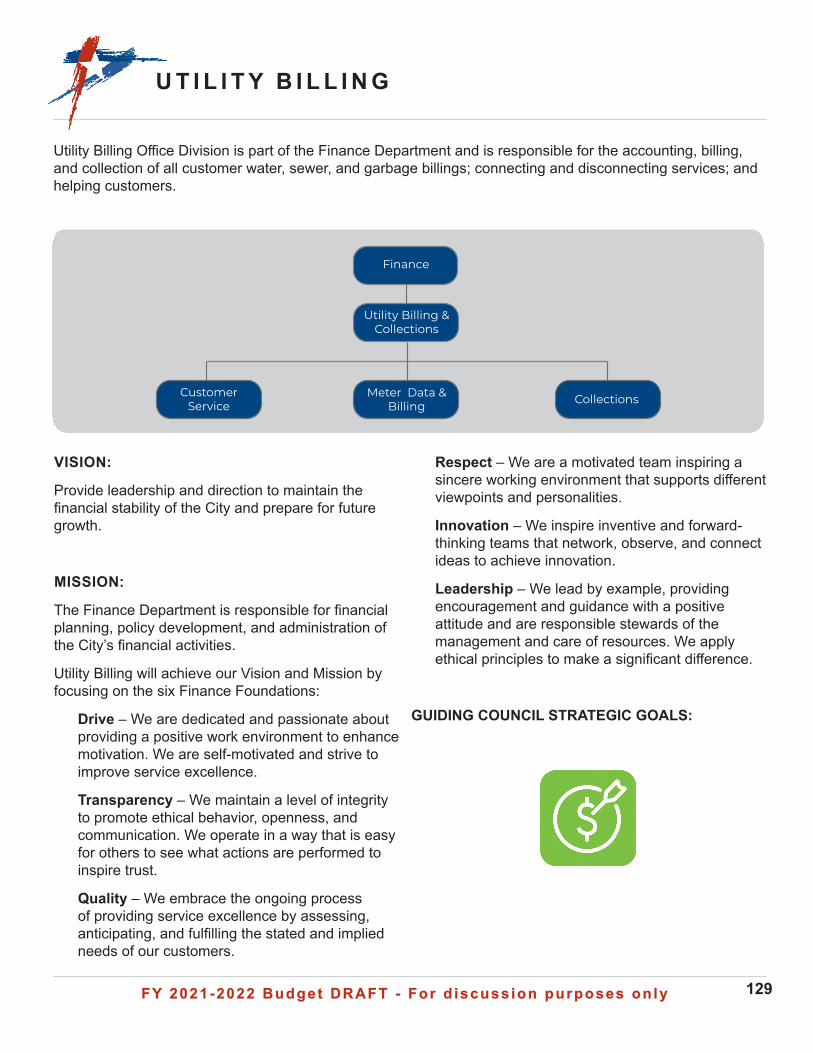
FY 2021-2022 Budget DRAFT - For d iscuss ion purposes on lyFY 2021-2022 Budget DRAFT - For d iscuss ion purposes on ly 129
U T I L I T Y B I L L I N G
Utility Billing Office Division is part of the Finance Department and is responsible for the accounting, billing, and collection of all customer water, sewer, and garbage billings; connecting and disconnecting services; and helping customers.
VISION:
Provide leadership and direction to maintain the financial stability of the City and prepare for future growth.
MISSION:
The Finance Department is responsible for financial planning, policy development, and administration of the City’s financial activities.
Utility Billing will achieve our Vision and Mission by focusing on the six Finance Foundations:
Drive – We are dedicated and passionate about providing a positive work environment to enhance motivation. We are self-motivated and strive to improve service excellence.
Transparency – We maintain a level of integrity to promote ethical behavior, openness, and communication. We operate in a way that is easy for others to see what actions are performed to inspire trust.
Quality – We embrace the ongoing process of providing service excellence by assessing, anticipating, and fulfilling the stated and implied needs of our customers.
Respect – We are a motivated team inspiring a sincere working environment that supports different viewpoints and personalities.
Innovation – We inspire inventive and forward-thinking teams that network, observe, and connect ideas to achieve innovation.
Leadership – We lead by example, providing encouragement and guidance with a positive attitude and are responsible stewards of the management and care of resources. We apply ethical principles to make a significant difference.
GUIDING COUNCIL STRATEGIC GOALS:
Customer Service
Meter Data & Billing Collections
Utility Billing & Collections
Finance
Lorem ipsum
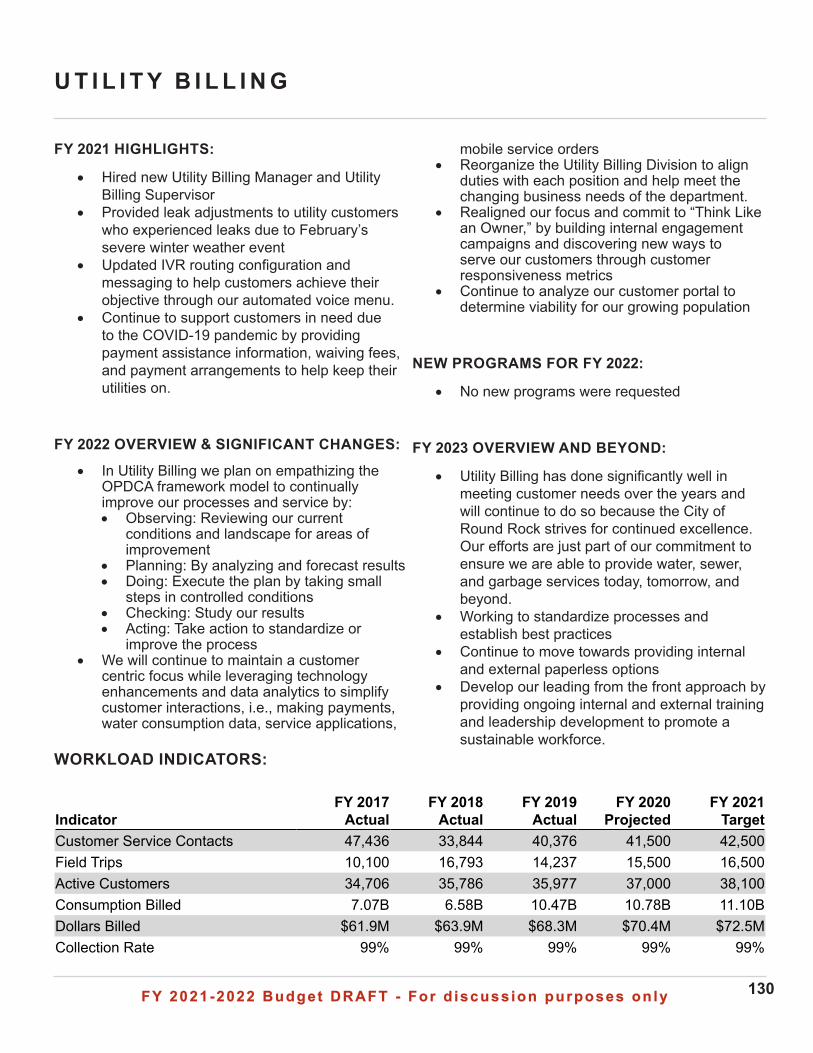
FY 2021-2022 Budget DRAFT - For d iscuss ion purposes on lyFY 2021-2022 Budget DRAFT - For d iscuss ion purposes on ly 130
U T I L I T Y B I L L I N G
WORKLOAD INDICATORS:
mobile service orders • Reorganize the Utility Billing Division to align
duties with each position and help meet the changing business needs of the department.
• Realigned our focus and commit to “Think Like an Owner,” by building internal engagement campaigns and discovering new ways to serve our customers through customer responsiveness metrics
• Continue to analyze our customer portal to determine viability for our growing population
NEW PROGRAMS FOR FY 2022:
• No new programs were requested
FY 2023 OVERVIEW AND BEYOND:
• Utility Billing has done significantly well in meeting customer needs over the years and will continue to do so because the City of Round Rock strives for continued excellence. Our efforts are just part of our commitment to ensure we are able to provide water, sewer, and garbage services today, tomorrow, and beyond.
• Working to standardize processes and establish best practices
• Continue to move towards providing internal and external paperless options
• Develop our leading from the front approach by providing ongoing internal and external training and leadership development to promote a sustainable workforce.
FY 2021 HIGHLIGHTS:
• Hired new Utility Billing Manager and Utility Billing Supervisor
• Provided leak adjustments to utility customers who experienced leaks due to February’s severe winter weather event
• Updated IVR routing configuration and messaging to help customers achieve their objective through our automated voice menu.
• Continue to support customers in need due to the COVID-19 pandemic by providing payment assistance information, waiving fees, and payment arrangements to help keep their utilities on.
FY 2022 OVERVIEW & SIGNIFICANT CHANGES:
• In Utility Billing we plan on empathizing the OPDCA framework model to continually improve our processes and service by:• Observing: Reviewing our current
conditions and landscape for areas of improvement
• Planning: By analyzing and forecast results • Doing: Execute the plan by taking small
steps in controlled conditions • Checking: Study our results • Acting: Take action to standardize or
improve the process • We will continue to maintain a customer
centric focus while leveraging technology enhancements and data analytics to simplify customer interactions, i.e., making payments, water consumption data, service applications,
Indicator FY 2017
Actual FY 2018
Actual FY 2019
Actual FY 2020
Projected FY 2021
Target Customer Service Contacts 47,436 33,844 40,376 41,500 42,500 Field Trips 10,100 16,793 14,237 15,500 16,500 Active Customers 34,706 35,786 35,977 37,000 38,100Consumption Billed 7.07B 6.58B 10.47B 10.78B 11.10B Dollars Billed $61.9M $63.9M $68.3M $70.4M $72.5M Collection Rate 99% 99% 99% 99% 99%
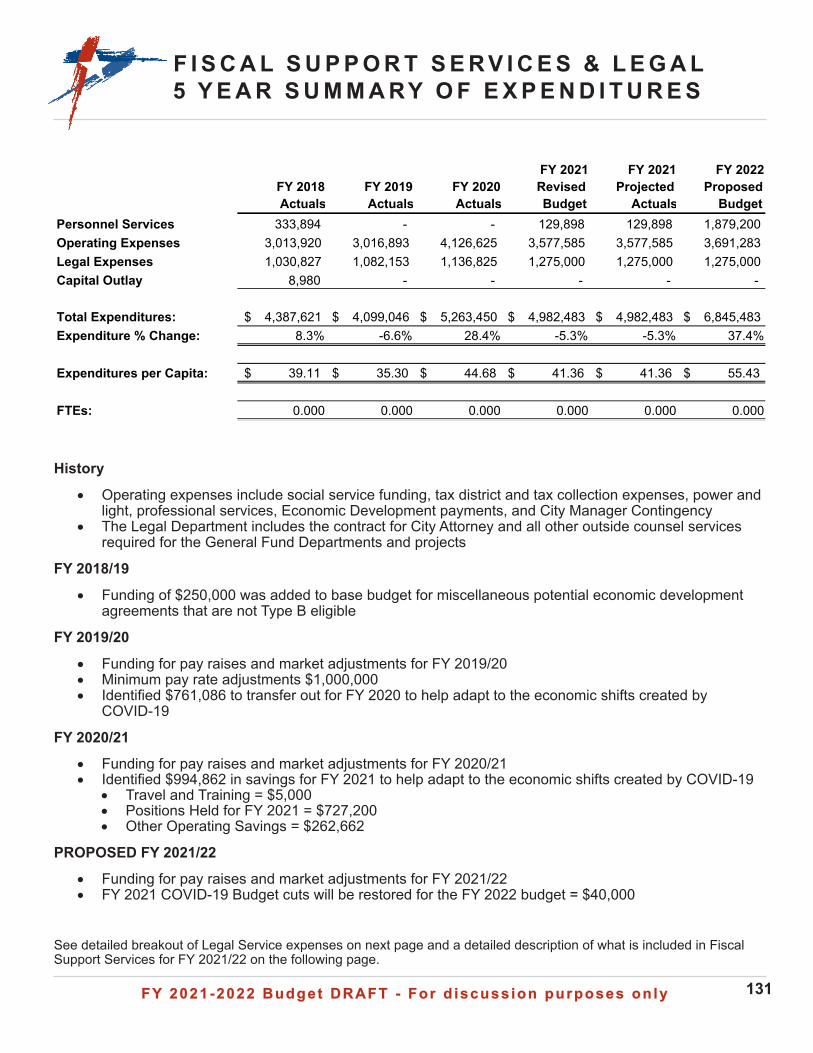
FY 2021-2022 Budget DRAFT - For d iscuss ion purposes on lyFY 2021-2022 Budget DRAFT - For d iscuss ion purposes on ly 131
F I S C A L S U P P O R T S E R V I C E S & L E G A L 5 Y E A R S U M M A RY O F E X P E N D I T U R E S
History
• Operating expenses include social service funding, tax district and tax collection expenses, power and light, professional services, Economic Development payments, and City Manager Contingency
• The Legal Department includes the contract for City Attorney and all other outside counsel services required for the General Fund Departments and projects
FY 2018/19
• Funding of $250,000 was added to base budget for miscellaneous potential economic development agreements that are not Type B eligible
FY 2019/20
• Funding for pay raises and market adjustments for FY 2019/20• Minimum pay rate adjustments $1,000,000• Identified $761,086 to transfer out for FY 2020 to help adapt to the economic shifts created by
COVID-19
FY 2020/21
• Funding for pay raises and market adjustments for FY 2020/21 • Identified $994,862 in savings for FY 2021 to help adapt to the economic shifts created by COVID-19
• Travel and Training = $5,000• Positions Held for FY 2021 = $727,200• Other Operating Savings = $262,662
PROPOSED FY 2021/22
• Funding for pay raises and market adjustments for FY 2021/22• FY 2021 COVID-19 Budget cuts will be restored for the FY 2022 budget = $40,000
See detailed breakout of Legal Service expenses on next page and a detailed description of what is included in Fiscal Support Services for FY 2021/22 on the following page.
FY 2018 Actuals
FY 2019 Actuals
FY 2020 Actuals
FY 2021 Revised Budget
FY 2021 Projected
Actuals
FY 2022 Proposed
BudgetPersonnel Services 333,894 - - 129,898 129,898 1,879,200 Operating Expenses 3,013,920 3,016,893 4,126,625 3,577,585 3,577,585 3,691,283 Legal Expenses 1,030,827 1,082,153 1,136,825 1,275,000 1,275,000 1,275,000 Capital Outlay 8,980 - - - - -
Total Expenditures: 4,387,621$ 4,099,046$ 5,263,450$ 4,982,483$ 4,982,483$ 6,845,483$ Expenditure % Change: 8.3% -6.6% 28.4% -5.3% -5.3% 37.4%
Expenditures per Capita: 39.11$ 35.30$ 44.68$ 41.36$ 41.36$ 55.43$
FTEs: 0.000 0.000 0.000 0.000 0.000 0.000
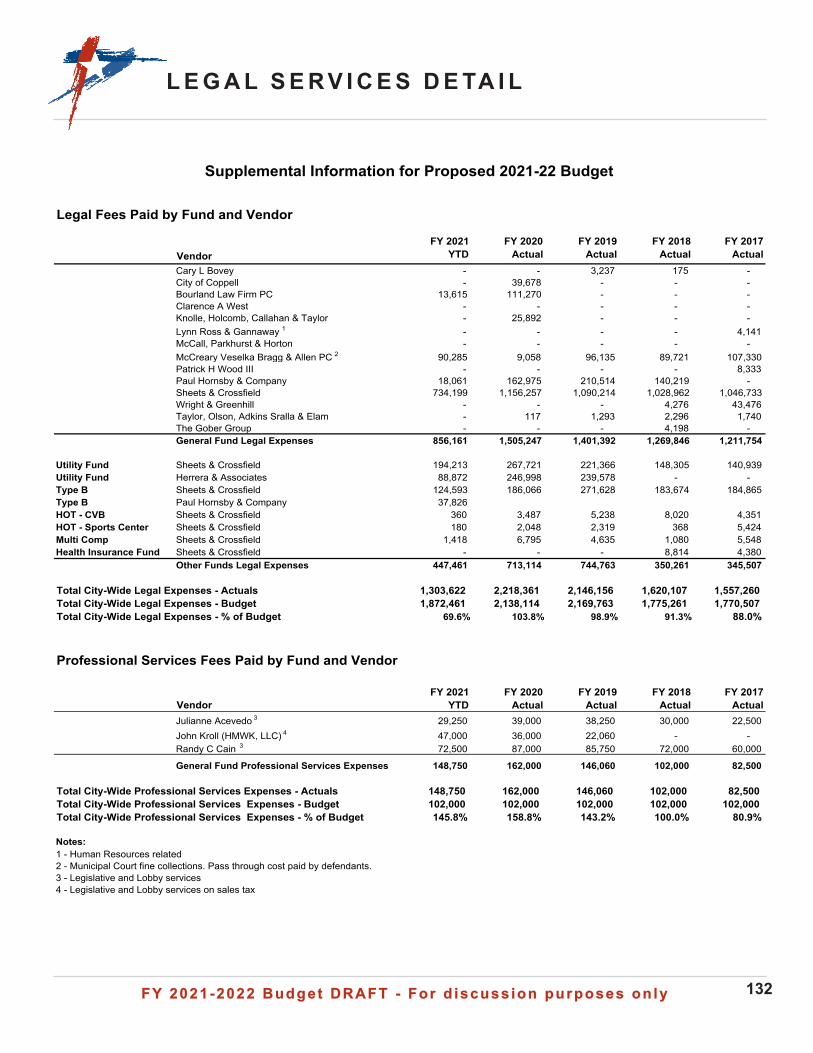
FY 2021-2022 Budget DRAFT - For d iscuss ion purposes on lyFY 2021-2022 Budget DRAFT - For d iscuss ion purposes on ly 132
L E G A L S E R V I C E S D E TA I L
Legal Fees Paid by Fund and Vendor
VendorFY 2021
YTDFY 2020
Actual FY 2019
Actual FY 2018
Actual FY 2017
Actual Cary L Bovey - - 3,237 175 - City of Coppell - 39,678 - - - Bourland Law Firm PC 13,615 111,270 - - - Clarence A West - - - - - Knolle, Holcomb, Callahan & Taylor - 25,892 - - - Lynn Ross & Gannaway 1 - - - - 4,141 McCall, Parkhurst & Horton - - - - - McCreary Veselka Bragg & Allen PC 2 90,285 9,058 96,135 89,721 107,330 Patrick H Wood III - - - - 8,333 Paul Hornsby & Company 18,061 162,975 210,514 140,219 - Sheets & Crossfield 734,199 1,156,257 1,090,214 1,028,962 1,046,733 Wright & Greenhill - - - 4,276 43,476 Taylor, Olson, Adkins Sralla & Elam - 117 1,293 2,296 1,740 The Gober Group - - - 4,198 - General Fund Legal Expenses 856,161 1,505,247 1,401,392 1,269,846 1,211,754
Utility Fund Sheets & Crossfield 194,213 267,721 221,366 148,305 140,939 Utility Fund Herrera & Associates 88,872 246,998 239,578 - - Type B Sheets & Crossfield 124,593 186,066 271,628 183,674 184,865 Type B Paul Hornsby & Company 37,826 HOT - CVB Sheets & Crossfield 360 3,487 5,238 8,020 4,351 HOT - Sports Center Sheets & Crossfield 180 2,048 2,319 368 5,424 Multi Comp Sheets & Crossfield 1,418 6,795 4,635 1,080 5,548 Health Insurance Fund Sheets & Crossfield - - - 8,814 4,380
Other Funds Legal Expenses 447,461 713,114 744,763 350,261 345,507
Total City-Wide Legal Expenses - Actuals 1,303,622 2,218,361 2,146,156 1,620,107 1,557,260 Total City-Wide Legal Expenses - Budget 1,872,461 2,138,114 2,169,763 1,775,261 1,770,507 Total City-Wide Legal Expenses - % of Budget 69.6% 103.8% 98.9% 91.3% 88.0%
Professional Services Fees Paid by Fund and Vendor
Vendor FY 2021
YTDFY 2020
Actual FY 2019
Actual FY 2018
Actual FY 2017
Actual Julianne Acevedo 3 29,250 39,000 38,250 30,000 22,500 John Kroll (HMWK, LLC) 4 47,000 36,000 22,060 - - Randy C Cain 3 72,500 87,000 85,750 72,000 60,000
General Fund Professional Services Expenses 148,750 162,000 146,060 102,000 82,500
Total City-Wide Professional Services Expenses - Actuals 148,750 162,000 146,060 102,000 82,500 Total City-Wide Professional Services Expenses - Budget 102,000 102,000 102,000 102,000 102,000 Total City-Wide Professional Services Expenses - % of Budget 145.8% 158.8% 143.2% 100.0% 80.9%
Notes:1 - Human Resources related2 - Municipal Court fine collections. Pass through cost paid by defendants.3 - Legislative and Lobby services4 - Legislative and Lobby services on sales tax
Supplemental Information for Proposed 2021-22 Budget
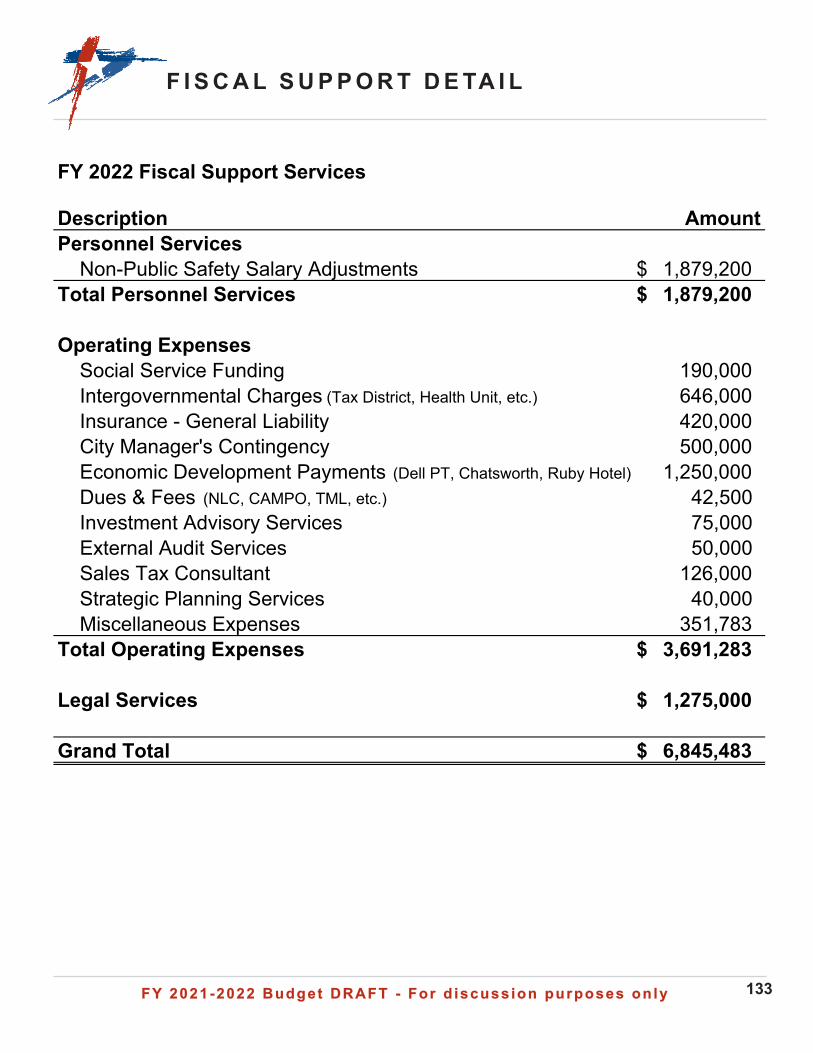
FY 2021-2022 Budget DRAFT - For d iscuss ion purposes on lyFY 2021-2022 Budget DRAFT - For d iscuss ion purposes on ly 133
F I S C A L S U P P O R T D E TA I L
FY 2022 Fiscal Support Services
Description AmountPersonnel Services
Non-Public Safety Salary Adjustments 1,879,200$ Total Personnel Services 1,879,200$
Operating ExpensesSocial Service Funding 190,000 Intergovernmental Charges (Tax District, Health Unit, etc.) 646,000 Insurance - General Liability 420,000 City Manager's Contingency 500,000 Economic Development Payments (Dell PT, Chatsworth, Ruby Hotel) 1,250,000 Dues & Fees (NLC, CAMPO, TML, etc.) 42,500 Investment Advisory Services 75,000 External Audit Services 50,000 Sales Tax Consultant 126,000 Strategic Planning Services 40,000 Miscellaneous Expenses 351,783
Total Operating Expenses 3,691,283$
Legal Services 1,275,000$
Grand Total 6,845,483$
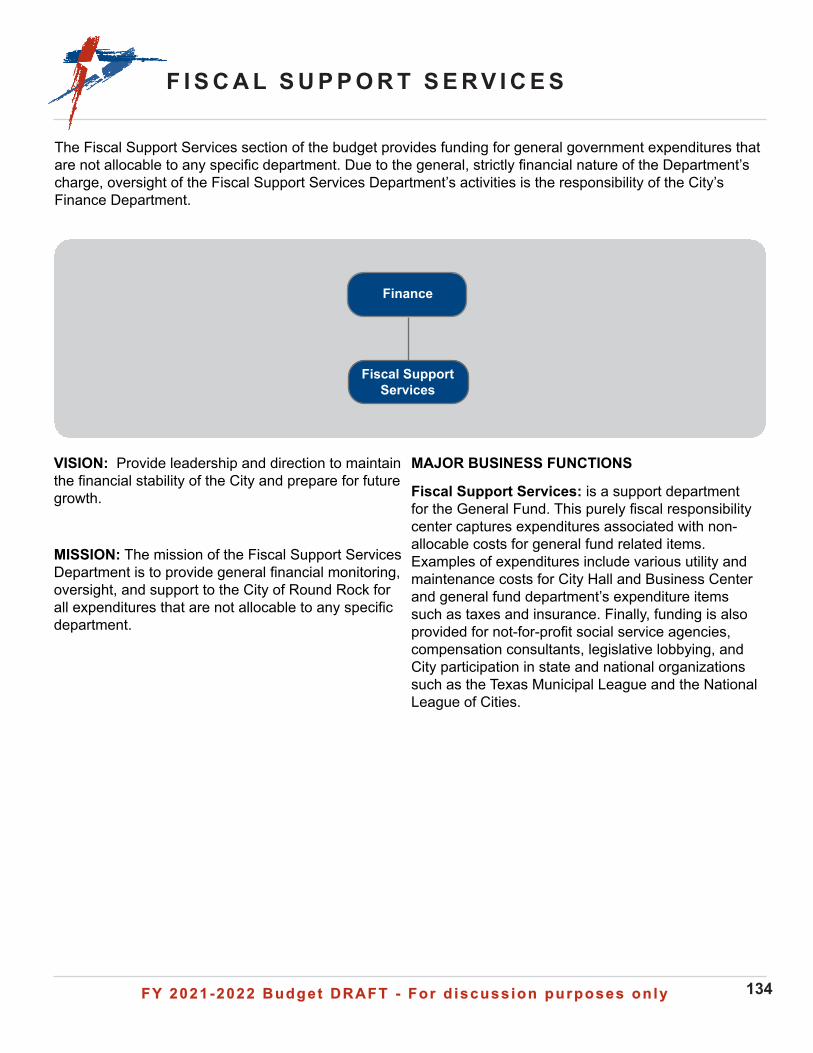
FY 2021-2022 Budget DRAFT - For d iscuss ion purposes on lyFY 2021-2022 Budget DRAFT - For d iscuss ion purposes on ly 134
F I S C A L S U P P O R T S E R V I C E S
Fiscal Support Services
Finance
The Fiscal Support Services section of the budget provides funding for general government expenditures that are not allocable to any specific department. Due to the general, strictly financial nature of the Department’s charge, oversight of the Fiscal Support Services Department’s activities is the responsibility of the City’s Finance Department.
VISION: Provide leadership and direction to maintain the financial stability of the City and prepare for future growth.
MISSION: The mission of the Fiscal Support Services Department is to provide general financial monitoring, oversight, and support to the City of Round Rock for all expenditures that are not allocable to any specific department.
MAJOR BUSINESS FUNCTIONS
Fiscal Support Services: is a support department for the General Fund. This purely fiscal responsibility center captures expenditures associated with non-allocable costs for general fund related items. Examples of expenditures include various utility and maintenance costs for City Hall and Business Center and general fund department’s expenditure items such as taxes and insurance. Finally, funding is also provided for not-for-profit social service agencies, compensation consultants, legislative lobbying, and City participation in state and national organizations such as the Texas Municipal League and the National League of Cities.
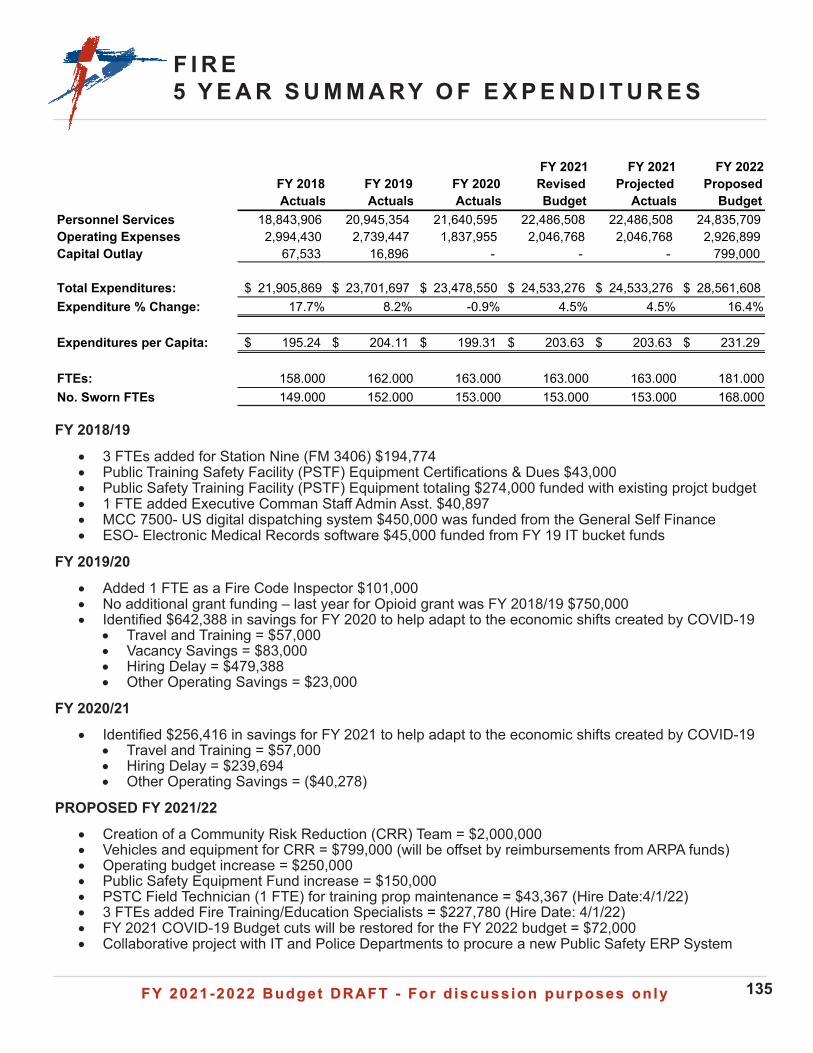
FY 2021-2022 Budget DRAFT - For d iscuss ion purposes on lyFY 2021-2022 Budget DRAFT - For d iscuss ion purposes on ly 135
F I R E5 Y E A R S U M M A RY O F E X P E N D I T U R E S
FY 2018/19
• 3 FTEs added for Station Nine (FM 3406) $194,774• Public Training Safety Facility (PSTF) Equipment Certifications & Dues $43,000• Public Safety Training Facility (PSTF) Equipment totaling $274,000 funded with existing projct budget• 1 FTE added Executive Comman Staff Admin Asst. $40,897• MCC 7500- US digital dispatching system $450,000 was funded from the General Self Finance• ESO- Electronic Medical Records software $45,000 funded from FY 19 IT bucket funds
FY 2019/20
• Added 1 FTE as a Fire Code Inspector $101,000• No additional grant funding – last year for Opioid grant was FY 2018/19 $750,000• Identified $642,388 in savings for FY 2020 to help adapt to the economic shifts created by COVID-19
• Travel and Training = $57,000• Vacancy Savings = $83,000• Hiring Delay = $479,388• Other Operating Savings = $23,000
FY 2020/21
• Identified $256,416 in savings for FY 2021 to help adapt to the economic shifts created by COVID-19• Travel and Training = $57,000• Hiring Delay = $239,694• Other Operating Savings = ($40,278)
PROPOSED FY 2021/22
• Creation of a Community Risk Reduction (CRR) Team = $2,000,000• Vehicles and equipment for CRR = $799,000 (will be offset by reimbursements from ARPA funds)• Operating budget increase = $250,000• Public Safety Equipment Fund increase = $150,000• PSTC Field Technician (1 FTE) for training prop maintenance = $43,367 (Hire Date:4/1/22)• 3 FTEs added Fire Training/Education Specialists = $227,780 (Hire Date: 4/1/22)• FY 2021 COVID-19 Budget cuts will be restored for the FY 2022 budget = $72,000• Collaborative project with IT and Police Departments to procure a new Public Safety ERP System
FY 2018 Actuals
FY 2019 Actuals
FY 2020 Actuals
FY 2021 Revised Budget
FY 2021 Projected
Actuals
FY 2022 Proposed
BudgetPersonnel Services 18,843,906 20,945,354 21,640,595 22,486,508 22,486,508 24,835,709 Operating Expenses 2,994,430 2,739,447 1,837,955 2,046,768 2,046,768 2,926,899 Capital Outlay 67,533 16,896 - - - 799,000
Total Expenditures: 21,905,869$ 23,701,697$ 23,478,550$ 24,533,276$ 24,533,276$ 28,561,608$ Expenditure % Change: 17.7% 8.2% -0.9% 4.5% 4.5% 16.4%
Expenditures per Capita: 195.24$ 204.11$ 199.31$ 203.63$ 203.63$ 231.29$
FTEs: 158.000 162.000 163.000 163.000 163.000 181.000No. Sworn FTEs 149.000 152.000 153.000 153.000 153.000 168.000
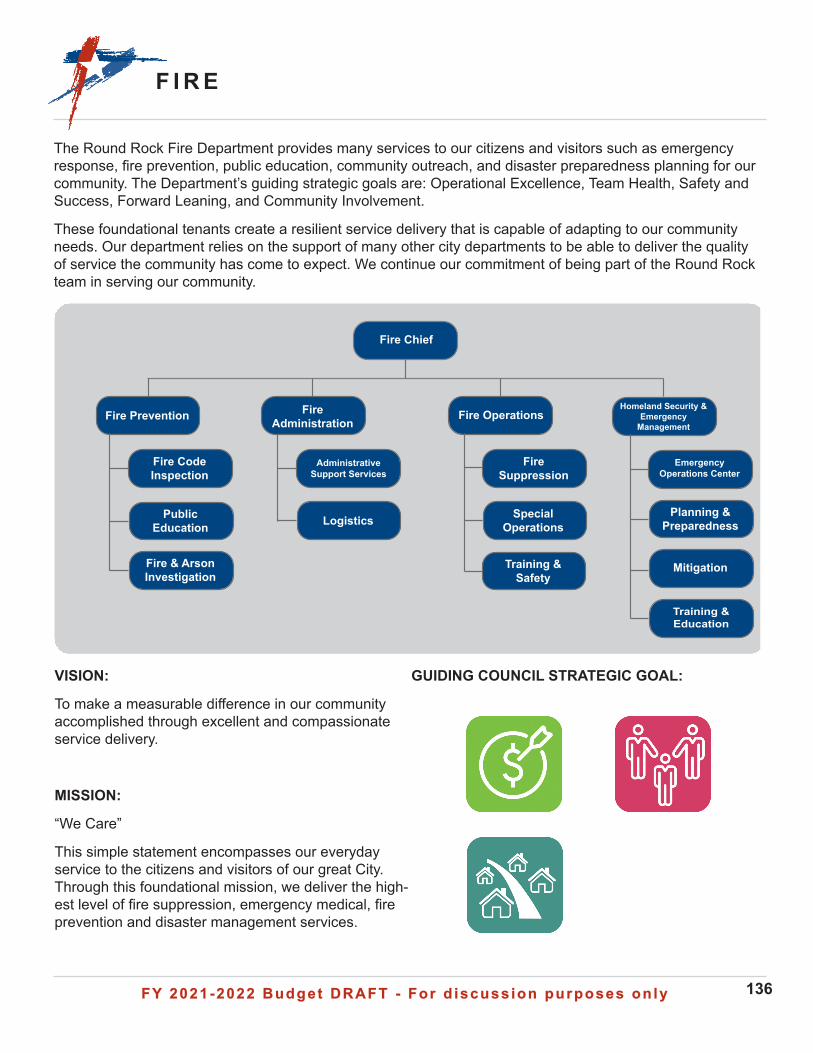
FY 2021-2022 Budget DRAFT - For d iscuss ion purposes on lyFY 2021-2022 Budget DRAFT - For d iscuss ion purposes on ly 136
F I R E
The Round Rock Fire Department provides many services to our citizens and visitors such as emergency response, fire prevention, public education, community outreach, and disaster preparedness planning for our community. The Department’s guiding strategic goals are: Operational Excellence, Team Health, Safety and Success, Forward Leaning, and Community Involvement.
These foundational tenants create a resilient service delivery that is capable of adapting to our community needs. Our department relies on the support of many other city departments to be able to deliver the quality of service the community has come to expect. We continue our commitment of being part of the Round Rock team in serving our community.
VISION:
To make a measurable difference in our community accomplished through excellent and compassionate service delivery.
MISSION:
“We Care”
This simple statement encompasses our everyday service to the citizens and visitors of our great City. Through this foundational mission, we deliver the high-est level of fire suppression, emergency medical, fire prevention and disaster management services.
GUIDING COUNCIL STRATEGIC GOAL:
Homeland Security & Emergency
Management
Training & Safety
Fire Administration
Administrative Support Services
Logistics
Fire Suppression
Emergency Operations Center
Planning & Preparedness
Fire Code Inspection
Public Education
Fire & Arson Investigation
Fire Prevention Fire Operations
Special Operations
Fire Chief
Mitigation
Training & Education
FY 2021-2022 Budget DRAFT - For d iscuss ion purposes on lyFY 2021-2022 Budget DRAFT - For d iscuss ion purposes on ly 137
F I R E
• Delivered bleeding control training to RRPD SWAT
• New hire academy restructured to model an academy for uncertified new hires
• Purchased a second set of bunker gear for over half of the suppression staff
• All fire stations have a vehicle exhaust removal system installed
FY 2022 OVERVIEW AND SIGNIFICANT CHANGES:
• Hire for the creation of a Mobile Outreach Team
• Select and purchase Pre-Incident Planning Software
• Select and purchase Requisition and Inventory Management Software
• Replacement of ballistic vests carried on the apparatus
• Purchase ballistic helmets for the apparatus• Purchase a second set of bunker gear for the
remainder of the suppression staff• Hire a Field Technician for the Public Safety
Training Center• Hire Fire Training/Education Specialists• Order the replacement for Engine 5 for delivery
in FY2023• Conduct a feasibility study for the relocation
of Central Fire Station, Fire Administration, HSEM, CRR, and Fire Logistics
NEW PROGRAMS FOR FY 2022:
• Community Risk Reduction Program - Ph 1• Community Risk Reduction Program - Ph 2• Public Safety Bucket Increase• PSTC Field Technician• Operating Budget Increase• First Due Pre-Incident Planning Software• Requesition and Inventory Management
Software• Fire Training/Education Specialists• Ballisitc Helmets
FY 2021 HIGHLIGHTS:
• Achieved an ISO rating of 1• Fire Marshal Office facilitated the opening of
Kalahari• Opening of new Fire Station 3• Assisted with administering COVID-19 vaccine
in Williamson County• Multiple crews deplaoyed to South Texas to
deliver COVID-19 vaccine• Assisted multiple City departments with contact
tracing• Participated in research program for rapid
COVID-19 testing• Maintained continuity of Fire Department
operations during Winter Storm Uri• Homeland Security and Emergency
Management Division facilitated a Virtual EOC during Winter Storm Uri, greatly enhancing cooperation of City efforts
• Worked with General Services to purchase a used aerial apparatus as a cost savings measure
• Worked with General Services to purchase a used apparatus for Hazmat as a cost saving measure
• Replacement of Heart Monitors• Implementation of new report management
software• Changing from ruggedized MCTs to iPads,
which are less expensive and have greater reliability
• Initiated a Community Risk Reduction Program• Grant funded purchase of Solo Rescue
machines• Delivered the Big Rig Training Class• Multiple deployments of the Wildland Team to
California• Developed the Round Rock Fire Department
Leadership Academy• Held a Council Academy and Team Building
sessions at the PSTC• Delivered Blue Card Training to the
Dispatchers• Hosted four regional training classes for
Technical Rescue and Hazmat
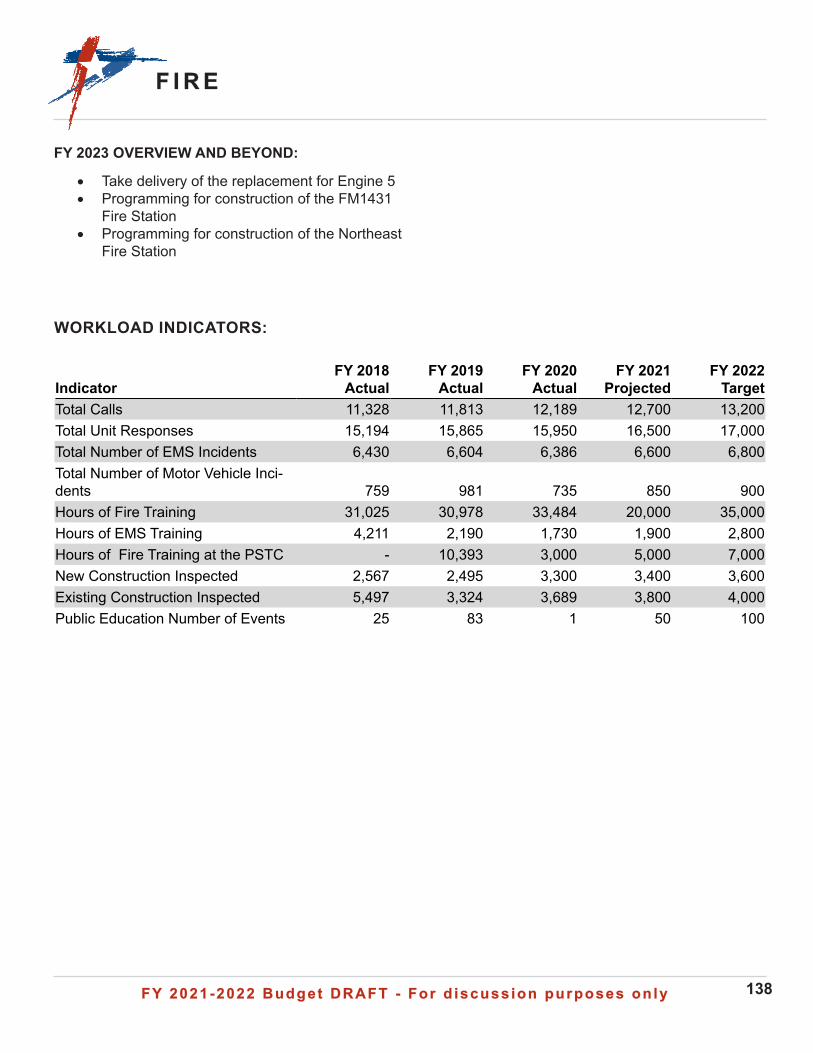
FY 2021-2022 Budget DRAFT - For d iscuss ion purposes on lyFY 2021-2022 Budget DRAFT - For d iscuss ion purposes on ly 138
F I R EF I R E
Indicator FY 2018
Actual FY 2019
Actual FY 2020
Actual FY 2021
Projected FY 2022
Target Total Calls 11,328 11,813 12,189 12,700 13,200Total Unit Responses 15,194 15,865 15,950 16,500 17,000Total Number of EMS Incidents 6,430 6,604 6,386 6,600 6,800Total Number of Motor Vehicle Inci-dents 759 981 735 850 900Hours of Fire Training 31,025 30,978 33,484 20,000 35,000Hours of EMS Training 4,211 2,190 1,730 1,900 2,800Hours of Fire Training at the PSTC - 10,393 3,000 5,000 7,000New Construction Inspected 2,567 2,495 3,300 3,400 3,600Existing Construction Inspected 5,497 3,324 3,689 3,800 4,000Public Education Number of Events 25 83 1 50 100
WORKLOAD INDICATORS:
FY 2023 OVERVIEW AND BEYOND:
• Take delivery of the replacement for Engine 5• Programming for construction of the FM1431
Fire Station• Programming for construction of the Northeast
Fire Station
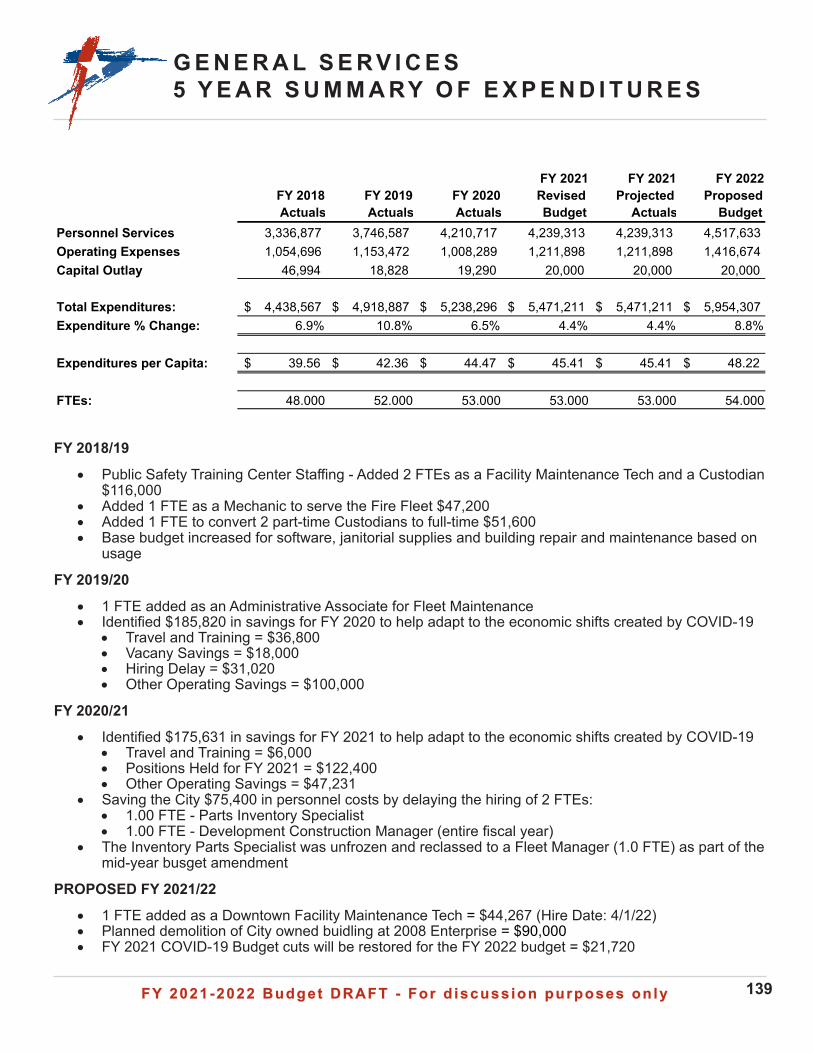
FY 2021-2022 Budget DRAFT - For d iscuss ion purposes on lyFY 2021-2022 Budget DRAFT - For d iscuss ion purposes on ly 139
G E N E R A L S E R V I C E S5 Y E A R S U M M A RY O F E X P E N D I T U R E S
FY 2018/19
• Public Safety Training Center Staffing - Added 2 FTEs as a Facility Maintenance Tech and a Custodian $116,000
• Added 1 FTE as a Mechanic to serve the Fire Fleet $47,200• Added 1 FTE to convert 2 part-time Custodians to full-time $51,600• Base budget increased for software, janitorial supplies and building repair and maintenance based on
usage
FY 2019/20
• 1 FTE added as an Administrative Associate for Fleet Maintenance• Identified $185,820 in savings for FY 2020 to help adapt to the economic shifts created by COVID-19
• Travel and Training = $36,800• Vacany Savings = $18,000• Hiring Delay = $31,020• Other Operating Savings = $100,000
FY 2020/21
• Identified $175,631 in savings for FY 2021 to help adapt to the economic shifts created by COVID-19• Travel and Training = $6,000• Positions Held for FY 2021 = $122,400• Other Operating Savings = $47,231
• Saving the City $75,400 in personnel costs by delaying the hiring of 2 FTEs:• 1.00 FTE - Parts Inventory Specialist• 1.00 FTE - Development Construction Manager (entire fiscal year)
• The Inventory Parts Specialist was unfrozen and reclassed to a Fleet Manager (1.0 FTE) as part of the mid-year busget amendment
PROPOSED FY 2021/22
• 1 FTE added as a Downtown Facility Maintenance Tech = $44,267 (Hire Date: 4/1/22)• Planned demolition of City owned buidling at 2008 Enterprise = $90,000• FY 2021 COVID-19 Budget cuts will be restored for the FY 2022 budget = $21,720
FY 2018 Actuals
FY 2019 Actuals
FY 2020 Actuals
FY 2021 Revised Budget
FY 2021 Projected
Actuals
FY 2022 Proposed
BudgetPersonnel Services 3,336,877 3,746,587 4,210,717 4,239,313 4,239,313 4,517,633 Operating Expenses 1,054,696 1,153,472 1,008,289 1,211,898 1,211,898 1,416,674 Capital Outlay 46,994 18,828 19,290 20,000 20,000 20,000
Total Expenditures: 4,438,567$ 4,918,887$ 5,238,296$ 5,471,211$ 5,471,211$ 5,954,307$ Expenditure % Change: 6.9% 10.8% 6.5% 4.4% 4.4% 8.8%
Expenditures per Capita: 39.56$ 42.36$ 44.47$ 45.41$ 45.41$ 48.22$
FTEs: 48.000 52.000 53.000 53.000 53.000 54.000
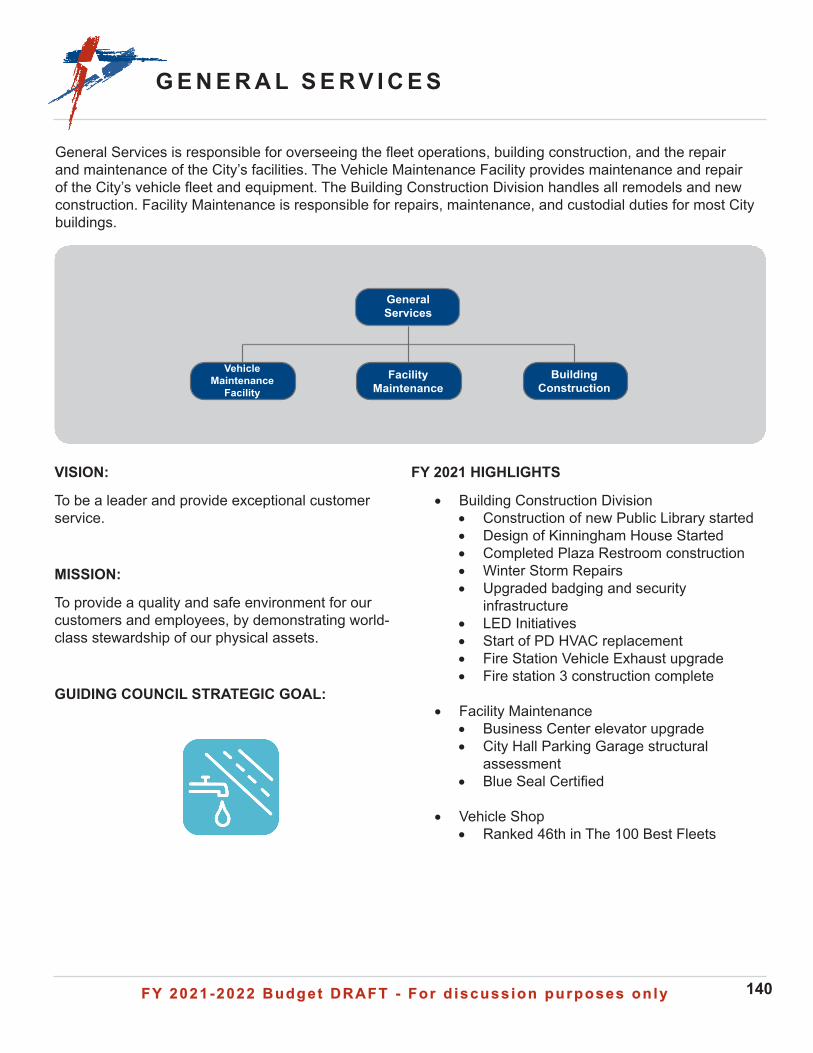
FY 2021-2022 Budget DRAFT - For d iscuss ion purposes on lyFY 2021-2022 Budget DRAFT - For d iscuss ion purposes on ly 140
G E N E R A L S E R V I C E S
Vehicle Maintenance
FacilityFacility
MaintenanceBuilding
Construction
General Services
General Services is responsible for overseeing the fleet operations, building construction, and the repair and maintenance of the City’s facilities. The Vehicle Maintenance Facility provides maintenance and repair of the City’s vehicle fleet and equipment. The Building Construction Division handles all remodels and new construction. Facility Maintenance is responsible for repairs, maintenance, and custodial duties for most City buildings.
VISION:
To be a leader and provide exceptional customer service.
MISSION:
To provide a quality and safe environment for our customers and employees, by demonstrating world-class stewardship of our physical assets.
GUIDING COUNCIL STRATEGIC GOAL:
FY 2021 HIGHLIGHTS
• Building Construction Division• Construction of new Public Library started• Design of Kinningham House Started• Completed Plaza Restroom construction• Winter Storm Repairs• Upgraded badging and security
infrastructure• LED Initiatives• Start of PD HVAC replacement• Fire Station Vehicle Exhaust upgrade• Fire station 3 construction complete
• Facility Maintenance• Business Center elevator upgrade• City Hall Parking Garage structural
assessment• Blue Seal Certified
• Vehicle Shop• Ranked 46th in The 100 Best Fleets
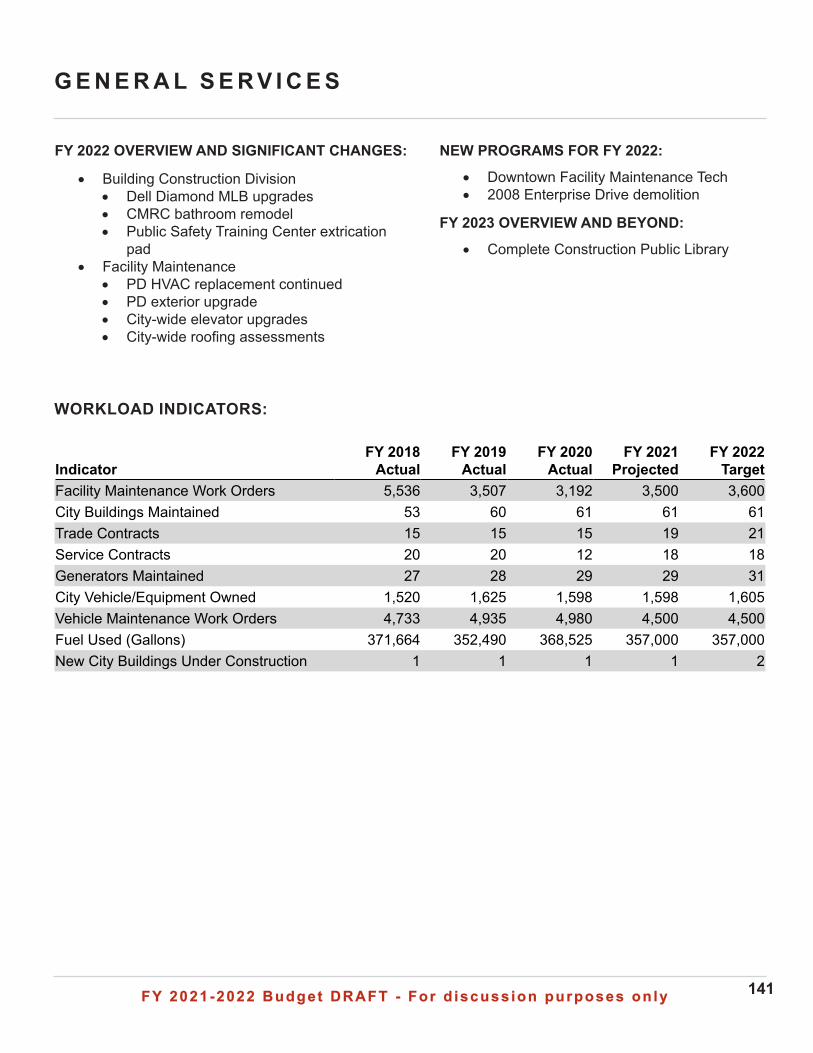
FY 2021-2022 Budget DRAFT - For d iscuss ion purposes on lyFY 2021-2022 Budget DRAFT - For d iscuss ion purposes on ly 141
G E N E R A L S E R V I C E S
WORKLOAD INDICATORS:
NEW PROGRAMS FOR FY 2022:
• Downtown Facility Maintenance Tech• 2008 Enterprise Drive demolition
FY 2023 OVERVIEW AND BEYOND:
• Complete Construction Public Library
FY 2022 OVERVIEW AND SIGNIFICANT CHANGES:
• Building Construction Division• Dell Diamond MLB upgrades• CMRC bathroom remodel• Public Safety Training Center extrication
pad• Facility Maintenance
• PD HVAC replacement continued• PD exterior upgrade• City-wide elevator upgrades• City-wide roofing assessments
Indicator FY 2018
Actual FY 2019
Actual FY 2020
Actual FY 2021
Projected FY 2022
Target Facility Maintenance Work Orders 5,536 3,507 3,192 3,500 3,600City Buildings Maintained 53 60 61 61 61Trade Contracts 15 15 15 19 21Service Contracts 20 20 12 18 18Generators Maintained 27 28 29 29 31City Vehicle/Equipment Owned 1,520 1,625 1,598 1,598 1,605Vehicle Maintenance Work Orders 4,733 4,935 4,980 4,500 4,500Fuel Used (Gallons) 371,664 352,490 368,525 357,000 357,000New City Buildings Under Construction 1 1 1 1 2
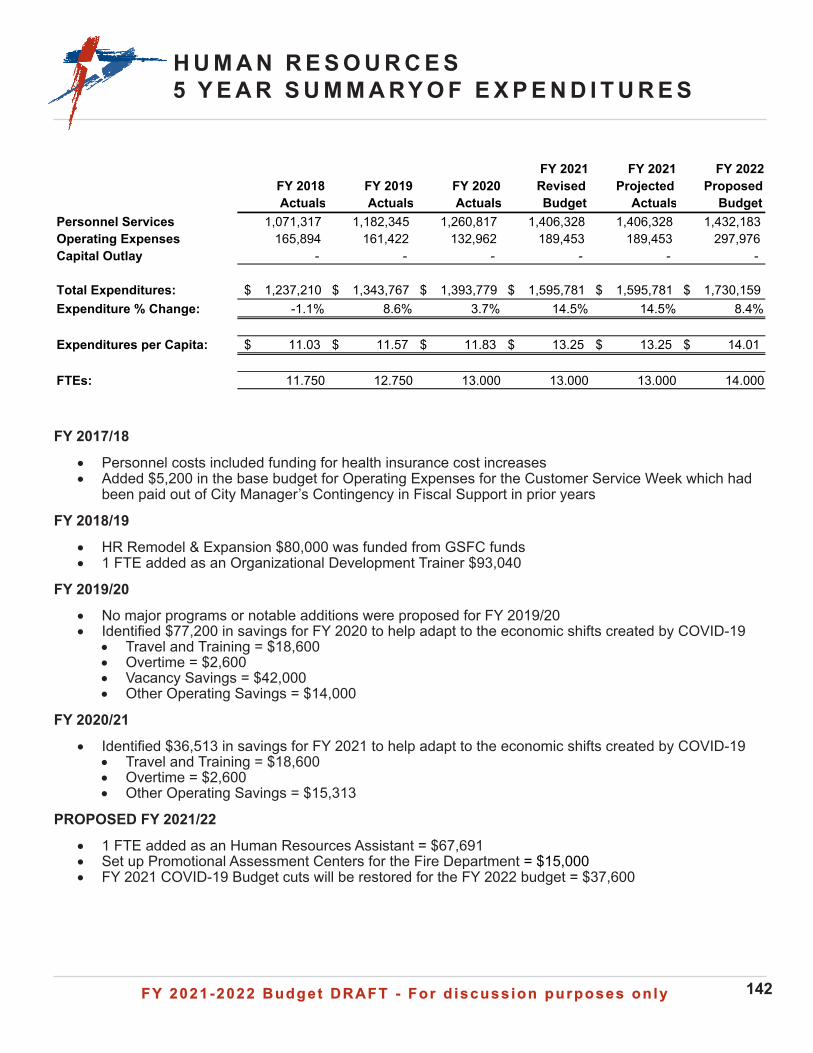
FY 2021-2022 Budget DRAFT - For d iscuss ion purposes on lyFY 2021-2022 Budget DRAFT - For d iscuss ion purposes on ly 142
H U M A N R E S O U R C E S5 Y E A R S U M M A RY O F E X P E N D I T U R E S
FY 2017/18
• Personnel costs included funding for health insurance cost increases• Added $5,200 in the base budget for Operating Expenses for the Customer Service Week which had
been paid out of City Manager’s Contingency in Fiscal Support in prior years
FY 2018/19
• HR Remodel & Expansion $80,000 was funded from GSFC funds• 1 FTE added as an Organizational Development Trainer $93,040
FY 2019/20• No major programs or notable additions were proposed for FY 2019/20• Identified $77,200 in savings for FY 2020 to help adapt to the economic shifts created by COVID-19
• Travel and Training = $18,600• Overtime = $2,600• Vacancy Savings = $42,000• Other Operating Savings = $14,000
FY 2020/21
• Identified $36,513 in savings for FY 2021 to help adapt to the economic shifts created by COVID-19• Travel and Training = $18,600• Overtime = $2,600• Other Operating Savings = $15,313
PROPOSED FY 2021/22
• 1 FTE added as an Human Resources Assistant = $67,691• Set up Promotional Assessment Centers for the Fire Department = $15,000• FY 2021 COVID-19 Budget cuts will be restored for the FY 2022 budget = $37,600
FY 2018 Actuals
FY 2019 Actuals
FY 2020 Actuals
FY 2021 Revised Budget
FY 2021 Projected
Actuals
FY 2022 Proposed
BudgetPersonnel Services 1,071,317 1,182,345 1,260,817 1,406,328 1,406,328 1,432,183 Operating Expenses 165,894 161,422 132,962 189,453 189,453 297,976 Capital Outlay - - - - - -
Total Expenditures: 1,237,210$ 1,343,767$ 1,393,779$ 1,595,781$ 1,595,781$ 1,730,159$ Expenditure % Change: -1.1% 8.6% 3.7% 14.5% 14.5% 8.4%
Expenditures per Capita: 11.03$ 11.57$ 11.83$ 13.25$ 13.25$ 14.01$
FTEs: 11.750 12.750 13.000 13.000 13.000 14.000
FY 2021-2022 Budget DRAFT - For d iscuss ion purposes on lyFY 2021-2022 Budget DRAFT - For d iscuss ion purposes on ly 143
H U M A N R E S O U R C E S
Benefit & Wellness
Safety & Risk Management
Employee Services HRIS & Records Organizational
Development
Human Resources
The Human Resources (HR) Department is responsible for providing direction and leadership in human resource matters that support the City’s success. Our focus is to provide the following major HR business functions: Safety and Risk Management, Benefits and Wellness, Employee Services (Compensation, Talent Management & Employee Relations), manage the Human Resource Information System/Records, and Organizational Development.
VISION:
To encourage and support a work/life balance for employees while maintaining a diverse, respectful, and safe work environment
MISSION:
Human Resources will set the service standard of excellence with talent and innovation to create a positive work culture.
HUMAN RESOURCES CORE VALUES:
Human Resources will achieve the mission by living our core values to SERVE:
S - Support - Work Together to meet the needs of the City
E - Engage - Involve others to promote individual and organizational growth
R - Respect - Treat everyone with dignity at all times
V - Voice - Tell us; we will listen and act
E - Empower - Provide the resources and environment to succeed
GUIDING COUNCIL STRATEGIC GOAL:
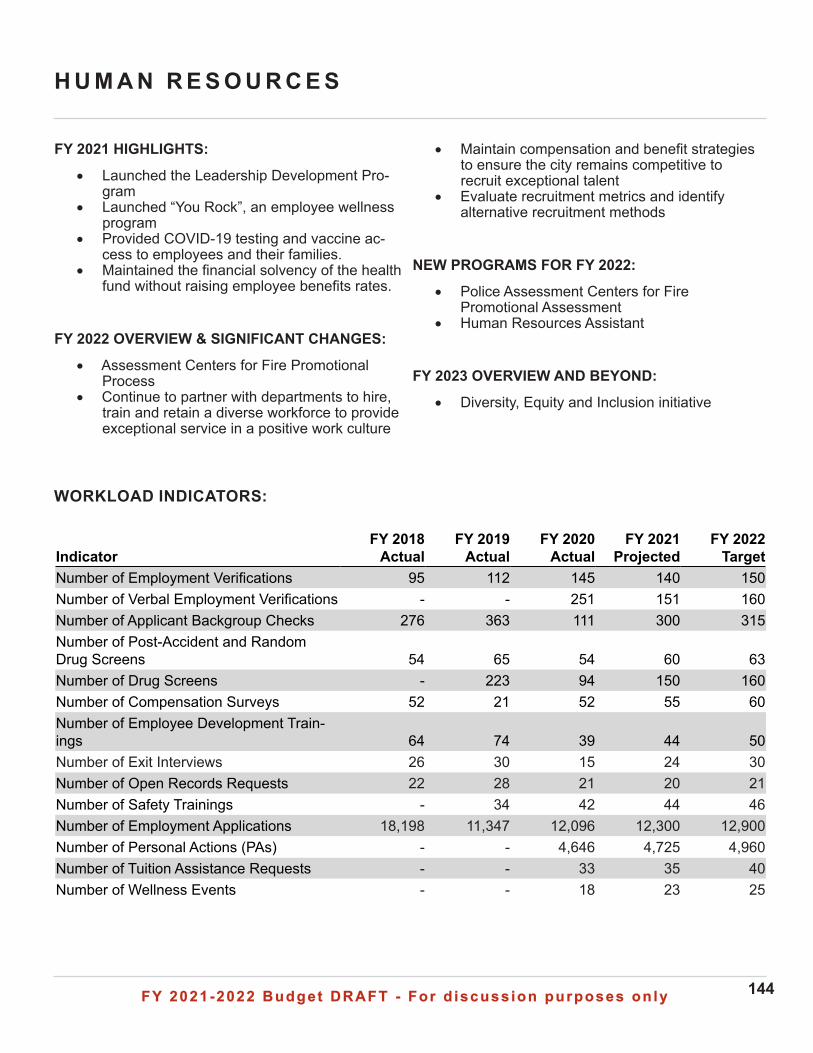
FY 2021-2022 Budget DRAFT - For d iscuss ion purposes on lyFY 2021-2022 Budget DRAFT - For d iscuss ion purposes on ly 144
H U M A N R E S O U R C E S
WORKLOAD INDICATORS:
• Maintain compensation and benefit strategies to ensure the city remains competitive to recruit exceptional talent
• Evaluate recruitment metrics and identify alternative recruitment methods
NEW PROGRAMS FOR FY 2022:
• Police Assessment Centers for Fire Promotional Assessment
• Human Resources Assistant
FY 2023 OVERVIEW AND BEYOND:
• Diversity, Equity and Inclusion initiative
FY 2021 HIGHLIGHTS:
• Launched the Leadership Development Pro-gram
• Launched “You Rock”, an employee wellness program
• Provided COVID-19 testing and vaccine ac-cess to employees and their families.
• Maintained the financial solvency of the health fund without raising employee benefits rates.
FY 2022 OVERVIEW & SIGNIFICANT CHANGES:
• Assessment Centers for Fire Promotional Process
• Continue to partner with departments to hire, train and retain a diverse workforce to provide exceptional service in a positive work culture
IndicatorFY 2018
ActualFY 2019
ActualFY 2020
ActualFY 2021
ProjectedFY 2022
TargetNumber of Employment Verifications 95 112 145 140 150Number of Verbal Employment Verifications - - 251 151 160Number of Applicant Backgroup Checks 276 363 111 300 315Number of Post-Accident and Random Drug Screens 54 65 54 60 63Number of Drug Screens - 223 94 150 160Number of Compensation Surveys 52 21 52 55 60Number of Employee Development Train-ings 64 74 39 44 50Number of Exit Interviews 26 30 15 24 30Number of Open Records Requests 22 28 21 20 21Number of Safety Trainings - 34 42 44 46Number of Employment Applications 18,198 11,347 12,096 12,300 12,900Number of Personal Actions (PAs) - - 4,646 4,725 4,960Number of Tuition Assistance Requests - - 33 35 40Number of Wellness Events - - 18 23 25
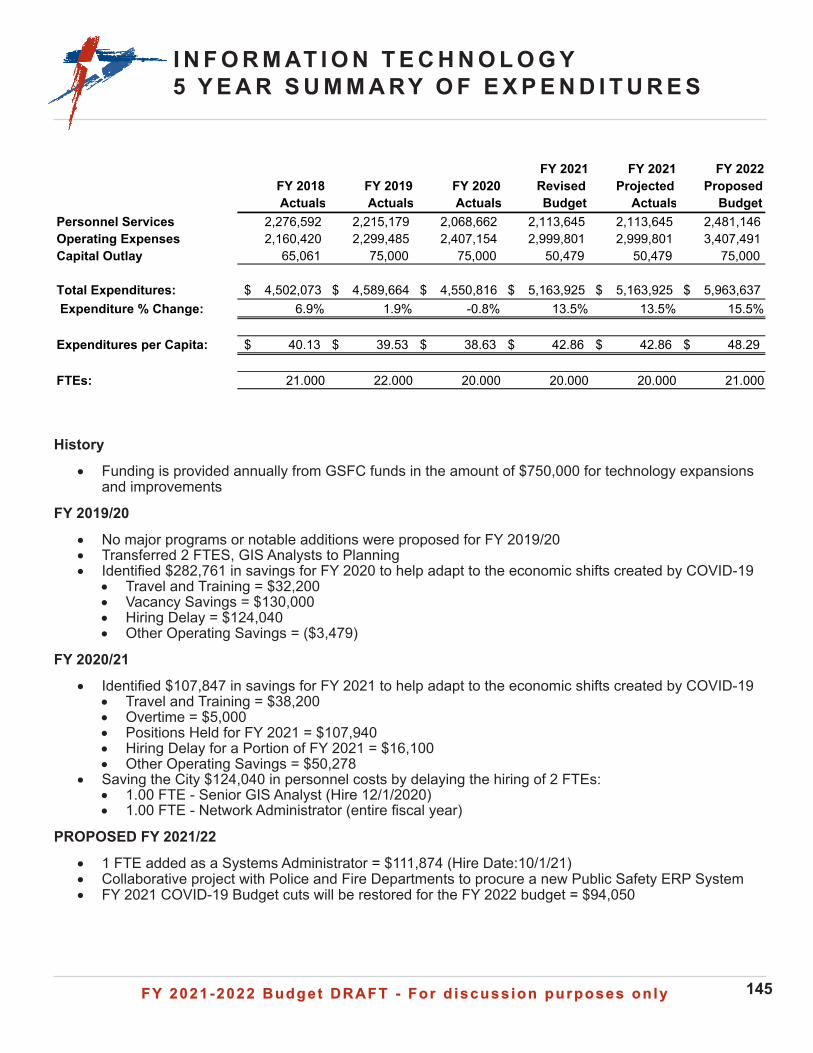
FY 2021-2022 Budget DRAFT - For d iscuss ion purposes on lyFY 2021-2022 Budget DRAFT - For d iscuss ion purposes on ly 145
I N F O R M AT I O N T E C H N O L O G Y5 Y E A R S U M M A RY O F E X P E N D I T U R E S
History
• Funding is provided annually from GSFC funds in the amount of $750,000 for technology expansions and improvements
FY 2019/20
• No major programs or notable additions were proposed for FY 2019/20• Transferred 2 FTES, GIS Analysts to Planning• Identified $282,761 in savings for FY 2020 to help adapt to the economic shifts created by COVID-19
• Travel and Training = $32,200• Vacancy Savings = $130,000• Hiring Delay = $124,040• Other Operating Savings = ($3,479)
FY 2020/21
• Identified $107,847 in savings for FY 2021 to help adapt to the economic shifts created by COVID-19• Travel and Training = $38,200• Overtime = $5,000• Positions Held for FY 2021 = $107,940• Hiring Delay for a Portion of FY 2021 = $16,100• Other Operating Savings = $50,278
• Saving the City $124,040 in personnel costs by delaying the hiring of 2 FTEs:• 1.00 FTE - Senior GIS Analyst (Hire 12/1/2020)• 1.00 FTE - Network Administrator (entire fiscal year)
PROPOSED FY 2021/22
• 1 FTE added as a Systems Administrator = $111,874 (Hire Date:10/1/21)• Collaborative project with Police and Fire Departments to procure a new Public Safety ERP System• FY 2021 COVID-19 Budget cuts will be restored for the FY 2022 budget = $94,050
FY 2018 Actuals
FY 2019 Actuals
FY 2020 Actuals
FY 2021 Revised Budget
FY 2021 Projected
Actuals
FY 2022 Proposed
BudgetPersonnel Services 2,276,592 2,215,179 2,068,662 2,113,645 2,113,645 2,481,146 Operating Expenses 2,160,420 2,299,485 2,407,154 2,999,801 2,999,801 3,407,491 Capital Outlay 65,061 75,000 75,000 50,479 50,479 75,000
Total Expenditures: 4,502,073$ 4,589,664$ 4,550,816$ 5,163,925$ 5,163,925$ 5,963,637$ Expenditure % Change: 6.9% 1.9% -0.8% 13.5% 13.5% 15.5%
Expenditures per Capita: 40.13$ 39.53$ 38.63$ 42.86$ 42.86$ 48.29$
FTEs: 21.000 22.000 20.000 20.000 20.000 21.000
FY 2021-2022 Budget DRAFT - For d iscuss ion purposes on lyFY 2021-2022 Budget DRAFT - For d iscuss ion purposes on ly 146
I N F O R M AT I O N T E C H N O L O G Y
Infrastructure and Customer Support
Enterprise Applications
GIS
Information Technology
The Information Technology (IT) Department’s function is to maintain and support the hardware and software infrastructure within the City government, assist in procurement and training for all major software systems, and help guide all departments in forming plans for their future use of technology.
MISSION:
The IT Department’s mission is to assist all City departments to become more productive using technology, to safeguard relevant data, and to increase the sharing of important governmental information between City departments.
GUIDING COUNCIL STRATEGIC GOALS:
FY 2021 HIGHLIGHTS:
• Completed 2-year Geospatial infrastructure modernization plan
• Implemented new Land Management & Permitting system
• Completed Phase 1 of phone system migration to Teams
• Created new employee benefit with iPhone Purchase Program
• Updated mobile technology in Fire apparatus• Implementation of ArcGIS Monitor for
increased uptime & monitoring of our GIS• Revamp of COVID-19 Surveillance dashboard• Completed and passed CJIS Security audit• Migrated all City Departments to SharePoint,
enabling Cloud access to organization data• Implemented new Fire Records Management
system• Met state requirements for completing
yearly required Security Training for all City Employees
FY 2022 OVERVIEW AND SIGNIFICANT CHANGES:
• Complete RFP process and selection of new Public Safety ERP system
• Coordinate with RRISD on fiber network overhaul
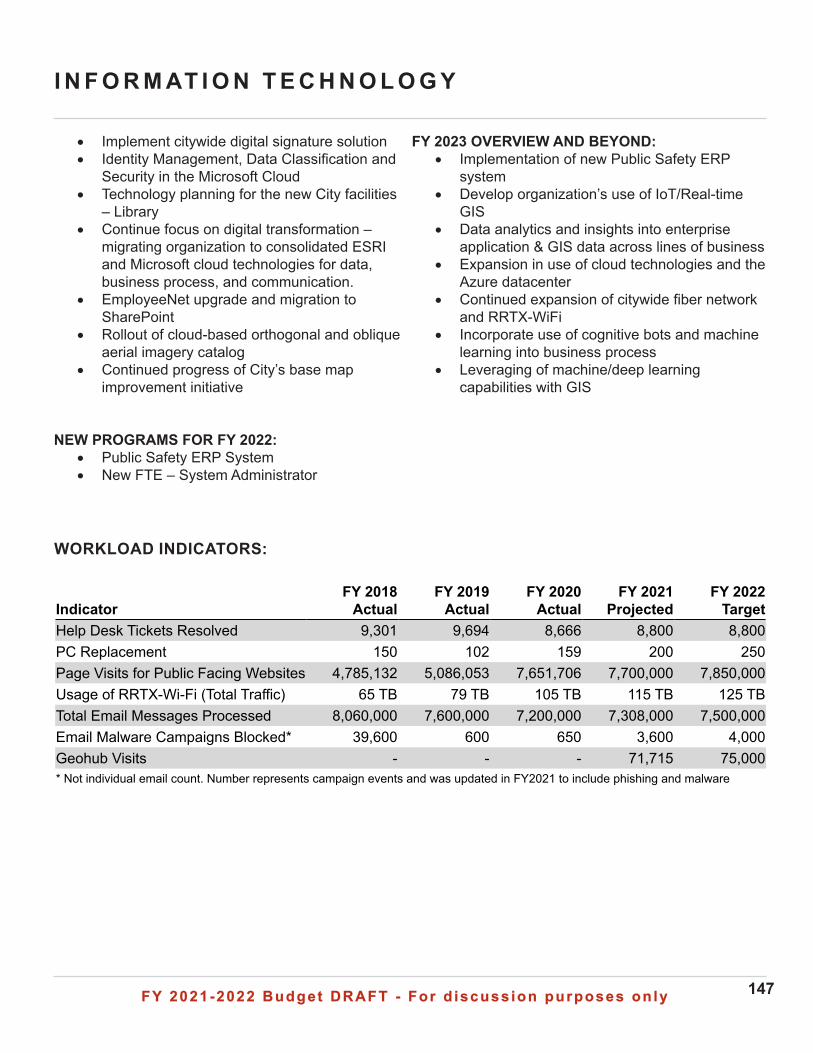
FY 2021-2022 Budget DRAFT - For d iscuss ion purposes on lyFY 2021-2022 Budget DRAFT - For d iscuss ion purposes on ly 147
I N F O R M AT I O N T E C H N O L O G Y
WORKLOAD INDICATORS:
FY 2023 OVERVIEW AND BEYOND:• Implementation of new Public Safety ERP
system• Develop organization’s use of IoT/Real-time
GIS• Data analytics and insights into enterprise
application & GIS data across lines of business• Expansion in use of cloud technologies and the
Azure datacenter• Continued expansion of citywide fiber network
and RRTX-WiFi• Incorporate use of cognitive bots and machine
learning into business process• Leveraging of machine/deep learning
capabilities with GIS
• Implement citywide digital signature solution• Identity Management, Data Classification and
Security in the Microsoft Cloud • Technology planning for the new City facilities
– Library • Continue focus on digital transformation –
migrating organization to consolidated ESRI and Microsoft cloud technologies for data, business process, and communication.
• EmployeeNet upgrade and migration to SharePoint
• Rollout of cloud-based orthogonal and oblique aerial imagery catalog
• Continued progress of City’s base map improvement initiative
NEW PROGRAMS FOR FY 2022:
• Public Safety ERP System• New FTE – System Administrator
Indicator FY 2018
Actual FY 2019
Actual FY 2020
Actual FY 2021
Projected FY 2022
Target Help Desk Tickets Resolved 9,301 9,694 8,666 8,800 8,800PC Replacement 150 102 159 200 250Page Visits for Public Facing Websites 4,785,132 5,086,053 7,651,706 7,700,000 7,850,000Usage of RRTX-Wi-Fi (Total Traffic) 65 TB 79 TB 105 TB 115 TB 125 TB Total Email Messages Processed 8,060,000 7,600,000 7,200,000 7,308,000 7,500,000 Email Malware Campaigns Blocked* 39,600 600 650 3,600 4,000Geohub Visits - - - 71,715 75,000* Not individual email count. Number represents campaign events and was updated in FY2021 to include phishing and malware
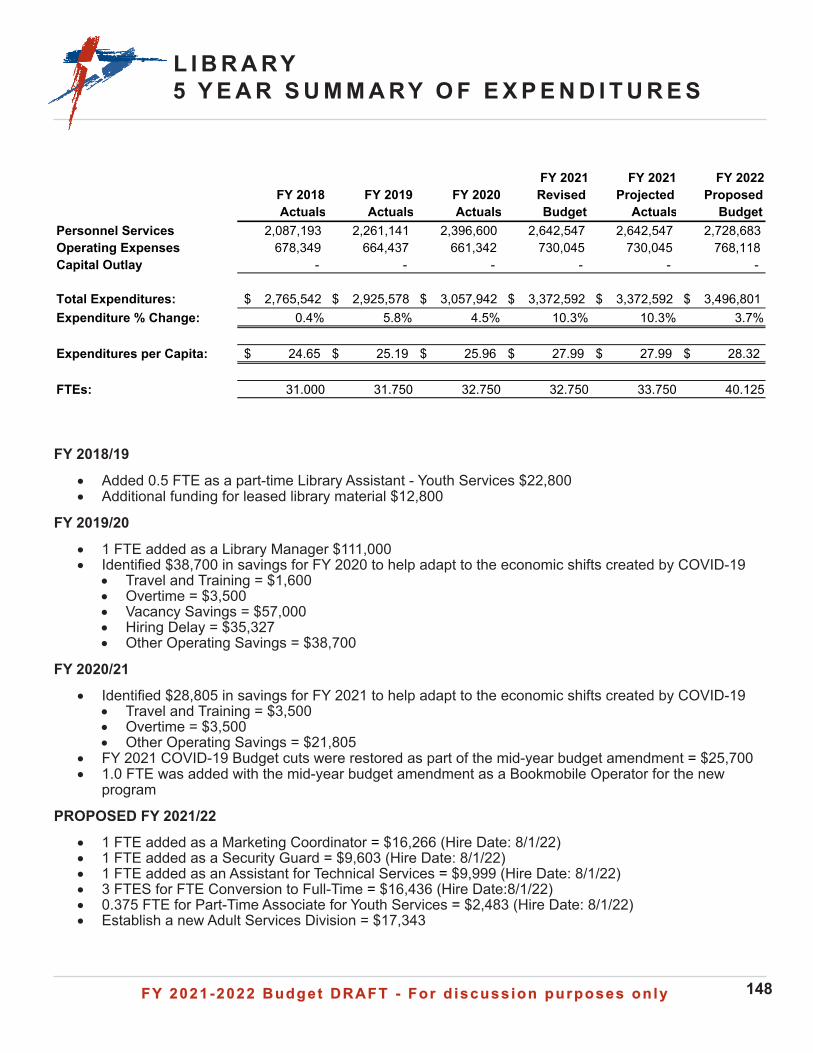
FY 2021-2022 Budget DRAFT - For d iscuss ion purposes on lyFY 2021-2022 Budget DRAFT - For d iscuss ion purposes on ly 148
L I B R A RY 5 Y E A R S U M M A RY O F E X P E N D I T U R E S
FY 2018/19
• Added 0.5 FTE as a part-time Library Assistant - Youth Services $22,800• Additional funding for leased library material $12,800
FY 2019/20
• 1 FTE added as a Library Manager $111,000• Identified $38,700 in savings for FY 2020 to help adapt to the economic shifts created by COVID-19
• Travel and Training = $1,600• Overtime = $3,500• Vacancy Savings = $57,000• Hiring Delay = $35,327• Other Operating Savings = $38,700
FY 2020/21
• Identified $28,805 in savings for FY 2021 to help adapt to the economic shifts created by COVID-19• Travel and Training = $3,500• Overtime = $3,500• Other Operating Savings = $21,805
• FY 2021 COVID-19 Budget cuts were restored as part of the mid-year budget amendment = $25,700• 1.0 FTE was added with the mid-year budget amendment as a Bookmobile Operator for the new
program
PROPOSED FY 2021/22
• 1 FTE added as a Marketing Coordinator = $16,266 (Hire Date: 8/1/22)• 1 FTE added as a Security Guard = $9,603 (Hire Date: 8/1/22)• 1 FTE added as an Assistant for Technical Services = $9,999 (Hire Date: 8/1/22)• 3 FTES for FTE Conversion to Full-Time = $16,436 (Hire Date:8/1/22)• 0.375 FTE for Part-Time Associate for Youth Services = $2,483 (Hire Date: 8/1/22)• Establish a new Adult Services Division = $17,343
FY 2018 Actuals
FY 2019 Actuals
FY 2020 Actuals
FY 2021 Revised Budget
FY 2021 Projected
Actuals
FY 2022 Proposed
BudgetPersonnel Services 2,087,193 2,261,141 2,396,600 2,642,547 2,642,547 2,728,683 Operating Expenses 678,349 664,437 661,342 730,045 730,045 768,118 Capital Outlay - - - - - -
Total Expenditures: 2,765,542$ 2,925,578$ 3,057,942$ 3,372,592$ 3,372,592$ 3,496,801$ Expenditure % Change: 0.4% 5.8% 4.5% 10.3% 10.3% 3.7%
Expenditures per Capita: 24.65$ 25.19$ 25.96$ 27.99$ 27.99$ 28.32$
FTEs: 31.000 31.750 32.750 32.750 33.750 40.125
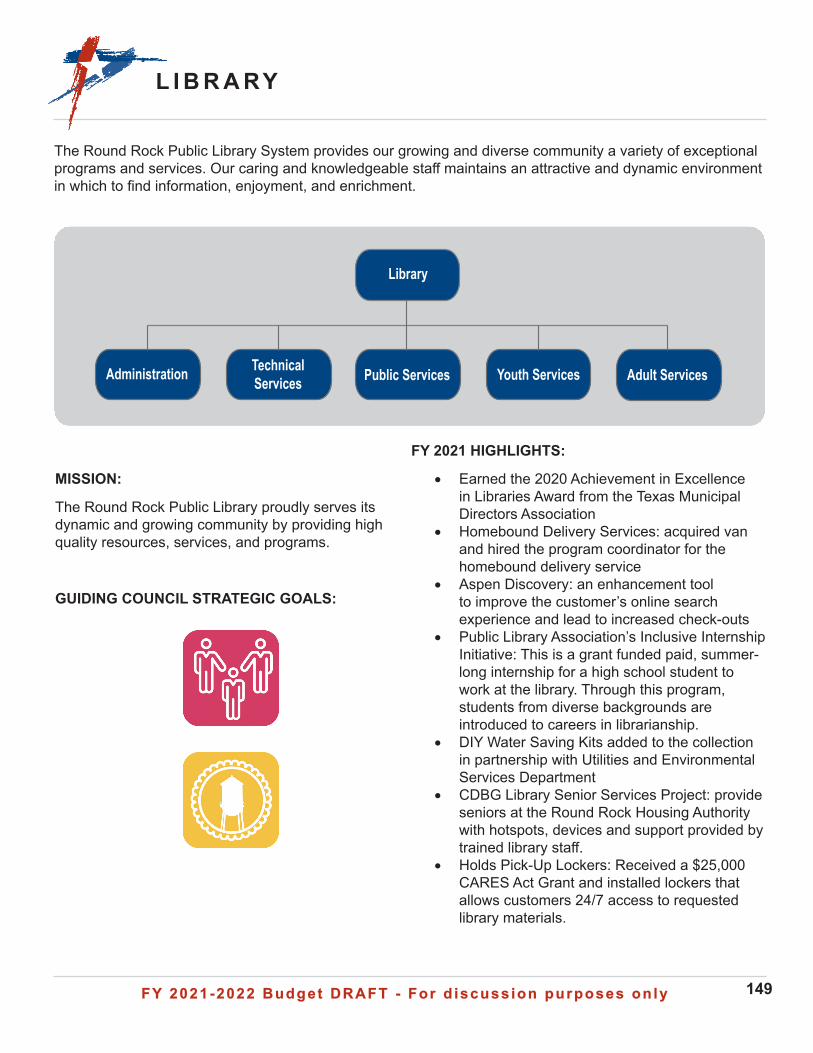
FY 2021-2022 Budget DRAFT - For d iscuss ion purposes on lyFY 2021-2022 Budget DRAFT - For d iscuss ion purposes on ly 149
L I B R A RY
Technical ServicesAdministration Public Services Youth Services Adult Services
Library
The Round Rock Public Library System provides our growing and diverse community a variety of exceptional programs and services. Our caring and knowledgeable staff maintains an attractive and dynamic environment in which to find information, enjoyment, and enrichment.
MISSION:
The Round Rock Public Library proudly serves its dynamic and growing community by providing high quality resources, services, and programs.
GUIDING COUNCIL STRATEGIC GOALS:
FY 2021 HIGHLIGHTS:
• Earned the 2020 Achievement in Excellence in Libraries Award from the Texas Municipal Directors Association
• Homebound Delivery Services: acquired van and hired the program coordinator for the homebound delivery service
• Aspen Discovery: an enhancement tool to improve the customer’s online search experience and lead to increased check-outs
• Public Library Association’s Inclusive Internship Initiative: This is a grant funded paid, summer-long internship for a high school student to work at the library. Through this program, students from diverse backgrounds are introduced to careers in librarianship.
• DIY Water Saving Kits added to the collection in partnership with Utilities and Environmental Services Department
• CDBG Library Senior Services Project: provide seniors at the Round Rock Housing Authority with hotspots, devices and support provided by trained library staff.
• Holds Pick-Up Lockers: Received a $25,000 CARES Act Grant and installed lockers that allows customers 24/7 access to requested library materials.
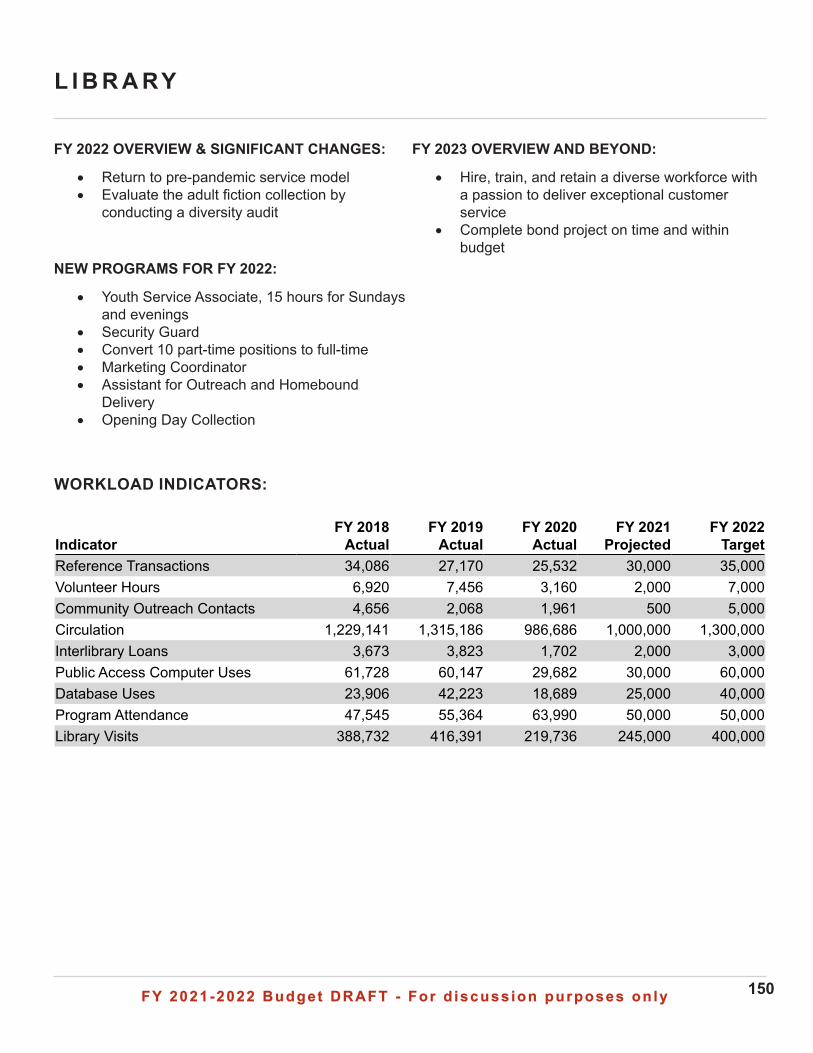
FY 2021-2022 Budget DRAFT - For d iscuss ion purposes on lyFY 2021-2022 Budget DRAFT - For d iscuss ion purposes on ly 150
L I B R A RY
FY 2023 OVERVIEW AND BEYOND:
• Hire, train, and retain a diverse workforce with a passion to deliver exceptional customer service
• Complete bond project on time and within budget
WORKLOAD INDICATORS:
FY 2022 OVERVIEW & SIGNIFICANT CHANGES:
• Return to pre-pandemic service model• Evaluate the adult fiction collection by
conducting a diversity audit
NEW PROGRAMS FOR FY 2022:
• Youth Service Associate, 15 hours for Sundays and evenings
• Security Guard• Convert 10 part-time positions to full-time• Marketing Coordinator• Assistant for Outreach and Homebound
Delivery• Opening Day Collection
Indicator FY 2018
Actual FY 2019
Actual FY 2020
Actual FY 2021
Projected FY 2022
Target Reference Transactions 34,086 27,170 25,532 30,000 35,000Volunteer Hours 6,920 7,456 3,160 2,000 7,000Community Outreach Contacts 4,656 2,068 1,961 500 5,000Circulation 1,229,141 1,315,186 986,686 1,000,000 1,300,000Interlibrary Loans 3,673 3,823 1,702 2,000 3,000Public Access Computer Uses 61,728 60,147 29,682 30,000 60,000Database Uses 23,906 42,223 18,689 25,000 40,000Program Attendance 47,545 55,364 63,990 50,000 50,000Library Visits 388,732 416,391 219,736 245,000 400,000
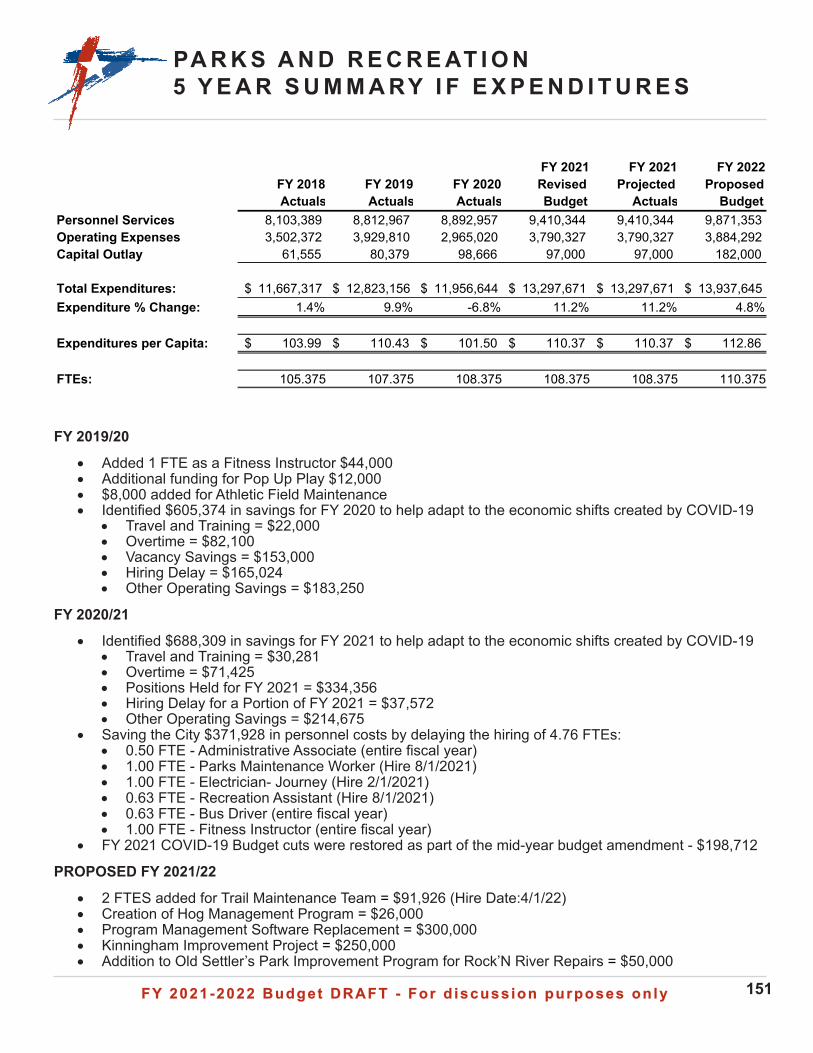
FY 2021-2022 Budget DRAFT - For d iscuss ion purposes on lyFY 2021-2022 Budget DRAFT - For d iscuss ion purposes on ly 151
PA R K S A N D R E C R E AT I O N5 Y E A R S U M M A RY I F E X P E N D I T U R E S
FY 2019/20
• Added 1 FTE as a Fitness Instructor $44,000• Additional funding for Pop Up Play $12,000• $8,000 added for Athletic Field Maintenance • Identified $605,374 in savings for FY 2020 to help adapt to the economic shifts created by COVID-19
• Travel and Training = $22,000• Overtime = $82,100• Vacancy Savings = $153,000• Hiring Delay = $165,024• Other Operating Savings = $183,250
FY 2020/21
• Identified $688,309 in savings for FY 2021 to help adapt to the economic shifts created by COVID-19• Travel and Training = $30,281• Overtime = $71,425• Positions Held for FY 2021 = $334,356• Hiring Delay for a Portion of FY 2021 = $37,572• Other Operating Savings = $214,675
• Saving the City $371,928 in personnel costs by delaying the hiring of 4.76 FTEs:• 0.50 FTE - Administrative Associate (entire fiscal year)• 1.00 FTE - Parks Maintenance Worker (Hire 8/1/2021)• 1.00 FTE - Electrician- Journey (Hire 2/1/2021)• 0.63 FTE - Recreation Assistant (Hire 8/1/2021)• 0.63 FTE - Bus Driver (entire fiscal year)• 1.00 FTE - Fitness Instructor (entire fiscal year)
• FY 2021 COVID-19 Budget cuts were restored as part of the mid-year budget amendment - $198,712
PROPOSED FY 2021/22
• 2 FTES added for Trail Maintenance Team = $91,926 (Hire Date:4/1/22)• Creation of Hog Management Program = $26,000• Program Management Software Replacement = $300,000• Kinningham Improvement Project = $250,000• Addition to Old Settler’s Park Improvement Program for Rock’N River Repairs = $50,000
FY 2018 Actuals
FY 2019 Actuals
FY 2020 Actuals
FY 2021 Revised Budget
FY 2021 Projected
Actuals
FY 2022 Proposed
BudgetPersonnel Services 8,103,389 8,812,967 8,892,957 9,410,344 9,410,344 9,871,353 Operating Expenses 3,502,372 3,929,810 2,965,020 3,790,327 3,790,327 3,884,292 Capital Outlay 61,555 80,379 98,666 97,000 97,000 182,000
Total Expenditures: 11,667,317$ 12,823,156$ 11,956,644$ 13,297,671$ 13,297,671$ 13,937,645$ Expenditure % Change: 1.4% 9.9% -6.8% 11.2% 11.2% 4.8%
Expenditures per Capita: 103.99$ 110.43$ 101.50$ 110.37$ 110.37$ 112.86$
FTEs: 105.375 107.375 108.375 108.375 108.375 110.375
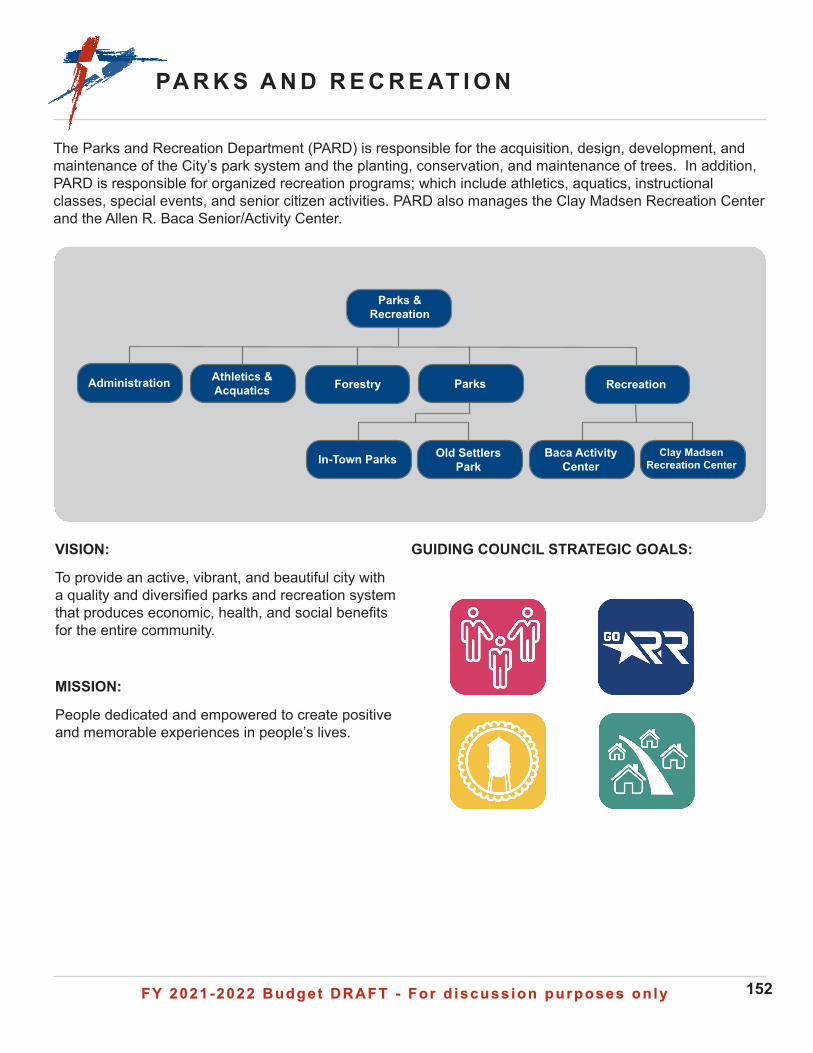
FY 2021-2022 Budget DRAFT - For d iscuss ion purposes on lyFY 2021-2022 Budget DRAFT - For d iscuss ion purposes on ly 152
PA R K S A N D R E C R E AT I O N
The Parks and Recreation Department (PARD) is responsible for the acquisition, design, development, and maintenance of the City’s park system and the planting, conservation, and maintenance of trees. In addition, PARD is responsible for organized recreation programs; which include athletics, aquatics, instructional classes, special events, and senior citizen activities. PARD also manages the Clay Madsen Recreation Center and the Allen R. Baca Senior/Activity Center.
VISION:
To provide an active, vibrant, and beautiful city with a quality and diversified parks and recreation system that produces economic, health, and social benefits for the entire community.
MISSION:
People dedicated and empowered to create positive and memorable experiences in people’s lives.
GUIDING COUNCIL STRATEGIC GOALS:
Athletics & AcquaticsAdministration ParksForestry Recreation
Clay Madsen Recreation Center
Baca Activity Center
Old Settlers Park
Parks & Recreation
In-Town Parks
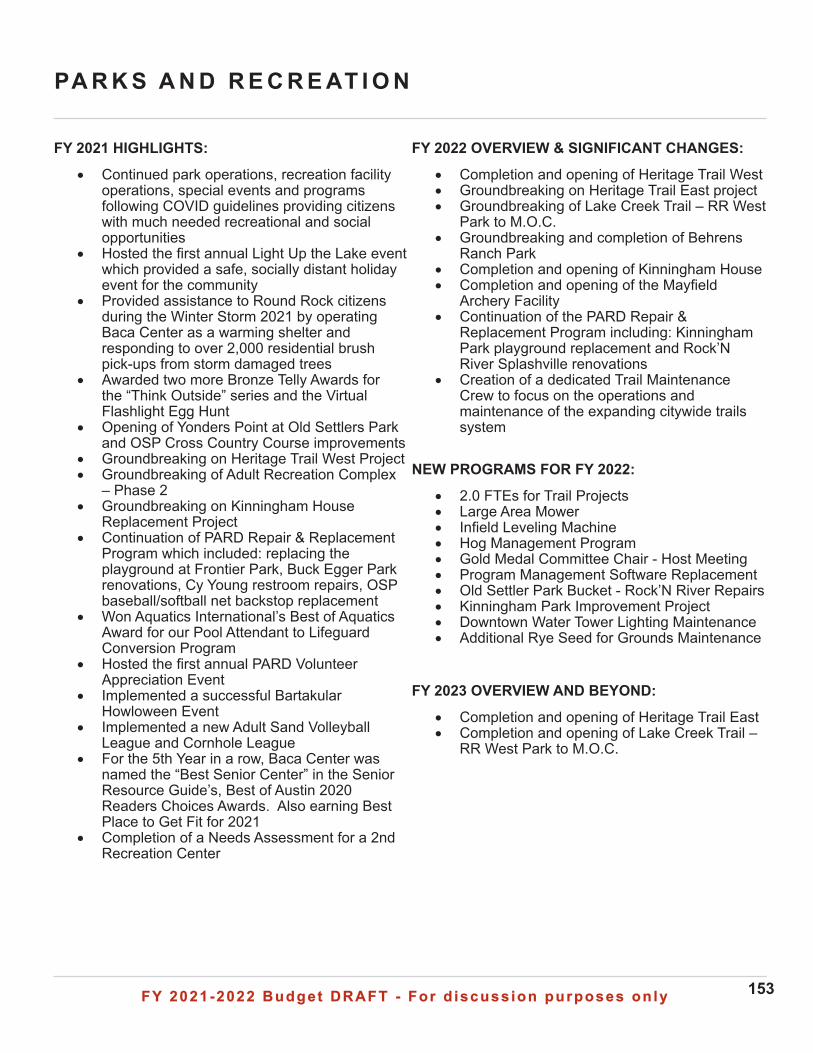
FY 2021-2022 Budget DRAFT - For d iscuss ion purposes on lyFY 2021-2022 Budget DRAFT - For d iscuss ion purposes on ly 153
PA R K S A N D R E C R E AT I O N
FY 2022 OVERVIEW & SIGNIFICANT CHANGES:
• Completion and opening of Heritage Trail West• Groundbreaking on Heritage Trail East project• Groundbreaking of Lake Creek Trail – RR West
Park to M.O.C.• Groundbreaking and completion of Behrens
Ranch Park• Completion and opening of Kinningham House • Completion and opening of the Mayfield
Archery Facility• Continuation of the PARD Repair &
Replacement Program including: Kinningham Park playground replacement and Rock’N River Splashville renovations
• Creation of a dedicated Trail Maintenance Crew to focus on the operations and maintenance of the expanding citywide trails system
NEW PROGRAMS FOR FY 2022:
• 2.0 FTEs for Trail Projects• Large Area Mower• Infield Leveling Machine• Hog Management Program• Gold Medal Committee Chair - Host Meeting• Program Management Software Replacement• Old Settler Park Bucket - Rock’N River Repairs• Kinningham Park Improvement Project• Downtown Water Tower Lighting Maintenance• Additional Rye Seed for Grounds Maintenance
FY 2023 OVERVIEW AND BEYOND:
• Completion and opening of Heritage Trail East• Completion and opening of Lake Creek Trail –
RR West Park to M.O.C.
FY 2021 HIGHLIGHTS:
• Continued park operations, recreation facility operations, special events and programs following COVID guidelines providing citizens with much needed recreational and social opportunities
• Hosted the first annual Light Up the Lake event which provided a safe, socially distant holiday event for the community
• Provided assistance to Round Rock citizens during the Winter Storm 2021 by operating Baca Center as a warming shelter and responding to over 2,000 residential brush pick-ups from storm damaged trees
• Awarded two more Bronze Telly Awards for the “Think Outside” series and the Virtual Flashlight Egg Hunt
• Opening of Yonders Point at Old Settlers Park and OSP Cross Country Course improvements
• Groundbreaking on Heritage Trail West Project• Groundbreaking of Adult Recreation Complex
– Phase 2• Groundbreaking on Kinningham House
Replacement Project• Continuation of PARD Repair & Replacement
Program which included: replacing the playground at Frontier Park, Buck Egger Park renovations, Cy Young restroom repairs, OSP baseball/softball net backstop replacement
• Won Aquatics International’s Best of Aquatics Award for our Pool Attendant to Lifeguard Conversion Program
• Hosted the first annual PARD Volunteer Appreciation Event
• Implemented a successful Bartakular Howloween Event
• Implemented a new Adult Sand Volleyball League and Cornhole League
• For the 5th Year in a row, Baca Center was named the “Best Senior Center” in the Senior Resource Guide’s, Best of Austin 2020 Readers Choices Awards. Also earning Best Place to Get Fit for 2021
• Completion of a Needs Assessment for a 2nd Recreation Center
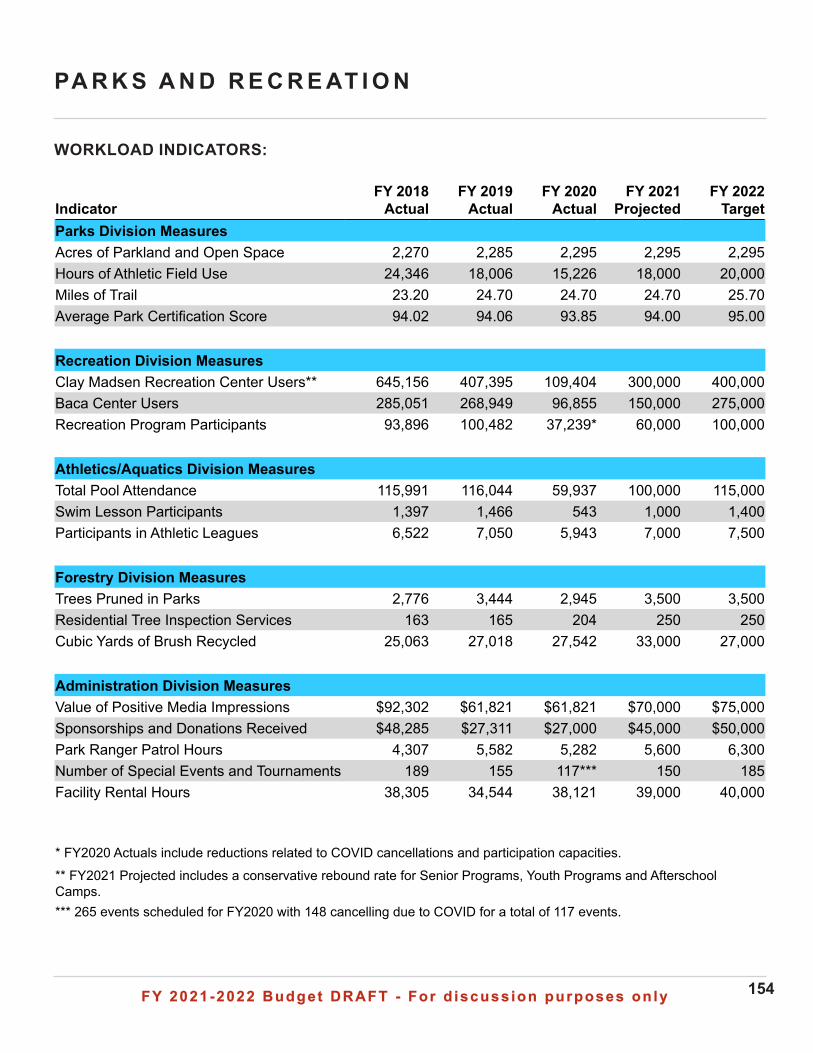
FY 2021-2022 Budget DRAFT - For d iscuss ion purposes on lyFY 2021-2022 Budget DRAFT - For d iscuss ion purposes on ly 154
PA R K S A N D R E C R E AT I O N
WORKLOAD INDICATORS:
Indicator FY 2018
Actual FY 2019
Actual FY 2020
Actual FY 2021
Projected FY 2022
Target Parks Division MeasuresAcres of Parkland and Open Space 2,270 2,285 2,295 2,295 2,295Hours of Athletic Field Use 24,346 18,006 15,226 18,000 20,000Miles of Trail 23.20 24.70 24.70 24.70 25.70Average Park Certification Score 94.02 94.06 93.85 94.00 95.00
Recreation Division MeasuresClay Madsen Recreation Center Users** 645,156 407,395 109,404 300,000 400,000Baca Center Users 285,051 268,949 96,855 150,000 275,000Recreation Program Participants 93,896 100,482 37,239* 60,000 100,000
Athletics/Aquatics Division MeasuresTotal Pool Attendance 115,991 116,044 59,937 100,000 115,000Swim Lesson Participants 1,397 1,466 543 1,000 1,400Participants in Athletic Leagues 6,522 7,050 5,943 7,000 7,500
Forestry Division MeasuresTrees Pruned in Parks 2,776 3,444 2,945 3,500 3,500Residential Tree Inspection Services 163 165 204 250 250Cubic Yards of Brush Recycled 25,063 27,018 27,542 33,000 27,000
Administration Division MeasuresValue of Positive Media Impressions $92,302 $61,821 $61,821 $70,000 $75,000Sponsorships and Donations Received $48,285 $27,311 $27,000 $45,000 $50,000 Park Ranger Patrol Hours 4,307 5,582 5,282 5,600 6,300Number of Special Events and Tournaments 189 155 117*** 150 185Facility Rental Hours 38,305 34,544 38,121 39,000 40,000
* FY2020 Actuals include reductions related to COVID cancellations and participation capacities.
** FY2021 Projected includes a conservative rebound rate for Senior Programs, Youth Programs and Afterschool Camps.*** 265 events scheduled for FY2020 with 148 cancelling due to COVID for a total of 117 events.
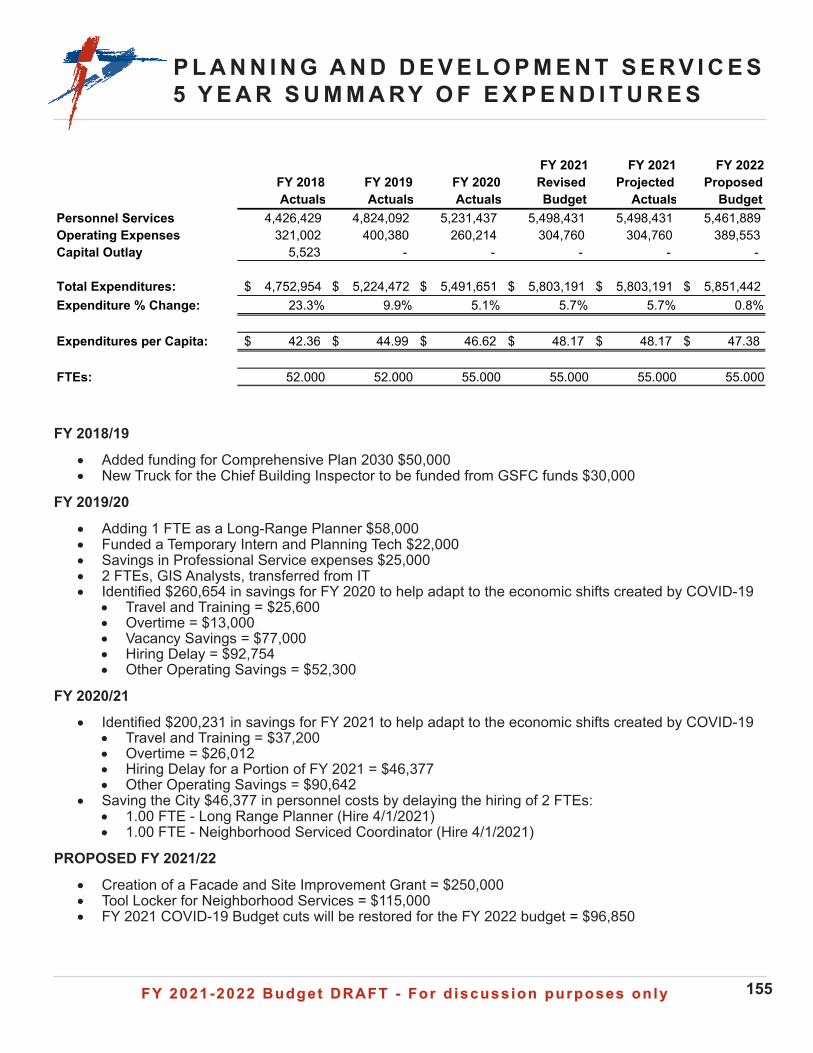
FY 2021-2022 Budget DRAFT - For d iscuss ion purposes on lyFY 2021-2022 Budget DRAFT - For d iscuss ion purposes on ly 155
P L A N N I N G A N D D E V E L O P M E N T S E R V I C E S5 Y E A R S U M M A RY O F E X P E N D I T U R E S
FY 2018/19
• Added funding for Comprehensive Plan 2030 $50,000• New Truck for the Chief Building Inspector to be funded from GSFC funds $30,000
FY 2019/20
• Adding 1 FTE as a Long-Range Planner $58,000• Funded a Temporary Intern and Planning Tech $22,000• Savings in Professional Service expenses $25,000• 2 FTEs, GIS Analysts, transferred from IT• Identified $260,654 in savings for FY 2020 to help adapt to the economic shifts created by COVID-19
• Travel and Training = $25,600• Overtime = $13,000• Vacancy Savings = $77,000• Hiring Delay = $92,754• Other Operating Savings = $52,300
FY 2020/21
• Identified $200,231 in savings for FY 2021 to help adapt to the economic shifts created by COVID-19• Travel and Training = $37,200• Overtime = $26,012• Hiring Delay for a Portion of FY 2021 = $46,377• Other Operating Savings = $90,642
• Saving the City $46,377 in personnel costs by delaying the hiring of 2 FTEs:• 1.00 FTE - Long Range Planner (Hire 4/1/2021)• 1.00 FTE - Neighborhood Serviced Coordinator (Hire 4/1/2021)
PROPOSED FY 2021/22
• Creation of a Facade and Site Improvement Grant = $250,000• Tool Locker for Neighborhood Services = $115,000• FY 2021 COVID-19 Budget cuts will be restored for the FY 2022 budget = $96,850
FY 2018 Actuals
FY 2019 Actuals
FY 2020 Actuals
FY 2021 Revised Budget
FY 2021 Projected
Actuals
FY 2022 Proposed
BudgetPersonnel Services 4,426,429 4,824,092 5,231,437 5,498,431 5,498,431 5,461,889 Operating Expenses 321,002 400,380 260,214 304,760 304,760 389,553 Capital Outlay 5,523 - - - - -
Total Expenditures: 4,752,954$ 5,224,472$ 5,491,651$ 5,803,191$ 5,803,191$ 5,851,442$ Expenditure % Change: 23.3% 9.9% 5.1% 5.7% 5.7% 0.8%
Expenditures per Capita: 42.36$ 44.99$ 46.62$ 48.17$ 48.17$ 47.38$
FTEs: 52.000 52.000 55.000 55.000 55.000 55.000
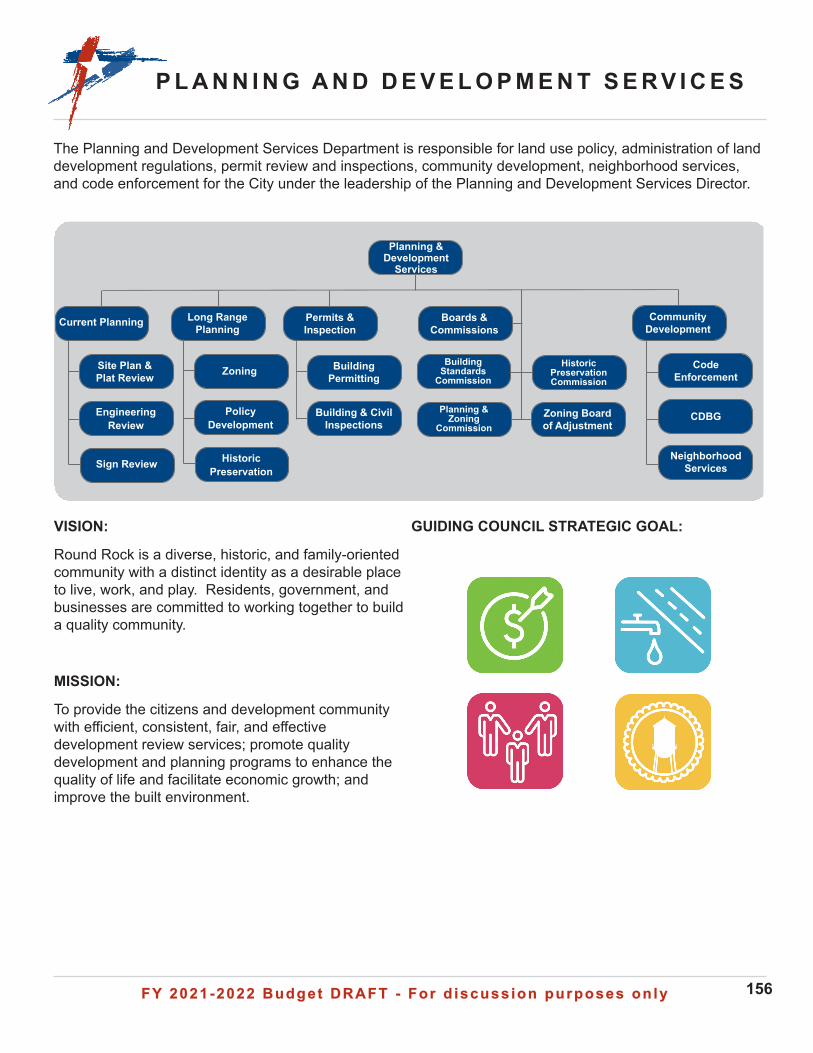
FY 2021-2022 Budget DRAFT - For d iscuss ion purposes on lyFY 2021-2022 Budget DRAFT - For d iscuss ion purposes on ly 156
P L A N N I N G A N D D E V E L O P M E N T S E R V I C E S
Long Range Planning
Current Planning
Site Plan & Plat Review
Engineering Review
Sign Review
Building Permitting
Building & Civil Inspections
Historic Preservation Commission
Building Standards
Commission
Permits & Inspection
Code Enforcement
Boards & Commissions
Zoning Board of Adjustment
Planning & Development
Services
Zoning
Policy Development
Historic Preservation
Planning & Zoning
Commission
Community Development
CDBG
Neighborhood Services
The Planning and Development Services Department is responsible for land use policy, administration of land development regulations, permit review and inspections, community development, neighborhood services, and code enforcement for the City under the leadership of the Planning and Development Services Director.
VISION:
Round Rock is a diverse, historic, and family-oriented community with a distinct identity as a desirable place to live, work, and play. Residents, government, and businesses are committed to working together to build a quality community.
MISSION:
To provide the citizens and development community with efficient, consistent, fair, and effective development review services; promote quality development and planning programs to enhance the quality of life and facilitate economic growth; and improve the built environment.
GUIDING COUNCIL STRATEGIC GOAL:
FY 2021-2022 Budget DRAFT - For d iscuss ion purposes on lyFY 2021-2022 Budget DRAFT - For d iscuss ion purposes on ly 157
P L A N N I N G A N D D E V E L O P M E N T S E R V I C E S
• Facilitate the development process of the District, City Library, Depot Townhomes, Kenney Fort North PUD, and other economic development projects in the pipeline
• Play an instrumental role in downtown redevelopment.
• Comprehensive Plan 2030 implementation.
NEW PROGRAMS FOR FY 2022:
• Tool Lending Lockers: this will allow for contactless pickup and dropoff of tools borrowed by citizens from the Neighborhood Services team, which will free up staff time and expand the hours of service.
• Commercial façade and site improvement grants: this program promotes rehabilitation, enhancement, restoration, and preservation of building facades and will be a catalyst to attract new customers and businesses by stimulating private investment and economic development.
FY 2023 OVERVIEW AND BEYOND:
• Consolidate all customer intake areas into a single, comprehensive development assistance counter.
• Continue to play an instrumental role in downtown redevelopment.
• Comprehensive Plan 2030 implementation and tracking.
FY 2021 HIGHLIGHTS:
• Maintained all development services during the COVID-19 lockdown, including inspections and virtual meetings.
• Met or exceeded deadlines on development applications, including during COVID-19.
• Successfully managed another year of high growth to the tune of a projected $390 million in new non-residential and multi-family projects, in accordance with established performance measures.
• During COVID-19 lockdowns, we relaxed temporary signage enforcement for restaurants; allowed pop-up tents (which are typically prohibited temporary structures) for the provision of commercial services outdoors; extended deadlines for compliance on residential violations; increased lending on lawnmowers, tree saws, and trimmers for homeowners to address violations and had Code Enforcement provide the delivery.
• Planning staff provided all Historic Preservation tax exemption inspections this year due to COVID-19.
• Continued to provide rent and utility assistance to low-income residents during COVID-19 through the CDBG Action Plan
• Facilitated the successful, on-time grand opening of Kalahari by exercising reasonable flexibility in the final inspection and Certificate of Occupancy process.
• Worked with the development community to entitle and permit new, innovative housing products to address growing affordability issues, such as Urbana’s “horizontal multifamily” development and a similar proposal in Avery Centre.
FY 2022 OVERVIEW & SIGNIFICANT CHANGES:
• Work with IT on implementation of the new land management software system, including electronic plan reviews and application submittals.
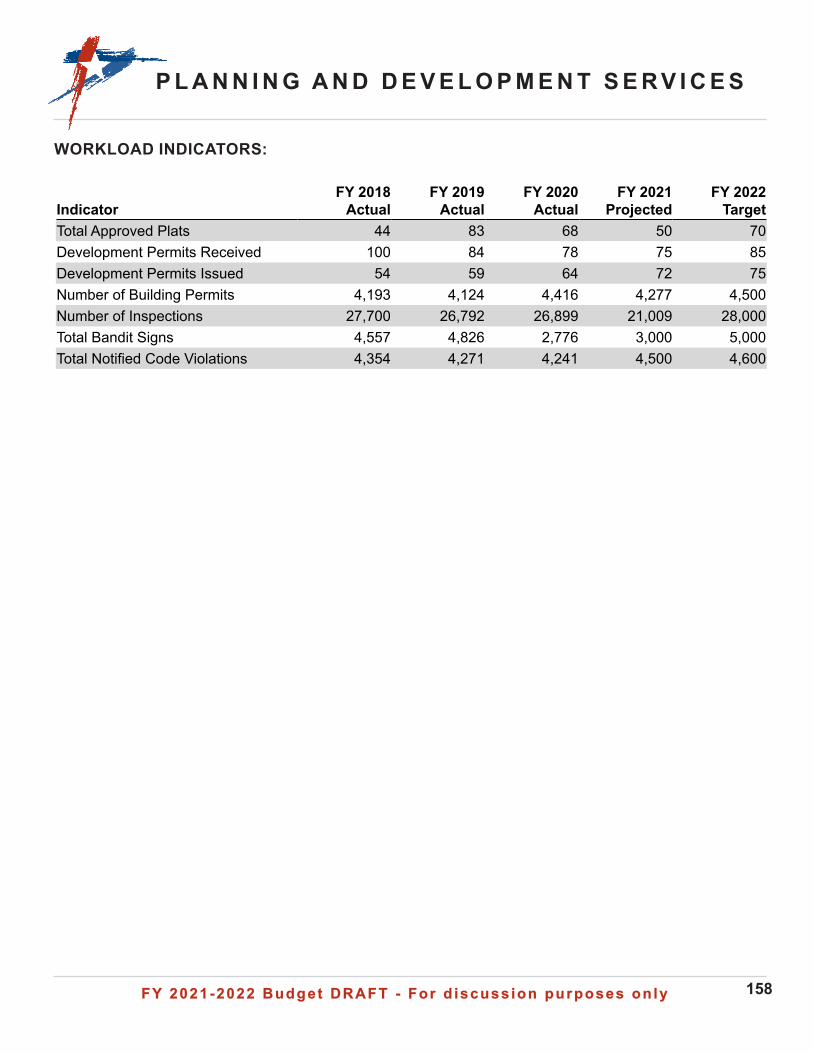
FY 2021-2022 Budget DRAFT - For d iscuss ion purposes on lyFY 2021-2022 Budget DRAFT - For d iscuss ion purposes on ly 158
Indicator FY 2018
Actual FY 2019
Actual FY 2020
Actual FY 2021
Projected FY 2022
Target Total Approved Plats 44 83 68 50 70Development Permits Received 100 84 78 75 85Development Permits Issued 54 59 64 72 75Number of Building Permits 4,193 4,124 4,416 4,277 4,500Number of Inspections 27,700 26,792 26,899 21,009 28,000Total Bandit Signs 4,557 4,826 2,776 3,000 5,000Total Notified Code Violations 4,354 4,271 4,241 4,500 4,600
WORKLOAD INDICATORS:
P L A N N I N G A N D D E V E L O P M E N T S E R V I C E S
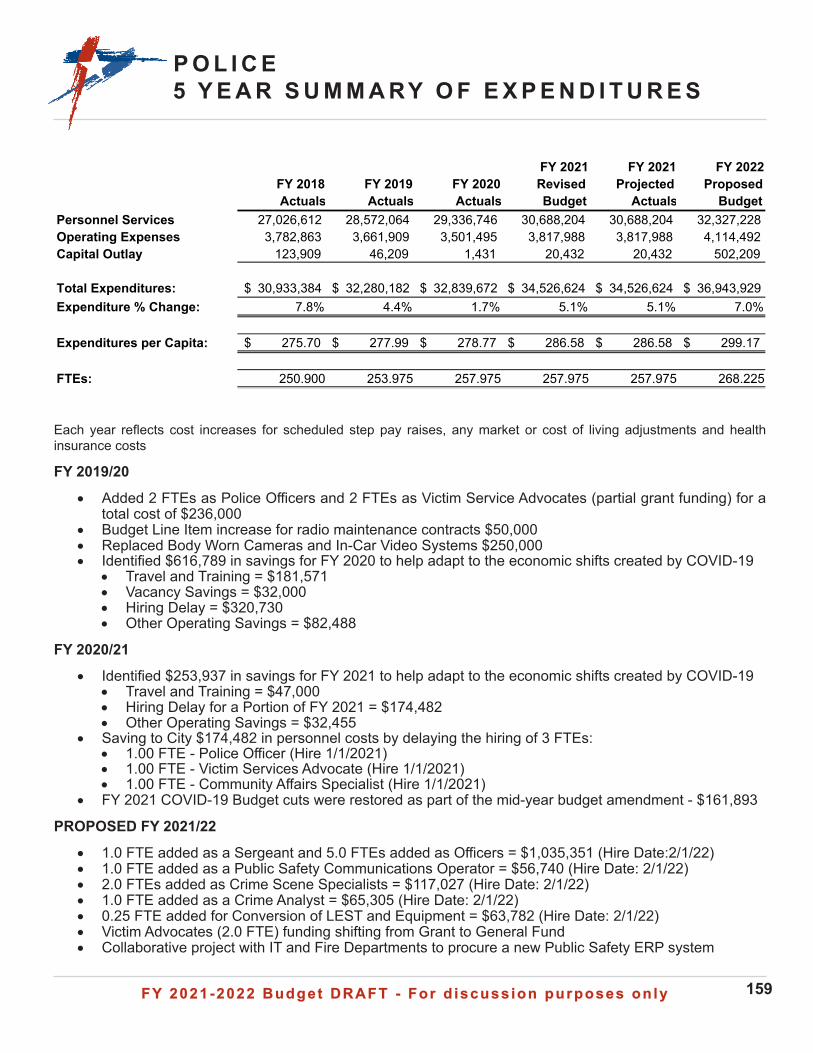
FY 2021-2022 Budget DRAFT - For d iscuss ion purposes on lyFY 2021-2022 Budget DRAFT - For d iscuss ion purposes on ly 159
P O L I C E5 Y E A R S U M M A RY O F E X P E N D I T U R E S
Each year reflects cost increases for scheduled step pay raises, any market or cost of living adjustments and health insurance costs
FY 2019/20
• Added 2 FTEs as Police Officers and 2 FTEs as Victim Service Advocates (partial grant funding) for a total cost of $236,000
• Budget Line Item increase for radio maintenance contracts $50,000• Replaced Body Worn Cameras and In-Car Video Systems $250,000• Identified $616,789 in savings for FY 2020 to help adapt to the economic shifts created by COVID-19
• Travel and Training = $181,571• Vacancy Savings = $32,000• Hiring Delay = $320,730• Other Operating Savings = $82,488
FY 2020/21
• Identified $253,937 in savings for FY 2021 to help adapt to the economic shifts created by COVID-19• Travel and Training = $47,000• Hiring Delay for a Portion of FY 2021 = $174,482• Other Operating Savings = $32,455
• Saving to City $174,482 in personnel costs by delaying the hiring of 3 FTEs:• 1.00 FTE - Police Officer (Hire 1/1/2021)• 1.00 FTE - Victim Services Advocate (Hire 1/1/2021)• 1.00 FTE - Community Affairs Specialist (Hire 1/1/2021)
• FY 2021 COVID-19 Budget cuts were restored as part of the mid-year budget amendment - $161,893
PROPOSED FY 2021/22
• 1.0 FTE added as a Sergeant and 5.0 FTEs added as Officers = $1,035,351 (Hire Date:2/1/22)• 1.0 FTE added as a Public Safety Communications Operator = $56,740 (Hire Date: 2/1/22)• 2.0 FTEs added as Crime Scene Specialists = $117,027 (Hire Date: 2/1/22)• 1.0 FTE added as a Crime Analyst = $65,305 (Hire Date: 2/1/22)• 0.25 FTE added for Conversion of LEST and Equipment = $63,782 (Hire Date: 2/1/22)• Victim Advocates (2.0 FTE) funding shifting from Grant to General Fund • Collaborative project with IT and Fire Departments to procure a new Public Safety ERP system
FY 2018 Actuals
FY 2019 Actuals
FY 2020 Actuals
FY 2021 Revised Budget
FY 2021 Projected
Actuals
FY 2022 Proposed
BudgetPersonnel Services 27,026,612 28,572,064 29,336,746 30,688,204 30,688,204 32,327,228 Operating Expenses 3,782,863 3,661,909 3,501,495 3,817,988 3,817,988 4,114,492 Capital Outlay 123,909 46,209 1,431 20,432 20,432 502,209
Total Expenditures: 30,933,384$ 32,280,182$ 32,839,672$ 34,526,624$ 34,526,624$ 36,943,929$ Expenditure % Change: 7.8% 4.4% 1.7% 5.1% 5.1% 7.0%
Expenditures per Capita: 275.70$ 277.99$ 278.77$ 286.58$ 286.58$ 299.17$
FTEs: 250.900 253.975 257.975 257.975 257.975 268.225
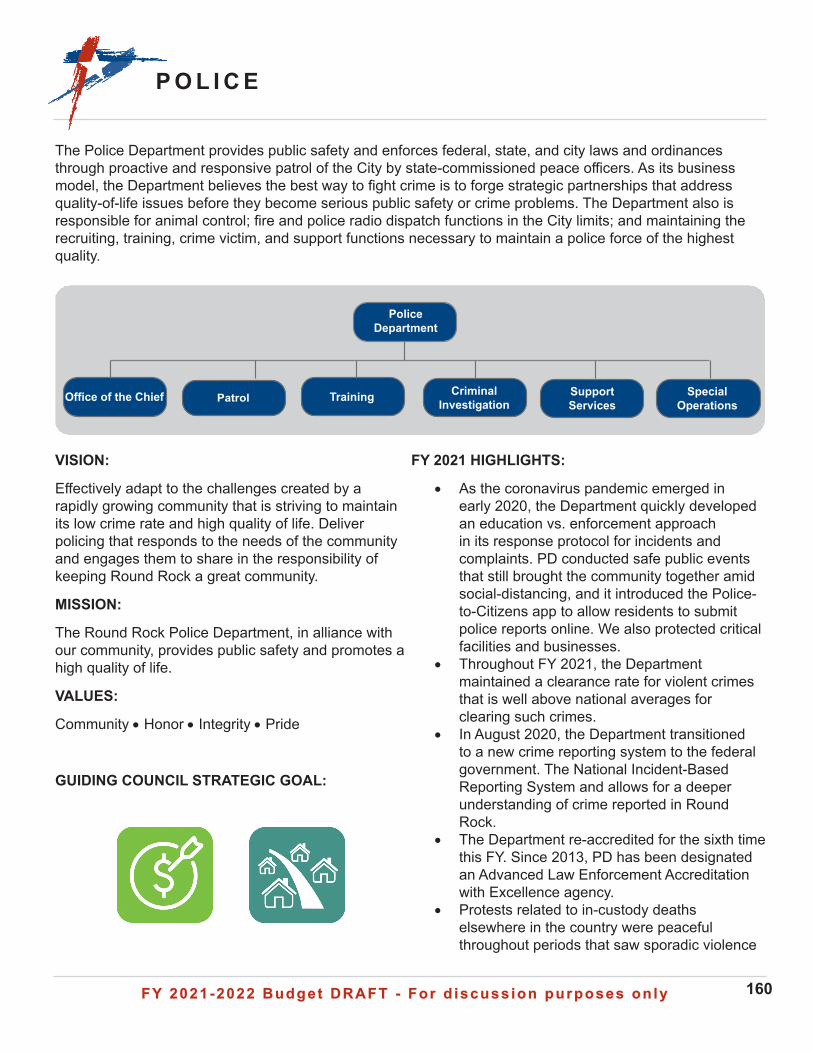
FY 2021-2022 Budget DRAFT - For d iscuss ion purposes on lyFY 2021-2022 Budget DRAFT - For d iscuss ion purposes on ly 160
P O L I C E
The Police Department provides public safety and enforces federal, state, and city laws and ordinances through proactive and responsive patrol of the City by state-commissioned peace officers. As its business model, the Department believes the best way to fight crime is to forge strategic partnerships that address quality-of-life issues before they become serious public safety or crime problems. The Department also is responsible for animal control; fire and police radio dispatch functions in the City limits; and maintaining the recruiting, training, crime victim, and support functions necessary to maintain a police force of the highest quality.
VISION:
Effectively adapt to the challenges created by a rapidly growing community that is striving to maintain its low crime rate and high quality of life. Deliver policing that responds to the needs of the community and engages them to share in the responsibility of keeping Round Rock a great community.
MISSION:
The Round Rock Police Department, in alliance with our community, provides public safety and promotes a high quality of life.
VALUES:
Community • Honor • Integrity • Pride
GUIDING COUNCIL STRATEGIC GOAL:
FY 2021 HIGHLIGHTS:
• As the coronavirus pandemic emerged in early 2020, the Department quickly developed an education vs. enforcement approach in its response protocol for incidents and complaints. PD conducted safe public events that still brought the community together amid social-distancing, and it introduced the Police-to-Citizens app to allow residents to submit police reports online. We also protected critical facilities and businesses.
• Throughout FY 2021, the Department maintained a clearance rate for violent crimes that is well above national averages for clearing such crimes.
• In August 2020, the Department transitioned to a new crime reporting system to the federal government. The National Incident-Based Reporting System and allows for a deeper understanding of crime reported in Round Rock.
• The Department re-accredited for the sixth time this FY. Since 2013, PD has been designated an Advanced Law Enforcement Accreditation with Excellence agency.
• Protests related to in-custody deaths elsewhere in the country were peaceful throughout periods that saw sporadic violence
PatrolOffice of the Chief Training Support Services
Special Operations
Police Department
Criminal Investigation
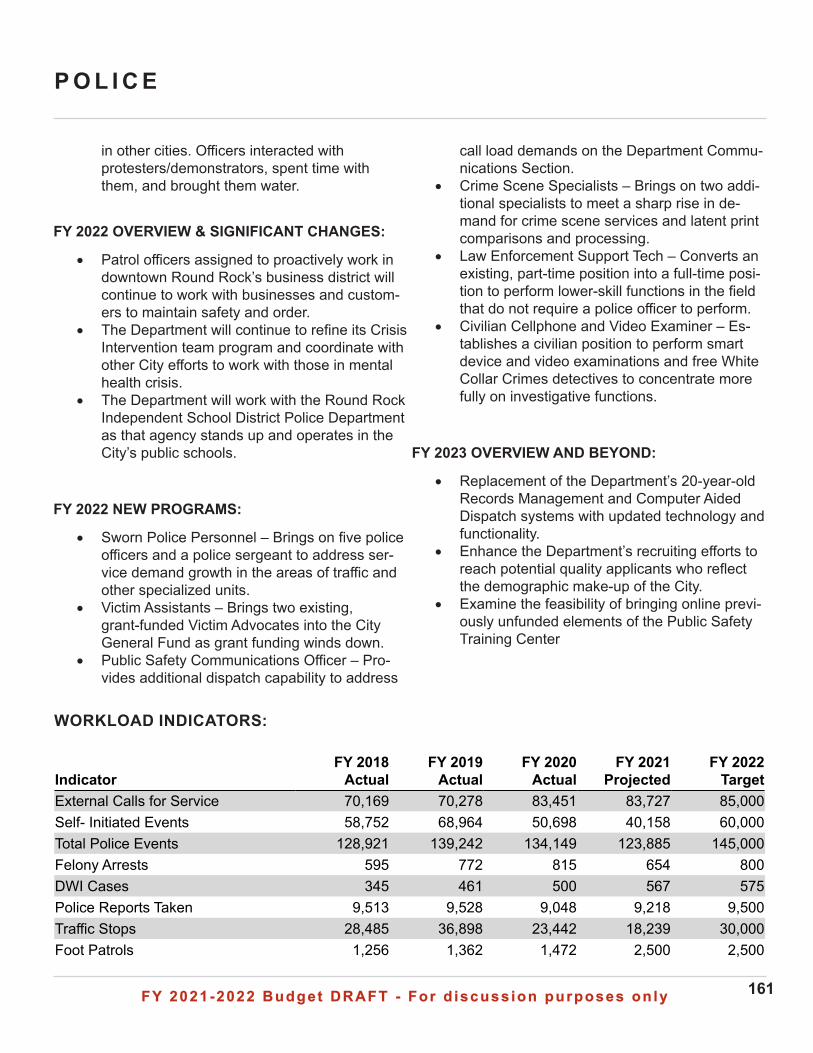
FY 2021-2022 Budget DRAFT - For d iscuss ion purposes on lyFY 2021-2022 Budget DRAFT - For d iscuss ion purposes on ly 161
P O L I C E
WORKLOAD INDICATORS:
call load demands on the Department Commu-nications Section.
• Crime Scene Specialists – Brings on two addi-tional specialists to meet a sharp rise in de-mand for crime scene services and latent print comparisons and processing.
• Law Enforcement Support Tech – Converts an existing, part-time position into a full-time posi-tion to perform lower-skill functions in the field that do not require a police officer to perform.
• Civilian Cellphone and Video Examiner – Es-tablishes a civilian position to perform smart device and video examinations and free White Collar Crimes detectives to concentrate more fully on investigative functions.
FY 2023 OVERVIEW AND BEYOND:
• Replacement of the Department’s 20-year-old Records Management and Computer Aided Dispatch systems with updated technology and functionality.
• Enhance the Department’s recruiting efforts to reach potential quality applicants who reflect the demographic make-up of the City.
• Examine the feasibility of bringing online previ-ously unfunded elements of the Public Safety Training Center
in other cities. Officers interacted with protesters/demonstrators, spent time with them, and brought them water.
FY 2022 OVERVIEW & SIGNIFICANT CHANGES:
• Patrol officers assigned to proactively work in downtown Round Rock’s business district will continue to work with businesses and custom-ers to maintain safety and order.
• The Department will continue to refine its Crisis Intervention team program and coordinate with other City efforts to work with those in mental health crisis.
• The Department will work with the Round Rock Independent School District Police Department as that agency stands up and operates in the City’s public schools.
FY 2022 NEW PROGRAMS:
• Sworn Police Personnel – Brings on five police officers and a police sergeant to address ser-vice demand growth in the areas of traffic and other specialized units.
• Victim Assistants – Brings two existing, grant-funded Victim Advocates into the City General Fund as grant funding winds down.
• Public Safety Communications Officer – Pro-vides additional dispatch capability to address
Indicator FY 2018
Actual FY 2019
Actual FY 2020
Actual FY 2021
Projected FY 2022
Target External Calls for Service 70,169 70,278 83,451 83,727 85,000Self- Initiated Events 58,752 68,964 50,698 40,158 60,000Total Police Events 128,921 139,242 134,149 123,885 145,000Felony Arrests 595 772 815 654 800DWI Cases 345 461 500 567 575Police Reports Taken 9,513 9,528 9,048 9,218 9,500Traffic Stops 28,485 36,898 23,442 18,239 30,000Foot Patrols 1,256 1,362 1,472 2,500 2,500
WORKLOAD INDICATORS:
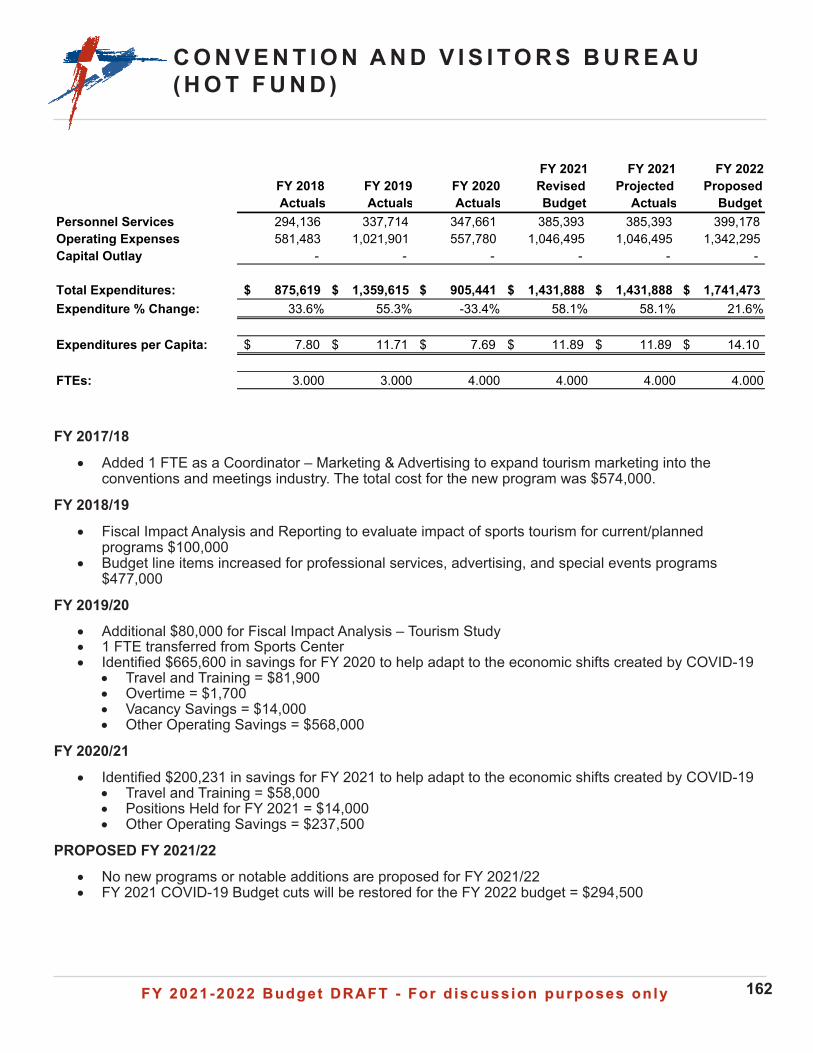
FY 2021-2022 Budget DRAFT - For d iscuss ion purposes on lyFY 2021-2022 Budget DRAFT - For d iscuss ion purposes on ly 162
C O N V E N T I O N A N D V I S I T O R S B U R E A U( H O T F U N D )
FY 2017/18
• Added 1 FTE as a Coordinator – Marketing & Advertising to expand tourism marketing into the conventions and meetings industry. The total cost for the new program was $574,000.
FY 2018/19
• Fiscal Impact Analysis and Reporting to evaluate impact of sports tourism for current/planned programs $100,000
• Budget line items increased for professional services, advertising, and special events programs $477,000
FY 2019/20• Additional $80,000 for Fiscal Impact Analysis – Tourism Study• 1 FTE transferred from Sports Center• Identified $665,600 in savings for FY 2020 to help adapt to the economic shifts created by COVID-19
• Travel and Training = $81,900• Overtime = $1,700• Vacancy Savings = $14,000• Other Operating Savings = $568,000
FY 2020/21
• Identified $200,231 in savings for FY 2021 to help adapt to the economic shifts created by COVID-19• Travel and Training = $58,000• Positions Held for FY 2021 = $14,000• Other Operating Savings = $237,500
PROPOSED FY 2021/22• No new programs or notable additions are proposed for FY 2021/22• FY 2021 COVID-19 Budget cuts will be restored for the FY 2022 budget = $294,500
FY 2018 Actuals
FY 2019 Actuals
FY 2020 Actuals
FY 2021 Revised Budget
FY 2021 Projected
Actuals
FY 2022 Proposed
BudgetPersonnel Services 294,136 337,714 347,661 385,393 385,393 399,178 Operating Expenses 581,483 1,021,901 557,780 1,046,495 1,046,495 1,342,295 Capital Outlay - - - - - -
Total Expenditures: 875,619$ 1,359,615$ 905,441$ 1,431,888$ 1,431,888$ 1,741,473$ Expenditure % Change: 33.6% 55.3% -33.4% 58.1% 58.1% 21.6%
Expenditures per Capita: 7.80$ 11.71$ 7.69$ 11.89$ 11.89$ 14.10$
FTEs: 3.000 3.000 4.000 4.000 4.000 4.000
FY 2021-2022 Budget DRAFT - For d iscuss ion purposes on lyFY 2021-2022 Budget DRAFT - For d iscuss ion purposes on ly 163
C O N V E N T I O N A N D V I S I T O R S B U R E A U
The function of this department is to implement the City’s long-term Tourism Plan and represent the City in all other functions related to tourism and the Convention and Visitors Bureau (CVB). The CVB is the desig-nated sales and marketing department for the City of Round Rock (designated DMO - “Destination Marketing Organization”). The tourism department’s mission aligns with the strategic plan by directly contributing to the economic vitality and enhancing the quality of life in Round Rock.
VISION:
To help promote Round Rock as the city of choice for tourists and citizens.
MISSION:
To promote economic diversity by developing the tourism industry in Round Rock.
GUIDING COUNCIL STRATEGIC GOALS:
FY 2021 HIGHLIGHTS:
• Held one national tournament in January 202• Tournaments and Events totaled 103,132
participants/guests• Reported 38 weeks (April 2020 – December
2020) of weekly hotel occupancy percentages to Finance during the Global Pandemic
• Social Media Statistics Comparing 2019 to 2020:
• Facebook: • Reactions: 70.2% increase • Comments: 60.7% increase• Shares: 38.4% increase
FY 2022 OVERVIEW & SIGNIFICANT CHANGES:
• Continue to position Round Rock as a premier destination as the hotel and hospitality industry recovers from the pandemic.
NEW PROGRAMS FOR FY 2022:
• No new programs were requested
Sports Management and Tourism
PurchasingConvention &
Visitors Bureau (CVB)Purchasing
Visitor Information
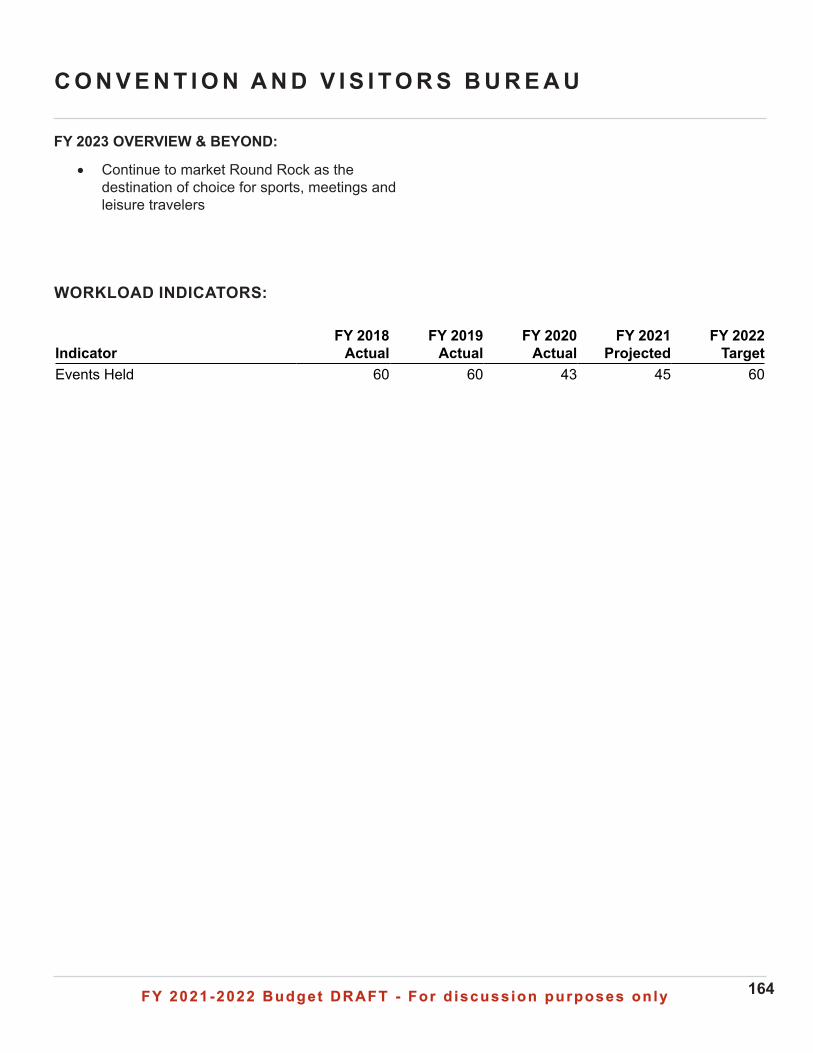
FY 2021-2022 Budget DRAFT - For d iscuss ion purposes on lyFY 2021-2022 Budget DRAFT - For d iscuss ion purposes on ly 164
C O N V E N T I O N A N D V I S I T O R S B U R E A U
WORKLOAD INDICATORS:
FY 2023 OVERVIEW & BEYOND:
• Continue to market Round Rock as the destination of choice for sports, meetings and leisure travelers
Indicator FY 2018
Actual FY 2019
Actual FY 2020
Actual FY 2021
Projected FY 2022
Target Events Held 60 60 43 45 60
FY 2021-2022 Budget DRAFT - For d iscuss ion purposes on lyFY 2021-2022 Budget DRAFT - For d iscuss ion purposes on ly 165
F O R E S T C R E E K G O L F C L U B( G O L F F U N D )
FY 2016/17
• New management company, Kemper Sports, began oversight of the Forest Creek Golf Club; with this change, a more detailed record of the expenditures are being tracked and monitored
• Under the new management several items were repaired or replaced to improve the appearance and functionality of the course – initial start-up costs were incurred
FY 2017/18
• Course closed for renovations from December 2017- September 2018• $740K transferred from GSFC to cover operating costs while the Golf Club was closed
FY 2018/19
• Golf Course anticipated re-opening in September 2018.• Projected revenues of $2.0M anticipated to fully cover expenses
FY 2019/20• $200,000 transfer from GSFC for future capital improvements and reserves• No budget reductions were needed as a result of COVID-19. The Golf Club remained open and
profitable throughout quarantine and saw a rise in patrons because the setting promoted social distancing while remaining active.
FY 2020/21• No new program requests or additional funding requested for FY 2020/21
PROPOSED FY 2021/22• No new programs or notable additions are proposed for FY 2021/22
FY 2018 Actuals
FY 2019 Actuals
FY 2020 Actuals
FY 2021 Revised Budget
FY 2021 Projected
Actuals
FY 2022 Proposed
BudgetPersonnel Services 939,697 843,433 908,260 1,252,875 1,252,875 1,364,247 Operating Expenses 404,610 1,086,153 1,436,003 1,303,493 1,303,493 1,340,382 Capital Outlay - 76,663 - 204,000 204,000 150,000
Total Expenditures: 1,344,307$ 2,006,249$ 2,344,263$ 2,760,368$ 2,760,368$ 2,854,629$ Expenditure % Change: -19.9% 49.2% 16.8% 17.7% 17.7% 3.4%
Expenditures per Capita: 11.98$ 17.28$ 19.90$ 22.91$ 22.91$ 23.12$
FTEs: 0.00 0.00 0.00 0.00 0.00 0.00
FY 2021-2022 Budget DRAFT - For d iscuss ion purposes on lyFY 2021-2022 Budget DRAFT - For d iscuss ion purposes on ly 166
F O R E S T C R E E K G O L F C L U B
Forest Creek Golf Club
PurchasingCourse & Grounds PurchasingFood & Beverage PurchasingGolf Shop
Forest Creek Golf Club provides hill country golf at its finest. Extensively renovated in 2018, the 7,147 yard par-72 golf course has been nationally recognized as one of the finest public golf courses in central Texas. Other amenities of the course include a full-service bar and grill, event space and an outstanding practice facility enhanced by LED lighting, allowing for practice into the evenings. Named “Best Public Golf Course in Central Texas” by Golf Digest, Forest Creek offers some of the most fabulous golf in the Texas hill country. Our Golf Course is replete with rolling fairways, pristine greens, and an abundance of native foliage. Our meticulous course maintenance and accommodating staff naturally complement the fantastic course design to create the total golf package.
MISSION: Differentiate Forest Creek Golf Club from competitors as the premier golf experience in the Round Rock area.
VISION:
Brand and establish Forest Creek Golf Club as a premier golf destination for public play, tournaments, and non-golf events in Round Rock and surrounding areas.
GUIDING COUNCIL STRATEGIC GOAL:
FY 2021 HIGHLIGHTS:
• The business of golf continues to boom at Forest Creek. The all time high demand for golf during and post-pandemic has led to record breaking number of rounds played and net income at the course.
• We have picked up a large number of new tournaments and events that we will likely keep for many years to come. Our competitors in the market have greatly reduced the number of tournaments that they are offering, which has led to some great organizations coming to Forest Creek for the first time. We are taking great care of them and many have already said they will continue to come back every year.
• Due to the major winter storm and damages that caused, we completed a full renovation of the clubhouse. The end result produced a greatly improved aesthetic at the clubhouse that now matches the quality of the course itself.
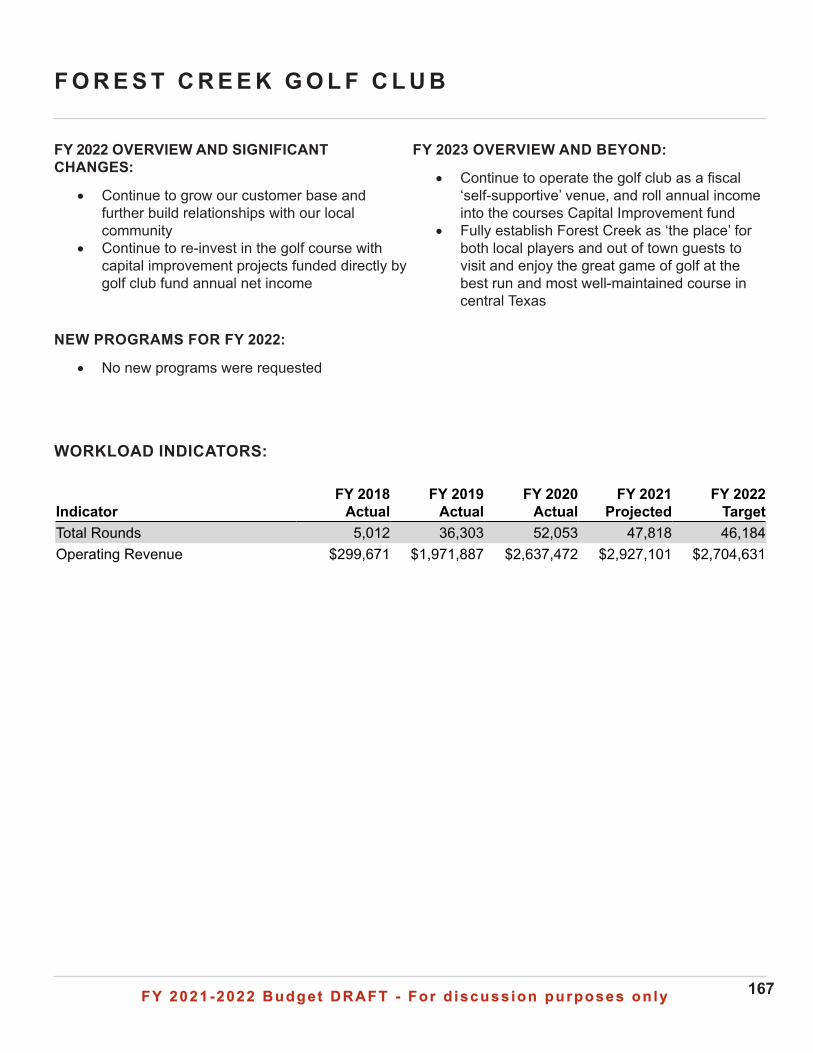
FY 2021-2022 Budget DRAFT - For d iscuss ion purposes on lyFY 2021-2022 Budget DRAFT - For d iscuss ion purposes on ly 167
F O R E S T C R E E K G O L F C L U B
WORKLOAD INDICATORS:
FY 2023 OVERVIEW AND BEYOND:
• Continue to operate the golf club as a fiscal ‘self-supportive’ venue, and roll annual income into the courses Capital Improvement fund
• Fully establish Forest Creek as ‘the place’ for both local players and out of town guests to visit and enjoy the great game of golf at the best run and most well-maintained course in central Texas
FY 2022 OVERVIEW AND SIGNIFICANT CHANGES:
• Continue to grow our customer base and further build relationships with our local community
• Continue to re-invest in the golf course with capital improvement projects funded directly by golf club fund annual net income
NEW PROGRAMS FOR FY 2022:
• No new programs were requested
IndicatorFY 2018
ActualFY 2019
ActualFY 2020
ActualFY 2021
ProjectedFY 2022
TargetTotal Rounds 5,012 36,303 52,053 47,818 46,184Operating Revenue $299,671 $1,971,887 $2,637,472 $2,927,101 $2,704,631
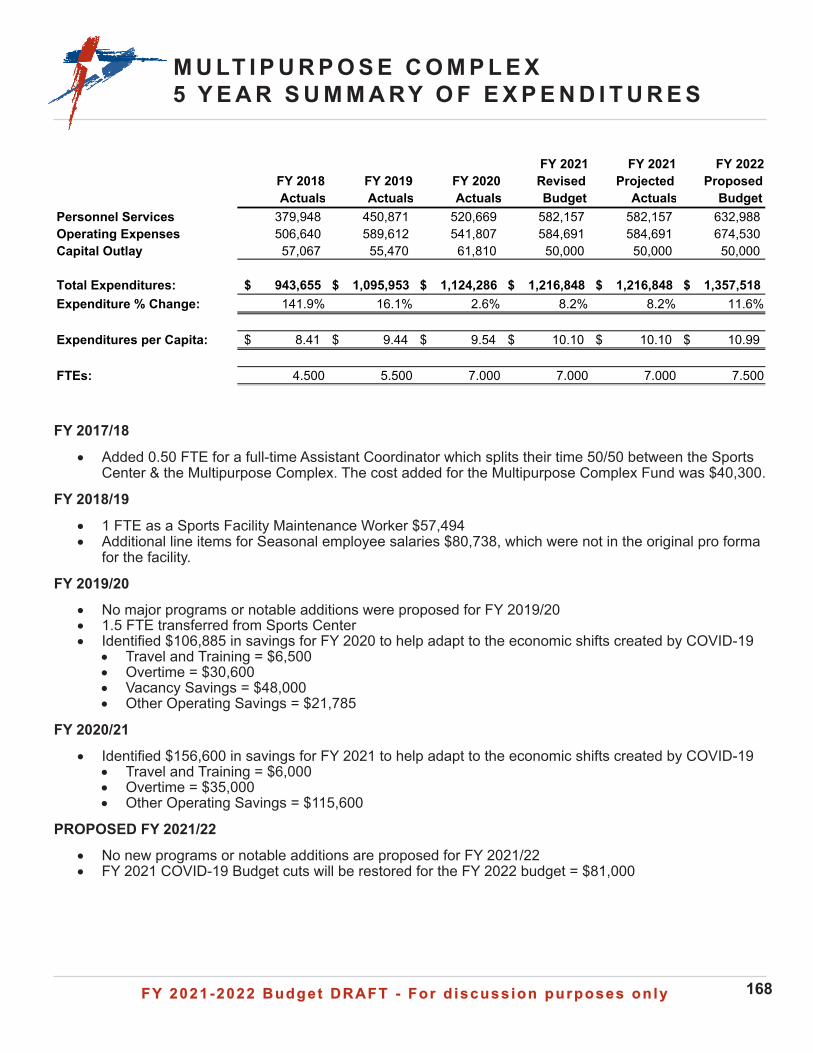
FY 2021-2022 Budget DRAFT - For d iscuss ion purposes on lyFY 2021-2022 Budget DRAFT - For d iscuss ion purposes on ly 168
M U LT I P U R P O S E C O M P L E X5 Y E A R S U M M A RY O F E X P E N D I T U R E S
FY 2017/18
• Added 0.50 FTE for a full-time Assistant Coordinator which splits their time 50/50 between the Sports Center & the Multipurpose Complex. The cost added for the Multipurpose Complex Fund was $40,300.
FY 2018/19
• 1 FTE as a Sports Facility Maintenance Worker $57,494• Additional line items for Seasonal employee salaries $80,738, which were not in the original pro forma
for the facility.
FY 2019/20• No major programs or notable additions were proposed for FY 2019/20• 1.5 FTE transferred from Sports Center• Identified $106,885 in savings for FY 2020 to help adapt to the economic shifts created by COVID-19
• Travel and Training = $6,500• Overtime = $30,600• Vacancy Savings = $48,000• Other Operating Savings = $21,785
FY 2020/21
• Identified $156,600 in savings for FY 2021 to help adapt to the economic shifts created by COVID-19• Travel and Training = $6,000• Overtime = $35,000• Other Operating Savings = $115,600
PROPOSED FY 2021/22• No new programs or notable additions are proposed for FY 2021/22• FY 2021 COVID-19 Budget cuts will be restored for the FY 2022 budget = $81,000
FY 2018 Actuals
FY 2019 Actuals
FY 2020 Actuals
FY 2021 Revised Budget
FY 2021 Projected
Actuals
FY 2022 Proposed
BudgetPersonnel Services 379,948 450,871 520,669 582,157 582,157 632,988 Operating Expenses 506,640 589,612 541,807 584,691 584,691 674,530 Capital Outlay 57,067 55,470 61,810 50,000 50,000 50,000
Total Expenditures: 943,655$ 1,095,953$ 1,124,286$ 1,216,848$ 1,216,848$ 1,357,518$ Expenditure % Change: 141.9% 16.1% 2.6% 8.2% 8.2% 11.6%
Expenditures per Capita: 8.41$ 9.44$ 9.54$ 10.10$ 10.10$ 10.99$
FTEs: 4.500 5.500 7.000 7.000 7.000 7.500
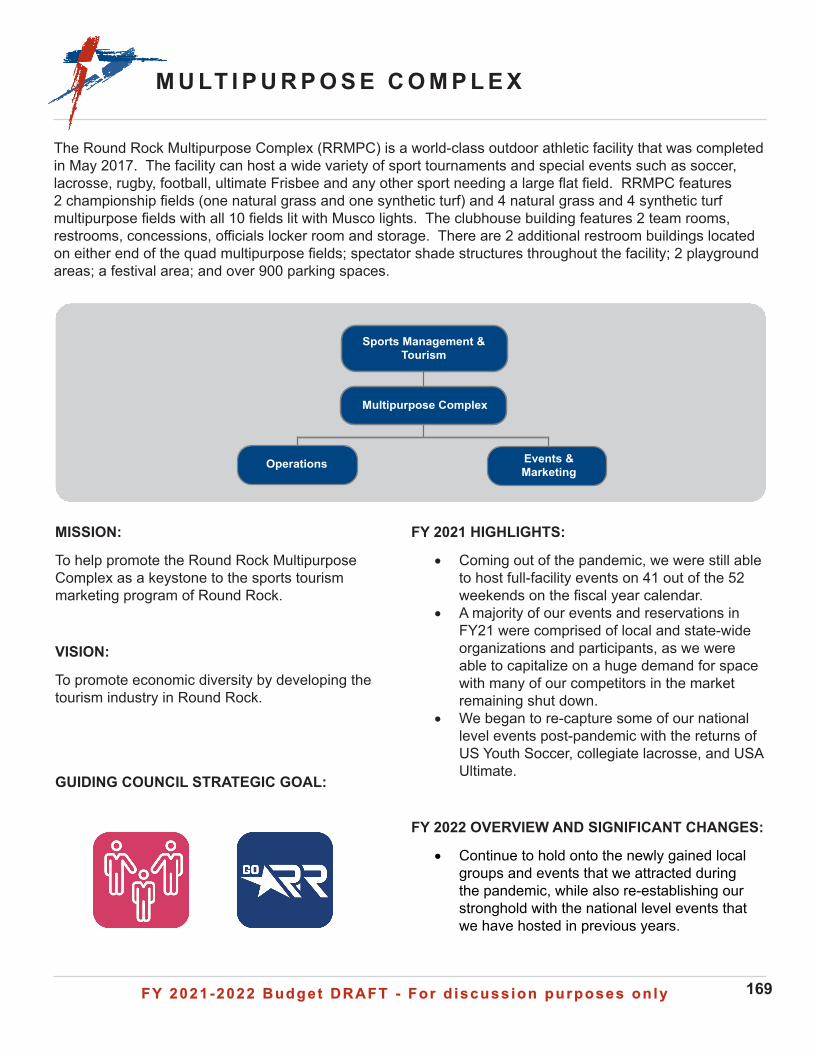
FY 2021-2022 Budget DRAFT - For d iscuss ion purposes on lyFY 2021-2022 Budget DRAFT - For d iscuss ion purposes on ly 169
M U LT I P U R P O S E C O M P L E X
The Round Rock Multipurpose Complex (RRMPC) is a world-class outdoor athletic facility that was completed in May 2017. The facility can host a wide variety of sport tournaments and special events such as soccer, lacrosse, rugby, football, ultimate Frisbee and any other sport needing a large flat field. RRMPC features 2 championship fields (one natural grass and one synthetic turf) and 4 natural grass and 4 synthetic turf multipurpose fields with all 10 fields lit with Musco lights. The clubhouse building features 2 team rooms, restrooms, concessions, officials locker room and storage. There are 2 additional restroom buildings located on either end of the quad multipurpose fields; spectator shade structures throughout the facility; 2 playground areas; a festival area; and over 900 parking spaces.
MISSION:
To help promote the Round Rock Multipurpose Complex as a keystone to the sports tourism marketing program of Round Rock.
VISION:
To promote economic diversity by developing the tourism industry in Round Rock.
GUIDING COUNCIL STRATEGIC GOAL:
FY 2021 HIGHLIGHTS:
• Coming out of the pandemic, we were still able to host full-facility events on 41 out of the 52 weekends on the fiscal year calendar.
• A majority of our events and reservations in FY21 were comprised of local and state-wide organizations and participants, as we were able to capitalize on a huge demand for space with many of our competitors in the market remaining shut down.
• We began to re-capture some of our national level events post-pandemic with the returns of US Youth Soccer, collegiate lacrosse, and USA Ultimate.
FY 2022 OVERVIEW AND SIGNIFICANT CHANGES:
• Continue to hold onto the newly gained local groups and events that we attracted during the pandemic, while also re-establishing our stronghold with the national level events that we have hosted in previous years.
Events & Marketing
Multipurpose Complex
Operations
Sports Management & Tourism
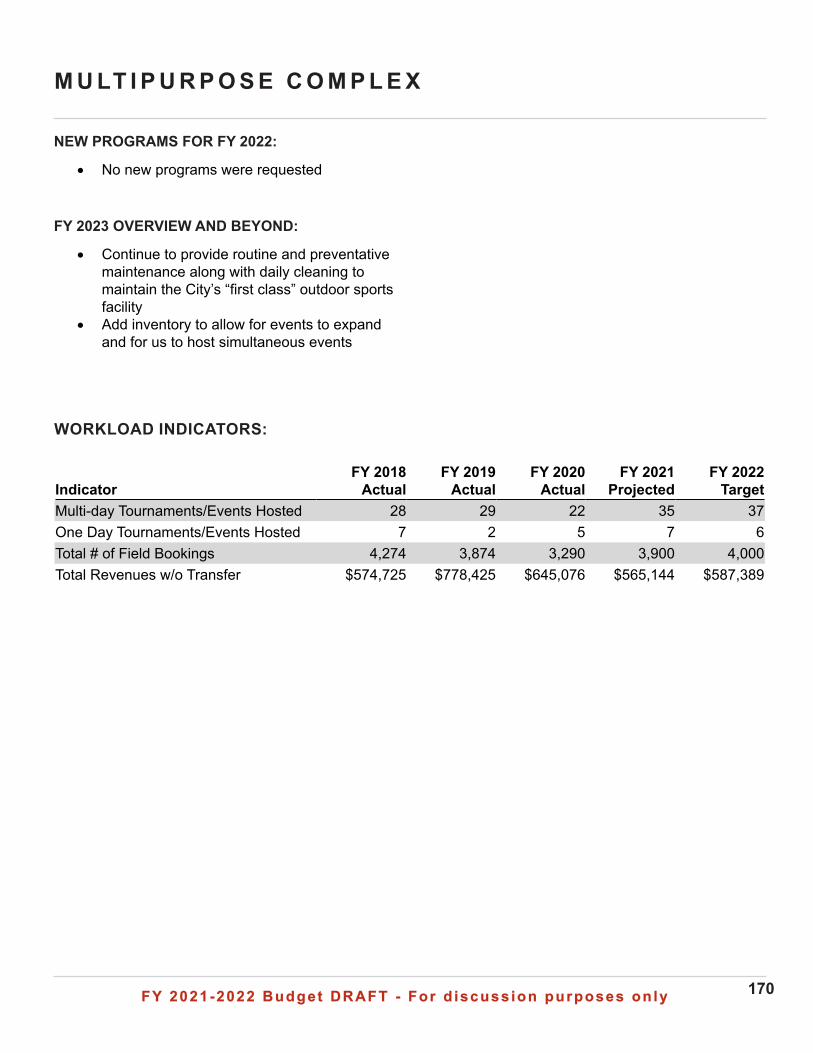
FY 2021-2022 Budget DRAFT - For d iscuss ion purposes on lyFY 2021-2022 Budget DRAFT - For d iscuss ion purposes on ly 170
M U LT I P U R P O S E C O M P L E X
WORKLOAD INDICATORS:
NEW PROGRAMS FOR FY 2022:
• No new programs were requested
FY 2023 OVERVIEW AND BEYOND:
• Continue to provide routine and preventative maintenance along with daily cleaning to maintain the City’s “first class” outdoor sports facility
• Add inventory to allow for events to expand and for us to host simultaneous events
IndicatorFY 2018
ActualFY 2019
ActualFY 2020
ActualFY 2021
ProjectedFY 2022
TargetMulti-day Tournaments/Events Hosted 28 29 22 35 37One Day Tournaments/Events Hosted 7 2 5 7 6Total # of Field Bookings 4,274 3,874 3,290 3,900 4,000Total Revenues w/o Transfer $574,725 $778,425 $645,076 $565,144 $587,389
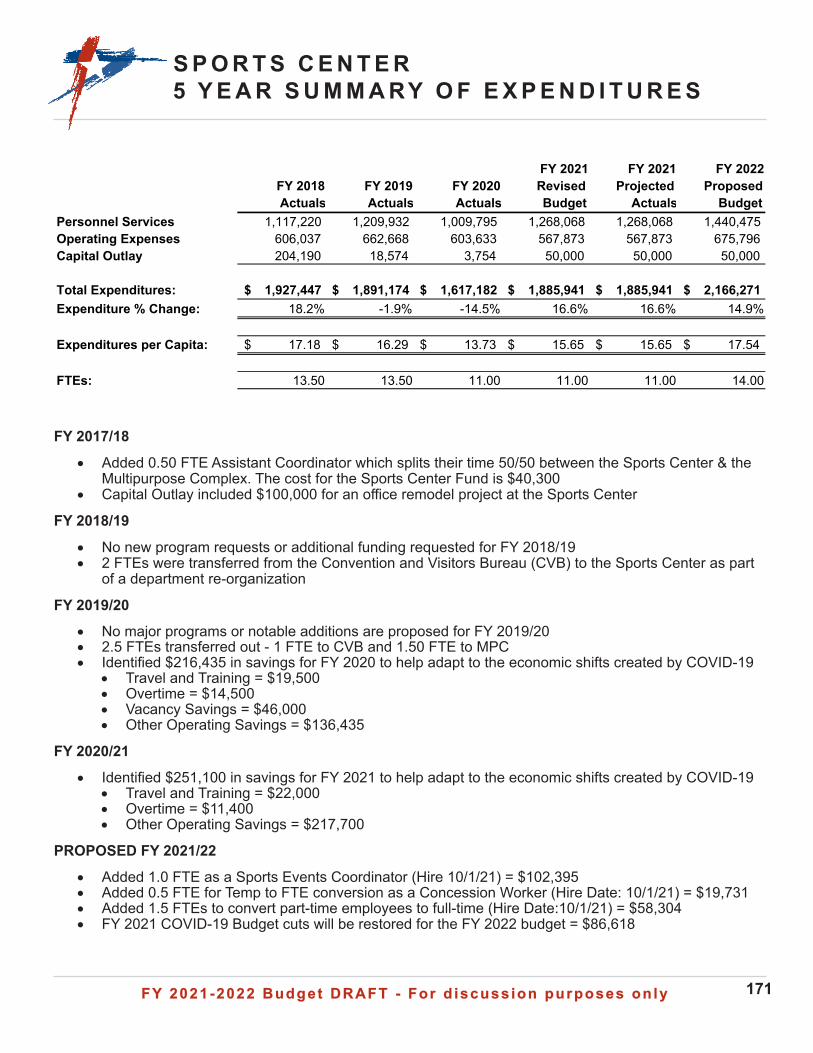
FY 2021-2022 Budget DRAFT - For d iscuss ion purposes on lyFY 2021-2022 Budget DRAFT - For d iscuss ion purposes on ly 171
S P O R T S C E N T E R5 Y E A R S U M M A RY O F E X P E N D I T U R E S
FY 2017/18
• Added 0.50 FTE Assistant Coordinator which splits their time 50/50 between the Sports Center & the Multipurpose Complex. The cost for the Sports Center Fund is $40,300
• Capital Outlay included $100,000 for an office remodel project at the Sports Center
FY 2018/19
• No new program requests or additional funding requested for FY 2018/19• 2 FTEs were transferred from the Convention and Visitors Bureau (CVB) to the Sports Center as part
of a department re-organization
FY 2019/20• No major programs or notable additions are proposed for FY 2019/20• 2.5 FTEs transferred out - 1 FTE to CVB and 1.50 FTE to MPC• Identified $216,435 in savings for FY 2020 to help adapt to the economic shifts created by COVID-19
• Travel and Training = $19,500• Overtime = $14,500• Vacancy Savings = $46,000• Other Operating Savings = $136,435
FY 2020/21
• Identified $251,100 in savings for FY 2021 to help adapt to the economic shifts created by COVID-19• Travel and Training = $22,000• Overtime = $11,400• Other Operating Savings = $217,700
PROPOSED FY 2021/22
• Added 1.0 FTE as a Sports Events Coordinator (Hire 10/1/21) = $102,395• Added 0.5 FTE for Temp to FTE conversion as a Concession Worker (Hire Date: 10/1/21) = $19,731• Added 1.5 FTEs to convert part-time employees to full-time (Hire Date:10/1/21) = $58,304• FY 2021 COVID-19 Budget cuts will be restored for the FY 2022 budget = $86,618
FY 2018 Actuals
FY 2019 Actuals
FY 2020 Actuals
FY 2021 Revised Budget
FY 2021 Projected
Actuals
FY 2022 Proposed
BudgetPersonnel Services 1,117,220 1,209,932 1,009,795 1,268,068 1,268,068 1,440,475 Operating Expenses 606,037 662,668 603,633 567,873 567,873 675,796 Capital Outlay 204,190 18,574 3,754 50,000 50,000 50,000
Total Expenditures: 1,927,447$ 1,891,174$ 1,617,182$ 1,885,941$ 1,885,941$ 2,166,271$ Expenditure % Change: 18.2% -1.9% -14.5% 16.6% 16.6% 14.9%
Expenditures per Capita: 17.18$ 16.29$ 13.73$ 15.65$ 15.65$ 17.54$
FTEs: 13.50 13.50 11.00 11.00 11.00 14.00
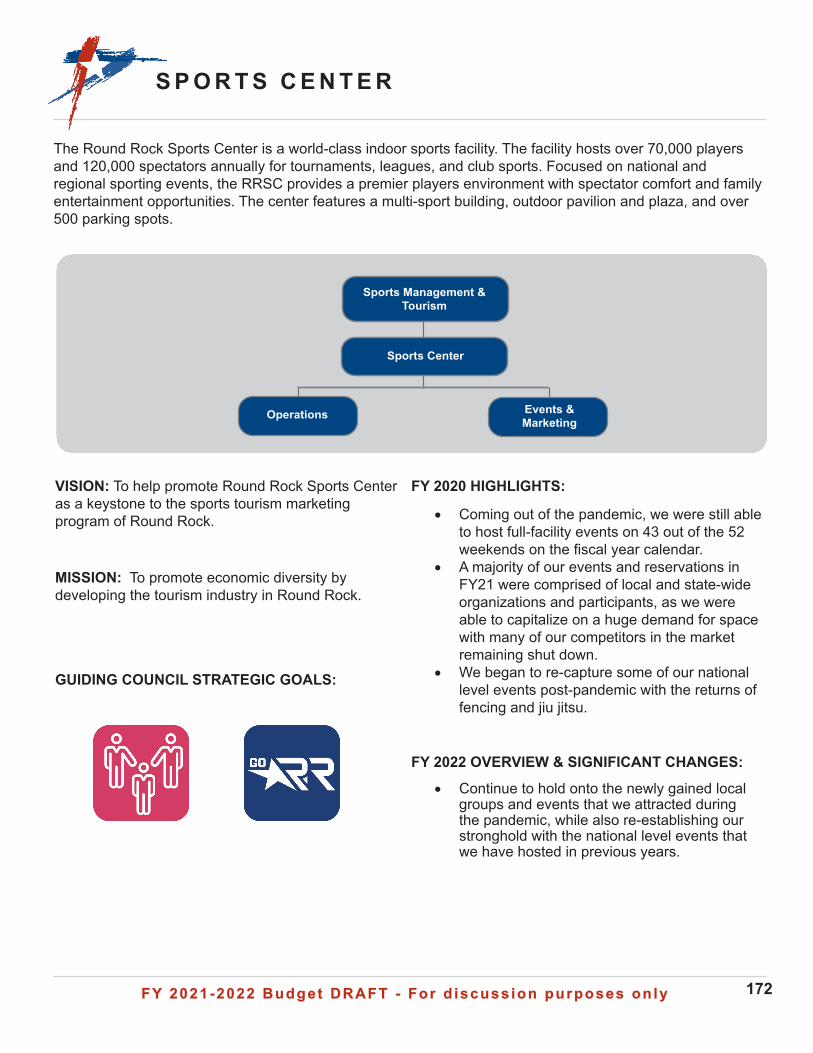
FY 2021-2022 Budget DRAFT - For d iscuss ion purposes on lyFY 2021-2022 Budget DRAFT - For d iscuss ion purposes on ly 172
S P O R T S C E N T E R
The Round Rock Sports Center is a world-class indoor sports facility. The facility hosts over 70,000 players and 120,000 spectators annually for tournaments, leagues, and club sports. Focused on national and regional sporting events, the RRSC provides a premier players environment with spectator comfort and family entertainment opportunities. The center features a multi-sport building, outdoor pavilion and plaza, and over 500 parking spots.
VISION: To help promote Round Rock Sports Center as a keystone to the sports tourism marketing program of Round Rock.
MISSION: To promote economic diversity by developing the tourism industry in Round Rock.
GUIDING COUNCIL STRATEGIC GOALS:
FY 2020 HIGHLIGHTS:
• Coming out of the pandemic, we were still able to host full-facility events on 43 out of the 52 weekends on the fiscal year calendar.
• A majority of our events and reservations in FY21 were comprised of local and state-wide organizations and participants, as we were able to capitalize on a huge demand for space with many of our competitors in the market remaining shut down.
• We began to re-capture some of our national level events post-pandemic with the returns of fencing and jiu jitsu.
FY 2022 OVERVIEW & SIGNIFICANT CHANGES:
• Continue to hold onto the newly gained local groups and events that we attracted during the pandemic, while also re-establishing our stronghold with the national level events that we have hosted in previous years.
Events & Marketing
Sports Center
Operations
Sports Management & Tourism
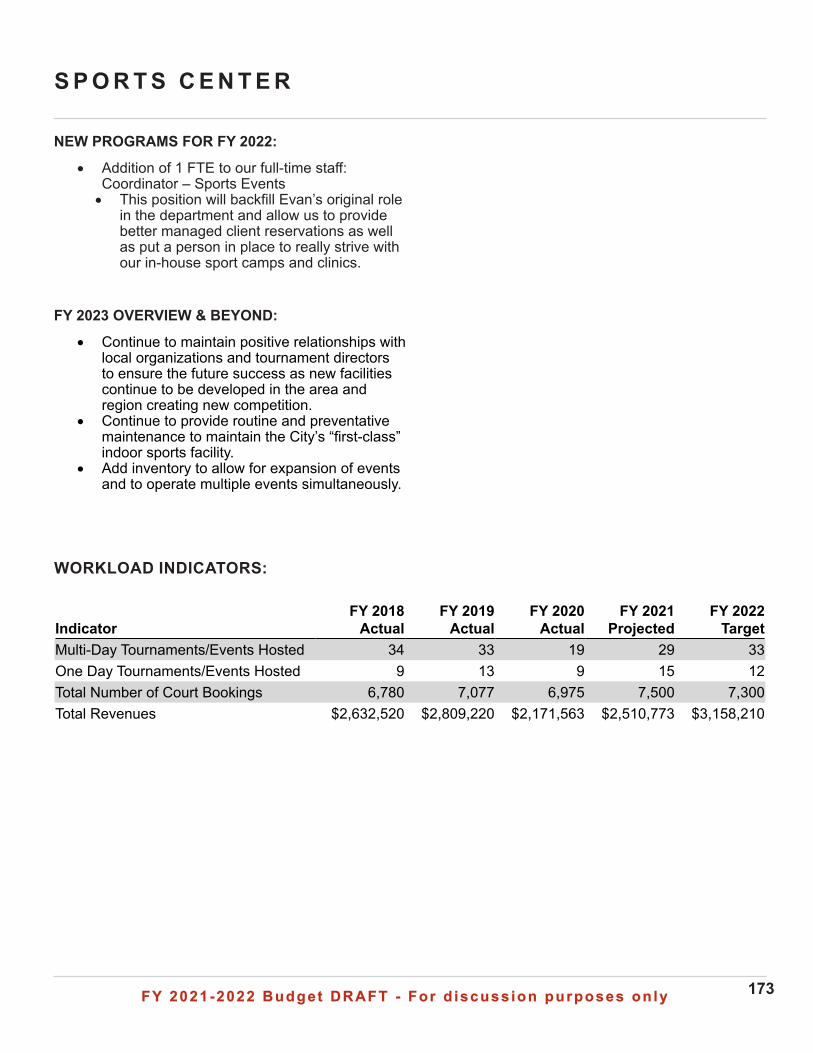
FY 2021-2022 Budget DRAFT - For d iscuss ion purposes on lyFY 2021-2022 Budget DRAFT - For d iscuss ion purposes on ly 173
S P O R T S C E N T E R
WORKLOAD INDICATORS:
NEW PROGRAMS FOR FY 2022:
• Addition of 1 FTE to our full-time staff: Coordinator – Sports Events• This position will backfill Evan’s original role
in the department and allow us to provide better managed client reservations as well as put a person in place to really strive with our in-house sport camps and clinics.
FY 2023 OVERVIEW & BEYOND:
• Continue to maintain positive relationships with local organizations and tournament directors to ensure the future success as new facilities continue to be developed in the area and region creating new competition.
• Continue to provide routine and preventative maintenance to maintain the City’s “first-class” indoor sports facility.
• Add inventory to allow for expansion of events and to operate multiple events simultaneously.
Indicator FY 2018
Actual FY 2019
Actual FY 2020
Actual FY 2021
Projected FY 2022
Target Multi-Day Tournaments/Events Hosted 34 33 19 29 33One Day Tournaments/Events Hosted 9 13 9 15 12Total Number of Court Bookings 6,780 7,077 6,975 7,500 7,300Total Revenues $2,632,520 $2,809,220 $2,171,563 $2,510,773 $3,158,210
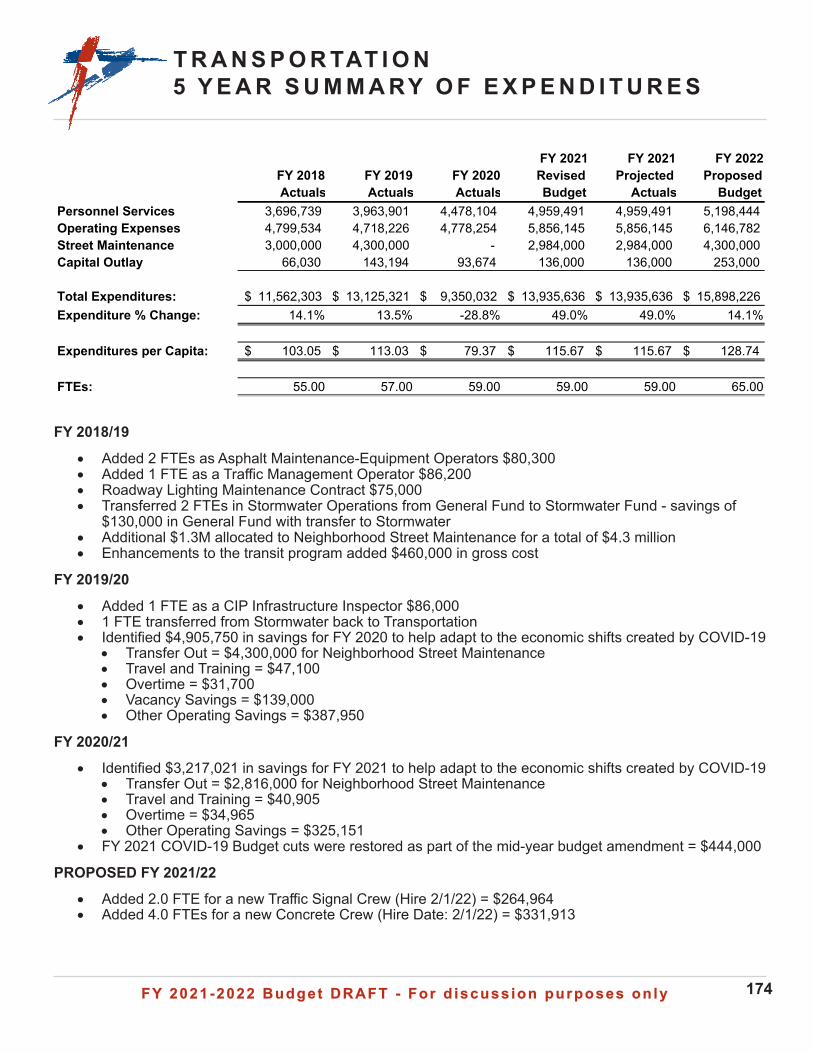
FY 2021-2022 Budget DRAFT - For d iscuss ion purposes on lyFY 2021-2022 Budget DRAFT - For d iscuss ion purposes on ly 174
T R A N S P O R TAT I O N5 Y E A R S U M M A RY O F E X P E N D I T U R E S
FY 2018/19
• Added 2 FTEs as Asphalt Maintenance-Equipment Operators $80,300 • Added 1 FTE as a Traffic Management Operator $86,200 • Roadway Lighting Maintenance Contract $75,000• Transferred 2 FTEs in Stormwater Operations from General Fund to Stormwater Fund - savings of
$130,000 in General Fund with transfer to Stormwater • Additional $1.3M allocated to Neighborhood Street Maintenance for a total of $4.3 million• Enhancements to the transit program added $460,000 in gross cost
FY 2019/20
• Added 1 FTE as a CIP Infrastructure Inspector $86,000• 1 FTE transferred from Stormwater back to Transportation• Identified $4,905,750 in savings for FY 2020 to help adapt to the economic shifts created by COVID-19
• Transfer Out = $4,300,000 for Neighborhood Street Maintenance• Travel and Training = $47,100• Overtime = $31,700• Vacancy Savings = $139,000• Other Operating Savings = $387,950
FY 2020/21
• Identified $3,217,021 in savings for FY 2021 to help adapt to the economic shifts created by COVID-19• Transfer Out = $2,816,000 for Neighborhood Street Maintenance• Travel and Training = $40,905• Overtime = $34,965• Other Operating Savings = $325,151
• FY 2021 COVID-19 Budget cuts were restored as part of the mid-year budget amendment = $444,000
PROPOSED FY 2021/22
• Added 2.0 FTE for a new Traffic Signal Crew (Hire 2/1/22) = $264,964• Added 4.0 FTEs for a new Concrete Crew (Hire Date: 2/1/22) = $331,913
FY 2018 Actuals
FY 2019 Actuals
FY 2020 Actuals
FY 2021 Revised Budget
FY 2021 Projected
Actuals
FY 2022 Proposed
BudgetPersonnel Services 3,696,739 3,963,901 4,478,104 4,959,491 4,959,491 5,198,444 Operating Expenses 4,799,534 4,718,226 4,778,254 5,856,145 5,856,145 6,146,782 Street Maintenance 3,000,000 4,300,000 - 2,984,000 2,984,000 4,300,000 Capital Outlay 66,030 143,194 93,674 136,000 136,000 253,000
Total Expenditures: 11,562,303$ 13,125,321$ 9,350,032$ 13,935,636$ 13,935,636$ 15,898,226$ Expenditure % Change: 14.1% 13.5% -28.8% 49.0% 49.0% 14.1%
Expenditures per Capita: 103.05$ 113.03$ 79.37$ 115.67$ 115.67$ 128.74$
FTEs: 55.00 57.00 59.00 59.00 59.00 65.00
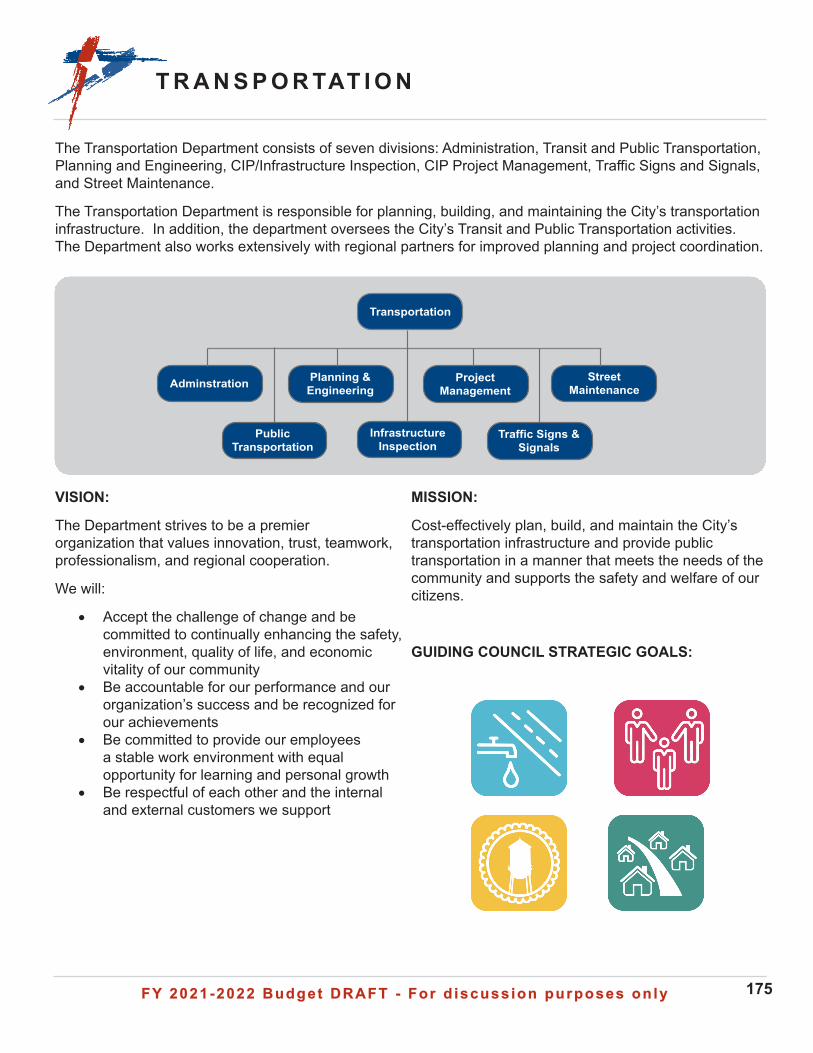
FY 2021-2022 Budget DRAFT - For d iscuss ion purposes on lyFY 2021-2022 Budget DRAFT - For d iscuss ion purposes on ly 175
T R A N S P O R TAT I O N
Planning & EngineeringAdminstration
Public Transportation
Traffic Signs & Signals
Project Management
Street Maintenance
Transportation
Infrastructure Inspection
The Transportation Department consists of seven divisions: Administration, Transit and Public Transportation, Planning and Engineering, CIP/Infrastructure Inspection, CIP Project Management, Traffic Signs and Signals, and Street Maintenance.
The Transportation Department is responsible for planning, building, and maintaining the City’s transportation infrastructure. In addition, the department oversees the City’s Transit and Public Transportation activities. The Department also works extensively with regional partners for improved planning and project coordination.
VISION:
The Department strives to be a premier organization that values innovation, trust, teamwork, professionalism, and regional cooperation.
We will:
• Accept the challenge of change and be committed to continually enhancing the safety, environment, quality of life, and economic vitality of our community
• Be accountable for our performance and our organization’s success and be recognized for our achievements
• Be committed to provide our employees a stable work environment with equal opportunity for learning and personal growth
• Be respectful of each other and the internal and external customers we support
MISSION:
Cost-effectively plan, build, and maintain the City’s transportation infrastructure and provide public transportation in a manner that meets the needs of the community and supports the safety and welfare of our citizens.
GUIDING COUNCIL STRATEGIC GOALS:
FY 2021-2022 Budget DRAFT - For d iscuss ion purposes on lyFY 2021-2022 Budget DRAFT - For d iscuss ion purposes on ly 176
T R A N S P O R TAT I O N
UPCOMING 2021-2022 CONSTRUCTION PROJECTS:
• Kenney Fort – Seg 2 & 3• Kenney Fort – Seg 4C• Gattis School – Seg 6• AW Grimes NB Right Turn Lanes at Chandler
Blvd and Old Settlers Blvd• Kenney Fort – Seg 2 & 3• S Mays St Corridor Improvements
FY 2022 OVERVIEW & SIGNIFICANT CHANGES:
• Continued emphasis on Five-Year Plan• Update to Transit Master Plan• Update Transportation Master Plan
NEW PROGRAMS FOR FY 2022:
• Additional Signal Crew to keep up with Growth• Additional Concrete Crew to keep up with
Growth
FY 2023 OVERVIEW AND BEYOND:
PROJECTS UNDER DEVELOPMENT:
• Gattis School – Seg 3• CR 112 – East• CR 112 – West• McNeil extension – Drainage under UPRR• US 79 @ Brushy Creek Plant Rd Signal• Red Bud – North• Red Bud – South• Wyoming Springs – Seg 1• SH 45 Frontage Roads and Ramps –
Heatherwilde to Donnell• Chisholm Trail North Widening• Old Settlers Blvd – Red Bud to CR 110• 2021 SMP A• 2021 SMP B
FY 2021 HIGHLIGHTS:
• DACS – Transportation Section Rewrite• Roadway Impact Fees Implementation• Five-year plan – Multiple projects under
design/construction
RECENTLY COMPLETED PROJECTS:
• McNeil Extension – Phase II• US 79 at Harrell Parkway - Kalahari• US 79 at Brushy Creek Plant Rd• Kenney Fort Blvd – Right Turn Lanes at
Kalahari• Kenney Fort Blvd – Overlay US 79 to Brushy
Creek• 2019 SMP A• 2019 SMP B• 2019 Arterial SMP• 2020 SMP A• Main Street Parklets• 2017 CDBG/ Chisholm Valley Sub• Luther Peterson at Sunrise Signal• N Mays – Paloma to Oakmont – Partner w/
Wilco• La Frontera @ Hesters Crossing Signal• Red Bud – NB Lane Imps US 79 to Pioneer
Crossing
CURRENT CONSTRUCTION PROJECTS:
• University Blvd Widening – IH 35 to E of Sunrise
• Chandler Creek/ Oakmont Connection• Kenney Fort – Seg 4B• Logan Street Gap Connection• RM 620 Safety Improvements (TxDOT
Partnership)• Northeast Downtown Improvements (Library
Area)• University Blvd East – AW Grimes to SH 130• College Park Dr – North• College Park Dr – South• Arterial H – Phase II
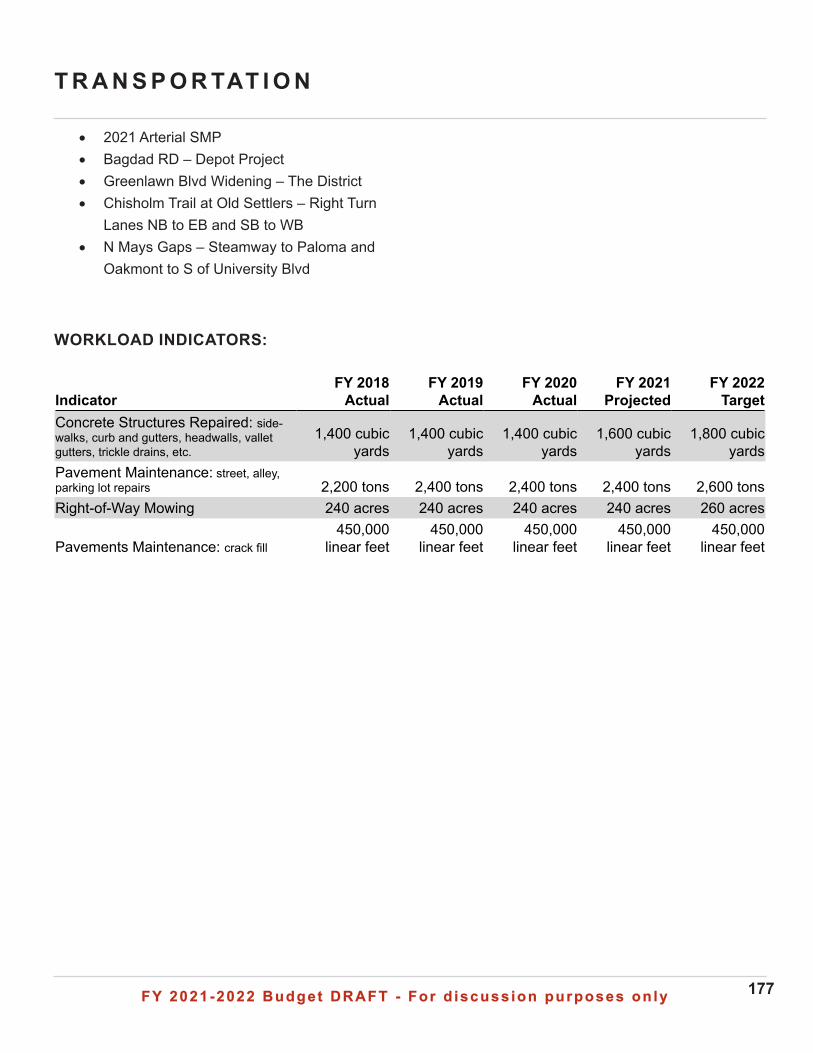
FY 2021-2022 Budget DRAFT - For d iscuss ion purposes on lyFY 2021-2022 Budget DRAFT - For d iscuss ion purposes on ly 177
T R A N S P O R TAT I O N
WORKLOAD INDICATORS:
Indicator FY 2018
Actual FY 2019
Actual FY 2020
Actual FY 2021
Projected FY 2022
Target Concrete Structures Repaired: side-walks, curb and gutters, headwalls, vallet gutters, trickle drains, etc.
1,400 cubic yards
1,400 cubic yards
1,400 cubic yards
1,600 cubic yards
1,800 cubic yards
Pavement Maintenance: street, alley, parking lot repairs 2,200 tons 2,400 tons 2,400 tons 2,400 tons 2,600 tons Right-of-Way Mowing 240 acres 240 acres 240 acres 240 acres 260 acres
Pavements Maintenance: crack fill 450,000
linear feet 450,000
linear feet 450,000
linear feet 450,000
linear feet 450,000
linear feet
• 2021 Arterial SMP• Bagdad RD – Depot Project• Greenlawn Blvd Widening – The District• Chisholm Trail at Old Settlers – Right Turn
Lanes NB to EB and SB to WB• N Mays Gaps – Steamway to Paloma and
Oakmont to S of University Blvd
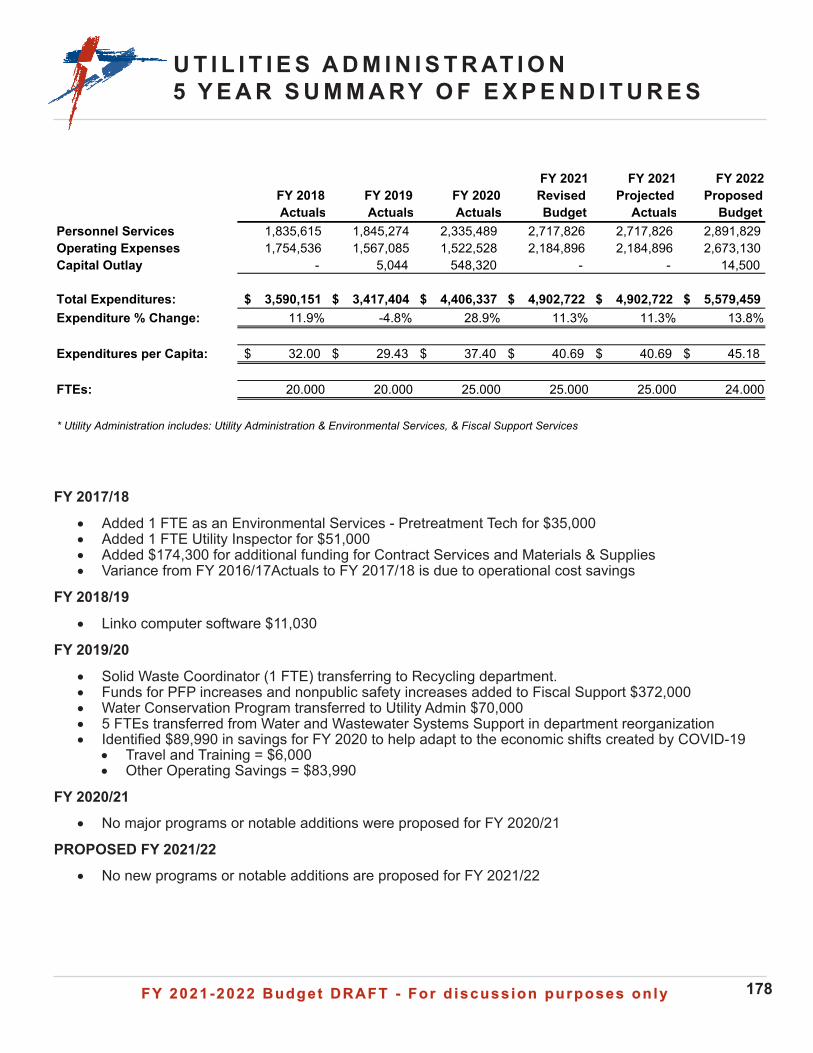
FY 2021-2022 Budget DRAFT - For d iscuss ion purposes on lyFY 2021-2022 Budget DRAFT - For d iscuss ion purposes on ly 178
U T I L I T I E S A D M I N I S T R AT I O N5 Y E A R S U M M A RY O F E X P E N D I T U R E S
FY 2017/18
• Added 1 FTE as an Environmental Services - Pretreatment Tech for $35,000• Added 1 FTE Utility Inspector for $51,000• Added $174,300 for additional funding for Contract Services and Materials & Supplies• Variance from FY 2016/17Actuals to FY 2017/18 is due to operational cost savings
FY 2018/19
• Linko computer software $11,030
FY 2019/20
• Solid Waste Coordinator (1 FTE) transferring to Recycling department.• Funds for PFP increases and nonpublic safety increases added to Fiscal Support $372,000• Water Conservation Program transferred to Utility Admin $70,000• 5 FTEs transferred from Water and Wastewater Systems Support in department reorganization• Identified $89,990 in savings for FY 2020 to help adapt to the economic shifts created by COVID-19
• Travel and Training = $6,000• Other Operating Savings = $83,990
FY 2020/21• No major programs or notable additions were proposed for FY 2020/21
PROPOSED FY 2021/22• No new programs or notable additions are proposed for FY 2021/22
FY 2018 Actuals
FY 2019 Actuals
FY 2020 Actuals
FY 2021 Revised Budget
FY 2021 Projected
Actuals
FY 2022 Proposed
BudgetPersonnel Services 1,835,615 1,845,274 2,335,489 2,717,826 2,717,826 2,891,829 Operating Expenses 1,754,536 1,567,085 1,522,528 2,184,896 2,184,896 2,673,130 Capital Outlay - 5,044 548,320 - - 14,500
Total Expenditures: 3,590,151$ 3,417,404$ 4,406,337$ 4,902,722$ 4,902,722$ 5,579,459$ Expenditure % Change: 11.9% -4.8% 28.9% 11.3% 11.3% 13.8%
Expenditures per Capita: 32.00$ 29.43$ 37.40$ 40.69$ 40.69$ 45.18$
FTEs: 20.000 20.000 25.000 25.000 25.000 24.000
* Utility Administration includes: Utility Administration & Environmental Services, & Fiscal Support Services
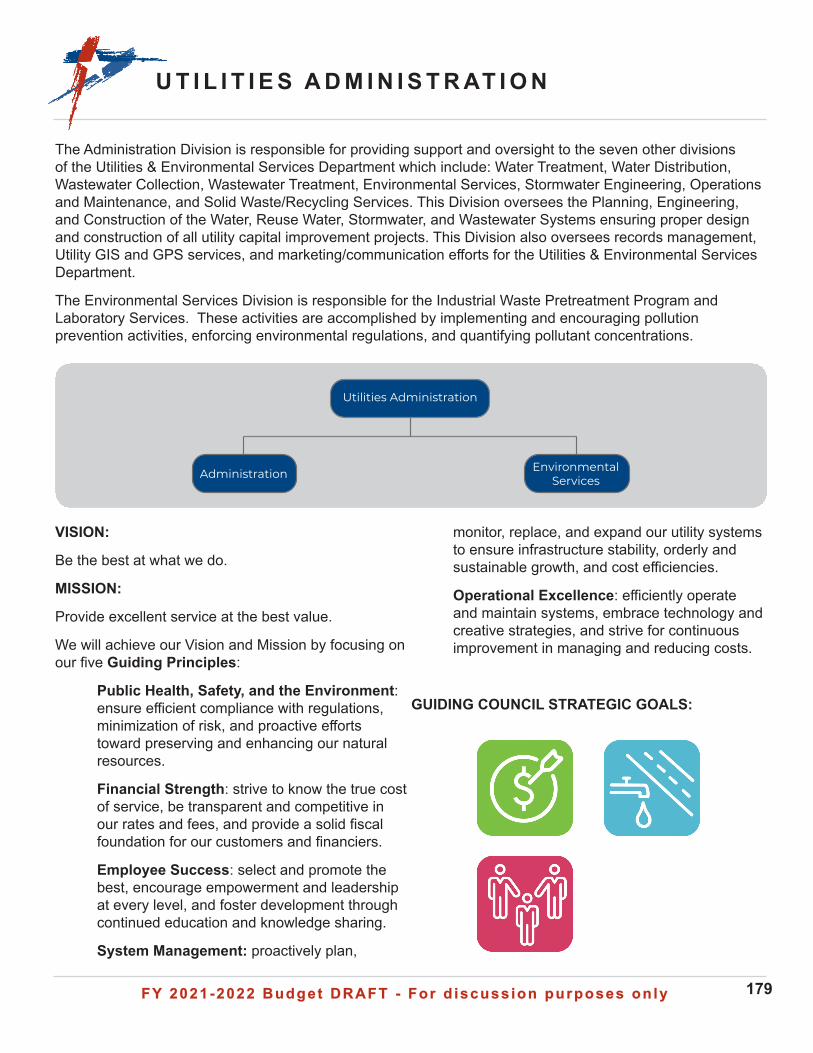
FY 2021-2022 Budget DRAFT - For d iscuss ion purposes on lyFY 2021-2022 Budget DRAFT - For d iscuss ion purposes on ly 179
U T I L I T I E S A D M I N I S T R AT I O N
Administration Environmental Services
Utilities Administration
The Administration Division is responsible for providing support and oversight to the seven other divisions of the Utilities & Environmental Services Department which include: Water Treatment, Water Distribution, Wastewater Collection, Wastewater Treatment, Environmental Services, Stormwater Engineering, Operations and Maintenance, and Solid Waste/Recycling Services. This Division oversees the Planning, Engineering, and Construction of the Water, Reuse Water, Stormwater, and Wastewater Systems ensuring proper design and construction of all utility capital improvement projects. This Division also oversees records management, Utility GIS and GPS services, and marketing/communication efforts for the Utilities & Environmental Services Department.
The Environmental Services Division is responsible for the Industrial Waste Pretreatment Program and Laboratory Services. These activities are accomplished by implementing and encouraging pollution prevention activities, enforcing environmental regulations, and quantifying pollutant concentrations.
VISION:
Be the best at what we do.
MISSION:
Provide excellent service at the best value.
We will achieve our Vision and Mission by focusing on our five Guiding Principles:
Public Health, Safety, and the Environment: ensure efficient compliance with regulations, minimization of risk, and proactive efforts toward preserving and enhancing our natural resources.
Financial Strength: strive to know the true cost of service, be transparent and competitive in our rates and fees, and provide a solid fiscal foundation for our customers and financiers.
Employee Success: select and promote the best, encourage empowerment and leadership at every level, and foster development through continued education and knowledge sharing.
System Management: proactively plan,
monitor, replace, and expand our utility systems to ensure infrastructure stability, orderly and sustainable growth, and cost efficiencies.
Operational Excellence: efficiently operate and maintain systems, embrace technology and creative strategies, and strive for continuous improvement in managing and reducing costs.
GUIDING COUNCIL STRATEGIC GOALS:
FY 2021-2022 Budget DRAFT - For d iscuss ion purposes on lyFY 2021-2022 Budget DRAFT - For d iscuss ion purposes on ly 180
U T I L I T I E S A D M I N I S T R AT I O N
• Continue to expand the City’s reuse water system to properties on the east side of Round Rock.
• Continue to work toward replacing asbestos-cement waterlines located in the City.
• Continue to build a redundant water distribution system and backup generator power to minimize customer outages.
• Working with the Brazos River Authority, we will continue evaluation of groundwater sources from the Carrizo-Wilcox Aquifer to the east that could provide future water to Round Rock and Williamson County.
Environmental Services:
• Continue to maintain NELAP certifications for both water and wastewater laboratories.
• Improve web-based compliance tools for the Pretreatment Program.
• Evaluate strategies for applying the wastewater surcharge to all nondomestic wastewater discharges.
NEW PROGRAMS FOR FY 2022:
• No new programs were requested
FY 2023 OVERVIEW AND BEYOND:
Administration:
• Continue construction of Phase 2 Deep Water Intake for the BCRUA from approximately 2022-2027.
• Complete construction of the 10 MGD Brushy Creek East Regional Wastewater Treatment Plant Expansion in 2023.
• Develop an alternative disposal method for wastewater treatment plant sludge from the Brushy Creek East Regional Wastewater Treatment Plant.
• Assuming final selection of groundwater supply from the Carrizo-Wilcox Aquifer, execute plan and necessary contracts for securing the groundwater for future need.
FY 2021 HIGHLIGHTS:
Administration:
• Continued construction of 10 MGD Brushy Creek East Regional Wastewater Treatment Plant Expansion.
• Completed several water and wastewater Capital Improvement Projects to meet growing demands of our City.
• Increased focus on the Department’s Employee Success Guiding Principle to foster and sustain a positive and effective work culture by furthering employee appreciation initiatives and team collaboration opportunities.
• Continued to implement an Employee Recognition Program to recognize employees throughout the year, encourage peer to peer recognition, and acknowledge and promote positivity in the workplace.
• Completed installation of waterline to the east along University Boulevard in order to serve the Jonah Special Utility District with potable water east of County Road 110.
Environmental Services:
• Implemented a Laboratory Management System in order to better manage sample log-in, analysis results and reporting, and billing for the laboratory.
• Due to COVID-19 the laboratory lobby was closed to customers. A table was placed outside the laboratory for customer sample drop off.
FY 2022 OVERVIEW & SIGNIFICANT CHANGES:
Administration:
• Complete design, easement acquisition, and award of construction contract for Phase 2 Deep Water Intake for the Brushy Creek Regional Utility Authority (BCRUA).
• Complete permanent Zebra Mussel Controls at intake structure at Lake Georgetown and Stillhouse Hollow Lake.
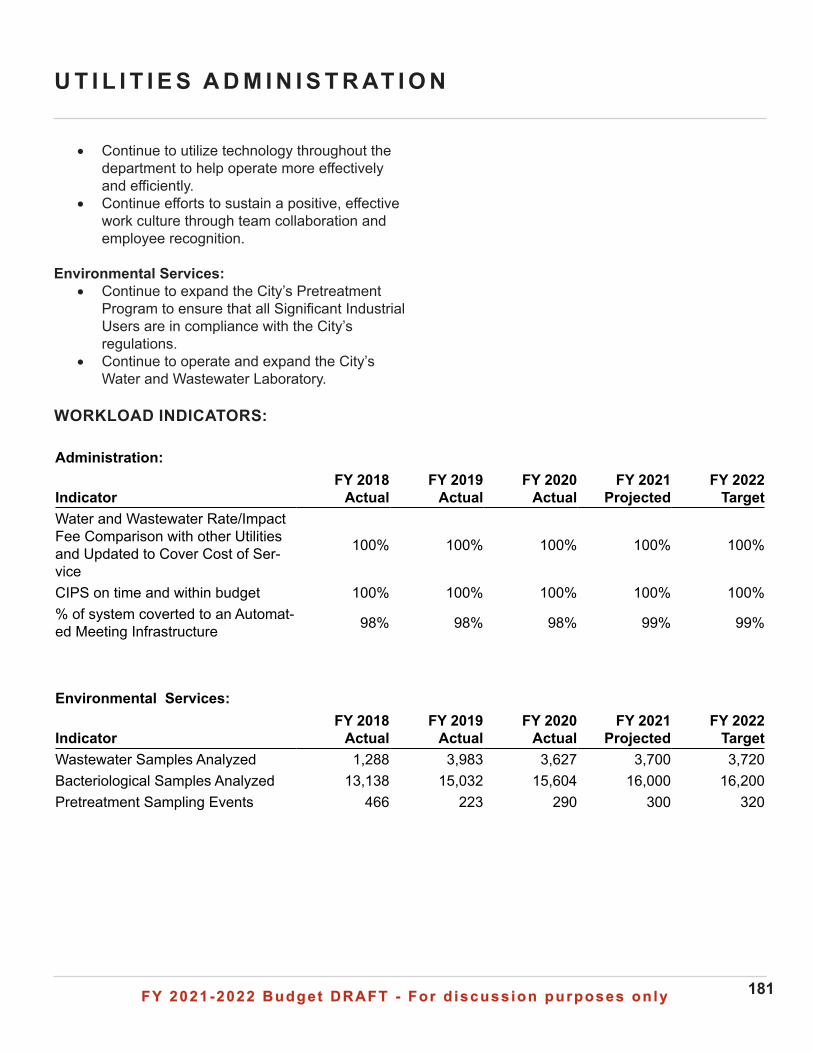
FY 2021-2022 Budget DRAFT - For d iscuss ion purposes on lyFY 2021-2022 Budget DRAFT - For d iscuss ion purposes on ly 181
U T I L I T I E S A D M I N I S T R AT I O N
WORKLOAD INDICATORS:
Administration:
Indicator FY 2018
Actual FY 2019
Actual FY 2020
Actual FY 2021
Projected FY 2022
Target Water and Wastewater Rate/Impact Fee Comparison with other Utilities and Updated to Cover Cost of Ser-vice
100% 100% 100% 100% 100%
CIPS on time and within budget 100% 100% 100% 100% 100%% of system coverted to an Automat-ed Meeting Infrastructure 98% 98% 98% 99% 99%
Environmental Services:
Indicator FY 2018
Actual FY 2019
Actual FY 2020
Actual FY 2021
Projected FY 2022
Target Wastewater Samples Analyzed 1,288 3,983 3,627 3,700 3,720Bacteriological Samples Analyzed 13,138 15,032 15,604 16,000 16,200Pretreatment Sampling Events 466 223 290 300 320
• Continue to utilize technology throughout the department to help operate more effectively and efficiently.
• Continue efforts to sustain a positive, effective work culture through team collaboration and employee recognition.
Environmental Services:• Continue to expand the City’s Pretreatment
Program to ensure that all Significant Industrial Users are in compliance with the City’s regulations.
• Continue to operate and expand the City’s Water and Wastewater Laboratory.
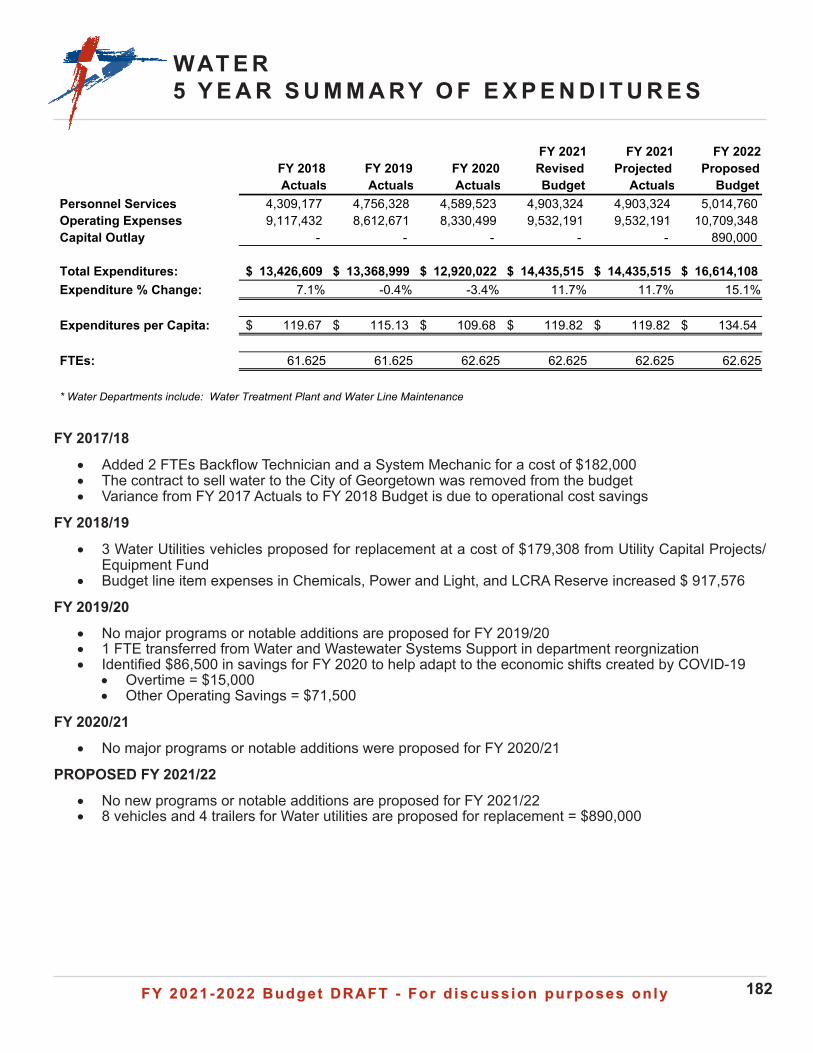
FY 2021-2022 Budget DRAFT - For d iscuss ion purposes on lyFY 2021-2022 Budget DRAFT - For d iscuss ion purposes on ly 182
WAT E R 5 Y E A R S U M M A RY O F E X P E N D I T U R E S
FY 2017/18
• Added 2 FTEs Backflow Technician and a System Mechanic for a cost of $182,000• The contract to sell water to the City of Georgetown was removed from the budget• Variance from FY 2017 Actuals to FY 2018 Budget is due to operational cost savings
FY 2018/19
• 3 Water Utilities vehicles proposed for replacement at a cost of $179,308 from Utility Capital Projects/Equipment Fund
• Budget line item expenses in Chemicals, Power and Light, and LCRA Reserve increased $ 917,576
FY 2019/20• No major programs or notable additions are proposed for FY 2019/20• 1 FTE transferred from Water and Wastewater Systems Support in department reorgnization• Identified $86,500 in savings for FY 2020 to help adapt to the economic shifts created by COVID-19
• Overtime = $15,000• Other Operating Savings = $71,500
FY 2020/21• No major programs or notable additions were proposed for FY 2020/21
PROPOSED FY 2021/22• No new programs or notable additions are proposed for FY 2021/22• 8 vehicles and 4 trailers for Water utilities are proposed for replacement = $890,000
FY 2018 Actuals
FY 2019 Actuals
FY 2020 Actuals
FY 2021 Revised Budget
FY 2021 Projected
Actuals
FY 2022 Proposed
BudgetPersonnel Services 4,309,177 4,756,328 4,589,523 4,903,324 4,903,324 5,014,760 Operating Expenses 9,117,432 8,612,671 8,330,499 9,532,191 9,532,191 10,709,348 Capital Outlay - - - - - 890,000
Total Expenditures: 13,426,609$ 13,368,999$ 12,920,022$ 14,435,515$ 14,435,515$ 16,614,108$ Expenditure % Change: 7.1% -0.4% -3.4% 11.7% 11.7% 15.1%
Expenditures per Capita: 119.67$ 115.13$ 109.68$ 119.82$ 119.82$ 134.54$
FTEs: 61.625 61.625 62.625 62.625 62.625 62.625
* Water Departments include: Water Treatment Plant and Water Line Maintenance
FY 2021-2022 Budget DRAFT - For d iscuss ion purposes on lyFY 2021-2022 Budget DRAFT - For d iscuss ion purposes on ly 183
WAT E RWAT E R
Water Distribution
Water Treatment
Water
The City provides water to over 150,000 people living in the City Limits and ETJ. The sources of water are from the Edwards Aquifer, Lake Georgetown, Lake Stillhouse Hollow, and, in the future, Lake Travis. The Operations are divided up into the Water Treatment and Water Distribution Divisions.
The Water Treatment Division handles the treatment of surface water, ground water, and reuse water to a level that meets or exceeds state and federal regulations. This is accomplished by utilizing sophisticated equipment, innovative treatment technologies, and state certified waterworks operators. This Division maintains numerous elevated and ground water storage tanks and several pump stations. The Water Treatment Division is also responsible for the operations of the Supervisory Control and Data Acquisition (SCADA) computer system used to monitor and control the treatment and distribution of water and the collection of wastewater.
The Water Distribution Division is responsible for the operation, maintenance, accountability, and repair of the City’s water distribution system. This Division maintains approximately 579 miles of waterlines, 13,481 valves, approximately 31,534 water meters, and 5,036 fire hydrants in the City’s water distribution system.
VISION:
Be the best at what we do.
MISSION:
Provide excellent service at the best value.
We will achieve our Vision and Mission by focusing on our five Guiding Principles:
Public Health, Safety, and the Environment: ensure efficient compliance with regulations, minimization of risk, and proactive efforts toward preserving and enhancing our natural resources.
Financial Strength: strive to know the true cost of service, be transparent and competitive in our rates and fees, and provide a solid fiscal foundation for our customers and financiers.
Employee Success: select and promote the best, encourage empowerment and leadership at every level, and foster development through
continued education and knowledge sharing.
System Management: proactively plan, monitor, replace, and expand our utility systems to ensure infrastructure stability, orderly and sustainable growth, and cost efficiencies.
Operational Excellence: efficiently operate and maintain systems, embrace technology and creative strategies, and strive for continuous improvement in managing and reducing costs.
FY 2021-2022 Budget DRAFT - For d iscuss ion purposes on lyFY 2021-2022 Budget DRAFT - For d iscuss ion purposes on ly 184
WAT E R
increase revenue.
• North 81 tank site project involved many different tasks including removing a 24” knuckle, tapping a fire hydrant from a 12” waterline to a 24” waterline as well as abandoning sections of an existing 12” waterline. Major improvement to the old site itself. Original quote was $100,000 by doing the project inhouse we saved $50,000.
• Our backflow program has 17,090 devices and we are at 95.1% complaint with testing them. This is higher then the national average.
Water Treatment Plant and Utility Support:
• Raw water intake screen replacement at Lake Georgetown is in progress.
• The design and install of the Chlorine Scrubber at Lake Creek Groundwater Facility is in progress.
• Permanent chemical feed system at Lake Georgetown for Zebra Mussel control is under way.
• Succession plan has been created and implemented.
• The chorine scrubber at the WTP was repaired internally, saving the City $90,000.
• Chain and Flight system in the settling basins is being rehabbed internally.
• Raw water pump #3 was repaired.
• Put Stone Oak pump station on-line when BCRUA’s raw waterline broke, enabling us to continue providing service to our customers.
• Replaced High-service #6, Booster pump #3, and Well pump #1 motors, with new, more efficient motors.
• Purchased 2 new pumps for Oak Bluff lift station.
GUIDING COUNCIL STRATEGIC GOALS:
FY 2021 HIGHLIGHTS:
Water Distribution:
• Repaired a major 24” potable waterline as well as added a new 24” valve to the waterline. All of the work was completed in house by various teams (Distribution, Water Treatment, Wastewater Collections, and Stormwater). It was a successful job with a lot of team work, no accidents, as well as no disruption of service to our customers.
• Repaired a 30” raw waterline in-house with no disruption of service to the Water Treatment Plant.
• Leak detected 213,000 linear feet of waterlines with 16 leaks identified. All leaks have been repaired with a savings of 20 gallons a minute. This saves on water loss, chemicals, and power.
• Meter program identified 190+ 3” or greater meters needing to be changed out to our Automated Metering Infrastructure (AMI) meters. We now change out approximately five of these large meters per month, and the goal is to have all of them changed out in three years. This will increase the accuracy of our meter readings and has the potential to
FY 2021-2022 Budget DRAFT - For d iscuss ion purposes on lyFY 2021-2022 Budget DRAFT - For d iscuss ion purposes on ly 185
WAT E R
• Permanent Chemical feed system at Lake Georgetown will be completed.
• Succession planning will continue to be implemented.
• SCADA Communications upgrade will be completed.
• Raw water pump #6 will be removed internally, for the first time.
• We are looking to replace our current chlorine analyzers, with new reagentless analyzers. This will save the City $10,000 per year.
• Installation of a new generator at South East Booster pump station, as well as a portable generator for South 81 pump station.
• Painting project to bring all piping up to code with TCEQ, including raw water pump station, high service pumps, and all exterior components at the Water Treatment Plant.
• Continue installation of sample stations for Bac-t samples and pressure monitors.
• Replacement of Phase 3 and 4 flocculators. These flocculators are anywhere from 20-25 years old.
NEW PROGRAMS FOR FY 2022:
• Water Disribution: No new programs requested
• Water Treatment Plant and Utility Support: No new programs requested
FY 2023 OVERVIEW AND BEYOND:
Water Distribution:
• Continue to promote staff to upgrade licenses and become dual-licensed if not already.
• All 21 turbidimeters at the Water Treatment Plant have been upgraded to the latest technology.
• Chemical costs decreased about $125,000. This was made possible by frequent jar-testing, and increased process control.
• SCADA Communication upgrade is currently under way. PLCs, network cabinets, Flocculator VFDs have been replaced, and some operations have been enabled on the new software, Ignition. Several hours of very complex logic programming, for our filter process control, has been completed. Substantial completion date for this project is January 2022
FY 2022 OVERVIEW & SIGNIFICANT CHANGES:
Water Distribution:
• Continue with our leak detection program. This program has helped reduce our water loss ensuring we stay below the recommended national average of 10% loss.
• Continue with our valve, fire hydrant, air release, and flushing programs to ensure all assets are properly maintained and in compliance with TCEQ, EPA, and AWWA rules and regulations.
• Continue adding AMI meters as well as sample/pressure monitoring sites. This will improve our water system with accurate water use readings, chlorine residuals, and pressure readings.
Water Treatment Plant and Utility Support:
• Raw water intake screen replacement project will be completed.
• Chlorine Scrubber project at Lake Creek will be completed.
FY 2021-2022 Budget DRAFT - For d iscuss ion purposes on lyFY 2021-2022 Budget DRAFT - For d iscuss ion purposes on ly 186
WAT E R
• Continue to improve our valves, fire hydrant, flushing, and leak detection programs by cross-training, obtaining dual-licensing for employees.
• Continue to update maps and provide tools necessary for staff to access utility maps on the job site.
• Continue promoting the Leadership Development Academy and Fred Pryor training to encourage employee growth and a sustainable workforce.
• Install additional sample/pressure monitoring sites around town to control water pressure planes and water quality better.
Water Treatment Plant and Utility Support:
• Continue to move forward with our assest management plan.
• Continue succession planning and cross-training.
• Continue encouraging employees to obtain higher licenses.
• Continue installing generators throughout the distribution system.
• Continue replacing motors that are 20+ years old, with new, more efficient motors.
WORKLOAD INDICATORS:
Water Treatment
Indicator FY 2018
Actual FY 2019
Actual FY 2020
Actual FY 2021
Projected FY 2022
Target Gallons of Water Treated 7,253,368,000 6,741,376,000 7,618,156,000 8,000,000,000 8,000,000,000Hours of Maintenance 2080 2,080 2,080 2,080 2,080 Gallons of Type I Reuse 252,045,000 228,830,000 433,148,000 450,000,000 450,000,000
Water Distribution
Indicator FY 2018
Actual FY 2019
Actual FY 2020
Actual FY 2021
Projected FY 2022
Target KW Usage Reduction 5% 3%AMI Meter Installations 97% 98% 100% 100% 100%Water Loss 6% 6% 7.17% >10% >10%KWH/MG Water Treated + Distributed (Surface) 2,450 2,450 2,492 2,450 2,450Valve Maintenance - 13,124 Valves 50% 50% 50% 50% 50%Fire Hydrant Maintenance - 4.961 FH 94% 94% 94% 94% 94%Customer Service Satisfac-tion Surveys 98% 98% 98% 98% 98%
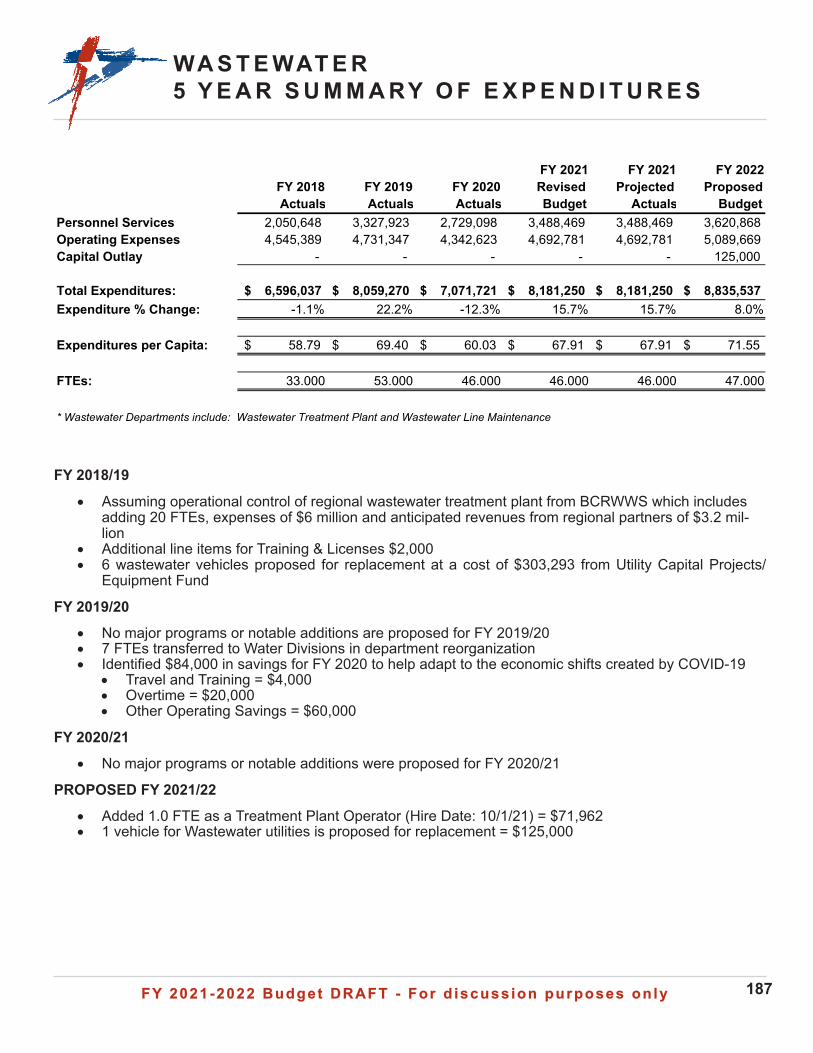
FY 2021-2022 Budget DRAFT - For d iscuss ion purposes on lyFY 2021-2022 Budget DRAFT - For d iscuss ion purposes on ly 187
WA S T E WAT E R5 Y E A R S U M M A RY O F E X P E N D I T U R E S
FY 2018/19
• Assuming operational control of regional wastewater treatment plant from BCRWWS which includes adding 20 FTEs, expenses of $6 million and anticipated revenues from regional partners of $3.2 mil-lion
• Additional line items for Training & Licenses $2,000• 6 wastewater vehicles proposed for replacement at a cost of $303,293 from Utility Capital Projects/
Equipment Fund
FY 2019/20• No major programs or notable additions are proposed for FY 2019/20• 7 FTEs transferred to Water Divisions in department reorganization• Identified $84,000 in savings for FY 2020 to help adapt to the economic shifts created by COVID-19
• Travel and Training = $4,000• Overtime = $20,000• Other Operating Savings = $60,000
FY 2020/21• No major programs or notable additions were proposed for FY 2020/21
PROPOSED FY 2021/22• Added 1.0 FTE as a Treatment Plant Operator (Hire Date: 10/1/21) = $71,962• 1 vehicle for Wastewater utilities is proposed for replacement = $125,000
FY 2018 Actuals
FY 2019 Actuals
FY 2020 Actuals
FY 2021 Revised Budget
FY 2021 Projected
Actuals
FY 2022 Proposed
BudgetPersonnel Services 2,050,648 3,327,923 2,729,098 3,488,469 3,488,469 3,620,868 Operating Expenses 4,545,389 4,731,347 4,342,623 4,692,781 4,692,781 5,089,669 Capital Outlay - - - - - 125,000
Total Expenditures: 6,596,037$ 8,059,270$ 7,071,721$ 8,181,250$ 8,181,250$ 8,835,537$ Expenditure % Change: -1.1% 22.2% -12.3% 15.7% 15.7% 8.0%
Expenditures per Capita: 58.79$ 69.40$ 60.03$ 67.91$ 67.91$ 71.55$
FTEs: 33.000 53.000 46.000 46.000 46.000 47.000
* Wastewater Departments include: Wastewater Treatment Plant and Wastewater Line Maintenance
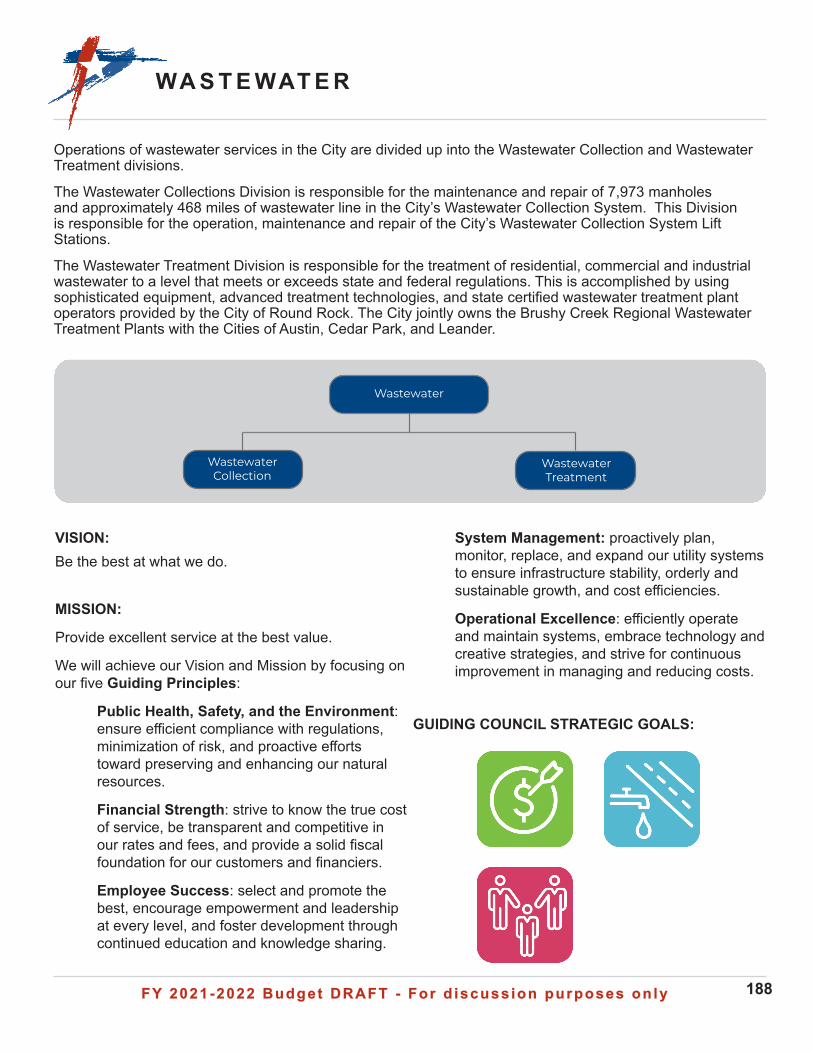
FY 2021-2022 Budget DRAFT - For d iscuss ion purposes on lyFY 2021-2022 Budget DRAFT - For d iscuss ion purposes on ly 188
WA S T E WAT E R
Wastewater Collection
Wastewater Treatment
Wastewater
Operations of wastewater services in the City are divided up into the Wastewater Collection and Wastewater Treatment divisions.
The Wastewater Collections Division is responsible for the maintenance and repair of 7,973 manholes and approximately 468 miles of wastewater line in the City’s Wastewater Collection System. This Division is responsible for the operation, maintenance and repair of the City’s Wastewater Collection System Lift Stations.
The Wastewater Treatment Division is responsible for the treatment of residential, commercial and industrial wastewater to a level that meets or exceeds state and federal regulations. This is accomplished by using sophisticated equipment, advanced treatment technologies, and state certified wastewater treatment plant operators provided by the City of Round Rock. The City jointly owns the Brushy Creek Regional Wastewater Treatment Plants with the Cities of Austin, Cedar Park, and Leander.
VISION: Be the best at what we do.
MISSION:
Provide excellent service at the best value.
We will achieve our Vision and Mission by focusing on our five Guiding Principles:
Public Health, Safety, and the Environment: ensure efficient compliance with regulations, minimization of risk, and proactive efforts toward preserving and enhancing our natural resources.
Financial Strength: strive to know the true cost of service, be transparent and competitive in our rates and fees, and provide a solid fiscal foundation for our customers and financiers.
Employee Success: select and promote the best, encourage empowerment and leadership at every level, and foster development through continued education and knowledge sharing.
System Management: proactively plan, monitor, replace, and expand our utility systems to ensure infrastructure stability, orderly and sustainable growth, and cost efficiencies.
Operational Excellence: efficiently operate and maintain systems, embrace technology and creative strategies, and strive for continuous improvement in managing and reducing costs.
GUIDING COUNCIL STRATEGIC GOALS:
FY 2021-2022 Budget DRAFT - For d iscuss ion purposes on lyFY 2021-2022 Budget DRAFT - For d iscuss ion purposes on ly 189
WA S T E WAT E R
FY 2022 OVERVIEW & SIGNIFICANT CHANGES:
• Purchase vactor camera tips that will allow wastewater staff to immediately inspect main line backups, using the vactor main line, after the after the initial relief of the backup. This is will help pinpoint real-time problems in the system and be able to recommend repairs or additional cleaning.
• Conduct wastewater repair trench safety training to ensure that our team is well educated on the rules of safety and conducting proper collection system repairs.
• Conduct In-House rehab repairs. These repairs are generated from the basin inspections conducted by the I&I team. Making these in-house rehab repairs will give teams more experience with main line repairs and save the department/city from spending efforts on contract labor.
• Reuse PLC Upgrade
• Replace another RAS pump
• Upgrade the fire suppression system in the Administration Building.
• Install Auto TSS / Polymer control system
NEW PROGRAMS FOR FY 2022:
• Wastewater Collections: No new programs were requested
• WWTP: One new FTE - due to larger footprint of the plant, 33% more equipment, 24/7 Operations and Safety
FY 2023 OVERVIEW & BEYOND:
• Continue to improve our inflow and infiltration and wastewater repair programs by cross training and obtaining dual licenses for employees
• Continue to update maps and provide hardware necessary for field personnel so that they will be able to access utility maps on the jobsite
FY 2021 HIGHLIGHTS:
• Created an internal Fat Oil Grease (FOG) team that has helped communication between the wastewater line maintenance team and the public. The goal is to educate the residents/businesses to minimize introducing FOG into the collection system and to improve communication when customers have issues with backups.
• Created Flow Monitoring program that will monitor the flow of wastewater through the collection system. This program will help the wastewater maintenance team be proactive in main line spills by monitoring the areas prone to backups. It will also allow the team to determine new areas needing cleaning and possible repairs to the collection system.
• Purchased IBAK Scanner for manhole inspections. This new technology has allowed the I&I team be more effective at inspecting manholes. The data provided by the software will be paperless, detailed and precise allowing us to conduct better inspections on the manholes in the collection system. The new technology will allow crews to inspect up to 50 manholes per day, compared to the average of 10 per day without the scanner.
• Completed the Edwards Aquifer Inspection Cycle 1 which is required by TCEQ.
• Replaced RAS pumps #3 and #6 with new pumps and rebuilt RAS pump # 4.
• Replaced 2 polymer pumps with new ones.
• Rebuilt Turblex Blower #1.
• Assisted with installation of new clarifier drive at clarifier #3.
• Replaced Mc. Nutt ILS pump #1 with a new one.
• Coordinating with engineers and contractor on Phase A of the 10MGD Plant expansion
• Passed TCEQ Inspection.
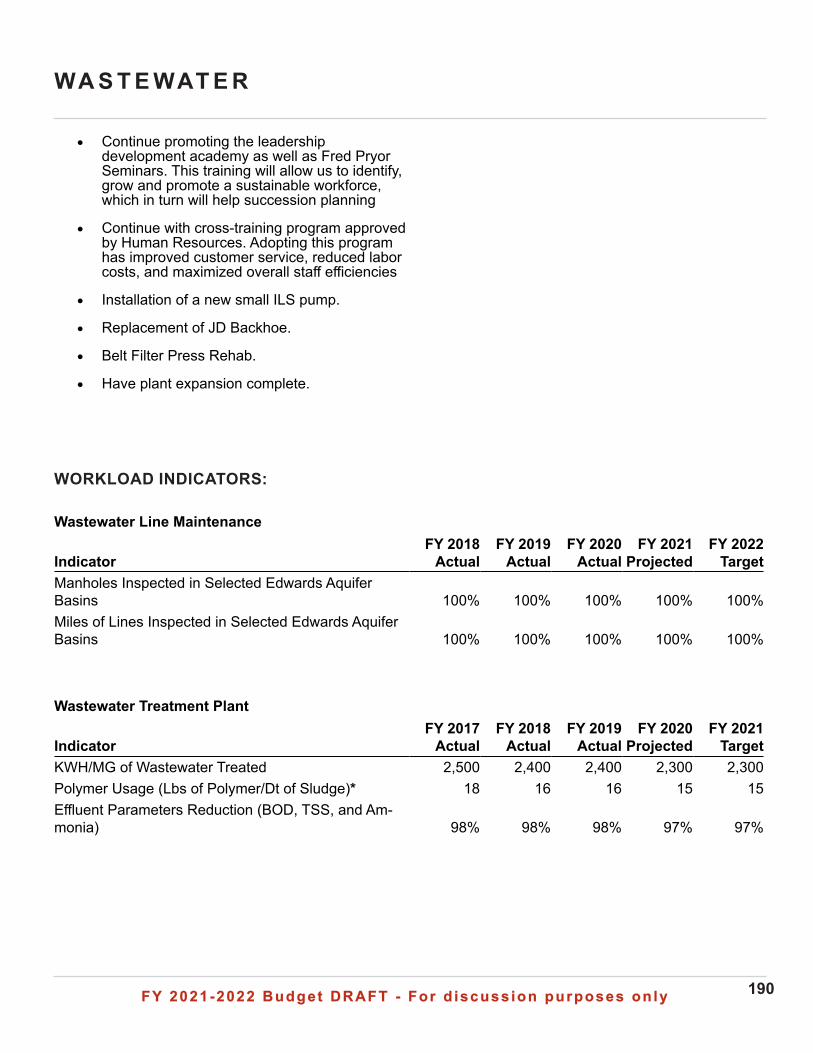
FY 2021-2022 Budget DRAFT - For d iscuss ion purposes on lyFY 2021-2022 Budget DRAFT - For d iscuss ion purposes on ly 190
WA S T E WAT E R
• Continue promoting the leadership development academy as well as Fred Pryor Seminars. This training will allow us to identify, grow and promote a sustainable workforce, which in turn will help succession planning
• Continue with cross-training program approved by Human Resources. Adopting this program has improved customer service, reduced labor costs, and maximized overall staff efficiencies
• Installation of a new small ILS pump.
• Replacement of JD Backhoe.
• Belt Filter Press Rehab.
• Have plant expansion complete.
WORKLOAD INDICATORS:
Wastewater Line Maintenance
Indicator FY 2018
Actual FY 2019
Actual FY 2020
Actual FY 2021
Projected FY 2022
Target Manholes Inspected in Selected Edwards Aquifer Basins 100% 100% 100% 100% 100%Miles of Lines Inspected in Selected Edwards Aquifer Basins 100% 100% 100% 100% 100%
Wastewater Treatment Plant
Indicator FY 2017
Actual FY 2018
Actual FY 2019
Actual FY 2020
Projected FY 2021
Target KWH/MG of Wastewater Treated 2,500 2,400 2,400 2,300 2,300 Polymer Usage (Lbs of Polymer/Dt of Sludge)* 18 16 16 15 15Effluent Parameters Reduction (BOD, TSS, and Am-monia) 98% 98% 98% 97% 97%
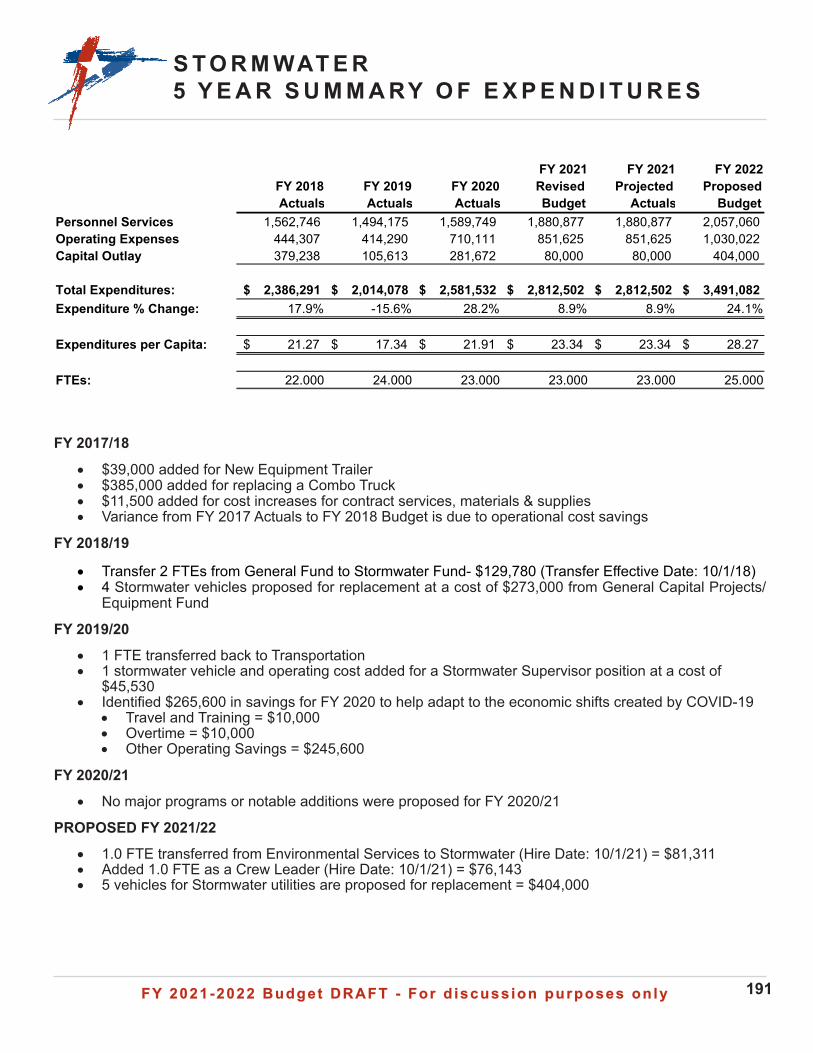
FY 2021-2022 Budget DRAFT - For d iscuss ion purposes on lyFY 2021-2022 Budget DRAFT - For d iscuss ion purposes on ly 191
S T O R M WAT E R5 Y E A R S U M M A RY O F E X P E N D I T U R E S
FY 2017/18
• $39,000 added for New Equipment Trailer • $385,000 added for replacing a Combo Truck • $11,500 added for cost increases for contract services, materials & supplies• Variance from FY 2017 Actuals to FY 2018 Budget is due to operational cost savings
FY 2018/19
• Transfer 2 FTEs from General Fund to Stormwater Fund- $129,780 (Transfer Effective Date: 10/1/18)• 4 Stormwater vehicles proposed for replacement at a cost of $273,000 from General Capital Projects/
Equipment Fund
FY 2019/20• 1 FTE transferred back to Transportation• 1 stormwater vehicle and operating cost added for a Stormwater Supervisor position at a cost of
$45,530• Identified $265,600 in savings for FY 2020 to help adapt to the economic shifts created by COVID-19
• Travel and Training = $10,000• Overtime = $10,000• Other Operating Savings = $245,600
FY 2020/21• No major programs or notable additions were proposed for FY 2020/21
PROPOSED FY 2021/22• 1.0 FTE transferred from Environmental Services to Stormwater (Hire Date: 10/1/21) = $81,311• Added 1.0 FTE as a Crew Leader (Hire Date: 10/1/21) = $76,143• 5 vehicles for Stormwater utilities are proposed for replacement = $404,000
FY 2018 Actuals
FY 2019 Actuals
FY 2020 Actuals
FY 2021 Revised Budget
FY 2021 Projected
Actuals
FY 2022 Proposed
BudgetPersonnel Services 1,562,746 1,494,175 1,589,749 1,880,877 1,880,877 2,057,060 Operating Expenses 444,307 414,290 710,111 851,625 851,625 1,030,022 Capital Outlay 379,238 105,613 281,672 80,000 80,000 404,000
Total Expenditures: 2,386,291$ 2,014,078$ 2,581,532$ 2,812,502$ 2,812,502$ 3,491,082$ Expenditure % Change: 17.9% -15.6% 28.2% 8.9% 8.9% 24.1%
Expenditures per Capita: 21.27$ 17.34$ 21.91$ 23.34$ 23.34$ 28.27$
FTEs: 22.000 24.000 23.000 23.000 23.000 25.000
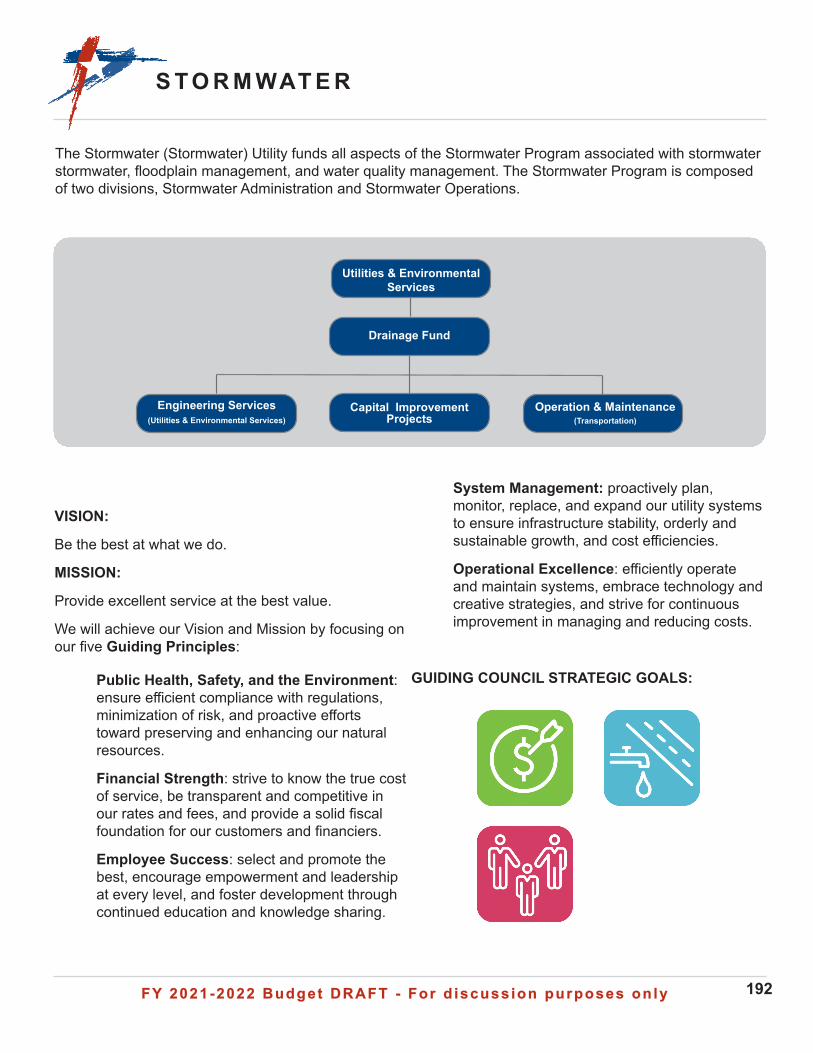
FY 2021-2022 Budget DRAFT - For d iscuss ion purposes on lyFY 2021-2022 Budget DRAFT - For d iscuss ion purposes on ly 192
S T O R M WAT E R
Utilities & Environmental Services
Drainage Fund
PurchasingCapital Improvement ProjectsPurchasing
Engineering Services(Utilities & Environmental Services)
PurchasingOperation & Maintenance(Transportation)
The Stormwater (Stormwater) Utility funds all aspects of the Stormwater Program associated with stormwater stormwater, floodplain management, and water quality management. The Stormwater Program is composed of two divisions, Stormwater Administration and Stormwater Operations.
VISION:
Be the best at what we do.
MISSION:
Provide excellent service at the best value.
We will achieve our Vision and Mission by focusing on our five Guiding Principles:
Public Health, Safety, and the Environment: ensure efficient compliance with regulations, minimization of risk, and proactive efforts toward preserving and enhancing our natural resources.
Financial Strength: strive to know the true cost of service, be transparent and competitive in our rates and fees, and provide a solid fiscal foundation for our customers and financiers.
Employee Success: select and promote the best, encourage empowerment and leadership at every level, and foster development through continued education and knowledge sharing.
System Management: proactively plan, monitor, replace, and expand our utility systems to ensure infrastructure stability, orderly and sustainable growth, and cost efficiencies.
Operational Excellence: efficiently operate and maintain systems, embrace technology and creative strategies, and strive for continuous improvement in managing and reducing costs.
GUIDING COUNCIL STRATEGIC GOALS:
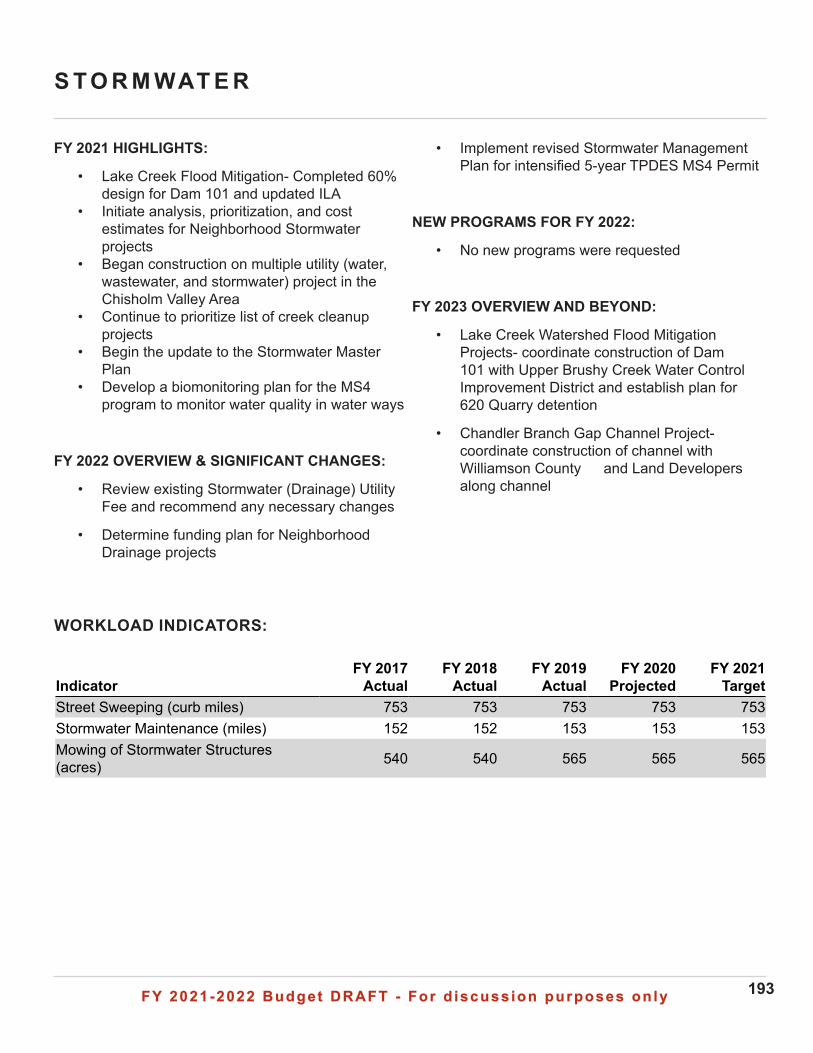
FY 2021-2022 Budget DRAFT - For d iscuss ion purposes on lyFY 2021-2022 Budget DRAFT - For d iscuss ion purposes on ly 193
S T O R M WAT E R
WORKLOAD INDICATORS:
• Implement revised Stormwater Management Plan for intensified 5-year TPDES MS4 Permit
NEW PROGRAMS FOR FY 2022:
• No new programs were requested
FY 2023 OVERVIEW AND BEYOND:
• Lake Creek Watershed Flood Mitigation Projects- coordinate construction of Dam 101 with Upper Brushy Creek Water Control Improvement District and establish plan for 620 Quarry detention
• Chandler Branch Gap Channel Project- coordinate construction of channel with Williamson County and Land Developers along channel
FY 2021 HIGHLIGHTS:
• Lake Creek Flood Mitigation- Completed 60% design for Dam 101 and updated ILA
• Initiate analysis, prioritization, and cost estimates for Neighborhood Stormwater projects
• Began construction on multiple utility (water, wastewater, and stormwater) project in the Chisholm Valley Area
• Continue to prioritize list of creek cleanup projects
• Begin the update to the Stormwater Master Plan
• Develop a biomonitoring plan for the MS4 program to monitor water quality in water ways
FY 2022 OVERVIEW & SIGNIFICANT CHANGES:
• Review existing Stormwater (Drainage) Utility Fee and recommend any necessary changes
• Determine funding plan for Neighborhood Drainage projects
Indicator FY 2017
Actual FY 2018
Actual FY 2019
Actual FY 2020
Projected FY 2021
Target Street Sweeping (curb miles) 753 753 753 753 753 Stormwater Maintenance (miles) 152 152 153 153 153 Mowing of Stormwater Structures (acres) 540 540 565 565 565
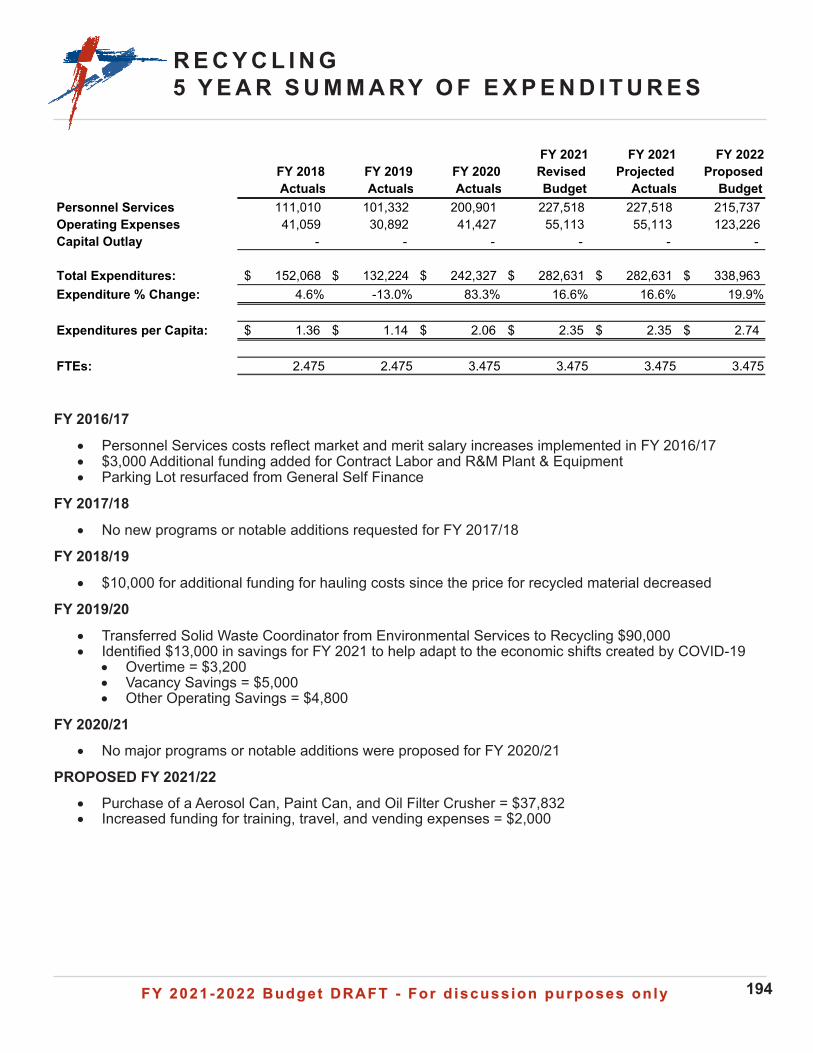
FY 2021-2022 Budget DRAFT - For d iscuss ion purposes on lyFY 2021-2022 Budget DRAFT - For d iscuss ion purposes on ly 194
R E C Y C L I N G5 Y E A R S U M M A RY O F E X P E N D I T U R E S
FY 2016/17
• Personnel Services costs reflect market and merit salary increases implemented in FY 2016/17• $3,000 Additional funding added for Contract Labor and R&M Plant & Equipment• Parking Lot resurfaced from General Self Finance
FY 2017/18
• No new programs or notable additions requested for FY 2017/18
FY 2018/19
• $10,000 for additional funding for hauling costs since the price for recycled material decreased
FY 2019/20
• Transferred Solid Waste Coordinator from Environmental Services to Recycling $90,000• Identified $13,000 in savings for FY 2021 to help adapt to the economic shifts created by COVID-19
• Overtime = $3,200• Vacancy Savings = $5,000• Other Operating Savings = $4,800
FY 2020/21• No major programs or notable additions were proposed for FY 2020/21
PROPOSED FY 2021/22• Purchase of a Aerosol Can, Paint Can, and Oil Filter Crusher = $37,832• Increased funding for training, travel, and vending expenses = $2,000
FY 2018 Actuals
FY 2019 Actuals
FY 2020 Actuals
FY 2021 Revised Budget
FY 2021 Projected
Actuals
FY 2022 Proposed
BudgetPersonnel Services 111,010 101,332 200,901 227,518 227,518 215,737 Operating Expenses 41,059 30,892 41,427 55,113 55,113 123,226 Capital Outlay - - - - - -
Total Expenditures: 152,068$ 132,224$ 242,327$ 282,631$ 282,631$ 338,963$ Expenditure % Change: 4.6% -13.0% 83.3% 16.6% 16.6% 19.9%
Expenditures per Capita: 1.36$ 1.14$ 2.06$ 2.35$ 2.35$ 2.74$
FTEs: 2.475 2.475 3.475 3.475 3.475 3.475
FY 2021-2022 Budget DRAFT - For d iscuss ion purposes on lyFY 2021-2022 Budget DRAFT - For d iscuss ion purposes on ly 195
R E C Y C L I N G
The Solid Waste Management Program provides our community with a variety of garbage collection and recycling programs and services. This program includes the management of the household hazardous waste collection events, Deepwood Recycling Center, used oil drop-off locations, and the City’s in-house recycling program. Also included in this program is the oversite of the residential garbage collection and disposal as well as the curbside collection program by a third-party contractor. In addition, this program oversees the franchise agreements with the commercial haulers who collect garbage and recycling for all commercial properties in the City. The program promotes environmental awareness to increase recycling and reduce the amount of waste disposed of in the landfill.
VISION: Be the best at what we do.
MISSION: Provide excellent service at the best value.
We will achieve our Vision and Mission by focusing on our five Guiding Principles:
• Public Health, Safety, and the Environment – ensure efficient compliance with regulations, minimization of risk, and proactive efforts toward preserving and enhancing our natural resources.
• Financial Strength – strive to know the true cost of service, be transparent and competitive in our rates and fees, and provide a solid fiscal foundation for our customers and financiers.
• Employee Success - select and promote the best, encourage empowerment and leadership at every level, and foster development through continued education and knowledge sharing.
• System Management - proactively plan, monitor, replace, and expand our utility systems to ensure infrastructure stability,
orderly and sustainable growth, and cost efficiencies.
• Operational Excellence - efficiently operate and maintain systems, embrace technology and creative strategies, and strive for continuous improvement in managing and reducing costs.
GUIDING COUNCIL STRATEGIC GOALS:
Utility Administration
Solid Waste Management
Program
Environmental Services
Recycling Services
Utilities &Environmental Services
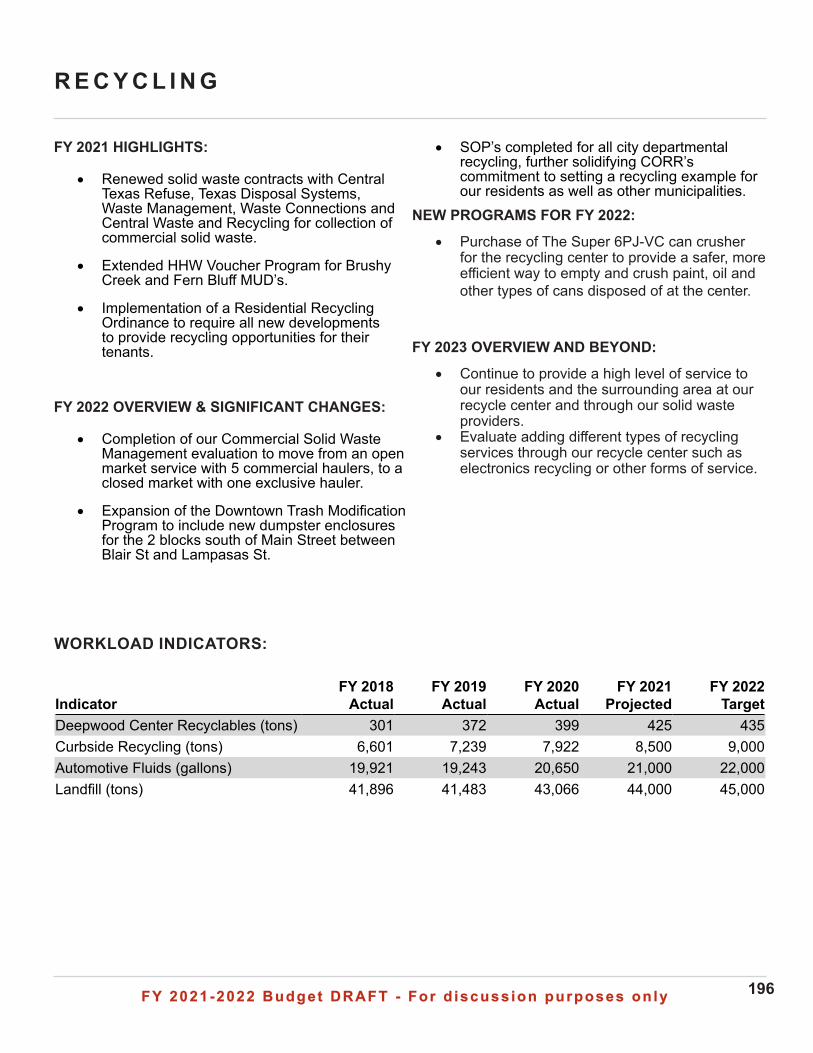
FY 2021-2022 Budget DRAFT - For d iscuss ion purposes on lyFY 2021-2022 Budget DRAFT - For d iscuss ion purposes on ly 196
R E C Y C L I N G
WORKLOAD INDICATORS:
• SOP’s completed for all city departmental recycling, further solidifying CORR’s commitment to setting a recycling example for our residents as well as other municipalities.
NEW PROGRAMS FOR FY 2022:
• Purchase of The Super 6PJ-VC can crusher for the recycling center to provide a safer, more efficient way to empty and crush paint, oil and other types of cans disposed of at the center.
FY 2023 OVERVIEW AND BEYOND:
• Continue to provide a high level of service to our residents and the surrounding area at our recycle center and through our solid waste providers.
• Evaluate adding different types of recycling services through our recycle center such as electronics recycling or other forms of service.
FY 2021 HIGHLIGHTS:
• Renewed solid waste contracts with Central Texas Refuse, Texas Disposal Systems, Waste Management, Waste Connections and Central Waste and Recycling for collection of commercial solid waste.
• Extended HHW Voucher Program for Brushy Creek and Fern Bluff MUD’s.
• Implementation of a Residential Recycling Ordinance to require all new developments to provide recycling opportunities for their tenants.
FY 2022 OVERVIEW & SIGNIFICANT CHANGES:
• Completion of our Commercial Solid Waste Management evaluation to move from an open market service with 5 commercial haulers, to a closed market with one exclusive hauler.
• Expansion of the Downtown Trash Modification Program to include new dumpster enclosures for the 2 blocks south of Main Street between Blair St and Lampasas St.
Indicator FY 2018
Actual FY 2019
Actual FY 2020
Actual FY 2021
Projected FY 2022
Target Deepwood Center Recyclables (tons) 301 372 399 425 435Curbside Recycling (tons) 6,601 7,239 7,922 8,500 9,000Automotive Fluids (gallons) 19,921 19,243 20,650 21,000 22,000Landfill (tons) 41,896 41,483 43,066 44,000 45,000
FY 2021-2022 Budget DRAFT - For d iscuss ion purposes on lyFY 2021-2022 Budget DRAFT - For d iscuss ion purposes on ly 197
S U P P L E M E N TA LS U P P L E M E N TA L
• Tax Rate Terminology....................................................................................198
• Glossary.........................................................................................................199
• Acronyms.........................................................................................................204
• Article 8 of City Charter..................................................................................205
• Financial Policies..........................................................................................210
• Senior Tax Exemption Information................................................................228
FY 2021-2022 Budget DRAFT - For d iscuss ion purposes on lyFY 2021-2022 Budget DRAFT - For d iscuss ion purposes on ly 198
TA X R AT E T E R M I N O L O G Y
Assessed Valuation – A valuation set upon real estate or other property by a government as a basis for levying taxes. (Note: Property values are established by WCAD & TCAD).
Market Value – Per the Texas Tax Code, all taxable property must be valued at 100% of market value, or what a house would sell for, as of January 1 each year. Because it is based on recent sales, the market value may change upwards or downwards any amount depending on recent market trends and is not limited to increases of 10% or more.
Taxable Assessed Value – Per the Texas Property Tax Code, an exemption for taxation is available to an individual’s primary residence. The exemption limits the amount that the value for taxation can increase from one year to the next. The “capped” value may not go up more than 10% in one year in most cases as long as the exemption was in place for the prior year. Many homestead properties reached their 10% cap in 2021. Cap applies to assessed value, not market value. The number of households for the City of Round Rock that have reached the cap increased 88% from 2020 to 2021.
Certified Tax Roll – A list of all taxable properties, values, and exemptions in the City. This roll is established by WCAD & TCAD.
Property Tax – Taxes that are levied on both real and personal property according to the property’s valuation and tax rate.
Tax Base – The total value of all real and personal property in the City as of January 1st of each year, as certified by the Appraisal Review Board.
Tax Levy – The total amount of taxes imposed by the City on taxable property, as determined by the Williamson Central Appraisal District.
Tax Rate – The amount of tax stated in terms of a unit of the tax base (e.g. cents per hundred dollars’ valuation).
Travis Central Appraisal District (TCAD) – Established under state law and granted responsibility for discovering and listing all taxable property, appraising that property at market/production value, processing taxpayer applications for exemptions, and submitting the appraised values and exemptions to each taxing unit. This listing becomes the Certified Tax Roll for the taxing unit. (1)
Williamson Central Appraisal District (WCAD) – Established under state law and granted responsibility for discovering and listing all taxable property, appraising that property at market/production value, processing taxpayer applications for exemptions, and submitting the appraised values and exemptions to each taxing unit. This listing becomes the Certified Tax Roll for the taxing unit. (2)
(1) In 2019, TCAD was 3% of City’s total taxable AV.(2) In 2019, WCAD was 97% of City’s total taxable AV.
FY 2021-2022 Budget DRAFT - For d iscuss ion purposes on lyFY 2021-2022 Budget DRAFT - For d iscuss ion purposes on ly 199
G L O S S A RY
Accrual Basis – A method of accounting that recognizes the financial effect of events, and interfund activities when they occur, regardless of the timing of related cash flows.
Ad Valorem Tax – A tax levied on the assessed value of real property (also known as “property taxes”).
Amortize – To provide for the gradual extinguishment of (as a mortgage) usually by contribution to a sinking fund at the time of each periodic payment.
Annual Comprehensive Financial Report – The annual financial report prepared by the City of Round Rock covering all financial activities and audited by an independent certified public accountant.
Appropriation – A specific amount of money authorized by City Council to make expenditures and incur obligations for specific purposes, frequently used interchangeably with “expenditures”.
Assessed Valuation – A valuation set upon real estate or other property by a government as a basis for levying taxes. (Note: Property values are established by the Williamson County Appraisal District).
Asset – A probable future economic benefit obtained or controlled by an entity because of past transactions or events. A current asset is cash or readily convertible into cash within a one-year time frame.
Audit – To conduct an official financial examination of an organization’s accounts.
Balanced Budget – A budget where total revenues are equal to or greater than total expense.
Benchmark – A comparison of performances across many organizations in order to better understand one’s own performance.
Bond – A written promise to pay a specific sum of money, called the face value or principal amount, at a specific date or dates in the future, called the maturity date, together with periodic interest at a specified rate.
Bonded Debt – The portion of indebtedness represented by outstanding bonds.
Budget – A plan of financial operation specifying expenditures to be incurred for a given period to accomplish specific goals, and the proposed means of financing them.
Budget Calendar – The schedule of key dates or milestones which the City follows in preparation, adoption, and administration of the budget.
Budget Year – From October 1st through September 30th, this is the same as the fiscal year.
Capital Improvement Program – See Community Investment Program.
Capitalized Lease Proceeds – Financing obtained through a three to five-year leasing program for durable equipment and rolling stock.
Capital Outlay – Expenditures which result in the acquisition of or addition to fixed assets.
Capital Projects Fund – A fund created to account for financial resources to be used for the acquisition or construction of major capital facilities or equipment.
Capital Recovery Fee – See Impact Fee.
Community Development Block Grant (CDBG) – Federal HUD entitlement funds used to meet a variety of needs of low income citizens including housing, infrastructure, equipment, facilities and public services.
Certificates of Obligation (CO’s) – A form of general obligation debt. CO’s do not require a vote of the citizens, but do require a 45 day advance notice and are subject to petition. CO’s can only be used for limited purposes such as transportation, public safety, and self supporting projects. CO’s cannot generally be used for parks, libraries, or city administrative buildings.
Certified Tax Roll – A list of all taxable properties, values and exemptions in the City. This roll is established by the Williamson County Appraisal District.
Comprehensive Annual Financial Report – Term no longer used, please see Annual Comprehensive Financial Report.
Community Investment Program (CIP) – A plan for capital expenditures to provide long-lasting physical improvements to be incurred over a fixed period of several future years. Examples include land, improvements to land, easements, buildings, building improvements and infrastructure.
FY 2021-2022 Budget DRAFT - For d iscuss ion purposes on lyFY 2021-2022 Budget DRAFT - For d iscuss ion purposes on ly 200
G L O S S A RY
Convention and Visitor’s Bureau (CVB) – The designated sales and marketing department for the City.
Debt Service – The payment of principal and interest on borrowed funds.
Debt Service Fund – A fund established to account for the accumulation of resources for, and the payment of, long-term debt principal and interest.
Delinquent Taxes – Taxes remaining unpaid on and after the date due.
Dell Sales Tax – Economic development agreement entitles Dell to 41.67% rebate of the 1.5% - expires December 31, 2053.
Demand – Reflects the scope of a program in terms of population or user activity.
Department – A logical division or classification of activities within the City (e.g. Police Department, Water Treatment Plant Department, etc.).
Depreciation – The decrease in value of physical assets due to use and the passage of time.
Destination Marketing Organization (DMO) – A resource used by the CVB to enhance the “Sports Capital of Texas” marketing program for the City.
Division – A logical subset of the city department used to help manage expenditures by activity.
Effectiveness – A program performance indicator that measures the quality of the program outputs.
Efficiency – A program performance indicator that measures the accomplishments of program goals and objectives in an economical manner.
Encumbrance – Commitments related to unperformed (executory) contracts for goods or services.
Enterprise Fund – A fund used to account for operations financed and operated in a manner similar to private business enterprises in that they are self-supported by user fees. These funds use full accrual accounting.
Executive Pay – This is the pay structure established for the City Management and City Director level positions.
Exempt Pay – This is the City’s pay structure for positions that are not paid by the hour. These positions also do not have overtime compensation.
Expenditure – The actual outflow of funds paid for an asset obtained or goods and services obtained.
Expense – A charge incurred in an accounting period, whether actually paid in that accounting period or not.
Filing Fee – A processing and review fee charge when any map (or plat) is tender to the planning department.
Fiscal – Pertaining to finances in general.
Fiscal Year – A twelve-month period to which the annual operating budget applies and at the end of which a government determines its financial position and the results of its operations.
Fixed Assets – Assets of a long-term character which are intended to continue to be held or used, such as land, buildings, improvements other than buildings, machinery and equipment.
Franchise – A special privilege granted by a government permitting the continuing use of public property and rights-of-way, such as city streets.
Full Faith and Credit – A pledge of the general taxing power of the City to repay debt obligations. This term is typically used in reference to general obligation bonds.
Full-time Equivalent (FTE) – A quantifiable unit of measure utilized to convert hours worked by part-time, seasonal employees into hours worked by full-time employees. Full-time employees work 2,080 hours annually. A part-time employee working 1,040 hours annually represents a .500 FTE.
Fund – A fiscal and accounting entity with a self-balancing set of accounts recording cash and other financial resources, together with all related liabilities and residual equities or balances, and changes therein. Funds are usually established to account for activities of a certain type.
Fund Balance – The excess of assets over liabilities in a governmental fund.
Gap Analysis – A technique for determining the steps to be taken in moving from a current state to a desired future-state. Also called need-gap analysis, needs analysis, and needs assessment.
FY 2021-2022 Budget DRAFT - For d iscuss ion purposes on lyFY 2021-2022 Budget DRAFT - For d iscuss ion purposes on ly 201
G L O S S A RY
GAAP – Generally Accepted Accounting Principles.
General Fund – The fund used to account for all financial resources except those required to be accounted for in another fund. This fund includes most of the basic operating services such as police and fire protection, parks and recreation, library services, street maintenance and general administration.
General Obligation Bonds – Bonds for the payment of which the full faith and credit of the City is pledged and approved by voters.
GIS (Geographical Information System) Fees – A fee intended to defray costs of adding plats to the City’s electronic mapping system.
Goals – Generalized statements of where an organization desires to be at some future time with regard to certain operating elements (e.g. financial condition, service levels provided, etc.).
Governmental Fund – It refers to the General Fund, all Special Revenue Funds and Debt Service Funds.
Grant – Contributions or gifts of cash or other assets from another government to be used for a specific purpose, activity or facility.
HOT – Hotel Occupancy Tax – 7% of room rental
• Limited by state law to specific tourism promotion purposes• Typically termed as “heads in beds” programs
I&S G.O. Bond Fund – Interest and Sinking General Obligation Bond Fund (See also Debt Service Fund).
Income – Funds available for expenditure during a fiscal year.
Infrastructure – Substructure or underlying foundation of the City (e.g. streets, utility lines, water and wastewater treatment facilities, etc).
Inputs – A program performance indicator that measures the amount of resources expended or consumed by the program in the delivery of service during the fiscal year.
Inventory – A detailed listing of property currently held by the City.
LaserFiche - A document management system.
Liability – Probable future sacrifices of economic benefits, arising from present obligations of a particular entity to transfer assets or provide services to other entities in the future as a result of past transactions or events. Current liabilities are expected to require the use of cash within a one-year time frame.
Levy – To impose taxes, special assessments, or service charges for the support of City activities.
Line Item Budget – A budget that itemizes each expenditure category (personnel, supplies, contract services, capital outlay, etc.), separately, along with the dollar amount budgeted for each specified category.
Long-Term Debt – Any un-matured debt that is not a fund liability with a maturity of more than one year.
Market Value - Per the Texas Tax Code, all taxable property must be valued at 100% of market value, or what a house would sell for, as of January 1 each year. Because it is based on recent sales, the market value may change upwards or downwards any amount depending on recent market trends and is not limited to increases of 10% or more.
Modified Accrual Basis – The basis of accounting in which revenues are recognized in the accounting period in which they become measurable and available. Expenditures are recognized in the accounting period in which the fund liability is incurred, if measurable.
Non-exempt Pay – This is the City’s pay structure for positions that are paid by the hour. These positions are eligible for overtime pay after working eight hours a day which would reflect a week’s total hours above 40.
Objectives – Specific, measurable targets set in relation to goals.
Operating Budget – Plans of current, day-to-day expenditures and the proposed means of financing them.
Outputs – These are program performance indicators that measure the quantity of work performed by the program. These are units of service delivered by the program to its customers. Sometimes this is called workload.
Performance Budget – A budget that focuses upon activities rather than line item expenditures. Work load and unit cost data are collected in order to assess efficiency of services.
FY 2021-2022 Budget DRAFT - For d iscuss ion purposes on lyFY 2021-2022 Budget DRAFT - For d iscuss ion purposes on ly 202
G L O S S A RY
Policy – A plan, course of action, or guiding principle, designed to set parameters for decisions and actions.
Program – A logical division or classification of activities within the City or within a Department. See also Department.
Property Tax – Taxes that are levied on both real and personal property according to the property’s valuation and tax rate.
Public Works – A combination of city departments organized to support the City Strategic Plan by sharing resources to improve efficiencies of common tasks.
Reserve – An account used to indicate that a portion of a fund’s balance is legally restricted for a specific purpose and is, therefore, not available for general appropriation.
Re-use Water – Water that has been treated from the wastewater treatment plant which meets TCEQ requirements to be used in limited ways rather than potable water.
Revenue – Funds received as income. It includes such items as tax payments, fees from specific services, fines, interest income, franchise fees, etc.
Revenue Bond - Bonds whose principal and interest are payable exclusively from user fees (e.g. Water and Wastewater utility rates).
Repair and Replacement Fund – A utility fun established for major wastewater system improvements. Funding originated through the conveyance of a portion of the City’s regional wastewater plant to the City of Austin.
Risk Management – An organized effort to protect the City’s assets against loss, utilizing the most economical methods.
Roadway Impact Fees (RIF) – Fees assessed on new development to recover the incremental cost of each new unit of development on the arterial and collector roadway infrastructure.
RRTEDC –
• Round Rock Transportation and Economic Development Corporation• Type B Sales Tax entity – 0.5% of sales tax
Sales Tax – Levied on applicable sales of goods and services at the rate of 8.25 percent in Round Rock. The City receives revenue from the sales tax at the rate of 1.5 percent. The Round Rock Transportation System Corp. receives 0.5 percent. Revenue from the remaining portion of the rate is collected by the state.
• 1.0% - General uses – goes to General Fund• 0.5% - Property tax reduction – goes to General
Fund• 0.5% - Economic Development / Transportation –
goes to Type B fund
Self-Financed Construction Fund – A fund used to allocate cash funding for projects rather than issuing debt. The fund’s sources are year-end transfers from the respective fund.
• Cash balances to fund major CIP and Repair & Maintenance of facilities, parks and internal services
• These funds support the City’s pay-as-you-go philosophy
• City has typically used conservative revenue projections to create excess sales tax revenues from prior years to cash fund projects and
maintenance that might otherwise be debt financed or deferred • Both the General Fund and Utilities strategically
manage cash available to fund current and future projects • GSFC – General Self-Financed Construction,
from excess General Fund Revenues or unspent General Fund budget• UFSC – Utility Self-Financed Construction,
from excess water and wastewater revenues or unspent utility budget
Senate Bill 2 – Senate Bill 2, also known as the Texas Property Tax Reform Act of 2019, was passed by the Texas Legislature in 2019. At its most fundamental level, S.B. 2 reforms the system of property taxation in three primary ways: (1) lowering the tax rate a taxing unit can adopt without voter approval and requiring a mandatory election to go above the lowered rate; (2) making numerous changes to the procedure by which a city adopts a tax rate; and (3) making several changes to the property tax appraisal process.
FY 2021-2022 Budget DRAFT - For d iscuss ion purposes on lyFY 2021-2022 Budget DRAFT - For d iscuss ion purposes on ly 203
G L O S S A RY
Special Revenue Fund (SRF) – A fund used to account for the proceeds of specific revenue sources that are legally restricted to expenditure for specified purposes (e.g. Hotel/Motel Special Revenue Funds, Stormwater Fund, Law Enforcement Fund, Library Fund, Municipal Court Fund, Parks Improvement and Acquisition Fund, PEG Fund, Tree Replacement Fund).
Strategic Budget – A budget that is closely linked to the City’s Strategic Plan and Departmental Goals, Objectives, and Performance Measures. Strategic Budgeting is the process that the City of Round Rock utilizes to link the City’s Strategic Plan and individual Departmental strategy and performance to the City’s Budget.
Strategic Plan – A collectively supported vision of the City’s future including observations regarding the potential effects of various operating decisions.
Subdivision Development Fee – A fee related to the inspection of subdivision improvements equating to 1.5 percent of the actual total construction costs.
Tax Base – The total value of all real and personal property in the City as of January 1st of each year, as certified by the Appraisal Review Board.
Tax Levy – The total amount of taxes imposed by the City on taxable property, as determined by the Williamson Central Appraisal District.
Tax Rate – The amount of tax stated in terms of a unit of the tax base (e.g. cents per hundred dollars valuation).
Taxable Appraised Value - Per the Texas Property Tax Code, an exemption for taxation is available to an individual’s primary residence. The exemption limits the amount that the value for taxation can increase from one year to the next. The “capped” value may not go up more than 10% in one year in most cases as long as the exemption was in place for the prior year. Many homestead properties reached their 10% cap in 2021. Cap applies to assessed value, not market value.
Travis Central Appraisal District – Established under state law and granted responsibility for discovering and listing all taxable property, appraising that property at market/production value, processing taxpayer applications for exemptions, and submitting the appraised values and exemptions to each taxing unit. This listing becomes the Certified Tax Roll for the taxing unit.
Utility Fund – See Water/Wastewater Utility Fund.
Venue Tax –
• Separately voted HOT tax of 2% of room rental• Dedicated to Sports Center
Water/Wastewater Utility Fund – A governmental accounting fund better known as an enterprise fund or proprietary fund in which the services provided are financed and operated similarly to those of a private business. The rates for these services are established to ensure that revenues are adequate to meet all necessary expenditures.
Water and Wastewater Impact Fee – A fee assessed to new water and wastewater service connections. Fees are to be used for specific water and wastewater system improvements and are accounted for in the Water/Wastewater Utility Impact Fee account group.
Williamson Central Appraisal District – Established under state law and granted responsibility for discovering and listing all taxable property, appraising that property at market/production value, processing taxpayer applications for exemptions, and submitting the appraised values and exemptions to each taxing unit. This listing becomes the Certified Tax Roll for the taxing unit.
Working Capital – The excess of current assets over current liabilities.
FY 2021-2022 Budget DRAFT - For d iscuss ion purposes on lyFY 2021-2022 Budget DRAFT - For d iscuss ion purposes on ly 204
A C R O N Y M S
ACC - Austin Community College
ADA - American with Disabilities Act
AMI - Automated Metering Infrastructure
ASE - Automatic Service Excellence. The City’s Fleet division in General Services has maintained its ASE Blue Seal Certification.
BACA - Allen R. Baca Center for Senior/Activity Center for adults ages 50 and older
BCRUA - Brushy Creek Regional Wastewater System
BRA - Brazos River Authority
CALEA - Commission on the Accreditation of Law Enforcement Agencies - The Round Rock Police Department has been CALEA - certified since 2004.
CAMPO - Capital Area Metropolitan Planning Organization
CCTV - Closed Circuit Television
CBDG - Community Development Block Grants
CIP - Capital Improvement Plan
CMRC - Clay Madsen Recreation Center
CORR - City of Round Rock
CVB - Convention and Visitors Bureau
DEA - Drug Enforcement Agency
DSO - Development Services Office
EMS - Emergency Medical Services
ETJ - Extra Territorial Jurisdiction
FBI - Federal Bureau of Investigation
FEMA - Federal Emergency Management Association
FTE - Full-time Equivalent
GASB - Governmental Accounting Standards Board
GFOA - Government Finance Officers Association
GIS - Geographical Information Systems
GSFC - General Self-Financed Construction
GTOT - Governmental Treasurers’ Organization of Texas
HR - Human Resources
ICMA - International City/County Management Association ILA - Interlocal Agreement
ISO - Insurance Service Office is a for-profit organization that provides statistical information on risk. The “ISO Rating” has a large impact on most fire departments.
IT - Information Technology
HIPPA - Health Insurance Portability and Accountability Act of 1996
LED - Light-Emitting Diode
MGD - Millions of Gallons per Day
MOT - Mobile Outreach Team. The Williamson County MOT is our Country’s emergency behavioral health response unit and is partnering with the Round Rock Fire Department and Round Rock Police Department on the opioid response grant.
MPC - Multipurpose Complex
NELAP - National Environmental Laboratory Accreditation Program
NFIRS - National Fire Incident Reporting System
OSP - Old Settlers Park
PARD - Parks and Recreation Department
RRFD - Round Rock Fire Department
RRISD - Round Rock Independent School District
RRPD - Round Rock Police Department
RTL - Right-turn lane
PSTC - Public Safety Training Center
TCEQ - Texas Commission on Environmental Quality
TCFP - Texas Commission on Law Enforcement
TCM - Tyler Content Manager
TPDES - Texas Pollutant Discharge Elimination System
TRAPS - Texas Recreation and Parks Society
UB - Utility Billing
WTP - Water
WWTP - Wastewater Treatment Plant
FY 2021-2022 Budget DRAFT - For d iscuss ion purposes on lyFY 2021-2022 Budget DRAFT - For d iscuss ion purposes on ly 205
H O M E R U L E C H A R T E R
ARTICLE 8 FINANCIAL ADMINISTRATION
Sec. 8.01. - Fiscal year.
The fiscal year of the City shall begin on the first day of each October and end on the last day of September of the succeeding year. All funds collected by the City during any fiscal year, including both current and delinquent revenues, shall belong to such fiscal year and, except for funds derived to pay interest and create a sinking fund on the bonded indebtedness of the City, may be applied to the payment of expenses incurred during such fiscal year, except as provided in this Charter. Any revenues uncollected at the end of any fiscal year, and any unencumbered funds actually on hand, shall become resources of the next succeeding fiscal year.
State Law reference— City fiscal year, V.T.C.A., Local Government Code § 101.022, V.T.C.A., Tax Code § 1.05.
Sec. 8.02. - Public record.
Copies of the budget adopted shall be public records and shall be made available to the public for inspection upon request.
State Law reference— Local Government Records Act, V.T.C.A., Local Government Code ch. 201.
Sec. 8.03. - Annual budget. (a) Content. The budget shall provide a complete financial plan of all City funds and activities and, except as required by law or this Charter, shall be in such form as the City Manager deems desirable or the City Council may require. A budget message explaining the budget both in fiscal terms and in terms of the work programs shall be submitted with the budget. It shall outline the proposed financial policies of the City for the ensuing fiscal year, describe the important features of the budget, indicate any major changes from the current year in financial policies, expenditures, and revenues, with reasons for such changes. It shall also summarize the City's debt position and include such other material as the City Manager deems desirable. The budget shall begin with a clear general summary of its contents and shall show in detail all estimated income, indicating the proposed property tax levy, and all proposed expenditures, including debt service, for the ensuing fiscal year. The proposed budget expenditures shall not exceed the total of estimated income. The budget shall be so arranged as to show comparative figures for actual and estimated income and expenditures of the current fiscal year and actual income and expenditures of the preceding fiscal year, compared to the estimate for the budgeted year. It shall include in separate sections:
(1) an itemized estimate of the expense of conducting each department, division, and office;
(2) reasons for proposed increases or decreases of such items of expenditure compared with the current fiscal year;
FY 2021-2022 Budget DRAFT - For d iscuss ion purposes on lyFY 2021-2022 Budget DRAFT - For d iscuss ion purposes on ly 206
H O M E R U L E C H A R T E R
(3) a separate schedule for each department, indicating tasks to be accomplished by the department during the year, and additional desirable tasks to be accomplished, if possible;
(4) a statement of the total probable income of the City from taxes for the period covered by the estimate;
(5) tax levies, rates, and collections for the preceding five years;
(6) an itemization of all anticipated revenue from sources other than the tax levy;
(7) the amount required for interest on the City's debts, for sinking fund and for maturing serial bonds;
(8) the total amount of outstanding City debts, with a schedule of maturities on bond issue;
(9) anticipated net surplus or deficit for the ensuring fiscal year of each utility owned or operated by the City and the proposed method of its disposition (subsidiary budgets for each such utility giving detailed income and expenditure information shall be attached as appendices to the budget);
(10) a Capital Improvement Program, which may be revised and extended each year to indicate capital improvements pending or in process of construction or acquisition, and shall include the following items:
i. a summary of proposed programs;
ii. a list of all capital improvements which are proposed to be undertaken during the five (5) fiscal years next ensuing, with appropriate supporting information as to the necessity for such improvements;
iii. cost estimates, method of financing and recommended time schedules for each such improvement; and
iv. the estimated annual cost of operating and maintaining the facilities to be constructed or acquired; and
(11) such other information as may be required by the City Council.
(b) Submission. On or before the first day of August of each year, the City Manager shall submit to the City Council a proposed budget and an accompanying message. The City Council shall review the proposed budget and revise same as deemed appropriate prior to general circulation for public hearing.
(c) Public Notice and Hearing. The City Council shall post in the City Hall a general summary of the proposed budget and a notice stating:
(1) the times and places where copies of the message and budget are available for inspection by the public; and
FY 2021-2022 Budget DRAFT - For d iscuss ion purposes on lyFY 2021-2022 Budget DRAFT - For d iscuss ion purposes on ly 207
H O M E R U L E C H A R T E R
(2) the time and place, not less than two (2) weeks after such publication, for a public hearing on the budget.
(d) Amendment Before Adoption. After the hearing, the City Council may adopt the budget with or without amendment. In amending the budget, it may add or increase programs or amounts and may delete or decrease any programs or amounts, except expenditures required by law or for debt service or for estimated cash deficit, provided that no amendment to the budget shall increase the authorized expenditures to an amount greater than the total of estimated income plus funds available from prior years.
(e) Adoption. The budget shall be finally adopted not later than the final day of the last month of the fiscal year. Adoption of the budget shall constitute a levy of the property tax therein proposed. Should the City Council take no final action on or prior to such day the budget, as submitted, together with its proposed tax levy, shall be deemed to have been finally adopted by the City Council. No budget shall be adopted, or appropriations made unless the total of estimated revenues, income and funds available shall be equal to or in excess of such budget or appropriations, except as otherwise provided in this Article.
(Charter amendment approved by voters January 20, 1996; May 10, 2008)
State Law reference— Municipal budget, V.T.C.A., Local Government Code ch. 102; when charter provisions control, V.T.C.A., Local Government Code § 102.011.
Sec. 8.04. - Administration of budget.
(a) Payments and Obligations Prohibited. No payment shall be made, or obligation incurred against any allotment or appropriation except in accordance with appropriations duly made and unless the City Manager or designee first certifies that there is a sufficient unencumbered balance in such allotment or appropriations and that sufficient funds therefrom are or will be available to cover the claim or meet the obligation when it becomes due and payable. Any authorization of payment or incurring of obligation in violation of the provisions of this Charter shall be void and any payment so made illegal. Such action shall be the cause for removal of any employee who knowingly authorized or made such payment or incurred such obligations, and such employee shall also be liable to the City for any amount so paid. However, this prohibition shall not be construed to prevent the making or authorizing of payments or making of contracts for capital improvements to be financed wholly or partly by the issuance of bonds, time warrants, certificates of indebtedness, or certificates of obligation, or to prevent the making of any contract or lease providing for payments beyond the end of the fiscal year, provided that such action is made or approved by ordinance.
(b) Financial Reports. The City Manager shall submit to the City Council at least quarterly the financial condition of the City by budget item, and budget estimate versus accruals for the fiscal year to date. The financial records of the City will be maintained on an accrual basis to support this type of financial management.
(Charter amendment approved by voters January 20, 1996; May 6, 2000; May 6, 2017)
FY 2021-2022 Budget DRAFT - For d iscuss ion purposes on lyFY 2021-2022 Budget DRAFT - For d iscuss ion purposes on ly 208
H O M E R U L E C H A R T E R
Sec. 8.05. - Emergency appropriations.
At any time in any fiscal year, the City Council may, pursuant to this section, make emergency appropriations to meet a pressing need for public expenditure, for other than regular or recurring requirements, to protect the public health, safety or welfare. Such appropriation shall be by ordinance adopted by the favorable votes of five (5) or more of the City Council members qualified and serving and shall be made only upon recommendation of the City Manager. The total amount of all emergency appropriations made in any fiscal year shall not exceed the amount allowed by state law.
(Charter amendment approved by voters January 20, 1996)
Sec. 8.06. - Borrowing to meet emergency appropriations. In the absence of unappropriated available revenues or other funds to meet emergency appropriations provided for under the preceding Section 8.05, the City Council may by resolution authorize the borrowing of money to meet such deficit as provided by law.
(Charter amendment approved by voters January 20, 1996)
Sec. 8.07. - Borrowing in anticipation of property taxes.
In any fiscal year, in anticipation of the collection of the ad valorem property tax for such year, whether levied or to be levied in such year, the City Council may by resolution authorize the borrowing of money, not to exceed in any fiscal year an amount equal to ten percent (10%) of the budget for that fiscal year. Such borrowing shall be by the issuance of negotiable notes of the City, each of which shall be designated, "Tax Anticipation Note for the Year ____________ " (stating the tax year). Such notes shall mature and be payable not later than the end of the fiscal year in which issued.
(Charter amendment approved by voters January 20, 1996)
Sec. 8.08. - Depository.
All monies received by any person, department or agency of the City for or in connection with affairs of the City shall be deposited promptly in the City depository or depositories, which shall be designated by the City Council in accordance with such regulations and subject to such requirements as to security for deposits and interest thereon as may be established by ordinance. All checks, vouchers, or warrants for the withdrawal of money from the City depositories shall be signed by the Mayor or City Manager and countersigned by an authorized designee, as approved by City Council ordinance. Provided, that the City Council, under such regulations and limitations as it may prescribe, may by ordinance authorize the use of machine-imprinted facsimile signatures of said Mayor and City Manager and authorized designee on such checks, vouchers and warrants.
(Charter amendment approved by voters January 20, 1996; May 15, 2004)
State Law reference— Depositories for municipal funds, V.T.C.A., Local Government Code ch. 105.
FY 2021-2022 Budget DRAFT - For d iscuss ion purposes on lyFY 2021-2022 Budget DRAFT - For d iscuss ion purposes on ly 209
H O M E R U L E C H A R T E R
Sec. 8.09. - Purchase procedure.
All purchases made and contracts executed by the City shall be pursuant to a requisition from the head of the office, department or agency whose appropriation will be charged and no contract order shall be binding upon the City unless the City Manager certifies that there is to the credit of such office, department or agency a sufficient unencumbered appropriation and allotment balance to pay for the supplies, materials, equipment or contractual services for which the contract or order is to be issued.
(Charter amendment approved by voters November 6, 1979, as amended by Charter amendment approved by voters April 5, 1986)
State Law reference— Competitive bidding, V.T.C.A., Local Government Code § 252.021 et seq.; exemptions, V.T.C.A., Local Government Code §§ 252.022, 252.023.
Sec. 8.10. - Independent audit.
At the close of each fiscal year, and at such other times as it may be deemed necessary, the Council shall cause an independent audit to be made of all accounts of the City by a certified public accountant. The certified public accountant so selected shall have no personal interest, directly or indirectly, in the financial affairs of the City or any of its elected officials. Upon completion of the audit, a copy of the audited annual financial report shall be placed in the public library and placed on file in the City Clerk's office as public record.
(Charter amendment approved by voters January 20, 1996; May 15, 2004; May 10, 2008; November 8, 2011; May 6, 2017)
State Law reference— Audit of municipal finances, V.T.C.A., Local Government Code ch. 103.
FY 2021-2022 Budget DRAFT - For d iscuss ion purposes on lyFY 2021-2022 Budget DRAFT - For d iscuss ion purposes on ly 210
F I N A N C I A L P O L I C I E S
Adopted August 27, 2020
2
PURPOSE
The City of Round Rock has an important responsibility to its citizens, taxpayers, ratepayers, and all customers to carefully account for public funds, to manage the City's finances wisely, and to plan for the adequate funding of services desired by the public. These policies implement and enhance the City Council’s strategic goal which states “The City of Round Rock is a financially sound city providing high value services.” To facilitate this responsibility, certain financial policies have been developed and implemented within the parameters established by provisions of the Texas Local Government Code and the City Charter. These policies, as itemized below, are adopted by the City Council annually and considered the basis for financial management, planning and budget preparation. These policies guide both the City of Round Rock and its component unit, the Round Rock Transportation and Economic Development Corporation (RRTEDC).
FUND STRUCTURE & BASIS OF ACCOUNTING All fund structures and accounting standards of the City of Round Rock are in compliance with generally accepted accounting principles for local governments as prescribed by the Governmental Accounting Standards Board (GASB) and other recognized professional standards.
GOVERNMENTAL FUNDS
Governmental funds revenues and expenditures are recognized on the modified accrual basis. Revenues are recognized in the accounting period in which they become available and measurable while expenditures are recognized in the accounting period in which the liability is incurred, if measurable. Because the appropriated budget is used as the basis for control and comparison of budgeted and actual amounts, the basis for preparing the budget is the same as the basis of accounting.
The governmental funds are used to account for general government operations and include the General Fund, Debt Service funds, Special Revenue funds, and Capital Projects funds. The City utilizes a full-cost approach to budgeting all of its services, which results in limited inter-fund transfers.
• General Fund
The General Fund is the Primary fund for core government services and is used to account for all resources not required to be accounted for in another fund and not otherwise devoted to specific activities. Most of the financial transactions for the City are reported in this fund. The services provided by the City are classified according to activity and presented as operating departments in the budget.
• Debt Service Funds
This fund type is used to account for resources used to service the principal and interest on long-term debt such as general obligation bonds, revenue bonds, certificates of obligation and tax-exempt leases classified as debt.
FY 2021-2022 Budget DRAFT - For d iscuss ion purposes on lyFY 2021-2022 Budget DRAFT - For d iscuss ion purposes on ly 211
F I N A N C I A L P O L I C I E S
3
• Capital Project Funds Capital Projects funds are used to account for resources restricted for the acquisition or development of major capital equipment and structures. Financing sources are usually provided by transfers from other funds, bond issue proceeds, or grants-in-aid. Capital projects are generally tracked on a project-length basis. The required financing is not appropriated on an annual basis (or any other period-length basis) but is approved at the outset of the project. The expected expenditures under the Community Investment Programs (called CIP) are presented as part of the overall budget adoption to accurately reflect the City’s total expected use of funds in any given budget year but these estimates are not considered binding appropriations.
• Special Revenue Funds
This fund type is used to account for the proceeds of specific revenue sources that are legally restricted to expenditures for specified purposes.
PROPRIETARY FUNDS
Proprietary fund revenues and expenses are recognized on the accrual basis. Revenues are recognized in the accounting period in which they are earned and become measurable while expenses are recognized in the period incurred, if measurable. The basis for preparing the budget is the same as the basis of accounting except for principal payments on long-term debt and capital outlay which are treated as budgeted expenses. Depreciation and compensates absences are not recognized as budgeted expenses.
Proprietary funds are used to account for the City's activities that are similar to commercial enterprise accounting. These funds include the Utility Fund and the Stormwater Fund.
• Utility Fund
The Utility Fund consists of utility administration, water and wastewater operations, billing and collections, environmental services, and utility fiscal support. It is the policy of the City that the water and wastewater operations be self-sufficient and not cross subsidize the other. Rates will be set to reflect cost of service by customer class where practical. The Utility Fund also accounts for the debt service and capital improvements of the utility system.
o Water - Water operations include water line maintenance, water systems
support, and the water treatment plant. o Wastewater - Wastewater operations include wastewater line maintenance,
wastewater systems support, and the wastewater treatment plant.
• Stormwater Fund The Stormwater Fund administers all aspects of the City’s Stormwater Drainage program including planning, engineering, programs, operations and maintenance associated with storm water drainage, floodplain management, and water quality management. The Drainage fund collects fees based on a property’s impact to the City’s drainage system. The fund also accounts for the debt service and capital improvements of the stormwater system.
FY 2021-2022 Budget DRAFT - For d iscuss ion purposes on lyFY 2021-2022 Budget DRAFT - For d iscuss ion purposes on ly 212
F I N A N C I A L P O L I C I E S
4
STRATEGIC PLANNING AND GOALS
City Council Strategic Plan The Council’s Strategic Plan consists of the long-term Vision (15 years), five-year Goals, and near-term Policy and Management priorities. The Vision, Goals, and Priorities are reviewed and updated by Council and staff annually and are amended and refined by the City Council at its annual Strategic Planning retreat.
Council Vision and Goals The Council has further defined the City’s Strategic Plan around six (6) Goals. These Goals become the City’s strategic direction for development and implementation of its master planning, capital improvement programs for infrastructure, long-term financial plans and annual budgets. The Goals may be reprioritized or refined from year to year, but generally stay consistent.
1. Financially Sound City Providing High Value Services 2. City Infrastructure: Today and for Tomorrow 3. ”The Sports Capital of Texas” for Tourism and Residents 4. Great Community to Live 5. Authentic Downtown – Exciting Community Destination 6. Sustainable Neighborhoods – Old and New
LONG TERM FINANCIAL PLANNING
A Five-Year Financial Forecast and Plan will be maintained and updated annually that will identify potential tax impacts, rate adjustments, and other factors that will enable or impede the implementation of the City’s Strategic Goals. Five-year plans will be created and updated for each of the City’s major operating funds, including:
• General Fund, including impacts to the M&O and Debt portions of the property tax rate • Utility Fund • Stormwater Fund • RRTEDC (also known as Type B) Fund • Hotel Occupancy Tax Fund • Sports Center Fund • Multi-Purpose Field Complex Fund • Golf Course Fund
The financial forecasts will assess long-term financial implications of current and proposed policies and programs and assist with the development of strategies to achieve the City’s goals.
ANNUAL BUDGET
Preparation The Charter (Section 8.03) requires that “the budget will provide a complete financial plan for all City funds and activities and, except as required by law or this Charter, shall be in such a form as the City Manager deems desirable or the City Council may require.” The budget shall be
FY 2021-2022 Budget DRAFT - For d iscuss ion purposes on lyFY 2021-2022 Budget DRAFT - For d iscuss ion purposes on ly 213
F I N A N C I A L P O L I C I E S
5
submitted on or before the first day of August of each year to the City Council.
Guiding Principles:
• The annual budget will be prepared to address Council Strategic Goals and direction. • Long-term financial needs identified in the five-year plans will be considered and
addressed when appropriate. • Current expenditures (operating and recurring capital) are to be funded with current, on-
going revenues.
Proposed Budget A proposed budget shall be prepared by the City Manager with participation from all of the City’s Department Directors within the provision of the Charter and the City Council’s strategic goals. A copy of the proposed budget will be available for citizen review at Round Rock City Hall and the public library.
Balanced Budget The goal of the City is to adopt and maintain a balanced operating budget using sustainable funding sources that are expected to continue to be available in subsequent fiscal years.
Revenues and Expenditures The annual budget is staff and Council’s best estimate of the revenues, expenditures, and available fund balances at the time of preparation. Therefore, transfers and amendments may be needed from time to time due to changing conditions.
Administrative allocations Allocations for the general support services to the Utilities Fund, Stormwater Fund, RRTEDC and any other operating funds will be reviewed, documented, and adjusted if necessary at least once every three years to assure reasonable cost of services is allocated to those funds.
Personnel The annual Budget will also include the approved number of full time equivalents (FTEs) for the City. Approval of budget is considered approval of the FTEs. City Manager may transfer and/or repurpose FTEs among departments and funds as needed to meet the needs of the community. If the transfer changes the total appropriations for any particular fund, then City Council approval is necessary.
In order to maintain effective staffing levels, the Police department may exceed total budgeted FTEs by 4.0 FTEs to accommodate planned departures and retirements in light of the long recruitment and training times required. The department must stay within appropriated budget for that fiscal year and receive advanced approval from the City Manager.
Fund Balance Balances in excess of authorized reserves will be used to fund the pay-as-you-go repair and maintenance programs, major capital projects and other one-time needs.
FY 2021-2022 Budget DRAFT - For d iscuss ion purposes on lyFY 2021-2022 Budget DRAFT - For d iscuss ion purposes on ly 214
F I N A N C I A L P O L I C I E S
6
Adoption Upon finalization of the budget proposal, the City Council will hold a public hearing, and subsequently adopt by Ordinance the final budget as amended. State law requires at least 60 percent of the members of the governing body to vote in favor of an ordinance setting a property tax rate that exceeds the no-new-revenue tax rate. In practical terms, that means five of the seven members must vote in favor of the tax rate. The budget shall be finally adopted not later than the final day of the last month of the fiscal year. The budget will be effective for the fiscal year beginning October 1st.
The Annual Budget document will be submitted annually to the Government Finance Officers Association (GFOA) for evaluation and consideration for the Distinguished Budget Presentation Award.
Reporting Summary financial reports will be presented to the City Council quarterly. These reports will be in a format appropriate to enable the City Council to understand the overall budget and financial status.
Budget Amendments The City will amend the budget at year end, if needed, for revenue-based expenditures that exceeded budgeted amounts due to increased revenues. The City will also amend the budget if necessary as part of the Mid-Year Review process if any known adjustments are needed and approved at that time. The Chief Financial Officer must certify availability of revenues or funding sources prior to amendment.
Emergency Appropriations The Charter (Section 8.05) allows for emergency appropriations “to meet a pressing need for public expenditure, for other than regular or recurring requirements, to protect the public health, safety or welfare.” An ordinance must be adopted by favorable votes of five (5) or more of the City Council members.
COMMUNITY INVESTMENT PROGRAM (CIP) BUDGET
The City’s goal is to maintain City facilities and infrastructure to provide services to the citizens within the community, meet growth related needs, and comply with all state and federal regulations.
Preparation The City will maintain and periodically update master plans to maintain and expand its infrastructure including, but not limited to: City Facilities, Stormwater, Parks and Recreation, Transportation, Water and Wastewater. The City annually updates a five-year CIP schedule. The capital budget will include all capital projects, capital resources, and estimated operational impacts. Capital projects are generally tracked on a project-length basis. The required financing is not appropriated on an annual basis but is approved at the outset of the project. The expected expenditures under the CIP schedule are presented as part of the overall budget adoption to accurately reflect the City’s total expected use of funds in any given budget year but these estimates are not considered binding appropriations in that year.
FY 2021-2022 Budget DRAFT - For d iscuss ion purposes on lyFY 2021-2022 Budget DRAFT - For d iscuss ion purposes on ly 215
F I N A N C I A L P O L I C I E S
7
Financing Programs When determining the financing options for CIP, the City will first evaluate the available funds in the Self Finance Construction funds. Where applicable, assessments, impact fees, pro rata charges, or other fees should be used when a specific developer can be identified as specifically benefitting from a particular project. Once other financing options have been considered, long-term debt financing will be explored to acquire major assets with expected lives equal to or exceeding the average life of the debt issue.
Short-term financing including Capital Leasing and other tax-supported obligations can be used to fund vehicles, computers, and other operating equipment provided the impact to the tax rate is minimal.
CAPITAL MAINTENANCE AND REPLACEMENT
The City recognizes that deferred maintenance increases future capital costs. Assessments are made annually as part of the budget preparation process to ensure that major repairs, replacements, and maintenance necessary to preserve the City’s capital investments are funded. To the extent that prior year excess fund balances are available, the City will annually fund allocations to the following:
• Fleet Maintenance and Replacement • Information Technology • Facilities Maintenance • Parks and Recreation • Public Safety Equipment
BUDGET CONTINGENCY PLAN
The City will take immediate corrective action at any time during the fiscal year if expenditure and revenue estimates are such that an operating deficit is projected at year end. Corrective actions in order of the precedence that will be explored are:
1. Reduce transfers to Self Finance Construction Funds for pay-as-you-go CIP 2. Deferral of capital purchases 3. Expenditure reductions 4. Hiring freezes 5. Freeze merit increases 6. Use of fund balance, including repair and maintenance funds 7. Increase fees 8. Lay-off employees
The use of fund balance, which is a one-time revenue source, may be used to fund an annual operating deficit only with a subsequent approval of a plan to replenish the fund balance if it is brought down below policy level.
FY 2021-2022 Budget DRAFT - For d iscuss ion purposes on lyFY 2021-2022 Budget DRAFT - For d iscuss ion purposes on ly 216
F I N A N C I A L P O L I C I E S
8
FUNDS, RESERVES AND DESIGNATIONS
The City of Round Rock will maintain budgeted minimum reserves in the ending working capital/fund balances of its operating and debt funds to provide a secure, healthy financial base for the City in the event of a natural disaster or other emergency and to maintain or enhance its credit worthiness. Funds will be used for purposes as designated by state law, charter and this policy.
General Fund
• Reserve In recognition of fund balance reserve best practices, the fund balance reserve in the General Fund shall be ninety (90) days or 25% of annual budgeted General Fund operating expenditures. {Staff comment: Beginning in 2018/19, the 25% target is achieved, therefore the transition wording is no long necessary} Staff will evaluate the financial stability of the General Fund revenues annually to ensure the reserve requirement remains adequate.
• Designation Concentration Risk account: For any single sales tax payer that represents more than 5% of the City’s net General Fund revenues, the city will designate a concentration risk fund at or above the City’s annual net exposure to that revenue source. If at any time a single tax payer drops below that threshold or no tax payer meets this threshold, this account may be gradually reduced and used for one-time expenditures.
Self Finance Construction Funds These designated funds support the City’s pay-as-you-go philosophy for repair and maintenance and major capital projects to reduce or eliminate the use of long-term debt where possible. The funding sources are year-end transfers from the respective fund using excess fund balance.
• General Self Finance Construction (GSFC) Transfers from the General Fund provides funding for the repairs and maintenance of fleet, facilities, parks, information technology, public safety equipment, one-time programs and general capital improvements.
• Utility Self Finance Construction (USFC) Transfers from the Utility fund provides funding for major capital improvements of the Utility System.
Utilities Fund
• Reserve Working capital reserves should be 33% or one hundred twenty (120) days of operating expenses and annual payments for long-term water contract costs.
• Coverage The City will maintain 1.35 times average annual debt service, above the bond covenant minimum requirement of 1.25 times average annual debt service.
Stormwater Fund
• Reserve Working capital reserves should be 25% or ninety (90) days of operating expenses, net of debt service requirements.
FY 2021-2022 Budget DRAFT - For d iscuss ion purposes on lyFY 2021-2022 Budget DRAFT - For d iscuss ion purposes on ly 217
F I N A N C I A L P O L I C I E S
9
• Coverage The City will maintain 1.35 times average annual debt service, above the bond covenant minimum requirement of 1.25 times average annual debt service.
Hotel Occupancy Tax (HOT) Fund
• Reserve Fund balance reserves should be 25% or ninety (90) days of operating expenditures, net of debt service requirements and other designations. Bond covenant also requires 1.40 times average annual debt service to be reserved.
• Designations o Capital Infrastructure
The City Council may designate available fund balance for the maintenance of assets considered part of the City’s “Sports Capital of Texas” strategic goal and to meet the statutory requirements for the use of these funds. These projects may include the city-owned Dell Diamond Triple A baseball stadium and conference center, the Round Rock Sports Center, and the Old Settlers Park Multi-Purpose Field Complex.
o Promotion of the Arts A minimum of five percent (5%) of HOT revenues, net of any rebates, is designated to fund the promotion of the Arts. The City will ensure that these funds are used to promote tourism as required by statute through an annual review of the use of the funds.
Round Rock Transportation and Economic Development Corporation (RRTEDC) (Type B)
• Allocation of Funds for Projects
A five-year project spending plan will be presented and adopted at least annually to ensure adequate funds are available for transportation, economic development and other allowed uses of Type B funds. This five-year plan will be reviewed by staff at least quarterly and updates will be presented to the Type B board as needed for transportation capital improvements programs (TCIP), economic incentive programs (EIP) and other legally allowable projects approved by the Type B board and ratified by Council.
• Reserve The RRTEDC shall maintain a minimum of $1 million or 33% of recurring operating type expenditures.
Sports Center
• Reserve Fund Balance reserves should be 25% or ninety (90) days of operating expenses, net debt service requirements and other designations.
• Designation
It is the goal of the City Council to establish a capital replacement account of $3 million to ensure the facility is maintained.
o Investment Reimbursement At such time as revenues are sufficient to meet operations, reserve and replacement funds, this fund is expected to repay the GSFC and HOT for initial investment in the Sports Center Facility.
FY 2021-2022 Budget DRAFT - For d iscuss ion purposes on lyFY 2021-2022 Budget DRAFT - For d iscuss ion purposes on ly 218
F I N A N C I A L P O L I C I E S
10
Multi-Purpose Field Complex • Reserve
Fund Balance reserves should be 25% or ninety (90) days of operating expenses. • Designation
A designation of $750,000 is established as a capital replacement account to ensure the facility is maintained.
• Funding Source Operating and debt principal and interest costs not covered by tournament and field rentals will be funded by transfers from the General Fund and HOT Fund at 50% from each fund.
Golf Course Fund • Reserve
It is the goal of the City Council to establish fund balance reserves of 25% or ninety (90) days of operating expenses.
• Designation A designation of $150,000 is established as a capital replacement account to ensure the facility is maintained.
REVENUES
The City will maintain a diverse and stable revenue system. In order to protect the City from revenue shortfalls and to maintain a stable level of service, revenues will be estimated realistically and conservatively taking into account the volatile nature of various revenue streams. The analysis will include probable economic changes and their impacts on revenues, historical collection rates, and trends. The benefits of a revenue source should exceed the cost of administration and collection of that revenue.
• Property Tax
All real and business personal property located within the City will be valued at 100% of the fair market value for any given year based on the current appraisal supplied by Williamson and Travis Central Appraisal Districts.
• Sales Tax
Sales tax revenue will be used to fund the recurring operations of the General Fund, the transportation improvements and economic development activities of the RRTEDC (Type B) fund, and one-time capital requirements in the General Self Finance Construction Fund. Sales tax revenue fluctuates due to changes in economic conditions and will be closely monitored to ensure the needs of the City are met.
The City’s goal is to have balanced and reliable on-going revenues for its General Fund operations without over-reliance on any single sales tax provider. Therefore, Dell sales tax receipts, net of rebate, are not to exceed 20% of budgeted sales tax revenues in the General Fund. Any funds in excess of expected or realized sales tax in excess of 20% will be budgeted and deposited in the General Self Finance Construction Fund for pay- as-you-go one time capital expenditures or projects.
• User Fees and Charges
For services associated with a user fee or charge, the direct and/or indirect costs of that service will be offset by a fee where possible. The City will review fees and charges no less than once every two years to ensure that fees provide adequate coverage for the cost of services. The City Council will determine how much of the cost of a service should be recovered by fees and charges.
FY 2021-2022 Budget DRAFT - For d iscuss ion purposes on lyFY 2021-2022 Budget DRAFT - For d iscuss ion purposes on ly 219
F I N A N C I A L P O L I C I E S
11
• Utility Rates
Rates will be reviewed periodically and adopted to generate sufficient revenues to fully cover operating expenses, meet debt coverage requirements and provide an adequate level of working capital. The utility revenues will be budgeted based on an average year’s rainfall/consumption. The rate analysis will anticipate neither drought nor wet conditions. Adjustments to the utility rates will be made based on revenue requirements over the five-year forecast for the Utility Fund. When financially feasible, a transfer from the Utility Fund will be budgeted to fund pay-as-you-go one-time capital expenditures or projects. It is the City’s goal to have growth pay for growth through impact fees and developer contributions where practical.
• Franchise Fees
Derived from major public utilities operating within the City, franchise fees are intended to reimburse the City for use of public streets and rights of way.
• Hotel Occupancy & Venue Taxes
Taxes imposed on hotel room nights allowed by statutory and charter authority. The use of these revenues are limited by state law to specific tourism promotion activities. The revenues will be estimated using actual properties and occupancy rates and prior year revenue collections.
• Non-Recurring Revenues
One-time or non-recurring revenues should not be used to finance current ongoing operations.
EXPENDITURES
• Appropriations & Transfers All expenses of the City will be made in accordance with the adopted annual budget or as legally amended. The legal level of control is at the fund level. The City Manager is authorized to transfer budgeted amounts among departments within any fund; however, any transfers or amendments that change the total expenditures of any fund must be approved by the City Council.
• Procurement
In accordance with state law and city ordinances, the City is to provide for the fair and equitable treatment of all persons involved in public purchasing with the City of Round Rock, to maximize the purchasing value of public funds in procurement, and to provide safeguards for maintaining a procurement system of quality and integrity while meeting all legally mandated federal, state, and local requirements. Competitive pricing will be sought in accordance with the following guidelines to ensure the best value is obtained through the procurement of products and services.
• Formal Approvals
The City Manager or City Council approval is required as detailed below. o City Manager Approval
▪ Any outside agreement/contract that requires a signature under $50,000.00;
o City Council Approval ▪ Any item the City Manager deems necessary to require City Council
approval;
FY 2021-2022 Budget DRAFT - For d iscuss ion purposes on lyFY 2021-2022 Budget DRAFT - For d iscuss ion purposes on ly 220
F I N A N C I A L P O L I C I E S
12
▪ Any outside agreement/contract over $50,000.00; ▪ All intergovernmental agreements
• Authorized Purchases
The adopted annual budget will include an Authorized Purchases list that considers certain planned purchases as approved in advance by Council. This policy allows the City Manager to approve items as listed without going back to Council under certain conditions.
o Routine equipment and technology purchases as included in the budget and the budget list are considered approved by Council, unless:
▪ Item is $200,000 or greater, unless the Council makes an exception, ▪ Item contains a contract requiring the Mayor’s signature; ▪ Purchase deviates from the original purchase as designated on the list; ▪ Cost exceeds the greater of 10% or $10,000; or ▪ Council has designated that item (s) come back for approval
o Capital projects and funding agreements will be presented to Council for consideration and approval.
CASH MANAGEMENT AND INVESTMENTS
The City Council has formally approved a separate Investment Policy for the City of Round Rock that meets the requirements of the Public Funds Investment Act (PFIA), Section 2256 of the Texas Local Government Code. This policy is reviewed annually by the City Council and applies to all financial assets held by the City and applies to all entities (component units) included in the City’s Comprehensive Annual Financial Report (CAFR) and/or managed by the City. The City will maintain cash management and investment policies and procedures will maintain the public trust through responsible actions as custodians of public funds.
Cash Management Philosophy The City shall maintain a comprehensive cash management program to include the effective collection of all accounts receivable, the prompt deposit of receipts to the City’s depository, the payment of obligations, and the prudent investment of idle funds in accordance with this policy.
Investment Objectives The City’s investment program will be conducted as to accomplish the following listed in priority order:
• Safety of the principal invested • Liquidity and availability of cash to pay obligations when due • Maximize earnings (yield) to the greatest extent possible consistent with the
City’s investment policy. DEBT
The City of Round Rock establishes the following policy concerning the issuance and management of debt. This policy is to improve the quality of decisions in relation to the City’s financing activities, provide a comprehensive view of the City’s long-term debt picture and make it easier for decision-makers to understand issues concerning debt issuance and management.
FY 2021-2022 Budget DRAFT - For d iscuss ion purposes on lyFY 2021-2022 Budget DRAFT - For d iscuss ion purposes on ly 221
F I N A N C I A L P O L I C I E S
13
It is the intent of this policy that the City’s debt be managed and monitored so as to enhance or maintain its credit rating with major ratings agencies. CONDITIONS OF DEBT ISSUANCE
Debt should be issued for the purpose of meeting the needs of the community through funding of capital projects and equipment but without constituting an unreasonable burden to taxpayers.
Long-term debt is only issued to finance the acquisition and/or construction of capital improvements. Additionally, only capital needs identified in the community investment program will be considered. Refunding bonds will only be issued if the present value of debt service savings exceeds three percent of the par value of the refunded bonds.
TYPES OF DEBT
• General Obligation Bonds
General Obligation Bonds may only be issued with a majority approval of a popular vote. The use of the proceeds from GO Bonds is limited to the acquisition or improvement of real property and other uses allowed by law and applicable bond ordinances. Libraries, parks and public safety facilities are all types of facilities that could be financed with GO Bonds. To the extent that property tax revenues are used to fund debt service, an increase to the property tax will be proposed.
• Certificate of Obligations
Certificate of Obligations may be used to fund capital improvements or equipment that are not otherwise funded by general obligation or revenue bonds. With CO bonds, the voters have an option to petition for an election on whether the certificates should be issued. There is a forty-five (45) day notice period before a city can pass an ordinance to issue the certificates giving time for citizen input and time to gather signatures for a petition to call an election. To the extent that property tax revenues are used to fund debt service, an increase to the property tax will be proposed.
• Enterprise Revenue Bonds
Enterprise Revenue Bonds finance facilities for a revenue producing enterprise and are payable from revenue sources within that enterprise. Municipal Water and Sewer and Solid Waste are examples of revenue producing enterprises within the City.
• Refunding Obligations
Pursuant to the Government Code and various other financing statutes applicable in particular situations, the City Council is authorized to provide for the issuance of bonds for the purpose of refunding any long-term obligation of the City. Absent any significant non-economic factors, a refunding should produce minimum net debt service savings (net of reserve fund earnings and other offsets) of at least 3% of the par value of the refunded bonds on a net present value basis, using the refunding issue’s True Interest Cost (TIC) as the discount rate, unless the Finance Department determines that a lower savings percentage is acceptable for issues or maturities with short maturity dates.
• Tax Anticipation Notes
Proceeds from Tax Anticipation Notes are used to fund projects whose source of payment is future tax revenues. These instruments have a term of one to three years
FY 2021-2022 Budget DRAFT - For d iscuss ion purposes on lyFY 2021-2022 Budget DRAFT - For d iscuss ion purposes on ly 222
F I N A N C I A L P O L I C I E S
14
and are for a specific purpose such as temporary financing for capital improvements, cash flow needs and major equipment leasing.
• Leases
Leases may be used to finance major capital purchases, other than infrastructure, including fleet, major system upgrades and large equipment purchases.
• Assessment Bonds
Proceeds from Assessment Bonds may be used to finance local public improvements, provided that said improvements benefit the parcels of land to be assessed. Local streets, street lights, landscaping, sidewalks and sanitary sewers are some examples of local improvements commonly financed by assessment bonds.
• Internal borrowing between City funds
The City can authorize use of existing long-term reserves as “loans” between funds. The borrowing fund will repay the loan at a rate consistent with current market conditions. The loan will be repaid within ten (10) years. The loan will be considered an investment of working capital reserves by the lending fund.
• Other Obligations
There may be special circumstances when other forms of debt are appropriate and may be evaluated on a case-by-case basis. Such other forms include, but are not limited to limited tax notes, non-enterprise revenue bonds, bond anticipation notes, grant anticipation notes and judgment or settlement obligation bonds.
RESTRICTION ON DEBT ISSUANCE
• The City of Round Rock will not use long-term debt to finance current operations or
normal maintenance. • Derivative products will not be used by the City. • Swaps will not be entered into without establishment of a Swap Policy. • Variable rate debt will not be entered into without establishment of a Variable Rate Debt
Policy. LIMITATIONS ON OUTSTANDING DEBT
There is no direct debt limitation in the City Charter or under State law. The City operates under a Home Rule Charter (Article XI, Section 5, Texas Constitution) approved by voters in August 1977 that limits maximum tax rate, for all City purposes to $2.50 per $100 assessed valuation. Administratively, the Attorney General of the State of Texas will permit allocation of $1.50 of the $2.50 maximum tax rate for general obligation debt service.
CHARACTERISTICS OF DEBT ISSUANCE
When the City finances capital projects by issuing bonds, it will pay back the bonds within standard terms that include the following:
• Term may be up to 30 years depending on cash flow assumptions, or useful life of asset
being financed.
FY 2021-2022 Budget DRAFT - For d iscuss ion purposes on lyFY 2021-2022 Budget DRAFT - For d iscuss ion purposes on ly 223
F I N A N C I A L P O L I C I E S
15
• Call provisions will be shortest possible optional call consistent with optimal pricing. • The City will seek level or declining debt repayment schedules and will avoid issuing
debt that provides for balloon principal payments reserved at the end of the term of the issue.
• The City will avoid variable-rate debt due to the potential volatility of such instruments. Therefore, the City will avoid the use of variable-rate debt for its general obligation bond issues.
• The Debt service program will be managed in conformity with applicable bond covenants.
Commercial insurance or other credit enhancements to the bond rating shall be considered when cost-effective.
DEBT ISSUANCE PROCESS
The City shall utilize the services of an independent, Municipal Securities Rulemaking Board- registered financial advisor on all debt financing. Although not required, the City may utilize an RFP-selected pool of underwriters to mitigate time constraints and reduce overhead costs to the City in procuring such services. Bond counsel will be used for each transaction.
The Finance Department shall review each debt issuance transaction on a case-by-case basis to determine the most appropriate method of sale.
• Competitive Sale
In a competitive sale, bids for the purchase of the bonds are opened at a specified place and time and are awarded to the underwriter (or syndicate) whose conforming bid represents the lowest true interest cost to the City (TIC). This method is most advantageous when the debt to be issued is less complex, the municipal bond market for high-grade credits is stable, and the sale of the City’s bonds is assured. o Bond sales shall be cancelable at any time prior to the time bids are to be
received. o Upon award to the bidder whose conforming bid represents the lowest true
interest cost, the City may restructure the bonds in accordance with the Official Notice of Sale. The City shall reserve the unfettered right to reject all bids or waive bid irregularities.
• Negotiated Sale
In a negotiated sale, the City chooses the initial buyer of the bonds in advance of the sale date. The initial buyer is usually an investment banking firm, or a syndicate of investment banking firms interested in reoffering the bonds to investors through an underwriting process. This type of sale allows the City to discuss different financing techniques with the underwriter in advance of the sale date. This method is most advantageous when the debt issue is complex, debt structuring flexibility is required (as would be the case in a bond refunding) or the municipal bond market is unstable or uncertain.
• Direct Purchase
In a direct purchase, the City may select a private purchaser willing to bid a below market rate or other preferential financing terms. Such transactions often allow debt to be issued more efficiently by eliminating the need for bond ratings and other
FY 2021-2022 Budget DRAFT - For d iscuss ion purposes on lyFY 2021-2022 Budget DRAFT - For d iscuss ion purposes on ly 224
F I N A N C I A L P O L I C I E S
16
associated issuance costs. Such financing will be analyzed on a case-by-case basis, depending primarily on rates prevailing in the market from time to time.
RATING AGENCY COMMUNICATION & DISCLOSURE
The City will seek to maintain and improve its current bond ratings so its borrowing costs are reduced to a minimum and its access to credit is preserved. In conjunction with the financial advisor, the City will open a line of communication with at least one of the rating agencies (Standard and Poor’s, Moody’s or Fitch) when issuing new bonds or refunding existing bonds to obtain an affirmed or upgraded rating.
Full disclosure of the City’s operations will be made to the bond rating agencies. The City staff, with the assistance of the financial advisors and bond counsel, will prepare the necessary materials for presentation to the rating agencies.
The City will adhere to the recommended disclosure guidelines as endorsed by the Public Securities Association, the Government Finance Officers Association, the Municipal Securities Rulemaking Board, the Government Accounting Standards Board, and the nationally recognized municipal securities information repository (NRMSIR) and any state information depository (SID) that is designated by the State of Texas and approved by the staff of the United States Securities and Exchange Commission (the SEC). SEC Rule 15c2-12 defines disclosure required by the SEC.
BOND REIMBURSEMENT RESOLUTIONS
The City may utilize bond reimbursements as a tool to manage its debt issues, due to arbitrage requirements and project timing. In so doing, the City uses its capital reserve “cash” to delay bond issues until such time when issuance is favorable and beneficial to the City.
The City Council may authorize a bond reimbursement resolution for General Capital projects that have a direct impact on the City’s ad valorem tax rate when the bonds will be issued within the term of the existing City Council. In the event of unexpected circumstances that delay the timing of projects, or market conditions that prohibit financially sound debt issuance, the approved project can be postponed and considered by a future council until circumstantial issues can be resolved.
The City Council may also authorize revenue bond reimbursements for approved utility and other self-supporting capital projects within legislative limits.
The total outstanding bond reimbursements may not exceed the total amount of the City’s reserve funds.
INVESTMENT OF BOND PROCEEDS
The City maintains in its Investment Policy document approved by the City Council, the strategy and policies for investing bond proceeds. The City’s Investment Policy complies, and will at all times comply, with the provisions of the Public Funds Investment Act, Chapter 2256, Texas Government Code, as amended. Interest on bond proceeds is restricted such that it may only be used to fund projects that have the same purpose as the purpose for which the bonds were
FY 2021-2022 Budget DRAFT - For d iscuss ion purposes on lyFY 2021-2022 Budget DRAFT - For d iscuss ion purposes on ly 225
F I N A N C I A L P O L I C I E S
17
originally issued. Construction proceeds are typically invested in short-term securities so that they are liquid. Interest & Sinking funds may be invested longer as they have to be maintained for the life of the issue.
FEDERAL REQUIREMENTS
The City will maintain written procedures to follow post issuance compliance rules, arbitrage rebate and other Federal requirements.
• Post issuance tax compliance rules will include records retention, arbitrage rebate, use
of proceeds, and • Continuing disclosure requirements under SEC Rule 15c2-12, MSRB standards, or as
may be required by bond covenants or related agreements. ECONOMIC DEVELOPMENT
The City will actively promote economic development and business retention with prescribed business focus areas to maintain and expand the long-term business, financial and employment base for the community. These efforts will be accomplished through a contract with the Chamber of Commerce and partnership with City staff, Council and local business leadership.
• An economic development plan or strategy will be developed and periodically reviewed
and updated as conditions change. • Financial incentive guidelines will be established and periodically reviewed. • Both economic impact and direct financial impact to the City will be evaluated and
considered for each incentive proposal. • Risks will be assessed as part of each proposed agreement and mitigated by
emphasizing performance-based programs and financial surety provisions where possible for any up front investments by the City or its partners.
Approved incentive agreements will be monitored for compliance with reporting of that compliance made to the City Manager at least annually.
ACCOUNTING, AUDITING AND FINANCIAL REPORTING
• Accounting The City is solely responsible for the recording and reporting of its financial affairs, both internally and externally. The Chief Financial Officer (CFO) is responsible for establishing the structure for the City’s Chart of Accounts and for assuring that procedures are in place to properly record financial transactions and report the City’s financial position.
• Audit of Accounts
In accordance with the City Charter, an independent audit of the City accounts will be performed every year. The auditor is retained by and is accountable to the City Council and will have no personal interest, directly or indirectly, in the financial affairs of the city or any of its officers. The auditing firm will serve for up to 5 years, at which time, the City will re-solicit proposals for these services if deemed necessary by the City Council. The
FY 2021-2022 Budget DRAFT - For d iscuss ion purposes on lyFY 2021-2022 Budget DRAFT - For d iscuss ion purposes on ly 226
F I N A N C I A L P O L I C I E S
18
actual need to rotate an auditing firm will be considered, but only at the discretion of the City Council in providing for the best financial oversight of the City.
• External Reporting
Upon completion and acceptance of the annual audit by the City’s auditors, the City will prepare a written Comprehensive Annual Financial Report (CAFR) which will be presented to the City Council within 180 calendar days of the City’s fiscal year end. The CAFR will be prepared in accordance with Generally Accepted Accounting Principles (GAAP) and will be presented annually to the Government Finance Officer Association (GFOA) for evaluation and consideration for the Certificate of Achievement in Financial Reporting.
• Receivables Policy
All receivables of the City are accounted for, aged and collected at the earliest opportunity. Delinquent receivables are processed expediently and collection agencies are utilized when appropriate.
• Payables Policy
All payables for incurred expenses are accounted for, aged and paid at the latest permissible time to maximize the City’s investment earning capability. All applicable discounts are taken.
INTERNAL CONTROLS
The Finance Department is responsible for designing appropriate controls for the departments and the departments are responsible for implementation. Inherent in these responsibilities is the recognition that the cost of the internal control should not exceed the benefits expected to be derived. The objective of internal controls is to provide management with reasonable, but not absolute, assurance that assets are safeguarded from fraud and are recorded properly.
• Department Policies
Where appropriate, this City will maintain appropriate policies to manage budgetary expenditures and control, procurements, personnel, and staffing management. These policies will be developed, updated, and approved by the City Manager as necessary.
• Written Procedures
Wherever possible, written procedures will be established and maintained by the CFO for all functions involving cash handling and/or accounting throughout the City.
• Internal Audit Program
An internal audit program will be maintained by the CFO to ensure compliance with City policies and procedures and to prevent the potential for fraud.
EMPLOYEES & COMPENSATION
Realizing the importance and contribution of employees in achieving the Strategic Goals of the City and to maintaining its high standards, the City’s policy as an employer is to attract and retain quality employees who provide excellent, friendly service to the Round Rock community
FY 2021-2022 Budget DRAFT - For d iscuss ion purposes on lyFY 2021-2022 Budget DRAFT - For d iscuss ion purposes on ly 227
F I N A N C I A L P O L I C I E S
19
in an effective and efficient manner. To meet the goal of a quality workforce, the City will maintain competitive compensation and benefit programs.
• The proposed budget will include an amount adequate to cover changes in market salaries, as well as funds for performance-based merit increases as determined annually by the City Manager.
• The City will maintain a competitive health insurance program, including considering new options and adjustments to provide quality benefits in a cost effective manner.
SELF INSURANCE & RISK MANAGEMENT
The City will maintain an internal service fund to account for the self-funded health insurance coverage for all City employees. In addition to the basic coverage provided to each employee, the employee may purchase dependent coverage through payroll deductions. Coverage will be financed by contributions from the City and employee payroll deductions.
The City will make a diligent effort to avoid or prevent loss of City assets and to reduce the City’s exposure to liability. All reasonable options will be investigated to finance risk exposure. If risk is retained, reserves will be established based on actuarial determinations.
FEDERAL AND STATE GRANTS
The City will seek State and Federal grants where applicable and practical. The benefits of the grant should exceed the cost of administration of the grant when possible. Council should approve the application of all grants that will have future funding requirements.
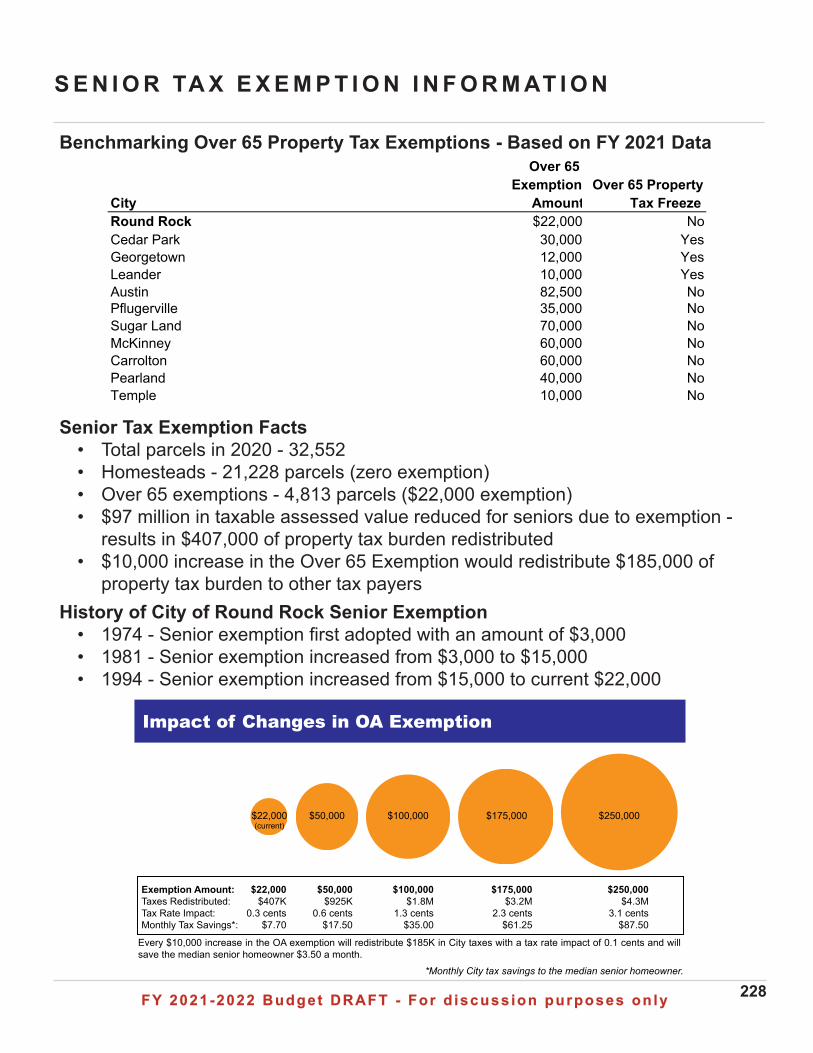
FY 2021-2022 Budget DRAFT - For d iscuss ion purposes on lyFY 2021-2022 Budget DRAFT - For d iscuss ion purposes on ly 228
S E N I O R TA X E X E M P T I O N I N F O R M AT I O N
City
Over 65 Exemption
AmountOver 65 Property
Tax FreezeRound Rock $22,000 NoCedar Park 30,000 YesGeorgetown 12,000 YesLeander 10,000 YesAustin 82,500 NoPflugerville 35,000 NoSugar Land 70,000 NoMcKinney 60,000 NoCarrolton 60,000 NoPearland 40,000 NoTemple 10,000 No
Benchmarking Over 65 Property Tax Exemptions - Based on FY 2021 Data
Senior Tax Exemption Facts• Total parcels in 2020 - 32,552• Homesteads - 21,228 parcels (zero exemption)• Over 65 exemptions - 4,813 parcels ($22,000 exemption)• $97 million in taxable assessed value reduced for seniors due to exemption -
results in $407,000 of property tax burden redistributed• $10,000 increase in the Over 65 Exemption would redistribute $185,000 of
property tax burden to other tax payersHistory of City of Round Rock Senior Exemption
• 1974 - Senior exemption first adopted with an amount of $3,000• 1981 - Senior exemption increased from $3,000 to $15,000• 1994 - Senior exemption increased from $15,000 to current $22,000
Impact of Changes in OA Exemption
$22,000(current)
$50,000 $100,000 $175,000 $250,000
Exemption Amount:Taxes Redistributed:Tax Rate Impact:Monthly Tax Savings*:
$22,000$407K
0.3 cents$7.70
$50,000$925K
0.6 cents$17.50
$100,000$1.8M
1.3 cents$35.00
$175,000$3.2M
2.3 cents$61.25
$250,000$4.3M
3.1 cents$87.50
Every $10,000 increase in the OA exemption will redistribute $185K in City taxes with a tax rate impact of 0.1 cents and will save the median senior homeowner $3.50 a month.
*Monthly City tax savings to the median senior homeowner.
FY 2021-2022 Budget DRAFT - For d iscuss ion purposes on lyFY 2021-2022 Budget DRAFT - For d iscuss ion purposes on ly 229
P R O P E R T Y TA X C A L C U L AT I O N W O R K S H E E TP R O P E R T Y TA X C A L C U L AT I O N W O R K S H E E T
• 2021 Tax Rate Calculation Worksheet..........................................................230
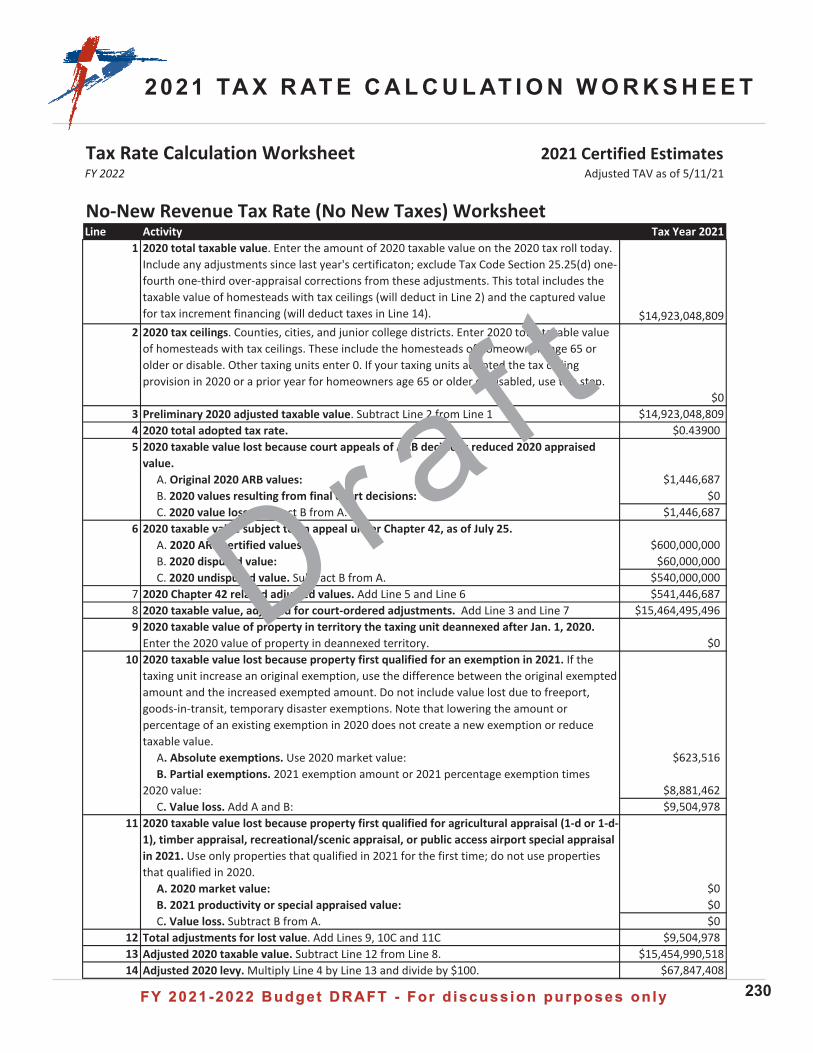
FY 2021-2022 Budget DRAFT - For d iscuss ion purposes on lyFY 2021-2022 Budget DRAFT - For d iscuss ion purposes on ly 230
Tax Rate Calculation Worksheet 2021 Certified EstimatesFY 2022 Adjusted TAV as of 5/11/21
No-New Revenue Tax Rate (No New Taxes) WorksheetLine Activity Tax Year 2021
1 2020 total taxable value. Enter the amount of 2020 taxable value on the 2020 tax roll today. Include any adjustments since last year's certificaton; exclude Tax Code Section 25.25(d) one-fourth one-third over-appraisal corrections from these adjustments. This total includes the taxable value of homesteads with tax ceilings (will deduct in Line 2) and the captured value for tax increment financing (will deduct taxes in Line 14). $14,923,048,809
2 2020 tax ceilings. Counties, cities, and junior college districts. Enter 2020 total taxable value of homesteads with tax ceilings. These include the homesteads of homeowners age 65 or older or disable. Other taxing units enter 0. If your taxing units adopted the tax ceiling provision in 2020 or a prior year for homeowners age 65 or older or disabled, use this step.
$03 Preliminary 2020 adjusted taxable value. Subtract Line 2 from Line 1 $14,923,048,8094 2020 total adopted tax rate. $0.439005 2020 taxable value lost because court appeals of ARB decisions reduced 2020 appraised
value.A. Original 2020 ARB values: $1,446,687B. 2020 values resulting from final court decisions: $0C. 2020 value loss. Subtract B from A. $1,446,687
6 2020 taxable value subject to an appeal under Chapter 42, as of July 25.A. 2020 ARB certified values: $600,000,000B. 2020 disputed value: $60,000,000C. 2020 undisputed value. Subtract B from A. $540,000,000
7 2020 Chapter 42 related adjusted values. Add Line 5 and Line 6 $541,446,6878 2020 taxable value, adjusted for court-ordered adjustments. Add Line 3 and Line 7 $15,464,495,4969 2020 taxable value of property in territory the taxing unit deannexed after Jan. 1, 2020.
Enter the 2020 value of property in deannexed territory. $010 2020 taxable value lost because property first qualified for an exemption in 2021. If the
taxing unit increase an original exemption, use the difference between the original exempted amount and the increased exempted amount. Do not include value lost due to freeport, goods-in-transit, temporary disaster exemptions. Note that lowering the amount or percentage of an existing exemption in 2020 does not create a new exemption or reduce taxable value.
A. Absolute exemptions. Use 2020 market value: $623,516B. Partial exemptions. 2021 exemption amount or 2021 percentage exemption times
2020 value: $8,881,462C. Value loss. Add A and B: $9,504,978
11 2020 taxable value lost because property first qualified for agricultural appraisal (1-d or 1-d-1), timber appraisal, recreational/scenic appraisal, or public access airport special appraisal in 2021. Use only properties that qualified in 2021 for the first time; do not use properties that qualified in 2020.
A. 2020 market value: $0B. 2021 productivity or special appraised value: $0C. Value loss. Subtract B from A. $0
12 Total adjustments for lost value. Add Lines 9, 10C and 11C $9,504,97813 Adjusted 2020 taxable value. Subtract Line 12 from Line 8. $15,454,990,51814 Adjusted 2020 levy. Multiply Line 4 by Line 13 and divide by $100. $67,847,408
D r af t
2021 TA X R AT E C A L C U L AT I O N W O R K S H E E T
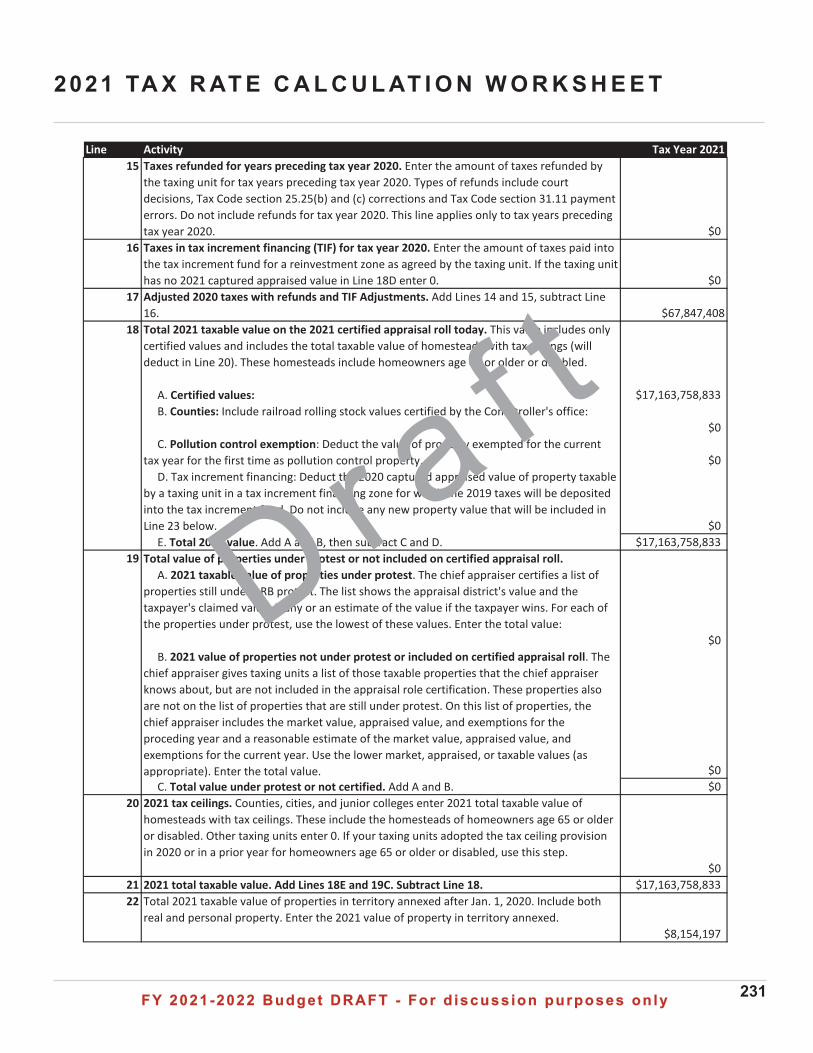
FY 2021-2022 Budget DRAFT - For d iscuss ion purposes on lyFY 2021-2022 Budget DRAFT - For d iscuss ion purposes on ly 231
Line Activity Tax Year 202115 Taxes refunded for years preceding tax year 2020. Enter the amount of taxes refunded by
the taxing unit for tax years preceding tax year 2020. Types of refunds include court decisions, Tax Code section 25.25(b) and (c) corrections and Tax Code section 31.11 payment errors. Do not include refunds for tax year 2020. This line applies only to tax years preceding tax year 2020. $0
16 Taxes in tax increment financing (TIF) for tax year 2020. Enter the amount of taxes paid into the tax increment fund for a reinvestment zone as agreed by the taxing unit. If the taxing unit has no 2021 captured appraised value in Line 18D enter 0. $0
17 Adjusted 2020 taxes with refunds and TIF Adjustments. Add Lines 14 and 15, subtract Line 16. $67,847,408
18 Total 2021 taxable value on the 2021 certified appraisal roll today. This value includes only certified values and includes the total taxable value of homesteads with tax ceilings (will deduct in Line 20). These homesteads include homeowners age 65 or older or disabled.
A. Certified values: $17,163,758,833B. Counties: Include railroad rolling stock values certified by the Comptroller's office:
$0C. Pollution control exemption: Deduct the value of property exempted for the current
tax year for the first time as pollution control property. $0D. Tax increment financing: Deduct the 2020 captured appraised value of property taxable
by a taxing unit in a tax increment financing zone for which the 2019 taxes will be deposited into the tax increment fund. Do not include any new property value that will be included in Line 23 below. $0
E. Total 2021 value. Add A and B, then subtract C and D. $17,163,758,83319 Total value of properties under protest or not included on certified appraisal roll.
A. 2021 taxable value of properties under protest. The chief appraiser certifies a list ofproperties still under ARB protest. The list shows the appraisal district's value and the taxpayer's claimed value, if any or an estimate of the value if the taxpayer wins. For each of the properties under protest, use the lowest of these values. Enter the total value:
$0B. 2021 value of properties not under protest or included on certified appraisal roll. The
chief appraiser gives taxing units a list of those taxable properties that the chief appraiser knows about, but are not included in the appraisal role certification. These properties also are not on the list of properties that are still under protest. On this list of properties, the chief appraiser includes the market value, appraised value, and exemptions for the proceding year and a reasonable estimate of the market value, appraised value, and exemptions for the current year. Use the lower market, appraised, or taxable values (as appropriate). Enter the total value. $0
C. Total value under protest or not certified. Add A and B. $020 2021 tax ceilings. Counties, cities, and junior colleges enter 2021 total taxable value of
homesteads with tax ceilings. These include the homesteads of homeowners age 65 or older or disabled. Other taxing units enter 0. If your taxing units adopted the tax ceiling provision in 2020 or in a prior year for homeowners age 65 or older or disabled, use this step.
$021 2021 total taxable value. Add Lines 18E and 19C. Subtract Line 18. $17,163,758,83322 Total 2021 taxable value of properties in territory annexed after Jan. 1, 2020. Include both
real and personal property. Enter the 2021 value of property in territory annexed.$8,154,197
D r af t
2021 TA X R AT E C A L C U L AT I O N W O R K S H E E T
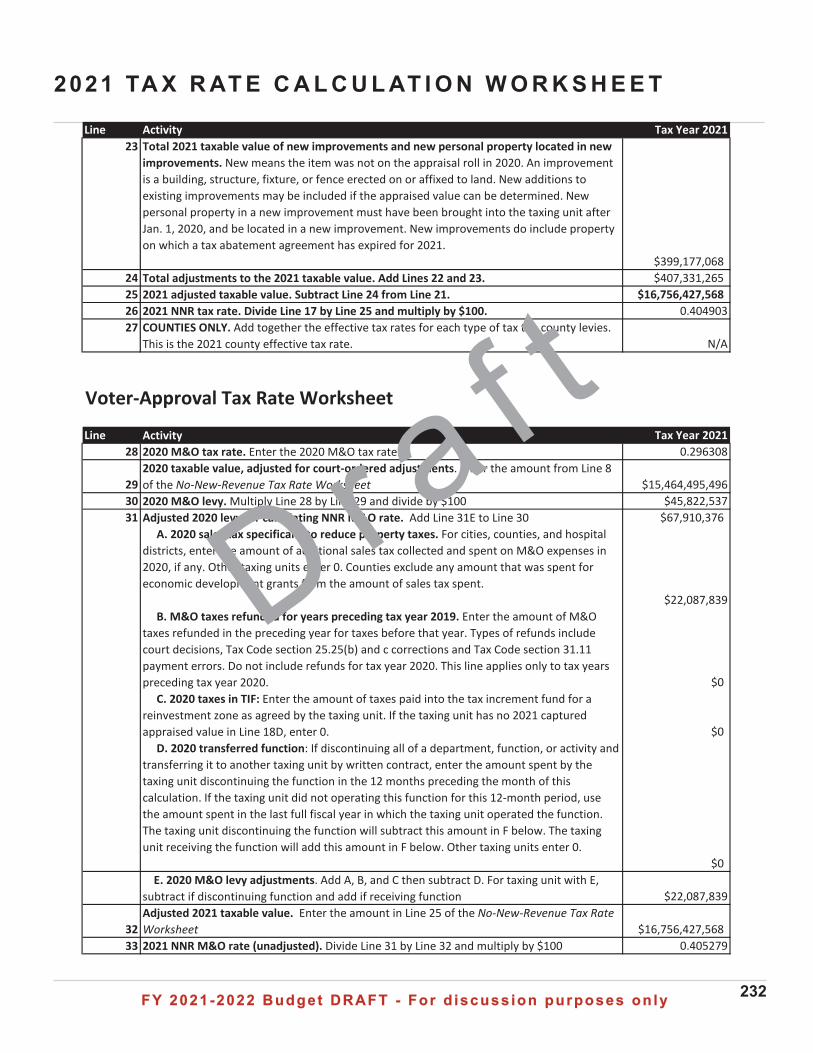
FY 2021-2022 Budget DRAFT - For d iscuss ion purposes on lyFY 2021-2022 Budget DRAFT - For d iscuss ion purposes on ly 232
Line Activity Tax Year 202123 Total 2021 taxable value of new improvements and new personal property located in new
improvements. New means the item was not on the appraisal roll in 2020. An improvement is a building, structure, fixture, or fence erected on or affixed to land. New additions to existing improvements may be included if the appraised value can be determined. New personal property in a new improvement must have been brought into the taxing unit after Jan. 1, 2020, and be located in a new improvement. New improvements do include property on which a tax abatement agreement has expired for 2021.
$399,177,06824 Total adjustments to the 2021 taxable value. Add Lines 22 and 23. $407,331,26525 2021 adjusted taxable value. Subtract Line 24 from Line 21. $16,756,427,56826 2021 NNR tax rate. Divide Line 17 by Line 25 and multiply by $100. 0.40490327 COUNTIES ONLY. Add together the effective tax rates for each type of tax the county levies.
This is the 2021 county effective tax rate. N/A
Voter-Approval Tax Rate Worksheet
Line Activity Tax Year 202128 2020 M&O tax rate. Enter the 2020 M&O tax rate. 0.296308
292020 taxable value, adjusted for court-ordered adjustments. Enter the amount from Line 8 of the No-New-Revenue Tax Rate Worksheet $15,464,495,496
30 2020 M&O levy. Multiply Line 28 by Line 29 and divide by $100 $45,822,53731 Adjusted 2020 levy for calculating NNR M&O rate. Add Line 31E to Line 30 $67,910,376
A. 2020 sales tax specifically to reduce property taxes. For cities, counties, and hospitaldistricts, enter the amount of additional sales tax collected and spent on M&O expenses in 2020, if any. Other taxing units enter 0. Counties exclude any amount that was spent for economic development grants from the amount of sales tax spent.
$22,087,839B. M&O taxes refunded for years preceding tax year 2019. Enter the amount of M&O
taxes refunded in the preceding year for taxes before that year. Types of refunds include court decisions, Tax Code section 25.25(b) and c corrections and Tax Code section 31.11 payment errors. Do not include refunds for tax year 2020. This line applies only to tax years preceding tax year 2020. $0
C. 2020 taxes in TIF: Enter the amount of taxes paid into the tax increment fund for areinvestment zone as agreed by the taxing unit. If the taxing unit has no 2021 captured appraised value in Line 18D, enter 0. $0
D. 2020 transferred function: If discontinuing all of a department, function, or activity andtransferring it to another taxing unit by written contract, enter the amount spent by the taxing unit discontinuing the function in the 12 months preceding the month of this calculation. If the taxing unit did not operating this function for this 12-month period, use the amount spent in the last full fiscal year in which the taxing unit operated the function. The taxing unit discontinuing the function will subtract this amount in F below. The taxing unit receiving the function will add this amount in F below. Other taxing units enter 0.
$0E. 2020 M&O levy adjustments. Add A, B, and C then subtract D. For taxing unit with E,
subtract if discontinuing function and add if receiving function $22,087,839
32Adjusted 2021 taxable value. Enter the amount in Line 25 of the No-New-Revenue Tax Rate Worksheet $16,756,427,568
33 2021 NNR M&O rate (unadjusted). Divide Line 31 by Line 32 and multiply by $100 0.405279
D r af t
2021 TA X R AT E C A L C U L AT I O N W O R K S H E E T
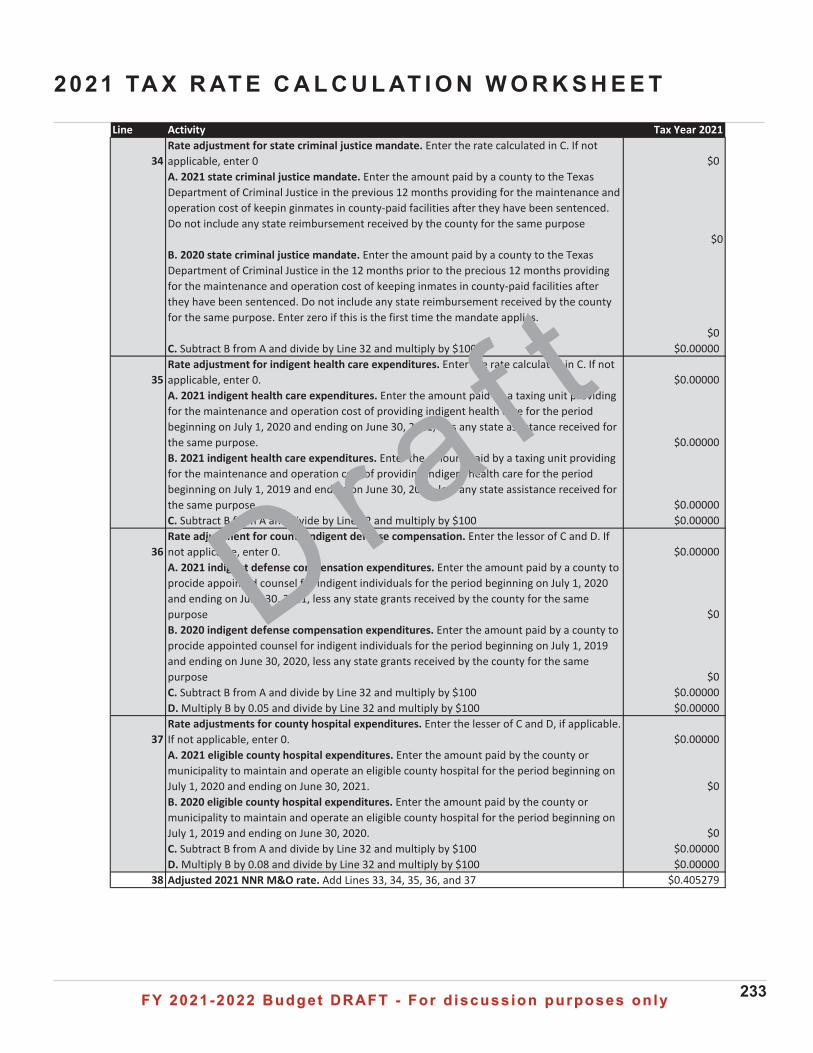
FY 2021-2022 Budget DRAFT - For d iscuss ion purposes on lyFY 2021-2022 Budget DRAFT - For d iscuss ion purposes on ly 233
Line Activity Tax Year 2021
34Rate adjustment for state criminal justice mandate. Enter the rate calculated in C. If not applicable, enter 0 $0A. 2021 state criminal justice mandate. Enter the amount paid by a county to the TexasDepartment of Criminal Justice in the previous 12 months providing for the maintenance andoperation cost of keepin ginmates in county-paid facilities after they have been sentenced.Do not include any state reimbursement received by the county for the same purpose
$0B. 2020 state criminal justice mandate. Enter the amount paid by a county to the TexasDepartment of Criminal Justice in the 12 months prior to the precious 12 months providingfor the maintenance and operation cost of keeping inmates in county-paid facilities afterthey have been sentenced. Do not include any state reimbursement received by the countyfor the same purpose. Enter zero if this is the first time the mandate applies.
$0C. Subtract B from A and divide by Line 32 and multiply by $100 $0.00000
35Rate adjustment for indigent health care expenditures. Enter the rate calculated in C. If not applicable, enter 0. $0.00000A. 2021 indigent health care expenditures. Enter the amount paid by a taxing unit providingfor the maintenance and operation cost of providing indigent health care for the periodbeginning on July 1, 2020 and ending on June 30, 2021, less any state assistance received forthe same purpose. $0.00000B. 2021 indigent health care expenditures. Enter the amount paid by a taxing unit providingfor the maintenance and operation cost of providing indigent health care for the periodbeginning on July 1, 2019 and ending on June 30, 2020, less any state assistance received forthe same purpose. $0.00000C. Subtract B from A and divide by Line 32 and multiply by $100 $0.00000
36Rate adjustment for county indigent defense compensation. Enter the lessor of C and D. If not applicable, enter 0. $0.00000A. 2021 indigent defense compensation expenditures. Enter the amount paid by a county toprocide appointed counsel for indigent individuals for the period beginning on July 1, 2020and ending on June 30, 2021, less any state grants received by the county for the samepurpose $0B. 2020 indigent defense compensation expenditures. Enter the amount paid by a county toprocide appointed counsel for indigent individuals for the period beginning on July 1, 2019and ending on June 30, 2020, less any state grants received by the county for the samepurpose $0C. Subtract B from A and divide by Line 32 and multiply by $100 $0.00000D. Multiply B by 0.05 and divide by Line 32 and multiply by $100 $0.00000
37Rate adjustments for county hospital expenditures. Enter the lesser of C and D, if applicable. If not applicable, enter 0. $0.00000A. 2021 eligible county hospital expenditures. Enter the amount paid by the county ormunicipality to maintain and operate an eligible county hospital for the period beginning onJuly 1, 2020 and ending on June 30, 2021. $0B. 2020 eligible county hospital expenditures. Enter the amount paid by the county ormunicipality to maintain and operate an eligible county hospital for the period beginning onJuly 1, 2019 and ending on June 30, 2020. $0C. Subtract B from A and divide by Line 32 and multiply by $100 $0.00000D. Multiply B by 0.08 and divide by Line 32 and multiply by $100 $0.00000
38 Adjusted 2021 NNR M&O rate. Add Lines 33, 34, 35, 36, and 37 $0.405279
D r af t
2021 TA X R AT E C A L C U L AT I O N W O R K S H E E T
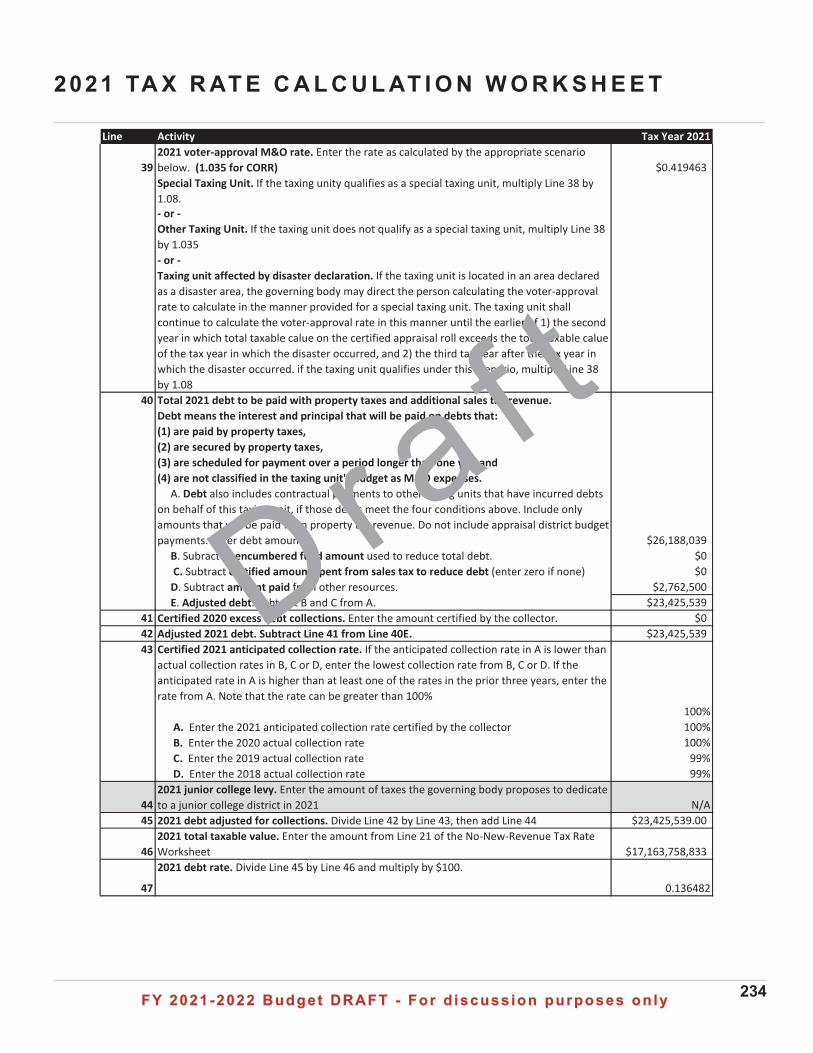
FY 2021-2022 Budget DRAFT - For d iscuss ion purposes on lyFY 2021-2022 Budget DRAFT - For d iscuss ion purposes on ly 234
Line Activity Tax Year 2021
392021 voter-approval M&O rate. Enter the rate as calculated by the appropriate scenario below. (1.035 for CORR) $0.419463Special Taxing Unit. If the taxing unity qualifies as a special taxing unit, multiply Line 38 by 1.08.- or -Other Taxing Unit. If the taxing unit does not qualify as a special taxing unit, multiply Line 38by 1.035- or -Taxing unit affected by disaster declaration. If the taxing unit is located in an area declaredas a disaster area, the governing body may direct the person calculating the voter-approvalrate to calculate in the manner provided for a special taxing unit. The taxing unit shallcontinue to calculate the voter-approval rate in this manner until the earlier of 1) the secondyear in which total taxable calue on the certified appraisal roll exceeds the total taxable calueof the tax year in which the disaster occurred, and 2) the third tax year after the tax year inwhich the disaster occurred. if the taxing unit qualifies under this scenario, multiply Line 38by 1.08
40 Total 2021 debt to be paid with property taxes and additional sales tax revenue.Debt means the interest and principal that will be paid on debts that:(1) are paid by property taxes,(2) are secured by property taxes,(3) are scheduled for payment over a period longer than one yar, and(4) are not classified in the taxing unit's budget as M&O expenses.
A. Debt also includes contractual payments to other taxing units that have incurred debtson behalf of this taxing unit, if those debts meet the four conditions above. Include only amounts that will be paid from property tax revenue. Do not include appraisal district budget payments. Enter debt amount $26,188,039
B. Subract unencumbered fund amount used to reduce total debt. $0C. Subtract certified amount spent from sales tax to reduce debt (enter zero if none) $0D. Subtract amount paid from other resources. $2,762,500E. Adjusted debt. Subtract B and C from A. $23,425,539
41 Certified 2020 excess debt collections. Enter the amount certified by the collector. $042 Adjusted 2021 debt. Subtract Line 41 from Line 40E. $23,425,53943 Certified 2021 anticipated collection rate. If the anticipated collection rate in A is lower than
actual collection rates in B, C or D, enter the lowest collection rate from B, C or D. If the anticipated rate in A is higher than at least one of the rates in the prior three years, enter the rate from A. Note that the rate can be greater than 100%
100%A. Enter the 2021 anticipated collection rate certified by the collector 100%B. Enter the 2020 actual collection rate 100%C. Enter the 2019 actual collection rate 99%D. Enter the 2018 actual collection rate 99%
442021 junior college levy. Enter the amount of taxes the governing body proposes to dedicate to a junior college district in 2021 N/A
45 2021 debt adjusted for collections. Divide Line 42 by Line 43, then add Line 44 $23,425,539.00
462021 total taxable value. Enter the amount from Line 21 of the No-New-Revenue Tax Rate Worksheet $17,163,758,833
47
2021 debt rate. Divide Line 45 by Line 46 and multiply by $100.
0.136482
D r af t
2021 TA X R AT E C A L C U L AT I O N W O R K S H E E T
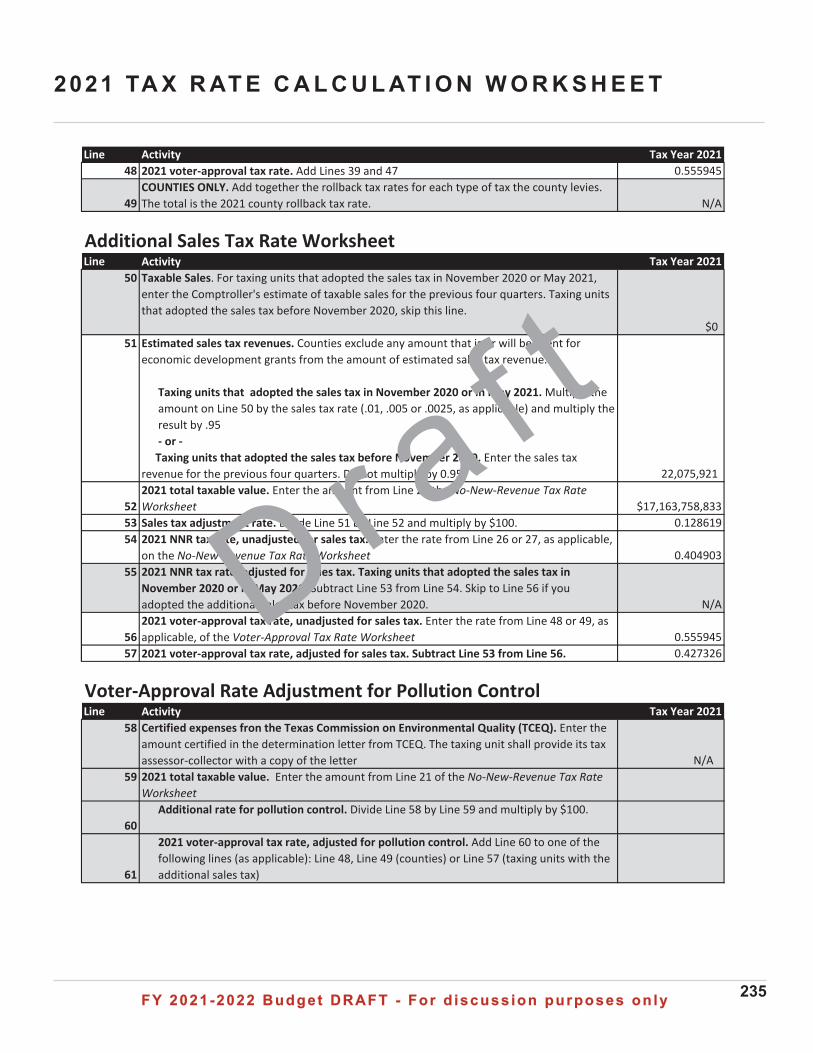
FY 2021-2022 Budget DRAFT - For d iscuss ion purposes on lyFY 2021-2022 Budget DRAFT - For d iscuss ion purposes on ly 235
Line Activity Tax Year 202148 2021 voter-approval tax rate. Add Lines 39 and 47 0.555945
49COUNTIES ONLY. Add together the rollback tax rates for each type of tax the county levies. The total is the 2021 county rollback tax rate. N/A
Additional Sales Tax Rate WorksheetLine Activity Tax Year 2021
50 Taxable Sales. For taxing units that adopted the sales tax in November 2020 or May 2021, enter the Comptroller's estimate of taxable sales for the previous four quarters. Taxing units that adopted the sales tax before November 2020, skip this line.
$051 Estimated sales tax revenues. Counties exclude any amount that is or will be spent for
economic development grants from the amount of estimated sales tax revenue.
Taxing units that adopted the sales tax in November 2020 or in May 2021. Multiply the amount on Line 50 by the sales tax rate (.01, .005 or .0025, as applicable) and multiply the result by .95- or -Taxing units that adopted the sales tax before November 2020. Enter the sales tax
revenue for the previous four quarters. Do not multiply by 0.95. 22,075,921
522021 total taxable value. Enter the amount from Line 21 the No-New-Revenue Tax Rate Worksheet $17,163,758,833
53 Sales tax adjustment rate. Divide Line 51 by Line 52 and multiply by $100. 0.12861954 2021 NNR tax rate, unadjusted for sales tax. Enter the rate from Line 26 or 27, as applicable,
on the No-New-Revenue Tax Rate Worksheet 0.40490355 2021 NNR tax rate, adjusted for sales tax. Taxing units that adopted the sales tax in
November 2020 or in May 2021. Subtract Line 53 from Line 54. Skip to Line 56 if you adopted the additional sales tax before November 2020. N/A
562021 voter-approval tax rate, unadjusted for sales tax. Enter the rate from Line 48 or 49, as applicable, of the Voter-Approval Tax Rate Worksheet 0.555945
57 2021 voter-approval tax rate, adjusted for sales tax. Subtract Line 53 from Line 56. 0.427326
Voter-Approval Rate Adjustment for Pollution ControlLine Activity Tax Year 2021
58 Certified expenses fron the Texas Commission on Environmental Quality (TCEQ). Enter the amount certified in the determination letter from TCEQ. The taxing unit shall provide its tax assessor-collector with a copy of the letter N/A
59 2021 total taxable value. Enter the amount from Line 21 of the No-New-Revenue Tax Rate Worksheet
60Additional rate for pollution control. Divide Line 58 by Line 59 and multiply by $100.
61
2021 voter-approval tax rate, adjusted for pollution control. Add Line 60 to one of the following lines (as applicable): Line 48, Line 49 (counties) or Line 57 (taxing units with the additional sales tax)
D r af t
2021 TA X R AT E C A L C U L AT I O N W O R K S H E E T
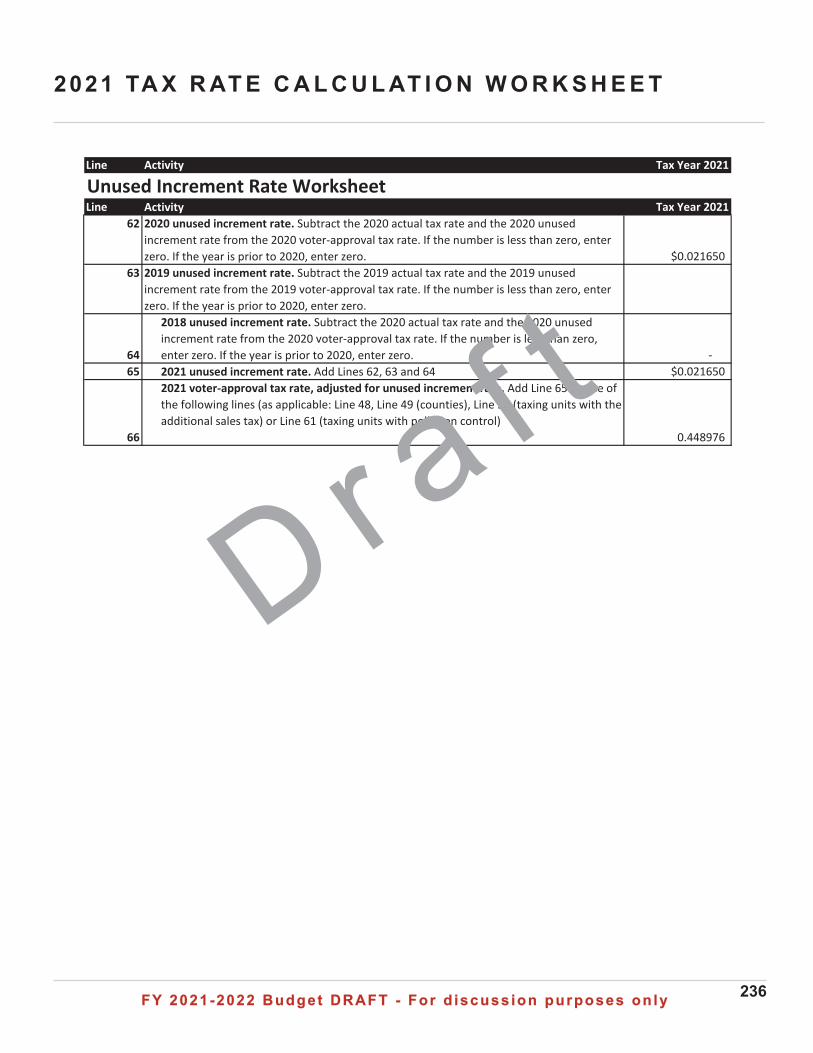
FY 2021-2022 Budget DRAFT - For d iscuss ion purposes on lyFY 2021-2022 Budget DRAFT - For d iscuss ion purposes on ly 236
2021 TA X R AT E C A L C U L AT I O N W O R K S H E E T
Line Activity Tax Year 2021
Unused Increment Rate WorksheetLine Activity Tax Year 2021
62 2020 unused increment rate. Subtract the 2020 actual tax rate and the 2020 unused increment rate from the 2020 voter-approval tax rate. If the number is less than zero, enter zero. If the year is prior to 2020, enter zero. $0.021650
63 2019 unused increment rate. Subtract the 2019 actual tax rate and the 2019 unused increment rate from the 2019 voter-approval tax rate. If the number is less than zero, enter zero. If the year is prior to 2020, enter zero.
64
2018 unused increment rate. Subtract the 2020 actual tax rate and the 2020 unused increment rate from the 2020 voter-approval tax rate. If the number is less than zero, enter zero. If the year is prior to 2020, enter zero. -
65 2021 unused increment rate. Add Lines 62, 63 and 64 $0.021650
66
2021 voter-approval tax rate, adjusted for unused increment rate. Add Line 65 to one of the following lines (as applicable: Line 48, Line 49 (counties), Line 57 (taxing units with the additional sales tax) or Line 61 (taxing units with pollution control)
0.448976
D r af t


![MAY 30, 2018 MINUTES · 7/1/2018 · packet and resubmit the RFP for Orange County and San Bernardino. (For: Councilmembers Eriksen [SA], Lagrand [SA], and Nutt [SA]. Against: Councilmembers](https://img.pdfslide.us/doc/110x75/5e830a61172daa075752b052/may-30-2018-minutes-712018-packet-and-resubmit-the-rfp-for-orange-county-and.jpg)