Embed Size (px)
Citation preview

IntroductionOne of the fastest growing areas of
chromatography today is two-dimensional
liquid chromatography (2D-LC, or LC × LC).
This burgeoning technique provides greater
overall separation efficiency (as judged by
peak capacity), because the peak capacity of
a 2D separation is theoretically the product
of the individual 1D peak capacities of the
two component dimensions [1]. Although
this ideal multiplicative peak capacity is
rarely achieved in practice, it is clear that 2D-
LC separations can provide greater resolving
power than 1D-LC alone. The theoretical
aspects of 2D-LC have been described
extensively in recent years, and these
reports should serve to convince the reader
of the value of these types of separations.
Applicable terms, a specific nomenclature,
and conventions have evolved with the
development of LC × LC, as described by
Marriott et al. [2] and Schoenmakers et al. [3].
Most 2D-LC experiments reported have
similar overall characteristics. Most
employ one or more detectors (e.g., UV
and mass spectrometry, MS) at the outlet
of the second dimension (2D) to monitor
the elution after both dimensions of
separation. The chromatographic profile
of the first dimension (1D) is reconstructed
from multiple slices, or samplings, across
each peak. Too few slices across a peak
results in ‘under-sampling’, which does
not adequately reproduce the profile of
the 1D. Thus, the time allowed for each 2D
separation is the 1D peak width divided
by the desired number of slices across the
peak (preferably at least 4). For example,
a 1 min peak width in the 1D would allow
four 15 s 2D separations across its peak
width. For this reason, 2D separations often
use very high flow rates to accomplish very
Blue Jacaranda Seed Oil Analysed Using Comprehensive Two Dimensional Liquid Chromatography with Quadruple Parallel Mass Spectrometryby William Craig Byrdwell, Food Composition and Methods Development Lab, Beltsville Human Nutrition Research Center, U.S.D.A., Agricultural Research Service, 10300 Baltimore Ave., Beltsville, MD 20705
Tel: 301-504-9357, Fax: 301-504-8314, Email: [email protected]
This report demonstrates comprehensive 2D-LC in which two mass spectrometers in parallel plus four other detectors (UV, FLD, CAD, and ELSD)
are used to monitor the first dimension (1D), while two more mass spectrometers in parallel plus a UV detector are used to monitor the second
dimension (2D). LC1MS2 x LC1MS2 = LC2MS4 was employed to identify and quantify tocopherols, diacylglycerols (DAGs), and triacylglycerols
(TAGs) in Jacaranda mimosifolia seed oil (JMSO) for the first time. Non-aqueous reversed-phase (NARP) HPLC in the 1D was coupled to ESI-MS and
APCI-MS employing selected ion monitoring and selected reaction monitoring (SRM). We found 591.0 ± 13.5 mg/g of a-tocopherol and 517.6 ± 7.8
mg/g of a-tocopherol in JMSO by SRM APCI-MS and report the percent relative compositions of DAGs and TAGs. We used a lab-made silver-ion
column for UHPLC in the 2D coupled to APPI-MS and ESI-MS to identify cis/trans isomers and regioisomers.
May / June 2018
Figure 1: Arrangement of instruments for LC1MS2 x LC1MS2 = LC2MS4 experiments. 1D: Agilent 1200
quaternary HPLC with UV, FLD, CAD, ELSD, HRAM ESI-MS, and APCI-MS; 2D: Agilent 1290 binary UHPLC
with UV, APPI-MS and ESI-MS. Controlled by wireless communication contact closure system (WCCCS).
56

57
rapid separations, which requires UHPLC
equipment to handle the elevated pressures
that accompany such high flow rates and
fast-scanning mass spectrometers to
obtain as many spectra across the narrow
peaks as possible. These 2D conditions
are coupled with low 1D flow rates (often
from conventional HPLC) to provide wider
peaks and low effluent solvent volumes to
minimise solvent incompatibility, column
overloading, and other issues.
We recently reported the first use of two
(dual parallel) mass spectrometers plus
four other detectors (a UV detector (UVD),
fluorescence detector (FLD), corona charged
aerosol detector (CAD), and an evaporative
light-scattering detector (ELSD)) for direct
detection of the 1D, combined with two
more (dual parallel) mass spectrometers plus
a UVD in the 2D, in what was described as an
LC1MS2 × LC1MS2 = LC2MS4 configuration
[4]. While not the first time that a detector
had been used to monitor the 1D in 2D-LC
[5], this was the first time dual parallel mass
spectrometry (DPMS) [6], or LC1MS2, was
used in the 1D plus four other detectors, as
well as being the first time DPMS was used
in the 2D (plus a UVD), for an additional
LC1MS2. Since the 1D was monitored
directly by six detectors, the peak profile did
not have to be reconstructed from the slices
across the 1D peaks, thereby bypassing the
problem of under-sampling. This approach
also allowed accurate quantification of
tocopherols using conventional calibration
curves, instead of relying on quantification
of ‘blobs’ in 2D chromatograms, which
is more problematic than quantification
by conventional 1D-LC [7]. The LC2MS4
experiments also allowed percentage relative
quantification of diacylglycerols (DAGs) and
triacylglycerols (TAGs) in Parinari curatellifolia
(African mobola plum). The use of high-
resolution accurate-mass orbitrap MS in the 1D also allowed identification of previously
unreported oxo-DAGs and oxo-TAGs.
That work is replicated and extended in
this report, in which the LC1MS2 × LC1MS2
arrangement of instruments is employed
for analysis of Jacaranda mimosifolia
(blue jacaranda) seed oil (JMSO), which
contains jacaric acid (Ja), a conjugated
polyunsaturated fatty acid, 8Z, 10E, 12Z
octadecatrienoic acid. We provide here
the first report of quantification of DAGs,
TAGs, and tocopherols in JMSO. In the 2D,
we employ a lab-made silver-ion UHPLC
column, which separates lipids based on
their degree of unsaturation, as well as
the location and type of unsaturation (cis
versus trans isomers, and differentiation of
regioisomers). Thus, isobaric TAG isomers
that coelute using NARP-HPLC and cannot
be distinguished using high-resolution
accurate-mass (HRAM)-MS in the 1D are
separated and quantified in the 2D.
ExperimentalSample preparation. Jacaranda mimosifolia
seeds were ordered from Sheffield’s Seed
Co. (Locke, NY, USA). ~500 mg were
ground and extracted using the chloroform/
methanol (MeOH) extraction method of
Folch et al. [8], with the specific details
provided in the supporting information
of our previous report [4] noting that the
KCl wash was 0.9%, not 0.1% KCl. The oily
residues averaged ~20% of starting weight.
Chromatographic analyses. The
arrangement of instruments is shown in
Figure 1. An Agilent Technologies (Santa
Clara, CA, USA) 1200 HPLC instrument
employing two reversed-phase columns in
series (Inertsil ODS-2, 25.0 cm x 4.6 mm, 5
μm particles), maintained at 10ºC, was used
for the 1D separation. A solvent system of
MeOH, ethanol (EtOH), acetonitrile (ACN),
and dichloromethane (DCM) was used to
accomplish the NARP HPLC separation,
using the gradients described previously
Figure 2: Partial chromatograms from A) ultraviolet (UV) diode array detector (DAD) at 297 nm and B)
fluorescence detector (FLD) at 330 nm emission for a 2.0 mg/mL fat-soluble vitamin standard solution.
Peaks: 1 – d-Tocopherol; 2 – Vitamin D2; 3 – Vitamin D3; 4 – g-Tocopherol; 5 – d6-a-Tocopherol + a-Tocopherol.
Table 1. Quantification of tocopherols in Jacaranda mimosifolia seed oil by APCI-MS and ESI-MS relative to
d6-a-tocopherol internal standard.
aExtracted ion chromatogram (EIC) from full scan m/z 200-2000. bEIC from targeted scan range m/z 300-750. cCoefficient of determination from APCI-MS SRM calibration lines.
a-Tocopherol ± SD g-Tocopherol ± SDAPCI-MS
SRM591.0 13.5 517.6 7.8
APCI-MS SIM
580.1 7.6 388.8 2.7
ESI-MS EIC1a
554.8 55.6 368.4 158.6
ESI-MS EIC2b
564.4 26.7 438.9 179.1
r2 = 0.9983c r2 = 0.9900

May / June 201858
[4], with 54 min runs for fat-soluble vitamin
(FSV) standards and 130 min runs for
JMSO samples, at 1 mL/min. A silver-ion
UHPLC column was made by loading an
ES Industries (West Berlin, NJ) Epic SCX
strong cation exchange column (10.0 cm ×
2.1 mm, 3 μm) with silver from AgNO3, as
already described [4]. The silver-ion column,
maintained at 10ºC, was used with a gradient
of 1% acetonitrile (ACN) in MeOH to 10%
ACN in MeOH, provided by an Agilent
Technologies 1290 binary UHPLC at 1 mL/
min, as recently described [4]. The fill time of
the two alternating 100 μL sample loops on
the Agilent G1170A switching valve was 1.86
min (based on the split flow of 53.67 mL/min),
with a modulation time of 1.91 min.
In the 1D, the effluent all went through
the Agilent Technologies UVD and FLD,
since these are non-destructive detectors,
and then to a splitter, where the flow was
split by a series of tees, where the flow to
each detector was dictated by the length
and internal diameter of the fused-silica
capillaries attached to the outlet of each
Figure 3: Calibration lines for alpha-tocopherol by atmospheric pressure chemical ionisation (APCI) mass
spectrometry (MS). A) Selected ion monitoring (SIM) at m/z 431.389, width 0.5 m/z; B) Selected reaction monitoring
(SRM) using m/z 431.389 → 165.149 transition.
Table 2: Triacylglycerol (TAG) percentage composition of Jacaranda mimosifolia extract determined by APCI-MS.
TAG RT % Comp. SD TAG RT % Comp. SDoxJaoxJaS 41.82 0.01% 0.00% LLA 85.63 0.20% 0.01%
oxJaJaL 44.01 0.01% 0.00% POP 86.14 0.05% 0.00%oxJaLL 45.61 0.04% 0.00% JaJaB 86.48 0.05% 0.00%
oxJaJaO 46.56 0.05% 0.00% SLP 86.91 0.32% 0.01%JaJaJa_iso 51.70 0.10% 0.00% JaOA 90.09 0.08% 0.00%
JaJaJa 52.92 0.84% 0.02% LL-21 90.28 0.02% 0.00%JaJaL 55.10 14.66% 0.31% JaLB 90.60 0.20% 0.01%LJaL 57.60 22.64% 0.18% JaSS 92.55 0.01% 0.00%
JaJaO 60.07 4.10% 0.02% OOS 93.49 0.11% 0.01%LLL 60.20 6.75% 0.12% OLA 94.06 0.08% 0.00%
JaJaP 61.18 0.32% 0.00% LLB 94.59 0.07% 0.00%OJaL 63.01 13.10% 0.32% JaJaLg 95.20 0.02% 0.00%JaLP 64.22 6.10% 0.07% SOP 95.53 0.09% 0.00%LLO 66.19 3.09% 0.06% PLA 96.12 0.12% 0.01%
JaJaG 66.52 0.06% 0.01% SSL 96.24 0.24% 0.01%LLP 67.52 2.29% 0.03% LL-23 98.77 0.01% 0.00%
JaJaS 68.40 0.49% 0.00% JaLLg 99.04 0.07% 0.00%OOJa 69.58 2.03% 0.03% OOA 102.00 0.01% 0.00%LJaG 69.83 0.93% 0.02% OLB 102.31 0.03% 0.00%JaOP 71.20 1.10% 0.01% LLLg 102.62 0.02% 0.00%JaLS 72.02 11.07% 0.14% SSO 103.93 0.06% 0.00%OOL 73.49 0.75% 0.02% POA 104.03 0.02% 0.00%LLG 73.56 0.14% 0.00% PLB 104.17 0.04% 0.00%POL 75.18 0.77% 0.02% SLA 104.33 0.06% 0.00%LLS 76.08 2.60% 0.07% OOB 108.64 0.01% 0.00%PPL 76.95 0.19% 0.01% OLLg 108.81 0.01% 0.00%
JaJaA 77.03 0.06% 0.00% POB 110.42 0.01% 0.00%JaOS 80.57 1.67% 0.06% SOA 110.44 0.01% 0.00%JaLA 81.29 0.82% 0.04% PLLg 110.54 0.02% 0.00%
JaJa-21 81.55 0.01% 0.00% SLB 110.59 0.03% 0.00%OOO 82.12 0.10% 0.00% SLLg 116.44 0.01% 0.00%JaSP 82.54 0.01% 0.00% SOB 116.50 0.01% 0.00%OOP 84.27 0.11% 0.00%SLO 84.94 0.87% 0.03% Sum 99.96%

59
tee. One branch of a tee went to a corona
charged aerosol detector (CAD), one branch
went to an evaporative light-scattering
detector (ELSD), one branch went to a
Thermo Fisher Scientific (San Jose, CA,
USA) HRAM Orbitrap mass spectrometer
operated in electrospray ionisation (ESI)
mode with ammonium formate (via syringe
pump) as electrolyte, one branch went to a
Thermo Fisher Scientific TSQ Vantage EMR
mass spectrometer in atmospheric pressure
chemical ionisation (APCI) mode, and one
branch went to the G1170A switching valve
to the 2D.
In the 2D, the effluent all went through the
UVD and then to a single tee, where the flow
was equally split to a TSQ Quantum Access
Max operated in atmospheric pressure
photoionisation (APPI) MS mode with acetone
supplied as dopant (via syringe pump) and to
an LCQ Deca XP ion trap mass spectrometer
in ESI-MS mode with ammonium formate (via
syringe pump) as electrolyte.
Specific acquisition parameters for all five LC
detectors plus the four mass spectrometers
have been provided elsewhere [4].
Acquisition on all instruments was
coordinated by the wireless communication
contact closure system (WCCCS) described
in detail previously [9].
Fatty acid abbreviations (carbon
number:double bonds). M: myristic acid,
14:0; P: palmitic acid, 16:0; Po: palmitoleic
acid, 16:1; Ja: jacaric acid, 8Z,10E,12Z-18:3;
L: linoleic acid, 9Z,12Z-18:2; O: oleic acid,
9Z-18:1; S: stearic acid, 18:0; A: arachidic
acid, 20:0; G: gadoleic acid, 20:1; B: behenic
acid, 22:0; Lg: lignoceric acid, 24:0.
Results and DiscussionTocopherols. Figure 2 shows partial UV and
FLD chromatograms (22-36 min) of a 2.0
μg/mL standard solution obtained from
the 1D separation. These demonstrate that
vitamin D3 and gamma tocopherol were
overlapped using UV detection, whereas
the FLD (an older version borrowed for test
purposes) was more specific for tocopherols.
Based on these data, we have purchased
and installed a newer, more sensitive
FLD that will be used for quantification of
tocopherols in the future. Because of partial
coelution of vitamin D3 and g-tocopherol
and the coelution of a-tocopherol and
d6-a-tocopherol, quantification of FSV by
UVD is not presented. Instead, selected ion
monitoring (SIM) APCI-MS and selected
reaction monitoring (SRM) APCI-MS were
used for quantification of FSVs, shown
in Table 1, since these MS modes easily
differentiated overlapped FSVs by mass
and were much more sensitive than the
older FLD. Extracted ion chromatograms
(EICs) from ESI-MS full scan (m/z 200-
2000) and targeted scan ranges (m/z
300-750) were also used for quantification
of tocopherols for comparison, although
the %RSDs using untargeted ESI-MS of
un-derivatised tocopherols were too high
for reliable quantification. Of course, SRM
is the most specific approach, and is not as
susceptible to any coincident background or
interfering ions like SIM and EICs are, so it
is considered the most reliable approach for
quantification.
Figure 3 shows the SIM and SRM APCI-
MS chromatograms and calibration curves
for a-tocopherol ([M+H]+ = m/z 431.389
calc., with SRM → m/z 165.149) in JMSO.
These two tocopherols can also be seen
in extracted ion chromatograms in Figures
4C (APCI-MS) and 5C (ESI-MS). The time-
segmented SIM chromatogram shown in
Figure 4C was used for the quantification
in Figure 3A, using d6-a-tocopherol as the
DAG RT % Comp. SD 2/1
oxJaO 20.40 0.08% 0.00% 0.64
oxJaP 26.62 0.06% 0.01% 0.98
JaJa 29.70 2.31% 0.09% 0.43
LJa 34.50 22.73% 0.20% 0.80
LL 37.57 31.58% 0.82% 0.54
OJa 38.67 3.44% 0.18% 0.61
OL 39.76 16.56% 0.49% 0.36
PL 39.93 6.83% 0.25% 0.22
OO 41.71 3.83% 0.08% 0.32
OP 41.96 2.12% 0.05% 0.32
SL 42.49 8.13% 0.09% 0.29
OS 44.91 2.34% 0.06% 0.27
Sum 100.00%
Table 3. Diacylglycerol (DAG) percentage composition of Jacaranda mimosifolia extract determined by APCI-MS.
Figure 4: Chromatograms and mass spectra of Jacaranda mimosifolia seed oil by atmospheric pressure
chemical ionisation (APCI) mass spectrometry (MS). A) Total ion current chromatogram (TIC) of all MS and MS/
MS scans; B) TIC of full-range MS scans; C) TIC of time-segmented SIM for fat-soluble vitamins (FSV) – Peak 1.
g-tocopherol, 2. a-tocopherol; D) 1. MS mass spectrum of JaJaL (calc. [M+H]+ = m/z 875.7), 2. MS/MS spectrum
of m/z 875.7 calc., 3. MS/MS spectrum of [JaJa]+ = m/z 595.5 calc.; E) 1. MS mass spectrum of LJaL (calc. [M+H]+
= m/z 877.7), 2. MS/MS spectrum of m/z 877.7 calc., 3. MS/MS spectrum of [JaL]+ = m/z 597.5 calc.

May / June 201860
internal standard (m/z 437.427 calc.).
Both SIM and SRM APCI-MS produced
calibration lines with good linearity for
a-tocopherol, having coefficients of
determination (r2) > 0.99. The selected SRM
transitions were highly specific for target
tocopherols (especially when combined
with the chromatographic retention times)
and unambiguously demonstrated their
presence in JMSO. SRM results indicated
that JMSO contained 591.0 ± 13.5 mg/g
a-tocopherol and 517.6 ± 7.8 mg/g
a-tocopherol.
g-tocopherol gave both [M]+· (m/z 416.365
calculated) and [M+H]+ (m/z 417.373
calc.) ions by APCI-MS, which were both
monitored by SIM. It was interesting that
g-tocopherol showed a greater ‘first set
effect’, in which the SIM produced higher
values for the first set of standards in the
sequence, which ran before the first sample.
The sample gradient runs, which include the
separation of TAGs, are longer and include
an ACN/DCM gradient. This effect seems
to be related to the previously mentioned
accumulation of an ACN polymerisation
product (‘blob’) on the tip of the corona
needle [10]. After the first set of samples
ran in triplicate, the remaining four sets of
standards gave good linearity by SIM.
TAG RT % Comp. SD TAG RT % Comp. SDoxJaoxJaS 41.88 0.00% 0.00% SLO 85.15 0.78% 0.02%
oxJaJaL 44.06 0.02% 0.00% LLA 85.80 0.18% 0.01%oxJaLL 45.71 0.06% 0.00% POP 86.22 0.03% 0.00%
oxJaJaO 46.62 0.07% 0.00% JaJaB 86.55 0.04% 0.00%oxJaLO 48.25 0.20% 0.01% SLP 87.01 0.28% 0.01%
JaJaJa_iso 51.79 0.10% 0.00% JaOA 90.22 0.07% 0.00%JaJaJa 52.97 0.99% 0.03% LL-21 90.32 0.01% 0.00%JaJaL 55.20 13.81% 0.39% JaLB 90.79 0.14% 0.00%LJaL 57.67 21.42% 0.63% JaSS 92.72 0.01% 0.00%
JaJaO 60.17 4.19% 0.14% OOS 93.56 0.07% 0.00%LLL 60.39 7.54% 0.33% OLA 94.22 0.06% 0.00%
JaJaP 61.29 0.26% 0.01% LLB 94.71 0.05% 0.00%OJaL 63.03 11.82% 0.71% JaJaLg 95.33 0.01% 0.00%JaLP 64.37 6.57% 0.29% SOP 95.81 0.05% 0.00%LLO 66.28 3.82% 0.14% PLA 96.26 0.17% 0.00%
JaJaG 66.63 0.05% 0.01% SSL 96.26 0.21% 0.01%LLP 67.58 2.39% 0.18% LL-23 98.94 0.01% 0.00%
JaJaS 68.50 0.47% 0.03% JaLLg 99.15 0.04% 0.00%OOJa 69.62 2.47% 0.08% OOA 101.99 0.01% 0.00%LJaG 69.94 1.04% 0.05% OLB 102.49 0.02% 0.00%JaOP 71.35 1.17% 0.05% LLLg 102.80 0.01% 0.00%JaLS 72.22 11.38% 0.50% SSO 104.08 0.04% 0.00%PPJa 73.26 0.01% 0.00% POA 104.08 0.03% 0.00%OOL 73.57 0.71% 0.05% PLB 104.39 0.04% 0.00%LLG 73.77 0.13% 0.01% SLA 104.41 0.05% 0.00%POL 75.35 0.66% 0.04% OOB 108.77 0.00% 0.00%LLS 76.13 2.89% 0.01% OLLg 109.03 0.01% 0.00%PPL 77.09 0.15% 0.00% POB 110.60 0.01% 0.00%
JaJaA 77.07 0.06% 0.00% SOA 110.60 0.01% 0.00%JaOS 80.65 2.04% 0.07% PLLg 110.73 0.02% 0.00%JaLA 81.44 0.84% 0.07% SLB 110.73 0.02% 0.00%
JaJa-21 81.85 0.00% 0.00% PLCe 116.57 0.01% 0.00%OOO 82.34 0.06% 0.00% SLLg 116.59 0.01% 0.00%JaSP 83.16 0.02% 0.00% SOB 116.52 0.00% 0.00%OOP 84.21 0.07% 0.00% Sum 99.97%
Figure 5: Chromatograms and mass spectra of Jacaranda mimosifolia seed oil by electrospray ionisation (ESI)
mass spectrometry (MS). A) Total ion current chromatogram (TIC) of all MS and MS/MS scans; B) TIC of full-range
MS scans; C) Extracted ion chromatogram of masses for fat-soluble vitamins (FSV) – Peak 1. g-tocopherol, 2.
a-tocopherol; D) 1. MS mass spectrum of JaJaL (calc. [M+NH4]+ = m/z 892.739), 2. MS/MS spectrum of m/z 892.739
calc., 3. MS/MS spectrum of [JaJa]+ = m/z 595.473 calc.; E) 1. MS mass spectrum of LJaL (calc. [M+NH4]+ = m/z
894.755), 2. MS/MS spectrum of m/z 894.755 calc., 3. MS/MS spectrum of [JaL]+ = m/z 597.488 calc.
Table 4: Triacylglycerol (TAG) percentage composition of Jacaranda mimosifolia extract determined by ESI-MS.

61
Diacylglycerols (DAGs) and Triacylglycerols
(TAGs). Analysis of DAGs and TAGs
was straightforward, with Figures 4 and
5 representing the total ion current
chromatograms (TICs) and mass spectra
from APCI-MS and ESI-MS mass
spectrometers, respectively, that were used
to monitor the 1D of the 2D-LC separation.
APCI-MS full-range scans (Figures 4D1, 4E1),
data-dependent acquisition (DDA) MS/
MS scans (Figures 4D2, 4E2), [DAG]+ scans
(m/z 400-750 with 40 V up-front CID), and
MS/MS of [DAG]+ (Figures 4D3, 4E3) were
used in addition to the targeted analysis of
FSV using time-segmented SIM (Figure 4C)
and SRM discussed above. For ESI-MS on
the HRAM orbitrap™ instrument, full scans
(Figures 5D1, 5E1) were followed by DDA
MS/MS (Figure 5D2, 5E2), then DDA MS/MS
(Figure 5D3, 5E3) of [DAG]+ scans (m/z 350-
750) that used 80 V up-front CID to enhance
[DAG]+ formation, and finally negative ion
full scans (not shown).
Relative quantification of TAGs and DAGs
was based on summation of the protonated
molecule ions, [M+H]+, for APCI-MS, or
ammonium adducts, [M+NH4]+, by ESI-
MS, combined with the diacylglycerol-like
fragment ions, [DAG]+, formed by losses
of fatty acyl chains, [M+H-RCOOH]+.
Since DAGs and TAGs differ by sites of
unsaturation, which are 2 Da, the 1 x 13C
isotopic peaks were included with the
[M+H]+, [M+NH4]+, and [DAG]+ peaks to
provide more signal for quantification,
without loss of specificity, as previously
demonstrated [11]. The TAG composition
by APCI-MS is given in Table 2 and the
DAG composition is given in Table 3. The
corresponding compositions by ESI-MS are
given in Tables 4 and 5, respectively. As was
the case with our recent report on Parinari
curatellifolia TAGs, the JMSO samples
contained small amounts of oxo-TAGs
and oxo-DAGs, which were conclusively
identified by HRAM orbitrap™ ESI-MS,
although the amounts here were less than
those in parinari seed oil. The exact nature
of the oxo-TAGs requires additional analysis,
such as using NMR, such as was recently
demonstrated for analysis of hydroxyl-group
containing TAGs in cocoa beans [12].
Four TAGs (LJaL, JaJaL, OJaL, and JaLS)
accounted for > 60% of TAG molecular
species. The amount of DAGs in Table 3
determined by APCI-MS constituted only
0.80% of the total integrated area, while
DAGs by ESI-MS in Table 5 represented
0.97% of the integrated area. To the best of
our knowledge, these tables represent the
first report of the DAG and TAG compositions
of Jacaranda mimosifolia seed oil.
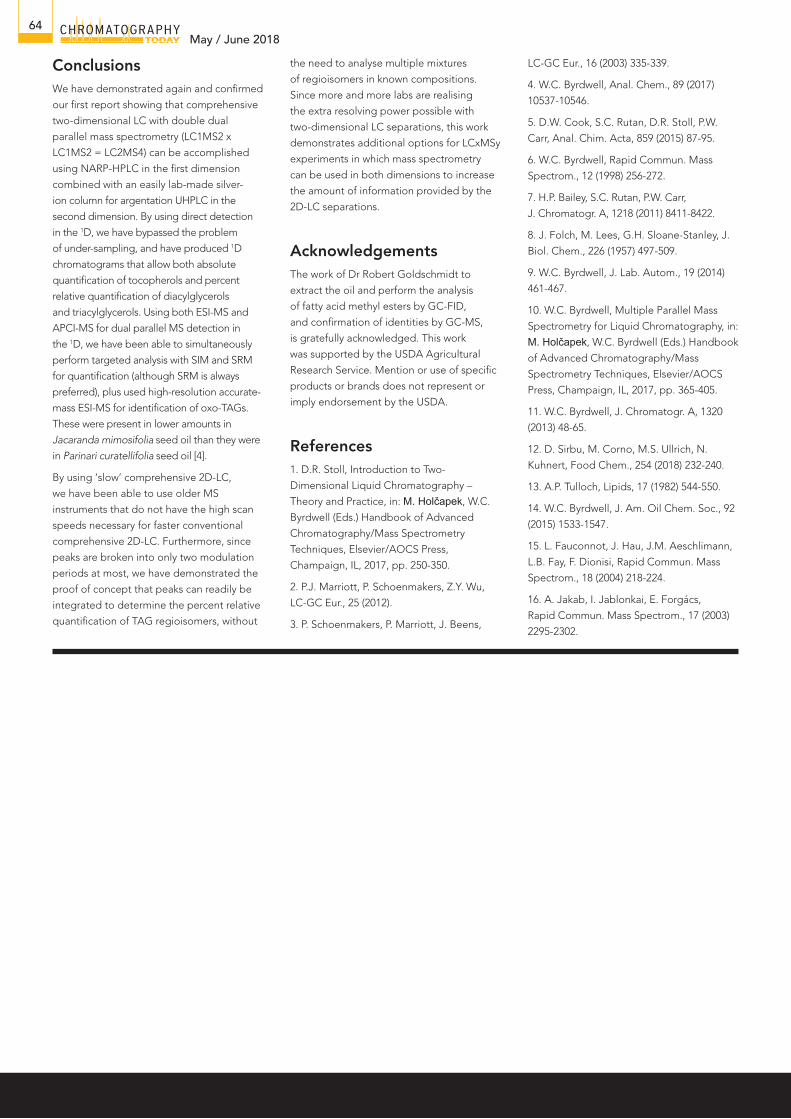
Fatty Acid Composition. The FA
compositions calculated from the DAG
and TAG compositions are given in Table
6 for comparison of the FA composition
determined by MS to that determined
by calibrated GC-FID. There was good
agreement between the MS results and the
FID (converted from weight % to mole %)
results. For APCI-MS results, there was less
than 4.1% error for each of the six FA present
at >0.4% and by ESI-MS there was less than
3.9% error for the FAs present at >0.4%.
These results were in surprisingly good
agreement to the partial FA composition
determined by 13C NMR [13], listed in
Table 6, although all saturated FA were
determined as a group using that technique.
Table 6 represents the most complete FA
composition for JMSO reported to date.
Table 5. Diacylglycerol (DAG) percentage composition of Jacaranda mimosifolia extract determined by ESI-MS.
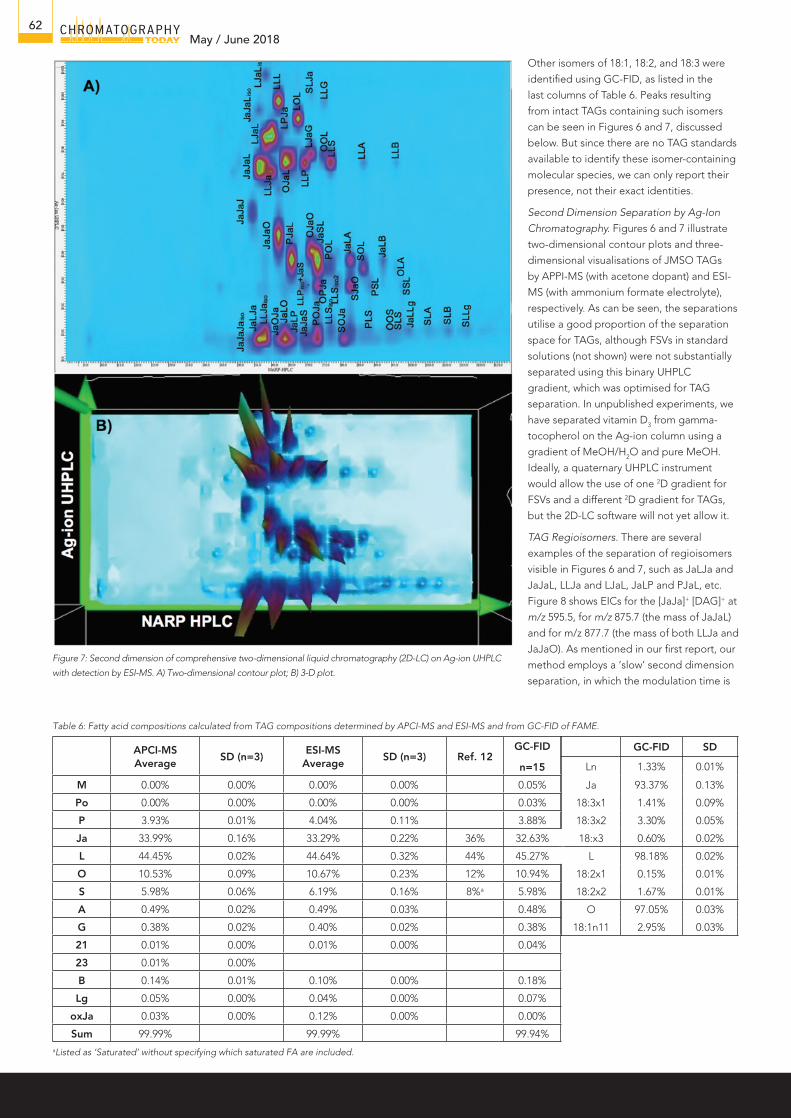
Figure 6: Second dimension of comprehensive two-dimensional liquid chromatography (2D-LC) on Ag-ion UHPLC
with detection by APPI-MS. A) Two-dimensional contour plot; B) 3-D plot.
DAG RT % Comp. SD 2/1
JaJa 29.84 3.11% 0.06% 0.42
LJa 34.60 23.89% 0.42% 0.57LL 37.67 31.29% 0.72% 0.51
OJa 38.72 3.83% 0.08% 0.56OL 39.86 15.38% 0.33% 0.44PL 40.00 6.44% 0.10% 0.35OO 41.81 4.74% 0.22% 0.16OP 42.02 1.88% 0.05% 0.33SL 42.57 7.77% 0.23% 0.40OS 45.01 1.67% 0.03% 0.38
Sum 100.00%
May / June 201862
Other isomers of 18:1, 18:2, and 18:3 were
identified using GC-FID, as listed in the
last columns of Table 6. Peaks resulting
from intact TAGs containing such isomers
can be seen in Figures 6 and 7, discussed
below. But since there are no TAG standards
available to identify these isomer-containing
molecular species, we can only report their
presence, not their exact identities.
Second Dimension Separation by Ag-Ion
Chromatography. Figures 6 and 7 illustrate
two-dimensional contour plots and three-
dimensional visualisations of JMSO TAGs
by APPI-MS (with acetone dopant) and ESI-
MS (with ammonium formate electrolyte),
respectively. As can be seen, the separations
utilise a good proportion of the separation
space for TAGs, although FSVs in standard
solutions (not shown) were not substantially
separated using this binary UHPLC
gradient, which was optimised for TAG
separation. In unpublished experiments, we
have separated vitamin D3 from gamma-
tocopherol on the Ag-ion column using a
gradient of MeOH/H2O and pure MeOH.
Ideally, a quaternary UHPLC instrument
would allow the use of one 2D gradient for
FSVs and a different 2D gradient for TAGs,
but the 2D-LC software will not yet allow it.
TAG Regioisomers. There are several
examples of the separation of regioisomers
visible in Figures 6 and 7, such as JaLJa and
JaJaL, LLJa and LJaL, JaLP and PJaL, etc.
Figure 8 shows EICs for the [JaJa]+ [DAG]+ at
m/z 595.5, for m/z 875.7 (the mass of JaJaL)
and for m/z 877.7 (the mass of both LLJa and
JaJaO). As mentioned in our first report, our
method employs a ‘slow’ second dimension
separation, in which the modulation time is
Figure 7: Second dimension of comprehensive two-dimensional liquid chromatography (2D-LC) on Ag-ion UHPLC
with detection by ESI-MS. A) Two-dimensional contour plot; B) 3-D plot.
APCI-MS Average
SD (n=3)ESI-MS
AverageSD (n=3) Ref. 12
GC-FID
n=15
M 0.00% 0.00% 0.00% 0.00% 0.05%
Po 0.00% 0.00% 0.00% 0.00% 0.03%
P 3.93% 0.01% 4.04% 0.11% 3.88%
Ja 33.99% 0.16% 33.29% 0.22% 36% 32.63%
L 44.45% 0.02% 44.64% 0.32% 44% 45.27%
O 10.53% 0.09% 10.67% 0.23% 12% 10.94%
S 5.98% 0.06% 6.19% 0.16% 8%a 5.98%
A 0.49% 0.02% 0.49% 0.03% 0.48%
G 0.38% 0.02% 0.40% 0.02% 0.38%
21 0.01% 0.00% 0.01% 0.00% 0.04%
23 0.01% 0.00%
B 0.14% 0.01% 0.10% 0.00% 0.18%
Lg 0.05% 0.00% 0.04% 0.00% 0.07%
oxJa 0.03% 0.00% 0.12% 0.00% 0.00%
Sum 99.99% 99.99% 99.94%
Table 6: Fatty acid compositions calculated from TAG compositions determined by APCI-MS and ESI-MS and from GC-FID of FAME.
aListed as ‘Saturated’ without specifying which saturated FA are included.
GC-FID SD
Ln 1.33% 0.01%
Ja 93.37% 0.13%
18:3x1 1.41% 0.09%
18:3x2 3.30% 0.05%
18:x3 0.60% 0.02%
L 98.18% 0.02%
18:2x1 0.15% 0.01%
18:2x2 1.67% 0.01%
O 97.05% 0.03%
18:1n11 2.95% 0.03%

63
long compared to the peak width. Instead
of having multiple modulations across each
peak to minimise under-sampling and then
having to reconstruct the 1D from the 2D
profiles, we bypass the problem of under-
sampling altogether by directly detecting
the 1D in detail, as described in the sections
above. Therefore, many peaks elute within
a single modulation period, and only some
peaks are split into two modulation periods
when the valve switches in the middle of a 1D
peak. This greatly simplifies the appearance
of 2D chromatograms and makes
quantification of regioisomers much easier.
For instance, In Figure 8C JaLJa eluted early
in the modulation period, followed by the
majority of JaJaL, with the second portion
of JaJaL eluted in the following modulation
period. The average APPI-MS spectra across
these peaks are seen in Figures 8E-8G.
The areas of these peaks (Figures 8B+C)
were integrated and it was found that the
JaLJa peak represented 26.5% ± 1.1%
(n=3) of the total area for this TAG (JaLJa +
(JaJaL & LJaJa)), while JaJaL (which is not
differentiated from its enantiomer LJaJa)
represented 73.5% of the molecular species.
These proportions are not dramatically
different from the statistically-expected ratio
of 33%/67%. On the other hand, peaks in
chromatograms such as Figure 8D indicated
that JaOJa represented only 6.5% ± 0.1%
(n=3) of the integrated area, meaning that
JaJaO (+OJaJa) represented 93.5% of the
regioisomer integrated area.
The physical separation of regioisomers
means that they can be quantified without
relying on the ratios of fragments in APCI-
MS spectra or ESI-MS spectra, with the latter
providing slightly less reliable results [14]
using that approach than the former. These
chromatograms and percentages demonstrate
the proof of concept for regioisomer
identification using Ag-ion UHPLC as the 2D
in a 2D-LC system. Further work should be
done using mixtures of pure regioisomers
for comparison of the percentages obtained
by chromatographic separation to those
obtained using a calibration curve approach
from the ratios of [DAG]+ ions in mass spectra
[15, 16]. The ability of a single chromatogram
to elucidate and quantify the regioisomer
compositions of TAGs represents a time-
saving advantage over running multiple
mixtures to construct a calibration line prior to
regioisomer quantification.
Figure 8: Second dimension separation of Jacaranda mimosifolia by Ag-ion UHPLC-APPI-MS. A) Total ion current chromatogram (TIC); B) m/z 595.5, [JaJa]+; C) m/z 875.7;
D) m/z 877.7; E) peak #1 - JaLJa; F) peak #2 – JaJaL, part 1; G) peak #3 – JaJaL, part 2; H) peak #4 – LJaL, part 1; I) peak #5 – LJaL, part 2; J) JaJaO. Green lines indicate
approximate 2D modulation times at 1.91 min intervals.
May / June 201864
ConclusionsWe have demonstrated again and confirmed
our first report showing that comprehensive
two-dimensional LC with double dual
parallel mass spectrometry (LC1MS2 x
LC1MS2 = LC2MS4) can be accomplished
using NARP-HPLC in the first dimension
combined with an easily lab-made silver-
ion column for argentation UHPLC in the
second dimension. By using direct detection
in the 1D, we have bypassed the problem
of under-sampling, and have produced 1D
chromatograms that allow both absolute
quantification of tocopherols and percent
relative quantification of diacylglycerols
and triacylglycerols. Using both ESI-MS and
APCI-MS for dual parallel MS detection in
the 1D, we have been able to simultaneously
perform targeted analysis with SIM and SRM
for quantification (although SRM is always
preferred), plus used high-resolution accurate-
mass ESI-MS for identification of oxo-TAGs.
These were present in lower amounts in
Jacaranda mimosifolia seed oil than they were
in Parinari curatellifolia seed oil [4].
By using ‘slow’ comprehensive 2D-LC,
we have been able to use older MS
instruments that do not have the high scan
speeds necessary for faster conventional
comprehensive 2D-LC. Furthermore, since
peaks are broken into only two modulation
periods at most, we have demonstrated the
proof of concept that peaks can readily be
integrated to determine the percent relative
quantification of TAG regioisomers, without
the need to analyse multiple mixtures
of regioisomers in known compositions.
Since more and more labs are realising
the extra resolving power possible with
two-dimensional LC separations, this work
demonstrates additional options for LCxMSy
experiments in which mass spectrometry
can be used in both dimensions to increase
the amount of information provided by the
2D-LC separations.
AcknowledgementsThe work of Dr Robert Goldschmidt to
extract the oil and perform the analysis
of fatty acid methyl esters by GC-FID,
and confirmation of identities by GC-MS,
is gratefully acknowledged. This work
was supported by the USDA Agricultural
Research Service. Mention or use of specific
products or brands does not represent or
imply endorsement by the USDA.
References1. D.R. Stoll, Introduction to Two-
Dimensional Liquid Chromatography –
Theory and Practice, in: M. Holčapek, W.C.
Byrdwell (Eds.) Handbook of Advanced
Chromatography/Mass Spectrometry
Techniques, Elsevier/AOCS Press,
Champaign, IL, 2017, pp. 250-350.
2. P.J. Marriott, P. Schoenmakers, Z.Y. Wu,
LC-GC Eur., 25 (2012).
3. P. Schoenmakers, P. Marriott, J. Beens,
LC-GC Eur., 16 (2003) 335-339.
4. W.C. Byrdwell, Anal. Chem., 89 (2017)
10537-10546.
5. D.W. Cook, S.C. Rutan, D.R. Stoll, P.W.
Carr, Anal. Chim. Acta, 859 (2015) 87-95.
6. W.C. Byrdwell, Rapid Commun. Mass
Spectrom., 12 (1998) 256-272.
7. H.P. Bailey, S.C. Rutan, P.W. Carr,
J. Chromatogr. A, 1218 (2011) 8411-8422.
8. J. Folch, M. Lees, G.H. Sloane-Stanley, J.
Biol. Chem., 226 (1957) 497-509.
9. W.C. Byrdwell, J. Lab. Autom., 19 (2014)
461-467.
10. W.C. Byrdwell, Multiple Parallel Mass
Spectrometry for Liquid Chromatography, in:
M. Holčapek, W.C. Byrdwell (Eds.) Handbook
of Advanced Chromatography/Mass
Spectrometry Techniques, Elsevier/AOCS
Press, Champaign, IL, 2017, pp. 365-405.
11. W.C. Byrdwell, J. Chromatogr. A, 1320
(2013) 48-65.
12. D. Sirbu, M. Corno, M.S. Ullrich, N.
Kuhnert, Food Chem., 254 (2018) 232-240.
13. A.P. Tulloch, Lipids, 17 (1982) 544-550.
14. W.C. Byrdwell, J. Am. Oil Chem. Soc., 92
(2015) 1533-1547.
15. L. Fauconnot, J. Hau, J.M. Aeschlimann,
L.B. Fay, F. Dionisi, Rapid Commun. Mass
Spectrom., 18 (2004) 218-224.
16. A. Jakab, I. Jablonkai, E. Forgács,
Rapid Commun. Mass Spectrom., 17 (2003)
2295-2302.
When contacting companies directly from this issue of please tell them where you found their information.


![Jacaranda night club [Acapulco]](https://img.pdfslide.us/doc/110x75/568c4e931a28ab4916a8758d/jacaranda-night-club-acapulco.jpg)