Embed Size (px)
Citation preview

33rd
International North Sea Flow Measurement Workshop
20th
– 23rd
October 2015
1
Maximising Economic Recovery –
A Review of Well Test Procedures in the North Sea
Craig Marshall, NEL
Alun Thomas, NEL
1 INTRODUCTION
1.1 General
In terms of Maximising Economic Recovery (MER) in the UKCS, the measurement of well
production rates is essential to best optimise the hydrocarbon production strategy from within
the well itself. This is achieved during a process called a well test where a snapshot of
production is monitored by measurement equipment and instrumentation. The data produced
is then used to optimise the wells production rates.
However, how accurate that measurement has to be to provide sufficient control has not been
established and there is little information in the public domain that shows what the current
typical operation measurement uncertainty is.
NEL have reviewed current industry practice in regard to well testing on the UKCS and have
received assistance from operators in the region. The information provided was used to
generate typical uncertainties found in well testing using test separator systems. These results
have then been compared with results from models assessing the impact of flow measurement
errors on recovery factor and hence economic recovery of hydrocarbons.
In addition, alternative methods available to complete well testing and how each of these can
impact on MER have been described.
1.2 Oil and Gas Authority
The requirement for MER is clear; since the first licenses were issued for production in the
North Sea, the industry has spent more than £500 billion in exploration, development and
production activities [1]. There are over 450,000 people employed in the oil and gas industry
in the UK and HM Treasury has received more than £310 billion in production taxes alone;
not to mention the subsequent revenues generated from income tax, exports and
manufacturing.
There are many impressive facts relating to the industrial and economic benefits of the
offshore oil and gas industry and to continue to reap these benefits would be in the best
interest of the UK. However, not only to reap the rewards, but to maximise those rewards
should be a plausible and achievable goal.
In February 2014, Sir Ian Wood published the Wood Review [1], an independently led
review of the UKCS’s oil and gas recovery potential in the coming decades. The aim of this
review was to assess the current state of operations, production and exploration in the UK and
the methods of licensing and regulatory control in order to make recommendations for MER.
In essence, the Review calls for a stronger and more authoritative regulator to work with both
Industry and HM Treasury in a new tripartite strategy for MER within the UKCS.

33rd
International North Sea Flow Measurement Workshop
20th
– 23rd
October 2015
2
The Oil and Gas Authority (OGA) was formed on 1st April 2015 with the responsibilities
being transferred from the Department of Energy and Climate Change (DECC) by the Energy
Bill Bill, which is currently (as of 1st October 2015) at the Committee stage in the House of
Lords. The progress of the bill, and the bill itself, may be reviewed at:
http://services.parliament.uk/bills/2015-16/energy.html [2].
OGA’s responsibilities include the regulation of fiscal oil & gas measurement & allocation
[3]. This work is carried out by the OGA’s Petroleum Measurement & Allocation Team
(PMAT), which is part of OGA’s Exploration & Production directorate. The role of OGA is
to work with government and industry to ensure that the UK obtains the maximum economic
return from its oil & gas resources.
A more in depth overview of OGA and their role within the offshore oil and gas industry can
be found at:
https://www.gov.uk/government/uploads/system/uploads/attachment_data/file/458593/A5_O
GA_Overview.pdf [4]
1.3 Well Testing
1.3.1 What is well testing?
Well testing is extremely valuable in the oil and gas industry as it allows operators to assess
the production performance of their wells to glean important information about its structure
and characteristics. As a whole it is an expensive operation involving significant resources
and logistics, and differs from most techniques as it requires the reservoir to be in a dynamic
state, as opposed to a static state, in order to activate the responses needed for mathematical
modelling.
A basic well test system consists of a subsurface string, incorporating downhole tools such as
gauges, check valves, flow switching valves, isolation valves and packer assemblies, together
with a surface or deck system for separating, sampling and metering the fluids flowing from
the well.
Well tests incorporate many aspects of operations from drilling and process plant production
and are performed in order to estimate reservoir properties. They are used to obtain dynamic
data from a reservoir during different stages of that reservoir’s life. During the exploration
phase, the results of well tests provide the key dynamic data which will directly affect
decision making regarding further development.
Well testing objectives are diverse and can be used to confirm the existence of hydrocarbon
fluids in the drilled wells, to obtain downhole samples and to characterise the reservoir. The
duration of a typical well test is usually short, of the order of tens of or hundreds of hours.
The main well test deliverables that can influence MER and will be discussed further in this
report are:
Reservoir parameter characterisation
Reservoir model selection
Production flowrate determination

33rd
International North Sea Flow Measurement Workshop
20th
– 23rd
October 2015
3
These three deliverables link closely to MER through reservoir optimisation and the ability to
maximise the recovery factor for the well.
1.3.2 Reservoir characterisation
Typically, reservoir characterisation is achieved by finding a model that matches the
empirical data which can provide the well characteristics such as flow capacity (i.e.
permeability-thickness product), skin factor, and the structural and/or hydrodynamic
boundaries.
The interpretation and ultimate utility of the well test data, which necessarily encompasses its
uncertainty, is linked to knowing the particular reservoir’s storage capacity i.e. porosity. One
important use of well test data is to determine (a) if a static model e.g. a geological one,
behaves in the same way as the real reservoir and (b) to enhance the predictability of that
model.
Well testing can also be used anytime during the life of a reservoir to diagnose strange
behaviour e.g. an unexpected gas-oil ratio, or an unexplained reduction in productivity.
Differing types of well testing procedure are designed to serve particular purposes, but in all
cases there will be some sort of controlled constant productions (or injections) while
recording the pressure data. For those cases where a well flows at a particular production rate,
it is termed a draw-down test, whilst when the well is closed or shut-in, it is termed a build-up
test as shown in Figure 1.
Figure 1: The concept of draw-down and build-up well tests [5]
The ultimate goal of either is to describe a reservoir such that it can reproduce the same
output for a given input signal. Therefore, because well testing is effectively an inverse
problem - one which needs the data to match the model - its interpretation largely depends
upon the quality of input and output data. Hence, the focus of the study in investigating the
role of measurement uncertainty upon MER.

33rd
International North Sea Flow Measurement Workshop
20th
– 23rd
October 2015
4
1.3.3 Production flowrate determination
Owing to the adverse conditions upstream of the well head, there is great difficulty in
monitoring component flowrates with great accuracy. Instead, the produced fluids are
isolated from other producing wells and sent to a test separator. The test separator separates
out the individual components of the flow into either liquids or gases – as in a two phase
model – or oil, water and gas – a three phase separator (more commonly used in the North
Sea). The separated components are then measured individually by single phase flow
measurement technologies as shown in Figure 2.
Figure 2: Three phase test separator flow measurements [6]
Using these measurements over the length of the well test it is possible to acquire a snapshot
of the production rates for that point in time. These values are then used as the well rates until
they are updated by the next series of well test data collected.
Coupling this flowrate data with reservoir parameters allows reservoir engineers to model
specific wells in order to optimise its production profile i.e. get as much hydrocarbon
produced versus as little water as possible.
It is intuitive that completing reservoir optimisation successfully depends on accurate data
being supplied. However, how accurate the data needs to be is unknown and one of the
questions the study aims to answer.
From Figure 2, it is easy to imagine process situations where measurement performance can
be worsened. In addition, other practical issues may arise that result in measurement errors.
Essentially, any deviation from non-ideal conditions will cause a detrimental effect on the
flow measurement which leads directly to poorer data for reservoir optimisation and hence
recovery factor.
There are many influences that can cause flow measurement error at the outlet of test
separators. Some common concerns are [7]:
Presence of a second component (carry-under and -over)

33rd
International North Sea Flow Measurement Workshop
20th
– 23rd
October 2015
5
Installation effects
Fouling on measurement device
Calibration expired
Poor maintenance/inspection
Secondary instrumentation error
Pulsating flows
Representativeness (do the flow rates during the well test represent the actual typical
conditions)
With so many potential measurement issues present, some being persistent, it is beneficial to
know what the overall cost of the measurement problems are. This way an appropriate cost
benefit analysis can be completed and the risk in regard to MER can be properly assessed.
This ties in with current OGA measurement uncertainty strategies and the recommendations
from the Wood Review.
3 REGULATION OF OFFSHORE OIL & GAS PRODUCTION
3.1 Current Guidelines
Currently, the OGA guidelines [3] do not specify a requirement for the performance of test
separator measurements unless they are used for, or to verify a multiphase meter used for,
allocation or fiscal measurement. However, the guidelines do recognise that it is normal and
good oilfield practice to periodically test production wells for the purpose of reservoir
management.
Typically, a well test frequency is in the region of 30 – 90 days and is dependent on a number
of variables. When required by OGA, the frequency is decided in agreement with the
regulator. This is normally based on a risk-based approach concerned with financial exposure
of any produced hydrocarbons with a normal frequency close to 30 days.
If the well test frequency is not met for wells where OGA are interested, then dispensations
must be obtained with appropriate reasons included.
Proof of measurement uncertainties for test separator systems may also be required to
validate measured values for OGA. In fields where OGA have no interest the driver for
obtaining the proof through measurement audits and calculations of uncertainties lies solely
with the operator. Anecdotal evidence from OGA suggests that in these installations, the
measurement uncertainties are typically larger than recommended by good oilfield practice
owing to the influences suggested in section 1.3.3.
In fields where OGA has an interest, proof of measurement uncertainty should be provided
either through operator’s obtaining audits from independent companies or through OGA’s
own inspection team. However, the Wood Review noted that DECC (before OGA were
formed) were severely understaffed and current OGA staff levels still do not permit the
inspection of every test separator measurement system. This results in a dependence on
operators obtaining their own verifications.

33rd
International North Sea Flow Measurement Workshop
20th
– 23rd
October 2015
6
4 CURRENT WELL TEST PROCEDURES
4.1 General
In order to assess the current state of well test procedures in the North Sea a questionnaire
was issued to operators to gauge typical well test frequency, success and methods.
Information was also sought about the equipment used to ascertain how fit for purpose it is in
regards to helping to maximise economic recovery [8].
A very low response rate was achieved predominantly due to the decrease in oil price over
the consultation period. Therefore the results obtained are a snapshot of industry and
unfortunately do not represent a significant sample to be applied to all. From the 32 operators
contacted, responses were received from 6 and for 7 installations. Overall this has led to data
from over 100 wells included in the uncertainty analysis.
4.2 Well Testing Methods
From the responses received it was clear that there are obstacles to accomplish successful
well testing. It is important to point out that some of the responses were negative in terms of
how companies approach well testing i.e. none or very little were completed. This was
typically due to the physical set up of wells either being in satellite fields or tie-backs. This
meant that wells could not be tested individually without shutting down other production
wells. Clearly this would be in conflict with company financial policies especially given the
time constraints to test each well and the number of wells.
Another issue was concerned with the amount of wells for an individual installation. In one
case, over 100 wells were in use to varying degrees and as such it was almost impossible to
accurately well test each one within a suitable time frame.
Of the submitted questionnaires where well tests were completed it was found that the vast
majority reported that a 4-8 week frequency was typical and this timescale was achieved in
close to 100% of wells. This timescale ties in well with expected values as prior to receiving
these answers 4 weeks was believed to be industry norm.
The typical well test length was in the region of 1-3 days with variations from 1 hour up to 7
days. This accounts for set-up, attaining steady state conditions and holding for the well test
duration. It is not uncommon for well tests to last up and over 70 days but these are usually
only in rare circumstances. Again, the values attained were similar to what was expected
from experience.
Considering an average 60 day well test campaign period and average duration to be around 2
days, it is easy to understand how installations with more than 30 wells begin to place
pressure on test separator systems. It is important to note this does not include change over
time or more importantly, maintenance and calibration time for the equipment.
In terms of operations it was reported that it is the operator themselves who have written the
procedures, perform and analyse the data coming from well tests. Service companies were
not used in this sample.

33rd
International North Sea Flow Measurement Workshop
20th
– 23rd
October 2015
7
4.3 Uncertainty
In terms of the measurement uncertainty for each phase the data provided was used in generic
uncertainty budgets to give estimates for typical values. The requested data included
information about the single phase measurement devices and stream configurations for the
test separator systems:
Flow meter used
Make/Model
Meter size
Upstream straight pipe length
Downstream straight pipe length
Temperature measurement
Pressure measurement
Calibration method
Calibration frequency
Data was also provided for each well that the test separator is used to test. Component flow,
pressure, temperature, physical properties and contamination levels were stated or estimated
for use within the uncertainty model.
The generic uncertainty budgets consisted of the following sources of uncertainty with the
values being determined from provided data or through previous history of the metering
technologies used:
Baseline meter uncertainty
Calibration uncertainty
Installation effects
Contamination of second component
Drift since calibration
Temperature
Pressure
As the supplied data was relatively low in number multiple runs were completed on the data
where certain sources of uncertainty were generated randomly based on previous history. For
instance, it is known that some fluids contain more impurities than others and hence cause
larger amounts of drift of measurement equipment through deposition. In order to account for
this, levels of drift of between 0.1% and 0.5% per annum were randomly generated and
applied to the data.
The data supplied from operators included information on the metering technologies and
dimensions, installation criteria, secondary instrumentation and calibration history. Then
flowrate, temperature, pressure and physical property data were used in the uncertainty model
of the equipment to generate estimated and representative uncertainty values for the data
given. As stated before, additional runs were incorporated given random values of the
uncertainty sources so as to give more data and to include extreme cases. This should give
more confidence that the results obtained are representative given the low population sample.
The ranges of uncertainties found were quite varied for the wells and were different for
liquids and gases. For liquids, both oil and water uncertainties were similar and were in the

33rd
International North Sea Flow Measurement Workshop
20th
– 23rd
October 2015
8
region of ± 1-5% where the larger numbers were associated with extreme cases of deposition
and contamination of second phases. In general, the uncertainty values were between 2 and
3%.
For gases, the uncertainties were slightly higher at values between ± 2-7%. Again the larger
numbers were attributed to cases under extreme conditions such as contamination and drift.
In general, the uncertainty values were between 3 and 5%.
These values are for measurement uncertainty at the outlets of the test separator. When
discussing the uncertainty of the flows in the well (more useful for reservoir modelling) then
volume corrections, flow pulsations and other contributing factors must be included. Once
they are accounted for the uncertainty can rise to over ± 10% (estimated).
The calculated numbers are similar to values expected from experience and general industry
held beliefs. The uncertainty relating to certain sources are subjective and may vary from
case to case. Only general rules of thumb have been applied which give an indication of
expected values. In addition, other separation methods for example a two-phase system will
have other contributing uncertainty factors.
The results are based on a desk-based assessment of provided data. A site audit of each
facility would give better indication of the current state of the art for test separator
measurement. This will allow for more accurate uncertainty budgets to be developed and give
a larger sample of uncertainties to assess.
5 WELL TEST SIGNIFICANCE
5.1 General
Throughout this report the term ‘accurate measurement’ has been used to discuss the
requirement for the quality of topside measurements for reservoir optimisation. However, it
has also been noted that the absolute level of quality required to ensure successful
optimisation remains unknown.
To investigate this problem, Coventry University completed a study relating to the
uncertainties in well test measurements and their consequent impact on MER [5]. The study
was a high level assessment of generic well test metering, including multiphase measurement
used during a standard well test. The focus of the Coventry work lay in running a number of
simplified models in order to explore the importance of rate measurement for well test
interpretations; as opposed to developing in-depth models akin to those in use commercially.
Coventry’s scope encompassed downhole rate measurement as a necessary means of
comparing and contrasting such measurement with surface techniques and, overall, the study
had much to say about downhole techniques. Nevertheless, the intent of the modelling was to
establish, in broad terms, the nature and strength of the link between surface well test
measurement uncertainty and its importance to maximising future extraction. This section of
the report summarises the work completed by Coventry and elaborates on the conclusions
drawn.
Firstly, it is important to understand the process in which flowrate measurements are used in
reservoir optimisation and production. In order to successfully optimise production from a

33rd
International North Sea Flow Measurement Workshop
20th
– 23rd
October 2015
9
particular well, the well itself has to be characterised so that its future production can be
accurately modelled with a low uncertainty. Only once production can be predicted can the
most optimum production pattern be obtained.
There are two parts to this prediction, the characterisation of the parameters within the well
itself e.g. porosity, permeability, skin factor etc and the model used to calculate the outputs
given the input parameters. Both of these parts are determined through data provided through
well tests. Traditionally, surface flow measurements have been a key component in the
analysis.
Characterising well parameters and selecting the most appropriate model to use is influenced
by data taken during well tests but the process involved is outside the scope of this study.
This report and the conclusions from Coventry’s work do not consider this process; only the
quality impact of the data on the recovery of oil and gas is considered.
5.2 Description of Work
An example reservoir was created and a series of test runs were conducted to assess the
output from the example with respect to the changing input parameters. The example
reservoir was based on a 100 ft vertical well within a fractured reservoir with a radius of
5000 ft. The following were used as the flow parameters of the reservoir:
Storativity ratio (ω) – 0.1
Inter-porosity flow coefficient (λ) – 2 x 10⁶
Permeability (K) – 500 md
Bulk porosity (S) – 0.27
The parameters can be taken as descriptors of how fluids flow through a reservoir and there
exact definitions can be found in various sources. However, for the purpose of this study they
can be thought of as inputs to a model where the closeness of the predicted values of these
inputs to the actual values dictates the accuracy of the model as a whole.
During each test run, the example reservoir was ‘produced’ with varying levels of
measurement information recorded and utilised. This measurement data was then used to
generate reservoir models and the predicted reservoir parameters. A comparison could then
be made between the accuracy of the model and correct parameters in the example reservoir.
The test runs consisted of a single phase oil drawdown phase at a constant flow of 9200
STB/D with a duration of 158 hours. Then the well is then shut-in for 8 hours for a build-up
phase before being produced again.
The second stage production could be applied for any time frame and for these tests the well
was assumed to produce fluids for 20 years allowing for a direct comparison of overall
production rates i.e. how much total hydrocarbon was recoverable over the timeframe
compared with values obtained during other test runs. This then allows comparison as to
which methodology allows for maximising recovery factors and hence MER.
The test runs considered during these tests were:
1. Correct flow rate measurements taken at the surface
2. Correct flow rate measurements taken downhole
3. 10% random error in flow rate measurement taken at the surface
33rd
International North Sea Flow Measurement Workshop
20th
– 23rd
October 2015
10
4. 10% random error in flow rate measurement taken downhole
The surface measurements are defined as measurements above the well head i.e. either test
separator measurement systems or multiphase flow meters. Downhole measurements are
defined as measurement taken in the well bore typically at the well perforations.
5.3 Results
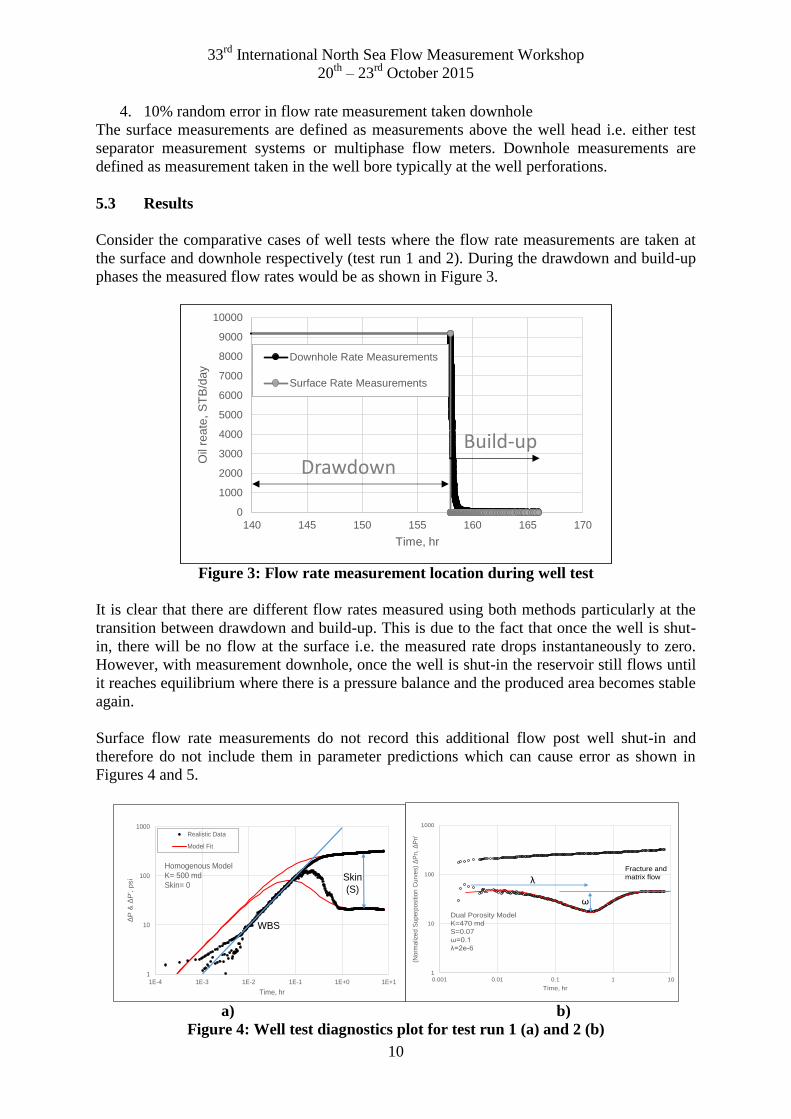
Consider the comparative cases of well tests where the flow rate measurements are taken at
the surface and downhole respectively (test run 1 and 2). During the drawdown and build-up
phases the measured flow rates would be as shown in Figure 3.
0
1000
2000
3000
4000
5000
6000
7000
8000
9000
10000
140 145 150 155 160 165 170
Oil
reate
, S
TB
/day
Time, hr
Downhole Rate Measurements
Surface Rate Measurements
Build-upDrawdown
Figure 3: Flow rate measurement location during well test
It is clear that there are different flow rates measured using both methods particularly at the
transition between drawdown and build-up. This is due to the fact that once the well is shut-
in, there will be no flow at the surface i.e. the measured rate drops instantaneously to zero.
However, with measurement downhole, once the well is shut-in the reservoir still flows until
it reaches equilibrium where there is a pressure balance and the produced area becomes stable
again.
Surface flow rate measurements do not record this additional flow post well shut-in and
therefore do not include them in parameter predictions which can cause error as shown in
Figures 4 and 5.
1
10
100
1000
1E-4 1E-3 1E-2 1E-1 1E+0 1E+1
ΔP
& Δ
P', p
si
Time, hr
Realistic Data
Model Fit
Homogenous Model
K= 500 md
Skin= 0Skin
(S)
WBS
1
10
100
1000
0.001 0.01 0.1 1 10
(Norm
aliz
ed S
uperp
ositi
on C
urv
es)
ΔP
n, Δ
Pn'
Time, hr
Dual Porosity Model
K=470 md
S=0.07
ω=0.1
λ=2e-6
Fracture and
matrix flow
ω
λ
a) b)
Figure 4: Well test diagnostics plot for test run 1 (a) and 2 (b)
33rd
International North Sea Flow Measurement Workshop
20th
– 23rd
October 2015
11
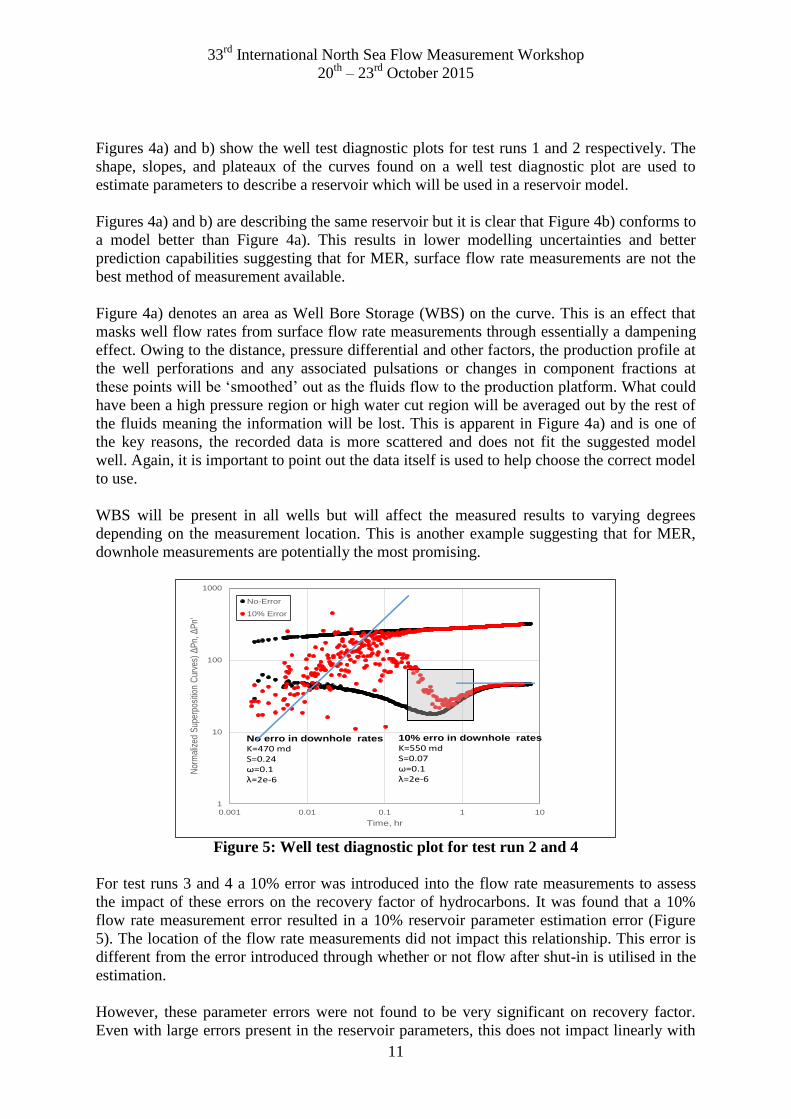
Figures 4a) and b) show the well test diagnostic plots for test runs 1 and 2 respectively. The
shape, slopes, and plateaux of the curves found on a well test diagnostic plot are used to
estimate parameters to describe a reservoir which will be used in a reservoir model.
Figures 4a) and b) are describing the same reservoir but it is clear that Figure 4b) conforms to
a model better than Figure 4a). This results in lower modelling uncertainties and better
prediction capabilities suggesting that for MER, surface flow rate measurements are not the
best method of measurement available.
Figure 4a) denotes an area as Well Bore Storage (WBS) on the curve. This is an effect that
masks well flow rates from surface flow rate measurements through essentially a dampening
effect. Owing to the distance, pressure differential and other factors, the production profile at
the well perforations and any associated pulsations or changes in component fractions at
these points will be ‘smoothed’ out as the fluids flow to the production platform. What could
have been a high pressure region or high water cut region will be averaged out by the rest of
the fluids meaning the information will be lost. This is apparent in Figure 4a) and is one of
the key reasons, the recorded data is more scattered and does not fit the suggested model
well. Again, it is important to point out the data itself is used to help choose the correct model
to use.
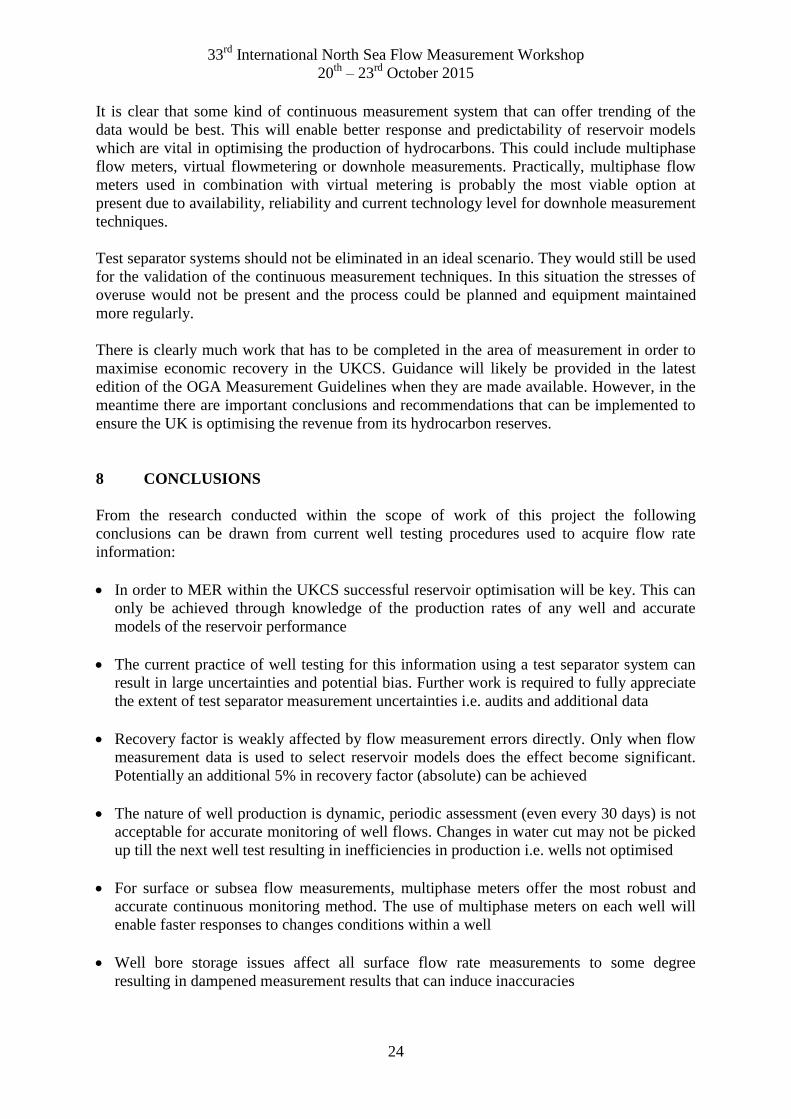
WBS will be present in all wells but will affect the measured results to varying degrees
depending on the measurement location. This is another example suggesting that for MER,
downhole measurements are potentially the most promising.
1
10
100
1000
0.001 0.01 0.1 1 10
Nor
mal
ized
Sup
erpo
sitio
n C
urve
s) Δ
Pn,
ΔP
n'
Time, hr
No-Error
10% Error
No erro in downhole ratesK=470 mdS=0.24ω=0.1λ=2e-6
10% erro in downhole ratesK=550 mdS=0.07ω=0.1λ=2e-6
Figure 5: Well test diagnostic plot for test run 2 and 4
For test runs 3 and 4 a 10% error was introduced into the flow rate measurements to assess
the impact of these errors on the recovery factor of hydrocarbons. It was found that a 10%
flow rate measurement error resulted in a 10% reservoir parameter estimation error (Figure
5). The location of the flow rate measurements did not impact this relationship. This error is
different from the error introduced through whether or not flow after shut-in is utilised in the
estimation.
However, these parameter errors were not found to be very significant on recovery factor.
Even with large errors present in the reservoir parameters, this does not impact linearly with

33rd
International North Sea Flow Measurement Workshop
20th
– 23rd
October 2015
12
how much hydrocarbon is produced from the well by itself. As an extreme case, when the
flow rate error is ± 50% under the conditions in the example reservoir, the recovery factor
after 20 years was found to have 3% error only. Essentially, for every 1% error in flow rate
measurement there is an error in recovery factor of 0.06%.
As discussed earlier there are two parts in reservoir prediction in order to optimise production
successfully. The main impact on MER from flow rate measurement errors is not from the
reservoir parameter estimation but from the use of the data to select the most appropriate
model.
For each test run, the data generated on reservoir parameter estimations and the most
appropriate reservoir model were used to ‘produce’ the example reservoir for a period of 20
years. For test runs 1 and 3 a single medium model was selected from the data and for test
runs 2 and 4 a dual medium model was selected. Dual medium denotes a reservoir fracture
was detected whereas single medium denoted no fracture.
Figure 6 shows the effect on recovery factor after 20 years using the each model and reservoir
parameter estimations.
0
0.05
0.1
0.15
0.2
0.25
0.3
0.35
0.4
0 5 10 15 20 25
Re
cove
ry F
acto
r
Time, Year
Single Medium
Dual Medium
Figure 6: Recovery factor after 20 years
The results show that the model uncertainty has higher impact on the final recovery. Using a
single medium model the reduction in the recovery factor is around 12% compared with the
dual medium model. Potentially this could be a huge number in terms of financial
calculations. To give an idea that how much this would be consider that the initial oil in place
for the example reservoir is around 3.78×10⁷ barrels of oil. Incorrect flow rate measurement
data either from errors or from location factors can result in around 5% decrease in producing
the original oil in place. Or at $60 per barrel, this is equivalent to £75 million for this
example.
In this study Coventry have highlighted the potential of flow rate measurements and in
particular downhole rate measurements for improved well test data, and demonstrated the
contribution of accurate measurements on reducing uncertainty in modelling, parameter
estimation and the ultimate recovery. Simulations were performed using the models that are
frequently used in the well test interpretation routines and only include the “direct” impact of
flow rate uncertainty on the recovery factor by extending the well test models for long term
predictions. As a consequence, only natural production mechanisms are considered and other
improved recovery techniques (such as water or gas injection) are not considered. In practice
there are “indirect” uncertainties induced from inaccurate rate measurements. Such

33rd
International North Sea Flow Measurement Workshop
20th
– 23rd
October 2015
13
uncertainties could result in making incorrect or sub-optimal decisions for reservoir
developments that can ultimately impact the secondary or enhanced oil recovery plans.
Assessment of the impact of such uncertainties in general cases is difficult, as each reservoir
requires its own considerations and different policies than the other reservoirs.
It is important to rationalise the study completed by Coventry for its applicability and
representativeness to the industry. The example reservoir modelled was simple in design in
comparison with ‘real world’ reservoirs. The results obtained are specific to the example and
are only given as indications of the potential significance of flow rate measurement error (and
hence uncertainty) to MER in the UKCS.
For the test runs including 10% error, the results consider the error introduced to the
permeability estimation only. Coventry recommended further work to determine the whole
effect of all reservoir parameters on recovery factor.
5.4 Summary
The results obtained in the work completed by Coventry show relatively small effects of
surface flow rate measurement errors on recovery factor (considering reservoir parameter
estimations only). However, production optimisation is not the only use of well testing in the
industry and there will be more significant consequences from flow rate measurement errors
in these applications.
Well flow rate measurements can be used in the allocation of produced hydrocarbons
between wells or fields, in the verification of multiphase meters and the decision making
process of field developments i.e. where to drill the next well. The significance of flow rate
measurements here can influence MER in different ways.
Where multiphase meters are used to monitor well flow rates continuously or during well
tests they will still be verified periodically against separator measurement systems. This acts
as a verification of the performance of the equipment and potentially can be used to apply
corrections (this assumes a better uncertainty in the separator measurements). There can be a
compounded effect of measurement error from separator system through to multiphase meter
through to reservoir parameter estimations.
In field developments the data from producing wells is used to assist in the positioning of
future drilling. Depending on where a new well is drilled may influence how much
hydrocarbon can be produced or the effectiveness of any injections for EOR.
Allocation is used to apportion produced fluids to particular wells in the event of comingling.
The allocated values can be determined from separate meters i.e. multiphase meters or by test
separator systems. Allocated fluids tie in with MER not through normal well test processes
but through continual monitoring of streams. The ability to quickly and in real-time
determine if water breakthrough is occurring is extremely valuable in MER.
It is clear from the completed study that the significance of flow measurement uncertainty
(and errors) cannot be linked directly to one output as the whole process is intrinsically linked
to varying degrees. Where one input is weakly linked to the output through one mechanism it
can be strongly linked through another. This coupled with significant secondary affects
makes it difficult to place absolute values on the implications of measurement accuracy.

33rd
International North Sea Flow Measurement Workshop
20th
– 23rd
October 2015
14
Instead, some examples have been presented with their stated limitations and sample values
calculated.
In summary, in terms of MER in the UKCS the study has found flow measurement is vitally
important in ensuring its success. However, the most significant contribution is not from the
measurement error or uncertainty itself but through the use of the data to choose an
appropriate reservoir model to use for reservoir optimisation. This ties in with not only the
quality of the measurements themselves but on the location and appropriateness of the
measurements.
Coventry University would recommend the use of downhole flow rate measurements as these
provide additional information on well flows not available from surface measurements. This
information has been shown to be extremely valuable in terms of MER through the models
run.
Another recommendation from Coventry is the use of multiphase meters instead of test
separator systems for surface flow rate determination. Primarily, for the reason they are able
to record and trend data continuously resulting in an improvement in data quality and
confidence of estimated reservoir parameters.
6 ALTERNATIVE METHODS AVAILABLE
6.1 General
The need of well testing for maximising oil and gas production and economic recovery,
formulating fiscal policy and attracting investment have been evident for years. In
conjunction with conventional well testing technologies, a number of alternative methods
have been developed to aid such operations since the early eighties by research organisations,
meter manufacturers, oil and gas production companies and others. A combination of
technologies has emerged, albeit their prototypes were quite dissimilar in functions and
designs. These technologies have become commercially available and their applications and
users are rapidly expanding.
Well testing for production analysis [9] involves measuring the contribution of oil/water/gas
from individual wells. Indeed, the knowledge and data obtained from well testing are then
utilised to facilitate reservoir management, field development, operational control, flow
assurance, production and fiscal measurements.
In this study, three popular alternative methods are chosen to be reviewed. These are:
virtual flow metering
multiphase flow metering
mobile well testing.
Virtual flowmeters (VFMs) are calculation based software suites that incorporate existing
measurements instruments to create estimation of flow in real-time at any point in the
process; with or without flow measurement technology being available. Multiphase
flowmeters (MPFMs) are physical measurements systems installed inline that measure the
component flows of oil, water and gas in real-time. Finally, mobile well testing (MWT) is
where portable separator systems, often combined with two or three phase measurements, are

33rd
International North Sea Flow Measurement Workshop
20th
– 23rd
October 2015
15
installed for short periods before being removed. The following section will discuss these
three popular methods for the use in MER.
6.2 Virtual Flow Metering
Although there are differences among VFM technologies, there is no attempt to undertake a
product-by-product comparison in this review. The perceived advantages and disadvantages
of VFMs are generalised and summarised in Table 1.
TABLE 1
Advantages and Disadvantages of VFMs
Advantages Disadvantages
Provision of real-time continuous monitoring
of reservoir characterisation, well
optimization & economic recovery.
Not suitable for responding transient pressure
due to rapid inflow. Detailed knowledge is
required to set up VFMs.
Cheaper than multiphase flow meters &
mobile well testing facilities.
Installation effects could affect the accuracy
of flow rate calculation.
Useful for visualisation of component phases
and flow assurance risks [10].
Accuracy of component phases are required to
be predicted based on pressure and
temperature measured in and around the wells.
Output flow rate uncertainties are unavailable.
Capable of recalibration if required. Regular verification is required to be
undertaken using real time measurements to
ensure accuracy & representativeness of flow
rates predicted
Elimination of maintenance requirements,
such as corrosion, sand plugging with wax,
methyl hydrates etc.
Corrosion, sand plugging with wax and
methyl hydrates would potentially affect the
accuracy of VFMs.
Cost effective and efficient for monitoring a
number of wells simultaneously as opposed
to a physical well testing.
Less efficient and accurate if meter fouling
were not identified in and round the well.
Elimination of operational risks, such as fluid
surges, leakages, formation of hydrates, etc.
Operational risks are simply transferred to
service providers who have to carry out
maintenance work.
Reliable and has good fault tolerance Less reliable if failed hard temperature and
pressure sensors were lack of regular
calibrations.
Useful for validation of well test,
reconciliation for and replacement of flow
meters [11].
VFMs consistently either over- or under-
predict as the choke size increased (i.e.
increase of flow rate). Some programs can
freeze and crash and significant time may be
spend opening, closing and switching between
analyses and post-processing the data.
Useful for tracking liquid slugs, MEG, pigs,
identification of hydrates, control of chokes,
monitoring for erosion, corrosion, wax or
leaks.
The drop in differential pressure also increases
the uncertainty of the flow rate through the
choke.
Useful for looking ahead and for performing
what if scenarios and uncertainty analysis.
The risk of bias or error in the flow rate
estimations increase, if the VFMs were
operating outside the trained range.

33rd
International North Sea Flow Measurement Workshop
20th
– 23rd
October 2015
16
VFMs are capable of reliably determining the well flow rate, if and only if the pressure,
temperature and other physical sensors were periodically calibrated and VFM flow rates
against calibrated and accurate multiphase flow meters were verified [12]. Preferably,
uncertainty performance of the various system components, e.g. downhole and subsea
pressure and temperature sensors, subsea or topside multiphase meters, a length of tieback
pipeline, a topside choke valve, separator with single-phase flow and water cut meters, are
regularly carried out for calibrating and verifying VFMs. At present, uncertainty ranges of
VFMs are rarely known and are not widely published. Critical and independent evaluation of
the performance and accuracy of VFMs for subsea well tests are virtually unavailable in the
public domain. Nonetheless, it was reported that VFMs could deviate from the multiphase
flow measurements by a range of 10% to 20%.
Even when accuracy is not considered sufficient, VFMs still offer valuable information from
their repeatability. Comparison and trending of the VFM result with other technologies, such
as MPFMs, can indicate when they require verification. In this sense they can qualitatively
check primary measurements for reproducibility and act as a redundancy.
6.3 Multiphase Flow Metering
Before 1980s, single phase measurements alone were sufficient to satisfy the needs of oil and
gas industry. The maturity of oil reserves together with smaller and deeper wells with higher
water contents saw the needs of multiphase flow meters (MPFMs). Since 1994, the
installation of MPFMs has steadily increased, with substantial growth from 1999 onwards. A
recent study suggested that there were approximately 2,700 MPFM applications covering
production optimisation, field allocation and mobile well testing.
Initially, the purpose of MPFMs was to analyse the increasing amounts of water and natural
gas that were producing in a greater part of fluid from some North Sea wells. However, oil
wells have a mixture of oil, natural gas, water and other chemical compounds. Ultimately, the
multiphase flow metering is defined as the utilisation of MPFMs, which are devices used to
measure the individual flow rates of constituent phases in a given flow of petroleum, gas and
water mixtures produced during oil production and well testing processes [13].
The initial interest in multiphase flow metering came from the offshore industry. In fact, the
North Sea oil field played a pivotal role in the development of MPFMs. The key factors
which have instigated the speedy uptake of multiphase flow metering technology are
identified as follows:
increases in oil prices
decreases in meter costs
improved meter performances
wider competition amongst operators
deployment of more compact meters for mobile systems.
Prior to the development of MPFMs, the only way to determine the fluid mixture was to
physically separate the fluids and to individually measure each phase. The main advantage of
state-of-the-art MPFMs is the elimination of the use of three-phase separators. The flow rates
and composition of the fluid from the well can be determined by MPFMs without using a test

33rd
International North Sea Flow Measurement Workshop
20th
– 23rd
October 2015
17
separator. Consequently, this offers a substantial economic and operating advantages over
conventional phase separating predecessors.
MPFMs provide important information and data about the fluid compositions in the well.
They also provide indications over the increase in the percentage of water coming out of a
well and the decline of oil production. MPFMs give a faster response time than their test
separator counterparts, because they log and analyse data in real time. MPFMs [14] are more
useful for allocation metering where produced fluids from different wells need to be
combined and sent to a processing station.
The main disadvantage of MPFMs, however, is their high capital and operating costs
involved. In particular, there are currently no single MPFM on the market meeting all
multiphase metering requirements. Other disadvantages include contaminations, sand
erosions, blockages and difficulty of calibration. All of these impose a higher level of
measurement uncertainties to MPFMs [15].
Table 2 generalises the advantages and disadvantages of MPFMs identified from literatures.
TABLE 2
Advantages and Disadvantages of MPFMs
Advantages Disadvantages
Elimination of test separators High capital, maintenance and software
costs
No requirements of regular intervention of
test separator by qualified personnel
High measurement accuracy requires more
intense radiation sources, which affect
safety aspects and mobility considerations.
Continuous well monitoring possible. This
is not practical using a test separator
The phase fractions will only be
representative over a cross section if the
phases are homogeneously mixed
No requirements of long period of steady
operation to achieve accurate
measurements. Information is available to
the users in a minutes after starting the
operation
Contaminations, sand erosions, blockages
and difficulty of calibration.
Ability to track, in real time, any changes in
fluid composition, flow rates, pressure and
temperature.
Intrusive
Ability to respond quickly to changes in
fluid composition and the reduced time to
stabilize flow
High measurement accuracy requires more
intense radiation sources, which affects
H&S and mobility considerations
No moving parts Static holes for pressure measurement may
be blocked by contaminants, sand and etc.
MPFMs vary in uncertainty estimates from manufacturer to manufacturer. The aim of this
review is not to compare the different MPFM models with each other but MPFMs
collectively with other well production monitoring techniques.

33rd
International North Sea Flow Measurement Workshop
20th
– 23rd
October 2015
18
Device performance is commonly split into the operating ranges it can measure within its
stated specifications. Some devices can handle higher gas volume fractions or water cuts than
others and this is based on the technology used in the measurement.
Typical ranges of uncertainties for components measured by MPFMs are 2-10% for liquids
(lower gas volume fractions allow for lower uncertainties) and 4-10% for gases [16]. Again,
the quantity of gas present has a large impact on uncertainty achieved.
6.4 Mobile Well Testing
In contrast with permanent flow-line well testing installations, which facilitate continuous
production measurements, mobile well testing (MWT) is a discrete testing approach. Mobile,
also known as portable, well testing units are fully portable production facilities and are
capable of both well test and clean-up operations. Typically, for offshore testing, MWTs
consist of partial separation units with two or three phase meters on the outlets. They take a
significantly less footprint than full separation systems and can be transferred between
installations after a well testing campaign is complete. Other models are smaller again, acting
like MPFMs with some capable of non-intrusive operation.
Table 3 briefly generalises the common benefits and drawbacks of MWTs, as most MWTs
are MPFMs which have been detailed in the last Section of this review.
TABLE 3
Advantages and Disadvantages of MWT Technologies
Technology Advantages Disadvantages
Separator,
MPFMs
Portable / mobile Process fluids may need conditioning
for optimum separation
Accessible to harsh arctic
operating conditions
Separation may be inefficient due to
liquid slugging or foaming
Complete package of well testing
and clean-up solutions
Complication and risk due to
operations and logistical needs of
heavy and bulky equipment to the well
site
Data to desk facilitated Size, cost and time constraints due to
limited numbers of well tests to be
performed at one time.
- Flow data is dependent on well test
frequency
- Impractical operations for running
multiple test packages throughout the
field.
- Intrusive
Radioactive
MPFMs
- Risk of H&S due to exposure to
gamma rays.
Clamp-on
Sonar flow
meter
Small-footprint to reduce the
amount of equipment or
disruption on process operations
Working accuracy is within 10%,
which is less accurate as opposed to
MPFMs.
Achieve periodic sampling of -

33rd
International North Sea Flow Measurement Workshop
20th
– 23rd
October 2015
19
fluids at line conditions
Non-intrusive -
Radioactive-
free MPFMs
Eliminate risk of H&S -
The uncertainties of multiphase flow measurements by means of test separators have been
described in Section 4 of this review, while the major uncertainties of MPFMs are
generalised in Section 6.3.
6.5 Impact on Maximising Economic Recovery
These alternative methods of well testing can provide very real substitutes to test separator
systems in one way or another. Each has their advantages and disadvantages as discussed in
the preceding section. As an impact to MER, there are varying levels of influence from the
alternative methods that must be discussed.
The main constraints on test separator systems are over use and intermittent data being used
between well test periods i.e. lack of real-time data. It is these two issues where these
alternative methods can provide significant advantages over test separator systems.
VFMs cannot replace measurement systems entirely. At best they can be used to reduce the
burden on other measurement systems by extending times between well tests. This is
accomplished through real-time monitoring of production rates from the software. Once the
software has been calibrated it can determine flows that can be used to optimise production.
However, the software can drift from the ideal response and needs to verified or even
recalibrated periodically. The frequency of this is likely to be lower than what would be
required acquiring well data from a periodic well test alone. This enables better economic
recovery through continual monitoring of flow rates and a faster response time.
Multiphase flowmeters can vastly impact on MER through continual measurement and faster
response times. When installed either subsea or topside in a multi-well capacity there is very
little stabilisation time required in comparison to test separator systems. This means a larger
number of wells can be tested or longer well tests can be obtained. If operating in a single-
well capacity, then real-time and continual measurements can be given. In either regard a
multiphase meter can be a viable alternative to test separator systems if verification can be
established through another means; potentially another multiphase meter, mobile well testing
equipment or even using the test separator itself.
It is the continuous measurement criteria where multiphase meters can offer a significant
advantage to test separator systems. Real time data vastly improves the ability to control
wells. The uncertainties associated with multiphase meters are comparable with test separator
systems too. Although larger, any influence on recovery factor should be minimised through
the larger amount of data that will be provided through continuous measurement.
Incorporating MPFMs into individual wells can only improve well optimisation and impact
positively on MER. The cost of MPFMs can be weighed against the perceived advantage in
MER it provides. It is likely this will be a case by case basis.

33rd
International North Sea Flow Measurement Workshop
20th
– 23rd
October 2015
20
7 DISCUSSION
The impact of flow measurement on MER will be significant on the UK economy and oil and
gas industry. Without accurate knowledge of the fluids produced from individual wells it will
be impossible to efficiently optimise and maximise the amount of hydrocarbons produced in
the UKCS, and hence maximise the economic contribution to the UK treasury. What type and
method of measurement is the best for MER is still not defined however the various methods
have been outlined in the preceding sections. Current industry practice shows the test
separator system as the system of choice for the large majority of installations.
From feedback from industry there appears to be significant restrictions in the capability of
test separator systems to accomplish MER from the point of view of overuse and equipment
quality. For example, pipe set ups can inhibit well testing through the requirement to shut all
producing wells down in order to test one well and there are many issues that can affect the
single phase measurement methods. It is also clear that a periodic review of a wells
production is not enough to ensure the production is kept optimized throughout its lifetime.
For instance, for a well being tested every 30 days, there can be a sudden water breakthrough
after 15 days that would not be found for another 15 days. This may have a detrimental effect
on the whole reservoir. But how much of an effect does mis-measurement have on the UK
economy?
According to the 2013 FT, the UK’s oil and gas industry made a substantial contribution to
the British economy, accounting for some 450,000 jobs and £5bn tax revenues. The UK has
one of the largest budget deficits among European countries at 5.8% of GDP [17]. As such,
the accurate field databases derived from real time well tests would certainly have an
influence on the forecast of UK’s economic prospects and reservoir life to allow the
processing, transport and export of the UK’s petroleum and investment in new key
infrastructure. It helps avoid the premature decommission of assets to the detriment of
production hubs and infrastructure critically needed for maximising economic recovery from
UK’s valuable production assets and for achieving the maximum economic extension of field
life.
Based on the OBR’s most recent long term forecasts, the oil and gas production from 2014 to
2044 inclusive is expected to be 9.1 billion barrels of oil equivalent (boe) in a central case,
7.7 billion boe in a low case and 10.7 billion boe in the high case, Figure 7 [18].
Figure 7: OBR Scenarios for Future Production, 2014 Onwards

33rd
International North Sea Flow Measurement Workshop
20th
– 23rd
October 2015
21
As can be seen, there would be a significant different of 3 billion boe between a low
production and high production future, all of these projections would fall short of maximising
economic recovery. Nonetheless, in his final report, Sir Ian Wood indicated that the recovery
of 15 to 16.5 billion boe is a realistic ambition [1].
In order to achieve the recovery of 15 to 16.5 billion boe, real time well tests based on
MPFMs would likely be the best option, as real time field data provides vital information to
facilitate exploration success and to optimise oil and gas production, petroleum revenue tax
(Figure 8) and financial performance in terms of net present value, internal rate of return,
profitability index, saving index and so on [19].
Figure 8: Government Revenues from UK Oil and Gas Production [20]
In its 2014 budget, the UK government announced a review of the fiscal regime to ensure that
it supports MER UK [21]. The fiscal regime which specifically targets (i) the maximisation
of economic recovery from oil and gas production and (ii) the profitability and cost
effectiveness of the industry would certainty needs accurate real time field data for striking a
balance between providing sufficient incentive for companies to operate in the UK, whilst
ensuring the nation gets a fair share of the proceeds. If the UKCS field databases were
discrete and uncertain, this would undoubtedly disadvantage the government's effort to
simplify the fiscal regime because of the incomplete picture which imposes additional
uncertainties. Ultimately, it could weaken the North Sea oil and gas investment and
production (Figure 9), as well as the uptake of improved and enhanced oil recovery
techniques and technologies as a whole.
Figure 9: North Sea Oil Production [22]

33rd
International North Sea Flow Measurement Workshop
20th
– 23rd
October 2015
22
The US Energy Information Agency (EIA) commented that UK North Sea oil production
would decrease again in 2016 to just 500,000 barrels per day. In contrast, the sharp decline in
Norwegian North Sea oil production has stopped and production rates, while down from
previous highs, has been broadly stable since 2012 because of effective government policies
intended to support the industry [23]. With the recommendations from the Wood Review
being actively pursued by the UK, the value of 500,000 barrels per day can hopefully be
increased. Reservoir optimisation through better measurement methods is one way of helping
to achieve this goal.
Though many hydrocarbon reservoirs are profitably produced, very few are depleted
efficiently and economically. To optimise reservoir productivity and performance and to
predict recovery trends, the time series mapping of depositional environmental, flow barriers,
flow rates and core data are required. In particular, well tests that provide the vital time series
data [24] for reservoir management and economic recovery can:
provide a better description of reservoir contents via flow quantification
reduce investment and recovery uncertainty by evaluating production history or
historical matching
establish a basis for total management and dynamic development for optimising
reservoir operation in all phases of depletion.
The real time flow data gathered from the field and well tests can provide actual evidences as
to whether or not an irregular fluid displacement is being hampered by “pockets” of flow
barriers, e.g. rocks. The reservoir reaction team can then rapidly take appropriate action(s) to
maximise volumetric flooding efficiency, and hence optimise the oil recovery factor.
In reality, every practical approach and decision making are essentially based on a set of real
time and accurate & representative data. In the nut shell, to economically achieve best
possible hydrocarbon recovery from reservoirs, real time field and well test data for decision
making are undoubtedly indispensable.
Figure 10 reviews the variation of flow patterns that can be captured by three alternative well
testing methods during reservoir depletion.
Figure 10: Flow Rates Plots of Well Testing Data
Table 4 summarises the three alternative methods available for well testing based on their real
time capability.

33rd
International North Sea Flow Measurement Workshop
20th
– 23rd
October 2015
23
TABLE 4
Real Time Continuity
Alternative Method Real Time
Capability
Comments
Virtual Flow Metering No Pseudo real time series, flow rates are
simulated by computer software.
Multiphase Flow
Meters
Yes Genuine real time series, flow rates are
physically measured and are not inferred by
computer software.
Mobile Well Testing No Discrete patterns, flow rates are measured on
a "pay-as-you-go" basis.
It should be noted from previous Sections that virtual flow metering is merely computer
simulations based on certain assumptions and boundary conditions, which are measured by
temperature and pressure sensors in and around the wells. The sensors once installed in and
around subsea wells would be hardly re-calibrated and verified. In contrast, mobile well tests
are carried out on discrete bases. Field data captured by virtual flow metering and mobile
well testing are lacking real-time continuity. To economically maximise hydrocarbon
recovery, each flow parameter captured must be verified against its consistency in real time
continuity. As such, the usual “garbage in, garbage out” approach can be avoided.
MPFMs allow both real time and continual flow measurements and have been subjected to
extensive and robust verifications [25]. Technically speaking, MPFMs would probably be the
best alternative option for well tests because MPFMs are capable of capturing real-time
continuous and accurate flow data which are essential for optimising the economic recovery
of deposits from hydrocarbon reservoirs. Nevertheless, virtual flow metering and mobile well
testing are also considered to be cost effective alternative options for complementing MPFMs
measurements.
In terms of errors in measurement or measurement uncertainty it was found that there is a
very weak link to recovery factor or MER. Instead, the biggest contributor to the recovery
factor from measurement is when the well test data is used to select a reservoir model. This
means that the estimated uncertainties found in this work seem to be acceptable in terms of
measurement requirements, as long as the reservoir model is correct. The mechanism for
selecting the model was not assessed in this work but it is recommended to complete further
work in this area.
The errors introduced from periodic testing of a well can clearly be seen in Figure 10 where
the dramatic changes in production profile is monitored to varying degrees by the different
alternative methods. Clearly, a continuous measurement system offers significant advantages
to periodic checking.
This work has shown that the current uncertainties in well testing, typically through test
separator systems, are fit for purpose in terms of measurement uncertainty they deliver for
their current use for operators. However, in terms of MER UK they lack the ability to provide
data in real time to fully optimise production. In addition, the restrictions of test separators in
terms of overuse will only continue and worsen.
33rd
International North Sea Flow Measurement Workshop
20th
– 23rd
October 2015
24
It is clear that some kind of continuous measurement system that can offer trending of the
data would be best. This will enable better response and predictability of reservoir models
which are vital in optimising the production of hydrocarbons. This could include multiphase
flow meters, virtual flowmetering or downhole measurements. Practically, multiphase flow
meters used in combination with virtual metering is probably the most viable option at
present due to availability, reliability and current technology level for downhole measurement
techniques.
Test separator systems should not be eliminated in an ideal scenario. They would still be used
for the validation of the continuous measurement techniques. In this situation the stresses of
overuse would not be present and the process could be planned and equipment maintained
more regularly.
There is clearly much work that has to be completed in the area of measurement in order to
maximise economic recovery in the UKCS. Guidance will likely be provided in the latest
edition of the OGA Measurement Guidelines when they are made available. However, in the
meantime there are important conclusions and recommendations that can be implemented to
ensure the UK is optimising the revenue from its hydrocarbon reserves.
8 CONCLUSIONS
From the research conducted within the scope of work of this project the following
conclusions can be drawn from current well testing procedures used to acquire flow rate
information:
In order to MER within the UKCS successful reservoir optimisation will be key. This can
only be achieved through knowledge of the production rates of any well and accurate
models of the reservoir performance
The current practice of well testing for this information using a test separator system can
result in large uncertainties and potential bias. Further work is required to fully appreciate
the extent of test separator measurement uncertainties i.e. audits and additional data
Recovery factor is weakly affected by flow measurement errors directly. Only when flow
measurement data is used to select reservoir models does the effect become significant.
Potentially an additional 5% in recovery factor (absolute) can be achieved
The nature of well production is dynamic, periodic assessment (even every 30 days) is not
acceptable for accurate monitoring of well flows. Changes in water cut may not be picked
up till the next well test resulting in inefficiencies in production i.e. wells not optimised
For surface or subsea flow measurements, multiphase meters offer the most robust and
accurate continuous monitoring method. The use of multiphase meters on each well will
enable faster responses to changes conditions within a well
Well bore storage issues affect all surface flow rate measurements to some degree
resulting in dampened measurement results that can induce inaccuracies

33rd
International North Sea Flow Measurement Workshop
20th
– 23rd
October 2015
25
Downhole flow rate measurements are the most valuable sources of information for MER
as they provide real-time, continuous, and undampened reservoir responses. This provides
the most accurate and useful data for reservoir engineers in production optimisation
The above conclusions state the findings from the work from the scope of work items.
However, it is important to view these in terms of how they influence MER in the UKCS in
terms of flow measurement:
The current levels of flow measurement uncertainty found in industry are acceptable for
their impact on economic recovery as long as reservoir models are correct
A periodic test of production rates is not acceptable to ensure MER. Continuous
measurements would be the preferred option with periodic verification of the continuous
measurement
9 RECOMMENDATIONS
The following recommendations are made to provide industry with flow measurements that
do not hinder MER in the UKCS:
The use of multiphase meters on wells where it is economically viable to install one
(subject to well lifetime and production rates)
Development of historical trending or history matching methods for well test data to
ensure full use of the considerable data resources available
Investigation into the current applicability of downhole flow rate measurement
technologies and their reliability
The current assessment of well test uncertainties be expanded to the point where it is
statistically representative. This will include sourcing additional production and
process data as well as audit reports
More stringent reporting requirements of well production data to the regulator
10 ACKNOWLEDGMENTS
The authors would like to thank the following for their input to the study:
National Measurement and Regulation Office for providing funding for the project
Oil and Gas Authority for their guidance and direction
Operators in the North Sea for providing data to complete the uncertainty analysis
Coventry University for assessing the significance of measurement error on recovery
factor and hence MER

33rd
International North Sea Flow Measurement Workshop
20th
– 23rd
October 2015
26
11 REFERENCES
[1] Sir Ian Wood, UKCS Maximising Recovery Review: Final report, Feb 2014
[2] http://services.parliament.uk/bills/2015-16/energy.html
[3] OGA, Guidance Notes for Petroleum Measurement – Issue 9.2, Oct 2015
[4] https://www.gov.uk/government/uploads/system/uploads/attachment_data/file/458593/A5_O
GA_Overview.pdf
[5] Coventry University, Well Test Report, March 2015
[6] http://www.emersonprocessxperts.com/2014/01/importance-of-flow-measurement-for-
separators/
[7] Ross & Stobie, Well Testing – An evaluation of test separators and multiphase meters,
NSFMW 2010
[8] NEL Questionnaire issued to North Sea Operators, Jan 2015
[9] Basic concepts in well testing for reservoir description. Heriot Watt University -
http://www.afes.org.uk/uploads/files/1.%20Well%20Testing%20Res%20Des%20Concepts.pdf
[10] Ingvil, Uncertainty in multiphase flow estimates for a field development case. Norwegian
University of Science and Technology, MSc thesis, June 2013.
[11] E Toskey, RPSE An evaluation of flow modeling. The Letton-Hall Group, Final Report
07121-1301-Task4.Final, Sept 20, 2011
[12] Bekt R., & et al, 2011. Comparison of commercial multiphase flow simulations with
experimental and field databases. BHR Group’s Multiphase Production Technology
Conference in Cannes 2011
[13] Tekna. Handbook of Multiphase Flow Metering, Revision 2, March 2005. Norwegian society
for oil and gas measurement. Norsk Forening for OLJE Gassmaling
[14] Gaviria F & et al, 2010. First Ever Complete Evaluation of a Multiphase Flow Meter in
SAGD and Demonstration of the Performance Against Conventional Equipment. 28th
International North Sea Flow Measurement Workshop 26th- 29
th October 2010.
[15] Bjrlo J., 2013. Uncertainty in multiphase flow estimates for a field development case. Master
of Science in Engineering and ICT. Norwegian University of Science and Technology,
Department of Energy and Process Engineering.
[16] Mulitphase manufacturer data sheet
[17] Trading Economics - http://www.tradingeconomics.com/united-kingdom/indicators
[18] HM Treasury. Driving investment: a plan to reform the oil and gas fiscal regime, December
2014
[19] Manaf N.A.A., & et al, 2014. Effects of fiscal regime changes on investment climate of
Malaysia’s marginal oil fields: Proposal model. International Conference on Accounting
Studies 2014. ICAS 2014, 18-19 August 2014, Kuala Lumpur, Malaysia
[20] HM Revenue & Customs, 2014. Statistics of Government Revenues from UK oil and gas
production
[21] Gov.UK. Review of the oil and gas fiscal regime: a call for evidence –
www.gov.uk/government/consultation s/review-of-the-oil-and-gas-fiscal-regime
[22] Will The UK Rescue North Sea Oil? By Investopedia, March 12, 2015 -
http://www.investopedia.com/articles/investing/031215/will-uk-rescue-north-sea-oil.asp
[23] Am K., and Helberg S., 2014. Public-private partnership for improved hydrocarbon recovery -
Lesson from Norway's major development programs. Energy Strategy Review 3 (2014) 30-48
[24] Smith R.G & et al, 1998. The road ahead to real-time oil and gas management. Institution of
Chemical Engineers. Trans IChemE. Vol 76, Part A July 1998.
[25] NEL, Multiflow I, II and III JIPs, 2001 - 2011