Embed Size (px)
Citation preview
MAURY REGIONAL HOSPITAL
Annual Financial Report
June 30, 2016
iv Y A Certified Public Accountants

MAURY REGIONAL HOSPITAL
Table of Contents
June 30, 2016
I. INTRODUCTORY SECTION
Board of Trustees and Management Officials 1 Transmittal Letter 2
II. FINANCIAL SECTION
Independent Auditor's Report 3 Combined Statements of Net Position 6 Combined Statements of Revenue, Expenses and Changes in Net Position 8 Combined Statements of Cash Flows 10 Notes to Combined Financial Statements 12
III. REQUIRED SUPPLEMENTARY INFORMATION
Schedule of Changes in Net Pension Liability and Related Ratios 37 Schedule of Actuarial Contributions 38
IV. INTERNAL CONTROL AND COMPLIANCE SECTION
Report on Internal Control Over Financial Reporting and on Compliance and Other Matters Based on an Audit of the Financial Statements Performed in Accordance with Government Auditing Standards 39
Schedule of Expenditures of Federal Awards 41 Notes to Schedule of Expenditures of Federal Awards 42 Schedule of Findings and Questioned Costs 43 Schedule of Prior Audit Findings 45 Report On Compliance for Each Major Federal Program and Report On Internal Control Over Compliance in Accordance with Uniform Guidance 46

SECTION I
INTRODUCTORY SECTION
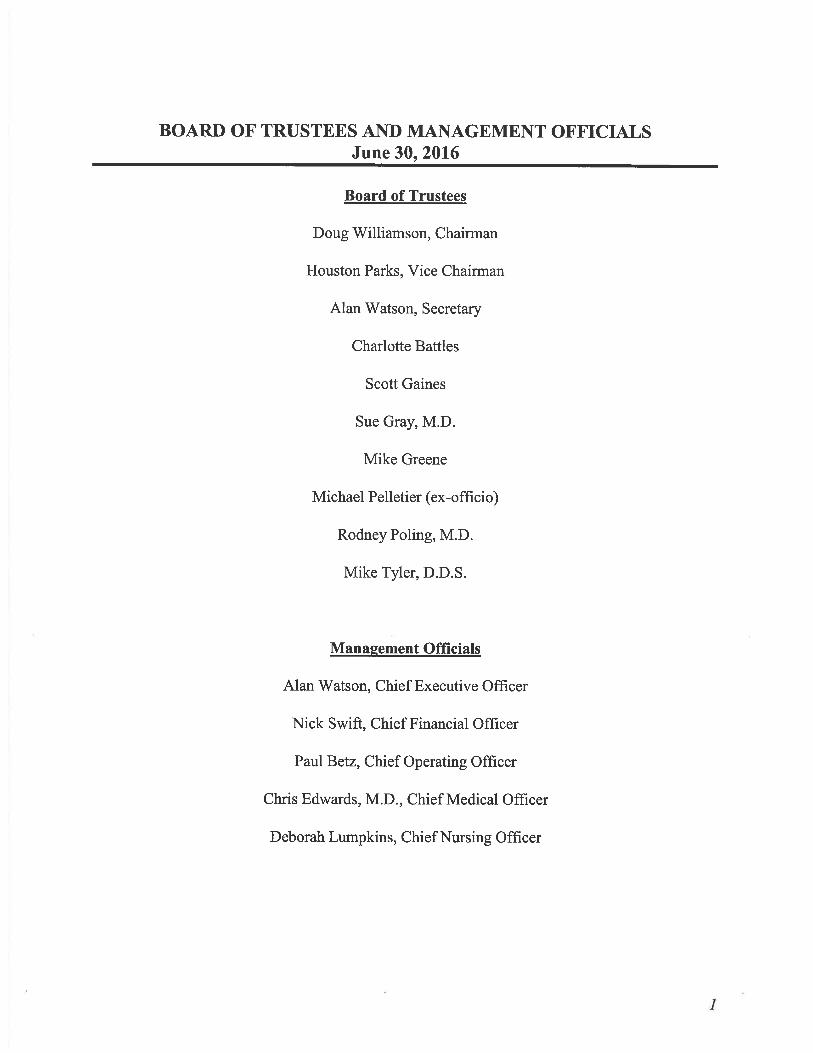
BOARD OF TRUSTEES AND MANAGEMENT OFFICIALS June 30, 2016
Board of Trustees
Doug Williamson, Chairman
Houston Parks, Vice Chairman
Alan Watson, Secretary
Charlotte Battles
Scott Gaines
Sue Gray, M.D.
Mike Greene
Michael Pelletier (ex-officio)
Rodney Poling, M.D.
Mike Tyler, D.D.S.
Management Officials
Alan Watson, Chief Executive Officer
Nick Swift, Chief Financial Officer
Paul Betz, Chief Operating Officer
Chris Edwards, M.D., Chief Medical Officer
Deborah Lumpkins, Chief Nursing Officer
I
MAURY REGIONAL MEDICAL CENTER
November 7, 2016
To the State of Tennessee - Comptroller of the Treasury Department of Audit & Municipal Division and Patrons of the Hospital:
State law requires all entities operating in the public sector to publish within six months of the close of each fiscal year a complete set of financial statements presented in conformity with accounting standards generally accepted in the United States of America. Pursuant to that requirement, we hereby issue this annual financial report for Maury Regional Hospital, headquartered in Columbia, Tennessee. The reporting period is the twelve months ended June 30, 2016.
Maury Regional Hospital (the Hospital), was created in 1953 by a Private Act of the State of Tennessee. The Hospital is a proprietary enterprise fund of Maury County, Tennessee and the nine members of the Board of Trustees are appointed by the Maury County Commission to three year terms.
As a proprietary enterprise fund of Maury County, the Hospital is required to use the same accounting principles generally accepted in the United States, otherwise known as GAAP, as similar Hospitals in the private sector. In addition to the Notes to the Financial Statements, GAAP prescribes three basic financial statements: Statement of Net Position, Statement of Revenues, Expenses and Changes in Net Position and Statement of Cash Flows.
If you have any questions about this report or need additional information, contact the Board of Trustees of Maury Regional Hospital at 1224 Trotwood Ave., Columbia, Tennessee 38401.
Respectfully Submitted,
ct';-(_1-• i-f-x.-,i-;-, &L"-)
Doug Williamson, Chairman Board of Trustees
2
1224 Trotwood Avenue • Columbia, TN 38401 • P: 931.381.1111 • mauryregional.com

SECTION II
FINANCIAL SECTION

4 :: 0 1 if I k Certified Public Accountants
PERSHING YOAKLEY & ASSOCIATES, P.C. One Cherokee Mills, 2220 Sutherland Avenue
Knoxville, TN 37919
p: (865) 673-0844 I f: (865) 673-0173 www.pyapc.com
INDEPENDENT AUDITOR'S REPORT
To the Board of Trustees of Maury Regional Hospital:
Report on the Combined Financial Statements
We have audited the accompanying combined financial statements of the business-type activities and aggregate discretely presented component units of Maury Regional Hospital (the Hospital), a part of the primary government of Maury County, Tennessee, as of and for the years ended June 30, 2016 and 2015, and the related notes to the combined financial statements, which collectively comprise the Hospital's basic financial statements as listed in the table of contents.
Management's Responsibility for the Combined Financial Statements
The Hospital's management is responsible for the preparation and fair presentation of these combined financial statements in accordance with accounting principles generally accepted in the United States of America; this includes the design, implementation, and maintenance of internal control relevant to the preparation and fair presentation of combined financial statements that are free from material misstatement, whether due to fraud or error.
Auditor's Responsibility
Our responsibility is to express opinions on these combined financial statements based on our audits. We conducted our audits in accordance with auditing standards generally accepted in the United States of America and the standards applicable to financial audits contained in Government Auditing Standards, issued by the Comptroller General of the United States. Those standards require that we plan and perform the audit to obtain reasonable assurance about whether the combined financial statements are free from material misstatement.
An audit involves performing procedures to obtain audit evidence about the amounts and disclosures in the combined financial statements. The procedures selected depend on the auditor's judgment, including the assessment of the risks of material misstatement of the combined financial statements, whether due to fraud or error. In making those risk assessments, the auditor considers internal control relevant to the Hospital's preparation and fair presentation of the combined financial statements in order to design audit procedures that are appropriate in the circumstances, but not for the purpose of expressing an opinion on the effectiveness of the Hospital's internal control. Accordingly, we express no such opinion. An audit also includes evaluating the appropriateness of accounting policies used and the reasonableness of significant accounting estimates made by management, as well as evaluating the overall presentation of the combined financial statements.
ATLANTA I KANSAS CITY I KNOXVILLE I NASHVILLE I TAMPA
3
We believe that the audit evidence we have obtained is sufficient and appropriate to provide a basis for our audit opinions.
Opinions
In our opinion, the combined financial statements referred to above present fairly, in all material respects, the financial position of the business-type activities and the aggregate discretely presented component units of Maury Regional Hospital as of June 30, 2016 and 2015, and the respective changes in financial position and, where applicable, cash flows thereof for the years then ended in accordance with accounting principles generally accepted in the United States of America.
Emphasis of Matter
As discussed in Note A, the combined financial statements present only the business-type activities and the aggregate discretely presented component units of Maury Regional Hospital and do not purport to, and do not, present fairly the financial position of Maury County, Tennessee as of June 30, 2016 and 2015, the changes in its financial position, or, where applicable, its cash flows for the years then ended in accordance with accounting principles generally accepted in the United States of America. Our opinion is not modified with respect to this matter.
Other Matters
Required Supplementary Information: Accounting principles generally accepted in the United States of America require that the Management's Discussion and Analysis (MD&A), the Schedule of Changes in Net Pension Liability and Related Ratios (shown on page 37) and the Schedule of Actuarial Contributions (shown on page 38) be presented to supplement the basic combined financial statements. Such information, although not a part of the basic combined financial statements, is required by the Governmental Accounting Standards Board, who considers it to be an essential part of financial reporting for placing the basic combined financial statements in an appropriate operational, economic, or historical context. However, Maury Regional Hospital has elected to omit the MD&A. Our opinion on the basic financial statements is not affected by this missing information.
We have applied certain limited procedures to the included required supplementary information in accordance with auditing standards generally accepted in the United States of America, which consisted of inquiries of management about the methods of preparing the information and comparing the information for consistency with management's responses to our inquiries, the basic combined financial statements, and other knowledge we obtained during our audit of the basic combined financial statements. We do not express an opinion or provide any assurance on the information because the limited procedures do not provide us with sufficient evidence to express an opinion or provide any assurance.
4
Other Information: Our audit was conducted for the purpose of forming an opinion on the Hospital's basic combined financial statements. The accompanying Schedule of Expenditures of Federal Awards, as required by the audit requirements of Title 2 U.S. Code of Federal Regulations (CFR) Part 200, Uniform Administrative Requirements, Cost Principles, and Audit Requirements for Federal Awards (Uniform Guidance), is presented for purposes of additional analysis and is not a required part of the basic combined financial statements.
The Schedule of Expenditures of Federal Awards is the responsibility of management and was derived from and relate directly to the underlying accounting and other records used to prepare the basic combined financial statements. Such information has been subjected to the auditing procedures applied in the audit of the basic combined financial statements and certain additional procedures, including comparing and reconciling such information directly to the underlying accounting and other records used to prepare the basic combined financial statements or to the basic combined financial statements themselves, and other additional procedures in accordance with auditing standards generally accepted in the United States of America. In our opinion, the Schedule of Expenditures of Federal is fairly stated in all material respects in relation to the basic combined financial statements as a whole.
Other Reporting Required by Government Auditing Standards
In accordance with Government Auditing Standards, we have also issued our report dated November 7, 2016 on our consideration of the Hospital's internal control over financial reporting and on our tests of its compliance with certain provisions of laws, regulations, contracts and grant agreements and other matters. The purpose of that report is to describe the scope of our testing of internal control over financial reporting and compliance and the results of that testing, and not to provide an opinion on the internal control over financial reporting or on compliance. That report is an integral part of an audit performed in accordance with Government Auditing Standards in considering the Hospital's internal control over financial reporting and compliance.
Knoxville, Tennessee November 7, 2016, except for our
report on Other Information which is dated January 9, 2017
5
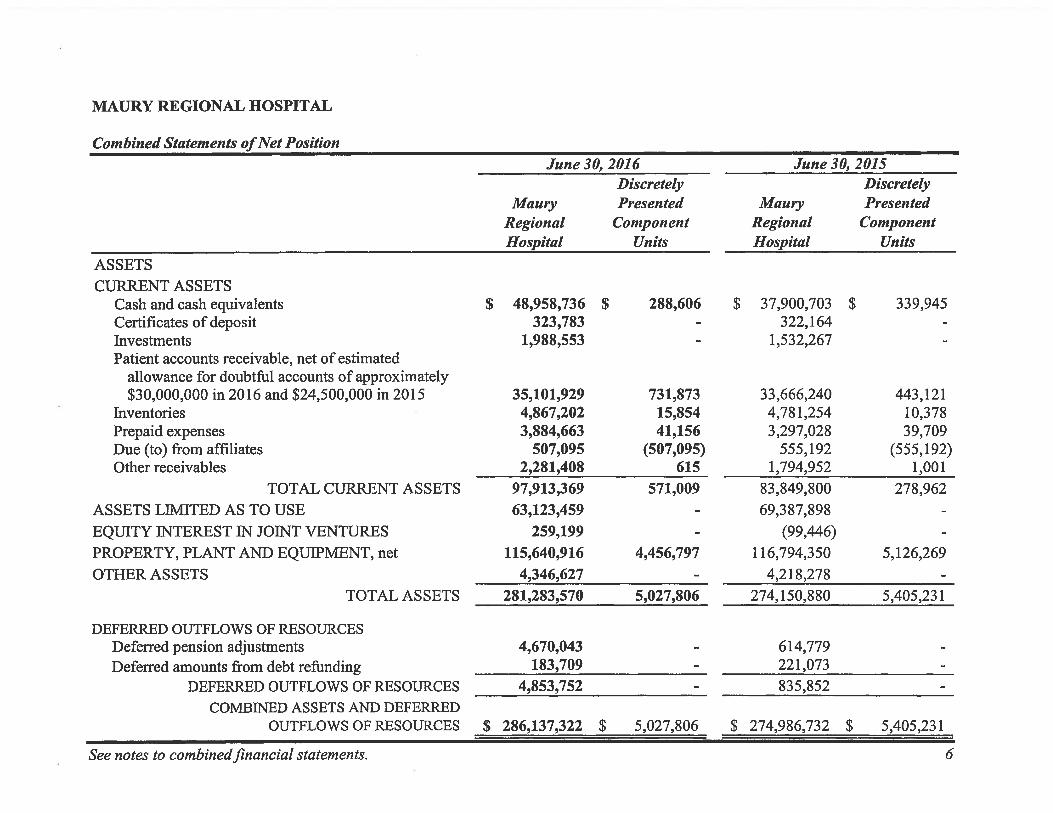
MAURY REGIONAL HOSPITAL
Combined Statements of Net Position June 30, 2016 June 30, 2015
Maury Regional Hospital
Discretely Presented
Component Units
Maury Regional Hospital
Discretely Presented
Component Units
ASSETS CURRENT ASSETS
Cash and cash equivalents $ 48,958,736 $ 288,606 $ 37,900,703 $ 339,945 Certificates of deposit 323,783 322,164 Investments 1,988,553 1,532,267 Patient accounts receivable, net of estimated
allowance for doubtful accounts of approximately $30,000,000 in 2016 and $24,500,000 in 2015 35,101,929 731,873 33,666,240 443,121
Inventories 4,867,202 15,854 4,781,254 10,378 Prepaid expenses 3,884,663 41,156 3,297,028 39,709 Due (to) from affiliates 507,095 (507,095) 555,192 (555,192) Other receivables 2,281,408 615 1,794,952 1,001
TOTAL CURRENT ASSETS 97,913,369 571,009 83,849,800 278,962 ASSETS LIMITED AS TO USE 63,123,459 69,387,898 EQUITY INTEREST IN JOINT VENTURES 259,199 (99,446) PROPERTY, PLANT AND EQUIPMENT, net 115,640,916 4,456,797 116,794,350 5,126,269 OTHER ASSETS 4,346,627 4,218,278
TOTAL ASSETS 281,283,570 5,027,806 274,150,880 5,405,231
DEFERRED OUTFLOWS OF RESOURCES Deferred pension adjustments 4,670,043 614,779 Deferred amounts from debt refunding 183,709 221,073
DEFERRED OUTFLOWS OF RESOURCES 4,853,752 835,852 COMBINED ASSETS AND DEFERRED
OUTFLOWS OF RESOURCES $ 286,137,322 $ 5,027,806 $ 274,986,732 $ 5,405,231
See notes to combined financial statements. 6
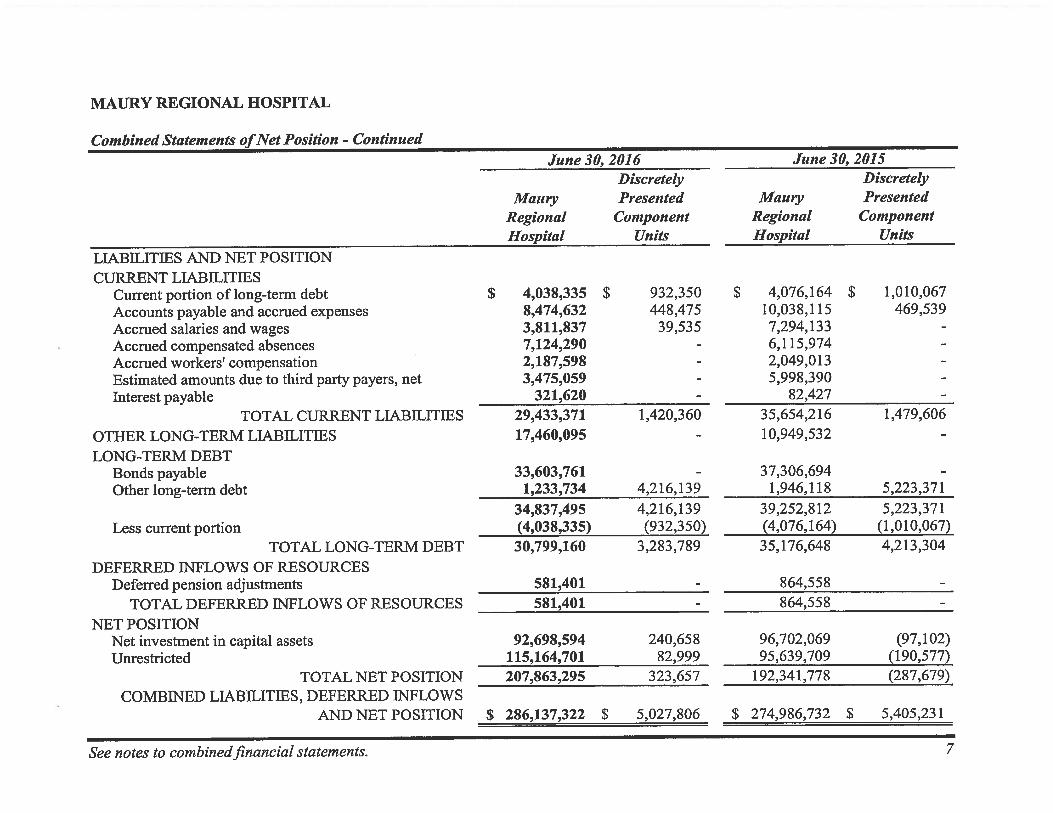
MAURY REGIONAL HOSPITAL
Combined Statements of Net Position - Continued June 30, 2016 June 30, 2015
Maury Regional Hospital
Discretely Presented
Component Units
Maury Regional Hospital
Discretely Presented
Component Units
LIABILITIES AND NET POSITION CURRENT LIABILITIES
Current portion of long-term debt $ 4,038,335 $ 932,350 $ 4,076,164 $ 1,010,067 Accounts payable and accrued expenses 8,474,632 448,475 10,038,115 469,539 Accrued salaries and wages 3,811,837 39,535 7,294,133 Accrued compensated absences 7,124,290 6,115,974 Accrued workers' compensation 2,187,598 2,049,013 Estimated amounts due to third party payers, net 3,475,059 5,998,390 Interest payable 321,620 82,427
TOTAL CURRENT LIABILITIES 29,433,371 1,420,360 35,654,216 1,479,606 OTHER LONG-TERM LIABILITIES 17,460,095 10,949,532 LONG-TERM DEBT
Bonds payable 33,603,761 37,306,694 Other long-term debt 1,233,734 4,216,139 1,946,118 5,223,371
34,837,495 4,216,139 39,252,812 5,223,371 Less current portion (4,038,335) (932,350) (4,076,164) (1,010,067)
TOTAL LONG-TERM DEBT 30,799,160 3,283,789 35,176,648 4,213,304 DEFERRED INFLOWS OF RESOURCES
Deferred pension adjustments 581,401 864,558 TOTAL DEFERRED INFLOWS OF RESOURCES 581,401 864,558
NET POSITION Net investment in capital assets 92,698,594 240,658 96,702,069 (97,102) Unrestricted 115,164,701 82,999 95,639,709 (190,577)
TOTAL NET POSITION 207,863,295 323,657 192,341,778 (287,679) COMBINED LIABILITIES, DEFERRED INFLOWS
AND NET POSITION $ 286,137,322 $ 5,027,806 $ 274,986,732 $ 5,405,231
See notes to combined financial statements. 7
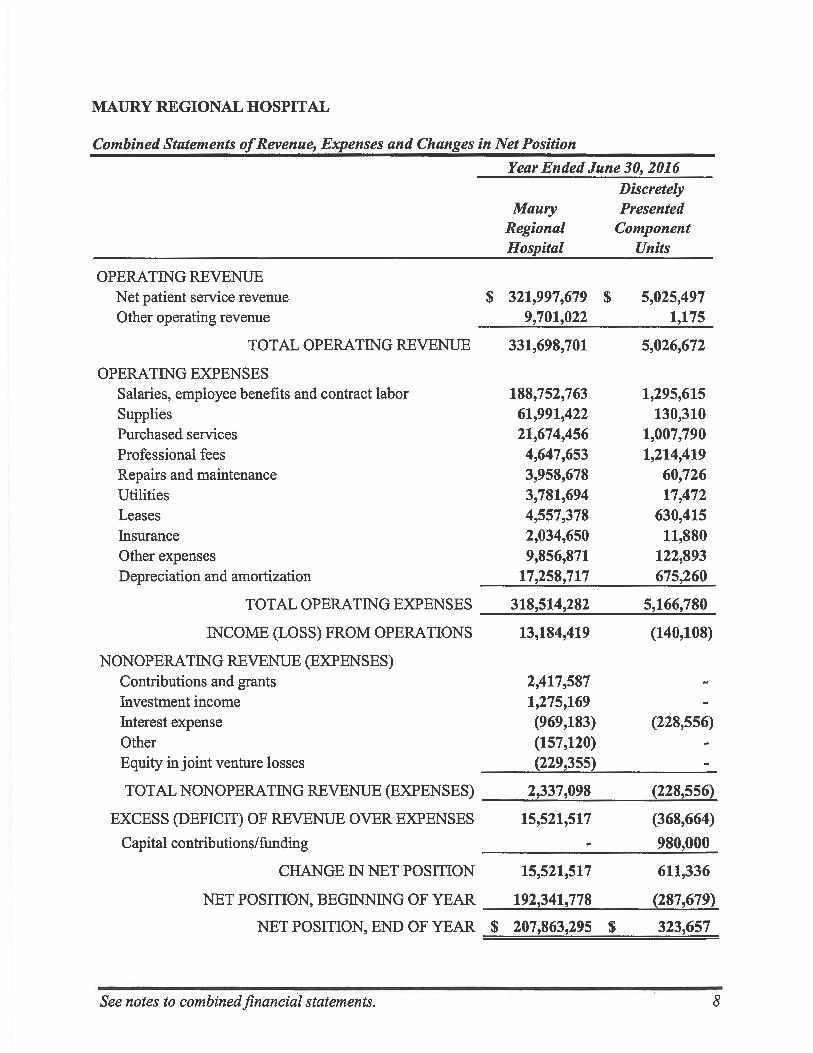
MAURY REGIONAL HOSPITAL
Combined Statements of Revenue, Expenses and Changes in Net Position
Year Ended June 30, 2016
Maury Regional Hospital
Discretely Presented
Component Units
OPERATING REVENUE Net patient service revenue $ 321,997,679 $ 5,025,497 Other operating revenue 9,701,022 1,175
TOTAL OPERATING REVENUE 331,698,701 5,026,672
OPERATING EXPENSES Salaries, employee benefits and contract labor 188,752,763 1,295,615 Supplies 61,991,422 130,310 Purchased services 21,674,456 1,007,790 Professional fees 4,647,653 1,214,419 Repairs and maintenance 3,958,678 60,726 Utilities 3,781,694 17,472 Leases 4,557,378 630,415 Insurance 2,034,650 11,880 Other expenses 9,856,871 122,893 Depreciation and amortization 17,258,717 675,260
TOTAL OPERATING EXPENSES 318,514,282 5,166,780
INCOME (LOSS) FROM OPERATIONS 13,184,419 (140,108)
NONOPERATING REVENUE (EXPENSES) Contributions and grants 2,417,587 Investment income 1,275,169 Interest expense (969,183) (228,556) Other (157,120) Equity in joint venture losses (229,355)
TOTAL NONOPERATING REVENUE (EXPENSES) 2,337,098 (228,556)
EXCESS (DEFICIT) OF REVENUE OVER EXPENSES 15,521,517 (368,664)
Capital contributions/funding 980,000
CHANGE IN NET POSITION 15,521,517 611,336
NET POSITION, BEGINNING OF YEAR 192,341,778 (287,679)
NET POSITION, END OF YEAR $ 207,863,295 $ 323,657
See notes to combined financial statements. 8
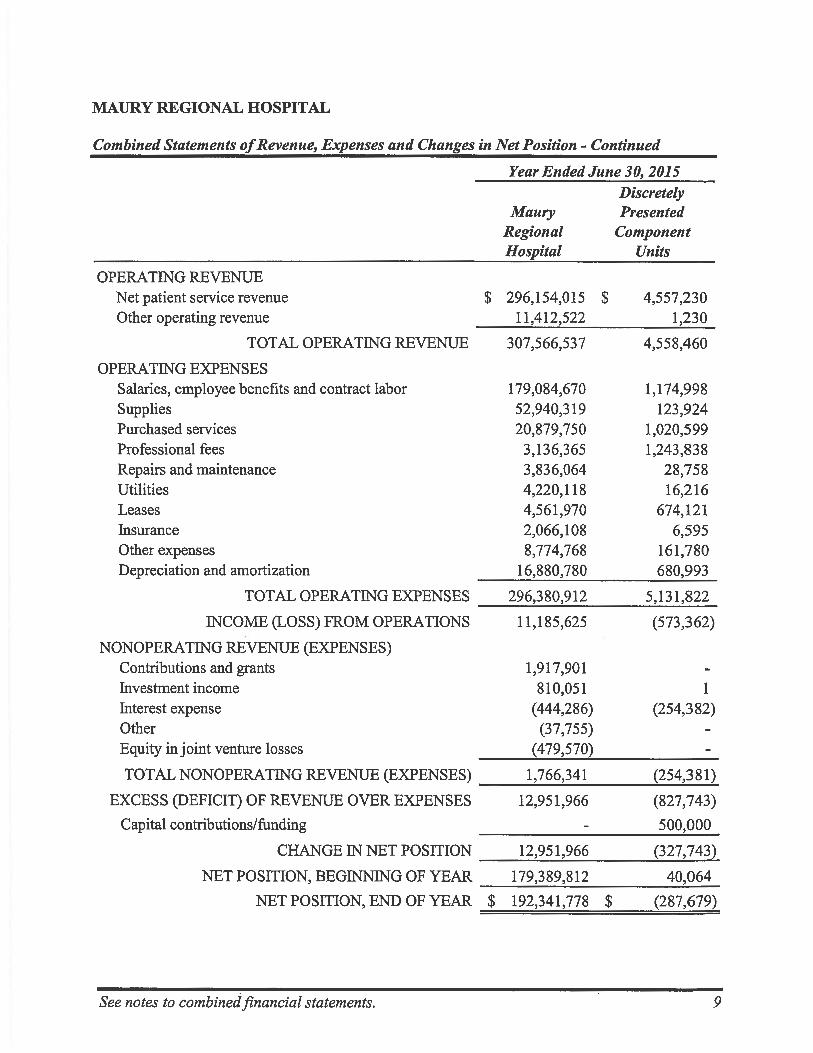
MAURY REGIONAL HOSPITAL
Combined Statements of Revenue, Expenses and Changes in Net Position - Continued
Year Ended June 30, 2015
Maury Regional Hospital
Discretely Presented
Component Units
OPERATING REVENUE Net patient service revenue $ 296,154,015 $ 4,557,230 Other operating revenue 11,412,522 1,230
TOTAL OPERATING REVENUE 307,566,537 4,558,460
OPERATING EXPENSES Salaries, employee benefits and contract labor 179,084,670 1,174,998 Supplies 52,940,319 123,924 Purchased services 20,879,750 1,020,599 Professional fees 3,136,365 1,243,838 Repairs and maintenance 3,836,064 28,758 Utilities 4,220,118 16,216 Leases 4,561,970 674,121 Insurance 2,066,108 6,595 Other expenses 8,774,768 161,780 Depreciation and amortization 16,880,780 680,993
TOTAL OPERATING EXPENSES 296,380,912 5,131,822
INCOME (LOSS) FROM OPERATIONS 11,185,625 (573,362)
NONOPERATING REVENUE (EXPENSES) Contributions and grants 1,917,901 Investment income 810,051 1 Interest expense (444,286) (254,382) Other (37,755) Equity in joint venture losses (479,570)
TOTAL NONOPERATING REVENUE (EXPENSES) 1,766,341 (254,381)
EXCESS (DEFICIT) OF REVENUE OVER EXPENSES 12,951,966 (827,743)
Capital contributions/funding 500,000
CHANGE IN NET POSITION 12,951,966 (327,743)
NET POSITION, BEGINNING OF YEAR 179,389,812 40,064
NET POSITION, END OF YEAR $ 192,341,778 $ (287,679)
See notes to combined financial statements. 9

MAURY REGIONAL HOSPITAL
Combined Statements of Cash Flows
Year Ended June 30, 2016 2015
CASH FLOWS FROM OPERATING ACTIVITIES: Receipts from patients and insurance programs $ 319,285,638 $ 296,419,251 Payments to vendors for supplies and other (114,739,868) (100,499,927) Payments to and on behalf of employees (186,107,731) (179,776,501) Other receipts 4,998,818 9,856,998
NET CASH PROVIDED BY OPERATING ACTIVITIES 23,436,857 25,999,821
CASH FLOWS FROM NONCAPITAL FINANCIAL ACTIVITIES: Contributions and grants 2,417,587 1,917,901
CASH FLOWS FROM CAPITAL AND RELATED FINANCING ACTIVITIES: Acquisition of property, plant and equipment (16,713,069) (15,621,477) Proceeds from sale of equipment 978,962 63,411 Proceeds from issuance of long-term debt 34,186,582 Payments on long-term debt (4,142,384) (13,714,312) Interest paid on long-term debt (1,035,559) (569,316) Deferred amounts from bond refunding (221,073)
NET CASH PROVIDED BY (USED IN) CAPITAL AND RELATED FINANCING ACTIVITIES (20,912,050) 4,123,815
CASH FLOWS FROM INVESTING ACTIVITIES: Interest income received on cash and investments 1,275,169 810,051 Proceeds from maturities of certificates of deposit 645,947 642,415 Purchase of certificates of deposit (647,566) (644,328) Purchases of investments and AWUL 5,808,153 (30,996,877) Investment in joint venture (588,000) (300,000) Issuance of notes receivable (378,064) (729,223)
NET CASH PROVIDED BY (USED IN) INVESTING ACTIVITIES 6,115,639 (31,217,962)
INCREASE IN CASH AND CASH EQUIVALENTS 11,058,033 823,575
CASH AND CASH EQUIVALENTS, BEGINNING OF YEAR 37,900,703 37,077,128
CASH AND CASH EQUIVALENTS, END OF YEAR $ 48,958,736 $ 37,900,703
See notes to combined financial statements. 10
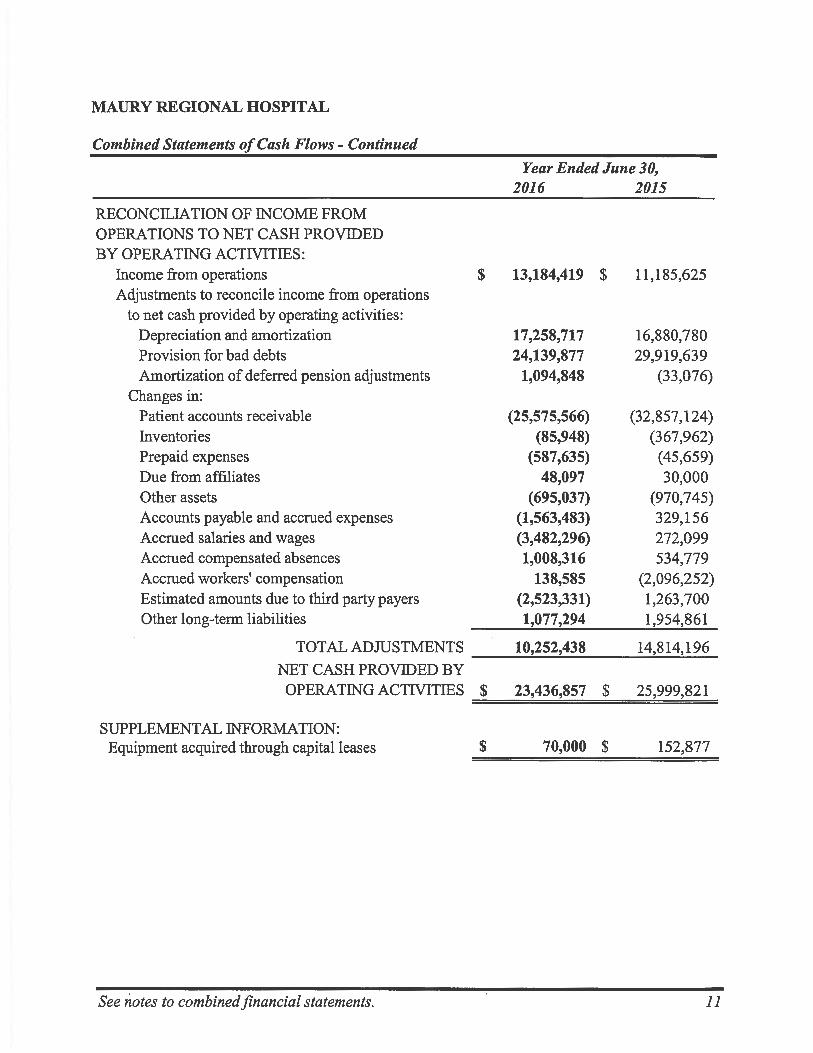
MAURY REGIONAL HOSPITAL
Combined Statements of Cash Flows - Continued
Year Ended June 30, 2016 2015
RECONCILIATION OF INCOME FROM OPERATIONS TO NET CASH PROVIDED BY OPERATING ACTIVITIES:
Income from operations $ 13,184,419 $ 11,185,625 Adjustments to reconcile income from operations
to net cash provided by operating activities: Depreciation and amortization 17,258,717 16,880,780 Provision for bad debts 24,139,877 29,919,639 Amortization of deferred pension adjustments 1,094,848 (33,076)
Changes in: Patient accounts receivable (25,575,566) (32,857,124) Inventories (85,948) (367,962) Prepaid expenses (587,635) (45,659) Due from affiliates 48,097 30,000 Other assets (695,037) (970,745) Accounts payable and accrued expenses (1,563,483) 329,156 Accrued salaries and wages (3,482,296) 272,099 Accrued compensated absences 1,008,316 534,779 Accrued workers' compensation 138,585 (2,096,252) Estimated amounts due to third party payers (2,523,331) 1,263,700 Other long-term liabilities 1,077,294 1,954,861
TOTAL ADJUSTMENTS 10,252,438 14,814,196 NET CASH PROVIDED BY OPERATING ACTIVITIES $ 23,436,857 $ 25,999,821
SUPPLEMENTAL INFORMATION: Equipment acquired through capital leases $ 70,000 $ 152,877
See notes to combined financial statements. 11
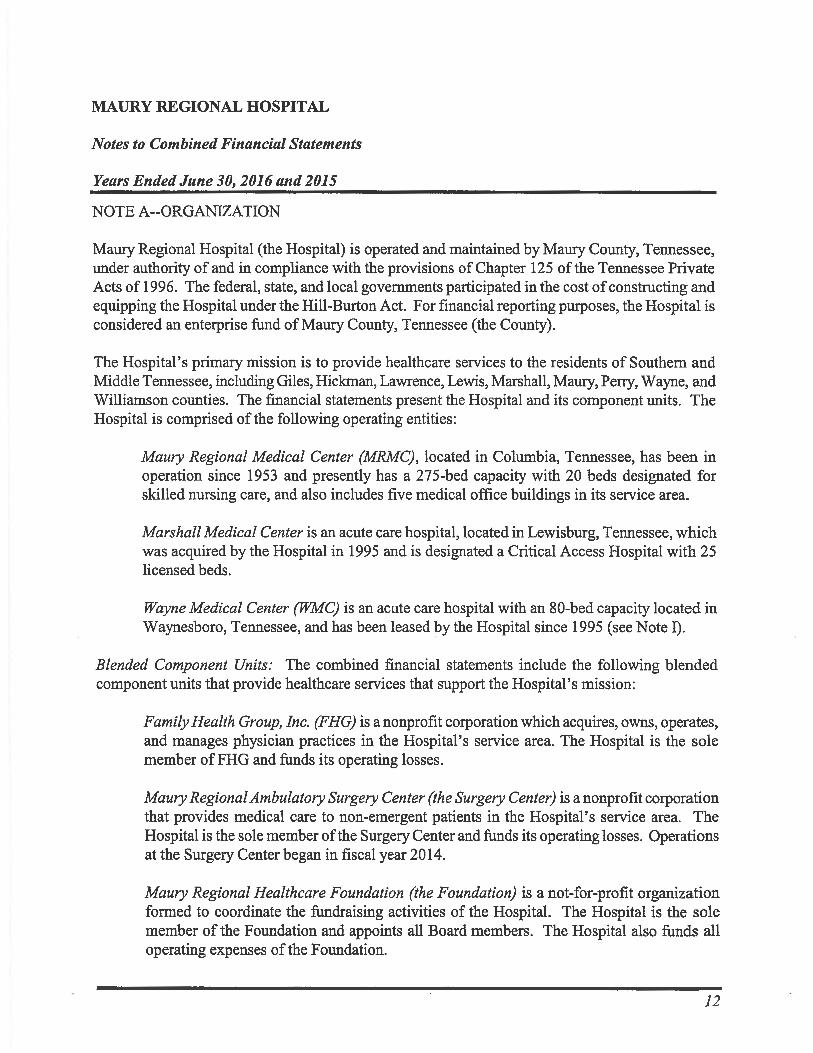
MAURY REGIONAL HOSPITAL
Notes to Combined Financial Statements
Years Ended June 30, 2016 and 2015
NOTE A--ORGANIZATION
Maury Regional Hospital (the Hospital) is operated and maintained by Maury County, Tennessee, under authority of and in compliance with the provisions of Chapter 125 of the Tennessee Private Acts of 1996. The federal, state, and local governments participated in the cost of constructing and equipping the Hospital under the Hill-Burton Act. For financial reporting purposes, the Hospital is considered an enterprise fund of Maury County, Tennessee (the County).
The Hospital's primary mission is to provide healthcare services to the residents of Southern and Middle Tennessee, including Giles, Hickman, Lawrence, Lewis, Marshall, Maury, Perry, Wayne, and Williamson counties. The financial statements present the Hospital and its component units. The Hospital is comprised of the following operating entities:
Maury Regional Medical Center (MRMC), located in Columbia, Tennessee, has been in operation since 1953 and presently has a 275-bed capacity with 20 beds designated for skilled nursing care, and also includes five medical office buildings in its service area.
Marshall Medical Center is an acute care hospital, located in Lewisburg, Tennessee, which was acquired by the Hospital in 1995 and is designated a Critical Access Hospital with 25 licensed beds.
Wayne Medical Center (WMC) is an acute care hospital with an 80-bed capacity located in Waynesboro, Tennessee, and has been leased by the Hospital since 1995 (see Note I).
Blended Component Units: The combined financial statements include the following blended component units that provide healthcare services that support the Hospital's mission:
Family Health Group, Inc. (FHG) is a nonprofit corporation which acquires, owns, operates, and manages physician practices in the Hospital's service area. The Hospital is the sole member of FHG and funds its operating losses.
Maury Regional Ambulatory Surgery Center (the Surgery Center) is a nonprofit corporation that provides medical care to non-emergent patients in the Hospital's service area. The Hospital is the sole member of the Surgery Center and funds its operating losses. Operations at the Surgery Center began in fiscal year 2014.
Maury Regional Healthcare Foundation (the Foundation) is a not-for-profit organization formed to coordinate the fundraising activities of the Hospital. The Hospital is the sole member of the Foundation and appoints all Board members. The Hospital also funds all operating expenses of the Foundation.
12
MAURY REGIONAL HOSPITAL
Notes to Combined Financial Statements - Continued
Years Ended June 30, 2016 and 2015
Discretely Presented Component Units: The discretely presented component units column in the financial statements includes joint ventures in which the Hospital has a majority ownership. The Hospital's intent in owning a portion of these joint ventures is to expand the healthcare services it provides. They are reported in a separate column to emphasize that they are legally separate from the Hospital and include the following entities:
Spring Hill Imaging Center, LLC (the Imaging Center) owns and operates an outpatient center that provides diagnostic and radiology services to patients in the Hospital's service area. The Imaging Center is owned 51% by the Hospital. The financial reports of the Imaging Center may be obtained by mailing a request to 5421 Main Street, Spring Hill, Tennessee 37174.
Vanderbilt-Maury Radiation Oncology, LLC (VMRO) owns and operates an outpatient center that provides radiation oncology treatment services to patients in the Hospital's service area. VMRO is owned 60% by the Hospital. Operations at VMRO began in fiscal year 2014. The financial reports of VMRO may be obtained by mailing a request to 1003 Reserve Boulevard, Suite 120, Spring Hill, Tennessee 37174.
NOTE B--SUMMARY OF SIGNIFICANT ACCOUNTING POLICIES
Method of Accounting: The Hospital utilizes the enterprise fund method of accounting. Revenue and expenses are recorded on the accrual basis using the economic resources measurement focus.
Estimates: The preparation of the combined financial statements in conformity with accounting principles generally accepted in the United States of America requires management to make estimates and assumptions that affect the reported amounts of assets and liabilities and disclosure of contingent assets and liabilities at the date of the combined financial statements and the reported amounts of revenue and expenses during the reporting period. Actual results could differ from those estimates.
Cash and Cash Equivalents: Cash and cash equivalents includes cash on hand, deposits in banks and investments with a maturity of three months or less when purchased, excluding any amounts whose use is limited by Board designation.
Inventories: Inventories consist principally of medical and surgical supplies and are reported at the lower of cost or market, with cost determined by the average cost method.
Patient Accounts Receivable: Patient accounts receivable are reported net of an estimated allowance for contractual adjustments and an estimated allowance for uncollectible accounts. The contractual allowance represents the difference between established billing rates and estimated reimbursement from Medicare, TennCare and other third party payer programs. The bad debt allowance is estimated
13
MAURY REGIONAL HOSPITAL
Notes to Combined Financial Statements - Continued
Years Ended June 30, 2016 and 2015
based upon the age of the account, prior experience and any unusual circumstances which affect the collectibility. The Hospital's policy does not require collateral or other security for patient accounts receivable and the Hospital routinely accepts assignment of, or is otherwise entitled to receive, patient benefits payable under health insurance programs, plans or policies.
Investments and Assets Limited as to Use: Investments and assets limited as to use are reported at estimated fair value based on quoted market prices. Interest, dividends, and gains and losses (realized and unrealized) are included in investment income. The Board has designated certain assets as limited as to use for future capital improvements. Included in assets limited as to use is approximately $11,900,000 restricted for future capital additions.
Property, Plant and Equipment: Property, plant and equipment is reported at cost or fair value at date of gift, if donated. The Hospital has established a capitalization threshold of $1,000. Depreciation is calculated by the straight-line method to allocate the cost of the assets (other than land) over their estimated useful lives which ranges from 3 to 20 years for equipment and 10 to 40 years for buildings and land improvements. Equipment held under capital lease obligations is amortized using the straight-line method over the shorter of the estimated useful life or the lease term. This amortization is included with depreciation expense and as part of accumulated depreciation in the combined financial statements. Interest costs incurred on applicable borrowings outstanding during the construction period of capital assets is capitalized as part of the cost of acquiring the asset and is amortized on the same basis as the related capital asset. Costs of maintenance and repairs are charged to expense when incurred. The Hospital periodically reviews property, plant, and equipment for indications of potential impairment. Management does not believe any impairment exists as of June 30, 2016.
Intangible Assets: Intangible assets, including goodwill, are amortized over their estimated useful life and included in other assets in the combined financial statements.
Compensated Absences: The Hospital's employees earn paid time off at varying rates depending on years of service. An accrual for paid time off is recorded in the period in which the employee earns the right to the compensation. Prior to July 1, 2015, employees also earned sick leave benefits based on varying rates depending on years of service and accumulated sick leave up to a specified maximum. Employees were not paid for accumulated sick leave if they left before retirement. However, employees who retired after the age of sixty could convert accumulated sick leave to termination payments. The estimated amount of sick leave which will ultimately be payable as termination payments totals approximately $1,090,000 and $1,170,000 at June 30, 2016 and 2015, respectively, and is reported as a noncurrent liability in the combined financial statements. The Hospital's paid time off policy was amended effective July 1, 2015 to eliminate future sick pay accruals and freeze existing sick pay accrual amounts at their June 30, 2015 amounts. In addition, the accrual for compensated absences at June 30, 2015 was modified to utilize a "years of service" factor which served to reduce the amount recorded. Due to uncertainties in this estimate, it is at least reasonably possible that management's estimate could change in 2017.
14
MAURY REGIONAL HOSPITAL
Notes to Combined Financial Statements - Continued
Years Ended June 30, 2016
Net Position: Net investment in capital assets consists of capital assets, net of accumulated depreciation and reduced by the balances of any outstanding borrowings used to finance the purchase or construction of those assets. Unrestricted net position is remaining assets that do not meet the definition of net investment in capital assets. There were no assets in a restricted position at June 30, 2016.
Net Patient Service Revenue: Net patient service revenue is reported as services are rendered at estimated net realizable amounts, including estimated retroactive revenue adjustments under reimbursement agreements with third party payers. Estimated settlements under third party reimbursement agreements are accrued in the period the related services are rendered and adjusted in future periods as final settlements are determined. An estimated provision for bad debts is included in net patient service revenue.
Charity Care: The Hospital provides care without charge to patients who meet certain criteria under its charity care policy. Because the Hospital does not pursue collection of amounts determined to qualify as charity care, they are not reported as net patient service revenue.
Operating Activities: The Hospital defines operating activities as reported on the Combined Statements of Revenue, Expenses and Changes in Net Position as those that generally result from exchange transactions, such as payments for providing services and payments for goods and services received. Non-exchange transactions, including contributions and grants, as well as investment income and interest expense, are considered nonoperating revenue and expenses.
Contributions and Grants: Revenues from contributions and grants are recognized when all eligibility requirements are met. Contributions and grants may be restricted for specific operating purposes or for capital purposes. Amounts that are unrestricted or that are restricted to a specific operating purpose are reported as nonoperating revenue. Amounts restricted to capital acquisitions, if any, are reported after nonoperating revenue and expenses.
Income Taxes: The Hospital meets the Internal Revenue Service definition of a governmental unit and is exempt from federal income taxes. As taxable entities, the owners of the Imaging Center and VMRO account for income taxes in accordance with Financial Accounting Standards Board (FASB) Accounting Standards Codification (ASC) 740, Income Taxes. At June 30, 2016, management does not believe the Hospital holds any uncertain tax positions that would require financial statement recognition or disclosure.
Subsequent Events: The Hospital evaluated all events or transactions that occurred after June 30, 2016 through November 7, 2016, the date the combined financial statements were available to be issued. Management did not note any subsequent events that required recognition or disclosure in the combined financial statements.
15

MAURY REGIONAL HOSPITAL
Notes to Combined Financial Statements - Continued
Years Ended June 30, 2016 and 2015
Reclassifications: Certain 2015 amounts in the accompanying combined financial statements have been reclassified to conform with the 2016 presentation.
Recently Issued/Adopted Accounting Pronouncements: In February 2015, the Governmental Accounting Standards Board (GASB) issued Statement No. 72, Fair Value Measurement and Application, which prescribes how governmental entities should define and measure fair value, provides guidance on which assets and liabilities should be measured at fair value, and expands disclosures related to fair value measurements. The Statement amends the definition of fair value currently utilized by GASB and defines fair value as the price that would be received to sell an asset or paid to transfer a liability in an orderly transaction between market participants at the measurement date. Fair value is described as an exit price. The Statement assumes that the transaction occurs in the principal, or most advantageous, market for the asset or liability and fair value is to be determined using one of three valuation approaches: market, cost, or income. The market approach uses prices and other relevant information generated by market transactions involving identical or comparable assets, liabilities, or a group of assets and liabilities. The cost approach reflects the amount that would be required to replace the present service capacity of an asset. The income approach converts future amounts, such as cash flows or income and expenses, to a single, current, discounted amount. The Statement generally requires investments to be measured at fair value and defines an investment as a security or other asset that (a) a governmental entity holds primarily for the purpose of income or profit and (b) has a present service capacity based solely on its ability to generate cash or to be sold to generate cash. A government entity is permitted in certain circumstances to establish the fair value of an investment that does not have a readily determinable fair value by using the net asset value per share, or its equivalent, of the investment. The Statement establishes a hierarchy of inputs to valuation techniques used to measure fair value. That hierarchy has three levels. Level 1 inputs are quoted prices, unadjusted, in active markets for identical assets or liabilities. Level 2 inputs are inputs, other than quoted prices, included within Level 1 that are observable for the asset or liability, either directly or indirectly. Level 3 inputs are unobservable inputs. The provisions of this Statement are effective for fiscal years beginning after June 15, 2015. The Hospital adopted this Statement during 2016, and it did not have a significant impact on the financial statements.
NOTE C--PATIENT SERVICE REVENUE AND ACCOUNTS RECEIVABLE
The Hospital has agreements with various third party payers that provide for payments to the Hospital at amounts different from established rates. The difference between the rates charged and the estimated payments from third party payers is recorded as a reduction of gross patient service charges. Revenue for patient service charges has been adjusted to the amounts estimated to be receivable under third party payer arrangements. Amounts recorded under these contractual arrangements are subject to review and fmal determination by various program intermediaries. Management believes that adequate provision has been made for any adjustments which may result from such reviews. However, due to uncertainties in the estimates, it is at least reasonably possible
16
MAURY REGIONAL HOSPITAL
Notes to Combined Financial Statements - Continued
Years Ended June 30, 2016 and 2015
that management's estimates will change in 2017. Net patient service revenue for the year ended June 30, 2016 increased by approximately $770,000 and decreased by approximately $820,000 for the year ended June 30, 2015, due to adjustments of estimates or final settlements of prior periods.
A summary of the payment arrangements with significant third party payers follows:
Medicare: Inpatient acute care services and outpatient services rendered to Medicare program beneficiaries are paid primarily on a prospective basis. These rates vary according to a patient classification system that is based on clinical diagnosis, procedures utilized and other factors. The Medicare program continues to reimburse certain other services based on a per diem or on a percentage of cost up to predetermined limits. The Hospital also receives additional payments from the Medicare program for providing services to a disproportionate share of Medicaid (TennCare) and other low income patients and such amounts are not guaranteed in future periods. Approximately $11,400,000 and $11,700,000 of net patient accounts receivable are due from the Medicare program at June 30, 2016 and 2015, respectively.
TennCare: The State of Tennessee's Medicaid waiver program (TennCare) provides coverage through several managed care organizations. TennCare reimbursement for both inpatient and outpatient services is based upon prospectively determined rates and per diem amounts. Approximately $2,800,000 and $2,900,000 of net patient accounts receivable are from payers under the TennCare program at June 30, 2016 and 2015.
During 2016 and 2015, the Hospital received additional distributions under the TennCare Essential Access, federal matching and other programs totaling approximately $2,100,000 and $2,340,000 respectively. Future distributions under these programs are not guaranteed. Such amounts are subject to potential recoupment.
Other Payers: The Hospital has also entered into payment agreements with certain commercial insurance carriers, health maintenance organizations, and preferred provider organizations. The basis for payment to the Hospital under these agreements includes prospectively determined rates, discounts from established charges, and prospectively determined per diem amounts.
Charity Care: The Hospital provides care without charge to patients who meet certain criteria under its charity care policy. Because the Hospital does not pursue collection of amounts determined to qualify as charity care, they are not reported as net patient revenue. The estimated direct and indirect cost of providing these services totaled approximately $4,900,000 and $5,800,000 in 2016 and 2015, respectively. Such costs are determined using a ratio of cost to charges analysis with indirect cost allocated under a reasonable and systematic approach.
A reconciliation of the amount of services provided to patients at established rates to net patient service revenue is as follows:
17
MAURY REGIONAL HOSPITAL
Notes to Combined Financial Statements - Continued
Years Ended June 30, 2016 and 2015
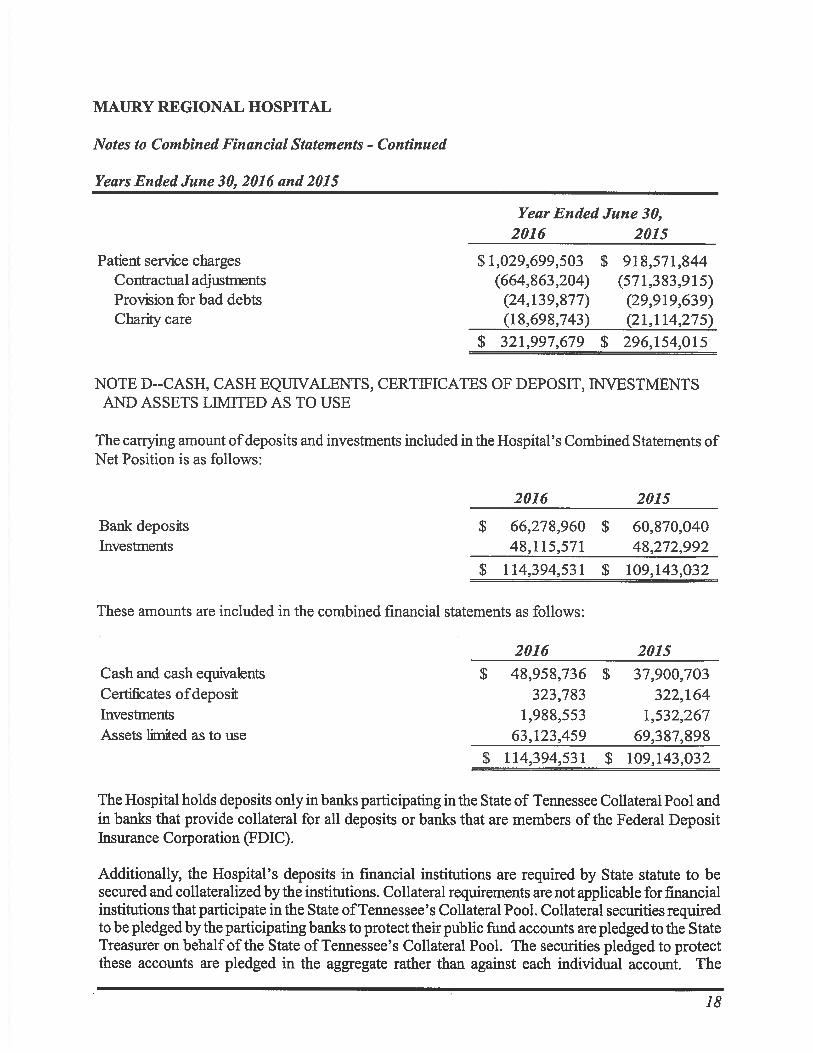
Year Ended June 30, 2016 2015
Patient service charges $ 1,029,699,503 $ 918,571,844 Contractual adjustments (664,863,204) (571,383,915) Provision for bad debts (24,139,877) (29,919,639) Charity care (18,698,743) (21,114,275)
$ 321,997,679 $ 296,154,015
NOTE D--CASH, CASH EQUIVALENTS, CERTIFICATES OF DEPOSIT, INVESTMENTS AND ASSETS LIMITED AS TO USE
The carrying amount of deposits and investments included in the Hospital's Combined Statements of Net Position is as follows:
2016 2015
Bank deposits $ 66,278,960 $ 60,870,040 Investments 48,115,571 48,272,992
$ 114,394,531 $ 109,143,032
These amounts are included in the combined fmancial statements as follows:
2016 2015 Cash and cash equivalents $ 48,958,736 $ 37,900,703 Certificates of deposit 323,783 322,164 Investments 1,988,553 1,532,267 Assets limited as to use 63,123,459 69,387,898
$ 114,394,531 $ 109,143,032
The Hospital holds deposits only in banks participating in the State of Tennessee Collateral Pool and in banks that provide collateral for all deposits or banks that are members of the Federal Deposit Insurance Corporation (FDIC).
Additionally, the Hospital's deposits in fmancial institutions are required by State statute to be secured and collateralized by the institutions. Collateral requirements are not applicable for financial institutions that participate in the State of Tennessee's Collateral Pool. Collateral securities required to be pledged by the participating banks to protect their public fund accounts are pledged to the State Treasurer on behalf of the State of Tennessee's Collateral Pool. The securities pledged to protect these accounts are pledged in the aggregate rather than against each individual account. The
18
MAURY REGIONAL HOSPITAL
Notes to Combined Financial Statements - Continued
Years Ended June 30, 2016 and 2015
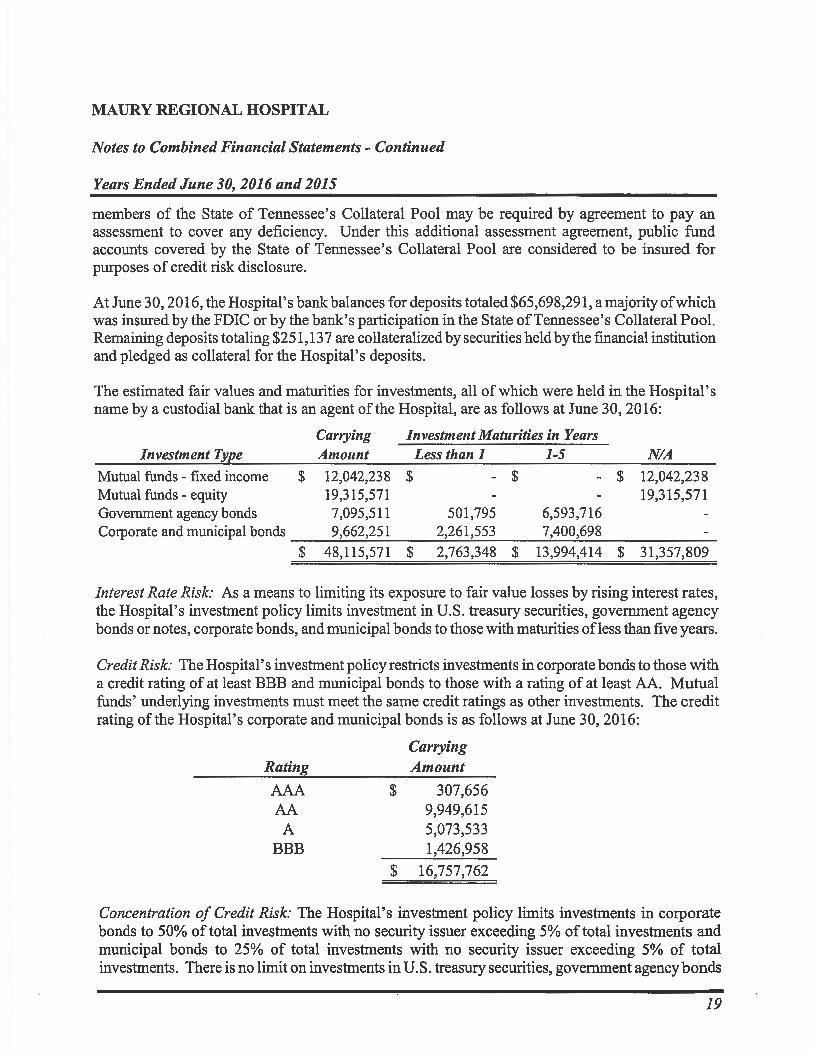
members of the State of Tennessee's Collateral Pool may be required by agreement to pay an assessment to cover any deficiency. Under this additional assessment agreement, public fund accounts covered by the State of Tennessee's Collateral Pool are considered to be insured for purposes of credit risk disclosure.
At June 30, 2016, the Hospital's bank balances for deposits totaled $65,698,291, a majority of which was insured by the FDIC or by the bank's participation in the State of Tennessee's Collateral Pool. Remaining deposits totaling $251,137 are collateralized by securities held by the financial institution and pledged as collateral for the Hospital's deposits.
The estimated fair values and maturities for investments, all of which were held in the Hospital's name by a custodial bank that is an agent of the Hospital, are as follows at June 30, 2016:
Investment Type Carrying Amount
Investment Maturities in Years N/A Less than 1 1-5
Mutual funds - fixed income $ 12,042,238 $ - $ $ 12,042,238 Mutual funds - equity 19,315,571 19,315,571 Government agency bonds 7,095,511 501,795 6,593,716 Corporate and municipal bonds 9,662,251 2,261,553 7,400,698
$ 48,115,571 $ 2,763,348 $ 13,994,414 $ 31,357,809
Interest Rate Risk: As a means to limiting its exposure to fair value losses by rising interest rates, the Hospital's investment policy limits investment in U.S. treasury securities, government agency bonds or notes, corporate bonds, and municipal bonds to those with maturities of less than five years.
Credit Risk: The Hospital's investment policy restricts investments in corporate bonds to those with a credit rating of at least BBB and municipal bonds to those with a rating of at least AA. Mutual funds' underlying investments must meet the same credit ratings as other investments. The credit rating of the Hospital's corporate and municipal bonds is as follows at June 30, 2016:
Rating Carrying Amount
AAA $ 307,656 AA 9,949,615 A 5,073,533
BBB 1,426,958 $ 16,757,762
Concentration of Credit Risk: The Hospital's investment policy limits investments in corporate bonds to 50% of total investments with no security issuer exceeding 5% of total investments and municipal bonds to 25% of total investments with no security issuer exceeding 5% of total investments. There is no limit on investments in U.S. treasury securities, government agency bonds
19

MAURY REGIONAL HOSPITAL
Notes to Combined Financial Statements - Continued
Years Ended June 30, 2016 and 2015
or notes. Mutual funds containing corporate bonds should not exceed 50% of total investments and a single mutual fund should not exceed 25% of total investments. Equity investments cannot exceed 15% of total investments. An investment in the equity of a single corporation and a single equity mutual fund should not exceed 5% and 15%, respectively, of total investments.
Custodial Credit Risk: For an investment, custodial credit risk is the risk that, in the event of the failure of the counterparty, the Hospital will not be able to recover the value of its investment or collateral. All investments are in the Hospital's name at a custodial bank.
NOTE E--PROPERTY, PLANT AND EQUIPMENT
A summary of changes in property, plant and equipment and related accumulated depreciation for the years ended June 30, 2016 and 2015 is as follows:
Capital assets being depreciated
Balance July 1, 2015
Additions/ Transfers Retirements
Balance June 30, 2016
Land improvements $ 5,613,433 $ 248,333 $ (5,000) $ 5,856,766 Buildings 182,723,713 6,247,220 (69,153) 188,901,780 Equipment 174,331,171 10,946,345 (5,284,316) 179,993,200
Total capital assets being depreciated 362,668,317 17,441,898 (5,358,469) 374,751,746
Less accumulated depreciation for: Land improvements 4,690,978 219,227 (5,000) 4,905,205 Buildings 116,113,277 7,695,303 (60,965) 123,747,615 Equipment 142,773,037 8,885,891 (4,577,463) 147,081,465
Total accumulated depreciation 263,577,292 16,800,421 (4,643,428) 275,734,285
Total capital assets being depreciated, net 99,091,025 641,477 (715,041) 99,017,461
Capital assets not being depreciated 8,078,966 (422,294) 7,656,672 Land
Construction in progress 9,624,359 (657,576) - 8,966,783
Total capital assets not being depreciated 17,703,325 (657,576) (422,294) 16,623,455
Total capital assets, net $ 116,794,350 $ (16,099) $ (1,137,335) $ 115,640,916
Capital assets being depreciated
Balance July 1, 2014
Additions/ Transfers Retirements
Balance June 30, 2015
Land improvements $ 5,613,433 $ $ $ 5,613,433 Buildings 181,214,696 1,549,955 (40,938) 182,723,713 Equipment 168,662,154 6,925,222 (1,256,205) 174,331,171
Total capital assets being depreciated 355,490,283 8,475,177 (1,297,143) 362,668,317
Less accumulated depreciation for: Land improvements 4,468,271 228,877 (6,170) 4,690,978 Buildings 108,490,555 7,622,722 116,113,277 Equipment 135,357,279 8,612,574 (1,196,816) 142,773,037
Total accumulated depreciation 248,316,105 16,464,173 (1,202,986) 263,577,292
Total capital assets being depreciated, net 107,174,178 (7,988,996) (94,157) 99,091,025
20
MAURY REGIONAL HOSPITAL
Notes to Combined Financial Statements - Continued
Years Ended June 30, 2016 and 2015
Capital assets not being depreciated
Balance July 1, 2014
Additions./ Transfers Retirements
Balance June 30, 2015
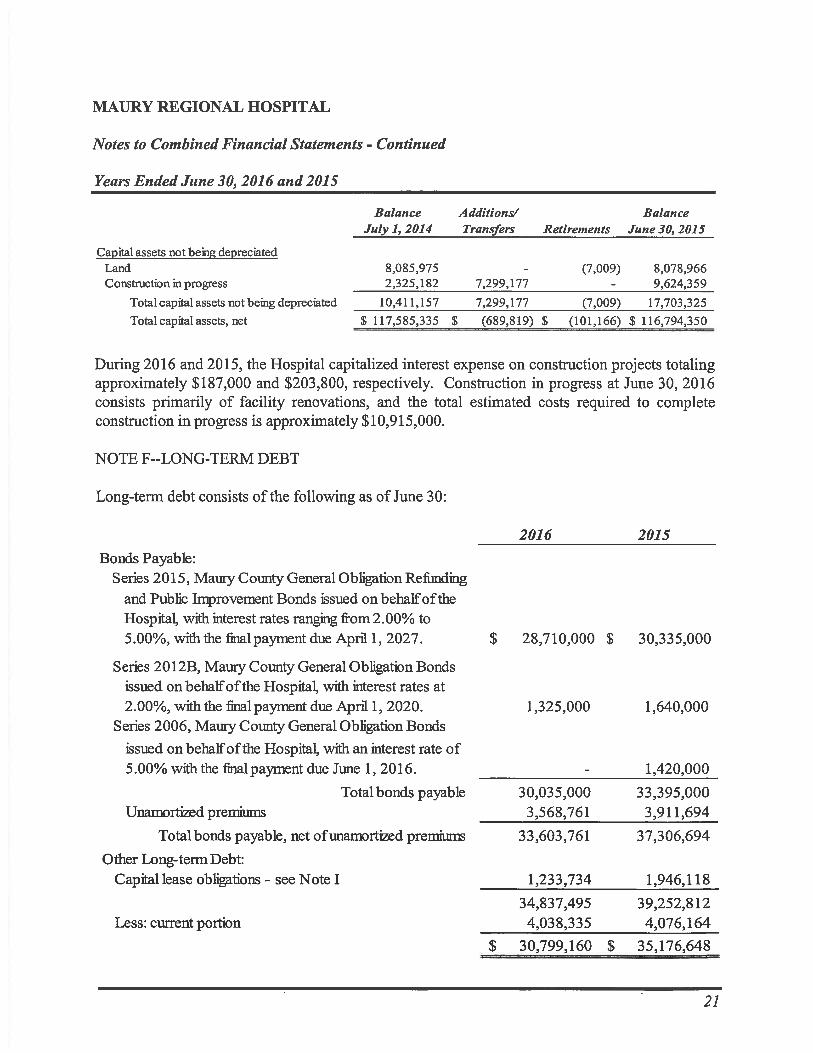
Land 8,085,975 - (7,009) 8,078,966 Construction in progress 2,325,182 7,299,177 - 9,624,359
Total capital assets not being depreciated 10,411,157 7,299,177 (7,009) 17,703,325
Total capital assets, net $ 117,585,335 $ (689,819) $ (101,166) $ 116,794,350
During 2016 and 2015, the Hospital capitalized interest expense on construction projects totaling approximately $187,000 and $203,800, respectively. Construction in progress at June 30, 2016 consists primarily of facility renovations, and the total estimated costs required to complete construction in progress is approximately $10,915,000.
NOTE F--LONG-TERM DEBT
Long-term debt consists of the following as of June 30:
Bonds Payable: Series 2015, Maury County General Obligation Refunding
and Public Improvement Bonds issued on behalf of the Hospital, with interest rates ranging from 2.00% to
2016 2015
5.00%, with the final payment due April 1, 2027. $ 28,710,000 $ 30,335,000
Series 2012B, Maury County General Obligation Bonds issued on behalf of the Hospital, with interest rates at 2.00%, with the final payment due April 1, 2020. 1,325,000 1,640,000
Series 2006, Maury County General Obligation Bonds
issued on behalf of the Hospital, with an interest rate of 5.00% with the final payment due June 1, 2016. 1,420,000
Total bonds payable 30,035,000 33,395,000 Unamortized premiums 3,568,761 3,911,694
Total bonds payable, net of unamortized premiums 33,603,761 37,306,694
Other Long-term Debt: Capital lease obligations - see Note I 1,233,734 1,946,118
34,837,495 39,252,812 Less: current portion 4,038,335 4,076,164
$ 30,799,160 $ 35,176,648
21
MAURY REGIONAL HOSPITAL
Notes to Combined Financial Statements - Continued
Years Ended June 30, 2016 and 2015
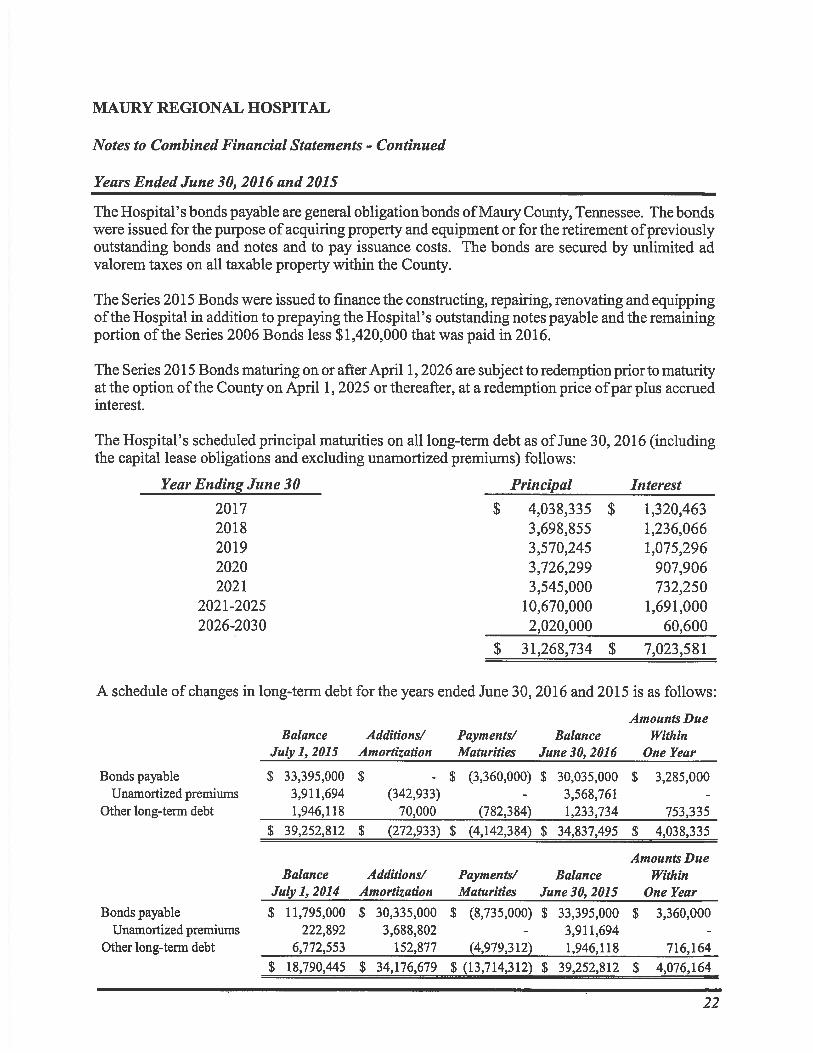
The Hospital's bonds payable are general obligation bonds of Maury County, Tennessee. The bonds were issued for the purpose of acquiring property and equipment or for the retirement of previously outstanding bonds and notes and to pay issuance costs. The bonds are secured by unlimited ad valorem taxes on all taxable property within the County.
The Series 2015 Bonds were issued to finance the constructing, repairing, renovating and equipping of the Hospital in addition to prepaying the Hospital's outstanding notes payable and the remaining portion of the Series 2006 Bonds less $1,420,000 that was paid in 2016.
The Series 2015 Bonds maturing on or after April 1, 2026 are subject to redemption prior to maturity at the option of the County on April 1, 2025 or thereafter, at a redemption price of par plus accrued interest.
The Hospital's scheduled principal maturities on all long-term debt as of June 30, 2016 (including the capital lease obligations and excluding unamortized premiums) follows:
Year Ending June 30 Principal Interest
2017 $ 4,038,335 $ 1,320,463 2018 3,698,855 1,236,066 2019 3,570,245 1,075,296 2020 3,726,299 907,906 2021 3,545,000 732,250
2021-2025 10,670,000 1,691,000 2026-2030 2,020,000 60,600
$ 31,268,734 $ 7,023,581
A schedule of changes in long-term debt for the years ended June 30, 2016 and 2015 is as follows:
Amounts Due Balance Additions/ Payments/ Balance Within
July 1, 2015 Amortization Maturities June 30, 2016 One Year
Bonds payable $ 33,395,000 $ $ (3,360,000) $ 30,035,000 $ 3,285,000 Unamortized premiums 3,911,694 (342,933) 3,568,761
Other long-term debt 1,946,118 70,000 (782,384) 1,233,734 753,335 $ 39,252,812 $ (272,933) $ (4,142,384) $ 34,837,495 $ 4,038,335
Amounts Due Balance Additions/ Payments/ Balance Within
July 1, 2014 Amortization Maturities June 30, 2015 One Year
Bonds payable $ 11,795,000 $ 30,335,000 $ (8,735,000) $ 33,395,000 $ 3,360,000 Unamortized premiums 222,892 3,688,802 - 3,911,694
Other long-term debt 6,772,553 152,877 (4,979,312) 1,946,118 716,164 $ 18,790,445 $ 34,176,679 $ (13,714,312) $ 39,252,812 $ 4,076,164
22
MAURY REGIONAL HOSPITAL
Notes to Combined Financial Statements - Continued
Years Ended June 30, 2016 and 2015
NOTE G--PENSION PLAN
Plan Description: Prior to May 1, 1997, all employees of the Hospital were eligible to participate in the Maury Regional Hospital Retirement Plan (the Plan), a single-employer public retirement system (PERS), accounted for as a separate entity from the Hospital. The purpose of the Plan is to provide retirement, death, and certain other benefits to employees as specified in the Plan. Although it has not expressed any intention to do so, the Hospital has the right under the Plan to discontinue its contributions at any time and to terminate the Plan subject to the provisions set forth in ERISA.
The Plan was amended effective May 1, 1997 to stop accrual of benefit service on April 30, 1997 for participants who made an irrevocable election to participate in the Maury Regional Healthcare System 403(b) Plan on May 1, 1997, 1998 or 2001. Employees hired after May 1, 1997, are not eligible to participate in the Plan.
Benefits Provided: In addition to normal retirement benefits, the Plan also provides for early retirement and death benefits. Retirement benefits are calculated as a percent of the employee's highest average compensation during 60 consecutive months of the last 120 months of employment. Employees earn full retirement benefits once an employee has reached the age of 65. Early retirement benefits are available once an employee has reached age 55 and 5 years of service at a reduced rate based on age. Death benefits equal the actuarial equivalent value of the employee's vested accrued benefit as of the date of death. An employee who terminates service for other reasons after five years of credited service will receive retirement benefits at the normal retirement date.
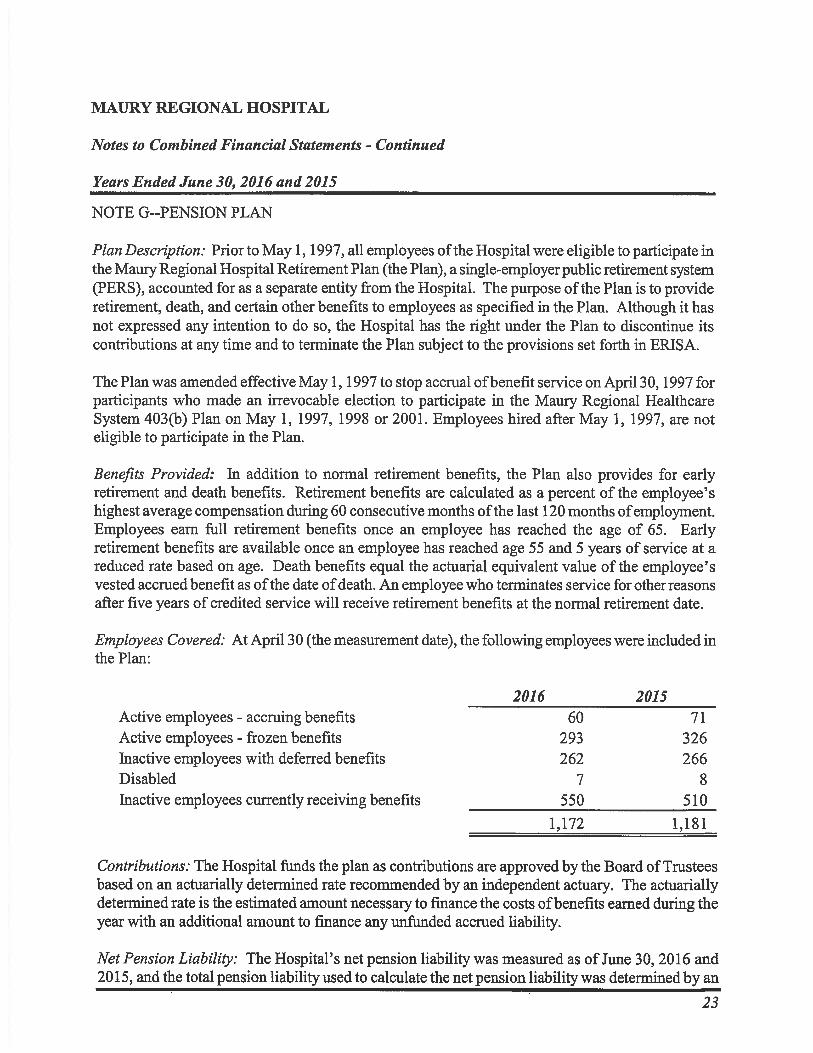
Employees Covered: At April 30 (the measurement date), the following employees were included in the Plan:
2016 2015 Active employees - accruing benefits 60 71 Active employees - frozen benefits 293 326 Inactive employees with deferred benefits 262 266 Disabled 7 8 Inactive employees currently receiving benefits 550 510
1,172 1,181
Contributions: The Hospital funds the plan as contributions are approved by the Board of Trustees based on an actuarially determined rate recommended by an independent actuary. The actuarially determined rate is the estimated amount necessary to finance the costs of benefits earned during the year with an additional amount to finance any unfunded accrued liability.
Net Pension Liability: The Hospital's net pension liability was measured as of June 30, 2016 and 2015, and the total pension liability used to calculate the net pension liability was determined by an
23
MAURY REGIONAL HOSPITAL
Notes to Combined Financial Statements - Continued
Years Ended June 30, 2016 and 2015
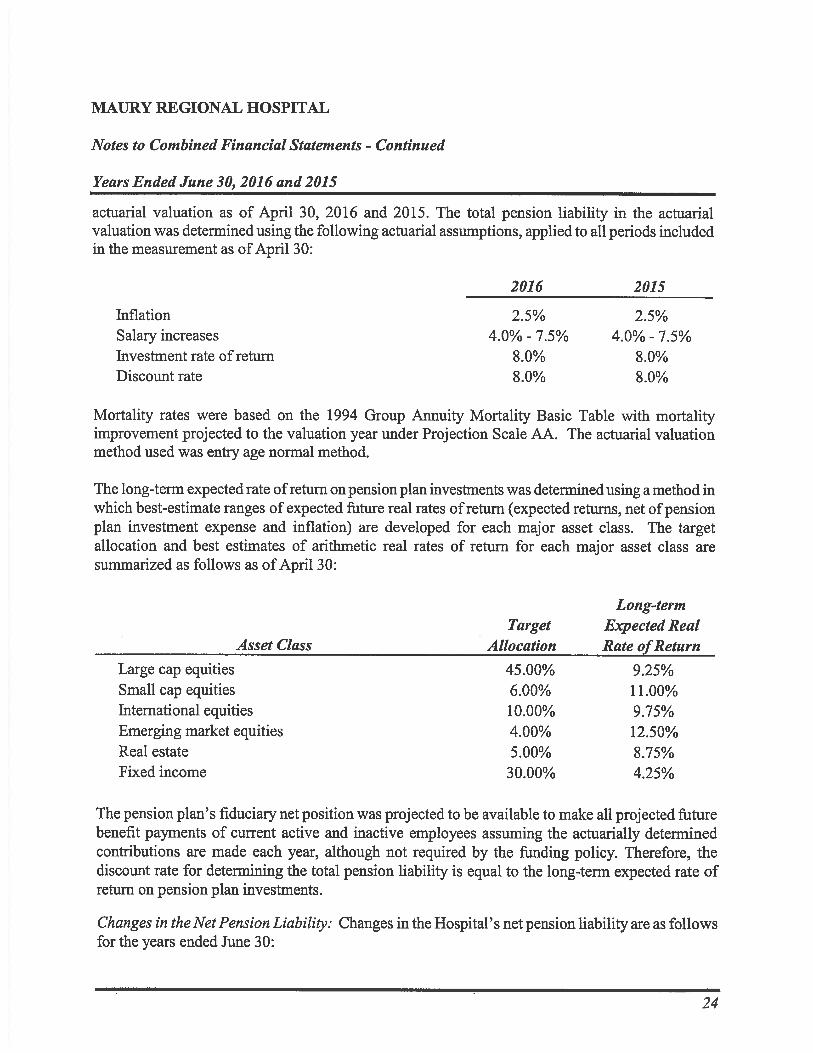
actuarial valuation as of April 30, 2016 and 2015. The total pension liability in the actuarial valuation was determined using the following actuarial assumptions, applied to all periods included in the measurement as of April 30:
2016 2015
Inflation 2.5% 2.5% Salary increases 4.0% - 7.5% 4.0% - 7.5% Investment rate of return 8.0% 8.0% Discount rate 8.0% 8.0%
Mortality rates were based on the 1994 Group Annuity Mortality Basic Table with mortality improvement projected to the valuation year under Projection Scale AA. The actuarial valuation method used was entry age normal method.
The long-term expected rate of return on pension plan investments was determined using a method in which best-estimate ranges of expected future real rates of return (expected returns, net of pension plan investment expense and inflation) are developed for each major asset class. The target allocation and best estimates of arithmetic real rates of return for each major asset class are summarized as follows as of April 30:
Asset Class Target
Allocation
Long-term Expected Real Rate of Return
Large cap equities 45.00% 9.25% Small cap equities 6.00% 11.00% International equities 10.00% 9.75% Emerging market equities 4.00% 12.50% Real estate 5.00% 8.75% Fixed income 30.00% 4.25%
The pension plan's fiduciary net position was projected to be available to make all projected future benefit payments of current active and inactive employees assuming the actuarially determined contributions are made each year, although not required by the funding policy. Therefore, the discount rate for determining the total pension liability is equal to the long-term expected rate of return on pension plan investments.
Changes in the Net Pension Liability: Changes in the Hospital's net pension liability are as follows for the years ended June 30:
24
MAURY REGIONAL HOSPITAL
Notes to Combined Financial Statements - Continued
Years Ended June 30, 2016 and 2015
Total Pension Liability
Plan Fiduciary Net Position
Net Pension Liability
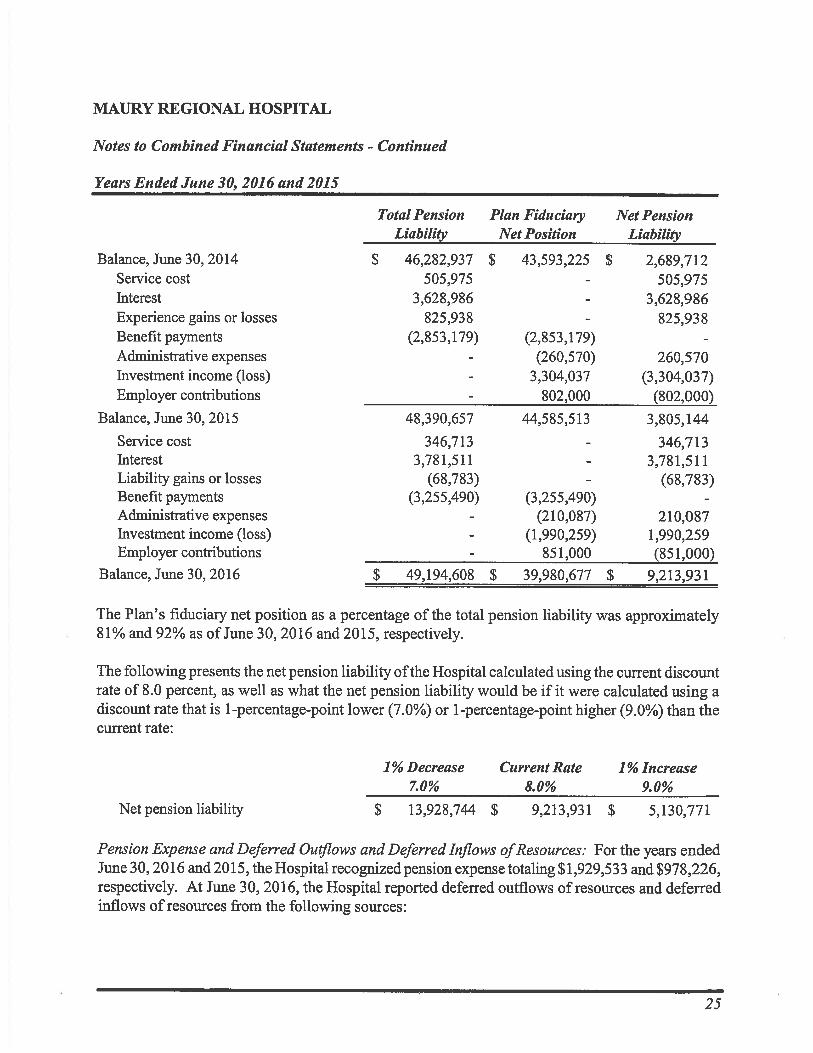
Balance, June 30, 2014 $ 46,282,937 $ 43,593,225 $ 2,689,712 Service cost 505,975 505,975 Interest 3,628,986 3,628,986 Experience gains or losses 825,938 825,938 Benefit payments (2,853,179) (2,853,179) - Administrative expenses (260,570) 260,570 Investment income (loss) 3,304,037 (3,304,037) Employer contributions 802,000 (802,000)
Balance, June 30, 2015 48,390,657 44,585,513 3,805,144 Service cost 346,713 346,713 Interest 3,781,511 3,781,511 Liability gains or losses (68,783) (68,783) Benefit payments (3,255,490) (3,255,490) - Administrative expenses (210,087) 210,087 Investment income (loss) (1,990,259) 1,990,259 Employer contributions 851,000 (851,000)
Balance, June 30, 2016 $ 49,194,608 $ 39,980,677 $ 9,213,931
The Plan's fiduciary net position as a percentage of the total pension liability was approximately 81% and 92% as of June 30, 2016 and 2015, respectively.
The following presents the net pension liability of the Hospital calculated using the current discount rate of 8.0 percent, as well as what the net pension liability would be if it were calculated using a discount rate that is 1-percentage-point lower (7.0%) or 1-percentage-point higher (9.0%) than the current rate:
1% Decrease Current Rate 1% Increase 7.0% 8.0% 9.0%
Net pension liability $ 13,928,744 $ 9,213,931 $ 5,130,771
Pension Expense and Deferred Outflows and Deferred Inflows of Resources: For the years ended June 30, 2016 and 2015, the Hospital recognized pension expense totaling $1,929,533 and $978,226, respectively. At June 30, 2016, the Hospital reported deferred outflows of resources and deferred inflows of resources from the following sources:
25

MAURY REGIONAL HOSPITAL
Notes to Combined Financial Statements - Continued
Years Ended June 30, 2016 and 2015
Deferred Deferred Outflows Inflows
of Resources of Resources Differences between expected and actual experience 275,312 (41,271) Differences between projected and actual earnings 4,394,731 (540,130)
$ 4,670,043 $ (581,401)
Amounts reported as deferred outflows of resources and deferred inflows of resources related to pensions will be recognized in pension expense as follows:
Year Ending June 30,
2017 $ 1,080,425 2018 818,868 2019 1,102,694 2020 1,086,655
NOTE H--OTHER RETIREMENT PLANS
Effective May 1, 1997, the Hospital implemented a defined contribution plan which includes a 403(b) feature and an employer matching provision and covers substantially all hourly and salaried employees. Voluntary contributions may be made by the participants as a percentage of annual compensation not to exceed Internal Revenue Service limits. The Hospital's contribution in 2016 and 2015 consisted of a matching contribution equal to 100% of the first 3% of annual compensation and an additional matching contribution equal to 125% of the employees' contribution from 4-5% of annual compensation if the employee had five or more years of service. The Hospital's total contributions for the years ended June 30, 2016 and 2015 were approximately $4,080,000 and $4,000,000, respectively. Hospital employees' total contributions for the years ended June 30, 2016 and 2015 were approximately $6,500,000 and $5,620,000, respectively.
NOTE I--LEASES
Capital Leases: The Hospital leases medical equipment under various capital lease agreements with interest rates ranging from 2.4% to 4.5%. A summary of the leased equipment, which is included in property, plant and equipment, at June 30 is as follows:
2016 2015 Equipment acquired under capital leases $ 3,731,077 $ 3,437,877 Less accumulated amortization (2,493,720) (1,568,578)
1,237,357 $ 1,869,299
26
MAURY REGIONAL HOSPITAL
Notes to Combined Financial Statements - Continued
Years Ended June 30, 2016 and 2015
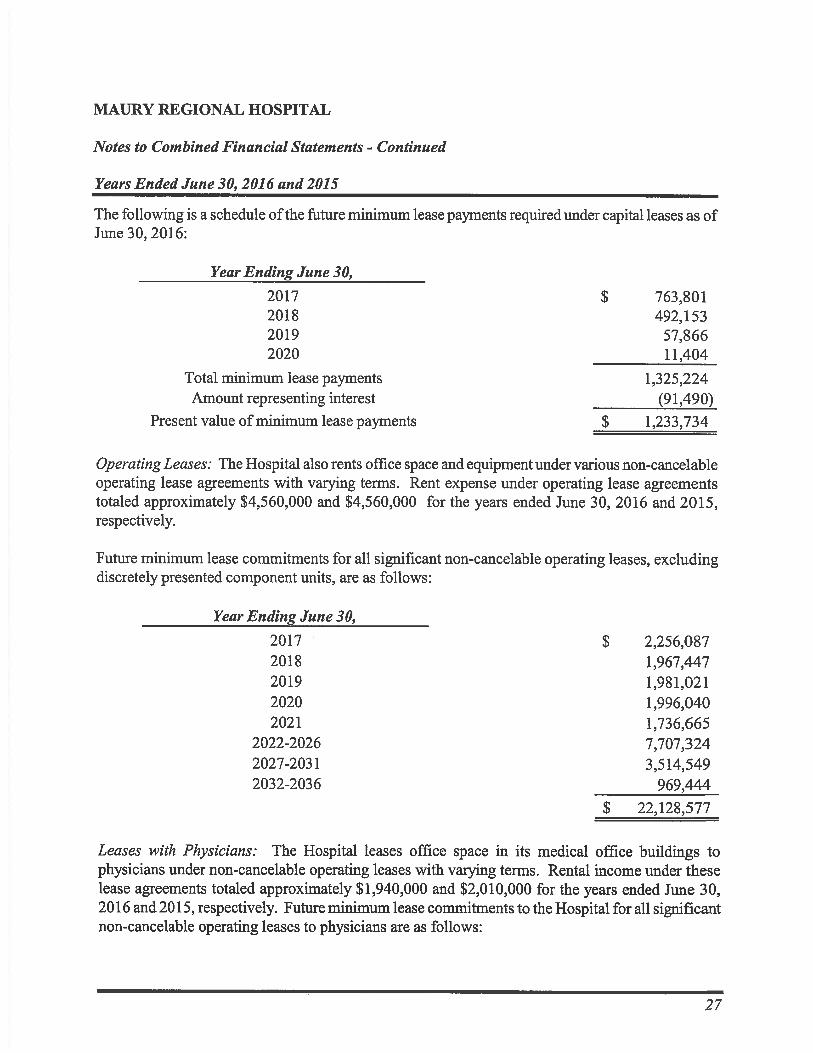
The following is a schedule of the future minimum lease payments required under capital leases as of June 30, 2016:
Year Ending June 30,
2017 $ 763,801 2018 492,153 2019 57,866 2020 11,404
Total minimum lease payments 1,325,224 Amount representing interest (91,490)
Present value of minimum lease payments $ 1,233,734
Operating Leases: The Hospital also rents office space and equipment under various non-cancelable operating lease agreements with varying terms. Rent expense under operating lease agreements totaled approximately $4,560,000 and $4,560,000 for the years ended June 30, 2016 and 2015, respectively.
Future minimum lease commitments for all significant non-cancelable operating leases, excluding discretely presented component units, are as follows:
Year Ending June 30,
2017 $ 2,256,087 2018 1,967,447 2019 1,981,021 2020 1,996,040 2021 1,736,665
2022-2026 7,707,324 2027-2031 3,514,549 2032-2036 969,444
$ 22,128,577
Leases with Physicians: The Hospital leases office space in its medical office buildings to physicians under non-cancelable operating leases with varying terms. Rental income under these lease agreements totaled approximately $1,940,000 and $2,010,000 for the years ended June 30, 2016 and 2015, respectively. Future minimum lease commitments to the Hospital for all significant non-cancelable operating leases to physicians are as follows:
27
MAURY REGIONAL HOSPITAL
Notes to Combined Financial Statements - Continued
Years Ended June 30, 2016 and 2015
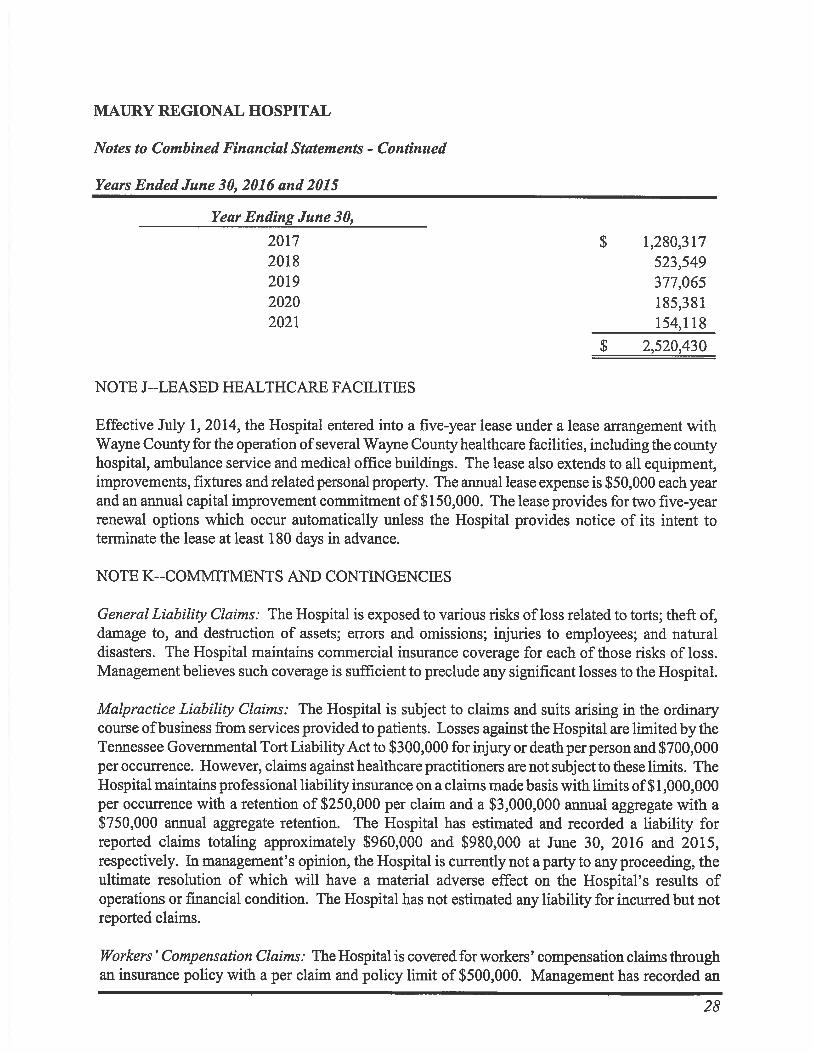
Year Ending June 30,
2017 $ 1,280,317 2018 523,549 2019 377,065 2020 185,381 2021 154,118
$ 2,520,430
NOTE J--LEASED HEALTHCARE FACILITIES
Effective July 1, 2014, the Hospital entered into a five-year lease under a lease arrangement with Wayne County for the operation of several Wayne County healthcare facilities, including the county hospital, ambulance service and medical office buildings. The lease also extends to all equipment, improvements, fixtures and related personal property. The annual lease expense is $50,000 each year and an annual capital improvement commitment of $150,000. The lease provides for two five-year renewal options which occur automatically unless the Hospital provides notice of its intent to terminate the lease at least 180 days in advance.
NOTE K--COMMITMENTS AND CONTINGENCIES
General Liability Claims: The Hospital is exposed to various risks of loss related to torts; theft of, damage to, and destruction of assets; errors and omissions; injuries to employees; and natural disasters. The Hospital maintains commercial insurance coverage for each of those risks of loss. Management believes such coverage is sufficient to preclude any significant losses to the Hospital.
Malpractice Liability Claims: The Hospital is subject to claims and suits arising in the ordinary course of business from services provided to patients. Losses against the Hospital are limited by the Tennessee Governmental Tort Liability Act to $300,000 for injury or death per person and $700,000 per occurrence. However, claims against healthcare practitioners are not subject to these limits. The Hospital maintains professional liability insurance on a claims made basis with limits of $1,000,000 per occurrence with a retention of $250,000 per claim and a $3,000,000 annual aggregate with a $750,000 annual aggregate retention. The Hospital has estimated and recorded a liability for reported claims totaling approximately $960,000 and $980,000 at June 30, 2016 and 2015, respectively. In management's opinion, the Hospital is currently not a party to any proceeding, the ultimate resolution of which will have a material adverse effect on the Hospital's results of operations or financial condition. The Hospital has not estimated any liability for incurred but not reported claims.
Workers' Compensation Claims: The Hospital is covered for workers' compensation claims through an insurance policy with a per claim and policy limit of $500,000. Management has recorded an
28

MAURY REGIONAL HOSPITAL
Notes to Combined Financial Statements - Continued
Years Ended June 30, 2016 and 2015
accrual for the estimated liability related to claims reported as of June 30, 2016 and 2015. The Hospital has not estimated any liability for incurred but not reported claims.
Healthcare Benefits: The Hospital maintains a partially self-insured healthcare plan to provide reimbursement for covered expenses incurred as a result of illness or injury to covered employees and dependents. Stop-loss insurance is purchased for annual claims per individual exceeding $300,000 with an additional aggregating specific amount of $100,000. The Hospital has estimated and recorded a liability for healthcare claims incurred but not yet reported totaling approximately $3,060,000 and $2,590,000 at June 30, 2016 and 2015, respectively. Prior to July 1, 2015, employees that retired after attaining age sixty and completing twenty years of service received continued coverage under the Hospital's health benefit program until they attain age sixty-five or become eligible for Medicare benefits. The Hospital's policy for healthcare benefits for retired employees was amended effective July 1, 2015, to eliminate future accruals and payments of healthcare benefits for employees not yet retired as of June 30, 2015. The estimated amount of retirement health benefits payable totaled approximately $855,000 and $1,175,000 at June 30, 2016 and 2015, respectively, and is reported as a noncurrent liability in the combined financial statements. Due to uncertainties in the estimate, it is at least reasonably possible that management's estimate could change in 2017.
Healthcare Industry: The healthcare industry is subject to numerous laws and regulations of federal, state and local governments. These laws and regulations include, but are not necessarily limited to, matters such as licensure, accreditation, government healthcare program participation requirements, reimbursement for patient services, Medicare fraud and abuse and under the provisions of the Health Insurance Portability and Accountability Act of 1996, patient records privacy and security. Recently, government activity has increased with respect to investigations and allegations concerning possible violations of fraud and abuse statutes and regulations by healthcare providers, such as the Medicare Recovery Audit Contractor Program. Violations of these laws and regulations could result in expulsion from government healthcare programs together with the imposition of significant fines and penalties, as well as significant repayments for patient services previously billed. Compliance with such laws and regulations can be subject to future government review and interpretation as well as regulatory actions unknown or unasserted at this time. Management believes that any amounts that may be payable related to audits through the Medicare Recovery Audit Contractor program, or similar initiatives, have been estimated and recorded as Other Long-term Liabilities in the combined financial statements and therefore, any additional impact on the combined financial statements will not be significant. However, due to the uncertainties involved, management's estimate could change in the near future.
Healthcare Reform: In March 2010, Congress adopted comprehensive health care insurance legislation, the Patient Care Protection and Affordable Care Act and the Health Care and Education Reconciliation Act. The legislation, among other matters, is designed to expand access to health care coverage to substantially all citizens through a combination of public program expansion and private
29
MAURY REGIONAL HOSPITAL
Notes to Combined Financial Statements - Continued
Years Ended June 30, 2016 and 2015
industry health insurance. Changes to existing TennCare coverage and payments are also expected to occur as a result of this legislation. Implementing regulations are generally required as a result of such legislation over a period of several years. Accordingly, the impact of any future regulations is not determinable.
NOTE L--FAIR VALUE OF FINANCIAL INSTRUMENTS
Management estimates that the carrying value of its financial instruments, including cash and cash equivalents, investments, patient accounts and other receivables, accounts payable and accrued expenses, and estimated liability for refunds are at fair value or approximate fair value due to the nature and short-term maturities of these instruments. Management estimates that the fair value of its capital lease obligations and long-term debt was approximately $39,800,000 as of June 30, 2016. Carrying amounts approximated fair value as of June 30, 2015.
NOTE M--FAIR VALUE MEASUREMENT
GASB Statement No. 72 emphasizes that fair value is a market-based measurement, not an entity-specific measurement. Therefore, a fair value measurement should be determined based on the assumptions that market participants would use in pricing the asset or liability. As such, GASB defines fair value as the price that would be received to sell an asset or paid to transfer a liability in an orderly transaction between market participants at the measurement date. GASB describes fair value as an exit price where measurement assumes a transaction takes place in an entity's principal market, or most advantageous market in the absence of a principal market, and the market participants are acting in their economic best interests. GASB Statement No. 72 requires an entity to use valuation techniques that are appropriate under the circumstances and for which sufficient data are available to measure fair value. Valuation techniques should be applied consistently and maximize the use of relevant observable inputs and minimize the use of unobservable inputs.
Valuation Hierarchy: GASB Statement No. 72 establishes a hierarchy of inputs to valuation techniques used to measure fair value. The hierarchy has three levels which are defined as follows:
• Level 1: Inputs to the valuation technique are quoted prices (unadjusted) for identical assets or liabilities in active markets.
• Level 2: Inputs to the valuation technique, other than quoted prices within Level 1, that are observable for an asset or liability, either directly or indirectly.
• Level 3: Inputs to the valuation technique are unobservable.
In instances where the determination of the fair value hierarchy measurement is based on inputs from different levels of the fair value hierarchy, the level in the fair value hierarchy within which the entire fair value measurement falls is based on the lowest level input that is significant to the fair value
30
MAURY REGIONAL HOSPITAL
Notes to Combined Financial Statements - Continued
Years Ended June 30, 2016 and 2015
measurement in its entirety. The Hospital's assessment of the significance of a particular input to the fair value measurement in its entirety requires judgment and considers factors specific to the asset or liability.
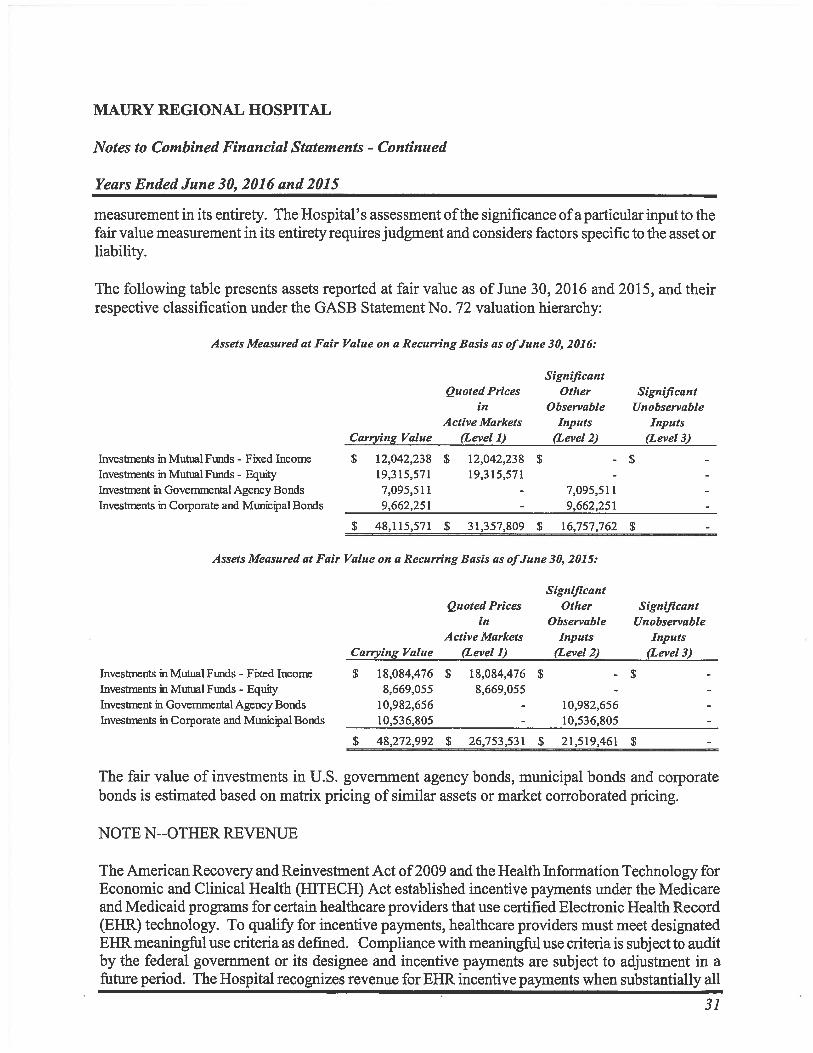
The following table presents assets reported at fair value as of June 30, 2016 and 2015, and their respective classification under the GASB Statement No. 72 valuation hierarchy:
Assets Measured at Fair Value on a Recurring Basis as ofJune 30, 2016:
Carrying Value
Quoted Prices in
Active Markets (Level 1)
Significant Other
Observable Inputs
(Level 2)
Significant Unobservable
Inputs (Level 3)
Investments in Mutual Funds - Fixed Income $ 12,042,238 $ 12,042,238 $ $ Investments in Mutual Funds - Equity 19,315,571 19,315,571 Investment in Governmental Agency Bonds 7,095,511 7,095,511 Investments in Corporate and Municipal Bonds 9,662,251 9,662,251
$ 48,115,571 $ 31,357,809 $ 16,757,762
Assets Measured at Fair Value on a Recurring Basis as of June 30, 2015:
Carrying Value
Quoted Prices in
Active Markets (Level 1)
Significant Other
Observable Inputs
(Level 2)
Significant Unobservable
Inputs (Level 3)
Investments in Mutual Funds - Fixed Income $ 18,084,476 $ 18,084,476 $ Investments in Mutual Funds - Equity 8,669,055 8,669,055 Investment in Governmental Agency Bonds 10,982,656 10,982,656 Investments in Corporate and Municipal Bonds 10,536,805 10,536,805
48,272,992 $ 26,753,531 $ 21,519,461 $
The fair value of investments in U.S. government agency bonds, municipal bonds and corporate bonds is estimated based on matrix pricing of similar assets or market corroborated pricing.
NOTE N--OTHER REVENUE
The American Recovery and Reinvestment Act of 2009 and the Health Information Technology for Economic and Clinical Health (HITECH) Act established incentive payments under the Medicare and Medicaid programs for certain healthcare providers that use certified Electronic Health Record (EHR) technology. To qualify for incentive payments, healthcare providers must meet designated EHR meaningful use criteria as defined. Compliance with meaningful use criteria is subject to audit by the federal government or its designee and incentive payments are subject to adjustment in a future period. The Hospital recognizes revenue for EHR incentive payments when substantially all
31
MAURY REGIONAL HOSPITAL
Notes to Combined Financial Statements - Continued
Years Ended June 30, 2016
contingencies have been met. The Hospital recognized approximately $200,000 and $2,300,000 of other revenue related to EHR incentive payments in 2016 and 2015, respectively.
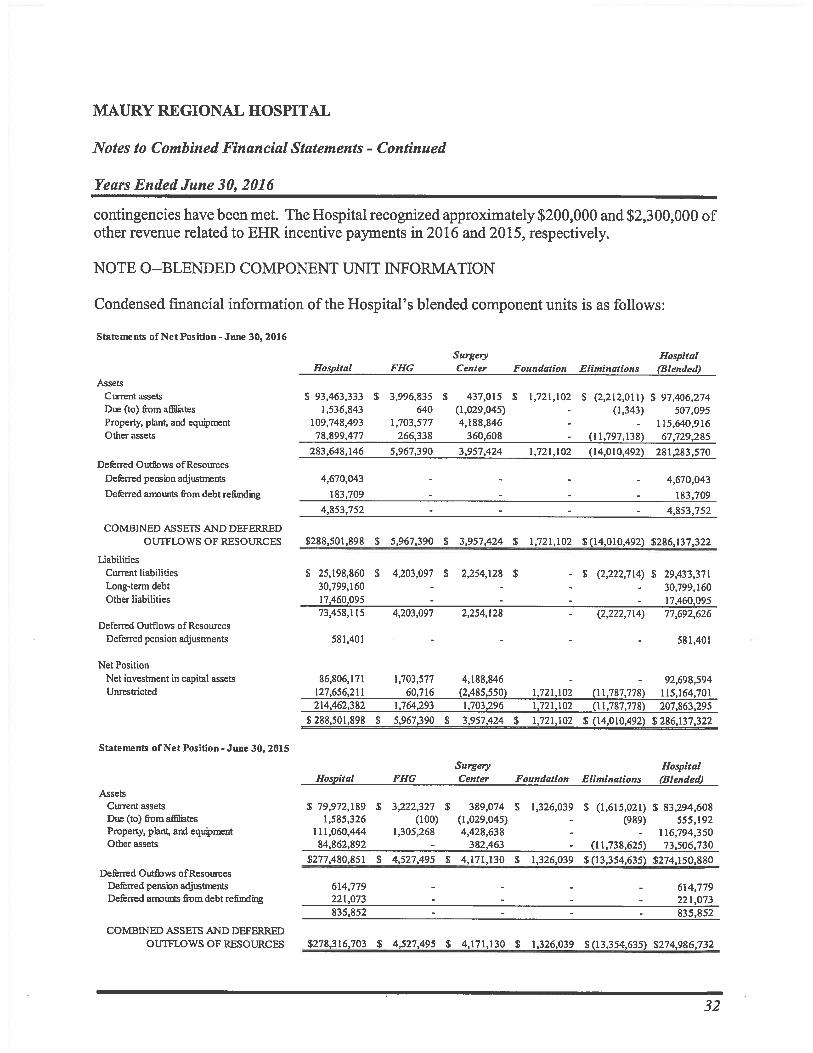
NOTE 0—BLENDED COMPONENT UNIT INFORMATION
Condensed fmancial information of the Hospital's blended component units is as follows:
Statements of Net Position - June 30, 2016
Assets
Hospital FHG Surgery Center Foundation Eliminations
Hospital (Blended)
Current assets $ 93,463,333 $ 3,996,835 $ 437,015 $ 1,721,102 $ (2,212,011) $ 97,406,274 Due (to) from affiliates 1,536,843 640 (1,029,045) (1,343) 507,095 Property, plant, and equipment 109,748,493 1,703,577 4,188,846 - 115,640,916 Other assets 78,899,477 266,338 360,608 (11,797,138) 67,729,285
283,648,146 5,967,390 3,957,424 1,721,102 (14,010,492) 281,283,570 Deferred Outflows of Resources
Deferred pension adjustments 4,670,043 - 4,670,043 Deferred amounts from debt refunding 183,709 183,709
4,853,752 4,853,752
COMBINED ASSETS AND DEFERRED OUTFLOWS OF RESOURCES $288,501,898 $ 5,967,390 $ 3,957,424 $ 1,721,102 $ (14,010,492) $286,137,322
Liabilities Current liabilities $ 25,198,860 $ 4,203,097 $ 2,254,128 $ - $ (2,222,714) $ 29,433,371 Long-term debt 30,799,160 - - - 30,799,160 Other liabilities 17,460,095 - 17,460,095
73,458,115 4,203,097 2,254,128 - (2,222,714) 77,692,626 Deferred Outflows of Resources
Deferred pension adjustments 581,401 581,401
Net Position Net investment in capital assets 86,806,171 1,703,577 4,188,846 - - 92,698,594 Unrestricted 127,656,211 60,716 (2,485,550) 1,721,102 (11,787,778) 115,164,701
214,462,382 1,764,293 1,703,296 1,721,102 (11,787,778) 207,863,295 $ 288,501,898 $ 5,967,390 $ 3,957,424 $ 1,721,102 $ (14,010,492) $ 286,137,322
Statements of Net Position- June 30, 2015
Surgery Hospital Hospital FHG Center Foundation Eliminations (Blended)
Assets Current assets $ 79,972,189 $ 3,222,327 $ 389,074 $ 1,326,039 $ (1,615,021) $ 83,294,608 Due (to) from affiliates 1,585,326 (100) (1,029,045) - (989) 555,192 Property, plant, and equipment 111,060,444 1,305,268 4,428,638 - 116,794,350 Other assets 84,862,892 - 382,463 - (11,738,625) 73,506,730
$277,480,851 $ 4,527,495 $ 4,171,130 $ 1,326,039 $ (13,354,635) $274,150,880 Deferred Outflows of Resources
Deferred pension adjustments 614,779 614,779 Deferred amounts from debt refunding 221,073 221,073
835,852 835,852
COMBINED ASSETS AND DEFERRED OUTFLOWS OF RESOURCES $278,316,703 $ 4,527,495 $ 4,171,130 $ 1,326,039 $ (13,354,635) $274,986,732
32
MAURY REGIONAL HOSPITAL
Notes to Combined Financial Statements - Continued
Years Ended June 30, 2016 and 2015
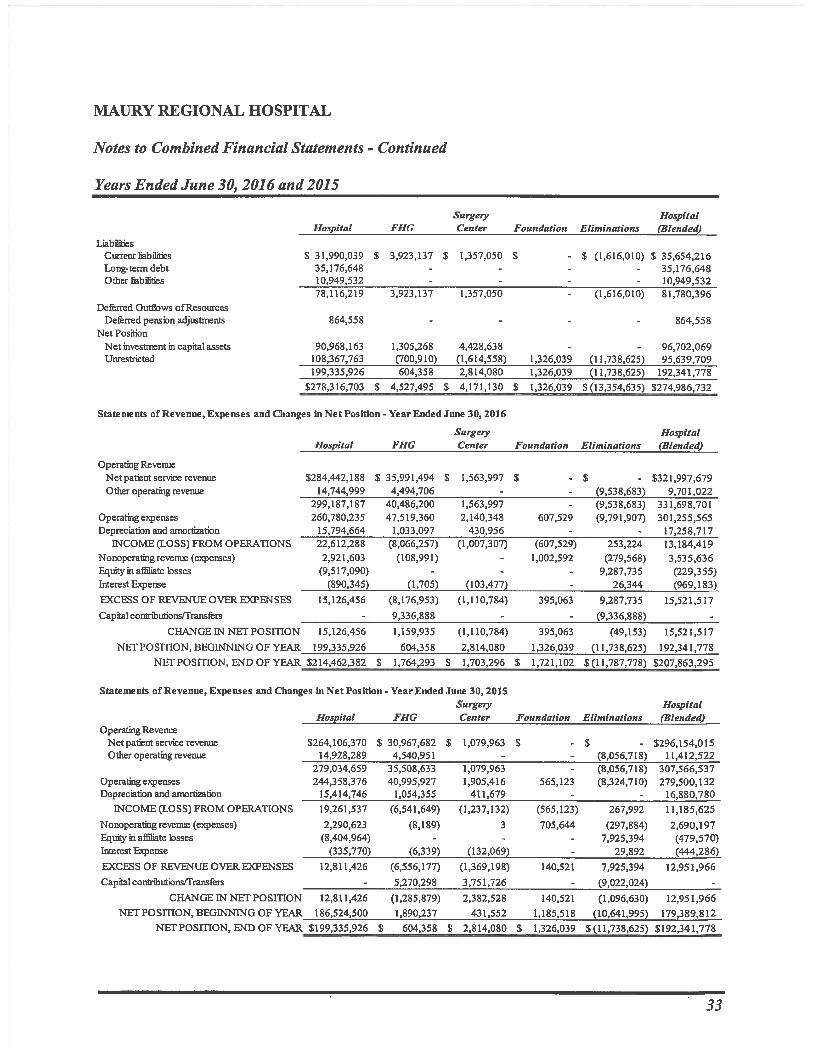
Liabilities
Hospital FHG Surgery Center Foundation Eliminations
Hospital (Blended)
Current liabilities $ 31,990,039 $ 3,923,137 $ 1,357,050 $ $ (1,616,010) $ 35,654,216 Long-term debt 35,176,648 - 35,176,648 Other liabilities 10,949,532 10,949,532
78,116,219 3,923,137 1,357,050 (1,616,010) 81,780,396 Deferred Outflows of Resources
Deferred pension adjustments 864,558 864,558 Net Position
Net investment in capital assets 90,968,163 1,305,268 4,428,638 - 96,702,069 Unrestricted 108,367,763 (700,910) (1,614,558) 1,326,039 (11,738,625) 95,639,709
199,335,926 604,358 2,814,080 1,326,039 (11,738,625) 192,341,778 $278,316,703 $ 4,527,495 $ 4,171,130 $ 1,326,039 5 (13,354,635) $274,986,732
Statements of Revenue, Expenses and Changes in Net Position - Year Ended June 30, 2016
Hospital FHG Surgery Center Foundation Eliminations
Hospital (Blended)
Operating Revenue Net patient service revenue $284,442,188 $ 35,991,494 $ 1,563,997 $ $321,997,679 Other operating revenue 14,744,999 4,494,706 (9,538,683) 9,701,022
299,187,187 40,486,200 1,563,997 (9,538,683) 331,698,701 Operating expenses 260,780,235 47,519,360 2,140,348 607,529 (9,791,907) 301,255,565 Depreciation and amortization 15,794,664 1,033,097 430,956 17,258,717
INCOME (LOSS) FROM OPERATIONS 22,612,288 (8,066,257) (1,007,307) (607,529) 253,224 13,184,419 Nonoperating revenue (expenses) 2,921,603 (108,991) 1,002,592 (279,568) 3,535,636 Equity in affiliate losses (9,517,090) 9,287,735 (229,355) Interest Expense (890,345) (1,705) (103,477) 26,344 (969,183)
EXCESS OF REVENUE OVER EXPENSES 15,126,456 (8,176,953) (1,110,784) 395,063 9,287,735 15,521,517
Capital contribulions/Trans*rs 9,336,888 (9,336,888)
CHANGE IN NET POSITION 15,126,456 1,159,935 (1,110,784) 395,063 (49,153) 15,521,517
NET POSITION, BEGINNING OF YEAR 199,335,926 604,358 2,814,080 1,326,039 (11,738,625) 192,341,778 NET POSITION, END OF YEAR $214,462,382 1,764,293 1,703,296 $ 1,721,102 $ (11,787,778) $207,863,295
Statements of Revenue, Expenses and Changes in Net Position - Year Ended June 30, 2015 Surgery Hospital
Hospital FHG Center Foundation Eliminations (Blended) Operating Revenue
Net patient service revenue 5264,106,370 $ 30,967,682 $ 1,079,963 5 $ - $296,154,015 Other operating revenue 14,928,289 4,540,951 (8,056,718) 11,412,522
279,034,659 35,508,633 1,079,963 (8,056,718) 307,566,537 Operating expenses 244,358,376 40,995,927 1,905,416 565,123 (8,324,710) 279,500,132 Depreciation and amortization 15,414,746 1,054,355 411,679 16,880,780
INCOME (LOSS) FROM OPERATIONS 19,261,537 (6,541,649) (1,237,132) (565,123) 267,992 11,185,625 Nonoperating revenue (expenses) 2,290,623 (8,189) 3 705,644 (297,884) 2,690,197 Equity in affiliate losses (8,404,964) 7,925,394 (479,570) Interest Expense (335,770) (6,339) (132,069) 29,892 (444,286) EXCESS OF REVENUE OVER EXPENSES 12,811,426 (6,556,177) (1,369,198) 140,521 7,925,394 12,951,966 Capital contnbutionsiTransffirs 5,270,298 3,751,726 (9,022,024)
CHANGE IN NET POSITION 12,811,426 (1,285,879) 2,382,528 140,521 (1,096,630) 12,951,966 NET POSITION, BEGINNING OF YEAR 186,524,500 1,890,237 431,552 1,185,518 (10,641,995) 179,389,812
NET POSITION, END OF YEAR $199,335,926 $ 604,358 $ 2,814,080 $ 1,326,039 $ (11,738,625) $192,341,778
33
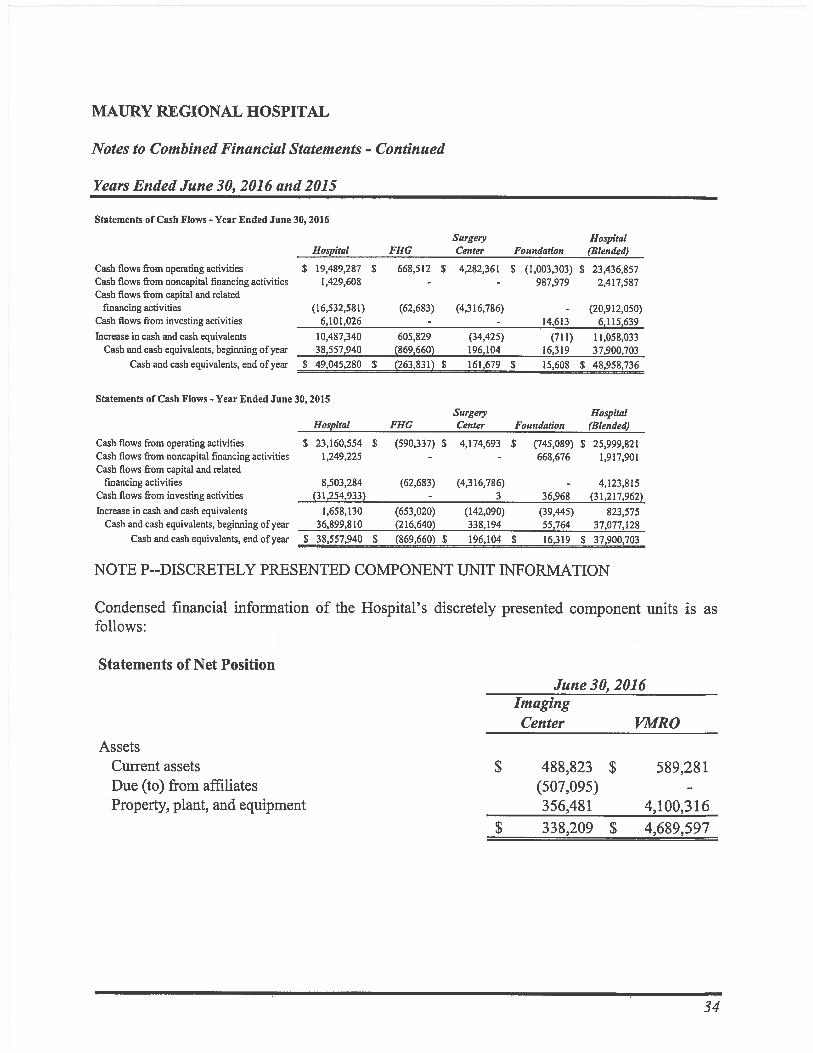
MAURY REGIONAL HOSPITAL
Notes to Combined Financial Statements - Continued
Years Ended June 30, 2016 and 2015
Statements of Cash Flows - Year Ended June 30, 2016
Hospital FHG Surgery Center Foundation
Hospital (Blended)
Cash flows from operating activities $ 19,489,287 $ 668,512 $ 4,282,361 $ (1,003,303) $ 23,436,857 Cash flows from noncapital financing activities 1,429,608 - 987,979 2,417,587 Cash flows from capital and related
financing activities (16,532,581) (62,683) (4,316,786) - (20,912,050) Cash flows from investing activities 6,101,026 14,613 6,115,639 Increase in cash and cash equivalents 10,487,340 605,829 (34,425) (711) 11,058,033
Cash and cash equivalents, beginning of year 38,557,940 (869,660) 196,104 16,319 37,900,703 Cash and cash equivalents, end of year $ 49,045,280 $ (263,831) $ 161,679 $ 15,608 $ 48,958,736
Statements of Cash Flows - Year Ended June 30, 2015
Hospital FHG Surgery Center Foundation
Hospital (Blended)
Cash flows from operating activities $ 23,160,554 $ (590,337) $ 4,174,693 $ (745,089) $ 25,999,821 Cash flows from noncapital financing activities 1,249,225 - 668,676 1,917,901 Cash flows from capital and related
financing activities 8,503,284 (62,683) (4,316,786) 4,123,815 Cash flows from investing activities (31,254,933) - 3 36,968 (31,217,962) Increase in cash and cash equivalents 1,658,130 (653,020) (142,090) (39,445) 823,575
Cash and cash equivalents, beginning of year 36,899,810 (216,640) 338,194 55,764 37,077,128 Cash and cash equivalents, end of year $ 38,557,940 $ (869,660) $ 196,104 $ 16,319 $ 37,900,703
NOTE P--DISCRETELY PRESENTED COMPONENT UNIT INFORMATION
Condensed financial information of the Hospital's discretely presented component units is as follows:
Statements of Net Position June 30, 2016
Imaging Center VMRO
Assets Current assets Due (to) from affiliates Property, plant, and equipment
$ 488,823 $ 589,281 (507,095) 356,481 4,100,316
$ 338,209 $ 4,689,597
34

MAURY REGIONAL HOSPITAL
Notes to Combined Financial Statements - Continued
Years Ended June 30, 2016 and 2015
Statements of Net Position June 30, 2016
Imaging Center VMRO
Liabilities Current liabilities $ 365,390 $ 1,054,970 Long-term debt 500,430 2,783,359
865,820 3,838,329
Net Position Net investment in capital assets (271,050) 511,708 Unrestricted (256,561) 339,560
(527,611) 851,268
$ 338,209 $ 4,689,597
Assets
June 30, 2015 Imaging Center VMRO
Current assets $ 661,440 $ 172,714 Due (to) from affiliates (555,192) Property, plant, and equipment 418,667 4,707,602
$ 524,915 $ 4,880,316
Liabilities Current liabilities $ 515,626 $ 963,980 Long-term debt 627,516 3,585,788
1,143,142 4,549,768
Net Position Net investment in capital assets (444,639) 347,537 Unrestricted (173,588) (16,989)
Net Position (618,227) 330,548
$ 524,915 $ 4,880,316
35
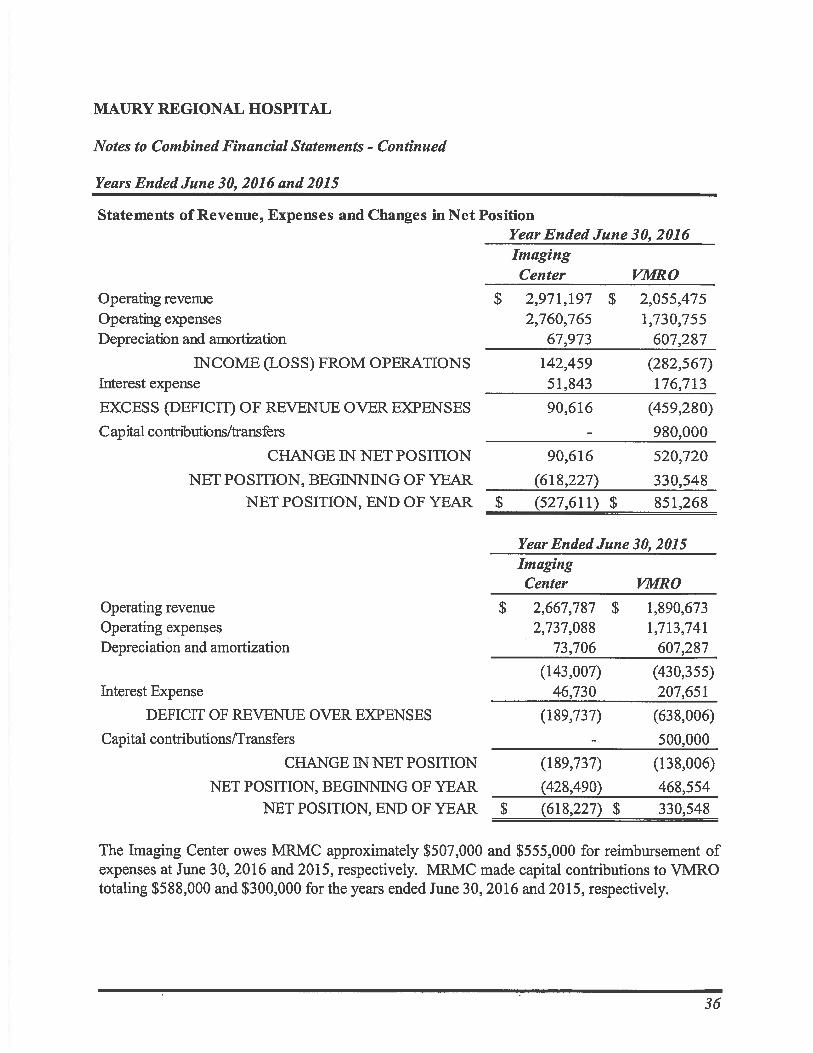
MAURY REGIONAL HOSPITAL
Notes to Combined Financial Statements - Continued
Years Ended June 30, 2016 and 2015
Statements of Revenue, Expenses and Changes in Net Position Year Ended June 30, 2016 Imaging Center VITRO
Operating revenue $ 2,971,197 $ 2,055,475 Operating expenses 2,760,765 1,730,755 Depreciation and amortization 67,973 607,287
INCOME (LOSS) FROM OPERATIONS 142,459 (282,567) Interest expense 51,843 176,713
EXCESS (DEFICIT) OF REVENUE OVER EXPENSES 90,616 (459,280)
Capital contributions/transfers 980,000
CHANGE IN NET POSITION 90,616 520,720
NET POSITION, BEGINNING OF YEAR (618,227) 330,548 NET POSITION, END OF YEAR $ (527,611) $ 851,268
Year Ended June 30, 2015 Imaging Center VMRO
Operating revenue $ 2,667,787 $ 1,890,673 Operating expenses 2,737,088 1,713,741 Depreciation and amortization 73,706 607,287
(143,007) (430,355) Interest Expense 46,730 207,651
DEFICIT OF REVENUE OVER EXPENSES (189,737) (638,006)
Capital contributions/Transfers - 500,000
CHANGE IN NET POSITION (189,737) (138,006)
NET POSITION, BEGINNING OF YEAR (428,490) 468,554 NET POSITION, END OF YEAR $ (618,227) $ 330,548
The Imaging Center owes MRMC approximately $507,000 and $555,000 for reimbursement of expenses at June 30, 2016 and 2015, respectively. MRMC made capital contributions to VMRO totaling $588,000 and $300,000 for the years ended June 30, 2016 and 2015, respectively.
36
SECTION III
REQUIRED SUPPLEMENTARY INFORMATION
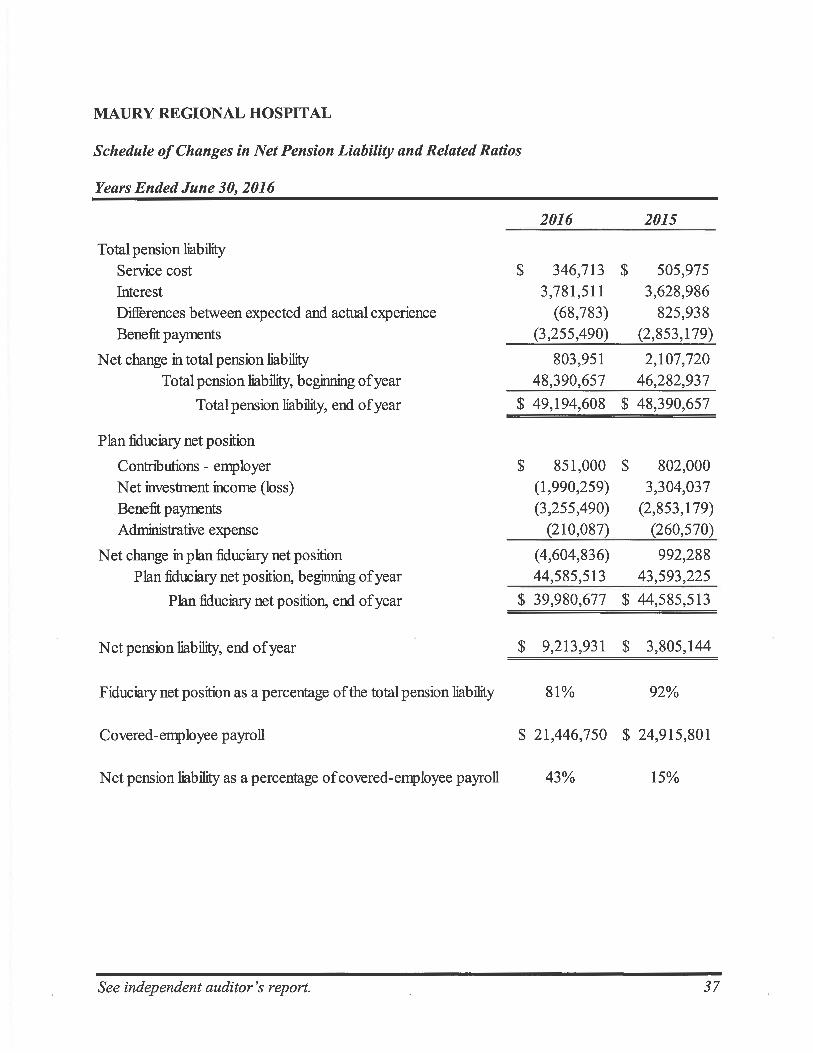
MAURY REGIONAL HOSPITAL
Schedule of Changes in Net Pension Liability and Related Ratios
Years Ended June 30, 2016
Total pension liability Service cost Interest Differences between expected and actual experience Benefit payments
Net change in total pension liability Total pension liability, beginning of year
2016 2015
$ 346,713 3,781,511
(68,783) (3,255,490)
$ 505,975 3,628,986
825,938 (2,853,179)
803,951 48,390,657
2,107,720 46,282,937
Total pension liability, end of year $ 49,194,608 $ 48,390,657
Plan fiduciary net position
Contributions - employer $ 851,000 $ 802,000 Net investment income (loss) (1,990,259) 3,304,037 Benefit payments (3,255,490) (2,853,179) Administrative expense (210,087) (260,570)
Net change in plan fiduciary net position (4,604,836) 992,288 Plan fiduciary net position, beginning of year 44,585,513 43,593,225
Plan fiduciary net position, end of year $ 39,980,677 $ 44,585,513
Net pension liability, end of year $ 9,213,931 $ 3,805,144
Fiduciary net position as a percentage of the total pension liability 81% 92%
Covered-employee payroll $ 21,446,750 $ 24,915,801
Net pension liability as a percentage of covered-employee payroll 43% 15%
See independent auditor's report. 37
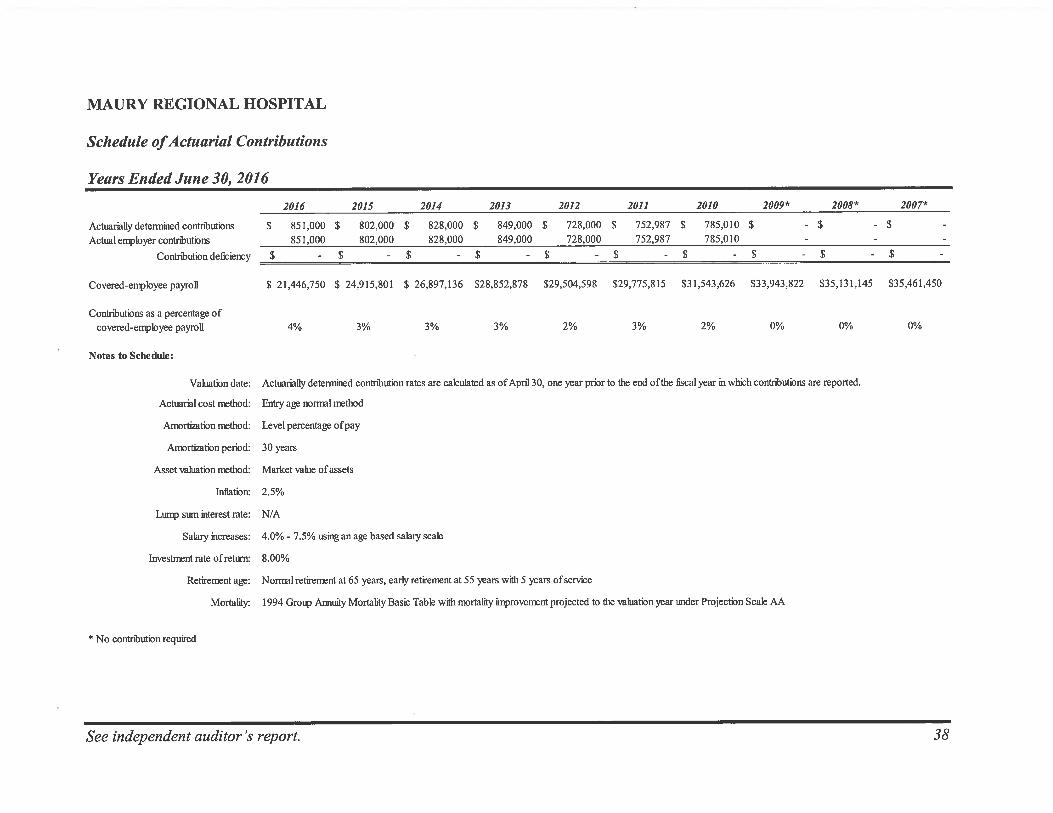
MAURY REGIONAL HOSPITAL
Schedule of Actuarial Contributions
Years Ended June 30, 2016
2016 2015 2014 2013 2012 2011 2010 2009* 2008* 2007*
Actuarially determined contributions $ 851,000 $ 802,000 $ 828,000 $ 849,000 $ 728,000 $ 752,987 $ 785,010 $ - $ - $
Actual employer contributions 851,000 802,000 828,000 849,000 728,000 752,987 785,010
Contribution deficiency $ - $ - $ - $ - $ - $ - $ - $ - $
Covered-employee payroll $ 21,446,750 $ 24,915,801 $ 26,897,136 $28,852,878 $29,504,598 $29,775,815 $31,543,626 $33,943,822 $35,131,145 $35,461,450
Contributions as a percentage of covered-employee payroll 4% 3% 3% 3% 2% 3% 2% 0% 0% 0%
Notes to Schedule:
Valuation date: Actuarially determined contribution rates are calculated as of April 30, one year prior to the end of the fiscal year in which contributions are reported.
Actuarial cost method: Entry age normal method
Amortization method: Level percentage of pay
Amortization period: 30 years
Asset valuation method: Market value of assets
Inflation: 2.5%
Lump sum interest rate: N/A
Salary increases: 4.0% - 7.5% using an age based salary scale
Investment rate of return: 8.00%
Retirement age: Normal retirement at 65 years, early retirement at 55 years with 5 years of service
Mortality 1994 Group Annuity Mortality Basic Table with mortality improvement projected to the valuation year under Projection Scale AA
* No contribution required
See independent auditor's report. 38

SECTION IV
INTERNAL CONTROL AND COMPLIANCE SECTION
PERSHING YOAKLEY & ASSOCIATES, P.C. One Cherokee Mills, 2220 Sutherland Avenue
Knoxville, TN 37919
p: (865) 673-0844 I f: (865) 673.0173 www.pyapc.com
Certified Public Accountants
REPORT ON INTERNAL CONTROL OVER FINANCIAL REPORTING AND ON COMPLIANCE AND OTHER MATTERS BASED ON AN AUDIT
OF FINANCIAL STATEMENTS PERFORMED IN ACCORDANCE WITH GOVERNMENT AUDITING STANDARDS
INDEPENDENT AUDITOR'S REPORT
To the Board of Trustees of Maury Regional Hospital:
We have audited, in accordance with auditing standards generally accepted in the United States of America and the standards applicable to financial audits contained in Government Auditing Standards issued by the Comptroller General of the United States, the combined financial statements of the business-type activities and aggregate discretely presented component units of Maury Regional Hospital (the Hospital) as of and for the year ended June 30, 2016, and the related notes to the combined financial statements which collectively comprise the Hospital's basic financial statements, and have issued our report thereon dated November 7, 2016.
Internal Control Over Financial Reporting
In planning and performing our audit of the financial statements, we considered the Hospital's internal control over financial reporting (internal control) to determine the audit procedures that are appropriate in the circumstances for the purpose of expressing our opinions on the financial statements, but not for the purpose of expressing an opinion on the effectiveness of the Hospital's internal control. Accordingly, we do not express an opinion on the effectiveness of the Hospital's internal control.
A deficiency in internal control exists when the design or operation of a control does not allow management or employees in the normal course of performing their assigned functions, to prevent, or detect and correct misstatements on a timely basis. A material weakness is a deficiency, or a combination of deficiencies, in internal control, such that there is a reasonable possibility that a material misstatement of the Hospital's financial statements will not be prevented, or detected and corrected on a timely basis. A significant deficiency is a deficiency, or a combination of deficiencies, in internal control that is less severe than a material weakness, yet important enough to merit attention by those charged with governance.
Our consideration of internal control was for the limited purpose described in the first paragraph of this section and was not designed to identify all deficiencies in internal control that might be material
ATLANTA I KANSAS CITY I KNOXVILLE I NASHVILLE I TAMPA
39
weaknesses or significant deficiencies. Given these limitations, during our audit we did not identify any deficiencies in internal control that we consider to be material weaknesses. However, material weaknesses may exist that have not been identified. We did identify a deficiency in internal control, described in the accompanying schedule of findings and questioned costs that we consider to be a significant deficiency. (2016-01)
Compliance and Other Matters
As part of obtaining reasonable assurance about whether the Hospital's financial statements are free of material misstatement, we performed tests of its compliance with certain provisions of laws, regulations, contracts, and grant agreements, noncompliance with which could have a direct and material effect on the determination of financial statement amounts. However, providing an opinion on compliance with those provisions was not an objective of our audit, and accordingly, we do not express such an opinion. The results of our tests disclosed no instances of noncompliance or other matters that are required to be reported under Government Auditing Standards.
Purpose of This Report
The purpose of this report is solely to describe the scope of our testing of internal control and compliance and the results of that testing, and not to provide an opinion on the effectiveness of the entity's internal control or on compliance. This report is an integral part of an audit performed in accordance with Government Auditing Standards in considering the Hospital's internal control and compliance. Accordingly, this communication is not suitable for any other purpose.
Piob, ?AI ' a/i-atto&A-0
Knoxville, Tennessee November 7, 2016
40
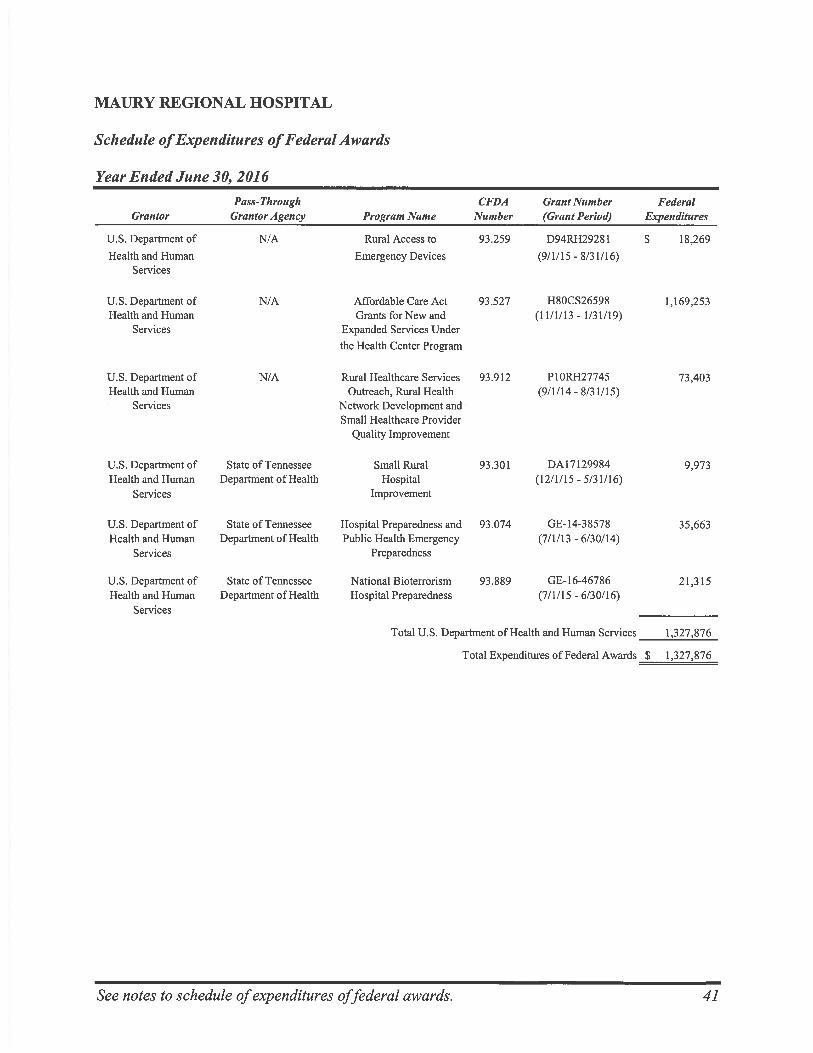
MAURY REGIONAL HOSPITAL
Schedule of Expenditures of Federal Awards
Year Ended June 30, 2016
Grantor Pass-Through
Grantor Agency Program Name CFDA
Number Grant Number (Grant Period)
Federal Expenditures
U.S. Department of N/A Rural Access to 93.259 D94RH29281 $ 18,269
Health and Human Emergency Devices (9/1/15 - 8/31/16) Services
U.S. Department of N/A Affordable Care Act 93.527 H80CS26598 1,169,253 Health and Human Grants for New and (11/1/13 - 1/31/19)
Services Expanded Services Under
the Health Center Program
U.S. Department of N/A Rural Healthcare Services 93.912 P1ORH27745 73,403 Health and Human Outreach, Rural Health (9/1/14 - 8/31/15)
Services Network Development and Small Healthcare Provider
Quality Improvement
U.S. Department of State of Tennessee Small Rural 93.301 DA17129984 9,973 Health and Human Department of Health Hospital (12/1/15 - 5/31/16)
Services Improvement
U.S. Department of State of Tennessee Hospital Preparedness and 93.074 GE-14-38578 35,663 Health and Human Department of Health Public Health Emergency (7/1/13 - 6/30/14)
Services Preparedness
U.S. Department of State of Tennessee National Bioterrorism 93.889 GE-16-46786 21,315 Health and Human Department of Health Hospital Preparedness (7/1/15 - 6/30/16)
Services
Total U.S. Department of Health and Human Services 1,327,876
Total Expenditures of Federal Awards $ 1,327,876
See notes to schedule of expenditures offederal awards. 41
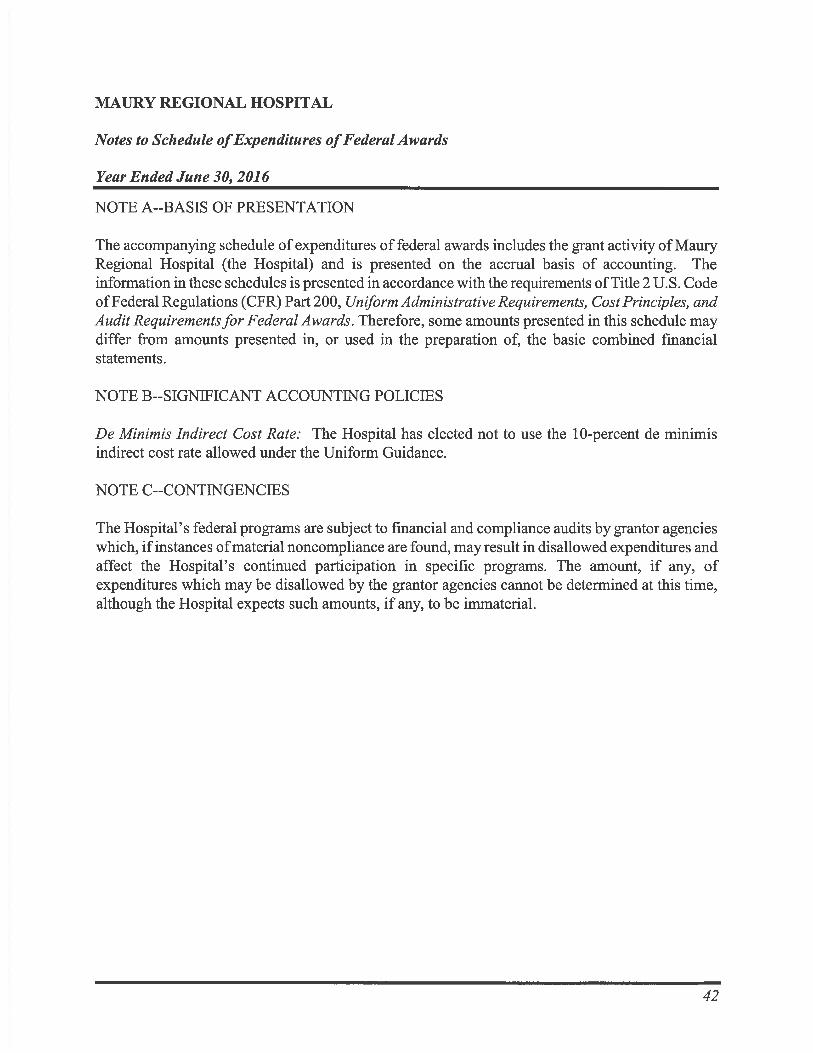
MAURY REGIONAL HOSPITAL
Notes to Schedule of Expenditures of Federal Awards
Year Ended June 30, 2016
NOTE A--BASIS OF PRESENTATION
The accompanying schedule of expenditures of federal awards includes the grant activity of Maury Regional Hospital (the Hospital) and is presented on the accrual basis of accounting. The information in these schedules is presented in accordance with the requirements of Title 2 U.S. Code of Federal Regulations (CFR) Part 200, Uniform Administrative Requirements, Cost Principles, and Audit Requirements for Federal Awards. Therefore, some amounts presented in this schedule may differ from amounts presented in, or used in the preparation of, the basic combined financial statements.
NOTE B--SIGNIFICANT ACCOUNTING POLICIES
De Minimis Indirect Cost Rate: The Hospital has elected not to use the 10-percent de minimis indirect cost rate allowed under the Uniform Guidance.
NOTE C--CONTINGENCIES
The Hospital's federal programs are subject to financial and compliance audits by grantor agencies which, if instances of material noncompliance are found, may result in disallowed expenditures and affect the Hospital's continued participation in specific programs. The amount, if any, of expenditures which may be disallowed by the grantor agencies cannot be determined at this time, although the Hospital expects such amounts, if any, to be immaterial.
42
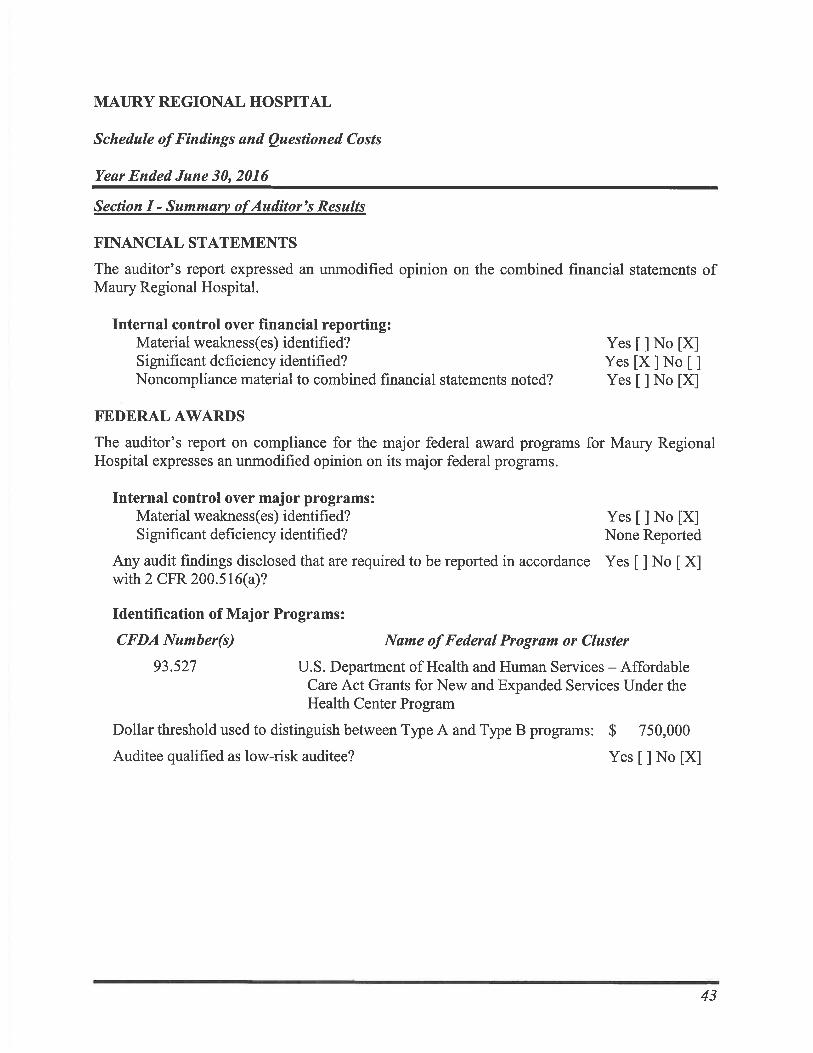
MAURY REGIONAL HOSPITAL
Schedule of Findings and Questioned Costs
Year Ended June 30, 2016
Section I - Summary of Auditor's Results
FINANCIAL STATEMENTS
The auditor's report expressed an unmodified opinion on the combined financial statements of Maury Regional Hospital.
Internal control over financial reporting: Material weakness(es) identified? Significant deficiency identified? Noncompliance material to combined financial statements noted?
FEDERAL AWARDS
Yes [ ] No [X] Yes [X] No [ Yes [ ] No [X]
The auditor's report on compliance for the major federal award programs for Maury Regional Hospital expresses an unmodified opinion on its major federal programs.
Internal control over major programs: Material weakness(es) identified? Yes [ ] No [X] Significant deficiency identified? None Reported
Any audit findings disclosed that are required to be reported in accordance Yes [ ] No [ X] with 2 CFR 200.516(a)?
Identification of Major Programs:
CFDA Number(s) Name of Federal Program or Cluster
93.527 U.S. Department of Health and Human Services — Affordable Care Act Grants for New and Expanded Services Under the Health Center Program
Dollar threshold used to distinguish between Type A and Type B programs: $ 750,000
Auditee qualified as low-risk auditee? Yes [ ] No [X]
43
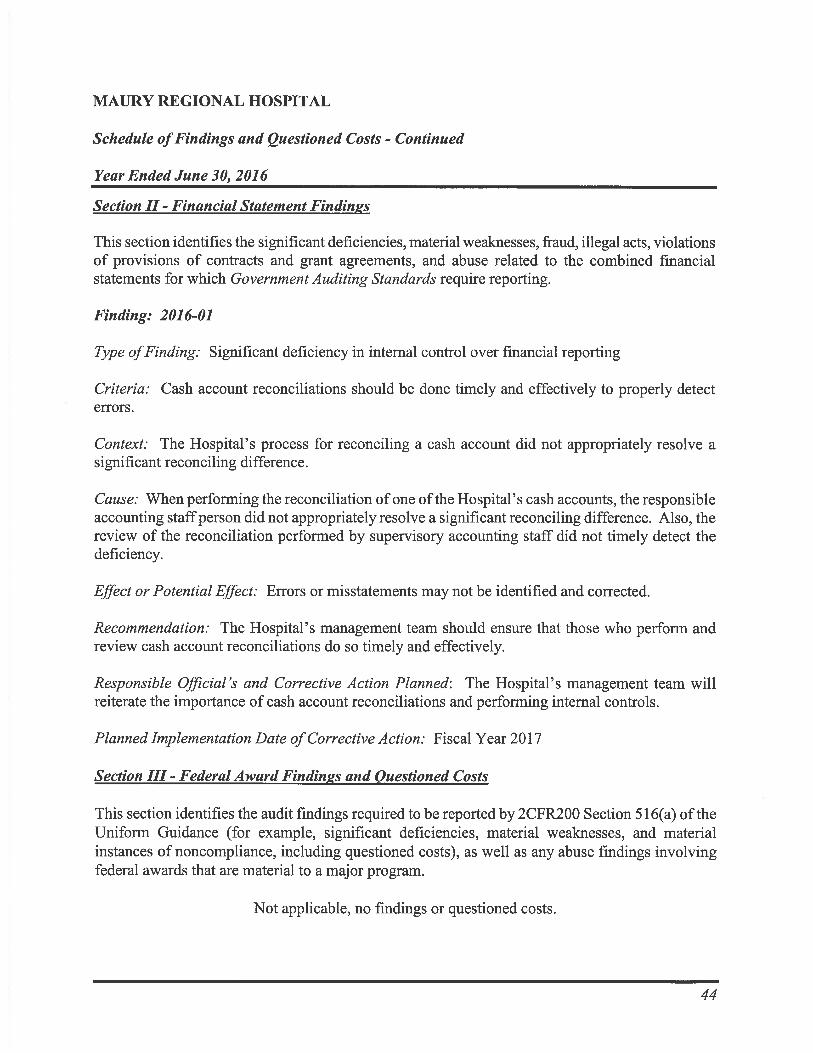
MAURY REGIONAL HOSPITAL
Schedule of Findings and Questioned Costs - Continued
Year Ended June 30, 2016
Section II - Financial Statement Findings
This section identifies the significant deficiencies, material weaknesses, fraud, illegal acts, violations of provisions of contracts and grant agreements, and abuse related to the combined financial statements for which Government Auditing Standards require reporting.
Finding: 2016-01
Type of Finding: Significant deficiency in internal control over financial reporting
Criteria: Cash account reconciliations should be done timely and effectively to properly detect errors.
Context: The Hospital's process for reconciling a cash account did not appropriately resolve a significant reconciling difference.
Cause: When performing the reconciliation of one of the Hospital's cash accounts, the responsible accounting staff person did not appropriately resolve a significant reconciling difference. Also, the review of the reconciliation performed by supervisory accounting staff did not timely detect the deficiency.
Effect or Potential Effect: Errors or misstatements may not be identified and corrected.
Recommendation: The Hospital's management team should ensure that those who perform and review cash account reconciliations do so timely and effectively.
Responsible Official's and Corrective Action Planned: The Hospital's management team will reiterate the importance of cash account reconciliations and performing internal controls.
Planned Implementation Date of Corrective Action: Fiscal Year 2017
Section III - Federal Award Findings and Questioned Costs
This section identifies the audit findings required to be reported by 2CFR200 Section 516(a) of the Uniform Guidance (for example, significant deficiencies, material weaknesses, and material instances of noncompliance, including questioned costs), as well as any abuse findings involving federal awards that are material to a major program.
Not applicable, no findings or questioned costs.
44
MAURY REGIONAL HOSPITAL
Schedule of Prior Audit Findings
Year Ended June 30, 2016
There were no prior audit findings.
45
PERSHING YOAKLEY & ASSOCIATES, P.C. One Cherokee Mills, 2220 Sutherland Avenue
Knoxville, TN 37919
p: (865) 673-0844 I f: (865) 673-0173 www.pyapc.com
Certified Public Accountants
REPORT ON COMPLIANCE FOR EACH MAJOR FEDERAL PROGRAM AND REPORT ON INTERNAL CONTROL OVER COMPLIANCE IN
ACCORDANCE WITH UNIFORM GUIDANCE
INDEPENDENT AUDITOR'S REPORT
To the Board of Trustees of Maury Regional Hospital:
Report on Compliance for Each Major Federal Program
We have audited Maury Regional Hospital's (the Hospital) compliance with the types of compliance requirements described in the U.S. Office of Management and Budget (OMB) Compliance Supplement that could have a direct and material effect on each of its major federal programs for the year ended June 30, 2016. The Hospital's major federal programs are identified in the summary of auditor's results section of the accompanying schedule of findings and questioned costs.
Management's Responsibility
Management is responsible for compliance with the requirements of laws, regulations, contracts, and grants applicable to its major federal programs.
Auditor's Responsibility
Our responsibility is to express an opinion on compliance for each of the Hospital's major federal programs based on our audit of the types of compliance requirements referred to above. We conducted our audit of compliance in accordance with auditing standards generally accepted in the United States of America; the standards applicable to financial audits contained in Government Auditing Standards, issued by the Comptroller General of the United States; and Title 2 U.S. Code of Federal Regulations (CFR) Part 200, Uniform Administrative Requirements, Cost Principles, and Audit Requirements for Federal Awards (Uniform Guidance). Those standards and the Uniform Guidance require that we plan and perform the audit to obtain reasonable assurance about whether noncompliance with the types of compliance requirements referred to above that could have a direct and material effect on a major federal program occurred. An audit includes examining, on a test basis, evidence about the Hospital's compliance with those requirements and performing such other procedures as we considered necessary in the circumstances.
ATLANTA I KANSAS CITY I KNOXVILLE I NASHVILLE I TAMPA
46
We believe that our audit provides a reasonable basis for our opinion on compliance for each major federal program. However, our audit does not provide a legal determination of the Hospital's compliance.
Opinion on Each Major Federal Programs
In our opinion, the Hospital complied, in all material respects, with the compliance requirements referred to above that could have a direct and material effect on each of its major federal programs for the year ended June 30, 2016.
Report on Internal Control Over Compliance
Management of the Hospital is responsible for establishing and maintaining effective internal control over compliance with the types of compliance requirements referred to above. In planning and performing our audit of compliance, we considered the Hospital's internal control over compliance with the types of requirements that could have a direct and material effect on each major federal program as a basis for designing auditing procedures that are appropriate in the circumstances for the purpose of expressing an opinion on compliance for each major federal program and to test and report on internal control over compliance in accordance with the Uniform Guidance, but not for the purpose of expressing an opinion on the effectiveness of internal control over compliance. Accordingly, we do not express an opinion on the effectiveness of the Hospital's internal control over compliance.
A deficiency in internal control over compliance exists when the design or operation of a control over compliance does not allow management or employees, in the normal course of performing their assigned functions, to prevent, or detect and correct noncompliance with a type of compliance requirement of a federal program on a timely basis. A material weakness in internal control over compliance is a deficiency, or combination of deficiencies, in internal control over compliance, such that there is a reasonable possibility that material noncompliance with a type of compliance requirement of a federal program will not be prevented, or detected and corrected on a timely basis. A significant deficiency in internal control over compliance is a deficiency, or a combination of deficiencies, in internal control over compliance with a type of compliance requirement of a federal program that is less severe than a material weakness in internal control over compliance, yet important enough to merit attention by those charged with governance.
Our consideration of internal control over compliance was for the limited purpose described in the first paragraph of this section and was not designed to identify all deficiencies in internal control over compliance that might be material weaknesses or significant deficiencies. We did not identify any deficiencies in internal control over compliance that we consider to be material weaknesses. However, material weaknesses may exist that have not been identified.
47
The purpose of this report on internal control over compliance is solely to describe the scope of our testing of internal control over compliance and the results of that testing based on requirements of the Uniform Guidance. Accordingly, this report is not suitable for any other purpose.
PN,Fe :. 4faee?p,c-
Knoxville, Tennessee January 9, 2017
48