Embed Size (px)
Citation preview
AFRICAN DEVELOPMENT BANK
PROJECT COMPLETION REPORT
ROSE BELLE SUGAR REHABILITATION PROJECT
MAURITIUS
AGRICULTURE AND RURAL DEVELOPMENT ONAR.2DEPARTMENT NOURTH, SOUTH, EAST REGION DIVISON May 2002

EQUIVALENTS AND ABBREVIATIONS
CURRENCY EQUIVALENTS
Current Unit : Mauritian Rupe (MRs)1 UA : Mrs 20.37531 MRs : UA 0.05
WEIGHTS AND MEASURES
1 hectare(ha) : 2.47 acres1 square kilometer (unit) : 100 ha1 tonne (t) : 1,000 kilogrammes (kg)1 kg : 2.2 pounds1 km : 0.62 miles1 metre : 3.28 feet (ft)
FINANCIAL YEARS
Government : 1st July - 30th JuneRSEB : 1st January - 31 December
ABBREVIATIONS
ADF : African Development FundADB : African Development BankF.C : Foreign CostGOM : Government of MauritiusLC : Local CostMRs : Mauritian RupeesPY : Project YearRSE : Rose Belle Sugar EstateRSEB : Rose Belle Sugar Estate BoardTCD : Tonne Cane per DayTCH : Tonnes of Cane per HourTSY : Tonnes of Sugar per YearUA : Bank Unit of AccountVLR : Variable Lending Rate
ii
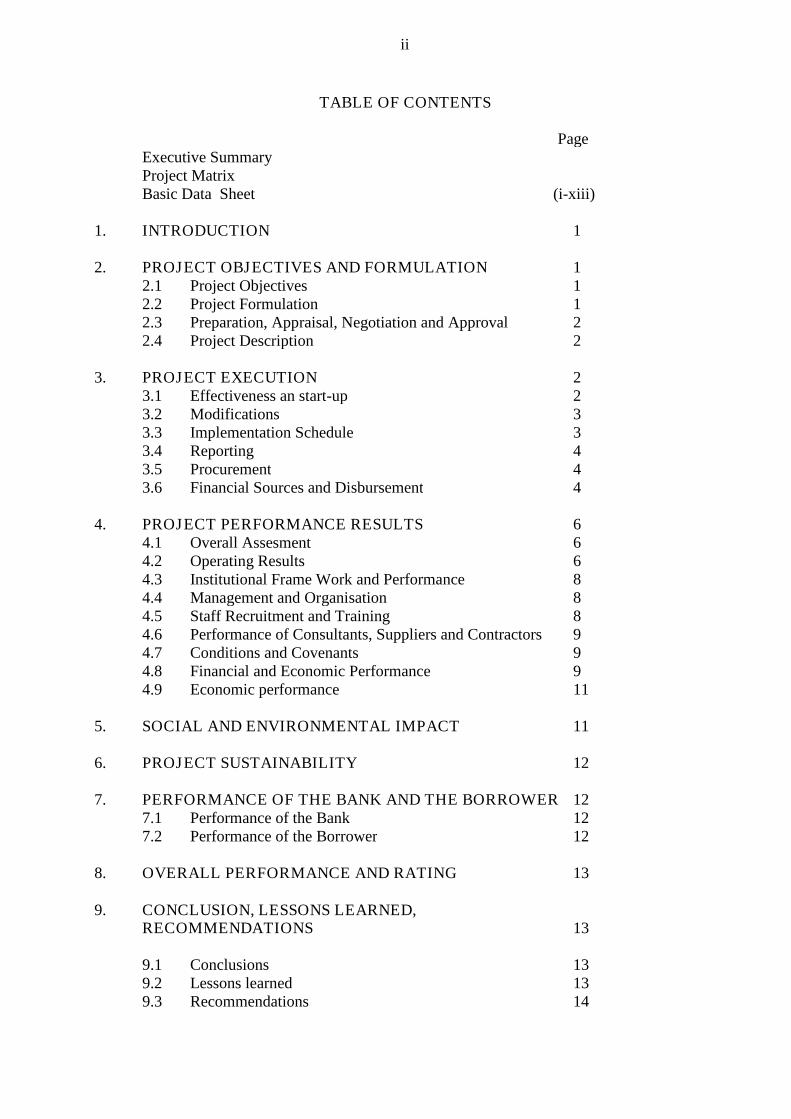
TABLE OF CONTENTS
PageExecutive SummaryProject MatrixBasic Data Sheet (i-xiii)
1. INTRODUCTION 1
2. PROJECT OBJECTIVES AND FORMULATION 12.1 Project Objectives 12.2 Project Formulation 12.3 Preparation, Appraisal, Negotiation and Approval 22.4 Project Description 2
3. PROJECT EXECUTION 23.1 Effectiveness an start-up 23.2 Modifications 33.3 Implementation Schedule 33.4 Reporting 43.5 Procurement 43.6 Financial Sources and Disbursement 4
4. PROJECT PERFORMANCE RESULTS 64.1 Overall Assesment 64.2 Operating Results 64.3 Institutional Frame Work and Performance 84.4 Management and Organisation 84.5 Staff Recruitment and Training 84.6 Performance of Consultants, Suppliers and Contractors 94.7 Conditions and Covenants 94.8 Financial and Economic Performance 94.9 Economic performance 11
5. SOCIAL AND ENVIRONMENTAL IMPACT 11
6. PROJECT SUSTAINABILITY 12
7. PERFORMANCE OF THE BANK AND THE BORROWER 127.1 Performance of the Bank 127.2 Performance of the Borrower 12
8. OVERALL PERFORMANCE AND RATING 13
9. CONCLUSION, LESSONS LEARNED,RECOMMENDATIONS 13
9.1 Conclusions 139.2 Lessons learned 139.3 Recommendations 14

iii
LIST OF ANNEXES
AnnexNo. Titles No of
Pages
1 : Project Location Map 12. : Calculation of Economic Internal Rate of Return 23. : Performance Evaluation and Rating 44. : Recommendations and Follow-up Actions 15. : Sources of Information 16. : Borrower PCR 17. : Executing Agency's Comments to the PCR 1
______________________________________________________________________________
This Report was prepared by Messrs H.A. Lam (Principal Agronomist and Team Leader), M.Basalirwa, Financial Analyst, and a Factory Engineer Consultant. All queries should be addressedto M. J.P. Rigoulot (Division Manager, ONAR.2) and the authors.
iv
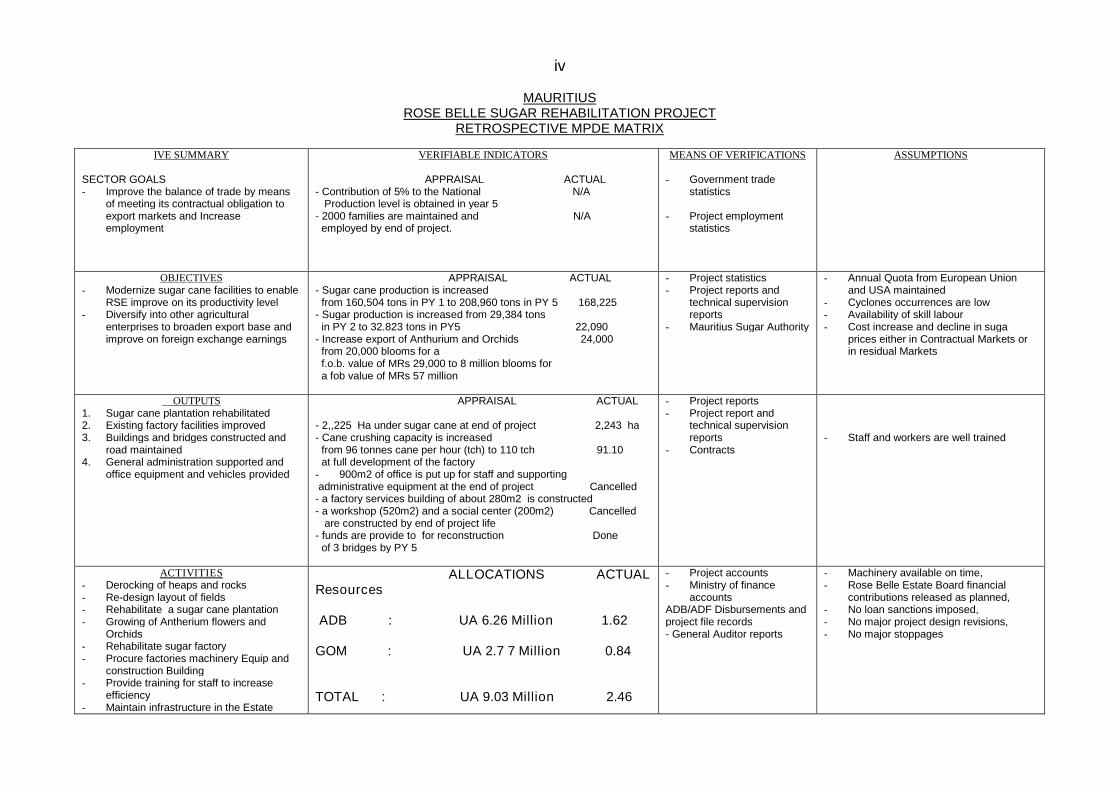
MAURITIUSROSE BELLE SUGAR REHABILITATION PROJECT
RETROSPECTIVE MPDE MATRIX
IVE SUMMARY
SECTOR GOALS- Improve the balance of trade by means
of meeting its contractual obligation toexport markets and Increaseemployment
VERIFIABLE INDICATORS
APPRAISAL ACTUAL- Contribution of 5% to the National N/A
Production level is obtained in year 5- 2000 families are maintained and N/A
employed by end of project.
MEANS OF VERIFICATIONS
- Government tradestatistics
- Project employmentstatistics
ASSUMPTIONS
OBJECTIVES- Modernize sugar cane facilities to enable
RSE improve on its productivity level- Diversify into other agricultural
enterprises to broaden export base andimprove on foreign exchange earnings
APPRAISAL ACTUAL- Sugar cane production is increased
from 160,504 tons in PY 1 to 208,960 tons in PY 5 168,225- Sugar production is increased from 29,384 tons
in PY 2 to 32.823 tons in PY5 22,090- Increase export of Anthurium and Orchids 24,000
from 20,000 blooms for af.o.b. value of MRs 29,000 to 8 million blooms fora fob value of MRs 57 million
- Project statistics- Project reports and
technical supervisionreports
- Mauritius Sugar Authority
- Annual Quota from European Unionand USA maintained
- Cyclones occurrences are low- Availability of skill labour- Cost increase and decline in suga
prices either in Contractual Markets orin residual Markets
OUTPUTS1. Sugar cane plantation rehabilitated2. Existing factory facilities improved3. Buildings and bridges constructed and
road maintained4. General administration supported and
office equipment and vehicles provided
APPRAISAL ACTUAL
- 2,,225 Ha under sugar cane at end of project 2,243 ha- Cane crushing capacity is increased
from 96 tonnes cane per hour (tch) to 110 tch 91.10at full development of the factory
- 900m2 of office is put up for staff and supportingadministrative equipment at the end of project Cancelled
- a factory services building of about 280m2 is constructed- a workshop (520m2) and a social center (200m2) Cancelled
are constructed by end of project life- funds are provide to for reconstruction Done
of 3 bridges by PY 5
- Project reports- Project report and
technical supervisionreports
- Contracts- Staff and workers are well trained
ACTIVITIES- Derocking of heaps and rocks- Re-design layout of fields- Rehabilitate a sugar cane plantation- Growing of Antherium flowers and
Orchids- Rehabilitate sugar factory- Procure factories machinery Equip and
construction Building- Provide training for staff to increase
efficiency- Maintain infrastructure in the Estate
ALLOCATIONS ACTUALResources
ADB : UA 6.26 Million 1.62
GOM : UA 2.7 7 Million 0.84
TOTAL : UA 9.03 Million 2.46
- Project accounts- Ministry of finance
accountsADB/ADF Disbursements andproject file records- General Auditor reports
- Machinery available on time,- Rose Belle Estate Board financial
contributions released as planned,- No loan sanctions imposed,- No major project design revisions,- No major stoppages

v
BASIC PROJECT DATA
1. Loan No. : ADB – B / MRS / IND – REH / 91 / 032. Borrower : Government of Mauritius3. Guarantor : Government of Mauritius4. Beneficiary : Rose Belle Sugar Estate5. Executing Agency : Rose Belle Sugar Estate
A.
LOAN APPRAISAL ACTUALESTIMATE
1. Amount (UA /Million) UA 6. 30 million 5.0 million2. Interest rate 8.05 Variable lending rate 8.05 V.L.R3. Repayment period 20 years 20 years4. Grace Period 6 years 6 years5. Loan Negotiation Date 15 May 19916. Loan Approval Date June 1991 17 June 19917. Loan Signature Date 2 August 19918. Date of Entry into force 6 November 1992
B. PROJECT DATAAPPRAISAL ACTUALESTIMATE
1. Total Cost (UA million) UA 6.30 million UA 5.0 million2. Financing Plan (UA million) FC LC FC LC
ADB 4.91 1.35 2.46 N.A.(due toloan cancellation)
RBES -- 2.77
3. Effective date of first disbursement : May 4, 19944. Effective date of last disbursement : 31/12/975. Commencement of project implementation activities : November 19926. Date of completion of project implementation activities : September 1998
C. PERFORMANCE INDICATORS
1. Cost underrun NA2. Time overrun 18 months
- Slippage of effectiveness- Slippage of Completion Date 18 months- Slippage of Last Disbursement- Number of extensions of last Disbursement Completion Date: 1
3. Project Implementation Status : completed
vi
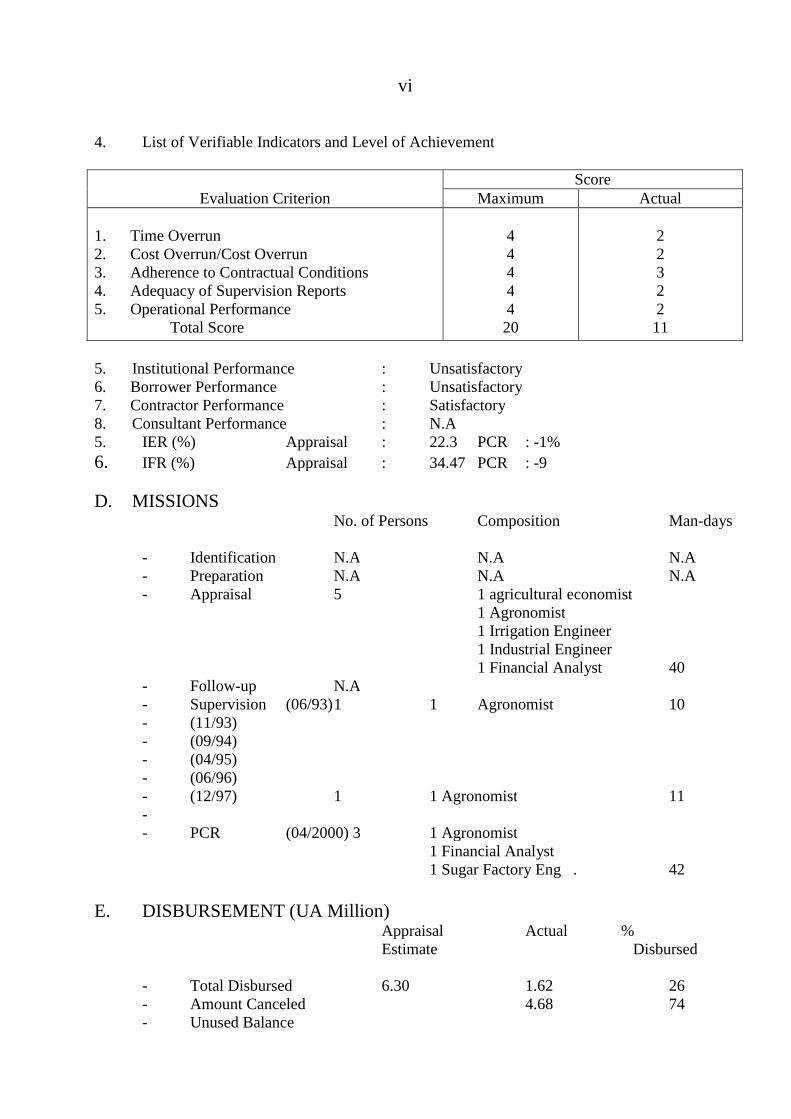
4. List of Verifiable Indicators and Level of Achievement
ScoreEvaluation Criterion Maximum Actual
1. Time Overrun2. Cost Overrun/Cost Overrun3. Adherence to Contractual Conditions4. Adequacy of Supervision Reports5. Operational Performance
Total Score
4444420
2232211
5. Institutional Performance : Unsatisfactory6. Borrower Performance : Unsatisfactory7. Contractor Performance : Satisfactory8. Consultant Performance : N.A5. IER (%) Appraisal : 22.3 PCR : -1%
6. IFR (%) Appraisal : 34.47 PCR : -9
D. MISSIONSNo. of Persons Composition Man-days
- Identification N.A N.A N.A- Preparation N.A N.A N.A- Appraisal 5 1 agricultural economist
1 Agronomist1 Irrigation Engineer1 Industrial Engineer1 Financial Analyst 40
- Follow-up N.A- Supervision (06/93)1 1 Agronomist 10- (11/93)- (09/94)- (04/95)- (06/96)- (12/97) 1 1 Agronomist 11-- PCR (04/2000) 3 1 Agronomist
1 Financial Analyst1 Sugar Factory Eng . 42
E. DISBURSEMENT (UA Million)Appraisal Actual %Estimate Disbursed
- Total Disbursed 6.30 1.62 26- Amount Canceled 4.68 74- Unused Balance

vii
E. Bank Disbursement
YearAmount Cum (%) Amount Cum (%)
1992 2.08 30.251993 2.13 67.251994 1.28 87.70 0.49 30.251995 0.48 95.37 0.18 41.361996 0.29 100 0.54 74.691997 -1998 0.41 100.0
TOTAL 6.26 100 1.62 100.0
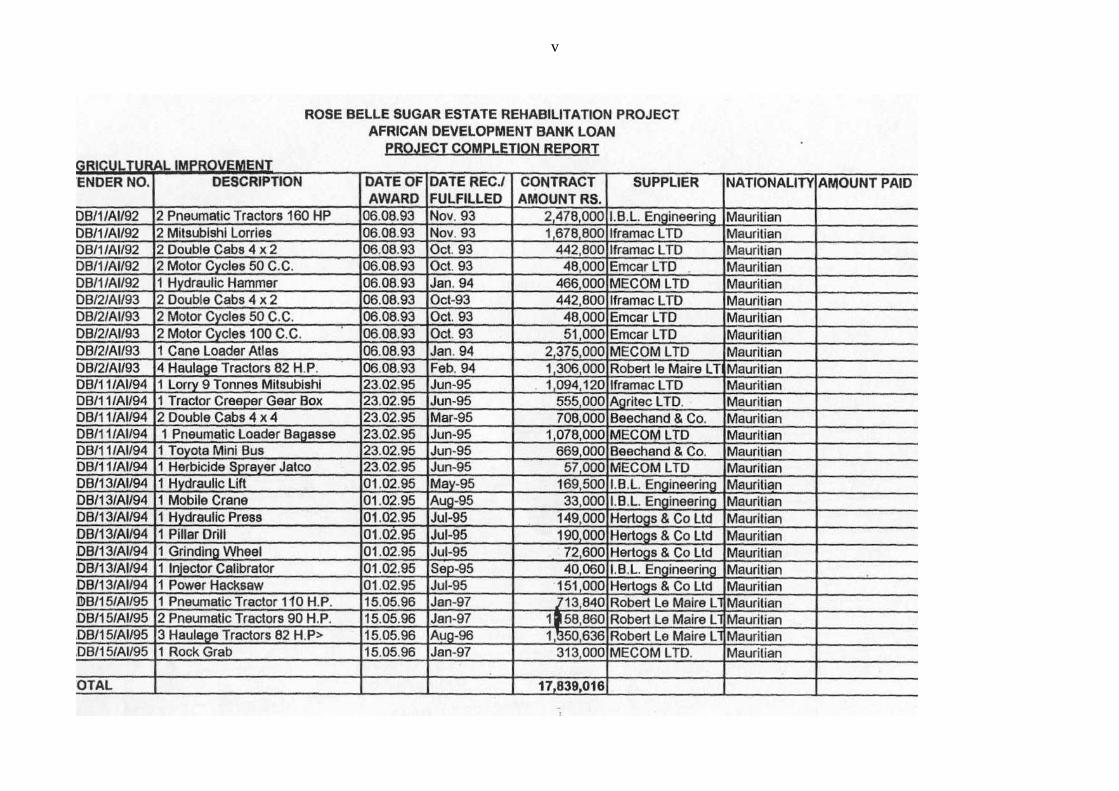
F. Contractor(s) / Supplier (s)See list in Annex
G. ConsultantNot required.
Appraisal Actual
v

ix
x

xi
xii
EXECUTIVE SUMMARY
1.1 Sugar industry plays a vital role in the economic structure of Mauritius. Sugar productioncapacity is directly related to the amount of sugar cane that can be produced, which in turn islimited in terms of land available in the country. Further increases in sugar production at thenational level; therefore mainly on increasing the productivity and the efficient utilisation of by-products. This requires mechanisation of agricultural activities, reclamation of land under rockand the upgrading of the processing facilities of the factory in order to increase efficiency andhigh yield.
1.2 The major objective of the project was to modernise existing sugar production facilities ofthe RBSE, like cane fields, factory and related infrastructure, to enable RBSE improve on itsproductivity and reinstate its production level of about 32,775 tones sugar per year or crushing of110 tones cane per hour. The project was also to diversify into agricultural enterprises, to broadenthe export base of the country and increase the foreign exchange earnings
1.3 The project was appraised in February 1991. The loan negotiations were held 14 and 15May 1991 and loan was approved on 17 June 1991 and signed on 02 August 1991. The totalproject cost was estimated to be Mauritius Rupees (MRs) 184.02 million or BUA 9.03 millioncomposed of foreign exchange and local cost. A loan of UA 6.30 million, representing ADBcontribution, was approved to meet the entire foreign component of the project and part of thelocal cost. Out of the total amount of UA 6.30 million, only UA 1.62 million was utilised. Uponrequest from the Government UA 4.68 million (about 74% of the loan) were cancelled.
1.4 The project encountered several difficulties in its implementation due to delays in loaneffectiveness, changes and modification of scope made mainly in the area of of factoryrehabilitation and improvement. The performance of the project has been poor. The target set inthe appraisal report was unrealistic. Due consideration for the past performance and the conditionof the equipment was overlooked. The equipment needed immediate replacement due to age, andtechnological advancement were not considered for replacement or modification. The equipmentof obsolete design and inefficient, should have been completely replaced for efficiencyimprovement. Expectations from an old plant were set high.
1.5 The project suffered implementation delay that affected greatly its performance. The loancancellation did not allow completion of the factory improvement for a better processingperformance. The target in the agricultural development (derocking, cane production) anddiversification programme were not reached. The financial performance of the company waspoor all over the project period. The company consistently registered losses from the time theloan was first disbursed. In 1992 the company registered a loss of MRs 14,439,903 and MRs10,061,963 in 1998. The cumulative losses over the period 1992 –98 after adjusting forextraordinary items were MRs 134,099,177.
1.6 With the cancellation of 74% of the loan, the financial internal rate of return estimated atappraisal was well above that obtained on completion. A recalculation of the FIRR on totalcapital invested, with prices and revenue adjusted to appraisal year figures yielded FIRR of –9%compared to the appraisal financial rate of return of 34%. Given the fact that only 26% of theloan was utilized and as such little investment was done, another measure, namely return on thefixed assets over the project period was evaluated. In 1992 the rate was -8%, which meant that aloss of 8 cents was incurred for every rupee invested in fixed assets, while in 1996 the rate was -12% meaning that the situation had worsened. There was an improvement in 1998 when thereturn on fixed assets was -3.6%, but on average, from 1992-98, the Estate incurred a loss of 6
xiii
cents on every rupee that was invested in fixed assets. This significantly reinforces the FIRR of –9%. Details of the calculations are indicated in Annex 2.
1.7 Considering the way the project was implemented and the non-achievement of its fullobjective, some key lessons be drawn: The short time devoted to prepare and appraise the projectdid not allow to set realistic target and clear assumptions. The disbursement method used(reimbursement method) needed to be carefully studied before it is proposed in Bank fundedprojects and properly addressed during appraisal and reviewed during implementation
1.8 Emphasis was put on rehabilitation works. With such project, in addition of the physicalrehabilitation, more attention should have been given to the processing and milling performance toincrease the recovery rate and reduce the sucrose losses.
1. INTRODUCTION
1.1 Sugar industry plays a vital role in the economic structure of Mauritius. It is an essentialfactor in the social and economic growth of the country. Sugar production capacity is directlyrelated to the amount of sugar cane that can be produced, which in turn is limited in terms ofland available in the country. Further increase in sugar production at the national level thereforedepends mainly on increasing productivity and the efficient utilization of by-products. Thisrequires mechanization of agricultural activities, reclamation of land under rock and theupgrading of the processing facilities of the factory in order to increasing efficiency and highyields. Further investments were needed to meet these requirements.
1.2 The Rose Belle Sugar Estate was proposed to be modernized, for existing sugar canefacilities viz. cane fields, factory and related infrastructure to enable RSE, improve on itsproductivity and achieve production level of 110 TCH. It also included meeting the standards setfor environment controls. The project also included the objective of diversification into flowerproduction for improving the foreign exchange earnings.
1.3 The total project cost was estimated to be Mauritius Rupees (MRs) 184.02 million or UA9.03 million composed of foreign exchange and local cost. A loan of UA 6.30 million,representing ADB contribution, was approved to meet the entire foreign component of theproject and part of the local cost.
2. PROJECT OBJECTIVES AND FORMULATION
2.1 Project Objectives
The major objective of the project was to modernise existing sugar facilities of the RBSElike cane fields, factory and related infrastructure, to enable RBSE improve on its productivity andreinstate its production level of about 32,775 tones sugar per year or crushing of 110 tones caneper hour. The project is also to diversify into agricultural enterprises, to broaden the export base ofthe country and increase the foreign exchange earnings
2.2 Formulation
2.2.1 Following the International Meeting on Agricultural Sector (IMAS) held in Mauritius,December 1990, the Government of Mauritius invited the African Development Bank to assessthe viability of improving on the operational efficiency of the Rose Belle Estate Sugar takinginto consideration measures recommended in SAP and the SIEA of 1988. A Bank missionvisited Mauritius in February/March 1991 to consider a Rehabilitation Programme for the RSE.No preliminary studies were undertaken.
2.2.2 The project was formulated with the objective of improving the productivity of land andlabor and improving efficiencies in the existing factory. For this two options were considered: (i)The Agricultural Improvement Option: and (ii) the Factory Improvement Option.
2.2.3 As the rainfall is sufficient and well spread throughout the year; irrigation (option one;for increasing production of land) was not considered. The second approach was to increasemechanization of the field operations and cane harvesting to increase productivity of land andlabour; hence derocking of the fields forms an essential component of the project
2
2.2.4 As the factory is existing and operating, though some machinery is aged, foroptimisation of crushing capacity to 110 tch and improvement in operating efficiencies, the
only viable option is to replace the unserviceable machinery, add instrumentation and someequipment to improve efficiencies in the existing factory only.
2.2.5 With respect to these two approaches, it was proposed, in the project to replace/repair oldmachinery and add some new items of machinery in the existing factory and resort to increasedmechanization and derocking of the fields for improvement in labour productivity and landproductivity to increase cane and sugar production.
2.3 Preparation, Appraisal, Negotiation and Approval
Following the invitation by the Government of Mauritius, the Bank undertook anappraisal mission in February 1991. There was no preparation. The loan negotiations were held14 and 15 May 1991 and the Bank approved loan on 17 June 1991. The loan was signed on 02August 1991.
2.4 Project Description
2.4.1 The project comprises the following components:A. Agricultural Improvement and Diversification Program:B. Factory ImprovementC. Infrastructure:D. Project Management Support
2.4.2 The project involved: (i) the rehabilitation of sugar production on a state of 2,225 ha ofsugar cane; (ii) the improvement of the existing factory; (iii) the construction of new functionalbuildings buildings, bridges and road maintenance. Machinery and equipment of the derockingprogramme, field operations, cane loading and haulage, and workshop will be purchased. Adiversification programme to produce cut flowers (Anthurium) and orchids for export markets willbe funded by the project. The project is also to diversify into agricultural enterprises, to broaden theexport base of the country and increase the foreign exchange earnings
3. PROJECT EXECUTION
3.1 Effectiveness and Start-up
The loan was effective on 6 November 1992. Prior to entry into force the Borrower wasto have: a) concluded a subsidiary loan agreement for on-lending the entire proceeds of the loanto Rose Belle Sugar Estate Board on the same terms and conditions as the Bank Loan; b)provided evidence that an internal auditor whose qualifications and experience are acceptable tothe Bank has been appointed; c) provided an undertaking that Rose Belle Sugar Estate will beoperated purely on an autonomous basis without the provision of subsidies by the Borrower; d)provided evidence that all of Rose Belle debts to state commercial banks have been cleared; ande) satisfied the Bank that firm contractual commitments had been negotiated with localcommercial banks to provide the short term financing facilities required by Rose Belle SugarEstate Board during the early stages of project implementation to meet the needs of the lowproduction phase.
3
3.2 Modifications
3.2.1 During project implementation., some changes and modifications were made, without theBank being informed, by the Executing Agency as compared to the initial Staff Appraisal Report(SAR). In the appraisal report, the project provided funds for rehabilitation of part of factorybuilding and addition of new building for housing the turboset in a cleaner environment; and toundertake a diversification programme which involves the growing of Antherium flowers andOrchids.
3.2.2 The Government was to provide 85 ha to the project for development of new cane. These85 were not given to project and there was no additional land for new plantation.
3.2.3 The Government requested partial loan cancellation for an amount of UA 4.3 million. Itwas indicated that the Borrower would take up on its own resources. This affected the impactassigned objective of the project. Changes and modifications on the project work as compared tothe initial appraisal report affected the transfer of Turbo House, construction of Artisans’ mess,factory offices, new administrative building, new clubhouse and reasphalting of the factory yard.These modifications that prevented reasphalting of the factory yard had an effect on the increaseof storage capacity of the cane and stabilization of the crushing rate. As per the stoppage record,the factory could not operate continuously due to intermittent supply of sugar cane.
3.2.4 The Rose Belle Sugar Estate Board has cancelled the construction of new administrativebuildings, the social center (clubhouse), the transfer of the turbo house, and deleted the Antheriumfrom the diversification programme. The reasons given are the following:
- Administrative building: the old building is still operational, hence there was no need toconstruct a new one with a new telephone system;
- Social center: no reason given;
- Transfer of the Turboset: The cost involved was considered very high and there was nofinancial return expected;
- Procurement of additional computers: additional computers were bought under ownRBSEB
-Antherium: problem with space and high cost of freight and risk of damage.
3.2.5 The air heater of the factory was modified to fit the existing boiler to increase the factorycrushing capacity.
3.3 Implementation Schedule
The project was to be implemented within a 5-year period ending December 1997. But theproject suffered a delay in implementation 18 months, due to delays in fulfilment of two main loanconditions (appointment of an internal auditor and clearance of all Rose Belle debts to commercialBanks). Also because of delays in procurement of factory and agricultural equipment, and lateapproval by RSEB of the list of capital expenditure for year 1997, it was not possible to completethe work. It was then agreed to extend the project to September 1998.
4
3.4 Reporting
3.4.1 The Quarterly Progress Reports (QPRs) were prepared by the project management butthey have been inadequate and not timely submitted, missing some key elements such asphysical implementation status by component, problems encountered during the period underreview and workplan for the following quarter. The Bank notified project management on thisshortcoming but very little improvement was observed.
3.4.2 The Estate accounts were to be audited internally by the Board internal audit beforeindependent auditors carry out the annual external audit. The financial statements for years 1992,1993, and 1994 were made and submitted, but these statements do not constitute the financialstatements required by the Bank in accordance to the General Conditions Applicable to LoanAgreement. The project was not audited per se, but financial situation was occasionally analysed bythe Management Audit Bureau (year 1995).
3.4.3 The internal auditing process of the project was not satisfactory. There was (i) no separateaccounts were kept for the project; (ii) no involvement of the internal auditor in the projectactivities. These problems were raised by several supervision missions and by the ManagementAudit Bureau Report (1995). Bank and the GOM agreed that an external audit would be conductedin 1998. This assignment was not carried out.
3.5 Procurement
3.5.1 The procurement method agreed upon at appraisal was International Shopping. The projectmanagement found this mode to be inappropriate and requested changes in mode of procurement(direct purchase). Added to this, the project management was not conversant with the procurementprocedures; this resulted into delay at various points of time. At one point extension, for timeperiod for loan disbursement was sought till June 1998 for the procurement of outstanding items.This could not be materialized due to cancellation of loan by GOM.
3.5.2 During implementation the Rose Belle Sugar Estate Board requested the procurementmethod for the acquisition of some equipment and materials required for the project be changedfrom International Shopping to (IS) to direct purchase. The argument presented by RSEB is that theamount of involved in each contract is too low (less than 30,000 US $) to attract internationalcompetitors and that the project has the capability of manufacturing some of the equipment (loadingcane trailers). The request was approved by the Bank
3.5.3 The executing agency faced a lot of problem with the procurement procedure of theBank. The project management staff was not adequately conversant with Bank's guidelines forthe procurement of goods and services.
3.6 Financial Sources and Disbursements
Financial sources
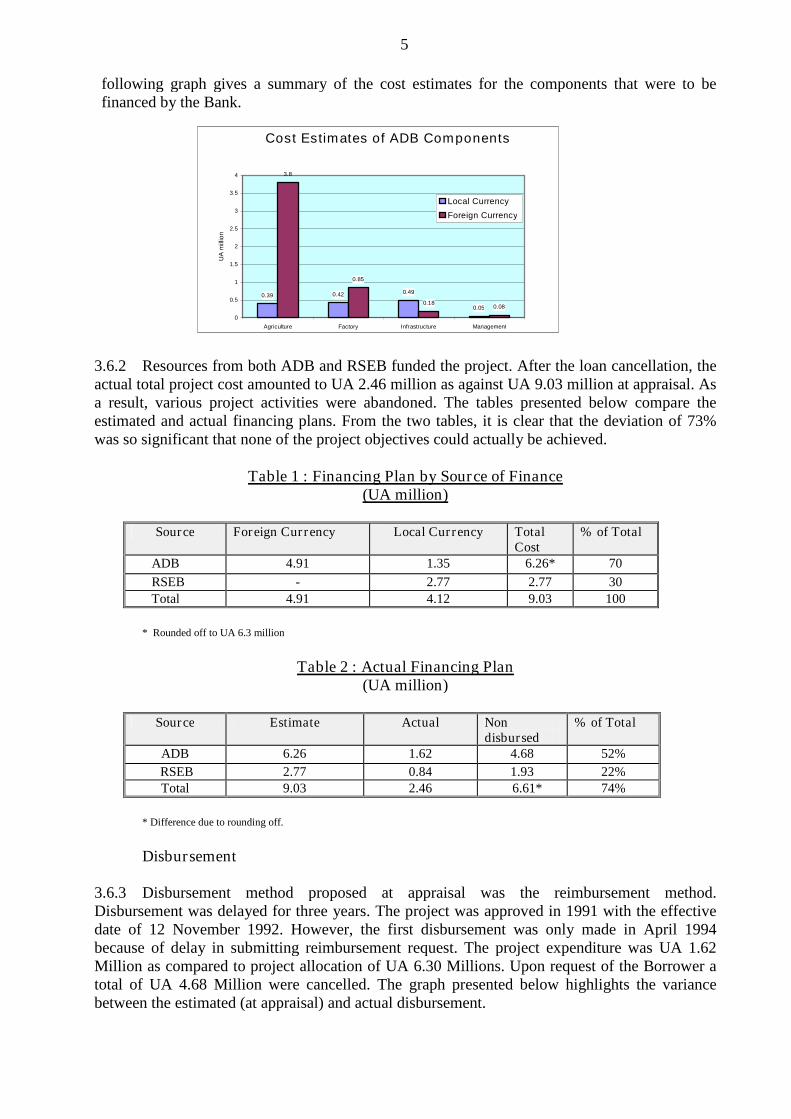
3.6.1 The total project cost, including contingencies at the time of appraisal, was estimated atUA 9.03 million of which the Bank was to provide UA 6.26 million (70%) and RSEB theequivalent of UA 2.77 million (30%). The ADB loan was to cover both local and foreigncurrency requirements to the amounts of UA 1.35 million and UA 4.91 million respectively. Outof the total amount of UA 6.26 million, the Bank disbursed only UA 1.62 million, thus, 26%since at the request of GOM, UA 4.68 million, about 74% of the loan was cancelled. The
5
following graph gives a summary of the cost estimates for the components that were to befinanced by the Bank.
3.6.2 Resources from both ADB and RSEB funded the project. After the loan cancellation, theactual total project cost amounted to UA 2.46 million as against UA 9.03 million at appraisal. Asa result, various project activities were abandoned. The tables presented below compare theestimated and actual financing plans. From the two tables, it is clear that the deviation of 73%was so significant that none of the project objectives could actually be achieved.
Table 1 : Financing Plan by Source of Finance(UA million)
Source Foreign Currency Local Currency TotalCost
% of Total
ADB 4.91 1.35 6.26* 70
RSEB - 2.77 2.77 30
Total 4.91 4.12 9.03 100
* Rounded off to UA 6.3 million
Table 2 : Actual Financing Plan(UA million)
Source Estimate Actual Nondisbursed
% of Total
ADB 6.26 1.62 4.68 52%
RSEB 2.77 0.84 1.93 22%Total 9.03 2.46 6.61* 74%
* Difference due to rounding off.
Disbursement
3.6.3 Disbursement method proposed at appraisal was the reimbursement method.Disbursement was delayed for three years. The project was approved in 1991 with the effectivedate of 12 November 1992. However, the first disbursement was only made in April 1994because of delay in submitting reimbursement request. The project expenditure was UA 1.62Million as compared to project allocation of UA 6.30 Millions. Upon request of the Borrower atotal of UA 4.68 Million were cancelled. The graph presented below highlights the variancebetween the estimated (at appraisal) and actual disbursement.
Cost Estimates of ADB Components
0.39 0.42 0.49
0.05
3.8
0.85
0.180.08
0
0.5
1
1.5
2
2.5
3
3.5
4
Agriculture Factory Infrastructure Management
UA
mill
ion
Local Currency
Foreign Currency

6
3.6.4 The disbursement method used was the reimbursement method, which was inappropriatefor this type of project since it required the borrower to first spend before being reimbursed forthe expenditures incurred. With a company that was already experiencing cashflow problems,coupled with the poor communication between the company and the government, it was difficultto have reimbursements made in time. This made it difficult for the company to carry out theproject activities continuously. This situation led to the accumulation of commitment fees on theundisbursed funds, a problem that later resulted into loan cancellation.
4. PROJECT PERFORMANCE AND RESULTS
4.1 Overall Assessment
4.1.1 Factory did not achieve the set target of 110 TCH. The rate of cane crushing achieved andthe sugar recovery percentage cane for last 10 seasons are as follows:
Year 1990 1991 1992 1993 1994 1995 1996 1997 1998 1999TCH 93.00 98.70 98.00 103.8 95.30 93.30 94.00 95.40 91.10 87.20Recovery % 10.67 10.43 10.54 10.31 10.02 10.50 10.78 10.33 10.81 9.76
4.1.2 It may also be observed that Sugar recovery is declining over the years and showingdown trend while the same plant had sugar recovery of over 12 % for three years during 1984 to1986. The year 1999 correspond to a year where the drought season occurred.
4.2 Operating Results
Agricultural Improvement
4.2.1 At appraisal it was proposed that 1150 ha (50% of total area of Rose Belle Sugar Estate)would derocked over a 5-year period at a rate of 230 ha/yr. At December 1997, only 200 ha of landhave been derocked representing 50 ha/yr. The estimated 230 ha/yr. could not be achieved becauseof weather conditions (heavy rain), unavailability of equipment, problem of rock disposal, and thenecessity to keep 90% of the area under cane production each year.
4.2.2 The increase of acreage of sugar cane, through the combined derocking operations and newplanting and replanting, brought the total area under cane to 2,243 ha. The Estate has replantedsome 1700 ha of old ratoons fields bringing the total area under cane to 2,243 as compared to the2,225 ha initially planed. By increasing the rate of replanting and shortening the crop cycle the
AN N U AL D ISB U R SE M E N T SC H E D U L E S
0
0 .5
1
1 .5
2
2 .5
1992 1993 1994 1995 1996 1997 1998Y ear
Am
ou
nt
(UA
mil
lio
n)
Estim ated
Actual
7
Estate was expected to increase productivity of sugar cane. The yield went from 67.16 tonecane/ha to 75.37 tc/ha. The derocking is a complex process and it will continue well beyond the
project duration. The appraisal estimate was too optimistic and did not take into account thecomplexity of the operation.
4.2.3 The project includes a diversification programme involving the growing of antherium, andorchids for the export market. This programme worked only for the orchid flowers that were sold inthe local market The Estate established six shade houses containing 24,000 Orchid plants. It is to benoted that the programme was finally financed through the RSEB own fund
4.2.4 After the project taken in hand, the stoppages due to cane has come down to 32 % in theyear 1999 as compared to 80.40 % in the year 1989. This is mainly due to some improvement inagricultural activity.
Factory Improvement
4.2.5 The aim of the project was to improve the factory crushing capacity from its normalcrushing capacity of 95 tones cane per hour (tch) to 110 tch. This was to be achieved by installingnew equipment, replacing the old tools at the workshop, the old factory roof and the construction ofa building to house the turbo and factory offices. The cane crushing capacity has not been broughtto an average of 100 tch. As shown in the table of paragraph 4.1.1 the tch was 91.10 in 1998 and87.20 in 1999.
4.2.6 Amongst the work for the factory rehabilitation, the milling plant, boilers shafts and millbearings were not executed due to the fact that the Government decided to cancel UA 0.66 millionleaving only 29% of the amount allocated to the component. Except for boiler rehabilitation nomajor work has been carried out during project implementation. No new equipment has been addedto increase the capacity of the plant or improve production efficiency. Total funds utilized for thefactory was only 5 % of the total project cost, while the allocation at appraisal was 23 %. Thiswas not sufficient to generate any positive result.
4.2.7 Two low capacity plants have been closed down after the Rose Belle project was taken inhand in 1991. It is understood that another plant, St. Felix is in the process of closing itsoperation after next season. The low capacity plant has been decided to close down its operationunder the undeclared policy of the Government. By reducing the number of plant, capacity of theremaining plant may be increased to make them more viable as the cane production is limitedwith the land.
4.2.8 The reasphalting of the factory yard could have increased storage capacity of the caneand stabilized the crushing rate. As per the stoppage record, the factory could not operatecontinuously due to intermittent supply of sugar cane.
4.2.9 The increase in plant capacity was marginal of 14 TCH (i.e. from 95 TCH to 110 TCH).The milling plant has been crushing 103 TCH in the past while as per standard milling plant iscapable of crushing 114 TCH. Only standard spares were considered for the milling section inappraisal report. The Cane Feed Control System was replaced to regularize cane feeding to themills. The desired spares were not replaced on milling station due to cancellation of part of theloan. No equipment were added / replaced in the boiling house. The annual crushing / crushingrate for ten year period indicates declining trend. At the end of the project the status of aboveactivities showed that factory did not achieve the set target of 110 TCH.
8
Infrastructure
4.2.10 Funds were provided by the project for the construction of buildings, roads, maintenanceand construction of bridges. A new garage building and office has been constructed. Three bridgeshave been constructed and 120 km of roads have been repaired or maintained. The RSEBabandoned the construction of administration building, factory building to house the turbo set. Thereason evoked is the high cost and the fact that the existing old buildings are still operational.
4.3 Institutional framework and Performance
4.3.1 The Staff Appraisal Report (SAR) indicated that the Rose Belle Sugar Estate Boardwould be the beneficiary of the loan and the Executing Agency of the project. The Governmentwill conclude a subsidiary loan agreement with RSEB on terms and conditions acceptable to theBank. This was a condition precedent to loan entry into force. The Rose Belle Sugar Company isState-owned, but it was expected to be run on commercial basis and as such it would bear theforeign exchange risks. The financial results were not satisfactory and the Company continues tobe subsidized.
4.3.2 The management of the Rose Belle Company is under the responsibility of a Board ofDirectors. The General Manager acts as the chief Executive Officer of the Board. He is assistedby the Financial Controller (Corporate Secretary), the Field Manager, the Factory Manager, thePersonnel Manager and the Transport Manager. The field manager was appointed as projectcoordinator. His role was to monitor, co-ordinate and supervise the implementation and theimprovement programme. He would report directly to the General Manager. The FinancialController as head of the Finance Division would be responsible for financial management andbudgetary control. The Factory Manager would supervise the factory work.
4.3.3 During implementation the organization did not work as it was specified. There was nocoordination between the project manager and the other Staff. The project was not run as ateamwork. The financial controller and the factory manager were not associated to the projectactivities. This situation affected to a great extent the project performance.
4.3.4 In the course of project implementation, the Rose Belle Sugar Board decided to divide theEstate into two entities: the Rose Belle Sugar Milling Company Ltd and the Rose Belle SugarEstate Board with the objective of allowing the smallholder and estate workers to becomeshareholders of the sugar factories. Under this new organisation it is expected that milling andprocessing performances will be enhanced. A factory performance audit should be undertaken toverify if objectives were achieved.
4.4 Management and Organizational Effectiveness
Some changes have occurred in the institutional and organisational structures of the RoseBelle Sugar Estate.
4.5 Staff Recruitment, Training and Développement
The project was to improve the efficiency of the management by providing office equipmentand conducting training for the management staff. Computer equipment (hardware and software)has been installed all around the Estate and training has been conducted for the managerial staff.This has improved project management efficiency in accounting, data management and monitoring.

9
4.6 Performance of Consultants, Suppliers and Contractors
The contractors performed well. There was no problem of supply or delivery ofequipment and materials according to specifications and due date. There were no consultancyservices engaged during project implementation.
4.7 Conditions / Covenants
Fulfillment of Loan Conditions
4.7.1 Most of the loan conditions were to be fulfilled by the Rose Belle Sugar Estate, since theloan was granted to them. Accounts have been prepared on a quarterly basis and they are up todate. The audited annual accounts (January 1 to December 31) are normally finalized andpresented to the Board of Directors by May. The Internal Auditor, who is directly under theFinancial Controller, is responsible for the day to day checking on the accounts, operations andassets of the Estate. The Internal Auditor was recruited in fulfillment of one of the loanconditions.
4.7.2 The recruitment of an internal Auditor was a fulfillment of one of the loan conditions, butit was not thoroughly done The condition stipulated for the recruitment of a well qualified staff,the company just promoted a clerk, who was working in the Diversification Sector, to InternalAuditor. Although this staff had worked as an accounts payable clerk, the task of internal auditwas beyond his capabilities, a factor that greatly contributed to the poor internal controls.
4.8 Financial Performance
Review of Financial Projections at Appraisal
4.8.1 At the time of appraisal, it was anticipated that sales progression for RSEB would beMRs 177.5 million in 1992 and the MRs 222.2 million in 1998, an increase of about 25%. It wasalso assumed that at full capacity, following the completion of the Rehabilitation Project, RSEBwould generate sufficient funds not only to service its entire loan but also to accumulate reservesfor capital replacement.
4.8.2 On the basis of the above assumptions and the proposed financing plan for the project,forecast financial statements for the project were prepared. Summaries of the projected financialstatements at the time of appraisal are presented in annex 2. The financial projections indicatedthat RSEB operations would be profitable from the first year of the project implementationonwards. For instance, return on total assets was projected to increase from 10% in 1992 to17.4% in 1998, while the return on equity was forecast to increase from 13.4% to 17.6%respectively. The average return on equity over the project duration was approximately 15.7%,which indicated potential positive returns in real terms if the inflation rate was not to exceed15.7%.
4.8.3 The debt/equity ratio was forecasted to decline from 33.6 to approximately 1 by 1998,while the debt service coverage ratio had been forecast to increase from 0.7 to 3 over the sevenyear period. The internal rate of return for the project had been estimated at 34.47% when totalincremental sugar production is sold at the world market price. Besides, sensitivity analysis wascarried out on the following key variables: occurrence of a cyclone, increase in project costs andreduction in world market prices.
10
Financial Results
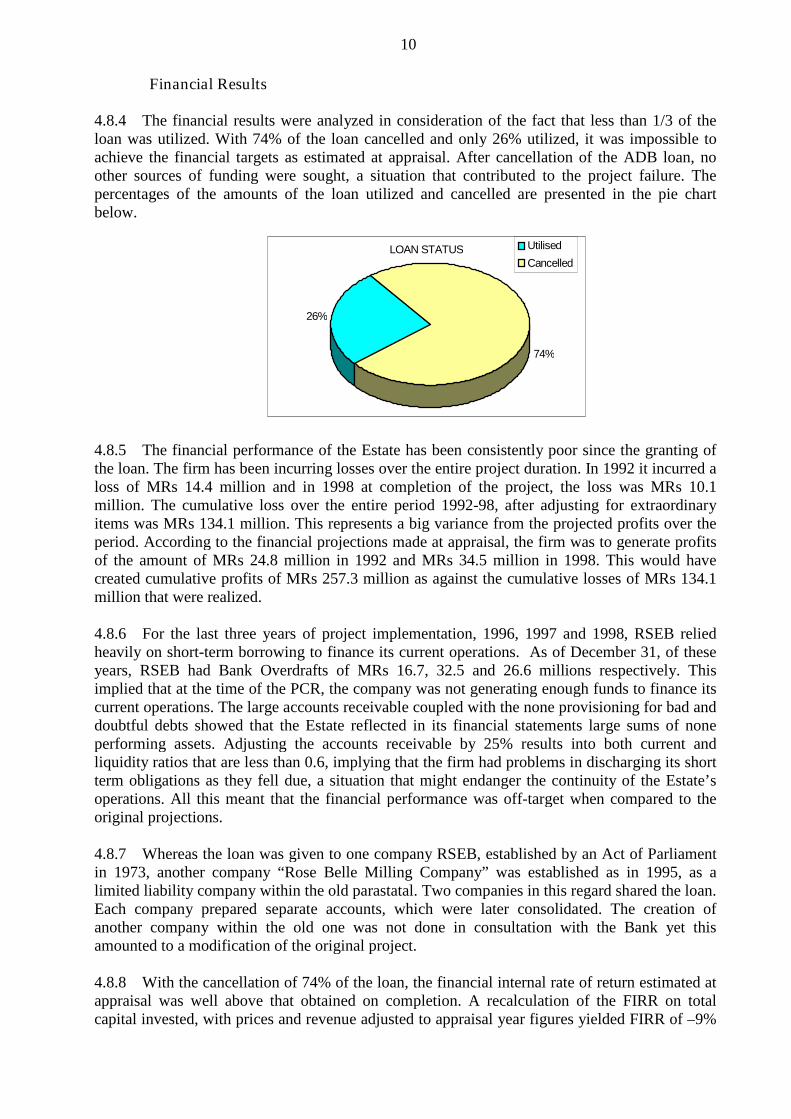
4.8.4 The financial results were analyzed in consideration of the fact that less than 1/3 of theloan was utilized. With 74% of the loan cancelled and only 26% utilized, it was impossible toachieve the financial targets as estimated at appraisal. After cancellation of the ADB loan, noother sources of funding were sought, a situation that contributed to the project failure. Thepercentages of the amounts of the loan utilized and cancelled are presented in the pie chartbelow.
4.8.5 The financial performance of the Estate has been consistently poor since the granting ofthe loan. The firm has been incurring losses over the entire project duration. In 1992 it incurred aloss of MRs 14.4 million and in 1998 at completion of the project, the loss was MRs 10.1million. The cumulative loss over the entire period 1992-98, after adjusting for extraordinaryitems was MRs 134.1 million. This represents a big variance from the projected profits over theperiod. According to the financial projections made at appraisal, the firm was to generate profitsof the amount of MRs 24.8 million in 1992 and MRs 34.5 million in 1998. This would havecreated cumulative profits of MRs 257.3 million as against the cumulative losses of MRs 134.1million that were realized.
4.8.6 For the last three years of project implementation, 1996, 1997 and 1998, RSEB reliedheavily on short-term borrowing to finance its current operations. As of December 31, of theseyears, RSEB had Bank Overdrafts of MRs 16.7, 32.5 and 26.6 millions respectively. Thisimplied that at the time of the PCR, the company was not generating enough funds to finance itscurrent operations. The large accounts receivable coupled with the none provisioning for bad anddoubtful debts showed that the Estate reflected in its financial statements large sums of noneperforming assets. Adjusting the accounts receivable by 25% results into both current andliquidity ratios that are less than 0.6, implying that the firm had problems in discharging its shortterm obligations as they fell due, a situation that might endanger the continuity of the Estate’soperations. All this meant that the financial performance was off-target when compared to theoriginal projections.
4.8.7 Whereas the loan was given to one company RSEB, established by an Act of Parliamentin 1973, another company “Rose Belle Milling Company” was established as in 1995, as alimited liability company within the old parastatal. Two companies in this regard shared the loan.Each company prepared separate accounts, which were later consolidated. The creation ofanother company within the old one was not done in consultation with the Bank yet thisamounted to a modification of the original project.
4.8.8 With the cancellation of 74% of the loan, the financial internal rate of return estimated atappraisal was well above that obtained on completion. A recalculation of the FIRR on totalcapital invested, with prices and revenue adjusted to appraisal year figures yielded FIRR of –9%
LOAN STATUS
26%
74%
Utilised
Cancelled
11
compared to the appraisal financial rate of return of 34%. Given the fact that only 26% of theloan was utilized and as such little investment was done, another measure, namely return on the
fixed assets over the project period was evaluated. In 1992 the rate was -8%, which meant that aloss of 8 cents was incurred for every rupee invested in fixed assets, while in 1996 the rate was -12% meaning that the situation had worsened. There was an improvement in 1998 when thereturn on fixed assets was -3.6%, but on average, from 1992-98, the Estate incurred a loss of 6cents on every rupee that was invested in fixed assets. This significantly reinforces the FIRR of –9%. Details of the calculations are indicated in annex.
4.9 Economic Performance
4.9.1 It may be observed from the above that most of the activities were not completed. Thishas ultimately affected the factory performance targets. The total funds utilized for the factorywas only 5 % of the total project cost, while the allocation appraisal was 23 %. This was notsufficient to generate any positive result. The equipment needed immediate replacement due toage and technological advancement were not considered for replacement or modification. Theequipment of obsolete design and inefficient, should have been completely replaced forefficiency improvement. The balancing of the plant was also not considered. Expectations froman old plant were set high.
4.9.2 Assuming export parity farm-gate prices and applying all project costs derived directlyfrom actual expenditures on the different components and also bearing in mind the datacomplexities, the economic analysis has been based on current costs and prices with only thebase year price retained over the entire project period. Financial costs were converted to theireconomic values using the standard conversion factor of 0.96. On the basis of this analysis, therecalculated economic rate of return at completion is –1%. This does not at all compare with the19% estimated at appraisal. Details of the calculation are shown in the annex.
5. SOCIAL AND ENVIRONMENTAL IMPACT
5.1 For the social aspect it envisaged that the project would enable the complex to retain andemploy about 2,000 families benefiting some 10,000 people. With the lack of labour most of theagricultural operations were mechanized. This did not allow the firm to meet the targetemployment which the reduce the social impact that was predicted.
5.2 Environment: the Flue gas treatment of the boiler was installed by the factory and wasworking fine for pollution control. A pilot under capacity Upflow Anaerobic Sludge BlanketReactor along with masonry tank was installed in late 1998 for the effluent treatment of the sugarplant to. This could be operative only in 1999 season. Though the results were acceptable but itcould not handle the entire amount of factory effluent resulting into bypassing the balanceeffluent to the drain. Since last season was a trial season, no proper record of the treated effluenthas been maintained.
5.3 It is known that the use of fertilizers can get leached and sugar factory produces variouspollutants in liquid, solid and gaseous form. During cleaning operations and washings effluents areformed. To minimize the environmental impact, the project has planned mitigated measures. Theproject provided funds for the treatment of factory effluent. In order to abide with the strict controlsfor particulate emission standard in boiler flue gases, the factory has installed flue gas wet scrubbingsystem.

12
6. PROJECT SUSTAINABILITY
Its is obvious that the financial variables estimated at appraisal could not be achieved.This means that the project cannot be sustained under the present conditions and unless majorinvestments are done to turn-round the company, especially the factory, soon or later the Estatemay have to be liquidated. However, if the company is to survive, there is need to increase thefactory crushing capacity, acquire more land, reduce overhead expenses and also review thehuman resource requirements.
7. PERFORMANCE OF THE BANK, AND THE BORROWER
7.1 Performance of the Bank
7.1.1 The Bank intervention in the sector was agreed upon following a formal request from theGovernment. The preparation/appraisal process of the project was not adequate. It took only 4working days for the Bank’s mission on the field to come up with the project. targets set in theappraisal report were unrealistic. The equipment that needed immediate replacement due to ageand technological advancement were not considered for replacement or modification duringappraisal
7.1.2 During implementation phase, the Bank through its supervision mission noted allweaknesses and shortcomings. Emphasis has been put in improving the capacity of the projectcoordinator in understanding Bank's rules of procedure for procurement. As for disbursementmethod (reimbursement), the Bank did not follow up, on a regular basis, submission ofreimbursement claims. Also the Bank did not send to the Borrower the disbursement letter, whichwould have help t better understand the disbursement method used. The performance of the Bankis judged as poor.
7.2 Performance of the Borrower
7.2.1 During implementation some weaknesses appeared in the managerial capabilities toaddress swiftly the problem encountered by the project. These weaknesses could be summarizedas follows: (i) lack of a strong and well structured Project Implementation Unit; and no steeringcommittee; (ii) insufficient monitoring at a higher level; (iii)) lack of communication betweenstaff involved in the project implementation and between the project coordinator and other staff;(iv) the Executing Agency was not conversant with Bank's procurement/disbursementprocedures; and (v) slow drawdown of loan resulting in high commitment fees.
7.2.2 The 85 ha of new land were to be given by the Government to the Rose Belle Sugar Estatehas been handed over to the small planters. The explanation given by the Government is thatthese 85 ha and some additional 300 ha would benefit to the Estate as all products of the smallplanters will be milled, by Rose Belle Sugar Estate and thus the milling opportunity of the Estatewould increase. This was not materialized during project implementation.
7.2.3 The management and co-ordination of the project was not satisfactory. Interviews withStaff revealed that Borrower’s staff did not participate to the project preparation. The weaknessesshown by the project management and lack of understanding of Bank’s procurement proceduresadded to difficulties encountered by the project which resulted in a poor performance by theBorrower.

13
8. OVERALL PERFORMANCE AND RATING
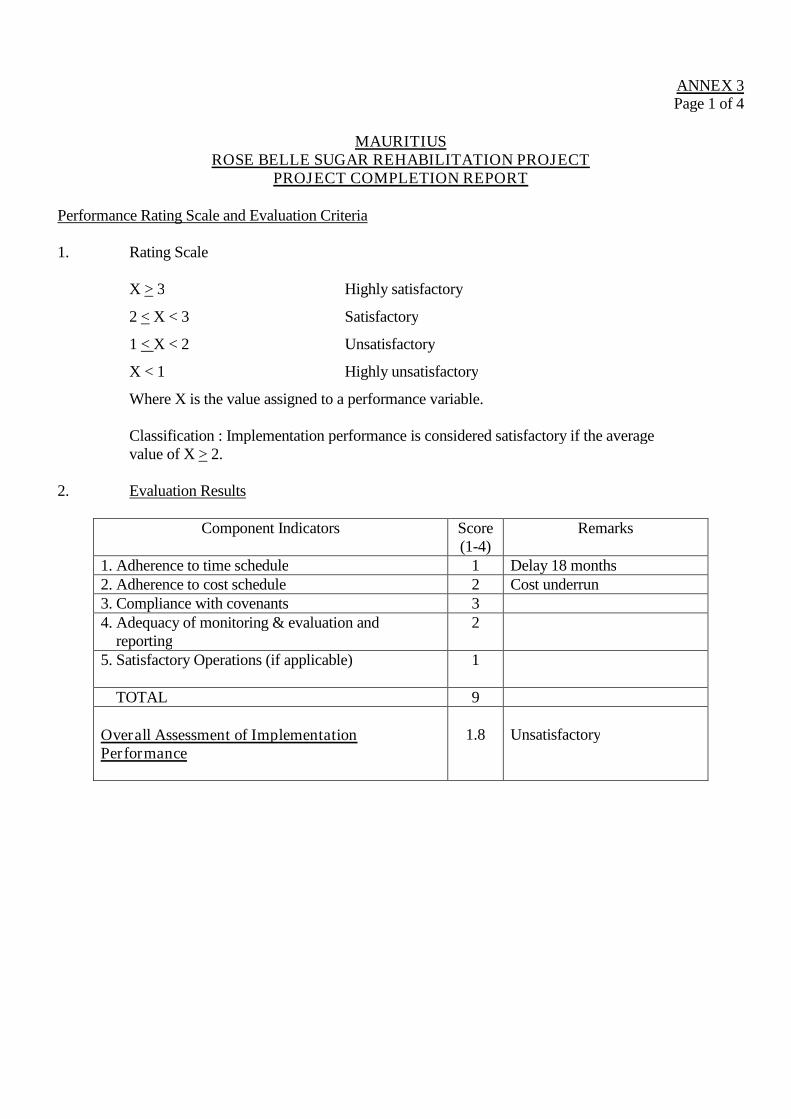
The project has suffered implementation delay that affected greatly its performance. Theloan cancellation did not allow completion of the factory improvement for a better processingperformance. The target in the agricultural development (derocking, cane production) anddiversification programme were not reached. The financial performance of the company was poorall over the project period. The company consistently registered losses from the time the loan wasfirst disbursed. In 1992 the company registered a loss of MRs 14,439,903 and MRs 10,061,963 in1998. The cumulative losses over the period 1992 –98 after adjusting for extraordinary itemswere MRs 134,099,177. In accordance with the implementation performance indicators (Annex3) the overall performance of the project is unsatisfactory with a rating of 1.8.
9. CONCLUSIONS, LESSONS LEARNED AND RECOMMENDATIONS
9.1 Conclusions
9.1.1 The performance of the project has been poor. The target set in the appraisal report wasunrealistic. Due consideration for the past performance and the condition of the equipment wasoverlooked. The equipment needed immediate replacement due to age and technologicaladvancement was not considered for replacement or modification. The equipment of obsoletedesign and inefficient, should have been completely replaced for efficiency improvement. Thebalancing of the plant was also not considered. Expectations from an old plant were set high.
9.1.2 The target in the agricultural development (derocking, cane production) anddiversification programme were not reached. The financial performance of the company waspoor all over the project period. The company consistently registered losses from the time theloan was first disbursed. In 1992 the company registered a loss of MRs 14,439,903 and MRs10,061,963 in 1998. The cumulative losses over the period 1992 –98 after adjusting forextraordinary items were MRs 134,099,177.
9.1.3 Due to short allocation and under utilization of funds, factory could not be improved onperformance as targeted in the appraisal report. The plant is not in a good condition to performefficiently with high performance parameters. The plant is heading for closer due to highmaintenance cost and incurring losses.
9.2 Lessons Learned
Considering the way the project was implemented and the non-achievement of theobjective, the following lessons could be drawn:
1) The process of project preparation was not adequate. The limited time given toprepare and appraise the project did not allow setting realistic target and clearassumptions.
2) In the implementation of the project emphasis was put on rehabilitation works. Withsuch project, in addition of the physical rehabilitation, more attention should havebeen given to the processing and milling performance to increase the recovery rateand reduce the sucrose losses.
3) The project encountered difficulties during project implementation in thedisbursement method used (reimbursement method). The procurement methodneed to be properly assessed with the Borrower during appraisal and reviewed
14
during implementation (midterm review) to avoid long dispute over it andtherefore avoid delay in project implementation. The Borrower should be such that
is capable of submitting reimbursement claims to the Bank on a regular basis toavoid problems of commitment charges due to delays.
4) Critically review objectives, assumptions and targets of projects of this natureduring appraisal and provide time for mid-term review
5) Emphasize the recruitment of professionally qualified staff for Bank fundedprojects and of a strong project coordination unit.
6) The equipment of obsolete design and inefficient, should be avoided in factoryrehabilitation if improvement in efficiency is to be attained.
9.3 Recommendations
To the Government
(i) A new high-pressure boiler and turbo generator set should be installed. The plantcapacity should be increased to an economically viable level of approx. 5000TCD. This will also allow utilizing upgraded and advanced technology. It wouldbe more beneficial to consider co-generation of electrical power as factory issaving good quantity of bagasse every year.
(ii) Effluent treatment plant of appropriate capacity should be provided.
(iii) Government policies pertaining to sugar sector should be considered for theproject sustainability.
To the Bank
(i) Any changes in project activity should be properly supported by strongjustifications and agreed with the Bank,
(ii) A Mid-Term Review should be systematically conducted;(iii) Project should be properly prepared.
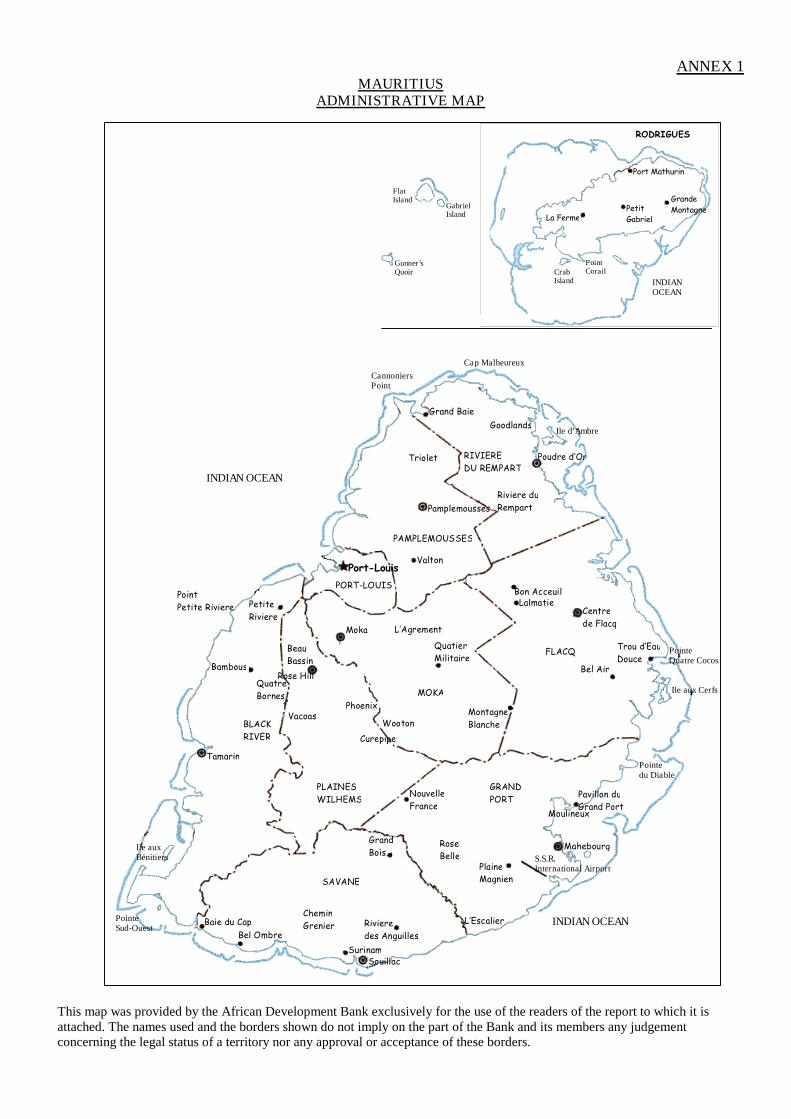
ANNEX 1MAURITIUS
ADMINISTRATIVE MAP
This map was provided by the African Development Bank exclusively for the use of the readers of the report to which it isattached. The names used and the borders shown do not imply on the part of the Bank and its members any judgementconcerning the legal status of a territory nor any approval or acceptance of these borders.
Cap Malheureux
CannoniersPoint
Grand Baie
Goodlands
Poudre d’Or
Ile d’Ambre
Triolet RIVIERE
DU REMPART
Riviere du
RempartPamplemousses
PAMPLEMOUSSES
Valton
PORT-LOUIS
Port-Louis
Bon AcceuilLalmatie
Centre
de Flacq
Trou d’Eau
DouceBel Air
Montagne
Blanche
FLACQ
Moka L’Agrement
Quatier
Militaire
MOKA
Petite
Riviere
Point
Petite Riviere
Bambous
Quatre
Bornes
Tamarin
BLACK
RIVER
Beau
Bassin
Rose Hill
VacoasPhoenix
Curepipe
PLAINES
WILHEMSNouvelle
France
GRAND
PORT
PointeQuatre Cocos
Ile aux Cerfs
Pointedu Diable
Pavillon du
Grand Port
Mahebourg
Plaine
Magnien
Rose
Belle
L’Escalier
Grand
Bois
Riviere
des Anguilles
Surinam
Souillac
Chemin
Grenier
SAVANE
Bel Ombre
Baie du CapPointeSud-Ouest
Ile auxBénitiers
Wooton
Moulineux
S.S.R.International Airport
INDIAN OCEAN
INDIAN OCEAN
RODRIGUES
Port Mathurin
Grande
MontagnePetit
GabrielLa Ferme
PointCorailCrab
Island INDIANOCEAN
Gunner’sQuoin
GabrielIsland
FlatIsland

ANNEX 2Page 1 of 5
ROSE BELLE SUGAR ESTATE BOARDPROJECTED PROFIT AND LOSS ACCOUNTS
FOR THE YEARS ENDED DECEMBER 31
Year 1992 1993 1994 1995 1996 1997 1998
REVENUE
Sugar 162,900,000 194,900,000 200,100,000 211,200,000 213,800,000 209,400,000 213,600,000
Special Income/Govt 6,000,000 4,000,000 0 0 0 0 0
Sugar Insurance Compensation 8,400,000 8,400,000 8,400,000 8,400,000 8,400,000 8,400,000 8,400,000
Profit on Disposal of Assets 200,000 200,000 200,000 200,000 200,000 200,000 200,000
Sub-Total 177,500,000 207,500,000 208,700,000 219,800,000 222,400,000 218,000,000 222,200,000
OPERATING COSTS
Employees Remuneration 77,880,000 81,790,000 81,790,000 81,790,000 81,790,000 81,790,000 81,790,000
Supplies and Services 34,330,000 34,840,000 35,360,000 35,900,000 36,430,000 36,980,000 37,530,000
Sugar Insurance Premiums 13,030,000 15,590,000 16,010,000 16,900,000 17,100,000 16,750,000 17,090,000
Taxes (excluding income tax) 5,620,000 5,890,000 6,200,000 6,490,000 6,830,000 7,170,000 7,520,000
Depreciation 7,200,000 8,700,000 10,600,000 11,300,000 11,300,000 11,300,000 11,500,000
Sub Total 138,060,000 146,810,000 149,960,000 152,380,000 153,450,000 153,990,000 155,430,000
Operating Profit/Loss 39,440,000 60,690,000 58,740,000 67,420,000 68,950,000 64,010,000 66,770,000
Other Income 800,000 1,060,000 400,000 1,000,000 180,000 160,000 150,000
Interest Payable 2,100,000 1,380,000 860,000 580,000 370,000 14,860,000 13,790,000
Gross Profit/Loss 38,140,000 60,370,000 58,280,000 67,840,000 68,760,000 49,310,000 53,130,000
Tax (35%) 13,349,000 21,129,500 20,398,000 23,744,000 24,066,000 17,258,500 18,595,500
Net Profit/Loss after tax 24,791,000 39,240,500 37,882,000 44,096,000 44,694,000 32,051,500 34,534,500
ANNEX 2Page 2 of 5
ROSE BELLE SUGAR ESTATE BOARDPROJECTED PROFIT AND LOSS ACCOUNTS
FOR THE YEARS ENDED DECEMBER 31
Year 1992 1993 1994 1995 1996 1997 1998
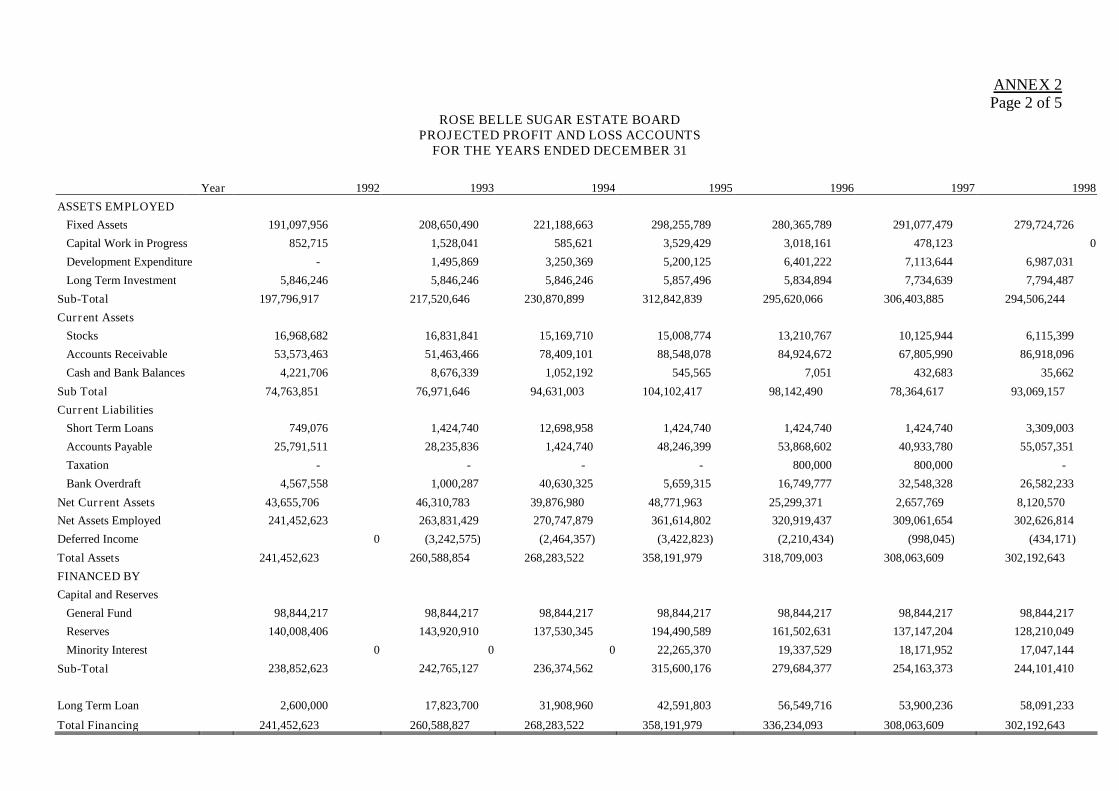
ASSETS EMPLOYED
Fixed Assets 191,097,956 208,650,490 221,188,663 298,255,789 280,365,789 291,077,479 279,724,726
Capital Work in Progress 852,715 1,528,041 585,621 3,529,429 3,018,161 478,123 0
Development Expenditure - 1,495,869 3,250,369 5,200,125 6,401,222 7,113,644 6,987,031
Long Term Investment 5,846,246 5,846,246 5,846,246 5,857,496 5,834,894 7,734,639 7,794,487
Sub-Total 197,796,917 217,520,646 230,870,899 312,842,839 295,620,066 306,403,885 294,506,244
Current Assets
Stocks 16,968,682 16,831,841 15,169,710 15,008,774 13,210,767 10,125,944 6,115,399
Accounts Receivable 53,573,463 51,463,466 78,409,101 88,548,078 84,924,672 67,805,990 86,918,096
Cash and Bank Balances 4,221,706 8,676,339 1,052,192 545,565 7,051 432,683 35,662
Sub Total 74,763,851 76,971,646 94,631,003 104,102,417 98,142,490 78,364,617 93,069,157
Current Liabilities
Short Term Loans 749,076 1,424,740 12,698,958 1,424,740 1,424,740 1,424,740 3,309,003
Accounts Payable 25,791,511 28,235,836 1,424,740 48,246,399 53,868,602 40,933,780 55,057,351
Taxation - - - - 800,000 800,000 -
Bank Overdraft 4,567,558 1,000,287 40,630,325 5,659,315 16,749,777 32,548,328 26,582,233
Net Current Assets 43,655,706 46,310,783 39,876,980 48,771,963 25,299,371 2,657,769 8,120,570
Net Assets Employed 241,452,623 263,831,429 270,747,879 361,614,802 320,919,437 309,061,654 302,626,814
Deferred Income 0 (3,242,575) (2,464,357) (3,422,823) (2,210,434) (998,045) (434,171)
Total Assets 241,452,623 260,588,854 268,283,522 358,191,979 318,709,003 308,063,609 302,192,643
FINANCED BY
Capital and Reserves
General Fund 98,844,217 98,844,217 98,844,217 98,844,217 98,844,217 98,844,217 98,844,217
Reserves 140,008,406 143,920,910 137,530,345 194,490,589 161,502,631 137,147,204 128,210,049
Minority Interest 0 0 0 22,265,370 19,337,529 18,171,952 17,047,144
Sub-Total 238,852,623 242,765,127 236,374,562 315,600,176 279,684,377 254,163,373 244,101,410
Long Term Loan 2,600,000 17,823,700 31,908,960 42,591,803 56,549,716 53,900,236 58,091,233
Total Financing 241,452,623 260,588,827 268,283,522 358,191,979 336,234,093 308,063,609 302,192,643

ANNEX 2Page 3 of 5
ROSE BELLE SUGAR ESTATE BOARDPROJECTED PROFIT AND LOSS ACCOUNTS
FOR THE YEARS ENDED DECEMBER 31
1992 1993 1994 1995 1996 1997 1998
147,475,902 183,707,942 144,169,112 185,404,272 204,573,664 204,977,495 237,341,928
(16,191,548) (20,641,054) (82,475) 0 0 0 0
12,042,873 6,470,313 43,419,764 25,642,290 24,107,642 13,062,988 14,906,446
2,586,081 3,499,907 3,816,605 7,805,918 8,281,872 8,279,299 8,464,273
0 0 0 0 0 0 0
45,360 302,452 1,168,275 296,155 73,919 219,459 163,287
145,958,668 173,339,560 192,491,281 219,148,635 237,037,097 226,539,241 260,875,934
101,935,905 109,103,558 120,053,906 136,647,431 139,625,057 140,565,550 152,613,431
41,416,990 41,032,782 45,350,622 50,350,743 75,087,824 70,448,916 75,368,680
11,787,352 13,736,674 16,636,608 18,682,043 21,556,690 20,068,370 22,516,110
5,775,004 7,143,665 8,555,613 17,189,352 15,824,416 18,526,041 16,390,613
0 0 0 0 0 0 776,336
0 0 0 0 981,000 0 0
0 0 0 0 62,500 0 0
0 0 0 0 2,086,908 2,207,156 0
0 0 0 0 0 2,650,331 0
160,915,251 171,016,679 190,596,749 222,869,569 255,224,395 254,466,364 267,665,170
(14,956,583) 2,322,881 1,894,532 (3,720,934) (18,187,298) (27,927,123) (6,789,236)
0 0 (7,244,859) (8,428,043) (13,249,452) 0 0
1,259,318 3,575,582 1,841,268 1,932,195 1,790,741 1,771,030 3,437,188
0 0 0 0 0 8,089,186 0
(742,638) (1,916,233) (2,881,506) (4,086,682) (5,154,918) (7,454,100) (8,005,853)
(14,439,903) 3,982,230 (6,390,565) (14,303,464) (34,800,927) (25,521,007) (11,357,901)
0 0 0 0 (800,000) 0 800,000
(14,439,903) 3,982,230 (6,390,565) (14,303,464) (34,000,927) (25,521,007) (12,157,901)
ANNEX 2Page 4 of 5
ROSE BELLE SUGAR ESTATE BOARDPROJECTED PROFIT AND LOSS ACCOUNTS
FOR THE YEARS ENDED DECEMBER 31
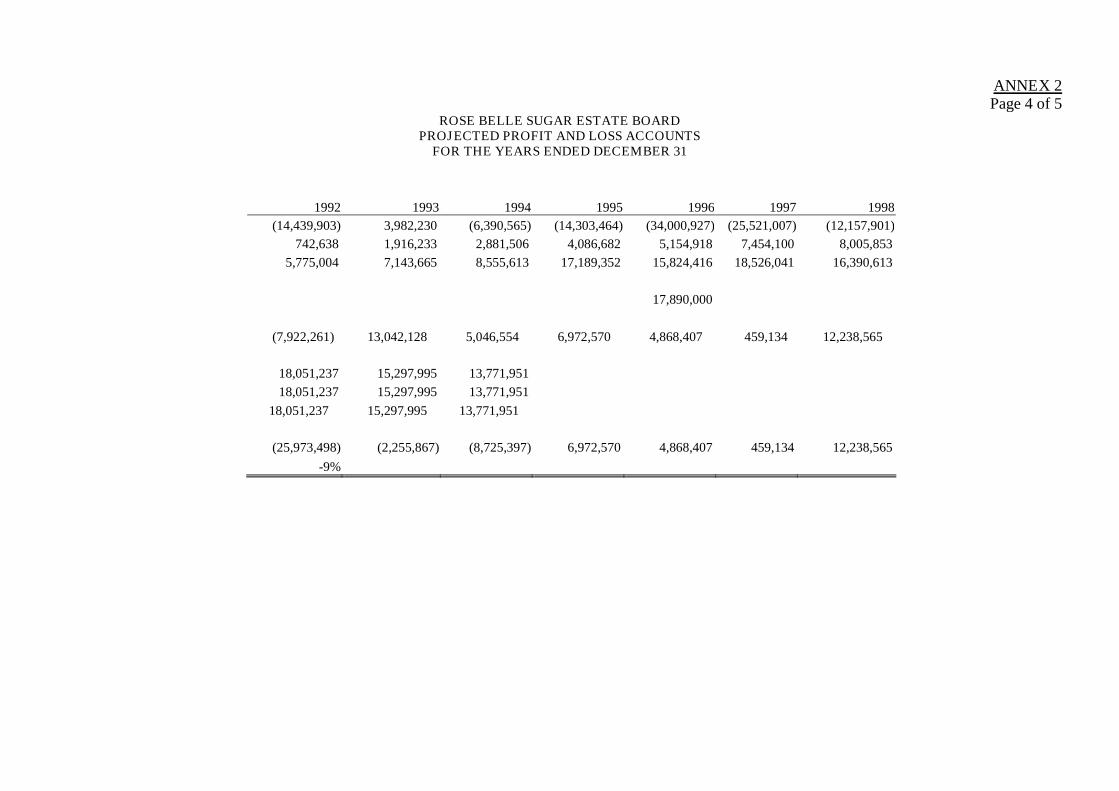
1992 1993 1994 1995 1996 1997 1998
(14,439,903) 3,982,230 (6,390,565) (14,303,464) (34,000,927) (25,521,007) (12,157,901)
742,638 1,916,233 2,881,506 4,086,682 5,154,918 7,454,100 8,005,853
5,775,004 7,143,665 8,555,613 17,189,352 15,824,416 18,526,041 16,390,613
17,890,000
(7,922,261) 13,042,128 5,046,554 6,972,570 4,868,407 459,134 12,238,565
18,051,237 15,297,995 13,771,951
18,051,237 15,297,995 13,771,951
18,051,237 15,297,995 13,771,951
(25,973,498) (2,255,867) (8,725,397) 6,972,570 4,868,407 459,134 12,238,565
-9%

ANNEX 2Page 5 of 5
ROSE BELLE SUGAR ESTATE BOARDPROJECTED PROFIT AND LOSS ACCOUNTS
FOR THE YEARS ENDED DECEMBER 31
1992 1993 1994 1995 1996 1997 1998
(13,862,307) 3,822,941 (6,134,942) (13,731,325) (33,408,890) (24,500,167) (10,903,585)
712,932 1,839,584 2,766,246 3,923,215 4,948,721 7,155,936 7,685,619
5,544,004 6,857,918 8,213,388 16,501,778 15,191,439 17,784,999 15,734,988
6,955,065 8,090,921 12,719,474
(7,605,371) 12,520,443 11,799,756 14,784,588 (549,255) 440,769 12,517,022
17,329,188 14,686,075 13,221,073
17,329,188 14,686,075 13,221,073
17,329,188 14,686,075 13,221,073
(24,934,558) (2,165,632) (1,421,316) 14,784,588 (549,255) 440,769 12,517,022
-1%
ANNEX 3Page 1 of 4
MAURITIUSROSE BELLE SUGAR REHABILITATION PROJECT
PROJECT COMPLETION REPORT
Performance Rating Scale and Evaluation Criteria
1. Rating Scale
X > 3 Highly satisfactory
2 < X < 3 Satisfactory
1 < X < 2 Unsatisfactory
X < 1 Highly unsatisfactory
Where X is the value assigned to a performance variable.
Classification : Implementation performance is considered satisfactory if the averagevalue of X > 2.
2. Evaluation Results
Component Indicators Score(1-4)
Remarks
1. Adherence to time schedule 1 Delay 18 months2. Adherence to cost schedule 2 Cost underrun3. Compliance with covenants 34. Adequacy of monitoring & evaluation and
reporting2
5. Satisfactory Operations (if applicable) 1
TOTAL 9
Overall Assessment of ImplementationPerformance
1.8 Unsatisfactory
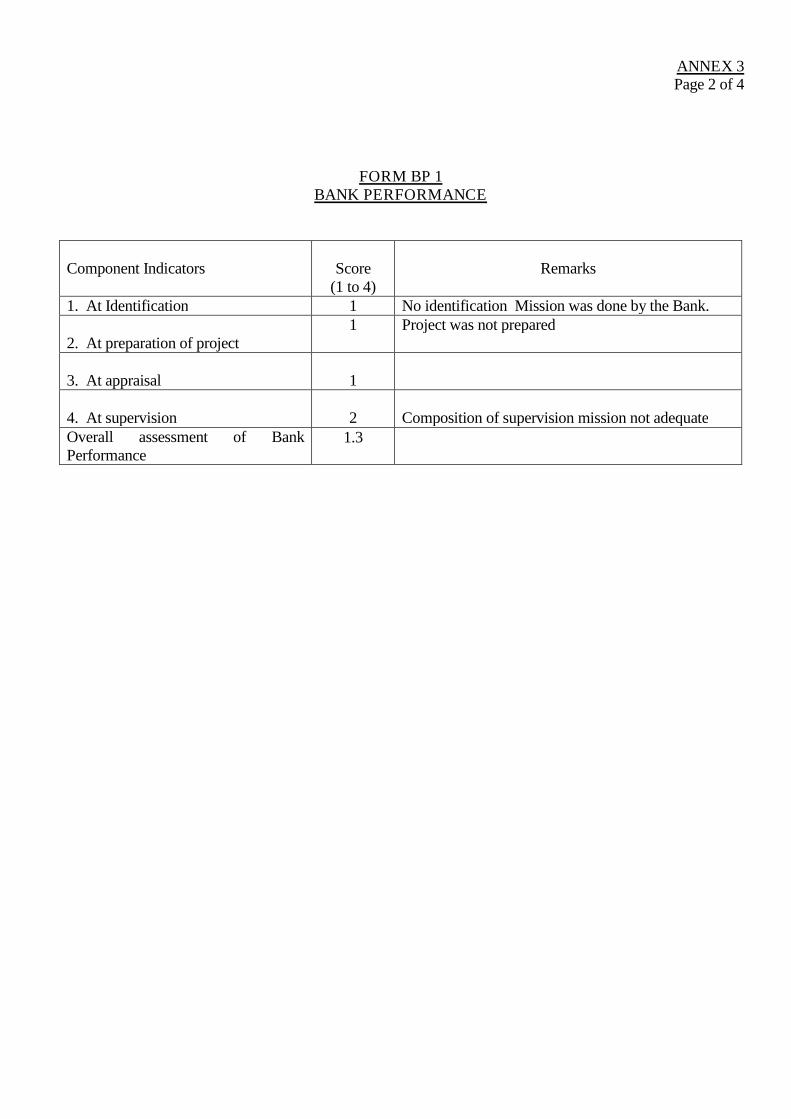
ANNEX 3Page 2 of 4
FORM BP 1BANK PERFORMANCE
Component Indicators Score(1 to 4)
Remarks
1. At Identification 1 No identification Mission was done by the Bank.
2. At preparation of project1 Project was not prepared
3. At appraisal 1
4. At supervision 2 Composition of supervision mission not adequateOverall assessment of BankPerformance
1.3

ANNEX 3Page 3 of 4
FORM PO 1
PROJECT OUTCOME
No. Component IndicatorsScore
(1 to 4) Remarks1 Relevance and Achievement of
Objectives*1.6
i) Macro-economic policy 1
ii) Sector Policy 1
iii) Physical (incl. Production) 2
iv) Financial1
v) Poverty alleviation & social &gender
1
vi) Environment 3
vii) Private sector development 1
viii) Other (Specify)
2 Institutional Development (ID)1.5
i) Institutional framework incl.Restructuring
2
ii) Financial and ManagementInformation Systems includingAudit Systems
2
iii) Transfer of Technology 1
iv) Staffing by qualified persons(incl. Turnover), training &counter-part staff
1

ANNEX 3Page 4 of 4
3 Sustainability
i) Continued BorrowerCommitment
2
ii) Environmental Policy 3
iii) Institutional Framework 2
iv) Technical Viability and Staffing 1
v) Financial viability including costrecovery systems
1
vi) Economic Viability 1
vii) Environmental Viability 3
viii) O&M facilitation (availability ofrecurrent funding, foreignexchange, spare parts, workshopfacilities etc.)
1
4 Economic Internal Rate ofReturn
1
TOTAL 31
Overall Assessment of Outcome 1.8
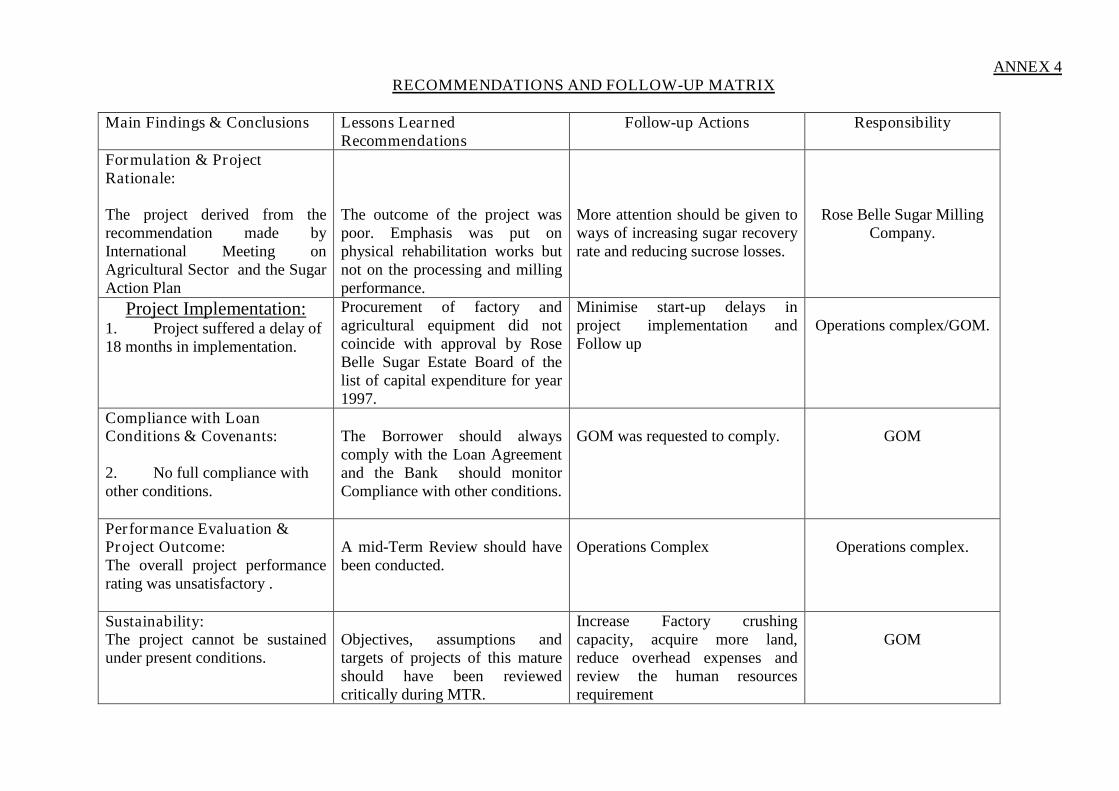
ANNEX 4RECOMMENDATIONS AND FOLLOW-UP MATRIX
Main Findings & Conclusions Lessons LearnedRecommendations
Follow-up Actions Responsibility
Formulation & ProjectRationale:
The project derived from therecommendation made byInternational Meeting onAgricultural Sector and the SugarAction Plan
The outcome of the project waspoor. Emphasis was put onphysical rehabilitation works butnot on the processing and millingperformance.
More attention should be given toways of increasing sugar recoveryrate and reducing sucrose losses.
Rose Belle Sugar MillingCompany.
Project Implementation:1. Project suffered a delay of18 months in implementation.
Procurement of factory andagricultural equipment did notcoincide with approval by RoseBelle Sugar Estate Board of thelist of capital expenditure for year1997.
Minimise start-up delays inproject implementation andFollow up
Operations complex/GOM.
Compliance with LoanConditions & Covenants:
2. No full compliance withother conditions.
The Borrower should alwayscomply with the Loan Agreementand the Bank should monitorCompliance with other conditions.
GOM was requested to comply. GOM
Performance Evaluation &Project Outcome:The overall project performancerating was unsatisfactory .
A mid-Term Review should havebeen conducted.
Operations Complex Operations complex.
Sustainability:The project cannot be sustainedunder present conditions.
Objectives, assumptions andtargets of projects of this matureshould have been reviewedcritically during MTR.
Increase Factory crushingcapacity, acquire more land,reduce overhead expenses andreview the human resourcesrequirement
GOM

ANNEX 5
MAURITIUS
ROSE BELLE SUGAR REHABILITATION PROJECT
PROJECT COMPLETION REPORT
SOURCES OF INFORMATION
1. Borrower's Project Completion Report
2. Appraisal Report.
3. Project Files.

ANNEX 6 & 7ANNEX 6 : BORROWER'S PCR
The Borrower's PCR is on the file with ONAR.2
ANNEX 7 : EXECUTING AGENCY'S COMMENTS TO THE BANK'S PCR
Comments are expected and will be incorporated upon receipt.