Embed Size (px)
Citation preview
Mathematics Assessment Collaborative Tool Kits for Teachers
Looking and Learning from Student Work 2009
Grade Seven
Contents by Grade Level:
• Overview of Exam • Grade Level Results • Cut Score and Grade History • Reflection of the Whole Grade Level By Task
• Task • Rubric • Questions for Reflection • Student Work • Core Ideas, Strengths and Weaknesses • Graph and Analysis of the Data • Understandings and Misunderstandings • Implications for Instruction • Ideas for Action Research • Grade Level Analysis • Examining the Ramp
Grade 7 Copyright © 2009 by Noyce Foundation All rights reserved
1
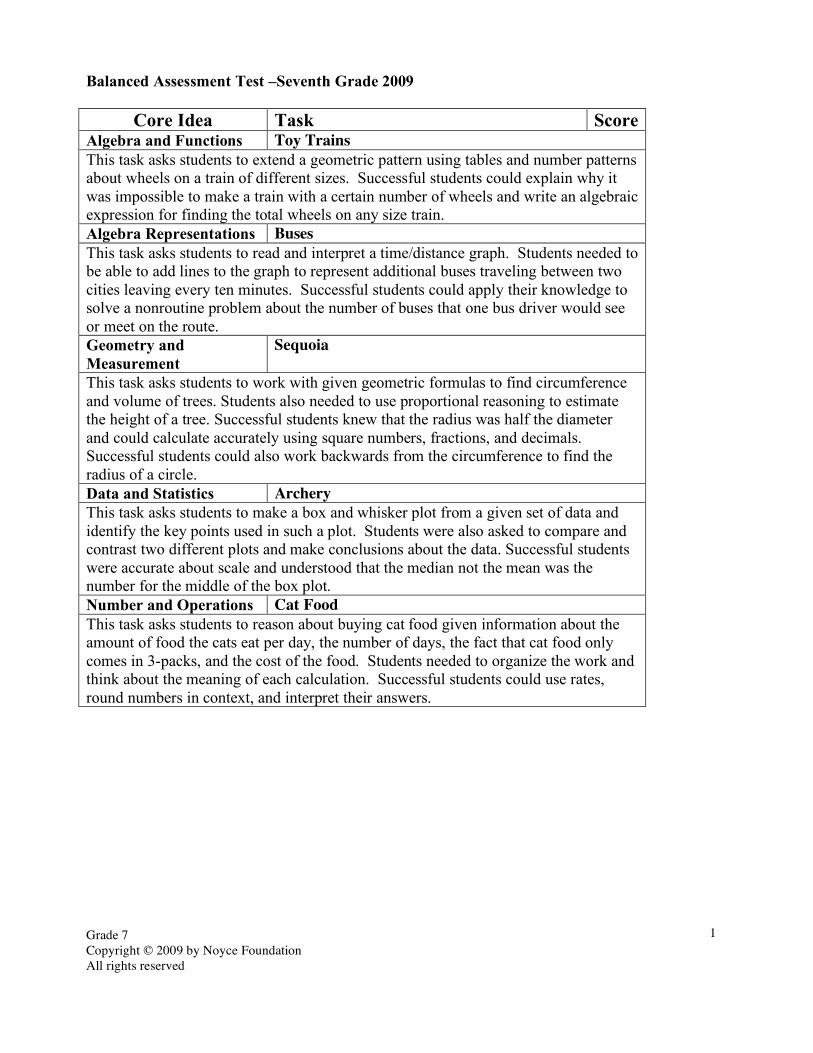
Balanced Assessment Test –Seventh Grade 2009
Core Idea Task Score Algebra and Functions Toy Trains This task asks students to extend a geometric pattern using tables and number patterns about wheels on a train of different sizes. Successful students could explain why it was impossible to make a train with a certain number of wheels and write an algebraic expression for finding the total wheels on any size train. Algebra Representations Buses This task asks students to read and interpret a time/distance graph. Students needed to be able to add lines to the graph to represent additional buses traveling between two cities leaving every ten minutes. Successful students could apply their knowledge to solve a nonroutine problem about the number of buses that one bus driver would see or meet on the route. Geometry and Measurement
Sequoia
This task asks students to work with given geometric formulas to find circumference and volume of trees. Students also needed to use proportional reasoning to estimate the height of a tree. Successful students knew that the radius was half the diameter and could calculate accurately using square numbers, fractions, and decimals. Successful students could also work backwards from the circumference to find the radius of a circle. Data and Statistics Archery This task asks students to make a box and whisker plot from a given set of data and identify the key points used in such a plot. Students were also asked to compare and contrast two different plots and make conclusions about the data. Successful students were accurate about scale and understood that the median not the mean was the number for the middle of the box plot. Number and Operations Cat Food This task asks students to reason about buying cat food given information about the amount of food the cats eat per day, the number of days, the fact that cat food only comes in 3-packs, and the cost of the food. Students needed to organize the work and think about the meaning of each calculation. Successful students could use rates, round numbers in context, and interpret their answers.

Grade 7 Copyright © 2009 by Noyce Foundation All rights reserved
2

Grade 7 Copyright © 2009 by Noyce Foundation All rights reserved
3

Grade 7 Toy Trains Copyright © 2009 by Mathematics Assessment Resource Service. All rights reserved. 4
Toy Trains This problem gives you the chance to: • find and use a number pattern • find an algebraic expression for a number pattern
Brenda’s toy shop sells toy trains. A size 1 set is just an engine, a size 2 has an engine and 1 carriage, a size 3 has an engine and 2 carriages and so on. The engine has 8 wheels, 4 on each side, and each carriage has 6 wheels, 3 on each side. The table shows the number if wheels on each size of train set.
Size of train set 1 2 3 4 5
Number of wheels 8 14
1. Fill in the table to show how many wheels sets 3, 4 and 5 have. 2. The biggest set in the shop is size 12. How many wheels does the size 12 set contain? Show how you figured it out.
__________________ 3. Mick says his train set has 42 wheels. Can Mick be correct? __________________ Explain how you know.
____________________________________________________________________________
4. The factory where the trains are made needs a rule for the number of wheels in any size set so that it can use this in its computer. Write an algebraic expression for the number of wheels in a size n set.
___________________________________
Size 1 Size 2 Size 3
7

Grade 7 Copyright © 2009 by Mathematics Assessment Resource Service. All rights reserved.
5
2009 Rubrics Grade 7
Toy Trains Rubric The core elements of performance required by this task are: • finding and using a number pattern • finding an algebraic expression for a number pattern Based on these, credit for specific aspects of performance should be assigned as follows
points
section points
1. Gives correct answers:
Partial credit One error
Size of train set 1 2 3 4 5 Number of wheels 8 14 20 26 32
2
(1)
2
2. Gives correct answer: 74 Shows correct work such as: 8 + 11 x 6 or continues table.
1 1
2
3. Gives correct answer: No Gives correct explanation such as: 42 – 8 = 34 is the number of wheels for the carriages and this does not divide by 6. Accept: set 7 has 44 wheels and set 6 has 38 wheels.
1 1
2
4. Gives correct answer such as: 6n + 2 or equivalent
1
1
Total Points 7
Grade 7 Copyright © 2009 by Noyce Foundation All rights reserved.
6
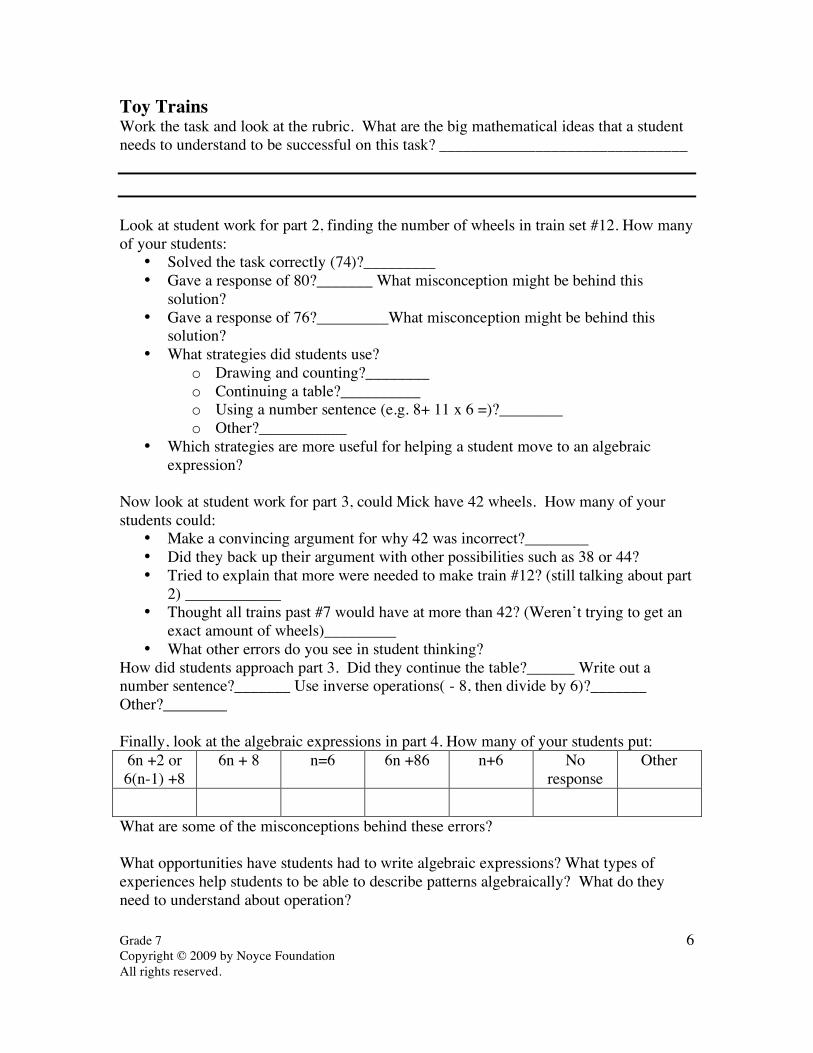
Toy Trains Work the task and look at the rubric. What are the big mathematical ideas that a student needs to understand to be successful on this task? _______________________________ Look at student work for part 2, finding the number of wheels in train set #12. How many of your students:
• Solved the task correctly (74)?_________ • Gave a response of 80?_______ What misconception might be behind this
solution? • Gave a response of 76?_________What misconception might be behind this
solution? • What strategies did students use?
o Drawing and counting?________ o Continuing a table?__________ o Using a number sentence (e.g. 8+ 11 x 6 =)?________ o Other?___________
• Which strategies are more useful for helping a student move to an algebraic expression?
Now look at student work for part 3, could Mick have 42 wheels. How many of your students could:
• Make a convincing argument for why 42 was incorrect?________ • Did they back up their argument with other possibilities such as 38 or 44? • Tried to explain that more were needed to make train #12? (still talking about part
2) ____________ • Thought all trains past #7 would have at more than 42? (Weren’t trying to get an
exact amount of wheels)_________ • What other errors do you see in student thinking?
How did students approach part 3. Did they continue the table?______ Write out a number sentence?_______ Use inverse operations( - 8, then divide by 6)?_______ Other?________ Finally, look at the algebraic expressions in part 4. How many of your students put: 6n +2 or 6(n-1) +8
6n + 8 n=6 6n +86 n+6 No response
Other
What are some of the misconceptions behind these errors? What opportunities have students had to write algebraic expressions? What types of experiences help students to be able to describe patterns algebraically? What do they need to understand about operation?
Grade 7 Copyright © 2009 by Noyce Foundation All rights reserved.
7
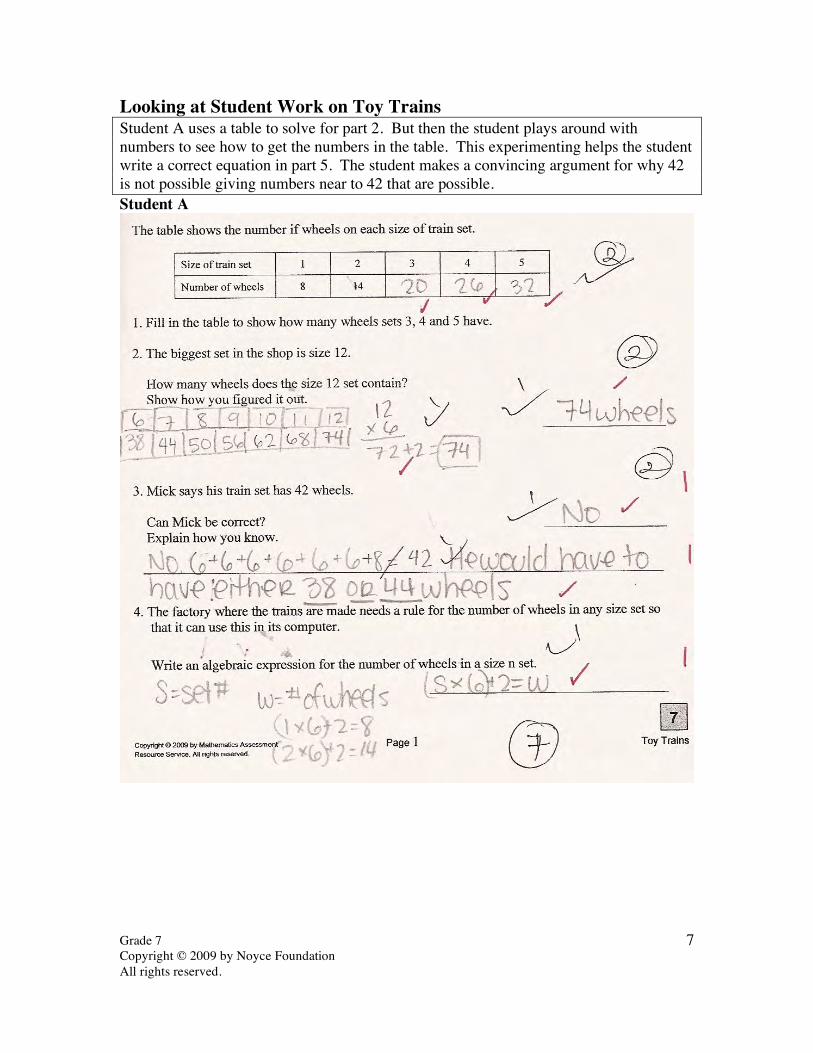
Looking at Student Work on Toy Trains Student A uses a table to solve for part 2. But then the student plays around with numbers to see how to get the numbers in the table. This experimenting helps the student write a correct equation in part 5. The student makes a convincing argument for why 42 is not possible giving numbers near to 42 that are possible. Student A
Grade 7 Copyright © 2009 by Noyce Foundation All rights reserved.
8
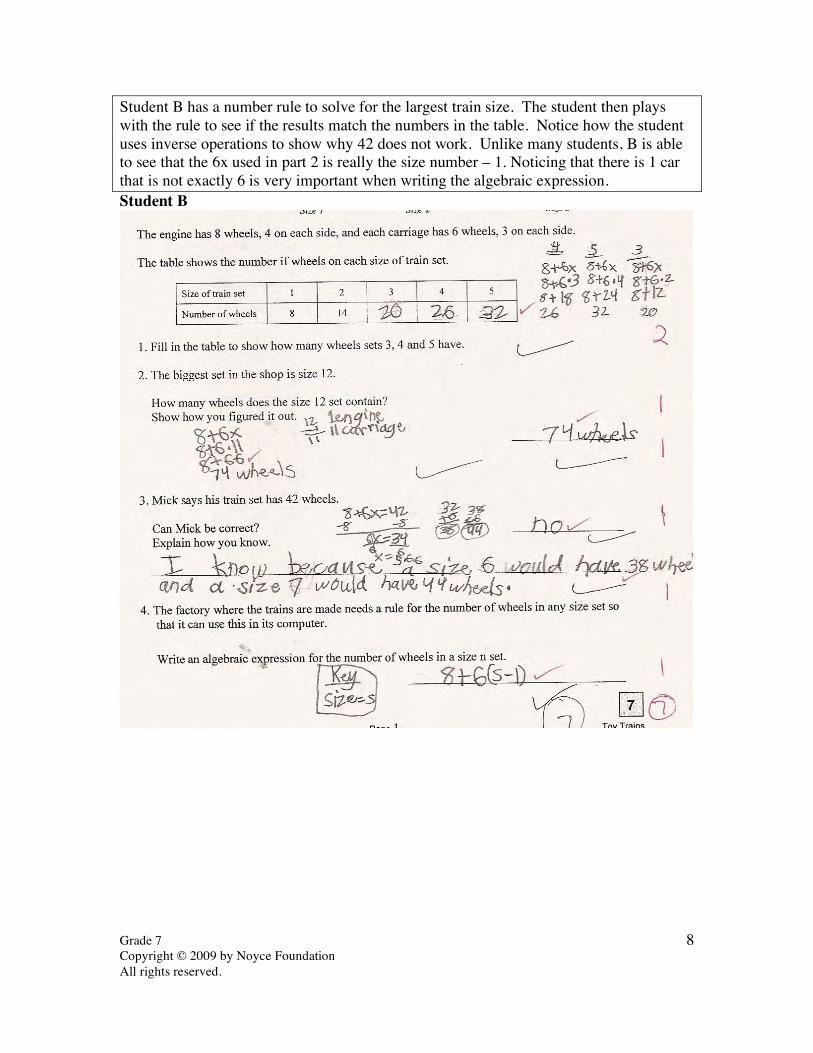
Student B has a number rule to solve for the largest train size. The student then plays with the rule to see if the results match the numbers in the table. Notice how the student uses inverse operations to show why 42 does not work. Unlike many students, B is able to see that the 6x used in part 2 is really the size number – 1. Noticing that there is 1 car that is not exactly 6 is very important when writing the algebraic expression. Student B
Grade 7 Copyright © 2009 by Noyce Foundation All rights reserved.
9
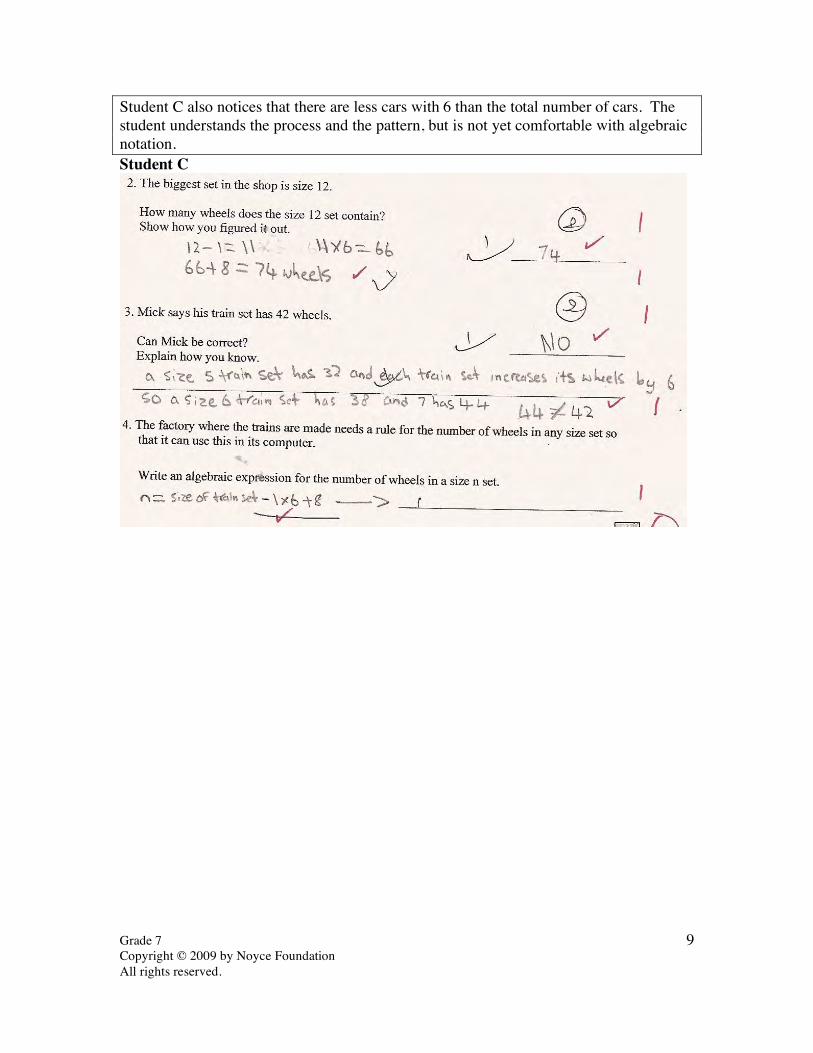
Student C also notices that there are less cars with 6 than the total number of cars. The student understands the process and the pattern, but is not yet comfortable with algebraic notation. Student C

Grade 7 Copyright © 2009 by Noyce Foundation All rights reserved.
10
Student D uses repeated addition to solve for part 2. This takes away the necessity of finding the number of times the 6 is used and leads to the error in writing the algebraic expression in part 4. What prompts or questions might you pose to push the thinking of this student to the next level? Student D
Grade 7 Copyright © 2009 by Noyce Foundation All rights reserved.
11
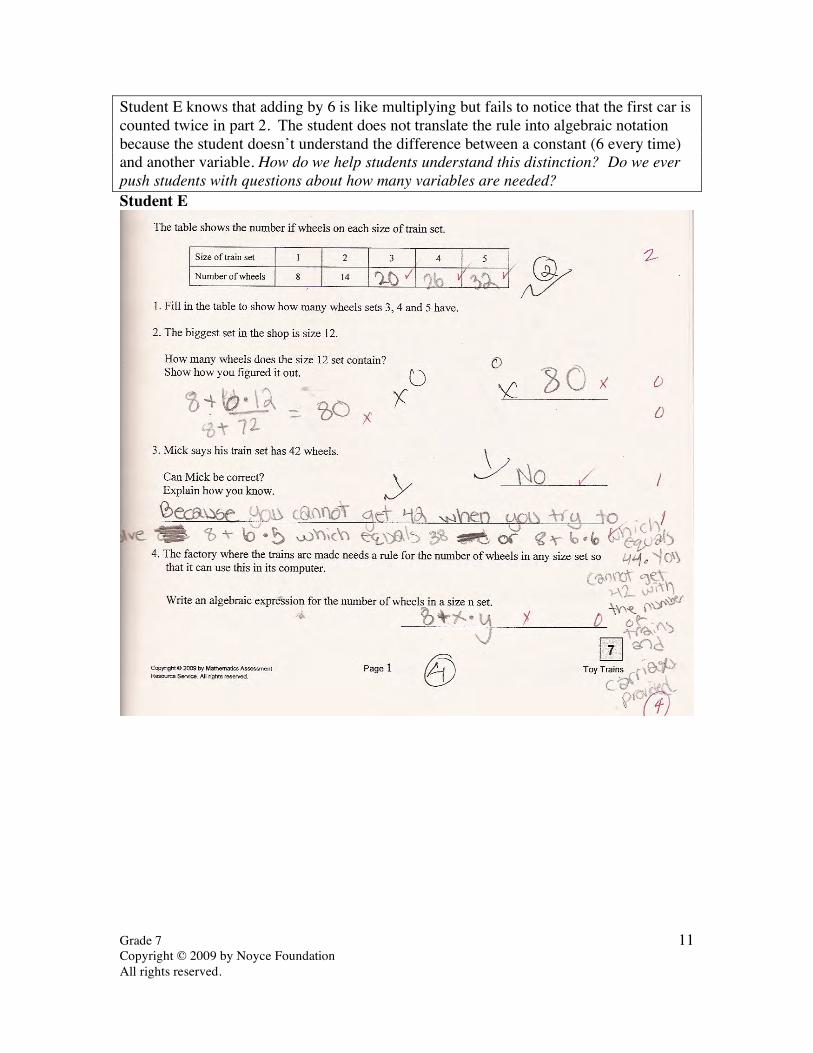
Student E knows that adding by 6 is like multiplying but fails to notice that the first car is counted twice in part 2. The student does not translate the rule into algebraic notation because the student doesn’t understand the difference between a constant (6 every time) and another variable. How do we help students understand this distinction? Do we ever push students with questions about how many variables are needed? Student E
Grade 7 Copyright © 2009 by Noyce Foundation All rights reserved.
12
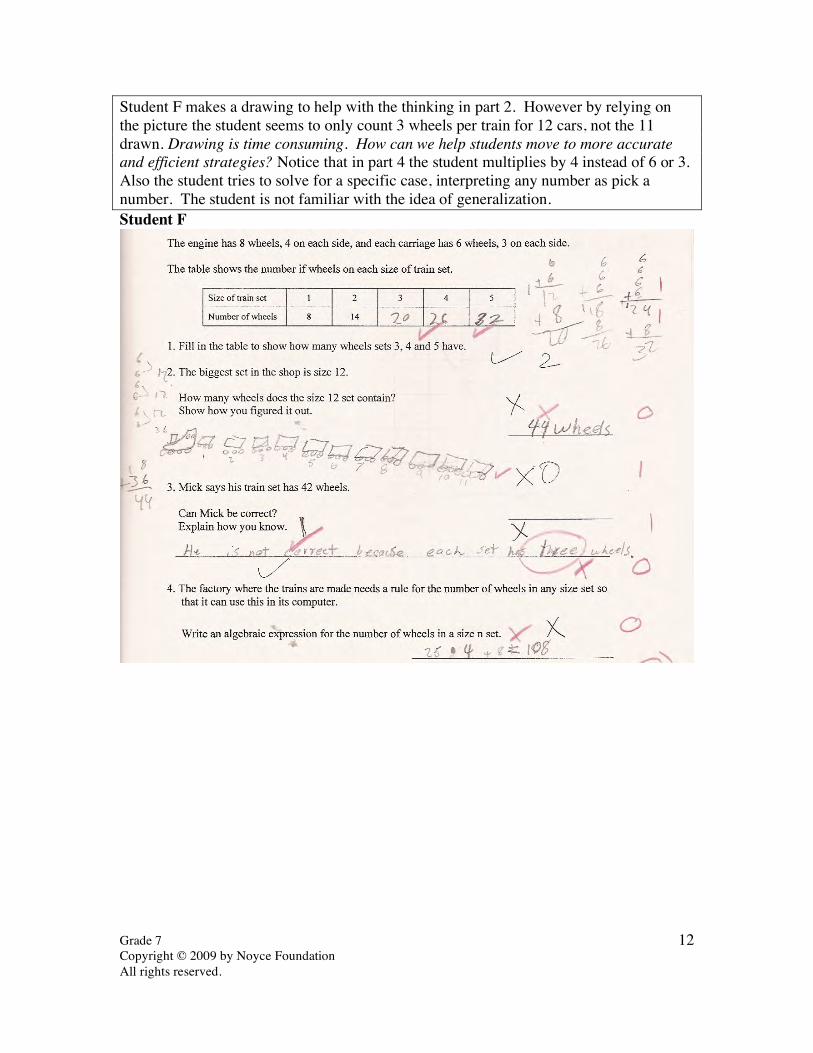
Student F makes a drawing to help with the thinking in part 2. However by relying on the picture the student seems to only count 3 wheels per train for 12 cars, not the 11 drawn. Drawing is time consuming. How can we help students move to more accurate and efficient strategies? Notice that in part 4 the student multiplies by 4 instead of 6 or 3. Also the student tries to solve for a specific case, interpreting any number as pick a number. The student is not familiar with the idea of generalization. Student F
Grade 7 Copyright © 2009 by Noyce Foundation All rights reserved.
13
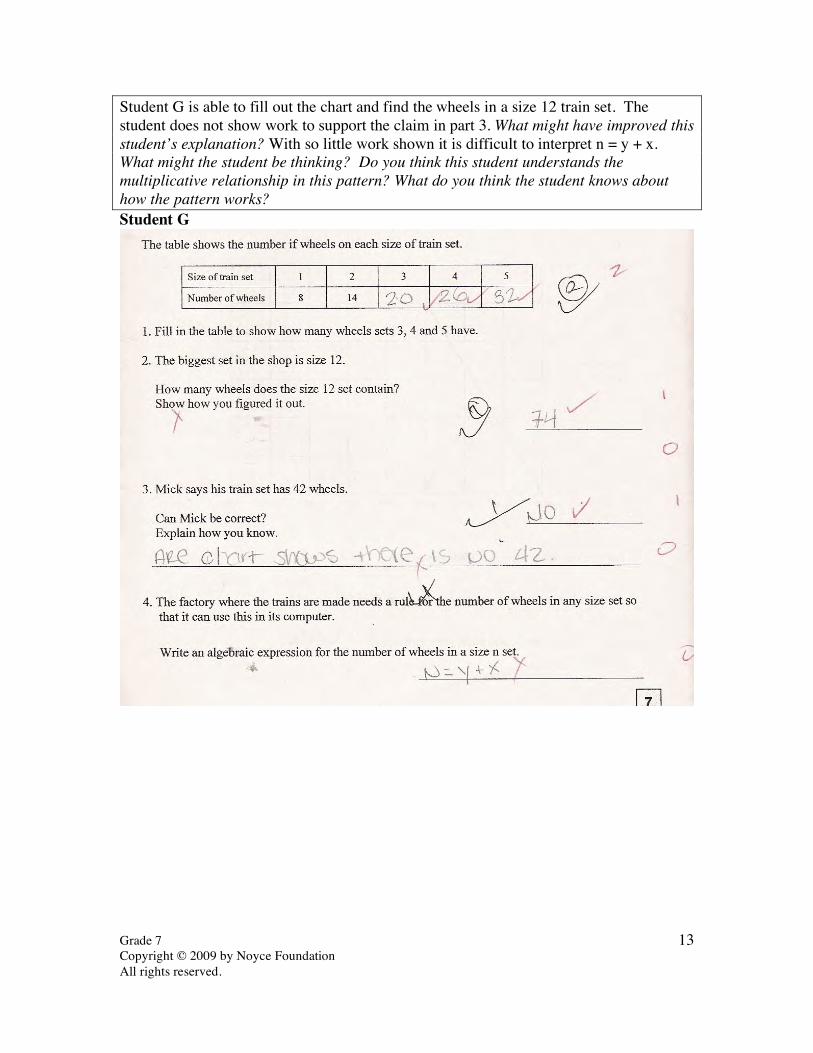
Student G is able to fill out the chart and find the wheels in a size 12 train set. The student does not show work to support the claim in part 3. What might have improved this student’s explanation? With so little work shown it is difficult to interpret n = y + x. What might the student be thinking? Do you think this student understands the multiplicative relationship in this pattern? What do you think the student knows about how the pattern works? Student G
Grade 7 Copyright © 2009 by Noyce Foundation All rights reserved.
14
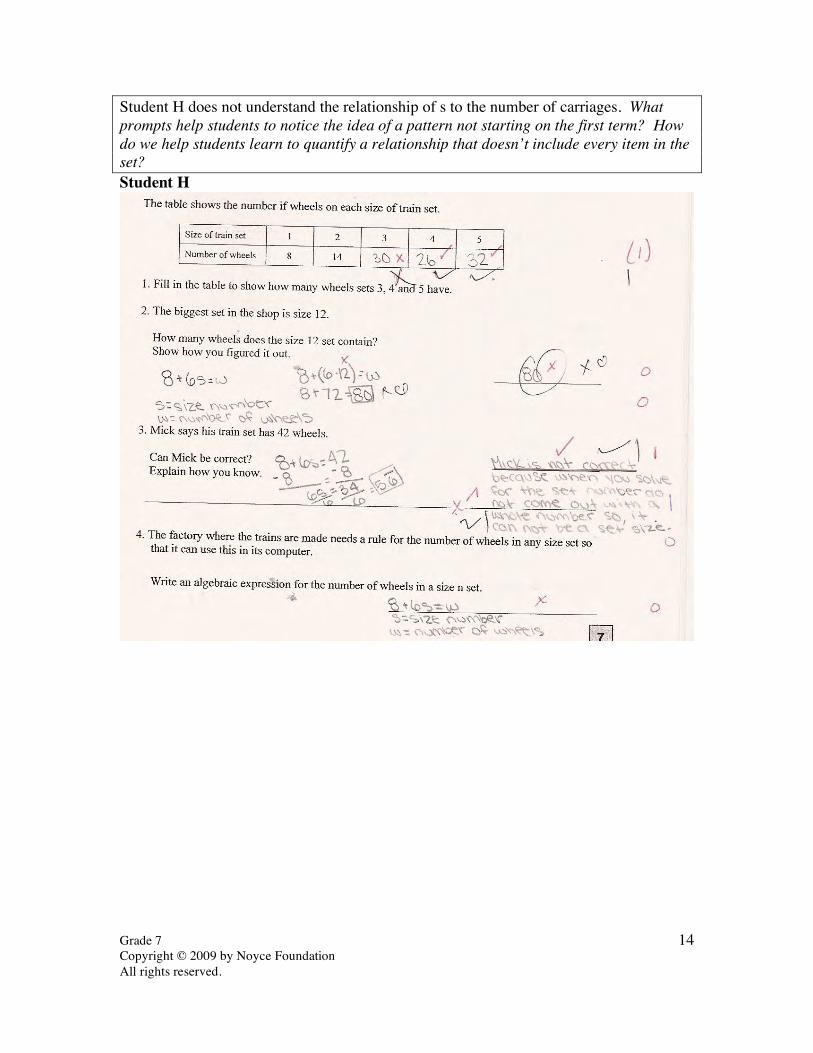
Student H does not understand the relationship of s to the number of carriages. What prompts help students to notice the idea of a pattern not starting on the first term? How do we help students learn to quantify a relationship that doesn’t include every item in the set? Student H
Grade 7 Copyright © 2009 by Noyce Foundation All rights reserved.
15
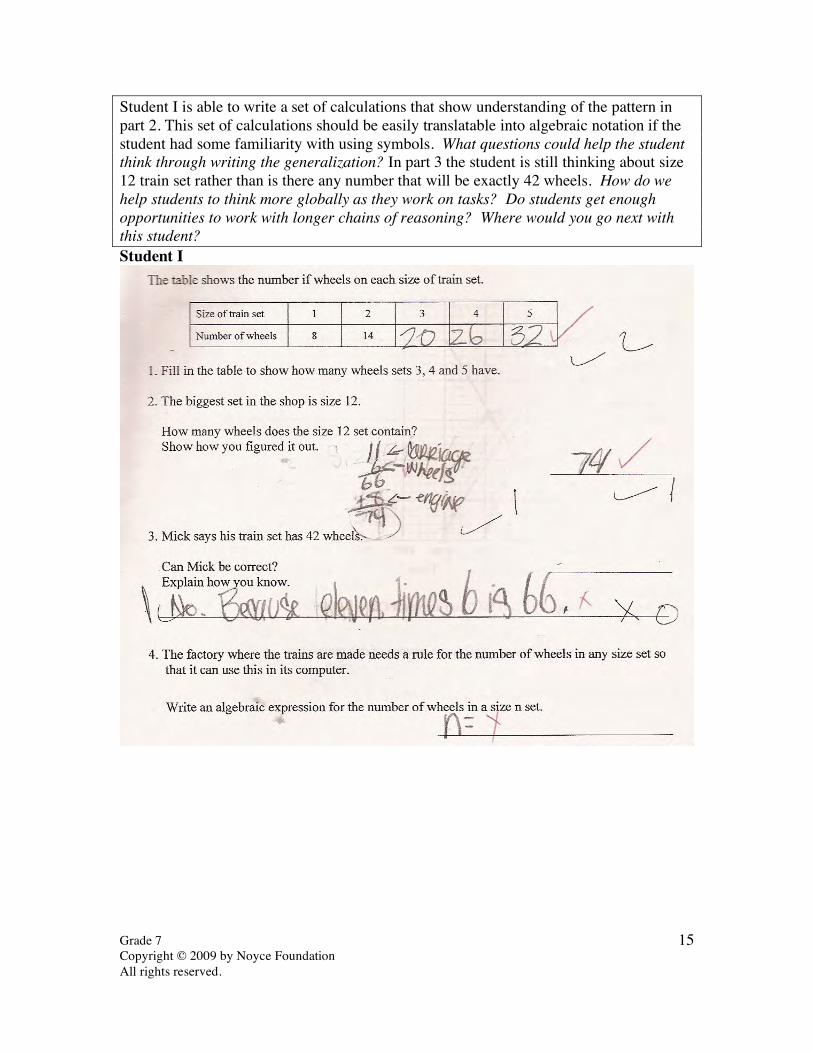
Student I is able to write a set of calculations that show understanding of the pattern in part 2. This set of calculations should be easily translatable into algebraic notation if the student had some familiarity with using symbols. What questions could help the student think through writing the generalization? In part 3 the student is still thinking about size 12 train set rather than is there any number that will be exactly 42 wheels. How do we help students to think more globally as they work on tasks? Do students get enough opportunities to work with longer chains of reasoning? Where would you go next with this student? Student I

Grade 7 Copyright © 2009 by Noyce Foundation All rights reserved.
16
Student J is able to use repeated addition or multiplication to extend the table. The student misinterprets the question in part 3. The student thinks that if there can be 74 wheels, then there must be 42 wheels. The student doesn’t think is there some train set with exactly 42 wheels. In part 4 the student makes a number sentence using numbers in the given and the variable. But the expression does not relate to the calculations from earlier parts of the task. Student J

Grade 7 Copyright © 2009 by Noyce Foundation All rights reserved.
17
7th Grade Task 1 Toy Trains Student Task Finding and using a number pattern. Finding an algebraic expression for
a number pattern. Core Idea 3 Algebra and Functions
Understand relations and functions, analyze mathematical situations, and use models to solve problems involving quantity and change.
• Represent, analyze, and generalize a variety of functions including linear relationships.
• Relate and compare different forms of representation for a relationship including words, tables, graphs in coordinate plane, and symbols.
• Express mathematical relationships using expressions and equations.
Mathematics of this task:
• Recognizing and extending a pattern • Using inverse operations to make a convincing argument about why 42 is not part
of the answer set • Writing an algebraic expression to describe the pattern for any solution in the set • Noting that the first term has a different pattern that the rest of the terms
Based on teacher observations, this is what seventh graders know and are able to do:
• Identify pattern and complete the table • Explain why 42 wheels are not possible • Use repeated addition and extending the table to find the number of wheels in a
size 12 Areas of difficulty for seventh graders:
• Writing an algebraic rule • Recognizing that the 6 is multiplied by one less that the pattern number or double
counting the engine • Working with inverse operations • Using repeated addition rather than seeing the multiplicative relationship • Writing expressions with too many variables, not understanding the role of the
“6” Strategies used by successful students:
• Extending the table • Using rules with multiplication • Playing with number combinations and checking it with answers in their table

Grade 7 Copyright © 2009 by Noyce Foundation All rights reserved.
18
The maximum score available for this task is 7 points. The minimum score needed for a level 3 response, meeting standards, is 4 points. Most students, 91%, could recognize the pattern and extend the table. Many students, 74%, could also explain why 42 wheels were not possible. Almost half the students, 47% could recognize and extend the pattern using the table or the set number and explain why 42 was not possible. 12% could meet all the demands of the task including writing an algebraic expression to represent the pattern. Almost 5% of the students scored no points on this task. All the students in the sample with this score attempted the task.
Grade 7 Copyright © 2009 by Noyce Foundation All rights reserved.
19
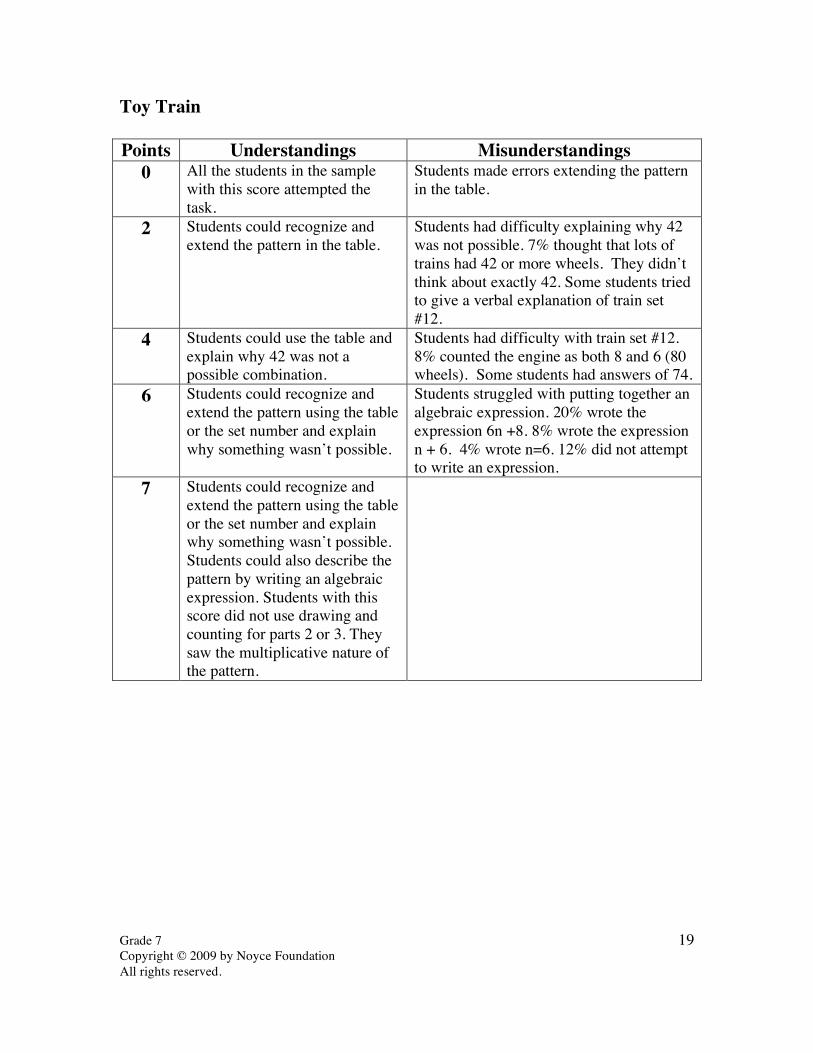
Toy Train Points Understandings Misunderstandings
0 All the students in the sample with this score attempted the task.
Students made errors extending the pattern in the table.
2 Students could recognize and extend the pattern in the table.
Students had difficulty explaining why 42 was not possible. 7% thought that lots of trains had 42 or more wheels. They didn’t think about exactly 42. Some students tried to give a verbal explanation of train set #12.
4 Students could use the table and explain why 42 was not a possible combination.
Students had difficulty with train set #12. 8% counted the engine as both 8 and 6 (80 wheels). Some students had answers of 74.
6 Students could recognize and extend the pattern using the table or the set number and explain why something wasn’t possible.
Students struggled with putting together an algebraic expression. 20% wrote the expression 6n +8. 8% wrote the expression n + 6. 4% wrote n=6. 12% did not attempt to write an expression.
7 Students could recognize and extend the pattern using the table or the set number and explain why something wasn’t possible. Students could also describe the pattern by writing an algebraic expression. Students with this score did not use drawing and counting for parts 2 or 3. They saw the multiplicative nature of the pattern.

Grade 7 Copyright © 2009 by Noyce Foundation All rights reserved.
20
Implications for Instruction Students at this grade level need frequent opportunities to work with patterns and try to describe them algebraically. When looking at patterns asking students questions, such as, “How does the pattern grow? What stays the same? What changes? Is there anything different in the first case?” helps students focus on the attributes of the pattern. Too often students rush to getting an answer by drawing and counting or using repeated addition. These strategies don’t serve to notice the multiplicative thinking or ideas about calculation patterns that can then be translated into algebraic terms. They are counter -productive to the new thinking we want students to develop at this grade level. Having students create good verbal descriptions of what is happening and of their description of the calculation process to extend the pattern helps them to create generalizable rules. Ideas for Action Research Often the focus is on the misconceptions of students. But for this exercise, you and your colleagues should focus on the work of successful students. What strategies did they use? How is their thinking process, even in the early parts of the problem, different than less successful students? Gather together the entire perfect papers, 7 points. Look through the work and see what commonalities appear in the their strategies for part 2 extending the pattern beyond the table to a size 12 train set. How does this work or way of tackling the problem show the beginnings of algebraic habits of mind? How do their solution strategies in part 2 aid in making the generalization in part 5? What are possible questions they are asking themselves to help them with the calculations in part 2? What attributes of the pattern help them with the calculations? How can you use those questions to help other students develop a similar “self-talk”? When you are done, look at the research from the sample on the next page.
Grade 7 Copyright © 2009 by Noyce Foundation All rights reserved.
21
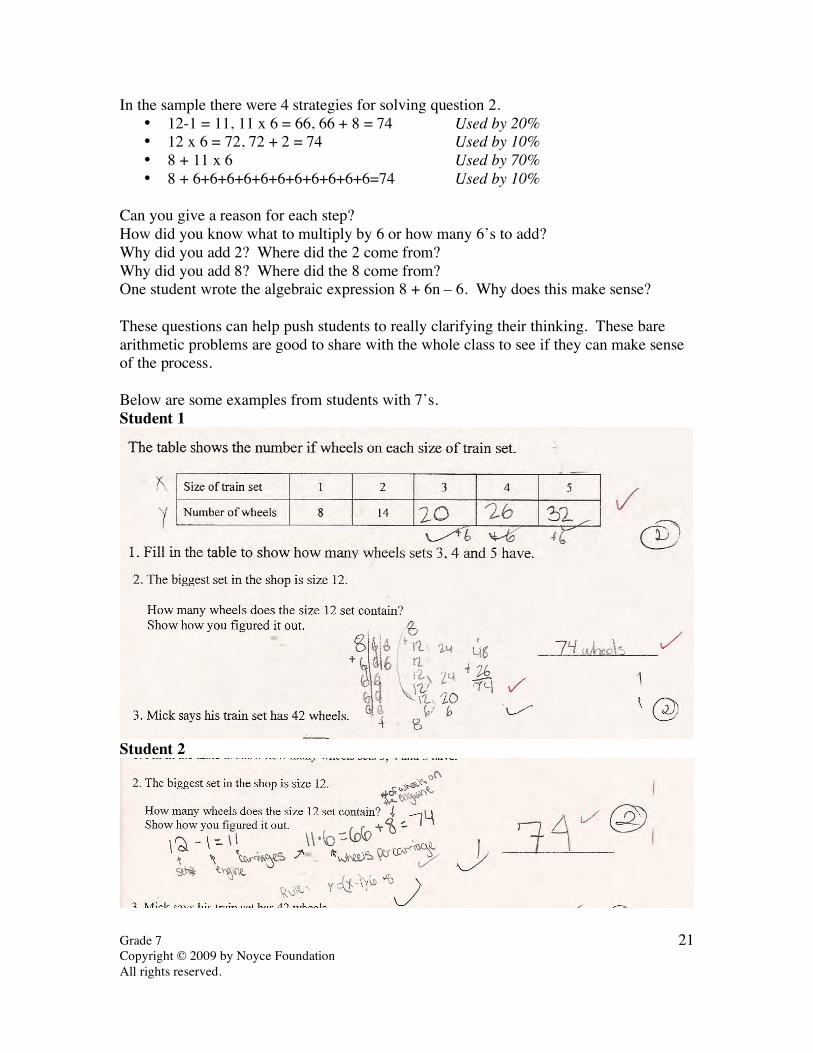
In the sample there were 4 strategies for solving question 2. • 12-1 = 11, 11 x 6 = 66, 66 + 8 = 74 Used by 20% • 12 x 6 = 72, 72 + 2 = 74 Used by 10% • 8 + 11 x 6 Used by 70% • 8 + 6+6+6+6+6+6+6+6+6+6+6=74 Used by 10%
Can you give a reason for each step? How did you know what to multiply by 6 or how many 6’s to add? Why did you add 2? Where did the 2 come from? Why did you add 8? Where did the 8 come from? One student wrote the algebraic expression 8 + 6n – 6. Why does this make sense? These questions can help push students to really clarifying their thinking. These bare arithmetic problems are good to share with the whole class to see if they can make sense of the process. Below are some examples from students with 7’s. Student 1
Student 2
Grade 7 Copyright © 2009 by Noyce Foundation All rights reserved.
22
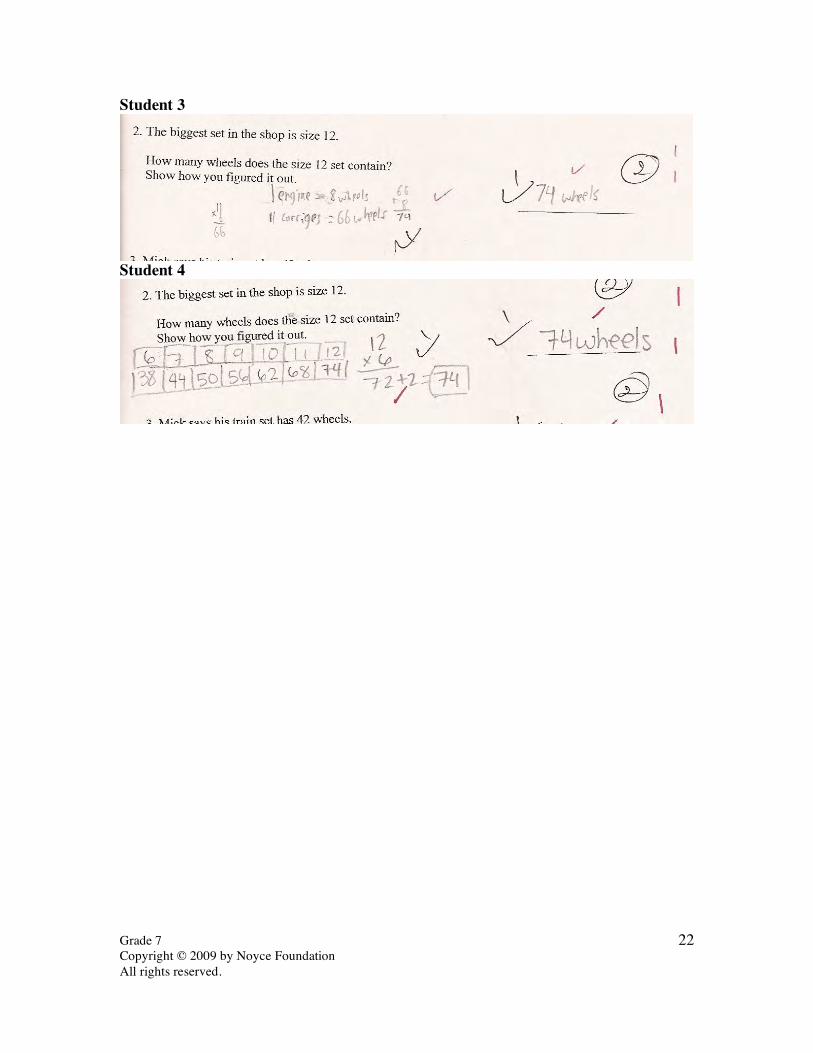
Student 3
Student 4
Grade 7 Buses Copyright © 2009 by Mathematics Assessment Resource Service. All rights reserved. 23
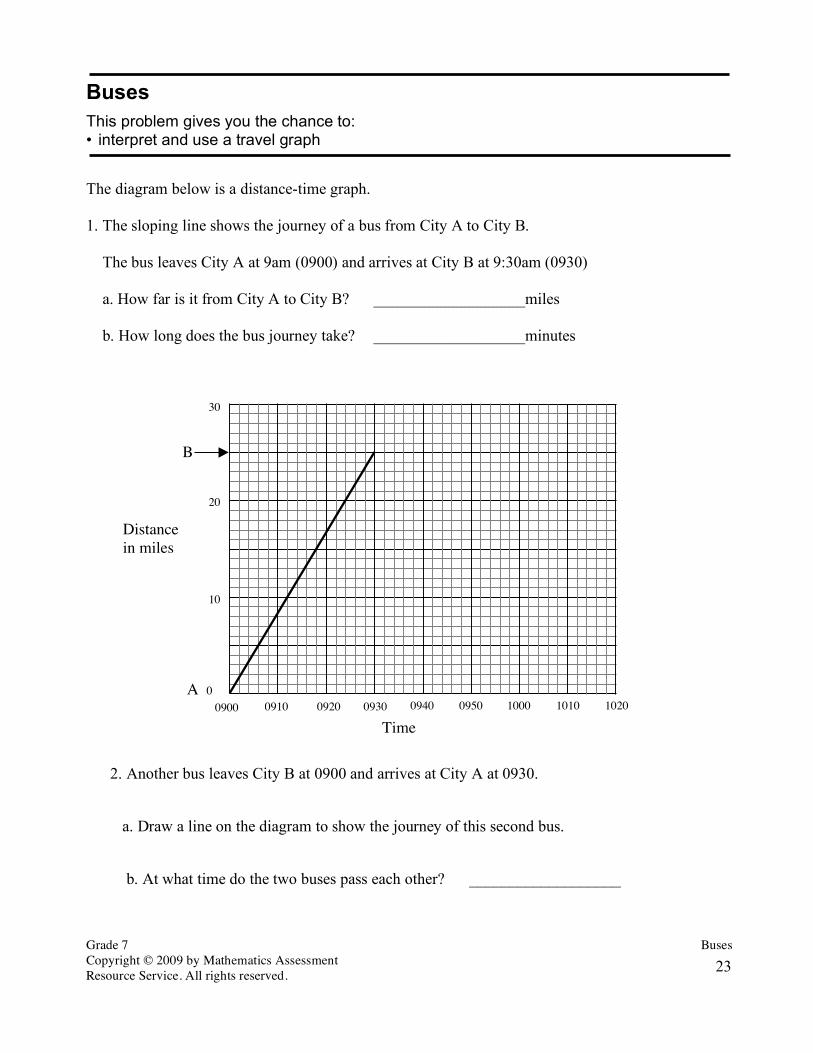
Buses This problem gives you the chance to: • interpret and use a travel graph The diagram below is a distance-time graph. 1. The sloping line shows the journey of a bus from City A to City B. The bus leaves City A at 9am (0900) and arrives at City B at 9:30am (0930) a. How far is it from City A to City B? ___________________miles b. How long does the bus journey take? ___________________minutes
2. Another bus leaves City B at 0900 and arrives at City A at 0930.
a. Draw a line on the diagram to show the journey of this second bus.
b. At what time do the two buses pass each other? ___________________
Distance
in miles
A 0
20
B
10
30
Time
0900 0910 10100920 0930 0940 0950 1000 1020

Grade 7 Buses Copyright © 2009 by Mathematics Assessment Resource Service. All rights reserved. 24
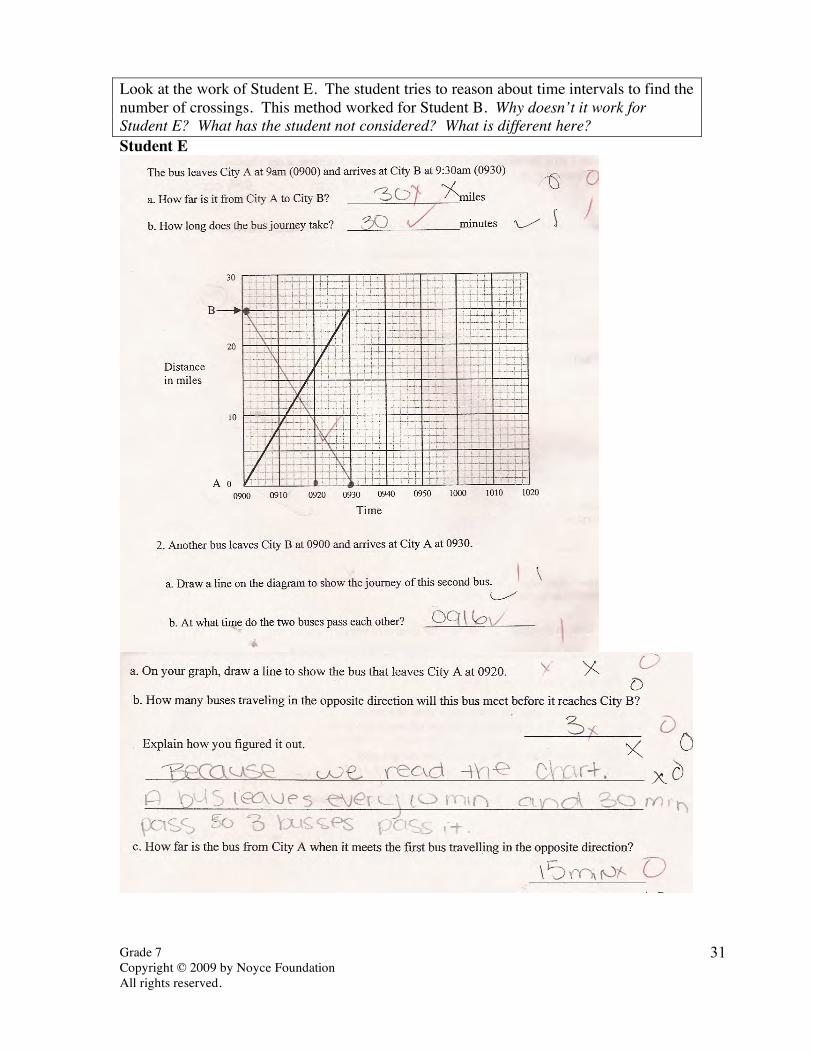
3. Buses leave City A and City B every 10 minutes during the morning, repeating the two journeys shown on your graph. a. On your graph, draw a line to show the bus that leaves City A at 0920. b. How many buses traveling in the opposite direction will this bus meet before it reaches City B? __________________ Explain how you figured it out. _____________________________________________________________________________
_____________________________________________________________________________
c. How far is the bus from City A when it meets the first bus travelling in the opposite direction?
__________________
8
Grade 7 Copyright © 2009 by Mathematics Assessment Resource Service. All rights reserved. 25
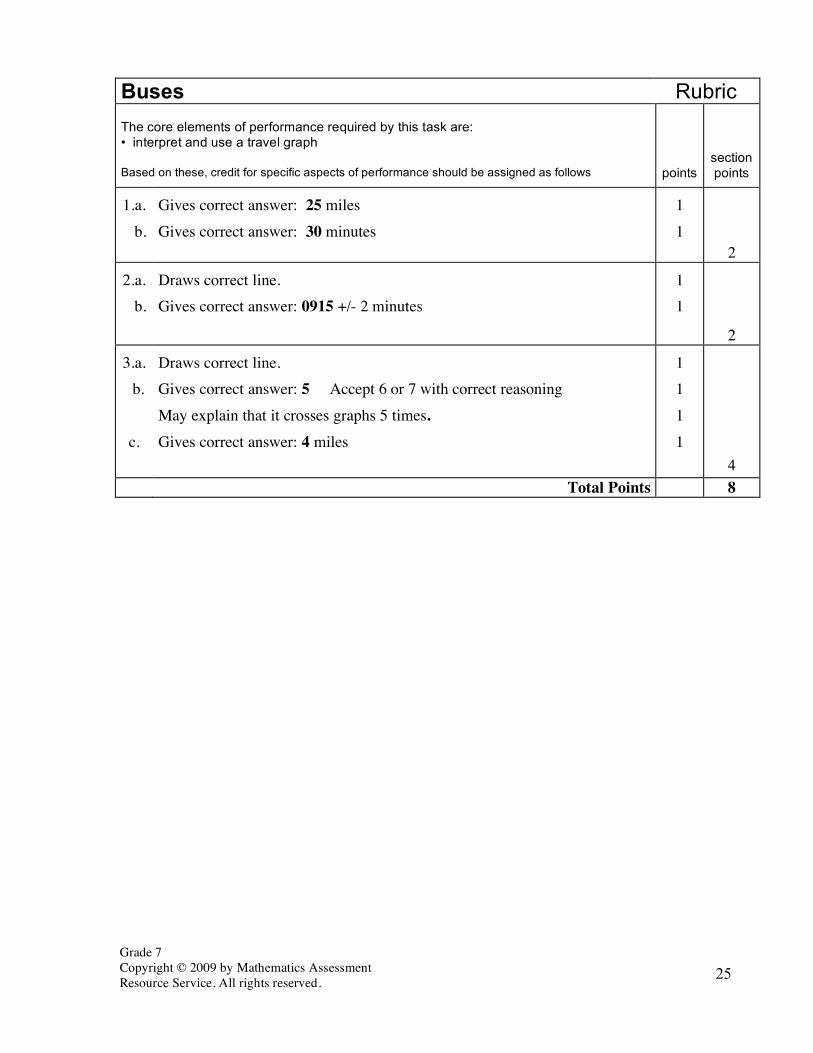
Buses Rubric The core elements of performance required by this task are: • interpret and use a travel graph Based on these, credit for specific aspects of performance should be assigned as follows
points
section points
1.a. b.
Gives correct answer: 25 miles Gives correct answer: 30 minutes
1 1
2
2.a. b.
Draws correct line. Gives correct answer: 0915 +/- 2 minutes
1 1
2
3.a. b.
c.
Draws correct line. Gives correct answer: 5 Accept 6 or 7 with correct reasoning May explain that it crosses graphs 5 times. Gives correct answer: 4 miles
1 1 1 1
4
Total Points 8

Grade 7 Copyright © 2009 by Noyce Foundation All rights reserved.
26
Buses Work the task and look at the rubric. What does a student need to know to be successful on this task? What are the big mathematical ideas in this task?_____________________ In general students did very well on question 1 and 2.
• On question 1a, about 7% of the students thought the distance between City A and B was 30 miles. What might students have been thinking?
• On question 1b, about 7% of the students thought the journey took 9:30 minutes? While the label was given to students, they still wrote down a time of day. How do we help students learn to think about elapsed time versus a specific time?
• On question 2a, draw a line to show the journey of the second bus. About 7% of the students drew no line at all. In your class or in your adopted mathematics program do students get frequent opportunities to use diagrams and graphs as problem-solving tools or do they mostly work with books where no writing is allowed?
• In question 2b, estimating the time the buses meet, 8% of the students picked 9:12. Where might they have gotten that answer?
Now look at work for part 3a, drawing in a bus leaving city A at 9:20. How many of your students:
• Drew in a correct line?__________ • Did not attempt a line?__________ • Drew the line from 9:20 back to point B?_________ • Drew line that only went up part way (did not go up to the 25 mile line)?_______
What other errors or misconceptions did you see? Now look at work on 3b, how many buses does it pass. How many of your students put:
5 3 1 2 4 Other
What misconceptions led to some of these errors? What was confusing for students? How many students did not draw in any additional lines?_________ Drew in only a few additional lines but not enough to reach a correct solution?_______ Why do you think students were hesitant to draw in the additional lines? _______ Students were all over the map in their answers to 3c, how far has the bus traveled when it meets the first bus. Many did not even use the correct units. How many of your students put:
4 mi. 12.5 mi. 8 mi. 25 mi. 10 mi. 5 mi. 13 mi.
15 min. 10 min. 20 min. A time e.g. 9:15
1/3 No response
Other
Why do you think this question was so confusing? What are some of the students’ misconceptions?

Grade 7 Copyright © 2009 by Noyce Foundation All rights reserved.
27
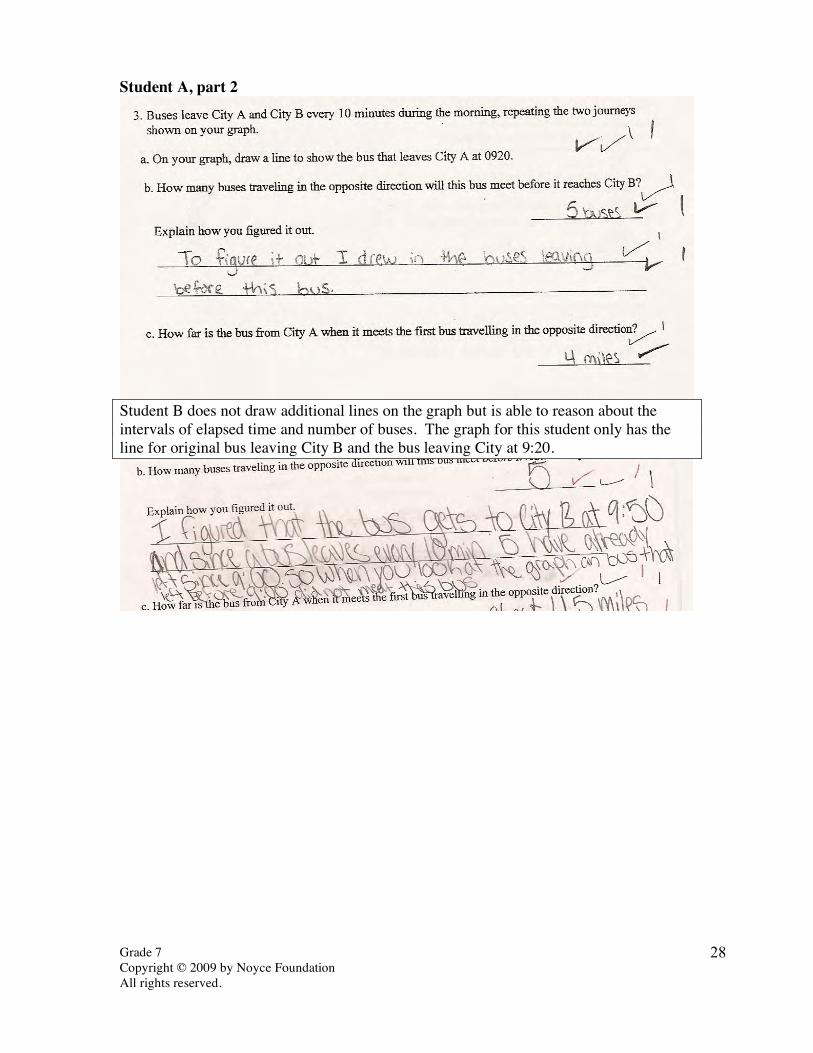
Looking at Student Work on Buses Student A is able to read and interpret and time-distance graph. The student is able to add lines to the graph to find the number of buses passed by the bus leaving at 9:20. The student uses a ruler to make the lines straight and make estimation of time and distance more accurate. Student A
Grade 7 Copyright © 2009 by Noyce Foundation All rights reserved.
28
Student A, part 2
Student B does not draw additional lines on the graph but is able to reason about the intervals of elapsed time and number of buses. The graph for this student only has the line for original bus leaving City B and the bus leaving City at 9:20.
Grade 7 Copyright © 2009 by Noyce Foundation All rights reserved.
29
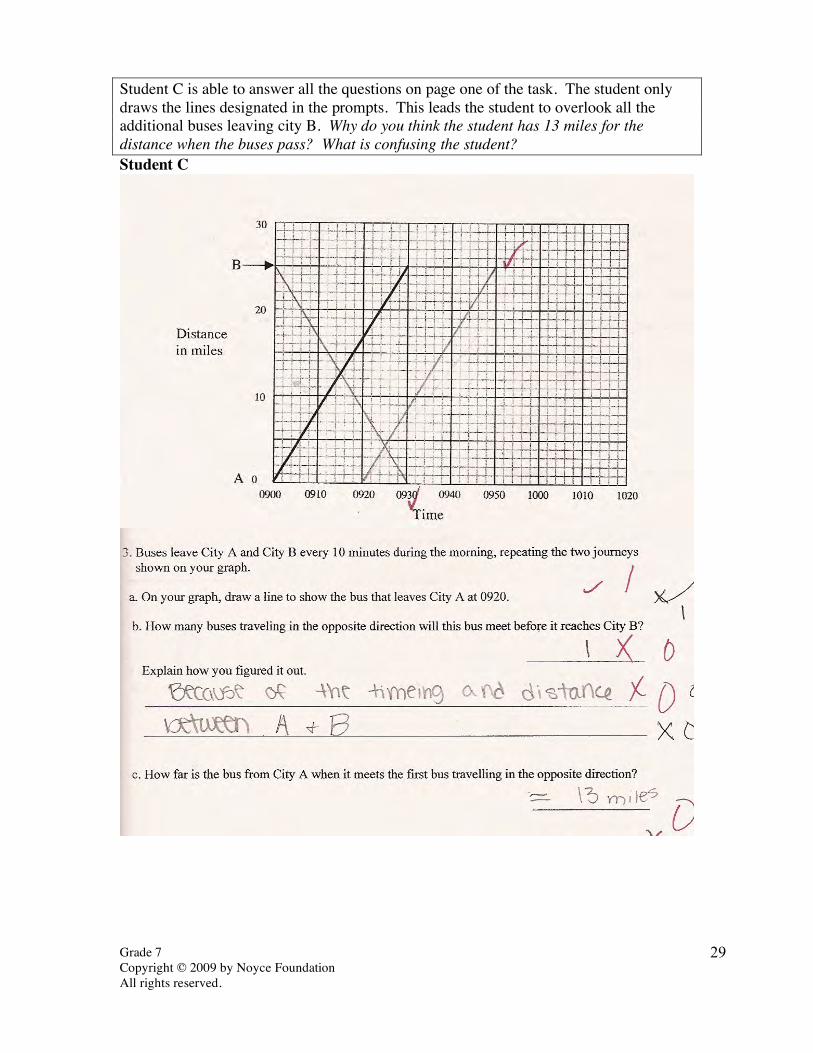
Student C is able to answer all the questions on page one of the task. The student only draws the lines designated in the prompts. This leads the student to overlook all the additional buses leaving city B. Why do you think the student has 13 miles for the distance when the buses pass? What is confusing the student? Student C

Grade 7 Copyright © 2009 by Noyce Foundation All rights reserved.
30
Look at the graph made by Student D. What assumptions or constraints does D put on the graph? What about the context is the student missing? Student D
Grade 7 Copyright © 2009 by Noyce Foundation All rights reserved.
31
Look at the work of Student E. The student tries to reason about time intervals to find the number of crossings. This method worked for Student B. Why doesn’t it work for Student E? What has the student not considered? What is different here? Student E

Grade 7 Copyright © 2009 by Noyce Foundation All rights reserved.
32
Student F confuses the graph of the journey with the picture of the bus returning to City C. What experiences does this student need? What questions might you ask? Student F

Grade 7 Copyright © 2009 by Noyce Foundation All rights reserved.
33
Student G makes the same graph as Student F. When you look at these calculations for 3band 3c, what might student G be thinking? Student G
Student H understands that the bus needs to travel the 25 miles, but is confused about maintaining the same rate of travel. What experiences does this student need? Student H
Grade 7 Copyright © 2009 by Noyce Foundation All rights reserved.
34
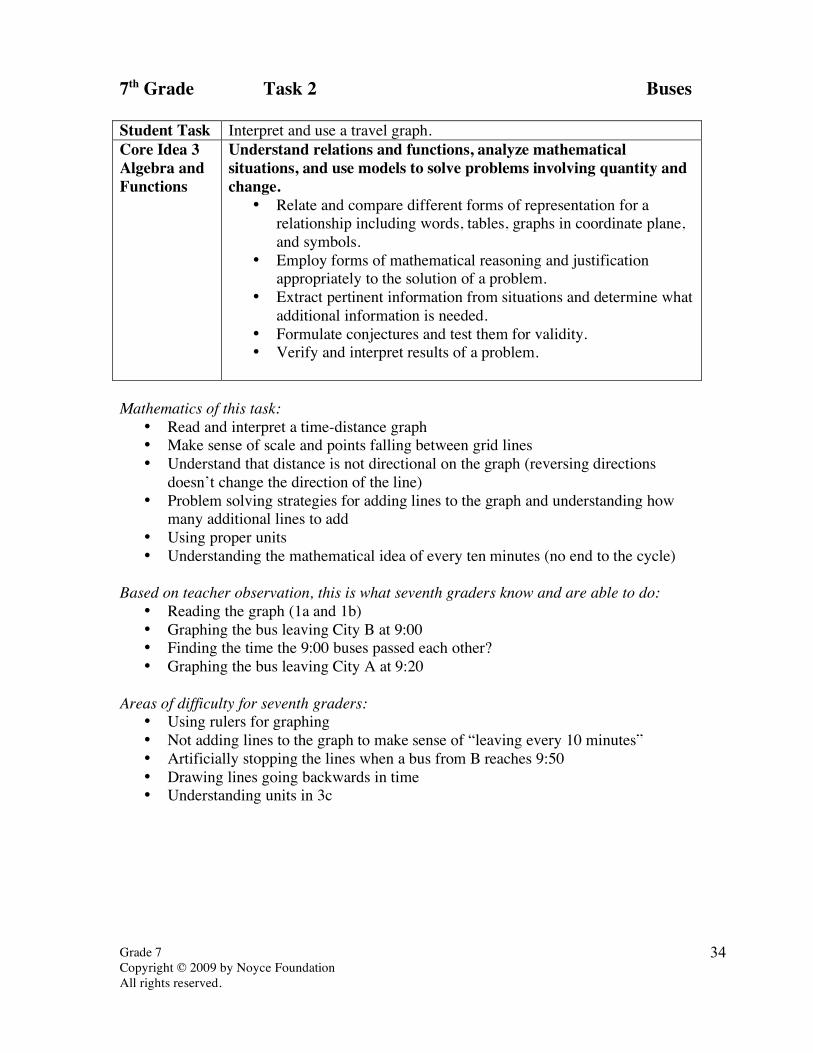
7th Grade Task 2 Buses Student Task Interpret and use a travel graph. Core Idea 3 Algebra and Functions
Understand relations and functions, analyze mathematical situations, and use models to solve problems involving quantity and change.
• Relate and compare different forms of representation for a relationship including words, tables, graphs in coordinate plane, and symbols.
• Employ forms of mathematical reasoning and justification appropriately to the solution of a problem.
• Extract pertinent information from situations and determine what additional information is needed.
• Formulate conjectures and test them for validity. • Verify and interpret results of a problem.
Mathematics of this task:
• Read and interpret a time-distance graph • Make sense of scale and points falling between grid lines • Understand that distance is not directional on the graph (reversing directions
doesn’t change the direction of the line) • Problem solving strategies for adding lines to the graph and understanding how
many additional lines to add • Using proper units • Understanding the mathematical idea of every ten minutes (no end to the cycle)
Based on teacher observation, this is what seventh graders know and are able to do:
• Reading the graph (1a and 1b) • Graphing the bus leaving City B at 9:00 • Finding the time the 9:00 buses passed each other? • Graphing the bus leaving City A at 9:20
Areas of difficulty for seventh graders:
• Using rulers for graphing • Not adding lines to the graph to make sense of “leaving every 10 minutes” • Artificially stopping the lines when a bus from B reaches 9:50 • Drawing lines going backwards in time • Understanding units in 3c
Grade 7 Copyright © 2009 by Noyce Foundation All rights reserved.
35
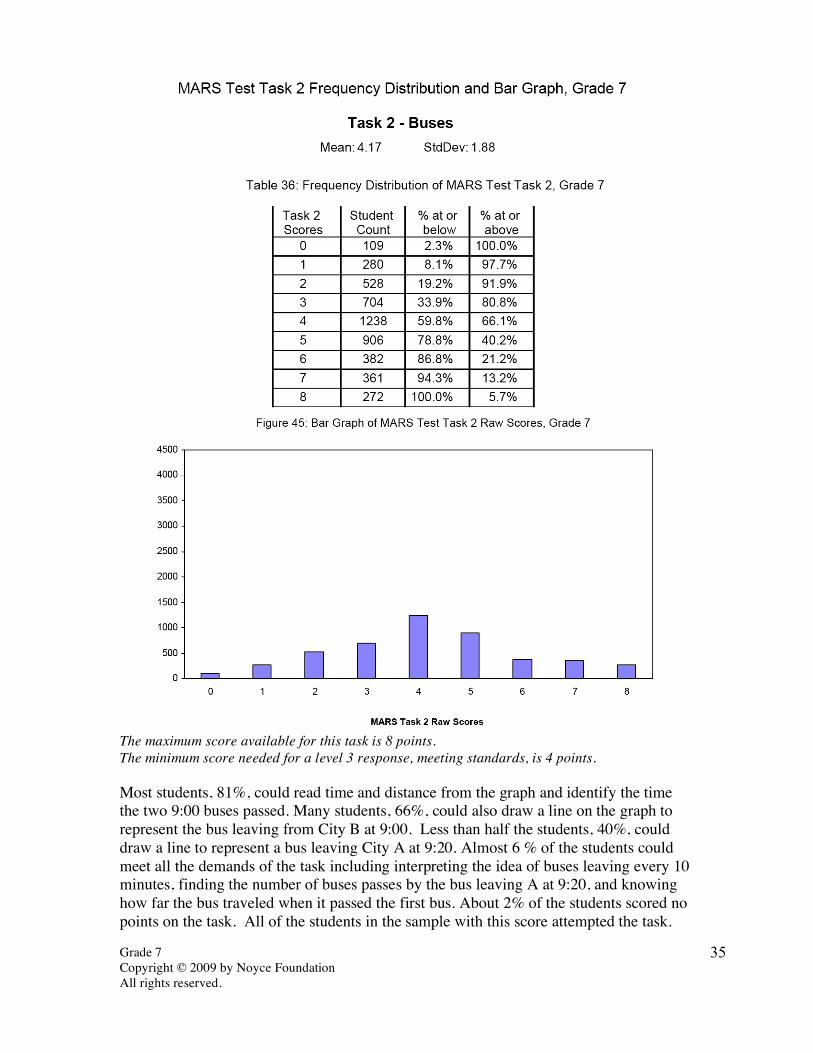
The maximum score available for this task is 8 points. The minimum score needed for a level 3 response, meeting standards, is 4 points. Most students, 81%, could read time and distance from the graph and identify the time the two 9:00 buses passed. Many students, 66%, could also draw a line on the graph to represent the bus leaving from City B at 9:00. Less than half the students, 40%, could draw a line to represent a bus leaving City A at 9:20. Almost 6 % of the students could meet all the demands of the task including interpreting the idea of buses leaving every 10 minutes, finding the number of buses passes by the bus leaving A at 9:20, and knowing how far the bus traveled when it passed the first bus. About 2% of the students scored no points on the task. All of the students in the sample with this score attempted the task.
Grade 7 Copyright © 2009 by Noyce Foundation All rights reserved.
36
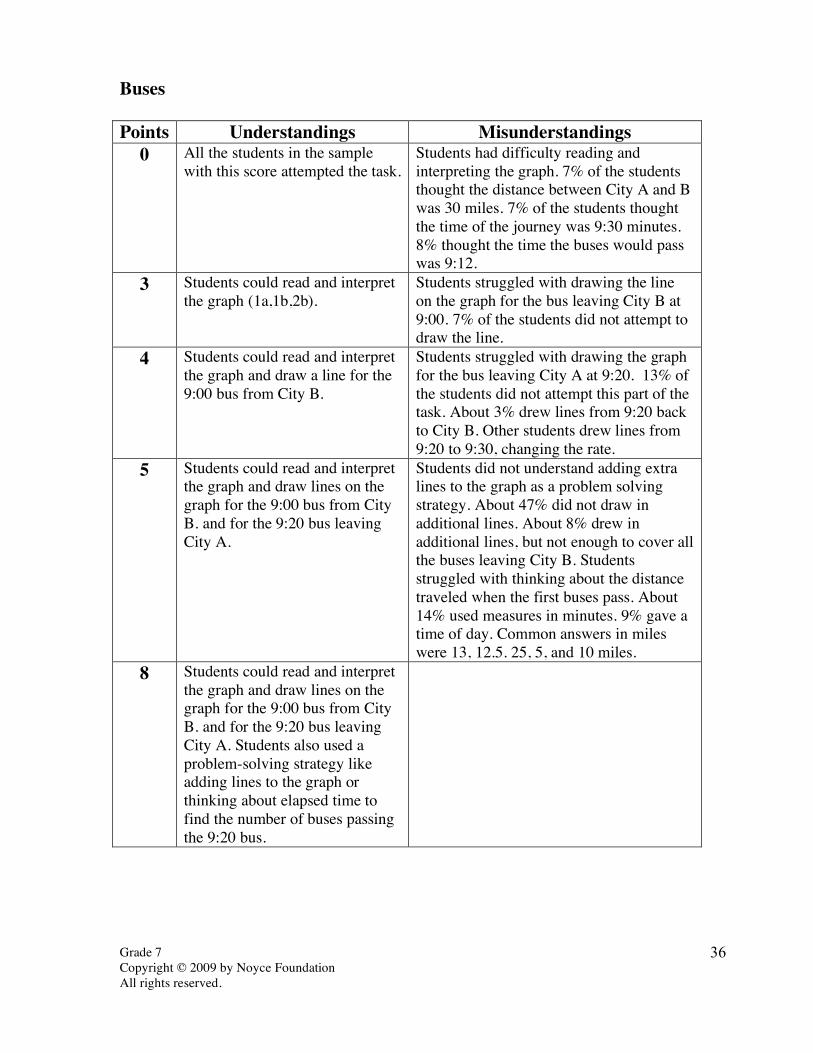
Buses Points Understandings Misunderstandings
0 All the students in the sample with this score attempted the task.
Students had difficulty reading and interpreting the graph. 7% of the students thought the distance between City A and B was 30 miles. 7% of the students thought the time of the journey was 9:30 minutes. 8% thought the time the buses would pass was 9:12.
3 Students could read and interpret the graph (1a,1b,2b).
Students struggled with drawing the line on the graph for the bus leaving City B at 9:00. 7% of the students did not attempt to draw the line.
4 Students could read and interpret the graph and draw a line for the 9:00 bus from City B.
Students struggled with drawing the graph for the bus leaving City A at 9:20. 13% of the students did not attempt this part of the task. About 3% drew lines from 9:20 back to City B. Other students drew lines from 9:20 to 9:30, changing the rate.
5 Students could read and interpret the graph and draw lines on the graph for the 9:00 bus from City B. and for the 9:20 bus leaving City A.
Students did not understand adding extra lines to the graph as a problem solving strategy. About 47% did not draw in additional lines. About 8% drew in additional lines, but not enough to cover all the buses leaving City B. Students struggled with thinking about the distance traveled when the first buses pass. About 14% used measures in minutes. 9% gave a time of day. Common answers in miles were 13, 12.5. 25, 5, and 10 miles.
8 Students could read and interpret the graph and draw lines on the graph for the 9:00 bus from City B. and for the 9:20 bus leaving City A. Students also used a problem-solving strategy like adding lines to the graph or thinking about elapsed time to find the number of buses passing the 9:20 bus.

Grade 7 Copyright © 2009 by Noyce Foundation All rights reserved.
37
Implications for Instruction Students need to be able to reason about time-distance graphs in context. Students need opportunities to see that the shape of the graph may be different than the action of the graph. In this case, a bus traveling from City A to City B does not return to City B, but travels greater distance and so moves across the graph from right to left. A bus cannot move backward in time. Students need to be able to use tools, like rulers to make sure their work is accurate. Some students had difficulty with the slope of the lines. Students at this level did not feel comfortable adding lines to the graph to aid in problem solving. Students had difficulty using the scale accurately or choosing the appropriate scale for answering questions. Students need to develop a good understanding of rate. They should be able to think about the rate the original bus is traveling, 50 mph. Implied within this context is that all buses will travel at the same rate. Students at this grade level should begin to associate rate with the slope on the graph and realize that buses traveling at the same rate with different start times will be represented by parallel lines on the graph. (For more rate problems consider 2008 8th grade Cog Railway. For graphing story problems look at 2006 6th grade Bike Ride.) Ideas for Action Research An interesting activity to push some of these ideas is to look at the activity Going to School from the Shell Centre, University of Nottingham, 1985. In this activity students look first at a time distance graph scatterplot and try to determine from descriptions about the students and a map, which student is represented by all the points. Students have to think about relative rates to help identify individuals. Then students are asked to construct a time – speed graph for a car trip by Peter’s father. This gets students focused on the idea of rate over time. This activity could then be extended to taking the information about the car trip and making a time – distance graph. The teacher can ask probing questions about how students knew what slope to make the lines, how does the slope equal the rate. When done, students can then make observations about the shape of the trip (map) and the shape of the other two graphs. This allows them to confront the idea of differences between action of the story and shape of the graph. It also helps them to construct ideas about the relationship between slope and rate on a time-distance graph.

Grade 7 Copyright © 2009 by Noyce Foundation All rights reserved.
38
Grade 7 Copyright © 2009 by Noyce Foundation All rights reserved.
39
Ideas for Action Research – Re-engagement
Re-engagement – Confronting misconceptions, providing feedback on thinking, going deeper into the mathematics. (See overview at beginning of toolkit). 1. Start with a simple problem to bring all the students along. This allows students to
clarify and articulate the mathematical ideas. 2. Make sense of another person’s strategy. Try on a strategy. Compare strategies. 3. Have students analyze misconceptions and discuss why they don’t make sense. In
the process students can let go of misconceptions and clarify their thinking about the big ideas.
4. Find out how a strategy could be modified to get the right answer. Find the seeds of mathematical thinking in student work.
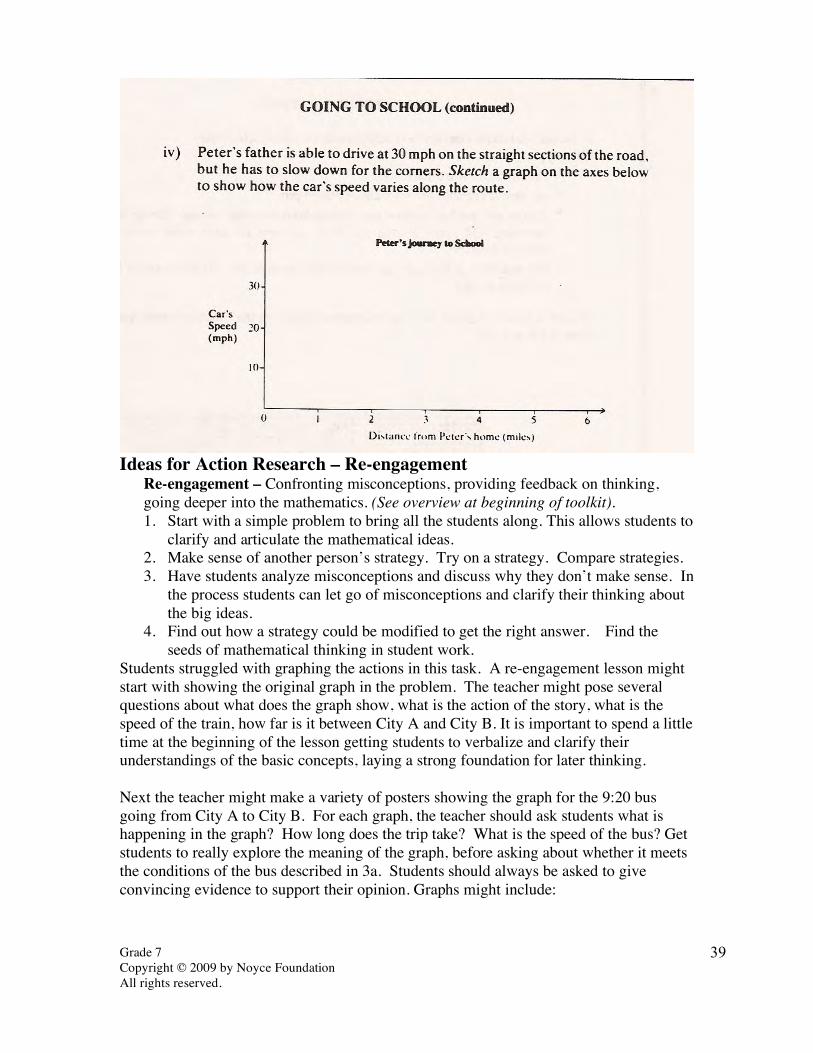
Students struggled with graphing the actions in this task. A re-engagement lesson might start with showing the original graph in the problem. The teacher might pose several questions about what does the graph show, what is the action of the story, what is the speed of the train, how far is it between City A and City B. It is important to spend a little time at the beginning of the lesson getting students to verbalize and clarify their understandings of the basic concepts, laying a strong foundation for later thinking. Next the teacher might make a variety of posters showing the graph for the 9:20 bus going from City A to City B. For each graph, the teacher should ask students what is happening in the graph? How long does the trip take? What is the speed of the bus? Get students to really explore the meaning of the graph, before asking about whether it meets the conditions of the bus described in 3a. Students should always be asked to give convincing evidence to support their opinion. Graphs might include:
Grade 7 Copyright © 2009 by Noyce Foundation All rights reserved.
40
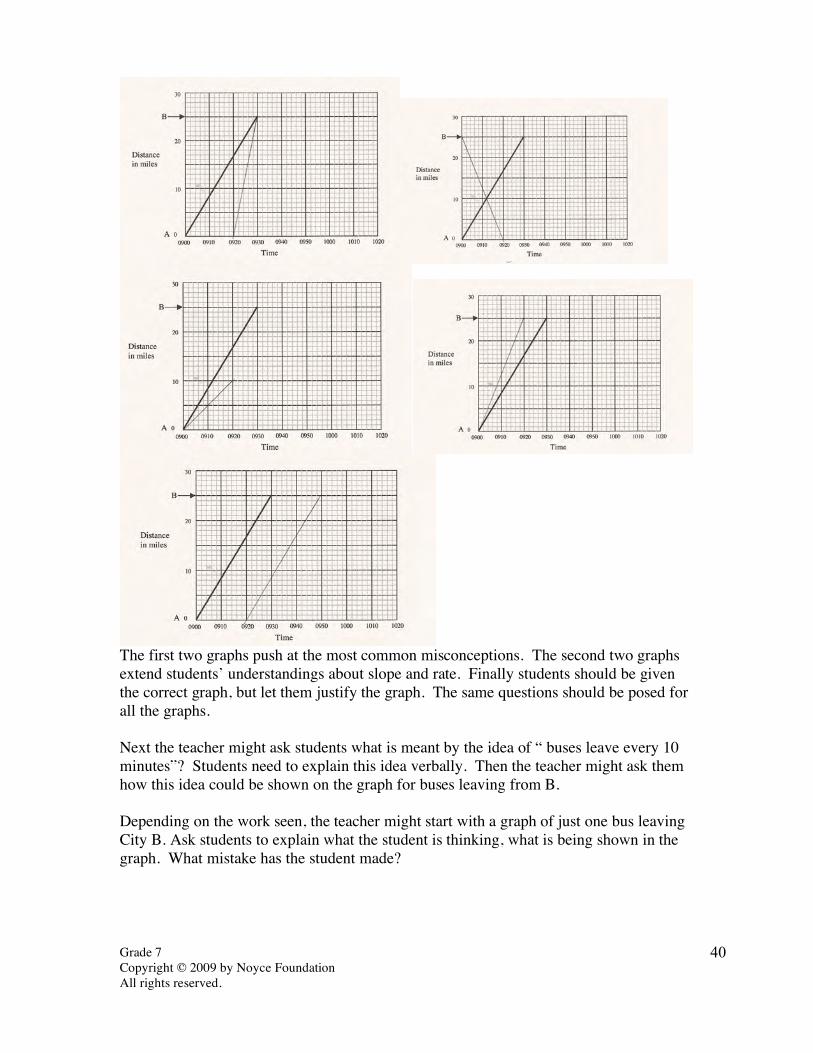
The first two graphs push at the most common misconceptions. The second two graphs extend students’ understandings about slope and rate. Finally students should be given the correct graph, but let them justify the graph. The same questions should be posed for all the graphs. Next the teacher might ask students what is meant by the idea of “ buses leave every 10 minutes”? Students need to explain this idea verbally. Then the teacher might ask them how this idea could be shown on the graph for buses leaving from B. Depending on the work seen, the teacher might start with a graph of just one bus leaving City B. Ask students to explain what the student is thinking, what is being shown in the graph. What mistake has the student made?
Grade 7 Copyright © 2009 by Noyce Foundation All rights reserved.
41
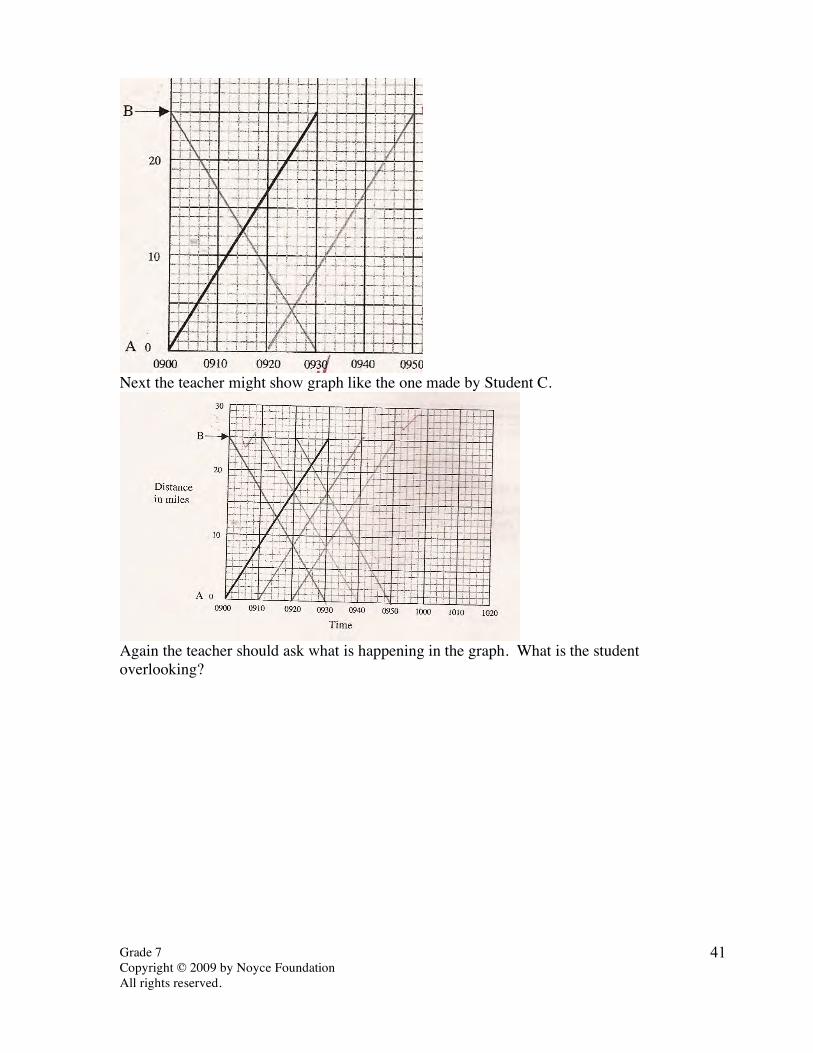
Next the teacher might show graph like the one made by Student C.
Again the teacher should ask what is happening in the graph. What is the student overlooking?
Grade 7 Copyright © 2009 by Noyce Foundation All rights reserved.
42
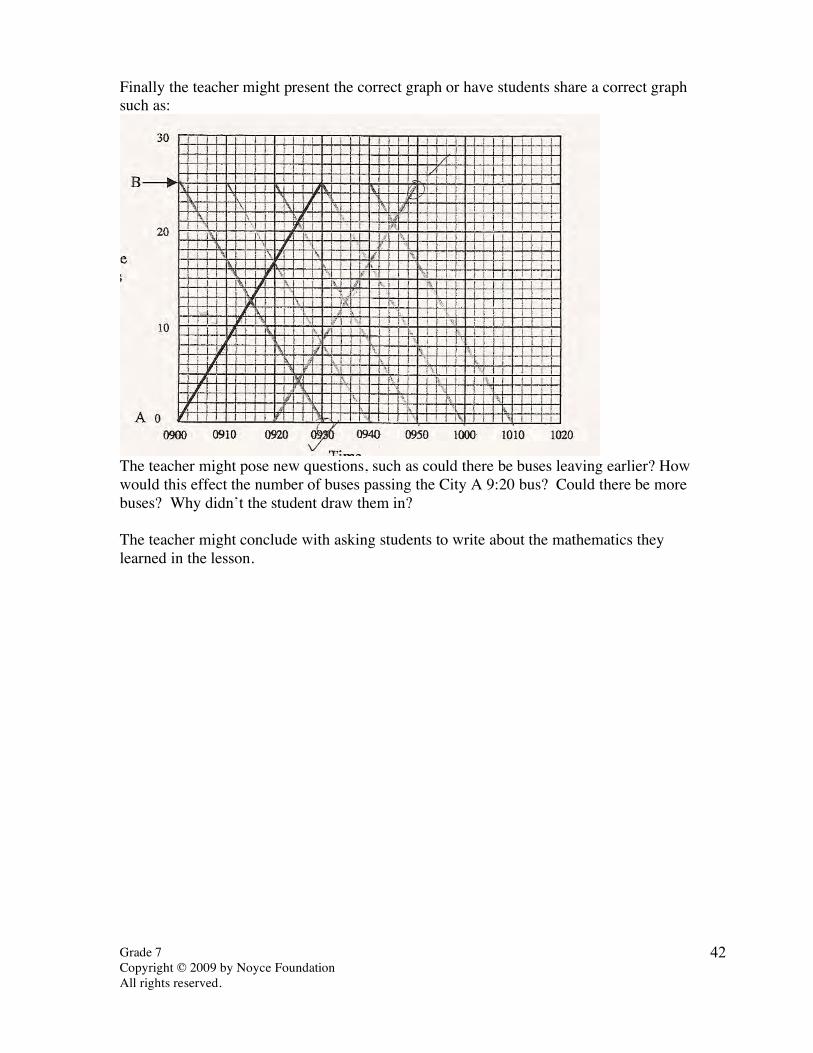
Finally the teacher might present the correct graph or have students share a correct graph such as:
The teacher might pose new questions, such as could there be buses leaving earlier? How would this effect the number of buses passing the City A 9:20 bus? Could there be more buses? Why didn’t the student draw them in? The teacher might conclude with asking students to write about the mathematics they learned in the lesson.

Grade 7 Sequoia Copyright © 2009 by Mathematics Assessment Resource Service. All rights reserved.
43
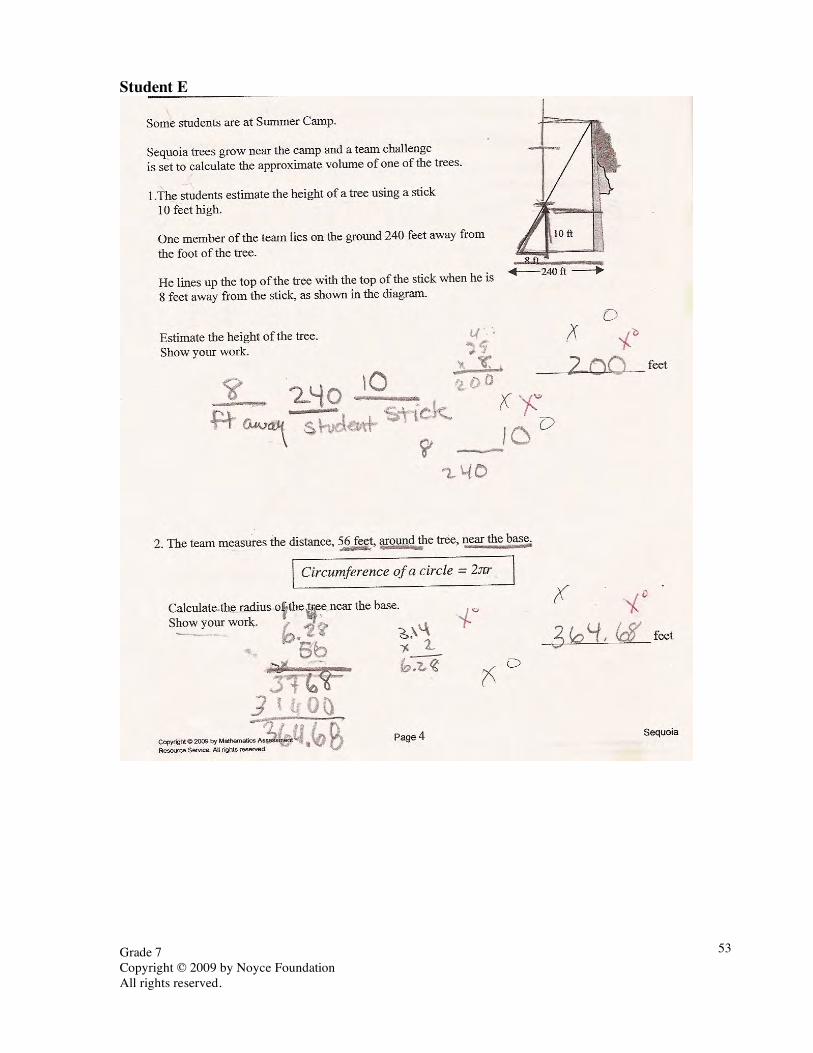
Sequoia This problem gives you the chance to: • use circumference of a circle • use volume of a cone and cylinder Some students are at Summer Camp. Sequoia trees grow near the camp and a team challenge is set to calculate the approximate volume of one of the trees. 1.The students estimate the height of a tree using a stick 10 feet high. One member of the team lies on the ground 240 feet away from the foot of the tree. He lines up the top of the tree with the top of the stick when he is 8 feet away from the stick, as shown in the diagram. Estimate the height of the tree. Show your work.
_________________ feet
2. The team measures the distance, 56 feet, around the tree, near the base.
Calculate the radius of the tree near the base. Show your work.
_________________ feet
8 ft 240 ft
10 ft
Circumference of a circle = 2πr
Grade 7 Sequoia Copyright © 2009 by Mathematics Assessment Resource Service. All rights reserved.
44
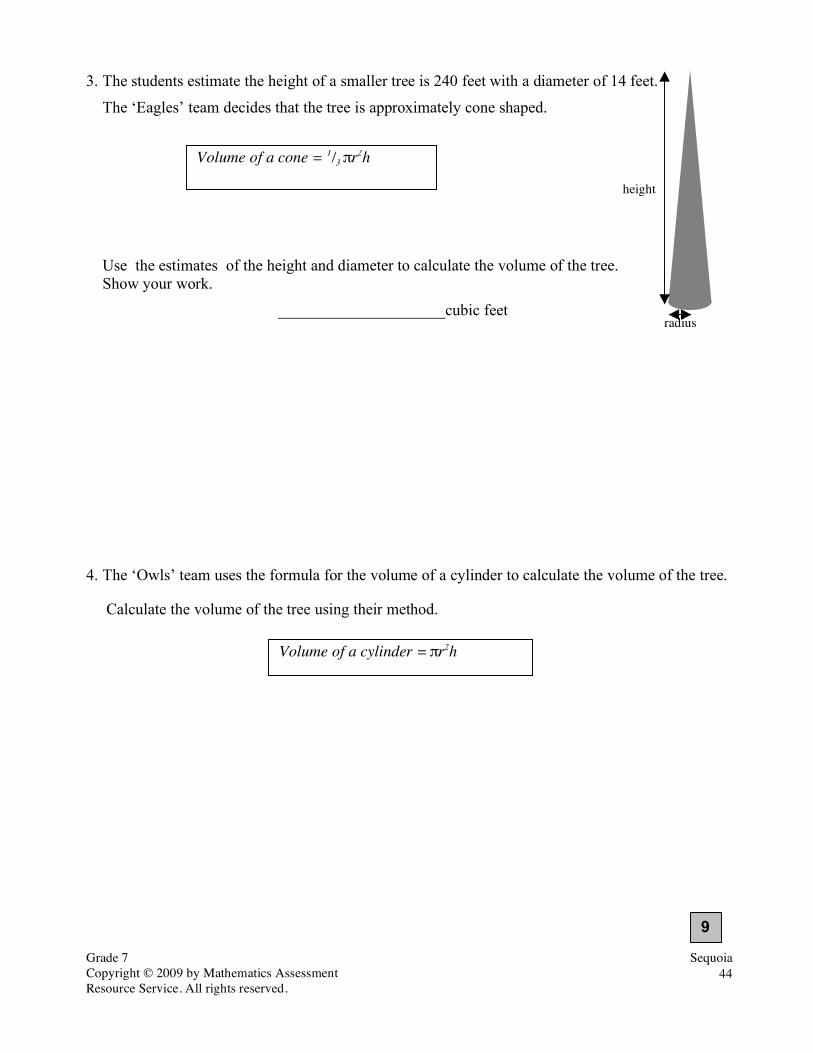
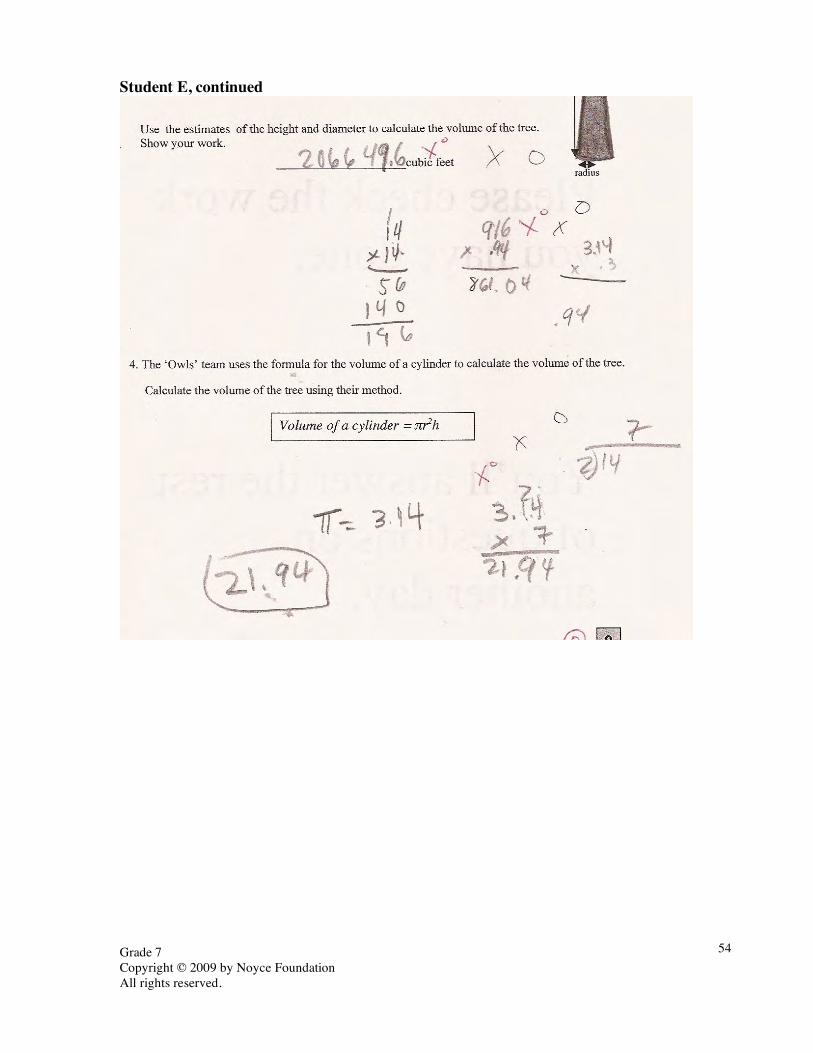
3. The students estimate the height of a smaller tree is 240 feet with a diameter of 14 feet.
The ‘Eagles’ team decides that the tree is approximately cone shaped.
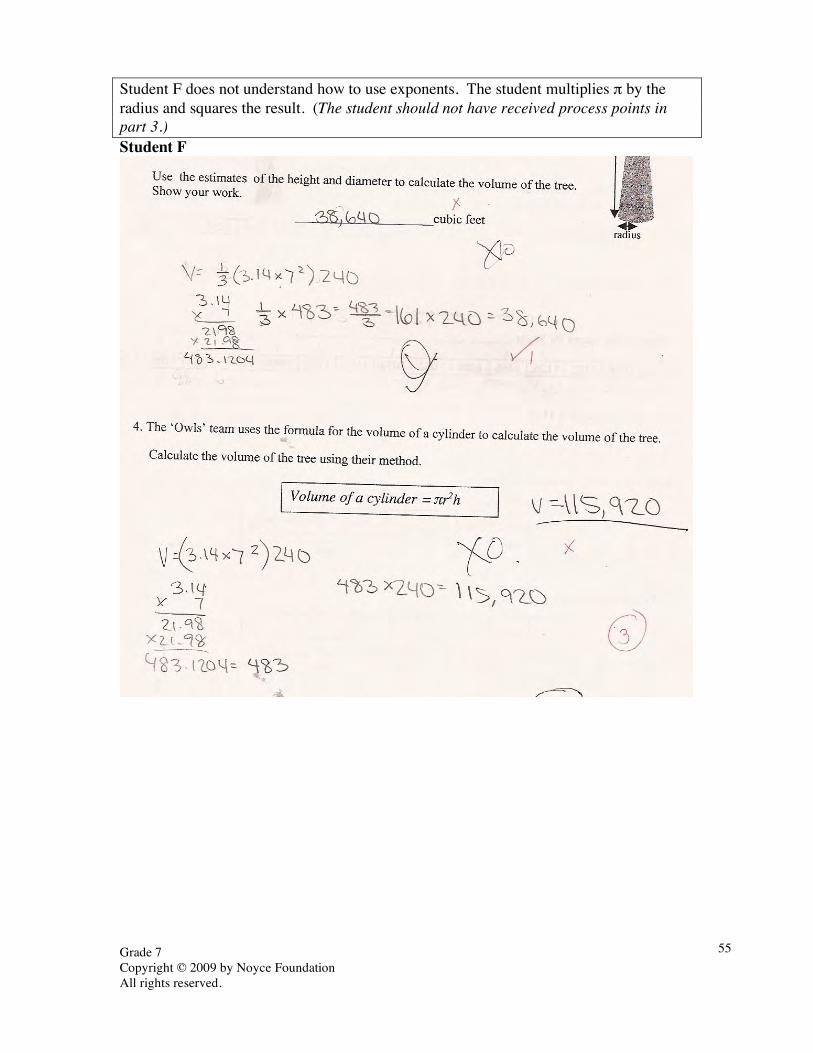
Use the estimates of the height and diameter to calculate the volume of the tree. Show your work.
_____________________cubic feet 4. The ‘Owls’ team uses the formula for the volume of a cylinder to calculate the volume of the tree.
Calculate the volume of the tree using their method.
height
radius
Volume of a cone = 1/3 πr2h
Volume of a cylinder = πr2h
9

Grade 7 Copyright © 2009 by Mathematics Assessment Resource Service. All rights reserved.
45
Sequoia Rubric The core elements of performance required by this task are: • circumference of a circle • volume of a cone and cylinder Based on these, credit for specific aspects of performance should be assigned as follows
points
section points
1. Gives correct answer: 300 Shows correct work such as: 10/8 = h/240 Partial credit: some correct work
1 2
(1)
3 2. Gives correct answer: 8.9 Accept 8.8 – 9.0
Shows correct work such as: 56 = 2πr r = 56/2π
Partial credit: some correct work
1 2
(1)
3
3. Gives correct answer: 12315 or 3920π Accept 12,000 – 12,400 or 3,900π Shows correct work such as: 1/3 x π x 72 x 240
1 1
2
4. Gives correct answer: 36945 or 11760π Accept 36, 000 – 37,000 1 1
Total Points 9
Grade 7 Copyright © 2009 by Noyce Foundation All rights reserved.
46
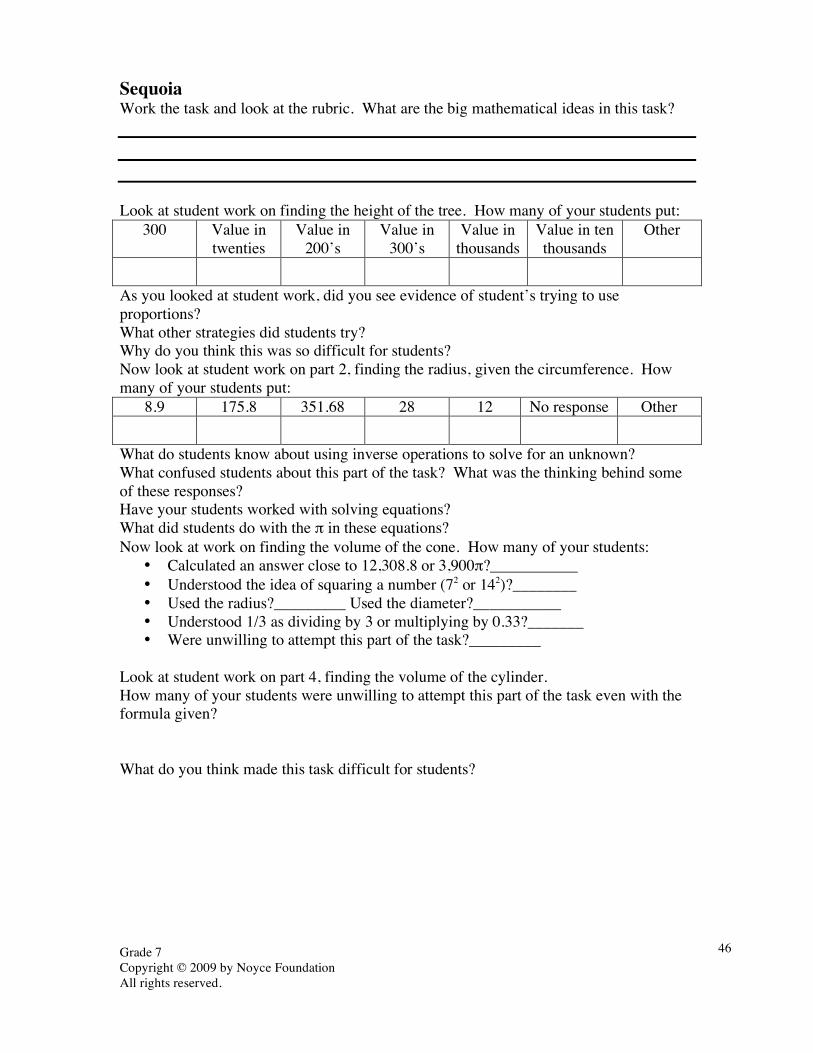
Sequoia Work the task and look at the rubric. What are the big mathematical ideas in this task? Look at student work on finding the height of the tree. How many of your students put:
300 Value in twenties
Value in 200’s
Value in 300’s
Value in thousands
Value in ten thousands
Other
As you looked at student work, did you see evidence of student’s trying to use proportions? What other strategies did students try? Why do you think this was so difficult for students? Now look at student work on part 2, finding the radius, given the circumference. How many of your students put:
8.9 175.8 351.68 28 12 No response Other
What do students know about using inverse operations to solve for an unknown? What confused students about this part of the task? What was the thinking behind some of these responses? Have your students worked with solving equations? What did students do with the π in these equations? Now look at work on finding the volume of the cone. How many of your students:
• Calculated an answer close to 12,308.8 or 3,900π?___________ • Understood the idea of squaring a number (72 or 142)?________ • Used the radius?_________ Used the diameter?___________ • Understood 1/3 as dividing by 3 or multiplying by 0.33?_______ • Were unwilling to attempt this part of the task?_________
Look at student work on part 4, finding the volume of the cylinder. How many of your students were unwilling to attempt this part of the task even with the formula given? What do you think made this task difficult for students?

Grade 7 Copyright © 2009 by Noyce Foundation All rights reserved.
47
Looking at Student Work on Sequoia This task was very difficult for students. Half the students in the sample scored no points. Student A used proportional reasoning and scale factor to the find the height of the tree in part 1. Student A continues to chunk out the computations, step by step, through out the rest of the problem. Looking at part 3, first 1/3 = 0.33. Second multiply by π. However the student is able to get through the entire task correctly. Student A

Grade 7 Copyright © 2009 by Noyce Foundation All rights reserved.
48
Student A, continued
Grade 7 Copyright © 2009 by Noyce Foundation All rights reserved.
49
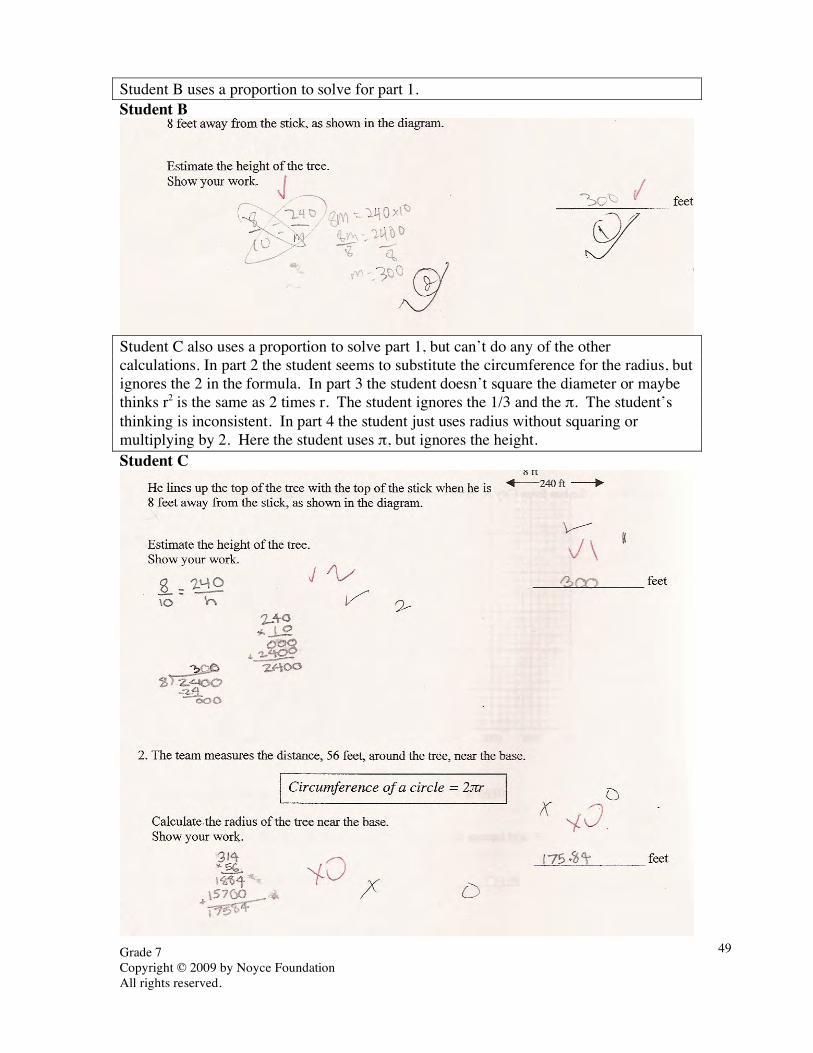
Student B uses a proportion to solve for part 1. Student B
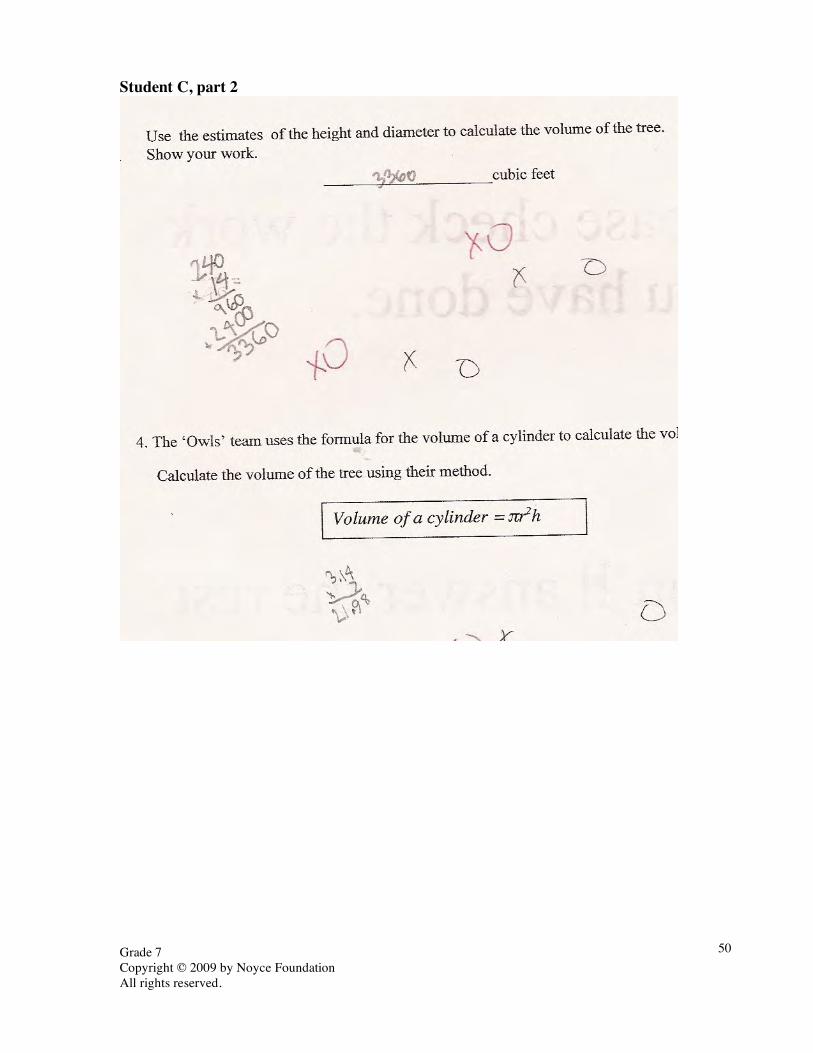
Student C also uses a proportion to solve part 1, but can’t do any of the other calculations. In part 2 the student seems to substitute the circumference for the radius, but ignores the 2 in the formula. In part 3 the student doesn’t square the diameter or maybe thinks r2 is the same as 2 times r. The student ignores the 1/3 and the π. The student’s thinking is inconsistent. In part 4 the student just uses radius without squaring or multiplying by 2. Here the student uses π, but ignores the height. Student C
Grade 7 Copyright © 2009 by Noyce Foundation All rights reserved.
50
Student C, part 2

Grade 7 Copyright © 2009 by Noyce Foundation All rights reserved.
51
Student D attempts to use the area formula to find the height of the tree, but has multiplied by the 10 twice. In part 2 the student seems to know that solving the equation is about using inverse operations, but the student ignores the π. The student is able to use the formulas to solve part 3 and 4. Student D

Grade 7 Copyright © 2009 by Noyce Foundation All rights reserved.
52
Student D, continued
Student E tries to use visual thinking to find the height of the tree. The student doesn’t understand the concept of “not drawn to scale”, an important underlying assumption about mathematical models. In part 2 the student substitutes the circumference for the radius. In part 3 the student squares the diameter instead of the radius and doesn’t use the height. In part 4 the student is able to identify the radius, but doesn’t square it. Again the student ignores the height. How do we help students develop longer chains of reasoning for working through complex formulas? How do we help students, such as E, become more solid in their geometrical thinking?
Grade 7 Copyright © 2009 by Noyce Foundation All rights reserved.
53
Student E
Grade 7 Copyright © 2009 by Noyce Foundation All rights reserved.
54
Student E, continued
Grade 7 Copyright © 2009 by Noyce Foundation All rights reserved.
55
Student F does not understand how to use exponents. The student multiplies π by the radius and squares the result. (The student should not have received process points in part 3.) Student F

Grade 7 Copyright © 2009 by Noyce Foundation All rights reserved.
56
A good assessment allows skills and misconceptions from earlier grade levels to surface naturally in the solution process. Student G shows a misunderstanding about the decimal value of 1/3 in part 3. Student G
Student H makes an assumption that the radius is 2 and uses this value consistently for all parts of the task. What might the student be thinking? Student H

Grade 7 Copyright © 2009 by Noyce Foundation All rights reserved.
57
Student H, continued

Grade 7 Copyright © 2009 by Noyce Foundation All rights reserved.
58
7th Grade Task 3 Sequoia Student Task Calculate circumference of a circle. Calculate volume of a cone and
cylinder. Core Idea 4 Geometry and Measurement
Analyze characteristics and properties of two- and three-dimensional geometric shapes; develop mathematical arguments about geometric relationships; apply congruence and similarity to analyze mathematical situations; and apply appropriate techniques, tools and formulas to determine measurements.
Mathematics of the task:
• Using proportional reasoning or scale factor to find the height of the tree • Solving an equation for a different variable • Using exponents • Understanding geometric concepts: circumference, diameter, radius and their
relationships to each other • Substituting values into a formula and using the all the values to carry out the
computation Based on teacher observation this is what seventh graders know and are able to do:
• Understanding that the diameter is equal to 2r • Substituting numbers into a formula • Using 3.14 as a value for π • Rounding decimals
Areas of difficulty for seventh graders:
• Don’t understand when to use diameter and when to use radius • Don’t understand the proportionality of similar triangles, so they tried to use
visual thinking, Pythagorean theorem, or area to find the missing side • Interpreting the geometric vocabulary, confusing circumference and radius or not
understanding the h = height in the formula • Working with exponents

Grade 7 Copyright © 2009 by Noyce Foundation All rights reserved.
59
The maximum score available for this task is 9 points. The minimum score needed for a level 3 response, meeting standards, is 4 points. Less than half the students, 46%, could substitute numbers in a given formula for the volume of a cylinder and compute the answer. To be successful on the formula students needed to convert a diameter to a radius, work with exponents, and know the value of π. Some students, about 36%, could also calculate the volume of a cone. A few students, 24%, could also solve an equation for circumference for the radius and calculate the value of the radius. About 5% of the students could meet all the demands of the task including using proportional reasoning or scale to find the height of the tree. Almost 54% of the students scored no points on this task. 97% of the students in the sample with this score attempted the task.

Grade 7 Copyright © 2009 by Noyce Foundation All rights reserved.
60
Sequoia Points Understandings Misunderstandings
0 97% of the students with this score attempted the task.
They could not use a formula for finding the volume of a cylinder. 18% did not attempt this part of the task. Many students used the diameter instead of the radius in the formula. Students did not know how to calculate with exponents.
1 Students could calculate the volume of a cylinder given the formula and the diameter.
Students had difficulty calculating the volume of a cone. 10% of the students did not attempt this part of the task. Many students used the diameter instead of the radius in the formula. Students did not know how to calculate with exponents. Some students did not know how to calculate with 1/3. Other students only carried out parts of the calculations. They were not systematic about the steps.
3 Students could calculate the volume of a cylinder and a cone given the formulas and the diameter.
Students struggled with solving an equation for circumference for the radius of the tree. 13% did not attempt this part of the task. 8% substituted the circumference for the radius. 7% just divided the circumference by 2 and ignored the effect of π. Other common answers were 175.8 and 112.
4 Students could solve for the radius given the circumference and calculate volumes of a cylinder and cone with one calculation error.
Students did not understand proportionality in finding the height of the tree. Answers ranged from 3 to 24,200. The most common answers were 30, 320, 1200, 24, and 25.
8 Students could solve for the radius given the circumference and calculate volumes of a cylinder and cone. Students could use scale factor or proportional reasoning to find the height of the tree.

Grade 7 Copyright © 2009 by Noyce Foundation All rights reserved.
61
Implications for Instruction Students need more work with using formulas and exponents. Students had difficulty understanding the difference between squaring a number and multiplying the number by two. Students did not know how to calculate 1/3 of something. Students might need more work with number talks to help develop their reasoning with squaring, square roots, and finding a fraction of a number. Students also had difficulty solving a formula for a different variable. Students should develop some basic understandings about operations and their inverses and the process of doing and undoing to help them solve equations. These big mathematical ideas can be developed before students reach a formal algebra course. Students need more work with proportional reasoning in a context. Many students did not see similar triangles as a proportional situation or did not understand the logic of setting up a proportion. Some students at this level did not realize that the radius is half the diameter and struggled with how to square a number. Other students had trouble with decimal place value when multiplying. Ideas for Action Research To help students develop intuition about solving equations, problems with balance scales help students to reason out some of the rules and properties for themselves. Consider some of the problems taken from SMP Interact, a middle school series published by Cambridge in the UK.

Grade 7 Copyright © 2009 by Noyce Foundation All rights reserved.
62
What types of algebraic principles does a student need to understand to solve the problems? How does this help push thinking about operations? Now consider problems, such as those found in Fostering Algebraic Thinking by Mark Driscoll. “Doing-Undoing. Effective algebraic thinking sometimes involves reversibility (i.e., being able to undo mathematical processes as well as do them). In effect, it is the capacity not only to use a process to get to a goal, but also to understand the process well enough to work backward from the answer to the starting point.”
Golden Apples A prince picked a basketful of golden apples in the enchanted orchard. On his way home, he was stopped by a troll who guarded the orchard. The troll demanded the payment of one-half of the apples plus two more. The prince gave him the apples and set off again. A little further on, he was stopped by a second troll guard. This troll demanded payment of one-half of the apples the prince now had plus two more. The prince paid him and set off again. Just before leaving the enchanted orchard, a third troll stopped him and demanded one-half of his remaining apples plus two more. The prince paid him and sadly went home. He had only two golden apples left. How many apples had he picked? The problem can be extended by changing the amount of apples remaining. How does this challenge students to think about the process of working backwards? What questions might you pose during the class discussion to help students articulate ideas about inverse operations? Solving equations? What might be some other problems that would help push students thinking?

Grade 7 Archery Copyright © 2009 by Mathematics Assessment Resource Service. All rights reserved.
63
Archery This problem gives you the chance to: • draw a box plot • compare sets of data Guy and Sagar both enjoy archery and hope to be picked for their college team. There have been 15 matches in college this year. These are the scores for Guy. 1192 1258 1038 1208 956 1052 1262 994 1128 1066 1286 1174 1050 926 1240 Guy’s mean score is 1122. These are the scores for Sagar. 1134 1098 1182 1126 1066 1204 1052 1072 1156 1102 1088 1220 1168 1106 1164 Sagar’s mean score is 1129.
Here is a box plot for Guy’s scores.
1. Draw a box plot for Sagar’s scores.
900 1000 1100 1200 1300
900 1000 1100 1200 1300
Grade 7 Archery Copyright © 2009 by Mathematics Assessment Resource Service. All rights reserved.
64
2. Explain the main points on your box plot.
_____________________________________________________________________________
_____________________________________________________________________________
_____________________________________________________________________________
3. Who is the more consistent archer? Explain how you know. ____________________
_____________________________________________________________________________
_____________________________________________________________________________
_____________________________________________________________________________
_____________________________________________________________________________ 4. If you were picking the college team would you choose Guy or Sagar? Explain why you would make this choice. ____________________
_____________________________________________________________________________
_____________________________________________________________________________
_____________________________________________________________________________
_____________________________________________________________________________
9
Grade 7 65 Copyright © 2009 by Mathematics Assessment Resource Service. All rights reserved.
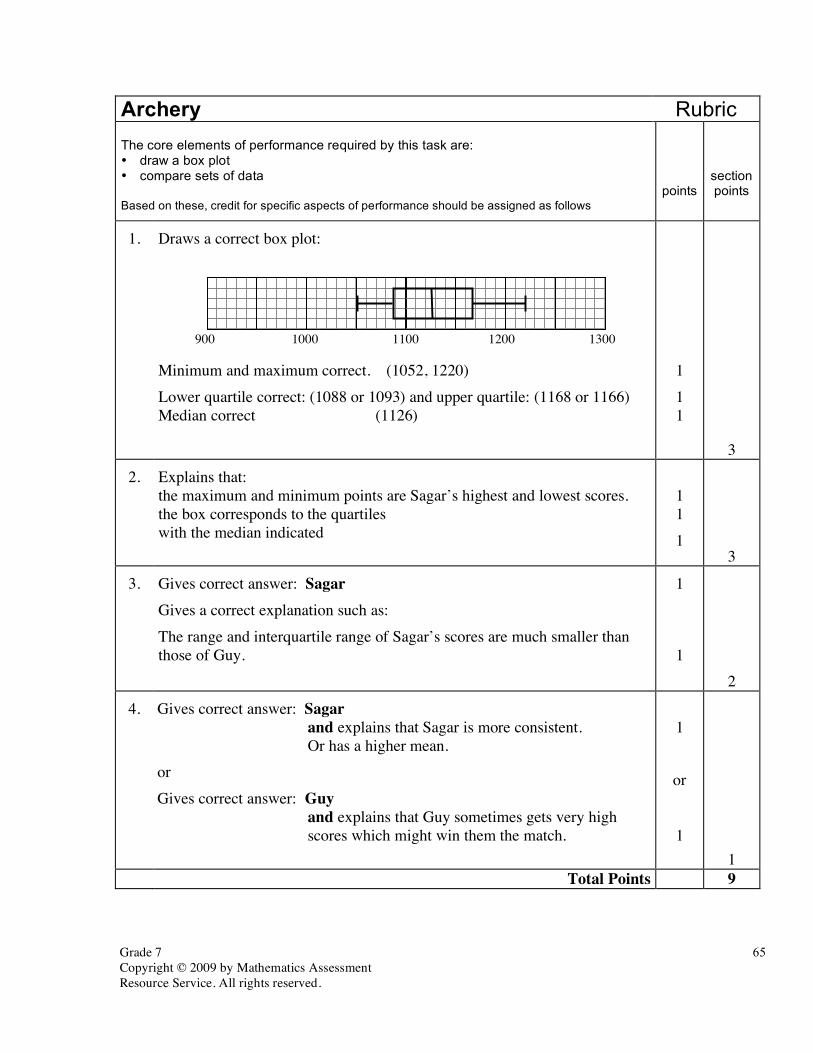
Archery Rubric The core elements of performance required by this task are: • draw a box plot draw a box plot • compare sets of data Based on these, credit for specific aspects of performance should be assigned as follows
points
section points
1. Draws a correct box plot: Minimum and maximum correct. (1052, 1220) Lower quartile correct: (1088 or 1093) and upper quartile: (1168 or 1166) Median correct (1126)
1 1 1
3
2. Explains that: the maximum and minimum points are Sagar’s highest and lowest scores. the box corresponds to the quartiles with the median indicated
1 1 1
3
3. Gives correct answer: Sagar Gives a correct explanation such as: The range and interquartile range of Sagar’s scores are much smaller than those of Guy.
1 1
2
4. Gives correct answer: Sagar and explains that Sagar is more consistent. Or has a higher mean.
or Gives correct answer: Guy
and explains that Guy sometimes gets very high scores which might win them the match.
1
or 1
1
Total Points 9
900 1000 1100 1200 1300

Grade 7 Copyright © 2009 by Noyce Foundation All rights reserved.
66
Archery Work the task and look at the rubric. What are the big ideas about data and measures of center that a student needs to understand to be successful on this task? ______________ Look at student work on part 1, making a box plot and refer to part 2 for supporting evidence.
• Do you see evidence that students ordered the data before making the graph? • Do you see evidence that students found and could plot the correct low and high
scores?___________ • Were errors on high and low scores attributable to:
o Problems with reading scale?______ o Not understanding the connection between high and low to the structure of
the box plot?______ o Choosing incorrect values?_________
• How many students could identify and plot the median?_________ • How many students used the mean as the midline on the graph?_______
How much experience do your students have with making and reading box and whisker graphs? Why are these useful for making sense of the data? Now look at student work on part 3, which archer is most consistent. How many of your students thought that Sagar was most consistent because:
• He had the lowest range?_______ • He had the highest or best scores?_______ • He had a higher mean?___________
How many of your students picked Guy because: • His scores are closer? _______ • His box plot is larger? _______ • Other? _______
Now look at work on part 4, who should the team pick. How many of your students:
• Picked Sagar because he is most consistent?________ • Picked Sagar because he will get an okay score?________ • Picked Sagar because he has a higher mean?________ • Picked Guy because he had higher scores?__________ • Picked Guy because he is more consistent?_________ • Other?
What are the most important ideas about data that your students need clarified? What might be your next steps?
Grade 7 Copyright © 2009 by Noyce Foundation All rights reserved.
67
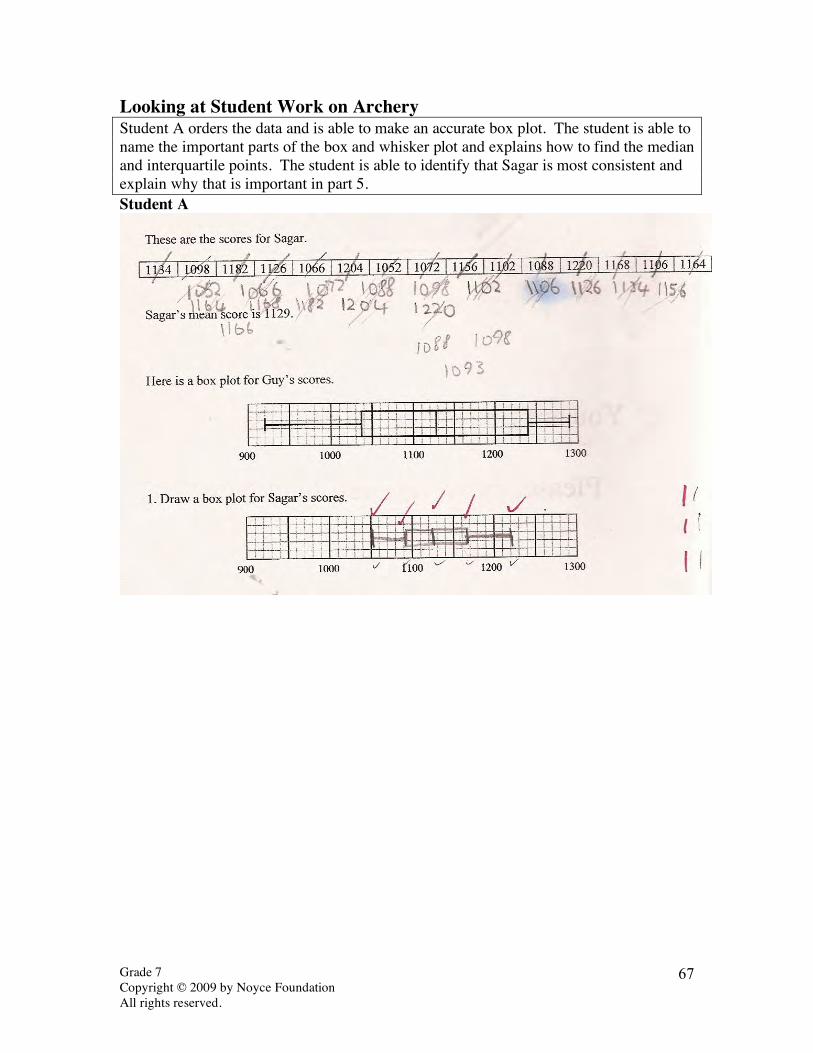
Looking at Student Work on Archery Student A orders the data and is able to make an accurate box plot. The student is able to name the important parts of the box and whisker plot and explains how to find the median and interquartile points. The student is able to identify that Sagar is most consistent and explain why that is important in part 5. Student A

Grade 7 Copyright © 2009 by Noyce Foundation All rights reserved.
68
Student A, part 2
Student B is able to order the data and find the median. The student is unable to use this information to accurately plot the points on the graph. The student does not understand the scale and the “between spaces” on the graph. Notice that all the points fall on the grid lines. Student B gives a legitimate reason for picking Guy over Sagar.

Grade 7 Copyright © 2009 by Noyce Foundation All rights reserved.
69
Student B
Grade 7 Copyright © 2009 by Noyce Foundation All rights reserved.
70
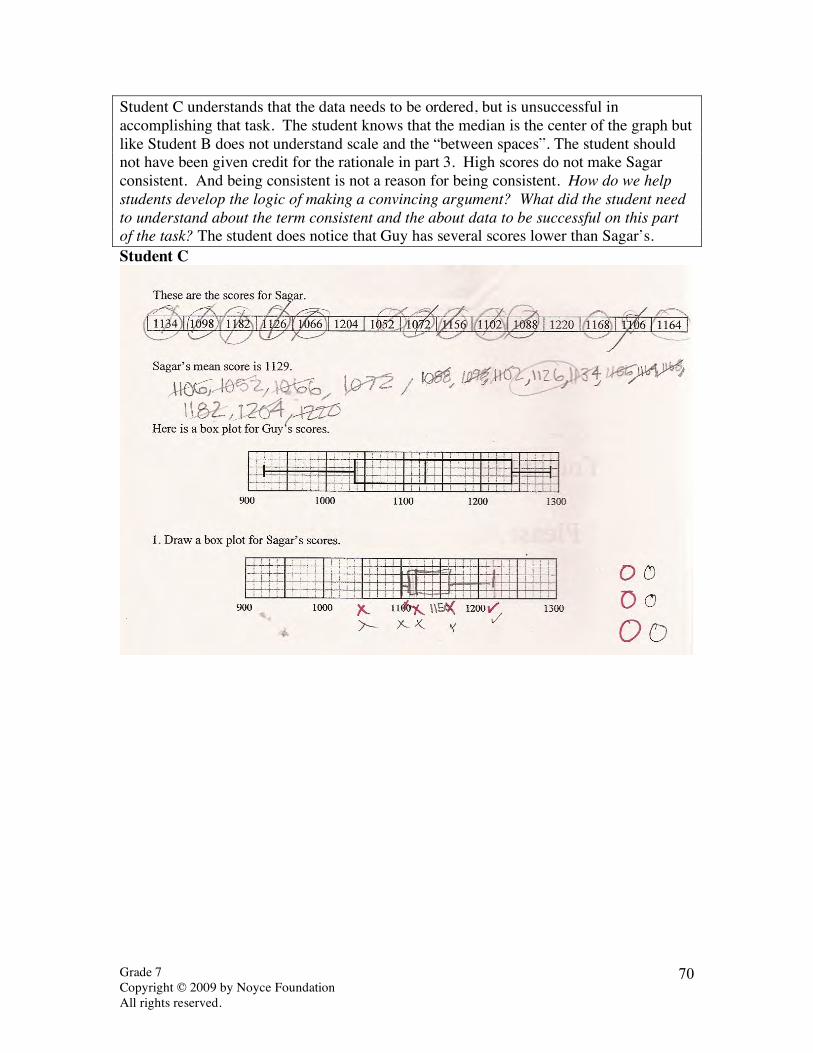
Student C understands that the data needs to be ordered, but is unsuccessful in accomplishing that task. The student knows that the median is the center of the graph but like Student B does not understand scale and the “between spaces”. The student should not have been given credit for the rationale in part 3. High scores do not make Sagar consistent. And being consistent is not a reason for being consistent. How do we help students develop the logic of making a convincing argument? What did the student need to understand about the term consistent and the about data to be successful on this part of the task? The student does notice that Guy has several scores lower than Sagar’s. Student C

Grade 7 Copyright © 2009 by Noyce Foundation All rights reserved.
71
Student C, part 2
Student D does not show evidence of ordering the data. The description in part 2 shows that the student has the idea of high, low and median but has a misconception of the interquartile values. Look at the response to part 3. What experiences does this student need? What question might you pose to get the student to focus more on the meaning of the data?
Grade 7 Copyright © 2009 by Noyce Foundation All rights reserved.
72
Student D
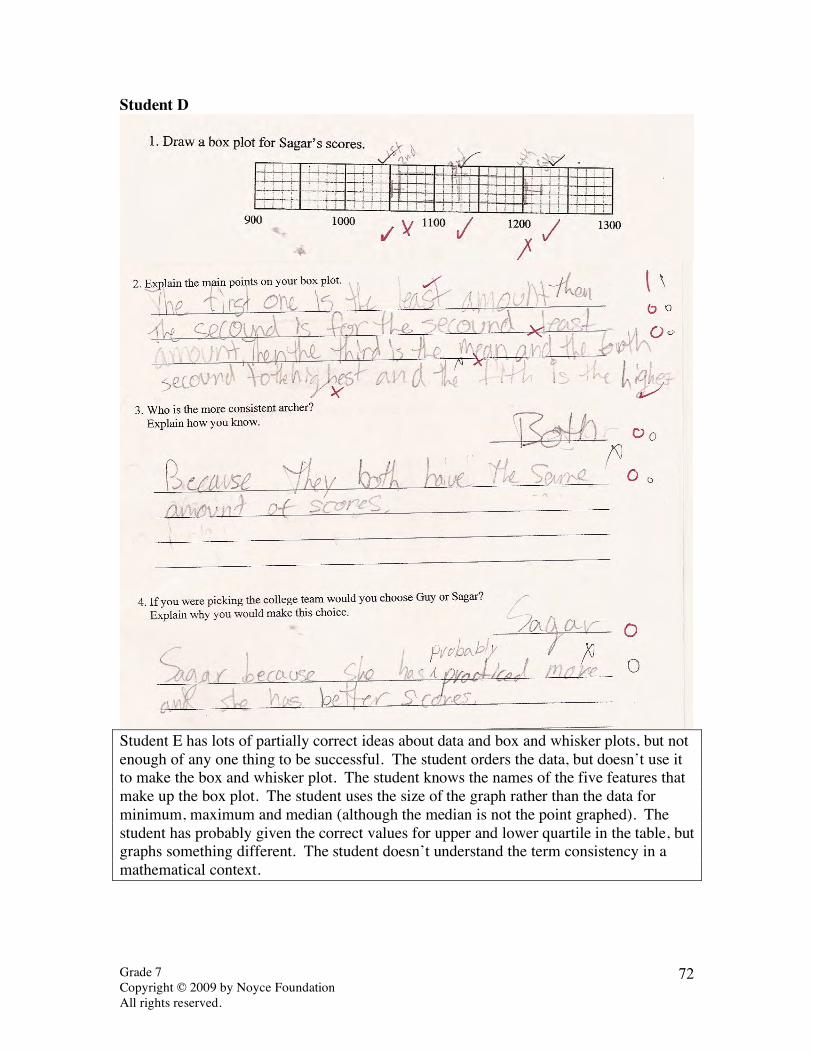
Student E has lots of partially correct ideas about data and box and whisker plots, but not enough of any one thing to be successful. The student orders the data, but doesn’t use it to make the box and whisker plot. The student knows the names of the five features that make up the box plot. The student uses the size of the graph rather than the data for minimum, maximum and median (although the median is not the point graphed). The student has probably given the correct values for upper and lower quartile in the table, but graphs something different. The student doesn’t understand the term consistency in a mathematical context.

Grade 7 Copyright © 2009 by Noyce Foundation All rights reserved.
73
Student E

Grade 7 Copyright © 2009 by Noyce Foundation All rights reserved.
74
7th Grade Task 4 Archery Student Task Draw a box plot and compare sets of data. Core Idea 5 Statistics
Understand statistical methods used to display, analyze, and compare and interpret different data sets.
• Construct the most appropriate graph, including frequency distribution, stem and leaf, and scatterplot, for a given set of data and justify the choice.
• Analyze data, including finding measures of center and spread presented in a frequency distribution.
• Find, use and interpret measures of center and spread, including interquartile range.
Mathematics of this task:
• Understanding definitions and using of measures of center: mean, median, and range and applying them in context
• Making a box and whisker plot from data • Examining different measures of center and determining which is more important
for making a decision Based on teacher observations, this is what seventh graders knew and were able to do:
• Identify the minimum and maximum numbers • Recognize which archer is most consistent and give a supporting reason • Choosing someone to be on the team and give a supporting reason
Areas of difficulty for seventh graders:
• Recognizing a need to order the data • Confusing the midline on the box as mean instead of median • Understanding scale and estimating the between spaces • Graphing a box and whisker plot • Using and interpreting academic language for data
Grade 7 Copyright © 2009 by Noyce Foundation All rights reserved.
75
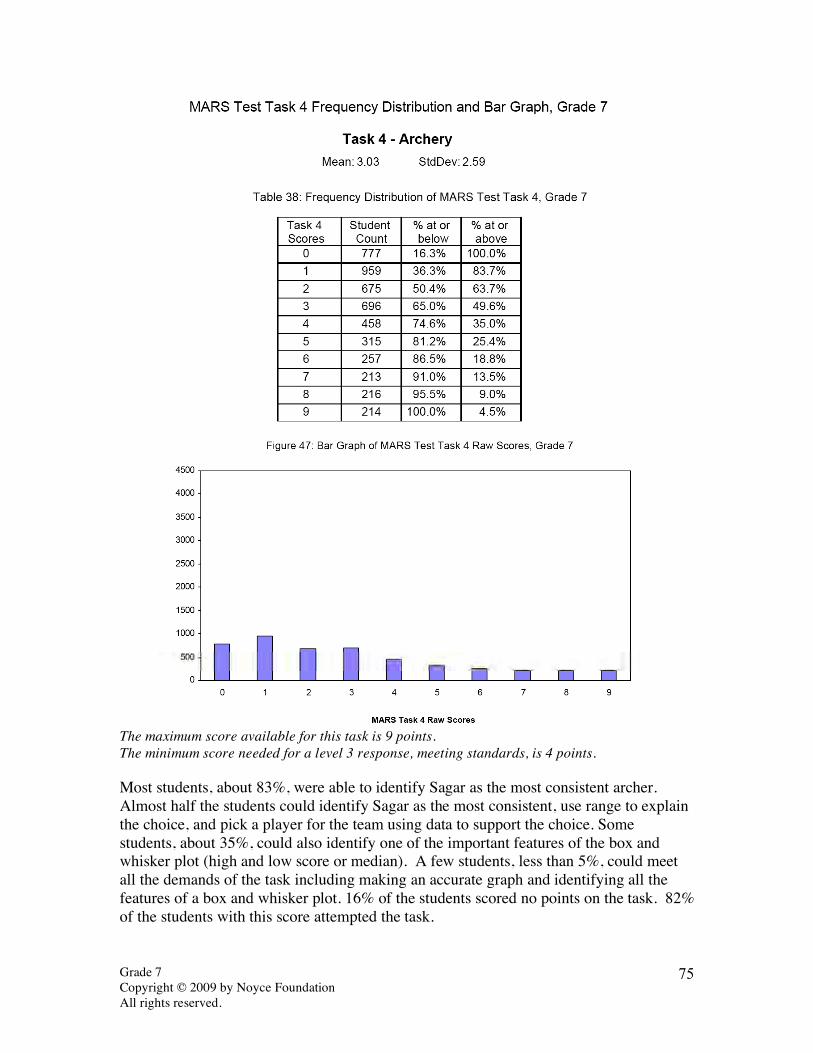
The maximum score available for this task is 9 points. The minimum score needed for a level 3 response, meeting standards, is 4 points. Most students, about 83%, were able to identify Sagar as the most consistent archer. Almost half the students could identify Sagar as the most consistent, use range to explain the choice, and pick a player for the team using data to support the choice. Some students, about 35%, could also identify one of the important features of the box and whisker plot (high and low score or median). A few students, less than 5%, could meet all the demands of the task including making an accurate graph and identifying all the features of a box and whisker plot. 16% of the students scored no points on the task. 82% of the students with this score attempted the task.
Grade 7 Copyright © 2009 by Noyce Foundation All rights reserved.
76
Archery Points Understandings Misunderstandings
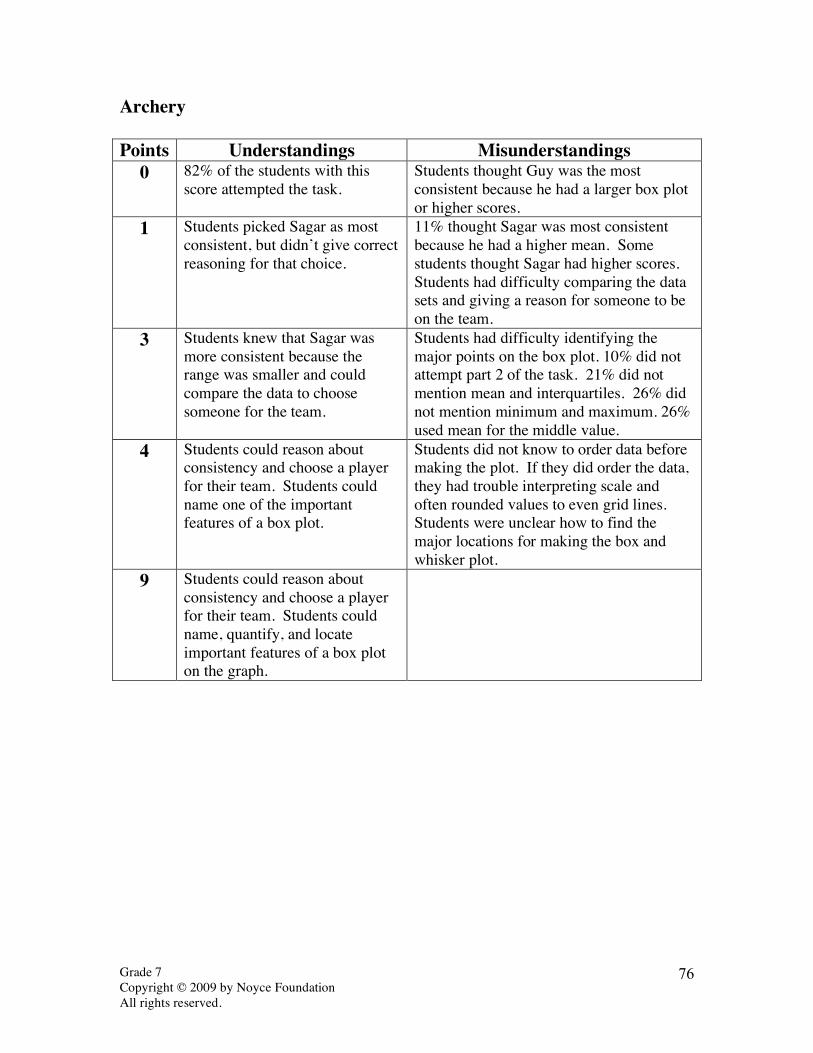
0 82% of the students with this score attempted the task.
Students thought Guy was the most consistent because he had a larger box plot or higher scores.
1 Students picked Sagar as most consistent, but didn’t give correct reasoning for that choice.
11% thought Sagar was most consistent because he had a higher mean. Some students thought Sagar had higher scores. Students had difficulty comparing the data sets and giving a reason for someone to be on the team.
3 Students knew that Sagar was more consistent because the range was smaller and could compare the data to choose someone for the team.
Students had difficulty identifying the major points on the box plot. 10% did not attempt part 2 of the task. 21% did not mention mean and interquartiles. 26% did not mention minimum and maximum. 26% used mean for the middle value.
4 Students could reason about consistency and choose a player for their team. Students could name one of the important features of a box plot.
Students did not know to order data before making the plot. If they did order the data, they had trouble interpreting scale and often rounded values to even grid lines. Students were unclear how to find the major locations for making the box and whisker plot.
9 Students could reason about consistency and choose a player for their team. Students could name, quantify, and locate important features of a box plot on the graph.
Grade 7 Copyright © 2009 by Noyce Foundation All rights reserved.
77
Implications for Instruction Students need to learn about data in context, so they develop an appreciation of how the measures are used. Using data in context allows students to have a purpose for using academic language and helps them develop richer meanings for the terms. They need to understand the purpose of the various measures of center. This helps to clarify procedures. For example, if the student understands the range is looking at how far apart the data points are and has opportunities to see where data is close together or spread apart, then they will be less likely to use the largest value for range or add together the largest and smallest data points. Students are hurt by learning short, quick definitions of terms. Many students have a shortened definition for median as the number in the middle. This ignores the importance of first ordering the numbers. Data should be used to help answer questions or make decisions. Working in a context helps students to see a purpose for looking at the measures of centers to make sense of the question or decision being solved. By working in context, hopefully students will develop a sense that the measures are trying to describe or typify the numbers in the data set. Looking at and comparing similar data helps them realize how the measures describe the similarities and differences in the data sets. These nuances of meaning don’t come into play when just working with strings of numbers. Students need to see how the box and whisker plot gives a picture about the shape of the data. Students should be able to notice how the shapes vary between data sets and discuss how that variation effects decision making. Students at this grade level still need to work on scale. As students move up in the grades, the span between grid lines becomes larger and more difficult to divide up. It is important for students to be exposed to a wide variety of scales and discuss what the un-labeled grid lines represent and what might be the value of the numbers between the grid lines. Ideas for Action Research
Re-engagement – Confronting misconceptions, providing feedback on thinking, going deeper into the mathematics. (See overview at beginning of toolkit). 1. Start with a simple problem to bring all the students along. This allows students to
clarify and articulate the mathematical ideas. 2. Make sense of another person’s strategy. Try on a strategy. Compare strategies. 3. Have students analyze misconceptions and discuss why they don’t make sense. In
the process students can let go of misconceptions and clarify their thinking about the big ideas.
4. Find out how a strategy could be modified to get the right answer. Find the seeds of mathematical thinking in student work.
Grade 7 Copyright © 2009 by Noyce Foundation All rights reserved.
78
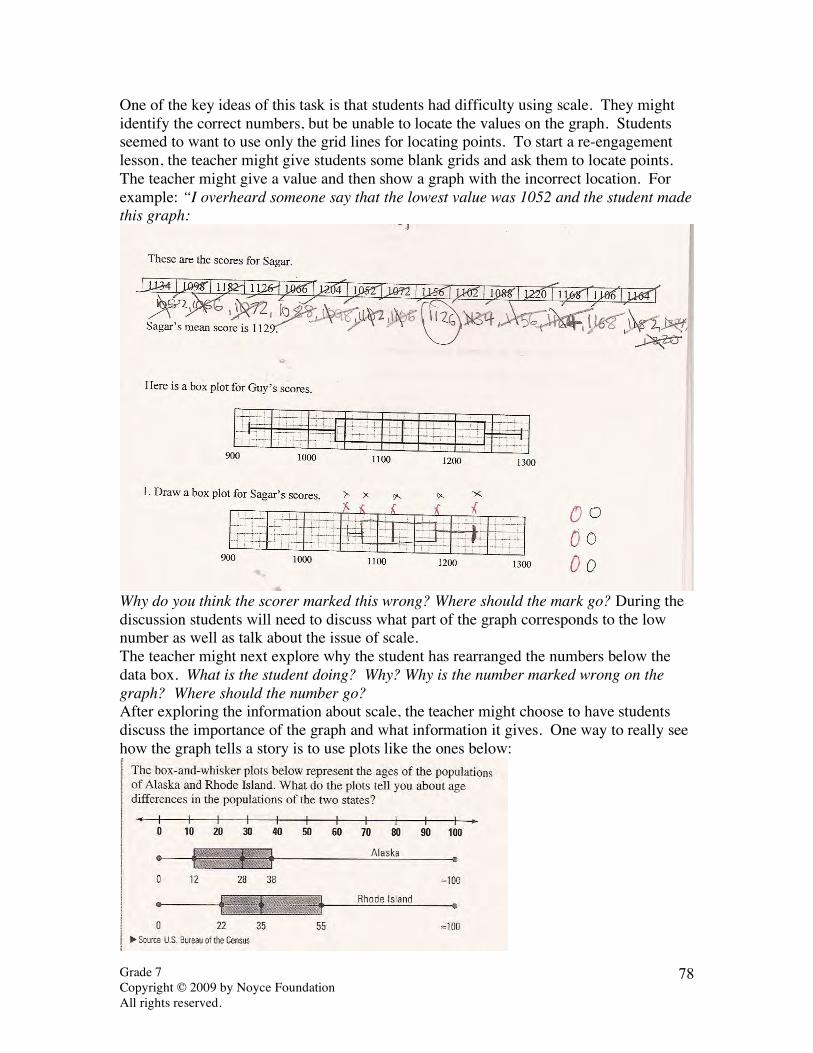
One of the key ideas of this task is that students had difficulty using scale. They might identify the correct numbers, but be unable to locate the values on the graph. Students seemed to want to use only the grid lines for locating points. To start a re-engagement lesson, the teacher might give students some blank grids and ask them to locate points. The teacher might give a value and then show a graph with the incorrect location. For example: “I overheard someone say that the lowest value was 1052 and the student made this graph:
Why do you think the scorer marked this wrong? Where should the mark go? During the discussion students will need to discuss what part of the graph corresponds to the low number as well as talk about the issue of scale. The teacher might next explore why the student has rearranged the numbers below the data box. What is the student doing? Why? Why is the number marked wrong on the graph? Where should the number go? After exploring the information about scale, the teacher might choose to have students discuss the importance of the graph and what information it gives. One way to really see how the graph tells a story is to use plots like the ones below:

Grade 7 Copyright © 2009 by Noyce Foundation All rights reserved.
79
By comparing different data sets for similar information, noticing the distributions gives an immediate idea about differences and their significance. The teacher might present the class with a box and whisker plot and tell the students the number of data points and ask them to come up with possible data points. For example: Below is box and whisker plot of some video game scores. If there were 15 players, what might be their scores? How do you know? Do you think everyone will have the same numbers? How might they be different? How do you think they will be the same?
Graphs taken from Mathematics Concepts and Skills, Course 2 published by McDougal Littell.
Grade 7 Cat Food Copyright © 2009 by Mathematics Assessment Resource Service. All rights reserved.
80
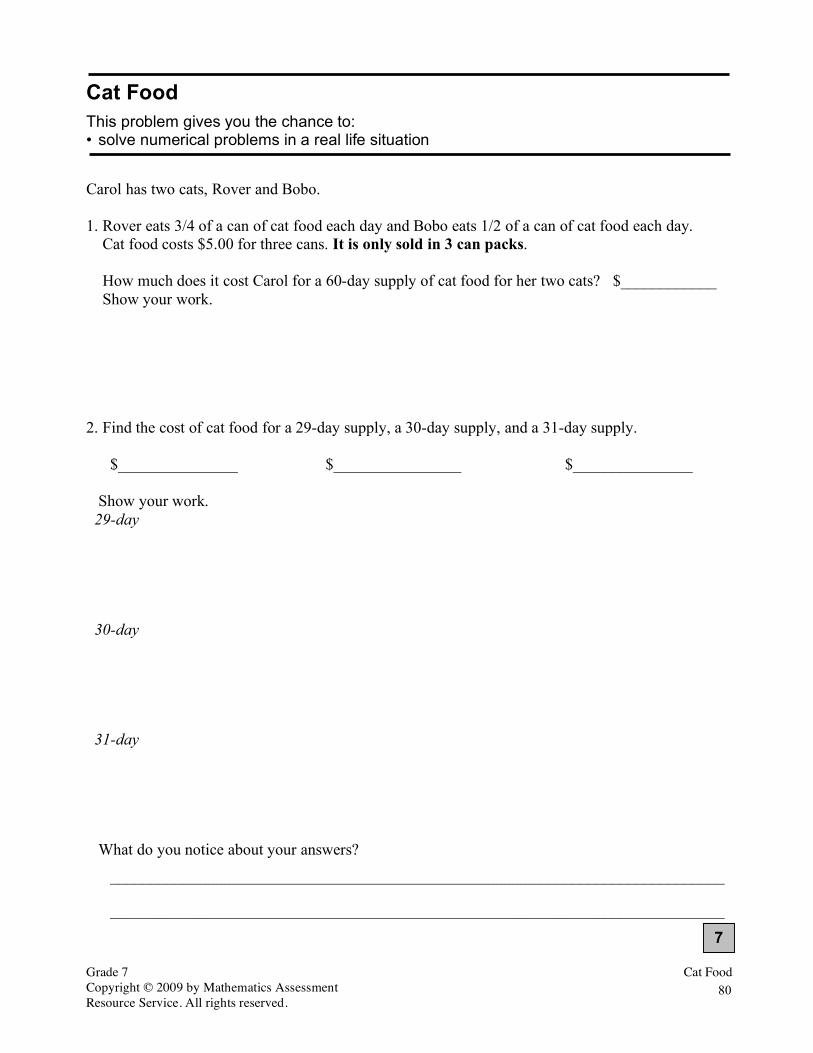
Cat Food This problem gives you the chance to: • solve numerical problems in a real life situation Carol has two cats, Rover and Bobo. 1. Rover eats 3/4 of a can of cat food each day and Bobo eats 1/2 of a can of cat food each day. Cat food costs $5.00 for three cans. It is only sold in 3 can packs. How much does it cost Carol for a 60-day supply of cat food for her two cats? $____________ Show your work. 2. Find the cost of cat food for a 29-day supply, a 30-day supply, and a 31-day supply. $_______________ $________________ $_______________ Show your work. 29-day 30-day 31-day What do you notice about your answers?
_____________________________________________________________________________
_____________________________________________________________________________ 7

Grade 7 Copyright © 2009 by Mathematics Assessment Resource Service. All rights reserved.
81
Cat Food Rubric The core elements of performance required by this task are: • solve numerical problems in a real life situation Based on these, credit for specific aspects of performance should be assigned as follows
points
section points
1. Gives correct answer: $125 Shows work such as: number of cans = 60 60 x 1.25 = 75 cost in $ = 75 ÷ 3 = $25 25 x 5 =
2 1
3
2. Gives correct answers: $65, $65, $65 and Shows work such as: number of cans = 29 29 x 1.25 = 36.25 (round to 39) cost in $ = 39 ÷ 3 = $13 13 x 5 = number of cans = 30 30 x 1.25 = 37.5 (round to 39) cost in $ = 39 ÷ 3 = $13 13 x 5 = number of cans = 31 31 x 1.25 = 38.75 (round to 39) cost in $ = 39 ÷ 3 = $13 13 x 5 = Comments that all these answers are the same because the number of cans needs to be rounded to a number that can be divided by 3. Special case Does not round, Gets answers $60.42, $62.50, $64.58
3 x 1
1
(2)
4
Total Points 7

Grade 7 Copyright © 2009 by Noyce Foundation All rights reserved.
81
Cat Food Work the task and look at the rubric. What are the big mathematical ideas a student needs to understand to be successful on this task? What mathematical habits of mind does a student need to work through the task?______________________________________________________________ Look at part 1 of the task.
$125 $300 $375 $100 $150 Other
Now look more closely at their thinking in part 1. How many of your students could: • Find the correct cost of the cat food?_______ • Find the rate per day for the two cats (1 1/4)?_________ • How many students used some other rate?_______ What are some examples of other rates: • Show understanding of the constraint, only sold in 3 packs, and could choose the correct
operation?___________ • Use labels to keep track of their calculations?_________
After looking at student work, what do you think students understand about rate? What made this task so difficult for students? In part 2, how many of your students put the correct answer: $65 for all 3?_____ How many put $145-$150-$155 for the 3 responses?_______ What might be the student’s reasoning for these answers? What were they not understanding? List a few other incorrect answers. Try to identify the logic behind them as well as the misconceptions. How can you use their understanding to help the students move forward mathematically?

Grade 7 Copyright © 2009 by Noyce Foundation All rights reserved.
82
Looking at Student Work on Cat Food Student A is able to combine the food for both cats to find cans per day. The student can then follow the chain of reasoning to find the cost of the 30 3-packs. The student understands the constraint that food must be purchased in threes and understands how to interpret the remainder. Notice the use of the rounding up indicated by the ≅ in part 2. Student A
Grade 7 Copyright © 2009 by Noyce Foundation All rights reserved.
83
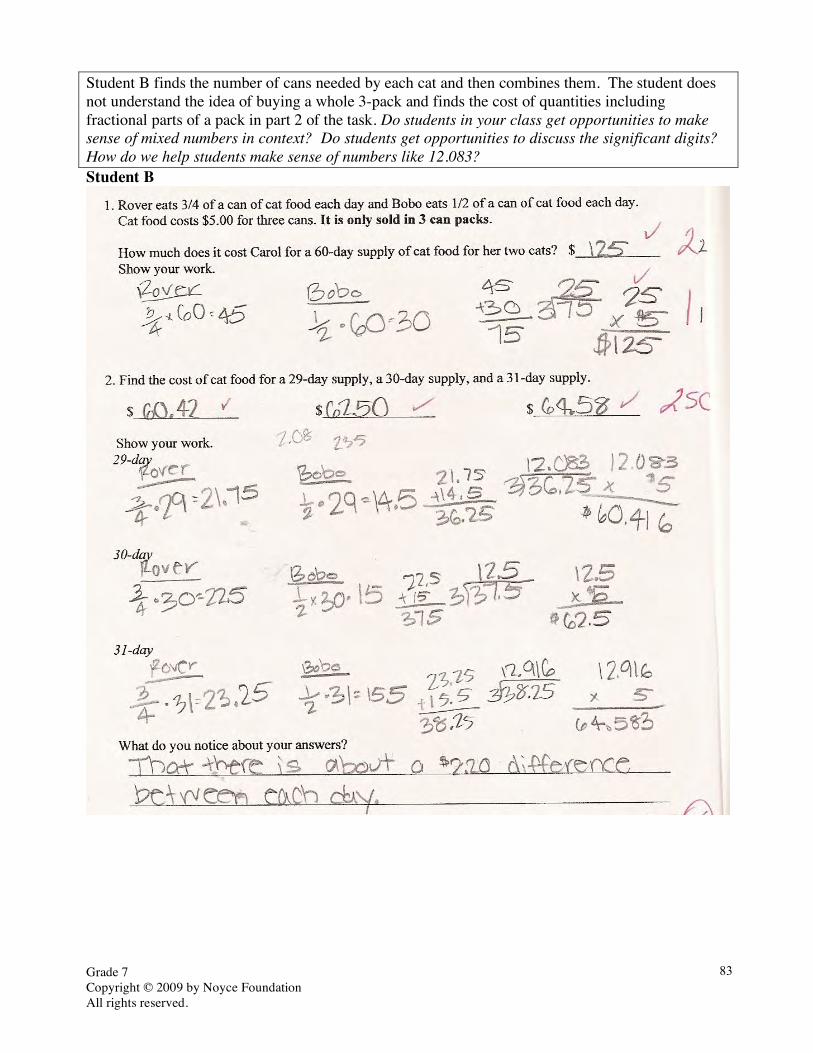
Student B finds the number of cans needed by each cat and then combines them. The student does not understand the idea of buying a whole 3-pack and finds the cost of quantities including fractional parts of a pack in part 2 of the task. Do students in your class get opportunities to make sense of mixed numbers in context? Do students get opportunities to discuss the significant digits? How do we help students make sense of numbers like 12.083? Student B
Grade 7 Copyright © 2009 by Noyce Foundation All rights reserved.
84
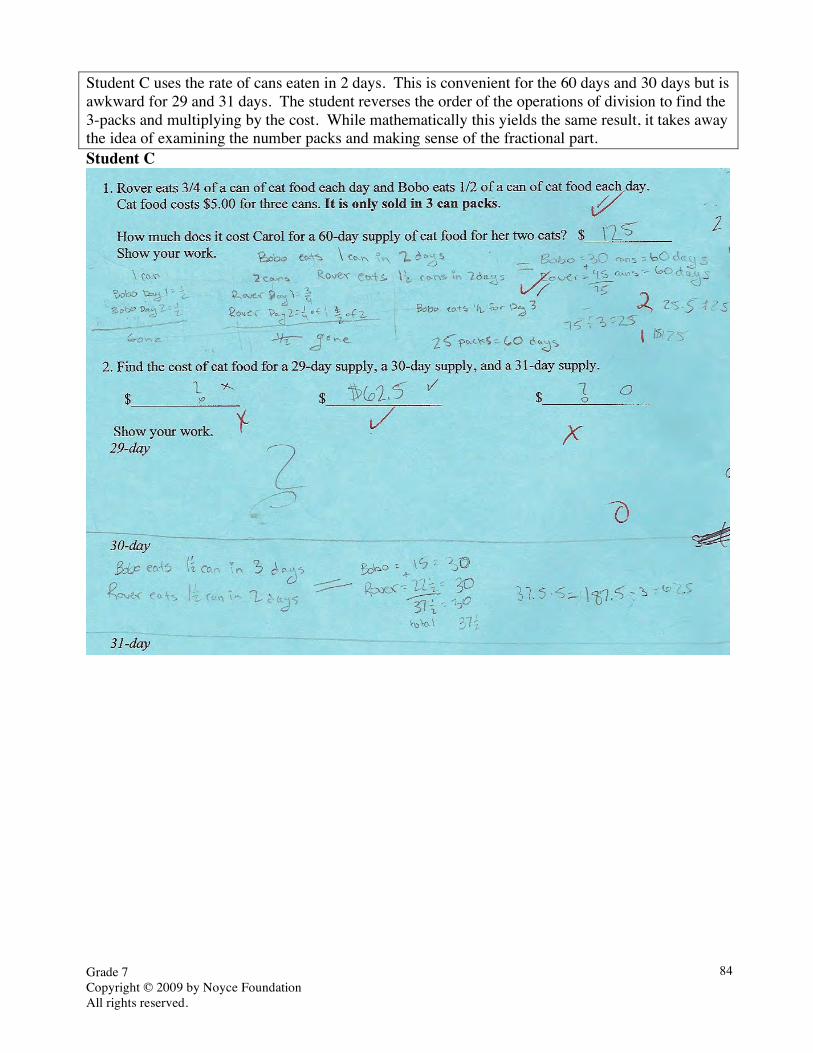
Student C uses the rate of cans eaten in 2 days. This is convenient for the 60 days and 30 days but is awkward for 29 and 31 days. The student reverses the order of the operations of division to find the 3-packs and multiplying by the cost. While mathematically this yields the same result, it takes away the idea of examining the number packs and making sense of the fractional part. Student C

Grade 7 Copyright © 2009 by Noyce Foundation All rights reserved.
85
Student D uses the rate per day for each cat. In part 1 this works out nicely as the numbers are divisible by 3. In part 2 the student appears to divide but it is unclear what number the divisor was. What are the problems inherent in this strategy? In part one the student labels the calculations. In part 2 the student loses track of the meaning of the final answer. What should the label be at the end of each number string? Do you think the label would have alerted the student to the error in thinking? Student D

Grade 7 Copyright © 2009 by Noyce Foundation All rights reserved.
86
Student E is confused about operations with fractions, mixing process and concept. The student performs the right calculations but has labeled it division instead of multiplication. Why is this idea confusing for students? How much time is spent in class helping students understand the meaning of operations with fractions over just learning procedures? Why is this important? Again the student has the correct calculations through most of part one, but then chooses the incorrect operation for the final step. Again the process in part 2 could have led to a correct solution if the student had stopped for a pause before the final step of multiplying by 5 to consider the effect of the remainder and chosen addition instead of subtraction. What types of experiences does this student need to help make sense of operation? Student E
Grade 7 Copyright © 2009 by Noyce Foundation All rights reserved.
87
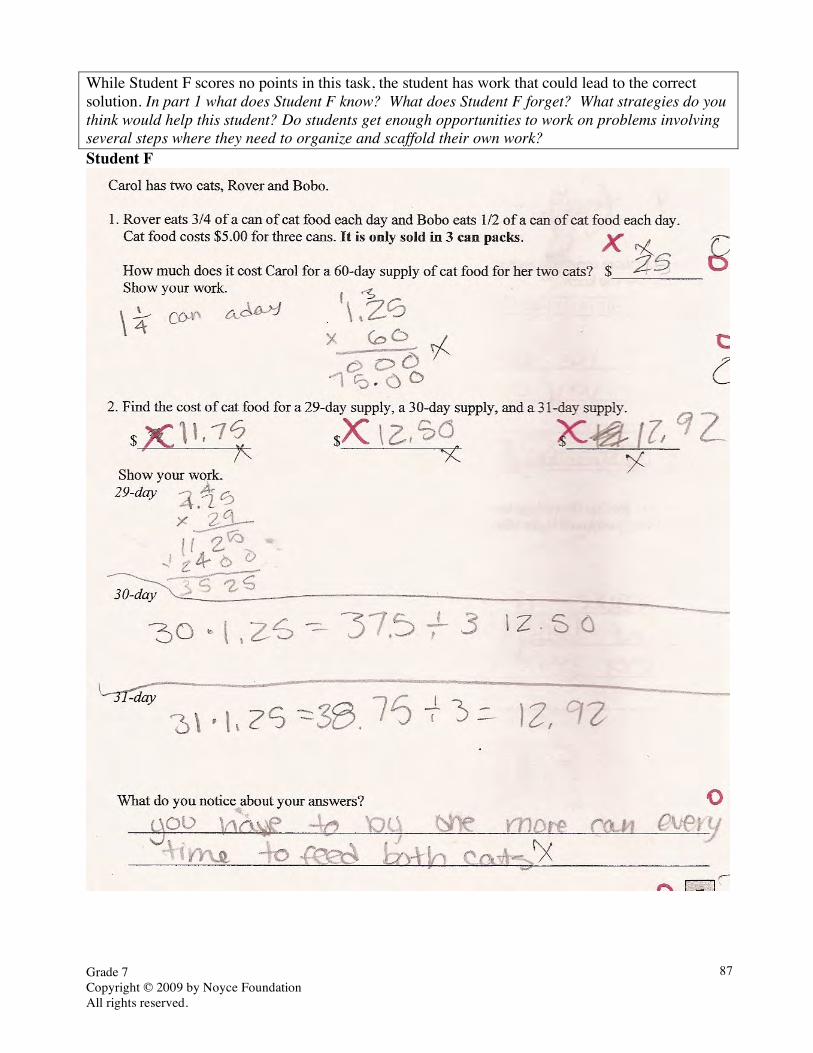
While Student F scores no points in this task, the student has work that could lead to the correct solution. In part 1 what does Student F know? What does Student F forget? What strategies do you think would help this student? Do students get enough opportunities to work on problems involving several steps where they need to organize and scaffold their own work? Student F
Grade 7 Copyright © 2009 by Noyce Foundation All rights reserved.
88
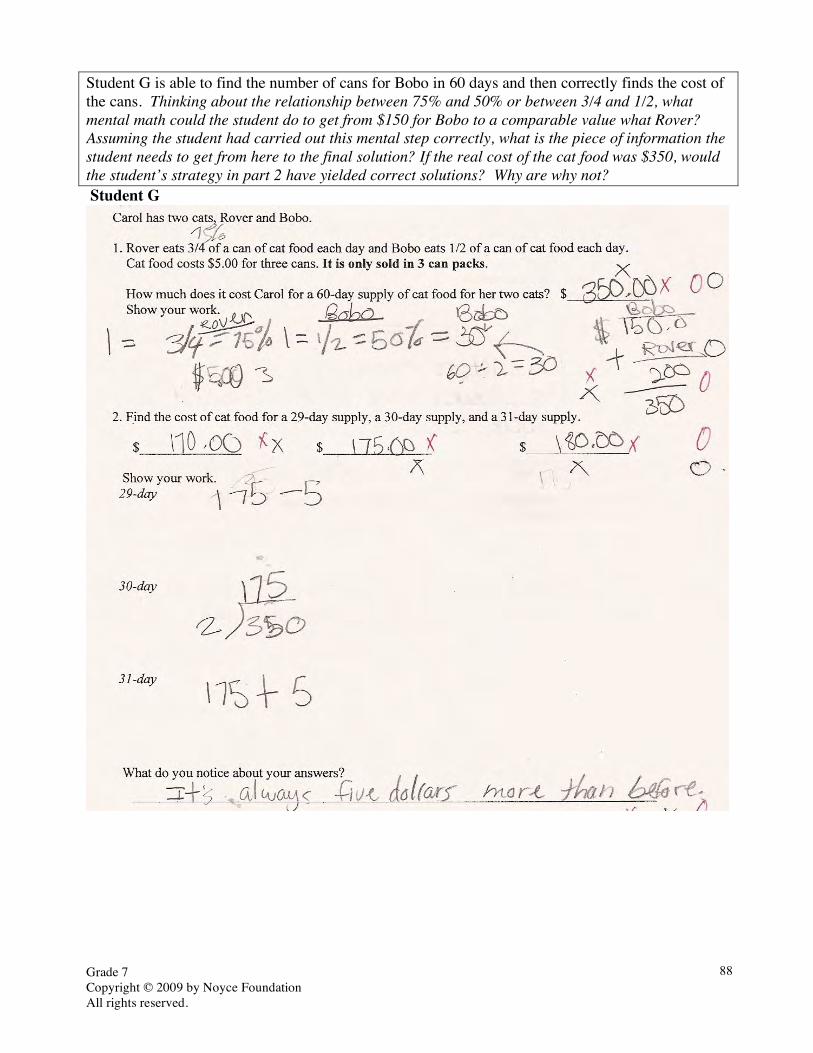
Student G is able to find the number of cans for Bobo in 60 days and then correctly finds the cost of the cans. Thinking about the relationship between 75% and 50% or between 3/4 and 1/2, what mental math could the student do to get from $150 for Bobo to a comparable value what Rover? Assuming the student had carried out this mental step correctly, what is the piece of information the student needs to get from here to the final solution? If the real cost of the cat food was $350, would the student’s strategy in part 2 have yielded correct solutions? Why are why not? Student G
Grade 7 Copyright © 2009 by Noyce Foundation All rights reserved.
89
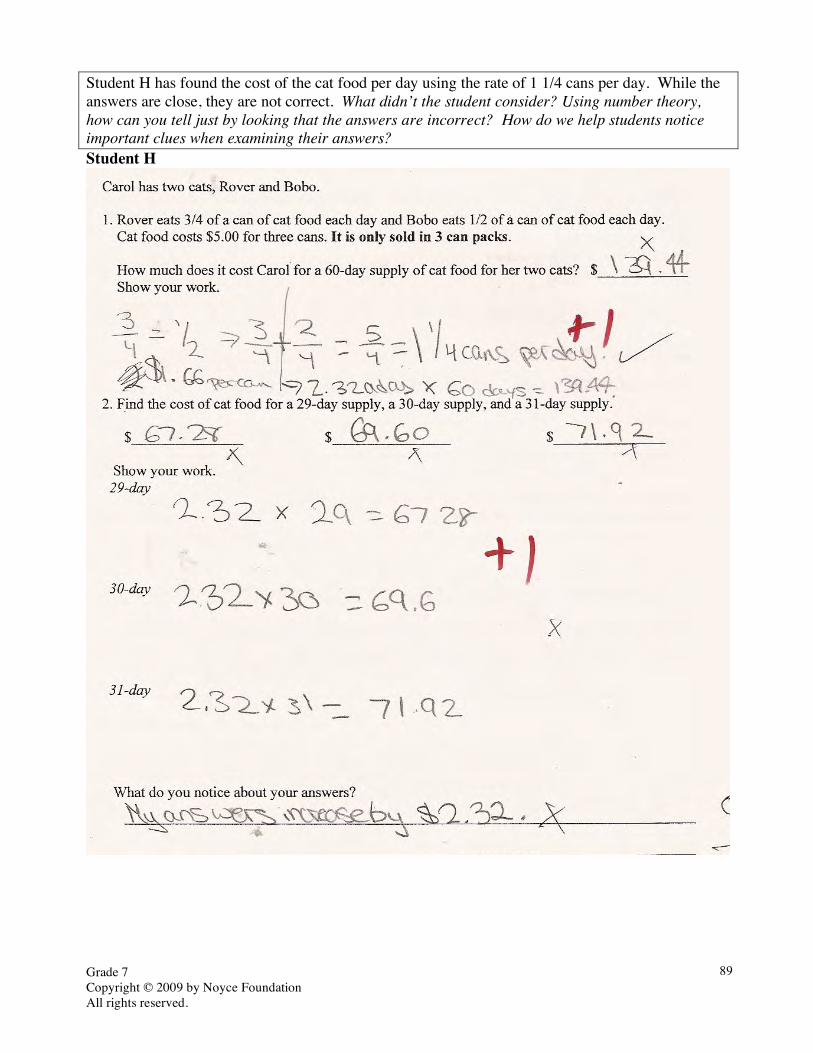
Student H has found the cost of the cat food per day using the rate of 1 1/4 cans per day. While the answers are close, they are not correct. What didn’t the student consider? Using number theory, how can you tell just by looking that the answers are incorrect? How do we help students notice important clues when examining their answers? Student H
Grade 7 Copyright © 2009 by Noyce Foundation All rights reserved.
90
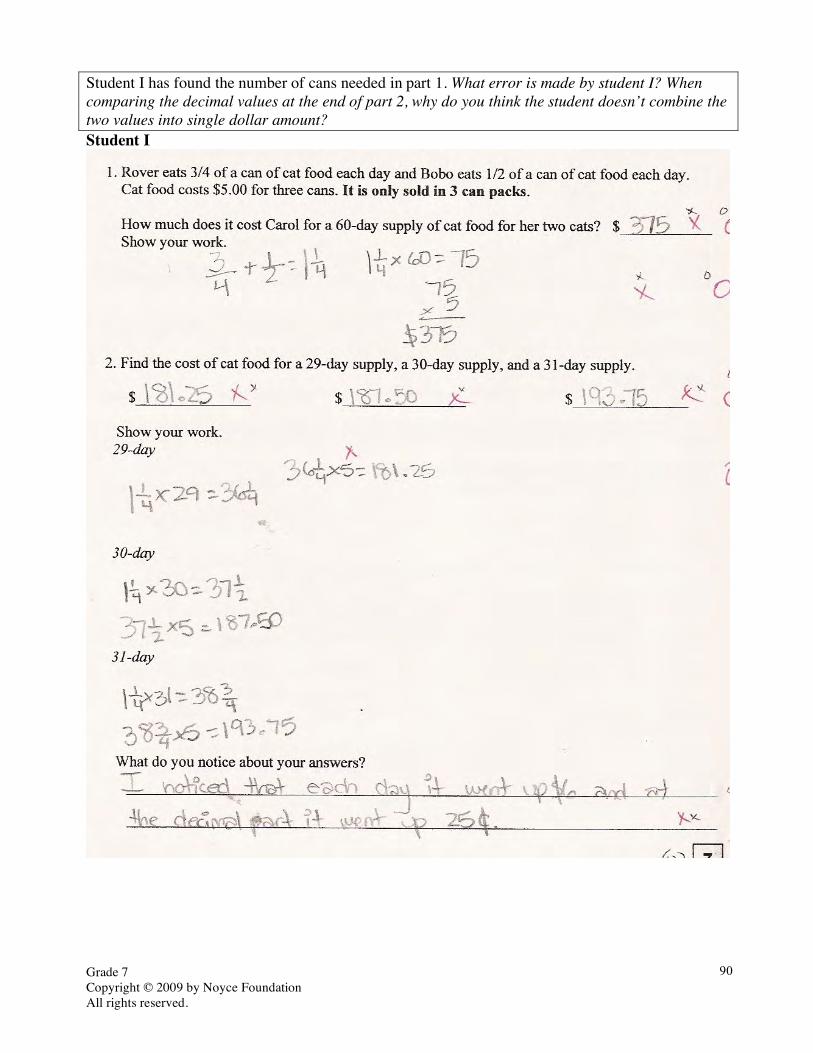
Student I has found the number of cans needed in part 1. What error is made by student I? When comparing the decimal values at the end of part 2, why do you think the student doesn’t combine the two values into single dollar amount? Student I

Grade 7 Copyright © 2009 by Noyce Foundation All rights reserved.
91
Student J finds a really interesting rate of 2.5 cans per 2 days. If you can multiply the rate 1.25 by 60 days, why doesn’t this method work for this rate? What would the student need to do to use this rate? Student J

Grade 7 Copyright © 2009 by Noyce Foundation All rights reserved.
92
Student K finds the rate of cat food consumption per day but doesn’t use it to find the cost. What has the student actually calculated in part 2? Under what conditions would this method be correct? What constraints has the student ignored? Student K
Grade 7 Copyright © 2009 by Noyce Foundation All rights reserved.
93
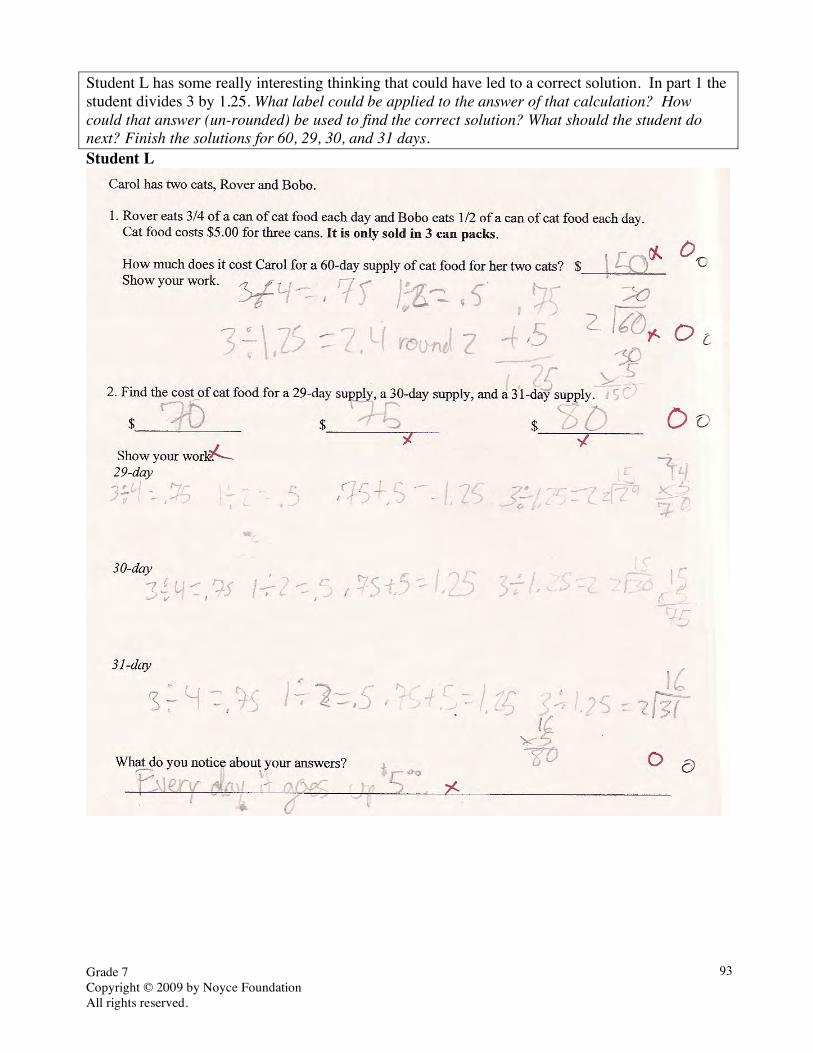
Student L has some really interesting thinking that could have led to a correct solution. In part 1 the student divides 3 by 1.25. What label could be applied to the answer of that calculation? How could that answer (un-rounded) be used to find the correct solution? What should the student do next? Finish the solutions for 60, 29, 30, and 31 days. Student L

Grade 7 Copyright © 2009 by Noyce Foundation All rights reserved.
94
Student M is able to find the number of cans needed for Bobo and then seems to know that the cost for Rover is a little bit more. Why isn’t estimation appropriate for this problem? How do we help students learn when to estimate and when an exact answer is needed? Student M

Grade 7 Copyright © 2009 by Noyce Foundation All rights reserved.
95
7th Grade Task 5 Cat Food Student Task Solve numerical problems in a real-life situation. Core Idea 1 Number and Operation
Understand number systems, the meanings of operations, and ways of representing numbers, relationships, and number systems.
• Develop, analyze and explain methods for solving problems involving proportional reasoning, such as scaling and finding equivalent ratios.
• Understand the meaning and effects of operations with rational numbers.
• Develop and use strategies to estimate the results of rational number computations, and judge the reasonableness of results.
• Work flexibly with fractions, decimals, and percents to solve problems.
• Understand the meaning of remainders by modeling division problems.
Mathematics of this task:
• Performing a long chain of reasoning, requiring the student to organize work and label calculations to keep track of what is known and what still needs to be found
• Using a rate to find the number of cans needed for a given number of days • Understanding the constraint of “3-pack” and rounding in context • Multiplying to find the total cost
Based on teacher observations, this is what seventh graders know and are able to do:
• Combine simple fractions • Convert fractions to decimals • Multiply amount by $5 to find cost
Areas of difficulty for seventh graders:
• Choosing the appropriate value to multiply by 5 • Understanding rounding in context • Understanding the meaning buying in packs of 3 • Mislabeling calculations as money or 3 packs • Reasoning out a multi-step solution process
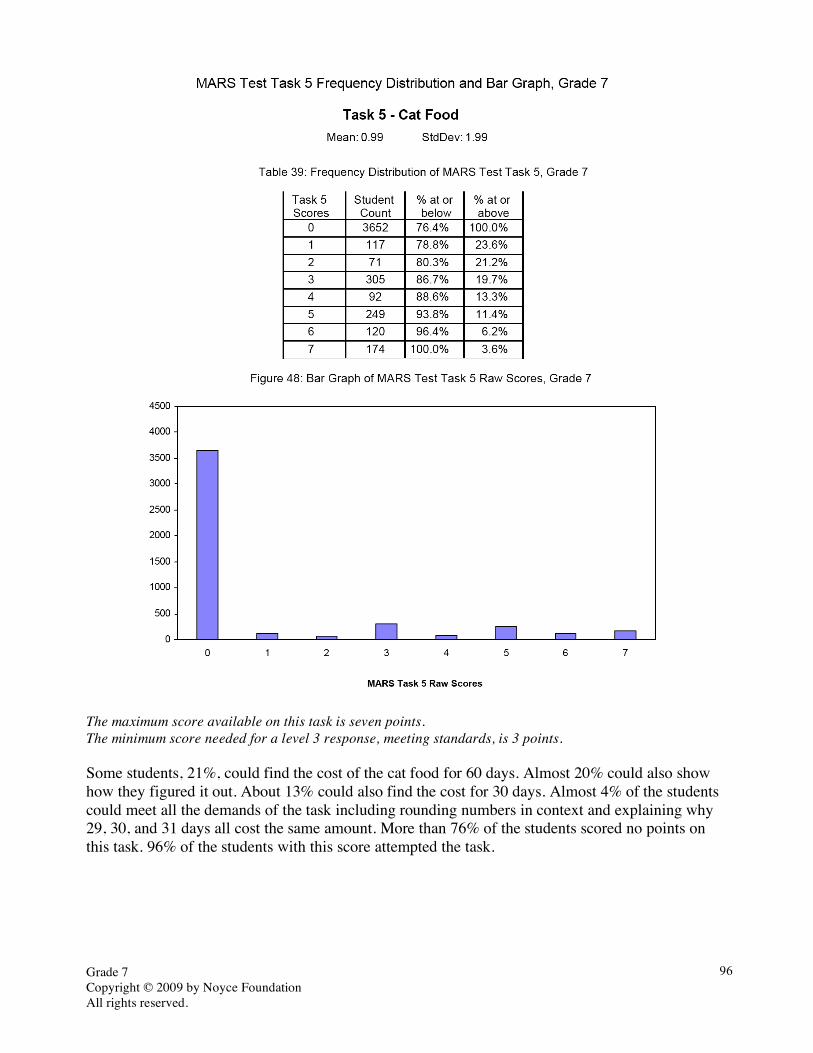
Grade 7 Copyright © 2009 by Noyce Foundation All rights reserved.
96
The maximum score available on this task is seven points. The minimum score needed for a level 3 response, meeting standards, is 3 points. Some students, 21%, could find the cost of the cat food for 60 days. Almost 20% could also show how they figured it out. About 13% could also find the cost for 30 days. Almost 4% of the students could meet all the demands of the task including rounding numbers in context and explaining why 29, 30, and 31 days all cost the same amount. More than 76% of the students scored no points on this task. 96% of the students with this score attempted the task.

Grade 7 Copyright © 2009 by Noyce Foundation All rights reserved.
97
Cat Food Points Understandings Misunderstandings
0 96% of the students with this score attempted the task.
Students could not find the cost of food for 60 days. 11% thought the cost was $300. 11% thought the cost was $100. 5% thought the cost was $150. Other common answers were $375 and $25. Students were often able to find a rate, but did not understand what to do next. Students often ignored some of the information or constraints in the problem.
2 Students could find the rate of consumption and number of cans needed for 60 days, reason about buying cans in 3-packs, and calculate the total cost.
Students struggled with explaining their thinking and showing all the steps.
3 Students could find the rate of consumption and number of cans needed for 60 days, reason about buying cans in 3-packs, calculate the total cost, and show how they figured it out.
Often when working part 2, students would try to shorten their strategies and use fewer steps. They commonly forgot about needing to buy the food in 3-packs.
4 Students could also find the cost of cat food for 30 days.
Students did not understand how to use rounding in context.
7 Students could find the rate of consumption and number of cans needed for a variety of number of days, reason about buying cans in 3-packs including rounding in context, calculate the total cost, and show how they figured it out.

Grade 7 Copyright © 2009 by Noyce Foundation All rights reserved.
98
Implications for Instruction Students need more opportunity to solve problems with longer chains of reasoning. At this grade students should start developing the skills to organize and scaffold their own work. They should start developing habits of mind, such as labeling their answers, to help them track what they know and what they need to find. In a complex problem students need to be aware of the units and how the units change with each computation. One of the difficulties in this task was the constraint that the cat food could only be purchased in a 3-pack. What does this mean when the amount food needed is not a multiple of 3? Students needed to make sense of remainders in the context of the problem and round up to the nearest multiple of 3. While the computations were simple, students needed to grapple with some important mathematical ideas and apply knowledge about rounding in nonstandard ways. Working with rates is a key idea for middle grade students. In this problem working with a rate per day was an easy rate to work with. Some students found other equivalent rates, but found them more difficult to work with when the answers were not multiples of 3. Students need opportunities to work with a variety of rates for the same context and discuss which rates would be most convenient and why. Students should start thinking about issues such as easiest rate as part of the routine problem-solving self-talk. This problem lends itself to use with calculators, because the focus should be on the logic train. However this also made it very easy to have decimals to the hundredths or thousandths place. Students need to be able to think about what are significant digits for this situation. In other cases the students could keep calculating long strings of computations without the need to pause and think about the significance of each answer individually. Ideas for Action Research
Re-engagement – Confronting misconceptions, providing feedback on thinking, going deeper into the mathematics. (See overview at beginning of toolkit). 1. Start with a simple problem to bring all the students along. This allows students to clarify
and articulate the mathematical ideas. 2. Make sense of another person’s strategy. Try on a strategy. Compare strategies. 3. Have students analyze misconceptions and discuss why they don’t make sense. In the
process students can let go of misconceptions and clarify their thinking about the big ideas. 4. Find out how a strategy could be modified to get the right answer. Find the seeds of
mathematical thinking in student work. This task begs for a re-engagement piece as 76% of the students received no points. Yet within these papers there is understanding that can be used and built upon. In earlier tasks in the tool kits, a re-engagement lesson has been given to you. The student work in this task was chosen to illustrate problems in student thinking and because each piece would lend itself well to the idea of a re-engagement question. In many of the comments for the work, there are some ideas or seeds for re-engagement questions in italics. The key to writing an engaging prompt is to use to small snippets of work devoid of the labels. This forces students to actively think about where the numbers come from, what is happening because of the computation, and why is this helpful. The cognitive demand of digging into the work in this way is much higher than that required to just carrying out procedures.

Grade 7 Copyright © 2009 by Noyce Foundation All rights reserved.
99
Look back at the work of Student D. What snapshots of this work could you use to build student thinking? How could you present this and make it interesting? I might say to students that I saw this work on someone’s paper and need there help figuring it out.
What are these numbers? Where do they come from? How do they help solve the problem? Later, I might show the work of Student F for just the 30-day solution.
Again I would want to know what is the student doing? Where do the numbers come from? And add a question about is this helpful or what should the student do next? At some later point in the lesson I might want students try the mental math to get an answer for Rover from the $150 for Bobo. Then I would want students to talk about the relationship between those two numbers. Once they have the answers, again I would want to ask them if this is the final solution. If not what would the student need to do next? I might ask them to talk about the good points and bad points in the solution strategy. One interesting path to explore is the idea that answers need to be multiples of 5. A question might be asked like Sally was walking to the pencil sharpener and saw that her friend had written $60.42 for 2a. Another friend had written $120.83. A third friend put $181.25. Without looking at their calculations she knew that their answers were incorrect. How did she know that? Here the idea is to help students move from specific situations to looking at a more global picture, moving towards generalizations. There are many rich pieces of student work for this problem as well as work from your own students. How would you put it together to make a meaningful conversation for your students?
Grade 7 Copyright © 2009 by Noyce Foundation All rights reserved.
100
Reflecting on the Results for Seventh Grade as a Whole: Think about student work through the collection of tasks and the implications for instruction. What are some of the big misconceptions or difficulties that really hit home for you? If you were to describe one or two big ideas to take away and use for planning for next year, what would they be? What were some of the qualities that you saw in good work or strategies used by good students that you would like to help other students develop? Five areas stood out for the Collaborative as a whole. These include:
1. Using algebraic notation to describe a situation and solving simple equations: In Toy Trains students had difficulty writing a rule for finding the total number of wheels. Students didn’t notice that the first car was different or didn’t understand how to show that difference using symbols. Students did not check the rule with numbers to make sure that it would work. In Sequoia students had difficulty substituting numbers into an equation. They often ignored some of the parts of the formula when trying to do all the computations. Many students did not understand the exponent and multiplied by two instead of squaring the number. Students also could not solve an equation for a different variable.
2. Understanding scale: In Buses students had trouble reading the graph. They didn’t understand the between spaces. In Archery students often identified the correct points to put on the box and whisker plot, but rounded to the nearest grid line. Again, students did not know how to use the “between” spaces on a scale.
3. Thinking proportionally: In Sequoia students did not know how to use proportional reasoning to solve for the height of the tree. Very few students used or attempted to use proportions to solve for the sides of similar triangles. In Cat Food students could often find the correct rate, but couldn’t scale the rate up for a different number of days. Students couldn’t reason from a unit rate to a rate for 30 days or 60 days. Students also had trouble working with a longer chain of reasoning and thinking about the effects of computation on the label.
Grade 7 Copyright © 2009 by Noyce Foundation All rights reserved.
101
4. Understanding and using mathematical terms: In Sequoia, many students did not understand or couldn’t apply basic geometric terms, such as radius, diameter, and circumference. In Archery, students had incomplete definitions or no definitions for important statistical terms, such as, median, range, consistent.
5. Rounding in context: In Cat Food, students did not know how to round in context. They may have rounded to early in the problem or they may not have rounded at all. They may have rounded money instead of rounding to the nearest 3-pack. Students need opportunities to discuss explicitly the idea of rounding: when, where, why, or why not.
How Are Seventh Students Succeeding on the Ramps? Examining the Ramp: Looking at Responses of the Early 4’s (29,30,31,32,33) With a group of colleagues look at student work around 29 – 32 points. Use the papers provided or pick some from your own students.
How are students performing on the ramp? What things impressed you about their performance?
What are skills or ideas they still need to work on? Are students relying on previous arithmetic skills rather than moving up to more grade level strategies? What was missing that you would hope to see from students working at this level? How do you help students at this level step up their performance or see a standard to aim for in explaining their thinking? Are our expectations high enough to these students? How do we provide models to help these students see how their work can be improved or what they are striving for? Do you think errors were caused by lack of exposure to ideas or misconceptions? What would a student need to fix or correct their errors? What is missing to make it a top-notch response? What concerns you about their work? What strategies did you see that might be useful to show to the whole class?
Toy Trains
• Part 4, writing an algebraic expression for the number of wheels in a size n set. Buses
• Part 3b, finding the number of buses traveling in the opposite direction that will pass the9:20 bus and explaining how they figured it out.
Sequoia • Part 1, finding the height of the tree • Part 2, solving for the radius given the circumference
Archery • Part 1, Using scale to make a box a whisker plot
Cat Food • Part 2, Finding the cost of cat for a 29 and 31 day supply • Using rounding in context • Understanding the constraint of a 3-pack • Structuring and organizing work for a long chain of reasoning
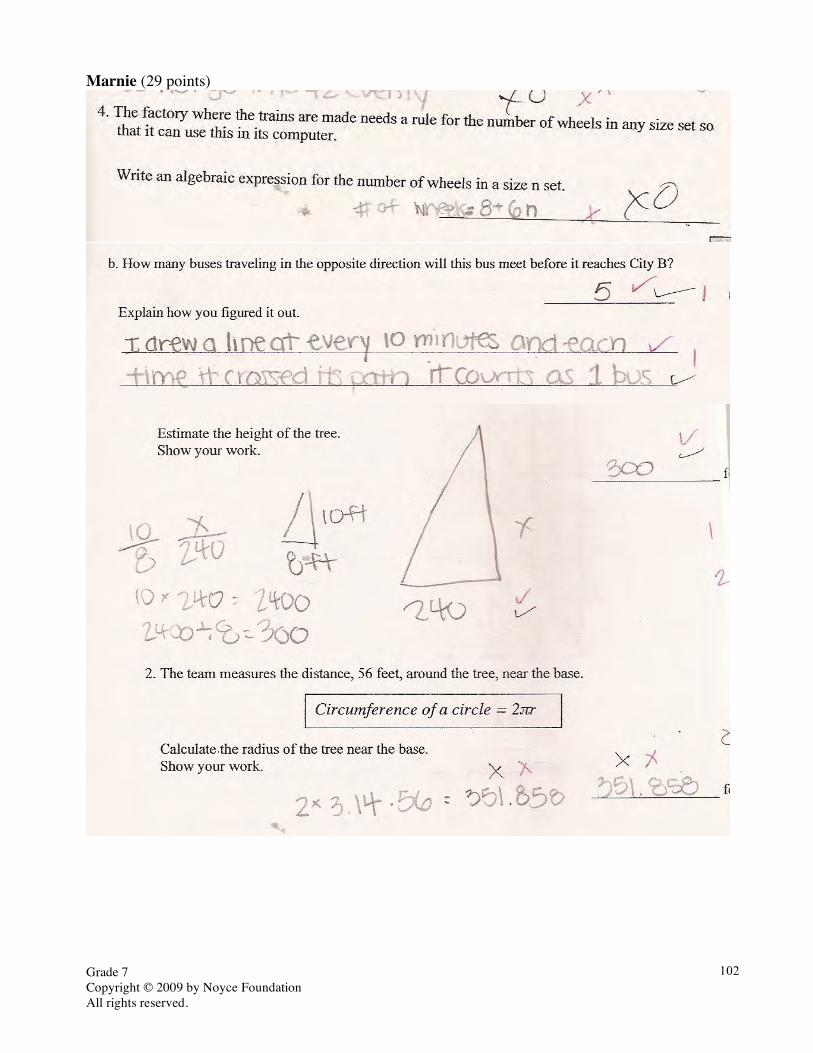
Grade 7 Copyright © 2009 by Noyce Foundation All rights reserved.
102
Marnie (29 points)

Grade 7 Copyright © 2009 by Noyce Foundation All rights reserved.
103
Marnie, part 2

Grade 7 Copyright © 2009 by Noyce Foundation All rights reserved.
104
Carolyn (30points)

Grade 7 Copyright © 2009 by Noyce Foundation All rights reserved.
105
Carolyn, part 2
Julie (30 points)
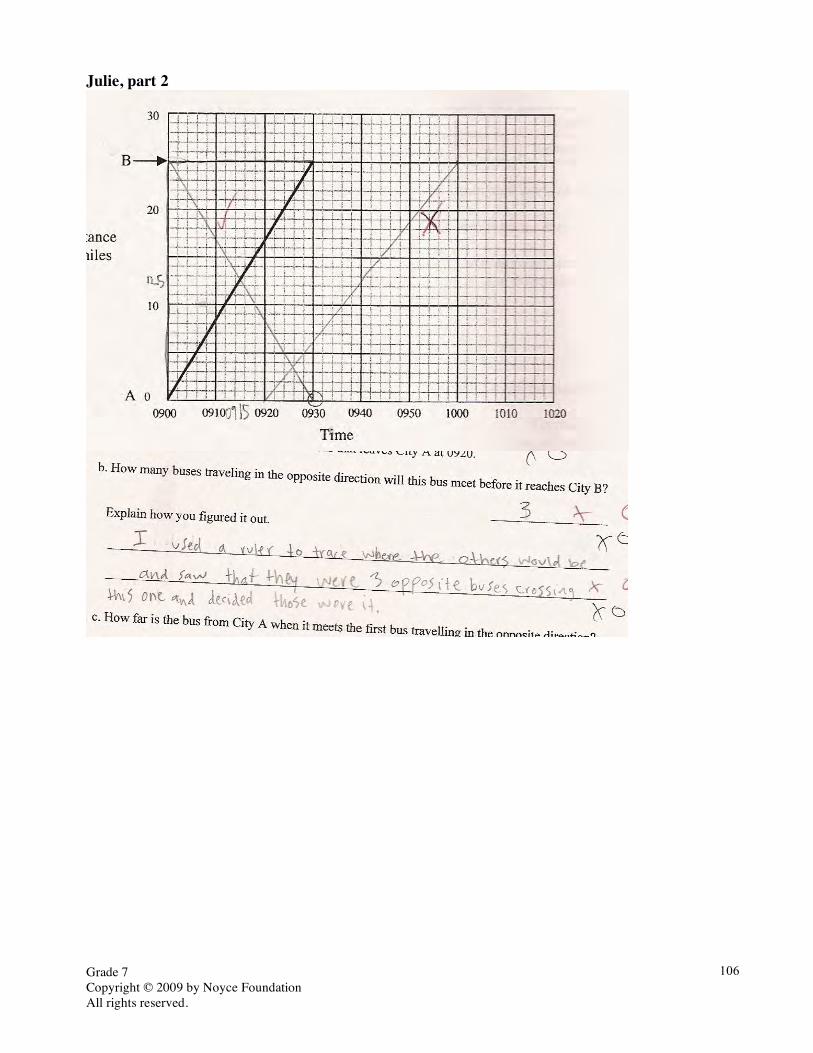
Grade 7 Copyright © 2009 by Noyce Foundation All rights reserved.
106
Julie, part 2

Grade 7 Copyright © 2009 by Noyce Foundation All rights reserved.
107
Julie, part 3
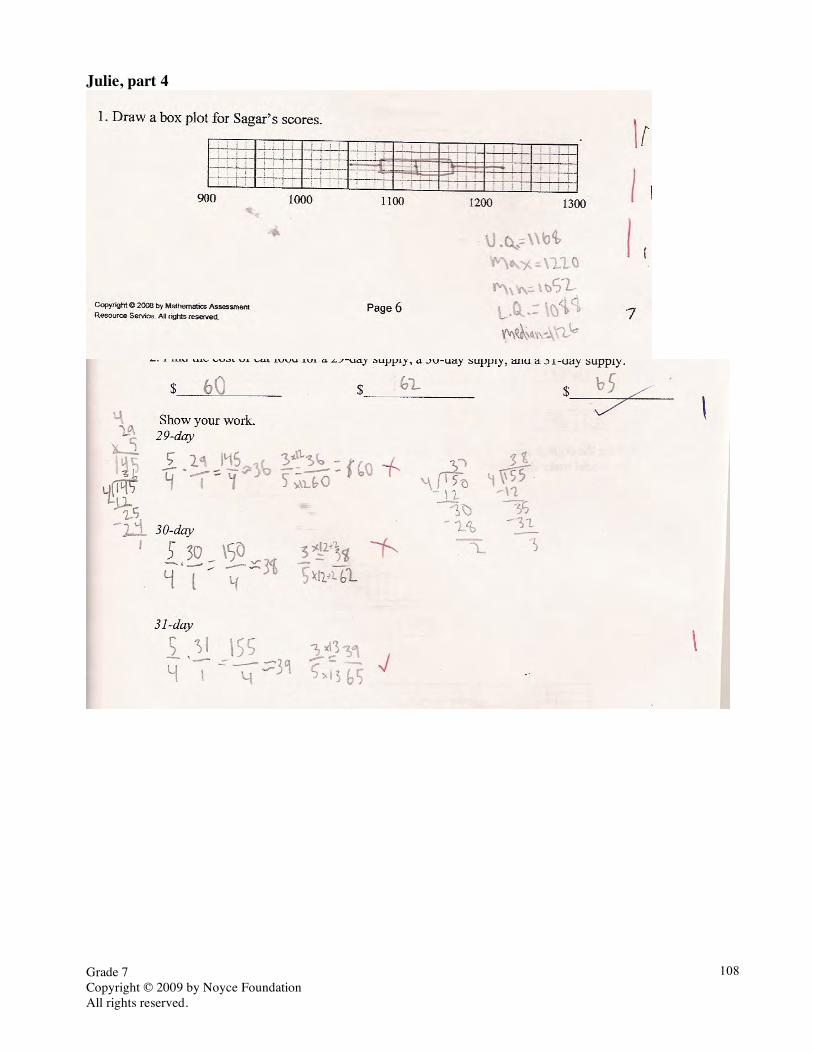
Grade 7 Copyright © 2009 by Noyce Foundation All rights reserved.
108
Julie, part 4

Grade 7 Copyright © 2009 by Noyce Foundation All rights reserved.
109
Keith
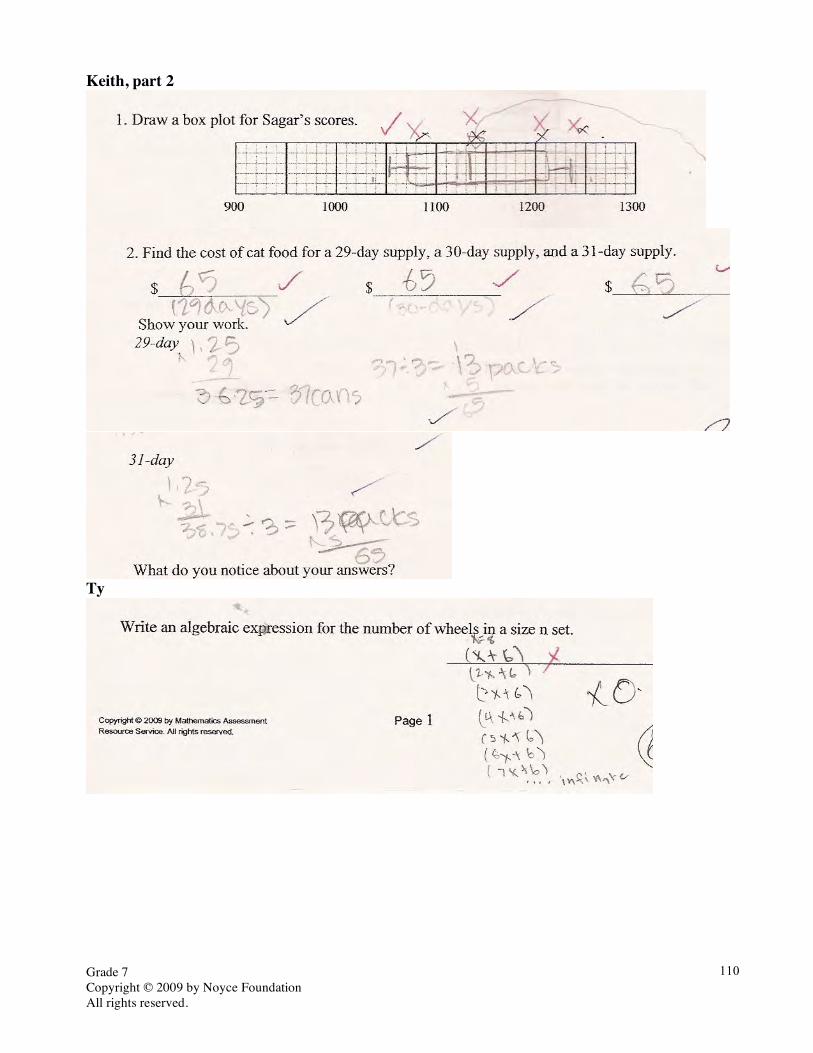
Grade 7 Copyright © 2009 by Noyce Foundation All rights reserved.
110
Keith, part 2
Ty

Grade 7 Copyright © 2009 by Noyce Foundation All rights reserved.
111
Ty, part 2
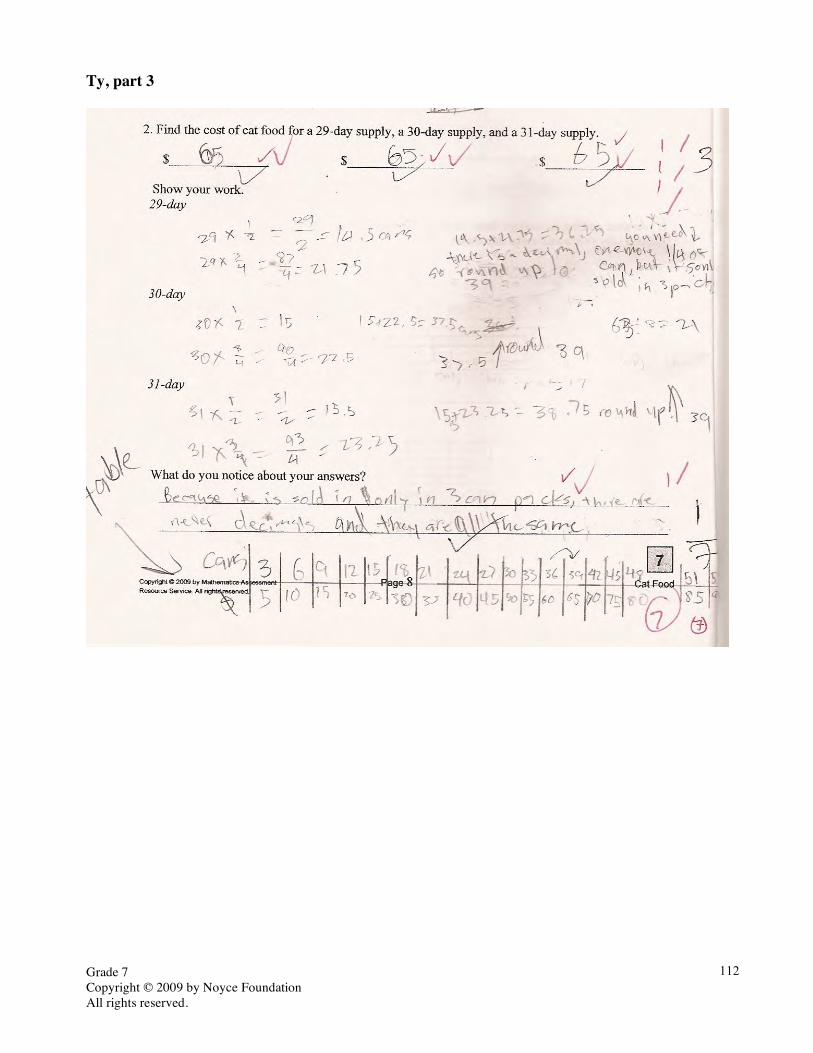
Grade 7 Copyright © 2009 by Noyce Foundation All rights reserved.
112
Ty, part 3