Embed Size (px)
Citation preview
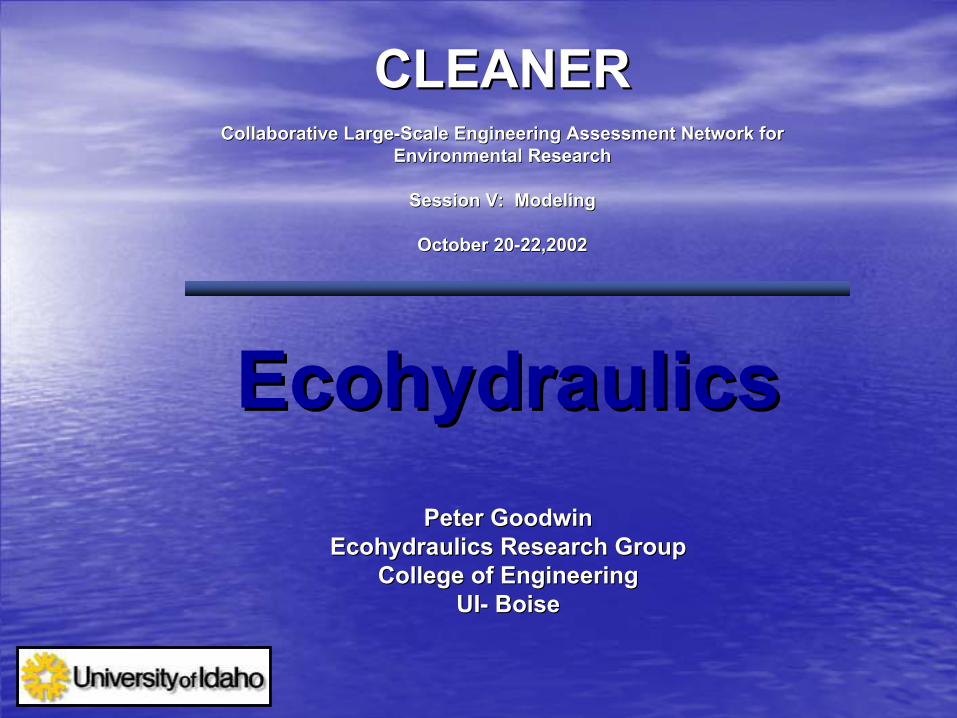
EcohydraulicsEcohydraulicsPeter GoodwinPeter Goodwin
EcohydraulicsEcohydraulics Research GroupResearch GroupCollege of EngineeringCollege of Engineering
UIUI-- BoiseBoise
CLEANERCLEANERCollaborative LargeCollaborative Large--Scale Engineering Assessment Network for Scale Engineering Assessment Network for
Environmental ResearchEnvironmental Research
Session V: ModelingSession V: Modeling
October 20October 20--22,2002 22,2002
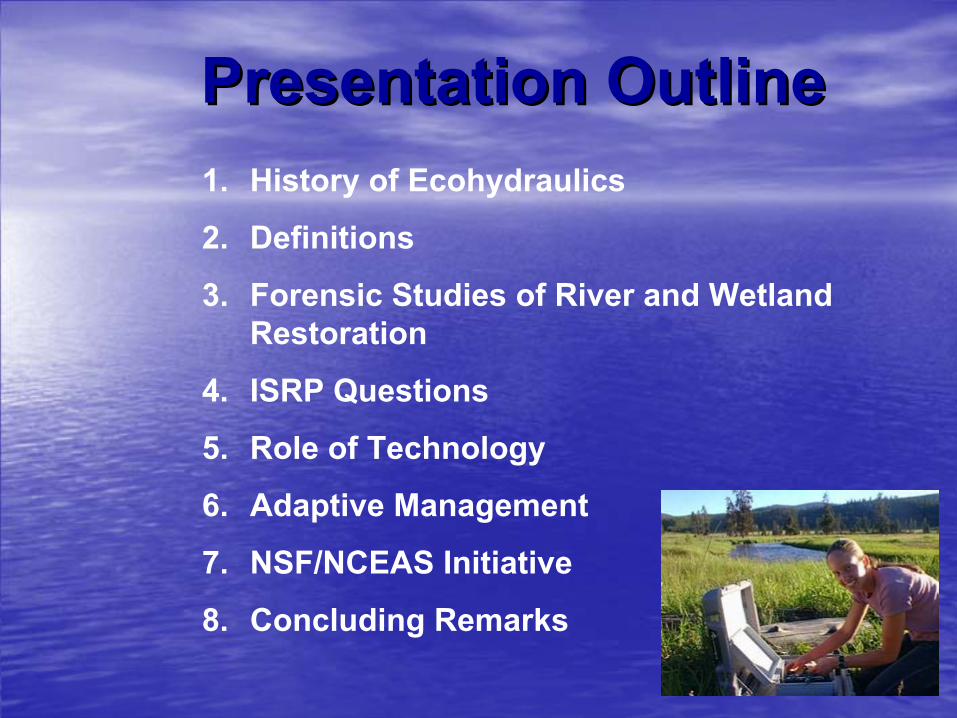
Presentation OutlinePresentation Outline1. History of Ecohydraulics
2. Definitions
3. Forensic Studies of River and Wetland Restoration
4. ISRP Questions
5. Role of Technology
6. Adaptive Management
7. NSF/NCEAS Initiative
8. Concluding Remarks
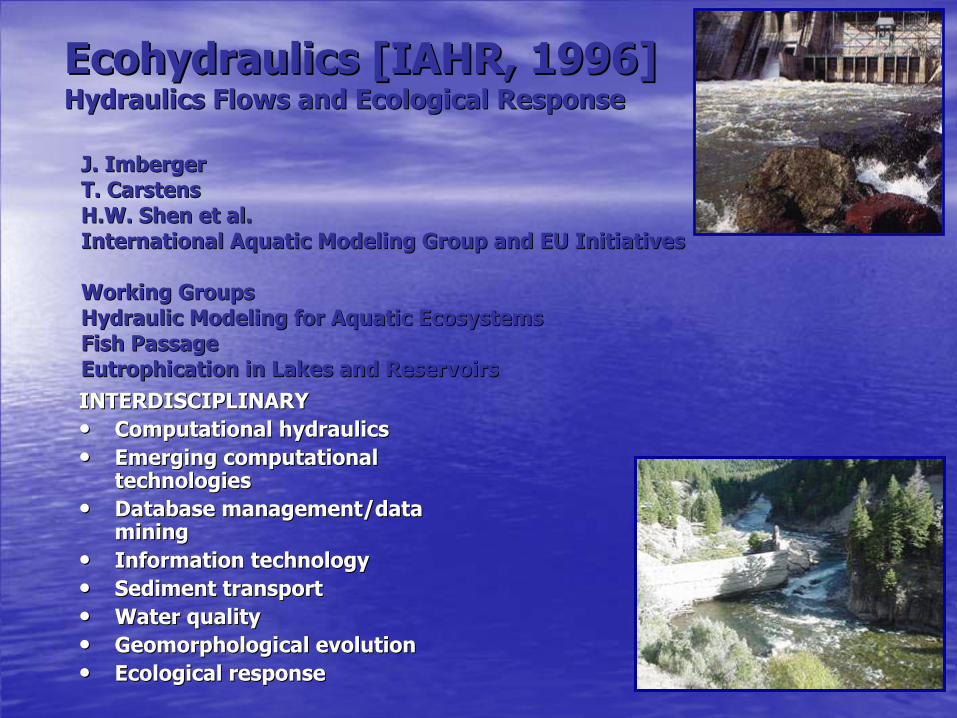
EEcohydraulicscohydraulics [[IAHR, 1996]IAHR, 1996]Hydraulics Flows and Ecological ResponseHydraulics Flows and Ecological Response
INTERDISCIPLINAINTERDISCIPLINARYRY•• Computational hydraulicsComputational hydraulics•• Emerging computational Emerging computational
technologies technologies •• Database management/data Database management/data
mining mining •• Information technologyInformation technology•• Sediment transportSediment transport•• Water qualityWater quality•• Geomorphological evolutionGeomorphological evolution•• Ecological responseEcological response
J. J. ImbergerImbergerT. T. CarstensCarstensH.W. H.W. ShenShen et al.et al.International Aquatic Modeling Group and EU InitiativesInternational Aquatic Modeling Group and EU Initiatives
Working GroupsWorking GroupsHydraulic Modeling for Aquatic EcosystemsHydraulic Modeling for Aquatic EcosystemsFish PassageFish PassageEutrophicationEutrophication in Lakes and Reservoirsin Lakes and Reservoirs
Restoration in the Western US Restoration in the Western US Example of Tidal WetlandsExample of Tidal Wetlands
•• The most productive ecosystems on the planet The most productive ecosystems on the planet ((TinerTiner, 1984). 2300g/m, 1984). 2300g/m22/yr (15% > tropical /yr (15% > tropical rain forest)rain forest)
•• Critical habitatCritical habitat
•• Linkages extend 1000s of milesLinkages extend 1000s of miles
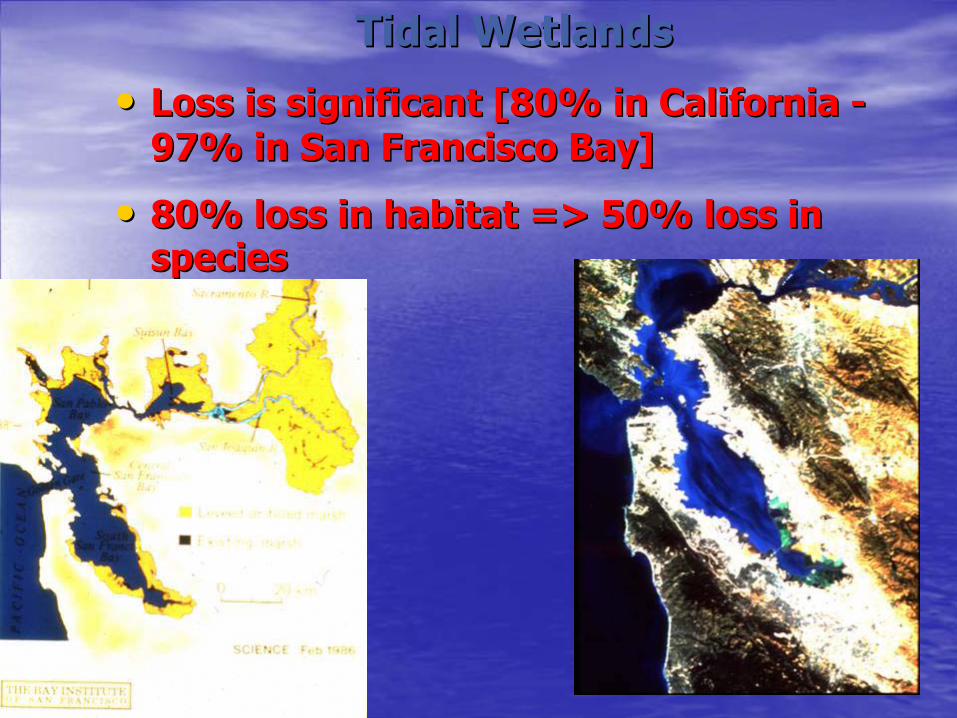
Tidal WetlandsTidal Wetlands
•• Loss is significant [80% in California Loss is significant [80% in California --97% in San Francisco Bay]97% in San Francisco Bay]
•• 80% loss in habitat => 50% loss in 80% loss in habitat => 50% loss in speciesspecies
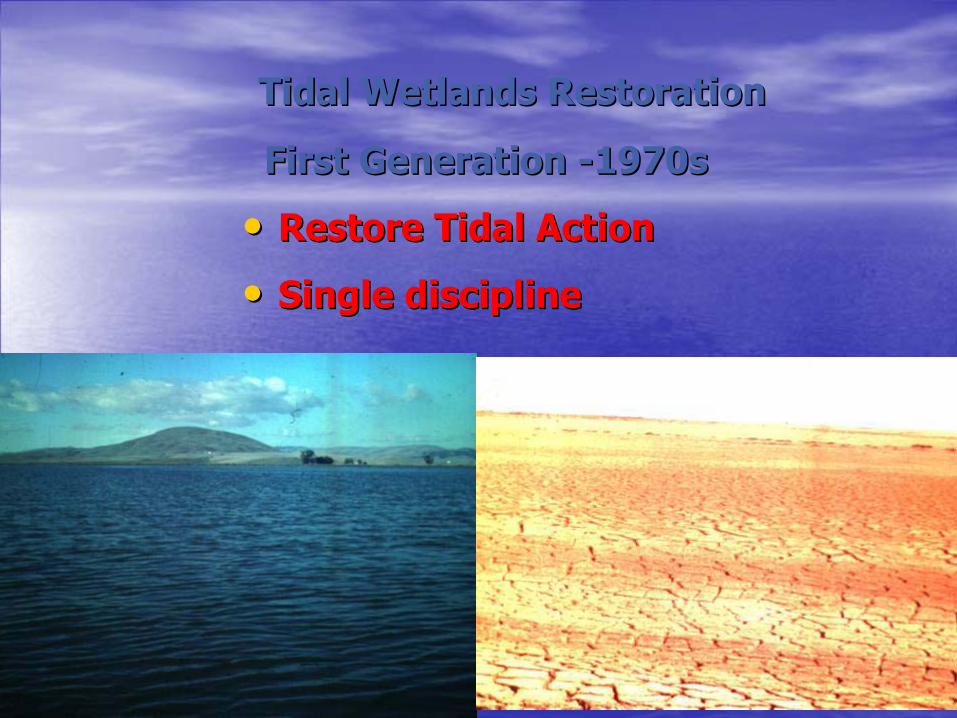
Tidal Wetlands RestorationTidal Wetlands Restoration
First Generation First Generation --1970s1970s
•• Restore Tidal ActionRestore Tidal Action
•• Single discipline Single discipline
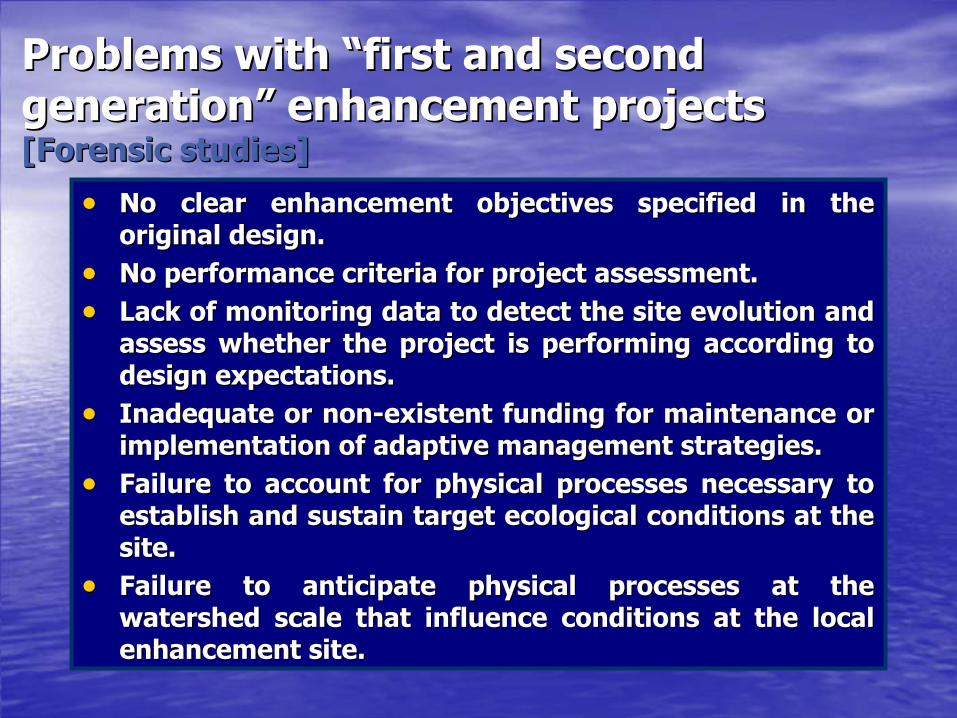
Problems with “first and second Problems with “first and second generation” enhancement projects generation” enhancement projects [Forensic studies][Forensic studies]
•• No clear enhancement objectives specified in the No clear enhancement objectives specified in the original design.original design.
•• No performance criteria for project assessment.No performance criteria for project assessment.•• Lack of monitoring data to detect the site evolution and Lack of monitoring data to detect the site evolution and
assess whether the project is performing according to assess whether the project is performing according to design expectations.design expectations.
•• Inadequate or nonInadequate or non--existent funding for maintenance or existent funding for maintenance or implementation of adaptive management strategies.implementation of adaptive management strategies.
•• Failure to account for physical processes necessary to Failure to account for physical processes necessary to establish and sustain target ecological conditions at the establish and sustain target ecological conditions at the site.site.
•• Failure to anticipate physical processes at the Failure to anticipate physical processes at the watershed scale that influence conditions at the local watershed scale that influence conditions at the local enhancement site. enhancement site.
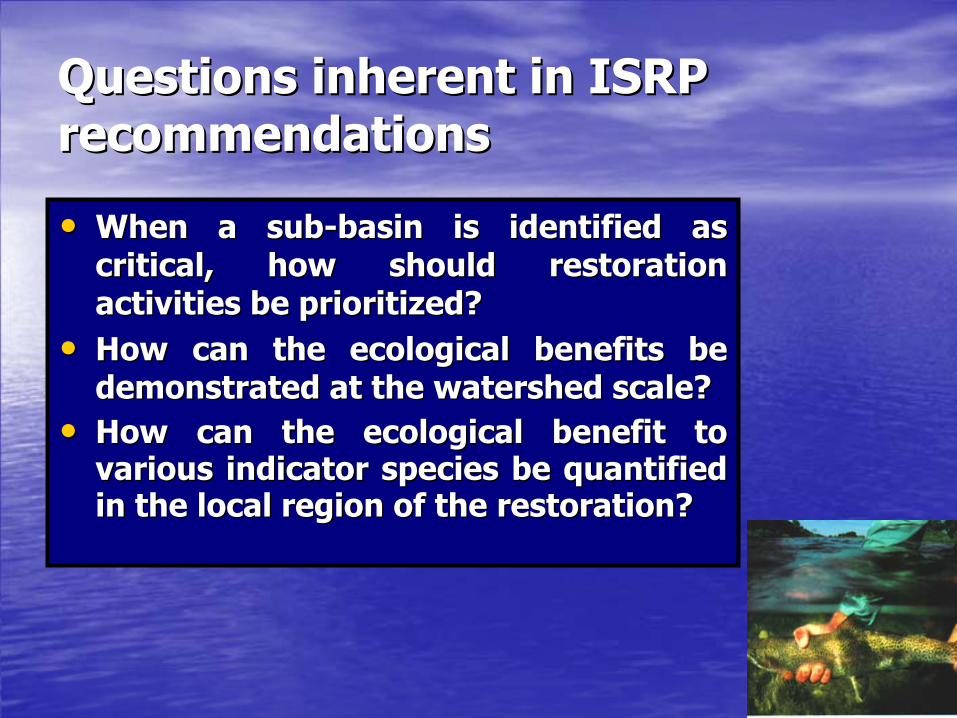
Questions inherent in ISRP Questions inherent in ISRP recommendationsrecommendations
•• When a subWhen a sub--basin is identified as basin is identified as critical, how should restoration critical, how should restoration activities be prioritized?activities be prioritized?
•• How can the ecological benefits be How can the ecological benefits be demonstrated at the watershed scale? demonstrated at the watershed scale?
•• How can the ecological benefit to How can the ecological benefit to various indicator species be quantified various indicator species be quantified in the local region of the restoration?in the local region of the restoration?
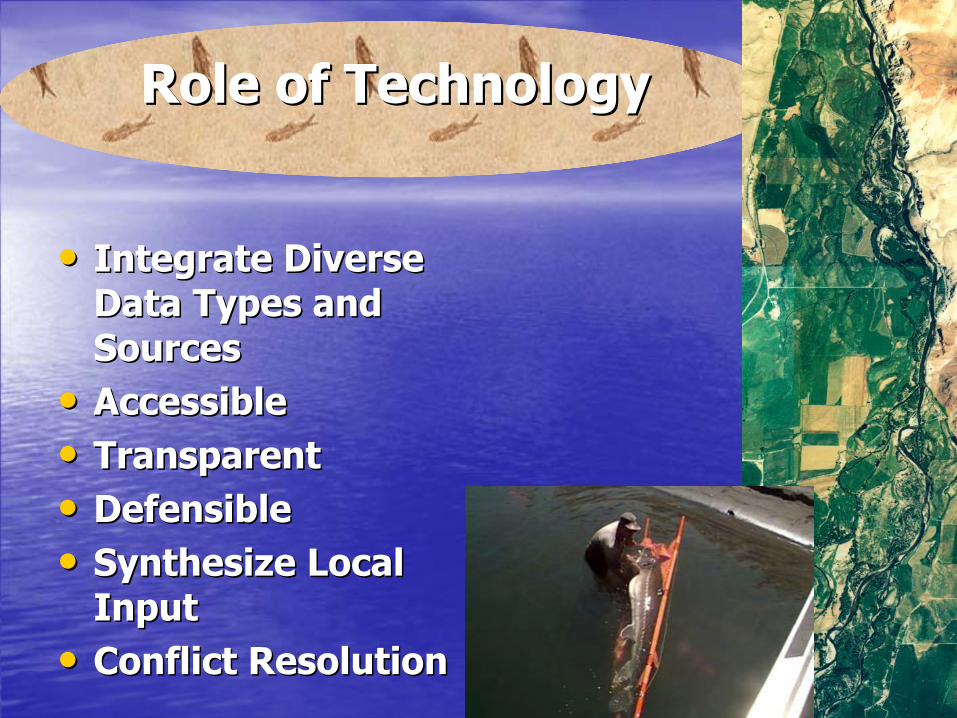
Role of TechnologyRole of Technology
•• Integrate Diverse Integrate Diverse Data Types and Data Types and SourcesSources
•• AccessibleAccessible•• TransparentTransparent•• DefensibleDefensible•• Synthesize Local Synthesize Local
InputInput•• Conflict ResolutionConflict Resolution
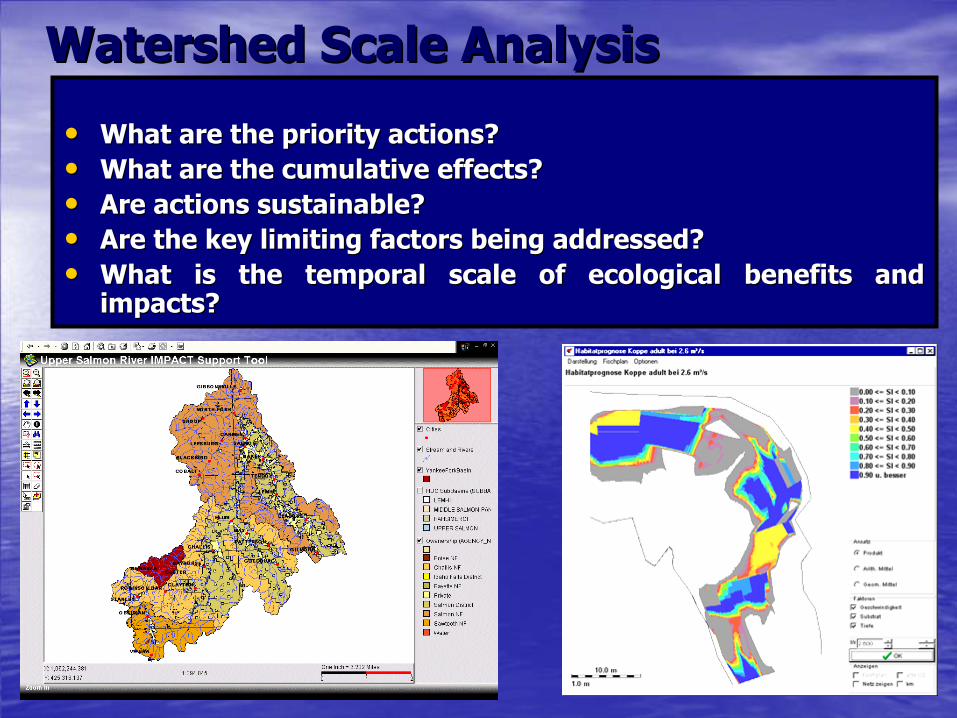
Watershed Scale AnalysisWatershed Scale Analysis
•• What are the priority actions?What are the priority actions?•• What are the cumulative effects?What are the cumulative effects?•• Are actions sustainable?Are actions sustainable?•• Are the key limiting factors being addressed?Are the key limiting factors being addressed?•• What is the temporal scale of ecological benefits and What is the temporal scale of ecological benefits and
impacts?impacts?
NNNNNNNNNNNNNNNNNNNNNNNNNNNNNNNNNNNNNN
NNNNNN
NNNNNNN
NNNNNNNNNNNNNNNNNNNNNNNNNNNNNNNNNNNNNNNNNNNNNNNNNNNNNNNNNNNNNNNNNNNNNNNNNNNNNNNNNNNNNNNNNNNNNNNNNNN
NNNNNNNNNNNNNNNNNN
NNNNNNNNNNNNNNNNNNNNNN
NNNNNNNNNNNNNNNNNNNNNNNNNNNNNNNNNNNNNNNNNNNNNNNNNNNNNNNNNNNNNNNNNNNNNNNNNNNNNNNNNNN
NNNNNNNNNNNNNNNNNNNNNNNNNNNN
NNNNNNNNNNNNNNNNNNNNNNNNNNNNNNNNNNNNNNNN
N
NNNNNNNNN
NNNNNNNNNNNNNNNNNNNN
NNNNNNNNNNNNNNNNNNNNNNNNNNNNNNNNNN
N
NNNNN
N
NNNNNN
NNNNN
NN N NN
NN NNNN
NN
NNNNN
N
NN
NNNNNNNN NNNNNNNNNNNNNNNNN NNNNNNNNNNN
NNNNNNNNNN
NNNNNNNNNNNNNNNNNNNNNNNNNNNNNNNNNNNNN NNNN
N
NNNNNNNNNNNNNNNNNNNNNNNNNNNNNNNNNNNNNNNNNNNNNNNNNNNNNNNNNNNNNNNNNNNNNNNNNNNNNNNNNNNNNNNNNNNNNNNNNNNNNNNNNNNNNNNNNNNNNNNNNNNNNNNNNNNNNNNNNNNNNNNNNNNNNNNNNNNN
NN
NNNNNNNNNNNNNNNNNNNNNNNNNNNNNNNNNNNNNNNNNNNNNNNNNNNNNNNNNNNNNNNNNNNNNNNNNNNNNNNNNNNNNNN
NNNNNNNNNNNNNN
NNNNNNNNNNNNNN
NNNN
NNNNNN
NNNNNNNN
NNNNNNNNNNNNNNNNNNNNNNNNNNNNNNNNNNN
NNNNNNNNNNNNNNNNNNNNNNN
NNNNNNNNNNNNNNNNNNNNNNNNNNNNN
NNNNNNNNNNNNNN
NNNNNNNNNNNNNNNNNNNNNNNNNNNNNNNNNNNNNNNNNN
NNNNNNNNNNN
NNNNNNNNNNNNNNNNNNNNNNNNNNNNNNNNNNN
NNNNNNNNNNNNNN
NNNNNNNNNNNNNNNNNNNNNNNNNNNNNNNNNNNNNNNNNNNNNNNNNNNNNNNNNNNNNNNNNNNNNNNNNNNNNNNNNNNNNNNNNNNNNNNNNNNNNNNNNNNNNNNNNNNNNNNNNNNNNNNNNNNNNNNNN
NNNNNNNNNNNNNNNNNNNNNNNNNNNNNNNNNNNNNNNNNNNNNNNN
NNNNNNNNNNNNNNNNNNNNNNNNNNNNNNNNNNNNNNNNNNNNNNNN
NNNN NNNNNNNNN
N NNNNNNNNNNNNNNNNN
NNNNNNNNNNNNNNNNNNNNNNNNNNNNNNNNNNNNNNNNNNNNNNNNNNNNNNNNNNNNNNNNNNNNNNNNNNNNNNNNNNNNNNNNNNNNNNNNNNNNNNNNNNNNNNNNNNNNNNNNNNNNNNNNNNNNNNNNN
NNNNNNNNNNNNNNNNNNNNNNNNNNNNNNNNNNNNNNNNNNNNNNNNNNNNNNNNNNNNNNNNNNNNNNNNNNNNNNNNNNNNNNNNNNNNNNNNNNNNNNNNN
NNN
NNNNNNNNNNNNNNNNNNN
NNNNNNN N
NNNNNNNNNNNNNNNNNNNNNNNNNNNNNNNNNNNNNNNNNNNNNNNNNNNNNNNNNNNNNNNNNNNNNNNNNNNNNNNNNNNNNNNNNNNNNNNNNNNNNNNNNNNNNNNNNNNNNNNNNNNNNNNNNNNNNNNNNNNNNNNNNNNNNNNNNNNN
NNNNNN
NNNNNNNNNNN
NNNNNNNNNNNNNNNNNNNNNNNNNNNNNNNNNNNNNNNNNNNNNNNNNNNN
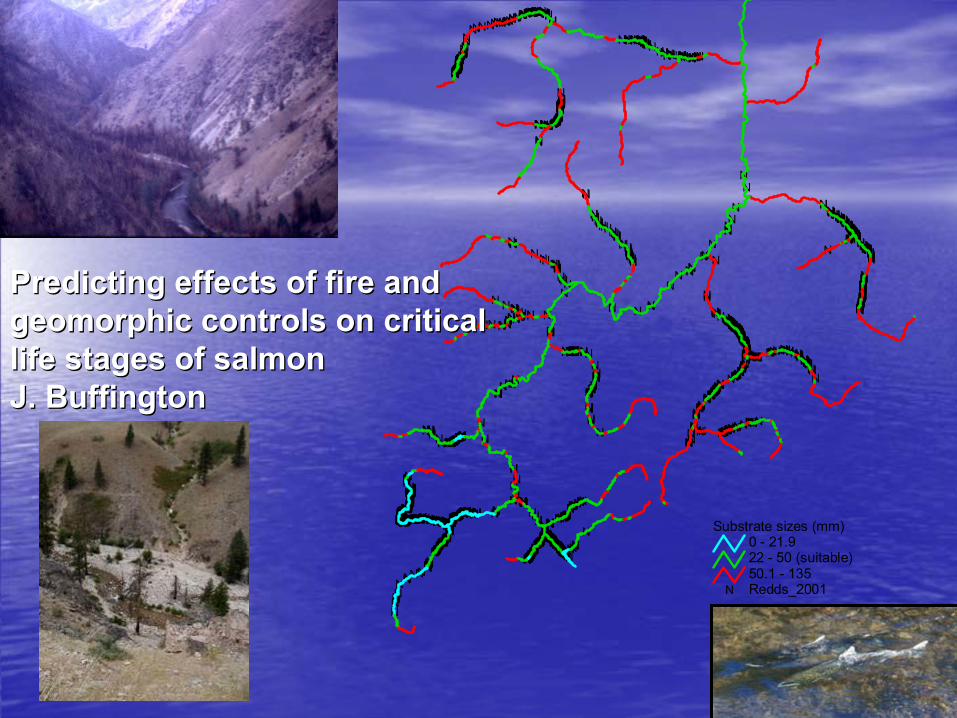
N Redds_2001
Substrate sizes (mm)0 - 21.922 - 50 (suitable)50.1 - 135
Predicting effects of fire and Predicting effects of fire and geomorphic controls on criticalgeomorphic controls on criticallife stages of salmonlife stages of salmonJ. BuffingtonJ. Buffington
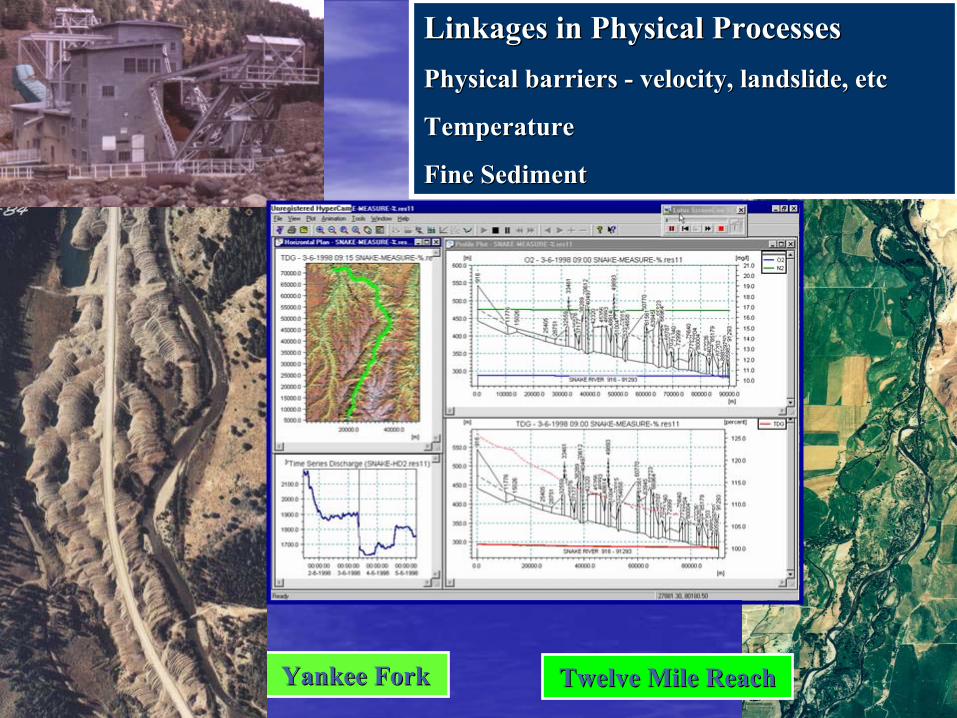
Yankee ForkYankee Fork
Linkages in Physical ProcessesLinkages in Physical ProcessesPhysical barriers Physical barriers -- velocity, landslide, etcvelocity, landslide, etc
TemperatureTemperature
Fine SedimentFine Sediment
Twelve Mile ReachTwelve Mile Reach
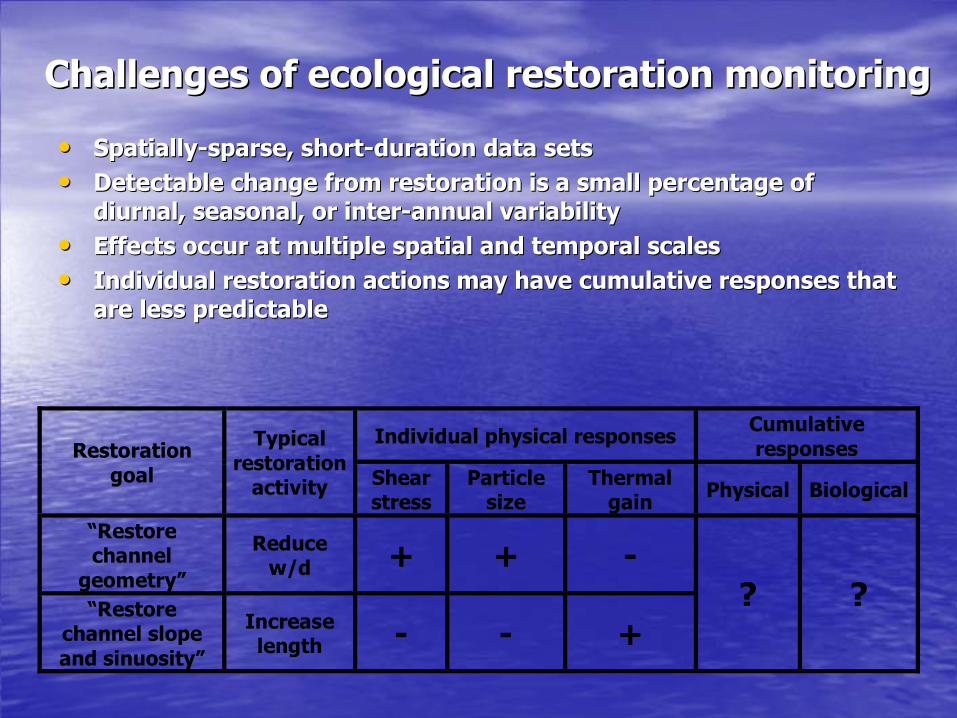
Challenges of ecological restoration monitoringChallenges of ecological restoration monitoring
•• SpatiallySpatially--sparse, shortsparse, short--duration data setsduration data sets•• Detectable change from restoration is a small percentage of Detectable change from restoration is a small percentage of
diurnal, seasonal, or interdiurnal, seasonal, or inter--annual variabilityannual variability•• Effects occur at multiple spatial and temporal scalesEffects occur at multiple spatial and temporal scales•• Individual restoration actions may have cumulative responses thaIndividual restoration actions may have cumulative responses that t
are less predictableare less predictable
Individual physical responses CumulativeresponsesRestoration
goal
Typicalrestoration
activity Shearstress
Particlesize
Thermalgain Physical Biological
“Restorechannel
geometry”
Reducew/d + + -
“Restorechannel slopeand sinuosity”
Increaselength - - +
? ?
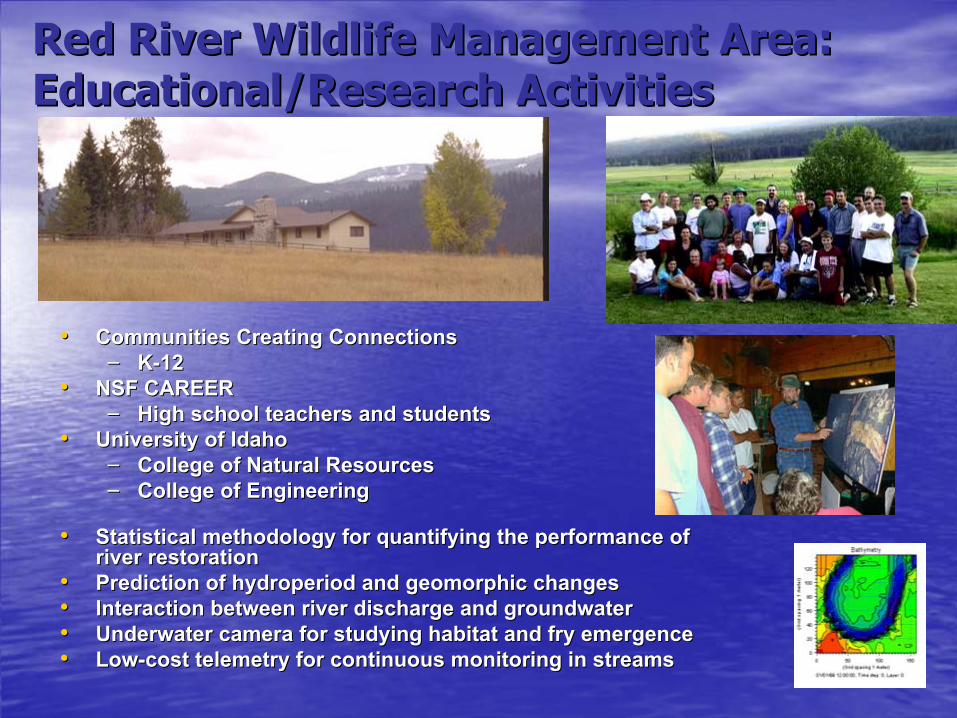
•• Communities Creating ConnectionsCommunities Creating Connections–– KK--1212
•• NSF CAREERNSF CAREER–– High school teachers and studentsHigh school teachers and students
•• University of IdahoUniversity of Idaho–– College of Natural ResourcesCollege of Natural Resources–– College of EngineeringCollege of Engineering
•• Statistical methodology for quantifying the performance of Statistical methodology for quantifying the performance of river restorationriver restoration
•• Prediction of Prediction of hydroperiodhydroperiod and geomorphic changesand geomorphic changes•• Interaction between river discharge and groundwaterInteraction between river discharge and groundwater•• Underwater camera for studying habitat and fry emergenceUnderwater camera for studying habitat and fry emergence•• LowLow--cost telemetry for continuous monitoring in streamscost telemetry for continuous monitoring in streams
Red River Wildlife Management Area:Red River Wildlife Management Area:Educational/Research ActivitiesEducational/Research Activities
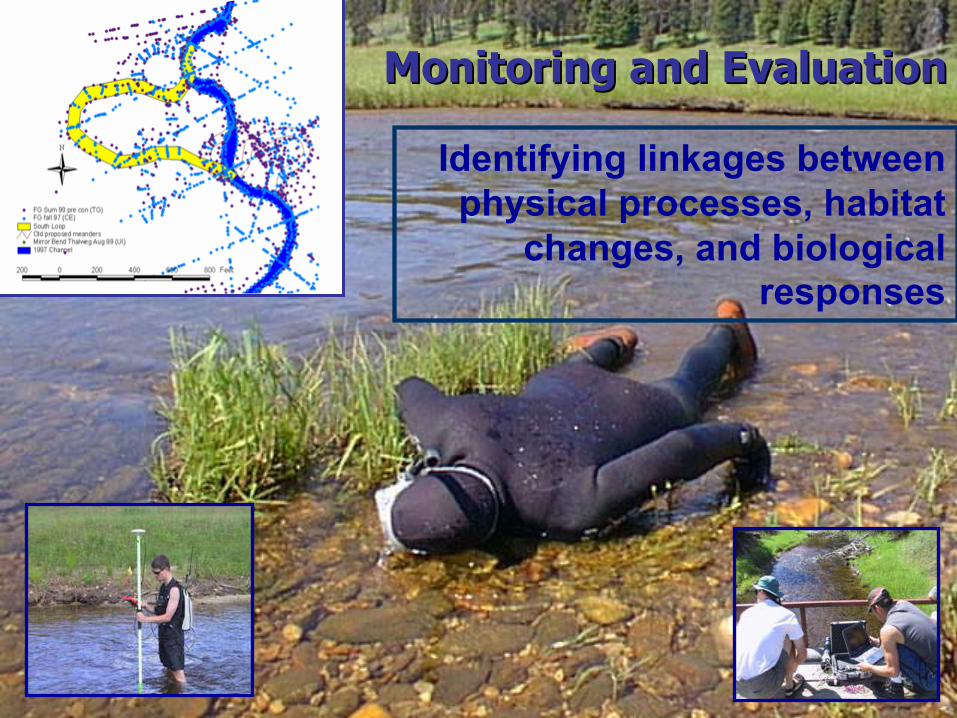
Identifying linkages between physical processes, habitat
changes, and biological responses
Monitoring and EvaluationMonitoring and Evaluation
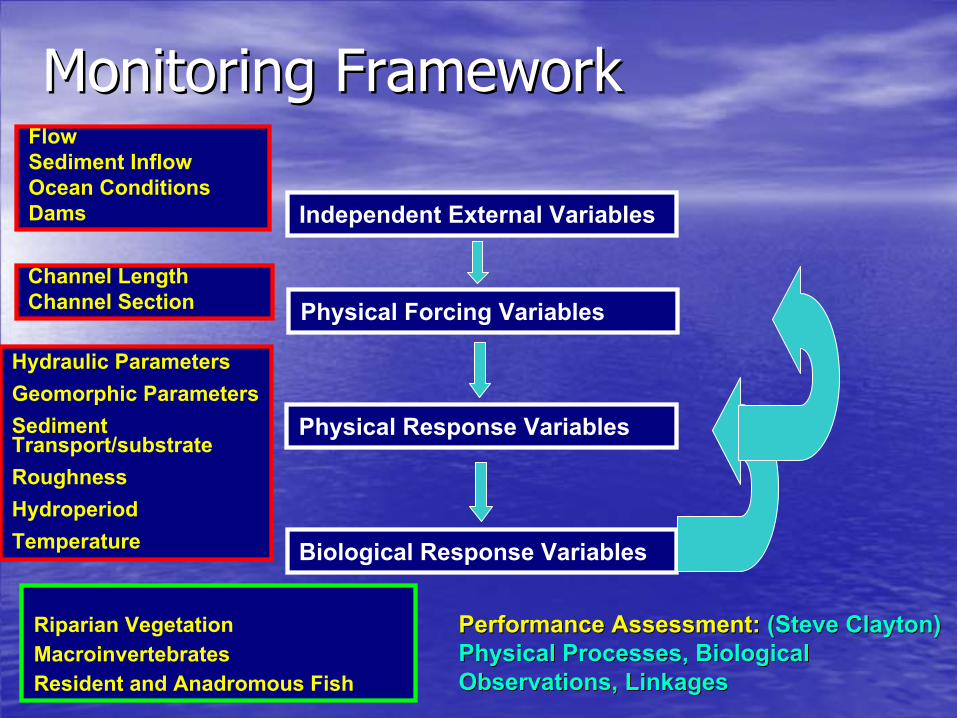
Monitoring FrameworkMonitoring Framework
Independent External Variables
Physical Forcing Variables
Physical Response Variables
Biological Response Variables
FlowSediment InflowOcean ConditionsDams
Channel LengthChannel Section
Hydraulic ParametersGeomorphic ParametersSediment Transport/substrateRoughnessHydroperiodTemperature
Riparian VegetationMacroinvertebratesResident and Anadromous Fish
Performance Assessment: Performance Assessment: (Steve Clayton)(Steve Clayton)Physical Processes, Biological Physical Processes, Biological Observations, LinkagesObservations, Linkages
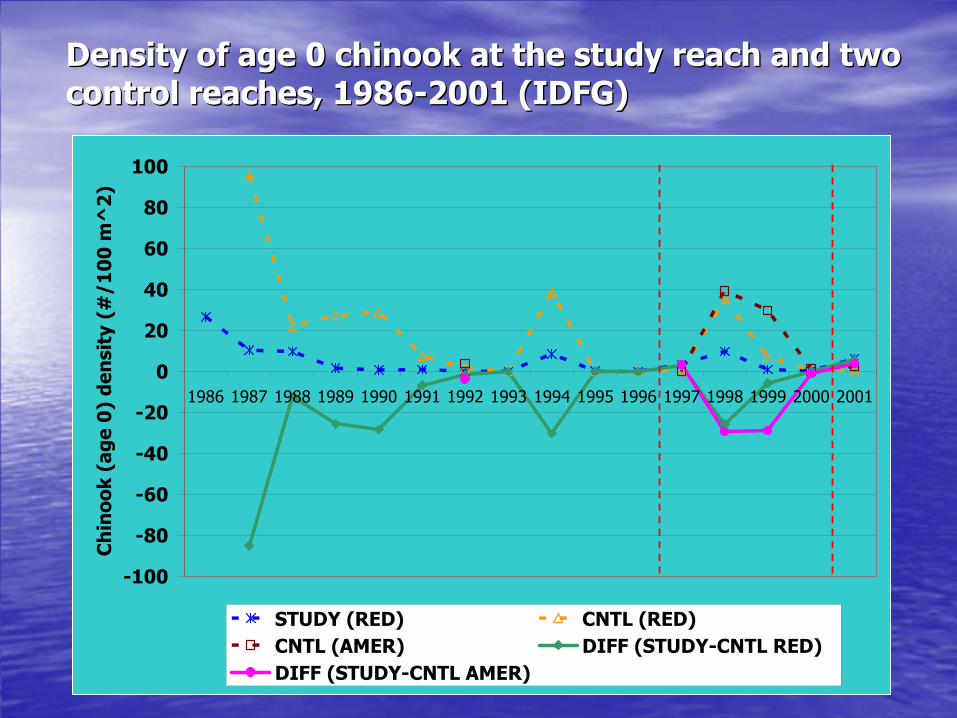
Density of age 0 chinook at the study reach and two Density of age 0 chinook at the study reach and two control reaches, 1986control reaches, 1986--2001 (IDFG)2001 (IDFG)
-100
-80
-60
-40
-20
0
20
40
60
80
100
1986 1987 1988 1989 1990 1991 1992 1993 1994 1995 1996 1997 1998 1999 2000 2001
Ch
inoo
k (a
ge 0
) de
nsi
ty (
#/1
00
m^
2)
STUDY (RED) CNTL (RED)CNTL (AMER) DIFF (STUDY-CNTL RED)DIFF (STUDY-CNTL AMER)
1994 2001YEAR
0.0
0.1
0.2
0.3
0.4
0.5
0.6
0.7
0.8
0.9
BA
SEFL
OW
VEL
OC
ITY
(m/s
)
1994 2001YEAR
0.1
0.2
0.3
0.4
0.5
0.6
0.7
0.8
0.9
1.0
1.1
BA
SEFL
OW
DEP
TH (m
)
1994 2001YEAR
0.0
0.1
0.2
0.3
0.4
0.5
0.6
0.7
0.8
BA
SEFL
OW
FR
OU
DE
NO
1994 2001YEAR
0
100
200
300
400
BA
SEF L
OW
WID
TH/D
EPTH
1994 2001YEAR
0.0
0.1
0.2
0.3
0.4
0.5
0.6
0.7
0.8
0.9
BA
SEFL
OW
AB
S A
*
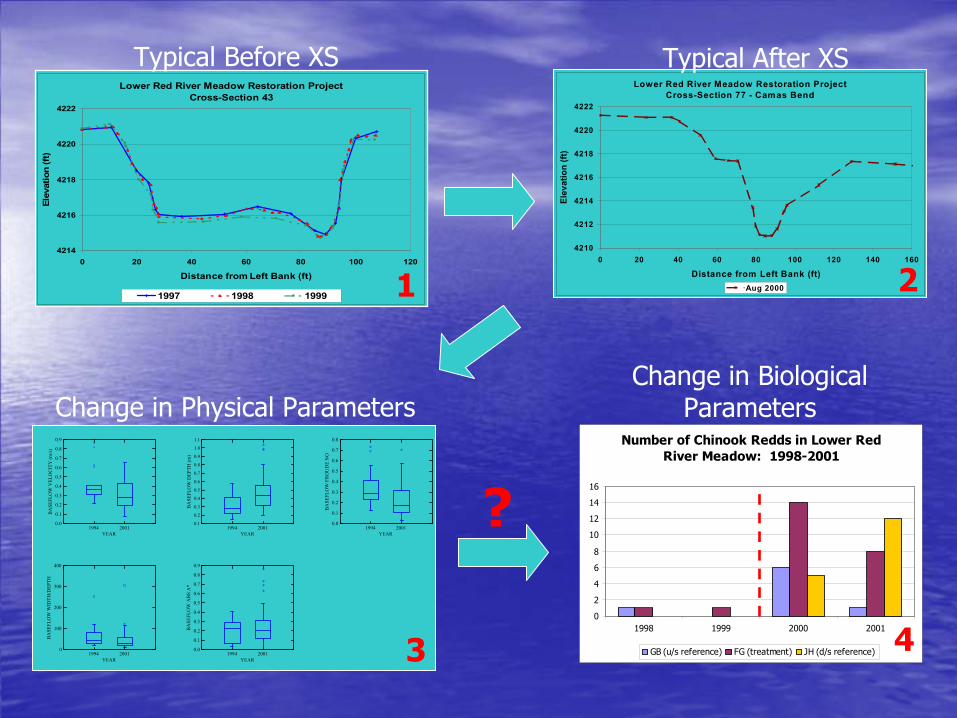
Lower Red River Meadow Restoration Project Cross-Section 43
4214
4216
4218
4220
4222
0 20 40 60 80 100 120
Distance from Left Bank (ft)
Elev
atio
n (ft
)
1997 1998 1999
Typical Before XSLower Red River Meadow Restoration Project
Cross-Section 77 - Camas Bend
4210
4212
4214
4216
4218
4220
4222
0 20 40 60 80 100 120 140 160
Distance from Left Bank (ft)
Elev
atio
n (ft
)
Aug 2000
Typical After XS
1 2
3
?Number of Chinook Redds in Lower Red
River Meadow: 1998-2001
0
2
4
6
8
10
12
14
16
1998 1999 2000 2001
GB (u/s reference) FG (treatment) JH (d/s reference)
Change in Biological Parameters
4
Change in Physical Parameters
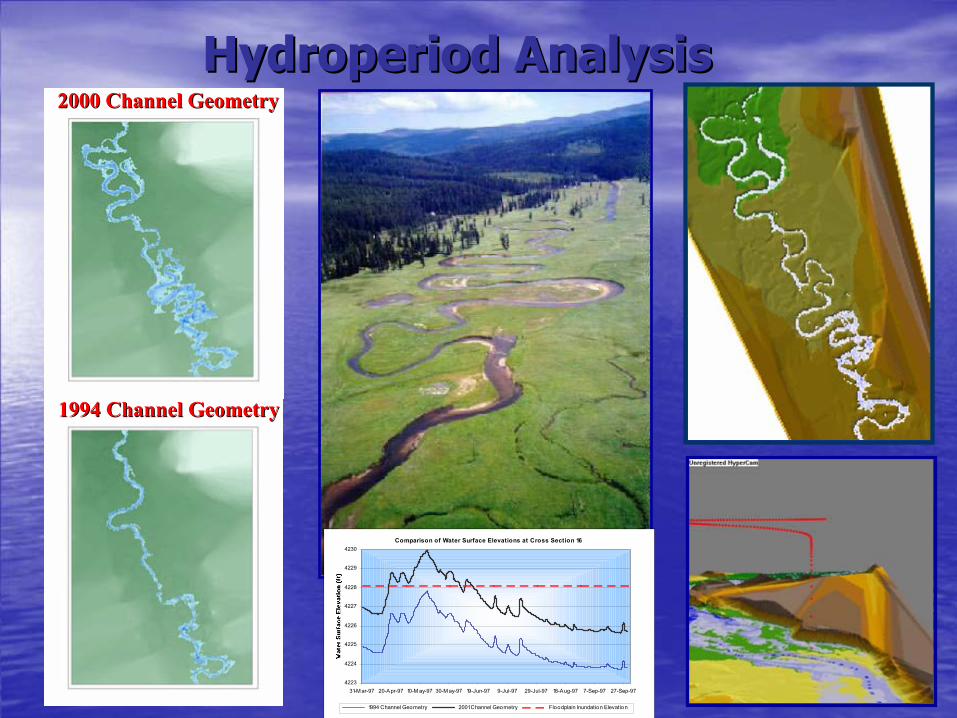
HydroperiodHydroperiod AnalysisAnalysis
1994 Channel Geometry1994 Channel Geometry
2000 Channel Geometry2000 Channel Geometry
Comparison of Water Surface Elevations at Cross Section 16
4223
4224
4225
4226
4227
4228
4229
4230
31-M ar-97 20-Apr-97 10-M ay-97 30-M ay-97 19-Jun-97 9-Jul-97 29-Jul-97 18-Aug-97 7-Sep-97 27-Sep-97
1994 Channel Geometry 2001 Channel Geometry Floodplain Inundation Elevation
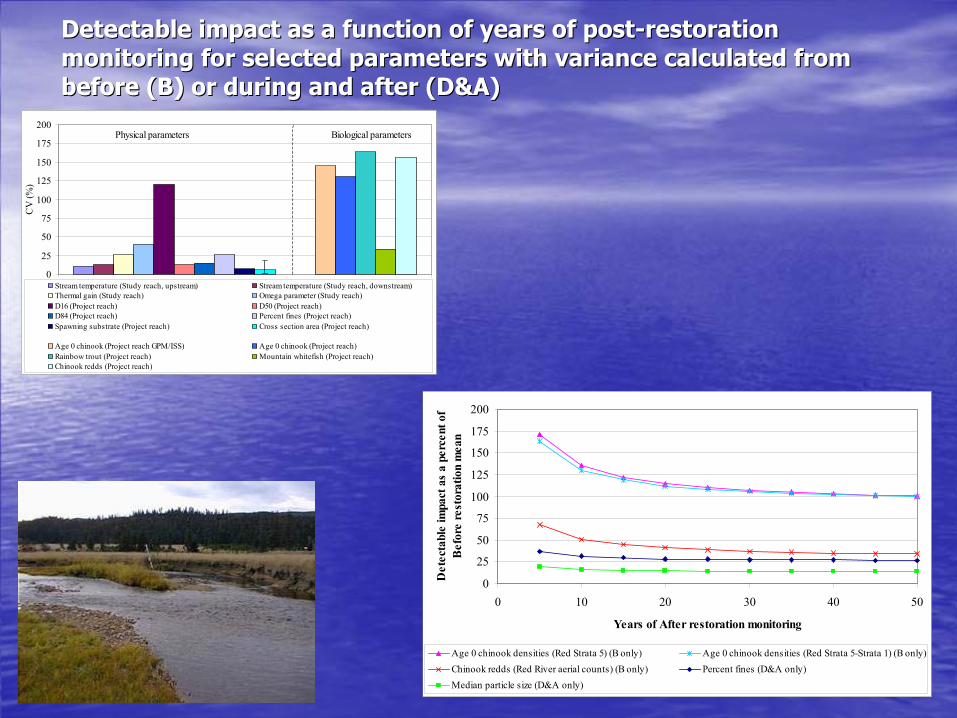
Detectable impact as a function of years of postDetectable impact as a function of years of post--restoration restoration monitoring for selected parameters with variance calculated frommonitoring for selected parameters with variance calculated frombefore (B) or during and after (D&A)before (B) or during and after (D&A)
0
25
50
75
100
125
150
175
200
0 10 20 30 40 50
Years of After restoration monitoring
Det
ecta
ble
impa
ct a
s a
perc
ent o
f B
efor
e re
stor
atio
n m
ean
Age 0 chinook densities (Red Strata 5) (B only) Age 0 chinook densities (Red Strata 5-Strata 1) (B only)Chinook redds (Red River aerial counts) (B only) Percent fines (D&A only)Median particle size (D&A only)
0
25
50
75
100
125
150
175
200
CV
(%)
Stream temperature (Study reach, upstream) Stream temperature (Study reach, downstream)Thermal gain (Study reach) Omega parameter (Study reach)D16 (Project reach) D50 (Project reach)D84 (Project reach) Percent fines (Project reach)Spawning substrate (Project reach) Cross section area (Project reach)
Age 0 chinook (Project reach GPM/ISS) Age 0 chinook (Project reach)Rainbow trout (Project reach) Mountain whitefish (Project reach)Chinook redds (Project reach)
Physical parameters Biological parameters
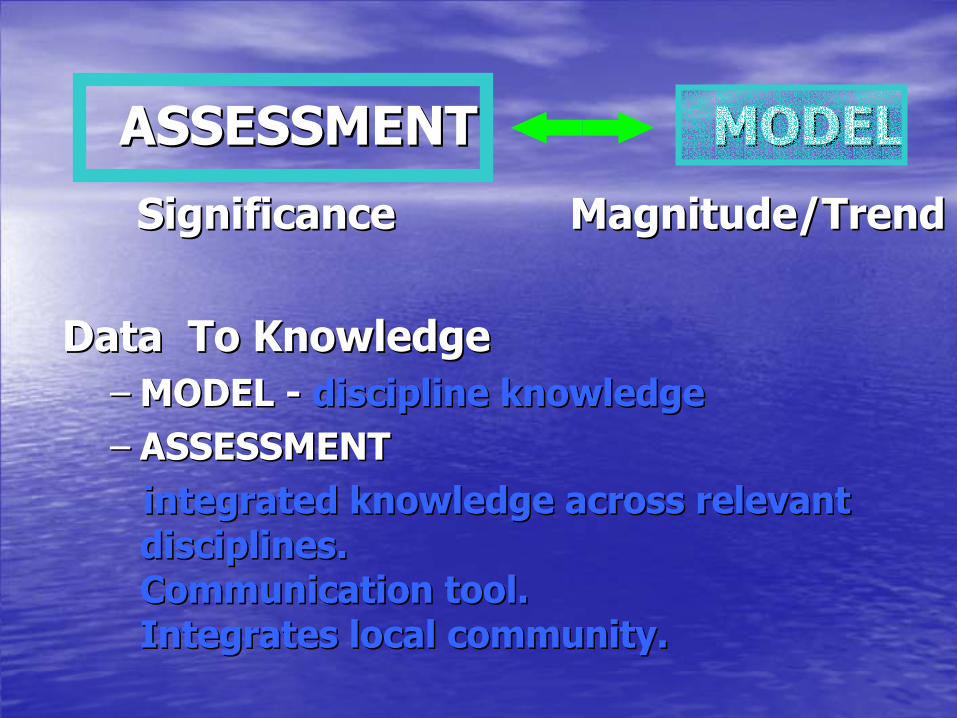
ASSESSMENT MODELASSESSMENT MODEL
SignificanceSignificance Magnitude/TrendMagnitude/Trend
Data To KnowledgeData To Knowledge–– MODEL MODEL -- discipline knowledgediscipline knowledge–– ASSESSMENT ASSESSMENT
integrated knowledge across relevant integrated knowledge across relevant disciplines. disciplines. Communication tool. Communication tool. Integrates local community.Integrates local community.
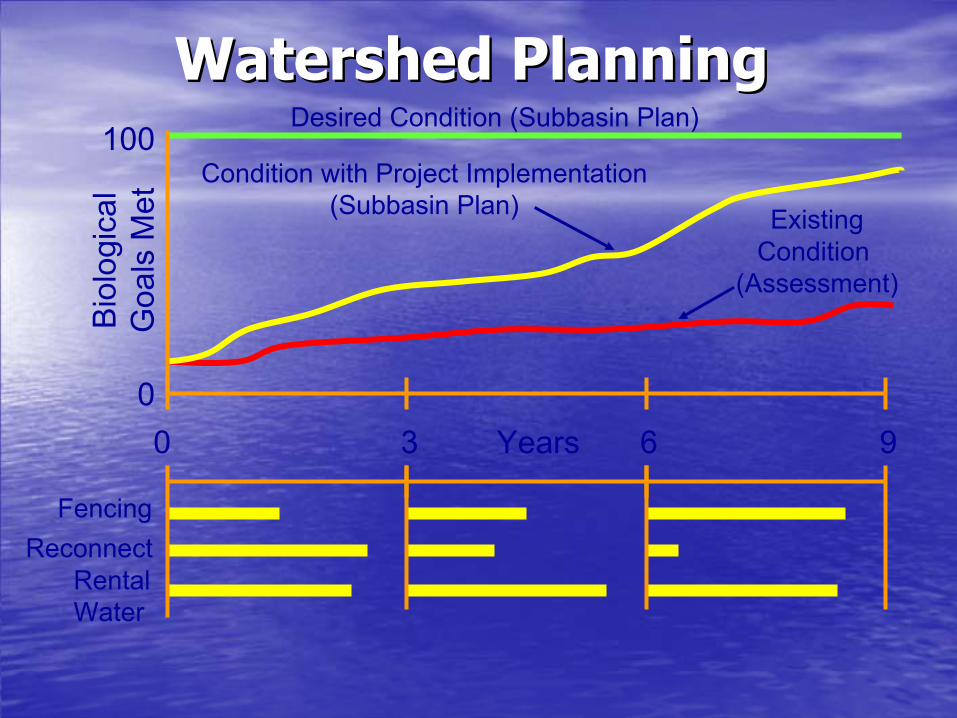
Watershed PlanningWatershed Planning
0
100Bi
olog
ical
Goa
ls M
et
0 3 6 9Years
ExistingCondition
(Assessment)
Desired Condition (Subbasin Plan)
FencingReconnect
RentalWater
Condition with Project Implementation(Subbasin Plan)
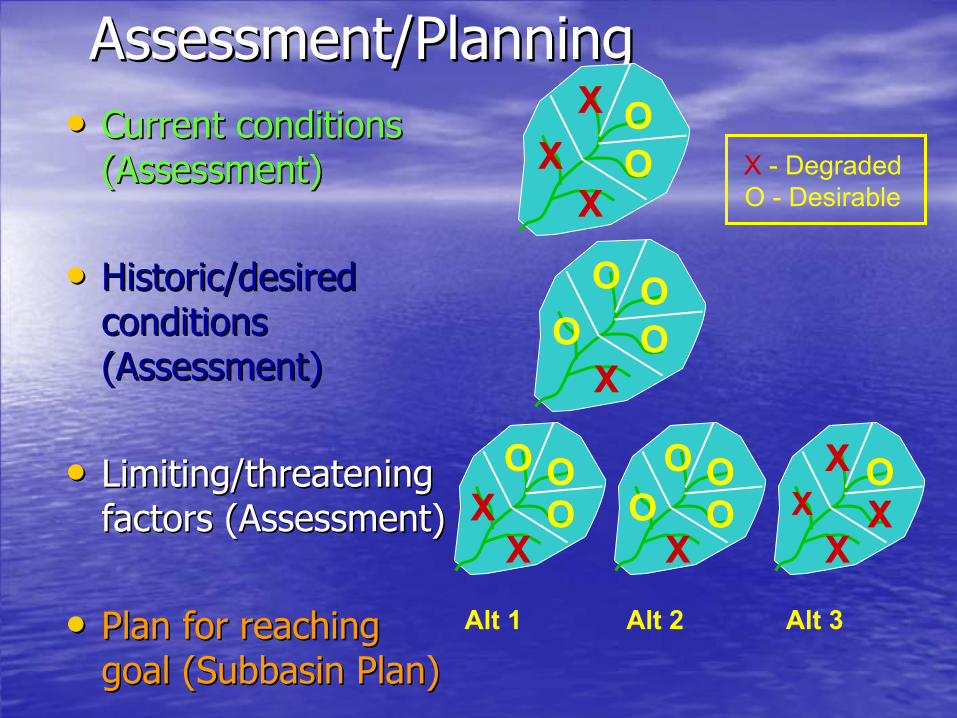
Assessment/PlanningAssessment/Planning•• Current conditionsCurrent conditions
(Assessment)(Assessment)
•• Historic/desired Historic/desired conditions conditions (Assessment)(Assessment)
•• Limiting/threatening Limiting/threatening factors (Assessment)factors (Assessment)
•• Plan for reaching Plan for reaching goal (Subbasin Plan)goal (Subbasin Plan)
XX
XOO
XO
OOO
XX
OOO
XO
OOO
XX
XXO
Alt 1 Alt 2 Alt 3
X - DegradedO - Desirable
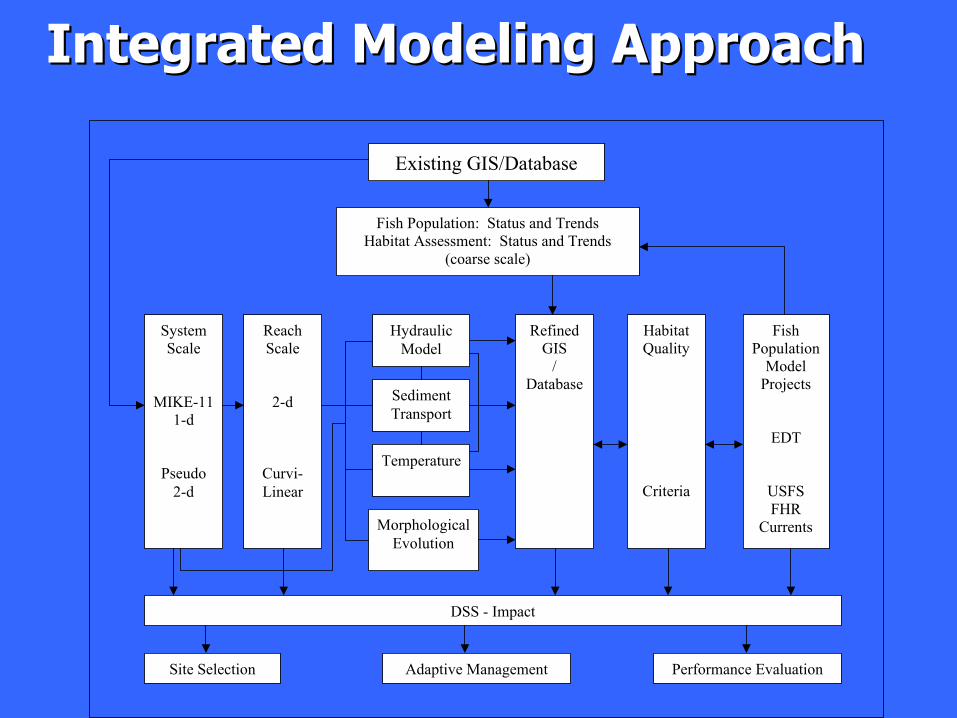
Existing GIS/Database
Fish Population: Status and Trends Habitat Assessment: Status and Trends
(coarse scale)
System Scale
MIKE-11 1-d
Pseudo 2-d
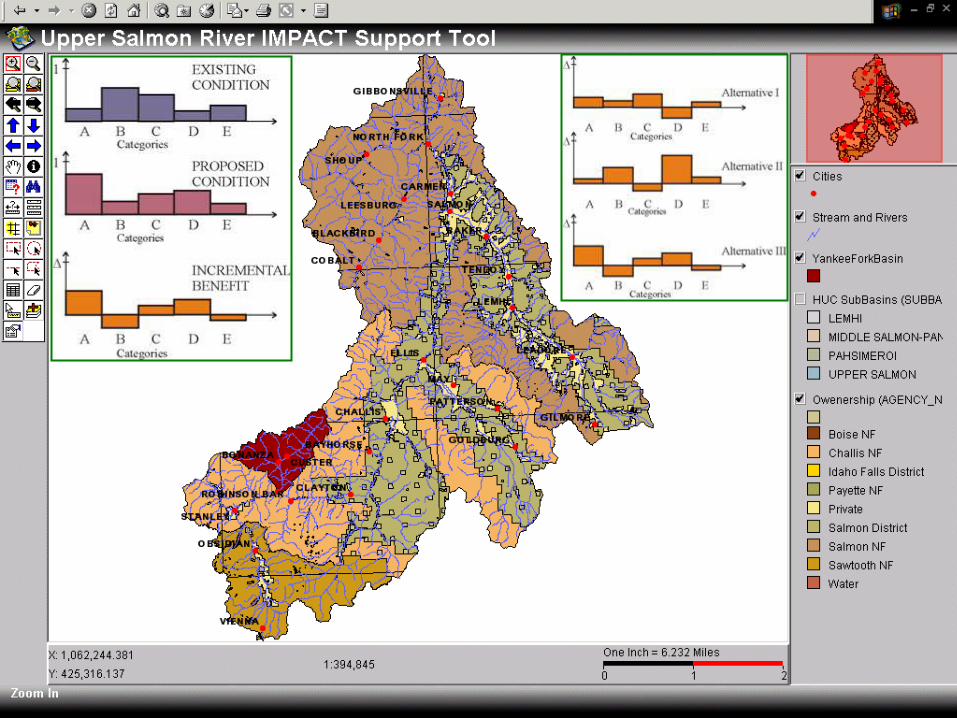
DSS - Impact
Site Selection Adaptive Management Performance Evaluation
Reach Scale
2-d
Curvi- Linear
Refined GIS
/ Database
Habitat Quality
Criteria
Fish Population
Model Projects
EDT
USFS FHR
Currents
Hydraulic Model
Sediment Transport
Temperature
Morphological Evolution
Integrated Modeling ApproachIntegrated Modeling Approach
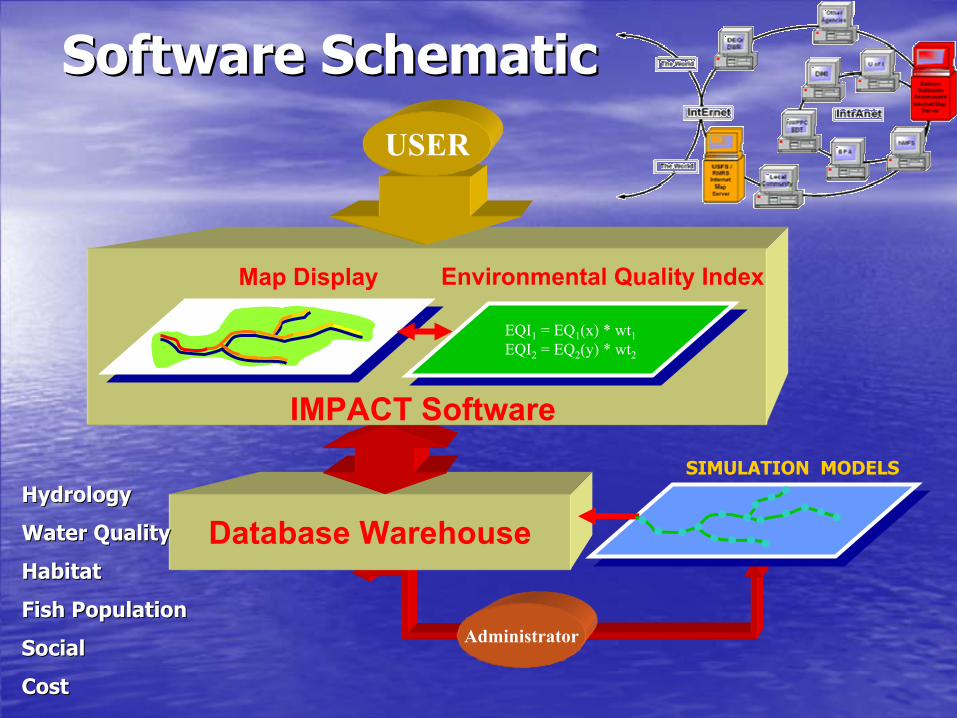
Software SchematicSoftware Schematic
Database Warehouse
SIMULATION MODELS
Environmental Quality IndexMap Display
IMPACT Software
USER
Administrator
EQI1 = EQ1(x) * wt1EQI2 = EQ2(y) * wt2
EQI1 = EQ1(x) * wt1EQI2 = EQ2(y) * wt2
HydrologyHydrology
Water QualityWater Quality
HabitatHabitat
Fish PopulationFish Population
SocialSocial
CostCost
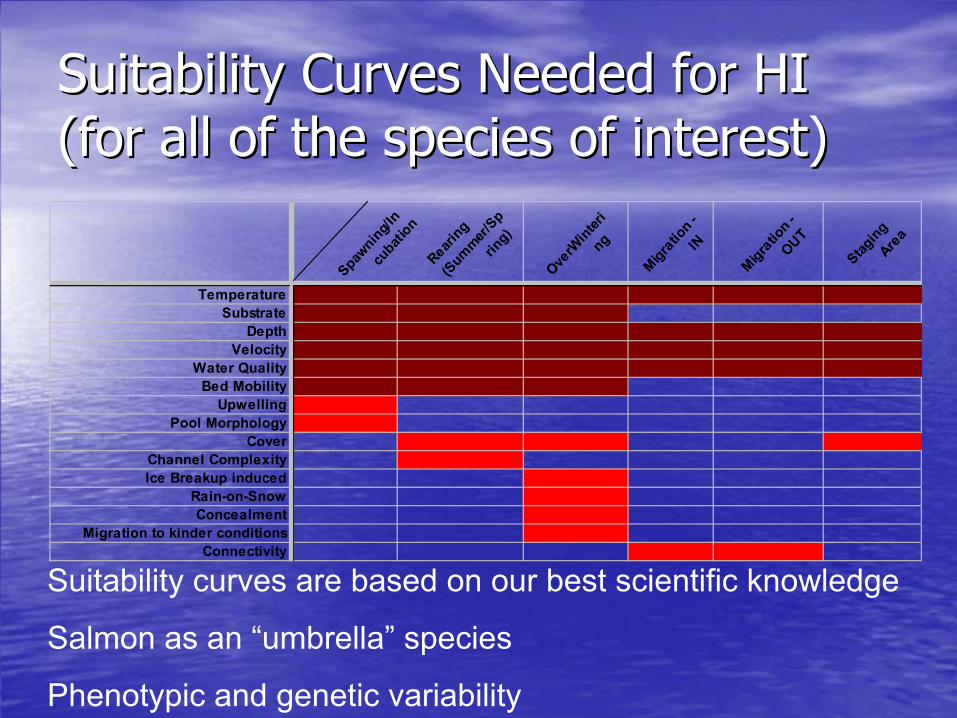
Suitability Curves Needed for HISuitability Curves Needed for HI(for all of the species of interest)(for all of the species of interest)
Spawning/I
ncu
bation
Rearing
(Sum
mer/Sp
ring)
OverW
interi
ng
Migratio
n - IN
Migratio
n - OUT
Staging
Are
a
TemperatureSubstrate
DepthVelocity
Water QualityBed Mobility
UpwellingPool Morphology
CoverChannel ComplexityIce Breakup induced
Rain-on-SnowConcealment
Migration to kinder conditionsConnectivity
Suitability curves are based on our best scientific knowledge
Salmon as an “umbrella” species
Phenotypic and genetic variability
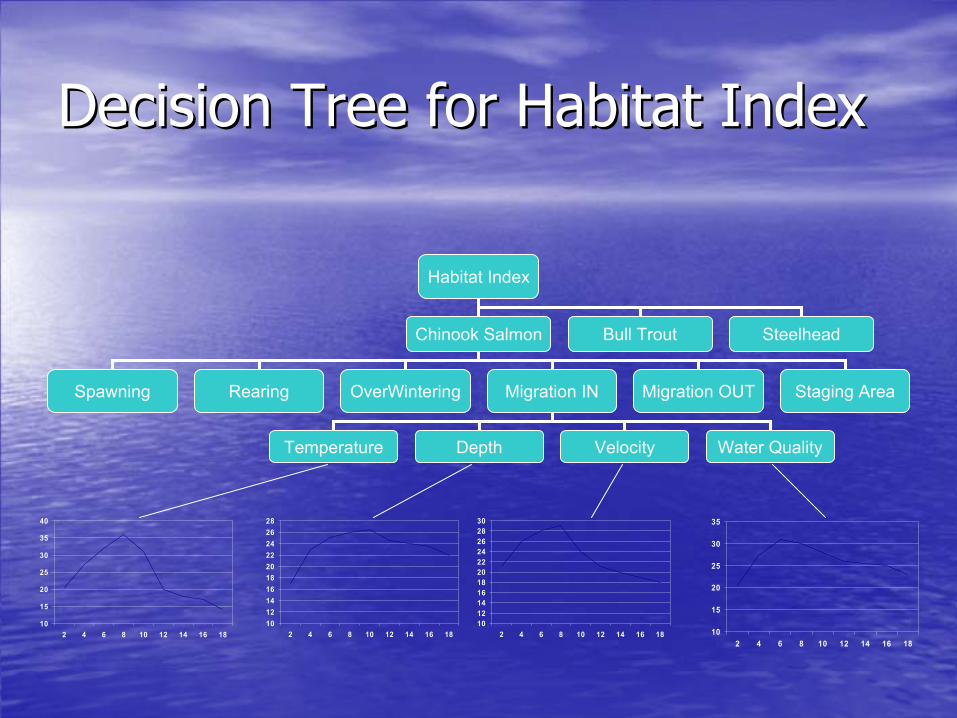
Decision Tree for Habitat IndexDecision Tree for Habitat Index
Habitat Index
Chinook Salmon Bull Trout Steelhead
Spawning Rearing OverWintering Migration IN Migration OUT Staging Area
Temperature Depth Velocity Water Quality
10121416182022242628
2 4 6 8 10 12 14 16 1810
15
20
25
30
35
40
2 4 6 8 10 12 14 16 181012141618202224262830
2 4 6 8 10 12 14 16 18 10
15
20
25
30
35
2 4 6 8 10 12 14 16 18
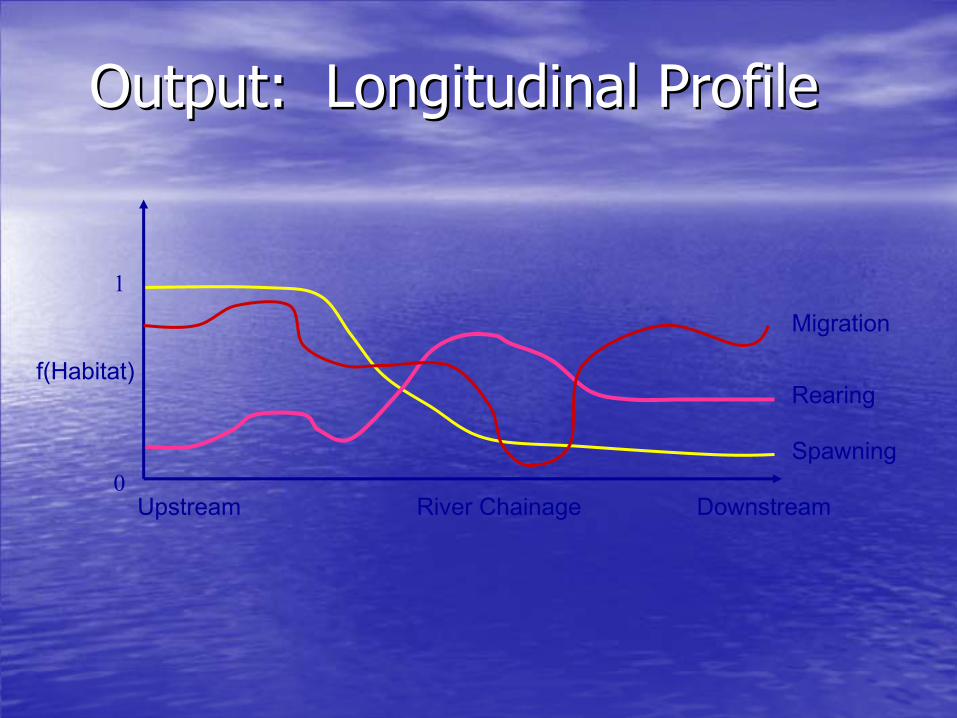
Output: Longitudinal ProfileOutput: Longitudinal Profile
River Chainage
1
0
Migration
Spawning
Rearing
DownstreamUpstream
f(Habitat)
2929
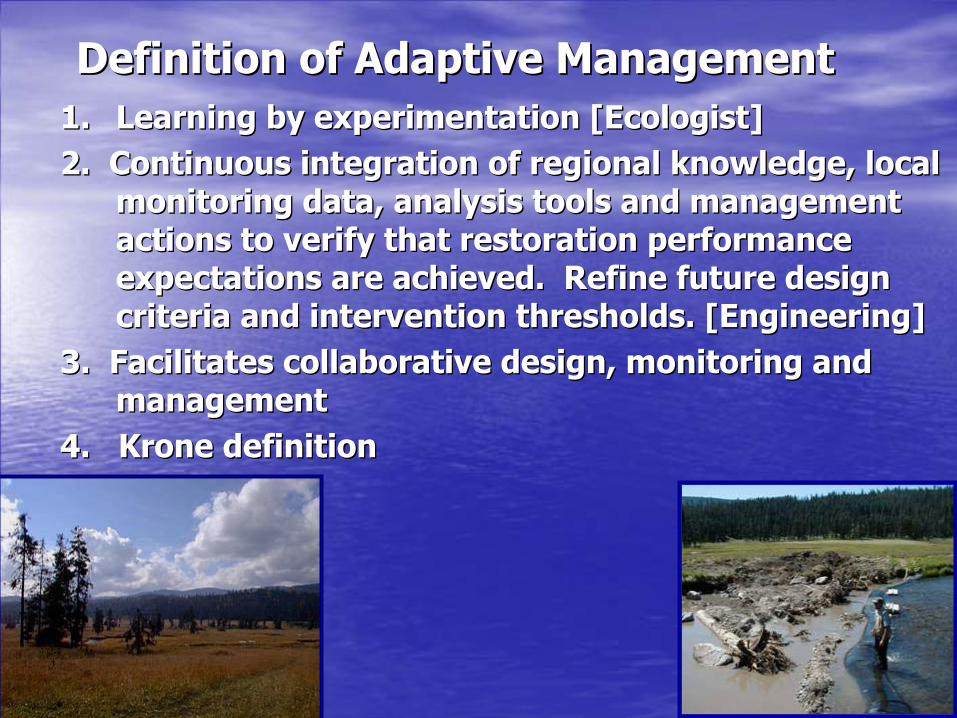
Definition of Adaptive ManagementDefinition of Adaptive Management1.1. Learning by experimentation [Ecologist]Learning by experimentation [Ecologist]2. Continuous integration of regional knowledge, local 2. Continuous integration of regional knowledge, local
monitoring data, analysis tools and management monitoring data, analysis tools and management actions to verify that restoration performance actions to verify that restoration performance expectations are achieved. Refine future design expectations are achieved. Refine future design criteria and intervention thresholds. [Engineering]criteria and intervention thresholds. [Engineering]
3. Facilitates collaborative design, monitoring and 3. Facilitates collaborative design, monitoring and managementmanagement
4. 4. KroneKrone definitiondefinition
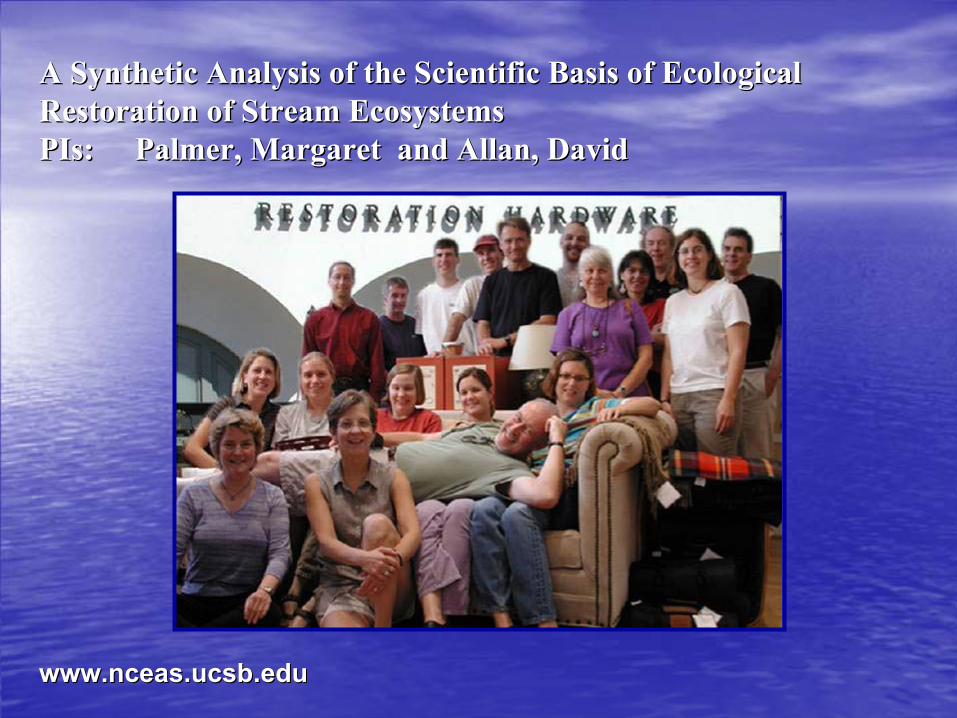
A Synthetic Analysis of the Scientific Basis of Ecological A Synthetic Analysis of the Scientific Basis of Ecological Restoration of Stream EcosystemsRestoration of Stream EcosystemsPIs:PIs: Palmer, Margaret and Allan, David Palmer, Margaret and Allan, David
www.nceas.ucsb.eduwww.nceas.ucsb.edu
Further details:Further details: www.ecohydraulics.uidaho.eduwww.ecohydraulics.uidaho.edu
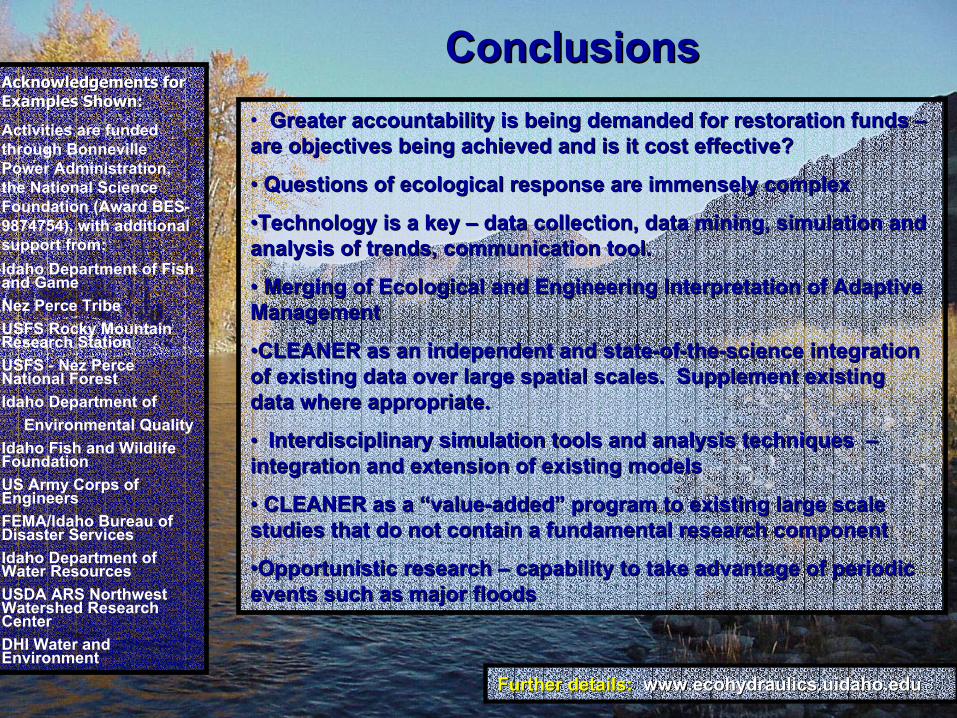
ConclusionsConclusionsAcknowledgements for Acknowledgements for Examples Shown:Examples Shown:
Activities are funded through Bonneville Power Administration, the National Science Foundation (Award BES-9874754), with additional support from:Idaho Department of Fish and GameNez Perce TribeUSFS Rocky Mountain Research StationUSFS - Nez Perce National ForestIdaho Department of
Environmental Quality Idaho Fish and Wildlife FoundationUS Army Corps of EngineersFEMA/Idaho Bureau of Disaster ServicesIdaho Department of Water ResourcesUSDA ARS Northwest Watershed Research CenterDHI Water and Environment
• Greater accountability is being demanded for restoration funds Greater accountability is being demanded for restoration funds ––are objectives being achieved and is it cost effective?are objectives being achieved and is it cost effective?
•• Questions of ecological response are immensely complexQuestions of ecological response are immensely complex
••Technology is a key Technology is a key –– data collection, data mining, simulation and data collection, data mining, simulation and analysis of trends, communication tool.analysis of trends, communication tool.
•• Merging of Ecological and Engineering Interpretation of AdaptivMerging of Ecological and Engineering Interpretation of Adaptive e ManagementManagement
••CLEANER as an independent and stateCLEANER as an independent and state--ofof--thethe--science integration science integration of existing data over large spatial scales. Supplement existingof existing data over large spatial scales. Supplement existingdata where appropriate.data where appropriate.
•• Interdisciplinary simulation tools and analysis techniques Interdisciplinary simulation tools and analysis techniques ––integration and extension of existing modelsintegration and extension of existing models
•• CLEANER as a “valueCLEANER as a “value--added” program to existing large scale added” program to existing large scale studies that do not contain a fundamental research componentstudies that do not contain a fundamental research component
••Opportunistic research Opportunistic research –– capability to take advantage of periodic capability to take advantage of periodic events such as major floodsevents such as major floods