Embed Size (px)
Citation preview

Copyright is owned by the Author of the thesis. Permission is given for a copy to be downloaded by an individual for the purpose of research and private study only. The thesis may not be reproduced elsewhere without the permission of the Author.

Mathematical models of biofilm growth and food particle
degradation in the gastrointestinal tract
A thesis presented in partial fulfillment of the requirements for the degree of
Doctor of Philosophy
in
Nutrition
at
Massey University
Palmerston North
New Zealand
Amy S. Van Wey Lovatt
2013

P a g e | ii

P a g e | iii
ABSTRACT
This thesis focuses on two important aspects of digestion: soluble nutrient loss
during gastric digestion and the fermentation of digesta by intestinal bacteria.
The bioaccessibility of nutrients within a food matrix has become of increasing
interest as it is the precursor of bioavailability. pH directly affects enzymatic reactions
and has a significant effect on the soluble loss from the food matrix. Analysis of the
propagation of acidic water in two model foods showed that the diffusion of the fluid
depends on both the pH and the food matrix. Mathematical models were developed to
describe the soluble particle loss during gastric digestion at various pH levels and to
predict the likely rate of soluble particle loss during digestion
Food components that are indigestible in the upper gastrointestinal (GI) tract are
likely substrate for the microbiota of the large bowel. The proximity of the
microorganisms to one another provides the potential for cross-feeding and competition
for nutrients. A modification of a mathematical model was used to characterize the
growth kinetics of 18 Bifidobacterium strains. This model was extended to describe
nutrient competition and cross-feeding between Bacteroides thetaiotaomicron and two
Bifidobacterium species and was able to predict their coculture growth dynamics based
on their respective monoculture growth kinetics.
While it has been known that the GI tract harbors a diverse bacterial population,
biofilms were only recently observed to be associated with the digesta. Biofilm growth
is critically dependent on the nutrient availability. Mathematical models that describe
nutrient transport within biofilms have made three simplifying assumptions: the
effective diffusion coefficient (EDC) is constant, is that of water, and/or is isotropic.
Using a Monte Carlo simulation, EDC values were determined, both parallel and

P a g e | iv
perpendicular to the substratum, within 131 single species, three-dimensional biofilms,
constructed from confocal laser scanning microscopy images. This study showed that
diffusion within bacterial biofilms was anisotropic and depth dependent. A new
reaction-diffusion model is proposed to describe the nutrient concentration within a
bacterial biofilm that accounts for the depth dependence of the EDC.
This thesis enhances our current knowledge in nutrition and microbiology by
providing more accurate models that describe food degradation due to acidic hydrolysis
and bacterial fermentation.

P a g e | v
ACKNOWLEGMENTS
There are many people with whom I owe my gratitude for their guidance,
support and encouragement. I would like to begin by thanking my many supervisors, all
of whom were available every time I needed them: Warren McNabb, Nicole Roy,
Adrian Cookson, Tanya Soboleva, Paul Moughan, and Paul Shorten. In particular, I
would like to thank Nicole Roy for her continued encouragement to publish my work
and unfailing effort to convert me from American to Kiwi English (who would have
thought it would be such a challenge to learn to use a “s” in place of a “z”); Adrian
Cookson for teaching me that it is quite acceptable to give deadlines to supervisors; Paul
Moughan and the Riddet Institute, Centre of Research Excellence, for granting me the
Earle Food Research Fellowship, which provided me with three years funding and
opportunities to attend both national and international conferences; Warren McNabb for
his willingness to continue to fund me and my project after my scholarship ended and
for not being offended when I referred to him as “my figure head, like the Queen of
England to New Zealand”; Tanya for being tough, which pushed me to work a bit
harder; and finally Paul Shorten, my go to guy who not only encouraged me throughout
my PhD process but was my constant sounding board and would at times “round me in”
when I had “lost the plot”.
A big thanks goes out to Romain Briandet and Arnaud Bridier. Without their
contribution (the growth and CLSM images of over 100 microbial biofilms) I would not
have been able to show that diffusion within biofilms is anisotropic. A big thanks also
goes to Robert Wieliczko for teaching me the basics in order for me to complete the
experiments necessary to model the degradation of food particles and to Pauline Hunt
for her critical and artistic eye in helping me to improve some of my figures.

P a g e | vi
I would like to thank the many friends I have met at the Ruakura Research
Centre and the Riddet Institute. Without their friendship, living in a foreign country
would not have been so enjoyable. To Margy Madsen and Chantelle Petrone, my
longtime friends who encouraged me throughout my entire academic career and pushed
me to continue when times were tough and I wanted to throw in the towel.
Most of all, I would like to thank my family. Without the encouragement of my
parents I may have never applied for the PhD project in New Zealand. More so, I would
like to thank them for a lifetime of continued emotional support and guidance. I would
like to thank my son for learning to make a life for himself in New Zealand and for his
subtle support over these years, despite his fears, disappointment, and anger for moving
him across the world (during his teenage years) and away from our wonderfully
supportive family. Last, I would like to thank my husband, Simon Lovatt, for refusing
to marry me until my PhD was submitted. What a motivator!

P a g e | vii
Contents
ABSTRACT .......................................................................................................................... III
ACKNOWLEGMENTS ......................................................................................................... V
CONTENTS ......................................................................................................................... VII
LIST OF FIGURES ............................................................................................................. XII
LIST OF TABLES .............................................................................................................. XIV
LIST OF ABBREVIATIONS .............................................................................................. XV
PUBLICATIONS ................................................................................................................ XVI
CHAPTER 1 INTRODUCTION ................................................................................ 17
1.1. BACKGROUND.......................................................................................... 17
1.2. DISSERTATION OVERVIEW ....................................................................... 18
CHAPTER 2 LITERATURE REVIEW ...................................................................... 28
2.1. FOOD DEGRADATION AS A RESULT OF GASTRIC DIGESTION .................... 28
EFFECTS OF THE COMPONENTS OF THE FOOD MATRIX ON 2.1.1.
GASTRIC DIGESTION ....................................................................... 30
MATHEMATICAL MODELS OF GASTRIC DIGESTION ......................... 31 2.1.2.
2.1.2.1. MATHEMATICAL MODELS OF FLUID AND FOOD PARTICLE
FLOW IN THE STOMACH ......................................................... 31
2.1.2.2. EMPIRICAL MODELS OF WET MASS RETENTION DURING
GASTRIC DIGESTION .............................................................. 32
2.1.2.3. EMPIRICAL MODELS OF DRY SOLID LOSS DURING GASTRIC
DIGESTION ............................................................................. 34
2.2. DIGESTION WITHIN THE SMALL BOWEL ................................................... 35
2.3. BACTERIAL BIOFILMS ASSOCIATED WITH FOOD PARTICLES IN THE
HUMAN LARGE BOWEL ........................................................................... 38

P a g e | viii
HEALTH BENEFITS ASSOCIATED WITH THE COMMENSAL 2.3.1.
INTESTINAL BACTERIA .....................................................................42
EFFECTS OF DIET ON THE MICROBIAL COMPOSITION .......................43 2.3.2.
2.3.2.1. POLYSACCHARIDES WITH PREBIOTIC EFFECTS........................46
2.3.2.2. MATHEMATICAL MODELS PREDICTING COCULTURE
DYNAMICS AND MICROBIAL CROSS-FEEDING ........................47
BACTERIAL BIOFILM FORMATION ....................................................52 2.3.3.
2.3.3.1. SURFACE CONDITIONING ........................................................53
2.3.3.2. INITIAL AND IRREVERSIBLE ATTACHMENT .............................54
2.3.3.3. BACTERIAL ATTACHMENT TO FOOD PARTICLES .....................56
2.3.3.4. THEORETICAL MODELS FOR BACTERIAL ATTACHMENT .........58
BIOFILM GROWTH AND DETACHMENT .............................................62 2.3.4.
2.3.4.1. NUTRIENTS AND GROWTH ......................................................63
2.3.4.2. QUORUM SIGNALING: STRUCTURE, VIRULENCE, AND
DETACHMENT .........................................................................64
2.3.4.3. NUTRIENT AND MOLECULE TRANSPORT IN BIOFILMS.............66
2.3.4.4. EFFECTIVE DIFFUSION COEFFICIENT .......................................67
2.3.4.5. RELATIONSHIP BETWEEN BIOFILM POROSITY OR DENSITY
AND NUTRIENT TRANSPORT ....................................................69
2.4. CONCLUDING COMMENTS .........................................................................72
2.5. AIMS OF RESEARCH ..................................................................................74
CHAPTER 3 A MATHEMATICAL MODEL OF THE EFFECT OF GASTRIC FLUID PH
ON FOOD DEGRADATION IN THE HUMAN STOMACH .........................78
3.1. ABSTRACT ................................................................................................78
3.2. INTRODUCTION .........................................................................................78

P a g e | ix
3.3. MATERIALS AND METHODS ..................................................................... 83
DIGESTION SIMULATION ................................................................. 83 3.3.1.
MATHEMATICAL MODEL OF MOISTURE TRANSPORT ...................... 85 3.3.2.
DETERMINING DIFFUSION COEFFICIENTS ........................................ 87 3.3.3.
DATA ANALYSIS ............................................................................. 90 3.3.4.
3.4. RESULTS AND DISCUSSION ...................................................................... 90
CHOICE OF MODEL FOOD MATRIX .................................................. 90 3.4.1.
EFFECT OF PH ON THE EFFECTIVE DIFFUSION COEFFICIENT ............ 91 3.4.2.
CHOICE OF EFFECTIVE DIFFUSION COEFFICIENT ............................. 95 3.4.3.
EFFECTIVE DIFFUSION COEFFICIENT AND RELATION TO PH IN 3.4.4.
CARROT........................................................................................... 98
BIOACCESSIBILITY MODEL ............................................................ 100 3.4.5.
3.5. CONCLUDING REMARKS ........................................................................ 103
CHAPTER 4 MONOCULTURE PARAMETERS SUCCESSFULLY PREDICT
COCULTURE GROWTH KINETICS OF BACTEROIDES
THETAIOTAOMICRON AND TWO BIFIDOBACTERIUM STRAINS ........... 105
4.1. ABSTRACT ............................................................................................. 105
4.2. INTRODUCTION ...................................................................................... 106
4.3. MATERIALS AND METHODS ................................................................... 109
MONOCULTURE AND COCULTURE BACTERIAL DATA .................... 109 4.3.1.
MECHANISTIC MODEL FOR BACTERIAL GROWTH IN 4.3.2.
MONOCULTURE ............................................................................. 110
4.4. RESULTS AND DISCUSSION .................................................................... 113

P a g e | x
MODEL FIT TO MONOCULTURE DATA ............................................113 4.4.1.
CLASSIFICATION OF BIFIDOBACTERIA STRAINS BASED ON THE 4.4.2.
MODEL PARAMETERS .....................................................................123
MECHANISTIC MODEL FOR COCULTURE BACTERIAL GROWTH ......125 4.4.3.
SENSITIVITY OF COCULTURE MODEL RESULTS TO GROWTH 4.4.4.
PARAMETERS BASED ON MONOCULTURE DATA ............................130
4.5. CONCLUDING COMMENTS .......................................................................133
CHAPTER 5 ANISOTROPIC NUTRIENT TRANSPORT IN THREE DIMENSIONAL
SINGLE SPECIES BACTERIAL BIOFILMS ..........................................135
5.1. ABSTRACT ..............................................................................................135
5.2. INTRODUCTION .......................................................................................136
5.3. MATERIALS AND METHODS ....................................................................140
BIOFILM STRUCTURES ....................................................................140 5.3.1.
MODELING DIFFUSION ...................................................................142 5.3.2.
5.4. RESULTS AND DISCUSSION .....................................................................143
ANISOTROPIC DIFFUSION ...............................................................143 5.4.1.
RELATIONSHIP BETWEEN DIFFUSION AND VOLUME FRACTION OF 5.4.2.
BACTERIA ......................................................................................147
THE EFFECTS OF EXTRACELLULAR POLYMERIC SUBSTANCES ON 5.4.3.
DIFFUSION ......................................................................................153
REACTION-DIFFUSION MODEL .......................................................156 5.4.4.
MODEL SIMULATION ......................................................................159 5.4.5.
5.5. CONCLUDING COMMENTS .......................................................................162
CHAPTER 6 KEY CONTRIBUTIONS AND RECOMMENDED FUTURE RESEARCH ....164
REFERENCES ................................................................................................................... 178

P a g e | xi APPENDIX A ...................................................................................................................... 196

P a g e | xii
List of Figures
Figure 2.1 Highlights of the human digestive process .................................................... 28
Figure 2.2 The three processes of food particle degradation .......................................... 30
Figure 2.3 (a) Three different profiles describing the wet mass retention ...................... 33
Figure 2.4 Bacterial counts in the gastrointestinal tract .................................................. 40
Figure 2.5 A conceptual schema of food degradation in relation to biofilm biomass .... 53
Figure 2.6 Schematic drawing of DLVO theory ............................................................. 59
Figure 2.7 The effective diffusion coefficient (EDC) as a function of distance ............. 68
Figure 2.8 A partial view of a Salmonella enterica biofilm ........................................... 70
Figure 3.1 Cross section of carrot core (a) and Edam cheese (b) ................................... 87
Figure 3.2 (a) Color density profile as a function of distance ......................................... 89
Figure 3.3 Cross section of carrot core after 20 minutes in acidic water ........................ 92
Figure 3.4 (a) AW concentration as a function of distance ............................................ 94
Figure 3.5 Acidic water penetration front profiles for carrot .......................................... 97
Figure 3.6 Estimated parameters A and b (squares), with standard error ....................... 99
Figure 3.7 Solid loss of carrots at fixed pH .................................................................. 101
Figure 3.8 pH of human gastric contents ...................................................................... 102
Figure 3.9 Carrot core solid loss at fixed pH of 1.8 ...................................................... 103
Figure 4.1 Model fit (Eqs. 4.2a-d) (solid lines) to Bifidobacterium catenulatum ......... 114
Figure 4.2 Model fit (Eqs. 4.2a-d) (solid lines) to Bifidobacterium adolescentis ......... 115
Figure 4.3 Model fit (Eqs. 4.2a-d) (solid lines) to bacterial growth ............................. 117
Figure 4.4 Model fit (Eqs. 4.2a-d) (solid lines) to Bifidobacterium gallacum ............. 118
Figure 4.5 Model fit (Eqs. 4.2a-d) (solid lines) to Bifidobacterium catenulatum ......... 119
Figure 4.6 Preferential degradation of oligosaccharide ................................................ 121
Figure 4.7 Growth kinetics of (a) Bifidobacterium longum LMG 11047 ..................... 128

P a g e | xiii
Figure 4.8 Coculture growth kinetics of Bifidobacterium breve Yakult ....................... 131
Figure 5.1 Model simulations of tortuosity ................................................................... 145
Figure 5.2 Volume fraction of bacteria, , within an E. coli biofilm ................. 147
Figure 5.3 Parity plot of simulated tortuosity factor ..................................................... 152
Figure 5.4 (a) Volume fraction of EPS ......................................................................... 154
Figure 5.5 (a) Concentration of glucose (g l-1) as a function of distance ...................... 160
Figure 5.6 Oxygen concentration (mol m-3) in artificial biofilms ................................. 162
zε1

P a g e | xiv
List of Tables
Table 2.1 Mathematical models describing the relationship between biofilm porosity . 71
Table 4.1 Parameter description and equations to for the coculture/cross-feeding model. ............................................................................................................................. 126
Table 5.1 Summary of experimental data used in Figure 5.1c ..................................... 146
Table 5.2 Random effects model for the coefficients a, b and c from Eq. 5.8 ............. 149
Table 5.3 Parameters used for modeling the concentration of nutrients ....................... 161

P a g e | xv
List of Abbreviations
Acid-Base (AB)
autoinducer 2 (AI-2)
chronic fatigue syndrome (CFS)
confocal laser scanning microscopy (CLSM)
degree of polymerization (DP)
Derjaguin-Landau-Verwey-Overbeek (DLVO)
effective diffusion coefficient (EDC)
extended DLVO (XDLVO)
extracellular polymeric substances (EPS)
fluorescence correlation spectroscopy (FCS)
fluorescence return after photo bleaching (FRAP)
fructose equivalents (FE)
gastrointestinal (GI)
gastric fluid (GF)
inflammatory bowel disease (IBD)
Lifshitz-van der Waals (LW)
Markov chain Monte Carlo (MCMC)
short chain fatty acids (SCFA)
simulated gastric fluid (SGF)
translocated intimin receptor (Tir)

P a g e | xvi
Publications
Van Wey, A. S., Cookson, A.L., Roy, N.C., McNabb, W.C., Soboleva, T.K., Shorten,
P.R. (2011) Bacterial biofilms associated with food particles in the human large bowel.
Molecular Nutrition and Food Research 55 (7); 969-978
Van Wey, A. S., Cookson, A.L., Soboleva, T.K., Roy, N.C., McNabb, W.C., Bridier, A.
Briandet, R., Shorten, P.R. (2012) Anisotropic nutrient transport in three-dimensional
single species bacterial biofilms. Biotechnology and Bioengineering 109 (5); 1280-1292
Van Wey, A. S., Cookson, A.L., Roy, N.C., McNabb, W.C., Soboleva, T.K., Wieliczko,
R.J., Shorten, P.R. (Submitted) A mathematical model of the pH and food matrix
composition on fluid transport into foods: An Application in gastric digestion and
cheese brining. Food Research International
Van Wey, A. S., Cookson, A.L., Roy, N.C., McNabb, W.C., Soboleva, T.K., Shorten,
P.R. (Submitted) Monoculture parameters successfully predict the coculture growth of
Bacteroides thetaiotaomicron and Bifidobacterium. ISME Journal
Van Wey, A.S. and Shorten, P.R. (Accepted) Mathematical models of food degradation
in the human stomach. In: Boland M, Golding M, Singh H (eds). Food Structures,
Digestion and Health. Elsevier.

P a g e | 17
Chapter 1 Introduction
1.1. Background
Diet is often considered the major driver influencing nutrition; however the diet
is only one aspect of human nutrition. In order for a healthy individual to make use of
the nutrients within their diet, the nutrients must first become bioaccessible (released
from the food matrix) and bioavailable (absorbed and used by the host). Thus, the
ability of the gastrointestinal (GI) tract to function efficiently is a component of both the
effectiveness of bioaccessibility and bioavailability of nutrients.
The bioaccessibility of nutrients begins with mastication and the secretion of
salivary enzymes (amylase and lingual lipase), which soften and fragment the food into
smaller particles. This fragmentation increases the overall surface area to volume ratio,
which improves digestion within the stomach. The increased surface area to volume
ratio provides additional contact area for gastric fluid (GF) to absorb into the food
particle; this absorption of GF tenderizes the food matrix and increases the
bioaccessibility of the nutrients within the food matrix. These nutrients are then
transported into the small bowel for absorption and then become bioaccessible. For
particles that are still too large to be passed to the small bowel, peristaltic contractions
squeeze the food bolus and create retropulsive flow patterns which moves the food
bolus from the antrum to the proximal region of the stomach. This movement, in
conjunction with the force of the contractions, contributes to additional fracturing of
food components and also causes erosion of the food matrices as the particles come into
contact with other foods within the bolus.

P a g e | 18
Within the small bowel, additional proteases (trypsin, chymotrypsin,
carboxypeptidase, etc.), pancreatic lipase and bile salts are secreted which are absorbed
into the food matrix. Here most of the protein and fat contents of food are leached into
the lumen of the small bowel then transported through the intestinal epithelium for
utilization by the host. Components of the food matrix that are indigestible by the host
are then passed into the large bowel. While it is commonly believed that all available
nutrients have been absorbed in the small bowel and thus the host has received all
possible benefits from the diet, this is not the case.
Historically, it has been believed that the function of the large bowel is to absorb
water and salts before the removal of the undigested food components. However, over
the past 30 years the focus of scientific research on the interaction between the
commensal intestinal bacteria and the host has demonstrated that the large bowel has a
much broader role in human health. The large bowel provides a nutrient rich
environment in which a diverse bacterial population thrives. It is estimated that there are
1014 bacteria cells within the digestive tract (Luckey 1972), composed of over 1000
distinct bacterial species (Hooper and MacPherson 2010). As the bacteria ferment the
non-digested food components, they produce metabolites that are essential for human
health. Indeed, intestinal bacteria provide the major source of metabolites such as folic
acid.
1.2. Dissertation Overview
This thesis aims to mathematically model some of the key components of human
digestion. Here the focus is on specific topics in which there is a significant gap in the
current literature in order to elucidate the key physiological factors involved in nutrient
bioavailability. In particular, this thesis focuses on two significant aspects of digestion.

P a g e | 19
Primarily, this thesis focuses on the interaction between the commensal bacteria and
food particles in the human large bowel. The effects of gastric pH and food matrix
composition on the digestion of food within the human stomach are also considered in
this thesis. This gastric digestive aspect was instigated in order to understand how
bacteria metabolize non-digested food components in that extracellular enzymes may
degrade food particles in a manner similar to the way nutrients are released from a food
matrix by gastric fluid. The interaction between the commensal bacteria and food
particles in the human large bowel is also dependent on the food particle size and
composition, which in turn are dependent on digestion in the stomach.
It may be argued that food particle size and composition also depends upon the
digestive process in the small bowel. Such a statement is true; however, the commensal
intestinal bacteria are primarily saccharolytic and thus preferentially ferment dietary
fiber such as resistant starch and non-starch polysaccharides. The rapid transit time of
dietary fiber, combined with the low bacterial population within the small bowel,
minimizes the impact of particle degradation by the small bowel commensal bacteria.
Essentially, the substrates preferred by the commensal bacteria will pass from the
stomach through the small bowel having only been altered by the gastric environment.
Thus, gastric digestion, rather than small bowel digestion, plays a significant role in
determining the particle size and composition of the food matrix that will be fermented
by the commensal bacteria in the large bowel.
Chapter 2 includes a review of gastric digestion, the effects of the components of
the food matrix on digestibility and the mathematical models currently in the literature
which relate to the degradation of food particles within the human stomach. Most of the
section reviewing gastric digestion and the models related to gastric digestion will be
published, as a book chapter, in the book titled Food Structures, Digestion and Health

P a g e | 20
(Van Wey and Shorten Accepted). Chapter 2 also reviews the current literature with
regards to bacterial biofilms associated with food particles in the human large bowel.
This review was published in Molecular Nutrition and Food Research (Van Wey et al
2011). Mathematical models of biofilm growth and nutrient transport within biofilms
are reviewed along with current methods for determining nutrient transport within
biofilms. Much of this section has been published in Biotechnology and Bioengineering.
Lastly, Chapter 2 summarizes the literature on the substantial impact of bacterial
metabolites on human health, the relevance of considering oligofructose and inulin as
substrates for the commensal intestinal bacteria, as well as an analysis of the
mathematical models within the literature that focus on microbial competition/cross-
feeding. This section is based on the introduction in the manuscript submitted to ISME
Journal. [Please see the List of Publications for details].
In Chapter 3, the effects of gastric pH and food matrix composition, on the
digestion of food within the human stomach, are considered. Within this chapter, the
effects of gastric pH and food composition on the propagation of the wetting front of
simulated gastric fluid without pepsin or mucin in two food models (carrot and Edam
cheese) are measured and analyzed. A model to describe the non-linear rate of soluble
particle loss during digestion at various constant pH levels is developed, which
incorporates the non-linear propagation of the acidic water into the food matrix. In
addition, a model to predict the likely rate of soluble particle loss during digestion in the
stomach is developed, which accounts for the change of pH during the digestion time
period. The content of Chapter 3 has been submitted to Food Research International for
publication (Van Wey et al Submitted-b).
In Chapter 4, models of the metabolism of fructose, oligofructose and inulin by
the commensal intestinal bacteria are described. Within this chapter, a model that draws

P a g e | 21
upon the previously proposed dynamic, mechanistic mathematical model of Amaretti et
al (2007) to describe the mechanisms for substrate consumption and subsequent
microbial growth and metabolite production for bacteria grown in monoculture is
developed. This model is modified to describe the preferential degradation of
oligofructose for monoculture microbial growth.
In addition to the aforementioned models, a model is developed to describe
competition between two bacterial species for a particular substrate as well as cross-
feeding resulting from the breakdown products from extracellular carbohydrate
hydrolysis by one of the bacterial species. This competitive/cross-feeding model
incorporates the primary metabolites produced by both bacterial species. The
competition/cross-feeding model is used to explore and predict the growth dynamics
between Bacteroides thetaiotaomicron LMG 11262 and Bifidobacterium longum LMG
11047 and Bacteroides thetaiotaomicron LMG 11262 and Bifidobacterium breve
Yakult as compared to experimental coculture data.
Chapter 4 can be considered a macroscopic view of the formation of heterogeneous
bacterial biofilms within the human GI tract. The work in Chapter 4 has been submitted
for publication in ISME Journal (Van Wey et al Submitted-a).
In Chapter 5, a microscopic view of bacterial biofilms is employed to investigate
the transport of nutrients within a bacterial biofilm. Within this chapter, (1) a method is
developed to determine the effective diffusion coefficient (EDC) within 131 distinct,
single species, three-dimensional bacterial biofilms; (2) the level of anisotropic
transport within bacterial biofilms is characterized; (3) the relationship between the
porosity of the biofilm and the EDC is determined; and (4) a model for nutrient
transport within a bacterial biofilm growing on a nutrient-providing substratum is

P a g e | 22
constructed. The work presented in Chapter 5 has been published in Biotechnology and
Bioengineering (Van Wey et al 2012).

P a g e | 23

P a g e | 24

P a g e | 25

P a g e | 26

P a g e | 27

P a g e | 28
Chapter 2 Literature Review
2.1. Food Degradation as a Result of Gastric Digestion
Digestion begins with the mastication of food particles [Figure 2.1]. While
mastication is not essential to the chemical breakdown of food particles in the stomach
(Davenport 1982), it is beneficial in that mastication mixes the food with the saliva
which lubricates and softens the foods. Additionally, a key enzyme in saliva, -
amylase, aids in the digestion of starch during gastric digestion when the pH of the
gastric contents is greater than three (Bornhorst and Singh 2012). Most importantly, the
Figure 2.1 Highlights of the human digestive process which begins with mastication and
ends with bacterial fermentation of undigested food particles in the large bowel.

P a g e | 29
process of mastication reduces the particle size which increases the surface area of the
particles allowing for more contact with and increased absorbance of gastric fluid upon
entering the stomach.
The human stomach is a dynamic and complex system, where the degradation of
food particles is the result of mechanical forces and chemical reactions. Peristaltic
movements in the stomach compress the food bolus which may lead to fracturing of
particular food matrices. The peristaltic movements also move the viscous food bolus in
a retropulsive flow pattern. This movement leads to shearing and erosion of the
individual food surfaces through contact with other food components in the bolus. In
addition to mechanical forces, acidic hydrolysis and enzymatic reactions cause leaching
of nutrients from the food matrix to be absorbed in the small bowel. Food digestion
kinetics are not limited to mechanical forces, but also depend on food structures,
particle size, meal volume and composition, viscosity, pH, temperature and enzymatic
reactions.
Food particles are broken down by the processes of erosion, fragmentation, and
tenderization (Kong and Singh 2009a, Kong and Singh 2009b, Kong et al 2011, Kong
and Singh 2011). These processes are shown in Figure 2.2. Erosion describes the
process of the gradual wearing away of the food surface when the applied stresses are
less than that required to fracture or break the food particle. Fragmentation describes the
breaking of food particles into two or more similar sized particles. The process of
tenderization occurs as a result of the transport of gastric juice into the food particle and
the resulting softening of the food matrix. In general, the process of tenderization
increases the rate of erosion and fragmentation. The transport of gastric juice into food
particles also facilitates leaching of solids into the gastric medium.

P a g e | 30
Effects of the Components of the Food Matrix on 2.1.1.Gastric Digestion
The food matrix composition has a marked effect on the degradation of the food
particle and may restrict or enhance enzymatic reactions. The digestibility of proteins in
various foods (legumes, cereals, milk products, chicken and kiwifruit) can be dependent
upon the protein secondary structure, in particular the β-sheets (Bublin et al 2008,
Carbonaro et al 2012, Guo et al 1995). These same secondary structures are found in β-
lactoglobulin, which has been shown to be resistant to proteolysis by both pepsin and
trypsin (Guo et al 1995).
While it is expected that the amount of protein in a food matrix would have an
effect on the ability of pepsin to hydrolyze peptides, the amount of fat in the food matrix
Figure 2.2 The three processes of food particle degradation: (a) tenderization, (b) erosion
and (c) fragmentation.

P a g e | 31
can also have a marked effect on protein digestibility. In a double-blind placebo-
controlled food challenge that tested for the allergenicity of peanuts in a recipe with low
and high fat content, it was found that the high fat content resulted in a low oral
allergenic effect (Grimshaw et al 2003). It was surmised that the lack of early oral
warning signs (i.e. anaphylactic response) was due to a concealing effect by the fat in
the high-fat food matrix, which reduced the bioaccessibility of the proteins. The ability
of fat to restrict the bioaccessibility of foods during gastric digestion has also been
shown in studies with vitamin B12 encapsulated in a water-in-oil-in-water double
emulsion (Giroux et al 2013). In the study only 4.4% of vitamin B12 was released after
120 minutes of gastric digestion. Thus, the fat content of foods will have an effect on
the digestibility, and hence, bioaccessibility of nutrients.
Mathematical Models of Gastric Digestion 2.1.2.There are remarkably few mathematical models in the literature that describe
food degradation in the human stomach.
2.1.2.1. Mathematical Models of Fluid and Food Particle Flow in the Stomach
The area that has received the most attention is that of modeling the motility and
geometry of the human stomach (Ferrua et al 2011). These models are based on
computation fluid dynamics (CFD). CFD has also been used in industrial/engineering
contexts to model particle-fluid flow, particle-fluid interactions, particle-particle
interactions, particle-wall interactions and particle erosion (which has been described as
a function of the particle impact velocities) (Li et al 2009).
Many of these models have described the stomach geometry and motility in two
dimensions for simplicity; however, Ferrua & Singh (2010) using a 3-D model have
shown that the flow of gastric contents is three dimensional and that the 2-D models

P a g e | 32
cannot account for the differences in velocity and flow patterns as described with a 3-D
model. In particular, the 2-D model cannot reproduce the retropulsive flow pattern and
eddy structures predicted by the 3-D model. The 3-D model predicted “that the strongest
fluid motions developed in the antropyloric region, and that a slow but constant flow
recirculation occurred between the proximal and distal regions of the stomach” (Ferrua
et al 2011).
While the 3-D model has provided good insight into the function of peristaltic
contractions and the movement of the stomach contents, it has yet to be expanded to
describe the shearing or fracturing of food components in the human stomach or the
leaching of nutrients from the food matrix.
2.1.2.2. Empirical Models of Wet Mass Retention During Gastric Digestion
The first mathematical models to describe the degradation of a food matrix have
primarily focused on the wet mass retention ratio of the food (wet sample weight after
digestion time t divided by the initial wet sample weight). The wet mass retention ratio
has been observed to follow three distinct profiles (delayed sigmoidal, sigmoidal and
exponential, Figure 2.3), yet all three profiles can be described using one equation:
tβtβkty exp1 2.1
where k and β are constants found using regression (Kong and Singh 2008, Kong and
Singh 2009b). The sigmoidal profile can be described by an initial slow disintegration
stage, followed by an exponential disintegration profile. The delayed sigmoidal profile
occurred in foods with low moisture content. In these foods, the absorption of gastric
fluid increased the wet weight of the food to such an extent that it exceeded the
degradation rate, which resulted in a wet mass retention ratio greater than 1. The
delayed sigmoidal profile can be seen with studies of raw and roasted almonds; in this
case the wet mass retention ratio increased, as a result of gastric fluid absorption, even

P a g e | 33
though the dry solid mass decreased over the same digestion time (Kong and Singh
2009a).
Figure 2.3 (a) Three different profiles describing the wet mass retention rate during
gastric digestion. (b) Diagram depicting how gastric fluid absorption influences the wet
mass retention rate profiles and subsequent erosion of the food matrix during gastric
digestion (Ferrua et al 2011). Reprinted with permission from Trends in Food Science &
Technology.

P a g e | 34
While it is useful to have a simple model that can be fit to the data using
regression methods, this model does not provide additional understanding of the
underlying processes facilitating degradation as it is an empirical model rather than a
mechanistic model. The use of the wet mass ratio may more accurately describe some of
the satiation properties of a food matrix by revealing insight into how meal volume
changes during the digestive process, rather than depicting the bioaccessibility of
nutrients within a food matrix.
2.1.2.3. Empirical Models of Dry Solid Loss during Gastric Digestion
In order to ascertain the bioaccessibility of nutrients from a food matrix, it is
important to be able to determine the dry solid loss during the digestive process. The
loss of the dry solid would constitute the soluble and insoluble nutrients which have
leached into the gastric medium and thus are available for absorption in the small
bowel. There has been only one mathematical model in the literature to describe solid
loss. Kong and Singh (2011) described soluble solid loss using an empirical model.
Specifically, they used a Weibull function to describe the ratio of dry solid loss at time,
t, hours of digestion:
batS
tSS exp10
0 2.2
where 0S is the initial dry solid weight and tS is the solid weight after t hours of
digestion and a and b are constants fit by regression (Kong and Singh 2011). However,
this description of the dry solid loss does not adequately describe the solid loss after an
extended time (e.g. 36 hours). This equation assumes that complete degradation will
occur at some time, which is not necessarily the case. Additionally, this equation does
not provide any insight into the mechanisms responsible for the solid loss; for example
the diffusion of the gastric fluid or the pH of the fluid.

P a g e | 35
In the same work, Kong and Singh (2011) used the first term of Fick’s second
law of diffusion for an infinite cylinder to determine the effective diffusion coefficient
(EDC) of simulated gastric fluid into raw carrot at different pH values (Eq. 2.3).
2
2
12
0
0 exp4R
tDS
tSS effn
n n
2.3
Based on this equation, Kong and Singh (2011) determined that for pH 5.3, the
EDC was constant, however at pH 3.5 and 1.8, they calculated two EDC values. They
explain the two calculated values characterize two stages of diffusion without any clear
explanation of the phenomena. A better explanation is that Eq. 2.3 does not adequately
describe the diffusion of the simulated gastric fluid because the EDC is a function of
time rather than a constant. Such an hypothesis is more consistent with other studies of
porous media (Crank 1975, Davey et al 2002, Gomi et al 1996, Yamamoto 1999).
2.2. Digestion within the Small Bowel
Particulate size, macronutrients (fat, protein, starch), meal viscosity and
temperature are a few of the factors which contribute to the rate of gastric emptying
(Davenport 1982, Goetze et al 2007, Siegel et al 1988). Of these, particulate size is
directly dependent upon the mechanical forces and chemical reactions within the
stomach. Liquids tend to empty rapidly from the stomach into the duodenum, whereas
solids often show a lag phase where initial, slow stomach emptying is followed by a
more rapid linear phase (Siegel et al 1988). The rate of emptying is directly related to
the particle size in that particles remain within the stomach until they reduce in size to
less than ~2 mm (Davenport 1982, Marciani et al 2001).
Upon entering the duodenum, the chime is mixed with mucus, pancreatic
enzymes and bile acids. These substances increase the pH of the chime to approximately

P a g e | 36
6, which allows enzymes such as amylase to be activated. Pancreatic enzymes are
primarily responsible for proteolysis and carbohydrate catabolism whereas lipolysis is
facilitated by both pancreatic lipase and bile salts. Even though the duodenum is a
fraction of the length of the jejunum and ileum combined (20 cm as compared to 7-8
m), it is within the duodenum that most of the chemical processes of intestinal digestion
occurs (Davenport 1982).
Nutrient absorption primarily takes place within the duodenum and jejunum, and
bile salts are absorbed through diffusion in the duodenum and jejunum and through
active transport in the ileum. Water, electrolytes and soluble nutrients (such as minerals
and vitamins) freely diffuse through the tight junctions between the epithelial cells. The
diffusion of water and electrolytes can be bi-directional depending on the osmotic and
electrochemical gradient; however the permeability of the small bowel to water and
electrolytes decreases linearly from the duodenum and jejunum to the ileum (Davenport
1982).
Large lipids, such as triglycerides, are broken down into monoglycerides and
free fatty acids by the pancreatic lipase. The monoglycerides and free fatty acids then
aggregate with bile slats forming micelles. Micelle formation provides a conduit to
improve the diffusion of monoglycerides and free fatty acids into the epithelium cells
(Carey et al 1983).
Protein digestion is complex and occurs in four locations: the stomach, intestinal
lumen, brush border (microvilli covered surface of the epithelium) and cytoplasm of the
mucosal cells (Carey et al 1983). Pepsin, an enzyme in gastric fluid, begins the digestive
process of proteins and results in polypeptides of various lengths and some free amino
acids which are readily absorbed in the small bowel. The polypeptides produced from
pepsin proteolysis are further digested in the lumen of the small bowel by pancreatic

P a g e | 37
enzymes such as trypsin, chymotrypsin and elastase. While proteolysis in the lumen
may result in some free amino acids, the aforementioned enzymes typically act on the
interior peptide bonds resulting in smaller polypeptides. As these polypeptides come
into contact with the brush border of the epithelium, additional enzymes
(aminopeptidases and dipeptidases) release amino acids through the hydrolysis of the
polypeptide at the carboxy and amino end. Unlike lipids, the resulting amino acids,
dipeptides, tripeptides, and some amino acids of length four are then actively
transported into the epithelium cells. Here the final step of proteolysis occurs as small
peptides are broken down into amino acids by cytoplasmic peptidases (Carey et al 1983,
Davenport 1982).
Carbohydrate catabolism is similar to proteolysis. Polysaccharide digestion
begins in the mouth, with the secretion and mixing of saliva which contains -amylase.
Further digestion of starch by -amylase in the stomach depends upon the mixing of
the contents and the pH, as -amylase is inactivated when the pH drops below ~3
(Bornhorst and Singh 2012). Pancreatic -amylase further hydrolyzes polysaccharides
in the intestinal lumen, resulting in oligosaccharides such as maltose, maltotriose, and
branched polymers containing between 6 and 8 glucose molecules (Carey et al 1983,
Davenport 1982). Like protein breakdown, the brush border contains a number of
oligosaccharidases which are responsible for the further hydrolysis of oligosaccharides.
While these oligosaccharidases are associated with the entire small bowel brush border,
the concentration of the enzymes is greatest in the mid to distal jejunum and upper
ileum (Davenport 1982). Monosaccharides released through the hydrolysis of
oligosaccharides by the enzymes in the brush border are not necessarily immediately
absorbed by the small bowel, but may return to the lumen. Unlike protein absorption,
not all monosaccharides are actively transported into the epithelium cells. Glucose and

P a g e | 38
galactose are actively transported, whereas fructose is transported through diffusion;
thus glucose absorption is approximately 3-6 times faster than fructose (Davenport
1982).
Transit of nutrients though the small bowel is governed by two types of
mechanical forces: segmental and peristaltic contractions. Segmental contractions mix
the chyme and the digestive juices as well as expose the chime to the intestinal barrier,
increasing nutrient absorption. Two types of segmental contractions may occur:
eccentric and concentric. Eccentric contractions occur in segments less than 2 cm long
and have little effect on the intraluminal pressure; therefore, during such contractions
the chyme is not forced out of the segment yet mixing of the chyme within the segment
may occur. Concentric contractions (in segments > 2 cm) generate enough luminal
pressure to completely empty the segment of chyme. Such contractions may cause
simultaneous retropulsive and forward movement of the chyme; however, the increased
frequency of the contractions in the duodenum and subsequent decrease in frequency
throughout the jejunum and ileum ensures that on average the chyme is directed towards
the colon (Davenport 1982, Toms et al 2011). Peristaltic contractions move in a
progressive wave distally from the duodenum to the ileum (Koch et al 2012). These
successive contractions of longitudinal and circular muscle function primarily to move
the digesta (in particular dietary fiber) through the small bowel and into the large bowel
to be fermented by the commensal intestinal bacteria.
2.3. Bacterial Biofilms Associated with Food Particles in the Human Large Bowel
In developed countries, some individuals are experiencing personal health
deterioration due to busy and often sedentary lifestyles that include an over

P a g e | 39
consumption of energy-dense, nutritionally-poor convenience foods (Granato et al
2010). This is evident by the prevalence of obesity, cardiovascular diseases, and
diabetes in developed countries (Flegal et al 2010, Ginter and Simko 2010, Panico and
Mattiello 2010). The decline of health, combined with new developments in nutritional
science and media attention focused upon the link between diet and health has resulted
in a higher demand for foods which improve human health (Granato et al 2010).
Many functional foods target the growth of intestinal bacteria since it has
become widely accepted that the maintenance of commensal bacterial populations are
necessary for intestinal (and overall) health. Due to the beneficial effects of commensal
bacteria, the formulation and utilization of probiotics, prebiotics and synbiotics have
been at the forefront of nutritional research (Tallon 2009). Probiotics are defined as
“live microbial feed supplements that beneficially affect the host by improving its
intestinal microbial balance” (Saulnier et al 2009). Synbiotics are the combination of
probiotic(s) and prebiotic(s), “selectively fermented ingredients that allow specific
changes, both in the composition and/or activity in the gastrointestinal microbiota that
confers benefits upon host well-being and health” (Saulnier et al 2009).
Bacteria within the large bowel have been found to affect host function by
producing short chain fatty acids (SCFA) (Albrecht et al 1996, Macfarlane and
Macfarlane 2007, Younes et al 2001), synthesizing vitamins (Albrecht et al 1996,
Burgess et al 2009, Conly et al 1994, Glancey et al 2007, Madhu et al 2009),
modulating the immune system (Borruel et al 2002, Furrie et al 2005, Macfarlane et al
2009, Saulnier et al 2009) and acting as inhibitors of colonization by potentially
pathogenic bacteria (Coconnier et al 1993, De Ruyter et al 1996, Lievin et al 2000).
The surface area of the human bowel (400 m2) combined with an ideal
temperature and an abundance of nutrients provides an environment in which anaerobic

P a g e | 40
and facultative anaerobic bacteria thrive (MacDonald and Monteleone 2005). It is
estimated that there are 1014 bacteria cells within the digestive tract, which is 10 times
the number of cells that constitute the human anatomy (Luckey 1972). The short transit
time (2-4 hours) causes a rapid flow of material through the small bowel, inhibiting
bacterial colonization (Macfarlane and Dillon 2007), whereas the transit time within the
large bowel, 1-3 days, provides an ideal environment for bacterial growth and
fermentation [Figure 2.4]. There are over 1000 distinct bacterial species (Hooper and
MacPherson 2010) with 30–40 species comprising up to 99% of the total population
(Hooper et al 2002). This may be an underestimate since only 10-50% of the bacteria
are cultivable (Kurokawa et al 2007, O'Toole and Claesson 2010, Suau et al 1999).
While the bacterial population of the adult human intestinal tract is heterogeneous and
\
Figure 2.4 Bacterial counts in the gastrointestinal tract, including the stomach
(Macfarlane and Dillon 2007), duodenum (O'May et al 2005) and small bowel (Saulnier
et al 2009) (colony forming units/ml luminal contents) and at the ileo-cecal valve
(Macfarlane and Dillon 2007) and within the large bowel (colony forming units/g luminal
contents) (Guarner and Malagelada 2003). Reprinted with permission from Molecular
Nutrition and Food Research.

P a g e | 41
individual specific (due to health, diet, age, and environment), their metabolism and
overall function are similar (Kurokawa et al 2007) and are unique to the intestinal
environment.
Given the prevalence of bacterial biofilms associated with food particles in
ruminants, it was assumed that bacteria formed biofilms on digesta within the human
intestinal tract, and in particular within the colon (Costerton et al 1983). However, the
first reports of bacterial biofilms associated with food particles in human fecal matter
were by Macfarlane and colleagues (Macfarlane et al 1997, Macfarlane and Macfarlane
2006, Probert and Gibson 2002). Due to the difficulty of studying digesta within the
human large bowel, little is known about the mechanisms used for bacterial attachment
or growth on food particles in vivo. The majority of our knowledge has been gained
from in vitro experimentation utilizing fecal inocula or single bacterial species.
However, studies of the large intestinal contents of sudden death victims have shown
higher levels of SCFA in the proximal colon (cecum and ascending colon) indicating
carbohydrate fermentation (Cummings et al 1987, Macfarlane et al 1992). Although
biofilms constitute only 5% of the bacterial population in human fecal samples
(Macfarlane and Macfarlane 2006), high levels of acetate within the proximal colon,
which is readily produced by heterogeneous bacterial biofilms (Leitch et al 2007,
Macfarlane and Macfarlane 2006, Macfarlane and Dillon 2007), implies that either
bacterial biofilms are prolific in this site or that the formation of a biofilm leads to
increased production of acetate.
With the possibility of biofilms being prevalent in the large bowel, extensive
research into the effects and functionality of digesta-associated biofilms is necessary. To
assist in this endeavor, the following sections will cover current knowledge of bacterial
biofilms associated with food particles in the human large bowel, examine the

P a g e | 42
established mathematical models depicting bacterial attachment, nutrient transport and
microbial cross-feeding/competition for nutrients and to elucidate key areas for further
research.
Health Benefits Associated with the Commensal 2.3.1.Intestinal Bacteria
The commensal intestinal bacteria have been found to have a substantial impact
on not only intestinal health, but the overall health of the host. The primary SCFA
produced by the commensal bacteria are butyrate, acetate and propionate. Butyrate
provides an energy source for the intestinal epithelial cells, improves the mucosal
integrity of the intestinal wall, and regulates gene expression and cell growth
(Macfarlane and Cummings 1991, Nepelska et al 2012). The role of SCFA in human
health is not restricted to the intestinal tract. Acetate is utilized as an energy source by
the heart, brain and skeletal muscles (Macfarlane and Cummings 1991). Propionate
enhances satiety by regulating hormones responsible for stomach emptying and appetite
and is associated with the inhibition of cholesterol, triglyceride and fatty acid synthesis
in the liver (Hosseini et al 2011); the effects suggest that propionate may play a role in
obesity in humans.
In addition to SCFA production, commensal bacteria have been associated with
the maturation and modulation of the human immune system. In particular, certain
lactobacilli and bifidobacterial strains have been shown to decrease symptoms
associated with immunoglobulin E (IgE)-associated allergies, such as allergic rhinitis,
asthma, and atopic dermatitis (Özdemir 2010). Additionally, recent studies have linked
intestinal inflammation and commensal bacteria population imbalances (reduced
bifidobacteria and/or lactobacilli) to inflammatory bowel disease (IBD) (Macfarlane et
al 2009) and chronic fatigue syndrome (CFS) (Lakhan and Kirchgessner 2010).

P a g e | 43
Furthermore, the use of prebiotics, probiotics or synbiotics have been shown to reduce
the levels of inflammatory cytokines in patients with IBD (Furrie et al 2005) and reduce
anxiety symptoms in CFS patients (Rao et al 2009). The awareness of the potential
benefits of the commensal bacteria and their metabolites has led to the development of
probiotics, prebiotic and functional foods that not only address digestive, but overall
human health.
Effects of Diet on the Microbial Composition 2.3.2.Until recently, human newborn intestinal tracts were believed to be sterile at
birth and bacterial colonization was influenced by the mode of delivery (cesarean versus
vaginal delivery), premature delivery and exposure to intensive care units, feeding
(breast fed versus formula fed), and sanitation (Jiménez et al 2008a, O'Toole and
Claesson 2010, Penders et al 2006, Perez et al 2007). While these factors influence the
bacterial population in neonates, recent research suggests that bacteria inhabit the fetal
intestinal tract in utero (Jiménez et al 2005, Jiménez et al 2008b, Satokari et al 2009)
and that breast milk supplies both oligosaccharides and commensal bacteria that have
prebiotic and probiotic effects, respectively, in the infant (Jiménez et al 2008a, Perez et
al 2007).
While the metabolic requirements for most of the enteric bacteria and the
metabolites produced by these bacteria are unknown (Jacobs et al 2009), current
metagenomic studies of bacteria from fecal samples have shown that the intestinal
bacteria of adult, weaned and unweaned children primarily function as carbohydrate
transporters and metabolizers (Kurokawa et al 2007). There was a notable difference
between the collective genomes of the microbiota (microbiome) of weaned children or
adults as compared to the microbiome of unweaned infants, which may be attributed to
the role played by bacteria in transport and uptake of simple sugars from breast milk.

P a g e | 44
A recent study comparing the fecal bacteria of European children, fed a
Westernized diet high in sugar, animal fat and energy dense foods, and the fecal bacteria
of rural African children, fed a diet high in plant polysaccharides, demonstrated
differences in the bacterial population once breastfeeding was replaced by solid foods
(De Filippo et al 2010). The ratio of Firmicutes to Bacteroidetes were particularly
different; Bacteroidetes such as Prevotella and Xylanibacter with cellulolytic and
xylanolytic plant polysaccharide degradation genes were most prevalent in the rural
African children. Similar disparities in the ratio of Firmicutes to Bacteroidetes have
been recorded in obese versus lean individuals (Ley et al 2006). De Filippo et al (2010)
propose that the ratio of Firmicutes to Bacteroidetes may be used as an indicator for
future obesity risk and that this disparity may result from diets rich in fat, animal protein
and sugar rather than diets high in plant carbohydrates and resistant starch (De Filippo
et al 2010).
The dominant phyla in fecal samples are Firmicutes and Bacteroidetes
(Kurokawa et al 2007). Firmicutes, in particular Ruminococcus species from
Clostridium cluster IV, have been found to adhere to and form biofilms on particulates
such as plant polysaccharides, resistant starch and mucin (Leitch et al 2007, Walker et al
2008). This difference in substrate association and utilization by Firmicutes and
Bacteroidetes was also reported by Mirande et al (2010) who compared dietary fiber
degradation by Bacteroides xylanisolvens SB1A and Roseburia intestinalis XB6B4
(Mirande et al 2010). It is surmised that Firmicutes are more efficient at fermenting
insoluble carbohydrates (Ley et al 2006), whereas many Bacteroides species, which
demonstrate substrate versatility (Hooper et al 2002, Leitch et al 2007), may rely on
soluble oligosaccharides and polysaccharides released by the breakdown of insoluble
polysaccharides (Walker et al 2008) when in a competitive environment. The ability of

P a g e | 45
some bacterial species to ferment metabolites produced by or released by another
species is called microbial cross-feeding, which is a defining factor in the heterogeneity
of bacterial biofilms.
Currently, most studies investigating the influence of diet on the commensal
enteric bacteria have primarily investigated the effects of prebiotics or synbiotics
(Macfarlane et al 2008). Additionally, these studies focus on how particular food
components affect specific bacterial species rather than changes in phylum distribution.
It is important to note that fecal samples are often used to enumerate and distinguish
bacterial species in human studies. This however may not be an accurate representation
of the bacterial population in specific areas of the bowel.
The information obtained from sudden death victims has been helpful in
confirming the degradation of indigestible carbohydrates within the colon, as well as in
determining the metabolites produced by the commensal bacteria (Cummings et al
1987, Macfarlane et al 1992). Additionally, the microbiota is capable of proteolysis,
which is evidenced by the occurrence of branch chained fatty acids in the human distal
colon (Cummings and MacFarlane 1997). Therefore it is reasonable to expect that the
bacterial populations associated with the digesta will change over time and may be
determined by the substrates available within the digesta. The bacterial population in
fecal samples may reflect the bacterial population within the transverse and descending
colon rather than the cecum and ascending colon, where carbohydrate fermentation
primarily takes place. This has been substantiated by a study comparing the cecal and
fecal bacteria of healthy humans. Marteau et al (2001), using 16 rRNA probes which
target Bacteroides and Clostridium groups found that strict anaerobic bacteria
represented 44% of the fecal bacterial rRNA and only 13% of the cecal bacterial rRNA.
Similarly, Marteau et al (2001) found that the facultative anaerobes Escherichia coli and

P a g e | 46
the Lactobacillus-Enterococcus group represented 50% of the cecal and 7% of the fecal
bacteria rRNA (Marteau et al 2001). Thus, when gaging the impact of a dietary
supplement or functional food on the commensal intestinal bacteria, the use of bacterial
counts from fecal samples may not provide an accurate representation of the microbial
population composition in the ascending or transverse colon.
2.3.2.1. Polysaccharides with Prebiotic Effects
Given that the commensal bacteria more readily metabolize resistant starch and
non-starch polysaccharides, products such as inulin and oligofructose are commonly
used food ingredients in functional foods. Neither inulin nor oligofructose are
hydrolyzed in the stomach or absorbed in the small bowel, yet they are completely
fermented by the commensal bacteria in the large bowel (Cherbut 2002, Ramnani et al
2010). In vivo studies have shown that inulin and oligofructose have a bifidogenic
effect, or increase the number of certain Bifidobacterium species, and in many cases
there is also an increase of Lactobacillus (Bouhnik et al 1999, Costabile et al 2010,
Gibson et al 1995, Meyer and Stasse-wolthuis 2009, Ramnani et al 2010). In addition to
the prebiotic effect, these ingredients add to the functionality of some foods, such as
dairy products, frozen desserts, table spreads, baked goods, breakfast cereals and salad-
dressings, as fat and sugar replacers (Brownawell et al 2012, Franck 2002). When inulin
is thoroughly hydrated it forms a gel with a spreadable texture and can act as a stabilizer
for foams and emulsions in ice creams, table spreads and sauces (Franck 2002).
Although oligofructose has one third the sweetness of sucrose, oligofructose can
enhance fruit flavors when used in combination with other alternative sweeteners, such
as aspartame and acesulfame K (Franck 2002). The addition of oligofructose decreases
the aftertaste of the alternative sweetener and provides an improved mouth feel (Franck
2002).

P a g e | 47
Given the bifidogenic effect of fructans, Bifidobacteria are often combined with
fructans as a synbiotic because of their beneficial effects to the host; however, in vitro
studies have shown that many Bifidobacteria are unable to break down and metabolize
sugars with a degree of polymerization greater than 8 (Falony et al 2009b, Rossi et al
2005). Given that bacteria do not live in isolation, but are often found as mixed species
biofilms (Macfarlane and Macfarlane 2006), the bifidogenic effect of fructan prebiotics
may be a result of microbial cross-feeding (Falony et al 2009a).
2.3.2.2. Mathematical Models Predicting Coculture Dynamics and Microbial Cross-Feeding
Only a few coculture experiments that specifically characterized bacterial cross-
feeding and nutrient competition have been reported (Falony et al 2006, Falony et al
2009a) and often do not report the bacterial growth, metabolites and substrate
degradation associated with each strain during coculture (Belenguer et al 2006,
Chassard and Bernalier-Donadille 2006, Degnan and Macfarlane 1995, Duncan et al
2004). These data are essential to determine bacterial interactions and the parameter
values for macroscopic mathematical models of interacting microbial populations.
Additionally, there are currently few mathematical models that describe either bacterial
cross-feeding or nutrient competition, most of which are empirical rather than
mechanistic models.
The Lotka-Voterra model (or variations thereof), which describes species
competition, has been applied to describe mixed microbial populations (Eqs 2.4a,b)
(Cornu et al 2011, Mounier et al 2008). Here, ir represents the growth rate of the ith
bacterial strain, ix , 12α is the effect species 2 has on species 1, similarly, 21α is the
effect that species 1 has on species 2, and iK represents the carrying capacity for the ith
bacterial strain.

P a g e | 48
1
212111
1 1K
xαxxrdtdx
2.4a
2
121222
2 1K
xαxxrdt
dx 2.4b
Cornu et al (2011) found that the Lotka-Voterra model (Eqs. 2.4a,b) was unable
to predict the mixed microbial populations (Listeria monocytogenes verses other
microflora) in salted diced bacon using parameters based on pure culture experiments.
While Mounier et al (2008) found that the Lotka-Voterra model provided insight into
the interactions between various yeast and bacteria during cheese making, the model
depicted interactions between specific bacteria and yeast that could not be explained by
the experimental results.
Wintermute and Silver (2010) proposed a simple dynamic, empirical model to
describe the level of cooperation between two auxotrophic Escherichia coli mutants
(Eqs. 2.5a,b). Each mutant was unable to synthesize an essential metabolite (amino
acids, nucleotides or cofactors) or components of the glycolysis and respiration
pathways necessary for the growth of the bacterium.
K
BABA
BCdtdA
B 1 2.5a
K
BABA
ACdtdB
A 1 2.5b
In the Eqs. 2.5a,b, the variables A and B represent the concentration of the two
different bacterial strains, AC and BC represent the level of cooperation on the part of
strain B and A, respectively, (i.e. BC is a numerical measure for the amount of benefit
strain A receives per bacterium B) and K represents the logistic carrying capacity of the
batch culture. In this model A and B are measured in terms of optical density. The first
factor in Eq. 2.5a demonstrates that there is an increased growth in strain A when strain

P a g e | 49
B increases; however, in this model the benefits from strain B must be divided amongst
all bacteria. Here cooperation implies that the paired strain provides a metabolite which
is necessary for the other strain to grow (i.e. provides a metabolite that the bacterium
cannot synthesize).
This model predicts that the growth of strain A will increase when partnered
with a cooperative strain (i.e. dtdA increases as BC increases). Additionally, the growth
of strain A will increase when A provides a low level of cooperation with strain B as a
result of decreased numbers of strain B and hence more metabolite available for A to
utilize; however, if the cooperation of strain A, AC , is high, then strain B dominates the
batch culture, reducing the growth rate of strain A. One drawback of this model is that it
assumes that both bacteria must contribute to the fitness of the other. If either AC or
BC are equal to zero then there is no growth of bacterial strain B or A, respectively.
Equations 2.5a,b are related to the model described by Bull and Harcombe
(2009) (Eq. 2.6a,b). The model proposed by Bull and Harcombe (2009) allows for the
growth of the individual species independent of any cooperation or cross-feeding
between the two species. This is accomplished by the inclusion of growth constant
terms, Ar and Br , that do not rely on the population of the other species. This inclusion
also allows for the possibility of one bacterial species benefiting from the other without
any reciprocal cross-feeding. To guarantee that the benefit from cross-feeding does not
approach infinity for small values of A (both strains are in terms of density), the addition
of Ak provides a dampening effect that makes the cross-feeding resource proportional to
B for vanishing values of A. This similarly applies to B.
KBA
kABCrA
dtdA
ABA 1
2.6a

P a g e | 50
KBA
kBACrB
dtdB
BAB 1
2.6b
Neither model (Eqs. 2.5 or 2.6) is suitable for explicitly describing and
understanding the nature of the interactions between microbial populations because they
do not incorporate the mechanisms that influence those interactions. For instance, there
is no explicit reference to the metabolites which are responsible for the benefits, nor the
substrate required for bacterial growth by either one or the other bacterium which
facilitates the production of the nebulous metabolite.
At present there are a few published models that have extended/modified the
microbial population model of Baranyi and Roberts (1994). The model proposed by
Baranyi and Roberts (1994) is used to describe the observed lag, exponential and
stationary phase of a single bacterium (Eqs. 2.7a-c). In Eqs. 2.7a-c, N represents the
concentration of the bacterial population at time t, maxμ is the maximum specific growth
rate, maxN represents the maximum population of the bacteria, and Q represents the
physiological state of the cells at any given time, which accounts for the lag phase.
maxmax 1
1 NN
QQNμ
dtdN
2.7a
QμdtdQ
max 2.7b
00 0,0 QtQNtN 2.7c
A number of models have modified or extended Eqs. 2.7a-c to include the
effects of mechanistic processes, such as metabolite production, substrate depletion and
changes in pH that may limit microbial growth (Janssen et al 2006, Poschet et al 2005,
Van Impe et al 2005). These models extend the Baranyi and Roberts (1994) model by
modifying the last factor in Eq. 2.7a, since a fixed value for the maximum concentration

P a g e | 51
of bacteria, maxN , cannot describe growth inhibition due to substrate limitations (i.e.,
different substrate concentrations will result in a different maxN ) nor toxic products
produced by a competitive bacterium (Van Impe et al 2005). These models also
included an additional differential equation to describe either the production of a
metabolite, substrate depletion or changes in pH, as a function of the bacterial
population. Only one of the models incorporated substrate limitations (Van Impe et al
2005), which is a key factor in mono- and coculture microbial growth.
A dynamic, mechanistic model has been proposed to demonstrate bacterial
growth (determined by optical density) and the subsequent butyrate production as a
result of lactate utilization (Muñoz-Tamayo et al 2011):
la
la ρYdt
dx 2.8a
la
la ρdt
ds 2.8b
laac
ac ρYdt
ds 2.8c
labu
bu ρYdt
ds 2.8d
where
la
lalamla sK
xskρ . 2.8e
The model variables are optical density of bacteria, lax , (which is assumed to be
proportional to the bacterial concentration) and concentration of metabolites, s, (lactate
(la), acetate (ac) and butyrate (bu)). The parameters are the rate of consumption of
lactate, mk , the Monod constant, K, the yield of biomass from lactate consumption, Y,
and the yield, Yi, of metabolites from lactate consumption (acetate aci or butyrate
bui ). A drawback to this model is it does not incorporate either the bacterium that

P a g e | 52
produced the lactate or the substrate hydrolyzed by the lactate-producing bacterium.
Thus the model does not provide a comprehensive description of coculture growth
kinetics.
Bacterial Biofilm Formation 2.3.3.Bacterial biofilms are a conglomeration of bacteria adhered to either a biotic or
abiotic surface and are distinguished from adherent microcolonies by the evidence of a
slime coating the bacterial consortia. This slime or extracellular polymeric substances
(EPS) can be comprised of polysaccharides, proteins, DNA and lipids that are
associated primarily through ionic interactions (Gristina 2004). Additionally, 90-99% of
the biofilm water content lies within the EPS (Flemming et al 2005). The water within
the biofilm is not uniformly distributed due to the spatial distribution of bacteria and the
overall structure of the biofilm.
Biofilms are ubiquitous in nature. Biofilms may be found not only in the human
intestinal tract, but in the gastrointestinal (GI) tract of all animals, associated with heart
valves and catheters, within river beds and streams, drinking water pipes, in foods and
food processing plants, and in waste water systems. Biofilms can be homogeneous,
consisting of only one bacterial or microbial species, or heterogeneous, consisting of
multiple bacteria or microbial species. In some instances bacterial biofilms are
beneficial, as in the commensal intestinal bacteria and biofilms in waste water treatment
systems (Dereli et al 2012); however, bacterial biofilms may be pathogenic and result in
complicated infections, as in the case of biofilm growth in the lungs of cystic fibrosis
patients and biofilm growth on biomedical implants within humans, or biofilms may
cause spoilage in the case of biofilms associated with food or food processing
equipment. Biofilms are so prolific that it is now believed that biofilm formation is the
preferred means of survival and maintenance for bacteria in dynamic systems.

P a g e | 53
In any environment, biofilm formation follows a five step process: (1) surface
conditioning, (2) initial, reversible attachment to the conditioning film, (3) irreversible
attachment, (4) accumulation or growth and (5) detachment (Boland et al 2000) [Figure
2.5].
2.3.3.1. Surface Conditioning
Regardless of the environment, surface conditioning is the precursor to biofilm
formation. Surface conditioning is the adsorption and accumulation of small molecules
to a surface. Surface conditioning has been observed primarily in studies of bacteria in
marine environments, bacteria associated with biomaterials, and dental caries. Prior to
Figure 2.5 A conceptual schema of food degradation in relation to biofilm biomass
accumulation. Initial attachment of bacteria to a food particle, biofilm growth via cell division
and recruitment of planktonic bacteria, biofilm maturation as food particle nutrients are
degraded and the dispersal of bacterial from the nutrient depleted particle.

P a g e | 54
bacterial attachment, water, ions, proteins, lipids, glycoproteins and polysaccharides
become attached to and accumulate on biomaterials and tissues within humans
(Chamberlain 1992, Gristina 2004). Conditioning alters the surface and impacts the
affinity of bacteria to the surface (Dunne 2002, Neu 1996). Currently, information
pertaining to specific diets and their influence on surface conditioning is lacking in the
literature; however, it is probable that surface conditioning occurs on food particles
within the GI tract due to the complexity of the digesta, which includes partially
degraded or indigestible food particles, digestive enzymes, epithelial cells, mucus, and
microbial metabolites. In vitro studies have provided evidence that many human
extracellular components are targeted by bacteria for adhesion (Dunne 2002). Ions, such
as calcium and magnesium (De Kerchove and Elimelech 2008), and glycoproteins, such
as fibronectin (Liu et al 2007b), may improve bacterial attachment. In the case of oral
biofilms, the coverage of the tooth by glycoproteins (pellicle formation) is required for
the attachment of bacteria (Rüdiger et al 2002).
2.3.3.2. Initial and Irreversible Attachment
Initial and irreversible attachments are not necessarily distinguishable phases in
biofilm development. Initial attachment is thought to be affected by the hydrophobicity,
cell size, and the electric charge of both the bacterial cell and conditioned surface (Jass
et al 1997) as well as environmental factors such as receptor sites (such as
glycoproteins) (Gristina 2004), nutrient availability, fluid dynamics and competing
bacteria. These mechanisms may be relatively weak and detachment may occur. Thus,
the subsequent or simultaneous adherence of proteins found on cellular membranes and
ends of filamentous cell appendages, such as fimbriae or pili, as well as the secretion of
EPS, binds the bacteria irreversibly to the substratum (Gristina 2004).

P a g e | 55
Given the difficulty of human studies of GI digesta movement, insights have
been gained from animal experiments. Lentle and Janssen (2008) suggested that laminar
mixing (in the small bowel) may result from simultaneous circular and longitudinal
contractions (Lentle and Janssen 2008). These contractions may be able to generate
radial mixing with the flow dependent upon the viscosity of the digesta, in that
increased amounts of indigestible carbohydrate reduces radial mixing. Little is known
about the mixing of contents within the human cecum, though it is reasonable to assume
that the mixing of the digesta is minimal given that indigestible carbohydrates make up
the majority of the digestive material. Moreover, as the digesta progresses through the
digestive tract it changes from a pseudoplastic fluid (in the small bowel) to a solid (in
the transverse colon) due to absorption of water (Lentle and Janssen 2010). Dehydration
of the digesta and reduced frequency of radial constriction and peristalsis result in little
to no churning of the digesta in the transverse and distal colon (Lentle et al 2005). This
implies that the motility of non-flagellated/nonpilated bacteria in the large bowel is
largely due to diffusion rather than fluid transport.
Generally, both the bacteria and the conditioned substratum are negatively
charged (Gristina 2004), although surface conditioning by ions may create a neutrally
charged substratum (De Kerchove and Elimelech 2008). A combination of van der Waal
and hydrophobic forces, and possibly chemical interactions with closely associated cells
(electrostatic, hydrogen and covalent bonding) may allow the bacterial cells to
overcome repulsive force from surfaces (Goller and Romeo 2008, Jass et al 1997,
Jenkinson et al 2003). In addition to environmental factors and molecular mechanisms,
flagella enable bacteria to overcome repulsion, although continued motility after
attachment can hinder biofilm formation (Goller and Romeo 2008, Jenkinson et al
2003).

P a g e | 56
Given the diversity of environmental factors, many bacteria have the ability to
express different adhesins. Biofilm formation by Gram-negative bacteria such as
Enterobacteriaceae is facilitated by proteins on either curli fimbriae or Type 1 fimbriae,
depending on environmental factors (Cookson and Woodward 1999, Cookson et al
2002, Goller and Romeo 2008). In experiments using intestinal tissue obtained from
either the distal duodenum or duodenum-jejunal junction in children, the adherence of
enteropathogenic E. coli required the direct contact of an outer surface protein, intimin,
with the mucosa (Hicks et al 1998). Enteropathogenic E. coli secretes several effector
proteins into the host cell and embeds a secreted protein, translocated intimin receptor
(Tir), into the host cell membrane, generating a receptor for intimin (Hicks et al 1998).
While the use of flagellum and pili may be essential for attachment of bacteria to
human tissue, Kurokawa et al (2007) reported that motility is not required for
commensal enteric bacteria to persist within the lumen of the colon (Kurokawa et al
2007). They suggested that flagellated bacteria, which are immunogenic, may be easily
targeted and eliminated by the immune system.
2.3.3.3. Bacterial Attachment to Food Particles
The attachment mechanisms used by pathogenic bacteria have been studied
extensively and there are numerous studies focusing on colonization inhibition via
surface conditioning of biomedical devices. However, very little is known about the
mechanisms used by commensal bacteria to attach to resistant starch, indigestible non-
starch polysaccharides, oligosaccharides, proteins and lipids within the intestinal lumen
or how surface conditioning effects attachment. The particular mechanism required for
attachment to resistant starch has been elucidated for only a few strains of enteric
bacteria. Surface cellular proteins appear to facilitate attachment to particular substrates,
resistant starch, which has been substantiated by studies involving Bacteroides

P a g e | 57
thetaiotaomicron (Shipman et al 1999, Shipman et al 2000), four additional intestinal
Bacteroidetes (Xu et al 2007), Bifidobacterium adolescentis and Bifidobacterium
pseudolongum (Crittenden et al 2001).
The mechanisms used to bind the enteric microbiota to either milk
oligosaccharides, lipids or proteins are not well understood. Given the high proportion
of carbohydrates in the digesta (Macfarlane and Cummings 1991) and the emphasis on
carbohydrate metabolism by the enteric bacteria (Kurokawa et al 2007), it is not
surprising that studies have focused on the utilization of resistant starch and dietary
fiber by the intestinal microbiota. However, oligosaccharides, present at 10-20
grams/liter in human milk, are a primary substrate for Bifidobacterium within the infant
intestinal tract (Wada et al 2008). In the infant large bowel, bacteria may attach to and
metabolize available milk oligosaccharides. Therefore, the inclusion of milk
oligosaccharides in further studies investigating the attachment mechanisms of enteric
bacteria to carbohydrates would be invaluable and may provide additional insights into
the formation of bacterial biofilms in the lumen of the infant GI tract.
Although the availability of protein in the large bowel is approximately one fifth
that of carbohydrates (Macfarlane and Cummings 1991), enteric bacteria metabolize
protein within the distal region of the large bowel. Additionally, it has been
hypothesized that the metabolites from proteolytic fermentation may increase the risks
of colon cancer and IBD (Jacobs et al 2009, O'Keefe 2008). Thus there is a need to both
ascertain which species metabolize protein and determine the binding mechanisms used
by the enteric bacteria.
Lipid metabolism primarily takes place in the small bowel, however
approximately 5-10% (0.3-0.6 grams/day) of bile acid escapes reabsorption in the distal
ileum (Begley et al 2006, Jones et al 2004). There is evidence to support that, in

P a g e | 58
humans, deconjugation of bile acids begins in the small bowel (Go et al 1988) and
continues in the cecum and colon (Eyssen 1973, Hamilton et al 2007, Ridlon et al 2006,
Thomas et al 2001). Studies detected bile salt hydrolase activity, the ability to
deconjugate bile salts, in Bifidobacterium, Lactobacillus, Enterococcus, Clostridium
and Bacteroides spp. (Begley et al 2006). The function of bile salt hydrolase activity is
still unknown, but it has been suggested that the bacteria incorporate cholesterol and/or
bile into the bacterial cell membrane which could strengthen the membrane and alter the
charge of the bacterium. Such modifications of the bacterial cell membrane may
increase their ability to survive areas of the GI tract that have a low pH. Although the
fecal bacteria have the ability to hydrolyze bile salts, our current understanding of the
human large bowel microbiome shows that the genes required for lipid transport and
metabolism are under-represented (Kurokawa et al 2007); however, this is likely due to
the relatively low levels of bile acids that enter the colon and that only ~0.0001% of the
total colonic microbiota are estimated to be capable of converting primary bile acids to
secondary bile acids (Ridlon et al 2006). Regardless, if indeed bile salt hydrolase
activity results in a change of the net charge of the bacterial cell membrane, this may
have an impact on the attachment process of these bacteria to food particles within the
large bowel. Further studies are needed.
2.3.3.4. Theoretical Models for Bacterial Attachment
In vitro and in vivo experimentation is complemented by mathematical
modeling. There are three accepted theories that describe attachment of charged
molecules or cells to a substratum in a liquid environment: Derjaguin-Landau-Verwey-
Overbeek (DLVO), Lifshitz-van der Waals (LW) Acid-Base (AB) approach to
thermodynamic theory and extended DLVO (XDLVO) theory (Missirlis and
Katsikogianni 2007).

P a g e | 59
DLVO theory was originally developed to describe the behavior of colloidal
particles with a surface in a liquid environment. DLVO theory assumes that the total
interaction energy, or energy of adhesion, is dependent upon the separation distance
between the surface and particle and is described as the sum of energies from LW
interactions and electrostatic repulsion (Hermansson 1999). DLVO theory was adopted
to explain the attachment of bacteria, which are similar in size to colloids, to a surface
as this process can follow two steps: reversible and irreversible attachment
(Hermansson 1999, Hori and Matsumoto 2010) [Figure 2.6]. However, not all bacteria
appear to follow this two-step process. The production of EPS and flagellum may also
influence bacterial attachment at relatively long ranges (100 nm) (Boks et al 2008, De
Kerchove and Elimelech 2008, Fletcher 1988, Goulter et al 2009, Long et al 2009),
Figure 2.6 Schematic drawing of DLVO theory. Repulsion (blue dotted curve) occurs
from the overlap of electric double layers of both the substratum and bacteria, whereas
permanent or induced dipoles attract (red dotted line) the bacteria to the substratum.
When the total potential energy (black line) is at the secondary minimum reversible
attachment occurs, whereas irreversible attachment happens at the primary minimum.

P a g e | 60
which is not accounted for in the DLVO theory. According to DLVO theory, bacterial
attachment should not occur at such distances but bacteria with EPS and/or flagellum
are readily able to attach at distances up to 100 nm (Boks et al 2008, De Kerchove and
Elimelech 2008, Fletcher 1988, Goulter et al 2009, Long et al 2009). Furthermore,
DLVO does not account for attraction due to hydrophobic interactions, which can be
10-100 times stronger than those from LW (Katsikogianni and Missirlis 2004, Pashley
et al 1985). The LW-AB thermodynamic theory for bacterial attachment was developed
to overcome these shortcomings.
Van Oss et al (1986) proposed the LW-AB thermodynamic theory in which the
AB component accounted for the observation that hydrophobic bacterial cells readily
attach to a hydrophobic substratum and that hydrophilic bacterial cells prefer a
hydrophilic substratum. The thermodynamic LW-AB approach considers that the total
free energy of adhesion is the sum of LW (apolar) interactions and AB (polar)
interactions (i.e. all possible electron-donor/electron-acceptor interactions) (Van Oss et
al 1988) at the substratum-liquid interface, substratum-bacterial interface and the
bacterial-liquid interface (Missirlis and Katsikogianni 2007). The AB interactions are
often referred to as hydrophobic/hydrophilic interactions due to potential hydrogen
bonding. The LW-AB theory does not consider the distance dependence of the LW or
AB interactions nor does it account for reversible attachment, as the model requires a
cell-substratum interface.
Given the respective merits of DLVO and LW-AB theory, Van Oss extended the
DLVO theory by incorporating AB interactions in the total energy of bacterial-
substratum interactions (Van Oss 1989). Therefore, XDLVO theory can be considered a
combination of DLVO and LW-AB theories (Missirlis and Katsikogianni 2007).

P a g e | 61
There is increasing evidence to suggest that all three theories do not adequately
describe bacterial attachment within the context of the human GI tract (Bayoudh et al
2009, De Kerchove and Elimelech 2008, Hori and Matsumoto 2010, Liu et al 2007b,
Missirlis and Katsikogianni 2007, Pashley et al 1985, Schneider 1996). Studies have
shown that LW-AB and XDLVO theories are more accurate than DLVO, which may be
due to the incorporation of AB interactions in both the XDLVO and LW-AB models.
As mentioned earlier, hydrophobic interactions can be 10-100 times stronger than those
of LW interactions when the cell-substratum distance is within 5 nm (Katsikogianni and
Missirlis 2004, Pashley et al 1985). Additionally, experiments studying bacterial
attachment found that surface conditioning by particular ions, such as magnesium and
calcium, can alter the charge of the substratum so that electrostatic and LW interactions
have an insignificant influence on bacterial attachment (Bayoudh et al 2009, De
Kerchove and Elimelech 2008, Hori and Matsumoto 2010, Pashley et al 1985). Thus,
the incorporation of AB interactions in the theoretical models of bacterial attachment
appears to be necessary (Liu et al 2007a).
Bacterial attachment is a very complex process. While these models describe
aspects of the physicochemical properties of bacterial attachment, they do not, however,
incorporate biological factors. The lack of inclusion of biological factors in the above
models may contribute to the discrepancy between model predictions and experimental
observations. Currently, these models are used to describe the attachment of bacteria to
surfaces in a variety of environments. A critical analysis of the agreement of XDLVO
and LW-AB theories with experiments may provide valuable insights. Given the
complexity of the various environments in which bacteria grow and the environmental
specific attachment methods employed by bacteria, a universal model may not be
feasible or appropriate.

P a g e | 62
Biofilm Growth and Detachment 2.3.4.Once irreversible attachment to a substratum has been established, biofilm
maturity is facilitated by the generation of daughter cells (Costerton et al 1987) and the
recruitment of bacteria from the surrounding medium. Both cellular proteins and the
production of EPS appear to help bind the bacteria to the substratum and aid in cell-to-
cell adherence (Bayston 1999, Costerton et al 1987). Biofilm associated protein
homolog, Bap, and accumulation associated protein, Aap, are surface proteins that are
thought to mediate biofilm formation via cell-to-cell contact with some Staphylococcus
strains (Sandiford et al 2007). In oral Streptococcus, bacterial cell-cell aggregation or
coaggregation is thought to be attributed to either lectin-saccharide or protein-protein
interactions (Hasty et al 1992).
Presently the role of the EPS remains equivocal. For example, components of
the EPS can aid binding of bacteria to conditioned surfaces (Koo et al 2010, Sutherland
2001b, Vu et al 2009), may be necessary for biofilm formation by providing structural
stability and protection from shear forces in hydrodynamic environments (Koo et al
2010, Marvasi et al 2010, Sutherland 2001b) and may promote both aggregation and co-
aggregation by providing receptor sites to which bacteria can bind (Donlan 2002, Koo et
al 2010, Marvasi et al 2010, Sutherland 2001b). The role of the EPS is not restricted to
biofilm formation and structural integrity, but may supply nutrients for utilization by
non-competing bacteria (Sutherland 2001a) and act as a storage receptacle for nutrients
to abate variation in nutrient availability (Sutherland 2001a). Additionally, the EPS may
increase resistance to antimicrobials (Mah and O'Toole 2001), provide protection from
gastric acid (Zhu and Mekalanos 2003) and reduce susceptibility to the human immune
system (Peters et al 2012). Given the diverse observations, it is likely that the EPS is

P a g e | 63
multifunctional and that functional components will vary depending on the types of
bacteria associated within the biofilm and environmental factors.
Biofilms do not experience unrestricted growth. The development of the biofilm
is restricted by nutrient availability, removal of waste, interactions with the immune
system and quorum sensing.
2.3.4.1. Nutrients and Growth
It is accepted that the mechanism employed for nutrient transport into the
biofilm is diffusion (Wanner et al 2006); thus, nutrient gradients develop within the
biofilm. This in turn, affects the growth rate of the bacteria within the biofilm. It is well
documented that bacteria within biofilms, primarily near a non-organic substratum,
exhibit a quiescent state brought on by the general stress response from nutrient and
oxygen deprivation, changes in pH and the buildup of toxic by-products (Dunne 2002),
whereas bacteria on the outer layer of the biofilm, where nutrients are easily accessible,
express a growth and metabolic rate similar to planktonic (free floating) bacteria
(Anderl et al 2003). However, this is not necessarily the case for biofilms attached to
food particles because the substratum acts as a substrate. In this scenario, bacteria
closely associated with the substratum and those on the periphery (closest to the
intestinal lumen) have more access to nutrients [Sandra MacFarlane, pers. comm.] and
thus would demonstrate the greatest growth rate. In contrast to biofilms in other
environments, biofilms growing on a nutrient providing substratum will penetrate into
the substratum while also spreading along the substratum and growing outward. The
penetration of the biofilm into the food matrix may provide further protection from
shear forces while increasing the surface area of the biofilm thereby improving substrate
availability.

P a g e | 64
2.3.4.2. Quorum Signaling: Structure, Virulence, and Detachment
Bacteria within biofilms demonstrate a number of phenotypic differences from
their planktonic counterparts. One such difference is the production of signaling
molecules by both Gram-negative and Gram-positive bacteria, which appear to be
regulated by bacterial cell population density (Hammer and Bassler 2003). Acyl-
homoserine lactones and post-translationally processed peptides, in Gram-negative and
Gram-positive bacteria respectively, have been implicated in the regulation of biofilm
development, biofilm structure, virulence and cell detachment (the fifth stage of biofilm
development) (Rhoads et al 2007).
Current studies exploring the mechanisms of quorum sensing in bacterial
biofilms have focused on pathogenic bacteria. Biofilm-associated Vibrio cholerae have
been shown to be 1000-fold more resistant to acid than planktonic bacteria (Zhu and
Mekalanos 2003), allowing them to survive the low pH of the stomach. V. cholerae
biofilm formation is initiated by the quorum-sensing regulator LuxO while maintenance
is dependent upon the HapR regulator (Zhu and Mekalanos 2003). Once within the
bowel, detachment from the biofilm, which is regulated by HapR, is necessary for
dispersal and maximal colonization of the small bowel (Zhu and Mekalanos 2003).
Quorum sensing appears to be necessary for differentiation, maintenance and
detachment of Pseudomonas aeruginosa biofilms. Although this bacterium is not found
within the GI tract, it has been well studied and many of the architectural and biofilm-
related processes of P. aeruginosa may be similar to intestinal bacteria. There are two
recognized cell-to-cell signaling systems in P. aeruginosa: lasI-lasR and rhlR-rhlI
(Davies et al 1998). The lasI-lasR system initiates biofilm formation via the synthesis of
the quorum sensing signal N-3-oxododecanoyl-L-homoserine lactone (N3OC12-HSL),

P a g e | 65
whereas the rhlR-rhlI system influences biofilm structure, maintenance and detachment
(Barken et al 2008, Boles et al 2005, Davey et al 2003).
E. coli K-12 may rely on the EPS component colanic acid for structural
differentiation. Strains deficient in colanic acid produced densely packed, thin
(approximately 2 cell depth), uniform biofilms similar to P. aeruginosa biofilms lacking
in N3OC12-HSL. Biofilms with colanic acid formed complex, 3-dimensional pillars (26
μm high) (Danese et al 2000). Given the similarity of colanic acid deficient E. coli
biofilms and the P. aeruginosa lasI mutant biofilms, Danese et al (2000) hypothesize
that quorum sensing may play a role in colanic acid production.
The autoinducer 2 molecule (AI-2), associated with the luxS, gene has been
proposed to be a common signaling molecule for inter and intra-species communication.
Tannock et al (2005) found that the luxS mutant strain of Lactobacillus reuteri was
capable of colonizing and forming biofilms in the forestomach epithelium of mice;
however the biofilms were thicker than the wild type. It was concluded that the
synthesis of AI-2 requires the luxS gene, based on the significant difference in AI-2
activity in mutant mice as compared to the wild type. Tannock et al (2005) reasoned that
the increased thickness in the mutant strain biofilms was a result of the lack of AI-2
molecule, which may be necessary for regulation of bacterial proliferation.
Lactobacillus rhamnosus GG (ATCC 53103), a probiotic strain, has been shown
to possess a luxS gene, required for A1-2 synthesis (Lebeer et al 2007). The insertion of
a tetracycline resistance marker gene disrupted the function of the luxS gene, which
suppressed the synthesis of AI-2. Lebeer et al (2007) found that the mutant strain had a
reduced ability to form biofilms in AOAC medium; however when AI-2 was added to
the medium, the mutant strain could not form biofilms analogous to the wild strain. The
addition of cysteine significantly increased biofilm formation, however wild type levels

P a g e | 66
were not achieved (Lebeer et al 2007). These findings suggest that the decrease in
biofilm formation may be attributed to metabolic pathways regulated by luxS rather than
by the signaling molecule AI-2.
Presently, the specific processes involved in the structural formation and
detachment of commensal enteric bacterial biofilms attached to food particles have yet
to be ascertained. However, it is likely that both quorum sensing and nutrient
availability will influence both the structural formation and detachment of bacterial
biofilms attached to digesta.
2.3.4.3. Nutrient and Molecule Transport in Biofilms
Biofilms are ubiquitous in nature. The transport of nutrients or molecules within
biofilms (microbial, yeast, bacteria or mixed) is better understood than any other topic
discussed thus far in the literature review. Most of our understanding stems from the
investigation of biofilms associated with waste management.
Existing experimental methods, such as pulse field gradient nuclear magnetic
resonance with (McLean et al 2008) or without confocal laser scanning microscopy
(CLSM) (Beuling et al 1998, Renslow et al 2010), microelectrodes (Beyenal and
Lewandowski 2002, Rasmussen and Lewandowski 1998), fluorescence return after
photobleaching (FRAP) (Bryers and Drummond 1998, Waharte et al 2010), and
fluorescence correlation spectroscopy (FCS) (Briandet et al 2008), have been used to
calculate the effective diffusion coefficient (EDC) parallel to the substratum in biofilms.
Such studies have shown that the EDC can vary at different locations within the biofilm
(Beyenal and Lewandowski 2002, Bryers and Drummond 1998, Renslow et al 2010,
Yang and Lewandowski 1995) and have resulted in EDCs that range from 5% to 95% of
that in water (Beuling et al 1998, Wood and Whitaker 2000).

P a g e | 67
Although information on transport parallel to the substratum is useful, three-
dimensional modeling simulations and in situ experimental studies have shown that
transport of nutrients perpendicular to the substratum is critically relevant to biofilm
function. In the case of low velocity flow in the bulk liquid environment (De Beer et al
1996), or when the chemical is only produced or consumed by the bacteria within the
biofilm (Picioreanu et al 2004), the concentration gradient is normal to the substratum;
however, in the latter case, this may depend upon the biofilm morphology since
multidimensional gradients may occur in biofilms which are highly porous and
channeled. Furthermore, in multi-species biofilms the concentration gradient may be
multidimensional if the chemical facilitates microbial cross-feeding (Picioreanu et al
2004). Thus there is a need for estimating the EDC in biofilms both parallel to and
perpendicular to the substratum.
2.3.4.4. Effective Diffusion Coefficient
Despite the evidence that nutrient transport is multidimensional, to date,
mathematical models have made three simplifying assumptions with regards to the
transport of particles within a biofilm: 1) the EDC is constant (Alpkvist and Klapper
2007, Chang et al 2003, Hermanowicz 2001, Rahman et al 2009, Rajagopalan et al
1997, Xavier et al 2004); 2) the EDC is that of water (Alpkvist and Klapper 2007, Kreft
et al 2001, Rajagopalan et al 1997, Xavier et al 2004); and 3) the EDC is isotropic (the
same in directions parallel and perpendicular to the substratum) (Alpkvist and Klapper
2007, Chang et al 2003, Rahman et al 2009, Xavier et al 2004).
There is one paper which describes the relationship between nutrient transport
perpendicular to the substratum and distance from the substratum. Using
microelectrodes, Beyenal and Lewandowski (2002) measured local effective diffusivity
profiles at multiple locations within biofilms to estimate the EDC. In this study,

P a g e | 68
biofilms consisting of Pseudomonas aeruginosa (ATCC 700829), Pseudomonas
fluorescens (ATCC 700830) and Klebsiella pneumonia (ATCC 700831) were grown on
flat plate reactors at various constant flow velocities. As seen in Figure 2.7, they found a
linear relationship between the EDC and the distance from the substratum. They
surmised that the linear decrease in the EDC towards the substratum is due to an
increased heterogeneity within the biofilm. They also found that the slope of the linear
relationship differed based on the flow conditions in which the bacteria were grown, in
that the slope of the EDC in biofilms grown at low or high flow velocities was lower
than biofilms grown at moderate flow velocities. Taking into consideration the external
mass transfer (dependent on flow velocity) and the resulting EDC, Beyenal and
Figure 2.7 The effective diffusion coefficient (EDC) as a function of distance from the
substratum for biofilms grown at selected flow velocities: 8cm/s (diamonds), 7.5 cm/s
(circles) and 28 cm/s (crosses) (Beyenal and Lewandowski 2002). Image reconstructed
using automatic image capturing software. Reprinted with permission from
Biotechnology and Bioengineering.

P a g e | 69
Lewandowski (2002) hypothesized that the EDC gradient in biofilms is related to the
biofilm density, as the biofilm structure has been shown to alter as a result of various
flow velocities.
While the linear relationship, between the EDC and the distance from the
substratum, observed by Beyenal and Lewandowski (2002) may seem satisfactory, this
linear relationship does not consider the behavior near to, or far from, the substratum. A
complete profile is necessary to determine an accurate relationship between the EDC
and distance from the substratum.
2.3.4.5. Relationship Between Biofilm Porosity or Density and Nutrient Transport
There are a multitude of models describing the relationship between either
biofilm porosity (volume fraction of the biofilm that is liquid) or biofilm density and
nutrient diffusion within the biofilm (Beuling et al 2000, Fan et al 1990, Ho and Ju
1988, Horn and Morgenroth 2006, Kapellos et al 2007, Libicki et al 1988, Maxwell
1892, Mota et al 2002, Phillips 2000, Wood et al 2002). For a review of mathematical
models see Wang and Zhang (2010). Some are heuristic fits to data (i.e. trial and error),
whereas others are derived using theoretical arguments based on simplified biofilm
geometry [Table 2.1]. It is not clear which of these models is most suitable for
describing the effect of biofilm structure on nutrient transport within the biofilm.
Many models partition the biofilm into two distinct components where one
component is comprised of biomass (bacteria and EPS) and the other of water (Alpkvist
and Klapper 2007, Hermanowicz 2001, Wanner et al 2006, Wood and Whitaker 2000).
The biofilm can then be considered a porous media. The biomass within the biofilm
reduces the rate of diffusion of particulates parallel to the substratum via steric
hindrance (De Beer et al 1997, Guiot et al 2002). However, the distribution of biomass
may be heterogeneous (Bridier et al 2010) and the diffusion parallel to the substratum

P a g e | 70
may be different to the diffusion perpendicular to the substratum. For example, if the
biomass is compact with multiple column like structures growing perpendicular to the
substratum (Bridier et al 2010, Danese et al 2000), one would expect that the columns
of bacteria would hinder the transport of particles parallel to the substratum to a greater
degree than perpendicular to the substratum [Figure 2.8]. Thus I hypothesize that the
EDC in biofilms is anisotropic, with a level of anisotropy that is dependent on the
biofilm structure.
Figure 2.8 A partial view of a Salmonella enterica biofilm created from stacked CLSM
images in MATLAB, demonstrating column like structures that form in biofilms. The z-
axis represents the distance μm from the substratum (microtiter plate).

P a g e | 71
Table 2.1 Mathematical models describing the relationship between biofilm porosity, ε, or
density, ρ , and the EDC, effD . Note, WD is the diffusion coefficient in water.
Model Reference
εε
DD
W
eff
32
(Maxwell 1892)
2τε
DD
W
eff (Epstein 1989)a
09.0
93.0
27.019.1143.0
1ρ
ρDeff
(Fan et al 1990)
ρbaDD
W
eff (Horn and Morgenroth 2006)b
b
W
eff εafDD
184.0exp 09.1
211 λεf
2822.0.2460727.3 λλa
20939.0366.0358.0 λλb
(Phillips 2000)c
(a) Here the tortuosity, , is defined as the ratio of the average pore length to the length of
the porous medium along the major flow or diffusion axis. (b) the parameters a and b are
found by linear regression. (c) In the context of biofilms, is the ratio of the radius of the
diffusing solute to the pore ratio. Since the model description was used to estimate diffusion
of solutes in muscle fiber, is assumed to be constant and the parameter values (a and b)
may not be suitable for biofilms as seen in the work by Kapellos et al (2007).

P a g e | 72
2.4. Concluding Comments
As our knowledge of food/bacteria/host interactions increases, it is becoming
clear that there is enormous potential in the development of functional foods. With the
increasing incidence of intestinal related conditions, allergies and food intolerances,
there is a growing awareness by the public for alternative methods to improve general
health. To maximize the potential health benefits from functional foods, it is essential
that we develop a deeper understanding of (1) how gastric digestion alters the food
matrix; (2) how to predict the proportion of the food matrix which remains after
digestion in the stomach and small bowel, as well as the composition of the remaining
food matrix; (3) how diet impacts bacterial attachment to the digesta in the small and
large bowel; (4) how diet impacts the bacterial colonization of the bowel; and (5) how
bacteria work in a consortium to degrade food particles within the small and large
bowel.
The human stomach is a dynamic and complex system. Here, the few models in
the literature pertaining to gastric digestion have been outlined. In terms of
mathematical modeling, it is only in its early development; however the building blocks
to fully understand how the stomach works to degrade food particles are slowly being
put together. Of course, future food degradation experiments which specifically
consider the effects of the food matrix components on erosion and fragmentation,
changes in food particle distribution during digestion and the rate of emptying, the
effects of temperature on degradation, and the diffusion of gastric fluid as a function of
pH are critical to advance the current mathematical models.
The value of understanding food/microbial interactions has only just gained
substantial notice in scientific research. Until recently, research has focused on
pathogenic bacteria, most of which are associated with the intestinal epithelium rather

P a g e | 73
than the digesta. Additionally, studies of the commensal bacteria associated with the
intestinal lumen and digesta have concentrated on enumeration, classification,
determination of preferred substrates of known species and potential metabolites
released via carbohydrate fermentation, and to a lesser extent protein metabolism and
bile acid hydrolysis.
It is clear that this area of research is still in its infancy. Many of the microbial
species associated with the GI tract, and in particular associated with the digesta, have
yet to be identified. While the enteric microbiota is capable of metabolizing a variety of
dietary and endogenous compounds, the mechanisms required for attachment to these
substrates has only been determined for a few bacterial strains and primarily to resistant
starch. When testing the current theoretical models for bacterial attachment, there is
clear evidence that these models do not accurately reflect bacterial attachment in this
dynamic system. Quorum signaling, in pathogenic bacteria, has been recognized as a
necessary process by which biofilm formation, structure and detachment is regulated,
although as yet, these pathways have not been determined in the commensal microbiota.
In terms of modeling bacterial growth and biofilm development, the scientific
community has made significant gains. However, as pointed out in the literature review,
the level of anisotropy of nutrient transport in biofilms has yet to be determined,
primarily due to the methods in which the effective diffusion coefficient is determined.
Furthermore, complete models which predict bacterial competition and cross-feeding
have yet to be developed. Much of the challenge in building reliable predictive models
is the lack of data required to validate the models. There is a substantial need for future
coculture and multi-culture bacterial experiments which explicitly measure growth
kinetics at relatively frequent time intervals.

P a g e | 74
Currently there is little knowledge of this unique, complex and highly important,
physiological system–the human gastrointestinal tract the interactions between
food/bacteria/host. This is an exciting field of study for those in nutrition, microbiology
and mathematical modeling.
2.5. Aims of Research
There are many challenges associated with understanding the complex
interactions in the human digestive tract. In vivo observation and experimentation is
often difficult, expensive or even impossible. For example, it is difficult to accurately
measure the rate of production of metabolites by bacteria within biofilms. In an in vivo
situation, the rate of production of metabolites by the commensal bacteria may be
difficult to directly quantify because, soon after they are produced, the majority of

P a g e | 75
metabolites diffuse through the intestinal epithelium to be utilized by the body. The
difficulties of in vivo experimentation necessitate the use of alternative methods for
measurement, prediction and understanding. In vitro experimental systems and
mathematical models are useful adjunct tools for this purpose.
From one point of view, mathematical models are similar to in vitro
experiments, in that both allow phenomena to be studied in a “model system” or
simplified scenario of the biological system of primary interest. Mathematical models
can be used to provide insight and understanding to the information obtained through in
vitro and in vivo experimentation. Mathematical models can be used to 1) provide a
systematic framework to link experiments, 2) form the basis of a statistical tool to
estimate physical variables that are difficult to measure directly (such as metabolite
production rates), 3) make predictions and 4) formulate new biological hypotheses to be
tested by new experiments.
The literature review has highlighted a number of areas in which mathematical
models could be used to provide better insight into the mechanisms responsible for the
degradation of food particles within the human digestive tract. As mentioned in section
2.1.2.3, there has yet to be a mechanistic model proposed in the current literature to
describe solid loss as a result of gastric digestion. To understand the complexities of
gastric digestion and to build models which accurately describe the underlying digestive
mechanisms, it is essential to determine the effects of different factors (food structure,
preparation, particle size, meal volume and composition, viscosity, pH, and
temperature) on gastric digestion prior to investigating the interactions between those
factors. Here, only the effect of pH on digestion is considered as the pH directly affects
enzymatic reactions, varies over the digestive time, and has been shown to have a
significant effect on the amount of soluble loss from the food matrix.

P a g e | 76
The hypothesis driving the work in Chapter 3 is that the rate of diffusion of the
fluid into a food particle is not only dependent upon the concentration of the fluid
diffusing into the food particle, but is also dependent on the pH of the fluid and the
structure of the food matrix. Furthermore, these dependencies contribute to the
increased rate of soluble loss and protein degradation in particles submerged in gastric
fluid with low pH. The aim is to demonstrate this dependency by developing a dynamic,
mechanistic mathematical model that describes the soluble loss of a food particle due to
degradation by acidic hydrolysis in the human stomach using raw carrot and Edam
cheese as model food systems.
Chapter 4 is motivated by the hypothesis that a mathematical model of microbial
growth can be used to predict coculture growth kinetics based on monoculture growth
kinetics. The aim of Chapter 4 is four fold: (1) to develop a model that draws upon the
previously proposed dynamic, mechanistic mathematical model of Amaretti et al (2007)
to describe the mechanisms for substrate consumption and subsequent microbial growth
and metabolite production for bacteria grown in monoculture, (2) to extend the model to
describe the preferential degradation of oligofructose during growth of a single bacterial
strain in monoculture, (3) to adapt the model to describe competition between two
bacterial species for a particular substrate as well as cross-feeding resulting from the
breakdown products of extracellular carbohydrate hydrolysis by one of the bacterial
species, and (4) to explore and predict the growth dynamics between Bacteroides
thetaiotaomicron LMG 11262 and Bifidobacterium longum MG 11047 and B.
thetaiotaomicron LMG 11262 and Bifidobacterium breve Yakult as compared to
experimental coculture data using the model described in the third aim of Chapter 4.
The work in Chapter 5 is driven by the hypothesis that nutrient transport in
biofilms is anisotropic. The aim of this chapter is four fold: (1) to utilize an alternative

P a g e | 77
method for determining the EDC in real three-dimensional bacterial biofilms, (2) to
determine the level of anisotropic nutrient transport in biofilms, (3) to ascertain the
relationship between the porosity of the biofilm and the EDC and (4) to construct a
model of nutrient transport within a bacterial biofilm growing on a nutrient-providing
substratum.

P a g e | 78
Chapter 3 A Mathematical Model of the Effect of Gastric Fluid pH on Food Degradation in the Human Stomach
3.1. Abstract
The question of bioaccessibility of nutrients within a food matrix has become of
increasing interest in the fields of nutrition and food science as bioaccessibility is the
precursor to bioavailability. By analyzing the propagation of the wetting front of
simulated gastric fluid (SGF) without pepsin or mucin in raw carrot core and Edam
cheese as model systems, the diffusion of the acidic water is shown to be dependent on
the pH of the gastric fluid and the food matrix. Utilizing the diffusion rates found at
various pH levels (1.50, 2.00, 3.50, 4.30, 5.25 and 7.00), a model is developed to
describe the measured non-linear rate of soluble particle loss during digestion at various
constant pH levels. Additionally, a model is developed to predict the likely rate of
soluble particle loss during digestion in the stomach where pH decreases with time. This
model can be used to help understand and optimize the relationship between food
structure/composition and food degradation in the human stomach, which may help in
the development of novel foods with desired functionality.
3.2. Introduction
In food science and nutrition the question of the bioaccessibility of a food (the
fraction of a nutrient released from a food matrix) is of increasing interest. In order for a

P a g e | 79
nutrient to become bioavailable (absorbed by and used by the host), it must first become
bioaccessible through the processes of mastication, stomach digestion, and enzymatic
reactions within the small bowel. Both the degree of particle loss and the amount of
remaining material is critical to human health; in that the leached soluble fraction is
readily available for absorption in the small bowel and the remaining insoluble fraction
may act as a substrate for bacterial growth within the small and large bowel. In order to
develop novel foods which either increase the rate of bioaccessibility (in the case of
foods targeted for consumption by athletes, infants and the elderly) or decrease the
bioaccessibility (in the case of food matrices which encapsulate probiotics and thus may
need to remain intact throughout digestion), a deeper understanding of human digestion
is required as well as the ability to predict the behavior of food matrices within the
human gastrointestinal (GI) tract.
The degradation of food particles within the stomach is complex and results
from both mechanical forces and chemical reactions. Peristaltic movements within the
stomach compress the food bolus, which can result in fracturing of food particulates,
and may facilitate erosion or shearing due to the mixing of the stomach contents.
Tenderization of food particles results from the absorption of gastric juice; both acidic
hydrolysis and enzymatic reactions cause leaching of nutrients from the food particle
making them bioaccessible. The extent of soluble particle loss, and hence nutrient
bioaccessibility, as well as the erosion of the particle are also dependent upon the food
structure, preparation, particle size, meal volume and composition, viscosity, pH, and
temperature.
An important factor contributing to the bioaccessibility of nutrients during
gastric digestion is the structure of the food matrix. When vitamin B12 is encapsulated in
a water-in-oil-in-water double emulsion only 4.4% of vitamin B12 was released after

P a g e | 80
120 minutes of gastric digestion, whereas all of the non-encapsulated vitamin B12 was
bioaccessible (Giroux et al 2013). While it is expected that the protein content of the
food matrix will have a marked effect on the extent of proteolysis, it has been shown
that the fat content of foods can reduce protein digestibility (Grimshaw et al 2003); it
was hypothesized that the fat encapsulated the protein molecules, restricting digestion.
A study comparing the digestibility of proteins in various foods (legumes, cereals, milk
products and chicken meat) has shown that the secondary structure elements of the
proteins within the food played a major role in reducing protein digestibility (Carbonaro
et al 2012). These same secondary structures are found in β-lactoglobulin, which has
been shown to be resistant to proteolysis by both pepsin and trypsin (Guo et al 1995). In
addition to the food composition and protein structure, pH can affect the efficacy of
pepsin. Studies with kiwifruit have shown that even after an hour of digestion, there was
very little breakdown of proteins when digested in simulated gastric fluid with pH
greater than 2.5 (Lucas et al 2008).
To understand the complexities of gastric digestion and to build models which
accurately describe the underlying digestive mechanisms, it is essential to determine the
effects of such different factors (food structure, preparation, particle size, meal volume
and composition, viscosity, pH, and temperature) on gastric digestion prior to
investigating the interactions between those factors
There have been few models proposed in the literature that describe food
digestibility. Current mathematical models which describe food digestibility have
primarily focused on the wet mass retention ratio of the studied food (wet sample
weight after digestion time divided by the initial wet sample weight) (Kong and Singh
2009b); however, the wet mass retention ratio is more suitable to describe the satiety
properties of a food matrix during digestion rather than the bioaccessibility of nutrients

P a g e | 81
within a food matrix. As observed in studies with raw and roasted almonds, the wet
mass retention ratio increased with digestion time as the food matrix absorbed gastric
fluid, whereas the dry solid mass decreased over the digestion time (Kong and Singh
2009a). Thus the wet retention ratio does not provide information on soluble solid loss
(or bioaccessibility), rather it provides information on the change in volume of the food
particle. Increased particle size reduces the rate at which the food particle empties from
the stomach and increases the volume of the bolus, both of which are directly related to
the feeling of fullness or satiety (Marciani et al 2001).
Recently, the dry solid loss of carrot was described using the Weibull function
(Kong and Singh 2011); however, this description of the dry solid loss does not
adequately describe the solid loss after an extended time (time equaling 36 hours). Such
empirical models, although useful for inference purposes, do not incorporate any of the
mechanisms that influence digestibility. For instance, the Weibull function does not
describe the process of diffusion of the gastric fluid into the food particle, which may be
pH dependent. Models of the mechanisms underlying the degradation of food particles
will yield a better understanding of the interaction and role of different processes in the
breakdown of food particles.
It is well known that the pH of the gastric contents after a meal is not static in
time, rather the pH of the gastric contents can reach approximately 5 within minutes
after the ingestion of a meal, and may take up to 2-3 hours before the gastric contents
reaches a pH below two (Malagelada et al 1976). In previous in vitro studies of carrot
digestion, the pH of the simulated gastric fluid had a marked effect on the amount of
soluble loss from the food matrix (Kong and Singh 2011). The rate of soluble loss from
a food matrix in the stomach is therefore not static in time and cannot be predicted
based on a static pH level. Here, only the effect of pH on digestion is considered as the

P a g e | 82
pH directly affects enzymatic reactions, varies over the digestive time, and has been
shown to have an effect on the amount of soluble loss from the food matrix.
Given these results, the rate of diffusion of the fluid into a food particle is
hypothesized to not only be dependent upon the concentration of the fluid diffusing into
the food particle, but is also dependent on the pH of the fluid and the structure of the
food matrix. Furthermore, these dependencies contribute to the increased rate of soluble
loss and protein degradation in particles submerged in gastric fluid with low pH.
Note that the hypotheses are independent of pepsin-mediated pH and food
effects on the rate of diffusion of the fluid into a food particle during gastric digestion
(e.g., pepsin was not included in the simulated gastric fluid to ensure that any difference
observed in the propagation of the acidic fluid between food matrices was a result of the
food structure). Even though pepsin effects are excluded from this study, this does not
preclude the important role of pepsin-dependent effects on the rate of diffusion of the
gastric fluid into a food particle (understanding the pepsin-independent effects is a
prerequisite to understanding the pepsin-dependent effects).
The aim of this work is to demonstrate the dependency of solid loss on pH and
food structure by developing a dynamic, mechanistic mathematical model that describes
the soluble loss of a food particle due to degradation by acidic hydrolysis in the human
stomach using raw carrot and Edam cheese as model food systems. As mentioned
earlier, there has yet to be a mechanistic model proposed in the current literature.
Specifically, the propagation of the wetting front into the food particle, which has a
major influence on the rate of nutrient release during gastric digestion, will be
described. The model will be tested by fitting the model to the measured non-linear rate
of soluble particle loss during digestion at various constant pH levels. Because the pH
within the stomach is not static, the model will be used to predict the likely rate of

P a g e | 83
soluble particle loss during digestion in the stomach where pH decreases with time after
meal ingestion. This model can be used to help understand and optimize the relationship
between food structure/composition and food degradation in the human stomach, which
may help in the development of novel foods with desired functionality.
3.3. Materials and Methods
Digestion Simulation 3.3.1.Raw carrots were purchased from local vegetable shops (Hamilton, New
Zealand). Attention was taken to purchase carrots of similar length (17.35 1.24 cm)
and weight (111.83 6.43 g). A cork borer was used to take cylindrical samples
(diameter 5.3 mm 21 mm length) from the core of the raw carrot, parallel to the
length of the carrot. The diameter of the sample was within the range of particle sizes
which enter the stomach after mastication (Mishellany-Dutour et al 2011, Peyron et al
2004), though on the larger end of the spectrum in order to improve the visualization of
the simulated gastric fluid (SGF) penetration front. The length of the cylindrical
samples was exaggerated to ensure that diffusion of SGF from either the top or bottom
of the cylinder did not influence the diffusion of gastric fluid at the center of the
cylindrical sample.
To gauge the effect of pH on diffusion rates, individual samples were placed in
sterile, 50 ml polypropylene centrifuge tubes (RayLab, New Zealand) with 30 ml of
SGF in a 37°C 0.1°C shaking water bath (Daihan Scientific Co., Ltd., Korea) at 30
rpm for 5, 10, 20, and 40 minutes. Four replicates were examined at each time period.
SGF was prepared without pepsin or mucin: NaCl (8.775 g/L), 2 M HCl (10 mL) and
distilled water (990 mL) (Kong and Singh 2008). It has previously been shown that
neither mucin nor pepsin had a significant effect on the solid loss of carrot; the lack of

P a g e | 84
proteolysis in carrots may be attributed to the fact that carrots only contain minor
amounts of protein (Kong and Singh 2009b, Kong and Singh 2011). SGF without
pepsin or mucin is essentially acidic water (AW), thus it is referred to as such in this
work. This experiment was repeated at six different pH levels: pH 1.50, 2.00, 3.50, 4.30,
5.25 and 7.00 0.01. AW was adjusted to the required pH by the addition of either HCl
or NaOH. Methylene blue was added to the AW in order to visualize the AW
penetration front (~2mg/450 ml of AW) (Kong and Singh 2009b). Given that the area of
a methylene blue molecule is approximately 1.32 – 1.35 nm2 (Hang and Brindley 1970)
and the space between the cells of the carrot can range from 100 nm to the micrometer
scale, the addition of methylene blue to the AW will have little to no effect on the
diffusion rates of the AW.
Edam cheese (Fonterra, New Zealand) was purchased from a local grocery store
(Hamilton, New Zealand). In order to compare the effect of the food matrix on the
diffusion of AW, sampling and digestion methods for Edam cheese were identical to the
methods described for carrot, with the following exceptions. Blocks of Edam were
frozen at -20°C prior to sampling in order to reduce sample compaction as a result of
cutting and the samples were allowed to defrost at room temperature prior to digestion
simulation. Given the purpose of the experiment was to examine the AW penetration
front and not the solid loss during digestion, the digestive times were 5, 10, 15 and 20
minutes. More frequent time frames were chosen for Edam to reduce the possibility of
the cheese melting at the given temperature. In order to ensure that any difference in the
AW propagation front between food matrices was a result of the food matrix itself,
pepsin was also not included in the AW for Edam. As observed in previous studies with
kiwifruit (Lucas et al 2008) and casein proteins (Guo et al 1995), one would expect
some proteolysis of cheese at low pH levels although not at pH greater than 2.5 – 3.

P a g e | 85
Such proteolysis at low pH may create additional solid loss and increase the speed of
the AW propagation front in cheese food matrix. However, the role of protein
hydrolysis on solid loss and the speed of the SGF propagation front are beyond the
scope of this work.
To halt the diffusion process, samples were removed after the respective soaking
times and frozen by submergence into liquid nitrogen and stored at -80°C. Sections of
approximately 4 mm were taken from the center of the cylindrical samples, using a
cryostat microtome (Leica, Germany) set at -12°C, which allowed the samples to
remain frozen until images were taken reducing the risk of further diffusion of AW in
the samples. Images of the cross sections were obtained at 16 magnification using a
high definition digital camera (Cannon PowerShot G6, Japan) attached to a microscope
(Zeiss, Germany). Images were obtained on a white background (OCT compound,
Sakura Fineteck, USA).
Mathematical Model of Moisture Transport 3.3.2.In the instance of sorption or desorption, the dependence of the effective
diffusion coefficient (EDC) on moisture content is well established (Crank 1975) and
has been shown to be relevant to cheese in the modeling work of Payne and Morison
(1999) and experimental work of Guinee and Fox (1983). In each instance, the EDC
increased concomitantly with an increase in moisture content. This activity is not
restricted to cheese, but has been demonstrated in the absorption of water in peas
(Waggoner and Parlange 1976), soybean, corn, cotton seeds (Phillips 1968), and rice
(Gomi et al 1996), in the dehydration of carbohydrates (Aldous et al 1997) and the
drying of gelatin and sugar solutions (Yamamoto 1999). The models which describe the
dependence of the EDC on moisture content primarily use either an exponential

P a g e | 86
function (Crank 1975), sum of exponentials (Gomi et al 1996, Gomi et al 1998) or the
power law (Yamamoto 1999). In this work, a standard exponential function was used:
θbAθD exp 3.1
where the parameters .0,bA
As shown in previous work (Saguy et al 2005, Syarief et al 1987), the theory of
liquid transport in porous materials, such as soil, can also be applied to food structures.
This theory is based on Darcy’s Law for unsaturated porous media (with no gravity
effects) and conservation of mass. Thus, the moisture content, , diffusing into a food
matrix (i.e., the AW concentration), which is expressed as volume of water in a unit
volume of porous media (sum of solid and pore volumes), can be described by the
following diffusion equation:
D
t
3.2
where θD is interpreted as the ratio of hydraulic conductivity to specific water
capacity. Assuming diffusion along the radius of a cross section of a cylinder, this
becomes
rθθD
rr
rθ 1 3.3
where r is the radial distance from the center of the cylinder. The initial and boundary
conditions are respectively:
00, trθ 3.4a
1, ttRrθ 3.4b
00,
ttrθ .
3.4c
That is, initially there is no AW in the food matrix and the boundary of the food matrix,
tR , which may be a function of time t, is fully saturated.

P a g e | 87
Determining Diffusion Coefficients 3.3.3.Images of the partially digested carrot and Edam cheese cross sections were uploaded
into MATLAB (The MathWorks; www.mathworks.com) [Figure 3.1]. The center of
each sample was determined by visual inspection and the initial radius was known (2.65
mm). The mean color density distribution for green, red and blue, were determined in
MATLAB as a function of distance from the center of the sample. The red color density
distribution provided the best indicator for the AW penetration front profile, as the mean
color density of the control samples (samples that had not undergone any digestive
processing) resulted in a relatively horizontal line, except at the boundary of the sample.
In the red, green and blue color density profiles, the color density increased at the
boundary of the sample which reflects cutting imperfections in the cork borer. However,
the apparent boundary effects had less of an impact on the red color density profile.
Figure 3.1 Cross section of carrot core (a) and Edam cheese (b) after 5 minutes in
acidic water at pH 7 and at pH 3.5, respectively. Area in which acidic water has
penetrated is shown by the presence of methylene blue (blue/purple).

P a g e | 88
Using a linear transformation, the mean color density distribution [Figure 3.2a]
was transformed into a concentration profile of the AW as a function of distance from
the center of the samples [Figure 3.2b]. To account for discrepancies in the red color
density values of carrot samples (as carrot core color varies between carrots and within
the same carrot), the value of the red color density at approximately 45 μm from the
center was used to represent the value for which no AW was present. Thus, only
samples in which the AW did not fully penetrate the sample were selected for data
analysis. Furthermore, Edam cheese samples were chosen for analysis if 1) the AW had
not fully penetrated the sample, 2) the sample maintained its cylindrical shape, and 3)
fissures did not occur in the sample. Given that the boundary of the samples were not
perfectly uniform, the minimum mean color density was used to represent the distance
at which the concentration of AW reached its maximum. To account for the lack of
uniformity at the boundary of the carrot, it was assumed that the AW concentration was
100% from the point where the AW reached its maximum concentration to the
boundary of the carrot.

P a g e | 89
Figure 3.2 (a) Color density profile as a function of distance from the center of carrot core:
raw data (red crosses), mean value (blue squares) and average maximum and minimum
values (dashed lines). (b) Linear transformation of average color density value (blue
triangles), standard deviation (blue bars), and smoothed edge effects (magenta diamonds).

P a g e | 90
Data Analysis 3.3.4.To determine the EDC model parameter means for the carrot samples (Eq. 3.1),
the multi-response method described in Pell & Kowalski (1991) was used. In this
method the trace of the matrix ZTZ is minimized, were Z is the matrix of residuals of the
difference between the AW penetration front profile at 5 and 10 minutes and the model.
This is equivalent to minimizing the mean square error. The trace of ZTZ was used as
the data were of the same units and scale (Pell and Kowalski 1991). As a result of the
limited number of usable Edam cheese samples, the EDC model parameter means were
determined by minimizing the mean square error for individual AW penetration front
profiles.
Unless otherwise specified, nonlinear regression model parameters were found
by minimizing the mean square error in MATLAB (The MathWorks;
www.mathworks.com). Significance tests for the relationship of pH to the distance for
which the AW concentration reached 50%, 21θ , were conducted using a one-way
ANOVA in GenStat V13.2 (VSN International Ltd., UK). Partial differential equations
were solved in MATLAB using the initial-boundary value solver pdepe.
3.4. Results and Discussion
Choice of Model Food Matrix 3.4.1.Given that the initial step in calculating the EDC requires the model food to
maintain a symmetric cross section of known size, it was essential that the selected food
matrices did not swell as a result of gastric fluid absorption or undergo conformational
changes at a temperature of 37°C. If the food structure undergoes conformational
changes, this results in a moving boundary problem which complicates the measurement
of the EDC. For this study our model food was the carrot which has a relatively

P a g e | 91
isotropic structure, even though the cellular structure is heterogeneous. Additionally, it
was previously shown that raw carrot is geometrically stable and does not swell under
gastric fluid digestion conditions (Kong and Singh 2008, Kong and Singh 2011).
Other foods such as meat, rice and almonds were considered; however, these
foods all have particular characteristics that complicate the estimation of the diffusion
rates with our methods. For example, it was found that high moisture cheese would
begin to melt at a temperature of 37°C, the sampling method increased the density of
the samples, and in many cases caused fissures in samples which enabled diffusion of
gastric fluid along the crevice path (data not shown) limiting its usefulness. The
anisotropic structure of meat fibers, distribution of fat, variable moisture content, and
potential differences in the cooked state all add additional complications in the sampling
of meat and the estimation of diffusion rates. Furthermore, studies of beef jerky (Kong
and Singh 2009b), almonds (Kong and Singh 2009a), and rice (Kong et al 2011)
showed that these food structures increased in wet weight during the initial stages of
digestion, which results in a moving boundary problem making the estimation of
diffusion rates more complex.
Effect of pH on the Effective Diffusion Coefficient 3.4.2.Figure 3.3a,b illustrates the effect of pH on the rate of diffusion of the AW into
the carrot matrix. Within 20 minutes, the AW adjusted to pH 1.5, fully penetrated the
carrot core (2.65 mm), whereas the AW adjusted to pH 4.3 penetrated less than 1 mm.
Several conditions were required and assumptions made, as described previously, in
order to use the color density profile to describe the AW penetration front. Thus, the
results presented here are based on the samples which were soaked in gastric fluid for
either 5 or 10 minutes; longer time periods resulted in the full penetration of the sample
with low AW pH levels.

P a g e | 92
The AW concentration profiles were different for various pH concentrations at
the same soaking time period [Figure 3.4a]. The difference in effective diffusion rates
between pH decreased as the pH became less acidic. To determine the significance of
the effect of pH on the AW concentration, the distance at which the AW concentration
reached 50%, 21θ μm, for each pH concentration examined was considered [Figure
3.4b] after soaking in gastric fluid for 5 and 10 minutes. An exponential regression
model was fit to the 10 minute data (Eq. 3.5):
Figure 3.3 Cross section of carrot core after 20 minutes in acidic water (AW) at pH 1.51
(a) and at pH 4.3 (b). Cross section of Edam cheese after 5 minutes in AW at pH 1.51
(c) and at pH 7 (d). Area in which AW has penetrated is shown by the presence of
methylene blue (blue/purple).

P a g e | 93
95.6411022672 121
pHθ . 3.5
The exponential model is biologically relevant given the definition of pH, and
accounts for 83.9% of the variance in distance. A one-way ANOVA for the data after
soaking for 5 minutes (not shown) and 10 minutes [Figure 3.4b] shows that the effect of
pH on the distance for which the AW concentration reached 50%, 21θ , is significant for
low pH levels (P<0.001); however, there was no significant difference in the mean
values for pH between 3.5 and 7.0.
The results in this study were compared with those in Kong and Singh (2009b)
by determining the SGF penetration front profile for their image of a carrot soaked in
SGF (pH 1.8-2.0) for 20 minutes. Contrary to visual inspection, the SGF had fully
penetrated the carrot sample, in that there was a dramatic drop in red color density near
the center of the carrot. While the SGF had traveled to the center of the carrot sample,
the color density was not uniform and there was a higher concentration of methylene
blue at the center and near the boundary of the carrot samples. This is consistent with
our observations of carrot samples soaked in AW at pH 1.5 [Figure 3.3a] and pH 2.0
under identical experimental conditions.
The diffusion rates between food matrices were different [Figure 3.5]. After ten
minutes of soaking, the distance at which the AW concentration reached 50% was
significantly different between Edam cheese and carrot at pH 1.5 and pH 7.0 (P <
0.001); the distance at which the AW concentration reached 50% for carrot was
approximately 3 times greater than Edam cheese at pH 1.5 and approximately 1.4 times
greater than Edam cheese at pH 7.0. This may be attributed to the difference in water
content, protein content and protein type between the two food matrices.
The high water content of carrot ( 90%, or 2.2 times greater than Edam) would
facilitate the diffusion of AW within the carrot. The protein content of Edam (26.4%)

P a g e | 94
Figure 3.4 (a) AW concentration as a function of distance (μm) from the center of
partially digested carrot, after 10 minutes, at pH 1.51 (blue triangle), pH 2.00 (purple
circle), pH 4.30 (pink diamonds), and pH 7.00 (green squares). (b) Distance (μm) at
which the AW concentration reaches 50% for carrot samples soaked in AW for 10
minutes, at pH 1.51 (solid square), 2.00 (solid triangles), 3.50 (solid diamonds), 4.30
(open square), 5.26 (open triangles) and 7.00 (open diamonds). The nonlinear
regression model (Eq. 3.5) is represented by the curve. The different letters a, b, and c
denote significant differences in mean values as determined by one-way ANOVA (P <
0.001).

P a g e | 95
may restrict the diffusion of gastric fluid as a result of coagulation of proteins. Guo
(1995) demonstrated that casein coagulates at pH between 3-4, restricting the
susceptibility of these proteins to proteolysis by pepsin. This coagulation of proteins,
may also be the reason that cheese has been shown to provide a good conduit for
probiotic delivery (Sharp et al 2008), as the coagulation of casein may hinder the gastric
fluid from diffusing into the food matrix, preserving the bacteria during gastric
digestion. The freezing of the Edam prior to sampling may also have resulted in cellular
damage. Such damage could potentially increase the rate at which the AW penetrated
the cheese, which would result in an even greater difference between carrot and Edam if
the Edam had not been frozen prior to sampling. Given the number of usable samples of
Edam cheese (as a result of conformational changes and fissures in the food material), a
significant effect of pH on the distance at which the AW reached 50% in Edam cheese
was unable to be determined.
Choice of Effective Diffusion Coefficient 3.4.3.As in the work by Davey et al (2002), the sum of exponentials equation (Gomi et
al 1996, Gomi et al 1998) did not improve the fit of the AW penetration front.
Additionally, Eq. 3.1 was compared to a power law function (Yamamoto 1999) and it
was found that the power law function did not describe the water penetration front better
than the exponential equation. Although the exponential description of the effective
diffusion coefficient resulted in the best fit for the AW penetration front for both the
carrot and Edam cheese [Figure 3.5], the exponential function did not adequately
describe the AW concentration at the boundary of the samples. The lack of uniformity
at the boundary of the carrot and Edam cheese samples, as well as the additional
attached frozen AW, generated difficulties in determining the concentration of AW at
the actual boundary of the samples [Figure 3.3]. As described previously, to account for

P a g e | 96
the lack of symmetry of the cut sample it was assumed that the maximum concentration
of AW was the minimum value of the mean red color density near the boundary. This
may provide an underestimate of the AW near the boundary of the sample. If this were
the case, then the exponential equation would provide an even better description of the
data. If there is a leveling off in the AW near the boundary of the sample, and this
behavior is not an artifact, then the Maxwell-Stefan model (Krishna and Wesselingh
1997, Payne and Morison 1999, Verschueren et al 2007) may provide a better
description of this behavior; however, this would be at the expense of having a
considerably greater number of model parameters.
The fit of the model (Eq. 3.3 with Eq. 3.1) to the carrot data resulted in an R2
value of 0.99 at both pH values, and R2 = 0.99, 0.98 for the model fit to the cheese data
at pH 1.5 and pH 7, respectively. The high R2 values determined by comparing the
model fit to the experimental data emphasizes the accuracy of the model and further
demonstrates the dependence of the diffusion coefficient on the concentration of fluid
diffusing into the food particle (Eq. 3.1).

P a g e | 97
Figure 3.5 Acidic water penetration front profiles for carrot (solid circles) and Edam cheese
(open circles) soaked for 10 minutes at pH 1.51 (a) and at pH 7 (b). The model fit (Eq. 3.1,
3.2, and 3.4) for individual profiles is denoted by the dotted curves.

P a g e | 98
Effective Diffusion Coefficient and Relation to pH in 3.4.4.Carrot
In order to determine the distribution in the model parameters, a Markov chain
Monte Carlo (MCMC) analysis on the combined AW penetration front profiles was
performed (Gilks et al 1996, Shorten et al 2004). From the MCMC analysis, the
relationship between pH and the coefficients of the diffusion model (Eq. 3.1) were then
determined by fitting a nonlinear regression model using maximum likelihood (Eqs. 3.6
and 3.7):
102339.010 10091.810997.9 pHA 3.6
pHb 641.01055.20 3.7
where the units of A are m2s-1, and the parameter b is dimensionless [Figure 3.6].
The relationship between pH and b implies that the diffusion coefficient is
dependent upon the AW concentration for pH < 3.5 and that for pH 3.5 the diffusion
coefficient is constant. Additionally, the relationship between pH and A shows that the
diffusion coefficient is dependent upon the AW concentration for pH < 3.5 and is
relatively constant for pH 3.5.

P a g e | 99
Figure 3.6 Estimated parameters A and b (squares), with standard error of the mean, for
the EDC Eq. 3.1 based on least squares best fit of multi-response data. The model
description (curves, Eqs. 3.6 and 3.7, respectively) of the relationship between the
parameter and pH is consistent with Figure 3.4b.
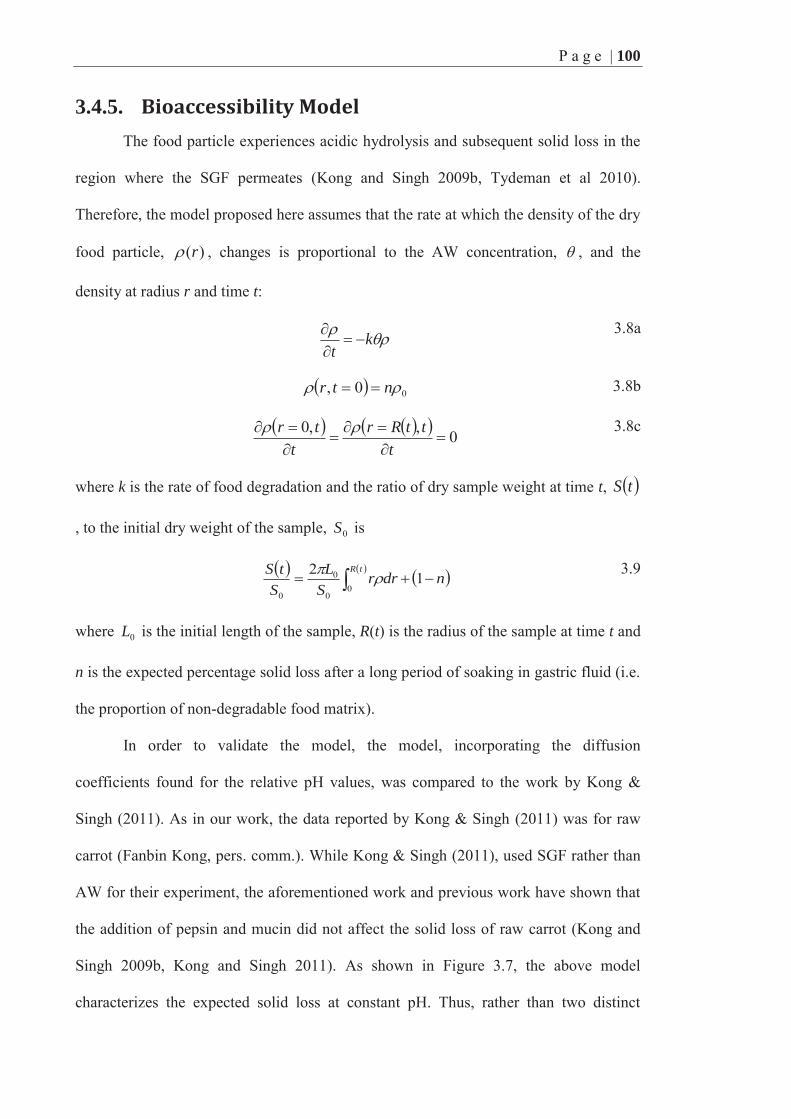
P a g e | 100
Bioaccessibility Model 3.4.5.The food particle experiences acidic hydrolysis and subsequent solid loss in the
region where the SGF permeates (Kong and Singh 2009b, Tydeman et al 2010).
Therefore, the model proposed here assumes that the rate at which the density of the dry
food particle, )(r , changes is proportional to the AW concentration, , and the
density at radius r and time t:
k
t
3.8a
00, ntr
3.8b
0,,0
tttRr
ttr
3.8c
where k is the rate of food degradation and the ratio of dry sample weight at time t, tS
, to the initial dry weight of the sample, 0S is
ndrrSL
StS tR
120
0
0
0
3.9
where 0L is the initial length of the sample, R(t) is the radius of the sample at time t and
n is the expected percentage solid loss after a long period of soaking in gastric fluid (i.e.
the proportion of non-degradable food matrix).
In order to validate the model, the model, incorporating the diffusion
coefficients found for the relative pH values, was compared to the work by Kong &
Singh (2011). As in our work, the data reported by Kong & Singh (2011) was for raw
carrot (Fanbin Kong, pers. comm.). While Kong & Singh (2011), used SGF rather than
AW for their experiment, the aforementioned work and previous work have shown that
the addition of pepsin and mucin did not affect the solid loss of raw carrot (Kong and
Singh 2009b, Kong and Singh 2011). As shown in Figure 3.7, the above model
characterizes the expected solid loss at constant pH. Thus, rather than two distinct

P a g e | 101
diffusion coefficients, as described previously by Kong & Singh (2011), this work
demonstrates that the expected solid loss is dependent on the concentration of AW and
the available degradable food matrix. Our observed effect of pH on the propagation of
the AW wetting front explains a component of the measured solid loss at constant pH.
Additionally, within the region of the carrot samples where the SGF had traversed,
significant cell separation and cell rupture had occurred (Kong and Singh 2009b,
Tydeman et al 2010). One may therefore interpret the decreased rate of solid loss at pH
1.8 after 1 hour of soaking in SGF (Kong and Singh 2011) as insoluble solid loss, or
cellular loss, rather than soluble solid loss.
The pH of the contents within the human stomach is not static. Figure 3.8
describes the change in pH from ten minutes to 4 hours after the ingestion of a meal
composed of coarsely ground tenderloin steak, cooked and seasoned with salt, white
Figure 3.7 Solid loss of carrots at fixed pH of 5.3 (triangles), 3.5 (circles) and 1.8 (squares)
(Kong and Singh 2011) and model fit (Eqs. 3.8 and 3.9) for the same fixed pH (curves).

P a g e | 102
bread with butter, vanilla ice cream topped with chocolate syrup and a glass of water
(Malagelada et al 1976). This change in pH, relative to time, is described in this work
with an exponential function, which is biologically relevant to the data:
4613.1 0179.0exp179.4 tpH 3.10
where 0t corresponds to 10 minutes after the ingestion of the meal. The type of meal
ingested will have a marked effect on the pH of the stomach. For example, meals that
are primarily vegetarian or vegan will be less acidic than meals which include meat.
Therefore, Eq. 3.8 may not be suitable to describe all possible meal combinations.
Additionally, this equation assumes that the pH of the gastric contents is uniform
throughout the stomach.
Taking into consideration the change in gastric pH over time one would expect
that the rate of solid loss of the carrot core would be slower initially, when pH is high,
and then increase as the pH decreases. Figure 3.9 shows the solid loss of carrot core,
Figure 3.8 pH of human gastric contents at ten minute intervals (triangles) using data
taken from Malagelada et al (1976), and best fit exponential equation (Eq.3.10, curve).

P a g e | 103
relative to the initial weight of a dry carrot core, at pH 1.8 as shown previously in Kong
and Singh (2011) as well as our model prediction for the dynamic pH in Figure 3.8. It
was assumed that 120 1007.5ρ g μm-3 (Selman et al 1983) and 54.0n in the model
(Eqs. 3.8-3.9). This simulation demonstrates that the rate of solid loss is initially slower
and increases as the gastric pH decreases.
3.5. Concluding Remarks
The effect of pH on the acidic hydrolysis of food solids within the human
stomach is of importance as it is one of the factors regulating satiety and the release of
nutrients into the stomach for absorption in the small bowel. Additionally, acidic
hydrolysis within the stomach damages the cell surface of indigestible starch and fiber
Figure 3.9 Carrot core solid loss at fixed pH of 1.8 (squares) (Kong and Singh 2011) and
predicted carrot core solid loss determined by the variation of gastric pH over time in Figure
3.8 (diamonds).

P a g e | 104
which allows access for bacterial enzymes, and the growth of bacterial biofilms on the
plant surface later in the small and large bowel. This work has shown that the diffusion
of gastric fluid into a food particle is pH dependent, and will depend upon the food
structure as demonstrated by the different penetration front profiles between raw carrot
core and Edam cheese. Other factors no doubt play a role in the diffusion of gastric fluid
into a food particle.
Additional studies are required to determine the exact relationship between pH
and the efficacy of different enzymes in the gastric fluid. Such studies must use foods
with low fat, as the fat content may hinder proteolysis within the stomach. Given that fat
is primarily digested in the small bowel, additional studies determining the effects of fat
content on gastric digestion would also be of great value.
The model here may be used to investigate the effects of pH on food structures,
which may help to improve the functionality of novel foods. Future work may extend
this model to include enzymatic reactions, change in temperature of the food bolus
during the digestive period, and mechanical forces such as the fluid dynamics and
peristaltic contractions which have a significant effect on the erosion and fragmentation
of food particles. However, additional experimental work is required for such models to
be constructed.

P a g e | 105
Chapter 4 Monoculture Parameters Successfully Predict Coculture Growth Kinetics of Bacteroides thetaiotaomicron and Two Bifidobacterium Strains
4.1. Abstract
Microorganisms rarely live in isolation, but are most often found in a
consortium. This provides the potential for cross-feeding and nutrient competition
among the microbial species, both of which make it challenging to predict growth
kinetics in coculture because the number of interactions increases factorially with the
number of bacteria considered. In this paper a previously developed mathematical
model to describe substrate consumption and subsequent microbial growth and
metabolite production for bacteria grown in monoculture was modified. The model was
used to characterize substrate utilization kinetics of 18 Bifidobacterium strains. Some
bifidobacterial strains demonstrated preferential degradation of oligofructose in that the
bacterium completely metabolized sugars with low degree of polymerization (DP) (DP
4or 3 ) before metabolizing sugars of higher DP, or vice versa. Thus, the model was
extended to describe the preferential degradation of substrate. In addition, the model
was adapted to describe the competition between Bacteroides thetaiotaomicron LMG
11262 and Bifidobacterium longum LMG 11047 or Bifidobacterium breve Yakult for
inulin as well as cross-feeding of breakdown products from the extracellular hydrolysis

P a g e | 106
of inulin by B. thetaiotaomicron LMG 11262. This study demonstrated that coculture
growth kinetics could be predicted based on the respective monoculture growth kinetics.
Using growth kinetics from monoculture experiments to predict coculture dynamics
complements data obtained from in vitro experiments and may reduce the number of in
vitro experiments required to parameterize multi-culture models.
4.2. Introduction
Commensal intestinal bacteria have been found to have a substantial impact on
not only intestinal health, but the overall health of the host. The primary SCFA
produced by the commensal bacteria are butyrate, acetate and propionate. Butyrate
provides an energy source for the intestinal epithelial cells, improves the mucosal
integrity of the intestinal wall, and regulates gene expression and cell growth
(Macfarlane and Cummings 1991, Nepelska et al 2012). The role of SCFA in human
health is not restricted to the intestinal tract. Acetate is utilized as an energy source by
the heart, brain and skeletal muscles (Macfarlane and Cummings 1991). Propionate
enhances satiety by regulating hormones responsible for stomach emptying and appetite
and is associated with the inhibition of cholesterol, triglyceride and fatty acid synthesis
in the liver (Hosseini et al 2011); the effects suggest that propionate may play a
significant role in obesity in humans. SCFA production is a result of bacterial
fermentation of food that has not been digested and absorbed in the small bowel.
Commensal intestinal bacteria are primarily saccharolytic and metabolize
resistant starch and indigestible non-starch oligosaccharides and polysaccharides. Some
bacteria are able to utilize proteins and lipids that escape digestion or absorption in the
small bowel; however the amount of protein that reaches the large bowel is only one-
fifth that of carbohydrates (3-9 g/day verses 8-40 g/day, respectively) (Macfarlane and

P a g e | 107
Cummings 1991). It has been reported that less than ~0.001% of the commensal
bacteria are capable of metabolizing the 5-10% of the bile acids which escape re-
absorption in the distal ileum (0.3-0.6 g/day) (Begley et al 2006, Jones et al 2004,
Ridlon et al 2006). The high proportions of carbohydrates which enter the large bowel,
as compared to proteins and lipids, has led to an enteric colonic bacterial population
more suited to metabolizing resistant starch and non-starch polysaccharides.
Given that the commensal bacteria readily metabolize dietary fibers, products
such as inulin and oligofructose are commonly used food ingredients in “functional
foods”. Neither inulin nor oligofructose are hydrolyzed in the stomach or absorbed in
the small bowel, yet they are completely fermented by the commensal bacteria in the
large bowel (Cherbut 2002, Ramnani et al 2010). In vivo studies have shown that inulin
and oligofructose have a bifidogenic effect, or increase the number of certain
Bifidobacterium species, and in many cases there is also an increase of Lactobacillus
(Bouhnik et al 1999, Costabile et al 2010, Gibson et al 1995, Meyer and Stasse-wolthuis
2009, Ramnani et al 2010). Given the bifidogenic effect of fructans, Bifidobacteria are
often combined with fructans as a synbiotic because of their beneficial effects to the
host; however, in vitro studies have shown that many Bifidobacteria are unable to break
down and metabolize sugars with a degree of polymerization (DP) greater than 8
(Falony et al 2009b, Rossi et al 2005). Given that bacteria do not live in isolation, but
are often found as mixed species biofilms (Macfarlane and Macfarlane 2006), the
bifidogenic effect of fructan prebiotics may be a result of microbial cross-feeding
(Falony et al 2009a).
Only a few coculture experiments that specifically characterized bacterial cross-
feeding and nutrient competition have been reported (Falony et al 2006, Falony et al
2009a) and often do not report the bacterial growth, metabolites and substrate

P a g e | 108
degradation associated with each strain during coculture (Belenguer et al 2006,
Chassard and Bernalier-Donadille 2006, Degnan and Macfarlane 1995, Duncan et al
2004). These data are essential to determine bacterial interactions and the parameter
values for macroscopic mathematical models of interacting microbial populations.
Furthermore, there are currently few mathematical models that describe either bacterial
cross-feeding or nutrient competition.
Wintermute and Silver (2010) proposed a simple dynamic model to describe the
level of cooperation between two auxotrophic Escherichia coli mutants. This model was
a slight simplification of a model described by Bull and Harcombe (2009), in that the
model did not allow for the growth of the individual species in the absence of cross-
feeding or cooperation. However, neither model was suitable for explicitly describing
and understanding the nature of the interactions between microbial populations because
they did not incorporate the mechanisms that influence those interactions.
At present there are a few published models that have extended the microbial
population model of Baranyi and Roberts (1994) to include the effects of mechanistic
processes, such as metabolite production and subsequent pH changes that may limit
microbial growth (Janssen et al 2006, Poschet et al 2005, Van Impe et al 2005). These
models did not incorporate substrate limitations, which is a key factor in mono- and
coculture microbial growth. A dynamic, mechanistic model has been proposed to
demonstrate bacterial growth (determined by optical density) and the subsequent
butyrate production as a result of lactate utilization (Muñoz-Tamayo et al 2011),
however this model did not incorporate either the bacterium that produced the lactate or
the substrate hydrolyzed by the lactate-producing bacterium.
This work is motivated by the hypothesis that a mathematical model of
microbial growth can be used to predict coculture growth kinetics based on monoculture

P a g e | 109
growth kinetics. Here, the aim is to develop a model that draws upon the previously
proposed dynamic, mechanistic mathematical model of Amaretti et al (2007) to describe
the mechanisms for substrate consumption and subsequent microbial growth and
metabolite production for bacteria grown in monoculture. This model was extended to
describe the preferential degradation of oligofructose for monoculture microbial growth.
Finally, the model was adapted to describe competition between two bacterial species
for a particular substrate as well as cross-feeding resulting from the breakdown products
of extracellular carbohydrate hydrolysis by one of the bacterial species. This
competitive/cross-feeding model incorporates the primary metabolites produced by both
bacterial species. This model was used to explore and predict the growth dynamics
between Bacteroides thetaiotaomicron LMG 11262 and Bifidobacterium longum MG
11047 and B. thetaiotaomicron LMG 11262 and Bifidobacterium breve Yakult as
compared to experimental coculture data.
4.3. Materials and Methods
Monoculture and Coculture Bacterial Data 4.3.1.The experimental work reported by Falony and colleagues provided the data
required to estimate the model parameters for monocultures. The data were obtained
from the graphical representation using automatic image capturing software. The
degradation of fructose, oligofructose (OraftiP95; BENEO-Orafti NV, Tienen, Belgium)
and inulin (OraftiHP; BENEO-Orafti) in monoculture by B. thetaiotaomicron LMG
11262 (Falony 2009, Falony et al 2009a) and 10 Bifidobacterium species constituting 18
strains was investigated by Falony et al (2009b). These authors then extended their work
by exploring the competitiveness of various Bifidobacterium species in coculture with
B. thetaiotaomicron LMG 11262 where inulin (OraftiHP) was included as the

P a g e | 110
carbohydrate substrate (Falony et al 2009a). All substrate quantities reported in the
aforementioned work were in fructose equivalents (FE).
All fermentations were conducted in 2-1 Biostat B-DCU fermenters (Sartorius
AG, Göttingen, Germany) containing 1.5 l of medium for colon bacteria, developed by
Van der Meulen et al (2006b) supplemented with 50 mM FE of either fructose,
oligofructose or inulin as the energy source. The average DP of oligofructose was 4 and
the average DP of inulin was greater than 23, which implies this would be
approximately 12.5 mM of oligofructose and 2 mM of inulin. Continuous sparging of
the medium with a mixture of 10% CO2 and 90% N2 (Air Liquide, Paris, France),
ensured anaerobic conditions. Fermentation temperature and pH were kept constant at
37°C and pH of 6.3, which was controlled automatically online (MFCS/win 2.1;
Satorius). A gentle, continues stirring of 100 rpm was also controlled online to keep the
medium homogenous (Falony et al 2009a, Falony et al 2009b).
Mechanistic Model for Bacterial Growth in 4.3.2.Monoculture
To determine the model parameters, the mechanistic model described by
Amaretti et al (2007) was both simplified and modified. First-order kinetics was
substituted for the Monod equation used in Amaretti et al (2007) due to the low
concentrations of substrates, S (mM FE), used in the experimental work (Falony et al
2009a, Falony et al 2009b). Thus, in the equations below, (h mM FE)-1 represents the
maximum specific growth rate divided by the Monod constant. Additionally,
metabolites such as acetate, lactate, formate or succinate were assumed to be produced
at a rate proportional to the rate of substrate degraded by the bacterial population;
hence, metabolites are produced as a result of microbial growth and maintenance. The
model is

P a g e | 111
BT
B
SX
T mSYdt
dS 1010/
4.1a
dT kS
dtdB
)10ln(1 4.1b
dt
dSkdtdP T
ii
4.1c
where XB 10log [where X is the bacterial population density (CFU/ml)], SXY /
(CFU/ml (mM FE)-1) is the yield of bacteria X from substrate TS (mM FE), m
-1CFU/ml)(h FE mM is the rate that the bacteria utilize the fructose equivalents for
cell maintenance, dk (log(CFU/ml) h-1) is the cellular death rate (or equivalently the
rate of reduction of bacteria due to either cell lysis or quiescence/unculturablility), and
ik (mM (mM FE)-1) characterizes the rate of production of the ith metabolite, iP (mM),
from substrate utilization.
This system of equations assumes that the bacteria can completely metabolize
the substrate; however, in the case of oligofructose and inulin, many of Bifidobacterium
species are unable to degrade long chain polysaccharides (De Vuyst and Leroy 2011,
Falony et al 2009b). To account for the inability of some bacterial species to fully
degrade the model substrate, the total substrate )()( tSStS UT was defined to be the
sum of undegradable )0()1( TU SaS and degradable )0()0( TaSS fractions,
where a is the fraction of the substrate that the bacterium is capable of utilizing within
the 48-hour experimental period and )0(TS
is the total initial concentration of substrate.
Based on our definition of the total substrate,
dt
dSdt
dSdt
dS UT .

P a g e | 112
However, the undegradable portion, US , does not change over time. Thus, 0dtdSU
and Eq. 4.1a-c becomes:
BB
SX
mSYdt
dS 1010/
; )0()0( TaSS 4.2a
dkS
dtdB
)10ln(1 4.2b
dtdSk
dtdP
ii
4.2c
)()( tSStS UT 4.2d
The model was fit to the multi-response data (bacteria, substrate and metabolite
concentrations) using nonlinear regression (Bates and Watts 2007). In the fitting
procedure, bacterial population measurements were log10 transformed to ensure that the
model residuals were homoscedastic (i.e., the variance of the variables is
homogeneous). The residual matrix Z=Y-H(Ө) was formed using the n×m observation
matrix Y (i.e., the experimental data, including the log10 transformed bacterial
population values) and the n×m response matrix H(Ө) (i.e., model values) defined by
either Eq. 4.2, Eq. 4.3 or Eq. 4.5 (where n is the number of times that response variables
were measured, m is the number of measured response variables and Ө is the vector of
unknown model parameters: SXY , η , m , dk and ik with 1i or 2). The variances of
the deviations in measurements within response variables were assumed to be constant
and independent, but variances in measurement deviations were allowed to be different
between response variables. Based on this assumption, the product of the diagonal of
the square matrix ZTZ was minimized, where the ith entry in the diagonal of ZTZ is the
sum of the squared residuals for the ith differential equation. Different assumptions
about the measurement deviations result in different fitting criterions (Bates and Watts
2007). For example, if the variance in measurement deviation is the same between

P a g e | 113
response variables then the appropriate fitting criterion would be to minimize the sum of
the diagonal of the square matrix ZTZ. This procedure ensures that the estimated model
parameters are independent of the scale of measurement (Pell and Kowalski 1991) and
ad-hoc transformations of the data to ensure that the variance in the measurement
deviations in the response variables are similar (Amaretti et al 2007) are not required.
Improper assumptions about the measurement deviations (i.e. that they are the same for
each response variable) can result in biased parameter estimates and invalid inference.
This is important because the bacterial population as measured by viable counts
(CFU/ml) on a log10 scale varied between 5 and 11, whereas the concentrations of
nutrients and metabolites produced varied between 0 and 120 (mM).
All differential equations were solved using ode15s in MATLAB (The
MathWorks; www.mathworks.com). To determine the standard errors in the model
parameters, a Markov chain Monte Carlo (MCMC) analysis was performed (Gilks et al
1996, Shorten et al 2004) in MATLAB.
4.4. Results and Discussion
Model Fit to Monoculture Data 4.4.1.Eqs. 4.2a-d adequately described the degradation of inulin and subsequent
growth of bacteria and production of metabolites for all 18 bifidobacterial strains and B.
thetaiotaomicron LMG 11262 reported by Falony (2009) and Falony et al (2009b)
[Figure 4.1]. The residuals between the model fit and the experimental data were
normally distributed with standard deviations for inulin consumption, bacterial growth
and acetate production of 1.35 mM FE, 0.17 log(CFU/ml) and 2.31 mM, respectively.
The cumulative R2 values (all 19 strains) for the model fit to inulin consumption,

P a g e | 114
bacterial growth and acetate production were 0.98, 0.96, and 0.94 respectively,
demonstrating the goodness of fit for the model to the data.
The model estimates the percentage of inulin utilized by the bacterial strain
within 48 hours. Based on the experimental data (Falony et al 2009b), it appeared that
OraftiHP contained inulin with a DP ranging from 1 to 65. Most of the bifidobacteria
strains degraded the inulin fractions simultaneously or preferentially, starting with
inulin fractions with low DP before utilizing fractions of higher DP. Thus, this model
provides the upper limit of the DP that the bacterial strain can degrade provided the
distribution of the particular DPs are known.
The model (Eqs. 4.2a-d) also adequately described the bifidobacterial growth,
substrate degradation and metabolite production when bifidobacteria were grown with
Figure 4.1 Model fit (Eqs. 4.2a-d) (solid lines) to Bifidobacterium catenulatum LMG 1043
growth (red circles) from inulin hydrolysis (black solid circles) and subsequent acetate
(magenta solid squares) and lactate (cyan open squares) production (Falony et al
2009b). Ninety-five percent confidence intervals are denoted by dotted lines.

P a g e | 115
fructose as the substrate. The residuals between the model fit and the experimental data
were normally distributed with standard deviations for fructose consumption, bacterial
growth, acetate production and secondary metabolite production of 2.56 mM F, 0.73
log(CFU/ml), 3.29 mM and 1.72 mM, respectively. The cumulative R2 values
(bifidobacteria only) for the model fit to fructose consumption, bacterial growth, acetate
production and secondary metabolite production were 0.99, 0.70, 0.99 and 0.99
respectively. In our model fit [Figure 4.2] only two of the metabolites were accounted
for (acetate and formate or lactate), however the model can be extended to describe
other measureable extracellular metabolites produced by the bacterium (data not
shown).
Figure 4.2 Model fit (Eqs. 4.2a-d) (solid lines) to Bifidobacterium adolescentis LMG
10733 growth (red circles) fructose hydrolysis (black solid circles) and subsequent
acetate (magenta solid squares) and lactate (cyan open squares) production (Falony et
al 2009b). Ninety-five percent confidence intervals are denoted by dotted lines.

P a g e | 116
The model could not describe the dramatic drop in bacterial counts between 9
and 15 hours as seen with both Bifidobacterium bifidum strains when grown with
fructose [Figure 4.3a,b]; however the model predicted bacterial counts at the end of the
experimental time (48 hours) that were consistent with the experimental data.
The model did not account for the high yield and growth rate from 0-9 hours
when B. gallicum LMG 11596 [Figure 4.4a] and B. angulatum LMG 11039 were grown
with fructose as the substrate. For these two strains very little substrate was depleted in
the 9 hours of growth, which suggests that the actual number of initial bacteria may
have been higher than what was reported by the authors (Falony et al 2009b). When the
initial counts were increased by 1 log(CFU/ml), the model described the growth kinetics
of both of these strains [Data shown for B. gallicum LMG 11596 only, Figure 4.4b.].
The standard deviation of the residuals after removing the four bacterial strains
mentioned above were 2.80 mM fructose, 0.21 log(CFU/ml) bacteria, 3.58 mM acetate,
and 1.81 mM secondary metabolite. The cumulative R2 values (14 strains) were 0.99,
0.95, 0.99 and 0.99 for the fructose utilization, bacterial growth, acetate production and
secondary metabolite production, respectively, demonstrating the goodness of fit of the
model to the experimental data.
The model (Eqs. 4.2a-d) was also capable of describing bacterial growth kinetics
where oligofructose was the substrate [Figure 4.5], except under circumstances where
the substrate was degraded preferentially. The residuals between the model fit and the
experimental data for the 13 strains that did not degrade the substrate preferentially
were normally distributed with standard deviations for oligofructose consumption,
bacterial growth, acetate production and secondary metabolite production of 3.49 mM
FE, 0.18 log(CFU/ml), 3.87 mM and 2.15 mM, respectively. The cumulative respective
R2 values were 0.98, 0.96, 0.99 and 0.98.

P a g e | 117
Figure 4.3 Model fit (Eqs. 4.2a-d) (solid lines) to bacterial growth (red circles) from
fructose hydrolysis (black solid circles) and subsequent acetate (magenta solid squares)
and lactate (cyan open squares) or formate (cyan open triangles) production. The
bacteria represented here are (a) Bifidobacterium bifidum DSM 20082 and (b) B.
bifidum LMG 11583, showing that the model cannot account for the dramatic drop in
bacteria from time 9-18 hours yet can still account for the bacteria counts at the end for
the 48 hour experimental period. Data found in Falony et al (2009b). Ninety-five percent
confidence intervals are denoted by dotted lines.

P a g e | 118
Figure 4.4 Model fit (Eqs. 4.2a-d) (solid lines) to Bifidobacterium gallacum LMG 11596
growth (red circles) from fructose hydrolysis (black solid circles) and subsequent acetate
(magenta solid squares) and formate (cyan open triangles) production. (a) The model
cannot account for the high yield during the initial 9 hours of the experiment (Falony et
al 2009b), however an increase of the initial concentration of B. gallacum LMG 11596 by
1 log(CFU ml-1) results in a good fit (b). Ninety-five percent confidence intervals are
denoted by dotted lines.

P a g e | 119
When bacteria degrade oligofructose preferentially the model must be adjusted
to describe the sequence of substrate utilization as shown in Eq. 4.3a-d:
Bα
B
αSX
αα mSYη
dtdS 1010
/
4.3a
α
Bβ
B
βSX
Pβ ScHmSYη
dtdS
1010/
4.3b
dkSS
dtdB
)10ln(1
4.3c
βαi
ii
βα
dtdSk
dtdP
,
, .
4.3d
Figure 4.5 Model fit (Eqs. 4.2a-d) (solid lines) to Bifidobacterium catenulatum LMG 1043
growth (red circles) from oligofructose hydrolysis (black solid circles) and subsequent
acetate (magenta solid squares) and lactate (cyan open squares) productions (Falony et
al 2009b). Ninety-five percent confidence intervals are denoted by dotted lines.

P a g e | 120
Here α and β represent the primary and secondary oligosaccharides or fermentation
metabolites, respectively, and αScH is the Heaviside function, where 0αScH
if the concentration of the primary metabolite is greater than or equal to c, otherwise
1αScH . As before, to account for the inability of some bacterial species to fully
degrade the model substrate, the total substrate )()( tSStS UT was defined to be the
sum of undegradable )0()1( TβαU SaaS and degradable
)0()0()0( Tβαβα SaaSS fractions, where αa and βa are the fraction of the
substrate that is degraded as a primary and secondary nutrient source, respectively,
within the 48 hour experimental period and )0(TS is the total initial concentration of
substrate.
The residuals between the model fit (Eq. 4.3a-d) and the experimental data for
the five strains were normally distributed with standard deviations for oligofructose
consumption, bacterial growth, acetate production and secondary metabolite production
of 3.19 mM FE, 0.26 log(CFU/ml), 4.54 mM and 2.15 mM, respectively. The
cumulative respective R2 values were 0.98, 0.95, 0.98 and 0.97. In this analysis the
strain Bifidobacterium adolescentis LMG 10734 was also included even though it
appears to breakdown oligofructose in more than two stages. However, as seen in
Figure 4.6 and by the R2 values, which include this strain, Eqs. 4.3a-d adequately
described the experimental data.
Energetically, acetate is the most favorable fermentation product during
fructose, oligosaccharide and inulin degradation by bifidobacteria. According to the
fructose 6-phoshate phosphoketolase (F6PPK) pathway when two fructose molecules
are metabolized, half of the carbon atoms from the fructose will contribute to the
formation of 3 acetate molecules and the remaining carbon atoms will contribute to the

P a g e | 121
Figure 4.6 Preferential degradation of oligosaccharide (black solid circles) by bacteria
(red open circles) and subsequent production of acetate (magenta solid squares) and
formate (cyan open triangles) or lactate (cyan open squares) (Falony et al 2009b). Best
fit of Eqs. 4.3a-d are represented by solid lines. (a) The model (Eqs. 4.3a-d) adequately
depicts growth kinetics of Bifidobacterium adolescentis LMG 10734 even though this
bacterium degrades oligofructose preferentially in more than two stages (DP 2 & 3, then
DP 4, followed by remaining sugars). (b) Preferential degradation of oligosaccharide
from saccharides with DP from 1-3, then DP 4 by B. breve LMG 13194.

P a g e | 122
formation of pyruvate which is then reduced to either 1) lactate or 2) formate, acetate
and ethanol (Sela et al 2010, Van der Meulen et al 2006a). During monoculture
experiments with bifidobacteria, two contrasting metabolite production rates for acetate
were noted as well as two contrasting metabolite production profiles; these differences
appear to be dependent on the utilization of either the preferred or secondary
carbohydrate substrates. In the five strains that showed preferential degradation, acetate
and lactate were produced from the utilization of the primary carbohydrates. When the
bacteria began to utilize the secondary carbohydrates the conversion of pyruvate to
lactate ceased which resulted in the production of formate and an increased production
of acetate. The conversion rate of oligofructose to acetate was approximately 1.32 times
greater when the bacteria were metabolizing the secondary carbohydrates than when
metabolizing the primary carbohydrates. The reduction of pyruvate to lactate does not
yield ATP, whereas the reduction of pyruvate to formate, acetate and ethanol results in
an additional ATP as well as NAD+ (Sela et al 2010, Van der Meulen et al 2006a). In
addition to a change in the metabolite profiles, there was little to no growth of bacteria
during the time that the bacteria metabolized the secondary carbohydrates, implying that
the additional ATP is not used for bacterial growth. Lowered growth rates and low
substrate concentrations have been associated with this switch from lactate production
to acetate, formate and ethanol production (De Vuyst and Leroy 2011, Falony et al
2006, Van der Meulen et al 2006b).
In every monoculture experiment with bifidobacteria, whether grown with
fructose, oligofructose or inulin as the substrate, as well as for the monoculture of B.
thetaiotaomicron LMG 11262 grown with inulin as the substrate, the maintenance term,
m, was not significantly different from zero (P<0.001). Thus, Eq. 4.2a may be
simplified to:

P a g e | 123
SYη
dtdS B
SX
10/
. 4.4
Amaretti et al (2007) also found that the maintenance term was not significantly
different from zero for the growth of Bifidobacterium adolescentis MB 239 on glucose,
galactose, lactose, and galactooligosaccharides. A maintenance term not significantly
different from zero suggests that under low substrate concentration the majority of the
bacteria are actively growing and dividing, quiescent or unculturable.
Classification of Bifidobacteria Strains Based on 4.4.2.the Model Parameters
Previous studies have suggested that bifidobacterial strains can be separated into
at least 4 clusters that are able to be differentiated on the basis of inulin-type fructans
degradation (Falony et al 2009b). Principal component and cluster analysis separated
strains into:
Cluster A) bifidobacteria unable to degrade polysaccharides with a DP >
2. Strains included in this category included B. bifidum DSM 20082 and
B. breve LMG 11040;
Cluster B) bifidobacteria able to degrade oligofructose, DP 8, but not
inulin and, in most cases, the strains showed a preferential degradation
pattern. Strains included in this category included B. breve LMG 13194
and B. longum LMG 13196;
Cluster C) bifidobacteria strains with the ability to partially degrade
inulin, the DP varying between strains with a maximum DP 20 (De
Vuyst and Leroy 2011), and in a non-preferential DP degradation pattern.
Strains included in this category included B. adolescentis LMG 10502
and B. longum LMG 11570; and

P a g e | 124
Cluster D) two bifidobacterial strains that were able to degrade inulin
much like those in Cluster C, however they were not able to determine if
there was a preferential degradation pattern from the oligofructose and
fructose experiments. Strains included in this category included B.
longum LMG 11047 and B. thermophilum LMG 11574 (Falony et al
2009b).
For bifidobacteria grown with inulin as the substrate, an analysis was undertaken
to see whether the parameters, SXY , and a were significantly different between the
clusters A-D as determined by Falony et al (2009b). One-way ANOVA (GenStat V13.2,
VSN International Ltd., UK) showed that the fraction of inulin used (a) was
significantly different between clusters (P < 0.001); however there was no significant
difference in either the yield ( SXY ) or η (the maximum specific rate divided by the
Monod constant) between clusters.
After further assessment, the data suggests there may be subcategories within the
previously described clusters. For instance, it appears that B. adolescentis LMG 10502
may degrade inulin and oligofructose extracellularly, which was evident by the increase
of monosaccharides in the growth medium when B. adolescentis LMG 10502 was
grown with oligofructose. This may also be the case for B. longum LMG 11570 and B.
adolescentis LMG 10733. All three of these bacteria are classified in Cluster C.
Additionally, it appears that the preferential degradation profile is not restricted to
bacteria that degrade only mono- and oligofructose (Cluster B) and may be divided into
two types: bacteria such as B. angulatum LMG 11039, which prefer polysaccharides
with a DP greater than 1 (and less than approximately 20) to monosaccharides, or
bacteria such as B. breve LMG 13194 which prefer to degrade short chain to long chain
oligosaccharides. Thus, the phenotypes could be further divided into sub-clusters

P a g e | 125
according to their patterns of substrate utilization. Given that our model was formulated
to describe primary and secondary preferential degradation, it is capable of describing
both types of preferential degradation, along with the resulting metabolites.
Mechanistic Model for Coculture Bacterial Growth 4.4.3.Here microbial cross-feeding was assumed to occur as a result of the buildup of
monosaccharides from the extracellular breakdown of polysaccharides by one of the
bacterial populations, as observed in the works of Falony et al (2009a) and Van der
Meulen et al (2006b). One of the bacteria can use both long (L) and short chain (S)
polysaccharides whereas the other cross-feeding bacterium can only use short chain
polysaccharides:
LM
L SBacrdt
dS 11 4.5a
LMSS
S SBacrSBacSBacdt
dS 121 4.5b
1,1
1
)10ln(1
dSL kSSηdt
dB 4.5c
2,2
2
)10ln(1
dS kSηdt
dB 4.5d
SiSLi
i SBackSBacSBackdtdP 211 ,2,1 .
4.5e
A detailed description of the model parameters is listed in Table 4.1. In the work
presented here, it was assumed that short chain polysaccharides comprise of sugars with
DP ranging from 1 to approximately 20, the maximum DP reported to be utilized by
Bifidobacterium (Falony et al 2009b).
Bacteroides thetaiotaomicron and Bifidobacterium longum have been reported
to be among the most prevalent bacterial species associated with food particles
(Macfarlane and Macfarlane 2006) with B. thetaiotaomicron being one of the more

P a g e | 126
Table 4.1 Parameter description and equations to for the coculture/cross-feeding model.
Parameter Description Equation
LS Concentration of long chain (LC)
polysaccharides (mM FE)
SS Concentration of short chain (SC)
polysaccharides (mM FE)
Mr Rate at which LC’s are converted to
monomers/fragments
},{}{ SLSjBac Rate of either LC or SC polysaccharide
degradation (mM FE h-1) by either the
monomer/fragment producing bacteria
1j or the cross-feeding bacteria
2j
BjjSL
Bj
jSX
j mSYη
1010 ,,/
jη Maximum utilization rate divided by
Monod constant for jth bacterium (h-1
FE-1)
jdk , Cellular death rate for jth bacterium
(log(CFU/ml) h-1)
ijk , Conversion constant (mM (mM FE)-1)
of the substrate (mM FE) to the ith
metabolite, iP (mM), by either the
monomer/fragment producing bacteria
1j or cross-feeding bacteria 2j

P a g e | 127
versatile polysaccharide fermenting bacteria (Degnan and Macfarlane 1995). Falony and
colleagues (2009a) have shown that B. longum LMG 11047 has the capacity to partially
degrade inulin and thus competes with B. thetaiotaomicron LMG 11262 for
polysaccharides with a maximum DP around 20.
Thus, to test the coculture model, the parameters determined from the best fit of
Eqs. 4.1a-d. to the monoculture data of B. longum LMG 11047 [Figure 4.7a] and B.
thetaiotaomicron LMG 11262 [Figure 4.7b] grown with inulin as the substrate were
used (Falony 2009, Falony et al 2009b). It was assumed that aSSS 0 and
SaSL 10 , where a is the fraction of the inulin concentration, S (mM FE), that the
cross-feeding bacteria were capable of degrading in monoculture. There was no
noticeable amount of formate in the monoculture of B. longum LMG 11047 when
grown with inulin so the parameter for the rate of production of formate was determined
from a best fit of Eqs. 4.2a-d to the growth of B. longum LMG 11047 in monoculture on
oligofructose. This required a transformation of the parameter value to account for the
change in metabolite profiles from oligofructose to inulin (less lactate, more formate
and acetate). The conversion rate of inulin to formate, Informk , , was calculated as
OligoInOligoformInform YYkk ,, where Oligoformk , is the conversion rate of oligofructose to
formate, OligoY and InY are the yield of bacteria from oligofructose and inulin
metabolism, respectively, as determined from the best fit of Eqs. 4.2a-d to the growth of
B. longum LMG 11047 in monoculture.
The production of formate in the coculture environment would imply that B.
longum LMG 11047 out competed B. thetaiotaomicron LMG 11262 for both the
monosaccharides and oligosaccharides, as formate is not a metabolic end product of B.
thetaiotaomicron LMG 11262. Additionally, the higher formate concentration (as
compared to B. longum LMG 11047 in monoculture) implies that inulin degradation by

P a g e | 128
Figure 4.7 Growth kinetics of (a) Bifidobacterium longum LMG 11047 (red open circles)
and (b) Bacteroides thetaiotaomicron LMG 11262 (blue crosses) in monoculture and the
two strains in (c) coculture: inulin (black solid circles), acetate (magenta squares),
succinate (green diamonds), and formate (cyan triangles) (Falony 2009, Falony et al
2009a, Falony et al 2009b). Solid lines represent the (a,b) model best fit of Eqs. 4.1a-c
to the monoculture data (a,b) and the model prediction (Eqs. 4.5a-e) to the coculture
data using parameter values derived from monoculture data prediction (c). Dotted lines
represent the 95% confidence intervals. Note that the error associated with formate (c)
may be considerably larger given the calculation of OligoInOligoformInform YYkk ,, , where
InY and OligoY were determined from the best fit values and Oligoformk , from the MCMC.

P a g e | 129
B. thetaiotaomicron LMG 11262 may produce oligofructose in addition to
monosaccharides. Figure 4.7a,b demonstrates the fit of Eqs. 4.2a-d to the growth of B.
longum LMG 11047 and B. thetaiotaomicron LMG 11262 when grown with inulin in
monoculture (Falony et al 2009a). As seen in Figure 4.7c, even though Eqs. 4.5a-e were
based on parameters derived from monoculture data, the model successfully described
the competitive dynamics between B. longum LMG 11047 and B. thetaiotaomicron
LMG 11262 growing in coculture in terms of the amounts of substrate utilized, bacterial
growth and metabolite produced. The predicted values for acetate after 24 hours were
within the 95% confidence intervals of the monoculture parameter values.
Given that there are more monosaccharides available from the hydrolysis of the
inulin by B. thetaiotaomicron LMG 11262, more than trace amounts of lactate (4.3 0.1
mM at 30 hrs) would be expected to be reported (Falony et al 2009a). The lack of
lactate may be associated with the increase in other metabolites such as acetate
(predicted value 86 mM and experimental value 95 mM at 48 hrs) or formate (predicted
value 31mM and experimental value 35 mM at 48 hrs). Such a shift in metabolite
production has been noted in previous studies with Bifidobacterium (De Vuyst and
Leroy 2011, Van der Meulen et al 2006a) and was discussed earlier. As noted earlier,
the shift in metabolite profiles has been associated with lowered growth rates and lower
substrate concentrations. This was found to be the case in the coculture environment.
The reduced growth rate obtained in monoculture (with inulin as compared to fructose)
for B. longum LMG 11047 was used and given the competition for substrate, there was
reduced substrate concentration availability per bacterial species. The parameter value
for the bacterial death rate for the Bacteroides strain in monoculture that was used to
predict the coculture growth of the Bacteroides strain resulted in a lower predicted value

P a g e | 130
at 48 hours than the experimental data; however, the experimental value was within the
95% confidence interval of the predicted value.
Sensitivity of Coculture Model Results to Growth 4.4.4.Parameters Based on Monoculture Data
Even though B. longum LMG 11047 is capable of utilizing long chain
polysaccharides, many Bifidobacterium species do not metabolize inulin, and only
metabolize monosaccharides or oligosaccharides with a DP 8 . For instance B. breve
Yakult, a common probiotic, has been shown to utilize only monosaccharides, yet in
vivo and in vitro studies have shown that there is an increase in overall bifidobacterial
numbers with the addition of inulin into the diet (Bouhnik et al 1999, Chen et al 2013,
Costabile et al 2010, Gibson et al 1995, Ramnani et al 2010). To further validate our
model and to help elucidate the mechanisms behind the increased growth of
Bifidobacterium when inulin is added to the diet, the parameters found from the best fit
of Eqs. 4.2a-d monoculture of B. breve Yakult were used in conjunction with Eqs. 4.5a-
e to predict the growth of B. breve Yakult with B. thetaiotaomicron LMG 11262 in
coculture with inulin. Given that B. breve Yakult only utilizes monosaccharides, it was
expected that B. breve Yakult would grow purely from the hydrolytic breakdown
products produced from extracellular degradation of polysaccharides by B.
thetaiotaomicron LMG 11262. Hence, the parameter values obtained from fitting Eqs.
4.2a-d to the monoculture data when B. breve Yakult was grown with fructose as the
metabolite were used. As seen in Figure 4.8a, the parameter values from monoculture
did not adequately describe the degradation of inulin by B. breve Yakult and B.
thetaiotaomicron LMG 11262 in coculture. It appears that when B. thetaiotaomicron
LMG 11262 was grown in coculture with B. breve Yakult, the value of η for B.
thetaiotaomicron LMG 11262 may be lower than when grown in monoculture.

P a g e | 131
Figure 4.8 Coculture growth kinetics of Bifidobacterium breve Yakult (red circles) and
Bacteroides thetaiotaomicron LMG 11262 (blue crosses): inulin (black solid circles),
acetate (magenta squares), succinate (green diamonds), and formate (cyan) (Falony et
al 2009a). Solid lines represent the model prediction (Eqs. 4.5a-e) to the coculture data
using parameter values derived from monoculture data prediction (a) and model
prediction (Eqs. 4.5a-e) with a decrease in the specific growth rate of B.
thetaiotaomicron LMG 11262 (b). Dotted lines represent the 95% confidence intervals
(a).

P a g e | 132
The parameter η is defined as the maximum specific growth rate divided by the Monod
constant, so a decrease in η implies a decrease in the specific growth rate for B.
thetaiotaomicron LMG 11262 in coculture with B. breve Yakult. It is well accepted that
there is variability in microbial growth between experiments and the effect of a decrease
in the growth rate of B. thetaiotaomicron LMG 11262 on the coculture dynamics was
examined. Figure 4.8b shows that a decrease from 0.011η to 008.0η , which is 3.1
standard deviations from the mean, results in a reasonable prediction of the coculture
dynamics (cumulative 97.02R ). This difference in growth rate may be within the
expected variability of experimental results. Additional experiments are necessary to
determine the variability in growth rate. Alternatively, there is a possibility that B. breve
Yakult produces a bacteriocin or another inhibitory metabolite, that was not measured in
the experimental design nor accounted for in our model that may reduce the specific
growth rate of B. thetaiotaomicron LMG 11262. A number of bifidobacteria have been
shown to produce bacteriocins (Kanmani et al 2013, Muñoz-Quezada et al 2013);
however there is no reference of antimicrobial activity by B. breve Yakult in the
literature. Previous in vitro and in vivo studies with pectic-oligosaccharides,
oligofructose, and inulin have shown an increase in bifidobacteria growth and a
decrease in or restricted growth of Bacteroides (Chen et al 2013, Gibson et al 1995).
Unfortunately, these studies only reported total counts of Bacteroides and
Bifidobacterium; knowing the particular species or strains whose numbers increased or
decreased would provide additional insight into the effects of prebiotics and may
encourage the use of particular strains of Bifidobacterium as prebiotics or synbiotics.
Regardless of the mechanism influencing the decrease in the specific growth rate of B.
thetaiotaomicron LMG 11262, the decrease in growth of B. thetaiotaomicron LMG
11262 provides an advantage to the B. breve Yakult in that it is able to compete for the

P a g e | 133
monosaccharides that are released as a result of long chain polysaccharides hydrolysis
by B. thetaiotaomicron LMG 11262.
4.5. Concluding Comments
This work has shown that a modified version of the model proposed by Amaretti
et al (2007) (Eqs. 4.2a-d) is capable of accurately describing the microbial growth and
metabolite production by 18 different Bifidobacterium strains and B. thetaiotaomicron
LMG 11262 as a result of the metabolism of either inulin or fructose. Additionally, the
model can be used to describe the growth kinetics of Bifidobacterium when grown with
oligofructose as long as the bacterium degrades the carbohydrate fractions
simultaneously. In the case when the bacteria preferentially degrade oligofructose
fractions (either in the order of fractions with low DP to high DP, or vice versa), an
additional model was proposed (Eqs. 4.3a-d). These models have shown that metabolite
production is proportional to substrate utilization and that very little of the substrate was
used for bacterial maintenance, which may imply that many of the bacteria were in a
quiescent state as a result of low nutrient availability.
Most importantly, this work demonstrated that microbial cross-feeding and
competition, as a result of the release of partially degraded polysaccharides from
extracellular degradation of inulin, can be predicted using parameter values determined
from monoculture experiments. This is a significant finding in that it may reduce the
number of in vitro experiments necessary to model multi-culture bacterial dynamics.
There is a substantial lack of published work that reports the growth kinetics of bacteria
in coculture over time. Additional in vitro experiments with a variety of bacteria and/or
microbiota are essential to determine in which cases and with which bacterial species
the model is valid.

P a g e | 134
The release of partially degraded polysaccharides is only one form of microbial
cross-feeding. Some bacterial species are capable of utilizing metabolites produced by
another species for growth (Duncan et al 2004, Falony et al 2006). In some cases,
microbial cross-feeding is a combination of the use of metabolites and partially
degraded substrates which accumulate from extracellular hydrolysis (Belenguer et al
2006, Falony et al 2006). Thus, the model proposed here (Eqs. 4.5a-e) is only one
pathway for which bacteria cross-feed. In future research, the model described here
could be extended to incorporate the other forms of microbial cross-feeding.

P a g e | 135
Chapter 5 Anisotropic Nutrient Transport in Three Dimensional Single Species Bacterial Biofilms
5.1. Abstract
The ability of a biofilm to grow and function is critically dependent on the
nutrient availability, and this in turn is dependent on the structure of the biofilm. This
relationship is therefore an important factor influencing biofilm maturation. Nutrient
transport in bacterial biofilms is complex; however, mathematical models that describe
the transport of particles within biofilms have made three simplifying assumptions: the
effective diffusion coefficient (EDC) is constant, the EDC is that of water, and/or the
EDC is isotropic. Using a Monte Carlo simulation, the EDC was determined, both
parallel to and perpendicular to the substratum, within 131 real, single species, three-
dimensional biofilms that were constructed from confocal laser scanning microscopy
images. Our study showed that diffusion within bacterial biofilms was anisotropic and
depth dependent. The heterogeneous distribution of bacteria varied between and within
species, reducing the rate of diffusion of particles via steric hindrance. In biofilms with
low porosity, the EDCs for nutrient transport perpendicular to the substratum were
significantly lower than the EDCs for nutrient transport parallel to the substratum. Here,
a reaction–diffusion model to describe the nutrient concentration within a bacterial
biofilm that accounts for the depth dependence of the EDC is proposed.

P a g e | 136
5.2. Introduction
Intestinal bacteria play an essential role in human health. Commensal bacteria
within the large bowel have been found to affect host function by producing short chain
fatty acids (Albrecht et al 1996, Macfarlane and Macfarlane 2007, Younes et al 2001),
synthesizing vitamins (Albrecht et al 1996, Burgess et al 2009, Conly et al 1994,
Glancey et al 2007, Madhu et al 2009), modulating the immune system (Borruel et al
2002, Furrie et al 2005, Macfarlane et al 2009, Saulnier et al 2009) and inhibiting the
colonization of the intestinal tract by potentially pathogenic bacteria (Coconnier et al
1993, De Ruyter et al 1996, Lievin et al 2000). These benefits are a result of bacterial
fermentation of food particles which escape digestion in the small bowel (Bernalier-
Donadille 2010, Cummings et al 1987, Cummings and MacFarlane 1997, Eyssen 1973,
Hamilton et al 2007, Macfarlane and Cummings 1991, Macfarlane et al 1992, Ridlon et
al 2006, Thomas et al 2001).
Biofilms are ubiquitous in nature, and were first reported associated with food
particles in human fecal matter by Macfarlane et al (1997). Even though only 5% of the
bacterial population in these samples were reported to be biofilms, the evidence of high
levels of acetate within the proximal colon, which is readily produced by heterogeneous
bacterial biofilms (Leitch et al 2007, Macfarlane and Macfarlane 2006, Macfarlane and
Dillon 2007), implies that either biofilms are abundant the human proximal colon or that
biofilm formation facilitates substantial acetate production. [For an extensive reviews
on bacterial biofilms in the human bowel, see Flint et al (2012) and Van Wey et al
(2011).]
Biofilms are distinguished from adherent cells by the evidence of a slime coating
the bacterial consortia. This slime or extracellular polymeric substances (EPS) can be
comprised of polysaccharides, proteins, DNA and lipids that are associated primarily

P a g e | 137
through ionic interactions (Gristina 1987). Ninety to ninety-nine percent of the biofilm
water content lies within this slime or EPS (Flemming et al 2005) providing a network
for the transport of nutrients into the biofilm. The extracellular space within the biofilm
also accounts for 4-98% of the biofilm volume (Libicki et al 1988, Wood et al 2002)
and is not uniformly distributed because of the complex spatial distribution of the
bacteria within the biofilm (Bridier et al 2010). The effect of the biofilm structure on
nutrient transport has been investigated theoretically using two-dimensional
transmission electron microscopy micrograph images of biofilm structures (Wood et al
2002), but not within real three-dimensional bacterial biofilms.
Existing experimental methods, such as pulse field gradient nuclear magnetic
resonance with confocal laser scanning microscopy (CLSM) (McLean et al 2008) or
without CLSM (Beuling et al 1998, Renslow et al 2010), microelectrodes (Beyenal and
Lewandowski 2002, Rasmussen and Lewandowski 1998), fluorescence return after
photobleaching (FRAP) (Bryers and Drummond 1998, Waharte et al 2010), and
fluorescence correlation spectroscopy (FCS) (Briandet et al 2008), have been used to
calculate the effective diffusion coefficient (EDC) parallel to the substratum in biofilms.
Such studies have shown that the EDC can vary at different locations within the biofilm
(Beyenal and Lewandowski 2002, Bryers and Drummond 1998, Renslow et al 2010,
Yang and Lewandowski 1995) and have resulted in EDCs that range from 5% to 95% of
that in water (Beuling et al 1998, Wood and Whitaker 2000).
Although information on transport parallel to the substratum is useful, three-
dimensional modeling simulations and in situ experimental studies have shown that
transport of nutrients perpendicular to the substratum is critically relevant to biofilm
function. In the case of low velocity flow in the bulk liquid environment (De Beer et al
1996), or when the chemical is only produced or consumed by the bacteria within the

P a g e | 138
biofilm (Picioreanu et al 2004), the concentration gradient is normal to the substratum;
however, in the latter case, this may depend upon the biofilm morphology since
multidimensional gradients may occur in biofilms which are highly porous and
channeled. Furthermore, in multi-species biofilms the concentration gradient may be
multidimensional if the chemical facilitates microbial cross feeding (i.e. is produced by
and utilized by different bacteria within the biofilm) (Picioreanu et al 2004). Thus there
is a need for estimating the EDC in biofilms both parallel to and perpendicular to the
substratum.
Despite the evidence that nutrient transport is multidimensional, to date,
mathematical models have made three simplifying assumptions with regards to the
transport of particles within a biofilm: 1) the EDC is constant (Alpkvist and Klapper
2007, Chang et al 2003, Hermanowicz 2001, Rahman et al 2009, Rajagopalan et al
1997, Xavier et al 2004); 2) the EDC is that of water (Alpkvist and Klapper 2007, Kreft
et al 2001, Rajagopalan et al 1997, Xavier et al 2004); and 3) the EDC is isotropic (the
same in directions parallel and perpendicular to the substratum) (Alpkvist and Klapper
2007, Chang et al 2003, Rahman et al 2009, Xavier et al 2004). There is one journal
article which characterizes the relationship between nutrient transport perpendicular to
the substratum and distance from the substratum; however, this linear description does
not consider the behavior near to, or far from, the substratum (Beyenal and
Lewandowski 2002). There are a multitude of models describing the relationship
between either biofilm porosity (volume fraction of the biofilm that is liquid) or biofilm
density and nutrient diffusion within the biofilm (Beuling et al 2000, Fan et al 1990, Ho
and Ju 1988, Horn and Morgenroth 2006, Kapellos et al 2007, Libicki et al 1988,
Maxwell 1892, Mota et al 2002, Wang and Zhang 2010, Wood et al 2002). Some are
heuristic fits to data, whereas others are derived using theoretical arguments based on

P a g e | 139
simplified biofilm geometry. It is not clear which of these models is most suitable for
describing the effect of biofilm structure on nutrient transport within the biofilm.
Many models partition the biofilm into two distinct components where one
component is comprised of biomass (bacteria and EPS) and the other of water (Alpkvist
and Klapper 2007, Hermanowicz 2001, Wanner et al 2006, Wood and Whitaker 2000).
The biofilm can then be considered a porous media. The biomass within the biofilm
reduces the rate of diffusion of particulates parallel to the substratum via steric
hindrance (De Beer et al 1997, Guiot et al 2002). However, the distribution of biomass
may be heterogeneous (Bridier et al 2010) and the diffusion parallel to the substratum
may be different to the diffusion perpendicular to the substratum. For example, if the
biomass is compact with multiple column like structures growing perpendicular to the
substratum (Bridier et al 2010, Danese et al 2000), the expectation would be that the
columns of bacteria would hinder the transport of particles parallel to the substratum to
a greater degree than perpendicular to the substratum. Thus the hypothesis of this work
is that the EDC in biofilms is anisotropic, with a level of anisotropy that is dependent on
the biofilm structure. The tortuosity factor, , is used to describe the resistive properties
of solutes in porous media and is defined here by the homogenized diffusion equation
(Shorten and Sneyd 2009),
CDCDτ
tC 2
eff2
5.1
where C is the concentration of nutrient within the biofilm at time, t, D is the nutrient
diffusion coefficient in water, and effD is the EDC, which is a function of the biofilm
structure.
The purpose of this study is four fold: 1) to utilize an alternative method for
determining EDCs within real three-dimensional bacterial biofilms; 2) to determine
whether or not the EDC within bacterial biofilms is isotropic or anisotropic; 3) to

P a g e | 140
ascertain the relationship between the porosity of the biofilm and the EDC; and 4) to
construct a model of nutrient transport within a bacterial biofilm growing on a nutrient-
providing substratum.
5.3. Materials and Methods
Biofilm Structures 5.3.1.Two-dimensional CLSM images of 131 distinct, single species biofilms
(Salmonella enterica, Pseudomonas aeruginosa, Escherichia coli, Enterococcus
faecalis, Staphylococcus aureus, and Listeria monocytogenes), formed on polystyrene
96-well microtiter plates as described previously (Bridier et al 2010), were acquired. For
a complete list of the bacterial strains, please refer to Appendix A. Twenty-four hour
biofilms were labeled with Syto9 (Invitrogen, France), a cell permeant green fluorescent
nucleic acids dye. For one strain of each species, biofilms were also labeled with Alexa
Fluor 633 conjugated to Concanavalin A (ConA; Molecular Probes, Invitrogen
Corporation) by adding 10 μl of a solution at 1 mg/ml directly to the wells. This
fluorescent lectin specifically binds α-mannopyranosyl and α-glucopyranosyl and thus
enables the visualization of some polysaccharides of the biofilm matrix (Chen et al
2007). Biofilms were scanned at 400 Hz using a 40 with a 0.8 N.A. (Leica HCX Apo)
water immersion objective lens with a 488 nm argon laser set at 25% intensity. Emitted
fluorescence was recorded within the range of 500-600 nm in order to visualize Syto9
fluorescence and from 650 nm to 750 nm for ConA. The CLSM images had a width of
119 μm, length of 119 μm (512 512 pixels) and were taken at a depth of 1 μm intervals
for Syto9 alone and had a width and length of 375 μm and were taken a depth of 1 μm
for Syto9 and ConA mix. Total biofilm depth varied from 10 μm to 65 μm. Within each
bacterial species, there were ten different strains and a minimum of two biofilms were

P a g e | 141
grown for each strain. Although the biofilms used in this study are potentially
pathogenic, they reflect the diversity of biofilm structure and the various degree of
porosity within biofilms found in a range of environments.
The three-dimensional renderings of bacterial biofilms were constructed by
stacking the two-dimensional CLSM slides in MATLAB (The MathWorks;
www.mathworks.com). In order to accurately determine the biofilm structure from the
CLSM slides, the background shades were segmented from those of the relevant
structural information (foreground shades) using the Otsu method. This method finds
the threshold shade intensity, 10 * Lk where L is the maximum level of shade
intensity (i.e. 256L for 8-bit images), that maximizes the weighted between-class
variance of the shade intensity histogram using the entire stack of CLSM images (Yerly
et al 2007). Thus, using the zeroth- and first-order cumulative moments of this
histogram, the weighted between class variance, kB2 , is defined as
kkkkk T
B 1) 2
2 5.2a
where the zeroth- and first order cumulative moments of the histogram are defined,
respectively, as
k
ipk0
5.2b
k
iipk0
5.2c
and the total mean level of shade intensity is defined as
1
01
L
iT ipL . 5.2d
Thus, according to the Otsu method, the optimal threshold shade intensity, *k , is given
as (Yerly et al 2007)

P a g e | 142
kk BLkB2
10
*2 max . 5.2e
The Otsu method is the optimal method for determining whether a particular voxel is
obstacle free based on a CLSM image. This segmentation method is species
independent and satisfies visual inspection even in images with biofilm coverage levels
near 1.2% (Yerly et al 2007).
Modeling Diffusion 5.3.2.To estimate the EDC within the aforementioned biofilms a Monte Carlo random
walk of a particle diffusing through the biofilm was simulated (Ölveczky and Verkman
1998, Saxton 1987, Saxton 1994). In this technique, the tracer moved along a uniform,
cubic mesh where both the obstacles (bacteria) and the obstacle free (water and EPS)
zones were specified. When the tracer moved to a point on the mesh that was defined as
an obstacle (i.e. a bacterium) the tracer remained in the original position at the boundary
of the obstacle (this represents particle reflection from the surface of the biofilm). If
is defined to be the set of all points which represent obstacles on the domain, then a
random walk, txtxtxt 321 ,,x , on that domain is given by,
tDη jjj 61 xx
ttt jj 1
x x x x
x1
1111 if
if
jj
jjjj t
5.3
where jη is a unit vector in one of the six Cartesian axis directions, t is the time step,
and tDx 6 is the mesh size. The definition of the mesh size results from the fact
that the mean square displacement, tr 2 , of a particle diffusing in n dimensions is
given by

P a g e | 143
nDttr 22 5.4
thus
tnDtri 22
or
tnDtri 2 .
An ensemble of tracer paths, beginning at a random position, 0x , was used
to calculate the mean-squared displacement and the tortuosity, τ , respectively.
22 0iii xtxtr 5.5
Dttr
DDτ i
t
ii 2
lim2eff
5.6
This definition of tortuosity is also referred to as relative diffusivity in (Hinson and
Kocher 1996, Horn and Morgenroth 2006).
To calculate the mean-squared displacement, the Monte Carlo simulated random
walk was repeated 1000 times for all 131 biofilms. For each simulated walk, the tracer
took 107 steps with a step size (i.e. mesh size) of 0.25 μm. The average of the tortuosity
factors in the x and y directions were used to determine the tortuosity factor parallel to
the substratum. In addition to calculating the tortuosity factor for each biofilm, the
porosity at every 1μm of depth within each biofilm and the average porosity over the
entire biofilm were calculated.
5.4. Results and Discussion
Anisotropic Diffusion 5.4.1.For particles moving parallel to the substratum our method provided values that
are in agreement with the tortuosity factors found using Maxwell’s equation for

P a g e | 144
impermeable cells (Eq. 5.7) [Figure 5.1a] (Hinson and Kocher 1996, Wood and
Whitaker 1999) :
εεετM 3
2 5.7
where is the porosity of the biofilm. However, our results provide evidence that
Maxwell’s equation does not adequately depict the tortuosity factor for particles that
move perpendicular to the substratum [Figure 5.1b].
Direct comparison to experimental findings is limited, as there have been few
studies for which porosity was directly calculated, and these studies have not used
bacterial biofilms (Axelsson and Persson 1988, Chresand et al 1988, Ho and Ju 1988).
Nonetheless, these studies also found that Maxwell’s equation adequately described the
relationship between porosity and tortuosity [Table 5.1, Figure 5.1c] when a particle
diffuses parallel to the substratum.
The tortuosity factors perpendicular to the substratum were significantly lower
than those parallel to the substratum in biofilms with low porosity; thus, providing
evidence that diffusion within bacterial biofilms is anisotropic [Figure 5.1b]. These
observations are of significance and imply that the transport of nutrients into biofilms
by diffusion is slower than previously reported (Kreft et al 2001, Rajagopalan et al
1997, Xavier et al 2004). The ability for a biofilm to grow and function is critically
dependent on the nutrient availability, and this in turn is dependent on the structure of
the biofilm. This relationship is therefore an important factor influencing biofilm
maturation.

P a g e | 145
Figure 5.1 Model simulations of tortuosity E. coli (blue diamond), E. faecalis (black
diamond), L. monocytogenes (green diamond), P. aeruginosa (magenta diamond), S.
aureus (cyan diamond), and S. enterica (red diamond). Average tortuosity values
parallel to the substratum, XYSIMτ , , (a) and perpendicular to the substratum, ZSIMτ , , (b)
versus porosity, ε , of the biofilm. Maxwell’s equation (solid line), Eq. 5.7, and 95%
confidence intervals (dotted lines) based on linear regression. (c) Experimental data of
tortuosity verses porosity from the literature. Reprinted with permission from
Biotechnology and Bioengineering.

P a g e | 146
Table 5.1 Summary of experimental data used in Figure 5.1c Reprinted with permission
from Biotechnology and Bioengineering.
Type of Cell Solute ε τ Source Symbol
Mammalian cells Lactate 0.575 0.480 (Chresand et al 1988) a
0.710 0.560
0.810 0.750
0.980 0.970
Penicillium chrysogenum Oxygen 0.996 0.977 (Ho and Ju 1988)
0.921 0.885
0.882 0.900
0.842 0.792
Saccharomyces cerevisiae Lactose 0.888 0.858 (Axelsson and Persson 1988)a,b
0.878 0.718
0.775 0.589
0.644 0.559
0.522 0.339
Glucose 0.888 0.857
0.878 0.729
0.775 0.611
0.644 0.550
0.522 0.371
Galactose 0.888 0.870
0.878 0.735
0.775 0.620
0.644 0.585
0.522 0.349
(a) Indicates data that has been interpolated from a graphical source. (b) Values reported
here differ from those reported by (Wood et al 2002) as they calculated the ratio of
effective diffusion coefficient and the diffusion coefficient within alginate gels rather than in
pure water.

P a g e | 147
Relationship between Diffusion and Volume 5.4.2.Fraction of Bacteria
The lack of agreement between the simulated tortuosity values perpendicular to
the substratum, ZSIMτ , , and those calculated by Maxwell’s equation was hypothesized to
be attributed to the complexity of the distribution of bacteria within the biofilms. The
volume fraction of bacteria, zε1 , was found to vary within a biofilm and be a
function of the distance, z (μm), from the substratum [Figure 5.2]. This non-linear
distribution of bacteria, which is consistent with previous studies (Lewandowski 2000,
Venugopalan et al 2005, Zhang and Bishop 1994), creates a bottle neck effect which
Figure 5.2 Volume fraction of bacteria, , within an E. coli biofilm as a function of
depth (μm) calculated using raw data (diamonds and circles) and by Eq. 5.8 (curves).
Strain A (solid blue) and Strain B (dotted green) demonstrate both the intra-species and
intra-strain variation of volume fraction of bacteria. Reprinted with permission from
Biotechnology and Bioengineering.
zε1

P a g e | 148
restricts the diffusion of particles perpendicular to the substratum. Surprisingly, this
nonlinear distribution was also found in biofilms with column like structures, which had
an effect on nutrient transport perpendicular to the substratum that was contrary to our
initial conjecture.
The porosity, ε , as a function of depth z (μm) from the substratum can be
approximated by
2exp1 bzcbzazε 5.8
and the bacterial distribution of each strain can be approximated by zε1 when
grown on a polystyrene microtiter plate [Figure 5.2]. The minimum porosity within the
biofilm and the depth at which the minimum porosity occurred varied both within and
between species and strains [Figure 5.2].
The model parameters a, b, c in Eq. 5.8 were estimated for each biofilm using
non-linear least squares. These parameters were then associated with a random effects
model:
ijkijiijk esbμy 5.9
where μ is a fixed overall mean, ib is a species effect (for species i), ijs is the effect for
the jth strain, and ijke is the residual effect (for the kth replicate). The random effects
model for the parameters in Eq. 5.8 is summarized in Table 5.2, it is important to note
the effects of the coefficients in Eq. 5.8 on the porosity and distribution of bacteria
within a biofilm. Differentiating Eq. 5.8 and setting the derivative equal to zero, the
depth at which the biofilm reaches its minimum porosity (or maximum volume fraction
of bacteria) and the minimum porosity are, respectively:
12cbz 5.10

P a g e | 149
5.0exp21 1caε . 5.11
Hence, the depth at which the biofilm reaches its minimum porosity is dependent upon
the values of b and c, and the minimum porosity is dependent upon the values of a and
c. Additionally, c describes the distribution of the bacteria within the biofilm, i.e. the
level of localization of the biofilm in space. Given that the variation between species at
all levels is significant for both a and b [Table 5.2], it is clear that the variability
between species, within species and between strains with regards to the minimum
porosity and the depth at which the minimum porosity occurs is substantial. While
Table 5.2 Random effects model for the coefficients a, b and c from Eq. 5.8; the
tortuosity values determined by the Monte Carlo random walk for diffusion parallel to the
substratum, XYSIMτ , , and perpendicular to the substratum, ZSIMτ , ; and tortuosity values
calculated using Eq. 5.13 with the raw data for porosity, RAWZτ , , and the estimated
values for porosity using Eq. 5.8, ESTZτ , . Reprinted with permission from Biotechnology
and Bioengineering.
Values Mean
(All Data) Between Species
Variance
Within Species (Between Strains) Variance
Within Strain Variance
a 0.1165 0.0036 0.0033 0.0013
b -1.5506 1.5579 1.6274 6.6297
c 0.0102 5.7072 10-7 1.64 10-5 1.95 10-5
0.7547 0.0142 0.0057 0.0061
0.6340 0.0779 0.0234 0.0245
0.6517 0.0627 0.0218 0.0179
0.6167 0.0666 0.0237 0.0175

P a g e | 150
variation between species, within species and between strains is small for the coefficient
c, a slight change in c will have a dramatic effect on the graph of Eq. 5.8. By adding
0.005 to the mean value of c (keeping a and b constant) a biofilm which has a
distribution consistent with strain A (higher), Figure 5.2, will be transformed to that of
strain B (lower), Figure 5.2. Thus, the differences in the distribution of bacteria within
the biofilm, and the biofilm porosity, can be characterized by the parameters a, b, and c
in Eq. 5.8. Given the considerable intra- and inter-species variation (Bridier et al 2010)
[Table 5.2], erroneous conclusions may arise when using mean values in modeling
either the biofilm porosity or the distribution of bacteria within a single species biofilm.
Additionally, biofilms are typically composed of multiple microbial species as well as
various strains within the same species, and thus average values for single-species
bacterial biofilms may not accurately describe heterogeneous biofilms.
To take into consideration the change in porosity at different depths within the
biofilm, homogenization theory was used to calculate the average tortuosity factor of a
particle diffusing parallel to, XYτ , and perpendicular to, Zτ , the substratum,
respectively:
L
MXY
XY dzzετLD
Dτ0
1eff
5.12
L
M
ZZ dz
zετL
DDτ
0
1eff
5.13
where L is total depth of the biofilm in μm (Goel et al 2006, Keener and Sneyd 1998,
Shorten and Sneyd 2009, Suslina 2005). Raw data values for zε [Figure 5.3a] and the
best fit equation in the form of Eq. 5.8 [Figure 5.3b] were used to generate a parity plot
of the tortuosity values obtained from our simulation, ZSIMτ , , and the tortuosity values
calculated by Eq. 5.13 [Figure 5.3]. The change in porosity (as a function of depth),

P a g e | 151
zε , rather than the average biofilm porosity, ε , has a significant impact on nutrient
diffusivity perpendicular to the substratum. Additionally, Eqs. 5.12 and 5.13 provide
accurate estimations for the tortuosity values when nutrient transport is parallel to or
perpendicular to the substratum, respectively. However, when using Eq. 5.8 as the
function of porosity rather than the raw data, Eq. 5.13 fails to provide reasonable
estimates for the tortuosity values when the porosity nears zero.
The values for the random effects model pertaining to the tortuosity values were
determined for A) simulated values, B) values as determined by Eq. 5.13 using raw data
for porosity RAWZ , , and C) values as determined by Eq. 5.13 using Eq. 5.8 for
porosity ESTZ , [Table 5.2]. The mean tortuosity value parallel to the substratum is
significantly greater than the mean tortuosity value perpendicular to the substratum
( 19%). The variance between species was approximately 5.5 times greater for the
tortuosity values perpendicular to the substratum than those parallel to the substratum,
and approximately 4 times greater for both the within species variance and within strain
variance. In both cases, the within species variance and the within strain variance were
similar. Values for tortuosity calculated by Eq. 5.13 resulted in an overestimate of the
mean (+0.0177) when used in conjunction with the raw data and an underestimate (-
0.0173) when used in conjunction with Eq. 5.8. However, this difference was not
significant (P < 0.05). With regard to the variance between species, within species and
within strains, both RAWZτ , and ESTZτ , provide similar values which were in agreement
with those calculated for the simulated tortuosity values, ZSIMτ , .

P a g e | 152
Figure 5.3 Parity plot of simulated tortuosity factor, ZSIMτ , , and the average tortuosity
factor, Mτ , as calculated using Eq. 5.13, of a particulate diffusion perpendicular to the
substratum using (a) raw data RAWZτ , and (b) estimated porosity values from Eq. 5.8,
ESTZτ , . Reprinted with permission from Biotechnology and Bioengineering.

P a g e | 153
The Effects of Extracellular Polymeric Substances 5.4.3.on Diffusion
EPS within bacterial biofilms is multifunctional. For instance, components of
the EPS have been recognized to provide structural stability and differentiation (Danese
et al 2000, Flemming et al 2007), aid in surface binding or coaggregation (Koo et al
2010, Marvasi et al 2010, Vu et al 2009), and provide or store nutrients to be utilized in
times of nutrient deficiency (Wang et al 2007, Wolfaardt et al 1999).
Given the various roles of EPS one would expect the EPS to hinder diffusion in
much the same way as the bacteria; hence, hindrance would depend on the porosity of
the EPS, the diameter of the channels within the EPS, the size of the molecule being
transported, and the distribution of the EPS. To further our knowledge in this area, six
biofilms were constructed and examined, as described in our methods, which were
stained for both bacteria and EPS. For a complete list of the bacterial strains, please
refer to Appendix A.
The measurable volume fraction of EPS was calculated as a function of depth,
and found that the EPS distribution can also be described by Eq. 5.8 [Figure 5.4a]. This
distribution is in agreement with other reports (Staudt et al 2004, Venugopalan et al
2005). Mean ratios of bacteria to EPS can vary between species as well as over time
(Staudt et al 2004, Venugopalan et al 2005); thus the volume fraction of EPS within a
biofilm is not necessarily correlated to the volume fraction of bacteria. Estimates of EPS
bio-volume have been reported to be between 10% and 90% of the total organic matter
(Nielsen and Jahn 1999). In the 6 biofilms studied here, the measurable EPS ranged
from 13.4% to 28.1% of the total biomass.
The EDCs were calculated, with and without the inclusion of EPS. Given our
method for determining the EDCs, the inclusion of EPS essentially decreases the overall
porosity of the biofilm. As expected, it was found that diffusion was still anisotropic;

P a g e | 154
Figure 5.4 (a) Volume fraction of EPS within E. faecalis (blue), P. aeruginosa (magenta),
and S. enterica (red) biofilms as a function of depth (μm) calculated using raw data
(diamonds) and by Eq. 5.8 (solid curves). (b) Average tortuosity values parallel (blue)
and perpendicular (green) to the substratum, with (diamonds) and without EPS
(squares), versus porosity, ε , of the biofilm along with Maxwell’s equation, Eq. 5.7 (solid
line). Ninety-five percent confidence intervals (dotted lines) calculated from original 131
data points using linear regression. Reprinted with permission from Biotechnology and
Bioengineering.

P a g e | 155
tortuosity factors for particles moving parallel to the substratum could be described by
Maxwell’s equation, and tortuosity factors for particles moving perpendicular to the
substratum deviated from Maxwell’s equation [Figure 5.4b]. Additionally, Eqs. 5.12
and 5.13 held for calculating the average tortuosity factor (data not shown).
To verify the reliability of our method to calculate EDCs, the results were
compared to those of others (Oubekka et al 2011). Oubekka and colleagues calculated
the EDC of BODIPY fluorescence in Staphylococcus aureus biofilm using FRAP. Their
results corresponded to a mean tortuosity value of 0.4659 0.175 for a particle moving
parallel to the substratum. Using the same biofilm as Oubekka and colleagues, which
was stained for both EPS and bacteria, our methods resulted in a tortuosity value of
0.709 for a particle moving parallel to the substratum and 0.361 for a particle moving
perpendicular to the substratum. Our estimate is within 95% confidence levels of those
calculated by Oubekka and colleagues.
The difference between the calculations found in this study and those reported
by Oubekka and colleagues may potentially be attributed to the fact that ConA does not
stain for all components of the EPS, and thus the calculation of the volume fraction of
EPS in this study was an underestimate. Current mechanisms used to either visualize
EPS in images or to separate EPS from bacterial biofilms have proven to be inefficient.
EPS staining using lectin-staining combined with various imaging techniques have been
used to estimate the EPS volume fraction (Boessmann et al 2003, Staudt et al 2004,
Venugopalan et al 2005); however, lectin only binds to particular polysaccharides and
these polysaccharides may only account for a portion, and in some cases a minor
portion, of the total EPS (Flemming et al 2007, Laspidou and Rittmann 2002). Physical
methods to extract EPS from intact biofilms have proven to be partially effective as
these methods remove only 3-68% of the total EPS or the methods result in cell lysis

P a g e | 156
which interferes with the analysis of the EPS composition (Cao et al 2004, Nielsen and
Jahn 1999). Thus, at this time there is no method which will accurately quantify the
volume fraction of a biofilm which is EPS and the method used here is expected to
provide an upper bound on tortuosity.
Reaction-Diffusion Model 5.4.4.This study has shown that the biomass distribution has a significant impact on
the transport of nutrients within a biofilm. At the local level, Maxwell’s equation is
sufficient to describe the tortuosity factor, thus diffusion of nutrients in any direction
within a rectangular biofilm can be described by the following diffusion equation and
boundary conditions, respectively:
CzyxετDt
tzyxCM ,,,,,
0,,, CtLzyxC z
Fz
tzyxC ,0,,
0,,,,,0,,,,,,,0 CtzLyxCtzyxCtzyLxCtzyxC yx
5.14
where tzyxC ,,, is the concentration of nutrients attached to a substratum at time t,
zyxε ,, is the local porosity, zL (μm) is the biofilm height, xL (μm) is the biofilm
depth, yL (μm) is the biofilm width, 0C is the concentration of nutrients at the biofilm-
bulk fluid interface, and F is the flux of nutrients at the biofilm-substratum interface.
For nutrient utilization by the biofilm, Eq. 5.14 becomes:
KC
CBzyxεrCτDt
tzyxCM max,,1,,,
5.15

P a g e | 157
where r is the rate of nutrient utilization by the biofilm, maxB is the maximum mass of
bacteria per volume, and K is the nutrient concentration giving one-half the maximum
rate of nutrient utilization (or the Monod saturation constant).
The biofilms studied in this work have a porosity that is dependent on distance
from the substratum zεzyxε ,, . By using Eqs. 5.12 and 5.13 (homogenization) it
follows that Eq. 5.15 becomes the anisotropic diffusion equation:
KCCBzyxεr
zCτD
yCτD
xCτD
ttzyxC
ZXYXY max2
2
2
2
2
2
,,1,,,
.
5.16
This model assumes the following:
1. Nutrients are transferred by diffusion, which obeys Fick’s law only and react
(or are utilized) by the bacteria.
2. Nutrient transfer is three dimensional.
3. There is only one limiting nutrient and the rate of nutrient utilization is
described by the Monod equation and is dependent upon the volume fraction
of biomass, zε1 within the biofilm.
4. Biofilm growth can either be on an impermeable substratum ( 0F ) or on a
nutrient-providing substratum ( 0F ).
5. Hydrodynamic interactions between the particles and the biofilm are not
included in the model.
It has been shown that convection may occur in bacterial biofilms (Stoodley et al
1994), however, the effect of convection is related to the fluid flow in the bulk liquid
(De Beer et al 1996). While mixing of contents may occur in the cecum and ascending
colon, very little to no mixing of the digesta occurs in the descending and transverse
colon due to the viscosity of the digesta (Lentle et al 2005, Lentle and Janssen 2008,
Lentle and Janssen 2010, Macfarlane and Macfarlane 2007). For simplicity, the distal
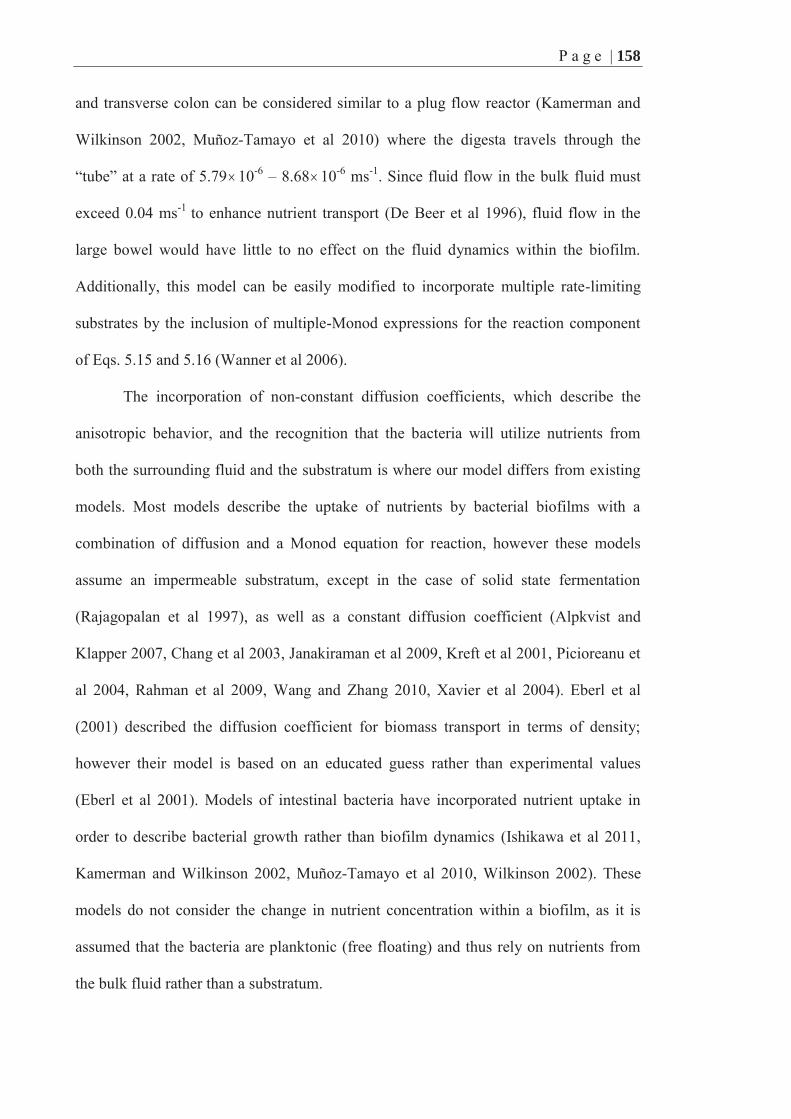
P a g e | 158
and transverse colon can be considered similar to a plug flow reactor (Kamerman and
Wilkinson 2002, Muñoz-Tamayo et al 2010) where the digesta travels through the
“tube” at a rate of 5.79 10-6 – 8.68 10-6 ms-1. Since fluid flow in the bulk fluid must
exceed 0.04 ms-1 to enhance nutrient transport (De Beer et al 1996), fluid flow in the
large bowel would have little to no effect on the fluid dynamics within the biofilm.
Additionally, this model can be easily modified to incorporate multiple rate-limiting
substrates by the inclusion of multiple-Monod expressions for the reaction component
of Eqs. 5.15 and 5.16 (Wanner et al 2006).
The incorporation of non-constant diffusion coefficients, which describe the
anisotropic behavior, and the recognition that the bacteria will utilize nutrients from
both the surrounding fluid and the substratum is where our model differs from existing
models. Most models describe the uptake of nutrients by bacterial biofilms with a
combination of diffusion and a Monod equation for reaction, however these models
assume an impermeable substratum, except in the case of solid state fermentation
(Rajagopalan et al 1997), as well as a constant diffusion coefficient (Alpkvist and
Klapper 2007, Chang et al 2003, Janakiraman et al 2009, Kreft et al 2001, Picioreanu et
al 2004, Rahman et al 2009, Wang and Zhang 2010, Xavier et al 2004). Eberl et al
(2001) described the diffusion coefficient for biomass transport in terms of density;
however their model is based on an educated guess rather than experimental values
(Eberl et al 2001). Models of intestinal bacteria have incorporated nutrient uptake in
order to describe bacterial growth rather than biofilm dynamics (Ishikawa et al 2011,
Kamerman and Wilkinson 2002, Muñoz-Tamayo et al 2010, Wilkinson 2002). These
models do not consider the change in nutrient concentration within a biofilm, as it is
assumed that the bacteria are planktonic (free floating) and thus rely on nutrients from
the bulk fluid rather than a substratum.

P a g e | 159
Model Simulation 5.4.5.In an attempt to mimic a bacterial biofilm attached to a fermentable food particle
within the human large bowel, the parameters used in the model simulation [Figure
5.5a] represent experimental values currently available in the literature [Table 5.3].
Additionally, the initial concentration in the bulk fluid reflects the amount of glucose
which enters the cecum. In the case of a biofilm attached to an impermeable substratum,
the concentration of nutrients will decrease to low values at the substratum, which is
consistent with the lack of viable cells observed near the substratum of biofilms grown
on polystyrene plates [Figure 5.2]. However, if the bacterial biofilm is attached to a
nutrient providing substratum, there will be increased growth, i.e. volume fraction of
bacteria, near both the substratum-biofilm interface and the bulk fluid-biofilm interface
(Macfarlane and Macfarlane 2006). This uptake of nutrients at the substratum-biofilm
interface and bulk fluid-biofilm interface, causes nutrient gradients to develop so that a
nutrient deficiency occurs near the center of the biofilm rather than near the substratum
[Figure 5.5a]. This is consistent with the observed increase in void space at the center of
biofilms growing on a food particle in human fecal matter [Figure 5.5b].
Further validation of the model was done by fitting Eq. 5.15 to concentration
profiles of oxygen in artificial biofilms, grown in spherical beads, measured using
microelectrodes at 30°C (Beuling et al 2000). As shown in Figure 5.6, our model is
consistent with the reported oxygen concentration profiles of artificial biofilms with
1.6%, 3.6%, 7.8% and 15.5% volume fraction of bacteria. To fit our model to the data in
Beuling (2000) it was assumed that the diffusion of oxygen in water at 30°C was 2.92
103 μm3 s-1 (Wiesmann et al 1994), maxB was as described in Table 5.3, the distribution
of bacteria was uniform as reported previously (Beuling et al 2000) and the Laplacian
operator in Eq. 5.15 was transformed to spherical coordinates. Given that K is the

P a g e | 160
concentration of oxygen for which the utilization rate will reach half maximum, and that
K is independent of the volume fraction of the biofilm that is bacteria, K was assumed to
be the same for all four biofilms. While one would expect the oxygen utilization rate, r,
Figure 5.5 (a) Concentration of glucose (g l-1) as a function of distance from the
substratum (μm) attached to a non-permeable substratum (blue dotted), low value
nutrient (green solid) and high value nutrient (red dashed). (b) Confocal z-sections of a
biofilm attached to a fermentable food particle from human fecal matter. Total
eubacteria (Eub) and bifidobacteria (Bifd) stained with Cy5 (blue) and Cy3 (red) labeled
probes, respectively (Macfarlane and Macfarlane 2006). Used with permission from
American Society for Microbiology. Reprinted with permission from Biotechnology and
Bioengineering.

P a g e | 161
to be the same for all four biofilms, the oxygen utilization rate was allowed to be
biofilm specific. The parameters K and r were estimated using non-linear least-squares.
A value of 4.51 10-4 mol oxygen m-3 for K was found as well as oxygen utilization
rates of 1.75 10-5, 4.51 10-5, 3.20 10-5 and 3.23 10-5 mol oxygen g biomass-1 s-1 for
Table 5.3 Parameters used for modeling the concentration of nutrients as a function of
distance [Figure 5.5a]. Reprinted with permission from Biotechnology and
Bioengineering.
Variable Value Units References
D 7.03 102 μm2s-1 (Mitchell et al 1991)
(at 37° C)
a 0.20158 None This work.
b -1.3045 None This work.
c 0.014222 None This work.
r 0.167 g glucose g dry
biomass-1 s-1
(Mlobeli et al 1998)
maxB 307.69 g dry biomass l-1 Estimated a
K 0.3 g l-1 (Mitchell et al 1991)
18,0C 0.35 g l-1 (Tony Bird, Pers. Comm.)
ztCLN 0, 50 g l-1μm-1 Estimate
ztCHN 0, 80 g l-1μm-1 Estimate
* zετM is defined by the composition of Eq. 5.7 with Eq. 5.8. (a) 2 10-13 g/ dry
bacterial cell; 1 cell = 0.65 μm3. (b) Value from (Mlobeli 1996) was extrapolated from
Fig. 13.

P a g e | 162
the biofilms with 1.6%, 3.6%, 7.8% and 15.5% volume fraction bacteria, respectively.
Although the utilization rates were similar in all four biofilms, the differences between
the values reported here is likely a result of either a difference in the percentage of
viable cells within the biofilms or an error in the calculation of the percentage of
bacterial cells within the biofilms.
5.5. Concluding Comments
Our method to calculate the EDC within bacterial biofilms provides a repeatable
indirect estimate while being non-destructive to the biofilm. Our method provides
tortuosity values within 95% confidence intervals as determined experimentally using
Figure 5.6 Oxygen concentration (mol m-3) in artificial biofilms grown in spherical beads
with cell volume fraction of 1.6% (diamond), 3.6% (square), 7.8% (triangle) and 15.5%
(circle) as a function of the radius (μm) of the bead (Beuling et al 2000) with corresponding
model fitting curves. Reprinted with permission from Biotechnology and Bioengineering.

P a g e | 163
FRAP. The accuracy of our method will likely improve once there is a technique to
accurately image the entire biomass volume fraction.
Our method has shown that the diffusivity of nutrients within bacterial biofilms
is anisotropic and that the diffusion coefficient perpendicular to the substratum is
significantly smaller than the diffusion coefficient parallel to the substratum. It was
suggested by Hinson and Kocher (1996) that the diffusivity within a biofilm is lowered
by the EPS rather than by steric hindrance by bacteria even though biofilms are assumed
to be 99% water, of which 90-99% has been reported to be extracellular (Flemming et al
2005). Our results partially support this view, in that hindrance to nutrient transport is
affected by the concentration of EPS. However, hindrance by bacteria cannot be
discounted as the EPS is strain dependent and in some strains may account for as little
as 10% of the total biomass. Our results indicate that both EPS and bacteria hinder
nutrient transport within biofilms.
In light of these findings, a modified reaction-diffusion model to describe
nutrient concentrations within bacterial biofilms that is consistent with experimental
observations of oxygen transport in biofilms was proposed. While this model was
chosen to describe nutrient transport within three-dimensional biofilms attached to a
fermentable food particle within the human large bowel, this model is not limited to this
particular application. For instance, this model may be easily modified to be utilized in
solid-state fermentation models, models describing antibiotic transport within biofilms
attached to medical devices or the transport of disinfectants within biofilms attached to
food processing equipment.

P a g e | 164
Chapter 6 Key Contributions and Recommended Future Research
As our knowledge of food/bacteria/host interactions increases, it is becoming
clear that there is enormous potential for this knowledge to contribute to the
development of functional foods. To maximize the potential health benefits from
functional foods, it is essential that we develop a deeper understanding of (1) how
gastric digestion alters the food matrix; (2) how to predict the proportion of the food
matrix which remains after digestion in the stomach and small bowel, as well as the
composition of the remaining food matrix; (3) how diet impacts bacterial attachment to
the digesta; (4) how diet impacts the bacterial colonization of the large bowel; and (5)

P a g e | 165
how bacteria work in a consortium to degrade food particles within the small and large
bowel.
This thesis presents a number of new mathematical models which describe some
of the key components of food/bacteria/host interaction in order to elucidate some of the
essential physiological factors involved in nutrient bioavailability. Primarily, this thesis
focused on modeling the interaction between the commensal bacteria (i.e. cross-feeding
and nutrient competition) as well as the commensal bacteria/food interaction in the
human large bowel. The effects of gastric pH and food matrix composition on the
digestion of food within the human stomach were also considered in this thesis in order
to better understand the food/bacteria and food/host interactions.
An essential aspect of food/host interactions is the ability to predict the
bioaccessibility of nutrients as a result of acidic hydrolysis. Additionally, the gastric
digestion aspect of this thesis provides a better understanding of how bacteria
metabolize non-digested food components (food/bacteria interactions) in that bacterial
extracellular enzymes may release nutrients from the food matrix in a manner similar to
the way nutrients are released from a food matrix by acidic hydrolysis. In addition, the
interaction between the commensal bacteria and food particles in the human large bowel
is dependent on the food particle size and composition, which in turn are dependent on
digestion in the stomach as the preferred substrates for bacterial fermentation are food
particles which escape digestion in the small bowel.
The human stomach is a dynamic and complex system. Currently, there is a
significant lack in modeling the degradation of food particles within the stomach. As
mentioned in Chapter 3, in order to understand the complexities of gastric digestion and
to build models which accurately describe the underlying digestive mechanisms, it is
essential to determine the effects of different factors (food structure, preparation,

P a g e | 166
particle size, meal volume and composition, viscosity, pH, and temperature) on gastric
digestion prior to investigating the interactions between those factors.
In Chapter 3, the focus was on the effect of pH, and acidic hydrolysis, as the pH
directly affects enzymatic reactions, varies over the digestive time, and has been shown
to have a significant effect on the amount of soluble loss from the food matrix. Thus, the
effect of pH is foundational to the other mechanisms by which food is digested within
the stomach.
In order to investigate the effect of pH, it was necessary to determine the
effective diffusion coefficient (EDC) within the model foods (Edam and raw carrot
core). To calculate the EDC, an objective method for measuring the propagation front of
fluid into porous media was described. This is the first study to apply the method
described in Chapter 3 to food digestion studies. The previous study which calculated a
diffusion coefficient for simulated gastric fluid in carrot (Kong and Singh 2011)
assumed that the EDC was constant, yet determined two values for the EDC (per pH
value) depending on the digestion time. This was a surprising claim as it is well
established that the EDC is dependent upon the moisture concentration in porous media.
The method used here, further demonstrated the necessity of incorporating the
concentration of the simulated gastric fluid (SGF) in determining the EDC of SGF
diffusing into food matrices during gastric digestion.
In Chapter 3, a novel mechanistic, mathematical model was developed to predict
solid particle loss of carrot as a result of acidic hydrolysis at constant pH. Rather than
using an empirical model (Kong and Singh 2011), this model describes the solid loss in
terms of the change in density of the food particle as soluble nutrients are released from
the food matrix. This is consistent with digestive studies, where a “halo” effect occurs

P a g e | 167
as the cells and other components of the food matrix are damaged as a result of acidic
hydrolysis, and nutrients are released (Kong and Singh 2009b, Tydeman et al 2010).
To provide a more realistic degradation profile, the model incorporated the
expected change in pH during the gastric digestive period. Here a prediction of the
likely rate of soluble particle loss of carrot during digestion is provided, which
demonstrates that the particle loss is slower at the beginning of the digestion period as a
result of high pH and an increase in solid loss occurs as the pH lowers.
The model presented here can be modified to predict the solid loss of other
foods; however in order to utilize this model additional experiments are required to
determine the specific pH dependency of the coefficients of the EDC parameters.
Essentially, the parameter values of the exponential equation used to describe the EDC
are found empirically due to necessity. Additional studies are required to determine the
exact components of the food structure that dictate the parameters of the EDC function.
Ideally, future work will modify the EDC function to incorporate food composition
effects. It is quite possible that the pH dependency may be consistent between foods that
are structurally similar. Foods such as carrot and parsnip have a high concentration of
water and similar cellular structure, fat content, and protein content. Such foods may
have a similar relationship between the pH and the EDC function.
Advances in modeling necessitate that the relationship between pH and the
efficacy of gastric enzymes, such as pepsin, be determined. Of course, this also requires
a clear understanding of the specific protein structures that are susceptible to proteolysis
by pepsin. Further experiments are required to specifically consider the different
components of the food matrix (protein, fat, polysaccharides, etc.) and reveal how the
different components of the food structure affect the efficacy of both acidic hydrolysis
and proteolysis. This is of particular necessity as the use of emulsions in food products

P a g e | 168
increases. Lipid and water emulsions may be quite complex, with the inclusion of a
variety of other components: proteins, polysaccharides, sugars, salts, etc. As noted by
Singh and Ye (2013) interactions between the gastric fluid and the emulsions may cause
conformational changes which not only affects the structure integrity of the emulsion
(especially at low pH) but may have a marked effect on the digestibility and
bioaccessibility of the emulsion components. Further studies of emulsions at low pH are
necessary to understand how the gastric environment affects the structural integrity of
emulsions.
The model presented in this thesis depicting particle degradation can be
considered a foundational model as it considers a fundamental aspect of gastric
digestion (acidic hydrolysis) which also affects the efficacy of enzymatic reactions. A
more complete model would extend this model to incorporate enzymatic reactions,
erosion from contact between food particles and fragmentation as a result of peristaltic
contractions. Of course, erosion and fragmentation will also be related to the food
matrix composition.
Many foods matrices contain components which are unable to be digested in the
stomach or the small bowel. For instance dietary fibers, such as non-starch
polysaccharides and resistant starch, transit from the gastric region through the small
intestinal tract and into the colon having only undergone conformational changes as a
result of mastication and gastric digestion. These food components are then readily
available for fermentation by the commensal bacteria.
Chapter 4 focused on another very important aspect of human digestion and
health: the relationship between food particles and the human commensal intestinal
bacteria. In this chapter a modified version of the model proposed by Amaretti et al
(2007) was used to characterize growth kinetics (substrate degradation and the

P a g e | 169
subsequent growth of bacteria and production of metabolites) of 18 bifidobacterial
strains when growth with inulin, oligofructose and fructose as substrates. Upon analysis,
it was shown that the model can be further simplified to omit the maintenance term
when the ratio of substrate concentration to bacterial inoculum is low. Further
experiments are required to determine whether this is the case when bacteria are grown
in a nutrient rich environment.
The aforementioned model was extended to account for preferential degradation
of substrate by the bacterium, which was observed by various strains of Bifidobacterium
when grown with oligofructose as the substrate (Falony et al 2009b). According to a
review of the literature, the model proposed here is the first model to describe
preferential degradation of a substrate. This is an important contribution as this model
confirms that degradation of oligofructose results in different values for the bacterial
yield, specific growth rate, and metabolite production rates depending on whether the
degree of polymerization (DP) of the polysaccharide is preferred or less preferred. Thus,
in the formulation of functional foods or prebiotics, the type of polysaccharides used
will have a significant impact on the competitiveness of particular bacterium as well as
the metabolites produced by the bacterium. Such effects need to be carefully considered
to ensure that the formulation of a functional food has the desired functionality (i.e.
increase growth rate of targeted bacterium, or increased production of a particular short
chain fatty acid).
Understanding the mechanisms which cause the change in metabolite production
will also play a key role in improving functional foods. At this time, there is only the
observation that the type of metabolite produced depends upon the DP of the
polysaccharide; however there must be a specific mechanism that triggers the reduction
of pyruvate to either lactate or formate, acetate and ethanol. A correlation between the

P a g e | 170
specific growth rate of the bacterium and the observed change in metabolite production
has been mentioned in the literature; however it is doubtful that a lowered growth rate is
the trigger. More than likely, the lowered growth rate and yield is a result of more
energy required to degrade the non-preferred substrate and less energy available to be
expended on growth and cell division. This would also explain the change in metabolite
production, since the reduction of pyruvate to formate, acetate and ethanol results in
additional ATP which would be necessary for the bacterium to degrade the non-
preferred substrate.
In addition to the models described above, a novel, mechanistic model was
developed to describe the competition between Bacteroides thetaiotaomicron LMG
11262 and Bifidobacterium longum LMG 11047 and B. thetaiotaomicron LMG 11262
and Bifidobacterium breve Yakult for a substrate (inulin). This competition model
includes the potential for microbial cross-feeding as a result of released nutrient
fragments from extracellular degradation of the substrate.
This is the first microbial competition model of its kind, as the proposed
mathematical model provides a complete picture of the growth kinetics of two
competing/cross-feeding bacteria. Previously proposed models were either empirical
models (provided no insight into the mechanisms driving competition or cross-feeding)
or neglected important aspects of the coculture dynamics (e.g., the competing or
nutrient providing bacterium, or the primary substrate).
The most significant result in Chapter 4 was that the competitive/cross-feeding
model adequately predicted co-culture dynamics using parameter values determined
from monoculture experiments. This finding means that significantly less bacterial
growth experiments are necessary to predict coculture growth kinetics (polysaccharide
degradation and the subsequent bacterial growth and metabolite production).

P a g e | 171
At this time, the competitive/cross-feeding model has been validated for B.
thetaiotaomicron LMG 11262 grown with either B. longum LMG 11047 or B. breve
Yakult. Additional experiments are necessary to validate the model for a variety of
commensal bacteria. Future work would also include an extension of this model to
incorporate other types of microbial cross feeding. Little work would be required to
modify the competition/cross-feeding model presented here to include the consumption
(by the secondary bacterium) of a metabolite produced by the primary bacterium. This
model could also be extended to describe the instances where the secondary bacterium
can only metabolize the primary substrate in the presence of and concurrently with a
particular metabolite. Preferential degradation by either bacterium could also be
incorporated into this model. In order to validate such extensions, it is essential for
additional experiments, both mono- and coculture, to be conducted where the bacterial
growth, substrate concentration, and metabolite concentrations are measured at frequent
time intervals as seen in the work of Falony et al (2009a).
As mentioned in the introduction, Chapter 4 is a macroscopic view of bacterial
growth as a result of substrate metabolism. In Chapter 5 a microscopic view was taken.
Here the transport of nutrients within a bacterial biofilm was investigated. Within
bacterial biofilms, nutrient gradients occur as the diffusing nutrients are utilized by the
bacteria. The nutrient concentration has a marked effect on the structure of the biofilm,
as bacteria will grow where the nutrients are highest.
In order to characterize the transport of nutrients within bacterial biofilms, a
repeatable, indirect method to estimate of the EDC was used. This method results in
EDC values (for nutrients moving parallel to the substratum) that are within the 95%
confidence intervals of those determined experimentally using FRAP.

P a g e | 172
The method described in this thesis to calculate the biofilm porosity is a
significant improvement to methods described previously, as the use of CLSM images
is not destructive to the biofilm. The analysis of biofilms reconstructed from CLSM
images revealed that the volume fraction of bacteria varies within a biofilm and is a
function of the distance from the substratum. The bacterial distribution had a profound
effect on the nutrient transport within bacterial biofilms. The non-linear distribution of
bacteria creates a bottle neck effect which restricts the diffusion of particles
perpendicular to the substratum. Surprisingly, this nonlinear distribution was also found
in biofilms with column like structures, which had an effect on nutrient transport
perpendicular to the substratum that was contrary to our initial conjecture. Nutrient
transport perpendicular to the substratum was found to be significantly slower than
transport parallel to the substratum in biofilms with low porosity.
Examination of the relationship of the biofilm porosity to the EDC calculated for
131 biofilms demonstrated that Maxwell’s equation provides a reliable estimate for the
EDC (as a function of biofilm porosity) when considering transport of nutrients parallel
to the substratum. Maxwell’s equation may also be used to estimate the EDC of a
nutrient diffusing perpendicular to the substratum; however in order to do so, one must
use the harmonic mean of the tortuosity (ratio of EDC to the diffusion coefficient in
water) over the depth of the biofilm. This method considers the depth dependency of the
bacterial distribution which is essential for calculating the EDC perpendicular to the
substratum in biofilms with low porosity. Additionally, the evidence that the
distribution of the bacteria has a significant effect on value of the EDC means that
future experimental methods must measure the EDC perpendicular to the substratum
rather than parallel, which has been the convention.

P a g e | 173
The method described in Chapter 5 to determine the fraction of the biofilm
which is composed of bacteria was also used to determine the fraction of the biofilm
which was composed of EPS. While the method is sound, it is dependent upon the
reliability and accuracy of the method for staining the EPS before CLSM images are
taken. As mentioned in Section 5.4.3, the current methods for staining the EPS are not
accurate as the stain only targets specific components of the EPS. Thus, the volume
fractions of EPS presented here are likely to be underestimates, which implies that the
EDC values may be even lower than reported here. However, it is important to note that
the relationship between the porosity and tortuosity will not change. Future work must
include additional methods for visualizing the structural components of the EPS, to
ensure that all components of the EPS that may hinder nutrient transport are accounted
for in CLSM images.
A modified reaction-diffusion model which incorporated the porosity and
distribution of the bacteria was proposed in Chapter 5. The inclusion of the bacterial
population improves the description of the change of concentration of nutrients within
the biofilm. The model was validated by comparing the oxygen concentration within
artificial biofilms with known porosity. As demonstrated in Figure 5.6 (Section 5.4.5),
the proposed reaction-diffusion model fit to the oxygen concentration profiles is
remarkably accurate.
Within the human gastrointestinal tract, bacterial biofilms are typically found
attached to a nutrient providing substratum (a food particle which escaped digestion in
the stomach and small bowel or the mucosa of the intestinal wall) and thus nutrients are
derived from both the substratum and the bulk fluid. Therefore, there will be increased
growth, i.e. volume fraction of bacteria, near both the substratum-biofilm interface and
the bulk fluid-biofilm interface (Macfarlane and Macfarlane 2006). This uptake of

P a g e | 174
nutrients, at the substratum-biofilm interface and bulk fluid-biofilm interface, causes
nutrient gradients to develop so that a nutrient deficiency occurs near the center of the
biofilm rather than near the substratum. This is clearly described by the simulation of
the proposed reaction-diffusion model, which assumed that the concentration of
nutrients originates from both the substratum and the bulk fluid. Additionally, these
results are consistent with the observed increase in void space at the center of biofilms
growing on a food particle in human fecal matter (Macfarlane and Macfarlane 2006).
The work presented in Chapter 5 clearly demonstrates the necessity of
incorporating the volume fraction of bacteria in determining the rate of change in the
concentration of the nutrients within the biofilm: both in terms of diffusion and reaction.
Presently, the specific processes involved in the structural formation and
detachment of commensal enteric bacterial biofilms attached to food particles have yet
to be ascertained. However, it is likely that both quorum sensing and nutrient
availability will have a significant influence on both the structural formation and
detachment of bacterial biofilms attached to digesta.
While this thesis clearly provides advances in the modeling and understanding
of the dynamics of bacteria associated with food particles in the human bowel, there is
still much work to be done. For instance, this thesis has not improved the mathematical
models describing bacterial attachment. Bacterial attachment is a very complex process.
While the DLVO, LW-AB and XDLVO models describe aspects of the
physicochemical properties of bacterial attachment, they do not, however, incorporate
biological factors. The lack of inclusion of biological factors in the above models may
contribute to the discrepancy between model predictions and experimental observations.
A critical analysis of the agreement of XDLVO and LW-AB theories with experiments
may give valuable insights into the environments for which these theories are

P a g e | 175
applicable. Given the complexity of the various environments in which bacteria grow
and the environmental specific attachment methods employed by bacteria, a universal
model may not be feasible or appropriate. Of course a prerequisite to the further
development of mathematical models is a better understanding of the mechanisms used
by the commensal intestinal bacteria to attach to various food particles.
One of the key distinguishing differences between biofilms in the GI tract and
biofilms found in various other environments is the fact that the biofilms in the GI tract
adhere to a nutrient providing substratum. The metabolism of complex dietary plant cell
wall components occurs as a result of enzymatic reactions. Given that the hydrolysis of
polysaccharides by some bacterial populations results in the release of polysaccharide
fragments which can be utilized by closely associated bacteria, in this case hydrolysis
must occur extracellularly. It may be that copious amounts of enzymes are released and
diffuse into the food matrix, releasing insoluble cell components. If this is the case, then
the food degradation model described in Chapter 2 may be relevant to the metabolism of
food particles by bacteria in the large bowel. Further studies are needed.
The life-cycle of a bacterial biofilm attached to a food particle in the human
intestinal tract entails (1) irreversible attachment, (2) accumulation and growth, and (3)
detachment. Detachment is dependent upon nutrient availability. Thus in addition, to
understanding the mechanisms of enzymatic hydrolysis by the commensal bacteria,
studies which measure the change in the food matrix and characterize food degradation
as a result of enzymatic hydrolysis are essential.
To summarize, this thesis has provided a number of novel mathematical models
which pertain to food/host for food/microbial interactions. However, there are three
main contributions that should be highlighted. Nutrient transport within bacterial
biofilms has been historically assumed to be isotropic. The work in this thesis has not

P a g e | 176
only provided evidence that nutrient transport within biofilms is anisotropic, but the
mathematical model incorporating the bacterial distribution has clearly demonstrated
that the bacterial distribution has a significant effect on nutrient transport. As mentioned
earlier, mathematical models can provide information that otherwise may be difficult,
expensive or even impossible to determine in vivo. This thesis also provides a
mathematical model which can predict soluble solid loss as a result of acidic hydrolysis
at various pH values, which provides a more accurate description of the in vivo
environment. Lastly, a mathematical model which predicts the co-culture dynamics of
commensal bacteria has been proposed. This model provides a better understanding of
food/microbial interactions. In particular, this model will provide information on the
time it takes the bacterial population to degrade different food components, the
quantities of metabolites produced by the competing/cross-feeding bacteria, and the
expected bacterial concentrations which result from the degradation of the substrate.
On a final note, while the models described here have been applied to particular
environments, it is important to realize that these models are not restricted to any one
environment. For instance the model used to describe the propagation of the acidic
water during gastric digestion (Eqs. 3.1 and 3.2; Section 3.3.2) can also be applied to
describe the sodium chloride concentration in cheese during the brining process (Van
Wey et al Submitted-b). The non-preferential degradation, preferential degradation and
competing/cross-feeding models proposed in Chapter 4 (Eqs. 4.2, 4.3 and 4.5; Sections
4.3.2, 4.4.1 and 4.4.3) have been validated for commensal intestinal bacteria; however,
the models may be applicable to bacteria associated with water treatment systems, river
beds, and food processing plants. And finally, the reaction diffusion model (Eq. 5.15;
Section 5.4.4) proposed in Chapter 5 can be applied to any rate limiting substance
(whether it be sugars, oxygen, or nitrogen) in any environment where biofilms form.

P a g e | 177

P a g e | 178
REFERENCES
Albrecht T, Almond J, Alfa M, Alton GG, Aly R, Asher D et al (1996). In: Baron S (ed). Medical Microbiology, 4th edn. The University of Texas Medical Branch at Galveston: Galveston. Aldous BJ, Franks F, Greer AL (1997). Diffusion of water within an amorphous carbohydrate. J Mater Sci 32: 301-308. Alpkvist E, Klapper I (2007). A multidimensional multispecies continuum model for heterogeneous biofilm development. B Math Biol 69: 765-789. Amaretti A, Bernardi T, Tamburini E, Zanoni S, Lomma M, Matteuzzi D et al (2007). Kinetics and metabolism of Bifidobacterium adolescentis MB 239 growing on glucose, galactose, lactose, and galactooligosaccharides. Appl Environ Microb 73: 3637-3644. Anderl JN, Zahller J, Roe F, Stewart PS (2003). Role of nutrient limitation and stationary-phase existence in Klebsiella pneumoniae biofilm resistance to ampicillin and ciprofloxacin. Antimicrob Agents Ch 47: 1251-1256. Axelsson A, Persson B (1988). Determination of effective diffusion coefficients in calcium alginate gel plates with varying yeast cell content. Appl Biochem Biotech 18: 231-250. Baranyi J, Roberts TA (1994). A dynamic approach to predicting bacterial growth in food. Int J Food Microbiol 23: 277-294. Barken KB, Pamp SJ, Yang L, Gjermansen M, Bertrand JJ, Klausen M et al (2008). Roles of type IV pili, flagellum-mediated motility and extracellular DNA in the formation of mature multicellular structures in Pseudomonas aeruginosa biofilms. Environ Microbiol 10: 2331-2343. Bates DM, Watts DG (2007). Nonlinear Regression Analysis and its Applications. John Wiley & Sons: New York. Bayoudh S, Othmane A, Mora L, Ben Ouada H (2009). Assessing bacterial adhesion using DLVO and XDLVO theories and the jet impingement technique. Colloid Surface B 73: 1-9. Bayston R (1999). Biofilms in medicine and disease: An overview. In: Wimpenny J, Gilbert P, Walker J, Brading M, Bayston R (eds). Biofilms: The Good, The Bad and The Ugly. BioLine: Cardiff. pp 1-6. Begley M, Hill C, Gahan CGM (2006). Bile salt hydrolase activity in probiotics. Appl Environ Microb 72: 1729-1738. Belenguer A, Duncan SH, Calder AG, Holtrop G, Louis P, Lobley GE et al (2006). Two routes of metabolic cross-feeding between Bifidobacterium adolescentis and butyrate-producing anaerobes from the human gut. Appl Environ Microb 72: 3593-3599. Bernalier-Donadille A (2010). Fermentative metabolism by the human gut microbiota. Gastroen Clin Biol 34: S16-S22. Beuling EE, Van Dusschoten D, Lens P, Van Den Heuvel JC, Van As H, Ottengraf SPP (1998). Characterization of the diffusive properties of biofilms using pulsed field gradient-nuclear magnetic resonance. Biotechnol Bioeng 60: 283-291.

P a g e | 179
Beuling EE, van den Heuvel JC, Ottengraf SPP (2000). Diffusion coefficients of metabolites in active biofilms. Biotechnol Bioeng 67: 53-60. Beyenal H, Lewandowski Z (2002). Internal and external mass transfer in biofilms grown at various flow velocities. Biotechnol Prog 18: 55-61. Boessmann M, Staudt C, Neu TR, Horn H, Hempel DC (2003). Investigation and modeling of growth, structure and oxygen penetration in particle supported biofilms. Chem Eng Technol 26: 219-222. Boks NP, Norde W, van der Mei HC, Busscher HJ (2008). Forces involved in bacterial adhesion to hydrophilic and hydrophobic surfaces. Microbiology 154: 3122-3133. Boland T, Latour RA, Sutzenberger FJ (2000). Molecular basis of bacterial adhesion. In: An YH, Friedman RJ (eds). Handbook of Bacterial Adhesion: Principles, Methods and Appllcations. Humana Press Inc.: Totowa. pp 29-41. Boles BR, Thoendel M, Singh PK (2005). Rhamnolipids mediate detachment of Pseudomonas aeruginosa from biofilms. Mol Microbiol 57: 1210-1223. Bornhorst GM, Singh RP (2012). Bolus formation and disintegration during digestion of food carbohydrates. Compr Rev Food Sci F 11: 101-118. Borruel N, Carol M, Casellas F, Antolin M, De Lara F, Espin E et al (2002). Increased mucosal tumour necrosis factor α production in Crohn's disease can be downregulated ex vivo by probiotic bacteria. Gut 51: 659-664. Bouhnik Y, Vahedi K, Achour L, Attar A, Salfati J, Pochart P et al (1999). Short-chain fructo-oligosaccharide administration dose-dependently increases fecal bifidobacteria in healthy humans. J Nutr 129: 113-116. Briandet R, Lacroix-Gueu P, Renault M, Lecart S, Meylheuc T, Bidnenko E et al (2008). Fluorescence correlation spectroscopy to study diffusion and reaction of bacteriophages inside biofilms. Appl Environ Microb 74: 2135-2143. Bridier A, Dubois-Brissonnet F, Boubetra A, Thomas V, Briandet R (2010). The biofilm architecture of sixty opportunistic pathogens deciphered using a high throughput CLSM method. J Microbiol Meth 82: 64-70. Brownawell AM, Caers W, Gibson GR, Kendall CWC, Lewis KD, Ringel Y et al (2012). Prebiotics and the health benefits of fiber: Current regulatory status, future research, and goals. J Nutr 142: 962-974. Bryers JD, Drummond F (1998). Local macromolecule diffusion coefficients in structurally non-uniform bacterial biofilms using fluorescence recovery after photobleaching (FRAP). Biotechnol Bioeng 60: 462-473. Bublin M, Radauer C, Knulst A, Wagner S, Scheiner O, Mackie AR et al (2008). Effects of gastrointestinal digestion and heating on the allergenicity of the kiwi allergens Act d 1, actinidin, and Act d 2, a thaumatin-like protein. Mol Nutr Food Res 52: 1130-1139. Bull JJ, Harcombe WR (2009). Population dynamics constrain the cooperative evolution of cross-feeding. PLoS ONE 4: e4115.

P a g e | 180
Burgess CM, Smid EJ, van Sinderen D (2009). Bacterial vitamin B2, B11 and B12 overproduction: An overview. Int J Food Microbiol 133: 1-7. Cao H, Li X, Jiang B, Sun J, Zhang Y (2004). Evaluation of the influence of extracellular polymeric substances on the mass transport of substrate within multispecies biofilms. Chinese J Chem Eng 12: 590-594. Carbonaro M, Maselli P, Nucara A (2012). Relationship between digestibility and secondary structure of raw and thermally treated legume proteins: A Fourier transform infrared (FT-IR) spectroscopic study. Amino Acids 43: 911-921. Carey MC, Small D, Bliss C (1983). Lipid digestion and absorption. Annu Rev Physiol 45: 651-677. Chamberlain AHL (1992). The role of adsorbed layers in bacterial adhesion. In: Melo LF, Bott TR, Fletcher M, Capdeville B (eds). Biofilms — Science and Technology. Springer Netherlands. pp 59-67. Chang I, Gilbert ES, Eliashberg N, Keasling JD (2003). A three-dimensional, stochastic simulation of biofilm growth and transport-related factors that affect structure. Microbiology 149: 2859-2871. Chassard C, Bernalier-Donadille A (2006). H2 and acetate transfers during xylan fermentation between a butyrate-producing xylanolytic species and hydrogenotrophic microorganisms from the human gut. FEMS Microbiol Lett 254: 116-122. Chen J, Liang RH, Liu W, Li T, Liu CM, Wu SS et al (2013). Pectic-oligosaccharides prepared by dynamic high-pressure microfluidization and their in vitro fermentation properties. Carbohyd Polym 91: 175-182. Chen M-Y, Lee D-J, Tay J-H, Show K-Y (2007). Staining of extracellular polymeric substances and cells in bioaggregates. Appl Microbiol Biot 75: 467-474. Cherbut C (2002). Inulin and oligofructose in the dietary fibre concept. Brit J Nutr 87: S159-162. Chresand TJ, Dale BE, Hanson SL (1988). A stirred bath technique for diffusivity measurements in cell matrices. Biotechnol Bioeng 32: 1029-1036. Coconnier MH, Bernet MF, Kernéis S, Chauvière G, Fourniat J, Servin AL (1993). Inhibition of adhesion of enteroinvasive pathogens to human intestinal Caco-2 cells by Lactobacillus acidophilus strain LB decreases bacterial invasion. FEMS Microbiol Lett 110: 299-305. Conly JM, Stein K, Worobetz L, Rutledge-Harding S (1994). The contribution of vitamin K2 (menaquinones) produced by the intestinal microflora to human nutritional requirements for vitamin K. Am J Gastroenterol 89: 915-923. Cookson AL, Woodward MJ (1999). The role of fimbriae in adhesion of verocytotoxic Escherichia Coli (VTEC). In: Wimpenny J, Gilbert P, Walker J, Brading M, Bayston R (eds). Biofilms: The Good, The Bad and The Ugly. BioLine: Cardiff. pp 73-80. Cookson AL, Cooley WA, Woodward MJ (2002). The role of type 1 and curli fimbriae of shiga toxin-producing Escherichia coli in adherence to abiotic surfaces. Int J Med Microbiol 292: 195-205.

P a g e | 181
Cornu M, Billoir E, Bergis H, Beaufort A, Zuliani V (2011). Modeling microbial competition in food: Application to the behavior of Listeria monocytogenes and lactic acid flora in pork meat products. Food Microbiol 28: 639-647. Costabile A, Kolida S, Klinder A, Gietl E, Buerlein M, Frohberg C et al (2010). A double-blind, placebo-controlled, cross-over study to establish the bifidogenic effect of a very-long-chain inulin extracted from globe artichoke (Cynara scolymus) in healthy human subjects. Brit J Nutr 104: 1007-1017. Costerton JW, Rozee KR, Cheng KJ (1983). Colonization of particulates, mucous, and intestinal tissue. Prog Food Nutr Sci 7: 91-105. Costerton JW, Cheng KJ, Geesey GG, Ladd TI, Nickel JC, Dasgupta M et al (1987). Bacterial biofilms in nature and disease. Annu Rev Microbiol 41: 435-464. Crank J (1975). The Mathematics of Diffusion, Second edn. Oxford University Press: New York. Crittenden R, Laitila A, Forssell P, Matto J, Saarela M, Mattila-Sandholm T et al (2001). Adhesion of bifidobacteria to granular starch and its implications in probiotic technologies. Appl Environ Microb 67: 3469-3475. Cummings JH, Pomare EW, Branch WJ, Naylor CPE, Macfarlane GT (1987). Short chain fatty acids in human large intestine, portal, hepatic and venous blood. Gut 28: 1221-1227. Cummings JH, MacFarlane GT (1997). Role of intestinal bacteria in nutrient metabolism. Clin Nutr 16: 3-11. Danese PN, Pratt LA, Kolter R (2000). Exopolysaccharide production is required for development of Escherichia coli K-12 biofilm architecture. J Bacteriol 182: 3593-3596. Davenport HW (1982). Physiology of the Digestive Tract, 5th edn. Year Book Medical Publishers, Inc.: Chicago. Davey ME, Caiazza NC, O'Toole GA (2003). Rhamnolipid surfactant production affects biofilm architecture in Pseudomonas aeruginosa PAO1. J Bacteriol 185: 1027-1036. Davey MJ, Landman KA, McGuinness MJ, Jin HN (2002). Mathematical modeling of rice cooking and dissolution in beer production. AIChE J 48: 1811-1826. Davies DG, Parsek MR, Pearson JP, Iglewski BH, Costerton JW, Greenberg EP (1998). The involvement of cell-to-cell signals in the development of a bacterial biofilm. Science 280: 295-298. De Beer D, Stoodley P, Lewandowski Z (1996). Liquid flow and mass transport in heterogeneous biofilms. Water Res 30: 2761-2765. De Beer D, Stoodley P, Lewandowski Z (1997). Measurement of local diffusion coefficients in biofilms by microinjection and confocal microscopy. Biotechnol Bioeng 53: 151-158. De Filippo C, Cavalieri D, Di Paola M, Ramazzotti M, Poullet JB, Massart S et al (2010). Impact of diet in shaping gut microbiota revealed by a comparative study in children from Europe and rural Africa. Proc Natl Acad Sci USA 107: 14691-14696.

P a g e | 182
De Kerchove AJ, Elimelech M (2008). Calcium and magnesium cations enhance the adhesion of motile and nonmotile Pseudomonas aeruginosa on alginate films. Langmuir 24: 3392-3399. De Ruyter PGGA, Kuipers OP, De Vos WM (1996). Controlled gene expression systems for Lactococcus lactis with the food-grade inducer nisin. Appl Environ Microbiol 62: 3662-3667. De Vuyst L, Leroy F (2011). Cross-feeding between bifidobacteria and butyrate-producing colon bacteria explains bifdobacterial competitiveness, butyrate production, and gas production. Int J Food Microbiol 149: 73-80. Degnan BA, Macfarlane GT (1995). Arabinogalactan utilization in continuous cultures of Bifidobacterium longum: Effect of co-culture with Bacteroides thetaiotaomicron. Anaerobe 1: 103-112. Dereli RK, Ersahin ME, Ozgun H, Ozturk I, Jeison D, van der Zee F et al (2012). Potentials of anaerobic membrane bioreactors to overcome treatment limitations induced by industrial wastewaters. Bioresource Technol 122: 160-170. Donlan RM (2002). Biofilms: Microbial life on surfaces. Emerg Infect Dis 8: 881-890. Duncan SH, Louis P, Flint HJ (2004). Lactate-utilizing bacteria, isolated from human feces, that produce butyrate as a major fermentation product. Appl Environ Microb 70: 5810-5817. Dunne WM, Jr. (2002). Bacterial adhesion: Seen any good biofilms lately? Clin Microbiol Rev 15: 155-166. Eberl HJ, Parker DF, Vanloosdrecht MCM (2001). A new deterministic spatio-temporal continuum model for biofilm development. J Theor Med 3: 161-175. Epstein N (1989). On tortuosity and the tortuosity factor in flow and diffusion through porous media. Chem Eng Sci 44: 777-779. Eyssen H (1973). Role of the gut microflora in metabolism of lipids and sterols. Proc Nutr Soc 32: 59-63. Falony G, Vlachou A, Verbrugghe K, De Vuyst L (2006). Cross-feeding between Bifidobacterium longum BB536 and acetate-converting, butyrate-producing colon bacteria during growth on oligofructose. Appl Environ Microbiol 72: 7835-7841. Falony G (2009). Butyrogenic effect of inulin-type fructans: Kinetics of cross-feeding between colon bacteria. PhD thesis, Vrije Universiteit Brussel, Brussels. Falony G, Calmeyn T, Leroy F, De Vuyst L (2009a). Coculture fermentations of Bifidobacterium species and Bacteroides thetaiotaomicron reveal a mechanistic insight into the prebiotic effect of inulin-type fructans. Appl Environ Microb 75: 2312-2319. Falony G, Lazidou K, Verschaeren A, Weckx S, Maes D, De Vuyst L (2009b). In vitro kinetic analysis of fermentation of prebiotic inulin-type fructans by Bifidobacterium species reveals four different phenotypes. Appl Environ Microb 75: 454-461. Fan LS, Leyva-Ramos R, Wisecarver KD, Zehner BJ (1990). Diffusion of phenol through a biofilm grown on activated carbon particles in draft-tube three-phase fluidized-bed bioreactor. Biotechnol Bioeng 35: 279-286.

P a g e | 183
Ferrua MJ, Singh RP (2010). Modeling the fluid dynamics in a human stomach to gain insight of food digestion. J Food Sci 75: R151-R162. Ferrua MJ, Kong F, Singh RP (2011). Computational modeling of gastric digestion and the role of food material properties. Trends Food Sci Technol 22: 480-491. Flegal KM, Carroll MD, Ogden CL, Curtin LR (2010). Prevalence and trends in obesity among US adults, 1999-2008. JAMA 303: 235-241. Flemming H, Neu T, Wozniak D (2007). The EPS matrix: The "house of biofilm cells". J Bacteriol 189: 7945 - 7947. Flemming HC, Leis A, Strathmann M, Leon-Morales F (2005). The matrix reloaded - An interactive milieu. In: McBain A, Allison D, Pratten J, Spratt D, Upton M, Verran J (eds). Biofilms: Persistence and Ubiquity. The Biofilm Club: Manchester. pp 67-81. Fletcher M (1988). Attachment of Pseudomonas fluorescens to glass and influence of electrolytes on bacterium-substratum separation distance. J Bacteriol 170: 2027-2030. Flint HJ, Scott KP, Louis P, Duncan SH (2012). The role of the gut microbiota in nutrition and health. Nat Rev Gastroenterol 9: 577-589. Franck A (2002). Technological functionality of inulin and oligofructose. Brit J Nutr 87: S287-291. Furrie E, Macfarlane S, Kennedy A, Cummings JH, Walsh SV, O'Neil DA et al (2005). Synbiotic therapy (Bifidobacterium longum/Synergy 1) initiates resolution of inflammation in patients with active ulcerative colitis: A randomised controlled pilot trial. Gut 54: 242-249. Gibson GR, Beatty ER, Wang X, Cummings JH (1995). Selective stimulation of bifidobacteria in the human colon by oligofructose and inulin. Gastroenterology 108: 975-982. Gilks WR, Richardson A, Spiegelhalter DJ (1996). Markov Chain Monte Carlo in Practice. Chapman & Hall: London. Ginter E, Simko V (2010). Diabetes type 2 pandemic in 21st century. Bratisl Med J 111: 134-137. Giroux HJ, Constantineau S, Fustier P, Champagne CP, St-Gelais D, Lacroix M et al (2013). Cheese fortification using water-in-oil-in-water double emulsions as carrier for water soluble nutrients. Int Dairy J 29: 107-114. Glancey A, McBain AJ, Gilbert P (2007). Intestinal biofilms in health and neoplastic disease. In: Gilbert P, Allison D, Brading M, Pratten J, Spratt D, Upton M (eds). Biofilms: Coming of Age. The Biofilm Club: Manchester. pp 107-117. Go PMNYH, Van Dieijen-Visser MP, Davies BI, Lens J, Brombacher PJ (1988). Microbial flora and bile acid metabolism in patients with an ileal reservoir. Scand J Gastroentero 23: 229-236. Goel P, Sneyd J, Friedman A (2006). Homogenization of the cell cytoplasm: The calcium bidomain equations. Multiscale Model Sim 5: 1045-1062. Goetze O, Steingoetter A, Menne D, Van Der Voort IR, Kwiatek MA, Boesiger P et al (2007). The effect of macronutrients on gastric volume responses and gastric emptying in humans: A

P a g e | 184
magnetic resonance imaging study. American Journal of Physiology - Gastrointestinal and Liver Physiology. pp G11-G17. Goller CC, Romeo T (2008). Environmental Influences on Biofilm Development. In: Romeo T (ed). Bacterial Biofilms. Springer: Berlin. pp 37-66. Gomi Y-I, Fukuoka M, Takeuchi S, Mihori T, Watanabe H (1996). Effect of temperature and moisture content on water diffusion coefficients in rice starch/water mictures. Food Sci Technol Int 2: 171-173. Gomi Y-I, Fukuoka M, Mihori T, Watanabe H (1998). The rate of starch gelatinization as observed by PFG-NMR measurement of water diffusivity in rice starch/water mixtures. J Food Eng 36: 359-369. Goulter RM, Gentle IR, Dykes GA (2009). Issues in determining factors influencing bacterial attachment: A review using the attachment of Escherichia coli to abiotic surfaces as an example. Lett Appl Microbiol 49: 1-7. Granato D, Branco GF, Nazzaro F, Cruz AG, Faria JA (2010). Functional foods and nondairy probiotic food development: Trends, concepts, and products. Compr Rev Food Sci F 9: 292-302. Grimshaw KEC, King RM, Nordlee JA, Hefle SL, Warner JO, Hourihane JOB (2003). Presentation of allergen in different food preparations affects the nature of the allergic reaction – A case series. Clin Exp Allergy 33: 1581-1585. Gristina A (2004). Biomaterial-centered infection: Microbial adhesion versus tissue integration. Clin Orthop Relat R: 4-12. Gristina AG (1987). Biomaterial-centered infection: Microbial adhesion versus tissue integration. Science 237: 1588-1595. Guarner F, Malagelada JR (2003). Gut flora in health and disease. Lancet 361: 512-519. Guinee TP, Fox PF (1983). Sodium chloride and moisture changes in Romano-type cheese during salting. J Dairy Res 50: 511-518. Guiot E, Georges P, Brun A, Fontaine-Aupart MP, Bellon-Fontaine MN, Briandet R (2002). Heterogeneity of diffusion inside microbial biofilms determined by fluorescence correlation spectroscopy under two-photon excitation. Photochem Photobio 75: 570-578. Guo MR, Fox PF, Flynn A, Kindstedt PS (1995). Susceptibility of β-lactoglobulin and sodium caseinate to proteolysis by pepsin and trypsin. J Dairy Sci 78: 2336-2344. Hamilton JP, Xie G, Raufman J-P, Hogan S, Griffin TL, Packard CA et al (2007). Human cecal bile acids: Concentration and spectrum. Am J Physiol Gastrointest Liver Physiol 293: G256-G263. Hammer BK, Bassler BL (2003). Quorum sensing controls biofilm formation in Vibrio cholerae. Mol Microbiol 50: 101-104. Hang PT, Brindley GW (1970). Methylene blue absorption by clay minerals. Determination of surface areas and cation exchange capacities (clay-organic studies XVIII). Clay Clay Miner 18: 203-212.

P a g e | 185
Hasty DL, Ofek I, Courtney HS, Doyle RJ (1992). Multiple adhesins of streptococci. Infect Immun 60: 2147-2152. Hermanowicz SW (2001). A simple 2D biofilm model yields a variety of morphological features. Math Biosci 169: 1-14. Hermansson M (1999). The DLVO theory in microbial adhesion. Colloid Surface B 14: 105-119. Hicks S, Frankel G, Kaper JB, Dougan G, Phillips AD (1998). Role of intimin and bundle-forming pili in enteropathogenic Escherichia coli adhesion to pediatric intestinal tissue in vitro. Infect Immun 66: 1570-1578. Hinson RK, Kocher WM (1996). Model for effective diffusivities in aerobic biofilms. J Environ Eng 122: 1023-1030. Ho CS, Ju L-K (1988). Effects of microorganisms on effective oxygen diffusion coefficients and solubilities in fermentation media. Biotechnol Bioeng 32: 313-325. Hooper LV, Midwedt T, Gordon JI (2002). How host-microbial interactions shape the nutrient environment of the mammalian intestine. Annu Rev Nutr 22: 283-307. Hooper LV, MacPherson AJ (2010). Immune adaptations that maintain homeostasis with the intestinal microbiota. Nat Rev Immunol 10: 159-169. Hori K, Matsumoto S (2010). Bacterial adhesion: From mechanism to control. Biochem Eng J 48: 424-434. Horn H, Morgenroth E (2006). Transport of oxygen, sodium chloride, and sodium nitrate in biofilms. Chem Eng Sci 61: 1347-1356. Hosseini E, Grootaert C, Verstraete W, Van de Wiele T (2011). Propionate as a health-promoting microbial metabolite in the human gut. Nutr Rev 69: 245-258. Ishikawa T, Sato T, Mohit G, Imai Y, Yamaguchi T (2011). Transport phenomena of microbial flora in the small intestine with peristalsis. J Theor Biol 279: 63-73. Jacobs DM, Gaudier E, van Duynhoven J, Vaughan EE (2009). Non-digestible food ingredients, colonic microbiota and the impact on gut health and immunity: A role for metabolomics. Curr Drug Metab 10: 41-54. Janakiraman V, Englert D, Jayaraman A, Baskaran H (2009). Modeling growth and quorum sensing in biofilms grown in microfluidic chambers. Ann Biomed Eng 37: 1206-1216. Janssen M, Geeraerd AH, Logist F, De Visscher Y, Vereecken KM, Debevere J et al (2006). Modelling Yersinia enterocolitica inactivation in coculture experiments with Lactobacillus sakei as based on pH and lactic acid profiles. Int J Food Microbiol 111: 59-72. Jass J, Emerton ME, Robinson GB, Simpson HARW (1997). Adhesion of bone matrix cells and Staphylococcus epidermidis to surfaces. In: Wimpenny J, Handley P, Gilbert P, Lappin-Scott H, Jones m (eds). Biofilms: Community Interactions and Control. BioLine: Cardiff. pp 55-62. Jenkinson HF, Nobbs AH, Jakubovics NS (2003). Adhesin-regulated biofilm communites. In: McBain A, Allison D, Brading M, Rickard A, Verran J, Walker J (eds). Biofilm Communities: Order from Chaos? BioLine: Cardiff. pp 97-103.

P a g e | 186
Jiménez E, Fernández L, Marín ML, Martín R, Odriozola JM, Nueno-Palop C et al (2005). Isolation of commensal bacteria from umbilical cord blood of healthy neonates born by cesarean section. Curr Microbiol 51: 270-274. Jiménez E, Delgado S, Fernández L, García N, Albújar M, Gómez A et al (2008a). Assessment of the bacterial diversity of human colostrum and screening of staphylococcal and enterococcal populations for potential virulence factors. Res Microbiol 159: 595-601. Jiménez E, Marín ML, Martín R, Odriozola JM, Olivares M, Xaus J et al (2008b). Is meconium from healthy newborns actually sterile? Res Microbiol 159: 187-193. Jones ML, Chen H, Ouyang W, Metz T, Prakash S (2004). Microencapsulated genetically engineered Lactobacillus plantarum 80 (pCBH1) for bile acid deconjugation and its implication in lowering cholesterol. J Biomed Biotechnol 2004: 61-69. Kamerman DK, Wilkinson MHF: In silico modelling of the human intestinal microflora. International Conference on Computational Science (ICCS). Springer-Verlag 2002. Kanmani P, Satish Kumar R, Yuvaraj N, Paari KA, Pattukumar V, Arul V (2013). Probiotics and its functionally valuable products-A review. Crit Rev Food Sci 53: 641-658. Kapellos GE, Alexiou TS, Payatakes AC (2007). A multiscale theoretical model for diffusive mass transfer in cellular biological media. Math Biosci 210: 177-237. Katsikogianni M, Missirlis YF (2004). Concise review of mechanisms of bacterial adhesion to biomaterials and of techniques used in estimating bacteria-material interactions. Eur Cells Mat 8: 37-57. Keener J, Sneyd J (1998). Mathematical Physiology. Springer-Verlag: New York. Koch KL, Bitar KN, Fortunato JE (2012). Tissue engineering for neuromuscular disorders of the gastrointestinal tract. World J Gastroentero 18: 6918-6925. Kong F, Singh RP (2008). A model stomach system to investigate disintegration kinetics of solid foods during gastric digestion. J Food Sci 73: E202-E210. Kong F, Singh RP (2009a). Digestion of raw and roasted almonds in simulated gastric environment. Food Biophys 4: 365-377. Kong F, Singh RP (2009b). Modes of disintegration of solid foods in simulated gastric environment. Food Biophys 4: 180-190. Kong F, Oztop MH, Singh RP, McCarthy MJ (2011). Physical changes in white and brown rice during simulated gastric digestion. J Food Sci 76: E450-E457. Kong F, Singh RP (2011). Solid loss of carrots during simulated gastric digestion. Food Biophys 6: 84-93. Koo H, Xiao J, Klein MI, Jeon JG (2010). Exopolysaccharides produced by Streptococcus mutans glucosyltransferases modulate the establishment of microcolonies within multispecies biofilms. J Bacteriol 192: 3024-3032. Kreft JU, Picioreanu C, Wimpenny JWT, Van Loosdrecht MCM (2001). Individual-based modelling of biofilms. Microbiology 147: 2897-2912.

P a g e | 187
Krishna R, Wesselingh JA (1997). The Maxwell-Stefan approach to mass transfer. Chem Eng Sci 52: 861-911. Kurokawa K, Itoh T, Kuwahara T, Oshima K, Toh H, Toyoda A et al (2007). Comparative metagenomics revealed commonly enriched gene sets in human gut microbiomes. DNA Res 14: 169-181. Lakhan SE, Kirchgessner A (2010). Gut inflammation in chronic fatigue syndrome. Nutr Metab 7: 1-10. Laspidou C, Rittmann B (2002). A unified theory for extracellular polymerica substances, soluble microbial products, and active and inert biomass. J Water Res 36: 2711 - 2720. Lebeer S, De Keersmaecker SCJ, Verhoeven TLA, Fadda AA, Marchal K, Vanderleyden J (2007). Functional analysis of luxS in the probiotic strain Lactobacillus rhamnosus GG reveals a central metabolic role important for growth and biofilm formation. J Bacteriol 189: 860-871. Leitch ECM, Walker AW, Duncan SH, Holtrop G, Flint HJ (2007). Selective colonization of insoluble substrates by human faecal bacteria. Environ Microbiol 9: 667-679. Lentle RG, Hemar Y, Hall CE, Stafford KJ (2005). Periodic fluid extrusion and models of digesta mixing in the intestine of a herbivore, the common brushtail possum (Trichosurus vulpecula). J Comp Physiol [B] 175: 337-347. Lentle RG, Janssen PWM (2008). Physical characteristics of digesta and their influence on flow and mixing in the mammalian intestine: A review. J Comp Physiol [B] 178: 673-690. Lentle RG, Janssen PWM (2010). Manipulating digestion with foods designed to change the physical characteristics of digesta. Crit Rev Food Sci 50: 130-145. Lewandowski Z (2000). Notes on biofilm porosity. Water Res 34: 2620-2624. Ley RE, Turnbaugh PJ, Klein S, Gordon JI (2006). Microbial ecology: Human gut microbes associated with obesity. Nature 444: 1022-1023. Li G, Wang Y, He R, Cao X, Lin C, Meng T (2009). Numerical simulation of predicting and reducing solid particle erosion of solid-liquid two-phase flow in a choke. Pet Sci 6: 91-97. Libicki SB, Salmon PM, Robertson CR (1988). Effective diffusive permeability of a nonreacting solute in microbial cell aggregates. Biotechnol Bioeng 32: 68-85. Lievin V, Peiffer I, Hudault S, Rochat F, Brassart D, Neeser JR et al (2000). Bifidobacterium strains from resident infant human gastrointestinal microflora exert antimicrobial activity. Gut 47: 646-652. Liu X, Lim JY, Donahue HJ, Dhurjati R, Mastro AM, Vogler EA (2007a). Influence of substratum surface chemistry/energy and topography on the human fetal osteoblastic cell line hFOB 1.19: Phenotypic and genotypic responses observed in vitro. Biomaterials 28: 4535-4550. Liu Y, Strauss J, Camesano TA (2007b). Thermodynamic investigation of Staphylococcus epidermidis interactions with protein-coated substrata. Langmuir 23: 7134-7142. Long G, Zhu P, Shen Y, Tong M (2009). Influence of extracellular polymeric substances (EPS) on deposition kinetics of bacteria. Environ Sci Technol 43: 2308-2314.

P a g e | 188
Lucas JSA, Cochrane SA, Warner JO, Hourihane JOB (2008). The effect of digestion and pH on the allergenicity of kiwifruit proteins. Pediatr Allergy Immu 19: 392-398. Luckey TD (1972). Introduction to intestinal microecology. Am J Clin Nutr 25: 1292-1294. MacDonald TT, Monteleone G (2005). Immunity, inflammation, and allergy in the gut. Science 307: 1920-1925. Macfarlane GT, Cummings JH (1991). The colonic flora, fermentation and large bowel digestive function. In: Philips SF, Pemberton JH, Shorter RG (eds). The Large Intestine: Physiology, Pathophysiology, and Disease. Raven Press, Ltd.: New York. pp 51-92. Macfarlane GT, Gibson GR, Cummings JH (1992). Comparison of fermentation reactions in different regions of the human colon. J Appl Bacteriol 72: 57-64. Macfarlane GT, Macfarlane S (2007). Models for intestinal fermentation: Association between food components, delivery systems, bioavailability and functional interactions in the gut. Curr Opin Biotechnol 18: 156-162. Macfarlane GT, Steed H, Macfarlane S (2008). Bacterial metabolism and health-related effects of galacto-oligosaccharides and other prebiotics. J Appl Microbiol 104: 305-344. Macfarlane GT, Blackett KL, Nakayama T, Steed H, Macfarlane S (2009). The gut microbiota in inflammatory bowel disease. Curr Pharm Design 15: 1528-1536. Macfarlane S, McBain AJ, Macfarlane GT (1997). Consequences of biofilm and sessile growth in the large intestine. Adv Dent Res 11: 59-68. Macfarlane S, Macfarlane GT (2006). Composition and metabolic activities of bacterial biofilms colonizing food residues in the human gut. Appl Environ Microbiol 72: 6204-6211. Macfarlane S, Dillon JF (2007). Microbial biofilms in the human gastrointestinal tract. J Appl Microbiol 102: 1187-1196. Madhu AN, Giribhattanavar P, Narayan MS, Prapulla SG (2009). Probiotic lactic acid bacterium from kanjika as a potential source of vitamin B12: Evidence from LC-MS, immunological and microbiological techniques. Biotechnol Lett 32: 1-4. Mah T-FC, O'Toole GA (2001). Mechanisms of biofilm resistance to antimicrobial agents. Trends Microbiol 9: 34-39. Malagelada JR, Longstreth GF, Summerskill WHJ, Go VLW (1976). Measurement of gastric functions during digestion of ordinary solid meals in man. Gastroenterology 70: 203-210. Marciani L, Gowland PA, Fillery-Travis A, Manoj P, Wright J, Smith A et al (2001). Assessment of antral grinding of a model solid meal with echo-planar imaging. Am J Physiol 280: G844-G849. Marteau P, Pochart P, Dore J, Bera-Maillet C, Bernalier A, Corthier G (2001). Comparative study of bacterial groups within the human cecal and fecal microbiota. Appl Environ Microb 67: 4939-4942. Marvasi M, Visscher PT, Casillas Martinez L (2010). Exopolymeric substances (EPS) from Bacillus subtilis : Polymers and genes encoding their synthesis. FEMS Microbiol Lett 313: 1-9.

P a g e | 189
Maxwell JC (1892). A Treatise on Electricity and Magnetism, Third edn, vol. 1. Clarendon Press: Oxford. McLean JS, Ona ON, Majors PD (2008). Correlated biofilm imaging, transport and metabolism measurements via combined nuclear magnetic resonance and confocal microscopy. ISME J 2: 121-131. Meyer D, Stasse-wolthuis M (2009). The bifidogenic effect of inulin and oligofructose and its consequences for gut health. Euro J Clin Nutr 63: 1277-1289. Mirande C, Kadlecikova E, Matulova M, Capek P, Bernalier-Donadille A, Forano E et al (2010). Dietary fibre degradation and fermentation by two xylanolytic bacteria Bacteroides xylanisolvens XB1AT and Roseburia intestinalis XB6B4 from the human intestine. J Appl Microbiol 109: 451-460. Mishellany-Dutour A, Peyron MA, Croze J, François O, Hartmann C, Alric M et al (2011). Comparison of food boluses prepared in vivo and by the AM2 mastication simulator. Food Qual Prefer 22: 326-331. Missirlis YF, Katsikogianni M (2007). Theoretical and experimental approaches of bacteria-biomaterial interactions. Materwiss Werksttech 38: 983-994. Mitchell DA, Do DD, Greenfield PF, Doelle HW (1991). A semimechanistic mathematical model for growth of Rhizopus oligosporus in a model solid-state fermentation system. Biotechnol Bioeng 38: 353-362. Mlobeli NT (1996). Batch culture stidies of Bifidobacterium bifidum. Master thesis, Massey University, Palmerston North. Mlobeli NT, Gutierrez NA, Maddox IS (1998). Physiology and kinetics of Bifidobacterium bifidum during growth on different sugars. Appl Microbiol Biot 50: 125-128. Mota M, Teixeira JA, Yelshin A (2002). Immobilized particles in gel matrix-type porous media. Nonhomogeneous cell distribution. Biotechnol Prog 18: 807-814. Mounier J, Monnet C, Vallaeys T, Arditi R, Sarthou AS, Hélias A et al (2008). Microbial interactions within a cheese microbial community. Appl Environ Microb 74: 172-181. Muñoz-Quezada S, Bermudez-Brito M, Chenoll E, Genovés S, Gomez-Llorente C, Plaza-Diaz J et al (2013). Competitive inhibition of three novel bacteria isolated from faeces of breast milk-fed infants against selected enteropathogens. Brit J Nutr 109: S63-S69. Muñoz-Tamayo R, Laroche B, Walter T, Doré J, Leclerc M (2010). Mathematical modelling of carbohydrate degradation by human colonic microbiota. J Theor Biol 266: 189-201. Muñoz-Tamayo R, Laroche B, Walter É, Doré J, Duncan SH, Flint HJ et al (2011). Kinetic modelling of lactate utilization and butyrate production by key human colonic bacterial species. FEMS Microbiol Ecol 76: 615-624. Nepelska M, Cultrone A, Béguet-Crespel F, Le Roux K, Doré J, Arulampalam V et al (2012). Butyrate produced by commensal bacteria potentiates phorbol esters induced AP-1 response in human intestinal epithelial cells. PLoS ONE 7: e52869.

P a g e | 190
Neu TR (1996). Significance of bacterial surface-active compounds in interaction of bacteria with interfaces. Microbiol Rev 60: 151-166. Nielsen PH, Jahn A (1999). Extraction of EPS. In: Wingender J, Neu TR, Flemming H-C (eds). Microbial Extracellular Polymeric Substances. Springer: Berlin. pp 49-72. O'Keefe SJD (2008). Nutrition and colonic health: The critical role of the microbiota. Curr Opin Gastroen 24: 51-58. O'May GA, Reynolds N, Smith AR, Kennedy A, Macfarlane GT (2005). Effect of pH and antibiotics on microbial overgrowth in the stomachs and duodena of patients undergoing percutaneous endoscopic gastrostomy feeding. J Clin Microbiol 43: 3059-3065. O'Toole PW, Claesson MJ (2010). Gut microbiota: Changes throughout the lifespan from infancy to elderly. Int Dairy J 20: 281-291. Ölveczky BP, Verkman AS (1998). Monte Carlo analysis of obstructed diffusion in three dimensions: Application to molecular diffusion in organelles. Biophys J 74: 2722-2730. Oubekka SD, Briandet R, Waharte F, Fontaine-Aupart MP, Steenkeste K: Image-based fluorescence recovery after photobleaching (FRAP) to dissect vancomycin diffusion-reaction processes in Staphylococcus aureus biofilms. Clinical and Biomedical Spectorscopy and Imaging II; Munich. 2011. Özdemir Ö (2010). Various effects of different probiotic strains in allergic disorders: An update from laboratory and clinical data. Clin Exp Immunol 160: 295-304. Panico S, Mattiello A (2010). Epidemiology of cardiovascular diseases in women in Europe. Nutr Metab Cardiovasc Dis 20: 379-385. Pashley RM, McGuiggan PM, Ninham BW, Evans DF (1985). Attractive forces between uncharged hydrophobic surfaces: Direct measurements in aqueous solution. Science 229: 1088-1089. Payne MR, Morison KR (1999). A multi-component approach to salt and water diffusion in cheese. Int Dairy J 9: 887-894. Pell RJ, Kowalski BR (1991). A test of three fitting criteria for multiresponse non-linear modeling. J Chemometr 5: 375-387. Penders J, Thijs C, Vink C, Stelma FF, Snijders B, Kummeling I et al (2006). Factors influencing the composition of the intestinal microbiota in early infancy. Pediatrics 118: 511-521. Perez PF, Doré J, Leclerc M, Levenez F, Benyacoub J, Serrant P et al (2007). Bacterial imprinting of the neonatal immune system: Lessons from maternal cells? Pediatrics 119. Peters BM, Jabra-Rizk MA, O'May GA, William Costerton J, Shirtliff ME (2012). Polymicrobial interactions: Impact on pathogenesis and human disease. Clin Microbiol Rev 25: 193-213. Peyron MA, Mishellany A, Woda A (2004). Particle size distribution of food boluses after mastication of six natural foods. J Dent Res 83: 578-582.

P a g e | 191
Phillips RE (1968). Water diffusivity of germinating soybean, corn, and cotton seed. Agron J 60: 568-571. Phillips RJ (2000). A hydrodynamic model for hindered diffusion of proteins and micelles in hydrogels. Biophys J 79: 3350-3353. Picioreanu C, Kreft JU, Van Loosdrecht MCM (2004). Particle-based multidimensional multispecies biofilm model. Appl Environ Microb 70: 3024-3040. Poschet F, Vereecken KM, Geeraerd AH, Nicolaï BM, Van Impe JF (2005). Analysis of a novel class of predictive microbial growth models and application to coculture growth. Int J Food Microbiol 100: 107-124. Probert HM, Gibson GR (2002). Bacterial biofilms in the human gastrointestinal tract. Curr Iss Intest Microbiol 3: 23-27. Rahman NK, Bakar MZA, Hekarl Uzir M, Kamaruddin AH (2009). Modelling on the effect of diffusive and convective substrate transport for biofilm. Math Biosci 218: 130-137. Rajagopalan S, Rockstraw DA, Munson-McGee SH (1997). Modeling substrate particle degradation by Bacillus coagulans biofilm. Bioresource Technol 61: 175-183. Ramnani P, Gaudier E, Bingham M, Van Bruggen P, Tuohy KM, Gibson GR (2010). Prebiotic effect of fruit and vegetable shots containing Jerusalem artichoke inulin: A human intervention study. Brit J Nutr 104: 233-240. Rao AV, Bested A, Beaulne T, Katzman M, Iorio C, Berardi J et al (2009). A randomized, double-blind, placebo-controlled pilot study of a probiotic in emotional symptoms of chronic fatigue syndrome. Gut Pathogens 1: 6. Rasmussen K, Lewandowski Z (1998). Microelectrode measurements of local mass transport rates in heterogeneous biofilms. Biotechnol Bioeng 59: 302-309. Renslow RS, Majors PD, McLean JS, Fredrickson JK, Ahmed B, Beyenal H (2010). In situ effective diffusion coefficient profiles in live biofilms using pulsed-field gradient nuclear magnetic resonance. Biotechnol Bioeng 106: 928-937. Rhoads DD, Wolcott RW, Cutting KF, Percival SL (2007). Evidenc of Biofilms in Wounds and Potential Ramifications. In: Gilbert P, Allison D, Brading M, Pratten J, Spratt D, Upton M (eds). Biofilms: Coming of Age. The Biofilm Club: Manchester. pp 131-143. Ridlon JM, Kang D-J, Hylemon PB (2006). Bile salt biotransformations by human intestinal bacteria. J Lipid Res 47: 241-259. Rossi M, Corradini C, Amaretti A, Nicolini M, Pompei A, Zanoni S et al (2005). Fermentation of fructooligosaccharides and inulin by bifidobacteria: A comparative study of pure and fecal cultures. Appl Environ Microb 71: 6150-6158. Rüdiger SG, Carlén A, Meurman JH, Kari K, Olsson J (2002). Dental biofilms at healthy and inflamed gingival margins. J Clin Periodontol 29: 524-530. Saguy IS, Marabi A, Wallach R (2005). New approach to model rehydration of dry food particulates utilizing principles of liquid transport in porous media. Trends Food Sci Technol 16: 495-506.

P a g e | 192
Sandiford S, Tagg J, Upton M (2007). Antimicrobial peptides as agents to combat coagulase megatie Stapylococcal biofilms. In: Gilbert P, Allison D, Brading M, Pratten J, Spratt D, Upton M (eds). Biofilms: Coming of Age. The Biofilm Club: Manchester. pp 145-156. Satokari R, Grönroos T, Laitinen K, Salminen S, Isolauri E (2009). Bifidobacterium and Lactobacillus DNA in the human placenta. Lett Appl Microbiol 48: 8-12. Saulnier DM, Kolida S, Gibson GR (2009). Microbiology of the human intestinal tract and approaches for its dietary modulation. Curr Pharm Design 15: 1403-1414. Saxton MJ (1987). Lateral diffusion in an archipelago. The effect of mobile obstacles. Biophys J 52: 989-997. Saxton MJ (1994). Anomalous diffusion due to obstacles: A Monte Carlo study. Biophys J 66: 394-401. Schneider RP (1996). Conditioning film-induced modification of substratum physicochemistry - Analysis by contact Angles. J Colloid Interface Sci 182: 204-213. Sela DA, Price NPJ, Mills DA (2010). Carbohydrate metabolism of the bifidobacteria. In: Mayo B, van Sinderen D (eds). Bifidobacteria: Genomics and Molecular Aspecs. Caister Academic Press: Norfolk. pp 46-48. Selman JD, Rice P, Abdul-Rezzak RK (1983). A study of the apparent diffusion coefficients for solute losses from carrot tissue during blanching in water. J Food Technol 18: 427-440. Sharp MD, McMahon DJ, Broadbent JR (2008). Comparative evaluation of yogurt and low-fat cheddar cheese as delivery media for probiotic Lactobacillus casei. J Food Sci 73: M375-M377. Shipman JA, Cho KH, Siegel HA, Salyers AA (1999). Physiological characterization of SusG, an outer membrane protein essential for starch utilization by Bacteroides thetaiotaomicron. J Bacteriol 181: 7206-7211. Shipman JA, Berleman JE, Salyers AA (2000). Characterization of four outer membrane proteins involved in binding starch to the cell surface of Bacteroides thetaiotaomicron. J Bacteriol 182: 5365-5372. Shorten PR, Membré JM, Pleasants AB, Kubaczka M, Soboleva TK (2004). Partitioning of the variance in the growth parameters of Erwinia carotovora on vegetable products. Int J Food Microbiol 93: 195-208. Shorten PR, Sneyd J (2009). A mathematical analysis of obstructed diffusion within skeletal muscle. Biophys J 96: 4764-4778. Siegel JA, Urbain JL, Adler LP, Charkes ND, Maurer AH, Krevsky B et al (1988). Biphasic nature of gastric emptying. Gut 29: 85-89. Singh H, Ye A (2013). Structural and biochemical factors affecting the digestion of protein-stabilized emulsions. Curr Opin Colloid In 18: 360-370. Staudt C, Horn H, Hempel DC, Neu TR (2004). Volumetric measurements of bacterial cells and extracellular polymeric substance glycoconjugates in biofilms. Biotechnol Bioeng 88: 585-592. Stoodley P, DeBeer D, Lewandowski Z (1994). Liquid flow in biofilm systems. Appl Environ Microb 60: 2711-2716.

P a g e | 193
Suau A, Bonnet R, Sutren M, Godon J-J, Gibson GR, Collins MD et al (1999). Direct analysis of genes encoding 16S rRNA from complex communities reveals many novel molecular species within the human gut. Appl Environ Microbiol 65: 4799-4807. Suslina TA (2005). On homogenization for a periodic elliptic operator in a strip. St Petersburg Math J 16: 237-257. Sutherland IW (2001a). The biofilm matrix - An immobilized but dynamic microbial environment. Trends Microbiol 9: 222-227. Sutherland IW (2001b). Biofilm exopolysaccharides: A strong and sticky framework. Microbiology 147: 3-9. Syarief AM, Gustafson RJ, Morey RV (1987). Moistrue diffusion coefficients for yellow-dent corn components. T Am Soc Agr Eng 30: 522-528. Tallon MJ (2009). Probiotics success strategies in food and drinks. Business Insights Ltd. Tannock GW, Ghazally S, Walter J, Loach D, Brooks H, Cook G et al (2005). Ecological behavior of Lactobacillus reuteri 100-23 is affected by mutation of the luxS gene. Appl Environ Microb 71: 8419-8425. Thomas LA, Veysey MJ, French G, Hylemon PB, Murphy GM, Dowling RH (2001). Bile acid metabolism by fresh human colonic contents: A comparison of caecal versus faecal samples. Gut 49: 835-842. Toms AP, Farghal A, Kasmai B, Bagnall A, Malcolm PN (2011). Physiology of the small bowel: A new approach using MRI and proposal for a new metric of function. Med Hypotheses 76: 834-839. Tydeman EA, Parker ML, Wickham MSJ, Rich GT, Faulks RM, Gidley MJ et al (2010). Effect of carrot (Daucus carota) microstructure on carotene bioaccessibilty in the upper gastrointestinal tract. 1. In vitro simulations of carrot digestion. J Agr Food Chem 58: 9847-9854. Van der Meulen R, Adriany T, Verbrugghe K, De Vuyst L (2006a). Kinetic analysis of bifidobacterial metabolism reveals a minor role for succinic acid in the regeneration of NAD+ through Its growth-associated production. Appl Environ Microbiol 72: 5204-5210. Van der Meulen R, Makras L, Verbrugghe K, Adriany T, De Vuyst L (2006b). In vitro kinetic analysis of oligofructose consumption by Bacteroides and Bifidobacterium spp. indicates different degradation mechanisms. Appl Environ Microb 72: 1006-1012. Van Impe JF, Poschet F, Geeraerd AH, Vereecken KM (2005). Towards a novel class of predictive microbial growth models. Int J Food Microbiol 100: 97-105. Van Oss CJ, Good RJ, Chaudhury MK (1986). The role of van der Waals forces and hydrogen bonds in "hydrophobic interactions" between bipolymers and low energy surfaces. J Colloid Interface Sci 111: 378-390. Van Oss CJ, Chaudhury MK, Good RJ (1988). Interfacial Lifshitz-van der Waals and polar interactions in macroscopic systems. Chem Rev 88: 927-941.

P a g e | 194
Van Oss CJ (1989). Energetics of cell-cell and cell-biopolymer interactions. Cell Biochem Biophys 14: 1-16. Van Wey AS, Cookson AL, Roy NC, McNabb WC, Soboleva TK, Shorten PR (2011). Bacterial biofilms associated with food particles in the human large bowel. Mol Nutr Food Res 55: 969-978. Van Wey AS, Cookson AL, Soboleva TK, Roy NC, McNabb WC, Bridier A et al (2012). Anisotropic nutrient transport in three-dimensional single species bacterial biofilms. Biotechnol Bioeng 109: 1280-1292. Van Wey AS, Shorten PR (Accepted). Mathematical models of food degradation in the human stomach. In: Boland M, Golding M, Singh H (eds). Food Structures, Digestion and Health. Elsevier. Van Wey AS, Cookson AL, Roy NC, McNabb WC, Soboleva TK, Shorten PR (Submitted-a). Monoculture parameters successfully predict the coculture growth of Bacteroides thetaiotaomicron and Bifidobacterium. ISME J. Van Wey AS, Cookson AL, Roy NC, McNabb WC, Soboleva TK, Wieliczko RJ et al (Submitted-b). A mathematical model of the effect of pH and food matrix composition on fluid transport into foods: An application in gastric digestion and cheese brining. Food Res Int. Venugopalan VP, Kuehn M, Hausner M, Springael D, Wilderer PA, Wuertz S (2005). Architecture of a nascent Sphingomonas sp. biofilm under varied hydrodynamic conditions. Appl Environ Microb 71: 2677-2686. Verschueren M, Engles WJM, Straatsman J, van den Berg G, de Jong P (2007). Modelling Gouda ripening to predict flavour development. In: Weinmer BC (ed). Improving the Flavour in Cheese. Woodhead Publishing: Philadelphia. pp 537-562. Vu B, Chen M, Crawford RJ, Ivanova EP (2009). Bacterial extracellular polysaccharides involved in biofilm formation. Molecules 14: 2535-2554. Wada J, Ando T, Kiyohara M, Ashida H, Kitaoka M, Yamaguchi M et al (2008). Bifidobacterium bifidum lacto-N-biosidase, a critical enzyme for the degradation of human milk oligosaccharides with a type 1 structure. Appl Environ Microb 74: 3996-4004. Waggoner PE, Parlange J-Y (1976). Water uptake and water diffusivity of seeds. Plant Physiol 57: 153-156. Waharte F, Steenkeste K, Briandet R, Fontaine-Aupart MP (2010). Diffusion measurements inside biofilms by image-based fluorescence recovery after photobleaching (FRAP) analysis with a commercial confocal laser scanning microscope. Appl Environ Microb 76: 5860-5869. Walker AW, Duncan SH, Harmsen HJM, Holtrop G, Welling GW, Flint HJ (2008). The species composition of the human intestinal microbiota differs between particle-associated and liquid phase communities. Environ Microbiol 10: 3275-3283. Wang Q, Zhang T (2010). Review of mathematical models for biofilms. Solid State Comm 150: 1009-1022. Wang Z, Liu Y, Tay J (2007). Biodegradability of extracellular polymeric substances produced by aerobic granules. Appl Microbiol Biot 74: 462 - 466.

P a g e | 195
Wanner O, Eberl HJ, Morgenroth E, Noguera DlR, Picioreanu C, Rittmann BE et al (2006). Mathematical Modeling of Biofilms. IWA Publishing: London. Wiesmann R, Zimelka W, Baumgärtl H, Götz P, Buchholz R (1994). Investigation of oxygen transfer through the membrane of polymer hollowspheres by oxygen micro-electrodes. J Biotech 32: 221-229. Wilkinson MHF (2002). Model intestinal microflora in computer simulation: A simulation and modeling package for host-microflora interactions. IEEE T Bio-Med Eng 49: 1077-1085. Wintermute EH, Silver PA (2010). Emergent cooperation in microbial metabolism. Mol Syst Biol 6. Wolfaardt GM, Lawrence JR, Korber DR (1999). Function of EPS. In: Wingender J, Neu TR, Flemming H-C (eds). Microbial Extracellular Polymeric Substances. Springer: Berlin. pp 171-200. Wood BD, Whitaker S (1999). Cellular growth in biofilms. Biotechnol Bioeng 64: 656-670. Wood BD, Whitaker S (2000). Multi-species diffusion and reaction in biofilms and cellular media. Chem Eng Sci 55: 3397-3418. Wood BD, Quintard M, Whitaker S (2002). Calculation of effective diffusivities for biofilms and tissues. Biotechnol Bioeng 77: 495-516. Xavier JB, Picioreanu C, van Loosdrecht MCM (2004). Assessment of three-dimensional biofilm models through direct comparison with confocal microscopy imaging. Wat Sci Tech 49: 177-185. Xu J, Mahowald MA, Ley RE, Lozupone CA, Hamady M, Martens EC et al (2007). Evolution of symbiotic bacteria in the distal human intestine. PLoS Biol 5: e156. Yamamoto S (1999). Effects of glycerol on the drying of gelatin and sugar solutions. Dry Technol 17: 1681-1695. Yang S, Lewandowski Z (1995). Measurement of local mass transfer coefficient in biofilms. Biotechnol Bioeng 48: 737-744. Yerly J, Hu Y, Jones SM, Martinuzzi RJ (2007). A two-step procedure for automatic and accurate segmentation of volumetric CLSM biofilm images. J Microbiol Meth 70: 424-433. Younes H, Coudray C, Bellanger J, Demigné C, Rayssiguier Y, Rémésy C (2001). Effects of two fermentable carbohydrates (inulin and resistant starch) and their combination on calcium and magnesium balance in rats. Brit J Nutr 86: 479-485. Zhang TC, Bishop PL (1994). Density, porosity, and pore structure of biofilms. Water Res 28: 2267-2277. Zhu J, Mekalanos JJ (2003). Quorum sensing-dependent biofilms enhance colonization in Vibrio cholerae. Dev Cell 5: 647-656.

P a g e | 196
Appendix A
The 60 strains of bacteria used to determine EDC values both perpendicular and
parallel to the substratum. For complete details about the origin of the bacteria used in
this study, please refer to the work of Bridier et al (2010). The strains in bold were used
to determine the effects of EPS on nutrient transport within biofilms.
Species Strain Species Strain
Salmonella enterica
S24 (ser. St Paul) I26 (ser. Agona) S2 (ser. Brandenburg) S19 (ser. Duby) S59 (ser. Dublin) S38 (ser. Enteritidis) S12 (ser. Hadar) S55 (ser. Indiana) ATCC 13311 (ser. Typhimurium) S34 (ser. Typhimurium)
Listeria monocytogenes
EGDe CIP 104794 CIP 103573 CIP 103575 CIP 78 39 370P-Lm Lm 162 Lm 481 LO28 BUG1641
Escherichia coli PHL 565 (MG1655) 163P-Ec 186P-Ec RS218 ATCC 8739 ESC.1.13 ESC.1.16 ESC.1.24 ESC.1.30 ESC.1.33
Pseudomonas aeruginosa
ATCC 15442 PSE.1.2 ATCC 10145 ATCC 14210 ATCC 49189 ATCC 9027 ATCC 15692 ATCC 9721 ATCC 14207 ATCC 51447
Staphylococcus aureus
ATCC 6538 CIP 57.10 ATCC 9144 ATCC 29213 ATCC 27217 ATCC 25923 ATCC 29247 ATCC 8096 ATCC 43300 STA.1.5
Enterococcus faecalis
ATCC 19433 ATCC 51188 ATCC 33012 ATCC 49477 ATCC 33186 ATCC 27959 ATCC 700802 ATCC 29212 ATCC 29302 ATCC 51299