Embed Size (px)
Citation preview
RESEARCH ARTICLE
Mathematical modeling of plant cell fate
transitions controlled by hormonal signals
Filip Z. Klawe1☯, Thomas StiehlID1,2,3☯, Peter Bastian2, Christophe Gaillochet4, Jan
U. LohmannID5, Anna Marciniak-CzochraID
1,2,3*
1 Institute of Applied Mathematics, Heidelberg University, Heidelberg, Germany, 2 Interdisciplinary Center for
Scientific Computing, Heidelberg University, Heidelberg, Germany, 3 Bioquant Center, Heidelberg University,
Heidelberg, Germany, 4 VIB-UGent Center for Plant Systems Biology, Ghent University, Ghent, Belgium,
5 Department of Stem Cell Biology, Centre for Organismal Studies, Heidelberg University, Heidelberg,
Germany
☯ These authors contributed equally to this work.
Abstract
Coordination of fate transition and cell division is crucial to maintain the plant architecture
and to achieve efficient production of plant organs. In this paper, we analysed the stem cell
dynamics at the shoot apical meristem (SAM) that is one of the plant stem cells locations.
We designed a mathematical model to elucidate the impact of hormonal signaling on the
fate transition rates between different zones corresponding to slowly dividing stem cells and
fast dividing transit amplifying cells. The model is based on a simplified two-dimensional
disc geometry of the SAM and accounts for a continuous displacement towards the periph-
ery of cells produced in the central zone. Coupling growth and hormonal signaling results in
a nonlinear system of reaction-diffusion equations on a growing domain with the growth rate
depending on the model components. The model is tested by simulating perturbations in the
level of key transcription factors that maintain SAM homeostasis. The model provides new
insights on how the transcription factor HECATE is integrated in the regulatory network that
governs stem cell differentiation.
Author summary
Plants continuously generate new organs such as leaves, roots and flowers. This process is
driven by stem cells which are located in specialized regions, so-called meristems. Divid-
ing stem cells give rise to offspring that, during a process referred to as cell fate transition,
become more specialized and give rise to organs. Plant architecture and crop yield cru-
cially depend on the regulation of meristem dynamics. To better understand this regula-
tion, we develop a computational model of the shoot meristem. The model describes the
meristem as a two-dimensional disk that can grow and shrink over time, depending on
the concentrations of the signalling factors in its interior. This allows studying how the
non-linear interaction of multiple transcription factors is linked to cell division and fate-
transition. We test the model by simulating perturbations of meristem signals and com-
paring them to experimental data. The model allows simulating different hypotheses
PLOS COMPUTATIONAL BIOLOGY
PLOS Computational Biology | https://doi.org/10.1371/journal.pcbi.1007523 July 20, 2020 1 / 21
a1111111111
a1111111111
a1111111111
a1111111111
a1111111111
OPEN ACCESS
Citation: Klawe FZ, Stiehl T, Bastian P, Gaillochet C,
Lohmann JU, Marciniak-Czochra A (2020)
Mathematical modeling of plant cell fate transitions
controlled by hormonal signals. PLoS Comput Biol
16(7): e1007523. https://doi.org/10.1371/journal.
pcbi.1007523
Editor: Attila Csikasz-Nagy, King’s College London,
UNITED KINGDOM
Received: October 30, 2019
Accepted: June 12, 2020
Published: July 20, 2020
Copyright: © 2020 Klawe et al. This is an open
access article distributed under the terms of the
Creative Commons Attribution License, which
permits unrestricted use, distribution, and
reproduction in any medium, provided the original
author and source are credited.
Data Availability Statement: All experimental data
used to validate the model has been previously
published and corresponding references are given
in the text.
Funding: This work was supported by research
funding from the German Research Foundation
DFG (Collaborative Research Center SFB 873,
Maintenance and Differentiation of Stem Cells in
Development and Disease). The funders had no
role in study design, data collection and analysis,
about signal effects. Based on the model we study the specific role of the transcription fac-
tor HECATE and provide new insights in its action on cell dynamics and in its interrela-
tion with other known transcription factors in the meristem.
Introduction
Tissue function is an effect of the cooperation of multiple specialized cell types. To establish,
maintain and regenerate tissues, cell production and fate specification have to be orchestrated
in a robust and well-defined manner. Perturbations of the underlying control mechanisms
may reduce the ability of the organism to adapt to changing environmental conditions.
Plants continuously generate new organs such as leaves, roots and flowers. For this purpose
they maintain pools of stem cells which remain active during the whole life of the plant. The
plant stem cells are located in specialized tissues, referred to as meristems. The accessibility of
meristems to live-imaging and the repetitive formation of identical organs, such as leaves,
make plants an attractive system to study the regulatory cues underlying cell production and
fate transition.
Stem cell proliferation and fate choice have a direct impact on the architecture of the plant
and its reproductive fitness. These vital functions require meristems to be robust with respect
to perturbations such as injuries or environmental fluctuations. In case of agricultural plants,
meristem dynamics are linked to the crop yield, therefore, a better understanding meristem
regulations is of practical importance [1, 2].
In this paper we focus on the stem cell dynamics in the shoot apical meristem (SAM) that is
responsible for formation of all above ground structures. The SAM is a curved structure and
its geometry can be approximated either by a spherical cap [3] or by a paraboloid [4]. Stem
cells are located in the central zone (CZ) surrounded by transit amplifying cells in the periph-
eral zone (PZ). Newly formed but still immature organs, so-called primordia, separate from
the meristem at the outer boundary of the PZ. A specialized cell population, the so called orga-
nizing center (OC), is located below the CZ and produces signals required for maintenance of
the stem cell fate, see [5]. The location of the SAM and its morphology is summarized in Fig 1.
There exists experimental evidence of different transcriptional factors coordinating cell
proliferation and fate choice in the SAM [6]. A key regulatory loop of the SAM consists of the
transcription factors WUSCHEL (WUS) and CLAVATA3 (CLV3). WUS is produced in the
OC and moves to the CZ where it maintains the stem cell identity. Stem cells in turn produce
CLV3 which inhibits WUS expression in OC cells [7, 8]. This core feedback loop interacts with
various other signals that fine-tune cell activity and allow the system to optimally adapt to
environmental conditions [5]. One important example for such signals is the HECATE (HEC)
transcription factor. It has been recently shown that HEC acts on cell fate transitions between
the different SAM domains, however the underlying regulatory network remains elusive [9].
One possibility to understand the effects of perturbed signaling is the study of mutant pheno-
types, such as the HEC mutant (hec123). However, studying the function of HEC genes at
high spatio-temporal resolution is experimentally challenging [9]. To close this gap, we pro-
pose an integrated approach combining mathematical modeling with experimental manipula-
tion and live imaging of plant stem cells.
Mathematical models are a powerful tool for studying complex nonlinear dynamics coordi-
nated by multiple factors. They have contributed considerably to the understanding of SAM
regulation [10–17]. In plants, cell fate decisions depend on local concentrations of spatially
heterogeneous signals [5] and therefore, spatial models are required to describe meristem
PLOS COMPUTATIONAL BIOLOGY Mathematical modeling of plant cell fate transitions controlled by hormonal signals
PLOS Computational Biology | https://doi.org/10.1371/journal.pcbi.1007523 July 20, 2020 2 / 21
decision to publish, or preparation of the
manuscript.
Competing interests: The authors have declared
that no competing interests exist.
dynamics. For this purpose different approaches have been developed. Individual-based mod-
els allow tracking dynamics of each individual cell that is explicitly modelled. Such approach
has been applied e.g., to study patterning of the WUS expressing domain [12, 16], mechanical
signals [18], mechanisms of organ initiation [10], and cell fate determination [15, 19]. On the
other hand, a continuous approach based on reaction-diffusion equations and ordinary differ-
ential equation models allows to study spatio-temporal interactions of different signaling mol-
ecules. Such models have been applied e.g., to investigate cytokinin signaling [11] and
patterning of the shoot apical meristem [14, 17]. To investigate the impact of HEC on fate tran-
sition and proliferation rates of cells in the CZ and PZ, we have recently proposed a model
based on the population dynamics approach, in which dynamics of different cell subpopula-
tions are described by ordinary differential equations [9]. Such approach allows tracking how
changes in cell proliferation, fate transition, primordia formation and primordia separation
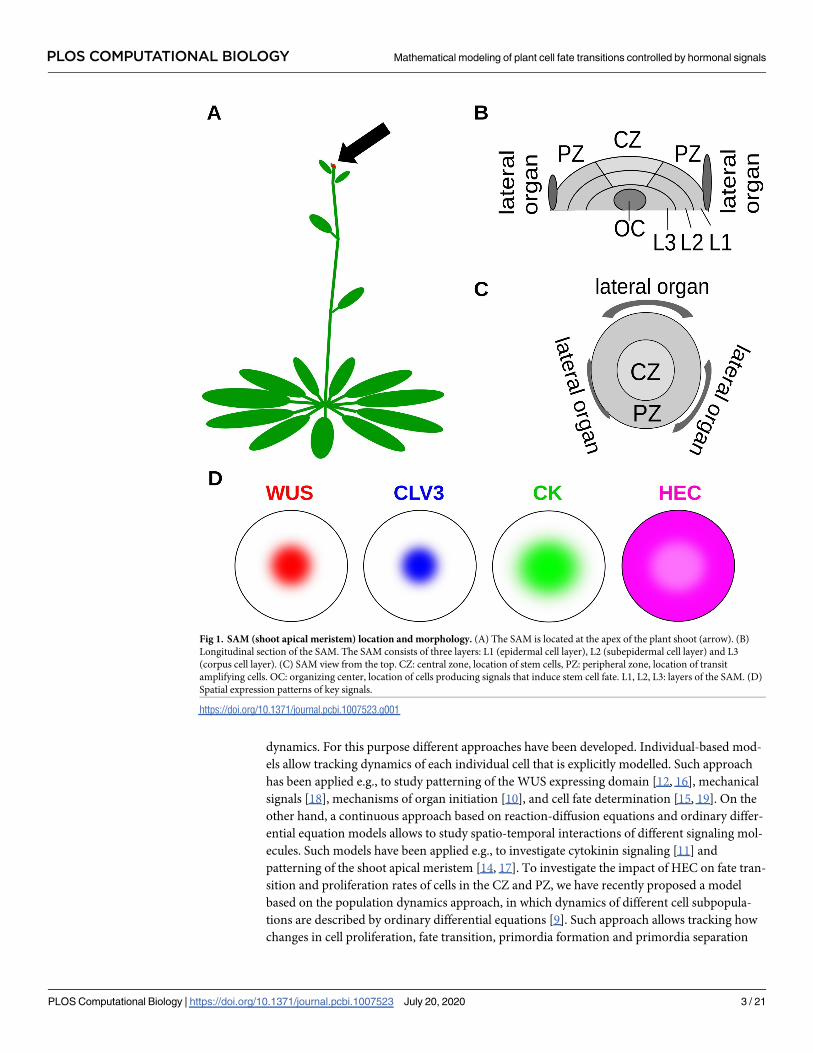
Fig 1. SAM (shoot apical meristem) location and morphology. (A) The SAM is located at the apex of the plant shoot (arrow). (B)
Longitudinal section of the SAM. The SAM consists of three layers: L1 (epidermal cell layer), L2 (subepidermal cell layer) and L3
(corpus cell layer). (C) SAM view from the top. CZ: central zone, location of stem cells, PZ: peripheral zone, location of transit
amplifying cells. OC: organizing center, location of cells producing signals that induce stem cell fate. L1, L2, L3: layers of the SAM. (D)
Spatial expression patterns of key signals.
https://doi.org/10.1371/journal.pcbi.1007523.g001
PLOS COMPUTATIONAL BIOLOGY Mathematical modeling of plant cell fate transitions controlled by hormonal signals
PLOS Computational Biology | https://doi.org/10.1371/journal.pcbi.1007523 July 20, 2020 3 / 21
affect the time evolution and steady-state size of the different SAM zones but does not take
into account spatio-temporal dynamics of the underlying signaling network.
In this paper, we study how time evolution of meristem cell populations and newly formed
organs depends on the spatio-temporal dynamics of the underlying signaling network regulat-
ing cell self-renewal and differentiation. We develop a novel modeling framework that
describes the SAM as a two-dimensional growing disc. The two-dimensional approximation
of the domain is justified due to the SAM structure consisting of a small number of cell layers.
The model describes interactions of the plant meristem key signals (CLV3, WUS, Cytokinin
and HEC) and links their local concentrations to cell proliferation and fate transition rates.
The change in the total SAM cell number is, in turn, linked to the change of domain size. Cou-
pling growth and signaling processes results in a nonlinear system of reaction-diffusion equa-
tions on a growing domain with the growth rate depending on the model components. Solving
such problems is mathematically challenging. We implemented the model using the DUNE
software package, which is a suitable numerical environment for sharp interface problems
appearing in models with a growing domain [20–22].
The model was tested using recent experimental observations. Importantly, it allowed to
gain more insight into stem cell differentiation dynamics in the HEC loss-of-function pheno-
type which has remained experimentally not feasible. A new insight stemming from this work
is that HEC may reduce the differentiation rate of WUS producing cells [9]. The dynamics of
OC cells are so far not well understood, since they are located deeply in the meristem and it is
difficult to image them in vivo. Our model helps to understand how signals modulating the
classical WUS-CLV3 loop act on the OC cells. In summary, the proposed comprehensive
modeling and computational framework can be further used to generate hypotheses about
interaction of the respective signaling factors and their impact on cell proliferation and fate
transition.
Results
Mathematical model
Model geometry: Plant cells are immobile since they are encased in a cell wall. Their fate is
determined by local signals; for review see [5]. The SAM consists of multiple layers. Since the
cell division process is anticlinal, i.e. the progeny of cells always belong to the same layer as
their parent cells [23–25], we model only the uppermost cell layer, referred to as L1, together
with the organizing center (OC). Specific cross-talk signals between the L1 and L2 layer have
so far not been described. Cells in both layers are exposed to the WUS signal from the OC and
regulate WUS expression by production of CLV3. We model the SAM as a two-dimensional
disc with radius R. The OC is located below the center of the meristem and it is also disc-
shaped. WUS is produced in the OC and transported to the CZ [19, 26]. We model this process
by a disc-shaped WUS source of radius r in the center of the meristem; see Fig 2. Due to organ
separation, cell proliferation and differentiation, the numbers of SAM and OC cells change
over time, which results in time-dependent changes of the corresponding radii R and r.The SAM geometry that can be represented by a spherical cap of radius rc and height hc [3]
is modelled by a two-dimensional disc. The approximation results from the following proce-
dure: The region of WUS expression is given by the radial projection of the OC on the L1
layer, which corresponds the shortest distance between the site of WUS production in the OC
and the site of WUS action on L1. After the radial projection on L1, the region of WUS expres-
sion is a spherical cap of radius rc and height ~hc. We then transform the spherical cap to a cir-
cle: Due to the rotational symmetry the spherical cap can be represented as the surface of
revolution of an arc. The diameter of the circular SAM representation is equal to the length of
PLOS COMPUTATIONAL BIOLOGY Mathematical modeling of plant cell fate transitions controlled by hormonal signals
PLOS Computational Biology | https://doi.org/10.1371/journal.pcbi.1007523 July 20, 2020 4 / 21
this arc. This implies that the SAM radius equals R = rc cos−1((rc − hc)/rc), with cos−1
expressed in radians. Accordingly, the radius of the WUS expressing domain r is equal to
r ¼ rc cos � 1ððrc �~hcÞ=rcÞ.
Signaling network: Lateral transport of all signals is modelled by diffusion. Regulatory fac-
tors considered include WUSCHEL (WUS), CLAVATA3 (CLV3), CYTOKININ (CK) and
HECATE (HEC). The model accounts for the following processes:
• WUS is produced by cells in the organizing center [19, 26]. For simplicity we assume that
WUS is produced at a constant rate per OC cell.
• CLV3 is produced by WUS-sensing cells [7, 8]. We assume a sigmoidal dependence of CLV3
production on WUS.
• We assume that CLV3 regulates the number of WUS-producing cells by increasing their dif-
ferentiation rate or by decreasing their proliferation rate. This corresponds to a negative
feedback loop between WUS and CLV3 [7, 8].
• CK signalling increases with increasing WUS concentration through inhibition of ARR5
[11, 27]. Furthermore CK production increases with increasing HEC concentrations [9].
However, HEC loss of function, as in the hec123 mutant, does not completely abrogate CK
production. On the other hand, WUS loss of function leads to arrest of the meristem, i.e. loss
of the stem cell population [28]. We therefore assume that CK production decreases to zero
in absence of WUS and that CK production is maintained at low levels in absence of HEC.
• HECATE (HEC) production is repressed by WUS [6].
In addition, we assume that all signals undergo a degradation at constant rates.
Description of the growing domain: We consider the Arabidopsis SAM in the inflorescence
state consisting of 1600-2200 cells, corresponding to several hundreds of cells on each meri-
stem layer [9]. The high number of cells justifies a continuous description of the SAM. In a
good agreement with experimental data [9], we assume that all meristem cells have the same
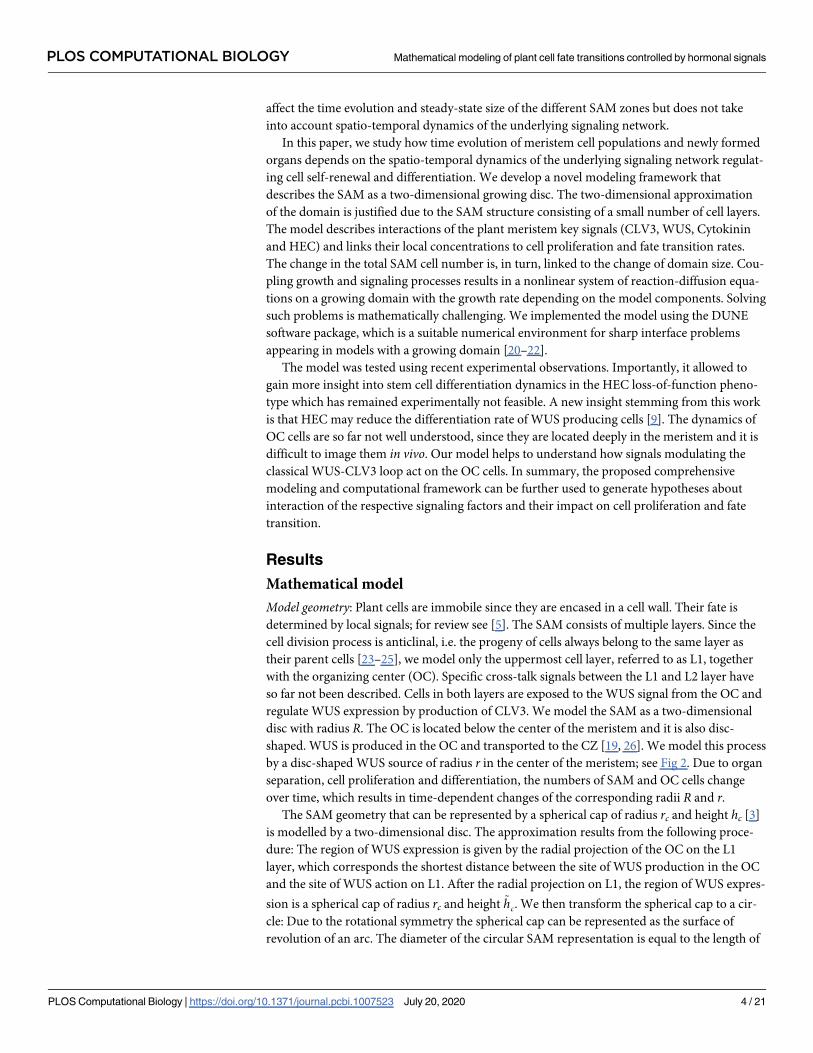
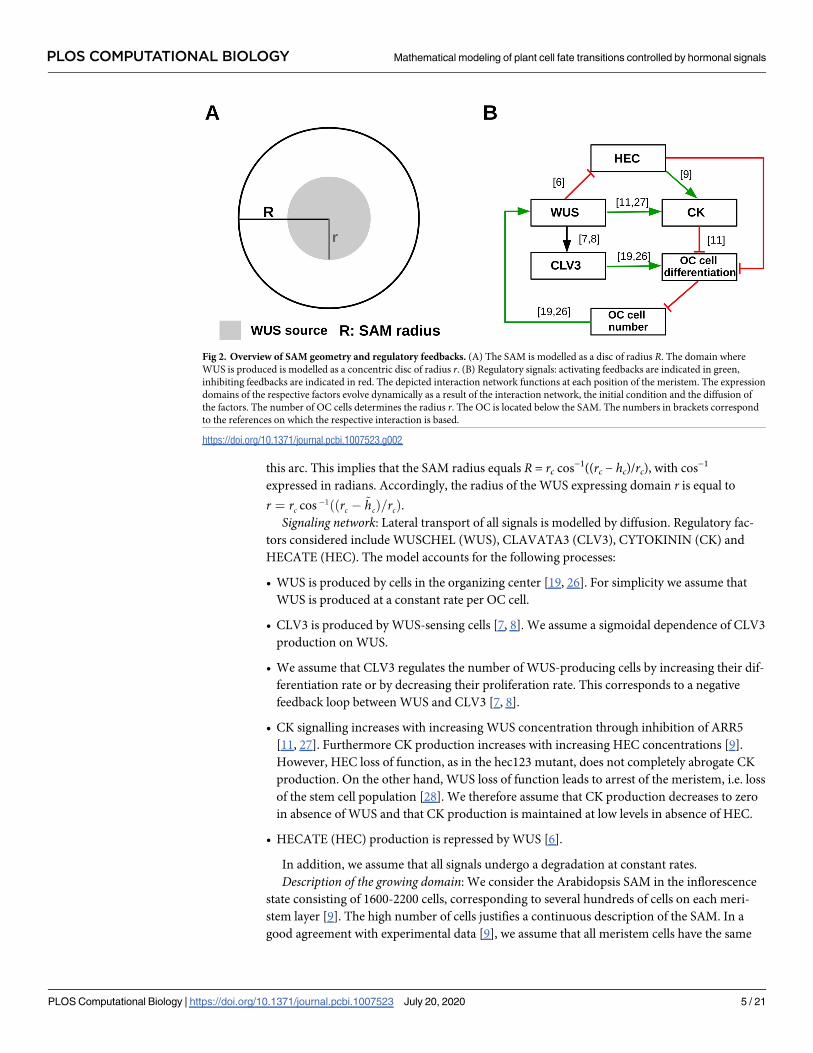
Fig 2. Overview of SAM geometry and regulatory feedbacks. (A) The SAM is modelled as a disc of radius R. The domain where
WUS is produced is modelled as a concentric disc of radius r. (B) Regulatory signals: activating feedbacks are indicated in green,
inhibiting feedbacks are indicated in red. The depicted interaction network functions at each position of the meristem. The expression
domains of the respective factors evolve dynamically as a result of the interaction network, the initial condition and the diffusion of
the factors. The number of OC cells determines the radius r. The OC is located below the SAM. The numbers in brackets correspond
to the references on which the respective interaction is based.
https://doi.org/10.1371/journal.pcbi.1007523.g002
PLOS COMPUTATIONAL BIOLOGY Mathematical modeling of plant cell fate transitions controlled by hormonal signals
PLOS Computational Biology | https://doi.org/10.1371/journal.pcbi.1007523 July 20, 2020 5 / 21
size. The radius of the meristem R(t) at time t can then be calculated based on the cell number.
Let N(t) be the cell number at time t and α, β their proliferation and differentiation rates. Cells
in all zones of the meristem proliferate. Differentiation is defined as the commitment of meri-
stem cells towards cells of the organ primordia and it is linked to their exit from the meristem.
Cells incorporated in the organ primordia continue proliferation, however their offspring does
not contribute to SAM any longer. Therefore, differentiation in the model leads to a decrease
of meristem size. Evolution of the cell population is governed by the equation
ddt
NðtÞ ¼ ðaðtÞ � bðtÞÞNðtÞ:
In many of the considered scenarios, such as the hec123 phenotype or the hec over-expres-
sion phenotype, the average cell size in the SAM is constant and identical to that of the wild-
type SAM [9]. Hence, we model the change of meristem size as a change in cell numbers and
set RðtÞ ¼ffiffiffiffiffiffiffiffiffiffiffiffiffiffiffiNðtÞ=p
p. Then, it holds
ddt
RðtÞ ¼ ðaðtÞ � bðtÞÞRðtÞ
2:
Biologically, meristem growth is caused by turgor-driven cell expansion, which stretches
cell walls, together with regular division, which partitions the cells. The rate of turgor-driven
expansion depends on the resistance of the cell walls to stretching (extent of cell wall loosen-
ing) and the level of turgor [29–34]. The model does not resolve these processes in detail.
Instead it considers the rates α and β. Increase in growth rate (higher α) may therefore reflect
either greater cell wall loosening or local increase in turgor in cells of the meristematic zone.
Parameter β describes a rate of cells exiting the meristematic region and switching to periph-
eral identity, which is a function of radius. High β corresponds to high numbers of differentiat-
ing cells per unit of time.
Signal-dependent cell kinetics: We model the organizing center as a homogeneous cell popu-
lation with signal-dependent proliferation or differentiation rate. We assume that CLV3
reduces proliferation or increases differentiation of OC cells and thus reduces the WUS con-
centrations. Similarly, HEC and CK reduce OC cell differentiation or induce proliferation and
lead to increased WUS concentrations [11]. The considered regulatory network is summarized
in Fig 2.
We consider the following processes to describe evolution of the L1 SAM layer. WUS
induces the stem cell fate [7, 8]. Stem cells have lower division rates than transit amplifying
cells [9, 35]. An increase of WUS concentration leads to increase of the fraction of slowly-
dividing stem cells in the meristem and decrease of cell production per unit of time. Therefore,
we assume that cell production decreases with increasing total WUS concentration. As shown
by experiments, reduced CK activity leads to reduction of the meristem radius [36, 37]. For
this reason the growth rate of the meristem radius can become negative in presence of small
CK concentrations. The mechanism underlying formation of organ primordia suggests that
organ formation rates increase with the area of the meristem [10, 38, 39]. This implies that the
cell outflux due to differentiation increases with increased meristem cell count, and hence it
depends on the size of the domain and is proportional to R2. In accordance with the biological
observations described above, we assume that high concentrations of CK and HEC lead to
increased OC cell numbers and that high CLV3 concentrations lead to decreased OC cell
numbers.
Mathematical model: We denote by u0(x, t) the concentration of WUS at location x and
time t. Similarly u1(x, t), u2(x, t) and u3(x, t) denote the concentrations of CLV3, CK and HEC
PLOS COMPUTATIONAL BIOLOGY Mathematical modeling of plant cell fate transitions controlled by hormonal signals
PLOS Computational Biology | https://doi.org/10.1371/journal.pcbi.1007523 July 20, 2020 6 / 21
at time t and location x respectively. The meristem domain at time t is denoted byO(t); it cor-
responds to a disc of radius R(t). The organizing center at time t is a disc-shaped domain of
radius r(t) and it is denoted as Osmall(t). The centers of O(t) and Osmall(t) coincide. The diffu-
sion constants of WUS, CLV3, CK and HEC are denoted by Di> 0, i = 1, . . ., 4, respectively.
The above-listed assumptions result in the following system of equations:
@tu0 ¼ D0Du0 � r � ðu0vÞ þ k1wOsmallðtÞ� d0u0; ðWUSÞ;
@tu1 ¼ D1Du1 � r � ðu1vÞ þk2
1þ e� ðu0 � k3Þk4� d1u1; ðCLVÞ;
@tu2 ¼ D2Du2 � r � ðu2vÞ þ 1þk9u3
1þ k10u3
� �k11u0
1þ k12u0
� d2u2; ðCKÞ;
@tu3 ¼ D3Du3 � r � ðu3vÞ þk13
1þ k14u0
� d3u3; ðHECÞ:
8>>>>>>>>>>>>><
>>>>>>>>>>>>>:
ð1Þ
@tR ¼k21
1þ k23
R
OðtÞu0 dx� pp
1þ R2
1þ R20
gðZ
OðtÞu2 dxÞ
!R2; ðmeristem radiusÞ
@tr ¼
Z
OsmallðtÞ
k77
1þ k7u1
f ðu2; u3Þ dx � pdbasic� �
r2; ðOC radiusÞ
8>>>>><
>>>>>:
ð2Þ
with model parameters ki, di, pp, R0, pdbasic being positive constants. χOsmall(t) denotes the
piecewise linear approximation of the indicator function ofOsmall(t), and v is a function related
to deformation of the domain and equal to
ffiffiffiffiffiffiffiffix2þy2p
R @tR. The system includes homogeneous
Neumann boundary conditions in ui and initial conditions for R, r and ui. For biological rea-
sons the radius of the organizing center cannot exceed the radius of the entire SAM. When rand R approach each other we slow down their evolution by multiplying the right hand-side of
Eq (2) with a nonnegative smooth function which depends on the distance between r and Rand equals zero if r = R. This mechanism corresponds to physical constraints preventing that
the OC has a larger diameter than the SAM.
Model of the domain growth: The functions f and g are defined as follows:
f ðu2; u3Þ ¼ max ðminðaa � u2 þ ab; k16 � u3 þ k15Þ; k17Þ; ð3Þ
gðxÞ ¼
1:1 x 2 ½0; 1�;
1:1 � 0:1ðx � 1Þ x 2 ½1; 2�;
1 x 2 ½2; 10�;
1 �x � 10
20x 2 ½10; 12�;
0:9 x 2 ½12;1Þ:
8>>>>>>>>>>>><
>>>>>>>>>>>>:
ð4Þ
It is known that WUS expression decreases with increasing CLV3 concentrations [40]. We
hypothesize that this is caused by a change of OC cell numbers. Based on experimental obser-
vations [9, 11, 27] we furthermore hypothesize that HEC and CK impact on OC dynamics.
This agrees with experiments showing that induction of HEC in the CZ results in an increase
of the OC [9]. In accordance with experimental observations showing repression of WUS by
PLOS COMPUTATIONAL BIOLOGY Mathematical modeling of plant cell fate transitions controlled by hormonal signals
PLOS Computational Biology | https://doi.org/10.1371/journal.pcbi.1007523 July 20, 2020 7 / 21
increased CLV3 concentrations [40], we consider CLV3 as the main regulator, in the sense
that for high CLV3 concentrations the OC cell number decreases. We express the OC prolifer-
ation rate as the product of two functions, a decreasing Hill function depending on CLV3 and
a function f that depends on CK and HEC. The shape of function f is depicted in S1 Text.
Function f models our hypothesis that the organizing center grows if CK and HEC concentra-
tions increase [9]. HEC is fine-tuning the meristem signaling. We assume that for increasing
HEC concentrations the effect of CK on the meristem increases. This assumption follows the
observations in [9]. For high HEC concentrations the CK effect saturates at a higher level com-
pared to the case of low HEC concentrations (i.e., the impact of high levels of CK signaling is
amplified by HEC). This may be explained by a HEC-induced production of CK target mole-
cules. Since it has been observed experimentally that HEC and CK loss of function do not lead
to loss of the OC [9, 37], the value of f is positive for u2 = u3 = 0.
Experiments have shown that decreased concentrations of CK lead to smaller meristems
[36, 37]. This is modeled by the function g which is depicted in S1 Text and reflects the obser-
vation that the meristem structure is robust to perturbations. Only large deviations of CK from
its wild type concentration (either towards very high or very low concentrations) impact on
the meristem radius by reducing the cell number [37]. The shape of the function g is motivated
as follows. Cells in organ primordia are induced to differentiate. Since organ primordia are
discrete structures, the function has multiple discrete steps. Although the organ output of the
meristem decreases with decreasing CK concentrations, the number of organs per area of the
meristem increases (the wildtype with a meristem diameter of 82μm produces 9.13 leafs within
11 days, the cre1-12 ahk2-2 ahk3-3 triple mutant with a meristem diameter of 29 μm produces
4 leafs within 11 days, [37]). For this reason the function g assumes higher values for lower CK
concentrations.
It is not clear how regulation of OC size is accomplished. In principle, two extreme possibil-
ities exist, namely constant proliferation and regulated differentiation or regulated prolifera-
tion and constant differentiation. The ODE for r as it is written above implies the latter.
However, for uniformly bounded ui it can be rewritten as
@tr ¼Z
OsmallðtÞK � K �
k77
1þ k7u1
f ðu2; u3Þ dxþ pdbasic� �� �
r2;
which corresponds to a constant proliferation K and a CLV3, HEC and CK dependent differ-
entiation term. Here K denotes the maximum ofk77
1þk7u1f ðu2; u3Þ. Taking into account the exper-
imental results for the upper meristem layers [9], the first option, i.e. HEC-dependent
regulation of differentiation seems more plausible.
Model calibration
Initial data and model parameters: Since stem cells are identified experimentally using CLV3
reporters, we define them in the model as the cells located at positions where CLV3 concentra-
tion is above a certain threshold. We assume that the meristem of the unperturbed adult wild
type plant is in a steady-state. Experiments show that under such conditions the CZ cell num-
ber corresponds to approximately 10% of the total meristem cell number [9]. This ratio is hold
in the locally stable equilibrium depicted in Fig 3(A). This equilibrium serves as a departure
point for all simulated experiments. The corresponding model parameters are listed in
Table 1. These provide an example set of parameters that fit the wild type meristem configura-
tion. Details on the calibration of proliferation and differentiation rates are given in S3 Text. A
sensitivity analysis is performed in S5 Text.
PLOS COMPUTATIONAL BIOLOGY Mathematical modeling of plant cell fate transitions controlled by hormonal signals
PLOS Computational Biology | https://doi.org/10.1371/journal.pcbi.1007523 July 20, 2020 8 / 21
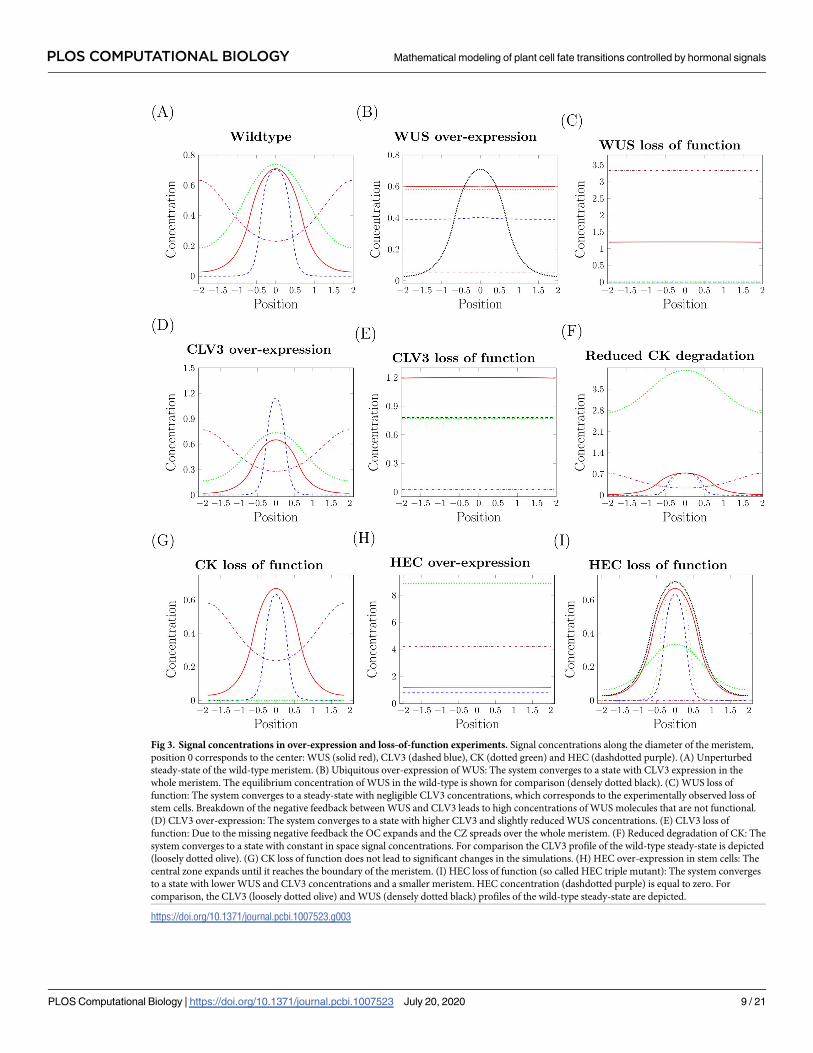
Fig 3. Signal concentrations in over-expression and loss-of-function experiments. Signal concentrations along the diameter of the meristem,
position 0 corresponds to the center: WUS (solid red), CLV3 (dashed blue), CK (dotted green) and HEC (dashdotted purple). (A) Unperturbed
steady-state of the wild-type meristem. (B) Ubiquitous over-expression of WUS: The system converges to a state with CLV3 expression in the
whole meristem. The equilibrium concentration of WUS in the wild-type is shown for comparison (densely dotted black). (C) WUS loss of
function: The system converges to a steady-state with negligible CLV3 concentrations, which corresponds to the experimentally observed loss of
stem cells. Breakdown of the negative feedback between WUS and CLV3 leads to high concentrations of WUS molecules that are not functional.
(D) CLV3 over-expression: The system converges to a state with higher CLV3 and slightly reduced WUS concentrations. (E) CLV3 loss of
function: Due to the missing negative feedback the OC expands and the CZ spreads over the whole meristem. (F) Reduced degradation of CK: The
system converges to a state with constant in space signal concentrations. For comparison the CLV3 profile of the wild-type steady-state is depicted
(loosely dotted olive). (G) CK loss of function does not lead to significant changes in the simulations. (H) HEC over-expression in stem cells: The
central zone expands until it reaches the boundary of the meristem. (I) HEC loss of function (so called HEC triple mutant): The system converges
to a state with lower WUS and CLV3 concentrations and a smaller meristem. HEC concentration (dashdotted purple) is equal to zero. For
comparison, the CLV3 (loosely dotted olive) and WUS (densely dotted black) profiles of the wild-type steady-state are depicted.
https://doi.org/10.1371/journal.pcbi.1007523.g003
PLOS COMPUTATIONAL BIOLOGY Mathematical modeling of plant cell fate transitions controlled by hormonal signals
PLOS Computational Biology | https://doi.org/10.1371/journal.pcbi.1007523 July 20, 2020 9 / 21
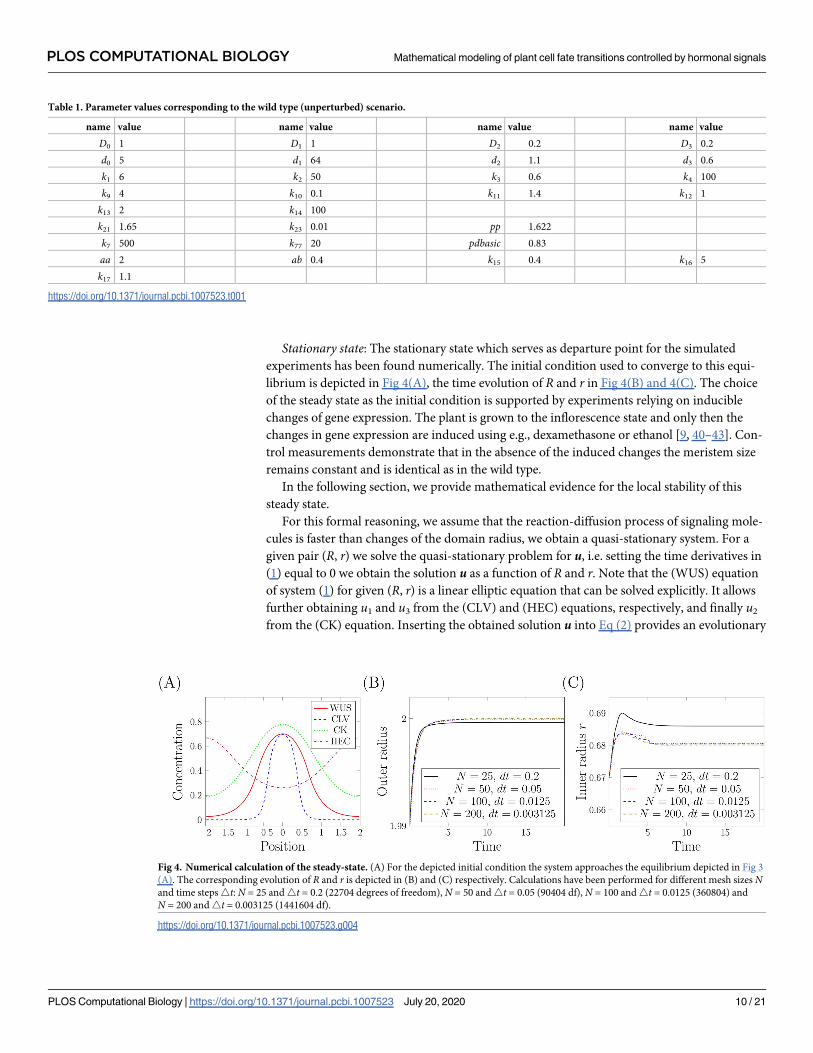
Stationary state: The stationary state which serves as departure point for the simulated
experiments has been found numerically. The initial condition used to converge to this equi-
librium is depicted in Fig 4(A), the time evolution of R and r in Fig 4(B) and 4(C). The choice
of the steady state as the initial condition is supported by experiments relying on inducible
changes of gene expression. The plant is grown to the inflorescence state and only then the
changes in gene expression are induced using e.g., dexamethasone or ethanol [9, 40–43]. Con-
trol measurements demonstrate that in the absence of the induced changes the meristem size
remains constant and is identical as in the wild type.
In the following section, we provide mathematical evidence for the local stability of this
steady state.
For this formal reasoning, we assume that the reaction-diffusion process of signaling mole-
cules is faster than changes of the domain radius, we obtain a quasi-stationary system. For a
given pair (R, r) we solve the quasi-stationary problem for u, i.e. setting the time derivatives in
(1) equal to 0 we obtain the solution u as a function of R and r. Note that the (WUS) equation
of system (1) for given (R, r) is a linear elliptic equation that can be solved explicitly. It allows
further obtaining u1 and u3 from the (CLV) and (HEC) equations, respectively, and finally u2
from the (CK) equation. Inserting the obtained solution u into Eq (2) provides an evolutionary
Table 1. Parameter values corresponding to the wild type (unperturbed) scenario.
name value name value name value name value
D0 1 D1 1 D2 0.2 D3 0.2
d0 5 d1 64 d2 1.1 d3 0.6
k1 6 k2 50 k3 0.6 k4 100
k9 4 k10 0.1 k11 1.4 k12 1
k13 2 k14 100
k21 1.65 k23 0.01 pp 1.622
k7 500 k77 20 pdbasic 0.83
aa 2 ab 0.4 k15 0.4 k16 5
k17 1.1
https://doi.org/10.1371/journal.pcbi.1007523.t001
Fig 4. Numerical calculation of the steady-state. (A) For the depicted initial condition the system approaches the equilibrium depicted in Fig 3
(A). The corresponding evolution of R and r is depicted in (B) and (C) respectively. Calculations have been performed for different mesh sizes Nand time steps4t: N = 25 and4t = 0.2 (22704 degrees of freedom), N = 50 and4t = 0.05 (90404 df), N = 100 and4t = 0.0125 (360804) and
N = 200 and4t = 0.003125 (1441604 df).
https://doi.org/10.1371/journal.pcbi.1007523.g004
PLOS COMPUTATIONAL BIOLOGY Mathematical modeling of plant cell fate transitions controlled by hormonal signals
PLOS Computational Biology | https://doi.org/10.1371/journal.pcbi.1007523 July 20, 2020 10 / 21
system for (R, r):
_R
_r
0
@
1
A ¼
~Gðu;R; rÞR
~Fðu;R; rÞr
0
@
1
A ¼GðR; rÞR
FðR; rÞr
!
; ð5Þ
where functions ~Fðu;R; rÞ and ~Gðu;R; rÞ correspond to the expressions on the right-hand of
system (2), see Fig 5. Linearization in the neighborhood of the steady-state (R�, r�) leads to
_R
_r
0
@
1
A ¼
R�@RGðR�; r�Þ þ GðR�; r�Þ R�@rGðR�; r�Þ
r�@RFðR�; r�Þ r�@rFðR�; r�Þ þ FðR�; r�Þ
0
@
1
AR
r
0
@
1
A
¼
R�@RGðR�; r�Þ R�@rGðR�; r�Þ
r�@RFðR�; r�Þ r�@rFðR�; r�Þ
0
@
1
AR
r
0
@
1
A ¼ AR
r
0
@
1
A;
ð6Þ
since F(R�, r�) = 0 and G(R�, r�) = 0.
Derivatives of G are negative, what can be checked by explicit calculations. The main task is
to calculate derivatives of function F. We are not able to do it analytically. However, using our
numerical approach we can calculate values of the function F in the neighborhood of the
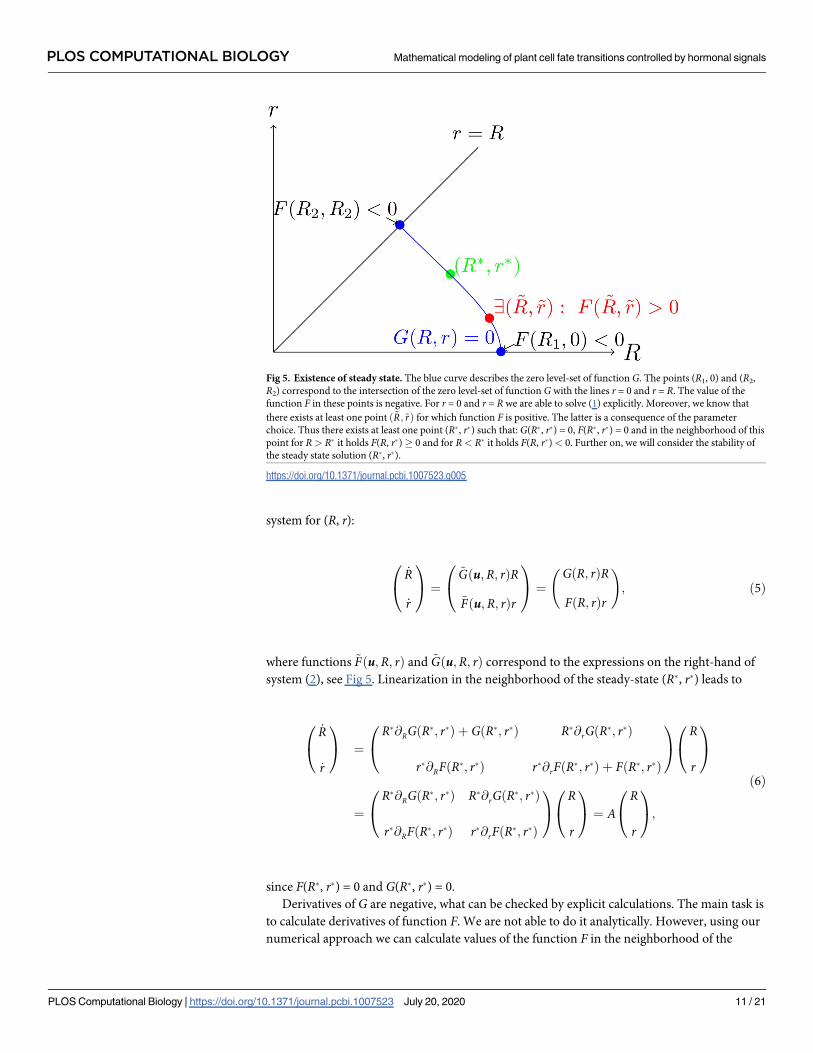
Fig 5. Existence of steady state. The blue curve describes the zero level-set of function G. The points (R1, 0) and (R2,
R2) correspond to the intersection of the zero level-set of function G with the lines r = 0 and r = R. The value of the
function F in these points is negative. For r = 0 and r = R we are able to solve (1) explicitly. Moreover, we know that
there exists at least one point ð~R;~rÞ for which function F is positive. The latter is a consequence of the parameter
choice. Thus there exists at least one point (R�, r�) such that: G(R�, r�) = 0, F(R�, r�) = 0 and in the neighborhood of this
point for R> R� it holds F(R, r�)� 0 and for R< R� it holds F(R, r�)< 0. Further on, we will consider the stability of
the steady state solution (R�, r�).
https://doi.org/10.1371/journal.pcbi.1007523.g005
PLOS COMPUTATIONAL BIOLOGY Mathematical modeling of plant cell fate transitions controlled by hormonal signals
PLOS Computational Biology | https://doi.org/10.1371/journal.pcbi.1007523 July 20, 2020 11 / 21
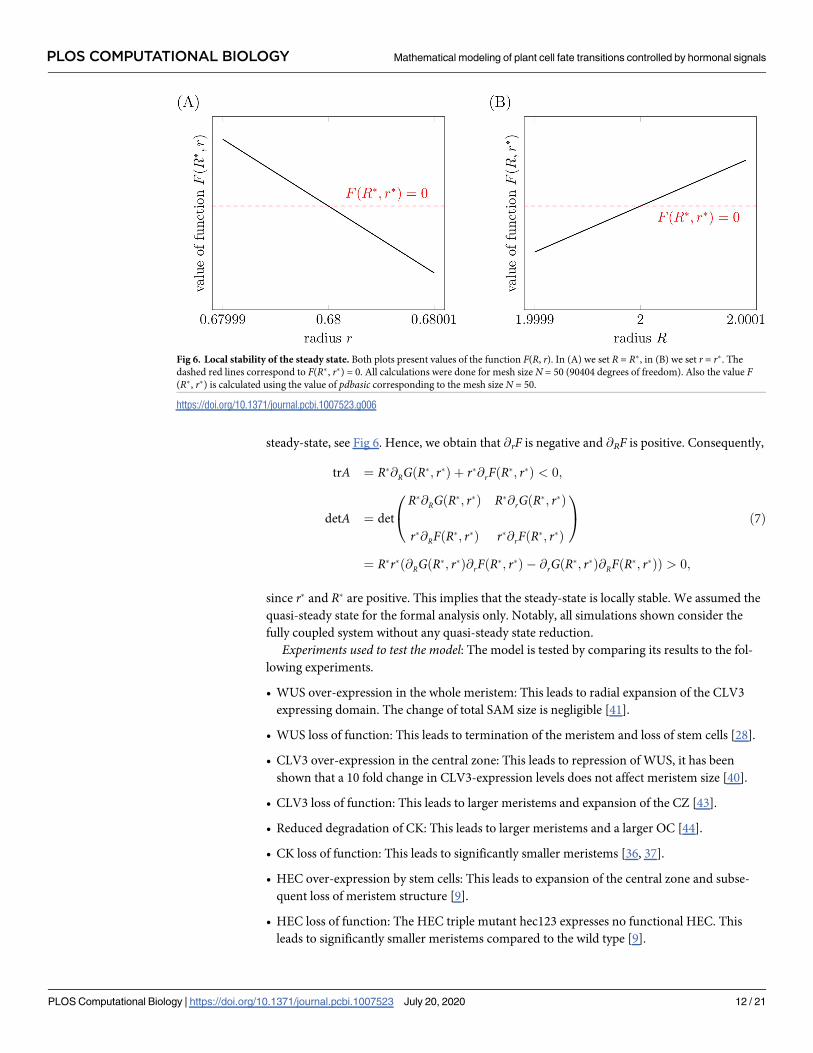
steady-state, see Fig 6. Hence, we obtain that @rF is negative and @RF is positive. Consequently,
trA ¼ R�@RGðR�; r�Þ þ r�@rFðR�; r�Þ < 0;
detA ¼ detR�@RGðR�; r�Þ R�@rGðR�; r�Þ
r�@RFðR�; r�Þ r�@rFðR�; r�Þ
0
@
1
A
¼ R�r�ð@RGðR�; r�Þ@rFðR�; r�Þ � @rGðR�; r�Þ@RFðR�; r�ÞÞ > 0;
ð7Þ
since r� and R� are positive. This implies that the steady-state is locally stable. We assumed the
quasi-steady state for the formal analysis only. Notably, all simulations shown consider the
fully coupled system without any quasi-steady state reduction.
Experiments used to test the model: The model is tested by comparing its results to the fol-
lowing experiments.
• WUS over-expression in the whole meristem: This leads to radial expansion of the CLV3
expressing domain. The change of total SAM size is negligible [41].
• WUS loss of function: This leads to termination of the meristem and loss of stem cells [28].
• CLV3 over-expression in the central zone: This leads to repression of WUS, it has been
shown that a 10 fold change in CLV3-expression levels does not affect meristem size [40].
• CLV3 loss of function: This leads to larger meristems and expansion of the CZ [43].
• Reduced degradation of CK: This leads to larger meristems and a larger OC [44].
• CK loss of function: This leads to significantly smaller meristems [36, 37].
• HEC over-expression by stem cells: This leads to expansion of the central zone and subse-
quent loss of meristem structure [9].
• HEC loss of function: The HEC triple mutant hec123 expresses no functional HEC. This
leads to significantly smaller meristems compared to the wild type [9].
Fig 6. Local stability of the steady state. Both plots present values of the function F(R, r). In (A) we set R = R�, in (B) we set r = r�. The
dashed red lines correspond to F(R�, r�) = 0. All calculations were done for mesh size N = 50 (90404 degrees of freedom). Also the value F(R�, r�) is calculated using the value of pdbasic corresponding to the mesh size N = 50.
https://doi.org/10.1371/journal.pcbi.1007523.g006
PLOS COMPUTATIONAL BIOLOGY Mathematical modeling of plant cell fate transitions controlled by hormonal signals
PLOS Computational Biology | https://doi.org/10.1371/journal.pcbi.1007523 July 20, 2020 12 / 21
Spatial resolution of proliferation rates: WUS is a transcription factor that induces stemness
in the SAM. WUS acts in a concentration-dependent manner. If its concentration is suffi-
ciently high, cells adopt the stem cell fate [41, 42, 45]. Since the stem cell fate is linked to a slow
cell proliferation, we assume that high WUS concentrations are linked to a slow proliferation.
For the sake of simplicity, we model the dependence of the proliferation rate at location x on
WUS with function aðx; tÞ ¼ c1þku0ðx;tÞ
, where c, k are constants and u0(x, t) is the local WUS
concentration. Details are given in S3 Text.
Simulation of key experiments
In this section, we test the model by comparing it to the outcomes of a set of experiments
involving over-expression or loss-of-function of certain signals. In several places, we refer to
genes expressed under a promoter. To express gene X under the promoter of gene Y means to
engineer genes such that X is always expressed together with Y. If the promoter of Y is ubiqui-
tously expressed, then X is expressed everywhere in the meristem, if the promoter of Y is site
specific, then X is expressed only in a subdomain of the meristem.
Perturbation of WUS. WUS over-expression: There exist different experimental works
studying an ubiquituous increase of WUS [41, 42]. Experimentally this has been accomplished
using a glucocorticoid-inducible form of WUS under a promoter that causes ubiquitous
expression. The experimental setting is modelled by the following modification of the equation
for WUS:
@tu0 ¼ D0Du0 þ k1wOsmallðtÞ� d0u0 þ c:
The positive constant c denotes the rate of WUS over-expression which is independent of
space, time and other signals. In the considered plants the induced ubiquitous WUS expres-
sion acts in addition to the physiological WUS expression in the organizing center. Therefore,
the equation contains both k1wOsmallðtÞand c source terms. The steady-state shown in Fig 3(A)
serves as initial condition for simulation of the experiment.
The biological experiments agree in the observation that the central zone gets larger. This
we also observe in the simulations. If the over-expression is high enough, the simulations show
a radial expansion of the CLV3 expression domain and the system converges to a state where
CLV3 is expressed in the whole meristem; Fig 3(B). This observation agrees with the experi-
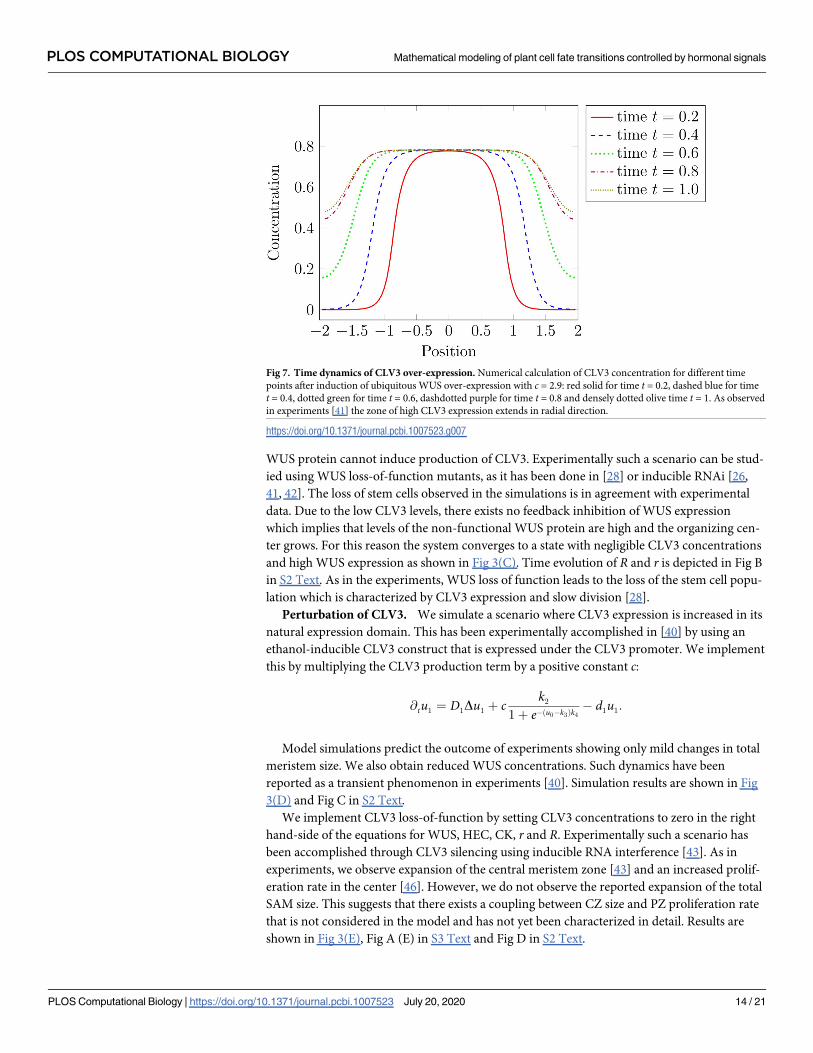
mental results from [41]. The radial expansion of the CLV3 expressing domain is depicted in
Fig 7. Biologically it has been considered unexpected that ubiquitous WUS over-expression
leads to a radial growth of the CZ instead of a simultaneous up-regulation of CZ fate in the
whole meristem. It has been speculated that the reason for this observation is that PZ cells
located at the boundary of the CZ respond differently to WUS compared to other PZ cells
[41]. The model simulations, however, suggest that the experimental observations can be
explained even if all PZ cells respond to WUS equally. The observation that the total meristem
size does not change significantly in the simulation matches also the experimental findings
[41]. In the simulations we see that ubiquitous WUS expression is linked to a reduction in pro-
liferation rate, see Fig A (B) in S3 Text, as it has been observed in experiments [41].
Simulations predict different outcomes for different levels of over-expression, Fig A in S2
Text. Since it is experimentally difficult to fine-tune the rate of over-expression, the diverse
outcomes obtained in the simulations have not yet been observed.
WUS loss-of-function: To simulate WUS loss of function, we set the WUS concentration
equal to zero in the equations for CLV3, HEC and CK. In this setting WUS is still produced
but it does not impact on dynamics of other signals. This corresponds e.g., to the case where
WUS cannot bind to its receptors. This scenario results in loss of stem cells, since the defective
PLOS COMPUTATIONAL BIOLOGY Mathematical modeling of plant cell fate transitions controlled by hormonal signals
PLOS Computational Biology | https://doi.org/10.1371/journal.pcbi.1007523 July 20, 2020 13 / 21
WUS protein cannot induce production of CLV3. Experimentally such a scenario can be stud-
ied using WUS loss-of-function mutants, as it has been done in [28] or inducible RNAi [26,
41, 42]. The loss of stem cells observed in the simulations is in agreement with experimental
data. Due to the low CLV3 levels, there exists no feedback inhibition of WUS expression
which implies that levels of the non-functional WUS protein are high and the organizing cen-
ter grows. For this reason the system converges to a state with negligible CLV3 concentrations
and high WUS expression as shown in Fig 3(C). Time evolution of R and r is depicted in Fig B
in S2 Text. As in the experiments, WUS loss of function leads to the loss of the stem cell popu-
lation which is characterized by CLV3 expression and slow division [28].
Perturbation of CLV3. We simulate a scenario where CLV3 expression is increased in its
natural expression domain. This has been experimentally accomplished in [40] by using an
ethanol-inducible CLV3 construct that is expressed under the CLV3 promoter. We implement
this by multiplying the CLV3 production term by a positive constant c:
@tu1 ¼ D1Du1 þ ck2
1þ e� ðu0 � k3Þk4� d1u1:
Model simulations predict the outcome of experiments showing only mild changes in total
meristem size. We also obtain reduced WUS concentrations. Such dynamics have been
reported as a transient phenomenon in experiments [40]. Simulation results are shown in Fig
3(D) and Fig C in S2 Text.
We implement CLV3 loss-of-function by setting CLV3 concentrations to zero in the right
hand-side of the equations for WUS, HEC, CK, r and R. Experimentally such a scenario has
been accomplished through CLV3 silencing using inducible RNA interference [43]. As in
experiments, we observe expansion of the central meristem zone [43] and an increased prolif-
eration rate in the center [46]. However, we do not observe the reported expansion of the total
SAM size. This suggests that there exists a coupling between CZ size and PZ proliferation rate
that is not considered in the model and has not yet been characterized in detail. Results are
shown in Fig 3(E), Fig A (E) in S3 Text and Fig D in S2 Text.
Fig 7. Time dynamics of CLV3 over-expression. Numerical calculation of CLV3 concentration for different time
points after induction of ubiquitous WUS over-expression with c = 2.9: red solid for time t = 0.2, dashed blue for time
t = 0.4, dotted green for time t = 0.6, dashdotted purple for time t = 0.8 and densely dotted olive time t = 1. As observed
in experiments [41] the zone of high CLV3 expression extends in radial direction.
https://doi.org/10.1371/journal.pcbi.1007523.g007
PLOS COMPUTATIONAL BIOLOGY Mathematical modeling of plant cell fate transitions controlled by hormonal signals
PLOS Computational Biology | https://doi.org/10.1371/journal.pcbi.1007523 July 20, 2020 14 / 21
Perturbation of CK. We simulate the following scenarios of CK perturbation:
• CK over-expression: during this experiment we change the degradation rate in the equation
for CK;
• CK loss of function: during this experiment we put 0 instead of the production term in the
CK-equation.
To study the impact of increased CK concentration the ckx3 ckx5 double mutant has been
used. In this mutant the degradation of CK via CKXs (cytokinin oxigenases/dehydrogenases)
is reduced [44]. We model this experiment by reducing the value of d2, which corresponds to
decreased CK degradation, as in the experiments. Numerical simulations are consistent with
the experiments in showing an increase of the OC, a slight increase of the CZ and an increase
in meristem radius [44].
Arabidopsis mutants lacking functional CK receptors, such as the cre1-12 ahk2-2 ahk3-3
triple mutant allow to study CK loss of function [37]. In agreement with experiments [36, 37]
simulations show a decrease of the OC radius and of the total meristem size, see Fig F in S2
Text.
New insights arising from in silico perturbation of HEC signaling
Simulation of HEC overexpression and loss-of-function. Recently, we have established
an experimental setting to study HEC over-expression in stem cells using an inducible HEC1
form expressed under the CLV3 promoter. The experiments show a change of meristem size
and stem cell number in case of HEC over-expression [9]. Our hypothesis is that HEC acts on
the OC cell differentiation or proliferation. This cannot be directly monitored in experiments
but can be tested using our model. We implement this experiment in the model by adding a
HEC production term that is proportional to the CLV3 source term in Eq (1). This yields the
following equation for HEC:
@tu3 ¼ D3Du3 þ ck2
1þ e� ðu0 � k3Þk4þ
k13
1þ k14u0
� d3u3;
where c describes the proportionality between HEC and CLV3 production resulting from the
expression of both signals under the same promoter. This scenario corresponds to the experi-
mental setting from [9], where HEC is expressed in stem cells that are characterized by high
CLV3 levels. For c large enough we observe that the system converges to a state with constant
in space signal concentrations. This corresponds to the experimentally observed expansion of
the CZ towards the boundaries of the meristem. Identically as in the experiments WUS, CLV3
and CK concentrations are increased compared to the wild-type meristem, Fig 3(H) for c = 3.
In the simulations, see Fig A (H) in S3 Text, as in the experiments [9], the proliferation rate is
reduced in the central zone and increased at the boundary of the meristem compared to the
wild-type. In agreement with experiments we observe an increase in total meristem radius R;
Fig G in S2 Text.
We implement HEC loss of function by setting HEC production equal to zero. As in experi-
mental data [11], we observe mild changes in WUS and CLV (Fig 3(I)) that are associated with
a smaller meristem (Fig H in S2 Text). The flux of cells from the meristem into lateral organs is
increased in the simulations compared to the wild-type. This is in agreement with the results
from [9]. Furthermore we see only very slight changes in proliferation rates which also fits to
the conclusions from [9].
Model simulations suggest a direct effect of HEC on OC cells. In Fig 2(B) we propose a
direct action of HEC on OC cell differentiation and an indirect action via CK. If we repeat
PLOS COMPUTATIONAL BIOLOGY Mathematical modeling of plant cell fate transitions controlled by hormonal signals
PLOS Computational Biology | https://doi.org/10.1371/journal.pcbi.1007523 July 20, 2020 15 / 21
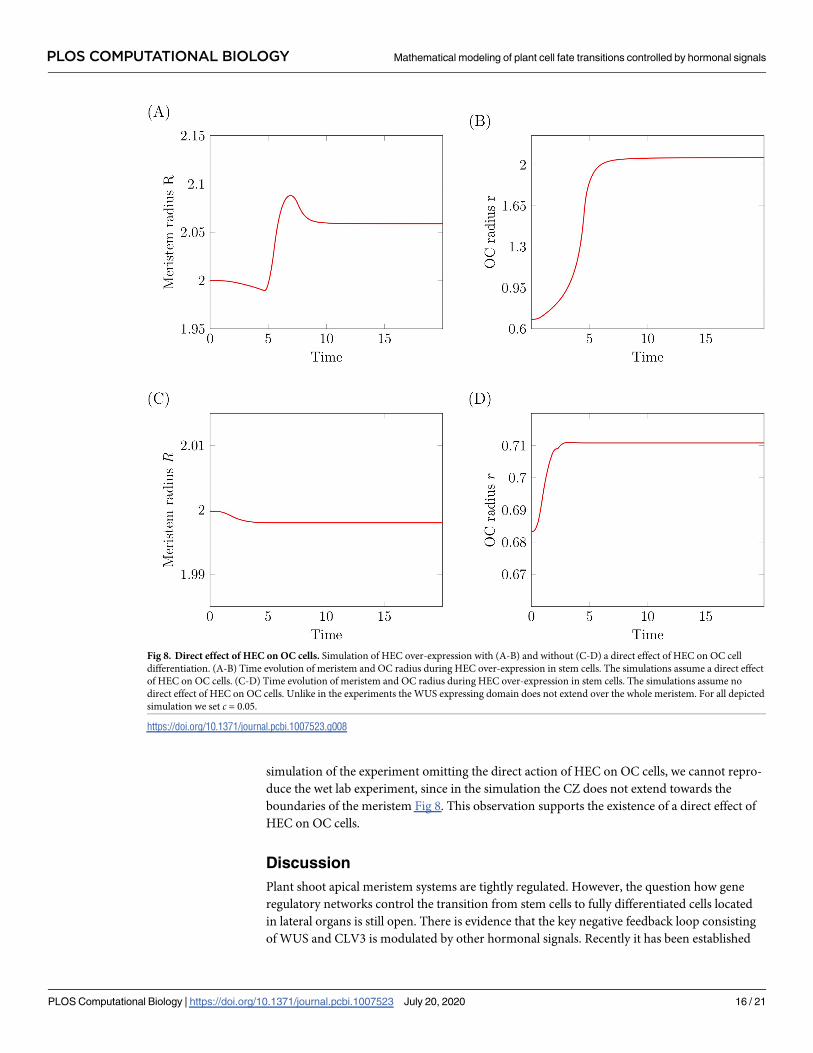
simulation of the experiment omitting the direct action of HEC on OC cells, we cannot repro-
duce the wet lab experiment, since in the simulation the CZ does not extend towards the
boundaries of the meristem Fig 8. This observation supports the existence of a direct effect of
HEC on OC cells.
Discussion
Plant shoot apical meristem systems are tightly regulated. However, the question how gene
regulatory networks control the transition from stem cells to fully differentiated cells located
in lateral organs is still open. There is evidence that the key negative feedback loop consisting
of WUS and CLV3 is modulated by other hormonal signals. Recently it has been established
Fig 8. Direct effect of HEC on OC cells. Simulation of HEC over-expression with (A-B) and without (C-D) a direct effect of HEC on OC cell
differentiation. (A-B) Time evolution of meristem and OC radius during HEC over-expression in stem cells. The simulations assume a direct effect
of HEC on OC cells. (C-D) Time evolution of meristem and OC radius during HEC over-expression in stem cells. The simulations assume no
direct effect of HEC on OC cells. Unlike in the experiments the WUS expressing domain does not extend over the whole meristem. For all depicted
simulation we set c = 0.05.
https://doi.org/10.1371/journal.pcbi.1007523.g008
PLOS COMPUTATIONAL BIOLOGY Mathematical modeling of plant cell fate transitions controlled by hormonal signals
PLOS Computational Biology | https://doi.org/10.1371/journal.pcbi.1007523 July 20, 2020 16 / 21
that HEC is an important regulator of cell fate transition in the shoot apical meristem. Experi-
mental works have studied the interaction of HEC with relevant plant hormones and its
impact on cell properties [5, 6, 9].
The model framework developed in this work allows to consider the interaction between
different regulatory signals and their impact on cell kinetics and fates. The 2d geometry
accounts for the planar heterogeneity of signal expression. The growing domain framework
keeping track of changes in SAM cell number allows to test hypotheses that relate signal con-
centrations to cell proliferation and differentiation.
The model developed in this work is based on the assumption that HEC inhibits the differ-
entiation (or promotes the proliferation) of OC cells leading to an increase of the WUS
expressing domain and thus to an increase of the CZ. We simulate the impact of the configura-
tion of the regulatory network on the time evolution of signal concentrations, OC size, CZ size
and total meristem cell count. Using fluorescence constructs all these quantities are experi-
mentally accessible. The proposed regulatory feedbacks are able to qualitatively reproduce
meristem changes under WUS loss of function, CLV3 loss of function, HEC over-expression,
HEC loss of function and CK loss of function. This supports the hypothesis that HEC directly
and indirectly (via CK) leads to a reduction of OC cell differentiation (or an increase of OC
cell proliferation).
Our simulations lead to several new biological insights. It is known that HEC is not
expressed in OC cells and that experimental expression of HEC in the OC leads to the loss of
the meristem [6]. Our model suggests that HEC directly acts on OC cell kinetics and that this
action is required to observe the growth of the CZ in HEC over-expression experiments.
In addition to this there exists a CK mediated effect of HEC on OC cell differentiation:
HEC increases CK expression and CK affects OC cells. This HEC mediated increase of CK sig-
naling is required to explain the reduced CK levels observed in the hec1,2,3 triple mutant [9].
The effect of CK on OC cell differentiation explains the change of OC size under CK perturba-
tion. Together these control couplings constitute an indirect CK-mediated effect of HEC on
OC cell differentiation. It is difficult to predict intuitively whether this indirect effect is suffi-
cient to explain experimental results or whether an additional direct action of HEC on the OC
is required. Our simulations suggest that without the direct effect the WUS expressing domain
does not show the gradual increase until it reaches the boundary of the meristem as it has been
observed experimentally in [9]. Therefore, our simulations support the existence of a direct
effect of HEC on OC cell kinetics. The investigation of HEC target genes may help to identify
reguatory nodes mediating the effect of HEC and to integrate them with known candidates
such as NGATHA [47].
In case of CLV3 loss of function or increased CK activity, the model predicts an increase of
the CZ what is reflected by experiments [43, 44], however it fails to reproduce the observed
growth of the meristem. The reason for this is that in the model system PZ cells are recommit-
ted to the stem cell fate, due to increase of WUS activity, which leads to an increase of the pool
of slowly dividing stem cells at the expense of fast dividing PZ cells. Hence, the model results
in disappearance of the PZ. The discrepancy between the model predictions and the experi-
mental data showing maintenance of the PZ suggests that there exists an additional mecha-
nism compensating the loss of PZ due to loss of CLV3 function. A molecular mechanism
underlying this observation is not known. In [43], the authors observe an increase of PZ cell
proliferation rates in case of CZ expansion and refer to it as a “long-distance effect”. Similarly,
in [9] an increase in the PZ mitotic index is observed following the CZ expansion due to HEC
over-expression in stem cells. Taking into account that HEC is unable to move from cell to
cell, the latter observation suggests that there exists a non-cell autonomous mechanism that
adjusts the number of PZ cells to the size of the CZ. Our model verifies that CK signalling is
PLOS COMPUTATIONAL BIOLOGY Mathematical modeling of plant cell fate transitions controlled by hormonal signals
PLOS Computational Biology | https://doi.org/10.1371/journal.pcbi.1007523 July 20, 2020 17 / 21
not sufficient to mediate this effect. In [41] it is discussed that a dose-dependent inhibitory
effect of WUS on proliferation rates may play a role in this context. Furthermore, ERECTA
signalling may be involved in confining the WUS and CLV3 expression to the meristem centre
by repressing both signals [48, 49]. These mechanisms could be compared in future extension
of our model.
Future version of the model have to include auxin signaling. It is known that auxin pro-
motes cell fate transition from the PZ to lateral organs. Auxin signaling is repressed by WUS
[42] in the meristem center and modulated by HEC in the meristem periphery [9]. The pro-
posed computational framework is ideally suited to investigate details of these interactions.
In conclusion, we have developed a modeling framework that allows to study how gene reg-
ulatory networks control fate transition dynamics in the shoot apical meristem. We propose a
network configuration that is sufficient to reproduce key experiments. Our simulations pro-
vide new insights in the effect of HEC and lead to the hypothesis that HEC directly and indi-
rectly (via CK) reduces OC cell differentiation rates and thus induces an expansion of the
central zone of the meristem if it is over-expressed in stem cells.
Methods
For numerical computations, the coupled system of reaction-diffusion Eq (1) and domain
evolvement (2) is decoupled using explicit equation splitting. The PDEs are then solved by the
moving finite element method [50] using conforming piecewise bilinear finite elements on
quadrilaterals in space and the implicit Euler method in time. The arising nonlinear algebraic
system is solved with Newton’s method where the (linear) Jacobian system is solved with a
sparse direct solver. The ODEs for domain movement are discretized by the explicit Euler
method. Implementation has been carried out in the PDE software framework Dune/PDELab
[20–22]. Details of the numerical scheme are provided in S4 Text.
All numerical experiments are done for mesh size N = 50 (i.e., 90404 degrees of freedom)
and time step Δt = 0.05. Following biologically relevant assumptions, we keep r smaller than R.
Secondly, we take smaller time steps if radii change very rapidly. One of main problems in
numerical simulation is the form of the evolutionary equation describing the dynamics of r.To calculate its right-hand side, we integrate a nonlinear function which depends on the
model solution. It poses a numerical error. Hence, estimating parameters pdbasic and pp based
on the prescribed steady-state values of r and R leads to different parameter values depending
on the mesh size. The values of pp and pdbasic used in numerical analysis of the model are val-
ues obtained in a limiting procedure. That explains why in Fig 4(C) we obtain the different val-
ues of inner radius for different mesh sizes.
Supporting information
S1 Text. Functions f and g.
(PDF)
S2 Text. Additional simulations results.
(PDF)
S3 Text. Spatial dependence of proliferation rates.
(PDF)
S4 Text. Description of the numerical scheme.
(PDF)
PLOS COMPUTATIONAL BIOLOGY Mathematical modeling of plant cell fate transitions controlled by hormonal signals
PLOS Computational Biology | https://doi.org/10.1371/journal.pcbi.1007523 July 20, 2020 18 / 21
S5 Text. Sensitivity.
(PDF)
Author Contributions
Conceptualization: Thomas Stiehl, Jan U. Lohmann, Anna Marciniak-Czochra.
Formal analysis: Filip Z. Klawe, Thomas Stiehl.
Funding acquisition: Anna Marciniak-Czochra.
Investigation: Filip Z. Klawe, Thomas Stiehl.
Methodology: Filip Z. Klawe, Thomas Stiehl.
Software: Filip Z. Klawe, Peter Bastian.
Supervision: Anna Marciniak-Czochra.
Validation: Christophe Gaillochet, Jan U. Lohmann.
Visualization: Filip Z. Klawe, Thomas Stiehl.
Writing – original draft: Filip Z. Klawe, Thomas Stiehl.
Writing – review & editing: Christophe Gaillochet, Anna Marciniak-Czochra.
References1. Park SJ, Jiang K, Tal L, Yichie Y, Gar O, Zamir D, et al. Optimization of crop productivity in tomato using
induced mutations in the florigen pathway. Nat Genet. 2014; 46:1337–42. PMID: 25362485
2. Park SJ, Jiang K, Schatz MC, Lippman ZB. Rate of meristem maturation determines inflorescence
architecture in tomato. PNAS. 2012; 109:693–44.
3. Yang W, Schuster C, Beahan CT, Charoensawan V, Peaucelle A, Bacic A, et al. Regulation of Meristem
Morphogenesis by Cell Wall Synthases in Arabidopsis. Curr Biol. 2016; 26(11):1404–1415. https://doi.
org/10.1016/j.cub.2016.04.026 PMID: 27212401
4. Gruel J, Landrein B, Tarr P, Schuster C, Refahi Y, Sampathkumar A, et al. An epidermis-driven mecha-
nism positions and scales stem cell niches in plants. Sci Adv. 2016; 2. https://doi.org/10.1126/sciadv.
1500989 PMID: 27152324
5. Gaillochet C, Daum G, Lohmann JU. O cell, where art thou? The mechanisms of shoot meristem pat-
terning. Curr Opin Plant Biol. 2015; 23:91–97. PMID: 25449732
6. Schuster C, Gaillochet C, Medzihradszky A, Busch W, Daum G, Krebs M, et al. A regulatory framework
for shoot stem cell control integrating metabolic, transcriptional, and phytohormone signals”. Dev Cell.
2014; 28(4):438–49.
7. Schoof H, Lenhard M, Haecker A, Mayer KFX, Juergens G, Laux T. The stem cell population of Arabi-
dopsis shoot meristems in maintained by a regulatory loop between the CLAVATA and WUSCHEL
genes. Cell. 2000; 100(6):635–644. PMID: 10761929
8. Brand U, Fletcher JC, Hobe M, Meyerowitz EM, Simon R. Dependence of stem cell fate in Arabidopsis
on a feedback loop regulated by CLV3 activity. Science. 2000; 289(5479):617–619. PMID: 10915624
9. Gaillochet C, Stiehl T, Wenzl C, Ripoll JJ, Bailey-Steinitz LJ, Li L, et al. Control of plant cell fate transi-
tions by transcriptional and hormonal signals. Elife. 2017; 6:e30135. https://doi.org/10.7554/eLife.
30135 PMID: 29058667
10. Jonsson H, Heisler MG, Shapiro BE, Meyerowitz EM, Mjolsness E. An auxin-driven polarized transport
model for phyllotaxis. Proc Natl Acad Sci U S A. 2006; 103(5):1633–1638. https://doi.org/10.1073/pnas.
0509839103 PMID: 16415160
11. Gordon SP, Chickarmane VS, Ohno C, Meyerowitz EM. Multiple feedback loops through cytokinin sig-
naling control stem cell number within the Arabidopsis shoot meristem. Proc Natl Acad Sci U S A. 2009;
106(38):16529–34. https://doi.org/10.1073/pnas.0908122106 PMID: 19717465
12. Chickarmane VS, Gordon SP, Tarr PT, Heisler MG, Meyerowitz EM. Cytokinin signaling as a positional
cue for patterning the apical-basal axis of the growing Arabidopsis shoot meristem. Proc Natl Acad Sci
U S A. 2012; 109(10):4002–4007. https://doi.org/10.1073/pnas.1200636109 PMID: 22345559
PLOS COMPUTATIONAL BIOLOGY Mathematical modeling of plant cell fate transitions controlled by hormonal signals
PLOS Computational Biology | https://doi.org/10.1371/journal.pcbi.1007523 July 20, 2020 19 / 21
13. Geier F, Lohmann JU, Gerstung M, Maier AT, Timmer J, Fleck C. A quantitative and dynamic model for
plant stem cell regulation. PLoS One. 2008; 3(10):e3553. https://doi.org/10.1371/journal.pone.0003553
PMID: 18958283
14. Fujita H, Toyokura K, Okada K, Kawaguchi M. Reaction-diffusion pattern in shoot apical meristem of
plants. PLoS One. 2011; 6(3):e18243. https://doi.org/10.1371/journal.pone.0018243 PMID: 21479227
15. Yadav RK, Perales M, Gruel J, Ohno C, Heisler M, Girke T, et al. Plant stem cell maintenance involves
direct transcriptional repression of differentiation program. Mol Syst Biol. 2013; 9:654. https://doi.org/
10.1038/msb.2013.8 PMID: 23549482
16. Jonsson H, Heisler M, Reddy GV, Agrawal V, Gor V, Shapiro BE, et al. Modeling the organization of the
WUSCHEL expression domain in the shoot apical meristem. Bioinformatics. 2005; 21 Suppl 1:i232–40.
PMID: 15961462
17. Zubairova US, Nikolaev SV. Models of regulation of stem cell niche structure in shoot apical meristem.
Russian Journal of Genetics. 2014; 4(4):273–280.
18. Hamant O, Heisler MG, Jonsson H, Krupinski P, Uyttewaal M, Bokov P, et al. Developmental patterning
by mechanical signals in Arabidopsis. Science. 2008; 322(5908):1650–1655. PMID: 19074340
19. Yadav RK, Perales M, Gruel J, Girke T, Jonsson H, Reddy GV. WUSCHEL protein movement mediates
stem cell homeostasis in the Arabidopsis shoot apex. Genes Dev. 2011; 25(19):2025–2030. https://doi.
org/10.1101/gad.17258511 PMID: 21979915
20. Bastian P, Blatt M, Dedner A, Engwer C, Klofkorn R, Kornhuber R, et al. A generic grid interface for par-
allel and adaptive scientific computing. Part II: implementation and tests in DUNE. Computing. 2008; 82
(2):121–138.
21. Bastian P, Blatt M, Dedner A, Engwer C, Klofkorn R, Ohlberger M, et al. A generic grid interface for par-
allel and adaptive scientific computing. Part I: abstract framework. Computing. 2008; 82(2):103–119.
22. Bastian P, Heimann F, Marnach S. Generic implementation of finite element methods in the Distributed
and Unified Numerics Environment (DUNE). Kybernetika. 2010; 46(2):294–315.
23. Reddy GV, Heisler MG, Ehrhardt DW, Meyerowitz EM. Real-time lineage analysis reveals oriented cell
divisions associated with morphogenesis at the shoot apex of Arabidopsis thaliana. Development.
2004; 131(17):4225–4237. PMID: 15280208
24. Satina S, Blakeslee AF, Avery AG. Demonstration of the Three Germ Layers in the Shoot Apex of
Datura by Means of Induced Polyploidy in Periclinal Chimeras. Am J Botany. 1940; 27(10):895–905.
25. Meyerowitz EM. Control of cell division patterns in developing shoots and flowers of Arabidopsis thali-
ana. Cold Spring Habr Quant Biol. 1997; 62:369–375.
26. Daum G, Medzihradszky A, Suzaki T, Lohmann JU. A mechanistic framework for noncell autonomous
stem cell induction in Arabidopsis. Proc Natl Acad Sci U S A. 2014; 111(40):14619–14624. https://doi.
org/10.1073/pnas.1406446111 PMID: 25246576
27. Leibfried A, To JPC, Busch W, Stehling S, Kehle A, Demar M, et al. WUSCHEL controls meristem func-
tion by direct regulation of cytokinin-inducible response regulators. Nature. 2005; 438(7071):1172–
1175. PMID: 16372013
28. Laux T, Mayer KF, Berger J, Juergens G. The WUSCHEL gene is required for shoot and floral meristem
integrity in Arabidopsis. Development. 1996; 122(1):87–96. PMID: 8565856
29. Sablowski R, Carnier Dornelas M. Interplay between cell growth and cell cycle in plants. J Exp Bot.
2014; 65(10):2703–2714. PMID: 24218325
30. Bogre L, Magyar Z, Lopez-Juez E. New clues to organ size control in plants. Genome Biol. 2008; 9
(7):226–226. https://doi.org/10.1186/gb-2008-9-7-226 PMID: 18671834
31. Willis L, Refahi Y, Wightman R, Landrein B, Teles J, Huang KC, et al. Cell size and growth regulation in
the Arabidopsis thaliana apical stem cell niche. Proc Natl Acad Sci U S A. 2016; 113(51):E8238–E8246.
https://doi.org/10.1073/pnas.1616768113 PMID: 27930326
32. Wolf S, Hematy K, Hofte H. Growth control and cell wall signaling in plants. Annu Rev Plant Biol. 2012;
63:381–407. PMID: 22224451
33. Sampathkumar A, Peaucelle A, Fujita M, Schuster C, Persson S, Wasteneys GO, et al. Primary wall
cellulose synthase regulates shoot apical meristem mechanics and growth. Development. 2019; 146
(10):dev179036. https://doi.org/10.1242/dev.179036 PMID: 31076488
34. Long Y, Cheddadi I, Mosca G, Mirabet V, Dumond M, Kiss A, et al. Cellular Heterogeneity in Pressure
and Growth Emerges from Tissue Topology and Geometry. Curr Biol. 2020.
35. Reddy GV, Heisler MG, Ehrhardt DW, Meyerowitz EM. Real-time lineage analysis reveals oriented cell
divisions associated with morphogenesis at the shoot apex of Arabidopsis thaliana. Development.
2004; 131(17):4225–4237. PMID: 15280208
PLOS COMPUTATIONAL BIOLOGY Mathematical modeling of plant cell fate transitions controlled by hormonal signals
PLOS Computational Biology | https://doi.org/10.1371/journal.pcbi.1007523 July 20, 2020 20 / 21
36. Werner T, Motyka V, Laucou V, Smets R, Onckelen HV, Schmulling T. Cytokinin-Deficient Transgenic
Arabidopsis Plants Show Multiple Developmental Alterations Indicating Opposite Functions of Cytoki-
nins in the Regulation of Shoot and Root Meristem Activity. The Plant Cell. 2003; 15:2532–2550.
https://doi.org/10.1105/tpc.014928 PMID: 14555694
37. Higuchi M, Pischke MS, Mahonen AP, Miyawaki K, Hashimoto Y, Seki M, et al. In planta functions of
the Arabidopsis cytokinin receptor family. Proc Natl Acad Sci U S A. 2004; 101(23):8821–8826. https://
doi.org/10.1073/pnas.0402887101 PMID: 15166290
38. Deb Y, Marti D, Frenz M, Kuhlemeier C, Reinhardt D. Phyllotaxis involves auxin drainage through leaf
primordia. Development. 2015; 142(11):1992–2001. PMID: 25953346
39. Heisler MG, Ohno C, Das P, Sieber P, Reddy GV, Long JA, et al. Patterns of auxin transport and gene
expression during primordium development revealed by live imaging of the Arabidopsis inflorescence
meristem. Curr Biol. 2005; 15(21):1899–1911. PMID: 16271866
40. Muller R, Borghi L, Kwiatkowska D, Laufs P, Simon R. Dynamic and compensatory responses of Arabi-
dopsis shoot and floral meristems to CLV3 signaling. Plant Cell. 2006; 18(5):1188–98. https://doi.org/
10.1105/tpc.105.040444 PMID: 16603652
41. Yadav RK, Tavakkoli M, Reddy GV. WUSCHEL mediates stem cell homeostasis by regulating stem
cell number and patterns of cell division and differentiation of stem cell progenitors. Development. 2010;
137(21):3581–9. PMID: 20876644
42. Ma Y, Miotk A, Sutiković Z, Ermakova O, Wenzl C, Medzihradszky A, et al. WUSCHEL acts as an auxin
response rheostat to maintain apical stem cells in Arabidopsis. Nat Commun. 2019; 10(1):5093. https://
doi.org/10.1038/s41467-019-13074-9 PMID: 31704928
43. Reddy GV, Meyerowitz EM. Stem-cell homeostasis and growth dynamics can be uncoupled in the Ara-
bidopsis shoot apex. Science. 2005; 310(5748):663–7. PMID: 16210497
44. Bartrina I, Otto E, Strnad M, Werner T, Schmulling T. Cytokinin regulates the activity of reproductive
meristems, flower organ size, ovule formation, and thus seed yield in Arabidopsis thaliana. Plant Cell.
2011; 23(1):69–80. https://doi.org/10.1105/tpc.110.079079 PMID: 21224426
45. Perales M, Rodriguez K, Snipes S, Yadav RK, Diaz-Mendoza M, Reddy GV. Threshold-dependent tran-
scriptional discrimination underlies stem cell homeostasis. Proc Natl Acad Sci U S A. 2016; 113(41):
E6298–E6306. https://doi.org/10.1073/pnas.1607669113 PMID: 27671653
46. Clark S, Running M, Meyerowitz E. CLAVATA3 is a specific regulator of shoot and floral meristem
development affecting the same processes as CLAVATA1. Development. 1995; 121:2057–2067.
47. Jamge S, van der Wal F, Angenent G, Immink R, Lohmann JU. A molecular network for functional ver-
satility of HECATE transcription factors. Plant J. 2018; 95(1):57–70. PMID: 29667268
48. Zhang L, DeGennaro D, Lin G, Chai J, Shpak ED. ERECTA family signaling constrains CLAVATA3 and
WUSCHEL to the center of the shoot apical meristem. bioRxiv. 2020;https://doi.org/10.1101/2020.02.
24.962787.
49. Kosentka PZ, Overholt A, Maradiaga R, Mitoubsi O, Shpak ED. EPFL Signals in the Boundary Region
of the SAM Restrict Its Size and Promote Leaf Initiation. Plant Physiol. 2019; 179(1):265–279. https://
doi.org/10.1104/pp.18.00714 PMID: 30409857
50. Madzvamuse A, Maini PK, Wathen AJ. A Moving Grid Finite Element Method for the Simulation of Pat-
tern Generation by Turing Models on Growing Domains. Journal of Scientific Computing. 2005; 24
(2):247–262.
PLOS COMPUTATIONAL BIOLOGY Mathematical modeling of plant cell fate transitions controlled by hormonal signals
PLOS Computational Biology | https://doi.org/10.1371/journal.pcbi.1007523 July 20, 2020 21 / 21