Embed Size (px)
Citation preview
Investigation of the Fate ofInvestigation of the Fate of Dispersed Oil in Aquatic Systems
James BonnerJames BonnerMichael Sterling
Cheryl PageCheryl PageChris Fuller
Texas A&M UniversityC ll St ti TX USACollege Station, TX, USA
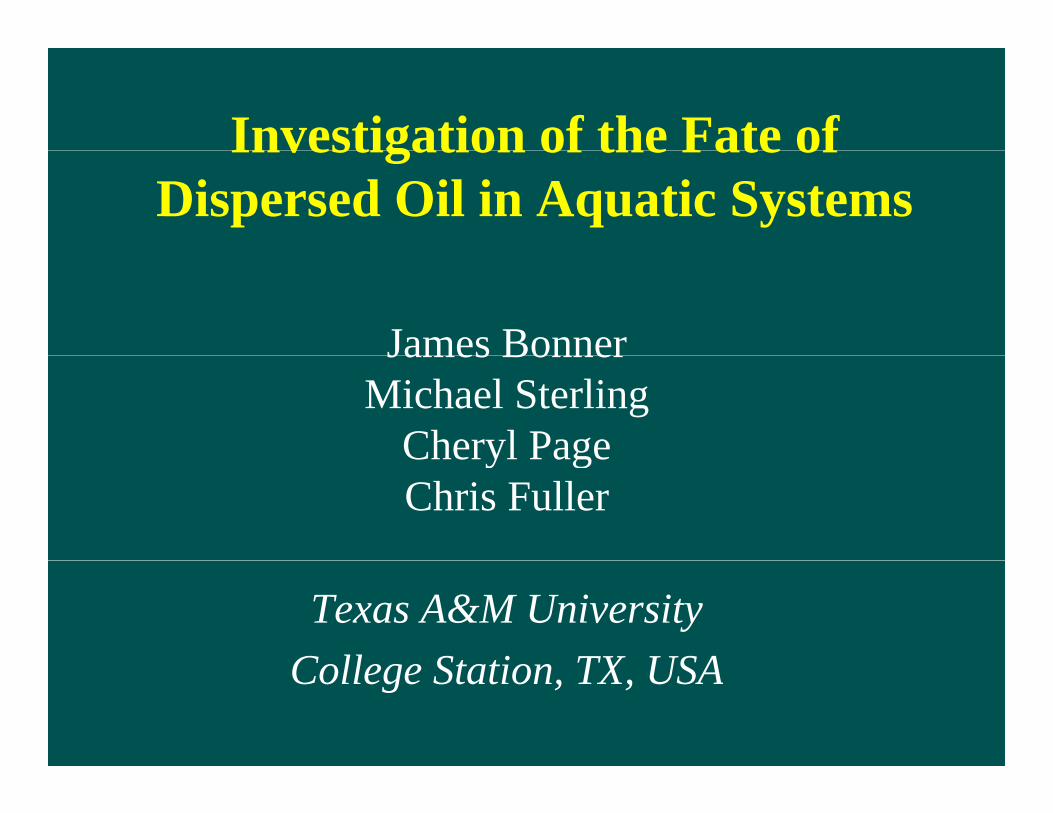
Early Oil Spill Research
• Emphasized fundamental “basic” science and hypothesis testingscience and hypothesis testing
• Advocated surface science principles “colloidal” applied to oil spill research
• His work led to other investigators winning Nobel Prize
• Advocated in situ oil spill monitoring• Advocated in situ oil spill monitoring to gain insight to behavior and understanding
• Advocated Intentional Release of Oil & Scaled experiments
• Could not get a U S permit soBen Franklin -- 1st U. S. Oil Spill ResearcherCould not get a U.S. permit, so
conducted research in Englandp
Presentation ObjectivesDiscussion points & results involving:
• experiments with crude oil dispersions at multiple scales including laboratory, mesocosm, controlled field and full field scale;
• ‘scaling’ as a primary experimental design criterion;
• theoretical hypothesis testing involving mathematical modeling approaches;
• Understanding of key environmental processes is critical to the understanding, prediction, and management of dispersed oil fateunderstanding, prediction, and management of dispersed oil fate in aqueous systems.
PhD Pipeline ProjectHistorical OverviewHistorical Overview
(1993-current)• Funded by Texas General Land Office (TGLO,
API, MSRC, NSF, ONR, COE, TCEQ, NYSRF. ExxonMobil, ARO, DOD, DOE, CODAR, FI…….. Others
• Long-term collaboration for better understanding of oil spill remediation technology
• Multi-disciplinary research team
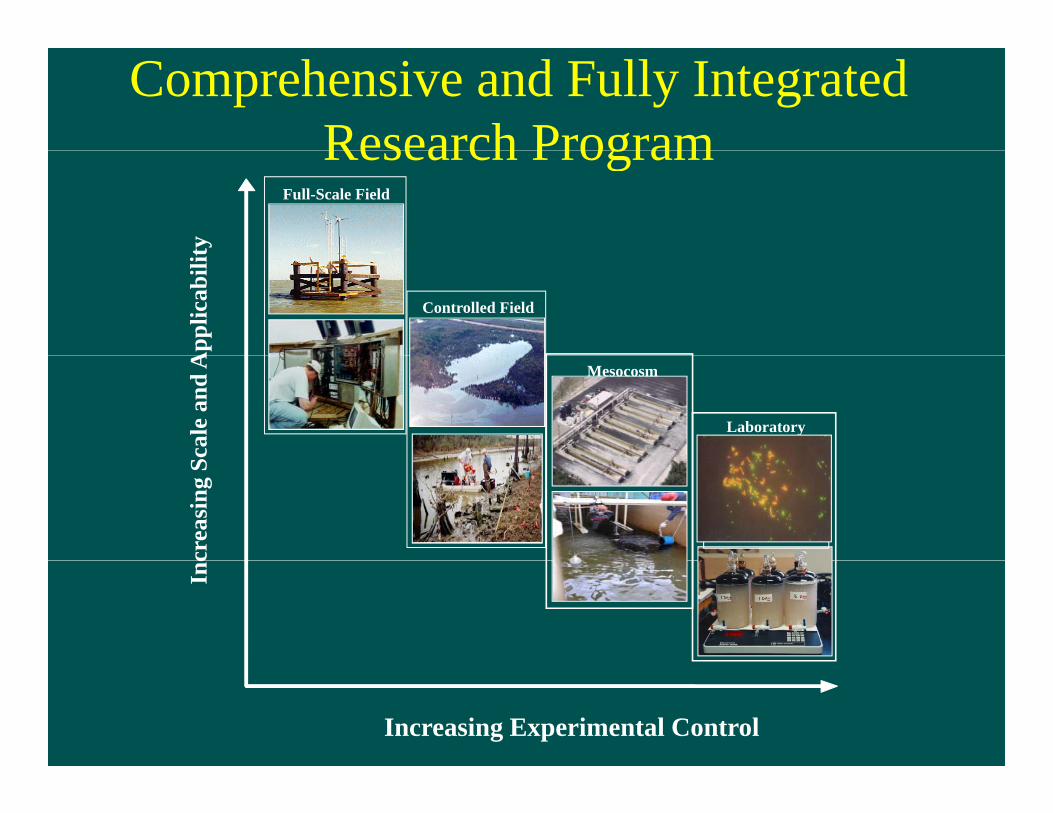
Comprehensive and Fully Integrated Research Program
Full-Scale Fieldty
Research Program
Controlled Field
App
licab
ilit
Mesocosm
Laboratory
cale
and
Acr
easi
ng S
Inc
Increasing Experimental Control
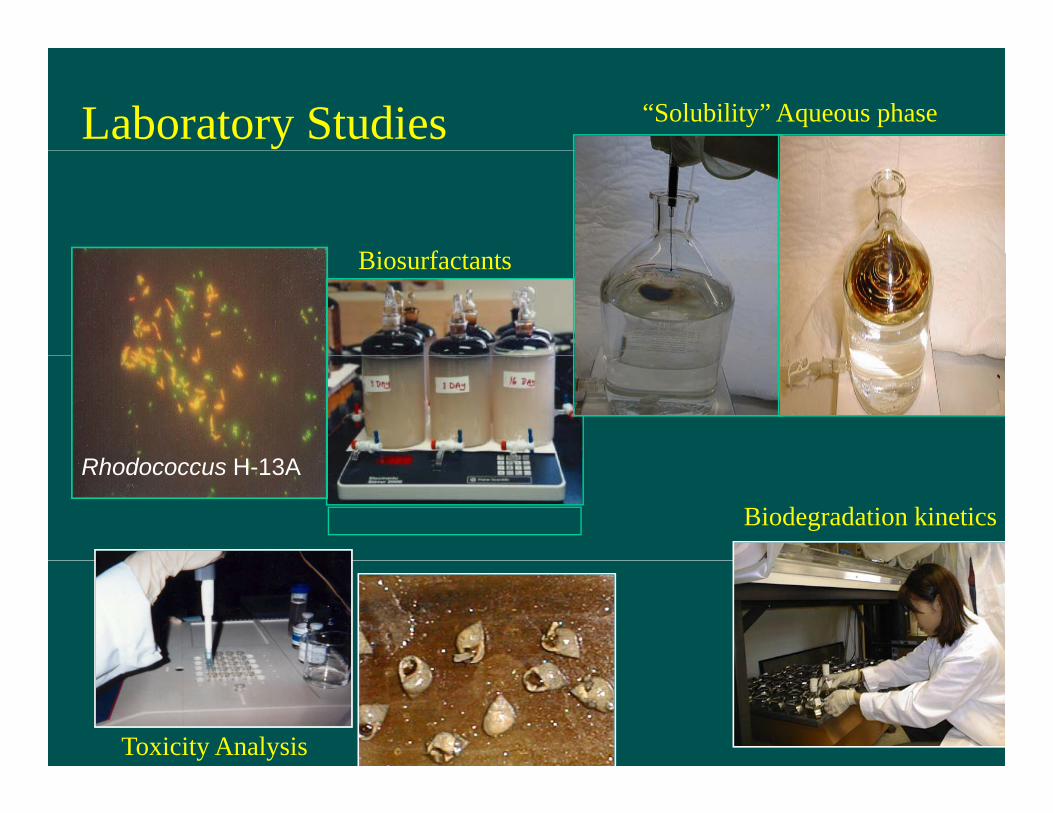
“Solubility” Aqueous phaseLaboratory Studies
Bi fBiosurfactants
Rh d H 13ARhodococcus H-13A
Biodegradation kinetics
Toxicity Analysis
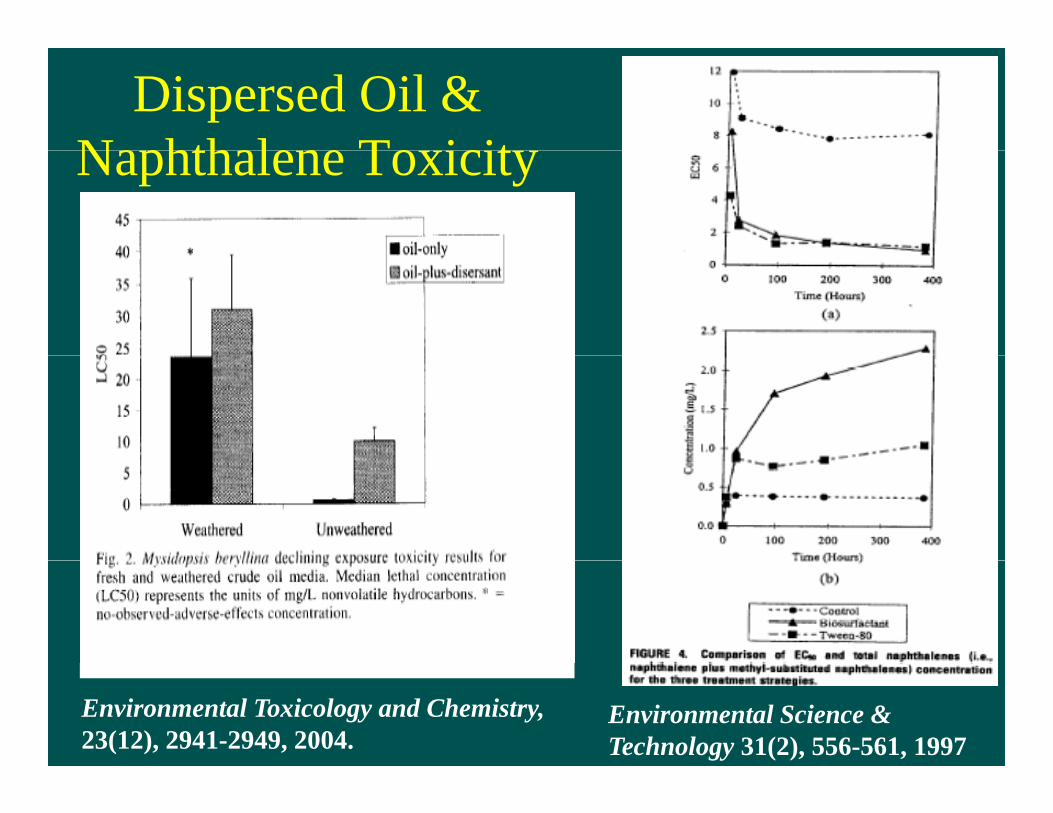
Dispersed Oil & N hth l T i itNaphthalene Toxicity
Environmental Science & Technology 31(2), 556-561, 1997
Environmental Toxicology and Chemistry, 23(12), 2941-2949, 2004.
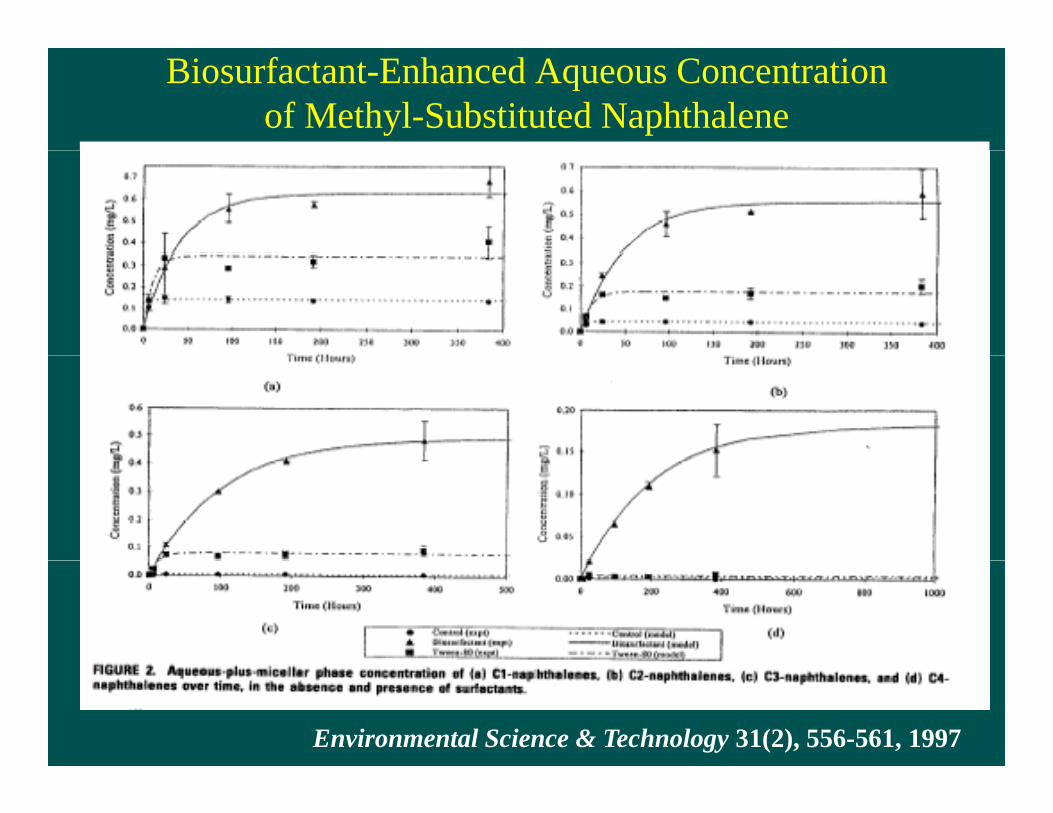
Biosurfactant-Enhanced Aqueous Concentration of Methyl-Substituted Naphthalene
Environmental Science & Technology 31(2), 556-561, 1997
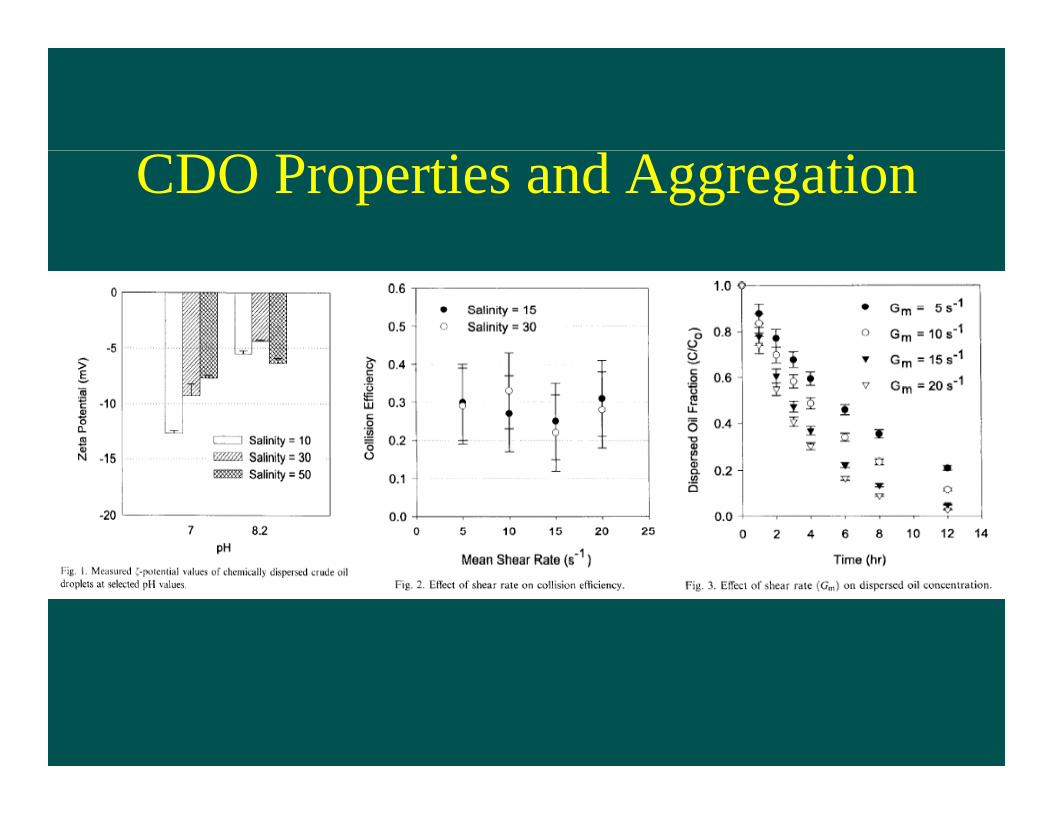
CDO Properties and Aggregation
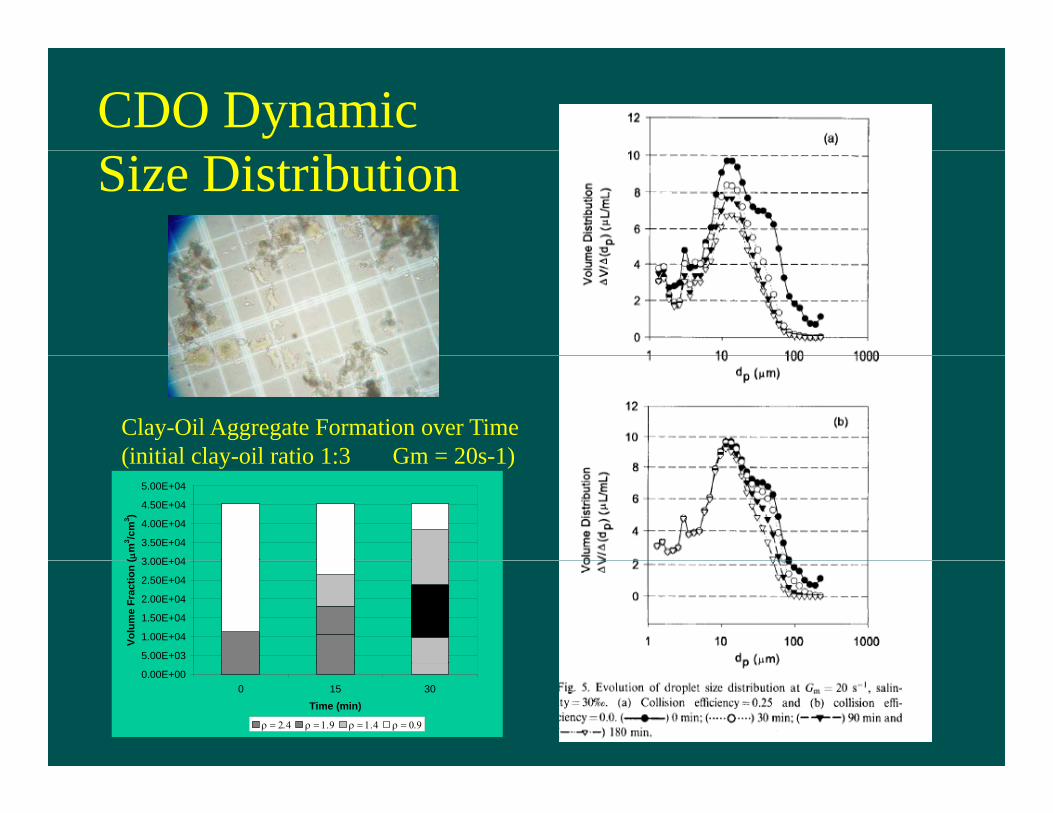
CDO Dynamic Size Distribution
Clay-Oil Aggregate Formation over Time(initial clay-oil ratio 1:3 Gm = 20s-1)
3 00E+04
3.50E+04
4.00E+04
4.50E+04
5.00E+04
( m
3 /cm
3 )
(initial clay-oil ratio 1:3 Gm = 20s-1)
5.00E+03
1.00E+04
1.50E+04
2.00E+04
2.50E+04
3.00E+04
Volu
me
Frac
tion
(
0.00E+000 15 30
Time (min)

CDO Biodegradation RatesAt these ese
Rates in
3 Days
95%
Reduction
At these Rates in30 Daysy95%Reduction

Real-time In situ Sensor Development
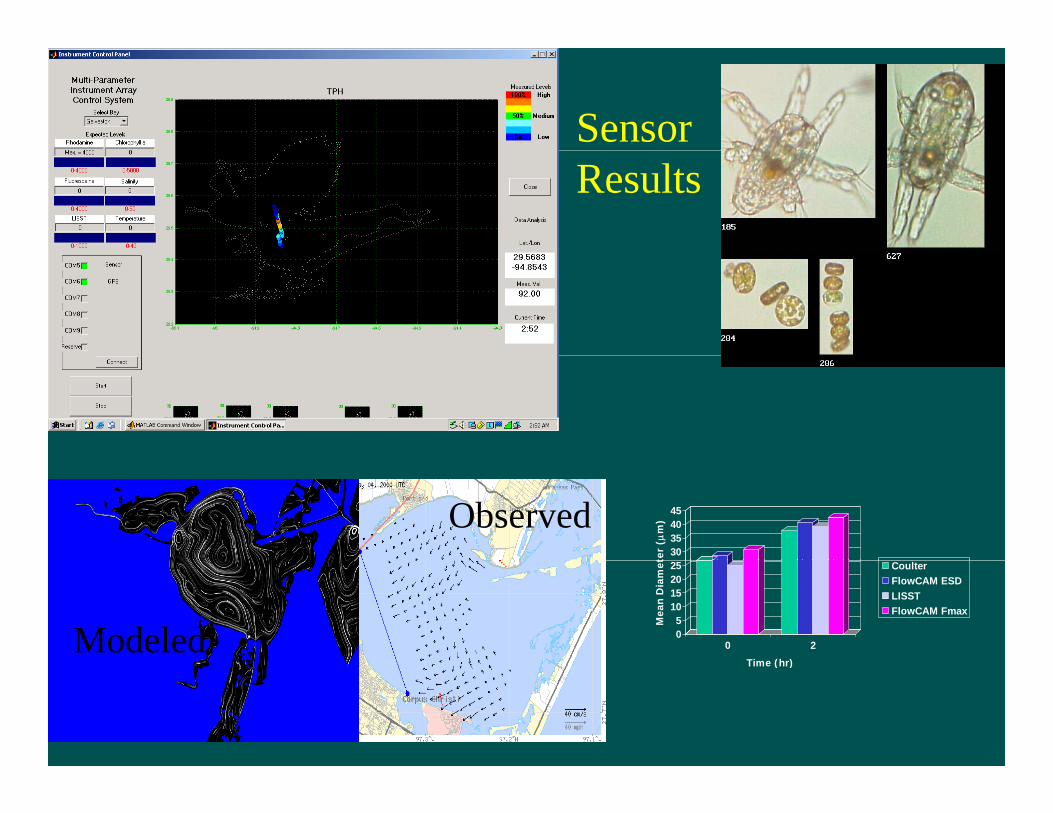
Sensor Results
Observed30354045
ter
(m
)Modeled 0
510152025
Mea
n D
iam
et0 2
Time (hr)
CoulterFlowCAM ESDLISSTFlowCAM Fmax
Time (hr)
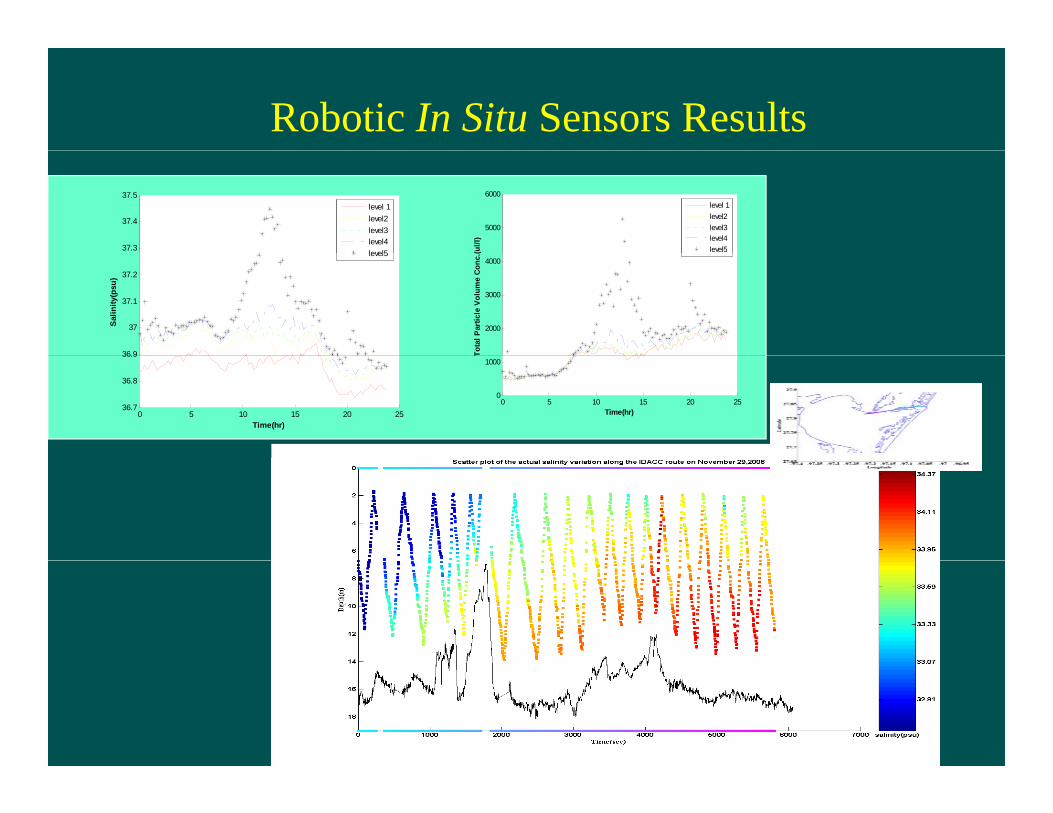
Robotic In Situ Sensors Results
37.3
37.4
37.5level 1level2level3level4level5
5000
6000
(ul/l
)
level 1level2level3level4level5
36 9
37
37.1
37.2
Sal
inity
(psu
)
level5
2000
3000
4000
Tota
l Par
ticle
Vol
ume
Conc
.(
0 5 10 15 20 2536.7
36.8
36.9
Time(hr)
0 5 10 15 20 250
1000
Time(hr)
T
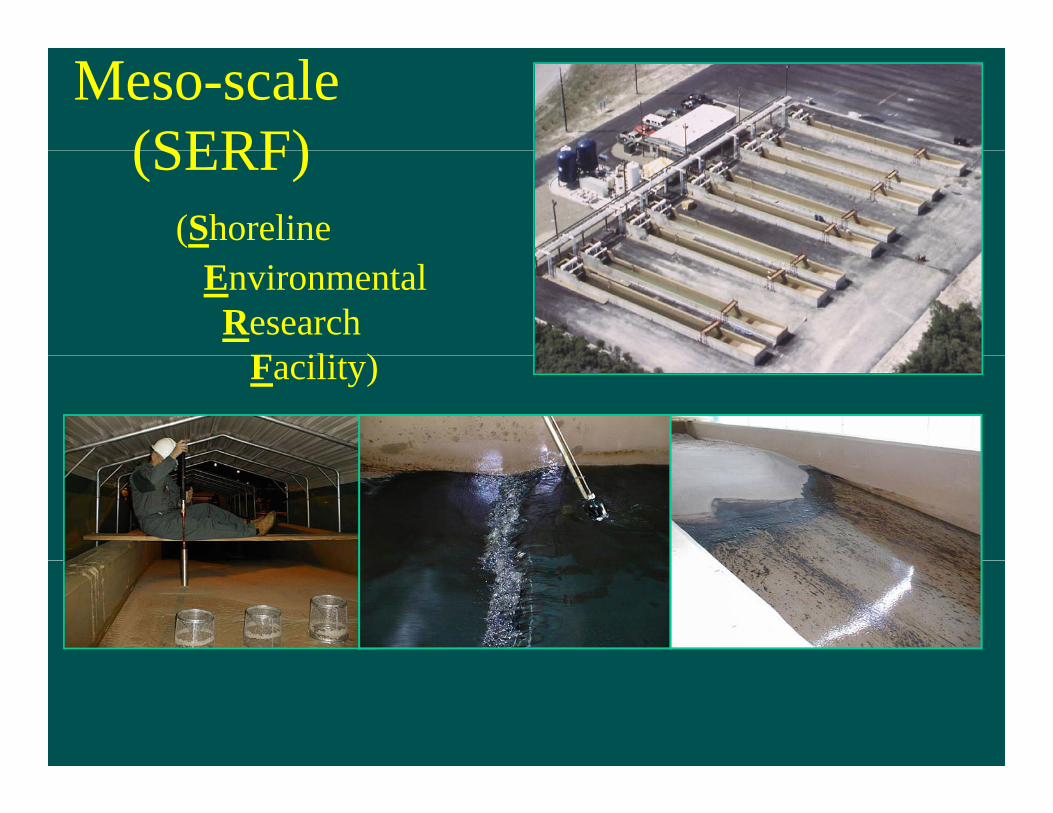
Meso-scale (SERF)(SERF)
(Shoreline Environmental
Research F ili )Facility)
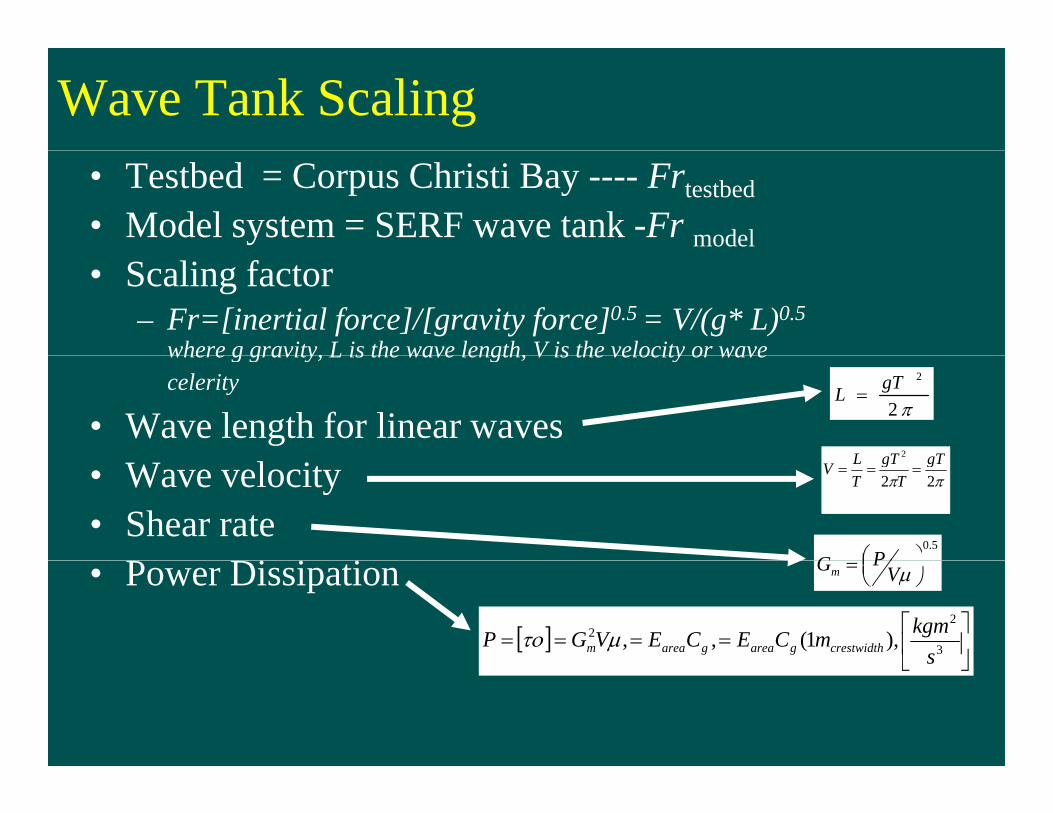
Wave Tank Scaling• Testbed = Corpus Christi Bay ---- Frtestbed• Model system = SERF wave tank -Fr model• Scaling factor
– Fr=[inertial force]/[gravity force]0.5 = V/(g* L)0.5
where g gravity, L is the wave length, V is the velocity or wavewhere g gravity, L is the wave length, V is the velocity or wave celerity
• Wave length for linear waves 2
2gTL
2 gTgTL• Wave velocity • Shear rate
i i i
22gT
TgT
TLV
5.0
PG• Power Dissipation
V
PGm
3
22 ),1(,,
skgmmCECEVGP crestwidthgareagaream
s
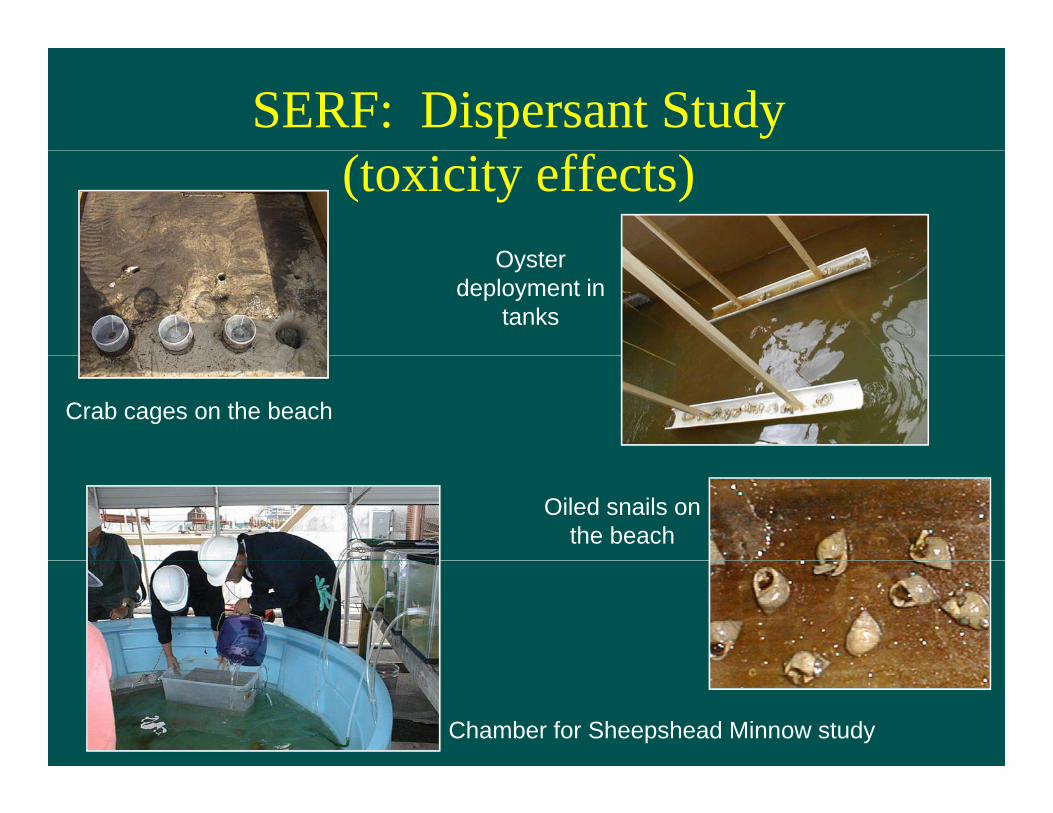
SERF: Dispersant Study (toxicity effects)
O tOyster deployment in
tanks
Crab cages on the beach
Oiled snails on the beach
Chamber for Sheepshead Minnow study
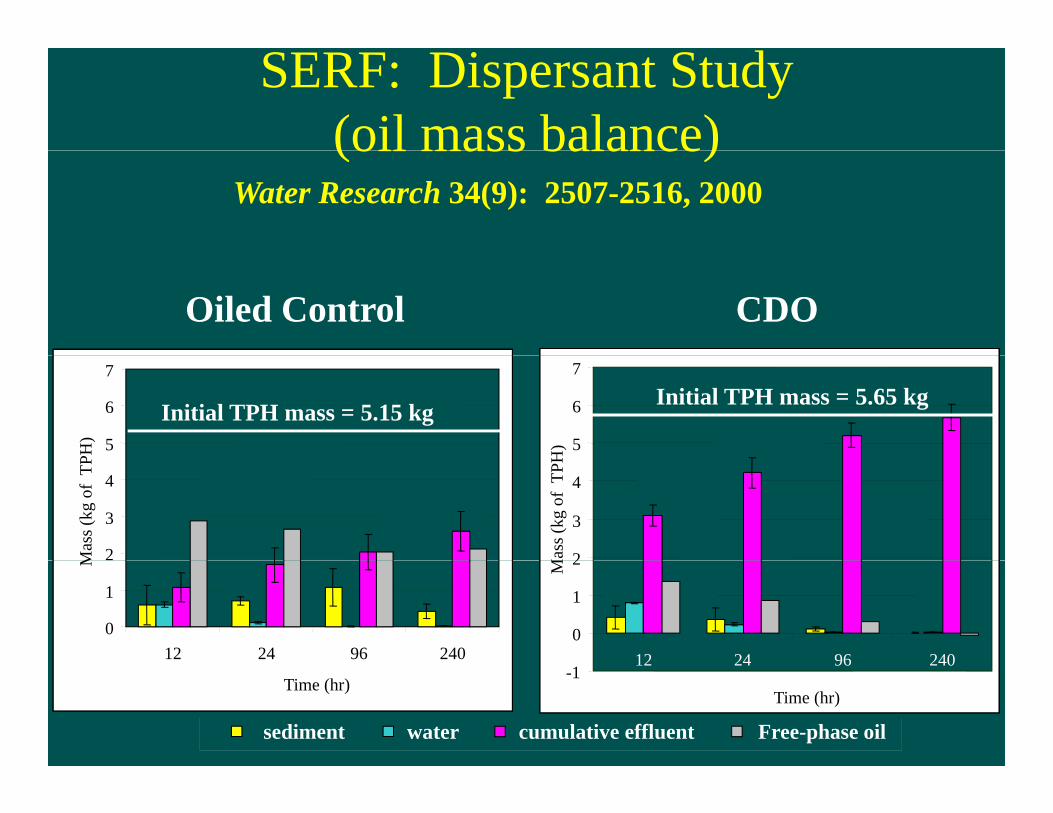
SERF: Dispersant Study (oil mass balance)(oil mass balance)
Water Research 34(9): 2507-2516, 2000
Oiled Control CDO
5
6
7
PH) 5
6
7
H)
Initial TPH mass = 5.15 kgInitial TPH mass = 5.65 kg
2
3
4
Mas
s (kg
of
TP
2
3
4
Mas
s (kg
of
TPH
0
1
12 24 96 240
M
0
1
2
12 24 96 240
M
Time (hr)
sediment water cumulative effluent Free-phase oil
-112 24 96 240
Time (hr)
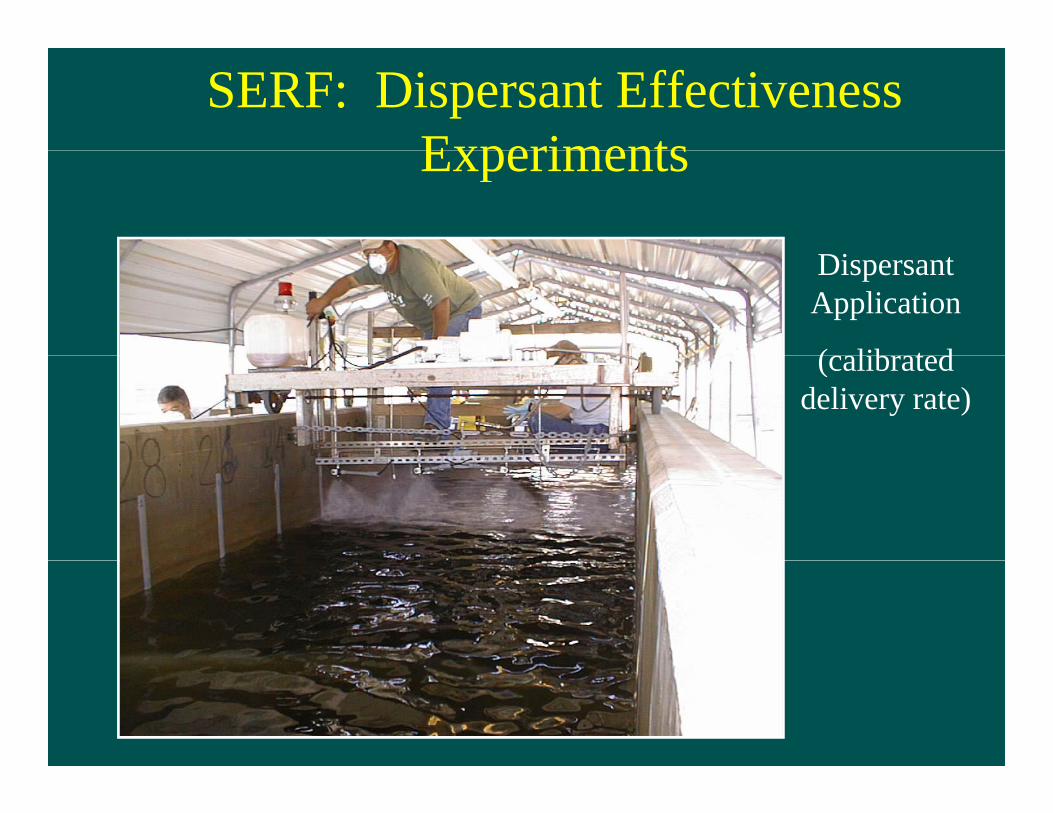
SERF: Dispersant Effectiveness ExperimentsExperiments
iDispersant Application
( lib t d(calibrated delivery rate)
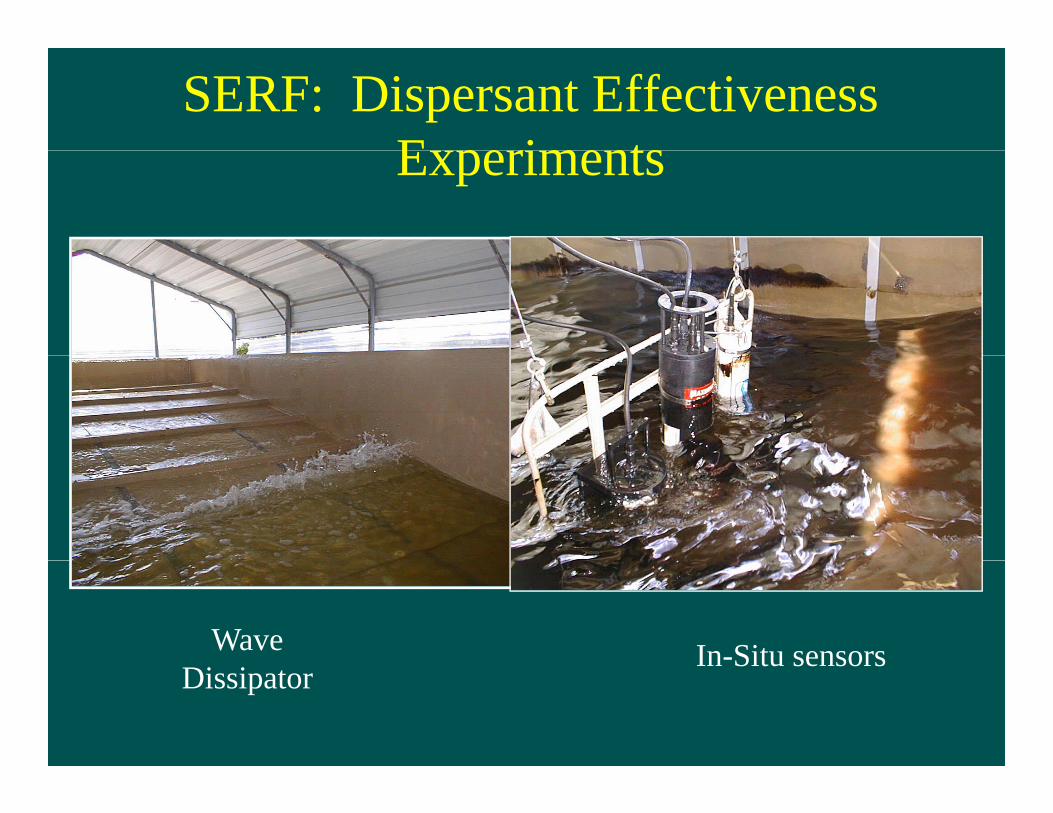
SERF: Dispersant Effectiveness E i tExperiments
Wave In-Situ sensorsDissipator
In Situ sensors
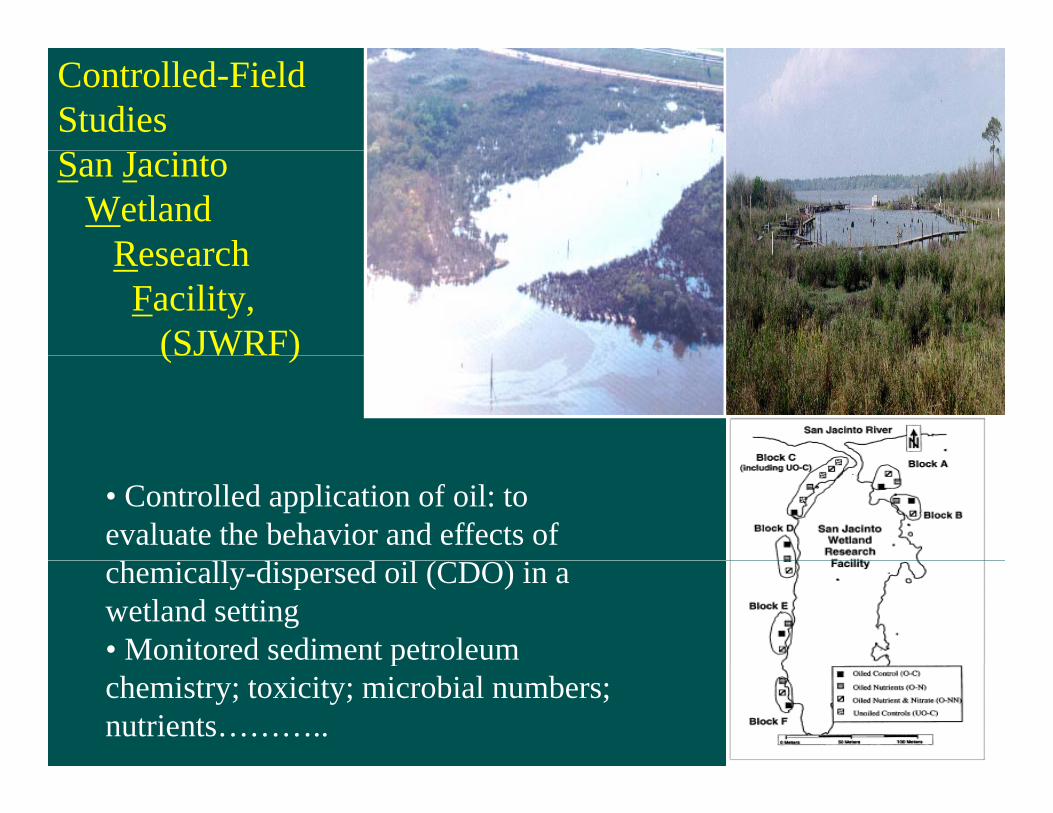
Controlled-Field StudiesSan Jacinto
Wetland ResearchResearch Facility,
(SJWRF)(SJW )
• Controlled application of oil: to evaluate the behavior and effects of chemically-dispersed oil (CDO) in a wetland setting • Monitored sediment petroleum pchemistry; toxicity; microbial numbers; nutrients………..

Controlled Application of Oil
Soil sample processingSoil sampling
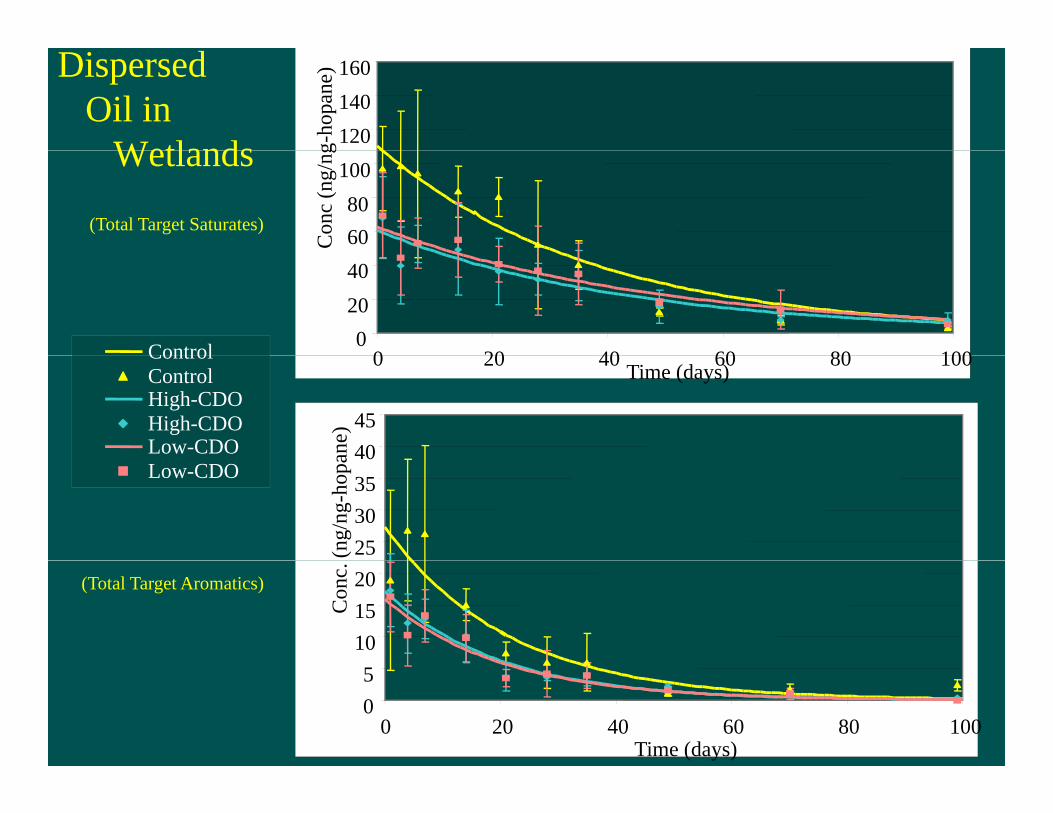
120140160
g-ho
pane
)Dispersed Oil in
Wetlands
6080
100
Con
c (n
g/ng
(Total Target Saturates)
Wetlands
Control 02040
0 20 40 60 80 100ControlControlHigh-CDOHigh-CDOLow-CDO
0 20 40 60 80 100Time (days)
4045
ane)
Low-CDO
25303540
(ng/
ng-h
opa
101520
Con
c.
(Total Target Aromatics)
05
0 20 40 60 80 100Time (days)

Full-Field Studies: Texas Coastal Waters
AT 502
Fluorescein dyeFluorescein dye
Rhodamine dyeRhodamine dye
Both dyes apparent
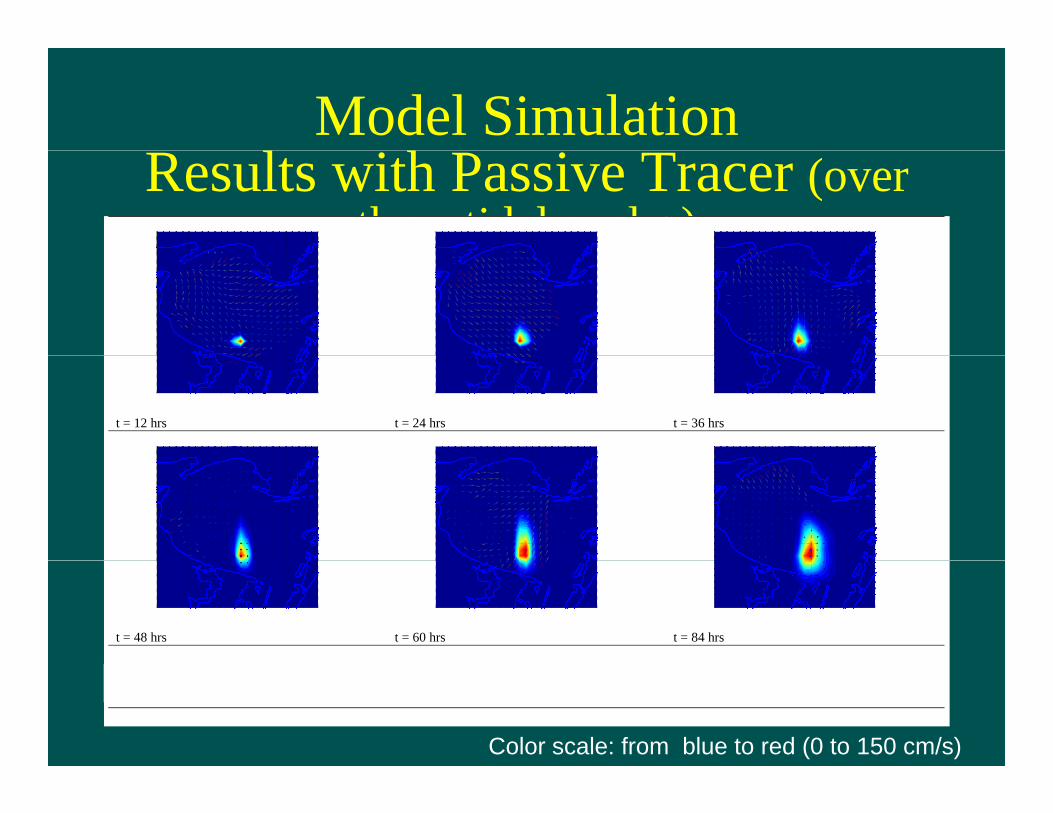
Model Simulation Results with Passive Tracer (over
three tidal cycles)
t = 12 hrs t = 24 hrs t = 36 hrs
t = 48 hrs t = 60 hrs t = 84 hrs
Figure 1. Evolution of diffusing conservative material over three tidal cycles; run #1. The arrows representing the current vectors are colored for relative strength from blue to red on a scale of 0-150 cm/s.
Color scale: from blue to red (0 to 150 cm/s)
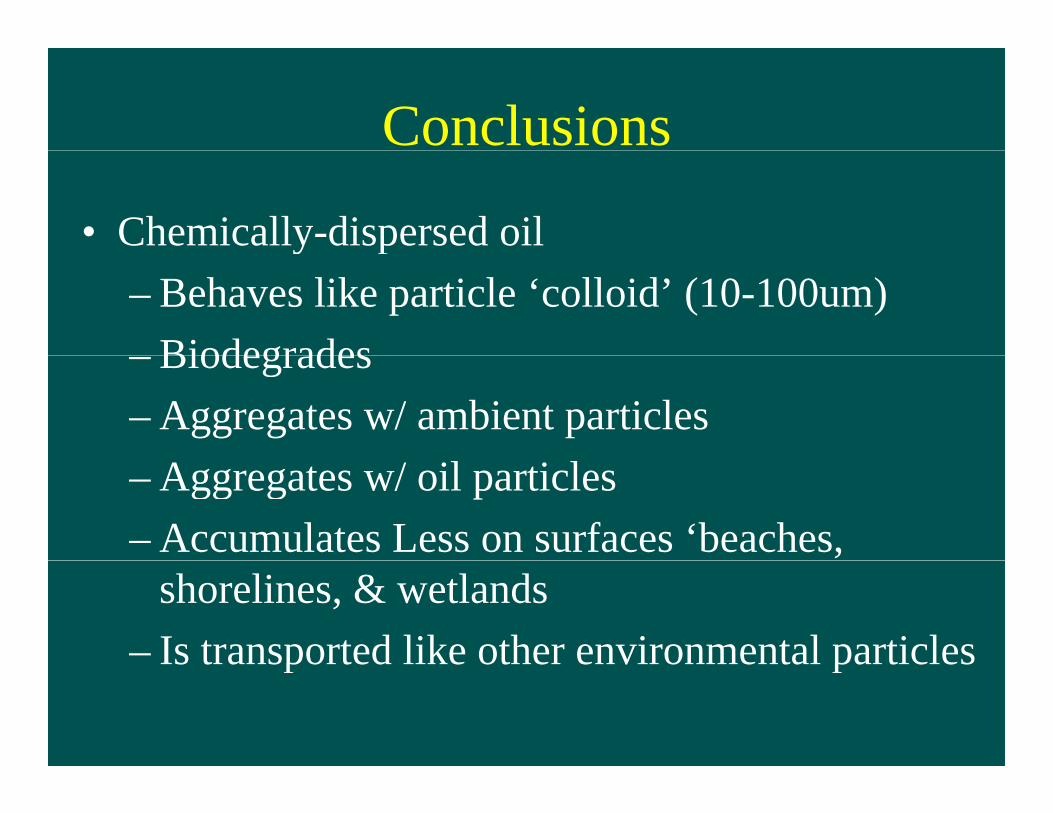
Conclusions
• Chemically-dispersed oil y p– Behaves like particle ‘colloid’ (10-100um)
Biodegrades– Biodegrades– Aggregates w/ ambient particles– Aggregates w/ oil particles– Accumulates Less on surfaces ‘beaches,
shorelines, & wetlands– Is transported like other environmental particlesIs transported like other environmental particles


![Preparation and characterization of very highly dispersed ... · pient wetness method resulted in well dispersed alumina-supported systems [16] but less well dispersed silica-supported](https://img.pdfslide.us/doc/110x75/5edc8590ad6a402d666736ef/preparation-and-characterization-of-very-highly-dispersed-pient-wetness-method.jpg)