Embed Size (px)
Citation preview
1
Supplementary Information
Materials/Subjects and Methods
Patients
The study was approved by the local ethics committee (REC No: 09/H0606/5). All
patients gave written informed consent in accordance with the Declaration of
Helsinki. Patients followed up at Liverpool University Hospital, Bournemouth Hospital
and the Oxford Radcliffe Cancer and Haematology Centre were recruited into the
study. Patient characteristics are summarized in Table 1. Overall, the patient cohort
was that of a tertiary referral centre with a high proportion of unmutated and
treatment refractory cases.
Sample collection
To minimize ambiguities in OncoSNP1 data interpretation as a result of sample
contamination, only samples from patients with lymphocytes contributing >90% of the
total white blood cell count (WBC) were collected. To achieve this, samples were
analyzed by multiparameter flow cytometry and expert hematopathological review.
Samples with <90% circulating B-CLL cells were excluded. These represented <10%
of patients, including patients with small lymphocytic lymphoma and early stage
patients. In total, 93 pre-treatment samples were collected.16 patients did not require
any treatment, 18 had chemotherapy refractory disease and for 15 patients, follow-up
was <1 year. 48 patients relapsed and for 42 of these, follow-up samples before
treatment of subsequent relapse were also available. Time to relapse varied from
patient to patient (6 months to 5 years), but follow-up samples were always from the
next relapse.
DNA was extracted from vital frozen cells using the QIAamp DNA Midi Kit (Qiagen,
Hilden, Germany) according to the manufacturer’s protocol.
A flowchart documenting the overall study design, the numbers of samples involved
and where they fit into the work undertaken is given in Supplementary Fig 1.
Clinical Risk Score and Statistical Analyses
To investigate the clinical significance of CNAs/cnLOHs, we assigned a clinical risk
score to each clinically evaluable patient in our cohort (n=76). Scores assigned were
were: 0=on watch and wait (W&W), 1=progression free survival (PFS) >1year,
2=PFS<1year and 3=chemotherapy refractory). We also categorized additional
covariates for testing (see ‘Summary Table for Statistical Testing’ below). We used
2
the total length of CNAs noted rather than the area under the curve (AUC) because
B-CLL is relatively stable and CNAs are comparatively sparse, confined mainly to
single copy number deletions or gains. Thus the AUC for B-CLL data reduces down
to a measure of total aberration length. This is in contrast to highly unstable cancers
such as polyploidy breast cancer or chromosomally unstable colon cancer, where
high values of AUC will result from long abnormalities with high copy number.
Logistic regression was used to evaluate the association between one response and
several prognostic categories using the appropriate statistical test for ordinal
variables eg Kruskal-Wallis test2, Cochran-Armitage trend exact test3,4, Chi-square
test5. The significance level for all statistical tests was 0.05. The analyses were
performed using the statistical software SAS 9.2.
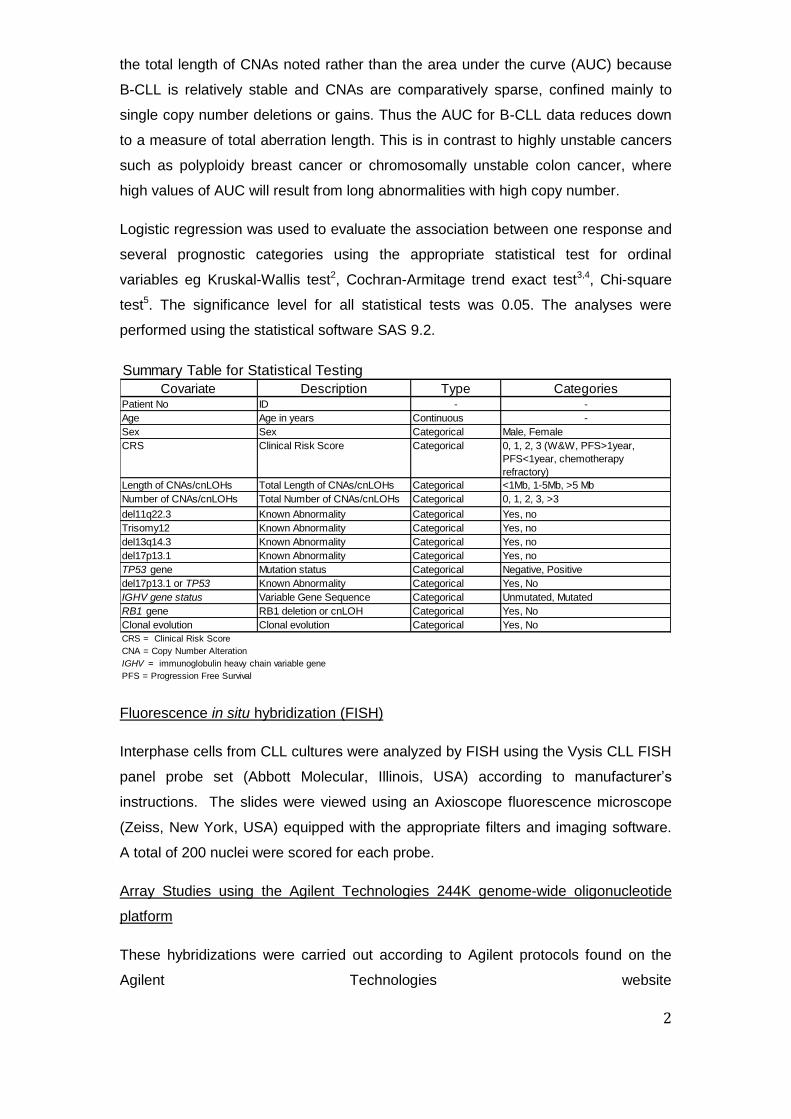
Summary Table for Statistical Testing
Covariate Description Type CategoriesPatient No ID - -
Age Age in years Continuous -
Sex Sex Categorical Male, Female
CRS Clinical Risk Score Categorical 0, 1, 2, 3 (W&W, PFS>1year,
PFS<1year, chemotherapy
refractory)
Length of CNAs/cnLOHs Total Length of CNAs/cnLOHs Categorical <1Mb, 1-5Mb, >5 Mb
Number of CNAs/cnLOHs Total Number of CNAs/cnLOHs Categorical 0, 1, 2, 3, >3
del11q22.3 Known Abnormality Categorical Yes, no
Trisomy12 Known Abnormality Categorical Yes, no
del13q14.3 Known Abnormality Categorical Yes, no
del17p13.1 Known Abnormality Categorical Yes, no
TP53 gene Mutation status Categorical Negative, Positive
del17p13.1 or TP53 Known Abnormality Categorical Yes, No
IGHV gene status Variable Gene Sequence Categorical Unmutated, Mutated
RB1 gene RB1 deletion or cnLOH Categorical Yes, No
Clonal evolution Clonal evolution Categorical Yes, No
CRS = Clinical Risk Score
CNA = Copy Number Alteration
IGHV = immunoglobulin heavy chain variable gene
PFS = Progression Free Survival
Fluorescence in situ hybridization (FISH)
Interphase cells from CLL cultures were analyzed by FISH using the Vysis CLL FISH
panel probe set (Abbott Molecular, Illinois, USA) according to manufacturer’s
instructions. The slides were viewed using an Axioscope fluorescence microscope
(Zeiss, New York, USA) equipped with the appropriate filters and imaging software.
A total of 200 nuclei were scored for each probe.
Array Studies using the Agilent Technologies 244K genome-wide oligonucleotide
platform
These hybridizations were carried out according to Agilent protocols found on the
Agilent Technologies website

3
(http://www.genomics.agilent.com/GenericA.aspx?PageType=Product&SubPageTyp
e=ProductLiterature&PageID=1465).
Illumina Genome-wide SNP Platform hybridizations
Hybridization to Illumina 1M-Duo SNP chips was performed according to
manufacturer’s protocols found on registration at
http://www.illumina.com/products/human1m_duo_dna_analysis_beadchip_kits.ilmn.
Due to product discontinuation, 22 samples were hybridized to alternative
HumanOmni1-Quad SNP chips according to manufacturer’s protocols found on
registration at http://www.illumina.com/support/array/array_kits/humanomni1-
quad_beadchip_kit/documentation.ilmn. In brief, patient DNA was denatured,
amplified and enzymatically fragmented and then hybridized onto the BeadChips by
rocking in an Illumina Hybridization Oven at 48˚C for 16-24hrs. The BeadChips were
washed according to the Illumina Inc protocol and the hybridized DNA detected by
primer extension with labeled nucleotides followed by detection using fluorescent
antibodies. The data were processed using GenomeStudioV2009.2 (Illumina, Inc.,
San Diego, California, USA) and then analyzed using OncoSNP v1.0 (see next
section). For visual comparisons, the data were processed also using Nexus 5
Discovery Edition (BioDiscovery, Inc., El Segundo, California, USA) with the following
settings in the first instance (SNPRank Segmentation): Significance Threshold 1x 10-
5; Max Contiguous Probe Spacing (Kbp) 1000.0; Min number of probes per segment
5; High Gain 0.6; Gain 0.2; Loss -0.2; Big Loss -1.0; 3:1 sex chromosome gain 1.2;
Homozygous Frequency threshold 0.95; Homozygous Value Threshold 0.8;
Heterozygous Imbalance Threshold 0.4; Minimum LOH Length (Kb) 20; percentage
outliers to remove 3%. All Nexus processed plots were also inspected visually to
scan for changes not identified using these analysis settings.
Statistical Computational Tool for Data Analysis
A number of dedicated cancer tools have emerged recently for SNP array analysis6-
10. However, not all approaches are best suited for our study. For example, Navin et
al. (2010)9 and Letouze et al. (2010)10 developed explicit modeling strategies and
algorithms to model the sequence of events leading to the genomic aberrations
observed in tumor samples. These methods rely on obtaining multiple spatio-
temporal samples (e.g. pre-treatment biopsies, sections from different parts of a
tumour, metastases, etc) from an individual patient and using the information to infer
possible models of tumour progression. In our study, these approaches would be
less useful since we have data generated from two time points only and spatial

4
heterogeneity is not applicable in this scenario. Furthermore, the degree of genomic
complexity in B-CLL is substantially lower than in the breast and bladder cancers
considered in other studies. Importantly, we were interested not only in the
accumulation of genomic aberrations over time (which in B-CLL is much rarer than
the other cancers), but we were also interested particularly in the expansion of
distinct sub-clones. For these reasons we selected OncoSNP to detect genomic
aberrations and quantify cellular admixture at a per-SNP level. We did not develop
formal algorithms for elucidating the actual sub-clonal structure; this will be
addressed in future work that will be aided by high-depth next generation sequencing
technology.
OncoSNP Analysis
Detailed methods have been described previously1 (see also
http://sites.google.com/site/oncosnp/). OncoSNP was run for 15 EM iterations in
intra-tumor heterogeneity mode using a thinning setting of 30 for training. Before
analysis, we removed all SNP and monomorphic probes in WTCCC2 germ-line copy
number variant regions. In addition, we also removed probes showing high levels of
signal variation (greater than three times the average median absolute deviation
across all probes) in the WTCCC2 samples. We used natural logarithms when
calculating the log Bayes Factor. Putative genomic aberrations detected by
OncoSNP with log Bayes Factor less than 30 were removed from consideration and
considered to be insignificant. The log Bayes Factor threshold value was required
due to unexplained, spatially correlated error artifacts in the data that resemble and
occur on the scale of real genomic aberrations (particularly when we allow tumor
heterogeneity and small signal deflections that may correspond to aberrations
present at low quantities in the sample). As described previously for QuantiSNP11,
the threshold value of 30 allows us to achieve low false positive rates whilst retaining
good detection power based on simulation and real data testing.
Reference data
To help identify and exclude germline CNVs of unlikely relevance from our data we
excluded SNP and monomorphic copy number probes in known germline CNV
regions from the OncoSNP analysis and we also used the Database of Genomic
Variants (DGV), a comprehensive catalog of structural variation noted in control data
from many studies and representing data from over 3000 samples12. This allowed us
to define somatic gains and losses >20Kb in size. Copy number changes that
encompassed fully changes noted in the DGV were excluded from further analysis.

5
However, the DGV does not inform upon cnLOH. To determine whether regions of
cnLOH >2Mb noted in our B-CLL samples were observed commonly in controls, we
used data from 150 controls, selected randomly from 6000 control sample data sets.
The latter were generated from 3000 samples from the 1958 British Birth Cohort and
3000 from the UK Blood Service Control Group by the Wellcome Trust Case Control
Consortium using an Illumina 1.2M custom chip. Although the occurrence of a region
of cnLOH both in WTCCC2 controls and in B-CLL samples could not rule out the
existence of relevant gene mutations in these regions, the information did provide an
element of stringency for cnLOH selection/exclusion. The main criterion for
excluding a cnLOH region >2Mb from our data was if it occurred/overlapped
relatively frequently in the control samples. By contrast, if a region of cnLOH was not
observed at all, then we included it in our data because we considered it unlikely to
occur at appreciable frequency in the rest of the WTCCC2 cohort. Therefore, for our
purposes, 150 data sets (one and a half times the number of pre-treatment samples)
were considered sufficient.
In addition, we considered CNA analysis against patient constitutional DNA.
However, this was not feasible for this study as germline samples were not available;
routine collection has started only recently. Furthermore, additional tests would be
limited severely by financial constraints
Array Data Analysis
The Illumina raw data generated using the B-CLL samples are available on request
from the Corresponding Author.
All CNAs ≥20Kb and all cnLOHs ≥2Mb were included in the analysis; both were
easily verified visually affording a high level of confidence in the results. The
comparatively higher ≥2Mb size threshold for cnLOH was applied because very small
regions of cnLOH are extremely common and current lack of knowledge would
render further investigation of putative clinical relevance unviable. Smaller
CNAs/cnLOHs were only included if they were in specific regions of interest and
visually verified. Imbalances that had been repeatedly observed previously either in
control data deposited in the DGV or in the WTCCC2 samples were not pursued
further. Similarly, cnLOH regions identified repeatedly (identical or overlapping) in
the WTCCC2 samples were not pursued further.
Where possible, the start and end point positions of CNA/cnLOH regions were
defined using OncoSNP. Of interest, we observed that OncoSNP and Nexus calls
were highly comparable; the start and end base positions differed subtly, but were
6
too small to alter the genes mapping within the minimally deleted regions (MDRs)
and minimally overlapping regions (MORs). Where there were apparent
discrepancies, the events and positions were manually verified using Nexus.
In order to delineate MDRs/MORs, OncoSNP (or in some instances, Nexus) start
and end positions of all CNA/cnLOH regions were entered first into Microsoft Excel
2007 spreadsheets. Second, CNAs noted in control samples in the DGV or cnLOH
regions occurring commonly in the WTCCC2 data were removed. Third, regions of
overlap involving the remaining CNAs/cnLOHs were identified using Microsoft Excel
2007 functions and the start and end positions of MDRs/MORs identified according
to the start/end positions of the changes noted in informative samples.
To be classified as recurrent, CNA/cnLOH regions had to occur at least two times,
either in different pre-treatment samples or once in a pre-treatment sample and once
newly emerging in a different relapse sample. Where relapse samples showed an
increased percentage of cells compared with the pre-treatment samples, this was
also noted. To increase the stringency for identifying MORs harboring putative driver
genes, MORs >5Mb were excluded. To avoid any inclusion of germ-line variants,
CNAs 20-500kb were only included if they showed mosaicism, if they were
homozygous deletions involving at least one exon, or if they mapped to a known
region of interest or had newly emerged/showed increase in percentage at relapse.
Results are given in Table 2.
Pathway Analysis
We identified 706 genes within the 62 MORs presented in Table 2. After exclusion of
genes mapping to regions with known copy number variants reported in the DGV,
542 genes remained and were tested for pathway enrichment using R/Bioconductor
org.Hs.eg.db and GOstats packages against a universe of 45,469 possible IDs. We
noted KEGG Pathways significantly over-represented at p≤0.05. Results were
validated using the DAVID web-based interface13. These analyses were then
repeated adding RB1, ATM, TP53 and DLEU2 to the previous list of genes.
TP53 mutation analysis
TP53 was screened for mutations using four high-resolution melting (HRM) assays
covering exons 5-8. Primers sequences are provided in the Table below. Each 10ul
PCR reaction contained 1x HotShot Diamond (Clent Life Sciences, Stourbridge, UK)
1x LCGreen (Clent Life Sciences), 1x Q solution (Qiagen), 1uM each primers and
40ng DNA. The PCR amplification consisted of an initial enzyme activation step of
95°C for 10 min, followed by 45 cycles of 95°C for 15sec, 60°C for 20sec, 72°C for

7
15sec. This was followed by the HRM which increased from 72°C to 95°C by 0.1°C
every 2sec. Both amplification and HRM were performed on a Rotorgene 6000
(Qiagen). Following HRM results were analyzed on the HRM module of the Rotor-
Gene 6000 software 1.7. Positive PCR products were purified then sequenced from
both strands. The products were analyzed on the CEQ 8000 (Beckman Coulter,
California, USA) using the Sequence Investigator software.
Primers used for TP53 sequencing
Primer Sequence (5'-3')
TP53 exon 5 (F) TGCCGTCTTCCAGTTGCT
TP53 exon 5 (R) CATCGCTATCTGAGCAGC
TP53 exon 6 (F) CAGGCCTCTGATTCCTCACTGATTGCTC
TP53 exon 6 (R) CTCACCTGGAGGGCCACTGACAA
TP53 exon 7 (F) CAAGGCGCACTGGCCTCATCT
TP53 exon 7 (R) CAGGCCAGTGTGCAGGGT
TP53 exon 8 (F) GGTAGGACCTGATTTCCTTACT
TP53 exon 8 (R) AGGCATAACTGCACCCTTGG
Analysis of Immunoglobulin heavy chain variable (IGHV) gene rearrangements
To identify clonal rearrangements of the immunoglobulin heavy (IGH) chain gene and
determine the somatic mutation status of the variable (V) gene sequence in patients
we used the IGH Somatic Hypermutation (SHM) Assay v2.0 (Invivoscribe, La Coutat,
France) according to the manufacturer’s instructions. Sequences were run on the
CEQ 8000 (Beckman Coulter) and analyzed by Vquest
(http://www.imgt.org/IMGT_vquest/share/textes/). The IGHV gene status of a patient
was categorized as mutated if there was <98% homology with germline and
unmutated if there was ≥98% homology with germline or presence of the V3-21 re-
arrangement14.
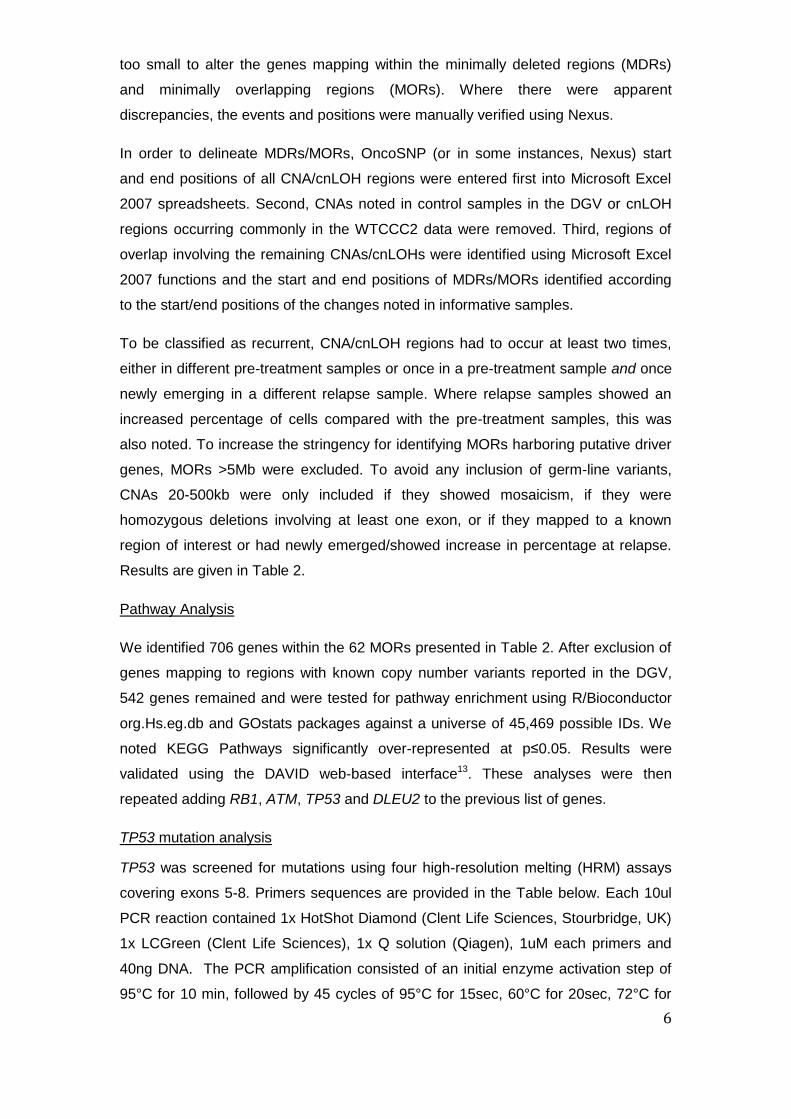
BLIMP1 sequencing
11 assays were designed to cover the whole of the coding region of the BLIMP1
gene. Primer sequences are provided in the Table below. Each primer had a M13
tail; forward: 5’GTAAAACGACGGCCAGT 3’ and reverse: 5’
CAGGAAACAGCTATGAC 3’. Each 25µl reaction contained 1x Qiagen MasterMix
(Qiagen) and 10mM of each primer. All PCR conditions, except for 5b, consisted of
an initial enzyme activation step of 95°C for 15 min, followed by 35 cycles of 95°C for
30sec, 60°C for 90sec, 72°C for 90sec, followed by a final 10min extension at 72°C.
Conditions for 5b were the same except the annealing temperature was 57°C.
Purified amplicons were sequenced from both strands using the M13 tails, then
8
analyzed on the CEQ 8000 (Beckman Coulter, California, USA) using the Sequence
Investigator software and compared with the corresponding germ-line sequences.
Primers used for BLIMP1 sequencing
Primer Sequence (5'-3')
BLIMP1 exon 1 (F) GCCGAGTGGCTAAGGAAATC
BLIMP1 exon 1 (R) GCAGAAGCATGTTTCTACTGC
BLIMP1 exon 2 (F) CATAGCCTCTCAGAAGGAGC
BLIMP1 exon 2 (R) GTAGGGAGATTTGGCACCAG
BLIMP1 exon 3 (F) GGCATCATTAATGTCTGTTTACTTATC
BLIMP1 exon 3 (R) CGCACCTTAGTCCCAGCTAC
BLIMP1 exon 4 (F) CTTACCTGTTTCCGCCCTG
BLIMP1 exon 4 (R) CAGCATGTCTGGACCAATCC
BLIMP1 exon 5a (F) CTAGCCCTCTGTGTAATCGC
BLIMP1 exon 5a (R) GTTGTTGATGCCATTCATGC
BLIMP1 exon 5b (F) AGTACGCTCACTACCCCAAGTTC
BLIMP1 exon 5b (R) CTCACAGCCCCTTGGACTG
BLIMP1 exon 6 (F) GAGCCAGCTTGAGAGCAGAG
BLIMP1 exon 6 (R) TGGGAGGGTGACTCACAGAC
BLIMP1 exon 7a (F) CCCGTTGGCAACTCTTAATC
BLIMP1 exon 7a (R) GCCTTTGCCTTGTTCATGC
BLIMP1 exon 7b (F) AAATGGTTTCCCCTCACCTC
BLIMP1 exon 7b (R) TGGGGAAATTTTCGCAGTG
BLIMP1 exon 7c (F) AGTCCTGTGGCCATTCAGAG
BLIMP1 exon 7c (R) ACCGACGTGATTGTGAGGTC
BLIMP1 exon 7d (F) TGAGCCAAGCCATGTAAAAG
BLIMP1 exon 7d (R) TGGAGATGTCGCTCACTGAC
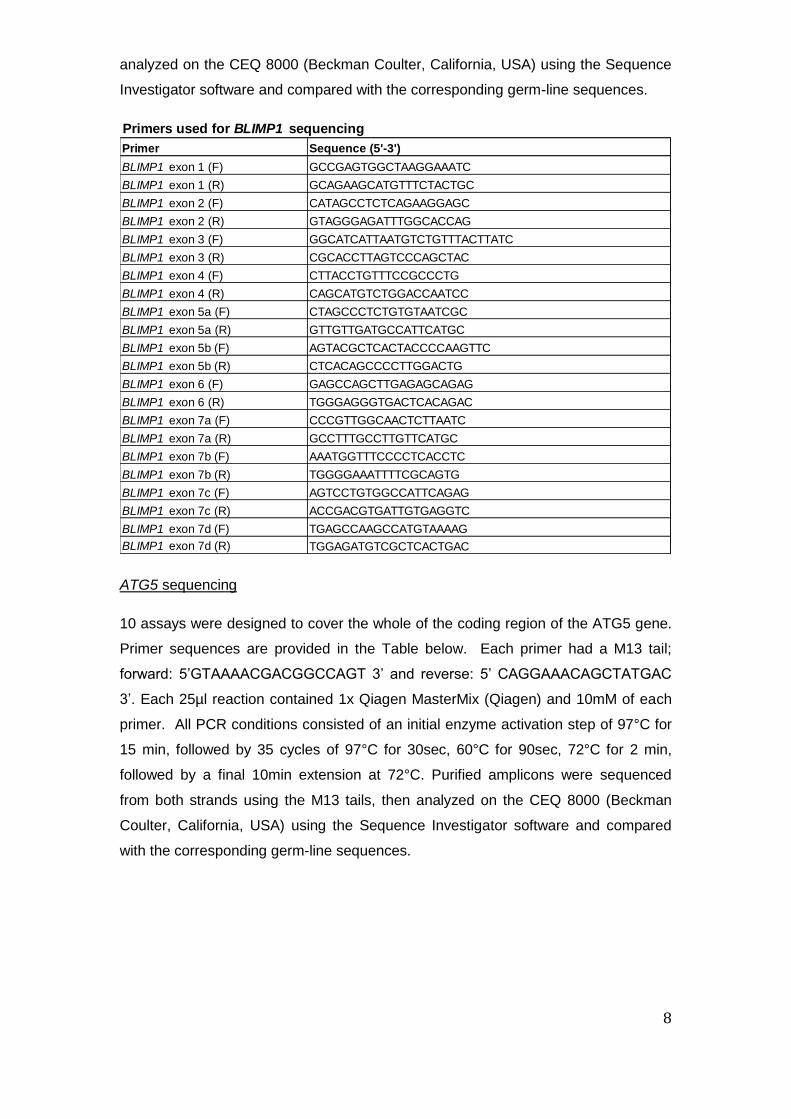
ATG5 sequencing
10 assays were designed to cover the whole of the coding region of the ATG5 gene.
Primer sequences are provided in the Table below. Each primer had a M13 tail;
forward: 5’GTAAAACGACGGCCAGT 3’ and reverse: 5’ CAGGAAACAGCTATGAC
3’. Each 25µl reaction contained 1x Qiagen MasterMix (Qiagen) and 10mM of each
primer. All PCR conditions consisted of an initial enzyme activation step of 97°C for
15 min, followed by 35 cycles of 97°C for 30sec, 60°C for 90sec, 72°C for 2 min,
followed by a final 10min extension at 72°C. Purified amplicons were sequenced
from both strands using the M13 tails, then analyzed on the CEQ 8000 (Beckman
Coulter, California, USA) using the Sequence Investigator software and compared
with the corresponding germ-line sequences.

9
Primers used for ATG5 sequencing
Primer Sequence (5'-3')
ATG5 exon 1 (F) CTGGGTTAGGCAGAACACG
ATG5 exon 1 (R) ACAAGGTGGACACACACACG
ATG5 exon 2 (F) TGCAAGGATCTGACTAATGCTC
ATG5 exon 2 (R) CCCATTTGCCACAATCAATG
ATG5 exon 3 (F) AAGAACACGGCTGTTTTTCC
ATG5 exon 3 (R) TGCTTAATAATGCAGAAAAATTCAC
ATG5 exon 4 (F) TTAAAGCCCCTGACATTTGG
ATG5 exon 4 (R) AATGGGACGAAGGAGAAATG
ATG5 exon 5 (F) TTGAAAAACTGGGGGATATAGTTC
ATG5 exon 5 (R) AATCTGGGCACAGAGGCTAC
ATG5 exon 6 (F) TTTCATCTCTTCATGTGAGGTATTC
ATG5 exon 6 (R) TGTCTGAGGCTTTCATAAATGG
ATG5 exon 7 (F) AAAAGGCACCTAATGCCAAC
ATG5 exon 7 (R) GAAATGTTTTAATGTTGCTGATTG
ATG5 exon 8a (F) TTGTTGGGTTTCTTTCTTGG
ATG5 exon 8a (R) TTCGTTAAGGAAAGATGGGTTTAC
ATG5 exon 8b (F) TTGAACTTTAGCTCATGAAAGTGG
ATG5 exon 8b (R) TCAGTGAAAATCGCAAAAGG
ATG5 exon 8c (F) CGATCATGGTTTTAGATCCCATA
ATG5 exon 8c (R) TTTTAAATAAAGACGGACACAACA
Results
Comparison between FISH and Agilent Technologies 244K and Illumina 1M-Duo
array platforms
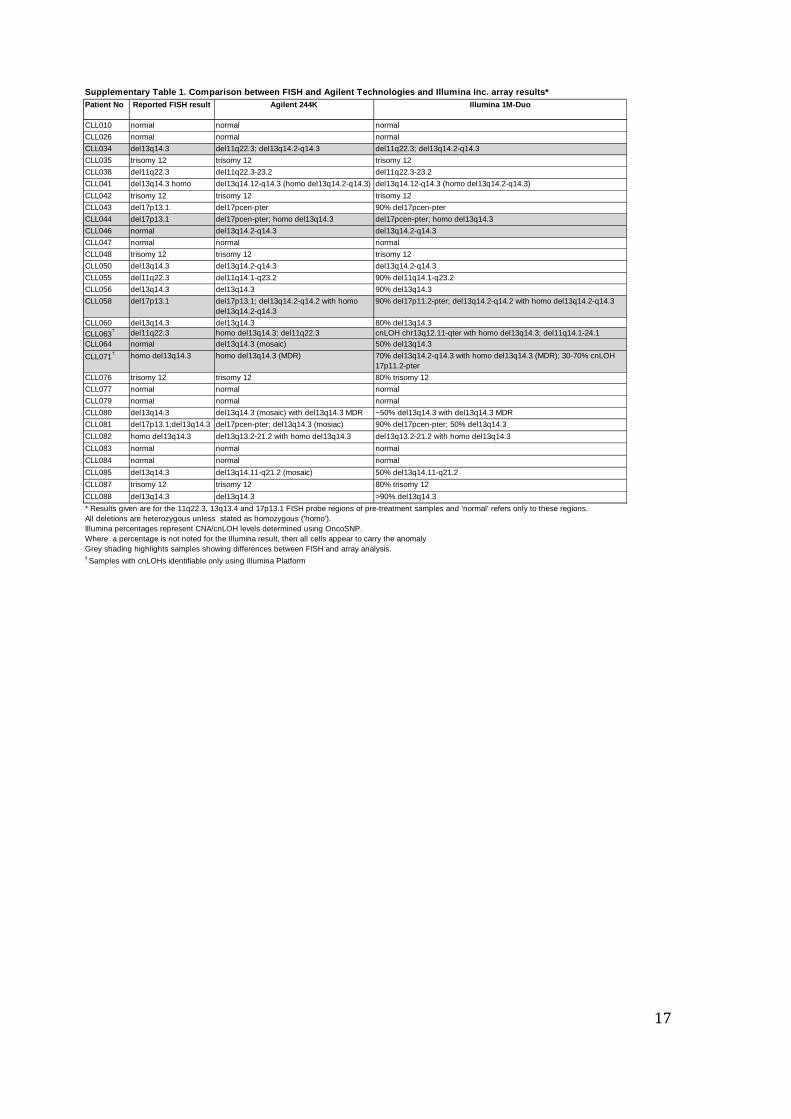
As part of the validation of array based platforms for the detection of CNAs in CLL,
we tested 31 patient DNAs using both the Agilent 244K and the Illumina 1M-Duo
platforms and compared the results with those obtained by routine FISH
(Supplementary Table 1). Both array platforms detected all of the CNAs seen by
FISH. Importantly, one case presented in Supplementary Table 1 (CLL034) and an
additional case tested only on the Illumina Platform (CLL118) had small 11q
deletions encompassing the ATM gene that were not noted in the patients’ FISH
results. The array data show that the ~732kb region interrogated by the probe from
the Vysis ATM/CEP11 FISH Probe Kit overlaps proximally with a non-deleted region
in both cases, thereby allowing probe binding (Supplementary Fig. 2). Both array
platforms also detected five 13q deletions that were not reported in the FISH results
(Supplementary Table 1). In addition, the use of arrays enabled the extent and
boundaries of the abnormalities to be defined more accurately.

10
Choice of Platform
Whilst both Agilent and Illumina platforms allowed the reliable detection of CNAs,
only the SNP-based Illumina platform was capable of identifying regions of cnLOH
that might be important in B-CLL evaluation. For example, three out of 93 patients,
CLL071, CLL075 and MCLL148, had cnLOH encompassing TP53. Mutation analysis
of these patients revealed TP53 mutations on both alleles (Supplementary Table 2,
Supplementary Fig. 3). When considering which SNP platform to choose for the
study, the Illumina platform was preferred to the Affymetrix because of the superior
signal to noise ratio. The content of the 1M-Duo chip (the highest density chip
available for use at the time) matched, in large part, the 1M-Duo design used for the
WTCCC2 study (1,109,332 probes in common). Therefore, this platform was chosen
to extend our studies.
Validation of OncoSNP Quantification
Spiking experiments have shown previously the excellent precision of the
quantitative data obtained with OncoSNP using promyelocytic leukemia cancer,
colon cancer and breast cancer samples1. To further validate the quantifications
obtained, we compared the OncoSNP output for heterozygous losses with visual
inspection of Nexus plots; the percentage calls were consistent with the observations
(Supplementary Fig. 4). Furthermore, we performed blindly a series of interphase
FISH experiments using cells from a subset of patients with known cytogenetic
abnormalities involving 11q22.3, 13q14.3, or 17p13.1 (Supplementary Table 3). This
comparison showed good correlation in 18/20 samples tested. One of the two
potentially inconsistent cases was CLL071, which involved a homozygous
del13q14.3. Here the OncoSNP call of 100% was not stated in Supplementary Table
3 because formal OncoSNP calibration for homozygous losses is pending. Thus,
inaccurate calibration may be the reason for the inconsistency in this case. The
second inconsistent result identified was for CLL084 where OncoSNP did not detect
the 15% 13q14.3 loss reported by FISH. On visual inspection of the array data, we
were unable to confirm the CNA despite the fact that a low-level CNA of 15% would
be expected to be visible. As FISH background levels of 10%-20% are allowable, we
believe that the most likely explanation here is that the FISH result may reflect non-
specific background.
11
Limitations of OncoSNP in this Study
Ultimately, the accuracy with which we can quantify cellular admixture using
OncoSNP or any other computational tool is determined by the noise variances of
the SNP data. Whilst OncoSNP was essential for our study, the performance is
subject to technological limitations which mean it is not proven accurate enough to
report mixed cell populations of >90% or <10% and has not been calibrated formally
for homozygous deletions. However, for some patient samples we did record values
>90% (but<100%), or of apparently 100% based on visual inspection of Nexus B-
allele frequency plots (Supplementary Fig. 4). For six cases, an aberration change
from 90% to >90% or vice versa was noted between paired pre-treatment and
relapse samples, potentially impacting on interpretation of clonal evolution. For these
cases, the possibility of variation in sampling (namely variation in the percentage of
B-cells harvested from paired pre-treatment sample and relapse samples) had to be
taken into consideration as a possible explanation for the observations. For three of
the six cases noted it was not possible to rule out sampling variation on the basis of
the array data alone. However, for the remaining three cases, comparison with CNAs
from other chromosomal regions of the samples suggested strongly that the
differences in percentages were not attributable to sampling. For example, in both
the pre-treatment and relapse samples for CLL068, the percentage of cells carrying
the chromosome 13q loss remained unchanged, whilst the percentage of cells
carrying the chromosome 2 loss increased visibly from 90% in the pre-treatment
sample to >90% in the relapse sample (data not shown).
Finally, we observed that some cnLOH regions visualized manually and reported
here, were interpreted by OncoSNP as germ-line variants.
We expect that the fundamental limits of ‘analogue’ array based technology will be
addressed ultimately by ‘digital’ high resolution next generation sequencing
technologies. However, for this study, our experience was that the data were best
interpreted by using the output of OncoSNP in combination with manual visualization
and verification of results using software such as Nexus.
Analysis of well-recognized CNAs in 93 pre-treatment samples
11q22.3 and 17p13.1 abnormalities
We identified a total of 17 out of 93 patients with deletions ≥500kb involving 11q22.3
(one of these, in CLL084, is newly visible at relapse) and two with cnLOH >2Mb). As
outlined above, for two cases, CLL034 and CLL118, the deletions were missed by
12
FISH using the standard Abbott/Vysis probes (Supplementary Fig. 2). Including these
cases, the MDR in our sample set was ~577kb involving CUL5, ACAT1, NPAT, ATM,
C11orf65, KDELC2, EXPH5 and DDX10. In both patient and control groups there
were small regions of cnLOH that included ATM, but two patients showed large
regions of cnLOH that were not observed in controls; CLL090 gave a mosaic pattern
showing 50% cnLOH 11qcen-qter, whereas CLL108 showed complete cnLOH for
11q12.3-qter. Although we did not formally prove the presence of ATM mutations in
these patients, the results point to a possible role of cnLOH in CLL.
Nine of the 93 samples tested carried single copy losses involving 17p13.1. Eight of
these had TP53 mutations of the non-deleted allele; three of the 93 had mono-allelic
mutations. A further three patients had bi-allelic mutations with cnLOH encompassing
TP53 (Supplementary Table 2, Supplementary Fig. 3). None of the control samples
showed CNAs or cnLOH of this region. This data provides further evidence that
areas of cnLOH can indicate hotspots for pathogenically important mutations. A
further 2/93 patients (CLL093 and CLL108) had mono-allelic mutations.
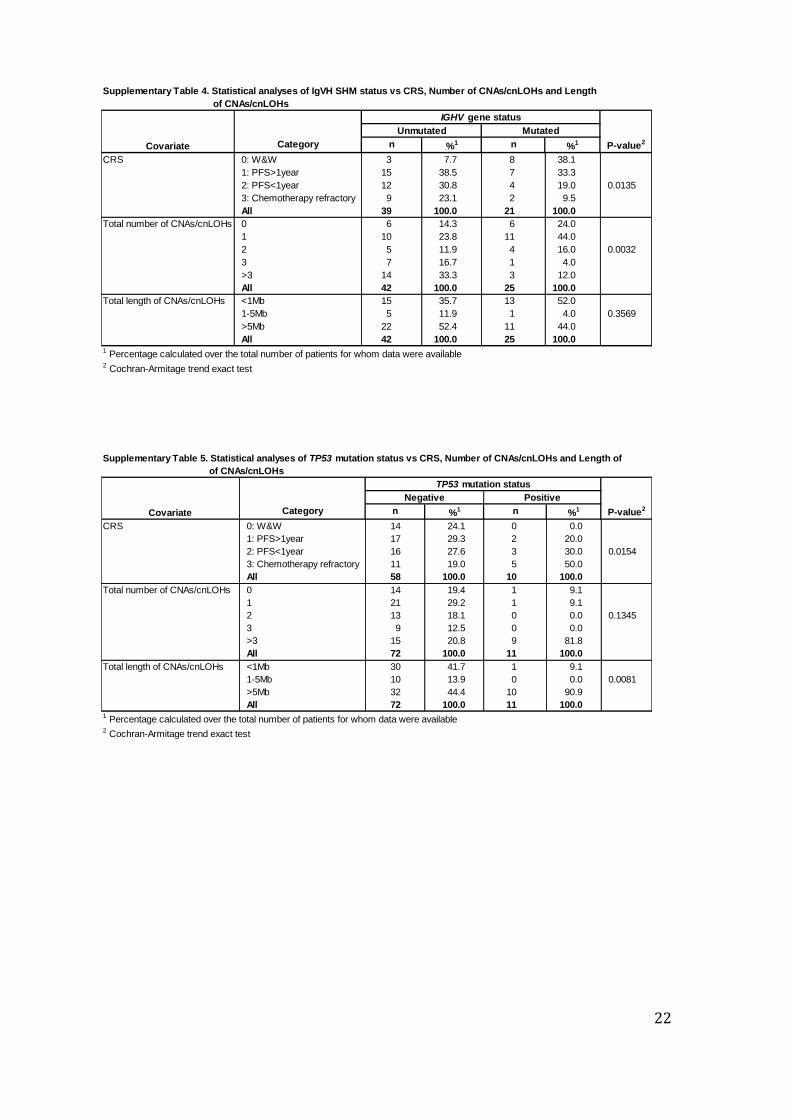
When we tested statistically the status of TP53 mutations vs CRSs we found that
patients who were TP53 mutation positive showed significantly higher CRSs (80.0%
≥ 2 CRS) than TP53 mutation negative patients (46.6% ≥ 2 CRS) (Cochran-Armitage
trend exact test, p-value=0.0154; Supplementary Table 5). Statistically significant
differences were also found with respect to the total length of CNAs/cnLOHs
between TP53 mutation groups (Cochran-Armitage trend exact test, p-value=0.0081;
Supplementary Table 5).
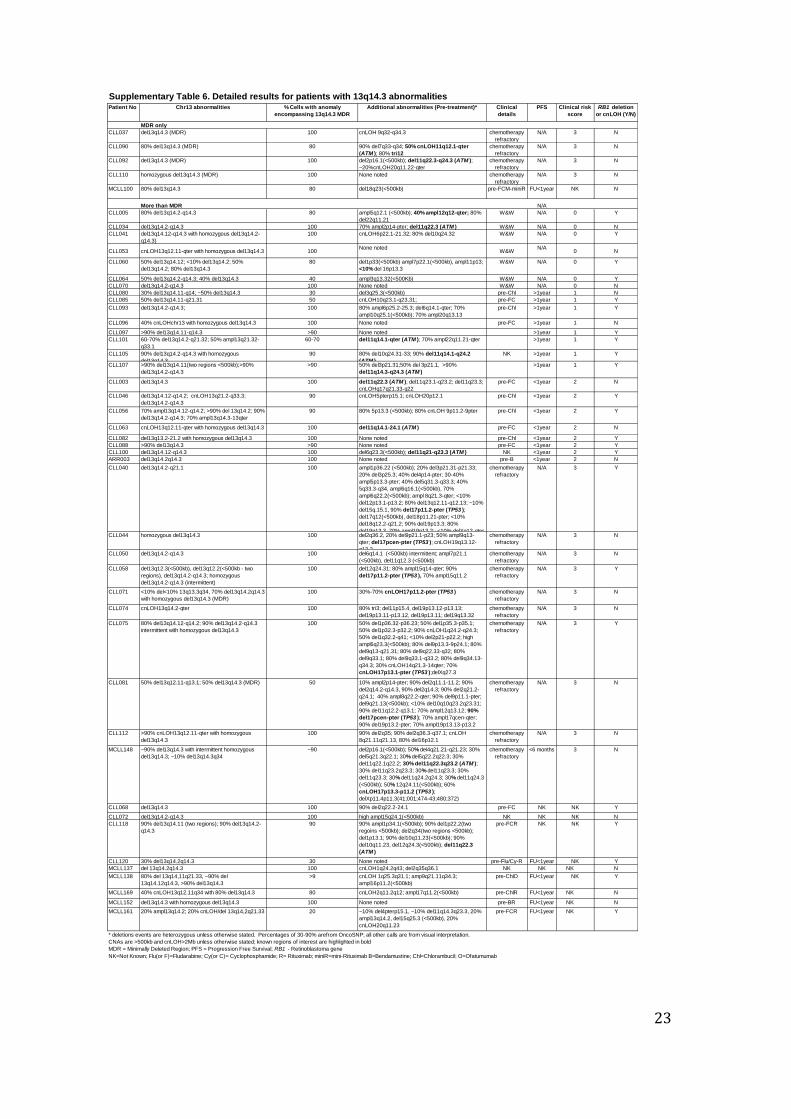
13q14.3 abnormalities
The most common abnormalities were CNAs/cnLOHs involving 13q14.3, detected in
47/93 of the pre-treatment patients. The ~7kb MDR in these cases involved DLEU2.
However, no single patient had a 13q abnormality restricted to DLEU2
(Supplementary Fig. 5).
33 patients had heterozygous deletions encompassing the MDR whereas 14 had a
homozygous deletion involving this region (Supplementary Table 6). In 24 patients,
the deletion included the retinoblastoma gene RB1 at 13q14.2. Seven patients with
13q abnormalities showed large regions of cnLOH. One of them (CLL074) showed
isolated cnLOH involving the 13q14.3 MDR. Quantification of the subclonal
distribution of CNAs/cnLOHs involving the 13q locus revealed that whilst the MDR
was deleted in the majority of leukemic cells in individual patients, regions next to the
MDR were deleted only in subpopulations of the same leukemia (eg: CLL060).
13
Together, these data confirm previous observations that the 13q14.3 locus is highly
heterogeneous in CLL patients. Furthermore, the results suggest that apparently
smaller abnormalities involving the MDR can gradually extend through clonal
evolution from an initially small proportion of cells carrying the extended abnormality
(Supplementary Fig. 6).
13q abnormalities and clinical outcome
There has been accumulating evidence that the size of 13q deletions has prognostic
relevance with regards to depth and duration of response to treatment15-17. However,
recent genetic evidence from conditional knock-out mice suggests that deletion of the
MDR containing the mir15a/16-1 locus is sufficient to control the expansion of the
mature B-cell pool in mice leading to a CLL-like disease albeit with low penetrance
and after a long period of latency18. In an attempt to establish whether there was an
association between the size of the 13q deletion and clinical outcome, we compared
the size of 13q deletions with the clinical risk score. To this end, we defined Type I
and Type II del13q14.3 as previously described on the basis of aberrations affecting
the RB1 gene (16). We excluded patients with additional known CNAs/cnLOHs in
addition to 13q deletions (in order to eliminate compounding factors) and patients for
whom no CRS was available and analyzed only patients who had del13q as their
sole abnormality (21/47 patients). When we looked at CRSs in patients without RB1
deletions or cnLOH compared with those with RB1 deletions or cnLOH we found that
patients without RB1 deletions or cnLOHs showed higher CRSs (73.7% ≥2 CRS)
than patients who carried RB1 deletions or cnLOHs (42.1% ≥2 CRS) (Cochran-
Armitage trend exact test, p-value=0.0466; Supplementary Table 7).
Thus, in our small cohort, large Type II 13q deletions were not associated with a
worse clinical outcome.
When we looked at IGHV gene status (unmutated/mutated) in patient samples with
isolated 13q anomalies we noted that patients without RB1 deletions or cnLOHs
showed a slightly higher percentage of cases with mutated IGHV genes (60.0%)
compared with patients with RB1 deletions or cnLOHs (41.2%). However, this did not
reach statistical significance (Chi-square test, p-value=0.2879; Supplementary Table
7).
Finally, we also found recurrent deletions of 22q involving the PRAME locus19.
However, both large and small deletions involving this locus were also observed in
the WTCCC samples indicating that this deletion is a common variant. Therefore it
was excluded from further analysis.

14
Patients without apparent genomic complexity
Recent studies of acute myeloid leukemia have shown that a large proportion of
cases exhibit low genomic instability, with 50% cases showing no acquired CNAs or
cnLOH at the resolution tested20. By contrast, when we investigated infrequent
CNAs/cnLOH events in our B-CLL pre-treatment cases (using 20kb and 2Mb
thresholds respectively), we found that only ~4% cases had no CNAs/cnLOH events
identified, ~18% cases had one CNA (including three cases of trisomy 12) and ~17%
had two CNAs (including three different cases with trisomy 12).
Pathway Analysis
When we tested the 542 genes from the MDRs/MORs of interest using the KEGG
pathway analysis, we obtained ten pathways over-represented at a P-value<0.05.
When ATM, RB1, DLEU2 and TP53 were added to the gene list we obtained 17
pathways over-represented at a P-value<0.05, many of these with a strong link to
cancer (Supplementary Table 10). Other pathways of interest were also identified,
though did not reach statistical significance in this analysis. The results for the
DAVID analyses were similar in each case.
15
Supplementary References
1. Yau C, Mouradov D, Jorissen RN, Colella S, Mirza G, Steers G, et al. A statistical approach for detecting genomic aberrations in heterogeneous tumor samples from single nucleotide polymorphism genotyping data. Genome Biol 2010 Sep 21; 11(9): R92.
2. Kruskal WH and Allen Wallis, W. Use of ranks in one-criterion variance analysis. Journal of the American Statistical Association 1952 Dec; 47(260): 583–621
3. Cochran, WG Some methods for strengthening the common chi-square tests. Biometrics 1954 Dec; 10 (4): 417–451.
4. Armitage, P. Tests for Linear Trends in Proportions and Frequencies. Biometrics 1955 Sep; 11 (3): 375–386.
5. Pearson K. On the criterion that a given system of deviations from the probable in the case of a correlated system of variables is such that it can be reasonably supposed to have arisen from random sampling. Philosophical Magazine, Series 5. 1900; 50 (302): 157–175.
6. Greenman CD, Bignell G, Butler A, Edkins S, Hinton J, Beare D, et al. PICNIC: an algorithm to predict absolute allelic copy number variation with microarray cancer data. Biostatistics 2010 Jan; 11(1): 164-175.
7. Sun W, Wright FA, Tang Z, Nordgard SH, Van Loo P, Yu T, et al. Integrated
study of copy number states and genotype calls using high-density SNP arrays. Nucleic Acids Res 2009 Sep; 37(16): 5365-5377.
8. Van Loo P, Nordgard SH, Lingjaerde OC, Russnes HG, Rye IH, Sun W, et al.
Allele-specific copy number analysis of tumors. Proc Natl Acad Sci U S A 2010 Sep 28; 107(39): 16910-16915.
9. Navin N, Krasnitz A, Rodgers L, Cook K, Meth J, Kendall J, et al. Inferring
tumor progression from genomic heterogeneity. Genome Res 2010 Jan; 20(1): 68-80.
10. Letouze E, Allory Y, Bollet MA, Radvanyi F, Guyon F. Analysis of the copy
number profiles of several tumor samples from the same patient reveals the successive steps in tumorigenesis. Genome Biol 2010; 11(7): R76.
11. Colella S, Yau C, Taylor JM, Mirza G, Butler H, Clouston P, et al. QuantiSNP:
an Objective Bayes Hidden-Markov Model to detect and accurately map copy number variation using SNP genotyping data. Nucleic Acids Res 2007; 35(6): 2013-2025.
12. Iafrate AJ, Feuk L, Rivera MN, Listewnik ML, Donahoe PK, Qi Y, et al.
Detection of large-scale variation in the human genome. Nat Genet 2004 Sep; 36(9): 949-951.

16
13. Wei Huang D, Sherman BT, Lempicki RA. Systematic and integrative
analysis of large gene lists using DAVID bioinformatics resources. Nature Protocols 2009; 4(1):44 & Genome Biology 2003; 4(5):P3 ).
14. Oscier DG, Gardiner AC, Mould SJ, Glide S, Davis ZA, Ibbotson RE, et al.
Multivariate analysis of prognostic factors in CLL: clinical stage, IGVH gene mutational status, and loss or mutation of the p53 gene are independent prognostic factors. Blood 2002 Aug 15; 100(4): 1177-1184.
15. Ouillette P, Erba H, Kujawski L, Kaminski M, Shedden K, Malek SN.
Integrated genomic profiling of chronic lymphocytic leukemia identifies subtypes of deletion 13q14. Cancer Res 2008 Feb 15; 68(4): 1012-1021.
16. Parker H, Rose-Zerilli MJ, Parker A, Chaplin T, Wade R, Gardiner A, et al.
13q deletion anatomy and disease progression in patients with chronic lymphocytic leukemia. Leukemia 2011 Mar; 25(3): 489-497.
17. Ouillette P, Collins R, Shakhan S, Li J, Li C, Shedden K, et al. The prognostic
significance of various 13q14 deletions in chronic lymphocytic leukemia. Clin Cancer Res Sep 2.
18. Klein U, Lia M, Crespo M, Siegel R, Shen Q, Mo T, et al. The DLEU2/miR-
15a/16-1 cluster controls B cell proliferation and its deletion leads to chronic lymphocytic leukemia. Cancer Cell Jan 19; 17(1): 28-40.
19. Gunn SR, Bolla AR, Barron LL, Gorre ME, Mohammed MS, Bahler DW, et al.
Array CGH analysis of chronic lymphocytic leukemia reveals frequent cryptic monoallelic and biallelic deletions of chromosome 22q11 that include the PRAME gene. Leuk Res 2009 Sep; 33(9): 1276-1281.
20. Walter MJ, Payton JE, Ries RE, Shannon WD, Deshmukh H et al. Acquired
copy number alterations in adult acute myeloid leukemia genomes. Proc Natl Acad Sci. 2009 Aug 4; 106(31):12950-12955.
17
Supplementary Table 1. Comparison between FISH and Agilent Technologies and Illumina Inc. array results*
Patient No Reported FISH result Agilent 244K Illumina 1M-Duo
CLL010 normal normal normal
CLL026 normal normal normal
CLL034 del13q14.3 del11q22.3; del13q14.2-q14.3 del11q22.3; del13q14.2-q14.3
CLL035 trisomy 12 trisomy 12 trisomy 12
CLL038 del11q22.3 del11q22.3-23.2 del11q22.3-23.2
CLL041 del13q14.3 homo del13q14.12-q14.3 (homo del13q14.2-q14.3) del13q14.12-q14.3 (homo del13q14.2-q14.3)
CLL042 trisomy 12 trisomy 12 trisomy 12
CLL043 del17p13.1 del17pcen-pter 90% del17pcen-pter
CLL044 del17p13.1 del17pcen-pter; homo del13q14.3 del17pcen-pter; homo del13q14.3
CLL046 normal del13q14.2-q14.3 del13q14.2-q14.3
CLL047 normal normal normal
CLL048 trisomy 12 trisomy 12 trisomy 12
CLL050 del13q14.3 del13q14.2-q14.3 del13q14.2-q14.3
CLL055 del11q22.3 del11q14.1-q23.2 90% del11q14.1-q23.2
CLL056 del13q14.3 del13q14.3 90% del13q14.3
CLL058 del17p13.1 del17p13.1; del13q14.2-q14.2 with homo
del13q14.2-q14.3
90% del17p11.2-pter; del13q14.2-q14.2 with homo del13q14.2-q14.3
CLL060 del13q14.3 del13q14.3 80% del13q14.3
CLL063† del11q22.3 homo del13q14.3; del11q22.3 cnLOH chr13q12.11-qter wth homo del13q14.3; del11q14.1-24.1
CLL064 normal del13q14.3 (mosaic) 50% del13q14.3
CLL071† homo del13q14.3 homo del13q14.3 (MDR) 70% del13q14.2-q14.3 with homo del13q14.3 (MDR); 30-70% cnLOH
17p11.2-pter
CLL076 trisomy 12 trisomy 12 80% trisomy 12
CLL077 normal normal normal
CLL079 normal normal normal
CLL080 del13q14.3 del13q14.3 (mosaic) with del13q14.3 MDR ~50% del13q14.3 with del13q14.3 MDR
CLL081 del17p13.1;del13q14.3 del17pcen-pter; del13q14.3 (mosiac) 90% del17pcen-pter; 50% del13q14.3
CLL082 homo del13q14.3 del13q13.2-21.2 with homo del13q14.3 del13q13.2-21.2 with homo del13q14.3
CLL083 normal normal normal
CLL084 normal normal normal
CLL085 del13q14.3 del13q14.11-q21.2 (mosaic) 50% del13q14.11-q21.2
CLL087 trisomy 12 trisomy 12 80% trisomy 12
CLL088 del13q14.3 del13q14.3 >90% del13q14.3
* Results given are for the 11q22.3, 13q13.4 and 17p13.1 FISH probe regions of pre-treatment samples and 'normal' refers only to these regions.
All deletions are heterozygous unless stated as homozygous ('homo').
Illumina percentages represent CNA/cnLOH levels determined using OncoSNP.
Where a percentage is not noted for the Illumina result, then all cells appear to carry the anomaly
Grey shading highlights samples showing differences between FISH and array analysis.† Samples with cnLOHs identifiable only using Illumina Platform

18
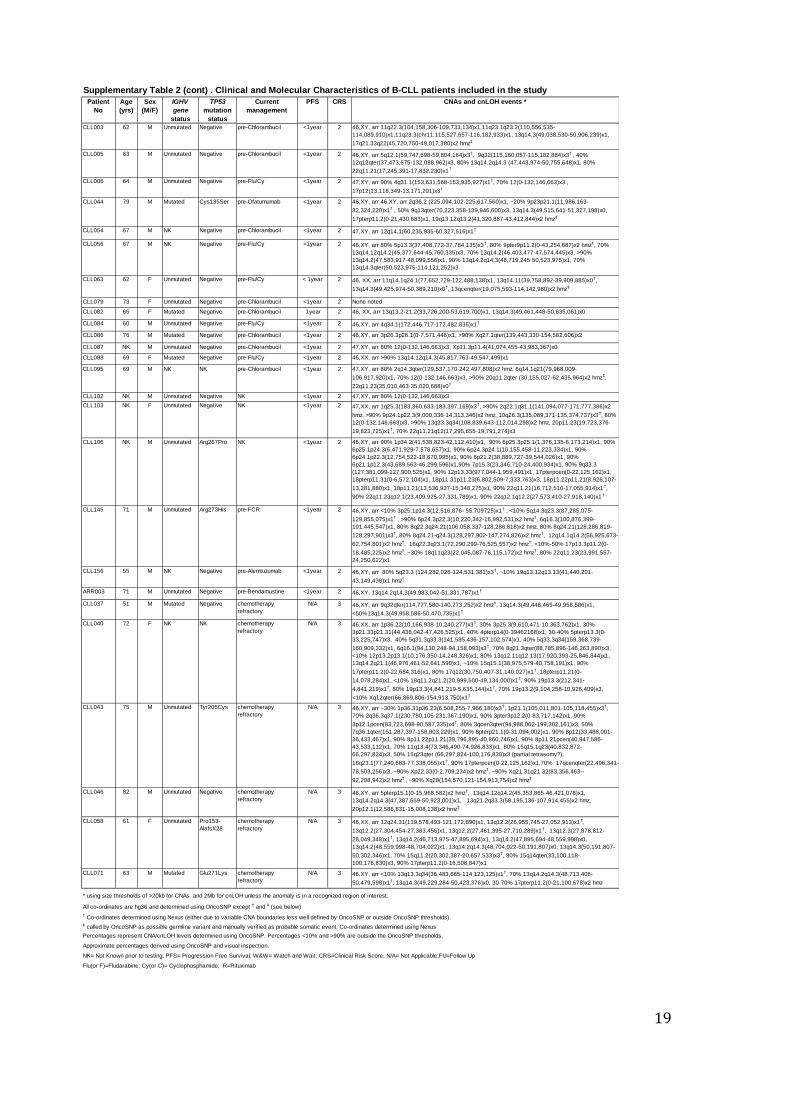
Supplementary Table 2. Clinical and Molecular Characteristics of B-CLL patients included in the study
Patient No Age
(yrs)
Sex
(M/F)
IGHV
gene
status
TP53
mutation
status
Current
management
PFS CRS CNAs and cnLOH events *
CLL034 73 M NK Negative W&W N/A 0 47,XY, arr 70% 2pterp14(0-65,091,911)x3, 11q22.3(107,477,140-108,054,389)x1,
13q14.2q14.3(48,737,980-50,553,577)x1
CLL035 71 F Mutated Negative W&W N/A 0 47,XX, arr 3p24.3(21,592,730-22,039,016)x1†, 12(0-132,146,663)x3
CLL041 68 F Unmutated Negative W&W N/A 0 46,XX, arr 6p21.32p22.1(25,791,596-32,491,015)x2 hmz‡, 80% 10q24.32(103,708,264-
104,851,056)x1, 13q14.12q14.3(45,763,393-47,874,856)x1, 13q14.2q14.3(47,874,856-
50,427,794)x0, 13q14.3(50,427,794-50,514,234)x1
CLL042 71 M Unmutated Negative W&W N/A 0 47,XY, arr 12(0-132,146,663)x3
CLL047 49 M Mutated NK W&W N/A 0 None noted
CLL048 54 M Mutated Negative W&W N/A 0 49,XY, arr 3p14.2(59,416,360-59,688,740)x3†, 12(0-132,146,663)x3, 18(0-76,116,152)x3, 19(0-
63,507,665)x3, Xp21.1(31,700,590-31,763,529)x0†
CLL052 63 M Mutated Negative W&W N/A 0 47,XY, arr 5p13.1(40,238,262-40,263,075)x1†,12(0-132,146,663)x3
CLL053 56 M NK Negative W&W N/A 0 46,XY, arr 13q12.11qter(22,060,201-114,121,252)x2 hmz, 13q14.3(49,460,089-50,493,338)x0
CLL055 51 M Unmutated Negative W&W N/A 0 46,XY, arr 90% 11q14.1q23.2 (78,697,937-114,120,247)x1
CLL060 75 M NK Negative W&W N/A 0 46,XY, arr 1p33(49,687,041-49,772,789),x1†, 7p22.1(4,932,547-5,123,570)x3
†, 11p13(33,083,227-
33,228,359)x3†, 50% 13q14.12q14.13(44,532,138-45,941,312)x1, <10% 13q14.2(45,941,312-
47,522,891)x1† , 50% 13q14.2(47,522,891-48,463,998)x1
†, 80% 13q14.3(48,463,998-
50,493,338)x1† ,
<10% 16p13.3(3,196,980-4,598,585)x1†
CLL061 36 M Mutated Negative W&W N/A 0 46,XY, arr 80% 6q21 (106,208,162-112,080,443)x1, 17q22q23.1(54,877,659-55,032,870)x3†
CLL062 55 M Mutated Negative W&W N/A 0 47,XY, arr 17q22q23.1(54,877,659-55,032,870)x3†
CLL064 45 M Mutated NK W&W N/A 0 46,XY, arr 3q13.32(120,256,979-120,302,958)x3† , 50% 13q14.2q14.3(46,776,954-50,012,183)x1
†,
40% 13q14.3(50,012,183-52,794,521)x1†
CLL070 82 M NK Negative W&W N/A 0 46,XY, arr 13q14.2-q14.3(48,660,957-51,331,565)x1
CLL072 NK M Mutated Negative W&W N/A 0 46,XY, arr 13q14.2q14.3 (48,381,735-50,599,548)x1
CLL110 62 F NK Negative W&W N/A 0 46,XX, arr 13q14.3(49,358,002-50,499,548)x1, 90% 13q14.3(49,468,192-50,355,810)x0
CLL010 63 F Unmutated Negative pre-Flu/Cy >1year 1 None noted
CLL023 70 F Unmutated Negative pre-Chlorambucil >1year 1 46,XX, arr 4q24(107,162,437-107,237,623)x3†
, 40% 10p12.23(17,833,779-18,398,113)x1, 40%
10q24.32q25.2 (103,562,915-112,637,185)x1,
CLL026 68 M Unmutated NK pre-Flu/Cy >1year 1 47,XY, arr 18p11.32(146,787-290,422)x3
CLL050 84 F Unmutated Negative pre-Chlorambucil >1year 1 46, XX, arr 6q14.1 (83,165,917-83,265,032)x1† , 7p21.1(18,576,853-18,602,061)x3
† ,
11q12.3(62,082,265-62,330,255)x1† , 13q14.2q14.3(48,608,987-51,326,824)x1
CLL068 71 M Mutated Negative pre-Chlorambucil >1year 1 46,XY, arr 90% 2q22.2q24.1(144,240,156-157,961,129)x1, 13q14.2q14.3(47,595,821-50,072,312)x1
CLL080 62 F Mutated NK pre-Chlorambucil >1year 1 46,XX, arr 3q25.31(156,553,159-156,572,680)x1† , 30% 13q14.11q14.3(40,674,362-49,342,922)x1
†,
~50% 13q14.3(49,342,923-50,332,192)x1†
CLL083 NK M Unmutated Negative pre-Flu/Cy >1year 1 46,XX, arr 4p14(39,001,471-39,049,059)x3† , 11q25(131,123,910-131,186,533)x3
† , <10%
12q14.3(64,809,667-64,853,817)x1† , 12q23.1(99,175,388-99,224,488)x1† ,10%
16p12.2(20,710,305-20,790,857)x3† , 17q12(34,817,937-34,948,998)x3
†
CLL085 54 M Unmutated Negative pre-Flu/Cy >1year 1 46,XY, arr 10q23.1q23.31(85,670,734-89,454,971)x2 hmz, 50% 13q14.11q21.31(43,934,565-
61,368,181)x1
CLL089 NK M Unmutated Negative pre-Flu/Cy >1year 1 46, XY, arr 1q21.1(144,335,130-144,614,943)x3†
, 1q25.2(174,495,962-174,547,429)x3†
CLL090 79 F Mutated Negative pre-Chlorambucil >1year 1 47,XX, arr 90% 7q33q34(134,397,353-139,656,577)x1, 90% 7q36 (156,694,855-156,824,049)x1†
,
50% 11q12.1qter(60,468,463-134,445,626)x2 hmz, 80% 12(0-132,146,663)x3, 80%
13q14.3(49,296,907-50,580,804)x1
CLL091 NK M Mutated Negative pre-Chlorambucil >1year 1 46,XY, arr 14q24.3q31.1(77,490,883-80,987,659)x2 hmz‡
CLL093 65 M Mutated HRM
Positive
pre-Chlorambucil >1year 1 46,XY, arr 80% 6p25.3p25.2-(94,609-4,294,807)x3, 6q14.1-qter(83,755,489-170,753,209)x1, 70%
10q25.1(109,682,821-109,770,215)x3† , 13q14.2-q14.3(47,556,552-50,610,384)x1, 70%
20q13.13(47,292,495-47,500,772)x3†
CLL096 51 F Mutated Negative pre-Flu/Cy >1year 1 46,XX arr 40% 13(0-114,121,252)x2 hmz, 13q14.3(49,425,974-49,522,141)x1, 13q14.3(49,522,141-
50,380,713)x0
MCLL189 63 F Unmutated Negative pre-FCM-miniR >1 year 1 46,XX, arr 4q24(107,259,869-107,283,621)x1†, 12q13.11q24.33(47,384,207-132,289,191)x2 hmz
CLL097 NK M Mutated NK NK >1year 1 46, XY, arr >90% 13q14.11q14.3(40,332,062-51,453,289)x1
CLL098 NK M Unmutated Negative NK >1year 1 None noted
CLL099 NK F Unmutated Negative NK >1year 1 46,XY, arr 70% 1q21.1(144,099,494-144,757,265)x3†
CLL100 NK M Unmutated Negative NK >1year 1 46,XY, arr 6q23.3(136,941,101-137,303,525)x1†, 11q21q23.3(95,807,200-116,159,645)x1,
13q14.12q14.3(45,803,275-50,435,049)x1
CLL101 NK M Unmutated Negative NK >1year 1 46,XY, arr 11q14.1qter(77,080,067-134,445,626)x1, 60-70% 13q14.2q21.32(47,781,909-
64,410,990)x1†, 50% 13q21.32q33.2(64,350,990-103,707,225)x3
†, 70% 22q11.21qter(17,403,754-
49,582,267)x3
CLL105 NK M Unmutated Negative NK >1year 1 46,XY, arr 80% 10q24.31q33(102,616,568-105,675,986)x1, 90% 11q14.1q24.2(78,235,887-
126,814,884)x1, 90% 13q14.2q14.3(47,373,566-51,972,428)x1, 13q14.3(49,425,974-49,953,648)x0
CLL107 NK M Unmutated Negative NK >1year 1 46,XY, arr 50% 3p21.31(46,827,053-50,133,778)x1, 50% 3p21.1(52,038,099-52,553,933)x1†, >90%
11q14.3q24.3(91,864,846-127,805,084)x1, >90% 13q14.11(40,389,170-40,761,341)x1† , >90%
13q14.11(41,687,912-41,826,016)x1†, >90% 13q14.2q14.3(47,515,748-51,333,756)x1
CLL108 NK F Unmutated Phe212-
SerfsX3
NK >1year 1 46,XX, arr 3q22.3(137,678,290-137,832,637)x1† , 80% 6q14.1q22.33(81,463,977-129,051,286)x1,
90% 11q12.3qter(62,398,575-134,445,626)x2 hmz, 80% 12pterp12.2(0-20,356,457)x2 hmz, 80%
12p12.2q21.31(20,356,457-84,251,286)x3, 80% 12q21.31qter(84,251,286-132,146,663)x2 hmz
* using size thresholds of >20kb for CNAs and 2Mb for cnLOH unless the anomaly is in a recognized region of interest.
All co-ordinates are hg36 and determined using OncoSNP except † and
‡ (see below)
† Co-ordinates determined using Nexus (either due to variable CNA boundaries less well defined by OncoSNP or outside OncoSNP thresholds)
‡ called by OncoSNP as possible germline variant and manually verified as probable somatic event. Co-ordinates determined using Nexus
Percentages represent CNA/cnLOH levels determined using OncoSNP. Percentages <10% and >90% are outside the OncoSNP thresholds.
Approximate percentages derived using OncoSNP and visual inspection.
NK= Not Known prior to testing; HRM= High Resolution Melting curve analysis; PFS= Progression Free Survival; W&W= Watch and Wait; CRS=Clinical Risk Score; N/A= Not Applicable; FU=Follow Up
Flu(or F)=Fludarabine; Cy(orC)= Cyclophosphamide; M=Mitozantrone; miniR=mini-Rituximab
19
Supplementary Table 2 (cont) . Clinical and Molecular Characteristics of B-CLL patients included in the study
Patient
No
Age
(yrs)
Sex
(M/F)
IGHV
gene
status
TP53
mutation
status
Current
management
PFS CRS CNAs and cnLOH events *
CLL003 62 M Unmutated Negative pre-Chlorambucil <1year 2 46,XY, arr 11q22.3(104,158,306-109,733,134)x1,11q23.1q23.2(110,556,535-
114,089,910)x1,11q23.3(chr11:115,527,657-116,182,933)x1, 13q14.3(49,038,530-50,906,239)x1,
17q21.33q22(45,720,750-49,017,380)x2 hmz‡
CLL005 63 M Unmutated Negative pre-Chlorambucil <1year 2 46,XY, arr 5q12.1(59,747,698-59,804,164)x3†, 9q32(115,160,057-115,182,884)x3
† , 40%
12q12qter(37,473,675-132,088,962)x3, 80% 13q14.2q14.3 (47,443,974-50,755,648)x1, 80%
22q11.21(17,245,391-17,832,230)x1†
CLL006 64 M Unmutated Negative pre-Flu/Cy <1year 2 47,XY, arr 90% 4q31.1(153,631,568-153,935,927)x1†, 70% 12(0-132,146,663)x3 ,
17p12(13,118,349-13,171,201)x3†
CLL044 79 M Mutated Cys135Ser pre-Ofatumumab <1year 2 46,XY, arr 46,XY, arr 2q36.2 (225,094,102-225,617,560)x1, ~20% 9p23p21.1(11,986,163-
32,324,220)x1† , 50% 9q13qter(70,223,358-139,946,600)x3, 13q14.3(49,515,641-51,327,198)x0,
17pterp11.2(0-21,430,683)x1, 19q13.12q13.2(41,320,887-43,412,844)x2 hmz‡
CLL054 67 M NK Negative pre-Chlorambucil <1year 2 47,XY, arr 12q14.1(60,235,935-60,327,516)x1†
CLL056 67 M NK Negative pre-Flu/Cy <1year 2 46,XY, arr 80% 5p13.3(37,408,772-37,784,135)x3†, 80% 9pter9p11.2(0-43,254,687)x2 hmz
‡, 70%
13q14.12q14.2(45,377,644-45,760,335)x3, 70% 13q14.2(46,403,477-47,574,445)x3, >90%
13q14.2(47,583,917-48,099,556)x1, 90% 13q14.2q14.3(48,719,245-50,523,975)x1, 70%
13q14.3qter(50,523,975-114,121,252)x3
CLL063 62 F Unmutated Negative pre-Flu/Cy < 1year 2 46, XX, arr 11q14.1q24.1(77,652,729-122,488,138)x1, 13q14.11(39,758,892-39,909,885)x0†,
13q14.3(49,425,974-50,389,210)x0†, 13qcenqter(19,075,593-114,142,980)x2 hmz
‡
CLL079 73 F Unmutated Negative pre-Chlorambucil <1year 2 None noted
CLL082 65 F Mutated Negative pre-Chlorambucil 1year 2 46, XX, arr 13q13.2-21.2(33,726,200-53,619,700)x1, 13q14.3(49,461,448-50,635,061)x0
CLL084 60 M Unmutated Negative pre-Flu/Cy <1year 2 46,XY, arr 4q34.1(172,446,717-172,482,835)x1†
CLL086 76 M Mutated Negative pre-Chlorambucil <1year 2 46,XY, arr 3p26.3p26.1(0-7,571,446)x1, >90% Xq27.1qter(139,443,330-154,582,606)x2
CLL087 NK M Unmutated Negative pre-Chlorambucil <1year 2 47,XY, arr 80% 12(0-132,146,663)x3, Xp11.3p11.4(41,074,455-43,983,367)x0
CLL088 69 F Mutated Negative pre-Flu/Cy <1year 2 46,XX, arr >90% 13q14.12q14.3(45,817,763-49,547,499)x1
CLL095 69 M NK NK pre-Chlorambucil <1year 2 47,XY, arr 80% 2q14.3qter(129,537,170-242,497,808)x2 hmz, 6q14.1q21(79,968,009-
106,917,920)x1, 70% 12(0-132,146,663)x3, >90% 20q11.2qter (30,155,027-62,435,964)x2 hmz‡,
22q11.23(35,010,463-35,020,688)x0†
CLL102 NK M Unmutated Negative NK <1year 2 47,XY, arr 80% 12(0-132,146,663)x3
CLL103 NK F Unmutated Negative NK <1year 2 47,XX, arr 1q25.3(183,360,633-183,397,169)x3†, >90% 2q22.1q31.1(141,094,077-171,777,386)x2
hmz, >90% 9p24.1p22.3(9,000,336-14,313,346)x2 hmz, 10q26.3(135,089,371-135,374,737)x3†, 80%
12(0-132,146,663)x3, >90% 13q33.3q34(108,839,643-112,014,298)x2 hmz, 20p11.23(19,723,376-
19,823,725)x1†, 70% 22q11.21q12(17,295,655-19,791,274)x3
CLL106 NK M Unmutated Arg267Pro NK <1year 2 46,XY, arr 90% 1p34.2(41,538,823-42,112,410)x1, 90% 6p25.3p25.1(1,376,135-6,173,214)x1, 90%
6p25.1p24.3(6,471,929-7,578,657)x1, 90% 6p24.3p24.1(10,155,458-11,223,334)x1, 90%
6p24.1p22.3(12,754,522-18,670,995)x1, 90% 6p21.2(38,889,727-39,544,026)x1, 90%
6p21.1p12.3(43,689,563-46,299,596)x1,90% 7p15.3(23,346,710-24,400,934)x1, 90% 9q33.3
(127,381,099-127,900,525)x1, 90% 12p13.33(977,044-1,959,491)x1, 17pterpcen(0-22,125,162)x1,
18pterp11.31(0-6,572,104)x1, 18p11.31p11.23(6,802,509-7,333,763)x3, 18p11.22p11.21(8,926,107-
13,281,880)x1, 18p11.21(13,536,937-15,348,275)x1, 90% 22q11.21(16,712,510-17,055,914)x1†,
90% 22q11.23q12.1(23,409,925-27,331,789)x1, 90% 22q12.1q12.2(27,573,410-27,918,140)x1†
CLL145 71 M Unmutated Arg273His pre-FCR <1year 2 46,XY, arr <10% 3p25.1p14.3(12,516,876- 55.709725)x1† , <10% 5q14.3q23.3(87,285,075-
129,855,075)x1† , >90% 6p24.3p22.3(10,220,342-16,992,531)x2 hmz
†, 6q16.3(100,876,399-
101,445,547)x1, 80% 8q22.3q24.21(106.058,337-128,286,818)x2 hmz, 80% 8q24.21(128,286,819-
128,297,901)x3†, 80% 8q24.21-q24.3(128,297,902-147,274,826)x2 hmz
†, 12q14.1q14.2(56,925,673-
62,754,801)x2 hmz†, 16q22.3q23.1(72,290,299-76,525,557)x2 hmz
†, <10%-50% 17p13.3p11.2(0-
18,485,225)x2 hmz†, ~30% 18q11q23(22,045,087-76,115,172)x2 hmz
†, 80% 22q11.23(23,991,557-
24,250,622)x1
CLL156 55 M NK Negative pre-Alemtuzumab <1year 2 46,XY, arr 80% 5q23.3 (124,282,026-124,531,381)x3†, ~10% 19q13.12q13.13(41,440,201-
43,149,438)x1 hmz†
ARR003 71 M Unmutated Negative pre-Bendamustine <1year 2 46,XY, 13q14.2q14.3(49,983,042-51,331,787)x1†
CLL037 51 M Mutated Negative chemotherapy
refractory
N/A 3 46,XY, arr 9q32qter(114,777,580-140,273,252)x2 hmz‡, 13q14.3(49,448,465-49,958,586)x1,
<50%13q14.3(49,958,586-50,470,735)x1†
CLL040 72 F NK NK chemotherapy
refractory
N/A 3 46,XX, arr 1p36.22(10,166,938-10,240,277)x3†, 30% 3p25.3(9,610,471-10,363,762)x1, 30%
3p21.33p21.31(44,436,042-47,426,525)x1, 40% 4pterp14(0-39462168)x1, 30-40% 5pterp13.3(0-
33,225,747)x3, 40% 5q31.3q33.3(141,585,436-157,102,574)x1, 40% 5q33.3q34(159,368,739-
160,909,332)x1, 6q16.1(94,130,248-94,158,093)x3†, 70% 8q21.3qter(88,785,896-146,263,890)x3,
<10% 12p13.2p13.1(10,176,350-14,248,326)x1; 80% 13q12.11q12.13(17,920,393-25,846,844)x1,
13q14.2q21.1(46,976,461-52,641,590)x1, ~10% 15q15.1(38,975,579-40,758,191)x1, 90%
17pterp11.2(0-22,684,316)x1, 80% 17q12(30,750,407-31,140,027)x1†, 18pterp11.21(0-
14,078,284)x1, <10% 18q11.2q21.2(20,999,500-49,134,000)x1†, 90% 19p13.3(212,341-
4,841,219)x1†, 80% 19p13.3(4,841,219-5,635,144)x1
†, 70% 19p13.2(9,104,258-10,926,409)x3,
<10% Xq12qter(66,869,806-154,913,750)x1†
CLL043 75 M Unmutated Tyr205Cys chemotherapy
refractory
N/A 3 46,XY, arr ~30% 1p36.31p36.23(6,508,255-7,966,180)x3†, 1p21.1(105,011,801-105,118,455)x3
†,
70% 2q36.3q37.1(230,780,105-231,367,190)x1, 90% 3pter3p12.2(0-83,717,142)x1, 90%
3p12.1pcen(83,723,698-90,587,335)x4†, 80% 3qcen3qter(94,988,002-199,302,161)x3, 50%
7q36.1qter(151,287,397-158,803,229)x1, 90% 8pterp21.1(0-31,094,002)x1, 90% 8p12(33,488,001-
36,433,467)x1, 90% 8p11.22p11.21(39,796,895-40,860,746)x1, 90% 8p11.21pcen(40,947,586-
43,533,112)x1, 70% 11q13.4(73,346,490-74,926,833)x1, 80% 15q15.1q23(40,832,872-
66,297,824)x3, 50% 15q23qter (66,297,824-100,176,830)x3 (partial tetrasomy?),
16q23.1(77,240,683-77,338,055)x1†, 90% 17pterpcen(0-22,125,162)x1,70% 17qcenqter(22,496,341-
78,503,256)x3, ~90% Xp22.33(0-2,709,234)x2 hmz‡, ~90% Xq21.31q21.32(83,356,463--
92,208,942)x2 hmz‡
, ~90% Xq28(154,570,121-154,913,754)x2 hmz‡
CLL046 82 M Unmutated Negative chemotherapy
refractory
N/A 3 46,XY, arr 5pterp15.1(0-15,968,582)x2 hmz†, 13q14.12q14.2(45,353,865-46,421,078)x1,
13q14.2q14.3(47,387,659-50,923,001)x1, 13q21.2q33.3(58,195,136-107,914,455)x2 hmz,
20p12.1(12,586,831-15,008,138)x2 hmz‡
CLL058 61 F Unmutated Pro153-
AlafsX28
chemotherapy
refractory
N/A 3 46,XX, arr 12q24.31(119,578,493-121,172,890)x1, 13q12.2(26,955,745-27,052,913)x1†,
13q12.2(27,304,454-27,383,456)x1, 13q12.2(27,461,395-27,710,289)x1†, 13q12.3(27,878,812-
28,049,348)x1†, 13q14.2(46,713,975-47,895,694)x1, 13q14.2(47,895,694-48,559,998)x0,
13q14.2(48,559,998-48,704,022)x1, 13q14.2q14.3(48,704,022-50,191,807)x0, 13q14.3(50,191,807-
50,302,346)x1, 70% 15q11.2(20,302,387-20,657,533)x3†, 80% 15q14qter(33,100,118-
100,176,830)x3, 90% 17pterp11.2(0-16,508,847)x1
CLL071 63 M Mutated Glu271Lys chemotherapy
refractory
N/A 3 46,XY, arr <10% 13q13.3q34(36,483,665-114,123,125)x1†, 70% 13q14.2q14.3(48,713,406-
50,479,598)x1†, 13q14.3(49,229,284-50,423,376)x0, 30-70% 17pterp11.2(0-21,100,678)x2 hmz
* using size thresholds of >20kb for CNAs and 2Mb for cnLOH unless the anomaly is in a recognized region of interest.
All co-ordinates are hg36 and determined using OncoSNP except † and
‡ (see below)
† Co-ordinates determined using Nexus (either due to variable CNA boundaries less well defined by OncoSNP or outside OncoSNP thresholds)
‡ called by OncoSNP as possible germline variant and manually verified as probable somatic event. Co-ordinates determined using Nexus
Percentages represent CNA/cnLOH levels determined using OncoSNP. Percentages <10% and >90% are outside the OncoSNP thresholds.
Approximate percentages derived using OncoSNP and visual inspection.
NK= Not Known prior to testing; PFS= Progression Free Survival; W&W= Watch and Wait; CRS=Clinical Risk Score; N/A= Not Applicable;FU=Follow Up
Flu(or F)=Fludarabine; Cy(or C)= Cyclophosphamide; R=Rituximab

20
Supplementary Table 2 (cont) . Clinical and Molecular Characteristics of B-CLL patients included in the study
Patient No Age
(yrs)
Sex
(M/F)
IGHV
gene
status
TP53
mutation
status
Current
management
PFS CRS CNAs and cnLOH events *
CLL074 NK F NK NK chemotherapy
refractory
N/A 3 47,XX, arr 80% 3(0-199,264,624)x3, 4q13.3(71,086,180-71,455,900)x1†, 4q13.3(71,736,694-
71,822,824)x1†, 11p15.4(9,745,400-10,316,737)x1, 11p13(32,809,601-33,299,316)x1
†,
11p13(33,682,105-34,179,798)x1†, 13q14.2qter(47,632,520-114,121,252)x2 hmz,
19p13.13p13.12(12,921,191-14,497,928)x1, 19p13.12p13.11(15,839,641-16,595,885)x1,
19p13.11(18,336,675-19,169,002)x1, 19q13.32(51,526,523-53,157,140)x1
CLL075 NK M NK HRM Positive chemotherapy
refractory
N/A 3 46,XY, arr 50% 1p36.23p36.32(2,396,446-8,492,493)x1, 50% 1p35.1p35.3(28,122,270-
32,692,291)x1, 50% 1p32.21p32.3(55,244,056-56,962,381)x1, 90% 1q24.2q24.3(167,889,551-
170,636,321)x2 hmz, 50% 1q32.2q41(212,087,837-215,475,787)x1,<10% 2p22.2p21(37,413,860-
43,848,439)x1†, 80% 9p24.19p13.3(5,944,274-33,693,234)x1, 80% 9q13q21.31(70,174,192-
80,333,445)x1, 80% 9q22.33q32(101,069,612-115,321,935)x1, 80% 9q33.1(119,325,172-
121,100,178)x1, 80% 9q33.1q33.2(121,461,281-122,566,552)x1, 80% 9q34.13q34.3(134,588,424-
139,101,448)x1, 80% 13q14.12q14.2(45,128,861-47,516,428)x1† , 90% 13q14.2q14.3(47,516,428-
49,482,152)x1† , 13q14.3 (49,482,152-49,732,093)x0, 90% 13q14.3(49,732,09-49,941,789)x1,
13q14.3 (49,941,789-50,302,346)x0, 90% 13q14.3(50,302,346-50,504,198)x1, 30%
14q21.3qter(47,690,870-104,581,072)x2 hmz, 70% 17pterp13.1(0-8,074,364)x2 hmz†, Xq27.3
(142,536,091-144,254,333)x0
CLL076 65 F NK Negative chemotherapy
refractory
N/A 3 47,XX, arr ~80% 1p36.12p36.11(21,423,975-23,960,71)x2 hmz†, ~50% 1pterp36.12(0-21,423,975)x2
hmz†, 2q37.1q37.1(230,940,929-231,540,187)x2 hmz
‡, 80%12(0-132,146,663)x3
CLL077 72 M Unmutated Negative chemotherapy
refractory
N/A 3 46,XY, arr 90% 20q11.21q13.12(31,081,079-43,771,286)x2 hmz, arr 20q13.12(43,780,732-
43,812,931)x0†, 90% 20q13.12,qter(43,812,931- 62,385,675)x2 hmz
CLL078 81 F Unmutated Negative chemotherapy
refractory
N/A 3 46,XX, arr 60% 4q13.1q22.2(59,939,995-95,374,528)x1, 60% 8p22p21.3(16,324,942-20,039,997)x1,
11q22.1(100,699,657-101,935,421)x1, 11q22.3q23.2(107,417,165-114,576,024)x1, 90%
Xq28(153,861,143-154,095,678)x0†
CLL081 59 M Unmutated Cys135Ser chemotherapy
refractory
<1year 3 46,XY, arr <10% 2pterp14(0-67,981,586)x3†, 90% 2q11.1q11.2(95,597,687-97,676,314)x1, 90%
2q14.2q14.3(121,572,920-126,531,524)x1, 90% 2q14.3(127,036,406-128,569,251)x1, 90%
2q21.2q24.1(134,752,138-155,542,922)x1, 40% 8q22.2qter(100,925,155-146,263,890)x3, 90%
9pterp11.2(0-33,318,812)x1, 90% 9p13.3p11.2(33,831,777-43,548,708)x1, 9q21.13(74,372,294-
74,516,002)x1†, <10% 10q23.2q23.31(89,306,467-93,720,035)x1
†, 90% 11q12.2q13.1(61,231,809-
64,790,450)x1, 70% 12q13.11q13.12(47,308,669-48,029,106)x3, 50% 13q11q13.1(17,920,393-
32,659,455)x1, 50% 13q14.3(48,898,975-50,805,219)x1, 90% 17pterpcen(0-22,125,162)x1, 70%
17qcenqter(22,713,949-78,637,198)x3; 90% 19pterp13.2(0-10,071,486)x1; 70%
19p13.2p13.13(10,071,486-13,419,854)x3
CLL092 65 M Unmutated Negative chemotherapy
refractory
<1year 3 46,XY, arr 2p16.1(55,330,268-55,352,382)x1†, 11q22.3q24.3(103,008,248-127,852,266)x1,
13q14.3(49,500,283-50,255,794)x1, ~20% 20q11.22qter(32,772,470-62,385,675)x2 hmz‡
CLL094 74 M Unmutated Negative chemotherapy
refractory
<1year 3 46,XY, arr 30% 2q33.2q36.3(206,690,791-230,780,953)x1, 40% 17pterp11.2(0-20,067,160)x1†, 60%
17p11.2(20,067,161-21,471,049)x1†
CLL111 67 F NK Negative chemotherapy
refractory
N/A 3 46,XX, arr 60% 2pterp16.1(0-60,616,006)x3, 4pterp14(0-37,269,568)x1, 4p13q12(41,367,356-
58,152,039)x1, 4q13.1q13.2(64,455,242-66,975,683)x1, 4q13.2q13.3(69,847,111-71,783,789)x1,
60% 8pterq12.1(0-63,281,507)x1, 11q21q24.2(92,396,199-126,058,859)x1, 60% 18pterp11.21(0-
12,950,950)x1†, 40% 18p11.21(12,950,950-14,856,930)x1
†,
CLL112 58 M NK Negative chemotherapy
refractory
N/A 3 46,XYarr 90% 2q35(218,476,667-220,204,673)x1, 90% 2q36.3q37.1(230,239,060-231,446,513)x1,
8q21.11q21.13(78,181,345-80,471,188)x2 hmz‡, >90% 13q11.2qter(20,381,113-113,908,097)x2 hmz,
13q14.3(49,494,577-50,238,316)x0, 80% 16p12.1(21,860,290-22,350,261)x1
ARR002 68 M Unmutated Negative chemotherapy
refractory
N/A 3 46,XY, arr 50% 2p16.1p14(60,279,157-67,896,939)x3†, 70% 15q25.2q25.3(82,852,550-
83,573,559)x3†,~10% 18q23(75,210,150-76,116,152)x1
†, 20q11.23(34,645,412-34,974,353)x1
†
MCLL148 87 M NK Ile195del chemotherapy
refractory
<6 months 3 46,XY, arr 2p16.1(56,456,704-56,519,123)x1†, 50% 4q21.21-q21.23(82,819,454-84,544,925)x1,
30% 5q21.3q22.1(106,355,299-110,412,993)x1†, 30% 5q22.2q22.3(112,371,443-113,463,403)x1,
30% 11q22.1q22.2(99,750,235-102,130,166)x1†, 30% 11q22.3q23.2(104,918,208-113,505,937)x1
†,
30% 11q23.2q23.3(114,934,105-115,687,486)x1†,30%11q23.3(117,457,306-118,510,342)x1
†, 30%
11q23.3(119,441,500-120,562,032)x1†, 30% 11q24.2q24.3(126,353,410-128,613,424)x1
†, 30%
11q24.3(128,805,080-128,951,253)x1†, 50% 12q24.11(109,411,836-109,658,160)x1
†, ~10%
13q13.3q14.3(36,320,198-49,460.768)x1†, ~90% 13q14.3(49,460.769-49,493,361)x1
†,
13q14.3(49,493,362-49,639,921)x0†, ~90% 13q14.3(49,639,922-49,845,114)x1
†,
13q14.3(49,845,115-49,992,953)x0†, ~90% 13q14.3(49,992,954-50,209,795)x1
†,
13q14.3(50,209,796-50,309,646)x0†, ~10% 13q14.3(50,309,647-50,383,609)x1
†, ~10%
13q14.3q34(50,383,610-114,125,255)x1†, 60% 17p13.3-p11.2(0-17,522,348)x2 hmz
†,
Xp11.4p11.3(41,001,474-43,480,372)x0†
CLL039 NK F NK Negative NK NK NK 46,XX, arr 4q24(107,162,437-107,237,623)x3†, 40% 10p12.33(17,900,269-18,398,113)x1, 40%
10q24.32q25.2 (103,564,352-112,658,371)x1, ~10% 16q23.1(74,997,818-75,060,214)x1†
CLL069 52 M Unmutated Negative pre-Flu/Cy FU<1year NK None noted
CLL114 63 M NK Negative pre-Flu/CyR FU<1year NK 46,XY, arr 70% 11q14.1q23.3(77,741,166-116,465,523)x1
CLL116 48 M NK HRM Positive pre-Alemtuzumab FU<1year NK 46,XY, arr 80% 17pterp11.2(0-21,964,965)x1, 80% 20p13-p12.2(4,785,063-9,654,363)x1, 80%
20p12.1q11.21(17,106,967-29,434,300)x1, 80% 20q11.22q13.12 (32,667,050-42,799,625)x1
CLL117 76 M NK NK pre-BR FU<1year NK 46,XY, arr 12p13.33(1,302,036-1,460,642)x3†, 16p13.3(3,601,816-3,736,149)x1
†,
90%16q24.3(87,195,552-88,104,547)x1, 17q21.2(37,362,610-37,545,814)x1†
CLL118 45 M Unmutated Negative pre-Flu/CyR FU<1year NK 46,XY, arr 70% 1p34.1(46,022,981-46,260,143)x3†, 90% 1p22.2(88,981,462-89,083,655)x1†, 90%
1p22.2(89,319,559-89,741,569)x1†, 90% 1p13.1(116,804,159-117,487,515)x1, 2q34(214,363,194-
214,512,575)x1†, 2q34(214,639,267-214,706,974)x1†, 90% 10q11.23(50,320,838-50,505,621)x1
†,
90% 10q11.23(51,479,606-52,200,825)x1, 11q22.3(107,443,788-108,149,178)x1,
12q24.31(121,703,515-121,806,600)x1†, 90% 13q14.11(40,332,062-40,718,960)x1, 90%
13q14.11(41,349,414-42,201,691)x1, 90% 13q14.2q14.3(47,731,453-51,632,859)x1
CLL119 65 M NK Negative pre-Flu/CyR FU<1year NK 46,XY, arr 90% 5q14.3q23.1(88,216,865-118,359,270)x1, 9q22.31(94,191,198-94,271,909)x1†, 90%
11q22.3q23.3(103,276,131-116,197,768)x1
CLL120 60 M NK Arg267Pro pre-Flu/CyR FU<1year NK 46,XY, arr 30% 13q14.2q14.3(47,411,558-50,943,647)x1†
MCLL159 72 M NK Negative pre-ChlR FU<1year NK 47,XY, arr 70% 12(0-132,146,663)x3†
MCLL171 71 F NK Negative pre-Chlorambucil FU<1year NK 46,XX, arr 70% 12(0-132,146,663)x3, 70% 17q22(51,452,730-51,748,539)x3†
MCLL137 NK M NK NK NK NK NK 46,XY, arr 1q24.2q43(230,738,028-234,657,439)x2 hmz, 2q35q36.1(220,876,620-221,498,801)x1,
13q14.2q14.3(48,748,895-51,339,176)x1
MCLL138 72 M Mutated Negative pre-ChlO FU<1year NK 46,XY, arr 1q25.3q31.1(183,714,636-188,107,919)x2 hmz†, 50% 9q21.11q34.3(71,087,509-
140,233,916)x2 hmz, 80% 13q14.11q21.33(40,811,871-45,706,420)x1, ~90%
13q14.12q14.3(45,706,421-49,971,647)x1, >90% 13q14.3(49,971,648-51,240,377)x1, 80% MCLL169 72 M NK Negative pre-ChlR FU<1year NK 46,XY, arr 2q11.2q12.1(100,630,839-104,604,613 )x2 hmz, 40% 13q12.11q34(19,727,582-
114,125,259)x2 hmz, 80% 13q14.3(49,443,358-50,378,319)x1, 17q11.2(24,916,898-24,975,608)x3
hmz†
MCLL121 70 M Mutated Negative pre-BR FU<1year NK 46,XY, arr 15q26(100,010,941-100,338,915)x1†, 17q11.2(24,913,908-24,975,608)x3
†
MCLL100 61 F Mutated Negative pre-FCM-miniR FU<1year NK 46,XX, arr 80% 13q14.3(49,552,639-49,967,095)x1, 18q23(72,560,419-72,606,933)x1†
MCLL152 67 M Mutated Negative pre-BR FU<1year NK 46,XY, arr 13q14.3(49,428,032-50,557,052)x1†, 13q14.3(49,516,595-50,2557,94)x0
MCLL161 53 M Unmutated Negative pre-FCR FU<1year NK 46,XY, arr ~10% 4pterp15.1(0-28,404,856)x1†, ~10% 11q14.3q23.3(90,803,515-117,404,675)x1
†,
20% 13q14.2q(46,483,567-47,832,800)x3†, 20%13q14.2q21.33(46,483,568-70,853,744)x2 hmz(or
x1)†, 15q25.3(83,260,487-83,303,854)x1
†, 20q11.23(34,428,530-35,199,710)x2 hmz
‡,
* using size thresholds of >20kb for CNAs and 2Mb for cnLOH unless the anomaly is in a recognized region of interest.
All co-ordinates are hg36 and determined using OncoSNP except † and
‡ (see below)
† Co-ordinates determined using Nexus (either due to variable CNA boundaries less well defined by OncoSNP or outside OncoSNP thresholds)
‡ called by OncoSNP as possible germline variant and manually verified as probable somatic event. Co-ordinates determined using Nexus
Percentages represent CNA/cnLOH levels determined using OncoSNP. Percentages <10% and >90% are outside the OncoSNP thresholds.
Approximate percentages derived using OncoSNP and visual inspection.
NK= Not Known prior to testing; PFS= Progression Free Survival; W&W= Watch and Wait; CRS=Clinical Risk Score; N/A= Not Applicable;FU=Follow Up
Flu(or F)=Fludarabine; Cy(or C)= Cyclophosphamide; Chl=Chlorambucil; R=Rituximab; B=Bendamustine; O-Ofatumumab; M=Mitozantrone; miniR=mini-Rituximab

21
Supplementary Table 3. Validation of OncoSNP Quantification by comparison with FISH data
Sample IDa OncoSNP Resultb FISH OncoSNP vs FISH
Correlation (Yes/No)c
CLL041 homozygous del13q14.3 90% homozygous 10% heterozygous del13q14.3 Yes
CLL060 80% heterozygous del13q14.3 84% heterozygous del13q14.3 Yes
CLL071 homozygous del13q14.3 84% homozygous del13q14.3 No
CLL058 90% heterozygous del17p13.1 81% heterozygous del17p13.1 Yes
CLL080 50% heterozygous del13q14.3 58% homozygous del13q14.3 Yes
CLL081 90% heterozygous del17p13.1 93% heterozygous del17p13.1 Yes
50% heterozygous del13q14.3 62% heterozygous del13q14.3 Yes
CLL082 homozygous del13q14.3 95% homozygous del13q14.3 Yes
CLL084 No change noted 15% heterozygous del13q14.3 No
CLL085 50% heterozygous del13q14.3 41% heterozygous del13q14.3 Yes
CLL087 80% trisomy 12 82% trisomy 12 Yes
CLL090 80% heterozygous del13q14.3 87% heterozygous del13q14.3 Yes
80% trisomy 12 66% trisomy 12 Yes
CLL092 90% heterozygous del11q22.3 97% heterozygous del11q22.3 Yes
90% heterozygous del13q14.3 87% heterozygous del13q14.3 Yes
CLL092 (relapse) 90% heterozygous del11q22.3 97% heterozygous del11q22.3 Yes
90% heterozygous del13q14.3 98% heterozygous del13q14.3 Yes
CLL093 90% heterozygous del13q14.3 100% heterozygous del13q14.3 Yes
CLL094 40% heterozygous del17p13.1 48% heterozygous del17p13.1 Yes
CLL095 70% trisomy 12 57% trisomy 12 Yes
aAll samples are pretreatment unless otherwise statedbMean OncoSNP % is given where segmentation of the data results in multiple calls across a region (eg trisomy 12 examples)
In the case of homozygous losses, OncoSNP percentages of 100% are not stated in the Table as formal calibration testing for homozyous events is pendingcCorrelation was defined as less than 15% difference between FISH and OncoSNP
22
Supplementary Table 4. Statistical analyses of IgVH SHM status vs CRS, Number of CNAs/cnLOHs and Length
of CNAs/cnLOHs
Covariate Category n %1 n %1 P-value2
CRS 0: W&W 3 7.7 8 38.1
1: PFS>1year 15 38.5 7 33.3
2: PFS<1year 12 30.8 4 19.0 0.0135
3: Chemotherapy refractory 9 23.1 2 9.5
All 39 100.0 21 100.0
Total number of CNAs/cnLOHs 0 6 14.3 6 24.0
1 10 23.8 11 44.0
2 5 11.9 4 16.0 0.0032
3 7 16.7 1 4.0
>3 14 33.3 3 12.0
All 42 100.0 25 100.0
Total length of CNAs/cnLOHs <1Mb 15 35.7 13 52.0
1-5Mb 5 11.9 1 4.0 0.3569
>5Mb 22 52.4 11 44.0
All 42 100.0 25 100.01 Percentage calculated over the total number of patients for whom data were available2 Cochran-Armitage trend exact test
IGHV gene status
Unmutated Mutated
Supplementary Table 5. Statistical analyses of TP53 mutation status vs CRS, Number of CNAs/cnLOHs and Length of
of CNAs/cnLOHs
Covariate Category n %1 n %1 P-value2
CRS 0: W&W 14 24.1 0 0.0
1: PFS>1year 17 29.3 2 20.0
2: PFS<1year 16 27.6 3 30.0 0.0154
3: Chemotherapy refractory 11 19.0 5 50.0
All 58 100.0 10 100.0
Total number of CNAs/cnLOHs 0 14 19.4 1 9.1
1 21 29.2 1 9.1
2 13 18.1 0 0.0 0.1345
3 9 12.5 0 0.0
>3 15 20.8 9 81.8
All 72 100.0 11 100.0
Total length of CNAs/cnLOHs <1Mb 30 41.7 1 9.1
1-5Mb 10 13.9 0 0.0 0.0081
>5Mb 32 44.4 10 90.9
All 72 100.0 11 100.01 Percentage calculated over the total number of patients for whom data were available2 Cochran-Armitage trend exact test
Negative Positive
TP53 mutation status
23
Supplementary Table 6. Detailed results for patients with 13q14.3 abnormalities Patient No Chr13 abnormalities % Cells with anomaly
encompassing 13q14.3 MDR
Additional abnormalities (Pre-treatment)* Clinical
details
PFS Clinical risk
score
RB1 deletion
or cnLOH (Y/N)
MDR only
CLL037 del13q14.3 (MDR) 100 cnLOH 9q32-q34.3 chemotherapy
refractory
N/A 3 N
CLL090 80% del13q14.3 (MDR) 80 90% del7q33-q34; 50% cnLOH11q12.1-qter
(ATM ); 80% tri12
chemotherapy
refractory
N/A 3 N
CLL092 del13q14.3 (MDR) 100 del2p16.1(<500kb); del11q22.3-q24.3 (ATM );
~20%cnLOH20q11.22-qter
chemotherapy
refractory
N/A 3 N
CLL110 homozygous del13q14.3 (MDR) 100 None noted chemotherapy
refractory
N/A 3 N
MCLL100 80% del13q14.3 80 del18q23(<500kb) pre-FCM-miniR FU<1year NK N
More than MDR N/A
CLL005 80% del13q14.2-q14.3 80 ampl5q12.1 (<500kb); 40% ampl12q12-qter; 80%
del22q11.21
W&W N/A 0 Y
CLL034 del13q14.2-q14.3 100 70% ampl2p14-pter; del11q22.3 (ATM ) W&W N/A 0 N
CLL041 del13q14.12-q14.3 with homozygous del13q14.2-
q14.3)
100 cnLOH6p22.1-21.32; 80% del10q24.32 W&W N/A 0 Y
CLL053 cnLOH13q12.11-qter with homozygous del13q14.3 100None noted
W&WN/A
0 N
CLL060 50% del13q14.12; <10% del13q14.2; 50%
del13q14.2; 80% del13q14.3
80 del1p33(<500kb) ampl7p22.1(<500kb), ampl11p13;
<10% del 16p13.3
W&W N/A 0 Y
CLL064 50% del13q14.2-q14.3; 40% del13q14.3 40 ampl3q13.32(<500Kb) W&W N/A 0 Y
CLL070 del13q14.2-q14.3 100 None noted W&W N/A 0 N
CLL080 30% del13q14.11-q14; ~50% del13q14.3 30 del3q25.3(<500kb) pre-Chl >1year 1 N
CLL085 50% del13q14.11-q21.31 50 cnLOH10q23.1-q23.31; pre-FC >1year 1 Y
CLL093 del13q14.2-q14.3; 100 80% ampl6p25.2-25.3; del6q14.1-qter; 70%
ampl10q25.1(<500kb); 70% ampl20q13.13
(<500kb)
pre-Chl >1year 1 Y
CLL096 40% cnLOHchr13 with homozygous del13q14.3 100 None noted pre-FC >1year 1 N
CLL097 >90% del13q14.11-q14.3 >90 None noted >1year 1 Y
CLL101 60-70% del13q14.2-q21.32; 50% ampl13q21.32-
q33.1
60-70 del11q14.1-qter (ATM ); 70% ampl22q11.21-qter >1year 1 Y
CLL105 90% del13q14.2-q14.3 with homozygous
del13q14.3
90 80% del10q24.31-33; 90% del11q14.1-q24.2
(ATM )
NK >1year 1 Y
CLL107 >90% del13q14.11(two regions <500kb);>90%
del13q14.2-q14.3
>90 50% del3p21.31;50% del 3p21.1, >90%
del11q14.3-q24.3 (ATM )
>1year 1 Y
CLL003 del13q14.3 100 del11q22.3 (ATM ); del11q23.1-q23.2; del11q23.3;
cnLOHq17q21.33-q22
pre-FC <1year 2 N
CLL046 del13q14.12-q14.2; cnLOH13q21.2-q33.3;
del13q14.2-q14.3
90 cnLOH5pterp15.1; cnLOH20p12.1 pre-Chl <1year 2 Y
CLL056 70% ampl13q14.12-q14.2; >90% del 13q14.2; 90%
del13q14.2-q14.3; 70% ampl13q14.3-13qter
90 80% 5p13.3 (<500kb); 80% cnLOH 9p11.2-9pter pre-Chl <1year 2 Y
CLL063 cnLOH13q12.11-qter with homozygous del13q14.3 100 del11q14.1-24.1 (ATM ) pre-FC <1year 2 N
CLL082 del13q13.2-21.2 with homozygous del13q14.3 100 None noted pre-Chl <1year 2 Y
CLL088 >90% del13q14.3 >90 None noted pre-FC <1year 2 Y
CLL100 del13q14.12-q14.3 100 del6q23.3(<500kb); del11q21-q23.3 (ATM ) NK <1year 2 Y
ARR003 del13q14.2q14.3 100 None noted pre-B <1year 2 N
CLL040 del13q14.2-q21.1 100 ampl1p36.22 (<500kb); 20% del3p21.31-p21.33;
20% del3p25.3; 40% del4p14-pter; 30-40%
ampl5p13.3-pter; 40% del5q31.3-q33.3; 40%
5q33.3-q34, ampl6q16.1(<500kb), 70%
ampl6q22.2(<500kb); ampl 8q21.3-qter; <10%
del12p13.1-p13.2; 80% del13q12.11-q12.13; ~10%
del15q.15.1, 90% del17p11.2-pter (TP53 );
del17q12(<500kb), del18p11.21-pter; <10%
del18q12.2-q21.2; 90% del19p13.3; 80%
del19p13.3, 70% ampl19p13.2;; <10% delXq12-qter
chemotherapy
refractory
N/A 3 Y
CLL044 homozygous del13q14.3 100 del2q36.2, 20% del9p21.1-p23; 50% ampl9q13-
qter; del17pcen-pter (TP53 ); cnLOH19q13.12-
q13.2
chemotherapy
refractory
N/A 3 N
CLL050 del13q14.2-q14.3 100 del6q14.1 (<500kb) intermittent; ampl7p21.1
(<500kb), del11q12.3 (<500kb)
chemotherapy
refractory
N/A 3 N
CLL058 del13q12.3(<500kb), del13q12.2(<500kb - two
regions), del13q14.2-q14.3; homozygous
del13q14.2-q14.3 (intermittent)
100 del12q24.31; 80% ampl15q14-qter; 90%
del17p11.2-pter (TP53 ), 70% ampl15q11.2
chemotherapy
refractory
N/A 3 Y
CLL071 <10% del<10% 13q13.3q34, 70% del13q14.2q14.3
with homozygous del13q14.3 (MDR)
100 30%-70% cnLOH17p11.2-pter (TP53 ) chemotherapy
refractory
N/A 3 N
CLL074 cnLOH13q14.2-qter 100 80% tri3; del11p15.4, del19p13.12-p13.13;
del19p13.11-p13.12, del19p13.11; del19q13.32
chemotherapy
refractory
N/A 3 N
CLL075 80% del13q14.12-q14.2; 90% del13q14.2-q14.3
intermittent with homozygous del13q14.3
100 50% del1p36.32-p36.23; 50% del1p35.3-p35.1;
50% del1p32.3-p32.2; 90% cnLOH1q24.2-q24.3;
50% del1q32.2-q41; <10% del2p21-p22.2; high
ampl6q23.3(<500kb); 80% del9p13.3-9p24.1; 80%
del9q13-q21.31; 80% del9q22.33-q32; 80%
del9q33.1; 80% del9q33.1-q33.2; 80% del9q34.13-
q34.3; 30% cnLOH14q21.3-14qter; 70%
cnLOH17p13.1-pter (TP53 );delXq27.3
chemotherapy
refractory
N/A 3 Y
CLL081 50% del13q12.11-q13.1; 50% del13q14.3 (MDR) 50 10% ampl2p14-pter; 90% del2q11.1-11.2; 90%
del2q14.2-q14.3, 90% del2q14.3; 90% del2q21.2-
q24.1; 40% ampl8q22.2-qter; 90% del9p11.1-pter;
del9q21.13(<500kb); <10% del10q10q23.2q23.31;
90% del11q12.2-q13.1; 70% ampl12q13.12; 90%
del17pcen-pter (TP53 ); 70% ampl17qcen-qter;
90% del19p13.2-pter; 70% ampl19p13.13-p13.2
chemotherapy
refractory
N/A 3 N
CLL112 >90% cnLOH13q12.11-qter with homozygous
del13q14.3
100 90% del2q35; 90% del2q36.3-q37.1; cnLOH
8q21.11q21.13, 80% del16p12.1
chemotherapy
refractory
N/A 3 N
MCLL148 ~90% del13q14.3 with intermittent homozygous
del13q14.3; ~10% del13q14.3q34
~90 del2p16.1(<500kb); 50% del4q21.21-q21.23; 30%
del5q21.3q22.1; 30% del5q22.2q22.3; 30%
del11q22.1q22.2; 30% del11q22.3q23.2 (ATM );
30% del11q23.2q23.3; 30% del11q23.3; 30%
del11q23.3; 30% del11q24.2q24.3; 30% del11q24.3
(<500kb); 50% 12q24.11(<500kb); 60%
cnLOH17p13.3-p11.2 (TP53 );
delXp11.4p11.3(41;001;474-43;480;372)
chemotherapy
refractory
<6 months 3 N
CLL068 del13q14.3 100 90% del2q22.2-24.1 pre-FC NK NK Y
CLL072 del13q14.2-q14.3 100 high ampl15q24.1(<500kb) NK NK NK N
CLL118 90% del13q14.11 (two regions); 90% del13q14.2-
q14.3
90 90% ampl1p34.1(<500kb); 90% del1p22.2(two
regoins <500kb); del2q34(two regions <500kb);
del1p13.1; 90% del10q11.23(<500kb); 90%
del10q11.23, del12q24.3(<500kb); del11q22.3
(ATM )
pre-FCR NK NK Y
CLL120 30% del13q14.2q14.3 30 None noted pre-Flu/Cy-R FU<1year NK Y
MCLL137 del 13q14.2q14.3 100 cnLOH1q24.2q43; del2q35q36.1 NK NK NK N
MCLL138 80% del 13q14,11q21.33, ~90% del
13q14.12q14.3, >90% del13q14.3
>9 cnLOH 1q25.3q31.1; amp9q21.11q34.3;
ampl16p11.2(<500kb)
pre-ChlO FU<1year NK Y
MCLL169 40% cnLOH13q12.11q34 with 80% del13q14.3 80 cnLOH2q11.2q12; ampl17q11.2(<500kb) pre-ChlR FU<1year NK N
MCLL152 del13q14.3 with homozygous del13q14.3 100 None noted pre-BR FU<1year NK N
MCLL161 20% ampl13q14.2; 20% cnLOH/del 13q14,2q21.33 20 ~10% del4pterp15.1, ~10% del11q14.3q23.3, 20%
ampl13q14.2, del15q25.3 (<500kb), 20%
cnLOH20q11.23
pre-FCR FU<1year NK Y
* deletions events are heterozygous unless otherwise stated. Percentages of 30-90% arefrom OncoSNP; all other calls are from visual interpretation.
CNAs are >500kb and cnLOH>2Mb unless otherwise stated; known regions of interest are highlighted in bold
MDR = Minimally Deleted Region; PFS = Progression Free Survival; RB1 - Retinoblastoma gene
NK=Not Known; Flu(or F)=Fludarabine; Cy(or C)= Cyclophosphamide; R= Rituximab; miniR=mini-Rituximab B=Bendamustine; Chl=Chlorambucil; O=Ofatumumab

24
Supplementary Table 7. Statistical analyses of RB1 deletions or cnLOH vs CRS and IGHV gene status in patients with
13q14.3 deletions
Covariate Category n %1 n %1 P-value
CRS 0: W&W 3 15.8 4 21.1
1: PFS>1year 2 10.5 7 36.8
2: PFS<1year 3 15.8 5 26.3 0.046622
3: Chemotherapy refractory 11 57.9 3 15.8
All 19 100.0 19 100.0
IGHV gene status Unmutated 6 40.0 10 58.8
Mutated 9 60.0 7 41.2 0.28793
All 15 100.0 17 100.01 Percentage calculated over the total of patients for which the data were available2 Cochran-Armitage trend exact test 3 Chi-square test
RB1 deletion or cnLOH
No Yes
Supplementary Table 8. Statistical analyses of Clinical Risk Score vs Total Number and Total Length of CNAs/cnLOHs excluding and
including well-known abnormalities
Covariate Category n %1 n %1 n %1 n %1 P-value2
0 4 25.0 3 13.6 5 25.0 0 0.0
1 8 50.0 9 40.9 3 15.0 3 16.7
2 2 12.5 2 9.1 3 15.0 2 11.1 0.0016
3 0 0.0 4 18.2 3 15.0 1 5.6
>3 2 12.5 4 18.2 6 30.0 12 66.7
All 16 100.0 22 100.0 20 100.0 18 100.0
<1Mb 9 56.3 9 40.9 9 45.0 0 0.0
1-5Mb 2 12.5 4 18.2 2 10.0 0 0.0 0.0002
>5Mb 5 31.3 9 40.9 9 45.0 18 100.0
All 16 100.0 22 100.0 20 100.0 18 100.0
0 1 6.3 2 9.1 1 5.0 0 0.0
1 5 31.3 4 18.2 6 30.0 0 0.0
2 6 37.5 6 27.3 3 15.0 3 16.7 0.0029
3 2 12.5 3 13.6 1 5.0 2 11.1
>3 2 12.5 7 31.8 9 45.0 13 72.2
All 16 100.0 22 100.0 20 100.0 18 100.01 Percentage calculated over the total number of patients for whom data were available2 Cochran-Armitage trend exact test
2 (PFS<1year) 3 (Chemotherapy
Refractory)
Clinical Risk Score
Total number of
CNAs/cnLOHs
including known
abnormalities
Total number of
CNAs/cnLOHs
excluding known
abnormalities
Total length of
CNAs/cnLOHs
excluding known
abnormalities
0 (W&W) 1 (PFS>1year)
Supplementary Table 9. Statistical analyses of Clonal Evolution vs CRS, Number of CNAs/cnLOHs and Length of
of CNAs/cnLOHs
Covariate Category n %1 n %1 P-value2
CRS 0: W&W 0 0.0 0 0.0
1: PFS>1year 9 52.9 10 40.0
2: PFS<1year 8 47.1 10 40.0 0.1696
3: Chemotherapy refractory 0 0.0 5 20.0
All 17 100.0 25 100.0
Total number of CNAs/cnLOHs 0 5 29.4 3 12.0
1 4 23.5 7 28.0
2 3 17.6 2 8.0 0.1020
3 3 17.6 3 12.0
>3 2 11.8 10 40.0
All 17 100.0 25 100.0
Total length of CNAs/cnLOHs <1Mb 10 58.8 6 24.0
1-5Mb 3 17.6 2 8.0
>5Mb 4 23.5 17 68.0 0.0075
All 17 100.0 25 100.01 Percentage calculated over the total number of patients for whom data were available2 Cochran-Armitage trend exact test
Clonal Evolution
No Yes
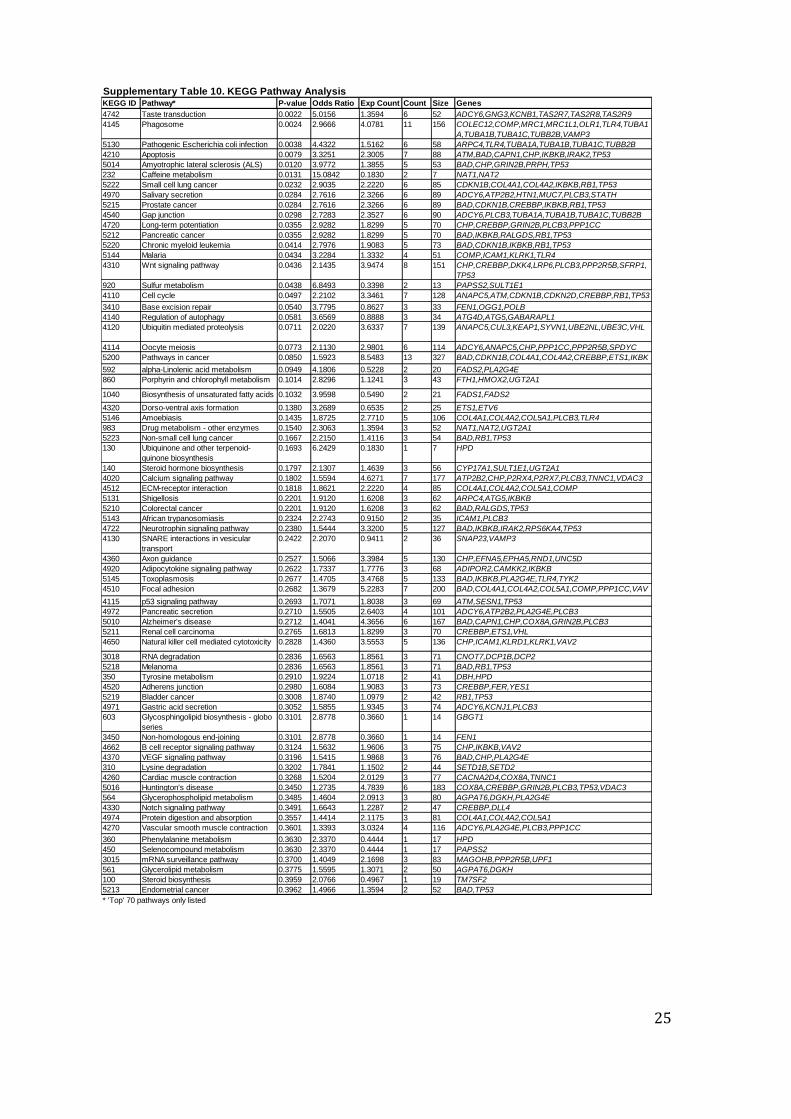
25
Supplementary Table 10. KEGG Pathway AnalysisKEGG ID Pathway* P-value Odds Ratio Exp Count Count Size Genes
4742 Taste transduction 0.0022 5.0156 1.3594 6 52 ADCY6,GNG3,KCNB1,TAS2R7,TAS2R8,TAS2R9
4145 Phagosome 0.0024 2.9666 4.0781 11 156 COLEC12,COMP,MRC1,MRC1L1,OLR1,TLR4,TUBA1
A,TUBA1B,TUBA1C,TUBB2B,VAMP3
5130 Pathogenic Escherichia coli infection 0.0038 4.4322 1.5162 6 58 ARPC4,TLR4,TUBA1A,TUBA1B,TUBA1C,TUBB2B
4210 Apoptosis 0.0079 3.3251 2.3005 7 88 ATM,BAD,CAPN1,CHP,IKBKB,IRAK2,TP53
5014 Amyotrophic lateral sclerosis (ALS) 0.0120 3.9772 1.3855 5 53 BAD,CHP,GRIN2B,PRPH,TP53
232 Caffeine metabolism 0.0131 15.0842 0.1830 2 7 NAT1,NAT2
5222 Small cell lung cancer 0.0232 2.9035 2.2220 6 85 CDKN1B,COL4A1,COL4A2,IKBKB,RB1,TP53
4970 Salivary secretion 0.0284 2.7616 2.3266 6 89 ADCY6,ATP2B2,HTN1,MUC7,PLCB3,STATH
5215 Prostate cancer 0.0284 2.7616 2.3266 6 89 BAD,CDKN1B,CREBBP,IKBKB,RB1,TP53
4540 Gap junction 0.0298 2.7283 2.3527 6 90 ADCY6,PLCB3,TUBA1A,TUBA1B,TUBA1C,TUBB2B
4720 Long-term potentiation 0.0355 2.9282 1.8299 5 70 CHP,CREBBP,GRIN2B,PLCB3,PPP1CC
5212 Pancreatic cancer 0.0355 2.9282 1.8299 5 70 BAD,IKBKB,RALGDS,RB1,TP53
5220 Chronic myeloid leukemia 0.0414 2.7976 1.9083 5 73 BAD,CDKN1B,IKBKB,RB1,TP53
5144 Malaria 0.0434 3.2284 1.3332 4 51 COMP,ICAM1,KLRK1,TLR4
4310 Wnt signaling pathway 0.0436 2.1435 3.9474 8 151 CHP,CREBBP,DKK4,LRP6,PLCB3,PPP2R5B,SFRP1,
TP53
920 Sulfur metabolism 0.0438 6.8493 0.3398 2 13 PAPSS2,SULT1E1
4110 Cell cycle 0.0497 2.2102 3.3461 7 128 ANAPC5,ATM,CDKN1B,CDKN2D,CREBBP,RB1,TP53
3410 Base excision repair 0.0540 3.7795 0.8627 3 33 FEN1,OGG1,POLB
4140 Regulation of autophagy 0.0581 3.6569 0.8888 3 34 ATG4D,ATG5,GABARAPL1
4120 Ubiquitin mediated proteolysis 0.0711 2.0220 3.6337 7 139 ANAPC5,CUL3,KEAP1,SYVN1,UBE2NL,UBE3C,VHL
4114 Oocyte meiosis 0.0773 2.1130 2.9801 6 114 ADCY6,ANAPC5,CHP,PPP1CC,PPP2R5B,SPDYC
5200 Pathways in cancer 0.0850 1.5923 8.5483 13 327 BAD,CDKN1B,COL4A1,COL4A2,CREBBP,ETS1,IKBK
B,NFKB2,RALGDS,RB1,SUFU,TP53,VHL592 alpha-Linolenic acid metabolism 0.0949 4.1806 0.5228 2 20 FADS2,PLA2G4E
860 Porphyrin and chlorophyll metabolism 0.1014 2.8296 1.1241 3 43 FTH1,HMOX2,UGT2A1
1040 Biosynthesis of unsaturated fatty acids 0.1032 3.9598 0.5490 2 21 FADS1,FADS2
4320 Dorso-ventral axis formation 0.1380 3.2689 0.6535 2 25 ETS1,ETV6
5146 Amoebiasis 0.1435 1.8725 2.7710 5 106 COL4A1,COL4A2,COL5A1,PLCB3,TLR4
983 Drug metabolism - other enzymes 0.1540 2.3063 1.3594 3 52 NAT1,NAT2,UGT2A1
5223 Non-small cell lung cancer 0.1667 2.2150 1.4116 3 54 BAD,RB1,TP53
130 Ubiquinone and other terpenoid-
quinone biosynthesis
0.1693 6.2429 0.1830 1 7 HPD
140 Steroid hormone biosynthesis 0.1797 2.1307 1.4639 3 56 CYP17A1,SULT1E1,UGT2A1
4020 Calcium signaling pathway 0.1802 1.5594 4.6271 7 177 ATP2B2,CHP,P2RX4,P2RX7,PLCB3,TNNC1,VDAC3
4512 ECM-receptor interaction 0.1818 1.8621 2.2220 4 85 COL4A1,COL4A2,COL5A1,COMP
5131 Shigellosis 0.2201 1.9120 1.6208 3 62 ARPC4,ATG5,IKBKB
5210 Colorectal cancer 0.2201 1.9120 1.6208 3 62 BAD,RALGDS,TP53
5143 African trypanosomiasis 0.2324 2.2743 0.9150 2 35 ICAM1,PLCB3
4722 Neurotrophin signaling pathway 0.2380 1.5444 3.3200 5 127 BAD,IKBKB,IRAK2,RPS6KA4,TP53
4130 SNARE interactions in vesicular
transport
0.2422 2.2070 0.9411 2 36 SNAP23,VAMP3
4360 Axon guidance 0.2527 1.5066 3.3984 5 130 CHP,EFNA5,EPHA5,RND1,UNC5D
4920 Adipocytokine signaling pathway 0.2622 1.7337 1.7776 3 68 ADIPOR2,CAMKK2,IKBKB
5145 Toxoplasmosis 0.2677 1.4705 3.4768 5 133 BAD,IKBKB,PLA2G4E,TLR4,TYK2
4510 Focal adhesion 0.2682 1.3679 5.2283 7 200 BAD,COL4A1,COL4A2,COL5A1,COMP,PPP1CC,VAV
24115 p53 signaling pathway 0.2693 1.7071 1.8038 3 69 ATM,SESN1,TP53
4972 Pancreatic secretion 0.2710 1.5505 2.6403 4 101 ADCY6,ATP2B2,PLA2G4E,PLCB3
5010 Alzheimer's disease 0.2712 1.4041 4.3656 6 167 BAD,CAPN1,CHP,COX8A,GRIN2B,PLCB3
5211 Renal cell carcinoma 0.2765 1.6813 1.8299 3 70 CREBBP,ETS1,VHL
4650 Natural killer cell mediated cytotoxicity 0.2828 1.4360 3.5553 5 136 CHP,ICAM1,KLRD1,KLRK1,VAV2
3018 RNA degradation 0.2836 1.6563 1.8561 3 71 CNOT7,DCP1B,DCP2
5218 Melanoma 0.2836 1.6563 1.8561 3 71 BAD,RB1,TP53
350 Tyrosine metabolism 0.2910 1.9224 1.0718 2 41 DBH,HPD
4520 Adherens junction 0.2980 1.6084 1.9083 3 73 CREBBP,FER,YES1
5219 Bladder cancer 0.3008 1.8740 1.0979 2 42 RB1,TP53
4971 Gastric acid secretion 0.3052 1.5855 1.9345 3 74 ADCY6,KCNJ1,PLCB3
603 Glycosphingolipid biosynthesis - globo
series
0.3101 2.8778 0.3660 1 14 GBGT1
3450 Non-homologous end-joining 0.3101 2.8778 0.3660 1 14 FEN1
4662 B cell receptor signaling pathway 0.3124 1.5632 1.9606 3 75 CHP,IKBKB,VAV2
4370 VEGF signaling pathway 0.3196 1.5415 1.9868 3 76 BAD,CHP,PLA2G4E
310 Lysine degradation 0.3202 1.7841 1.1502 2 44 SETD1B,SETD2
4260 Cardiac muscle contraction 0.3268 1.5204 2.0129 3 77 CACNA2D4,COX8A,TNNC1
5016 Huntington's disease 0.3450 1.2735 4.7839 6 183 COX8A,CREBBP,GRIN2B,PLCB3,TP53,VDAC3
564 Glycerophospholipid metabolism 0.3485 1.4604 2.0913 3 80 AGPAT6,DGKH,PLA2G4E
4330 Notch signaling pathway 0.3491 1.6643 1.2287 2 47 CREBBP,DLL4
4974 Protein digestion and absorption 0.3557 1.4414 2.1175 3 81 COL4A1,COL4A2,COL5A1
4270 Vascular smooth muscle contraction 0.3601 1.3393 3.0324 4 116 ADCY6,PLA2G4E,PLCB3,PPP1CC
360 Phenylalanine metabolism 0.3630 2.3370 0.4444 1 17 HPD
450 Selenocompound metabolism 0.3630 2.3370 0.4444 1 17 PAPSS2
3015 mRNA surveillance pathway 0.3700 1.4049 2.1698 3 83 MAGOHB,PPP2R5B,UPF1
561 Glycerolipid metabolism 0.3775 1.5595 1.3071 2 50 AGPAT6,DGKH
100 Steroid biosynthesis 0.3959 2.0766 0.4967 1 19 TM7SF2
5213 Endometrial cancer 0.3962 1.4966 1.3594 2 52 BAD,TP53
* 'Top' 70 pathways only listed

26
Paired Pre-treatment and Relapse samples (n=42 pairs)
Pre-treatment samples only (n=93)
All samples investigated for intra-clonal
heterogeneity using
arrays and OncoSNP
All Pre-treatment and Relapse pairs investigated for clonal
evolution over time using arrays and OncoSNP
B-CLL Study patients (n=93)B-CLL Study samples (93+42=135)
IGHV gene mutation status (n=67) and TP53 mutation status (n=83) established
Supplementary Figure 1. Flowchart documenting numbers of samples and
overview of study.

27
Supplementary Figure 2. The Vysis LSI ATM FISH probe (boundaries
indicated by yellow arrow and dashed lines) binds to non-deleted regions in
two B-CLL patients with small 11q22.3 MDR deletions (indicated by red bars).

28
Mutated TP53
Wild-type TP53
a) cnLOH detected by Illumina chip b) High resolution melting curve c) Sanger sequencing of TP53
CLL071Fluorescenceintensityratio
B-allelefrequency
Supplementary Figure 3. TP53 Mutation screening of the sample from CLL071 with cnLOH encompassing this gene. a) Nexus image showing
cnLOH across the region b) high resolution melting curve analysis shows deviation from the TP53 reference sequence c) Sanger sequencing
confirms the presence of a GAG>AAG mutation in this patient sample.
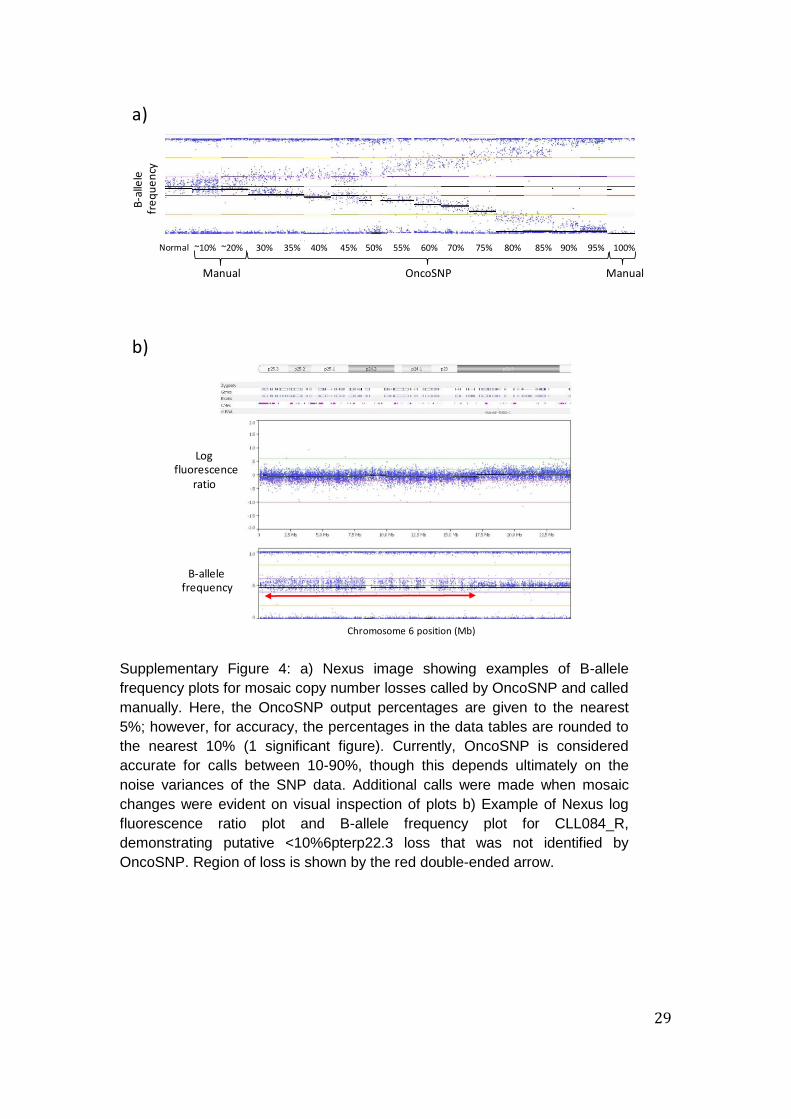
29
a)
b)
B-allelefrequency
Logfluorescence
ratio
Normal ~10% ~20% 30% 45%35% 55%40% 75% 80% 85% 90% 95% 100%50% 60% 70%
OncoSNP ManualManual
Chromosome 6 position (Mb)
B-a
llele
fre
qu
en
cy
Supplementary Figure 4: a) Nexus image showing examples of B-allele
frequency plots for mosaic copy number losses called by OncoSNP and called
manually. Here, the OncoSNP output percentages are given to the nearest
5%; however, for accuracy, the percentages in the data tables are rounded to
the nearest 10% (1 significant figure). Currently, OncoSNP is considered
accurate for calls between 10-90%, though this depends ultimately on the
noise variances of the SNP data. Additional calls were made when mosaic
changes were evident on visual inspection of plots b) Example of Nexus log
fluorescence ratio plot and B-allele frequency plot for CLL084_R,
demonstrating putative <10%6pterp22.3 loss that was not identified by
OncoSNP. Region of loss is shown by the red double-ended arrow.

30
47
B-C
LL p
atie
nts
with
de
letio
ns/c
nL
OH
invo
lvin
g 1
3q
13
.4
MDR (~7kb)
involves DLEU2
1
47
50%
0%
50%
100%
100%
1
47
Chromosome 13
CNVs
Exons
Genes
miRNA
Supplementary Figure 5. Nexus (BioDiscovery) image showing Illumina 1M-Duo data calls from 47 patients with deletions/cnLOH involving 13q13.4. Red bar = CNA loss (thick bar indicates homozygous loss); green bar = CNA gain; mustard bar = LOH; purple bar = allelic imbalance.
.

31
Supplementary Figure 6. a) The B-allele frequency plot shows clear evidence of
mosaicism involving chromosome 13q14.1-q14.3 (red arrow) in a pre-treatment
sample from CLL080 b) clonal evolution of a chromosome 13q14.3 deletion in a
pre-treatment sample from patient CLL071 - the red, dashed arrows indicate the
apparent boundary extension involving one allele.

32
Pre-treatment
Relapse
~20% ~30% ~80%
Proportion of sub-clones with CNA/cnLOH
CNAs/cnLOHs identified
11q22.3q24.3(x1)
20q11.22qter(x2) hmz
Leukemic Progenitor(s)
13q14.3(x1)
<5% >90%~60%
2p16.1(x1)
11q22.1(x1)
~10%
Supplementary Figure 7. Schematic representation of the possible clonal architecture
pre-treatment and at relapse for patient CLL092. Percentages below 10% and above
90% and cell populations without identifiable CNAs/cnLOHs are inferred. The precision
of the percentage contribution of sub-clones with CNAs/cnLOH is +/- 10%.


![Avionics AUC[1]](https://img.pdfslide.us/doc/110x75/577d23e21a28ab4e1e9b0804/avionics-auc1.jpg)