Embed Size (px)
Citation preview

MATERIAL FLOWS IN THE UNITED STATESA Physical Accounting of the U.S. IndustrialEconomy
World Resources Institute10 G Street, NEWashington, DC 20002 USA
www.wri .org
DON ROGICH
AMY CASSARA
IDDO WERNICK
MARTA MIRANDA
W R I R E P O R T


i
WRI: MATERIAL FLOWS IN THE UNITED STATES
MATERIAL FLOWS IN THE UNITED STATES
A PHYSICAL ACCOUNTING OF THE U.S. INDUSTRIAL ECONOMY
DONALD ROGICH
AMY CASSARA
IDDO WERNICK
MARTA MIRANDA
W A S H I N G T O N , D C

ii
WRI: MATERIAL FLOWS IN THE UNITED STATES
HYACINTH BILLINGSPUBLICATIONS DIRECTOR
MAGGIE POWELLLAYOUT
Each World Resources Institute report represents a timely, scholarly treatment of a subject of public concern. WRI takes responsibility for choosing the study topics and guaranteeing its authors and researchers freedom of inquiry. It also
solicits and responds to the guidance of advisory panels and expert reviewers. Unless otherwise stated, however, all the interpretation and fi ndings set forth in WRI publications are those of the authors.
Copyright © 2008 World Resources Institute. All rights reserved.
ISBN 978-1-56973-682-1
Printed in the United States of America on chlorine-free paper with recycled content of 50%, 20% of which is post-consumer.

iii
WRI: MATERIAL FLOWS IN THE UNITED STATES
CONTENTS
Acknowledgments ................................................................................................iv
Foreword .................................................................................................................v
Executive Summary ...............................................................................................1
1. Introduction to Material Flows .........................................................................5
2. Aggregated Indicators of Material Flows ...................................................... 10
3. Material Flows by Sector .................................................................................. 15
4. Special Applications of Material Flows Analysis .......................................... 24
5. Recommendations and Areas for Future Research ...................................... 27
Notes .................................................................................................................... 30
Sources ................................................................................................................32
Appendix 1. Characterizing Material Flows ....................................................... 33
Appendix 2. Commodities Included in the Material Flows Accounts ............. 36
Appendix 3. National Indicators by Weight and Sector .................................... 38
Appendix 4. National Indicators Per Capita by Sector .....................................40

iv
WRI: MATERIAL FLOWS IN THE UNITED STATES
ACKNOWLEDGMENTS
We want to acknowledge the many colleagues who have generously given their time and information to help us develop this report.
WRI has now worked in the fi eld of material fl ows accounting for almost ten years, building on the data, analyses, and ideas of colleagues in numerous educa-tional organizations, research institutes, and govern-ments. Even with years of work behind us, we are con-tinually uncovering new ways to measure and monitor the fl ows of materials through the environment.
The data sets used in this report were compiled by WRI, but would not have been available at all without the constant work of our colleagues in U.S. govern-ment agencies. In particular, the background research of the U.S. Geological Survey, the U.S. Forest Service, the Department of Energy, the Department of Agricul-ture, and the Environmental Protection Agency made this report possible.
More specifi cally, we would like to thank Diana Bauer and Angie Leith of the EPA, Stefan Bringezu at the Wuppertal Institute, William Dillingham (USGS), Ted Heintz (CEQ), and Tom Theis at the University of Illinois-Chicago for their comments and suggestions on how to improve our work. We also want to thank Al Hammond, Tim Herzog, Christian Layke, and Amanda Sauer, our WRI colleagues, for their critical reading of the manuscript.
Special thanks to Dan Tunstall and David Jhirad, who worked on the project with us and provided valu-able suggestions, criticisms, and information along the way. We also want to acknowledge Grecia Matos and colleagues at the U.S. Geological Survey for help-ing us develop the data and the accounting methods outlined in the report.
Thanks also to designers, editors, and production managers Jo Tunstall, Karen Holmes, Maggie Powell, and Hyacinth Billings for their thoughtful, imagina-tive, and thorough work in bringing this report to completion.
Finally, we wish to thank Derry Allen and Barbara Karn of the Environmental Protection Agency for their extensive guidance and encouragement. They have supported WRI’s work on material fl ows over the years and have brought their knowledge and persis-tence to bear on the research and application of mate-rial fl ows in the EPA.
This project was conducted under a cooperative agreement and with fi nancial support from the Envi-ronmental Protection Agency, which we acknowledge with our sincere thanks.

v
WRI: MATERIAL FLOWS IN THE UNITED STATES
FOREWORD
There is no end to the debate about the direc-tion and condition of the U.S. economy. Is it growing fast enough? Which sectors are taking
off, and which are in decline? Recently, economic dia-logue has expanded to encompass urgent, new ques-tions about human-induced climate change. How will climate change affect the economy? What shifts can we anticipate in the energy sector—including introduction of new, carbon-neutral energy sources as well as accelerating technological innovation in the effi ciency of energy use—and how will this evolution affect economic growth and environmental quality?
In general, U.S. decision-makers enjoy access to some of the best economic information and analysis in the world, including detailed measurements of economic activity, employment, and changes in the productivity of labor and capital. These statistics and indicators drive policy and move markets. Regret-tably, our conventional economic accounts are not so effective when it comes to providing adequate infor-mation on the long-term costs to society of environ-mental degradation.
Offi cial U.S. economic accounts do not systemati-cally track the movement of materials and energy into and out of our economy—from extraction to manufacturing, product use (and reuse or recycling), and eventual disposal. This failure makes it more diffi cult to gauge the full economic costs and benefi ts (including associated environmental consequences)
of the energy and materials used to provide goods and services. And as a result, public policies and private actions are based on an incomplete, perhaps seriously misguided, understanding of the true costs of production.
With this report Material Flows in the United States: A Physical Accounting of the U.S. Industrial Economy, WRI is releasing the third in a series of studies that explore the development of measurements that can document the fl ow of materials through the national economy. This information can be used to monitor progress and shape policies toward a more effi cient economy—one that will be built on new forms of energy, on technological and economic innovations, and on an accounting system that includes the full spectrum of production costs.
The current report follows on our 1997 study Re-source Flows: The Material Basis of Industrial Economies, which set out the basic concepts and accounting pro-cedures to measure the physical fl ows of materials. In a subsequent study, The Weight of Nations, released in 2000, we compared U.S. material fl ows with those of other advanced countries, including Austria, Ger-many, Japan, and the Netherlands.
This new report, Material Flows in the United States, provides detailed data on trends in material fl ows in four key sectors of the U.S. economy: metal and minerals, nonrenewable organic materials (including

vi
WRI: MATERIAL FLOWS IN THE UNITED STATES
fossil fuels), agriculture, and forestry. It looks at 169 primary-level raw materials for which data are avail-able and which are the building blocks of the U.S. economy. Among these 169 materials are toxic sub-stances—such as arsenic, cadmium, lead, mercury, and others—whose fl ow we trace into the economy and back out to the environment, revealing in the process the strengths and weaknesses in our national regulatory policies and procedures.
So, where do we stand? How do we use these ac-counts and indicators to assess progress (or the lack of it) toward sustainability?
Those who follow the ebb and fl ow of the busi-ness cycle, when assessing economic conditions and policies, speak in terms of leading, coincident, and lagging indicators. In the case of material fl ows, our leading indicator is the amount of materials consumed to produce a dollar of GDP. According to the fi ndings of this study, this fi gure declined by 31 percent over the 25-year study period (1975 to 2000), refl ecting more effi cient use of fossil fuels, metals and minerals, and renewable resources.
However, the trend in per capita consumption of material (a coincident indicator) is increasing, with a rise of some 23 percent over the study period. If the U.S. economy were solidly on a path to sustainability, this indicator would be declining.
Meanwhile, total consumption of materials (a lag-ging indicator) grew 57 percent over the study period, to 6.5 billion metric tons in 2000. If the United States had been a sustainable economy during this period, we would have avoided the creation of 25 bil-lion tons of waste (and its subsequent disposal into our air and water and onto our land).
These numbers carry important messages for meeting one of the most signifi cant challenges of our time: to create an economy that uses materials more effi ciently and that is much less damaging to the environment.
An accounting system of material fl ows is feasible as this report shows and provides a useful, even es-sential, tool for charting the course to a more sustain-able economy.
The time has come for the U.S. government to em-brace the development of material fl ows accounting on a regular basis, report the data and indicators to the public, and make the information widely avail-able. The United States needs, and deserves to have, offi cial accounts that capture material fl ows, and their environmental consequences, as well as they do fi nancial fl ows.
JONATHAN LASHPresident, World Resources Institute

1
WRI: MATERIAL FLOWS IN THE UNITED STATES
EXECUTIVE SUMMARY
Basis of Industrial Economies (1997) and The Weight of Nations: Material Outfl ows from Industrial Economies (2000). This, the third report, focuses on the United States and accounts of material fl ows from 1975 to 2000. It presents the accounts in aggregate and by economic sector, examines specifi c fl ows of environ-mental or economic importance, and recommends next steps for institutionalization of these accounts at the national level.
The full details of the study, including technical notes, sources, and a database of material fl ows ac-counts for the United States can be accessed online at http://materials.wri.org.
FINDINGS
Focusing on just the United States has permitted a signifi cant expansion of the materials included and of the dimensions analyzed, leading to a greater depth of analysis across materials, economic sectors, and end uses. Results indicate the following trends in material consumption, effi ciency, and outputs:
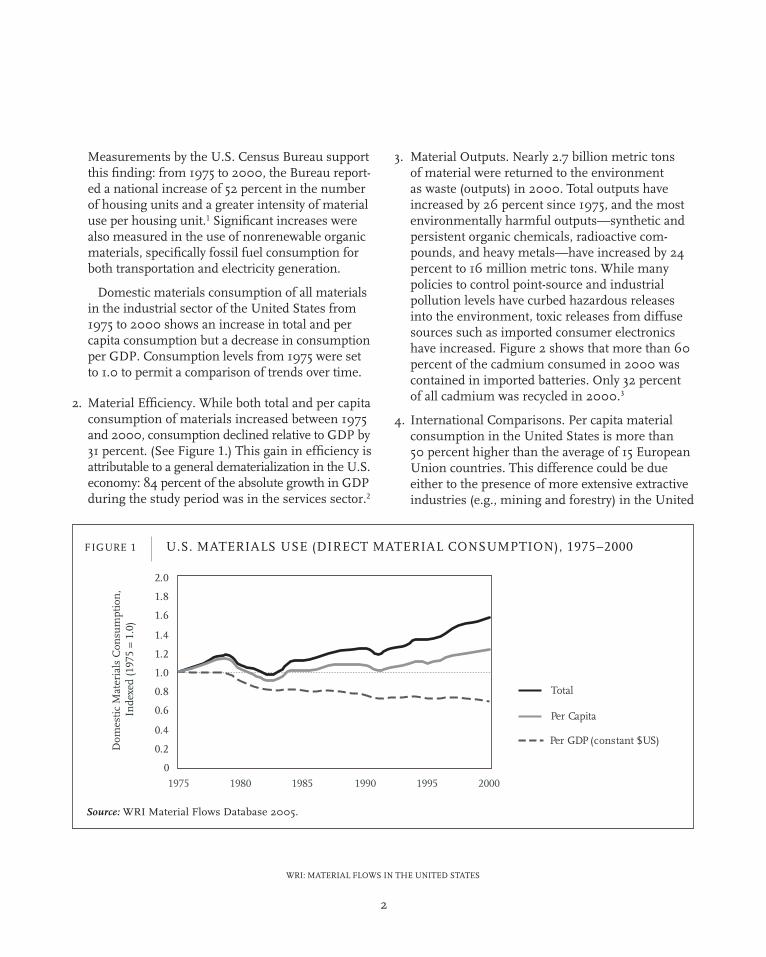
1. Consumption. In absolute terms, total material consumption increased from 1975 to 2000 by 57 percent to 6.5 billion metric tons in 2000. Per capita consumption increased by 23 percent. (See Figure 1.) The majority of growth can be explained by an 83 percent increase in built infrastructure.
Economists and policymakers often look to a country’s gross domestic product (GDP) when measuring its economic health. However, GDP
and other standard economic indicators measure only the dollar value of goods and services without specifi cally considering the non-dollar cost of the physical movement of materials associated with industrial development.
Experts in the fi eld of industrial ecology have quan-tifi ed the movement of raw materials and processed goods through national economies using a system known as material fl ows analysis (MFA). MFA has already shown, in a broad sense, how natural re-sources are extracted, used, and discarded, providing important insight into the links between economic growth, population growth, and materials use. When more developed, MFA will give a more accurate account of the time cost of industrial development. The results will lead to improved policy in a variety of fi elds, including environmental protection, trade, national security, and technology development.
This report is the third in a series of material fl ows analyses conducted by the World Resources Institute (WRI). In 1995, WRI partnered with fi ve interna-tional organizations to develop the fi rst system-atic method for tracing the extraction, processing, production, use, recycling, and disposal of all major commodities in a nation’s economy. Two reports have already been published: Resource Flows: The Material
2
WRI: MATERIAL FLOWS IN THE UNITED STATES
Measurements by the U.S. Census Bureau support this fi nding: from 1975 to 2000, the Bureau report-ed a national increase of 52 percent in the number of housing units and a greater intensity of material use per housing unit.1 Signifi cant increases were also measured in the use of nonrenewable organic materials, specifi cally fossil fuel consumption for both transportation and electricity generation.
Domestic materials consumption of all materials in the industrial sector of the United States from 1975 to 2000 shows an increase in total and per capita consumption but a decrease in consumption per GDP. Consumption levels from 1975 were set to 1.0 to permit a comparison of trends over time.
2. Material Effi ciency. While both total and per capita consumption of materials increased between 1975 and 2000, consumption declined relative to GDP by 31 percent. (See Figure 1.) This gain in effi ciency is attributable to a general dematerialization in the U.S. economy: 84 percent of the absolute growth in GDP during the study period was in the services sector.2
3. Material Outputs. Nearly 2.7 billion metric tons of material were returned to the environment as waste (outputs) in 2000. Total outputs have increased by 26 percent since 1975, and the most environmentally harmful outputs—synthetic and persistent organic chemicals, radioactive com-pounds, and heavy metals—have increased by 24 percent to 16 million metric tons. While many policies to control point-source and industrial pollution levels have curbed hazardous releases into the environment, toxic releases from diffuse sources such as imported consumer electronics have increased. Figure 2 shows that more than 60 percent of the cadmium consumed in 2000 was contained in imported batteries. Only 32 percent of all cadmium was recycled in 2000.3
4. International Comparisons. Per capita material consumption in the United States is more than 50 percent higher than the average of 15 European Union countries. This difference could be due either to the presence of more extensive extractive industries (e.g., mining and forestry) in the United

3
WRI: MATERIAL FLOWS IN THE UNITED STATES
States or to differences in consumption, housing, transportation, and infrastructure development patterns between the EU and the United States. Despite small methodological differences in mate-rial fl ows accounting, consumption values for the United States can generally be compared to those computed for the European Union. However, because of the differences in national economies mentioned above, the comparisons must be inter-preted with care.
RECOMMENDATIONS
A well established system of national material ac-counts could enable more effective policymaking in both the public and private sectors. Until now, how-ever, material analyses have been conducted sporadi-cally, with limited resources, and principally through the work of nongovernmental organizations. Making MFA effective will require funds for both data collec-tion and policy analysis across a number of govern-ment agencies; partnerships with international MFA consortia, private industry, academia, and NGOs; and the establishment of a central organization—a Center for Material Flows—to manage the collection, analy-sis, and dissemination of material fl ows accounts in the United States.
Establishing viable material accounts in the United States will require both institutional and analytical improvements. To create a practical analytical frame-work for MFA, WRI has joined the National Resource Council’s Committee on Materials Flow Account-ing in recommending that the federal government establish a Center for Material Flows in collaboration with nongovernmental organizations and the private sector.4 WRI also recommends the following actions:
1. Establish a robust materials accounting frame-work. A more systematic and vigorous methodol-ogy needs to be established to fully capture the physical and chemical changes observed in materi-
als across time and space. While the accounts presented in this report are detailed enough to allow for tentative recommendations about materials (e.g., cadmium metal) and industries (e.g., construction), the current MFA accounting methodology is not yet adequately developed to account for variations in a material’s residence time in the economy, chemical transformations, or fabrications of fi nished goods with components from many different sectors. In addition, accounts must allow geospatial analysis and evaluation of the intensity of materials across economic sectors in order to provide policy-relevant information.
2. Expand and synthesize core data across the life cycle of a material. While the latest study of mate-rial fl ows accounts features more detailed informa-tion from a broader range of sources than previous studies, signifi cant data gaps remain. Current accounts do not contain any specifi c information
4
WRI: MATERIAL FLOWS IN THE UNITED STATES
about the production and use of organic and inor-ganic chemicals, plastics, and synthetic fi bers. The materials in most imported fi nished goods cannot be measured, including electronic devices that contain heavy metals and other materials that are hazardous to human health and the environment. Data on wastes released to the environment in the United States are still largely nonexistent.
To fi ll these data gaps, the federal government can engage local and national agencies as well as the private sector to compile the data necessary for complete material fl ows accounts. The cen-tralization of statistical functions across different organizations—particularly through increased coordination among U.S. government agencies such as the Environmental Protection Agency, the
U.S. Geological Survey, the Forest Service, and the U.S. Department of Agriculture—will allow the full value of both new and existing data to be bet-ter captured for use in policymaking.
3. Incorporate material fl ows analysis into environ-mental and economic decisionmaking. Because material fl ows accounts track the movement of goods into and out of the economy, they can be used as early warning indicators of potential threats to human health and undesirable changes in natural resources. With a more detailed data-base on materials use and consumption, policy-makers can track materials of environmental concern and act to stem their release into the environment.

5
WRI: MATERIAL FLOWS IN THE UNITED STATES
1
INTRODUCTION TO MATERIAL FLOWS
In the past decade, experts in the fi eld of industri-al ecology have quantifi ed the movement of raw materials and processed goods through national
economies, providing insight into the links between economic growth, population growth, and materials use. These fl ows are measured and reported using a system known as material fl ows analysis (MFA). Because MFA provides information on the potential environmental impacts associated with industrial development, it offers an analytical framework for considering ways to meet society’s social and eco-nomic needs while preserving the natural resource base upon which all life depends.
Researchers working at the World Resources Insti-tute (WRI) have been engaged in preparing and ana-lyzing material fl ows accounts since 1995. A network of fi ve international organizations, including WRI, developed the fi rst systematic method for tracing the extraction, processing, production, use, recycling, and disposal of all major commodities in a nation’s economy. Preliminary national material fl ows ac-counts for Germany, Japan, the Netherlands, and the United States were published in 1997 in Resource Flows: The Material Basis of Industrial Economies.5 Up-dated accounts for these four countries plus Austria were published in 2000 in The Weight of Nations: Material Outfl ows from Industrial Economies.6
This, the third report, provides material fl ows accounts for the United States from 1975 to 2000.
Focusing on one country has permitted a signifi cant expansion in the dimensions of the material fl ows analyzed and a greater depth of analysis across com-modities, sectors, and end uses. The study compiled a set of inputs and outputs for 169 individual com-modities, using these data to develop aggregated indicators of material fl ows for the United States. (For a list of these 169 commodities, see Appendix 2.) Indicators were created for four economic sectors of origin: agriculture, forestry, minerals and metals, and nonrenewable organic materials (mainly fossil fuels). The data used in this study were derived primar-ily from offi cial government statistics on materials use. In some cases these data were supplemented by industry and other sources. (See Sources.)
The full details of this study include technical notes, sources, a database of U.S. material fl ows accounts, and a report, Material Flows Accounts: A Tool For Mak-ing Environmental Policy. All can be accessed online at <http://materials.wri.org>.
MFA DEFINITIONS
MFA begins with examining data on the resources that are extracted from the environment in the form of commodities. In this study, commodities refer to primary-level raw materials and manufactured products, such as plywood for construction or iron ore for automobile manufacture. These are direct

6
WRI: MATERIAL FLOWS IN THE UNITED STATES
inputs into the economy. The total mass of material inputs from both domestic extraction and imports are combined across all sectors to form an aggregate in-dicator measured at a national scale, Direct Material Input (DMI). Material inputs that are not exported to other countries are consumed in the United States. The Direct Material Consumption (DMC) indicator is calculated as DMI minus exports.
The extraction and processing of inputs often re-sults in additional materials that are not purchased or consumed as fi nished goods in the economy, such as earth moved for mineral extraction or wastes emit-ted from manufacturing processes. In MFA, these are known as hidden fl ows. Hidden fl ows include mining overburden, erosion, earth moving, gangue (the unusable portion of mineral ore that typically is discarded as waste by mining operations), residues from logging and crop harvests, and manufacturing losses in all sectors. Some hidden fl ows associated with erosion and infrastructure development could not be categorized in any of the four primary sectors studied but are still included in the aggregate MFA indicators.
Many hidden fl ows associated with extraction and processing are not directly measured. Some can be derived from production and import data based on technical estimates; for example, overburden from iron ore extraction is estimated to be 2.3 times the production of usable ore. Other hidden fl ows, such as manufacturing wastes, are assumed to equal the mass of material not accounted for in the fi nished goods. For example, manufacturing waste from a chicken processing plant is calculated as the live weight of chickens slaughtered less the mass actually sold as food and animal feed. All hidden fl ows gener-ated in this country and abroad for imports (foreign hidden fl ows) are added to DMI to produce an indica-tor called Total Material Requirement (TMR), the sum of all fl ows associated with material inputs.
BOX 1 SUMMARY OF TERMS USED IN MATERIAL FLOWS ACCOUNTING
Total Material Requirement (TMR): The sum of all raw materials (inputs) required to produce commodities in an economy. TMR includes raw materials extracted domestically, imports of raw materials, and the mass of all hidden fl ows generated in securing those inputs. Hidden fl ows generated in other countries (foreign hidden fl ows) are included in this analysis, but they are typically omitted when comparing material fl ows among countries.
Direct Material Input (DMI): Sum of all inputs that enter the economy. Equivalent to TMR less hidden fl ows generated during extraction and processing.
Direct Material Consumption (DMC): Total materials consumed in the domestic economy. Equivalent to DMI less exports of processed materials.
Net Additions to Stock (NAS): The mass of physical infrastructure added to an economy’s stock minus the mass of used materials removed from stock. Items removed from stock include construction materials that are reclaimed or discarded when buildings are dismantled.
Domestic Processed Output (DPO): Materials that are consumed in the domestic economy and subsequently fl ow to the domestic environment. Additions to stock, recycled materials, and hidden fl ows are not included here.
Hidden Flows: Materials that are mobilized or produced in the domestic and/or foreign environment but are not purchased as fi nished goods or consumed in the economy. Hidden fl ows occur during the extraction, processing, manufacturing, and use of materials. All hidden fl ow inputs become hidden fl ow outputs.

7
WRI: MATERIAL FLOWS IN THE UNITED STATES
Just as materials fl ow into the economy, they fl ow from the economy back into the environment as they are used. These fl ows are called outputs. Outputs can include emissions to air from fuel combustion, mate-rial loads in wastewater, household wastes deposited in landfi lls, and dissipated fl ows such as fertilizer and road salt that are dispersed on land. Additions to stock (defi ned below) and recycled materials are not included in output fl ows.7 The sum of all output fl ows that enter the waste stream in a given year is expressed as Domestic Processed Output (DPO).
Some materials do not exit the economy rapidly but accumulate in the form of buildings and other infrastructure. They are called stocks. Net Additions to Stock (NAS) measures stocks entering infrastruc-ture in a given year minus stocks removed. In this report, any material that is in use for more than 30 years before it is recycled or discarded is classifi ed as an addition to stock.8
8
WRI: MATERIAL FLOWS IN THE UNITED STATES
METHODOLOGICAL LIMITATIONS
The current MFA methodology assumes that materi-als are either recycled or discarded as waste in the same year they were initially consumed. This over-simplifi es the actual situation. A number of durable goods are consumed for more than 1 year but less than 30 years (e.g., automobiles, computers, refrig-erators). However, since durable goods only represent 6 percent of material consumption by weight, this assumption should not distort the accuracy of the ag-gregate accounts in any critical way.
All fl ows are measured by weight in metric tons. Water fl ows and oxygen emissions from combustion were excluded from the aggregated accounts. How-ever, some mass of water and oxygen is embodied in agriculture and forestry raw materials. This mass is included in material consumption (DMC) but not in outputs (DPO).
At the present time, imports of fi nished goods are not accounted for in material fl ows analysis since these items are typically recorded by customs offi ces in dollar terms without specifi c measures of mate-rial content. In dollar terms, however, imports of
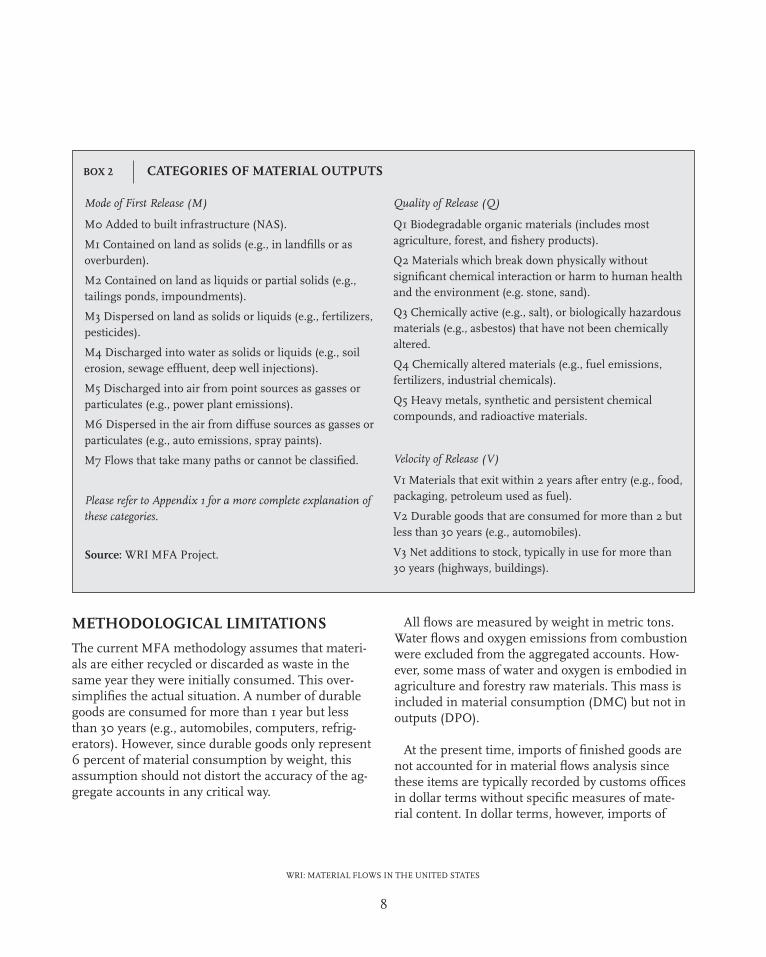
Mode of First Release (M)
M0 Added to built infrastructure (NAS).
M1 Contained on land as solids (e.g., in landfi lls or as overburden).
M2 Contained on land as liquids or partial solids (e.g., tailings ponds, impoundments).
M3 Dispersed on land as solids or liquids (e.g., fertilizers, pesticides).
M4 Discharged into water as solids or liquids (e.g., soil erosion, sewage effl uent, deep well injections).
M5 Discharged into air from point sources as gasses or particulates (e.g., power plant emissions).
M6 Dispersed in the air from diffuse sources as gasses or particulates (e.g., auto emissions, spray paints).
M7 Flows that take many paths or cannot be classifi ed.
Please refer to Appendix 1 for a more complete explanation of these categories.
Source: WRI MFA Project.
Quality of Release (Q)
Q1 Biodegradable organic materials (includes most agriculture, forest, and fi shery products).
Q2 Materials which break down physically without signifi cant chemical interaction or harm to human health and the environment (e.g. stone, sand).
Q3 Chemically active (e.g., salt), or biologically hazardous materials (e.g., asbestos) that have not been chemically altered.
Q4 Chemically altered materials (e.g., fuel emissions, fertilizers, industrial chemicals).
Q5 Heavy metals, synthetic and persistent chemical compounds, and radioactive materials.
Velocity of Release (V)
V1 Materials that exit within 2 years after entry (e.g., food, packaging, petroleum used as fuel).
V2 Durable goods that are consumed for more than 2 but less than 30 years (e.g., automobiles).
V3 Net additions to stock, typically in use for more than 30 years (highways, buildings).
BOX 2 CATEGORIES OF MATERIAL OUTPUTS

9
WRI: MATERIAL FLOWS IN THE UNITED STATES
goods quadrupled over the study period, accounting for 13 percent of GDP in 2000,9 meaning that there are possibly large quantities of environmentally and economically important materials fl owing into the United States without being monitored.
The defi nitions and methodologies incorporated in these accounts differ slightly from the international practices established by Eurostat (Statistical Offi ce of the European Communities) in 2002. The Eurostat methodology records fl ows only when they enter or leave the economy, removing some of the account-ing diffi culties and potential inconsistencies possible in the U.S. accounts, which currently track fl ows through extraction, manufacturing, use, and post-use phases.10 Nonetheless, material input and consump-tion values for the United States are generally com-parable to those produced by the European Union.11 This suggests that standardized practices are evolving, permitting meaningful analysis across countries. Because the structure of national economies differs, comparisons must be interpreted with care.
CHARACTERIZING OUTPUTS
Not all material outputs are equal in their potential environmental impact. To take that into consideration in MFA, outputs are rated along three characteristics, based on the use to which a fl ow is put while a part of the industrial economy. (See Box 2 for category defi nitions.)
The fi rst category is the mode of fi rst release (M). Some materials become a permanent part of the built infrastructure, such as steel used for building con-struction. Others may end up contained in landfi lls for long periods of time, and some materials such as automobile emissions immediately disperse into the environment from many sources.
The second categorization is quality (Q). Some fl ows are biodegradable or break down physically in the environment while others are chemically processed or create a potential hazard to the environ-ment. The Q designation enables the isolation of potentially hazardous materials in national material fl ows accounts. This ability is particularly important as many of the materials that are most toxic to the en-vironment and human health—mercury and arsenic, for example—are consumed in much smaller quanti-ties on a national scale than some relatively benign materials such as sand and gravel, which dominate the aggregated accounts.
The third category is velocity (V). Materials that are retained and used in the economy for long periods decrease the need for extraction of natural resources. Such fl ows (greater than 30 years for this study) are considered additions to the stock of built infrastructure.
Within these defi nitions, characterizing a fl ow of materials is, to a degree, subjective. At their current level of complexity, these preliminary national ac-counts provide an indication of the potential impact of industrial development on the environment, rather than a defi nitive linkage between a given fl ow and its subsequent environmental effects. By disaggregating data on material fl ows according to industrial sector and characterizing fl ows according to their mode of fi rst release, this analysis constitutes an important fi rst step in understanding the nature and extent of environmental change due to material fl ows. How-ever, directly linking individual fl ows to subsequent environmental impacts would require large amounts of highly specifi c information (on the characteris-tics of the fl ow; when, where, and how the fl ow was released; and the nature of the systems in which the fl ow was released), and is thus beyond the scope of this analysis.
10
WRI: MATERIAL FLOWS IN THE UNITED STATES
2
AGGREGATED INDICATORS OF MATERIAL FLOWS
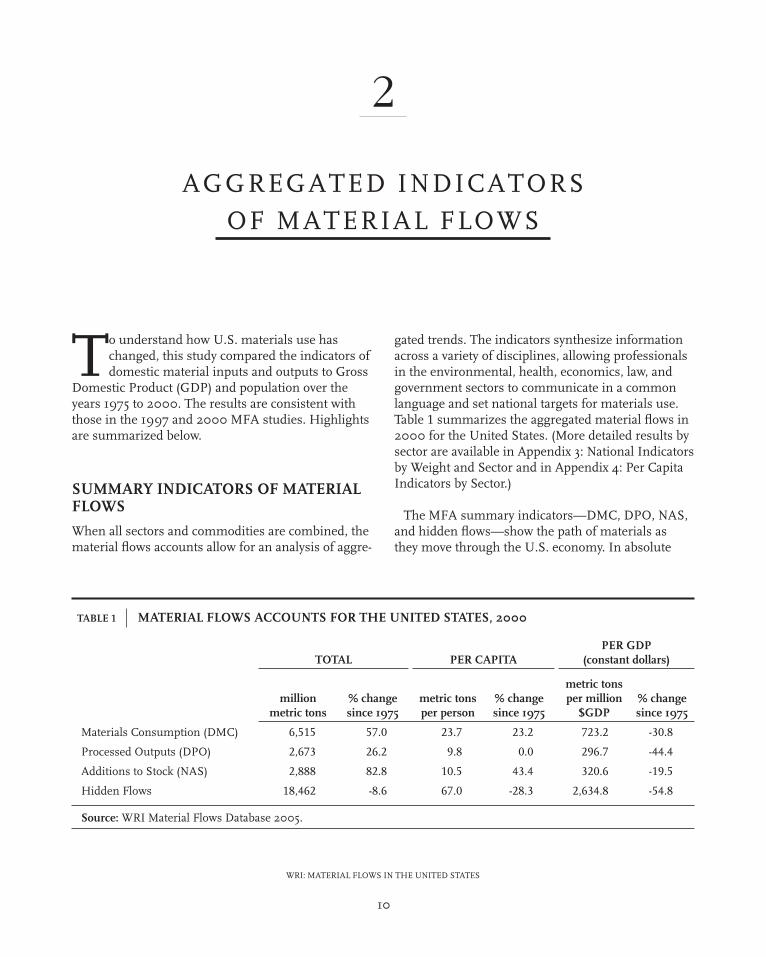
gated trends. The indicators synthesize information across a variety of disciplines, allowing professionals in the environmental, health, economics, law, and government sectors to communicate in a common language and set national targets for materials use. Table 1 summarizes the aggregated material fl ows in 2000 for the United States. (More detailed results by sector are available in Appendix 3: National Indicators by Weight and Sector and in Appendix 4: Per Capita Indicators by Sector.)
The MFA summary indicators—DMC, DPO, NAS, and hidden fl ows—show the path of materials as they move through the U.S. economy. In absolute
To understand how U.S. materials use has changed, this study compared the indicators of domestic material inputs and outputs to Gross
Domestic Product (GDP) and population over the years 1975 to 2000. The results are consistent with those in the 1997 and 2000 MFA studies. Highlights are summarized below.
SUMMARY INDICATORS OF MATERIAL FLOWS
When all sectors and commodities are combined, the material fl ows accounts allow for an analysis of aggre-
TABLE 1 MATERIAL FLOWS ACCOUNTS FOR THE UNITED STATES, 2000
TOTAL PER CAPITA PER GDP
(constant dollars)
million metric tons
% change since 1975
metric tons per person
% change since 1975
metric tons per million
$GDP% change since 1975
Materials Consumption (DMC) 6,515 57.0 23.7 23.2 723.2 -30.8
Processed Outputs (DPO) 2,673 26.2 9.8 0.0 296.7 -44.4
Additions to Stock (NAS) 2,888 82.8 10.5 43.4 320.6 -19.5
Hidden Flows 18,462 -8.6 67.0 -28.3 2,634.8 -54.8
Source: WRI Material Flows Database 2005.

11
WRI: MATERIAL FLOWS IN THE UNITED STATES
terms, material consumption (DMC) increased over the study period by 57 percent to 6.5 billion metric tons in 2000. Nearly 2.7 billion metric tons of this material were returned to the environment as waste (DPO).
The majority of the increase in consumption can be explained by an 83 percent increase in built infra-structure (NAS) over the study period. This trend cor-responds with a national increase of 52 percent in the number of housing units and an apparent increasing intensity of materials use per housing unit.12 (See Table 5: Housing and Construction Materials in the United States on page 25.) Signifi cant increases were also observed in nonrenewable organic materials, specifi cally in fossil fuel consumption for both trans-portation and electricity generation. Hidden fl ows decreased by 9 percent in absolute terms between 1975 and 2000 due to decreases in erosion, dredging, and highway construction.
Figures 4, 5, and 6 illustrate the trends in materi-als consumption (DMC), outputs (DPO), and stocks (NAS) over the study period of 1975-2000. In each fi gure, values are indexed with 1975 set at 1.0, allow-ing a comparison of changes over time.
Consumption of materials increased much more rapidly than population growth during the same period. Figure 4 shows that the intensity of materials use per capita has grown rapidly, particularly from 1995 to 2000. While the U.S. population grew by 27.5 percent in the 25-year study period, domestic material consumption grew at more than twice the rate of population growth to a level of almost 23 metric tons per person. Because population growth is projected to continue, albeit at a slower pace, the absolute growth in the mobilization and use of resources for construction is expected to increase.13 During the 25-year study period, material outputs (DPO) kept pace with population growth, while addi-tions to stock (NAS) increased.

12
WRI: MATERIAL FLOWS IN THE UNITED STATES
Material consumption (DMC) and outputs (DPO) declined relative to GDP by 31 and 44 percent, respectively, between 1975 and 2000. (See Figures 4 and 5.) While some decoupling of economic growth and materials use has occurred in the United States, increases in extraction and waste in absolute terms over the study period point to rising environmental stress in both the United States and in countries that provide goods for U.S. consumption. A more careful examination of extraction and waste (output) trends could be both environmentally and economi-cally benefi cial, revealing opportunities for improved materials effi ciency.
The results of the current study were compared with the results obtained in Resource Flows (WRI 1997) and The Weight of Nations (WRI 2000). Although additional commodity fl ows were incorpo-rated in the current analysis, and some alternate data sources and methods were employed, the inputs and outputs reported here do not deviate by more than 5 percent from the values reported for the same years in WRI’s previous studies.
CHARACTERIZING OUTPUTS
Economic expansion and population growth have fueled an increase in material outputs that includes a number of potentially hazardous and environmen-tally harmful substances. Domestic processed output (DPO) increased at roughly the same pace as the pop-ulation to nearly 2.7 billion tons in 2000, with the most growth occurring in the minerals, metals, and nonrenewable organic materials sectors. Character-izing fl ows in 2000 by type (Q) indicates that more than 80 percent underwent chemical processing, or transformation, at one stage or another of their life cycles. (See Figure 7.) The largest growth, however, was observed in chemically active fl ows (Q3), which more than doubled to 24 million metric tons over the study period.

13
WRI: MATERIAL FLOWS IN THE UNITED STATES
Releases to the atmosphere, from both point and diffuse sources, accounted for about three quarters of total outputs to the environment in 2000. The domi-nance of fl ows dispersed into the air as a mode of fi rst release is due primarily to emissions associated with energy consumption, which is growing in both absolute and per capita terms. A principal contributor of outputs to the atmosphere is coal-fi red electric-ity plants, which released some 1.9 billion tons of carbon dioxide in 2000. This one category of source was responsible for nearly half of the total increase in outputs to the atmosphere across all sectors over the study period. The emission of carbon dioxide and other greenhouse gasses associated with fossil fuel combustion has been linked with potentially harmful changes in the global climate.14
Flows dispersed on land increased by more than 150 percent between 1975 and 2000 as a result of increases in the use of sand and salt to de-ice roads, synthetic rubber for the manufacture of vehicle tires, and nitrogen for fertilizers. These fl ows still account-ed for only 3 percent of all outputs, however.
Outputs discharged directly into water consisted mainly of soaps, detergents, and water treatment chemicals. While this mode of fi rst release represents only a tiny fraction (0.2 percent) of total outputs, some underreporting is likely. No attempt was made to characterize hidden fl ows that might result in discharges directly into water, such as tailings from metals and minerals extraction. In addition, many fl ows that are initially discharged to air or dispersed on land travel into water bodies.
COMPARISON WITH EUROPEAN UNION ACCOUNTS
Materials consumption in the United States totaled some 23.6 metric tons per capita in 2000, more than 50 percent higher than consumption in the European Union, averaged across 15 EU countries.15(See Table
2.) Among the 15 countries, all but two (Finland and Ireland) had lower levels of per capita materials con-sumption than the United States.
Moreover, the rate of growth in U.S. consumption also diverged sharply from trends in the EU. While per capita consumption in the United States grew by almost 21 percent from 1980 to 2000, consumption in the EU (averaged across 15 countries) declined by some 3 percent. Within the 15 countries, only three—Greece, Portugal, and Spain—experienced more rapid increases in consumption than the United States.16
TABLE 2 PER CAPITA MATERIALS CONSUMPTION IN THE EUROPEAN UNION AND THE UNITED STATES, 2000
Metric Tons Per Person
Percent Change Since 1980
Finland 35.6 -1.0
Ireland 23.6 12.0
United States 23.6 20.7
Denmark 22.7 1.0
Sweden 21.3 -10.0
Austria 18.1 -5.0
Germany 17.8 -13.0
Spain 16.7 39.0
Belgium and Luxemburg 16.6 -4.0
Greece 15.9 35.0
EU-15 AVERAGE 15.6 -3.0
France 15.3 -12.0
Portugal 14.2 32.0
Netherlands 13.0 -17.0
Italy 12.6 -2.0
United Kingdom 11.6 -7.0
Sources: European Commission 2002; WRI Material Flows Database 2005.

14
WRI: MATERIAL FLOWS IN THE UNITED STATES
Note that these three countries produced much lower GDP per capita than other countries in the region ($13,000 per year on average in 2000, versus an aver-age of $21,000 for the EU-15 overall).17
The comparatively higher levels of per capita mate-rial consumption and growth in the United States than in the EU could be attributable to several factors. Divergence among countries in per capita material fl ows could be a result of fundamental variations in geography, resource availability, and population den-sity, as well as differences in lifestyle and consumer preferences (size and density of housing, recycling habits, use of individual versus public modes of transportation, etc.).
As shown in Figure 8, per capita materials con-sumption tends to decline as population density rises.18 Typically, infrastructure, such as transporta-tion systems and public and commercial buildings, is more effi ciently utilized, from a materials perspective,
in smaller, more densely populated countries. In con-trast, less densely populated countries require great investments per capita in roads and transportation.
In addition, large, sparsely populated countries tend to have signifi cant resource extraction industries. Much of the materials consumptions in Finland and the United States can be attributed to forestry and mining as well as infrastructure development. Mean-while, more densely populated countries, such as Belgium, the Netherlands, and the United Kingdom, typically import many materials rather than extract-ing them locally, and these upstream fl ows are not accounted for in estimates of domestic consumption.
From a policy perspective, certain countries in Europe have chosen to establish higher standards for material use, re-use, and recycling, and as a result, their domestic material consumption is lower.

15
WRI: MATERIAL FLOWS IN THE UNITED STATES
3
MATERIAL FLOWS BY SECTOR OF ORIGIN
accounts by sector of origin, source material, and end use.
The data collected in this study were classifi ed based on a material’s origin in one of four sectors: forestry, agriculture, non-renewable organic materi-als (mostly fossil fuels), and metals and minerals. As shown in Figure 9, metals and minerals make up the greatest share of materials consumption, increasing from 41 to 47 percent of total materials consumption (DMC) in the study period. Nonrenewable organic materials (mainly fossil fuels) were second.
In 2004, the OECD Council on Material Flows and Resource Productivity recommended that member states “promote the development and
use of material fl ow analysis and derived indica-tors at macro and micro levels.”19 The preliminary accounts discussed in this report enable analysis at both of these levels simultaneously. The aggregated MFA indicators presented in Chapter 2—similar to those developed previously for the United States, Japan, and the European Union—provide a broad context for policy decisions at the macro level. The following discussion disaggregates the U.S.
16
WRI: MATERIAL FLOWS IN THE UNITED STATES
The following analysis examines trends in materials use by sector in order to address the following ques-tions: What are the broad trends in sectoral resource fl ows? Which commodities and end uses are driv-ing these trends? Where can reduction, re-use, and substitution improve resource effi ciency? What are the most important opportunities for further research and policy dialogue?
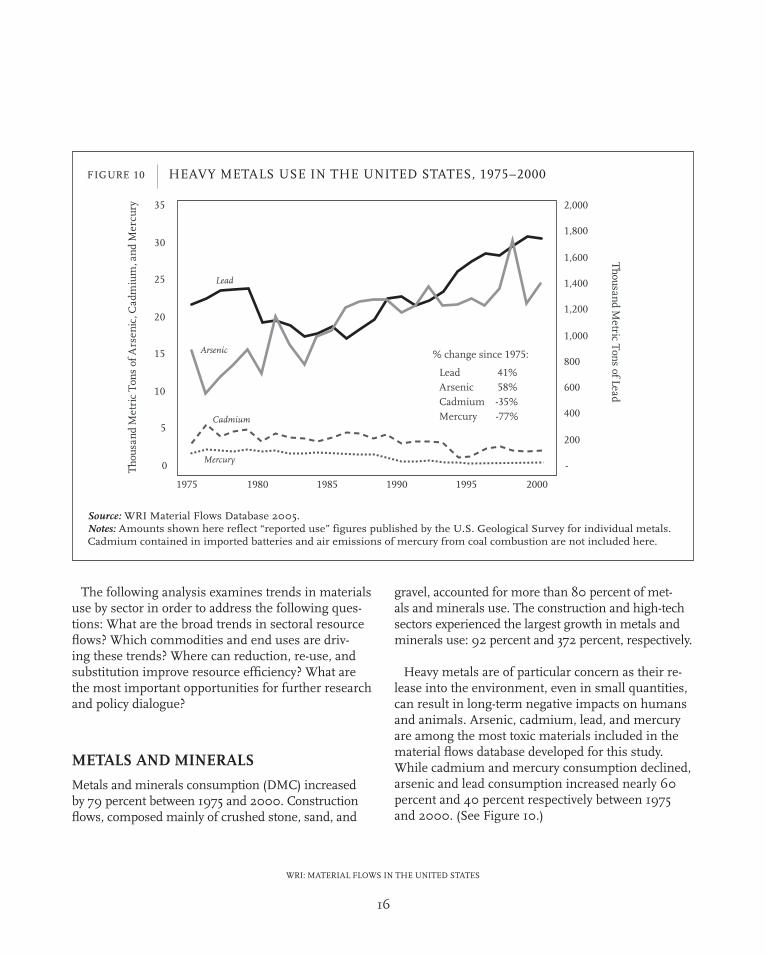
METALS AND MINERALS
Metals and minerals consumption (DMC) increased by 79 percent between 1975 and 2000. Construction fl ows, composed mainly of crushed stone, sand, and
gravel, accounted for more than 80 percent of met-als and minerals use. The construction and high-tech sectors experienced the largest growth in metals and minerals use: 92 percent and 372 percent, respectively.
Heavy metals are of particular concern as their re-lease into the environment, even in small quantities, can result in long-term negative impacts on humans and animals. Arsenic, cadmium, lead, and mercury are among the most toxic materials included in the material fl ows database developed for this study. While cadmium and mercury consumption declined, arsenic and lead consumption increased nearly 60 percent and 40 percent respectively between 1975 and 2000. (See Figure 10.)

17
WRI: MATERIAL FLOWS IN THE UNITED STATES
Increases in arsenic use were mainly due to the inclusion of copper chromium arsenate (CCA) as a wood preservative. Since 2004, however, arsenic use has dramatically declined. MFA studies of arsenic were partially responsible for this success in protect-ing both the environment and human health. Coop-eration between the EPA and wood manufacturers produced guidelines that severely restrict the use of CCA in treated wood.20
Lead consumption initially declined as its use as a gasoline additive was phased out, but a rise in the number of motor vehicles resulted in increased consumption of lead for automotive batteries. More than 90 percent of all lead is recycled.21 However, lead released into the environment—estimated at 560,000 tons in 2000—can cause brain and kidney damage in humans, and lead ions that form in surface waters are particularly toxic to marine life.
Generally, recycling presents an opportunity to “close the loop” on the materials cycle by decreas-ing both the extraction of materials for use and the need for their disposal post-use. Figure 11 shows the
trends in metal recycling rates over the study period. Historically, fl uctuations in recycling rates have mir-rored fl uctuations in the commodity prices that drive demand for both new and recycled metals. More recently, however, foreign recycling of U.S.-generated scrap metal (not included in Figure 11) has replaced much domestic recycling. For example, China produces more copper from scrap than any other country in the world, obtaining the majority of its raw material from the United States.22
For some heavy metals, recycling trends are in-fl uenced by environmental concerns. For example, less than 20 percent of all mercury was recycled in 1975. By 2000, federal regulations had drastically reduced the amount of mercury in use by stipulat-ing complete recovery of mercury from industrial processes such as chlorine and caustic soda manu-facture and phasing out mercury’s use in nones-sential applications such as paint and thermom-eters.23 However, several hundred tons of mercury still enter the environment from coal combustion and discarded waste materials such as fl uorescent lamps and computers.

18
WRI: MATERIAL FLOWS IN THE UNITED STATES
In the future, MFA in the metals and minerals sector would be strengthened by a closer examina-tion of both reclaimed stocks and imported goods. Better accounting of materials that exist as part of and are reclaimed from built infrastructure (stocks) can improve resource effi ciency and facilitate the environmental remediation of previously developed lands that are now brownfi elds. More precise analy-ses of imported materials would allow policymakers to better manage the unknown quantities of poten-tially toxic metals and minerals entering the United States in automobiles, electronics, and other goods. For example, more than 50 percent of cadmium use is unaccounted for in the current MFA for the United States because it enters the economy through battery imports.
NONRENEWABLE ORGANIC MATERIALS
Nonrenewable organic materials consist primarily of fossil fuel resources such as coal, natural gas, and petroleum. From 1975 to 2000, annual consumption of nonrenewable organic materials increased by 45 percent, faster than population growth (27 percent) but less rapidly than growth in GDP (127 percent). Electricity generation per capita increased by 60 percent over the study period,24 driving much of the increase in material fl ows in this sector. For example, consumption of coal for electricity generation in-creased by 500 million metric tons, while natural gas consumption for electricity increased by 40 million metric tons. (See Table 3.)
TABLE 3 TRENDS IN NONRENEWABLE ORGANIC MATERIAL USE (DMC), 1975–2000
Economic Sector(and selected fuel types)
Total Use(thousand metric tons)
Percent change1975 2000
I. Residential Heating and Cooking * 160,212 137,086 -14
II. Electricity Generation 508,052 1,030,019 103
coal 368,387 894,573 143
natural gas 64,233 105,907 65
III. Industrial Uses 327,174 326,113 0
IV. Commercial Uses 87,515 85,656 -2
V. Transportation 394,344 587,745 49
jet fuel 44,705 77,957 74
motor gasoline 278,639 359,039 29
distillate fuel oil 48,810 122,374 151
VI. Other (Nonfuel Uses) 120,819 149,339 24
TOTAL FROM ALL SECTORS 1,598,116 2,315,958 45
* Heating and cooking powered by electricity are classifi ed under II. Electricity Generation and are not included in I. Residential Heating and Cooking.
Source: WRI Material Flows Database 2005.

19
WRI: MATERIAL FLOWS IN THE UNITED STATES
Fuel consumption in the transportation sector increased nearly 50 percent over the study period. (See Table 3.) Motor gasoline consumption in-creased by 29 percent as the improved fuel effi cien-cy realized in the fi rst decade of the study period was eclipsed by a growth in total transport volume and a doubling of the market share of vans, pick-ups, and sport utility vehicles in new vehicle sales.25 Increases in diesel fuel (distillate fuel oil) consump-tion can be partially explained by an 84 percent increase in freight traffi c carried by trucks between 1975 and 2000.26
Use of plastics and synthetic fi bers grew by 239 percent over the study period to about 38 mil-lion tons in 2000. Only 5 percent of this material,
derived from nonrenewable organic resources, was recycled in 2000.27
Coal combustion can result in the incidental release of metal by-products such as arsenic, cobalt, lead, mercury, and nickel. The release of such metals and minerals into the air doubled during the study period. (See Figure 12.) While their combined mass is still much smaller than the quantities of metal released on land and in water, these dissipative fl ows disperse easily into the environment. Even trace amounts can harm human health and ecosystems.
In 2005, the EPA took preliminary actions to limit these fl ows by proposing a cap-and-trade emissions scheme to regulate mercury emissions from power

20
WRI: MATERIAL FLOWS IN THE UNITED STATES
plants.28 More sophisticated material fl ows accounts could help to track the future trends in mercury emissions to evaluate the effi cacy of the new regula-tions.
AGRICULTURE
Agricultural fl ows (DMC) increased by 30 percent in absolute terms between 1975 and 2000, the lowest growth rate of any primary sector. (See Appendix 3.) Most agricultural products (92 percent) are classi-fi ed as food or animal feed. (See Figure 13.) These fl ows increased by 66 percent and 16 percent, respectively, over the study period, while material outputs (e.g., manure) from livestock remained fairly constant.
Food consumption outpaced population growth in all categories, with the largest increases observed in sweeteners (130 percent) and grains (75 percent). These results come from both increased caloric intake and an increase in food waste. Consump-tion of all meat and fi sh increased slightly faster than population growth, and chicken consumption doubled in the study period. Since animal husbandry practices have changed to produce more rapid weight gain, a shorter lifespan, and lower mortality among livestock, material outputs in this sector remained constant even as meat consumption increased. Out-puts from agriculture are still signifi cant, however. The sector produced 250 million tons of manure (dry weight) and consumed 470 million tons of feed to produce 105 million tons of animal products (meat and dairy) for human consumption.
Other agricultural fl ows with relatively small masses do not affect aggregate accounts but indicate important trends. A more-than-sevenfold increase oc-curred in the use of grains to produce ethanol for use in automotive fuels. Pesticide consumption remained constant as crop production increased by 25 percent,
although more detailed analysis would be required to determine specifi c conclusions or projections from these trends.
The preliminary accounts presented above could be expanded to more specifi cally address key environ-mental and economic issues in the agricultural sec-tor: imports and export trends, links to energy fl ows (specifi cally energy intensity of agricultural produc-tion), geographic intensifi cation of production, and levels of nonpoint source pollution by watershed. In addition, human respiration, animal respiration, and methane emissions from animals and composting were not included in the calculation of outputs; po-tential improvements to the accounts would enhance the connection between MFA and existing data on biological cycles.

21
WRI: MATERIAL FLOWS IN THE UNITED STATES
FORESTRY
Forestry fl ows were disaggregated into categories re-fl ecting construction, paper products, and fuel wood. Currently each of these uses consumes about 100 million tons of wood per year. Overall, consumption of forestry products grew by 53 percent, almost twice the rate of population growth, but many specifi c uses exceeded that rate. (See Figure 14.)
Despite the transition to electronic forms of com-munication during the study period, paper and paperboard consumption increased more than 50 percent from 1975 to 2000, indicating that the use of computers has not converted the United States into a “paperless” economy. This trend is global. World-
wide, paper and paperboard consumption increased by 150 percent in absolute terms during the study period, with two-thirds of this increase occurring in high-income countries.29 The use of forest products for packaging decreased as plastic was substituted for paper in many applications.
Wood panel and lumber consumption grew by more than 130 percent and 70 percent, respectively. These products are used mostly for construction. The use of natural rubber for automotive and truck tires increased by 44 percent, but this was considerably less than the nearly threefold increase in the use of synthetic rubber for the same purpose.
22
WRI: MATERIAL FLOWS IN THE UNITED STATES
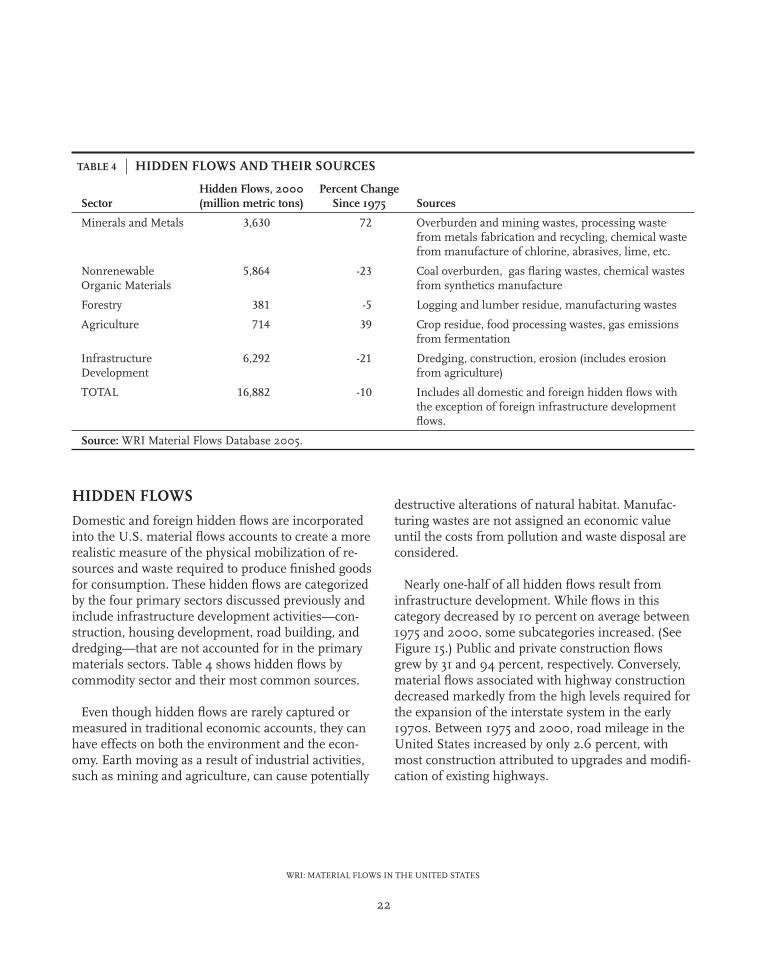
HIDDEN FLOWS
Domestic and foreign hidden fl ows are incorporated into the U.S. material fl ows accounts to create a more realistic measure of the physical mobilization of re-sources and waste required to produce fi nished goods for consumption. These hidden fl ows are categorized by the four primary sectors discussed previously and include infrastructure development activities—con-struction, housing development, road building, and dredging—that are not accounted for in the primary materials sectors. Table 4 shows hidden fl ows by commodity sector and their most common sources.
Even though hidden fl ows are rarely captured or measured in traditional economic accounts, they can have effects on both the environment and the econ-omy. Earth moving as a result of industrial activities, such as mining and agriculture, can cause potentially
TABLE 4 HIDDEN FLOWS AND THEIR SOURCES
SectorHidden Flows, 2000(million metric tons)
Percent ChangeSince 1975 Sources
Minerals and Metals 3,630 72 Overburden and mining wastes, processing waste from metals fabrication and recycling, chemical waste from manufacture of chlorine, abrasives, lime, etc.
Nonrenewable Organic Materials
5,864 -23 Coal overburden, gas fl aring wastes, chemical wastes from synthetics manufacture
Forestry 381 -5 Logging and lumber residue, manufacturing wastes
Agriculture 714 39 Crop residue, food processing wastes, gas emissions from fermentation
Infrastructure Development
6,292 -21 Dredging, construction, erosion (includes erosion from agriculture)
TOTAL 16,882 -10 Includes all domestic and foreign hidden fl ows with the exception of foreign infrastructure development fl ows.
Source: WRI Material Flows Database 2005.
destructive alterations of natural habitat. Manufac-turing wastes are not assigned an economic value until the costs from pollution and waste disposal are considered.
Nearly one-half of all hidden fl ows result from infrastructure development. While fl ows in this category decreased by 10 percent on average between 1975 and 2000, some subcategories increased. (See Figure 15.) Public and private construction fl ows grew by 31 and 94 percent, respectively. Conversely, material fl ows associated with highway construction decreased markedly from the high levels required for the expansion of the interstate system in the early 1970s. Between 1975 and 2000, road mileage in the United States increased by only 2.6 percent, with most construction attributed to upgrades and modifi -cation of existing highways.

23
WRI: MATERIAL FLOWS IN THE UNITED STATES
24
WRI: MATERIAL FLOWS IN THE UNITED STATES
4
SPECIAL APPLICATIONS OF MATERIAL FLOWS ANALYSIS
Building Council is developing Leadership in Energy and Environmental Design (LEED) standards for residential housing to complement the commercial guidelines that are already in place. To become LEED-certifi ed, homes must meet certain standards for en-ergy and water effi ciency, the sustainability of source materials, and housing size and density.32
ELECTRONICS AND COMPUTERS
From 1983 to 2000, sales of consumer electronic devices rose from $14.1 billion to $97 billion, a sevenfold increase.33 Many of these devices have bat-teries containing cadmium, which poses a threat to the environment and human health if it is released into air or water, especially as a result of incinera-tion. Although cadmium consumption appears to have declined from 3,000 to 2,000 metric tons per year during the study period, this outcome does not take into account over 2,500 metric tons of cadmium contained in imported batteries in 2000,34 which are not included in the original U.S. Geological Survey statistics. Indeed, an examination of cadmium fl ows using additional data indicates that nearly two-thirds of cadmium consumption can be attributed to battery imports. (See Figure 16.)
Concern about the potential release of cadmium from batteries in landfi lls was the stimulus for state laws controlling its disposal,35 followed in 1996 by
It is diffi cult to identify the specifi c material fl ows associated with the consumption of many fi nished goods. However, MFA estimates for
the United States identify broad categories of use for specifi c source commodities and therefore allow researchers to analyze trends in materials consump-tion. Two product categories in particular are experi-encing rapid growth: housing and electronic goods.
HOUSING AND PUBLIC CONSTRUCTION
In 1975, the median size of a new home in the United States was 1535 square feet; less than 1 percent of these homes contained three or more baths. In 2000, the median size of new homes rose to 2057 square feet, and 20 percent of all homes contained three or more baths.30 The total number of housing units in the United States increased by 52 percent from 1975 to 2000, nearly twice as fast as population growth.31 Concurrent with this increase, the material fl ows as-sociated with housing grew by 91 percent (see Table 5), indicating that the intensity of materials used per housing unit has risen substantially. The use of clay, primarily in the production of tiles and sanitary ware, nearly quadrupled, refl ecting the U.S. consumer’s growing preference for multiple bathrooms.
In response to the environmental impacts of increased residential construction, the U.S. Green

25
WRI: MATERIAL FLOWS IN THE UNITED STATES
federal legislation requiring that batteries used in small electronic devices be labeled and made easy to remove.36 Disposing of batteries containing cadmium is already a challenge, and it is likely to become even more so. Understanding and responding to the mag-nitude of the cadmium disposal problem will require more accurate accounting of battery imports as well as imports of fi nished goods containing cadmium batteries.
Sales of televisions and computers accounted for more than one-half of the growth in consumer electronic devices.37 As a result of frequent computer upgrades and electronic innovations, these devices are generally replaced rather than repaired. Data on the average life of televisions are not available, but
new computers often become obsolete in fi ve years or less, at which point they may be discarded, recycled, or stockpiled. More than 160 million computers were in use in the United States in 2000, enough to oc-cupy nine million cubic meters of landfi ll space, the equivalent of a football fi eld stacked 2½ kilometers high with computer waste.38
Although the volume of computer-related waste represents only about 1 percent of municipal waste,39 electronic devices contain heavy metals and other hazardous materials that may be harmful to the environment and to human health if deposited in landfi lls or improperly recycled. In 2000, only 10 percent of consumer electronics were recycled.40 Al-though recycling is recognized as an environmentally
TABLE 55 HOUSING AND CONSTRUCTION MATERIALS IN THE UNITED STATES, 1975–2000
Material Used for:Consumption in 2000 (thousand metric tons)
% change since 1975
Asbestos Roofi ng products 9 -72
Aluminum Construction 1,113 27
Gypsum Gypsum products 27,400 201
Clay, ball Floor and wall tiles 331 373
Clay, ball Sanitary ware 274 372
Titanium dioxide Paint, varnishes, and lacquers 575 93
Lumber Construction 68,227 76
Plywood & Laminated Veneer Lumber (LVL) Construction 9,010 19
Wood Panels Construction (estimated 80% of total) 13,942 133
Lumber Other 10,698 53
Plywood & Laminated Veneer Lumber (LVL) Other 3,897 128
Wood Panels Other (estimated 20% of total) 3,486 133
TOTAL 138,962 91
Total population (millions) 275.3 28
Total housing units (thousands) 115,905 46
Source: WRI Material Flows Database 2005.

26
WRI: MATERIAL FLOWS IN THE UNITED STATES
responsible method of handling most material waste, the processing of electronic waste, or e-waste, can lead to environmental and human health risks. Most e-waste destined for recycling is sent to Asia, particu-larly China, where it is disassembled by low-skilled, low-wage workers wearing minimal, if any, protec-tive gear. High-value metals, such as gold, silver, and palladium are recovered, while the remainder of the waste may be incinerated in the open air or dumped in streams, in open fi elds, and along riverbanks. Under these circumstances, unrecovered heavy met-als and other non-valuable hazardous substances contained in computers and televisions are likely to contaminate groundwater and aquatic resources.41
Public concern for the export of e-waste to develop-ing countries, supported by a number of interna-tional nongovernmental organizations, led the EPA’s Offi ce of Solid Waste to publish guidelines for the management of “end-of-life” electronics in 2004.42 The EPA’s recommendations for voluntary action have been criticized as insuffi cient. The United States remains the only industrialized country in the world that has no legislation governing the export of hazardous waste to developing countries and has not ratifi ed the Basel Convention, an international agree-ment to regulate the fl ow of hazardous substances across national boundaries.43

27
WRI: MATERIAL FLOWS IN THE UNITED STATES
5
RECOMMENDATIONS
NEXT STEPS FOR IMPROVING MATERIAL FLOWS ACCOUNTS
Full realization of the benefi ts of MFA will require funds for both data collection and policy analysis across a number of government agencies; partner-ships with international MFA consortia, private industry, academia, and NGOs; and the establish-ment of a central organization—a Center for Material Flows—to manage the collection, analysis, and dis-semination of material fl ows accounts in the United States.
To further the development of material fl ows ac-counting, WRI recommends the following actions:
1. Establish a systematic and practical framework for material fl ows accounting.
Recent revisions to the U.S. material fl ows ac-counts have expanded to more completely describe all stages in the life cycles of materials. Still, a more systematic and robust methodology needs to be established to fully capture the physical and chemical changes observed in materials across time and space. Two existing analytical frame-works—the input-output tables associated with economic accounts and the life-cycle assessments utilized in the fi eld of industrial ecology—are already guiding the evolution of more sophisti-cated accounts in Europe and may be useful in the United States as well.
Until now, material fl ows analyses have been conducted sporadically, with limited re-sources, and principally through the work of
nongovernmental organizations.
Groups in the United States and internationally have called for increases in funding, partnerships, and institutional capacity to establish a complete set of material fl ows accounts. A study on material fl ows accounting commissioned in 2003 by the National Research Council (NRC) also recommended that “an independent organization, comprised of interdis-ciplinary experts, be created and funded through a formal process” to further the development and use of material fl ows analyses.44
In 2003, the Organisation for Economic Co-opera-tion and Development (OECD) began a three-year project to help member countries better understand and implement MFA. Progress to date in the 30 OECD member states has varied. Several countries have established offi cial material fl ows accounts and set fi nite targets for materials use. Other OECD countries have not yet developed any accounts at all. While the United States has established preliminary accounts, no specifi c plans are in place for systematic collection and analysis of national material fl ows data.

28
WRI: MATERIAL FLOWS IN THE UNITED STATES
The analytical framework for MFA needs to be de-tailed enough to capture useful information without introducing an unnecessarily burdensome level of complexity. The accounts presented in this report are more detailed than those attempted thus far in European Union countries and Japan. However, the current MFA methodology is not yet adequately developed to account for variations in a material’s residence time in the economy, chemical trans-formations, or fabrications of fi nished goods with components drawn from many different sectors.
A more systematic accounting methodology will also allow evaluation of the intensity of material fl ows in economic sectors. This type of analysis is al-ready taking place in some industries. Several major chemicals, metals, and recycling companies current-ly do track their product materials with MFA.45 In 2002, a global coalition of activist groups concerned with the impacts of mining on ecosystems and com-munities called on governments to promote MFA as a way of identifying opportunities for more effi cient use of energy and materials in the mining sector.46
To date, nearly all material fl ows analyses have been conducted at a national scale. However, regional and local consumption patterns are most relevant for citizens concerned with the impacts that these materials may have on their neighborhoods and their families. As the National Research Coun-cil recommends in their 2003 report,47 accounts must enable geospatial analysis in order to provide policy-relevant information. A material fl ows study by the New York Academy of Sciences in the New York/New Jersey Harbor demonstrated the utility of this approach by engaging stakeholders in govern-ment, private industry, and the research community to reduce contaminant emissions and health risks.
To create a robust and practical analytical frame-work for MFA, WRI joins the National Resource Council’s Committee on Materials Flow Account-ing in recommending that the federal government establish a Center for Material Flows in collabora-
tion with nongovernmental organizations and the private sector. The center would manage the de-velopment of MFA methodological guidelines that are applicable to the United States and compatible with international accounts. It would also produce information and analyses of U.S. material fl ows in coordination with government agencies, academic researchers, and the private sector and produce an-nual reports on major materials.
2. Expand and synthesize core data across the life-cycles of materials.
While this study of material fl ows accounts fea-tures more detailed information from a broader range of sources than previous studies, signifi cant data gaps remain. Current accounts do not contain any specifi c information about the production and use of organic and inorganic chemicals or the large fl ows associated with the production, use, and disposal of plastics and synthetic fi bers. Data on pesticides such as pendimethalin or trifl uralin are reported erratically, based on isolated stud-ies, with estimates from different government agencies varying by more than 100 percent. The materials in most imported fi nished goods cannot be measured, including electronic devices that contain heavy metals and other materials that are hazardous to human health and the environment.
Data on wastes released to the environment in the United States are still largely nonexistent. Isolated surveys of municipal solid waste are reported by the Environmental Protection Agency, as are outputs of hazardous materials through the Toxic Resources Inventory and other mechanisms. However, commercial waste, liquid waste, and comprehensive municipal waste are not tracked on a national scale. As a result, substantial errors are introduced into current material fl ows accounts by estimates of waste based solely on production data.
To fi ll these data gaps, the federal government can engage local and national agencies as well as the
29
WRI: MATERIAL FLOWS IN THE UNITED STATES
private sector to compile the data necessary for com-plete material fl ows accounts. Government agencies may require additional budget and technical support to periodically provide these data to a centralized or-ganization, such as a Center for Material Flows. The coordination of statistical functions across differ-ent organizations will allow the full value of both new and existing data to be more fully realized.
3. Incorporate material fl ows analysis into environmen-tal and economic decisionmaking.
Improvements in assessment methodologies and core data sets will allow policymakers to incorporate MFA into environment, trade, national security, and natural resources management policies. Because material fl ows accounts track the trends in materi-als in and out of the economy, they can be used as early warning indicators of potentially serious impacts on human health and undesirable changes in natural resources. With a detailed database on materials use and consumption, policymakers can track materials of environmental concern and act to stem their release into the environment.
In the past, MFA has not directly addressed the environmental impacts of the extraction and release of materials. However, identifying the most environ-mentally deleterious patterns is required if policy-makers are to make informed decisions encourag-ing more responsible use of natural resources.
Most previous assessments relating materials use to environmental impacts have been largely anecdotal, and MFA does not include an overall measurement of environmental health. Direct correlations between material consumption and its corresponding impact on the environment are possible with some materials, such as CO
2 and
chlorofl uorocarbons (CFCs). Further work linking impacts and material consumption is required to address such policy-relevant questions as: What consumption patterns are the most environmen-tally destructive? Where could substitutions or policy interventions be the most effective to ensure
that material consumption does not negatively af-fect human or environmental health?
To date, material fl ows accounts have received limited support from government agencies. The Environmental Protection Agency has funded three preliminary studies in the past decade, and a number of other agencies—U.S. Geological Survey, the Forest Service, U.S. Department of Ag-riculture, and the Census Bureau—have provided data and expertise to the effort. Without a larger mandate, these agencies are unable to contribute more time and money to establishing systematic, regularly updated accounts.
While there is still no federal mandate or fund-ing to establish a Center for Material Flows, the U.S. House of Representatives has recognized the need for improved data and comprehensive analy-sis in the minerals and metals sector. In Septem-ber 2006, the House of Representative’s Commit-tee on Resources introduced the Resource Origin & Commodity Knowledge (ROCK) Act, which would establish a Mineral Commodity Informa-tion Administration responsible for “acquiring and analyzing data related to the origin and uses of domestic and international mineral commodi-ties.” The ROCK Act represents a promising fi rst step in establishing centralized data collection and analysis of materials use in the United States.48
Economic accounts and social indicators have aided policymaking in both the public and private sectors for many decades, yet the resources that support eco-nomic and social well-being are typically measured in isolation from each other—if they are measured at all. The holistic approach of material fl ows ac-counting provides a critical link in understanding the physical implications of the extraction, fabrication, use, and disposal of roughly 20 billion tons of mate-rial each year in the United States. Only with proper measurement can the United States manage the di-verse physical resources that support the livelihoods of the entire population.
30
WRI: MATERIAL FLOWS IN THE UNITED STATES
NOTES1. U.S. Census Bureau. 2000 and 2006. Statistical Ab-
stract of the United States 2006: Table 945, and Statistical Abstract of the United States 2000: Table 1207. Washing-ton, DC: U.S. Census Bureau. Online at <http://www.census.gov/compendia/statab/2006edition.html> and <http://www.census.gov/prod/www/statistical-abstract-1995_2000.html>.
2. Development Data Group, The World Bank. 2006. 2006 World Development Indicators Online. Washington, DC: The World Bank. Online at <http://publications.worldbank.org/ecommerce/catalog/product?item_id=631625>.
3. Plachy, Joseph. 2003. Cadmium Recycling in the United States in 2000. Page 3. Reston, VA: U.S. Geological Survey. Online at <http://pubs.usgs.gov/circ/c1196o/c1196o.pdf>.
4. Committee on Material Flows Accounting of Natural Resources, Products, and Residuals. 2004. Materials Count: The Case for Material Flows Analysis. Page 95. Washington, DC: National Research Council of the National Academies.
5. Adriaanse et al. 1997. Resource Flows: The Material Basis of Industrial Economies. Washington, D.C.: World Resources Institute.
6. Matthews et al. 2000. The Weight of Nations: Material Outfl ows from Industrial Economies. Washington, D.C.: World Resources Institute.
7. In previous WRI studies, any material in use for more than two years and less than 30 years was counted as an addition to stock; the current study classifi es these mate-rials as output fl ows. This change was made to account for consumer durables in output fl ows. These goods are typically disposed of in landfi lls, where they may contribute to environmental degradation through metals leaching or alteration of the national environment.
8. WRI has changed its defi nition of stock additions in this study; see the above note for further explanation.
9. Development Data Group, The World Bank. 2006. 2006 World Development Indicators Online. Washington, DC: The World Bank. Online at <http://publications.worldbank.org/ecommerce/catalog/product?item_id=631625>.
10. EUROSTAT. 2001. Economy-wide Material Flow Accounts and Derived Indicators: A Methodological Guide. Section 3.32. Luxembourg: Offi ce for Offi cial Publications of the European Communities.
11. Newson, Brian et al. 2002. Material Use in the European Union, 1980–2000: Indicators and Analysis. Working Papers and Studies, Theme 2: Economy and Finance. Page 18. Luxembourg: European Commission.
12. U.S. Census Bureau. 2000 and 2006. Statistical Ab-stract of the United States 2006. Table 945 and Statistical Abstract of the United States 2000. Table 1207. Washing-ton, DC: U.S. Census Bureau. Online at <http://www.census.gov/compendia/statab/2006edition.html> and <http://www.census.gov/prod/www/statistical-abstract-1995_2000.html>.
13. U.S. Census Bureau. 2000. Annual Projections of the Total Resident Population as of July 1: Middle, Lowest, Highest, and Zero International Migration Series, 1999 to 2100. Online at <www.census.gov/population/projec-tions/nation/summary/np-t1.pdf>.
14. Houghton et al. 2001. Climate Change 2001: The Sci-entifi c Basis. Cambridge: Intergovernmental Panel on Climate Change.
15. Newson, Brian et al. 2002. Material Use in the European Union, 1980–2000: Indicators and Analysis. Working Papers and Studies, Theme 2: Economy and Finance. Page 16. Luxembourg: European Commission.
16. Ibid.17. Development Data Group, The World Bank. 2006.
2006 World Development Indicators Online. Washington, DC: The World Bank. Online at <http://publications.worldbank.org/ecommerce/catalog/product?item_id=631625>.
18. Newson, Brian et al. 2002. Material Use in the European Union, 1980-2000: Indicators and Analysis. Working Papers and Studies, Theme 2: Economy and Finance. Page 34 Luxembourg: European Commission.
19. Organisation for Economic Co-operation and Devel-opment. 2004. Recommendation of the Council on Material Flows and Resource Productivity. Page 3. Paris: OECD. Online at <http://www.oecd.org/datao-ecd/3/63/31571298.pdf>.
20. U.S. Environmental Protection Agency. 2004. “Supple-mental Guidance on Interpretation of Revised CCA

31
WRI: MATERIAL FLOWS IN THE UNITED STATES
Wood Preservative Label.” Washington, DC: U.S. Envi-ronmental Protection Agency.
21. U.S. Environmental Protection Agency. 2005. Mu-nicipal Solid Waste in the United States: 2003 Facts and Figures. Table 6. Washington, DC: U.S. Environmental Protection Agency. Online at <http://www.epa.gov/ep-aoswer/non-hw/muncpl/pubs/03data.pdf>.
22. U.S. Geological Survey. 2003. Minerals Yearbook 2003, Vol. 1: Minerals and Metals. Page 61.3. Reston, VA: U.S. Geological Survey. Online at <http://minerals.usgs.gov/minerals/pubs/commodity/recycle/recycmyb03.pdf>.
23. Sznopek, J and T. Goonan. 2000. The Materials Flow of Mercury in the Economies of the United States and the World. U.S. Geological Survey Circular 1197. Page 10. U.S. Geological Survey: Denver.
24. International Energy Agency (IEA). 2003. Indicators for OECD Countries (2003 Edition). Electronic database available online at <http://data.iea.org/ieastore/default.asp>. Paris: Organization for Economic Cooperation and Development.
25. U.S. Environmental Protection Agency, Offi ce of Transportation and Air Quality. 2005. “Light-Duty Au-tomotive Technology and Fuel Economy Trends: 1975 through 2005.” Page iv. U.S. Environmental Protection Agency: Washington, DC.
26. U.S. Census Bureau. 1997. Statistical Abstract of the United States. No. 992. Volume of Domestic Intercity Freight and Passenger Traffi c, by Type of Transport: 1980 to 1985. Washington, DC: U.S. Census Bureau.
U.S. Census Bureau. 2006. Statistical Abstract of the United States. Table 1047. Volume of Domestic Intercity Freight and Passenger Traffi c by Type of Transport: 1980 to 2001. Washington, DC: U.S. Census Bureau.
27. U.S. Environmental Protection Agency. 2005. Mu-nicipal Solid Waste in the United States: 2003 Facts and Figures. Table 2. Washington, DC: U.S. Environmental Protection Agency. Available at <http://www.epa.gov/epaoswer/non-hw/muncpl/pubs/03data.pdf>.
28. U.S. Environmental Protection Agency. 2005. Standards of Performance for New and Existing Stationary Sources: Electric Utility Steam Generating Units. Washington, DC: Environmental Protection Agency. Available at <http://www.epa.gov/air/mercuryrule/pdfs/camr_fi nal_pre-amble.pdf>.
29. World Resources Institute. 2005. EarthTrends: The En-vironmental Information Portal. Washington DC: World Resources Institute. Available at <http://earthtrends.wri.org>. Searchable database query for Resource Con-sumption: Paper and Paperboard.
30. U.S. Census Bureau. 2000. Manufacturing, Mining and Construction Statistics: Characteristics of New Housing. Washington, DC: U.S. Census Bureau. Available at <http://www.census.gov/const/www/charindex.html>.
31. U.S. Census Bureau. Statistical Abstract of the United States 2006: Table 945, and Statistical Abstract of the United States 2000: Table 1207. Washington, DC: U.S. Census Bureau.
32. U.S. Green Building Council. LEED for Homes Pilot Rat-ing System. Available at <http://www.usgbc.org/Show-File.aspx?DocumentID=855>.
33. Consumer Electronics Association. 2004. “2003 U.S. Sales of Consumer Electronics to Hit New Record, Kiss-ing $100 billion.” Press release on January 5, 2004. Available at <http://www.ce.org/Press/CurrentNews/press_release_detail.asp?id=10138>.
34. Boehme, Susan and Panero, Marta. 2003. Pollution Prevention and Management Strategies for Cadmium in the New York/New Jersey Harbor. New York: The Harbor Consortium of the New York Academy of Sciences, page 31.
35. State of New York. New York State Bill A00935. 1999–2000 Regulatory Session in Assembly. Bill text is available at <http://ssl.csg.org/dockets/21cycle/2001B/2001bbills/0121B01ny.PDF>.
36. The Mercury Containing and Rechargeable Battery Management Act, Public Law 104-142. May 13, 1996. Statute text is available at <http://www.epa.gov/epao-swer/hazwaste/state/policy/pl104.pdf>.
37. U.S. Census Bureau. 2005. Statistical Abstract of the United States 2006. Table 1003. Washington, DC: U.S. Census Bureau.
38. International Telecommunication Union (ITU). 2006. World Telecommunication Indicators 2005. Geneva: ITU. Available online at <http://www.itu.int/ITU-D/ict/pub-lications/world/world.html>. Football fi eld illustration based on a comparison made in Matthews and Mat-thews’ Information Technology, p. 33.
32
WRI: MATERIAL FLOWS IN THE UNITED STATES
39. U.S. Environmental Protection Agency. Offi ce of Solid Waste. 2005. Municipal Solid Waste in the United States: 2003 Data Tables. Table 12. Washington, DC: U.S. Envi-ronmental Protection Agency.
40. Ibid. Table 13.
41. Puckett et al. February 2002. Exporting Harm: The High-Tech Trashing of Asia. San Jose, CA.: Basel Action Network and SVTC.
42. U.S. Environmental Protection Agency. May 2004. “Plug-In to eCycling: Guidelines for Materials Manage-ment.”
43. Basel Action Network. May 24, 2004. “Critique of EPA’s ‘Plug-In to E-cycling’ Guidelines for Material Management.” Available at <http://www.epa.gov/epao-swer/osw/conserve/plugin/pdf/guide.pdf>.
44. Committee on Material Flows Accounting of Natural Resources, Products, and Residuals. 2004. Materials Count: The Case for Material Flows Analysis. Page 101. Washington, DC: National Research Council of the National Academies.
45. Ibid., pp. 40-47.
46. Young, J and A. Septoff. 2002. Digging for Change: Toward a Responsible Minerals Future, an NGO and Community Perspective. Page 4. A report from members of the Global Mining Campaign. Washington, DC: Mineral Policy Center.
47. Committee on Material Flows Accounting of Natural Resources, Products, and Residuals. 2004. Materials Count: The Case for Material Flows Analysis. Page 89. Washington, DC: National Research Council of the National Academies.
48. United States House of Representatives Committee on Resources. September 20, 2006. “Resources Commit-tee holds hearing on Drake Bill.” Available at <http://resourcescommittee.house.gov/Press/press.htm>.
SOURCESThe minerals and metals data were obtained from the U.S. Geological Survey’s annual Minerals Yearbook and Mineral Commodity Summaries publications. All of the commodities for which the U.S.G.S. publishes specifi c data are included in the commodities list.
Data on nonrenewable organic materials were obtained from the U.S. Department of Energy, the Energy Informa-tion Administration’s Annual Energy Review, the American Coal and Ash Association, and the U.S.G.S.
Forestry data were obtained from the U.S. Forest Service, including J. Howard, 2003. U.S. Timber Production, Trade, Consumption, and Price Statistics. Madison, WI: U.S. De-partment of Agriculture. Data were also obtained from the American Forest and Paper Association and the U.N. Food and Agriculture Organization.
Agricultural data were obtained from the U.N. Food and Agriculture Organization and the U.S. Department of Agri-culture National Agricultural Statistical Service.
Infrastructure data were obtained from the U.S. Corps of Engineers, the Federal Highway Administration, the Natural Resources Conservation Service, and Council of Economic Advisors to the President, 2003. Economic Report of the President. Washington, DC: U.S. Government Print-ing Offi ce.
Population data were obtained from the United States Census Bureau.
Data for the European Union were obtained from Brian Newson et al., 2002. Material Use in the European Union, 1980-2000: Indicators and Analysis. Working Papers and Studies, Theme 2: Economy and Finance. Luxembourg: European Commission.

33
WRI: MATERIAL FLOWS IN THE UNITED STATES
APPENDIX 1CHARACTERIZING MATERIAL FLOWS
released to air may end up on the land. It is acknowl-edged that identifying all the possible pathways subsequent to fi rst release is necessary for a complete assessment of potential impacts. However, this is normally an extremely complicated, site-dependent analysis, much beyond the fi rst level categorizations undertaken for this study. It should also be noted that no attempt was made to provide information on the specifi c sites of output fl ows. The following mode of release categories are used in the spreadsheets:
M0) Flows that become a “permanent” part of the built infrastructure and do not exit the economy during the period under consideration (that is, 30 years).
M1) Flows contained or controlled on land as sol-ids (landfi lls, overburden).
M2) Flows contained on land as liquids or partial solids (tailings ponds, impoundments).
Since both M1 and M2 are controlled in essentially the same manner, it may be possible to combine them.
M3) Flows dispersed directly onto land in a solid, partial solid, or liquid form (fertilizers, pesticides, and fungicides).
M4) Flows discharged into water systems in a solid, partial solid, or liquid form (dredge spoil, soil erosion, sewage effl uent, and deep well injec-
In MFA, the outputs that fl ow into the environ-ment are characterized by their use while a part of the industrial economy. Their role generally
indicates how, when, where, and in what condition they will be released. To take into account the variety among fl ows, each fl ow is characterized by mode of fi rst release (M), quality (Q), and velocity from input to output (V). Within these three categories are many sub-categories that describe the outputs more fully and therefore support an analysis of their impact on the environment. See The Weight of Nations, p.117, Box A1, for more information.
MODE OF RELEASE (M)
The spatial dimension over which a fl ow impacts the environment is related to its dispersion and freedom of movement. A fi rst approximation of this can be inferred from the mode in which the fl ow exits the economy, the physical state of the output fl ow (gas-eous, liquid, or solid), and the degree to which the output fl ow is, or can be, controlled. It is fortunate that the available information on material life cycles for most major fl ows permitted a reasonable judg-ment about these two factors, especially at the point where the fl ow fi rst enters the environment.
Changes in form and mobility do occur subsequent to fi rst entry. Flows dispersed on land as solids may later be dissolved and end up in water systems; those

34
WRI: MATERIAL FLOWS IN THE UNITED STATES
tion). While it could be argued that deep well injection is a controlled release more appropriate to category M1, the degree of containment in the geologic structure can be uncertain.
M5) Flows discharged into air from point sources in a gaseous or particulate form (power plant and industrial source stack emissions).
M6) Flows discharged into air from diffuse sources in a gaseous or particulate form (auto emissions, household heating plants, spray paints).
M7) Flows that take many paths, or no clearly defi ned path, or which are not classifi able.
While it was considered useful to differentiate be-tween point and diffuse sources, it is acknowledged that the spatial domain affected by multiple point sources may, in some cases, be the same as that for diffuse sources.
QUALITY OF RELEASE (Q)
A quality descriptor should provide some informa-tion on whether the environment can assimilate a fl ow and whether it is biologically harmful. Only fl ows that are biodegradable, or are a consequence of our human physiology, can potentially be assimilated in anything short of thousands of years. A descriptor should also identify fl ows that are similar to geologic processes that operate over relatively short time frames. Erosion, beach formation and removal, and siltation of rivers are continuous natural processes that physically transform and move material, and are observable in a human time frame. Some fl ows in our economy, such as road building, are similar to these.
Assigning fl ows to quality categories is potentially more contentious than mode of fi rst release, but it is necessary if we are to begin sorting out fl ows in a
useful way. It should be noted that quality categories should not be treated as hierarchical. All fl ows cause environmental change, and none can automatically be considered innocuous. As an example, while bio-degradable manure can be a useful soil supplement, too much in one place can be a signifi cant problem, as recently witnessed at some large-scale pig and poultry farms. Similarly, just because a fl ow replicates a geologic process does not mean it is benign. The fi lling of a wetland, or the building of a road through a critical ecosystem can have major impacts. The fol-lowing categories are used in the spreadsheets:
Q1) Flows that are biodegradable (agriculture, forest, and fi shery products).
Q2) Flows that replicate rapid continuous geologic processes (particle size reduction and movement only).
Q3) Flows that have not been chemically processed but are chemically active (salt) or biologically hazardous (asbestos).
Q4) Flows that have undergone chemical process-ing. These may or may not be chemically active (fuel emissions, fertilizers, industrial chemicals, certain mineral processing wastes).
Q5) Flows that are heavy metals, synthetic and persis-tent chemical compounds, or radioactive.
VELOCITY OF RELEASE (V)
The velocity of a fl ow—or its converse, the residence time in the human economy—is an important vari-able that can be related to potential impacts on the environment. Some fl ows, such as overburden re-moval, enter and exit almost simultaneously. Others, such as the aluminum used in beverage containers that are not recycled, may have a service life of weeks. Concrete and steel used in construction projects may remain in the economy for 100 years. While the impact a fl ow has on the environment is not, on a per

35
WRI: MATERIAL FLOWS IN THE UNITED STATES
unit basis, directly related to its velocity, the quantity released, or disposed of in a given period of time, certainly is. Recapture by recycling, remanufacture, or reuse increases residence time and reduces the quantity released per unit of service obtained. The available information allowed the velocity of a fl ow to be reasonably estimated according to four broad categories as shown below:
V1) Flows that exit within 2 years after entry (food, fertilizer, packaging, petroleum used as fuel).
V2) Flows that exit after from 3 to 30 years in the economy (durable consumer goods, automobiles). It would be useful if V2 could be further divided into 3–10, and 10–30 year categories, but it is not clear that the available data permits this distinc-tion to be made.
V3) Flows that stay in the economy for more than 30 years and are additions to the stock of built infra-structure (highways, buildings).
V4) One item, construction and demolition waste withdrawn from the stock of built infrastructure, was placed in this category.

36
WRI: MATERIAL FLOWS IN THE UNITED STATES
APPENDIX 2COMMODITIES INCLUDED IN MATERIAL FLOWS ACCOUNTS
investigated. Specifi c references for each fl ow in the database are shown on data sheets on the MFA web-site, available at <http://materials.wri.org>.Selection of the individual commodity fl ows
for analysis was based on the availability of suffi cient detailed data for the time periods
APPENDIX 2 COMMODITIES INCLUDED IN MATERIAL FLOWS ACCOUNTS
Metals and Minerals1. Abrasives (Manufactured)2. Aluminum 3. Antimony4. Arsenic5. Asbestos6. Barite7. Beryllium8. Bismuth9. Boron10. Bromine11. Cadmium12. Caustic Soda13. Cement14. Cesium15. Chlorine16. Chromium17. Clay, ball18. Clay, bentonite19. Clay, common20. Clay, fi re clay21. Clay, fullers earth22. Clay, kaolin23. Clay, totals24. Cobalt25. Columbium26. Copper27. Crushed stone28. Diamonds, industrial29. Diatomite30. Feldspar31. Fluorspar
32. Gallium33. Garnet34. Germanium35. Gold36. Graphite37. Gypsum38. Hafnium39. Helium40. Indium41. Iodine42. Iron & Steel43. Iron & Steel Slag 44. Iron ore45. Kyanite and related minerals46. Lead47. Lime48. Lithium49. Magnesium compounds50. Magnesium metal51. Manganese52. Mercury53. Mica, natural sheet54. Mica, scrap and fl ake55. Molybdenum56. Nickel57. Nickel58. Nitrogen59. Peat60. Perlite61. Phosphate rock62. Phosphoric acid63. Potash
64. Pumice & pumicite65. Quartz crystal, industrial66. Rare earths67. Rhenium68. Rubidium69. Salt70. Sand & Gravel construction71. Sand & Gravel industrial72. Scandium73. Selenium74. Silicon75. Silver76. Soda ash77. Sodium sulfate78. Stone, dimension79. Strontium80. Sulfur81. Talc & Pyrophyllite82. Tantalum83. Tellurium84. Thallium85. Thorium86. Tin87. Titanium concentrates88. Titanium dioxide89. Titanium sponge metal90. Tungsten91. Vanadium92. Vermiculite93. Yttrium94. Zinc95. Zirconium
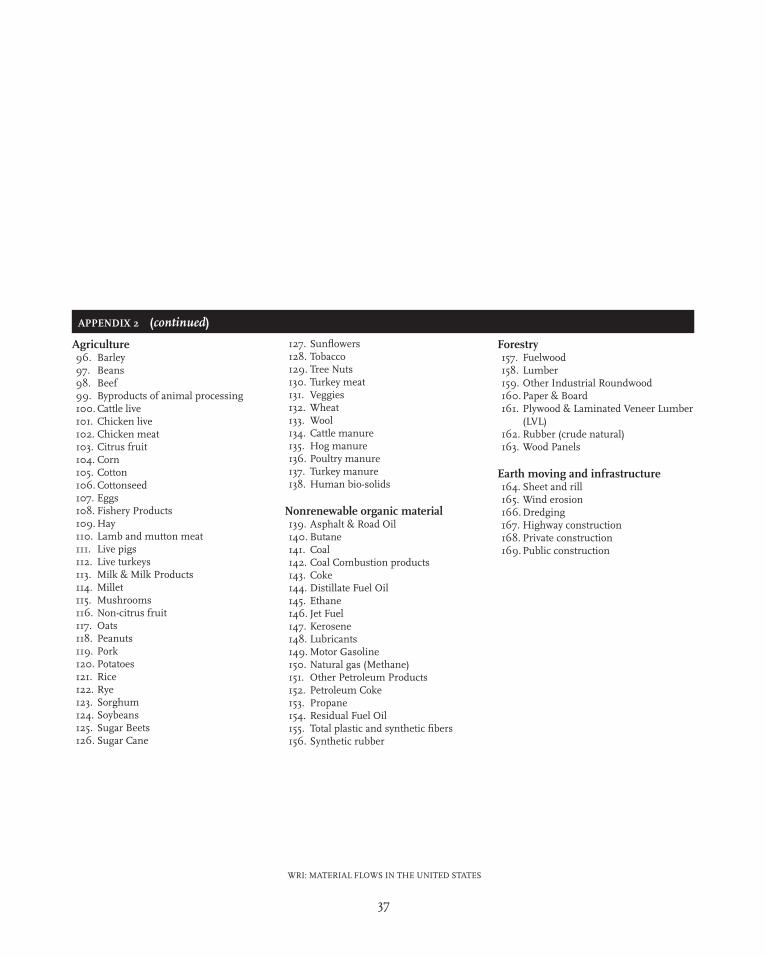
37
WRI: MATERIAL FLOWS IN THE UNITED STATES
Agriculture96. Barley97. Beans98. Beef99. Byproducts of animal processing100. Cattle live101. Chicken live102. Chicken meat103. Citrus fruit104. Corn105. Cotton106. Cottonseed107. Eggs108. Fishery Products109. Hay110. Lamb and mutton meat111. Live pigs112. Live turkeys113. Milk & Milk Products114. Millet115. Mushrooms116. Non-citrus fruit117. Oats118. Peanuts119. Pork120. Potatoes121. Rice122. Rye123. Sorghum124. Soybeans125. Sugar Beets126. Sugar Cane
127. Sunfl owers128. Tobacco129. Tree Nuts130. Turkey meat131. Veggies132. Wheat133. Wool134. Cattle manure135. Hog manure136. Poultry manure137. Turkey manure138. Human bio-solids
Nonrenewable organic material139. Asphalt & Road Oil140. Butane141. Coal142. Coal Combustion products143. Coke144. Distillate Fuel Oil145. Ethane146. Jet Fuel 147. Kerosene148. Lubricants149. Motor Gasoline150. Natural gas (Methane)151. Other Petroleum Products152. Petroleum Coke153. Propane154. Residual Fuel Oil155. Total plastic and synthetic fi bers156. Synthetic rubber
Forestry157. Fuelwood158. Lumber159. Other Industrial Roundwood160. Paper & Board161. Plywood & Laminated Veneer Lumber (LVL)162. Rubber (crude natural)163. Wood Panels
Earth moving and infrastructure164. Sheet and rill165. Wind erosion166. Dredging167. Highway construction168. Private construction169. Public construction
APPENDIX 2 (continued)
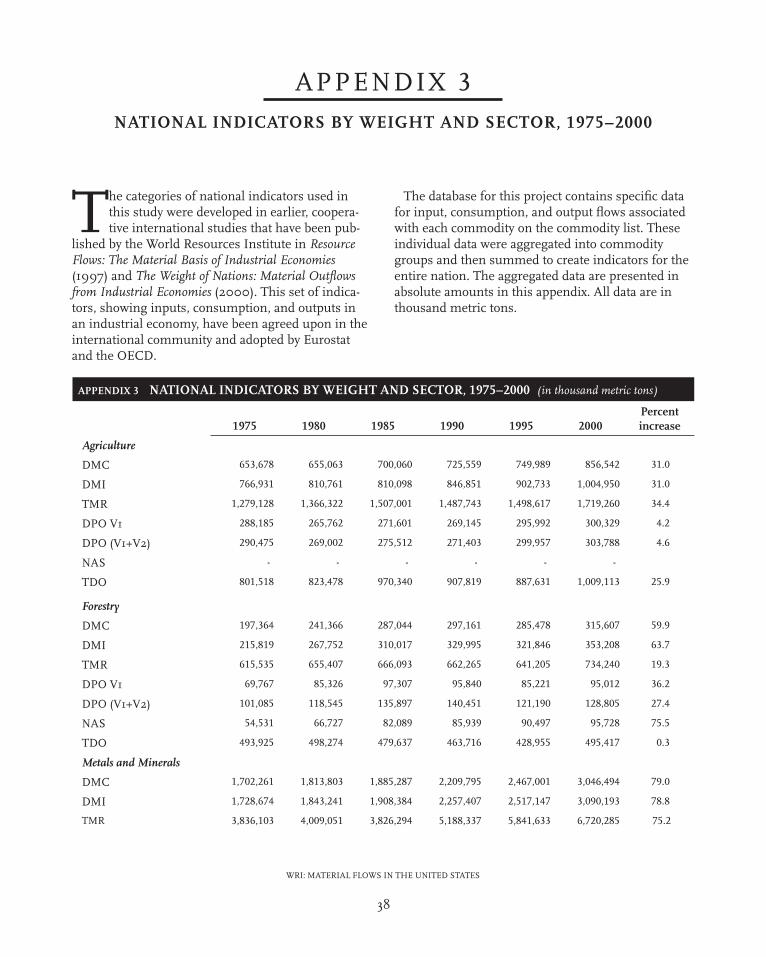
38
WRI: MATERIAL FLOWS IN THE UNITED STATES
APPENDIX 3NATIONAL INDICATORS BY WEIGHT AND SECTOR, 1975–2000
The categories of national indicators used in this study were developed in earlier, coopera-tive international studies that have been pub-
lished by the World Resources Institute in Resource Flows: The Material Basis of Industrial Economies (1997) and The Weight of Nations: Material Outfl ows from Industrial Economies (2000). This set of indica-tors, showing inputs, consumption, and outputs in an industrial economy, have been agreed upon in the international community and adopted by Eurostat and the OECD.
APPENDIX 3 NATIONAL INDICATORS BY WEIGHT AND SECTOR, 1975–2000 (in thousand metric tons)
1975
1980
1985
1990
1995
2000
Percent increase
Agriculture
DMC 653,678 655,063 700,060 725,559 749,989 856,542 31.0
DMI 766,931 810,761 810,098 846,851 902,733 1,004,950 31.0
TMR 1,279,128 1,366,322 1,507,001 1,487,743 1,498,617 1,719,260 34.4
DPO V1 288,185 265,762 271,601 269,145 295,992 300,329 4.2
DPO (V1+V2) 290,475 269,002 275,512 271,403 299,957 303,788 4.6
NAS - - - - - -
TDO 801,518 823,478 970,340 907,819 887,631 1,009,113 25.9
Forestry
DMC 197,364 241,366 287,044 297,161 285,478 315,607 59.9
DMI 215,819 267,752 310,017 329,995 321,846 353,208 63.7
TMR 615,535 655,407 666,093 662,265 641,205 734,240 19.3
DPO V1 69,767 85,326 97,307 95,840 85,221 95,012 36.2
DPO (V1+V2) 101,085 118,545 135,897 140,451 121,190 128,805 27.4
NAS 54,531 66,727 82,089 85,939 90,497 95,728 75.5
TDO 493,925 498,274 479,637 463,716 428,955 495,417 0.3
Metals and Minerals
DMC 1,702,261 1,813,803 1,885,287 2,209,795 2,467,001 3,046,494 79.0
DMI 1,728,674 1,843,241 1,908,384 2,257,407 2,517,147 3,090,193 78.8
TMR 3,836,103 4,009,051 3,826,294 5,188,337 5,841,633 6,720,285 75.2
The database for this project contains specifi c data for input, consumption, and output fl ows associated with each commodity on the commodity list. These individual data were aggregated into commodity groups and then summed to create indicators for the entire nation. The aggregated data are presented in absolute amounts in this appendix. All data are in thousand metric tons.

39
WRI: MATERIAL FLOWS IN THE UNITED STATES
APPENDIX 3 (continued)
1975 1980 1985 1990 1995 2000
Percent increase
Metals and Minerals (continued)
DPO V1 115,846 136,873 126,772 166,060 179,554 178,366 54.0
DPO (V1+V2) 173,539 193,197 186,223 199,510 220,542 246,028 41.8
NAS 1,497,970 1,585,191 1,666,021 1,965,260 2,199,041 2,754,950 83.9
TDO 1,625,416 1,693,534 1,491,508 2,586,913 2,878,561 2,807,877 72.7
Nonrenewable Organic Material
DMC 1,595,821 1,748,675 1,765,244 1,907,851 2,048,054 2,296,460 43.9
DMI 1,668,081 1,861,596 1,890,572 2,049,106 2,181,199 2,406,300 44.3
TMR 9,364,833 8,964,647 8,500,409 8,942,157 8,059,587 8,270,270 -11.7
DPO V1 1,529,415 1,651,258 1,561,137 1,742,508 1,817,774 1,945,117 27.2
DPO (V1+V2) 1,553,056 1,682,827 1,593,900 1,777,947 1,858,954 1,994,132 28.4
NAS 27,203 29,181 31,159 33,137 35,116 37,094 36.4
TDO 9,249,808 8,785,879 8,203,737 8,670,999 7,737,342 7,858,102 -15.0
National Totals
DMC 4,149,124 4,458,907 4,637,635 5,140,365 5,550,522 6,515,103 57.0
DMI 4,379,504 4,783,350 4,919,071 5,483,359 5,922,926 6,854,651 56.5
TMR 15,095,599 14,995,427 14,499,796 16,280,502 16,041,042 17,444,056 15.6
TMR* 23,115,368 22,136,388 21,224,703 22,480,565 21,424,011 23,735,652 2.7
DPO V1 2,003,213 2,139,219 2,056,817 2,273,553 2,378,541 2,518,824 25.7
DPO (V1+V2) 2,118,156 2,263,571 2,191,533 2,389,311 2,500,643 2,672,753 26.2
NAS 1,579,704 1,681,099 1,779,269 2,084,336 2,324,654 2,887,772 82.8
TDO 12,170,667 11,801,165 11,145,222 12,629,446 11,932,489 12,170,508 0.0
TDO* 20,190,436 18,942,126 17,870,129 18,829,509 17,315,458 18,462,104 -8.6
* These indicators include the earth moving and infrastructure hidden fl ows shown below. Earth Moving & Infrastructure Hidden Domestic Flows (excluded above, except as noted)
Erosion
Sheet and rill 2,000,000 1,720,000 1,534,800 1,303,600 1,101,900 1,010,025 -49.5
Wind erosion 1,500,000 1,420,714 1,339,800 1,074,560 855,400 795,500 -47.0
Dredging
Dredging (Soil disposed on land) 279,813 255,750 259,875 239,250 224,242 247,706 -11.5
Dredging (Soil disposed in water) 279,813 255,750 259,875 239,250 224,242 247,706 -11.5
Earth moving
Highway construction 2,427,274 1,891,250 1,376,932 1,253,717 916,810 1,152,751 -52.5
Private construction 1,326,750 1,424,459 1,821,776 1,893,396 1,871,946 2,568,187 93.6
Public construction 206,119 173,038 131,849 196,290 188,429 269,720 30.9
Total 8,019,769 7,140,961 6,724,907 6,200,063 5,382,969 6,291,596 -21.5

40
WRI: MATERIAL FLOWS IN THE UNITED STATES
APPENDIX 4NATIONAL INDICATORS PER CAPITA BY SECTOR, 1975–2000
The categories of national indicators used in this study were developed in earlier, coopera-tive international studies that have been pub-
lished by the World Resources Institute in Resource Flows: The Material Basis of Industrial Economies (1997) and The Weight of Nations: Material Outfl ows from Industrial Economies (2000). This set of indica-tors, showing inputs, consumption, and outputs in an industrial economy, have been agreed upon in the international community and adopted by Eurostat and the OECD.
The database for this project contains specifi c data for input, consumption, and output fl ows associated with each commodity shown on the commodity list. These individual data were aggregated into commod-ity groups and then summed to create indicators for the entire nation. The aggregated data are presented in this appendix on a per capita basis, a form that per-mits comparisons among countries, regions, states, and any other comparable groups. Data are in metric tons per person.
APPENDIX 4 PER CAPITA NATIONAL INDICATORS BY SECTOR, 1975–2000 (in metric tons per capita)
1975 1980 1985 1990 1995 2000
Percent increase
Total US population/1000 215,973 227,726 238,466 249,973 263,082 275,372 27.50
GDP (million 1995 dollars) 3,969,200 4,771,900 5,563,500 6,520,500 7,338,400 9,008,507 126.96
Agriculture
DMC 3.03 2.88 2.94 2.90 2.85 3.11 2.8
DMI 3.55 3.56 3.40 3.39 3.43 3.65 2.8
TMR 5.92 6.00 6.32 5.95 5.70 6.24 5.4
DPO V1 1.33 1.17 1.14 1.08 1.13 1.09 -18.3
DPO (V1+V2) 1.34 1.18 1.16 1.09 1.14 1.10 -18.0
NAS 0.00 0.00 0.00 0.00 0.00 0.00
TDO 3.71 3.62 4.07 3.63 3.37 3.66 -1.3
Forestry
DMC 0.91 1.06 1.20 1.19 1.09 1.15 25.4
DMI 1.00 1.18 1.30 1.32 1.22 1.28 28.4
TMR 2.85 2.88 2.79 2.65 2.44 2.67 -6.4
DPO V1 0.32 0.37 0.41 0.38 0.32 0.35 6.8
DPO (V1+V2) 0.47 0.52 0.57 0.56 0.46 0.47 -0.1
NAS 0.25 0.29 0.34 0.34 0.34 0.35 37.7
TDO 2.29 2.19 2.01 1.86 1.63 1.80 -21.3
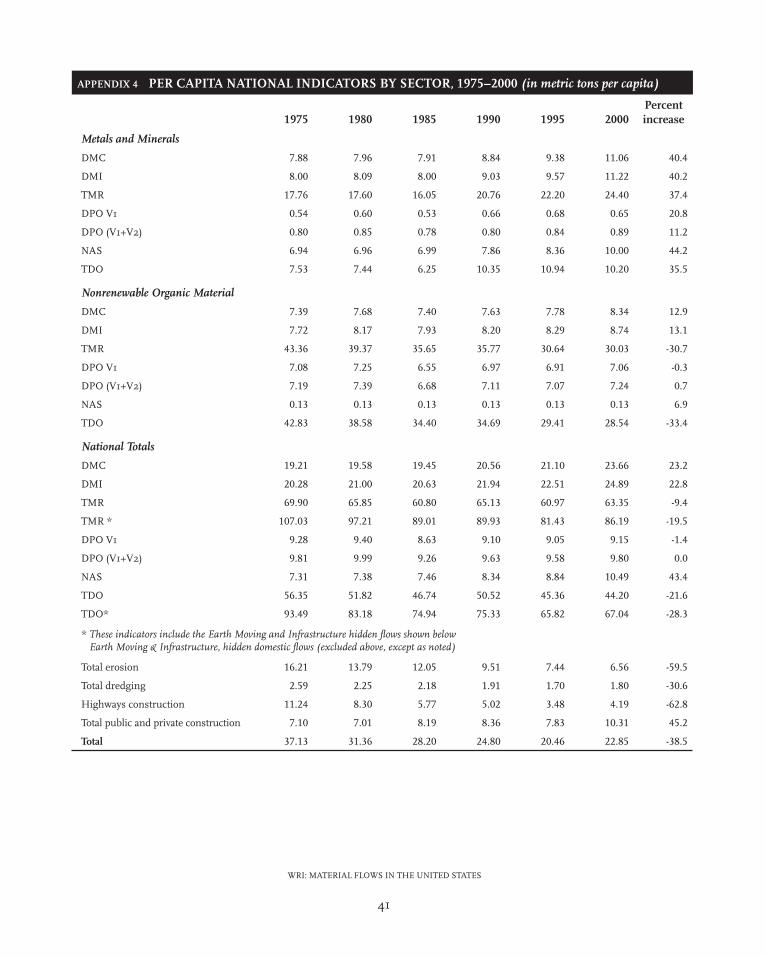
41
WRI: MATERIAL FLOWS IN THE UNITED STATES
APPENDIX 4 PER CAPITA NATIONAL INDICATORS BY SECTOR, 1975–2000 (in metric tons per capita)
1975 1980 1985 1990 1995 2000
Percent increase
Metals and Minerals
DMC 7.88 7.96 7.91 8.84 9.38 11.06 40.4
DMI 8.00 8.09 8.00 9.03 9.57 11.22 40.2
TMR 17.76 17.60 16.05 20.76 22.20 24.40 37.4
DPO V1 0.54 0.60 0.53 0.66 0.68 0.65 20.8
DPO (V1+V2) 0.80 0.85 0.78 0.80 0.84 0.89 11.2
NAS 6.94 6.96 6.99 7.86 8.36 10.00 44.2
TDO 7.53 7.44 6.25 10.35 10.94 10.20 35.5
Nonrenewable Organic Material
DMC 7.39 7.68 7.40 7.63 7.78 8.34 12.9
DMI 7.72 8.17 7.93 8.20 8.29 8.74 13.1
TMR 43.36 39.37 35.65 35.77 30.64 30.03 -30.7
DPO V1 7.08 7.25 6.55 6.97 6.91 7.06 -0.3
DPO (V1+V2) 7.19 7.39 6.68 7.11 7.07 7.24 0.7
NAS 0.13 0.13 0.13 0.13 0.13 0.13 6.9
TDO 42.83 38.58 34.40 34.69 29.41 28.54 -33.4
National Totals
DMC 19.21 19.58 19.45 20.56 21.10 23.66 23.2
DMI 20.28 21.00 20.63 21.94 22.51 24.89 22.8
TMR 69.90 65.85 60.80 65.13 60.97 63.35 -9.4
TMR * 107.03 97.21 89.01 89.93 81.43 86.19 -19.5
DPO V1 9.28 9.40 8.63 9.10 9.05 9.15 -1.4
DPO (V1+V2) 9.81 9.99 9.26 9.63 9.58 9.80 0.0
NAS 7.31 7.38 7.46 8.34 8.84 10.49 43.4
TDO 56.35 51.82 46.74 50.52 45.36 44.20 -21.6
TDO* 93.49 83.18 74.94 75.33 65.82 67.04 -28.3
* These indicators include the Earth Moving and Infrastructure hidden fl ows shown below Earth Moving & Infrastructure, hidden domestic fl ows (excluded above, except as noted)
Total erosion 16.21 13.79 12.05 9.51 7.44 6.56 -59.5
Total dredging 2.59 2.25 2.18 1.91 1.70 1.80 -30.6
Highways construction 11.24 8.30 5.77 5.02 3.48 4.19 -62.8
Total public and private construction 7.10 7.01 8.19 8.36 7.83 10.31 45.2
Total 37.13 31.36 28.20 24.80 20.46 22.85 -38.5

42
WRI: MATERIAL FLOWS IN THE UNITED STATES
ABOUT WORLD RESOURCES INSTITUTE (WRI)
The World Resources Institute (WRI) is an environmental think tank that goes beyond research to fi nd practical ways to protect the earth and improve people’s lives.
Our mission is to move human society to live in ways that protect Earth’s en-vironment and its capacity to provide for the needs and aspirations of current and future generations.
Because people are inspired by ideas, empowered by knowledge, and moved to change by greater understanding, WRI provides—and helps other institu-tions provide—objective information and practical proposals for policy and institutional change that will foster environmentally sound, socially equitable development.
WRI organizes its work around four key goals:
● People & Ecosystems: Reverse rapid degradation of ecosystems and assure their capacity to provide humans with needed goods and services.
● Access: Guarantee public access to information and decisions regarding natural resources and the environment.
● Climate Protection: Protect the global climate system from further harm due to emissions of greenhouse gases and help humanity and the natural world adapt to unavoidable climate change.
● Markets & Enterprise: Harness markets and enterprise to expand economic opportunity and protect the environment.
10 G Street, NEWashington, DC 20002, USA(202) 729-7600 www.wri.org

MATERIAL FLOWS IN THE UNITED STATESA Physical Accounting of the U.S. IndustrialEconomy
World Resources Institute10 G Street, NEWashington, DC 20002 USA
www.wri .org
DON ROGICH
AMY CASSARA
IDDO WERNICK
MARTA MIRANDA
W R I R E P O R T