Embed Size (px)
Citation preview

Capital Flows to EU New Member States:
Does Sector Destination Matter?
Pritha Mitra
WP/11/67

© 2011 International Monetary Fund WP/11/67
IMF Working Paper
European
Capital Flows to EU New Member States: Does Sector Destination Matter?
Prepared by Pritha Mitra
Authorized for distribution by Jeffrey R. Franks
March 2011
Abstract
The recent boom-bust episode in Emerging Europe was largely the product of surges and sudden stops in capital inflows. This paper empirically argues that the sectors into which capital flows determines their impact on GDP growth. Applying data from EU New Member States, it is found that capital flows into real estate have a greater impact on swings in GDP than other sectors, irrespective of a country's exchange rate or fiscal policy. Consequently, as new waves of capital inflows spread to emerging markets, policies may usefully focus on supporting capital inflows towards economic sectors that minimize large swings in GDP.
JEL Classification Numbers: E2, E51, F30, F41
Keywords: Crisis, Capital flows, Emerging markets, Central and Eastern Europe, Bulgaria, Czech Republic, Estonia, Hungary, Latvia, Lithuania, Poland, Romania, and Slovak Republic.
Author’s e-mail address: [email protected]
This Working Paper should not be reported as representing the views of the IMF. The views expressed in this Working Paper are those of the author(s) and do not necessarily represent those of the IMF or IMF policy. Working Papers describe research in progress by the author(s) and are published to elicit comments and to further debate.

2
Contents Page
I. Introduction ........................................................................................................................... 3 II. Stylized Facts: Capital Flows and GDP Growth in NMS during the Recent Boom-Bust Cycle ..................................................................................................................................... 5 III. Empirical Analysis: Does it Matter which Sectors Foreign Capital Flows Into? ............. 16 IV. Conclusion ........................................................................................................................ 21 Appendix I. ..............................................................................................................................25 Appendix II. .............................................................................................................................26 Appendix III. ............................................................................................................................27
3
I. INTRODUCTION1
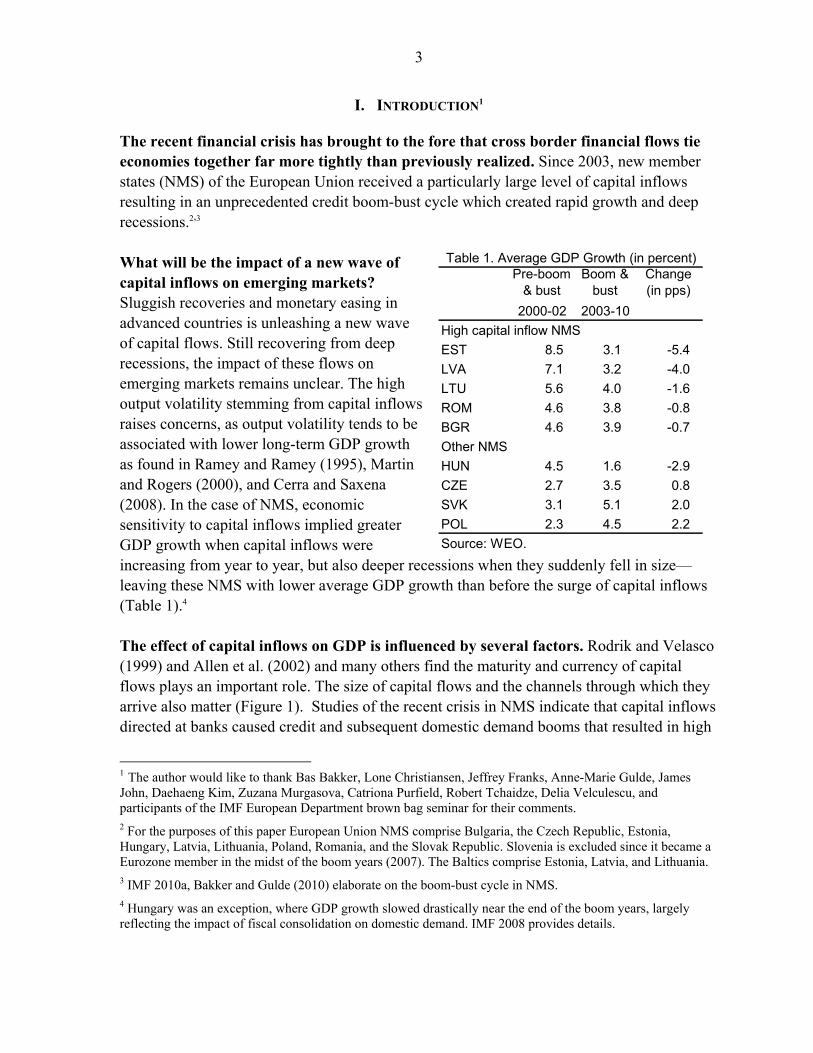
The recent financial crisis has brought to the fore that cross border financial flows tie economies together far more tightly than previously realized. Since 2003, new member states (NMS) of the European Union received a particularly large level of capital inflows resulting in an unprecedented credit boom-bust cycle which created rapid growth and deep recessions.2,3 What will be the impact of a new wave of capital inflows on emerging markets? Sluggish recoveries and monetary easing in advanced countries is unleashing a new wave of capital flows. Still recovering from deep recessions, the impact of these flows on emerging markets remains unclear. The high output volatility stemming from capital inflows raises concerns, as output volatility tends to be associated with lower long-term GDP growth as found in Ramey and Ramey (1995), Martin and Rogers (2000), and Cerra and Saxena (2008). In the case of NMS, economic sensitivity to capital inflows implied greater GDP growth when capital inflows were increasing from year to year, but also deeper recessions when they suddenly fell in size—leaving these NMS with lower average GDP growth than before the surge of capital inflows (Table 1).4 The effect of capital inflows on GDP is influenced by several factors. Rodrik and Velasco (1999) and Allen et al. (2002) and many others find the maturity and currency of capital flows plays an important role. The size of capital flows and the channels through which they arrive also matter (Figure 1). Studies of the recent crisis in NMS indicate that capital inflows directed at banks caused credit and subsequent domestic demand booms that resulted in high
1 The author would like to thank Bas Bakker, Lone Christiansen, Jeffrey Franks, Anne-Marie Gulde, James John, Daehaeng Kim, Zuzana Murgasova, Catriona Purfield, Robert Tchaidze, Delia Velculescu, and participants of the IMF European Department brown bag seminar for their comments. 2 For the purposes of this paper European Union NMS comprise Bulgaria, the Czech Republic, Estonia, Hungary, Latvia, Lithuania, Poland, Romania, and the Slovak Republic. Slovenia is excluded since it became a Eurozone member in the midst of the boom years (2007). The Baltics comprise Estonia, Latvia, and Lithuania. 3 IMF 2010a, Bakker and Gulde (2010) elaborate on the boom-bust cycle in NMS. 4 Hungary was an exception, where GDP growth slowed drastically near the end of the boom years, largely reflecting the impact of fiscal consolidation on domestic demand. IMF 2008 provides details.
Pre-boom & bust
Boom & bust
Change (in pps)
2000-02 2003-10
High capital inflow NMS
EST 8.5 3.1 -5.4
LVA 7.1 3.2 -4.0
LTU 5.6 4.0 -1.6
ROM 4.6 3.8 -0.8
BGR 4.6 3.9 -0.7
Other NMS
HUN 4.5 1.6 -2.9
CZE 2.7 3.5 0.8
SVK 3.1 5.1 2.0
POL 2.3 4.5 2.2
Source: WEO.
Table 1. Average GDP Growth (in percent)
4
GDP growth which collapsed with a sudden stop in these inflows.5 However, credit growth is not always commensurate with GDP growth. For instance, Bulgaria had a much higher increase in credit to GDP ratio than Romania during the recent boom but similar GDP growth (Figure 1), suggesting additional factors may play a role. An area little explored in the literature is the importance of the economic sector into which capital flows. For example, capital flowing into real estate may fuel speculative bubbles, fueling high economic growth until the bubble bursts and severe recession follows, likely resulting in lower long-term growth. In contrast, capital flows that support economic sectors such as tradables may promote high sustainable long-term growth.
This paper studies the influence of economic sectors on the impact of capital flows on GDP. Whether it’s FDI or bank flows, capital inflows ultimately affect GDP by the manner in which they are invested.6 External capital channeled towards the corporate sector affects GDP differently than when it is channeled into real estate. The experiences of NMS during the recent boom and crisis episode (Section II) is used to study the differing empirical impact on GDP growth of capital inflows channeled to economic sectors such as real estate and
5 Ibid footnote 3. 6 The sectors into which capital flows also determine the economic agent who bears the ultimate investment risk.
Figure 1. Boom: GDP growth, capital inflows, and credit
BGR
CZE
EST
HUN
LVA
LIT
POL
ROMSVK
0
2
4
6
8
10
12
0 50 100 150 200
Rea
l GD
P g
row
th
Capital inflows
Average Real GDP growth (in percent) vs. capital inflows (in percent 2003 GDP) 1/
BGR
CZE
EST
HUN
LVA
LIT
POL
ROMSVK
0
2
4
6
8
10
12
0 10 20 30 40 50 60
Rea
l GD
P g
row
th
Credit-to-GDP
Average Real GDP growth vs. change in credit-to-GDP
(in percent) 1/
Sources: Haver, IFS, WEO.1/ The boom period is defined as 2003Q1-2007Q4 for Estonia and Latvia, 2003Q2-2008Q1 for Hungary, 2003Q3-2008Q2for Lithuania and Romania, 2003Q4-2008Q3 for Bulgaria, Poland, and the Czech and Slovak Republics.

5
corporate investment (via mortgages, consumer credit, corporate real estate credit, real estate FDI, corporate non-real estate credit, and non-real estate FDI). The results (Section III) attempt to shed light on the extent to which the ultimate destination of capital inflows is important for surges and collapses of GDP.
II. STYLIZED FACTS: CAPITAL FLOWS AND GDP GROWTH IN NMS DURING THE RECENT BOOM-BUST CYCLE
A review of recent boom and bust experiences of NMS indicate that the sectors to which capital flows matter. While many factors have influenced GDP growth during the recent boom and bust episodes,7 the surge and sudden decline of capital inflows into NMS appears to coincide with the rapid increase and collapse of GDP growth. NMS that had smaller swings in GDP growth received smaller capital inflows and tended to have export-led booms influenced by global growth. It is likely that the level of capital inflows experienced in a given period influences consumption, investment, and thus GDP. Consequently, changes in GDP stemming from changes in consumption and investment may be correlated with changes in capital inflows. NMS with the largest swings in GDP growth also had the largest concentration of capital inflows into real estate. Consumption-led GDP booms and busts coincided with the majority of capital inflows being channeled to the real estate sector either directly through FDI or capital inflows to banks fueling household mortgage and consumer credit. NMS where the majority of capital inflows were channeled towards non-real estate sectors had investment-led booms and busts with lower fluctuations in GDP than those with consumption-led growth. Stylized facts describing the boom and bust are provided below. The Boom Years During the boom years, the strength of GDP growth varied greatly across NMS. At one extreme, the Baltics grew the fastest amongst NMS—on average by 8 to 10 percent per year (Figure 2) while average growth in the Czech
7 Lane and Milesi-Ferretti (2010) and Rose and Spiegel (2009) survey the literature on factors impacting crisis GDP growth.
Figure 2. Boom: Average Annual Real GDP
Growth (percent) 1/
0
2
4
6
8
10
12
HUN CZE POL SVK BGR ROM LIT EST LVA
Export BoomConsumption ,Investment Boom
Source: Haver.1/ Average boom GDP growth is the annual average GDP growth over 2003Q1-2007Q4 for Estonia and Latvia, 2003Q2-2008Q1 for Hungary, 2003Q3-2008Q2 for Lithuania and Romania, 2003Q4-2008Q3 for Bulgaria, Poland, and the Czech and Slovak Republics.

6
Republic8, Hungary, and Poland was around 3 to 5 percent per year. Bulgaria, Romania, and the Slovak Republic fell in between, with annual average growth of 6, 7, and close to 8 percent, respectively. At the same time, capital inflows surged into the Baltics, Bulgaria, and Romania (Figure 3). In the five years leading to the peak of the boom, net capital inflows ranged from 80 to 160 percent of 2003 GDP in the Baltics, Bulgaria, and Romania. While bank inflows (both direct and through FDI) dominated in the Baltics and Romania, FDI (non-bank) was the main inflow to Bulgaria. In contrast, Hungary, Poland, and the Czech and Slovak Republics received capital inflows ranging from 30 to 60 percent of 2003 GDP, with inflows relatively evenly split between bank-related flows and FDI (non-bank). The exceptions are Hungary where bank flows were much larger and the Czech Republic where non-bank FDI flows dominated.
8 The Czech Republic is now classified as an advanced country by the IMF, although early in the period under study it was an emerging market.

7
The sectors in which capital inflows were invested were key to determining whether the country experienced consumption and/or investment-driven growth. In the Baltics and Romania, bank credit (fueled by bank inflows) and FDI
flowed to household real estate and consumption supporting a consumption boom and to non-real estate corporate investments fueling an investment boom (Figure 3).9 Both investment and consumption grew to several times their levels at the beginning of the boom. Almost half of domestic credit went to households (mainly mortgages in the Baltics and consumer credit in Romania).10 Mortgage growth fueled rapid real estate price growth, especially in Latvia—where nominal real estate prices grew by 60 percent per annum11—which propelled consumption through wealth effects, adding to rising incomes and falling savings during the boom.12
Bank credit and FDI fueling corporate investments financed investment-driven growth in Bulgaria. At its peak, investment had grown by 120 percent since the boom began. FDI was the largest component of capital inflows (Figure 1). Half of FDI was used to finance corporate investment (especially manufacturing and development of domestic trade infrastructure), one fifth went to the financial sector (fueling domestic credit), while the remainder went to the corporate real estate sector —largely financing the building of vacation real estate aimed at foreigners (Figure 3).13 The FDI and domestic bank credit supporting developers creating vacation real estate marketed to foreigners caused average nominal real estate prices to grow by 50 percent per annum during the boom.14 Since Bulgarian households benefited little from these price increases, most of the impact of corporate real estate investment was on investment with little impact on consumption. Domestic credit supporting consumption growth (through mortgages and consumer credit) was small relative to domestic credit for corporate investment (Figure 3). Consequently, even at its peak, consumption was only 30 percent higher than when the boom began.
9 Purfield and Rosenberg (2010) provide details on the boom and bust cycle in the Baltics. 10 Between 2004-08, the National Bank of Romania took measures to limit mortgage debt of households (IMF, 2009a). 11 Source: Authorities. The boom period is defined as 2003Q1-2007Q4 for Latvia. 12 Housing prices, through their wealth effect, have been shown to have a significant impact on consumption. See Campbell and Cocco (2005) and Benito and Mumtaz (2006). In the Baltics and Romania two common channels were people who fully owned their homes (i.e. had no mortgage) could sell them at high prices or take mortgages out on them. 13 During 2005-06, the Bulgarian National Bank imposed limits on credit expansion. However, domestic bank borrowing was replaced by domestic non-bank and foreign borrowing. See Vandenbussche (2010). 14 Source: Haver.

8
The Baltics and Romania experienced the largest booms with consumption propelling GDP growth (Figure 4). Consumption was by far the largest component of GDP growth in Latvia, Lithuania, and Romania (growing at over 10 percent per annum), despite important contributions of investment and exports. In contrast to the Baltics and Romania, consumption growth was about half as much in Bulgaria and one third as high in Hungary, Poland, and the Czech and Slovak Republics.
Investment drove the boom in Bulgaria, and played an important role in Estonia (Figure 4). Although, average annual boom investment growth in Hungary, Poland, and the Czech and Slovak Republics was around 5 percent, in the Baltics it was almost three times as much, and even higher in Bulgaria and Romania at over 20 percent. Investment was the largest contributor to growth in Bulgaria and tied with consumption as the sizeable second largest contributor after exports in Estonia.15 NMS with export-led growth—Hungary, Poland, and the Czech and Slovak Republics—experienced only moderate booms. Exports fueled growth in all NMS. However, receiving fewer capital inflows than the Baltics, Bulgaria, and Romania, the remaining NMS (Hungary, Poland, and the Czech and Slovak Republics) had export-driven growth. Since the turn of the century, NMS annual exports grew by an average of 8½ percent per year in line with high global and Eurozone growth (Figure 5) as
15 In countries with low pre-boom per capita GDP (Bulgaria, Latvia, Lithuania, and Romania), EU accession and income convergence may have both contributed to the consumption- investment boom and to increased capital inflows.
Figure 5. World Real GDP and NMS Export Growth
(Percent)
0
2
4
6
8
10
12
14
16
0
1
2
3
4
5
6
2002 2003 2004 2005 2006 2007 2008Sources: WEO, Haver.
World GDP
Euro AreaGDP Growth
NMS Export Growth (RHS)
(Percent) 1/
Figure 4. Boom: GDP Contributions
Source: Haver.1/ Average boom GDP growth is the annual average GDP growth over 2003Q1-2007Q4 for Estonia and Latvia, 2003Q2-2008Q1 for Hungary, 2003Q3-2008Q2 for Lithuania and Romania, 2003Q4-2008Q3 for Bulgaria, Poland, and the Czech and Slovak Republics.
-20
-15
-10
-5
0
5
10
15
20
25
30
HUN CZE POL SVK BGR ROM LIT EST LVA
C
I
X
M
C = consumptionX = exportsI = investmentM = imports
Consumption ,Investment BoomExport Boom
9
Figure 6. Marginal Propensity to Import 2003-08
(Percent)1/
0
20
40
60
80
100
120
BGR EST LVA LIT
Consumption
Investment
Sources: WEO, World Integrated Trade System.1/ Insufficient data for Romania.
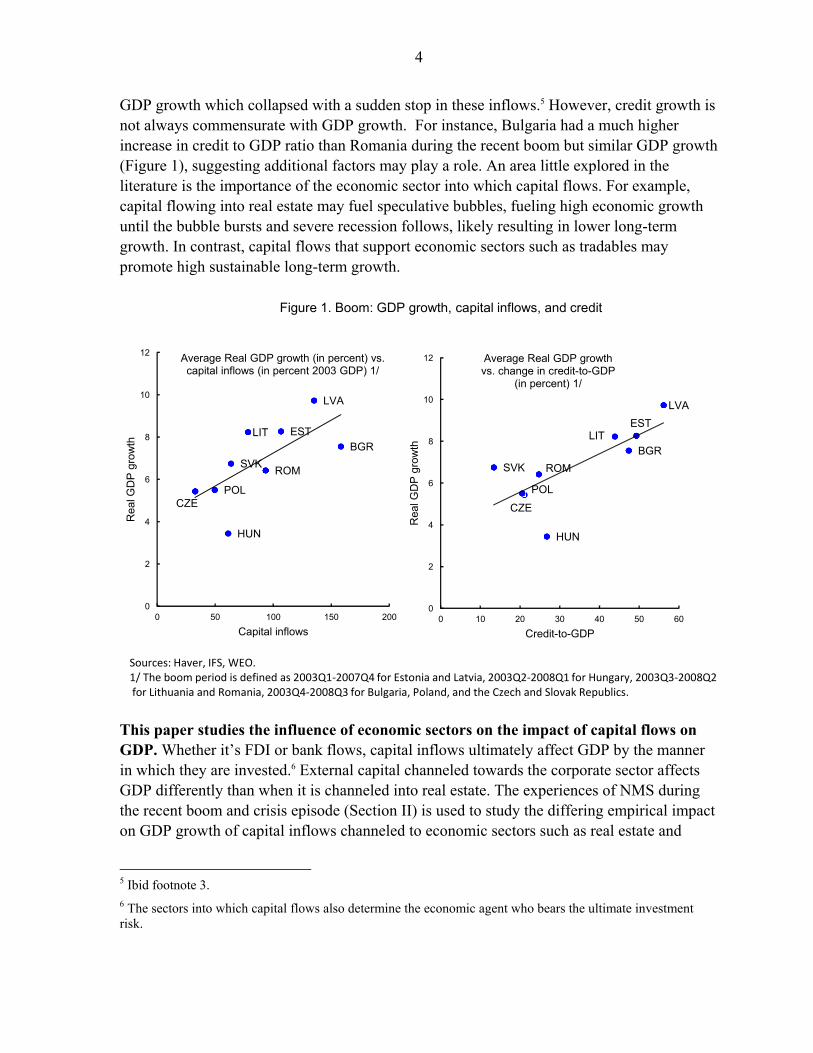
well as EU accession16. Consumption and investment also played an important role in Poland (where exports’ contribution to GDP was not as quite as high as the non-consumption and investment boom NMS) and in the Slovak Republic (where they boosted the large contribution of exports). Investment and export-led booms had less impact on GDP growth than consumption-led booms. In large part, this reflects higher import growth draining some of the positive impacts of exports and investment on GDP. The negative contribution of imports to GDP growth was about two thirds that of other components’ positive contribution across NMS, except Latvia and Lithuania where it was only one half. Owing to the participation of Hungary, Poland, the Czech and Slovak Republics in integrated cross-border production chains—producing components and intermediate goods for Western European manufacturers—export production involved a large import component.17 Meanwhile, in Bulgaria and Estonia, where investment growth played an important role, a large proportion of increased domestic demand was absorbed by higher imports rather than domestic production since the import content of investment is generally higher for investment than for consumption (Figure 6). Conversely, imports placed less of a drag on GDP growth in Latvia and Lithuania where consumption’s influence on growth out-weighed that of investment. The Crisis Years A slowdown of capital inflows – first in the Baltics then in other NMS—combined with the global downturn, brought an end to their booms. In mid-2007, with growing concerns regarding over-exposure to the Baltics, Swedish banks began reducing capital flows to the Baltics. In the fall of 2008, following the default of Lehman Brothers, capital flows to NMS
16 Estonia, Hungary, Latvia, Lithuania, Poland, and the Czech and Slovak Republics joined the European Union in 2004, followed by Bulgaria and Romania in 2007. 17 Dullien (2010), Hais, Mahlberg, and Molling (2009) provide details on the integrated nature of production of these NMS with the Euro Area, particularly Germany. Ariel, Kurz, and Tesar (2008) assess the alignment of production integration with the business cycles of a country’s largest production and trade partners.
10
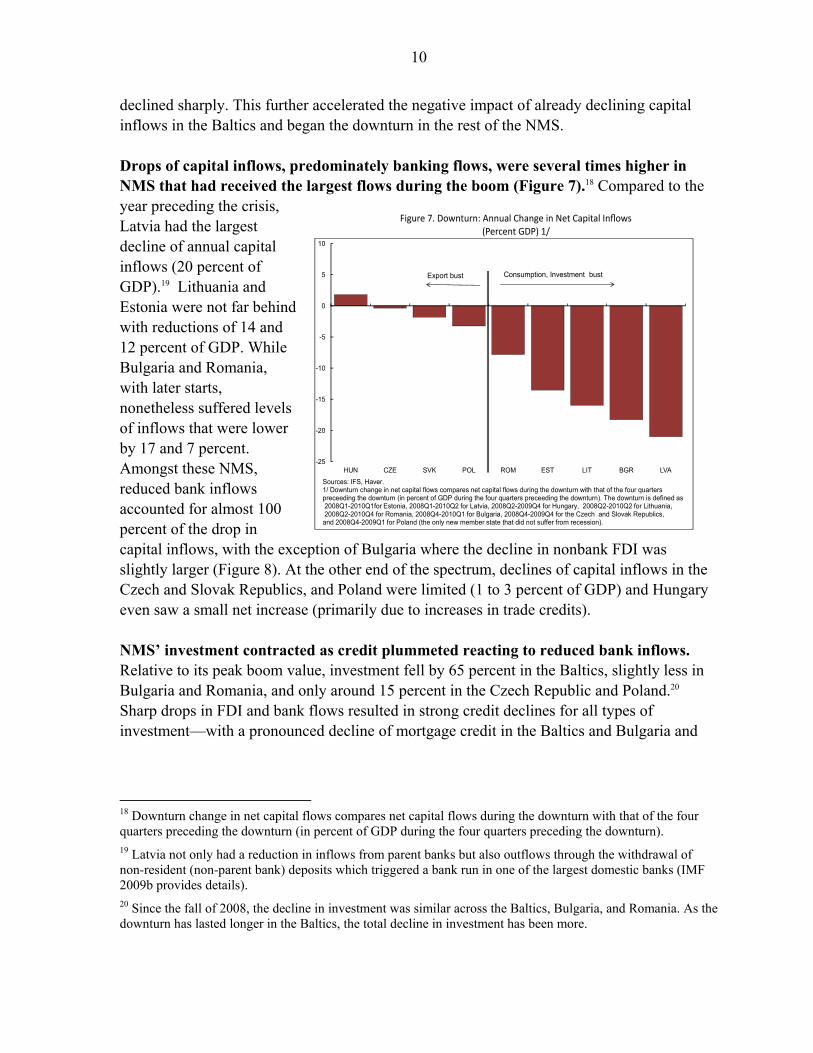
declined sharply. This further accelerated the negative impact of already declining capital inflows in the Baltics and began the downturn in the rest of the NMS. Drops of capital inflows, predominately banking flows, were several times higher in NMS that had received the largest flows during the boom (Figure 7).18 Compared to the year preceding the crisis, Latvia had the largest decline of annual capital inflows (20 percent of GDP).19 Lithuania and Estonia were not far behind with reductions of 14 and 12 percent of GDP. While Bulgaria and Romania, with later starts, nonetheless suffered levels of inflows that were lower by 17 and 7 percent. Amongst these NMS, reduced bank inflows accounted for almost 100 percent of the drop in capital inflows, with the exception of Bulgaria where the decline in nonbank FDI was slightly larger (Figure 8). At the other end of the spectrum, declines of capital inflows in the Czech and Slovak Republics, and Poland were limited (1 to 3 percent of GDP) and Hungary even saw a small net increase (primarily due to increases in trade credits). NMS’ investment contracted as credit plummeted reacting to reduced bank inflows. Relative to its peak boom value, investment fell by 65 percent in the Baltics, slightly less in Bulgaria and Romania, and only around 15 percent in the Czech Republic and Poland.20 Sharp drops in FDI and bank flows resulted in strong credit declines for all types of investment—with a pronounced decline of mortgage credit in the Baltics and Bulgaria and
18 Downturn change in net capital flows compares net capital flows during the downturn with that of the four quarters preceding the downturn (in percent of GDP during the four quarters preceding the downturn). 19 Latvia not only had a reduction in inflows from parent banks but also outflows through the withdrawal of non-resident (non-parent bank) deposits which triggered a bank run in one of the largest domestic banks (IMF 2009b provides details). 20 Since the fall of 2008, the decline in investment was similar across the Baltics, Bulgaria, and Romania. As the downturn has lasted longer in the Baltics, the total decline in investment has been more.
Figure 7. Downturn: Annual Change in Net Capital Inflows(Percent GDP) 1/
-25
-20
-15
-10
-5
0
5
10
HUN CZE SVK POL ROM EST LIT BGR LVA
Sources: IFS, Haver.1/ Downturn change in net capital flows compares net capital flows during the downturn with that of the four quarters preceeding the downturn (in percent of GDP during the four quarters preceeding the downturn). The downturn is defined as2008Q1-2010Q1for Estonia, 2008Q1-2010Q2 for Latvia, 2008Q2-2009Q4 for Hungary, 2008Q2-2010Q2 for Lithuania, 2008Q2-2010Q4 for Romania, 2008Q4-2010Q1 for Bulgaria, 2008Q4-2009Q4 for the Czech and Slovak Republics, and 2008Q4-2009Q1 for Poland (the only new member state that did not suffer from recession).
Consumption, Investment bustExport bust

11
consumer credit declines in Romania (Figure 8).21 Meanwhile, in all NMS—including those whose banks were not dependent on capital inflows—as economies contracted, higher perceived risks of default and lower banking sector deposits further reduced credit supply, while the worsened economic conditions of consumers and investors lowered credit demand. Credit flows for all types of investment fell by 75 to 110 percent per annum in all NMS except Poland (25 percent, Figure 8).
21 All reductions of capital inflows and credit during the downturn are calculated in comparison with the year preceding the downturn. Consequently, although FDI for example remained positive during every quarter of the downturn in Bulgaria and Romania, the change in FDI is negative since the level of FDI during the downturn was lower relative to the previous year.
-30
-25
-20
-15
-10
-5
0
5
10
15
HUN CZE SVK POL ROM EST LIT BGR LVA
Downturn: Change in Net Capital Inflows(Percent GDP) 1/
FDI, nonbank
FDI, bank
Banks
Other
Export bust
-115
-95
-75
-55
-35
-15
5
25
HUN CZE SVK POL ROM EST LIT BGR LVA
Downturn: Annual Change in Credit Flows(Percent) 1/ 2/
Export bust
Figure 8. Downturn: Capital flows and credit
Sources:IFS, Haver, authorities.1/ Downturn change in net capital flows compares net capital flows during the downturn with that of the four quarters preceeding the downturn (in percent of GDP during the four quarters preceeding the downturn). The downturn is defined as 2008Q1-2010Q1for Estonia, 2008Q1-2010Q2 for Latvia, 2008Q2-2009Q4 for Hungary, 2008Q2-2010Q2 for Lithuania, 2008Q2-2010Q4 for Romania, 2008Q4-2010Q1 for Bulgaria, 2008Q4-2009Q4 for the Czech and Slovak Republics, and 2008Q4-2009Q1 for Poland (the only new member state that did not suffer from recession). 2/ Measured as annual downturn credit flows less flows in the four quarters preceeding the downturn.3/ Includes construction and other activities.4/ FDI excludes financial intermediation FDI - largely foreign equity investment in banks.
-25
-20
-15
-10
-5
0
5
10
POL SVK CZE HUN LIT ROM EST LVA BGR
Change in investment flows: Real estate and consumption
(Percent GDP) 1/ 3/ 4/
Mortgage
Consumercredit
Nonfinancialcorporation
credit
FDI
-25
-20
-15
-10
-5
0
5
10
POL SVK CZE HUN LIT ROM EST LVA BGR
Change in investment flows:Corporations, non-real estate
(Percent GDP) 1/ 2/ 4/
FDI
Credit
Consumption,Investment bust
12
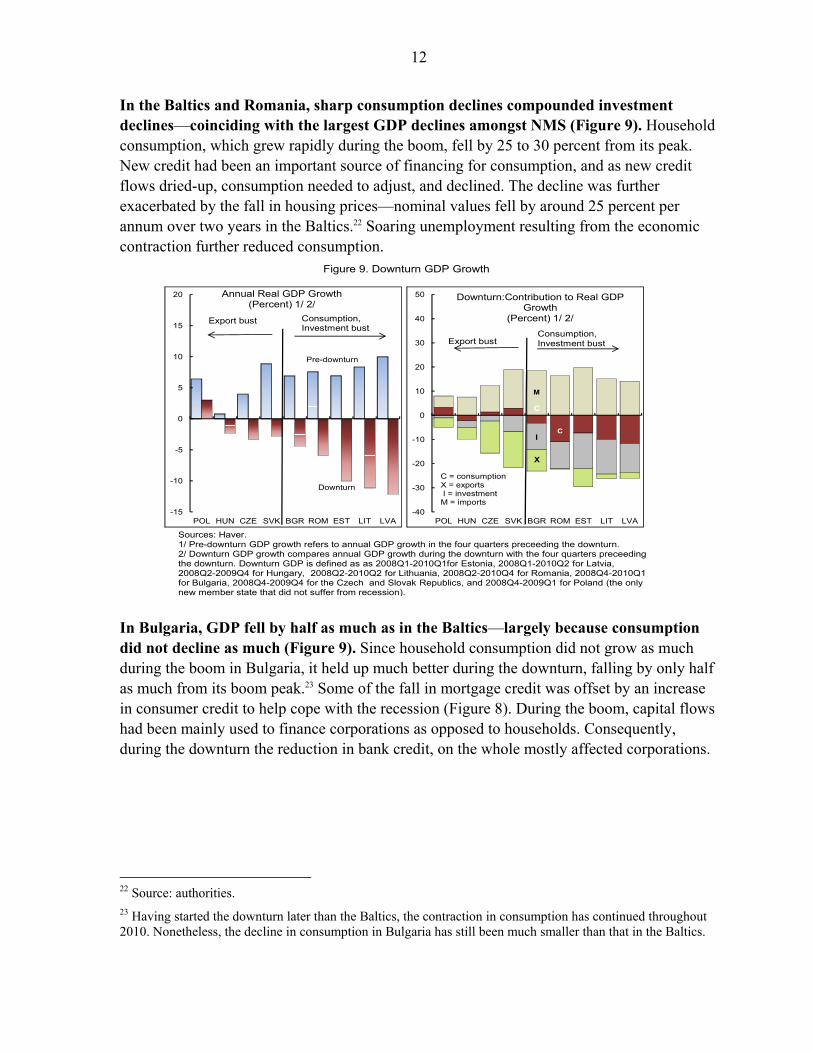
In the Baltics and Romania, sharp consumption declines compounded investment declines—coinciding with the largest GDP declines amongst NMS (Figure 9). Household consumption, which grew rapidly during the boom, fell by 25 to 30 percent from its peak. New credit had been an important source of financing for consumption, and as new credit flows dried-up, consumption needed to adjust, and declined. The decline was further exacerbated by the fall in housing prices—nominal values fell by around 25 percent per annum over two years in the Baltics.22 Soaring unemployment resulting from the economic contraction further reduced consumption.
In Bulgaria, GDP fell by half as much as in the Baltics—largely because consumption did not decline as much (Figure 9). Since household consumption did not grow as much during the boom in Bulgaria, it held up much better during the downturn, falling by only half as much from its boom peak.23 Some of the fall in mortgage credit was offset by an increase in consumer credit to help cope with the recession (Figure 8). During the boom, capital flows had been mainly used to finance corporations as opposed to households. Consequently, during the downturn the reduction in bank credit, on the whole mostly affected corporations.
22 Source: authorities. 23 Having started the downturn later than the Baltics, the contraction in consumption has continued throughout 2010. Nonetheless, the decline in consumption in Bulgaria has still been much smaller than that in the Baltics.
Sources: Haver. 1/ Pre-downturn GDP growth refers to annual GDP growth in the four quarters preceeding the downturn. 2/ Downturn GDP growth compares annual GDP growth during the downturn with the four quarters preceeding the downturn. Downturn GDP is defined as as 2008Q1-2010Q1for Estonia, 2008Q1-2010Q2 for Latvia, 2008Q2-2009Q4 for Hungary, 2008Q2-2010Q2 for Lithuania, 2008Q2-2010Q4 for Romania, 2008Q4-2010Q1 for Bulgaria, 2008Q4-2009Q4 for the Czech and Slovak Republics, and 2008Q4-2009Q1 for Poland (the only new member state that did not suffer from recession).
-15
-10
-5
0
5
10
15
20
POL HUN CZE SVK BGR ROM EST LIT LVA
Annual Real GDP Growth (Percent) 1/ 2/
Downturn
Pre-downturn
Export bust
-40
-30
-20
-10
0
10
20
30
40
50
POL HUN CZE SVK BGR ROM EST LIT LVA
Downturn:Contribution to Real GDP Growth
(Percent) 1/ 2/
C = consumptionX = exportsI = investmentM = imports
M
C
I
X
C
Export bustConsumption, Investment bust
Consumption, Investment bust
Figure 9. Downturn GDP Growth
13
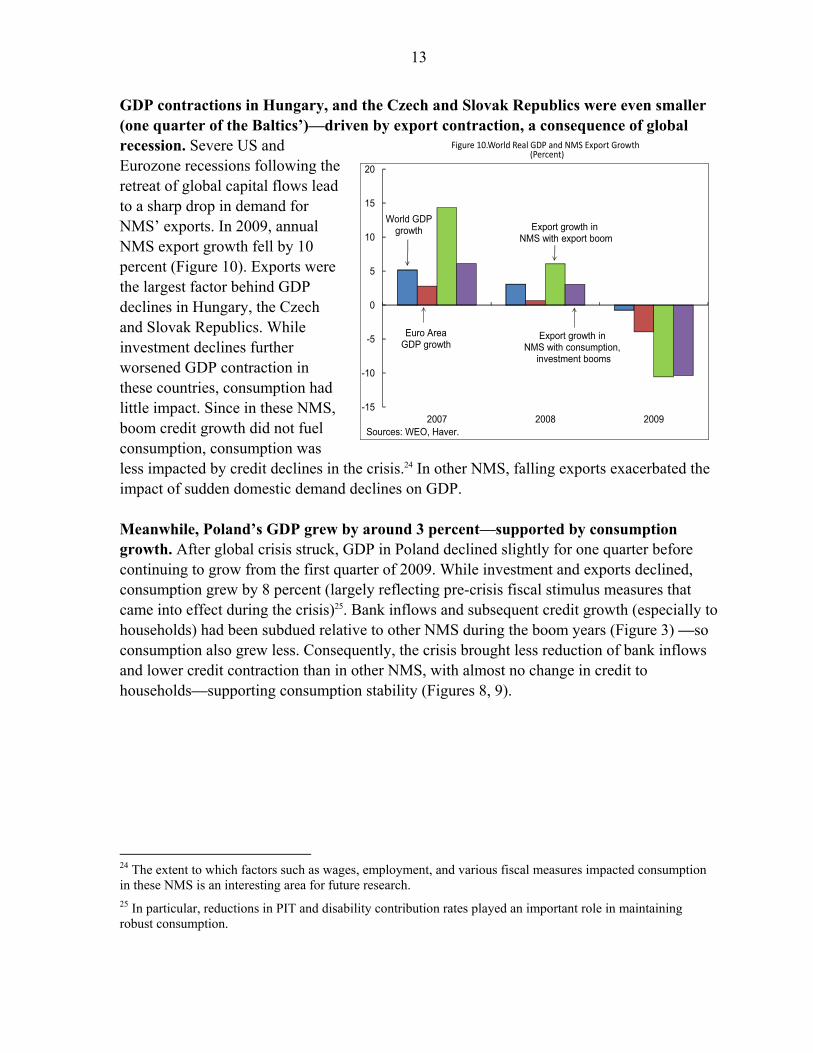
GDP contractions in Hungary, and the Czech and Slovak Republics were even smaller (one quarter of the Baltics’)—driven by export contraction, a consequence of global recession. Severe US and Eurozone recessions following the retreat of global capital flows lead to a sharp drop in demand for NMS’ exports. In 2009, annual NMS export growth fell by 10 percent (Figure 10). Exports were the largest factor behind GDP declines in Hungary, the Czech and Slovak Republics. While investment declines further worsened GDP contraction in these countries, consumption had little impact. Since in these NMS, boom credit growth did not fuel consumption, consumption was less impacted by credit declines in the crisis.24 In other NMS, falling exports exacerbated the impact of sudden domestic demand declines on GDP. Meanwhile, Poland’s GDP grew by around 3 percent—supported by consumption growth. After global crisis struck, GDP in Poland declined slightly for one quarter before continuing to grow from the first quarter of 2009. While investment and exports declined, consumption grew by 8 percent (largely reflecting pre-crisis fiscal stimulus measures that came into effect during the crisis)25. Bank inflows and subsequent credit growth (especially to households) had been subdued relative to other NMS during the boom years (Figure 3) —so consumption also grew less. Consequently, the crisis brought less reduction of bank inflows and lower credit contraction than in other NMS, with almost no change in credit to households—supporting consumption stability (Figures 8, 9).
24 The extent to which factors such as wages, employment, and various fiscal measures impacted consumption in these NMS is an interesting area for future research. 25 In particular, reductions in PIT and disability contribution rates played an important role in maintaining robust consumption.
Figure 10.World Real GDP and NMS Export Growth (Percent)
-15
-10
-5
0
5
10
15
20
2007 2008 2009Sources: WEO, Haver.
World GDPgrowth
Euro AreaGDP growth
Export growth in NMS with export boom
Export growth in NMS with consumption,
investment booms

14
Did Policies Matter?
NMS with fiscal buffers saw smaller deteriorations in their headline fiscal balances— easing fiscal consolidation pressures for 2010. Large declines in consumption, business activity and profitability, and compliance during the downturn meant substantially lower government revenues in all NMS.26 Given the severity of the crisis, expenditures could not be cut in line with revenues and subsequently fiscal balances deteriorated sharply.27 At one extreme, the fiscal balance of Latvia deteriorated by 8 pps during the crisis–resulting in the highest headline deficit of all NMS (Figure 11) 28. All other NMS (except Hungary) met with deteriorations of 3 to 6 pps of their fiscal balances. Among fixed exchange rate NMS—larger international reserves contained risk premiums and interest rates, preventing a worsening of the downturn. Lending rates in Latvia peaked at over 30 percent in 2009—rising 20 percentage points above its average pre-crisis value. On the other hand, in Bulgaria lending rates rose less than one percentage point from its pre-crisis value. The lower interest rates in Bulgaria reflect lower risk premiums.29 CDS spreads in Bulgaria remained within 660 basis points, while in Latvia they rose to 1100 basis points (Figure 12). The differential in risk premiums reflects to a large extent concerns about the sustainability of the fixed exchange rate regime in Latvia— which is one of the 26 Sancak et al. (2010) elaborates on the impact of consumption and compliance declines on tax revenues in the Baltics. 27 Hungary, Poland and the Slovak Republic had the lowest declines in revenue growth amongst NMS. With high debt to GDP ratios, Hungary contracted public expenditures and improved the deficit in order to maintain investor confidence. Poland and the Slovak Republic allowed real expenditures to grow during the crisis, worsening their fiscal balances. 28 This section intends to portray a qualitative story. As such, exact numerical comparisons across fiscal balances should not be made using this data as the fiscal balance is reported as a cash balance for Bulgaria and Latvia and an accrual balance for the others. 29 Risk premiums, measured as CDS spreads are typically an additive factor for the parent banks’ setting of interest rates charged to their foreign subsidiaries in NMS.
Sources: WEO.1/ The boom period is represented as 2003-07 for all except Bulgaria, Czech and Slovak Republics, and Poland, where the boom is represented by 2004-08 - the boom continued into 2008Q3 for these countries.2/ Changes in downturn fiscal balance compares annual averages during the downturn with that during the boom. The downturn is represented as 2008-10 for all except Bulgaria, Czech and Slovak Republics, and Poland, where the downturn is represented as 2009-10.
-8
-7
-6
-5
-4
-3
-2
-1
0
1
2
3
4
BGR EST LVA LIT CZE SVK ROM POL HUN
Boom: Average Annual Fiscal Balance (Percent GDP) 1/
-10
-9
-8
-7
-6
-5
-4
-3
-2
-1
0
1
2
3
4
5
6
EST BGR HUN CZE ROM LIT POL SVK LVA
Downturn: Average Annual Fiscal Balance, Changes and Levels
(Percent GDP) 2/
Fiscal Balance(Percent GDP)
Change in Fiscal Balance(Percentage Points)
Figure 11. Fiscal balances
15
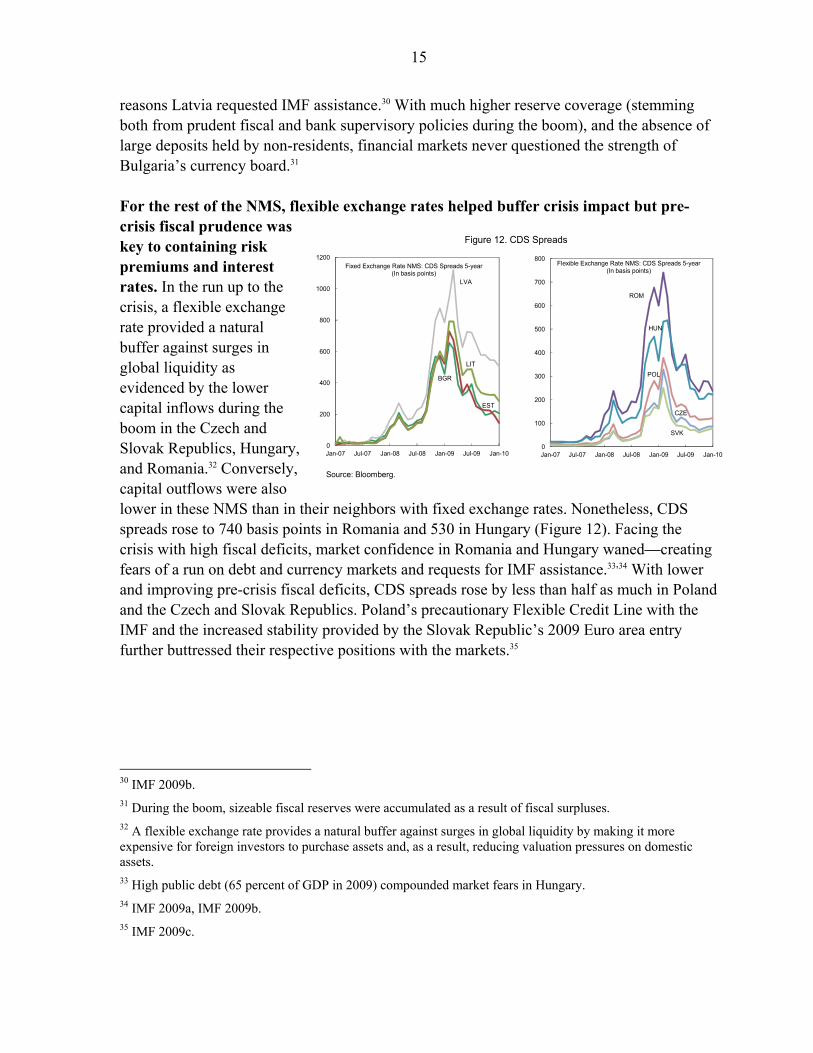
reasons Latvia requested IMF assistance.30 With much higher reserve coverage (stemming both from prudent fiscal and bank supervisory policies during the boom), and the absence of large deposits held by non-residents, financial markets never questioned the strength of Bulgaria’s currency board.31 For the rest of the NMS, flexible exchange rates helped buffer crisis impact but pre-crisis fiscal prudence was key to containing risk premiums and interest rates. In the run up to the crisis, a flexible exchange rate provided a natural buffer against surges in global liquidity as evidenced by the lower capital inflows during the boom in the Czech and Slovak Republics, Hungary, and Romania.32 Conversely, capital outflows were also lower in these NMS than in their neighbors with fixed exchange rates. Nonetheless, CDS spreads rose to 740 basis points in Romania and 530 in Hungary (Figure 12). Facing the crisis with high fiscal deficits, market confidence in Romania and Hungary waned—creating fears of a run on debt and currency markets and requests for IMF assistance.33,34 With lower and improving pre-crisis fiscal deficits, CDS spreads rose by less than half as much in Poland and the Czech and Slovak Republics. Poland’s precautionary Flexible Credit Line with the IMF and the increased stability provided by the Slovak Republic’s 2009 Euro area entry further buttressed their respective positions with the markets.35
30 IMF 2009b. 31 During the boom, sizeable fiscal reserves were accumulated as a result of fiscal surpluses. 32 A flexible exchange rate provides a natural buffer against surges in global liquidity by making it more expensive for foreign investors to purchase assets and, as a result, reducing valuation pressures on domestic assets. 33 High public debt (65 percent of GDP in 2009) compounded market fears in Hungary. 34 IMF 2009a, IMF 2009b. 35 IMF 2009c.
Figure 12. CDS Spreads
Source: Bloomberg.
BGR
LVA
EST
LIT
0
200
400
600
800
1000
1200
Jan-07 Jul-07 Jan-08 Jul-08 Jan-09 Jul-09 Jan-10
Fixed Exchange Rate NMS: CDS Spreads 5-year(In basis points)
ROM
HUN
CZE
POL
SVK
0
100
200
300
400
500
600
700
800
Jan-07 Jul-07 Jan-08 Jul-08 Jan-09 Jul-09 Jan-10
Flexible Exchange Rate NMS: CDS Spreads 5-year(In basis points)

16
III. EMPIRICAL ANALYSIS: DOES IT MATTER WHICH SECTORS FOREIGN CAPITAL FLOWS INTO?
The role of economic sectors has thus far received little attention in empirical growth and finance literature. The positive influence of financial development (often measured as a function of the stock of credit) on GDP is summarized in Levine (2005) and Khan and Senhadji (2003). In recent years, the literature has graduated to focusing on the impact of credit flows (as opposed to stocks) on GDP. Cappiello et al. (2010) find a non-negligible positive relationship between growth in credit flows and GDP growth for the Euro area, in contrast to Driscoll (2004) finding less such evidence for the United States. Since Borensztein et al. (1998), many studies have also found a positive relationship between FDI and growth, as summarized in Ozturk (2007), again to varying degrees. This study adds to the literature by examining the importance of the sectors into which bank credit and FDI flow. Capital inflows impact GDP by flowing to economic sectors that affect consumption, investment, exports, and imports (Figure 13). The presumption is that capital inflows are channeled to: Households through banks who provide both mortgages and consumer credit to
households, boosting consumption and in turn GDP.36 Investment may also be positively impacted by these flows—for example, when the stock of housing is increased to meet increased housing demand.
Corporate real estate, via bank credit and FDI, supporting investment. For instance, corporations building vacations homes targeted at foreigners have a direct effect on investment but not consumption.
Corporate sectors outside real estate, both through bank credit and FDI, boosting investment. Exports also benefit when capital inflows support investment in export-producing industries.
Some of the positive impact of capital inflows to GDP is leaked out through imports reflecting inputs needed for investment and to produce exports. During the recent boom in NMS, higher consumption also fueled imports as consumers’ incomes rose leading to demand for imported luxury goods.
36 Capital inflows to banks may be in the form of FDI, loans or deposits by foreigners (often parent banks) to domestic banks.

17
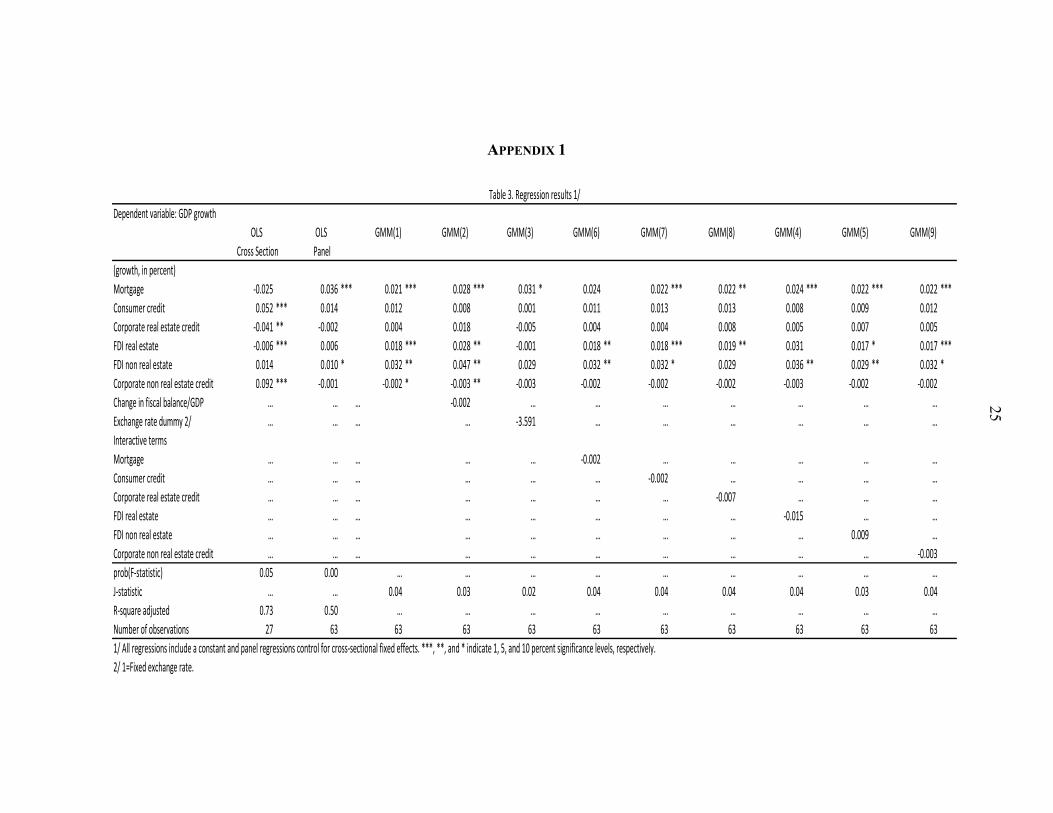
Empirical estimates of the extent to which economic sectors supported by capital inflows impact GDP are described in this section. An initial examination of the data shows that GDP growth is positively correlated with growth in the flow of mortgages, consumer credit, corporate real estate credit, real estate FDI, non-real estate FDI, and corporate non-real estate credit during both booms and busts (Figure 14). The degree to which variations in GDP growth are affected by each of these areas is first estimated through ordinary least squares (OLS) regressions on a cross section of pre-boom (2003–4), boom (2005–7), and crisis periods for the nine NMS.37 However, these estimates suffer from small sample bias. Thus an OLS panel (with fixed effects) on annual data (2003–9) for the nine NMS is estimated. Since the RHS variables (especially growth in credit flows) may be impacted by GDP growth, instrumental variables and generalized method of moments (GMM) estimation is applied to solve any problems of endogeneity, using lagged independent variables as instruments.38 The influences of fiscal and exchange rate policy are also tested. All data has been collected from central banks, ministries of finance, national statistical institutes, and the IMF’s International Financial Statistics. The results are summarized in Table 2 and Appendix 1.39
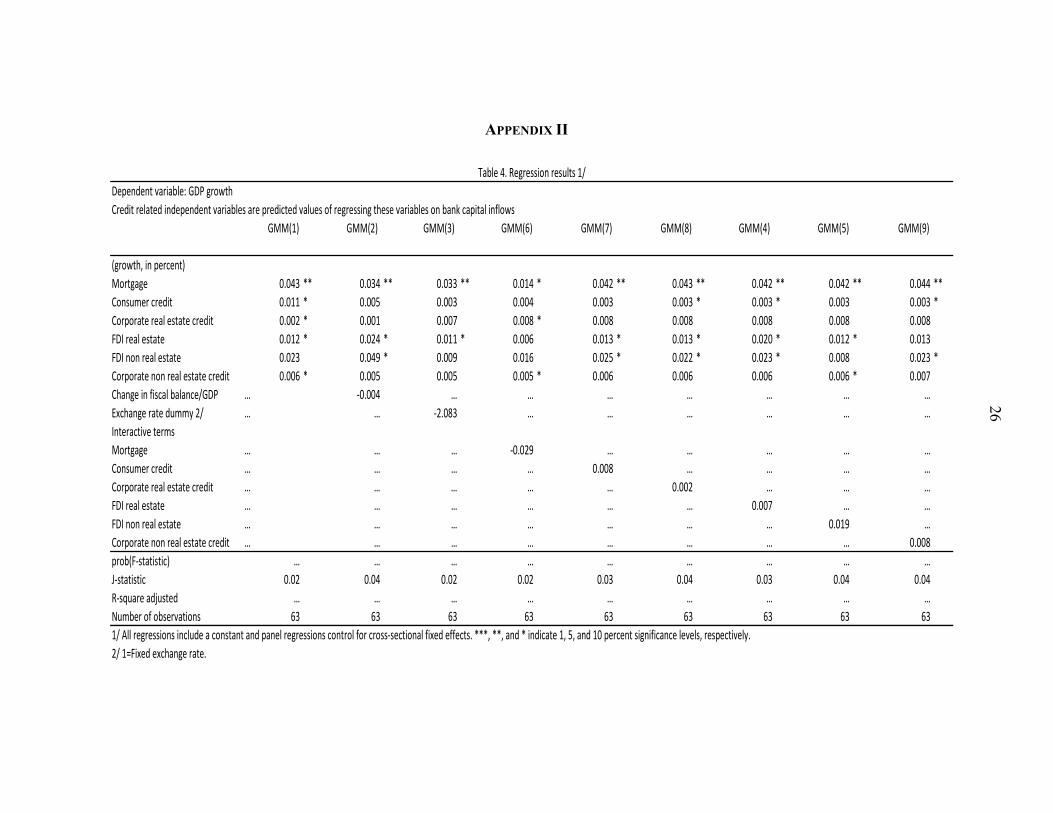
37 Each of the nine NMS then has three observation sets (pre-boom, boom, and crisis), for a total of 27 observations in the regression. Crisis is defined as 2008Q1-2010Q1for Estonia, 2008Q1-2010Q2 for Latvia, 2008Q2-2009Q4 for Hungary, 2008Q2-2010Q2 for Lithuania and Romania, 2008Q4-2010Q1 for Bulgaria, 2008Q4-2009Q4 for the Czech and Slovak Republics, and 2008Q4-2009Q1 for Poland (the only new member state that did not suffer from recession). There may be a bias in the crisis period since the recession is still running its course in some NMS. 38 Granger causality tests found some causality of GDP on credit but none for FDI. The implied endogeneity is addressed with instrumental variables. The coefficients from estimates of regressions of GDP growth on the lagged RHS variables were not significant and thus they were deemed appropriate as instruments. 39 Although bank credit was largely funded by capital inflows in most NMS, a portion of credit was also funded from domestic deposits and interbank markets. As this may be creating a bias in the results, a robustness check applying the predicted values of credit variables regressed on bank flows as a proxy for the actual credit variables themselves supported the results above (see Appendix 2). However, the broader set of results reported in Table 2 and Appendix 1 capture also the important indirect effects of large capital inflows influencing incomes and thus deposits, which in turn supported further loan growth.
Figure 13. How capital inflows impact GDP
Banks
FDI
Foreign funding
New Loans
Mortgages
Consumer Loans
Corporations
CI
NX
FDI
Other
CorporationsCI
NX

18
Growth in mortgage credit flows has a significant positive relationship with GDP growth. The OLS panel estimate implies that for a 10 percentage point (pps) increase in the flow of mortgage credit, GDP growth will increase by 0.36 pps. The size of the GMM estimates is similar, with a 10 pps increase in mortgage credit flows corresponding to a 0.21–0.31 pps increase in GDP growth. The result supports the hypothesis that mortgage credit
Figure 14. GDP growth, credit and FDI flow growth during recent boom-bust episodes across the nine NMS (in percent)
Source: Haver, IFS, authorities.
-20.0
-15.0
-10.0
-5.0
0.0
5.0
10.0
15.0
-1000 0 1000 2000 3000 4000
GD
P
FDI Real Estate
GDP vs Real estate FDI
-20.0
-15.0
-10.0
-5.0
0.0
5.0
10.0
15.0
-200 0 200 400 600 800
GD
P
FDI Non-Real Estate
GDP vs Non-real estate FDI
-20.0
-15.0
-10.0
-5.0
0.0
5.0
10.0
15.0
20.0
-200 0 200 400 600
GD
P
Mortgage
GDP vs Mortgage credit
-20.0
-15.0
-10.0
-5.0
0.0
5.0
10.0
15.0
-200 0 200 400 600 800
GD
P
Consumer credit
GDP vs Consumer credit
-20.0
-15.0
-10.0
-5.0
0.0
5.0
10.0
15.0
20.0
-200 0 200 400 600 800 1000
GD
P
Corporate real estate credit
GDP vs Corporate real estate credit
-20.0
-15.0
-10.0
-5.0
0.0
5.0
10.0
15.0
20.0
-300 -200 -100 0 100 200 300 400 500
GD
P
Corporate non-real estate credit
GDP vs Corporate non-real estate credit

19
flows boost household consumption and thus growth.40 Under the cross section OLS, the estimated coefficient for growth in the flow of mortgage credit is negative but not significant.
GDP and real estate FDI flow growth also have a significant positive relationship. GDP growth increases by 0.17–0.28 pps under GMM estimates in relation to a 10 pps increase in real estate FDI flows. The panel OLS estimate is not significant but of the correct sign. Meanwhile, the weaker cross-section OLS method has a negative and significant relationship. GDP growth is positively correlated with FDI flows into sectors unrelated to real estate. Regressions applying both panel OLS and GMM methodologies on annual data confirm this. For a 10 pps increase in non-real estate FDI flows, the corresponding GDP growth increase ranges from 0.10 pps under the panel OLS and 0.32–0.47 pps under GMM estimates. The strength of this relationship may reflect (i) FDI flows in tradables that boosted export growth and/or (ii) that a sizeable proportion of FDI flows in NMS was invested in nontradables that flourished from the consumption boom, such as restaurants, hotels, and retail trade.41 The cross-section OLS, which suffers from small sample bias, is of a positive sign but not significant. However, the relationship between GDP and flows in corporate credit as well as consumer credit is not as robust. The panel OLS and GMM estimates mostly lack significance, although most of the estimates carry positive signs. Non-real estate corporate 40 Regressions of consumption growth on the RHS variables described above (see Appendix 3) find that consumption growth is strongly correlated to growth in mortgage flows (a 10 pps increase yields 0.71-0.96 pps rise in consumption growth), and to a lesser extent consumer credit flows (less than half the impact of mortgage flows). 41 Investment growth, more generally, appears to be most highly correlated with growth in both real estate and non-real estate FDI flows (a 10 pps increase of each corresponds to about a 1 ppt rise in investment growth), followed by growth in corporate real estate credit flows (having about a quarter to half as much impact as FDI flows), and growth in mortgage flows (about one tenth the impact of FDI). Appendix 3 provides details.
Table 2. Summary regression results: GDP vs. 10 pps growth in credit and FDI variables 1/Dependent variable: GDP growth
OLS OLS GMM(1)-(9) 2/Cross Section Panel
10 pps growth in…Mortgage -0.25 0.36 *** 0.21 to 0.31 ***Consumer credit 0.52 *** 0.14 0.01 to 0.13Corporate real estate credit -0.41 ** -0.02 -0.05 to 0.18FDI real estate -0.06 *** 0.06 0.17 to 0.28 ***FDI non real estate 0.14 0.10 * 0.32 to 0.47 **Corporate non real estate credit 0.92 *** -0.01 -0.03 to -0.02 *1/ All panel regressions include a constant and panel regressions control for cross-sectional fixed effects. ***, **, and * indicate 1, 5, and 10 percent significance levels, respectively.2/ The range of GMM coefficients summarizes the results for the nine sets of GMM regressions in Table 3, Appendix 1.

20
credit flows are barely significant (at the 10 percent level) under the GMM estimate indicating a decline in GDP growth by 0.03 pps for a 10 pps increase in non-real estate corporate credit flows. The results vary in the weaker cross-section OLS method where a 10 pps increase in (i) non-real estate corporate credit flows implies a significant 0.92 pps increase in GDP growth (ii) consumer credit flows correlate to a 0.52 percent increase in GDP growth, and (ii) corporate real estate credit flows correspond to a 0.41 pps decline in GDP growth. Taking the regression evidence all together it appears that capital inflows into real estate have the strongest correlation with GDP. Adding together the mid-points of the ranges of GMM estimates for growth in mortgage flows and real estate FDI flows, a 10 pps increase in each would together correspond to a 0.49 pps increase in GDP growth. In comparison, the non-real estate sector has less of an impact. GDP growth only increases by 0.37 pps for a 10 pps increase in growth in each of FDI flows and corporate credit flows in non-real estate sectors, again applying the mid-points of GMM estimates. Turning to the policy control parameters, fiscal policy did not have a significant impact on growth during the recent boom-bust episodes. The change in fiscal balance over GDP was added as a RHS variable in the GMM estimation. Although stylized facts indicate that strong fiscal policy during the boom years helped provide a buffer for the crisis, the regression results indicate that fiscal policy did not have a significant direct impact on GDP growth and therefore did not appear to add in a significant manner to the overheating pressures experienced during the boom. The exchange rate neither has a significant impact on GDP growth nor does it enhance the effect of credit flows or FDI flows in a particular sector on GDP. The GMM estimates were supplemented with a dummy for fixed exchange rate regimes, which lacks significance and is slightly negative.42 The hypothesis that fixed exchange rate regimes may enhance the impact of capital inflows going into a particular sector was also tested through interactive terms in the GMM regression. The coefficients are not significant and mostly near zero.
42 This result for NMS is in line with the broader finding that the exchange rate regime in emerging market countries is uncorrelated with output fluctuations during crisis (IMF World Economic Outlook, April 2010).

21
IV. CONCLUSION
Capital inflows into real estate appear to have a greater impact on surges and collapses of GDP than other sectors. During the past seven years NMS’ GDP appears to have responded strongly to large fluctuations of capital inflows. While most of these inflows went to FDI or banks fueling credit growth, this paper emphasizes that it is the destination, not the form of capital inflow, that most influences GDP growth. The empirical analysis suggests that inflows that were targeted at the real estate sector (in particular via mortgage flows and real estate related FDI flows) have the most sizeable impact on GDP growth, outweighing the impact on growth of inflows that were destined to non-real estate related activities. However, non-real estate FDI flows have the largest impact of any single variable. This may reflect either or both FDI flows in nontradables such as restaurants, hotels, and retail trade that follow consumption booms and busts or FDI flows in tradables. As new waves of capital inflows spread to emerging markets, attention to policies that support flows towards productive, growth-sustaining sectors may be useful. The lessons learnt from the recent boom and bust cycle in NMS can be applied to other emerging markets receiving large capital inflows. Although the empirical evidence in this paper shows that in the face of large capital inflows fiscal policies have little direct impact on GDP growth, strong fiscal and financial sector buffers were key to softening the blow experienced during crisis and maintaining exchange rate stability. To minimize sharp swings in GDP growth and ensure a more sustainable growth path, it may be beneficial to focus policies in areas (such as infrastructure and education) that improve the attractiveness of tradables for capital inflows. Strengthening financial sector supervision and corporate governance in emerging market economies could also help this process. Finally, there are many avenues for future research. The role of sub-sectors within the real estate and non-real estate sectors could be further explored. For instance, within the non-real estate sector, the impact on GDP growth of tradables and non-tradables could be differentiated. The estimations may also be refined with other instruments. An extension of the analysis to crisis episodes in other emerging markets is likely to bolster the results.
22
BIBLIOGRAPHY
Allen, Mark C., Christoph B. Rosenberg, Christian Keller, Brad Setser, and Nouriel Roubini, 2002, “A Balance Sheet Approach to Financial Crisis,” Working Paper No. 02/210 (Washington: International Monetary Fund).
Bakker, Bas B., and Anne-Marie Gulde, 2010, “The Credit Boom in the EU New Member
States: Bad Luck or Bad Policies?” Working Paper No. 10/130 (Washington: International Monetary Fund).
Benito, Andrew, and Haroon Mumtaz, 2009. "Excess Sensitivity, Liquidity Constraints, and
The Collateral Role Of Housing," Macroeconomic Dynamics, Cambridge University Press, Vol. 13(03), pp. 305–26, June.
Borensztein, Eduardo, Jose De Gregorio, and Jong-Wha Lee, 1998. “How Does FDI Affect Economic Growth?” Journal of International Economics, Vol. 45(1), pp. 115–35. Burstein, Ariel, and Christopher Kurz, and Linda Tesar, 2008, "Trade, Production Sharing,
and the International Transmission of Business Cycles," Journal of Monetary Economics, Elsevier, Vol. 55(4), pp. 775–95, May.
Campbell, John Y. & Joao F. Cocco, 2007. "How do House Prices Affect Consumption? Evidence from Micro Data," Journal of Monetary Economics, Elsevier, Vol. 54(3), pp. 591–621, April. Cappiello, Lorenzo, Arjan Kadareja, Christoffer Kok Sorensen, and Marco Protopapa, 2010.
“Do Bank Loans and Credit Standards have an Effect on Output? A Panel Approach for the Euro Area,” ECB Working Paper No. 1150 (Frankfurt: European Central Bank).
Cerra, Valerie and Sweta C. Saxena, 2008. "Growth Dynamics: The Myth of Economic Recovery," American Economic Review, Vol. 98(1), pp. 439–57, March. Driscoll, John. C, 2004.”Does Bank Lending Affect Output? Evidence from the U.S. States Journal of Monetary Economics, Vol. 51(3), pp. 451–71. Dullien, Sebastian, 2010, “Productive Integration in the European Union: A German
Perspective,” Agência Brasileira de Desenvolvimento Industrial, pp. 156–219, Brasilia.
Haiss, Peter, and Bernhard Mahlberg and Mike Molling, 2009, “The Automotive Industry in
23
Central and Eastern Europe–Engine of Grow or Free Rider?” 2009 Oxford Business and Economics Conference (OBEC), June 24–26, Oxford University, United Kingdom.
International Monetary Fund, 2010a, Regional Economic Outlook: Europe, (Washington: October 2010). International Monetary Fund, 2010b, World Economic Outlook (Washington: April 2010).
International Monetary Fund, 2008, Country Report No. 08/313, Washington.
International Monetary Fund, 2009a, Country Report No. 09/183, Washington. International Monetary Fund, 2009b, Country Report No. 09/3, Washington.
International Monetary Fund, 2009c, Country Report No. 09/138, Washington. Khan, Moshin and Abdelhak S. Senhadji, 2003, “Financial Development and Economic
Growth: A Review and New Evidence,” Journal of African Economies, Vol. 12(2), pp.89–110.
Lane, Philip R., and Gian Maria Milesi-Ferretti, 2010, “The Cross Country Incidence of the
Global Crisis,” Discussion Paper Series No.7954, Center for Economic Policy Research, London.
Levine, Ross, 2005, “Finance and Growth: Theory and Evidence,” in Philippe Aghion and
Steven Durlauf, eds. Handbook of Economic Growth. (The Netherlands: Elsevier Science).
Martin, Philippe and Ann Rogers, 2000, “Long-term Growth and Short-term Economic Instability,” European Economic Review, Vol. 44, pp. 359–81. Rodrik, Dani and Andres Velasco, 1999, "Short-Term Capital Flows," NBER Working Papers No. 7364 (Boston, Massachusetts: National Bureau of Economic Research). Ozturk, Ilhan, 2007, “Foreign Direct Investment—Growth Nexus: A Review of the Recent
Literature,” International Journal of Applied Econometrics and Quantitative Studies, Vol.42.
Purfield, Catriona, and Christoph B. Rosenberg, 2010, “Adjustment Under a Currency Peg:
Estonia, Latvia, Lithuania during the Global Financial Crisis 2008–09,” IMF Working Paper No. 10/213 (Washington: International Monetary Fund).
Rose, Andrew, and Mark Speigel, 2009, “The Causes and Consequences of the 2008 Crisis:
24
Early Warning,” Global Journal of Economics, forthcoming. Ramey, Garey, and Valerie A. Ramey, 1995, “Cross-Country Evidence on the Link Between Volatility and Growth, American Economic Review, Vol. 85, pp. 1138–59. Sancak, Cemile, Ricardo Velloso, and Jing Xing, 2010, “Tax Revenue Response to the
Business Cycle,” IMF Working Paper No. 10/71 (Washington: International Monetary Fund).
Vandenbussche, Jerome, 2010, “Recent Evolution and Soundness of the Bulgarian Banking Sector,” IMF Country Report No. 10/159, pp.44–65.
25
APPENDIX 1
Table 3. Regression results 1/
Dependent variable: GDP growth
OLS OLS GMM(1) GMM(2) GMM(3) GMM(6) GMM(7) GMM(8) GMM(4) GMM(5) GMM(9)
Cross Section Panel
(growth, in percent)
Mortgage -0.025 0.036 *** 0.021 *** 0.028 *** 0.031 * 0.024 0.022 *** 0.022 ** 0.024 *** 0.022 *** 0.022 ***
Consumer credit 0.052 *** 0.014 0.012 0.008 0.001 0.011 0.013 0.013 0.008 0.009 0.012
Corporate real estate credit -0.041 ** -0.002 0.004 0.018 -0.005 0.004 0.004 0.008 0.005 0.007 0.005
FDI real estate -0.006 *** 0.006 0.018 *** 0.028 ** -0.001 0.018 ** 0.018 *** 0.019 ** 0.031 0.017 * 0.017 ***
FDI non real estate 0.014 0.010 * 0.032 ** 0.047 ** 0.029 0.032 ** 0.032 * 0.029 0.036 ** 0.029 ** 0.032 *
Corporate non real estate credit 0.092 *** -0.001 -0.002 * -0.003 ** -0.003 -0.002 -0.002 -0.002 -0.003 -0.002 -0.002
Change in fiscal balance/GDP … … … -0.002 … … … … … … …
Exchange rate dummy 2/ … … … … -3.591 … … … … … …
Interactive terms
Mortgage … … … … … -0.002 … … … … …
Consumer credit … … … … … … -0.002 … … … …
Corporate real estate credit … … … … … … … -0.007 … … …
FDI real estate … … … … … … … … -0.015 … …
FDI non real estate … … … … … … … … … 0.009 …
Corporate non real estate credit … … … … … … … … … … -0.003
prob(F-statistic) 0.05 0.00 … … … … … … … … …
J-statistic … … 0.04 0.03 0.02 0.04 0.04 0.04 0.04 0.03 0.04
R-square adjusted 0.73 0.50 … … … … … … … … …
Number of observations 27 63 63 63 63 63 63 63 63 63 63
1/ All regressions include a constant and panel regressions control for cross-sectional fixed effects. ***, **, and * indicate 1, 5, and 10 percent significance levels, respectively.
2/ 1=Fixed exchange rate.
26
APPENDIX II
Table 4. Regression results 1/
Dependent variable: GDP growth
Credit related independent variables are predicted values of regressing these variables on bank capital inflows
GMM(1) GMM(2) GMM(3) GMM(6) GMM(7) GMM(8) GMM(4) GMM(5) GMM(9)
(growth, in percent)
Mortgage 0.043 ** 0.034 ** 0.033 ** 0.014 * 0.042 ** 0.043 ** 0.042 ** 0.042 ** 0.044 **
Consumer credit 0.011 * 0.005 0.003 0.004 0.003 0.003 * 0.003 * 0.003 0.003 *
Corporate real estate credit 0.002 * 0.001 0.007 0.008 * 0.008 0.008 0.008 0.008 0.008
FDI real estate 0.012 * 0.024 * 0.011 * 0.006 0.013 * 0.013 * 0.020 * 0.012 * 0.013
FDI non real estate 0.023 0.049 * 0.009 0.016 0.025 * 0.022 * 0.023 * 0.008 0.023 *
Corporate non real estate credit 0.006 * 0.005 0.005 0.005 * 0.006 0.006 0.006 0.006 * 0.007
Change in fiscal balance/GDP … -0.004 … … … … … … …
Exchange rate dummy 2/ … … -2.083 … … … … … …
Interactive terms
Mortgage … … … -0.029 … … … … …
Consumer credit … … … … 0.008 … … … …
Corporate real estate credit … … … … … 0.002 … … …
FDI real estate … … … … … … 0.007 … …
FDI non real estate … … … … … … … 0.019 …
Corporate non real estate credit … … … … … … … … 0.008
prob(F-statistic) … … … … … … … … …
J-statistic 0.02 0.04 0.02 0.02 0.03 0.04 0.03 0.04 0.04
R-square adjusted … … … … … … … … …
Number of observations 63 63 63 63 63 63 63 63 63
1/ All regressions include a constant and panel regressions control for cross-sectional fixed effects. ***, **, and * indicate 1, 5, and 10 percent significance levels, respectively.
2/ 1=Fixed exchange rate.

27
Appendix III
Table 5. Regression results 1/
Dependent variable: Investment growth
GMM(1) GMM(2)
(growth, in percent)
Mortgage … 0.010 *
Consumer credit … 0.009
Corporate real estate credit 0.025 0.058 ***
FDI real estate 0.084 *** 0.101 ***
FDI non real estate 0.076 ** 0.100 ***
Corporate non real estate credit -0.005 -0.005
J-statistic 0.07 0.02
Number of observations 63 63
1/ All regressions include a constant and panel regressions control for cross-sectional fixed effects.
***, **, and * indicate 1, 5, and 10 percent significance levels, respectively.
Table 6. Regression results 1/
Dependent variable: Consumption growth
GMM(1) GMM(2) GMM(3)
(growth, in percent)
Mortgage 0.084 *** 0.096 ** 0.071 **
Consumer credit 0.040 * 0.036 * 0.015 *
Corporate real estate credit … -0.001 0.003
FDI real estate … … 0.005
FDI non real estate … … 0.007
Corporate non real estate credit … 0.000 0.001
J-statistic 0.00 0.00 0.01
Number of observations 63 63 63
1/ All regressions include a constant and panel regressions control for cross-sectional fixed effects.
***, **, and * indicate 1, 5, and 10 percent significance levels, respectively.