Embed Size (px)
Citation preview
Matching Renewable Energy Supply and Demand inGreen DatacentersI
Inigo Goiria, Md E. Haquea,∗, Kien Lea, Ryan Beaucheaa, Thu D. Nguyena,Jordi Guitartb, Jordi Torresb, Ricardo Bianchinia
aDepartment of Computer Science, Rutgers University, USAbUniversitat Politecnica de Catalunya and Barcelona Supercomputing Center, Spain
Abstract
In this paper, we propose GreenSlot, a scheduler for parallel batch jobs in a data-center powered by a photovoltaic solar array and the electrical grid (as a backup).GreenSlot predicts the amount of solar energy that will be available in the near fu-ture, and schedules the workload to maximize the green energy consumption whilemeeting the jobs’ deadlines. If grid energy must be used to avoid deadline viola-tions, the scheduler selects times when it is cheap. Our results for both scientificcomputing workloads and data processing workloads demonstrate that GreenSlotcan increase solar energy consumption by up to 117% and decrease energy cost byup to 39%, compared to conventional schedulers. Based on these positive results,we conclude that green datacenters and green-energy-aware scheduling can have asignificant role in building a more sustainable IT ecosystem.
Keywords: Green energy, energy-aware job scheduling, datacenters.
1. Introduction
Datacenters consume an enormous amount of energy: estimates for 2010 in-dicate that they consume around 1.5% of the total electricity used world-wide [1].Electricity cost thus represents a significant burden for datacenter operators. More-over, this electricity consumption contributes to climate change, since most of theelectricity is produced by burning fossil fuels. A 2008 study estimated world-widedatacenters to emit 116 million metric tons of carbon, slightly more than the entirecountry of Nigeria [2]. We refer to the energy produced by carbon-intensive meansand distributed via the electrical grid as “brown energy”.
IThis submission is a modified and extended version of “GreenSlot: Scheduling Energy Con-sumption in Green Datacenters”, which was originally published in SC’11.
∗Corresponding authorEmail address: [email protected] (Md E. Haque)
Preprint submitted to Elsevier March 28, 2014
These cost and environmental concerns have been prompting many “green”energy initiatives. One initiative is for datacenters to either generate their own re-newable energy or draw power directly from a nearby renewable power plant. Thisapproach is being implemented by many small and medium datacenters (partiallyor completely) powered by solar and/or wind energy all over the globe [3]. Largercompanies are also investing in this direction. For example, Apple is building a40MW solar array for its North Carolina datacenter [4]. McGraw-Hill has recentlycompleted a 14MW solar array for its datacenter [5].
We expect that this trend will continue, as these technologies’ capital costskeep decreasing (e.g., the inflation-adjusted cost of solar panels has decreased by10-fold in the last three decades [6]) and governments continue to provide generousincentives for green power generation (e.g., federal and state incentives for solarpower in the United States can reduce capital costs by up to 60% [7]). In fact,the trend may actually accelerate if carbon taxes and/or cap-and-trade schemesspread from Europe and Asia to the rest of the world. For example, a cap-and-trade scheme in the UK imposes caps on the brown energy consumption of largeconsumers [8]. We present a more extensive discussion of the feasibility of usinggreen energy in datacenters in [9].
We argue that the ideal design for green datacenters connects them to both thesolar/wind energy source and the electrical grid (as a backup). The major researchchallenge with solar and wind energy is that, differently from brown energy drawnfrom the grid, it is not always available. For example, photovoltaic (PV) solarenergy is only available during the day and the amount produced depends on theweather and the season. Datacenters sometimes can “bank” green energy in batter-ies or on the grid itself (called net metering) to mitigate this variability. However,both batteries and net metering have problems: (1) batteries involve energy lossesdue to internal resistance and self-discharge; (2) the cost of purchasing and main-taining batteries can dominate in a solar system [9, 10]; (3) today’s most popularbattery technology for datacenters (lead-acid) uses chemicals that are harmful tothe environment; (4) net metering incurs energy losses due to the voltage transfor-mation involved in feeding the green energy into the grid; (5) net metering is notavailable in many parts of the world; and (6) where net metering is available, thepower company may pay less than the retail electricity price for the green energy.
Thus, in this paper, we investigate how to manage a datacenter’s computationalworkload to match the green energy supply. In particular, we design a schedulerfor parallel batch jobs, called GreenSlot, in a datacenter powered by an array ofPV solar panels and the electrical grid. Jobs submitted to GreenSlot come withuser-specified numbers of nodes, expected running times, and deadlines by whichthey shall have completed. The deadline information provides the flexibility thatGreenSlot needs to manage energy consumption aggressively.
2
GreenSlot seeks to maximize the green energy consumption (or equivalentlyto minimize the brown energy consumption) while meeting the jobs’ deadlines. Ifbrown energy must be used to avoid deadline violations, it schedules jobs for timeswhen brown energy is cheap. In more detail, GreenSlot combines solar energyprediction, energy-cost-awareness, and least slack time first (LSTF) job ordering[11]. It first predicts the amount of solar energy that will likely be available in thefuture, using historical data and weather forecasts. Based on its predictions andthe information provided by users, it schedules the workload by creating resourcereservations into the future. When a job’s scheduled start time arrives, GreenSlotdispatches it for execution. Clearly, GreenSlot differs significantly from most jobschedulers, which seek to reduce completion times or bounded slowdown.
We implement two versions of GreenSlot: one extends the SLURM schedulerfor Linux [12], and the second extends the MapReduce scheduler of Hadoop [13].We use real scientific workloads from the Life Sciences Department of the BarcelonaSupercomputing Center to evaluate our SLURM extension and a Facebook-inspiredworkload to evaluate our Hadoop extension. Our results demonstrate that Green-Slot accurately predicts the amount of solar energy to become available. The re-sults also demonstrate that GreenSlot can increase green energy consumption anddecrease energy cost by up to 117% and 39%.
Based on these positive results, we conclude that green datacenters and green-energy-aware scheduling can have a significant role in building a more sustainableInformation Technology ecosystem.
In summary, we make the following contributions: (1) Introduce GreenSlot,a batch job scheduler for datacenters partly powered by solar energy; (2) Imple-ment and evaluate GreenSlot in two different environments: a scientific computingcluster and a data-processing MapReduce cluster; and (3) Present extensive resultsisolating the impact of different aspects of the scheduler.
2. Background
Solar energy and datacenters. Solar is a promising clean energy technology, as itdoes not cause the environmental disruption of hydroelectric energy and does nothave the waste storage problem of nuclear energy. Wind energy is also promising,but is not as abundant in many locations. Except for our (solar) energy predictions,our work is directly applicable to wind energy as well.
Transforming solar energy into (direct-current or DC) electricity is commonlydone using PV panels. The panels are made of cells containing PV materials, suchas monocrystalline and polycrystalline silicon. The photons of sunlight transferenergy to the electrons in the material. This energy causes the electrons to transferbetween the two regions of the material, producing a current that is driven throughthe electrical load (e.g., a datacenter).
3
Solar
Panels
Battery
Inverter GridCharge
Controler
AC Load
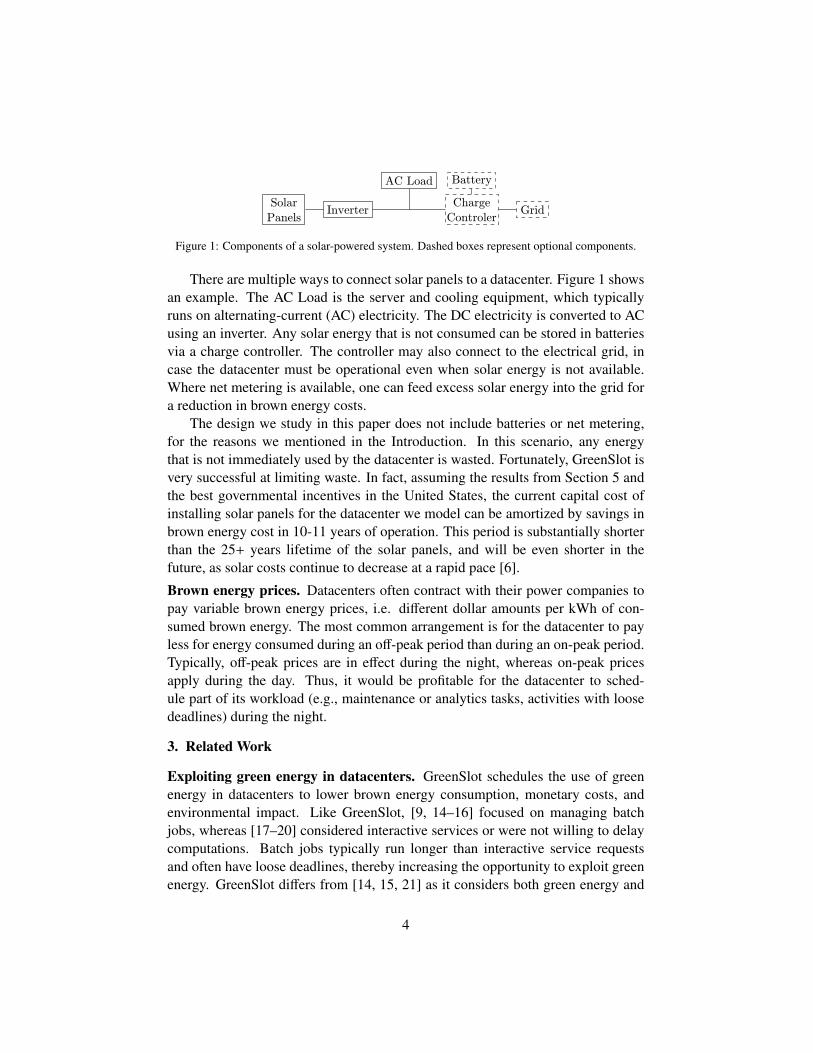
Figure 1: Components of a solar-powered system. Dashed boxes represent optional components.
There are multiple ways to connect solar panels to a datacenter. Figure 1 showsan example. The AC Load is the server and cooling equipment, which typicallyruns on alternating-current (AC) electricity. The DC electricity is converted to ACusing an inverter. Any solar energy that is not consumed can be stored in batteriesvia a charge controller. The controller may also connect to the electrical grid, incase the datacenter must be operational even when solar energy is not available.Where net metering is available, one can feed excess solar energy into the grid fora reduction in brown energy costs.
The design we study in this paper does not include batteries or net metering,for the reasons we mentioned in the Introduction. In this scenario, any energythat is not immediately used by the datacenter is wasted. Fortunately, GreenSlot isvery successful at limiting waste. In fact, assuming the results from Section 5 andthe best governmental incentives in the United States, the current capital cost ofinstalling solar panels for the datacenter we model can be amortized by savings inbrown energy cost in 10-11 years of operation. This period is substantially shorterthan the 25+ years lifetime of the solar panels, and will be even shorter in thefuture, as solar costs continue to decrease at a rapid pace [6].
Brown energy prices. Datacenters often contract with their power companies topay variable brown energy prices, i.e. different dollar amounts per kWh of con-sumed brown energy. The most common arrangement is for the datacenter to payless for energy consumed during an off-peak period than during an on-peak period.Typically, off-peak prices are in effect during the night, whereas on-peak pricesapply during the day. Thus, it would be profitable for the datacenter to sched-ule part of its workload (e.g., maintenance or analytics tasks, activities with loosedeadlines) during the night.
3. Related Work
Exploiting green energy in datacenters. GreenSlot schedules the use of greenenergy in datacenters to lower brown energy consumption, monetary costs, andenvironmental impact. Like GreenSlot, [9, 14–16] focused on managing batchjobs, whereas [17–20] considered interactive services or were not willing to delaycomputations. Batch jobs typically run longer than interactive service requestsand often have loose deadlines, thereby increasing the opportunity to exploit greenenergy. GreenSlot differs from [14, 15, 21] as it considers both green energy and
4
brown energy prices in making its decisions. It differs from [15] in other importantways: [15] used only short-term green energy predictions and runs more or fewerbatch jobs in arrival order as a function of green energy availability, without explicitdeadlines; if green energy runs out, any started jobs are terminated. In contrast,GreenSlot schedules the jobs two days into the future, possibly reordering them,within their explicit deadlines. Jobs are never terminated, and may run completelyon brown energy, if their deadlines so require.
GreenSlot differs from GreenHadoop [16] in that it leverages user-provided jobrun times, numbers of servers, and deadlines to schedule jobs more accurately. Liuet al. [22] focused on a similar problem as GreenSlot, but took a modeling andoptimization approach to it.
To study real green datacenters, we have recently built Parasol, a small proto-type datacenter powered by a solar array and the electrical grid [9]. We also builtGreenSwitch, a software system for dynamically selecting the energy source, themedium for energy storage, and for scheduling deferrable and non-deferrable jobs[9]. GreenSwitch leverages some of the same ideas as GreenSlot for schedulingdeferrable jobs, but targets datacenters with energy storage and does not rely onuser-provided information about the jobs.
Other works [23–27] have considered green energy, but only in multi-datacentersetups. These works focus on workload distribution/migration, rather than on greenenergy-aware scheduling within each datacenter. Finally, [24, 28, 29] consideredcarbon offsetting as a different approach to greening datacenters.Managing energy prices. Most of the works that have considered variable energyprices have targeted request distribution across multiple datacenters in interactiveInternet services [23, 24, 26, 30]. GreenSlot differs from these efforts as it seeks tomaximize green energy use, predict green energy availability, and schedule batchjobs within a single datacenter.GreenSlot vs. conventional job schedulers. GreenSlot has a few unique charac-teristics, compared to other job schedulers, e.g. [12, 31]. First, it promotes the useof green energy and cheap brown energy, possibility at the cost of increasing jobwaiting times (but not violating deadlines). Talby and Feitelson [32] introduced thenotion of increasing waiting times up to certain bounds in the context of backfilling.However, most job schedulers seek to minimize waiting times, makespan, and/orbounded slowdown; they never consider green energy or brown energy prices.
Second, GreenSlot borrows ideas from (soft) real-time systems: (1) jobs and/orworkflows (i.e., sequences of related jobs [33]) have deadlines by which they shallcomplete; (2) it keeps the queued jobs in LSTF order [11]; and (3) new jobs thatcannot be run before their deadlines are not admitted into the system. Althoughsome previous job schedulers have considered deadlines (e.g., [34, 35]), most ofthem typically do not.
5
If the underlying scheduler (e.g., SLURM) allows job suspensions, GreenSlotsuspends the jobs that outlast their allowed run times, instead of canceling themlike most other schedulers do. As these jobs have already consumed energy, itwould be wasteful to cancel them.Run time estimates and deadlines. Prior research showed that users typicallyprovide inaccurate estimates of run time [36, 37]. In fact, users often consciouslyoverestimate to avoid job cancellations. Deadlines create another avenue for “gam-ing” the system; users may provide unnecessarily tight deadlines so that the sched-uler executes their jobs ahead of others.
To alleviate these problems, we envision a computation pricing model for usewith GreenSlot. To encourage users not to overestimate run times, users would payin proportion to the actual run time of their jobs/workflows, but also pay a chargewhen they significantly overestimate those times. From this value, an amount pro-portional to how loose the deadlines are would be deducted. This model wouldachieve our two goals: tight expected run times, and loose deadlines. To compen-sate the user for a missed deadline, the datacenter operator would reimburse theuser for an amount proportional to the length of the violation. Obviously, the pay-ments in our model need not be in a real currency; rather, they could be effected ina virtual currency representing the right to use resources in the future, for example.
As another way of tackling poor run time estimates, GreenSlot could combinethem with automatic predictions based on recent executions by the same users [38].Hadoop. Some efforts have sought to reduce the energy consumption of Hadoopclusters. For example, [39, 40] focused on the careful placement of data replicas inHadoop’s distributed file system (HDFS), so that servers can be turned off withoutaffecting data availability. These efforts can be combined with GreenSlot to reduce(or eliminate) the need for it to keep servers on only to serve data. In fact, ourGreenSlot extension of Hadoop assumes the Covering Subset approach [39], underwhich one copy of the dataset is stored on the smallest possible number of servers;other servers can be deactivated without affecting data availability.
Lang and Patel proposed a different approach, called All-In Strategy (AIS) [41].Instead of turning some servers off when utilization is low, AIS either keeps theentire cluster on or off. In essence, AIS attempts to concentrate load, possibly bydelaying job execution, to have high utilization during on periods and zero energyuse during off periods. AIS considers neither the availability of green energy norvariable energy prices.
4. Scheduling in Green Datacenters
We propose GreenSlot, a parallel job scheduler for datacenters powered by PVsolar panels and the grid. GreenSlot relies on predictions of the availability of solar
6
Green availability Green energy used Brown energy used
J1J1
J2 J2J3 J3
J1 J2J3TimeNow
Nod
es
Nod
es Pow
er
Queued job
Now Time
Pow
er
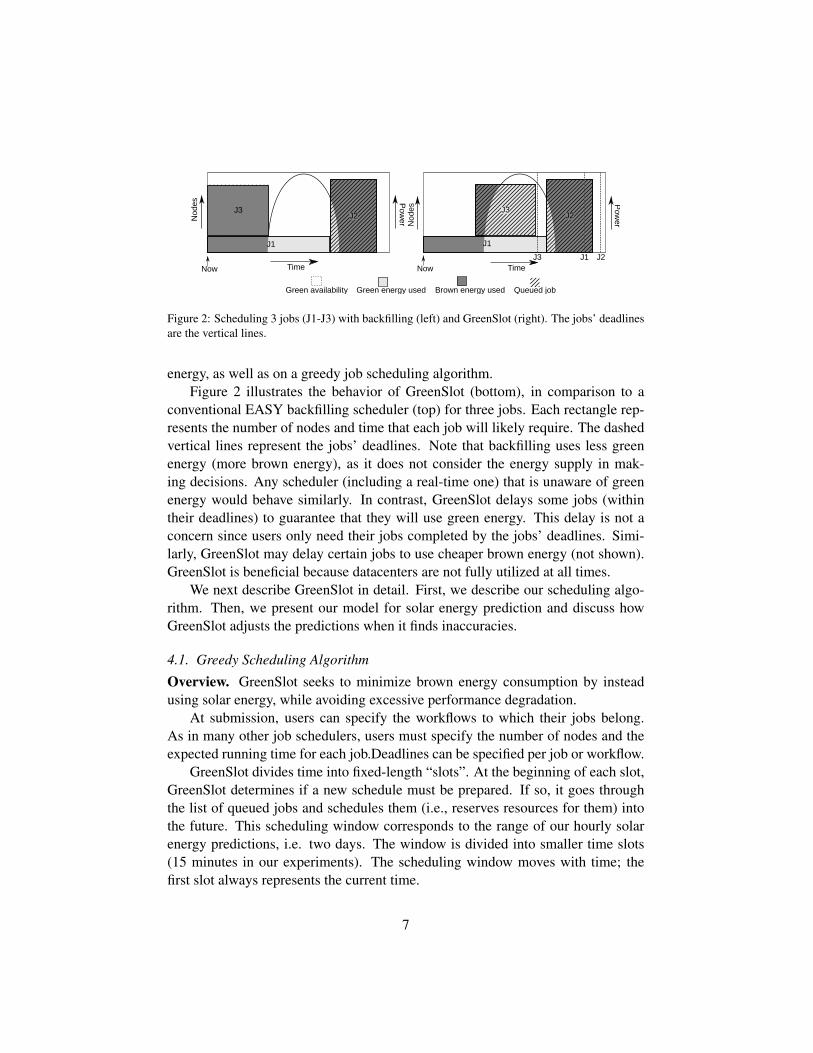
Figure 2: Scheduling 3 jobs (J1-J3) with backfilling (left) and GreenSlot (right). The jobs’ deadlinesare the vertical lines.
energy, as well as on a greedy job scheduling algorithm.Figure 2 illustrates the behavior of GreenSlot (bottom), in comparison to a
conventional EASY backfilling scheduler (top) for three jobs. Each rectangle rep-resents the number of nodes and time that each job will likely require. The dashedvertical lines represent the jobs’ deadlines. Note that backfilling uses less greenenergy (more brown energy), as it does not consider the energy supply in mak-ing decisions. Any scheduler (including a real-time one) that is unaware of greenenergy would behave similarly. In contrast, GreenSlot delays some jobs (withintheir deadlines) to guarantee that they will use green energy. This delay is not aconcern since users only need their jobs completed by the jobs’ deadlines. Simi-larly, GreenSlot may delay certain jobs to use cheaper brown energy (not shown).GreenSlot is beneficial because datacenters are not fully utilized at all times.
We next describe GreenSlot in detail. First, we describe our scheduling algo-rithm. Then, we present our model for solar energy prediction and discuss howGreenSlot adjusts the predictions when it finds inaccuracies.
4.1. Greedy Scheduling Algorithm
Overview. GreenSlot seeks to minimize brown energy consumption by insteadusing solar energy, while avoiding excessive performance degradation.
At submission, users can specify the workflows to which their jobs belong.As in many other job schedulers, users must specify the number of nodes and theexpected running time for each job.Deadlines can be specified per job or workflow.
GreenSlot divides time into fixed-length “slots”. At the beginning of each slot,GreenSlot determines if a new schedule must be prepared. If so, it goes throughthe list of queued jobs and schedules them (i.e., reserves resources for them) intothe future. This scheduling window corresponds to the range of our hourly solarenergy predictions, i.e. two days. The window is divided into smaller time slots(15 minutes in our experiments). The scheduling window moves with time; thefirst slot always represents the current time.
7
J1J2Now
J3
J5
J4
Nod
es
Time
Power
J2
J1
J2
J3
J4
J3
J4
J5J1
J2
J1
T2)
T1)
T3)
Green actual
Green energy used
Brown energy used
Queued job
Scheduling Window
Brown energy price
Green predicted
Now
Now
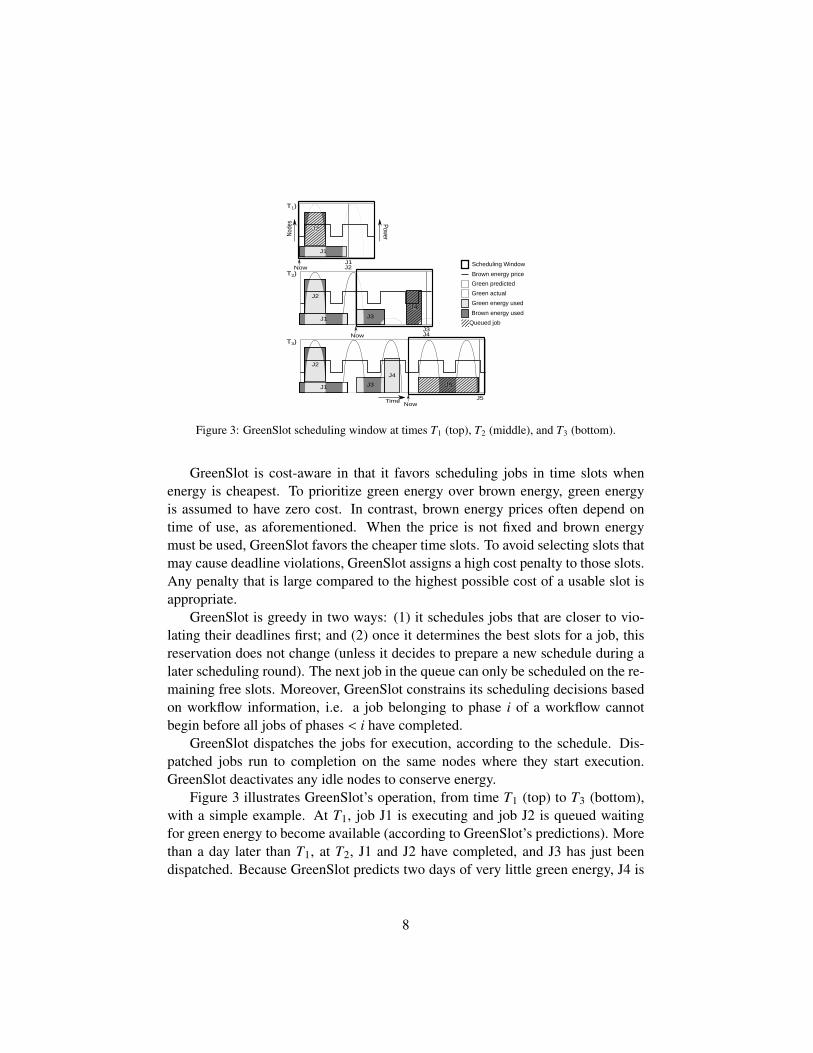
Figure 3: GreenSlot scheduling window at times T1 (top), T2 (middle), and T3 (bottom).
GreenSlot is cost-aware in that it favors scheduling jobs in time slots whenenergy is cheapest. To prioritize green energy over brown energy, green energyis assumed to have zero cost. In contrast, brown energy prices often depend ontime of use, as aforementioned. When the price is not fixed and brown energymust be used, GreenSlot favors the cheaper time slots. To avoid selecting slots thatmay cause deadline violations, GreenSlot assigns a high cost penalty to those slots.Any penalty that is large compared to the highest possible cost of a usable slot isappropriate.
GreenSlot is greedy in two ways: (1) it schedules jobs that are closer to vio-lating their deadlines first; and (2) once it determines the best slots for a job, thisreservation does not change (unless it decides to prepare a new schedule during alater scheduling round). The next job in the queue can only be scheduled on the re-maining free slots. Moreover, GreenSlot constrains its scheduling decisions basedon workflow information, i.e. a job belonging to phase i of a workflow cannotbegin before all jobs of phases < i have completed.
GreenSlot dispatches the jobs for execution, according to the schedule. Dis-patched jobs run to completion on the same nodes where they start execution.GreenSlot deactivates any idle nodes to conserve energy.
Figure 3 illustrates GreenSlot’s operation, from time T1 (top) to T3 (bottom),with a simple example. At T1, job J1 is executing and job J2 is queued waitingfor green energy to become available (according to GreenSlot’s predictions). Morethan a day later than T1, at T2, J1 and J2 have completed, and J3 has just beendispatched. Because GreenSlot predicts two days of very little green energy, J4 is
8
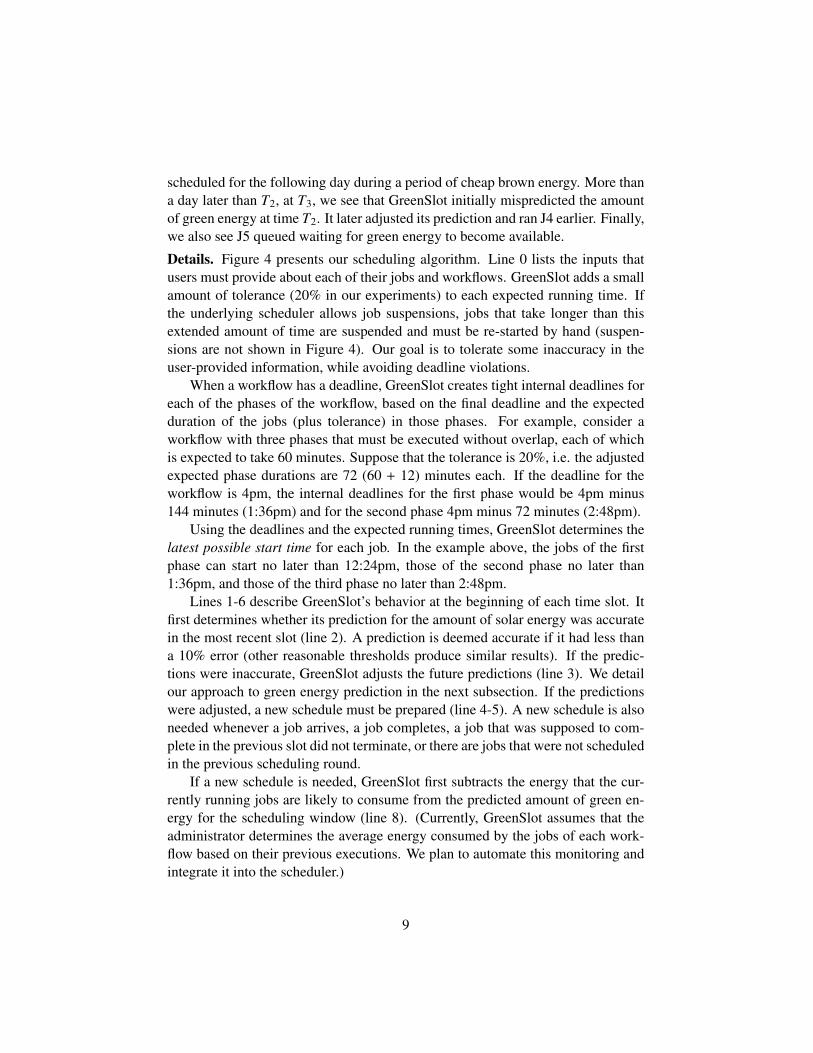
scheduled for the following day during a period of cheap brown energy. More thana day later than T2, at T3, we see that GreenSlot initially mispredicted the amountof green energy at time T2. It later adjusted its prediction and ran J4 earlier. Finally,we also see J5 queued waiting for green energy to become available.
Details. Figure 4 presents our scheduling algorithm. Line 0 lists the inputs thatusers must provide about each of their jobs and workflows. GreenSlot adds a smallamount of tolerance (20% in our experiments) to each expected running time. Ifthe underlying scheduler allows job suspensions, jobs that take longer than thisextended amount of time are suspended and must be re-started by hand (suspen-sions are not shown in Figure 4). Our goal is to tolerate some inaccuracy in theuser-provided information, while avoiding deadline violations.
When a workflow has a deadline, GreenSlot creates tight internal deadlines foreach of the phases of the workflow, based on the final deadline and the expectedduration of the jobs (plus tolerance) in those phases. For example, consider aworkflow with three phases that must be executed without overlap, each of whichis expected to take 60 minutes. Suppose that the tolerance is 20%, i.e. the adjustedexpected phase durations are 72 (60 + 12) minutes each. If the deadline for theworkflow is 4pm, the internal deadlines for the first phase would be 4pm minus144 minutes (1:36pm) and for the second phase 4pm minus 72 minutes (2:48pm).
Using the deadlines and the expected running times, GreenSlot determines thelatest possible start time for each job. In the example above, the jobs of the firstphase can start no later than 12:24pm, those of the second phase no later than1:36pm, and those of the third phase no later than 2:48pm.
Lines 1-6 describe GreenSlot’s behavior at the beginning of each time slot. Itfirst determines whether its prediction for the amount of solar energy was accuratein the most recent slot (line 2). A prediction is deemed accurate if it had less thana 10% error (other reasonable thresholds produce similar results). If the predic-tions were inaccurate, GreenSlot adjusts the future predictions (line 3). We detailour approach to green energy prediction in the next subsection. If the predictionswere adjusted, a new schedule must be prepared (line 4-5). A new schedule is alsoneeded whenever a job arrives, a job completes, a job that was supposed to com-plete in the previous slot did not terminate, or there are jobs that were not scheduledin the previous scheduling round.
If a new schedule is needed, GreenSlot first subtracts the energy that the cur-rently running jobs are likely to consume from the predicted amount of green en-ergy for the scheduling window (line 8). (Currently, GreenSlot assumes that theadministrator determines the average energy consumed by the jobs of each work-flow based on their previous executions. We plan to automate this monitoring andintegrate it into the scheduler.)
9

0. Users specify number of nodes, expected running time, deadline for each job/workflow
Add tolerance to expected running times
1. At the beginning of each time slot:
2. Determine whether the green energy predictions produced most recently were accurate
3. If they were inaccurate: adjust the future predictions
4. If predictions were just adjusted, a job arrived, a job completed,
a job expected to complete on the previous slot did not, OR
there are jobs to schedule:
5. Prepare a new schedule
6. Dispatch jobs according to schedule
7. Prepare schedule:
8. Update the availability of green energy over time based on currently running jobs
9. Try to schedule the next queued job in Least Slack Time First (LSTF) order
10. Calculate cost of scheduling the job to start in each slot in the scheduling window
11. The cost of starting the job on a slot should be infinite in the following cases:
12. (1) a preceding job in the same workflow will not have completed until this slot
13. (2) the job will end outside of the window
14. (3) there are not enough nodes on this or at least one other needed slot
15. When the cost is not infinite and brown energy is likely to be used:
16. Account for the cost of the brown energy
17. When the cost is not infinite, but the deadline will likely be violated:
18. Add a violation penalty to the cost of the appropriate slots
19. If cost is infinite for every slot:
20. If job was submitted in this slot and deadline is within the window: reject it
21. Otherwise: try to schedule this job in the next scheduling round
22. Move to the next job (line 9)
23. If a job would likely violate the deadline in every slot:
24. Decrease its deadline (internally) by one slot
25. Schedule job at the cheapest slot, except:
26. A job with deadline outside the window should only be scheduled in the window
if it can use green energy only (i.e., cost for cheapest slot = 0)
27. Account for the energy and the nodes that will be used by the job
28.Dispatch jobs and adjust the number of active nodes:
29. Activate nodes from S3 state, if necessary
30. Start jobs that should be started now, according to the current schedule
31. Send idle nodes to S3 state
Figure 4: GreenSlot algorithm. For simplicity, the pseudo-code assumes that no single job takeslonger than the scheduling window. In addition, it does not show the suspension of jobs that haveexceeded their expected running times (plus the tolerance).
After updating the green energy availability, GreenSlot sorts the queued jobsin LSTF order. In more detail, it orders the queued jobs based on their remain-ing “slack”, i.e. the difference between the current time and the latest possiblestart time (line 9). It then goes through the ordered list and schedules (reserves re-sources for) the jobs into the future (line 10-26). The key to scheduling each job iscomputing the energy cost of starting the job at each slot (lines 11-18). GreenSlotselects the starting slot that will lead to the lowest overall cost for the job (line 25),assuming that: (1) solar energy has zero cost; (2) the cost is infinite for any slot onwhich the job cannot start (lines 11-14); and (3) violating the deadline incurs anextra cost (lines 17-18). In computing costs, GreenSlot accounts for brown energyprices (line 16). Importantly, it requires no modifications to tackle scenarios in
10
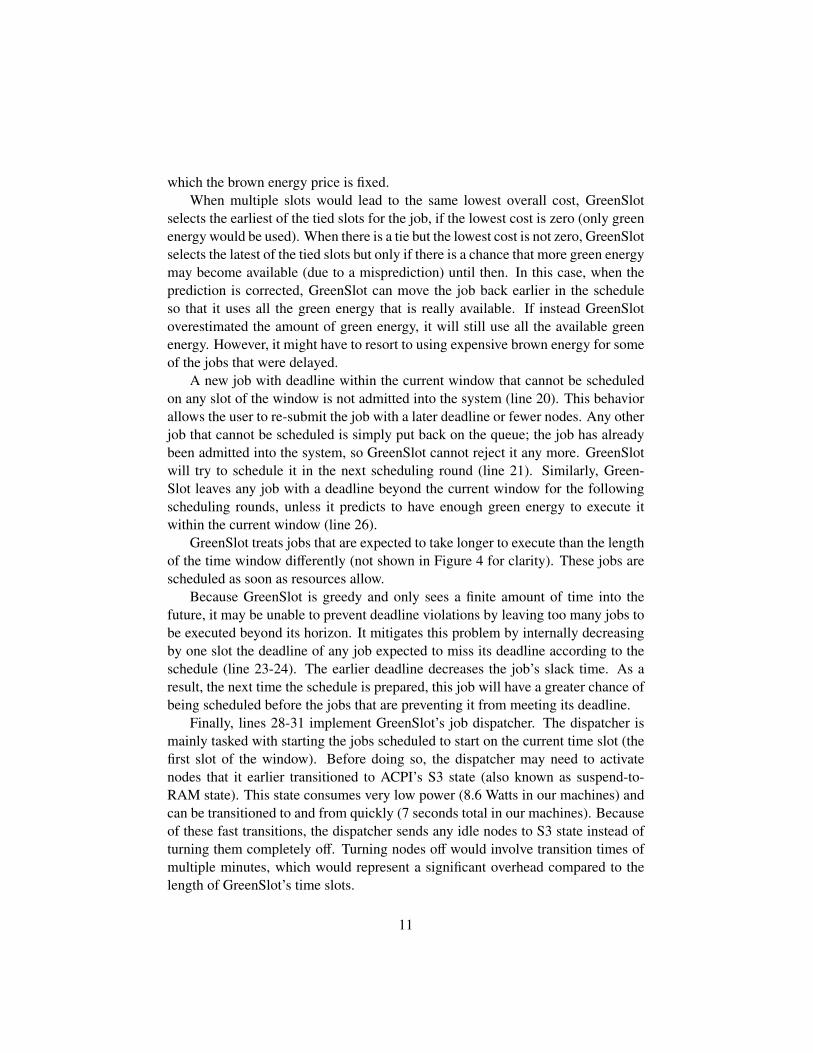
which the brown energy price is fixed.When multiple slots would lead to the same lowest overall cost, GreenSlot
selects the earliest of the tied slots for the job, if the lowest cost is zero (only greenenergy would be used). When there is a tie but the lowest cost is not zero, GreenSlotselects the latest of the tied slots but only if there is a chance that more green energymay become available (due to a misprediction) until then. In this case, when theprediction is corrected, GreenSlot can move the job back earlier in the scheduleso that it uses all the green energy that is really available. If instead GreenSlotoverestimated the amount of green energy, it will still use all the available greenenergy. However, it might have to resort to using expensive brown energy for someof the jobs that were delayed.
A new job with deadline within the current window that cannot be scheduledon any slot of the window is not admitted into the system (line 20). This behaviorallows the user to re-submit the job with a later deadline or fewer nodes. Any otherjob that cannot be scheduled is simply put back on the queue; the job has alreadybeen admitted into the system, so GreenSlot cannot reject it any more. GreenSlotwill try to schedule it in the next scheduling round (line 21). Similarly, Green-Slot leaves any job with a deadline beyond the current window for the followingscheduling rounds, unless it predicts to have enough green energy to execute itwithin the current window (line 26).
GreenSlot treats jobs that are expected to take longer to execute than the lengthof the time window differently (not shown in Figure 4 for clarity). These jobs arescheduled as soon as resources allow.
Because GreenSlot is greedy and only sees a finite amount of time into thefuture, it may be unable to prevent deadline violations by leaving too many jobs tobe executed beyond its horizon. It mitigates this problem by internally decreasingby one slot the deadline of any job expected to miss its deadline according to theschedule (line 23-24). The earlier deadline decreases the job’s slack time. As aresult, the next time the schedule is prepared, this job will have a greater chance ofbeing scheduled before the jobs that are preventing it from meeting its deadline.
Finally, lines 28-31 implement GreenSlot’s job dispatcher. The dispatcher ismainly tasked with starting the jobs scheduled to start on the current time slot (thefirst slot of the window). Before doing so, the dispatcher may need to activatenodes that it earlier transitioned to ACPI’s S3 state (also known as suspend-to-RAM state). This state consumes very low power (8.6 Watts in our machines) andcan be transitioned to and from quickly (7 seconds total in our machines). Becauseof these fast transitions, the dispatcher sends any idle nodes to S3 state instead ofturning them completely off. Turning nodes off would involve transition times ofmultiple minutes, which would represent a significant overhead compared to thelength of GreenSlot’s time slots.
11
Limitations. GreenSlot may potentially reject more jobs or miss more deadlinesthan a scheduler that delays fewer jobs. However, as our sensitivity study in Sec-tion 5.3.1 shows, this is only likely to occur in datacenters with unusually highutilizations. In fact, we have not seen any job rejections or missed deadlines un-der the more common (yet still relatively high) utilizations and real workloads westudy. A full evaluation of these effects is a topic for our future work.
4.2. Predicting the Availability of Solar EnergyOur model for predicting the generation of solar energy is based on a simple
premise: various weather conditions, e.g., partly cloudy, reduce the energy gen-erated in a predictable manner from that generated on an ideal sunny day. Thispremise is expressed as Ep(t) = f (w(t))B(t), where Ep(t) is the amount of energypredicted for time t, w(t) is the weather forecast, f (w(t)) is a weather-dependentattenuation factor (between 0 and 1), and B(t) is the amount of energy expectedunder ideal conditions.
We implement solar energy prediction using the above model at the granu-larity of an hour. We use weather forecasts available from sites such as TheWeather Channel to instantiate w(t). These sites provide hourly predictions forup to 48 hours into the future (which explains why the scheduling window is twodays). Each prediction includes a string describing the forecasted condition suchas “cloudy” or “scattered thunderstorms”. This string is the output of w(t).
We use historical data to instantiate both B(t) and f (w(t)). Specifically, for agiven hour t, we use the actual weather conditions and energy generated during themonth centered on t from the previous year. We choose this “reference” montharound t to account for seasonal effects. We set B(t) to the maximum energy gen-erated for the same hour of any day in the reference month. For each weathercondition wc, we compute f (wc) as the median amount by which wc decreasedB(t) whenever this condition was reported during the reference month.
Unfortunately, weather forecasts can be wrong. For example, we have observedthat thunderstorm forecasts are frequently inaccurate and can remain inaccuratethroughout a day; i.e., the forecast continues to predict a thunderstorm hour-by-hour but the storm never arrives. Further, weather is not the only factor that affectsenergy generation. For example, after a snow storm, little energy will be generatedwhile the solar panels remain covered by snow even if the weather is sunny.
To increase accuracy during the above “mispredictions”, we also use an alter-nate method of instantiating the attenuation factor for time t. Specifically, we as-sume that the recent past can predict the near future, and compute this factor usingthe observed energy generated in the previous hour. When invoked, our predictionmodule compares the accuracy of the two methods for predicting the energy gener-ated during the last hour, and chooses the more accurate method to instantiate the
12
attenuation factor for the remainder of the current day. Beyond the current day, wealways instantiate this factor using weather forecasts because weather conditionscan change significantly from one day to the next.
Although we do not claim our prediction approach as a contribution of thispaper, it does have three important characteristics: it is simple, relies on widelyavailable data, and is accurate at medium time scales, e.g. a few hours to a fewdays. Previous works have proposed more complex models based on historicalweather data [42]. However, these models tend to be inaccurate at medium timescales [43]. Based on this observation, Sharma et al. proposed a simple modelbased on historical data and weather forecasts [43]. Our approach is similar, butalso embodies error correction based on the recent green energy production.
4.3. GreenSlot Implementations
We built two implementations of GreenSlot: the first extends the SLURM par-allel job scheduler for Linux, and the second extends the MapReduce scheduler ofHadoop. The core of GreenSlot consists of 2300 uncommented lines of Pythoncode that are independent of the underlying scheduler. The first implementationadds another 500 uncommented lines of SLURM-related Python code for a totalof 2800 lines. The second implementation consists of 60 uncommented lines ofJava code to make Hadoop energy-aware and another 200 lines of Hadoop-relatedPython code. In the absence of GreenSlot, both SLURM and Hadoop schedulejobs in First-Come First-Served fashion without any delays.
5. Evaluation
5.1. Methodology
Hardware and software. We evaluate GreenSlot using a 16-node cluster, whereeach node is a 4-core Xeon server with 8GB of memory, 1 7200rpm SATA disk,and a 1Gb/s Ethernet card. GreenSlot runs on an additional server. The serversare connected by a Gigabit Ethernet switch. We measure power with an accurateYokogawa multimeter. Our servers consume up to roughly 150W, whereas theswitch consumes 55W and the low-power server that runs GreenSlot consumesroughly 30W.
Solar panel array. We model the solar panel array as a scaled-down version ofthe Rutgers solar farm. The farm can produce 1.4MW of power (after DC to ACconversion) that is used by the entire campus. By computing the actual energyproduction over time with respect to this maximum power, we can estimate theproduction of smaller installations. In particular, we scale the farm’s AC produc-tion down to 10 solar panels capable of producing 2.3kW of power. We selected
13

this scaled size because, after conversion, it produces roughly the common-casepeak power consumption of our system.
We considered one year worth of solar energy production by the farm, fromMarch 8th 2010 to March 7th 2011. The scaled-down daily productions for theweekdays in this period can be found in http://www.darklab.rutgers.edu/
GreenDC/solar.html. We collected weather forecast data for 30 of these weeks.From this set, we picked 4 weeks to study in detail: the week with the most solarenergy (starting on May 31th 2010), the week with the average amount of solarenergy (starting on July 12th 2010), a week with little solar energy in the firstthree days but later significant energy (starting on August 23rd 2010), and a weekwith lots of solar energy in the first two days but later little solar energy (startingon March 7th 2010). We call these weeks “Most”, “Average”, “Low-High”, and“High-Low”, respectively.
Brown energy prices. We assume the most common type of variable pricing,namely on-peak/off-peak pricing. In on-peak/off-peak pricing, brown energy costsless when used during off-peak consumption times (from 11pm to 9am) and morewhen consumed during on-peak times (from 9am until 11pm). The difference be-tween on-peak and off-peak prices is largest in the summer time (June-September).We assume the prices charged by PSEG in New Jersey: $0.13/kWh and $0.08/kWh(summer) and $0.12/kWh and $0.08/kWh (rest of year). Summer prices apply tothe Most, Average, and Low-High weeks.
Accelerating and validating the experiments. It would be impossible to performall of the experiments in this paper in real time. This would require hundreds ofdays of non-stop experiments. To speed up our study, we accelerate the experi-ments by a factor of 100. This means that a job that takes 100 minutes in real timecompletes in just 1 minute in the accelerated experiment. In addition, it means thatfive days of real time elapse in 72 minutes.
To verify that an accelerated run is faithful to its real-time counterpart, we runa validation experiment for 31 hours — from Monday at 9am until Tuesday at 4pm— with GreenSlot for SLURM scheduling our real scientific computing workloads(described in Section 5.3 below) with their estimated run times and deadlines. Thecorresponding accelerated run shortens all job-related times by 100x. Specifically,the accelerated jobs do not perform actual work; they simply occupy the nodesfor the proper amount of time. Both runs assume on-peak/on-peak brown prices.GreenSlot itself cannot be accelerated. In this experiment, it takes a maximumof 0.3 seconds (without any optimizations) to prepare a full schedule on an IntelAtom-based server. This maximum occurs when the largest number of jobs (70) isin the queue. As Figure 4 suggests, GreenSlot’s execution time is proportional tothe number of jobs in the system.
14
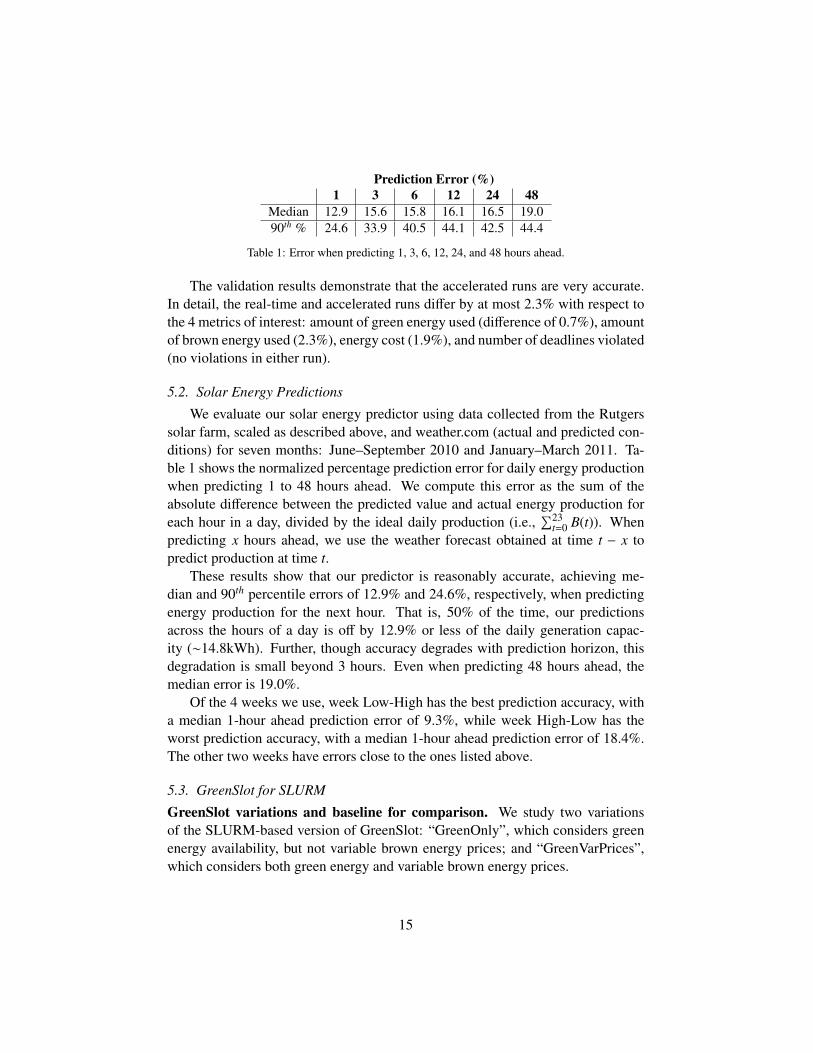
Prediction Error (%)1 3 6 12 24 48
Median 12.9 15.6 15.8 16.1 16.5 19.090th % 24.6 33.9 40.5 44.1 42.5 44.4
Table 1: Error when predicting 1, 3, 6, 12, 24, and 48 hours ahead.
The validation results demonstrate that the accelerated runs are very accurate.In detail, the real-time and accelerated runs differ by at most 2.3% with respect tothe 4 metrics of interest: amount of green energy used (difference of 0.7%), amountof brown energy used (2.3%), energy cost (1.9%), and number of deadlines violated(no violations in either run).
5.2. Solar Energy Predictions
We evaluate our solar energy predictor using data collected from the Rutgerssolar farm, scaled as described above, and weather.com (actual and predicted con-ditions) for seven months: June–September 2010 and January–March 2011. Ta-ble 1 shows the normalized percentage prediction error for daily energy productionwhen predicting 1 to 48 hours ahead. We compute this error as the sum of theabsolute difference between the predicted value and actual energy production foreach hour in a day, divided by the ideal daily production (i.e.,
∑23t=0 B(t)). When
predicting x hours ahead, we use the weather forecast obtained at time t − x topredict production at time t.
These results show that our predictor is reasonably accurate, achieving me-dian and 90th percentile errors of 12.9% and 24.6%, respectively, when predictingenergy production for the next hour. That is, 50% of the time, our predictionsacross the hours of a day is off by 12.9% or less of the daily generation capac-ity (∼14.8kWh). Further, though accuracy degrades with prediction horizon, thisdegradation is small beyond 3 hours. Even when predicting 48 hours ahead, themedian error is 19.0%.
Of the 4 weeks we use, week Low-High has the best prediction accuracy, witha median 1-hour ahead prediction error of 9.3%, while week High-Low has theworst prediction accuracy, with a median 1-hour ahead prediction error of 18.4%.The other two weeks have errors close to the ones listed above.
5.3. GreenSlot for SLURM
GreenSlot variations and baseline for comparison. We study two variationsof the SLURM-based version of GreenSlot: “GreenOnly”, which considers greenenergy availability, but not variable brown energy prices; and “GreenVarPrices”,which considers both green energy and variable brown energy prices.
15
For comparison, we study a variant of EASY backfilling [44] that considersthe deadlines in sorting the job queue in LSTF order. The scheduler backfills jobs,as long as the first job in the queue is not delayed. We refer to this scheduler as“Conventional”. Like GreenSlot, Conventional assigns a 20% tolerance to the user-estimated run times. If a job’s estimate and tolerance are exceeded, Conventionalcancels the job. It transitions unneeded servers to ACPI’s S3 state to save energy.
Workloads. We use 3 scientific computing workloads in production use at theLife Sciences Department of the Barcelona Supercomputing Center [45]. Eachworkload implements a different pipelined approach to the sequencing and miningof the genome of a baker’s yeast. Each workload runs for 5 days and comprises aset of workflows, each of which analyzes a different yeast sample. Workload1 andWorkload3 have 8 workflows each, whereas Workload2 has 12 workflows. Eachworkflow of Workload1 comprises 4 phases: initialization (1 job that runs for 8minutes on our cluster), data splitting (1 job that runs for 1 minute), computation(16 jobs that last between 6 minutes and 9 hours, with an average of 2.4 hours), andcollect/visualization (1 job that runs for 5 minutes). Each workflow of Workload2comprises 3 phases: initialization and splitting (1 job that runs for 10 minutes),computation (8 jobs that last between 2 hours and 9 hours, with an average of 4hours), and collect/visualization (1 job that runs for 5 minutes). Each workflow ofWorkload3 also comprises 3 phases: initialization and splitting (1 job that runs for10 minutes), computation (8 jobs that last between 1.25 hours and 2.27 hours, withan average of 1.26 hours), and collect/visualization (1 job that runs for 5 minutes).In total, there are 352 jobs and 28 workflows in these workloads. On average, theinput data for each workflow is 1.2 GB, the intermediate file sizes are 800 MBeach, and the final output size is 100 MB. Our Life Sciences colleagues run theseworkloads on a cluster of the same size as our own, so we do not scale them.
Starting on Monday at 9:30am of every week, a workflow from each work-load is submitted every 30 minutes. The workflows of Workload1 and Workload3have deadlines every day at 9:00am and 2:00pm from Tuesday until Friday. Theworkflows of Workload2 have deadlines every day at 9:00am, 1:00pm, and 4:00pmfrom Tuesday until Friday. The reason for the staggered deadlines is that they givethe researchers time to interpret the results before they are shipped to another re-search group. Since our workloads run from Monday to Friday, we loosely referto these five days as a week. This configuration corresponds to approximately50% cluster utilization, which is comparable to (or even higher than) many realscientific-computing datacenters and grids [46, 47].
As it is clear from the description above, the computation jobs represent thevast majority of the jobs and the time in the workloads. These are multithreadedjobs that use as many cores as are available at the server on which they run. There
16
0
0.2
0.4
0.6
0.8
1
1.2
1.4
1.6
1.8
Mon00:00
Mon12:00
Tue00:00
Tue12:00
Wed00:00
Wed12:00
Thu00:00
Thu12:00
Fri00:00
Fri12:00
Sat00:00
0
0.05
0.1
0.15
0.2
0.25
0.3P
ower
(kW
)
Bro
wn
ener
gy
pric
e ($
/kW
h)
Brown consumedGreen consumed
Green actualBrown price
Figure 5: Conventional scheduler and Averageweek.
0
0.2
0.4
0.6
0.8
1
1.2
1.4
1.6
1.8
Mon00:00
Mon12:00
Tue00:00
Tue12:00
Wed00:00
Wed12:00
Thu00:00
Thu12:00
Fri00:00
Fri12:00
Sat00:00
0
0.05
0.1
0.15
0.2
0.25
0.3
Pow
er (
kW)
Bro
wn
ener
gy
pric
e ($
/kW
h)
Brown consumedGreen consumedGreen predicted
Brown price
Figure 6: GreenOnly scheduler and Averageweek.
MostLow-HighAverageHigh-Low
%
0Cost savingsGreen energy increase
20
40
60
80
100
120
Figure 7: GreenOnly’s green energy increase andcost savings.
0
0.2
0.4
0.6
0.8
1
1.2
1.4
1.6
1.8
Mon00:00
Mon12:00
Tue00:00
Tue12:00
Wed00:00
Wed12:00
Thu00:00
Thu12:00
Fri00:00
Fri12:00
Sat00:00
0
0.05
0.1
0.15
0.2
0.25
0.3
Pow
er (
kW)
Bro
wn
ener
gy
pric
e ($
/kW
h)
Green consumedGreen actualBrown price
Brown consumed
Figure 8: GreenOnly with actual green energyavailability.
are no multi-node jobs in the real workloads. In Section 5.4, we evaluate a work-load with multi-node jobs that arrive over time, rather than clustered on Monday.Finally, our experiments assume that the user-provided estimates of job run timeare exactly the run times listed above. We have studied the impact of inaccuraciesin runtime estimates of up to [-40%,+20%], and our results (not shown here be-cause of space constraints) show that such inaccuracies have essentially negligibleimpact on GreenSlot.
Power consumption. We measured the power consumption of each job in eachworkflow. The computation jobs almost constantly consume 105W, whereas theinitialization jobs consume 140W, the splitting jobs consume 90W, and the col-lection/visualization jobs consume 102W. Overall, the common-case peak powerconsumption for our scientific workloads is 1765W = 16 × 105W + 55W (switch)+ 30W (GreenSlot). When a server is idle, GreenSlot sends it to S3 state, whichconsumes 8.6W. Transitioning into and out of S3 takes 7 seconds.
5.3.1. ResultsThis section presents our experimental results. First, we isolate the impact of
being aware of green energy by comparing GreenOnly with Conventional. Theseresults also assess the impact of the quality of green energy predictions on ourscheduling. Second, we study GreenVarPrices to isolate the benefit of being awareof brown energy prices. Third, we study the impact of the datacenter utilization onGreenVarPrices. Finally, we quantify the impact of poor run time estimates.
17
0
0.2
0.4
0.6
0.8
1
1.2
1.4
1.6
1.8
Mon00:00
Mon12:00
Tue00:00
Tue12:00
Wed00:00
Wed12:00
Thu00:00
Thu12:00
Fri00:00
Fri12:00
Sat00:00
0
0.05
0.1
0.15
0.2
0.25
0.3
Pow
er (
kW)
Bro
wn
ener
gy
pric
e ($
/kW
h)
Brown consumedGreen consumedGreen predicted
Brown price
Figure 9: GreenVarPrices and Average week.
Greenenergy increase Cost savings0
20
40
60
80
100
120MostLow-HighAverageHigh-Low
%
Figure 10: GreenVarPrices’ green energy in-crease and savings.
In our experiments, Conventional and GreenSlot do not violate any deadlines,except when we explore high datacenter utilizations to purposely cause violations.
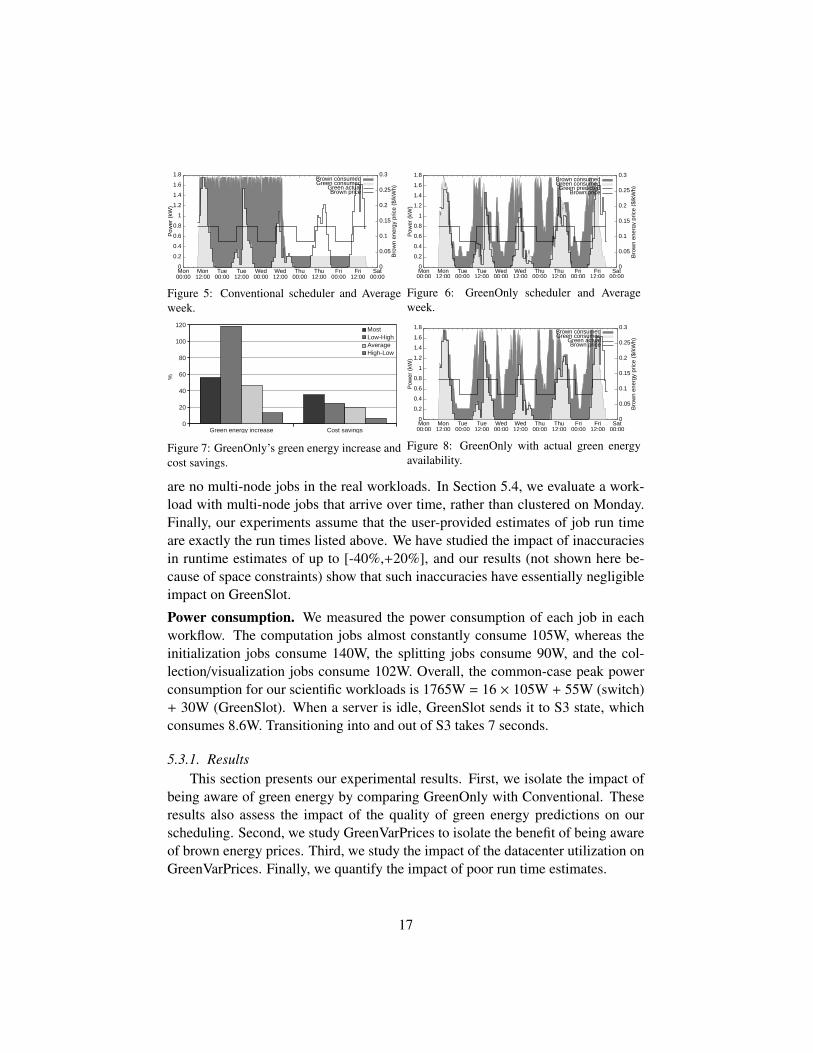
Scheduling for solar energy and impact of predictions. Figure 5 shows thebehavior of Conventional for our workloads, the Average week, and accurate jobrun time estimates. The X-axis represents time, whereas the Y-axis representscluster-wide power consumption (left) and brown energy prices (right). The figuredepicts the green and brown energy consumptions in light gray and dark gray,respectively. The two line curves represent the green energy available (labeled“Green actual”) and the brown energy price (“Brown price”).
As Conventional schedules the workloads to complete as soon as possible, itheavily uses the servers early in the week and leave them in deep-sleep state latein the week. This approach is ideal in terms of conserving energy, since keepingmodern servers powered on involves a high “static” energy. However, Conventionalwastes a large amount of green energy, which could be used instead of brownenergy. In this experiment, only 26% of the energy consumed is green.
Figure 6 depicts the behavior of GreenOnly, under the same conditions as inFigure 5. In this figure, we plot the amount of green energy that GreenSlot pre-dicted to be available an hour earlier (labeled “Green predicted”). The green pre-diction line does not exactly demarcate the light gray area, because our predictionssometimes do not match the actual green energy available.
A comparison between Figures 5 and 6 clearly illustrates how GreenOnly is ca-pable of using substantially more green energy than Conventional, while meetingall job/workflow deadlines. GreenOnly spreads out job execution across the week,always seeking to reduce the consumption of brown energy within resource anddeadline constraints. Overall, GreenOnly consumes 47% more green energy thanConventional in this experiment. Although GreenOnly does not explicitly considerbrown energy prices in making decisions, its energy cost savings reach 20% com-pared to Conventional. More than 80% of these cost savings comes from replacingbrown energy with green energy.
The results for the other weeks are similar, as seen in Figure 7. The figureshows two sets of 4 bars. The set on the left represents the increase in green energy
18

consumption, whereas the set on the right represents the energy cost savings. Eachbar represents a week. Overall, GreenOnly increases green energy consumptionbetween 13% and 118%, and reduces costs between 7% and 35%. GreenOnlyimproves on Conventional even for the worst-case week (High-Low) for us.
Another interesting observation is that our predictions of green energy avail-ability are plenty accurate for our purposes. The green availability curve traces thegray area in Figure 6 well. To quantify the impact of prediction accuracy, considerFigure 8. The figure shows the behavior of GreenOnly under the same conditions,except that we use the actual green energy availability (representing idealized per-fect knowledge of future energy production) instead of our predictions of it. Acomparison of Figures 6 and 8 shows similar schedules. Overall, we find that per-fect knowledge increases green energy use and decreases cost both by only 1%.Thus, this experiment is the only one in which we consider perfect knowledge ofgreen energy availability.
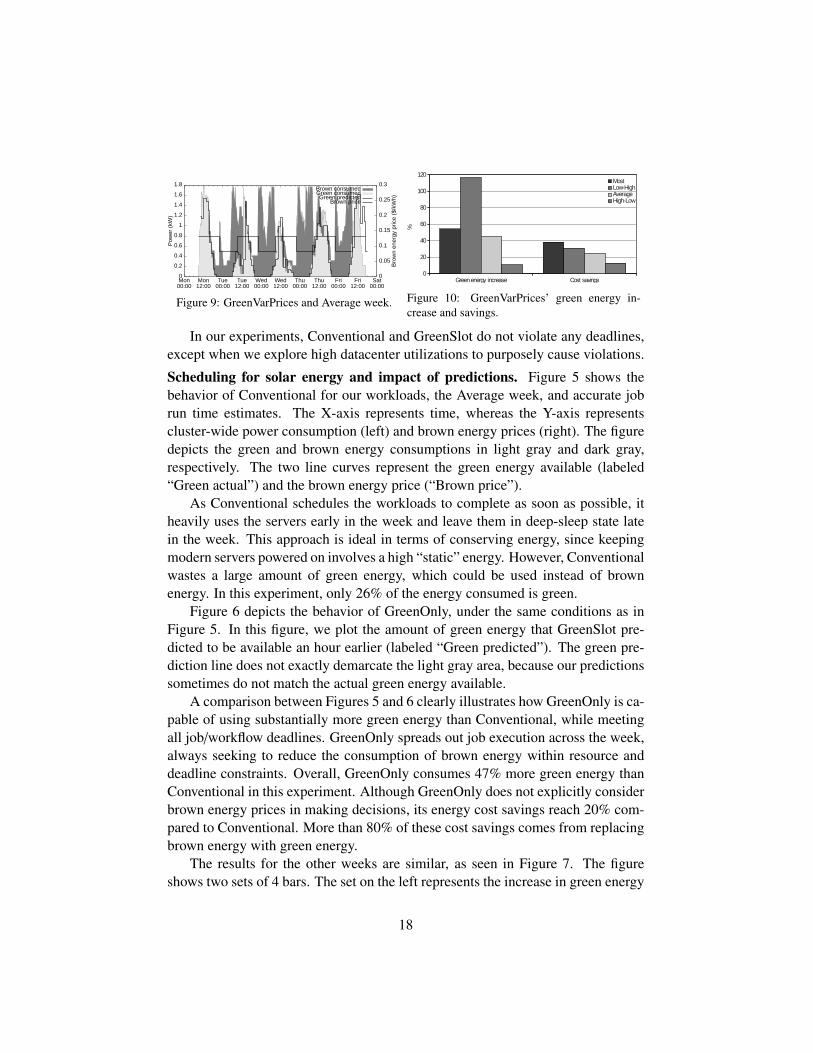
Scheduling for solar energy and brown energy prices. So far, we have studiedscheduling that does not explicitly exploit variable brown energy prices. However,GreenSlot can reduce costs further when brown energy prices vary and brown en-ergy must be consumed to avoid deadline violations. To quantify these savings, wenow consider the GreenVarPrices version of GreenSlot.
Figure 9 shows the behavior of GreenVarPrices again for our real workloads,the Average week, and accurate job run time estimates. Comparing this figureagainst Figure 6, one can clearly see that GreenVarPrices moves many jobs thatmust consume brown energy to periods with cheap brown energy. For example,GreenOnly runs many jobs on Tuesday night, Wednesday night, and Thursdaynight that consume expensive brown energy. Those jobs get scheduled during pe-riods of cheap energy under GreenVarPrices. As a result, GreenVarPrices exhibitshigher energy cost savings of 25% compared to Conventional for this week, whileconsuming almost the same amount of green energy as GreenOnly.
GreenVarPrices achieves positive results for the other weeks as well, as illus-trated in Figure 10. Overall, the GreenVarPrices cost savings range from 13% to39%, whereas its increases in green energy consumption range from 11% to 117%.
A comparison between Figures 7 and 10 illustrates the benefit of consideringbrown energy prices explicitly in GreenSlot. As one would expect, doing so de-creases costs with respect to GreenOnly. To isolate GreenSlot’s ability to exploitcheap brown energy in the absence of green energy, we also consider an idealizedweek with no solar energy. For this week, GreenVarPrices reduces energy cost by13% with respect to Conventional.
Impact of datacenter utilization. Another important factor in evaluating Green-Slot is its behavior as a function of datacenter utilization. Under high enough
19
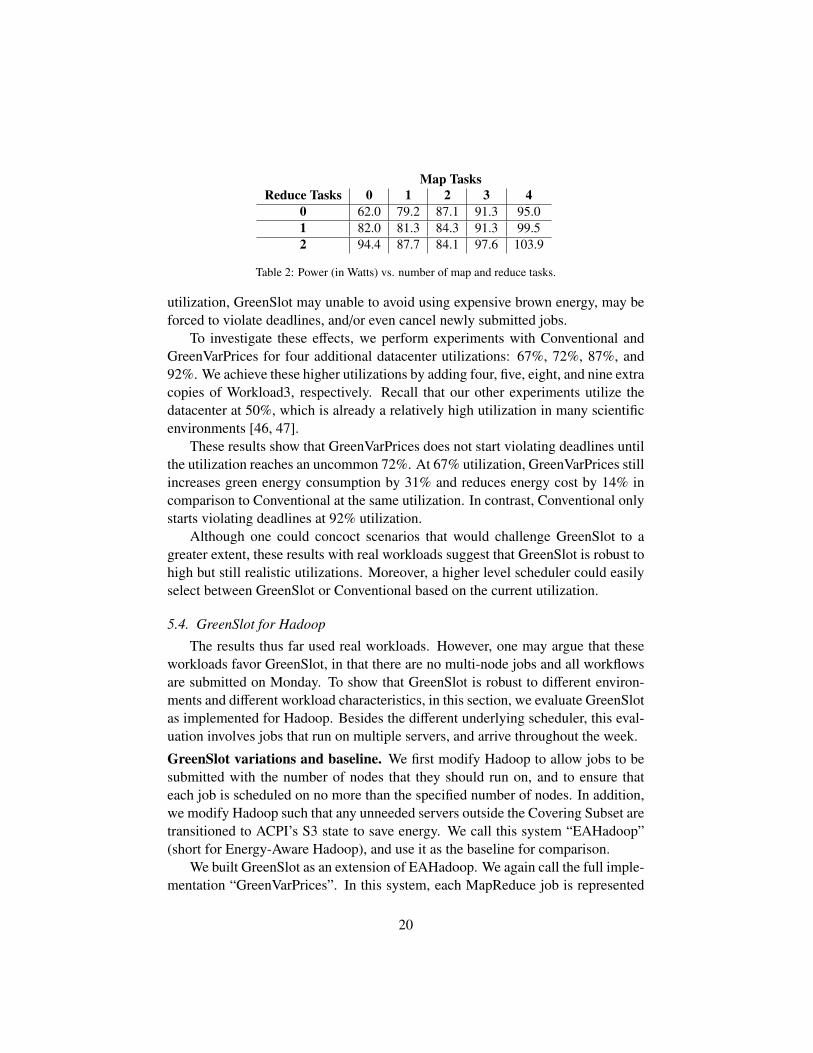
Map TasksReduce Tasks 0 1 2 3 4
0 62.0 79.2 87.1 91.3 95.01 82.0 81.3 84.3 91.3 99.52 94.4 87.7 84.1 97.6 103.9
Table 2: Power (in Watts) vs. number of map and reduce tasks.
utilization, GreenSlot may unable to avoid using expensive brown energy, may beforced to violate deadlines, and/or even cancel newly submitted jobs.
To investigate these effects, we perform experiments with Conventional andGreenVarPrices for four additional datacenter utilizations: 67%, 72%, 87%, and92%. We achieve these higher utilizations by adding four, five, eight, and nine extracopies of Workload3, respectively. Recall that our other experiments utilize thedatacenter at 50%, which is already a relatively high utilization in many scientificenvironments [46, 47].
These results show that GreenVarPrices does not start violating deadlines untilthe utilization reaches an uncommon 72%. At 67% utilization, GreenVarPrices stillincreases green energy consumption by 31% and reduces energy cost by 14% incomparison to Conventional at the same utilization. In contrast, Conventional onlystarts violating deadlines at 92% utilization.
Although one could concoct scenarios that would challenge GreenSlot to agreater extent, these results with real workloads suggest that GreenSlot is robust tohigh but still realistic utilizations. Moreover, a higher level scheduler could easilyselect between GreenSlot or Conventional based on the current utilization.
5.4. GreenSlot for Hadoop
The results thus far used real workloads. However, one may argue that theseworkloads favor GreenSlot, in that there are no multi-node jobs and all workflowsare submitted on Monday. To show that GreenSlot is robust to different environ-ments and different workload characteristics, in this section, we evaluate GreenSlotas implemented for Hadoop. Besides the different underlying scheduler, this eval-uation involves jobs that run on multiple servers, and arrive throughout the week.
GreenSlot variations and baseline. We first modify Hadoop to allow jobs to besubmitted with the number of nodes that they should run on, and to ensure thateach job is scheduled on no more than the specified number of nodes. In addition,we modify Hadoop such that any unneeded servers outside the Covering Subset aretransitioned to ACPI’s S3 state to save energy. We call this system “EAHadoop”(short for Energy-Aware Hadoop), and use it as the baseline for comparison.
We built GreenSlot as an extension of EAHadoop. We again call the full imple-mentation “GreenVarPrices”. In this system, each MapReduce job is represented
20
by a simple workflow comprising a map phase and a reduce phase. Each Hadoopnode is configured to have m map slots and r reduce slots, i.e. a node can simulta-neously run m map tasks and r reduce tasks. GreenSlot must schedule map tasksonly in the map slots and reduce tasks only in the reduce slots. The user-providednumber of nodes n is multiplied by m to get the maximum number of map tasks thatcan be run simultaneously, and multiplied by r to get the total number of reducetasks. In our experiments, m = 4 and r = 2.
Workload. Our data-processing workload is modeled after the Facebook work-load described in [48], but simplified (by consolidating 9 groups of different jobsizes into 3 groups) and scaled down for our smaller cluster. It consists of 75%small, 13% medium, and 12% large jobs. Each of the jobs is a TeraSort appli-cation [49], a common Hadoop benchmark. Each small job comprises 20 maptasks and 10 reduce tasks, runs on 5 nodes,1 and takes 2.8 hours on average. Eachmedium job comprises 40 map tasks and 20 reduce tasks, runs on 7 nodes, andtakes 4.5 hours on average. Each large job comprises 80 map tasks and 40 reducetasks, runs on 11 nodes, and takes 5.4 hours on average. Job arrival follows a Pois-son distribution with an average inter-arrival time of 40 seconds, corresponding toapproximately 50% cluster utilization. Other researchers have assumed Poissonarrivals for Hadoop [50]. Deadlines are 6 hours, 12 hours, and 24 hours for small,medium, and large jobs, respectively. Recall that we accelerate all job run timesand deadlines.
Power consumption. As Table 2 shows, the per-node power consumption dependson the number of map and reduce tasks currently running on the node. When anode is kept active just to provide data, i.e., 0 map and 0 reduce tasks, it consumesapproximately 62W.
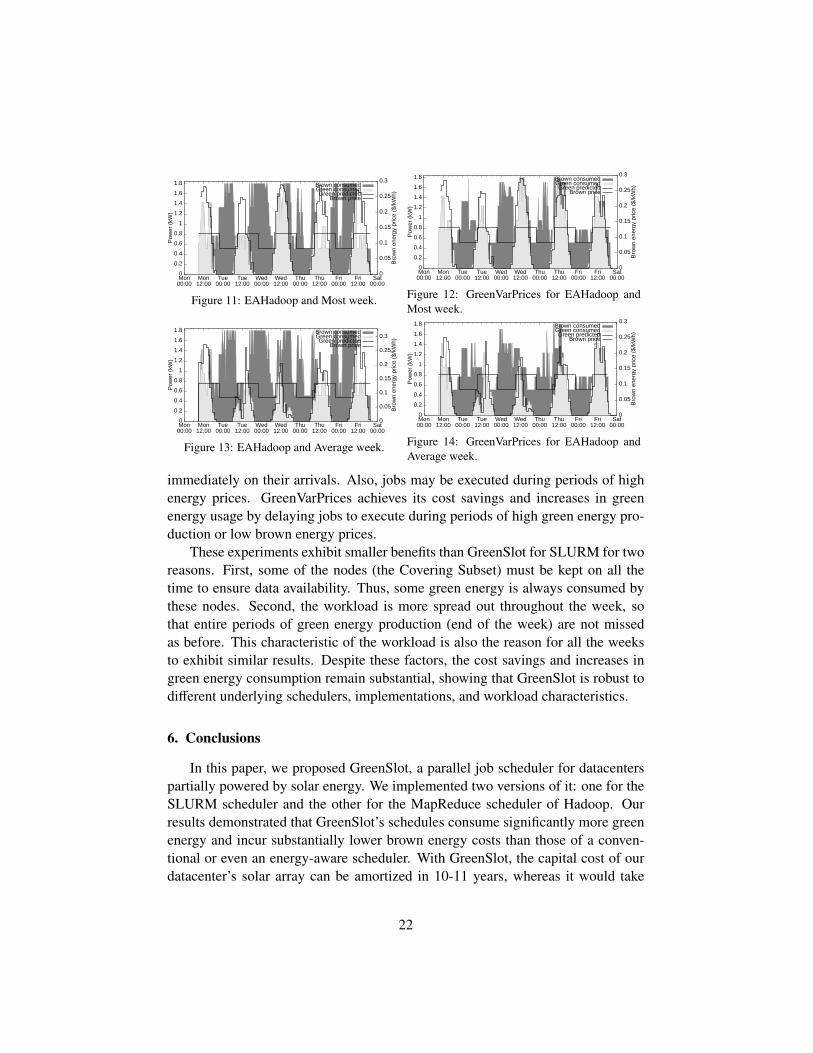
5.4.1. ResultsWe compare the behaviors of GreenVarPrices and EAHadoop for the same 4
weeks as before. Again, neither system violated any deadlines.Figures 11–14 show the behaviors of EAHadoop and GreenVarPrices for the
Most and Average weeks. Figure 15 plots the increase in green energy usage andcost savings for GreenVarPrices compared to EAHadoop.
Overall, GreenVarPrices achieves cost savings from 28% to 31%, and increasesgreen energy consumption from 19% to 21%. Figures 11–14 show that the work-load peaks can be misaligned with green energy production when jobs are executed
1We carefully chose the number of nodes per job to create fragmentation in our 16-node cluster.For example, 2 small jobs and 1 medium job cannot be scheduled simultaneously because theyrequire 17 nodes. This makes it harder for GreenSlot to maximize green energy usage.
21
0
0.2
0.4
0.6
0.8
1
1.2
1.4
1.6
1.8
Mon00:00
Mon12:00
Tue00:00
Tue12:00
Wed00:00
Wed12:00
Thu00:00
Thu12:00
Fri00:00
Fri12:00
Sat00:00
0
0.05
0.1
0.15
0.2
0.25
0.3
Pow
er (
kW)
Bro
wn
ener
gy
pric
e ($
/kW
h)
Green consumedGreen predicted
Brown price
Brown consumed
Figure 11: EAHadoop and Most week.
0
0.2
0.4
0.6
0.8
1
1.2
1.4
1.6
1.8
Mon00:00
Mon12:00
Tue00:00
Tue12:00
Wed00:00
Wed12:00
Thu00:00
Thu12:00
Fri00:00
Fri12:00
Sat00:00
0
0.05
0.1
0.15
0.2
0.25
0.3
Pow
er (
kW)
Bro
wn
ener
gy
pric
e ($
/kW
h)
Green consumedBrown consumed
Green predictedBrown price
Figure 12: GreenVarPrices for EAHadoop andMost week.
0
0.2
0.4
0.6
0.8
1
1.2
1.4
1.6
1.8
Mon00:00
Mon12:00
Tue00:00
Tue12:00
Wed00:00
Wed12:00
Thu00:00
Thu12:00
Fri00:00
Fri12:00
Sat00:00
0
0.05
0.1
0.15
0.2
0.25
0.3
Pow
er (
kW)
Bro
wn
ener
gy
pric
e ($
/kW
h)
Green consumedGreen predicted
Brown price
Brown consumed
Figure 13: EAHadoop and Average week.
0
0.2
0.4
0.6
0.8
1
1.2
1.4
1.6
1.8
Mon00:00
Mon12:00
Tue00:00
Tue12:00
Wed00:00
Wed12:00
Thu00:00
Thu12:00
Fri00:00
Fri12:00
Sat00:00
0
0.05
0.1
0.15
0.2
0.25
0.3
Pow
er (
kW)
Bro
wn
ener
gy
pric
e ($
/kW
h)
Brown consumedGreen consumedGreen predicted
Brown price
Figure 14: GreenVarPrices for EAHadoop andAverage week.
immediately on their arrivals. Also, jobs may be executed during periods of highenergy prices. GreenVarPrices achieves its cost savings and increases in greenenergy usage by delaying jobs to execute during periods of high green energy pro-duction or low brown energy prices.
These experiments exhibit smaller benefits than GreenSlot for SLURM for tworeasons. First, some of the nodes (the Covering Subset) must be kept on all thetime to ensure data availability. Thus, some green energy is always consumed bythese nodes. Second, the workload is more spread out throughout the week, sothat entire periods of green energy production (end of the week) are not missedas before. This characteristic of the workload is also the reason for all the weeksto exhibit similar results. Despite these factors, the cost savings and increases ingreen energy consumption remain substantial, showing that GreenSlot is robust todifferent underlying schedulers, implementations, and workload characteristics.
6. Conclusions
In this paper, we proposed GreenSlot, a parallel job scheduler for datacenterspartially powered by solar energy. We implemented two versions of it: one for theSLURM scheduler and the other for the MapReduce scheduler of Hadoop. Ourresults demonstrated that GreenSlot’s schedules consume significantly more greenenergy and incur substantially lower brown energy costs than those of a conven-tional or even an energy-aware scheduler. With GreenSlot, the capital cost of ourdatacenter’s solar array can be amortized in 10-11 years, whereas it would take
22
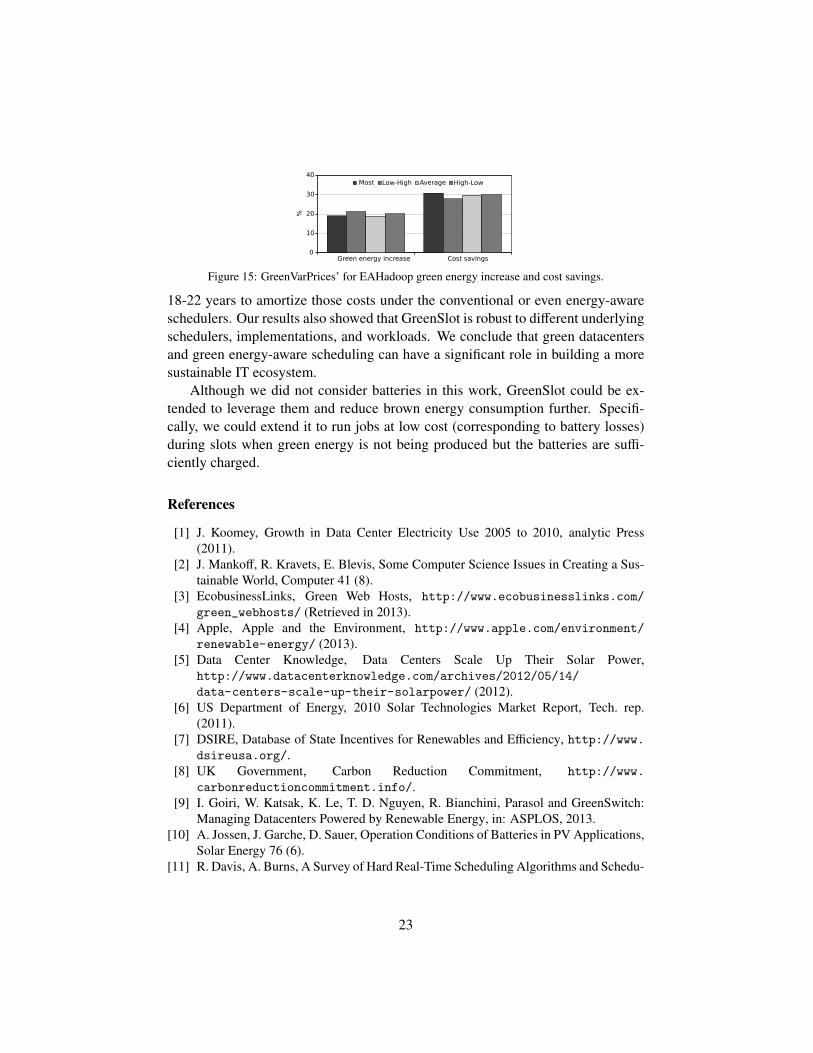
Most Low-High Average High-Low40
30
20
0
10
%
Green energy increase Cost savings
Figure 15: GreenVarPrices’ for EAHadoop green energy increase and cost savings.
18-22 years to amortize those costs under the conventional or even energy-awareschedulers. Our results also showed that GreenSlot is robust to different underlyingschedulers, implementations, and workloads. We conclude that green datacentersand green energy-aware scheduling can have a significant role in building a moresustainable IT ecosystem.
Although we did not consider batteries in this work, GreenSlot could be ex-tended to leverage them and reduce brown energy consumption further. Specifi-cally, we could extend it to run jobs at low cost (corresponding to battery losses)during slots when green energy is not being produced but the batteries are suffi-ciently charged.
References
[1] J. Koomey, Growth in Data Center Electricity Use 2005 to 2010, analytic Press(2011).
[2] J. Mankoff, R. Kravets, E. Blevis, Some Computer Science Issues in Creating a Sus-tainable World, Computer 41 (8).
[3] EcobusinessLinks, Green Web Hosts, http://www.ecobusinesslinks.com/
green_webhosts/ (Retrieved in 2013).[4] Apple, Apple and the Environment, http://www.apple.com/environment/
renewable-energy/ (2013).[5] Data Center Knowledge, Data Centers Scale Up Their Solar Power,
http://www.datacenterknowledge.com/archives/2012/05/14/
data-centers-scale-up-their-solarpower/ (2012).[6] US Department of Energy, 2010 Solar Technologies Market Report, Tech. rep.
(2011).[7] DSIRE, Database of State Incentives for Renewables and Efficiency, http://www.
dsireusa.org/.[8] UK Government, Carbon Reduction Commitment, http://www.
carbonreductioncommitment.info/.[9] I. Goiri, W. Katsak, K. Le, T. D. Nguyen, R. Bianchini, Parasol and GreenSwitch:
Managing Datacenters Powered by Renewable Energy, in: ASPLOS, 2013.[10] A. Jossen, J. Garche, D. Sauer, Operation Conditions of Batteries in PV Applications,
Solar Energy 76 (6).[11] R. Davis, A. Burns, A Survey of Hard Real-Time Scheduling Algorithms and Schedu-
23
lability Analysis Techniques for Multiprocessor Systems, Tech. Rep. YCS-2009-443,Dept. of Comp. Science, University of York (2009).
[12] A. Yoo, M. Jette, M. Grondona, SLURM: Simple Linux Utility for Resource Man-agement, in: JSSPP, 2003.
[13] Apache Hadoop, http://hadoop.apache.org/.[14] M. Arlitt, C. Bash, Y. Blagodurov, S. Chen, T. Christian, D. Gmach, C. Hyser, N. Ku-
mari, Z. Liu, M. Marwah, A. McReynolds, C. Patel, A. Shah, Z. Wang, R. Zhou,Towards the Design and Operation of Net-Zero Energy Data Centers, in: ITherm,2012.
[15] B. Aksanli, J. Venkatesh, L. Zhang, T. Rosing, Utilizing Green Energy Prediction toSchedule Mixed Batch and Service Jobs in Data Centers, in: HotPower, 2011.
[16] I. Goiri, K. Le, T. Nguyen, J. Guitart, J. Torres, R. Bianchini, GreenHadoop: Lever-aging Green Energy in Data-Processing Frameworks, in: Eurosys, 2012.
[17] K. Kant, M. Murugan, D. H. C. Du, Willow: A Control System for Energy andThermal Adaptive Computing, in: IPDPS, 2011.
[18] A. Krioukov, S. Alspaugh, P. Mohan, S. Dawson-Haggerty, D. Culler, R. Katz, De-sign and Evaluation of an Energy Agile Computing Cluster, Tech. Rep. EECS-2012-13, University of California at Berkeley (January 2012).
[19] C. Li, A. Qouneh, T. Li, iSwitch: Coordinating and Optimizing Renewable EnergyPowered Server Clusters, in: ISCA, 2012.
[20] C. Stewart, K. Shen, Some Joules Are More Precious Than Others: Managing Re-newable Energy in the Datacenter, in: HotPower, 2009.
[21] A. Krioukov, C. Goebel, S. Alspaugh, Y. Chen, D. Culler, R. Katz, Integrating Re-newable Energy Using Data Analytics Systems: Challenges and Opportunities, Bul-letin of the IEEE Computer Society Technical Committee.
[22] Z. Liu, Y. Chen, C. Bash, A. Wierman, D. Gmach, Z. Wang, M. Marwah, C. Hyser,Renewable and Cooling Aware Workload Management for Sustainable Data Centers,in: SIGMETRICS, 2012.
[23] K. Le, R. Bianchini, M. Martonosi, T. D. Nguyen, Cost- And Energy-Aware LoadDistribution Across Data Centers, in: HotPower, 2009.
[24] K. Le, O. Bilgir, R. Bianchini, M. Martonosi, T. D. Nguyen, Capping the BrownEnergy Consumption of Internet Services at Low Cost, in: IGCC, 2010.
[25] K. Le, J. Zhang, J. Meng, Y. Jaluria, T. D. Nguyen, R. Bianchini, Reducing ElectricityCost Through Virtual Machine Placement in High Performance Computing Clouds,in: SC, 2011.
[26] Z. Liu, M. Lin, A. Wierman, S. Low, L. Andrew, Greening Geographical Load Bal-ancing, in: SIGMETRICS, 2011.
[27] Y. Zhang, Y. Wang, X. Wang, GreenWare: Greening Cloud-Scale Data Centers toMaximize the Use of Renewable Energy, in: Middleware, 2011.
[28] N. Deng, C. Stewart, D. Gmach, M. Arlitt, J. Kelley, Adaptive Green Hosting, in:ICAC, 2012.
[29] C. Ren, D. Wang, B. Urgaonkar, A. Sivasubramaniam, Carbon-Aware Energy Capac-ity Planning for Datacenters, in: MASCOTS, 2012.
[30] A. Qureshi, R. Weber, H. Balakrishnan, J. Guttag, B. Maggs, Cutting the ElectricBill for Internet-Scale Systems, in: Proceedings of the Special Interest Group on
24
Data Communications, August 2009.[31] D. Feitelson, L. Rudolph, U. Schwiegelshohn, Parallel Job Scheduling – A Status
Report, in: JSSPP, 2004.[32] D. Talby, D. Feitelson, Supporting Priorities and Improving Utilization of the IBM
SP2 Scheduler Using Slack-Based Backfilling, in: IPDPS, 1999.[33] E. Deelman, J. Blythe, Y. Gil, C. Kesselman, G. Mehta, K. Vahi, K. Blackburn,
A. Lazzarini, A. Arbree, R. Cavanaugh, S. Koranda, Mapping Abstract ComplexWorkflows Onto Grid Environments, Journal of Grid Computing 1 (1).
[34] M. Islam, Qos in parallel job scheduling, Ph.D. thesis, Dept. of Computer Scienceand Engineering, Ohio State University (2008).
[35] J. Sherwani, N. Ali, N. Lotia, Z. Hayat, R. Buyya, Libra: A Computational Economy-Based Job Scheduling System for Clusters, Software Practice and Experience 34 (6).
[36] C. Lee, Y. Schwartzman, J. Hardy, A. Snavely, Are User Runtime Estimates Inher-ently Inaccurate?, in: JSSPP, 2004.
[37] A. W. Mu’alem, D. G. Feitelson, Utilization, Predictability, Workloads, and UserRuntime Estimates in Scheduling the IBM SP2 with Backfilling, IEEE Transactionson Parallel and Distributed Systems 12 (6).
[38] D. Tsafrir, Y. Etsion, D. G. Feitelson, Backfilling Using System-Generated Predic-tions Rather Than User Runtime Estimates, IEEE Transactions on Parallel and Dis-tributed Systems 18 (6).
[39] J. Leverich, C. Kozyrakis, On the Energy (In)efficiency of Hadoop Clusters, in: Hot-Power, 2009.
[40] R. T. Kaushik, M. Bhandarkar, K. Nahrstedt, Evaluation and Analysis of Green-HDFS: A Self-Adaptive, Energy-Conserving Variant of the Hadoop Distributed FileSystem, in: CloudCom, 2010.
[41] W. Lang, J. M. Patel, Energy Management for MapReduce Clusters, in: VLDB, 2010.[42] S. Jebaraj, S. Iniyan, A Review of Energy Models, Renewable and Sustainable En-
ergy Reviews 10 (4).[43] N. Sharma, J. Gummeson, D. Irwin, P. Shenoy, Cloudy Computing: Leveraging
Weather Forecasts in Energy Harvesting Sensor Systems, in: SECON, 2010.[44] D. Lifka, The ANL/IBM SP Scheduling System, in: JSSPP, 1995.[45] O. Flores, M. Orozco, NucleR: A Package for Non-Parametric Nucleosome Position-
ing, Bioinformatics 27 (15).[46] P. Ranganathan, P. Leech, D. Irwin, J. Chase, Ensemble-level Power Management for
Dense Blade Servers, in: ISCA, 2006.[47] I. Rodero, F. Guim, J. Corbalan, Evaluation of Coordinated Grid Scheduling Strate-
gies, in: HPCC, 2009.[48] M. Zaharia, D. Borthakur, J. Sen Sarma, K. Elmeleegy, S. Shenker, I. Stoica, De-
lay Scheduling: a Simple Technique for Achieving Locality and Fairness in ClusterScheduling, in: Eurosys, 2010.
[49] O. OMalley, A. Murthy, Winning a 60 Second Dash with a Yellow Elephant, in: SortBenchmark, 2009.
[50] G. Wang, A. R. Butt, H. Monti, K. Gupta, Towards Synthesizing Realistic WorkloadTraces for Studying the Hadoop Ecosystem, in: MASCOTS, 2011.
25