Embed Size (px)
Citation preview
Matching capacity and demand An analysis of the planning issues at the gynecology clinic at Medisch Spectrum Twente
2012
Master thesis for completion of the master Health Science at the University of Twente H.E. Kobes October 2012

2
Lieske (H.E.) Kobes BSc.
Health Science – track Health Services and Management
School of Management and Governance
University of Twente
Internal supervisor:
Dr. ir. Ingrid (I.M.H.) Vliegen
Industrial Engineering and Business Information
Systems (IEBIS)
Dr. ir. Wineke (W.A.) van Lent
Health Technology Service Research (HTSR)
External supervisor:
Josephine oude Lohuis-Tijkotte
Head of Unit Gynecology

3
Samenvatting
Dit onderzoek is gestart naar aanleiding van het niet behalen van het afgesproken productievolume
binnen de afdeling gynaecologie van het ziekenhuis "Medisch Spectrum Twente" in Nederland. Na
een eerste analyse van dit probleem, werd het doel van dit onderzoek het vinden van een oplossing om
een betere afstemming tussen de capaciteit en de vraag naar zorg te bewerkstelligen en daarmee de
tactische planning van middelen te verbeteren. Het idee was om met informatie over de doorstroming
van patiënten in zorgpaden de verwachte vraag voor de toekomst te bepalen.
In MST worden verschillende spreekuren gehouden per subspecialisatie. De planning van de capaciteit
van de artsen wordt uitgevoerd door één werknemer die verantwoordelijk is voor de planning. De
planner verdeeld de artsen over de taken zonder dit te baseren op historische gegevens. Historische
gegevens over de vraag naar ongecompliceerde zwangerschap zorg leren dat de vraag fluctueert over
de maanden van het jaar. Een model voor de prognose van de vraag moet daarom rekening houden
met deze fluctuaties. Het beschreven zorgpad dient als basis voor het onderzoek met informatie over
de capaciteit die nodig is per fase en de stroom van patiënten door middel van het zorgproces.
In dit onderzoek is het model gebaseerd op het zorgpad voor ongecompliceerde zwangerschappen. Het
model moet het aantal benodigde ‘slots’ voor controlepatiënten en nieuwe patiënten voor een bepaalde
week kunnen voorspellen. Het aantal ‘CP slots’ in een week is gebaseerd op het aantal ‘slots’ in de
week voor. Het aantal ‘NP slots’ in een week is ofwel gebaseerd op een voorspelling van nieuwe
patiënten of op het werkelijke aantal patiënten. Het model is gebouwd in Excel wat resulteerde in een
planningstool met als uitkomst de benodigde NP en CP ‘slots’ voor de komende periode. Uit
verificatie van de tool blijkt dat die goed functioneert. De uitkomsten van de planningstool werden
gevalideerd door het vergelijken van de uitkomsten van het model met het werkelijke aantal ‘slots’ die
nodig zijn in twee gecontroleerde weken. De uitkomsten van het model zijn niet zo goed als gehoopt.
Maar die uitkomst kan nauwkeuriger worden omdat het mogelijk is om werkelijke data in te voeren in
de planningstool. Met het invoeren van die data als randvoorwaarde voor gebruik, verwachten we dat
de planningstool zeker nuttig is voor een betere match tussen capaciteit en vraag.
Een aanbeveling voor de afdeling gynaecologie is het doen van een pilot met de planning tool. Na de
pilot zullen zij in staat zijn om aanpassingen te doen aan de planningstool of het proces om het model
zo goed mogelijk te kunnen toepassen. Het ontwikkelde model maakt een voorspelling van de vraag
mogelijk. Meer inzicht in de vraag naar slechts een subspecialisme maakt het mogelijk voor de planner
om ook te beslissen over de toewijzing van capaciteit aan andere sub specialismen. Daarmee is zijn de
planner en artsen in staat om beslissingen te nemen over het leveren van zorg in de nabije toekomst.
Dit kan een manier zijn om het volume van EPB’s te beheren en de haalbaarheid van het
overeengekomen productievolume te bepalen.
4
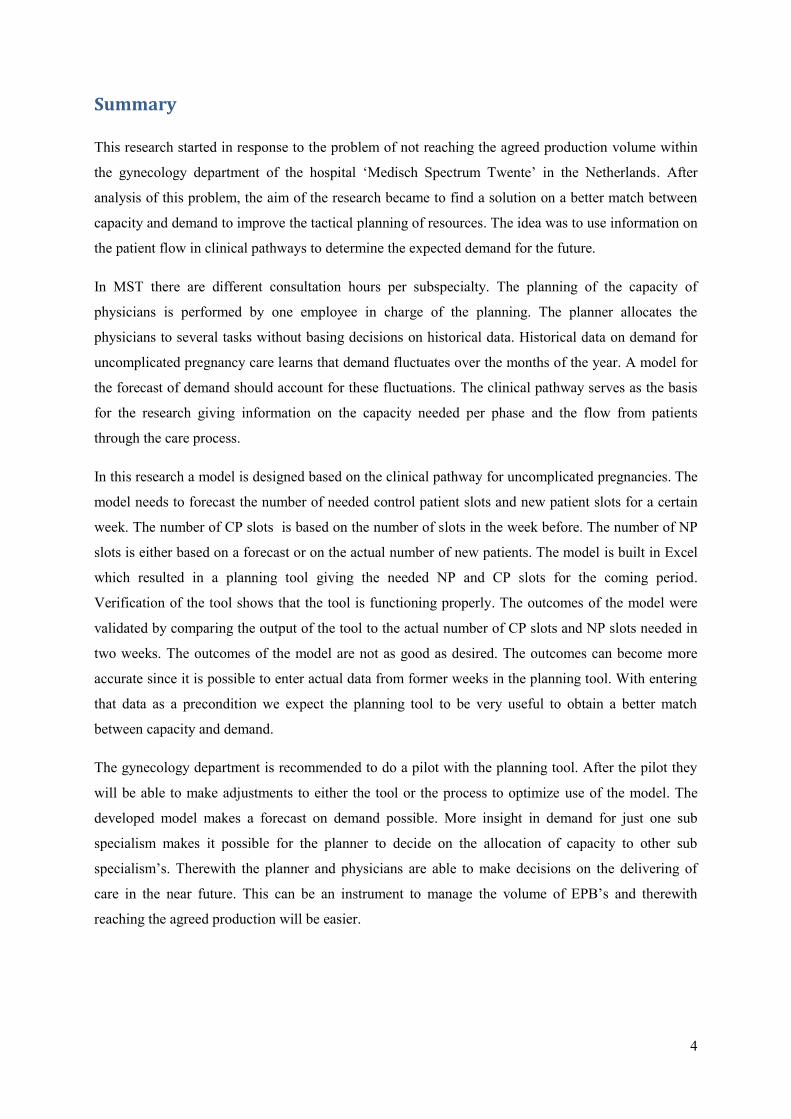
Summary
This research started in response to the problem of not reaching the agreed production volume within
the gynecology department of the hospital ‘Medisch Spectrum Twente’ in the Netherlands. After
analysis of this problem, the aim of the research became to find a solution on a better match between
capacity and demand to improve the tactical planning of resources. The idea was to use information on
the patient flow in clinical pathways to determine the expected demand for the future.
In MST there are different consultation hours per subspecialty. The planning of the capacity of
physicians is performed by one employee in charge of the planning. The planner allocates the
physicians to several tasks without basing decisions on historical data. Historical data on demand for
uncomplicated pregnancy care learns that demand fluctuates over the months of the year. A model for
the forecast of demand should account for these fluctuations. The clinical pathway serves as the basis
for the research giving information on the capacity needed per phase and the flow from patients
through the care process.
In this research a model is designed based on the clinical pathway for uncomplicated pregnancies. The
model needs to forecast the number of needed control patient slots and new patient slots for a certain
week. The number of CP slots is based on the number of slots in the week before. The number of NP
slots is either based on a forecast or on the actual number of new patients. The model is built in Excel
which resulted in a planning tool giving the needed NP and CP slots for the coming period.
Verification of the tool shows that the tool is functioning properly. The outcomes of the model were
validated by comparing the output of the tool to the actual number of CP slots and NP slots needed in
two weeks. The outcomes of the model are not as good as desired. The outcomes can become more
accurate since it is possible to enter actual data from former weeks in the planning tool. With entering
that data as a precondition we expect the planning tool to be very useful to obtain a better match
between capacity and demand.
The gynecology department is recommended to do a pilot with the planning tool. After the pilot they
will be able to make adjustments to either the tool or the process to optimize use of the model. The
developed model makes a forecast on demand possible. More insight in demand for just one sub
specialism makes it possible for the planner to decide on the allocation of capacity to other sub
specialism’s. Therewith the planner and physicians are able to make decisions on the delivering of
care in the near future. This can be an instrument to manage the volume of EPB’s and therewith
reaching the agreed production will be easier.

5
Preface
Before you lies my master thesis which marks the end to my master study Health Science at the
University of Twente. It contains the outcomes of a study on the tactical planning process in an
outpatient department for gynecology. During the research a model is developed to forecast the future
demand with the aim to improve the match between demand and capacity while planning capacity.
At the start of this project I was very eager to find an interesting assignment preferably at an hospital. I
was happy to find this at the Medisch Spectrum Twente hospital in Enschede. Very soon it became
clear that there was no clear problem description. At least not one I was able to solve. I thereafter sort
of created my own problem analysis with help of my supervisor. This has resulted in the thesis your
are about to read. The process to the final report has been long and challenging but it has also been an
instructive period. I am now looking forward to the future starting with my working career.
I would like to thank my first supervisor Ingrid Vliegen for the support and patience during my
graduating project and for all the help to come to a structured report. I also would like to thank Wineke
van Lent for being second supervisor and providing the needed critical view on the project.
Furthermore I want to thank Josephine oude Lohuis for giving me the possibility for a master thesis at
the Medisch Spectrum Twente and for the interesting conversations about the department. And last but
not least I want to thank my dear family and friends for all the support during my study.
Vriezenveen, 2012
Lieske Kobes
6
Content
Abbreviations .......................................................................................................................................... 8
1 Introduction .................................................................................................................................... 9
1.1 Background ............................................................................................................................. 9
1.2 Problem analysis ...................................................................................................................... 9
1.2.1 Production agreements are not feasible ......................................................................... 10
1.2.2 Capacity is not used efficiently ..................................................................................... 13
1.3 Problem definition ................................................................................................................. 15
1.3.1 Main goal ....................................................................................................................... 16
1.3.2 Research questions ........................................................................................................ 16
1.3.3 Research methods .......................................................................................................... 17
1.3.4 Scope of the research ..................................................................................................... 18
2 Context analysis and literature overview ...................................................................................... 19
2.1 Gynecology and obstetrics .................................................................................................... 19
2.1.1 The obstetric system ...................................................................................................... 19
2.2 Usefulness of clinical pathways ............................................................................................ 20
2.3 Literature on scheduling in hospitals ..................................................................................... 20
2.3.1 Tactical planning ........................................................................................................... 21
2.4 Former research on matching capacity and demand ............................................................. 22
2.4.1 Forecasting demand ....................................................................................................... 23
2.4.2 Panel sizing .................................................................................................................... 24
2.5 Conclusions ........................................................................................................................... 25
3 Analyzing the current situation ..................................................................................................... 26
3.1 The gynecology department .................................................................................................. 26
3.2 The planning process ............................................................................................................. 27
3.3 Uncomplicated pregnancies................................................................................................... 29
3.4 Clinical pathway uncomplicated pregnancy .......................................................................... 30
3.5 Conclusions ........................................................................................................................... 31
4 Model and planning tool ............................................................................................................... 32
7
4.1 Model description .................................................................................................................. 32
4.1.1 Demand ......................................................................................................................... 33
4.1.2 Capacity ......................................................................................................................... 34
4.2 Planning tool .......................................................................................................................... 35
4.2.1 Input model .................................................................................................................... 35
4.2.2 Verification planning tool .............................................................................................. 36
4.2.3 Validation outputs ......................................................................................................... 37
4.3 Conclusions ........................................................................................................................... 38
5 Conclusions .................................................................................................................................. 39
5.1 Answer research questions .................................................................................................... 39
5.2 Discussing the research ......................................................................................................... 40
6 Recommendations and implementation ........................................................................................ 42
6.1 Recommendations ................................................................................................................. 42
6.1.1 Pilot planning tool ......................................................................................................... 42
6.1.2 Planning process ............................................................................................................ 42
6.1.3 Further research ............................................................................................................. 43
6.2 Implementing the planning tool............................................................................................. 43
6.2.1 Implementation in the current process........................................................................... 43
6.2.2 Data inputs ..................................................................................................................... 44
6.3 Final conclusion .................................................................................................................... 44
7 References .................................................................................................................................... 45

8
Abbreviations
CP: follow-up patient (In Dutch: controle patient)
DTC: diagnosis treatment combination (In Dutch: diagnose behandel combinatie (DBC))
EPB: first outpatient visit (In Dutch: eerste polikliniekbezoek)
MST: Medisch Spectrum Twente
NP: new patient (In Dutch: nieuwe patient)
OBS: observation room
OR: operating room (In Dutch: operatiekamer (OK))
POR: policlinic operating room (In Dutch: poliklinische operatiekamer (POK))
RVE: result responsible unit (In Dutch: resultaat verantwoordelijke eenheid)
VKC: woman child centre (In Dutch: vrouw kind centrum)
9
1 Introduction
In this first chapter, the research will be introduced by some background information in Section 1.1,
followed by an analysis of the possible related problems in Section 1.2. This is an extensive analysis
because the primary problem is related to a lot of issues. Finally, in Section 1.3, we define the main
goal and the research questions for this research.
1.1 Background
Today’s political agenda focuses heavily on controlling health care costs. One of the latest
developments from politics is an administrative agreement on cost trends for hospital care, in which
the expenditure growth for hospital care is set to a limit. The aim is to have a maximum expenditure
growth of 2,5% each year (Ministerie VWS, 2011). This has impact on hospitals and the organization
within the hospitals. In the agreement (Ministerie VWS, 2011) it is also mentioned that redundant
capacity in hospitals needs to be reduced. It is clear that organizing processes in an efficient way is
getting more and more important for hospital organizations.
This research was performed at the outpatient department of gynecology in the hospital Medisch
Spectrum Twente (MST) in Enschede, the Netherlands. This outpatient department, also called
gynecology department, provides ambulatory care. Ambulatory care can be defined as care for which
patients come for diagnosis and treatment without staying overnight. The gynecology department is
part of the so-called “Woman Child Centre”, which besides the gynecology department consists of the
urology and the pediatrics department. At the outpatient department of gynecology, opportunities for
improvement on organizing processes efficiently are expected. The department is located in the
hospital MST in the centre of Enschede. Furthermore there are locations in Oldenzaal, Haaksbergen en
Losser where patients come on consults.
1.2 Problem analysis
The starting point for this research is that the production volume agreements are not met for the
outpatient department of gynecology. Each year agreements are made regarding the number of so-
called “first outpatient visits” (In Dutch: eerste polikliniekbezoeken (EPB’s)). An EPB is registered
when it is either the first visit to the particular outpatient department or when it is the first visit more
than twelve months after the last EPB (Nederlandse Zorgautoriteit, 2008). EPB’s generate revenue for
the outpatient department, repeat consults do not. Reaching the production volume on EPB’s is
therefore very important for the department.
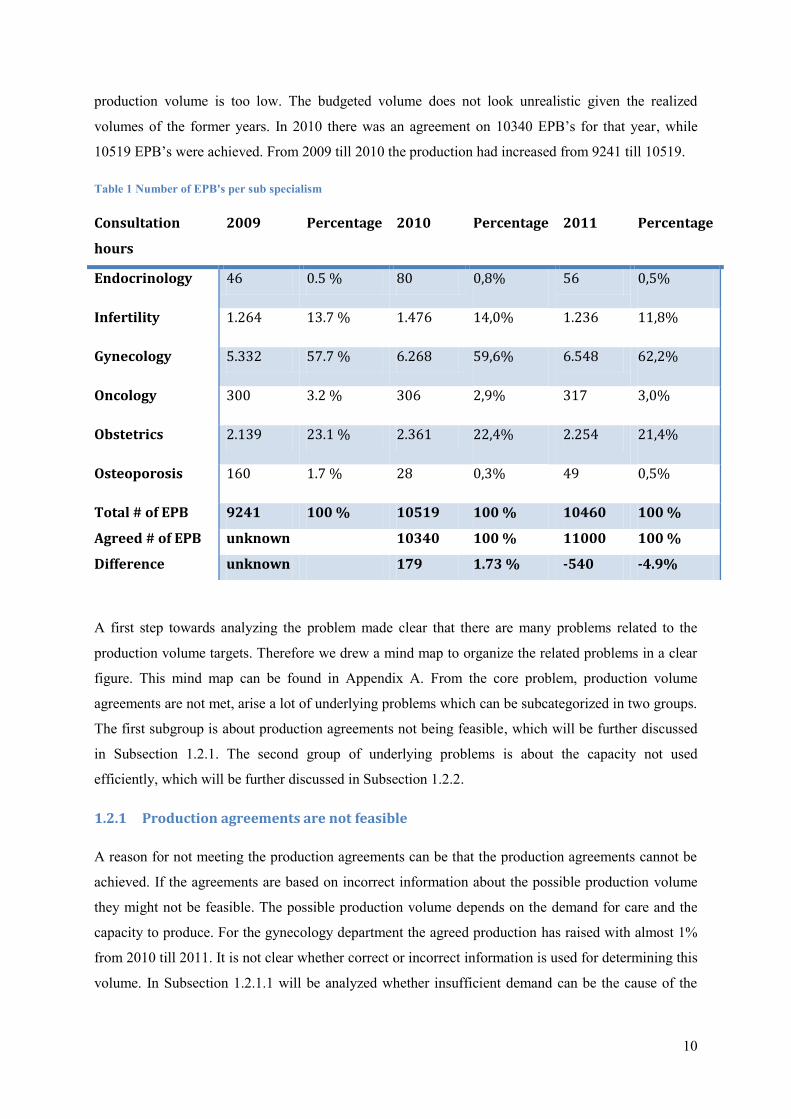
For 2011 the production volume was set on 11000 EPB’s. Table 1 shows the actual results for year
2009 to 2011. The number of registered EPB’s for 2011 are 10460, which means that the actual
10
production volume is too low. The budgeted volume does not look unrealistic given the realized
volumes of the former years. In 2010 there was an agreement on 10340 EPB’s for that year, while
10519 EPB’s were achieved. From 2009 till 2010 the production had increased from 9241 till 10519.
Table 1 Number of EPB's per sub specialism
A first step towards analyzing the problem made clear that there are many problems related to the
production volume targets. Therefore we drew a mind map to organize the related problems in a clear
figure. This mind map can be found in Appendix A. From the core problem, production volume
agreements are not met, arise a lot of underlying problems which can be subcategorized in two groups.
The first subgroup is about production agreements not being feasible, which will be further discussed
in Subsection 1.2.1. The second group of underlying problems is about the capacity not used
efficiently, which will be further discussed in Subsection 1.2.2.
1.2.1 Production agreements are not feasible
A reason for not meeting the production agreements can be that the production agreements cannot be
achieved. If the agreements are based on incorrect information about the possible production volume
they might not be feasible. The possible production volume depends on the demand for care and the
capacity to produce. For the gynecology department the agreed production has raised with almost 1%
from 2010 till 2011. It is not clear whether correct or incorrect information is used for determining this
volume. In Subsection 1.2.1.1 will be analyzed whether insufficient demand can be the cause of the
Consultation
hours
2009 Percentage 2010 Percentage 2011 Percentage
Endocrinology 46 0.5 % 80 0,8% 56 0,5%
Infertility 1.264 13.7 % 1.476 14,0% 1.236 11,8%
Gynecology 5.332 57.7 % 6.268 59,6% 6.548 62,2%
Oncology 300 3.2 % 306 2,9% 317 3,0%
Obstetrics 2.139 23.1 % 2.361 22,4% 2.254 21,4%
Osteoporosis 160 1.7 % 28 0,3% 49 0,5%
Total # of EPB 9241 100 % 10519 100 % 10460 100 %
Agreed # of EPB unknown 10340 100 % 11000 100 %
Difference unknown 179 1.73 % -540 -4.9%
11
production volume not being reached. The possibility of insufficient capacity is discussed in
Subsection 1.2.1.2.
1.2.1.1 Insufficient demand for care
When aiming to reach a certain production volume, sufficient demand is needed for the care in that
area. The demand for gynecological care has been measured by averaging patient contacts at several
outpatient departments in the Netherlands. With that information and expectations on prevalence and
incidence for gynecological care the demand for gynecological care for woman has been forecasted,
for both hospitalization and outpatient care (van Greuningen, Batenburg, & Hansen, 2010). For
outpatient care in the category woman from in the age 14-44 demand is expected to decrease with 2.97
percent and for woman in the age of 45-64 and 65-74 the demand is expected to slightly increase with
respectively 0.52 and 0.57 percent. Based on this information the overall demand for the outpatient
care in 2014 is expected to decline with 2 percent.
Another indicator for the future demand is the number of referrals from general practitioners to the
gynecological care. The number of referrals has increased over the past years. From the year 2001 till
2007 the number of referrals increased on average with 1.6 percent per year (van Greuningen,
Batenburg, & Hansen, 2010). This trend is expected to continue in the future.
Based on these indicators the report concludes a growing demand for care (van Greuningen,
Batenburg, & Hansen, 2010). Therefore it is not likely to assume that the demand for the gynecologic
department is insufficient.
1.2.1.2 Insufficient capacity
Insufficient capacity may cause a gap between agreements and performance and is therefore part of the
problem analysis. Circa 2400 EPB’s are expected to be derived from visits on the observation rooms
and the delivery rooms, where emergency patients are helped. To know whether a volume of the
remainder of 8600 EPBs is feasible we should determine the capacity on consultation hours. Although
an EPB either can be an new patients visit (NP), taking 20 minutes, or an follow-up patient (CP),
taking 10 minutes, we do our calculations with 20 minutes slots as if an EPB always is a NP. Each
consultation hour lasts on average 3 hours. Which means there is 9 NP slots in one consultation hour.
Therefore we need 8600 divided by 9 is rounded 956 consultation hours to be able to reach the agreed
production. Besides that we need capacity for the CP slots. The average repeat factor 2.68 (see
Appendix B table 5). We need 8600 times 2.68 is 23048 CP slots. There is 18 CP slots in one
consultation hour. Therefore we need 1280 consultation hours for CP slots. Together 2236
consultation hours are needed to be able to reach the agreed production volume. The planning software
gives totals on the number of scheduled consultation hours. The data is not entirely correct but it gives
an approximation of the capacity with a total of 2722 consultation hours planned throughout the year
12
2011. Based on this data the capacity on consultation hours should be more than sufficient to reach the
agreed production.
For each consultation hour one professional, a consultation room and in most cases ultrasound
equipment are necessary resources. There are 8 consultation rooms at the gynecology department at
location Enschede. The physicians do not have their own room but are assigned to one of the rooms
when doing consultations. Till now the number of consultation rooms has not been a bottleneck,
because there are not more than 8 consultation hours on the same moment. Given the number of
scheduled consultation hours and presuming 42 full working weeks per year, there is an average of 13
consultation hours per day. These are spread over the mornings and afternoons. The department has 6
echo devices. This means that it happens that one of the physicians has to work without an ultrasound
device. The physicians experience this as insufficient capacity. However, because ultrasound
examination is not always needed, this should not affect the production.
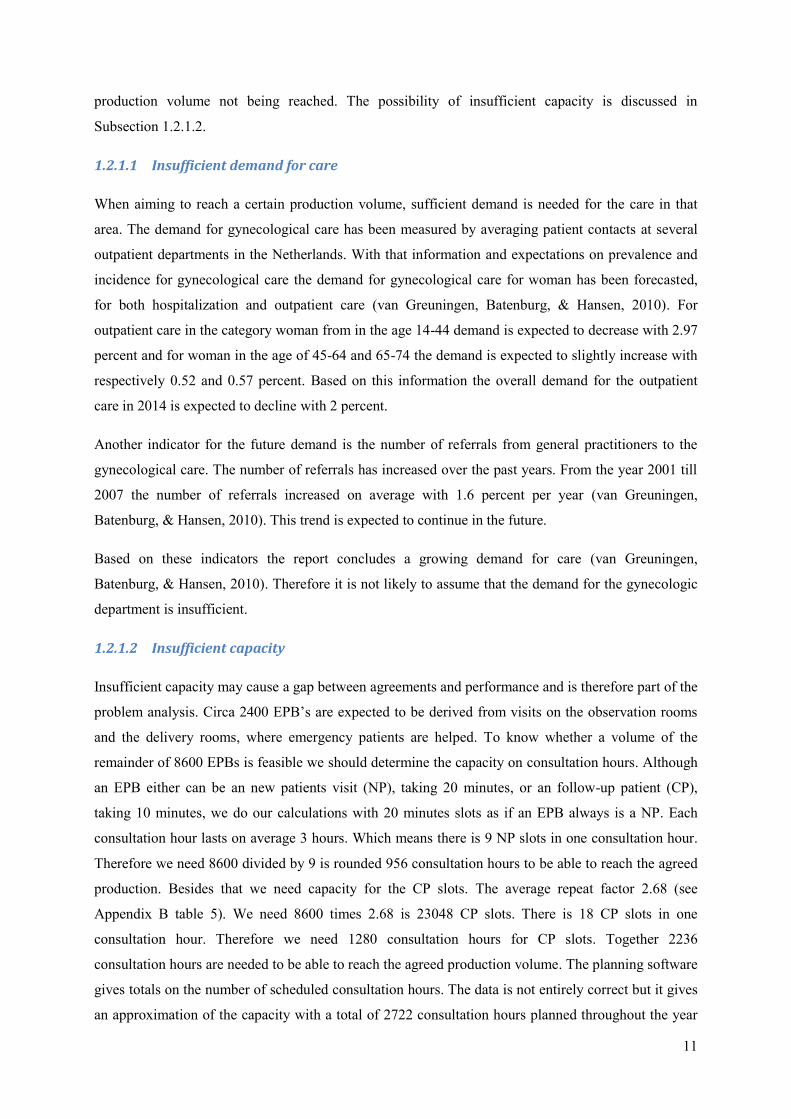
Waiting lists
Although capacity is assumed to be sufficient to reach the production volume, capacity does not
always match the demand. Due to variability in demand and supply waiting lists can occur. We can
define waiting lists as: “a queue of patients waiting for access to a service” (Vissers, van der Bij, &
Kusters, 2001). We summarized the waiting lists for consultation hours at the main location Enschede
in the Figures 1 and 2. Appendix B, Figure 14 and 15, shows the waiting lists for the location
Oldenzaal.
Figure 1 Access time outpatient department Enschede 2010
0
2
4
6
8
10
jan feb mar apr may jun jul aug sep okt nov dec
Enschede
# W
ee
ks
Access time outpatient department 2010
Gynecology Gynecology oncology Gynecology infertility Gynecology incontinence
13
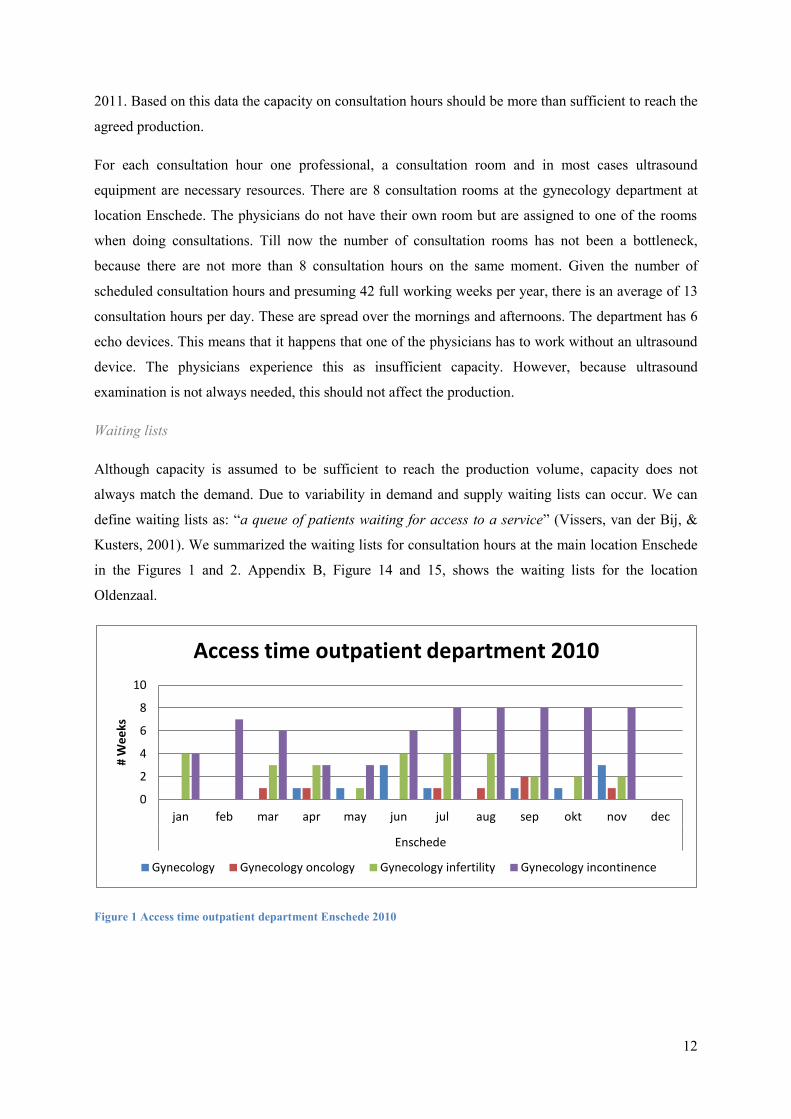
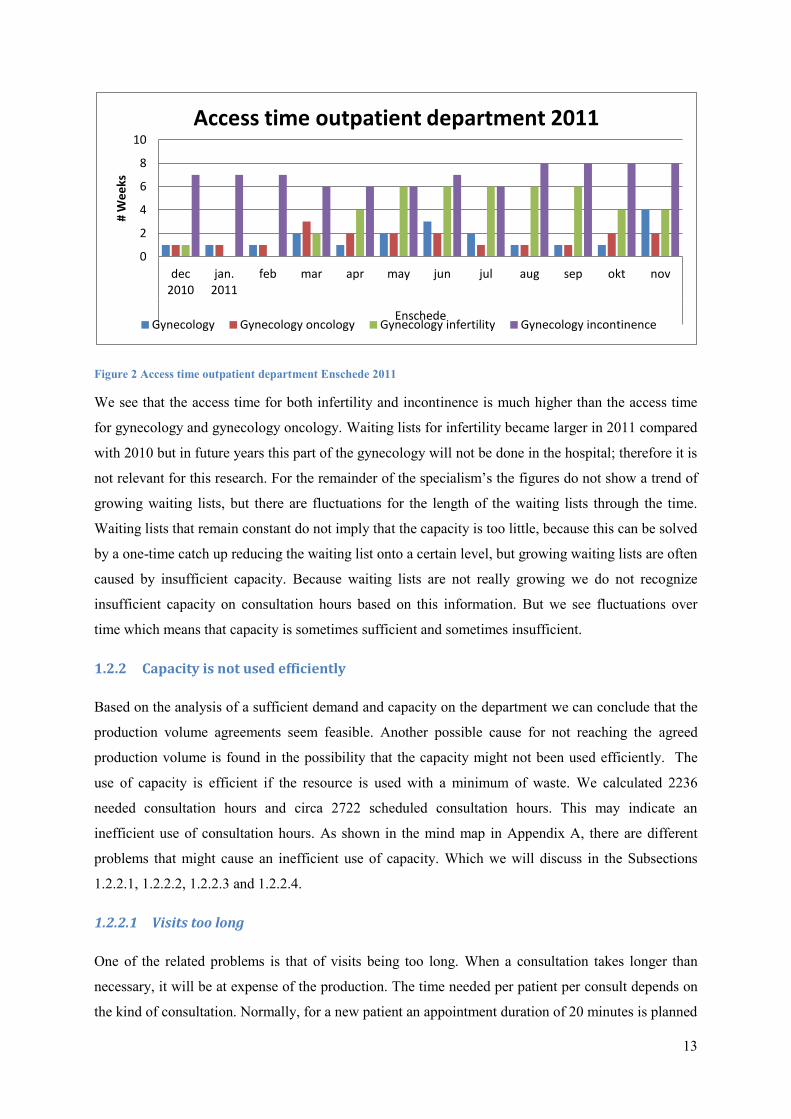
Figure 2 Access time outpatient department Enschede 2011
We see that the access time for both infertility and incontinence is much higher than the access time
for gynecology and gynecology oncology. Waiting lists for infertility became larger in 2011 compared
with 2010 but in future years this part of the gynecology will not be done in the hospital; therefore it is
not relevant for this research. For the remainder of the specialism’s the figures do not show a trend of
growing waiting lists, but there are fluctuations for the length of the waiting lists through the time.
Waiting lists that remain constant do not imply that the capacity is too little, because this can be solved
by a one-time catch up reducing the waiting list onto a certain level, but growing waiting lists are often
caused by insufficient capacity. Because waiting lists are not really growing we do not recognize
insufficient capacity on consultation hours based on this information. But we see fluctuations over
time which means that capacity is sometimes sufficient and sometimes insufficient.
1.2.2 Capacity is not used efficiently
Based on the analysis of a sufficient demand and capacity on the department we can conclude that the
production volume agreements seem feasible. Another possible cause for not reaching the agreed
production volume is found in the possibility that the capacity might not been used efficiently. The
use of capacity is efficient if the resource is used with a minimum of waste. We calculated 2236
needed consultation hours and circa 2722 scheduled consultation hours. This may indicate an
inefficient use of consultation hours. As shown in the mind map in Appendix A, there are different
problems that might cause an inefficient use of capacity. Which we will discuss in the Subsections
1.2.2.1, 1.2.2.2, 1.2.2.3 and 1.2.2.4.
1.2.2.1 Visits too long
One of the related problems is that of visits being too long. When a consultation takes longer than
necessary, it will be at expense of the production. The time needed per patient per consult depends on
the kind of consultation. Normally, for a new patient an appointment duration of 20 minutes is planned
0
2
4
6
8
10
dec 2010
jan. 2011
feb mar apr may jun jul aug sep okt nov
Enschede
# W
ee
ks
Access time outpatient department 2011
Gynecology Gynecology oncology Gynecology infertility Gynecology incontinence
14
and for a repeat consultation 10 minutes is booked. In a study on the future labor market for
gynecologists, gynecologists are questioned on the time they use per patient. On average the study
shows 19,4 minutes needed for a new patient and 11.1 minutes for a follow-up patient (van
Greuningen, Batenburg, & Hansen, 2010). The time per appointment in MST is just slightly different
from the average needed time in the study. Therefore it seems unlikely that the time per consultation is
too long or too short.
1.2.2.2 Too many repeat visits
The more time needed for CP visits for follow-up patients, the less time is available for the production
of EPB’s. Follow-up consults are included in the diagnosis treatment combination (DTC) for the EPB
and do therefore not generate any revenue. In Table 5 (in appendix B) the repeat factor of the different
patient groups is shown. Most of the factors are around 1 and 2, only the factor for obstetrics is much
higher. Although there is a striking repeating factor of more than 6 for the obstetric consultation hours,
judgments cannot yet be made because of insufficient knowledge of the standard in repeat visits for
this specialism. From the perspective of using available capacity efficiently, repeat consultations
should be restricted. No more repeat consultations should be performed than recommended in clinical
pathway descriptions. The released capacity can then be used for other patients.
1.2.2.3 Not all capacity used
The right use of capacity depends also on the use of each planned slot. An issue is the occurrence of
no shows. That means that people who are planned on a certain day do not come to the outpatient
department. There can be personal reasons for not showing, but it is also possible that an employee
made a mistake in the planning of the patient. In 2011 there were 1880 no shows, see also Figure 16
(in Appendix B). This is a lot of unused capacity. According to the trend this number is increasing
over time. Currently, a study is going on in which the medical secretary calls the patients to ask for the
reason of staying away, to gain insight in the problem, and to reduce the number of no-shows in the
future.
Another issue is related to unused slots. The planning starts with scheduling the number of
consultation hours. The consultation hours are assigned to a certain sub specialism with the right
professional. After that, patients are planned at the slots within the consultation hours. We assumed
that demand would be sufficient. However, the demand for care for the different sub specialism’s
within gynecology varies. Although we do not depose of precise numbers, it happens regularly that the
staff finds out that there are still some unused slots for a certain sub specialism. To prevent empty slots
the head of the unit tries to regularly check the patient planning. More insight in demand on forehand
could make tackling this problem much easier. Given the above analysis improvements related to
unused capacity are expected to be possible.
15
1.2.2.4 Planning is not optimal
In the last part of the previous paragraph is mentioned that although there is sufficient demand and
capacity, demand does not always match with the capacity. On the department there is one employee
in charge of the planning. She tries to plan the right number of consultation hours per week. The
process of planning the production has to be done on several levels: strategically, tactical and
operational. These levels will be further specified in Chapter 2. The planning described here is at the
tactical level. The tactical level is facing the challenge of matching the demand with the capacity.
Optimal planning arises when demand and capacity are balanced with a positive effect on the
production volume. However, at the department there is a lot of uncertainty about the demand and the
capacity related to this level. Therefore it is not possible to judge the performance properly.
Uncertainty on the demand for care per sub specialism on the intermediate term makes matching the
capacity with the demand difficult. Especially when the absence of the physicians for congresses,
vacations or research is not aligned with developments in the demand of care neither with the absence
of colleague physicians.
In the planning process the department tries to take into account some expectations on the demand for
care but after all the planning is highly supply driven. Because of the different specialties of the
physicians and physician assistants, the supply or capacity on a certain moment influences the
schedule. To be able to reach the production agreements the aim should be to adapt the capacity to the
demand. At this level, there is much improvement to be made which will make the use of capacity
more efficient.
1.3 Problem definition
The performed problem analysis made aware of the extensiveness of the subject of not reaching the
agreed production. A lot of problems seem to contributed to this main problem. To solve the main
problem we want to tackle one of the sub problems. The problem analysis reveals that insufficient
capacity or demand is not the issue. The most relevant problems were found within the subgroup:
capacity is not used efficiently. Although the problems within this subgroup can be interrelated we
focus on one problem. A very relevant and interesting part is that of the planning not being optimal.
This will be the focus of this research. Finding a solution on making a planning with a better match
between capacity and demand will help to use the capacity more efficient.
A match between capacity and demand is needed when planning consultation hours per sub
specialism. The problem analysis shows that there is no insight in the performance on this match.
There is uncertainty on the demand for the different specialism’s. Insight in this demand can make a
better match between capacity and demand, which will reduce the chance that capacity is not used
efficiently because the capacity is actually needed within another sub specialism for a certain week.

16
To develop a model that makes this match possible this research makes use of so-called clinical
pathways. A clinical pathway describes the path a patient goes through after a first visit. It describes
when a patient should be seeing a certain caregiver. Clinical pathways will be discussed in more detail
in Chapter 2.2. The idea that future demand is partly based on the demand of patients already in the
system and following a certain path, is very important in this research.
1.3.1 Main goal
The aim of this study is to analyze the current tactical planning process and to develop a model that
provides information on the expected demand of care and needed capacity to support the planning on
the outpatient department with the goal to improve the match between capacity and demand.
This in turn can make the use of capacity more efficient to ensure that inefficiency is not the problem
that limits the department form reaching the agreed production volume.
1.3.2 Research questions
To reach the research goal, we need to answer the following research questions:
1. What relevant information can be found in literature on tactical planning of capacity and
demand?
2. How is the current planning process organized?
3. How can we develop a model to provide insight in the expected demand and the needed
capacity to improve the match between capacity and demand for ambulatory care?
4. Is the planning tool, based on the model, useful in improving the match between capacity and
demand?
5. What are the conclusions and discussion points of this research?
6. Which recommendations can be done to the gynecology department?
7. How can we implement the planning tool into the planning process?
The next paragraph will explain the methods used to answer the research questions.
17
1.3.3 Research methods
This research can be called applied research. Babbie (2007) distinguishes between pure and applied
research. Pure research is meant to derive knowledge and theories about a certain topic whereas
applied research aims to apply a solution in a certain case. We try to find an intervention that will
work in practice for this specific organization. Therefore this is an design-oriented case-study. To be
able to design a model this research contents two of the purposes described by Babbie (2007). These
purposes are exploration, description and explanation. This research has both descriptive and
explanatory elements. Descriptive by questioning the performance of the current situation and the
current process. And explanatory by identifying possible reasons and possibilities for improvement.
Both qualitative and quantitative methods are used to get the needed information. Designing a model
to improve the current planning process is the ultimate goal.
To answer the first research question we will search for literature on planning methods and former
research on improvement of planning processes. The search engines Scopus and Google scholar are
the main sources for literature search. The results on the literature study are provided in Chapter 2.
Answering question 2 is done by analyzing the planning process by observing the process and by
questioning the head of the unit and the employee in charge of the planning. We use open
interviewing. This means that there are some questions prepared on forehand, the rest of the questions
depend on the conversation. Furthermore, we analyze some work descriptions and protocols. An
employee in charge of the data warehouse provides data on the number of EPB’s per month per
diagnose, repeat factors, access times and no shows. The results of the analysis can be found in
Chapter 3.
To answer the third question we identify the variables needed to determine the future demand. Then
we develop a model in which we link future demand and capacity. We use Excel to make a planning
tool. With verification and validation on the model we give an answer on the fourth question. Chapter
4 describes and validates the model and the planning tool.
The answer on the fifth question will follow from the results in Chapter 4. We gather the suggestions
that are found during research. With reference to the developed model and the planning process we list
the conclusions and discussion points in Chapter 5.
To answer question 6 we gather the recommendations based on the conclusions of the research. The
recommendations are discussed together with members of the department. This is described in Chapter
6. This chapter will also answer question 7, outlining ways for implementation. We will also develop a
manual for the planning tool in collaboration with the head of the department.
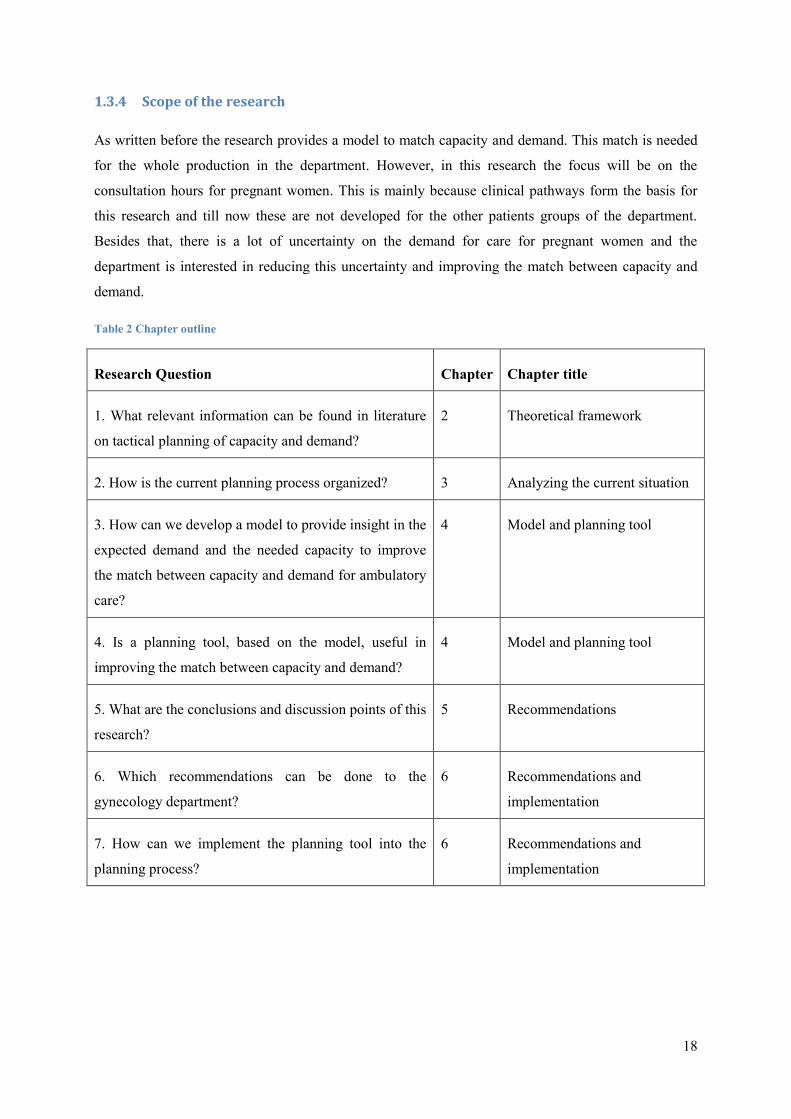
Table 2 gives an overview on the research questions and the linked chapters in this thesis.
18
1.3.4 Scope of the research
As written before the research provides a model to match capacity and demand. This match is needed
for the whole production in the department. However, in this research the focus will be on the
consultation hours for pregnant women. This is mainly because clinical pathways form the basis for
this research and till now these are not developed for the other patients groups of the department.
Besides that, there is a lot of uncertainty on the demand for care for pregnant women and the
department is interested in reducing this uncertainty and improving the match between capacity and
demand.
Table 2 Chapter outline
Research Question Chapter Chapter title
1. What relevant information can be found in literature
on tactical planning of capacity and demand?
2 Theoretical framework
2. How is the current planning process organized? 3 Analyzing the current situation
3. How can we develop a model to provide insight in the
expected demand and the needed capacity to improve
the match between capacity and demand for ambulatory
care?
4 Model and planning tool
4. Is a planning tool, based on the model, useful in
improving the match between capacity and demand?
4 Model and planning tool
5. What are the conclusions and discussion points of this
research?
5 Recommendations
6. Which recommendations can be done to the
gynecology department?
6 Recommendations and
implementation
7. How can we implement the planning tool into the
planning process?
6 Recommendations and
implementation
19
2 Context analysis and literature overview
This chapter provides a brief analysis of the context of the research and contains an overview of the
relevant literature regarding the research questions. Context information on the obstetric system and
clinical pathways is discussed in Section 2.1 and 2.2. Section 2.3 and 2.4 give an answer to the first
research question: What relevant information can be found in literature on tactical planning of
capacity and demand? In Section 2.3, the theory on planning on a tactical level is described. Section
2.4 provides literature on matching capacity and demand. And Section 2.5 gives the implications of
this information for the research.
2.1 Gynecology and obstetrics
The specialisms gynecology and obstetrics deal with all kind of woman diseases. Originally a
gynecologist was dealing with all the diseases in his department. In 1972, however, the American
Board of Obstetrics and Gynecology formed some subspecialties within the discipline of gynecology
and obstetrics (American Board of Obstetrics and Gynecology, 2009). This lead to the creation of the
sub specialism’s: gynecologic oncology, maternal-fetal medicine, reproductive endocrinology and
infertility. In the Netherlands accepted sub specialism’s are:
- gynecologic oncology: for cancer in the female genital;
- obstetric perinatology: for high risk pregnancies;
- urogynecology: for pelvic floor problems and incontinence;
- reproductive medicine: for man and woman with fertility problems.
2.1.1 The obstetric system
The obstetric care in the Netherlands is delivered by obstetricians, gynecologists and physician
assistants. There is a distinction between first line and second line care. First line care is delivered
close to home with obstetricians counseling the pregnancy as long as the progress is normal. The first
line obstetrician is able to detect a possible increased risk. The patient is then referred to second line
care. This care is delivered at a hospital by gynecologists and obstetricians working under supervision
of a gynecologists. Risk selection is very important in choosing for first line or second line care and is
an continuing process during the pregnancy (Bais & Pel, 2007). The supply of patients in the obstetric
system is via the first line. The first line refers to the second line. Lako & Rosenau (2009) show that
the choice for the hospital is often made by the referring obstetrician or general practitioner, namely in
58% of the cases. For 18% of the patients the choice was based on the reputation and 24 % chose for
another reason e.g. location.
20
2.2 Usefulness of clinical pathways
Clinical pathways or integrated care pathways are very important in this thesis. The model for the
forecast of future demand is based on the patient flow outlined by the clinical pathway for
uncomplicated pregnancies. Vanhaecht, De Witte, & Sermeus (2007) give the following definition for
a clinical pathway, also known as care pathway:
“A care pathway is a complex intervention for the mutual decision making and organization of care
processes for a well-defined group of patients during a well-defined period.
Defining characteristics of care pathways include:
i. An explicit statement of the goals and key elements of care based on evidence, best practice,
and patients’ expectations and their characteristics;
ii. the facilitation of the communication among the team members and with patients and families;
iii. the coordination of the care process by coordinating the roles and sequencing the activities of
the multidisciplinary care team, patients and their relatives;
iv. the documentation, monitoring, and evaluation of variances and outcomes; and
v. the identification of the appropriate resources.”
The origin of this phenomenon is to be found in the industrial quality management. Standard operating
procedures (SOP) where developed to use the resources in a more efficient way and to use a standard
amount of time to finish a certain task . Clinical pathways were first used in the New England Medical
Center in the USA. Originally clinical pathways were used to design care processes to deliver
qualitative good care. Today the clinical pathways are also used to improve the efficiency in processes
(Vanhaecht, Panella, van Zelm, & Sermeus, 2010). Literature and guidelines need to be input for the
pathways. To guarantee the validity of clinical pathways and the quality of the care process itself,
there should be continuous improvement (Vanhaecht, Panella, van Zelm, & Sermeus, 2010).
When starting to use clinical pathways the design of the pathway makes care givers think about the
current care processes. Changing certain elements of the process in the creation of the pathway causes
the first improvements. In a survey with questions on the ways in which clinical pathways can be used,
most respondents agreed that pathways can be used for allocating resources and workforce and service
planning. The actual use in the questioned applications was much lower (Hindle, Dowdeswell, &
Yasbeck, 2004).
2.3 Literature on scheduling in hospitals
The literature search on matching capacity and demand learned that there are a lot of topics regarding
scheduling in different parts of health care at different levels. A lot of research is performed to find
ways to improve the capacity utilization in hospitals. The simulation model PROMT is an example of
21
software that can be used to simulate different scenarios the resources beds, operating theatres and
nurses (Harper, 2002). This example is totally based on hospitals as a place where patients stay
overnight. There is also literature on appointment systems in outpatient departments, especially on the
operational level. Simulation is often used to reduce waiting times for patients and to avoid idle time
of physicians. Cayirli & Veral (2003) reviewed the literature for outpatient scheduling appointments,
concluding that a lot of studies are too case-specific to use in other cases and that a lot of possible
appointments schedules are found but there is a lack of knowledge on variation in patient flow.
Moreover appointment rules were not successfully implemented in practice.
Appointment systems assume a certain amount of capacity in the system. Often this capacity is fixed,
when filling up with appointments. However, capacity in a department working with physicians with
different subspecialties is partly variable. This means that a decision needs to be made on how much
time or capacity, is used on a certain sub specialism. In some literature importance of these decisions
is stated but not included in the research (Gupta & Denton, 2008). They describe that in case of several
medical specialties access rules are used to determine the needed time for a certain type of
appointment. Literature on appointment systems is often on the operational level, while this research
focuses on decisions on a tactical level, which will be explained in the next paragraph.
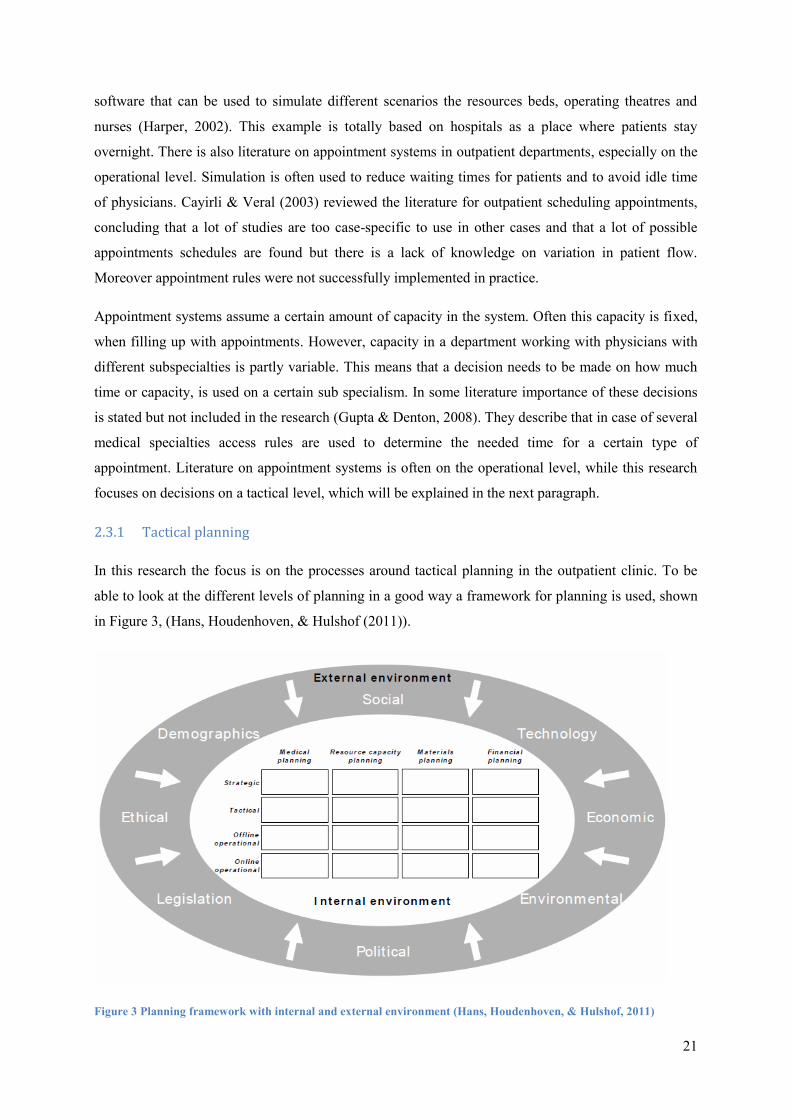
2.3.1 Tactical planning
In this research the focus is on the processes around tactical planning in the outpatient clinic. To be
able to look at the different levels of planning in a good way a framework for planning is used, shown
in Figure 3, (Hans, Houdenhoven, & Hulshof (2011)).
Figure 3 Planning framework with internal and external environment (Hans, Houdenhoven, & Hulshof, 2011)
22
This framework enables the user to place each planning function and activity in the right context.
There is a lot of interaction between the boxes. For instance strategic decisions have impact on tactical
planning and the performance on the tactical level can influence the strategic decisions in a next
period. In addition, the different planning areas, medical planning, material planning and financial
planning, do influence the decisions and choices for the tactical resource capacity planning. The
financial planning provides constraints or possibilities for decisions in the other planning areas.
Besides the internal environment the framework includes the external environment of a health
organization. As written in the introduction there is a major role of the politics influencing the
decisions in a hospital regarding cost efficiency. Another issue already mentioned in Chapter 1 is that
of demographics, because it determines the expected demand in a certain area.
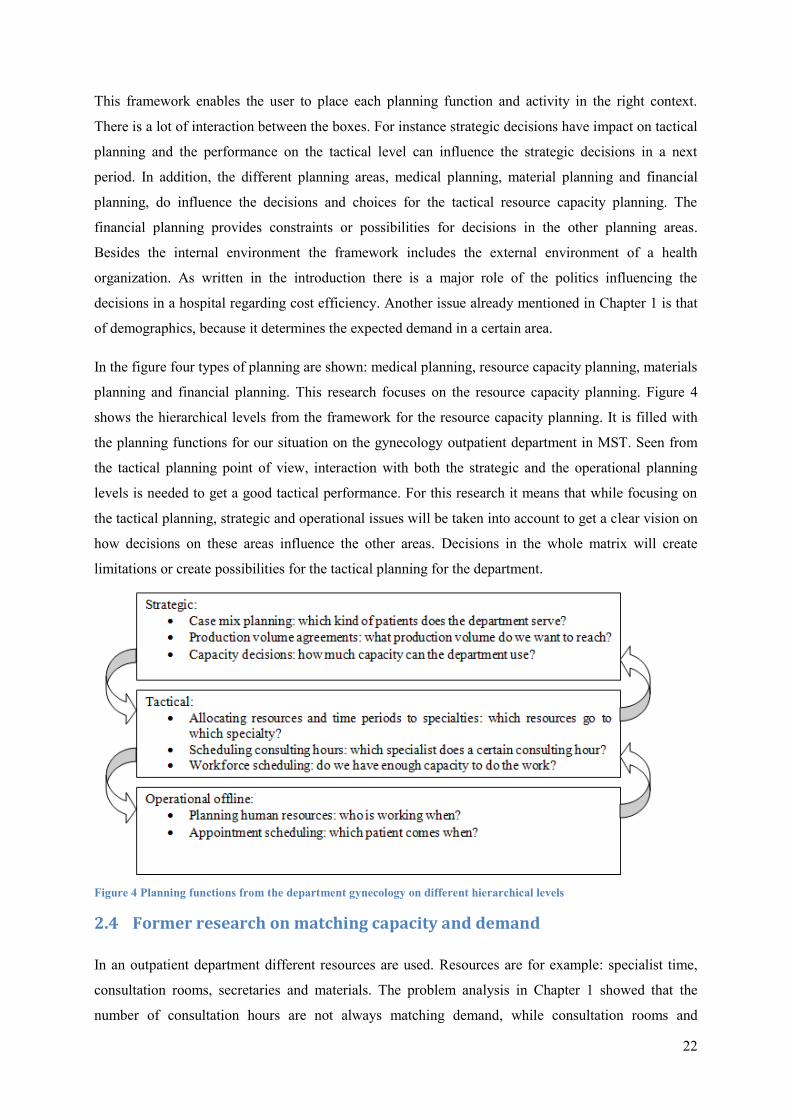
In the figure four types of planning are shown: medical planning, resource capacity planning, materials
planning and financial planning. This research focuses on the resource capacity planning. Figure 4
shows the hierarchical levels from the framework for the resource capacity planning. It is filled with
the planning functions for our situation on the gynecology outpatient department in MST. Seen from
the tactical planning point of view, interaction with both the strategic and the operational planning
levels is needed to get a good tactical performance. For this research it means that while focusing on
the tactical planning, strategic and operational issues will be taken into account to get a clear vision on
how decisions on these areas influence the other areas. Decisions in the whole matrix will create
limitations or create possibilities for the tactical planning for the department.
Figure 4 Planning functions from the department gynecology on different hierarchical levels
2.4 Former research on matching capacity and demand
In an outpatient department different resources are used. Resources are for example: specialist time,
consultation rooms, secretaries and materials. The problem analysis in Chapter 1 showed that the
number of consultation hours are not always matching demand, while consultation rooms and
23
equipment were sufficient. Therefore the specialist time is assumed to be the bottleneck resource.
Specialist time is a shared resource which has to be divided among different patient care activities,
such as operating theatres, clinic sessions and consultation hours per sub specialism (Vissers J. ,
2005).
2.4.1 Forecasting demand
To obtain a match between capacity and demand information on the expected future demand is
essential for planning on the different planning levels. Forecasting can be used to determine the
expected demand for a future time frame. Although a forecast is never exact it can be used to decide
on the planning of resources.
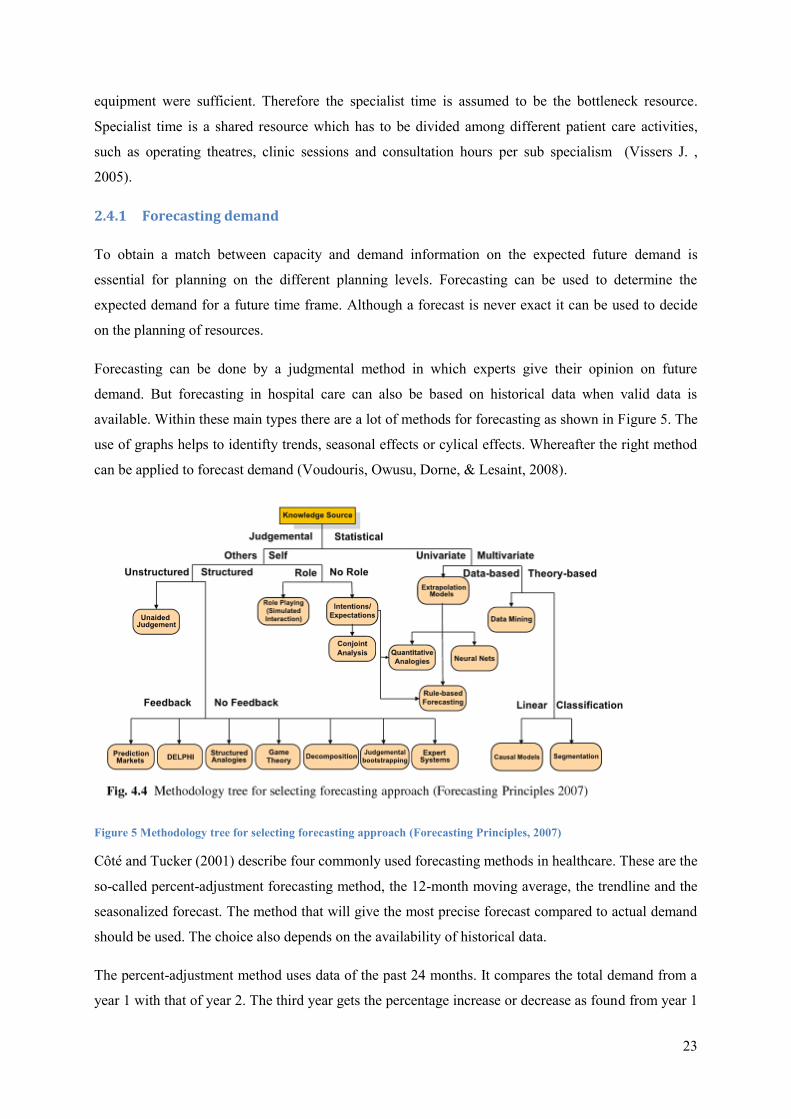
Forecasting can be done by a judgmental method in which experts give their opinion on future
demand. But forecasting in hospital care can also be based on historical data when valid data is
available. Within these main types there are a lot of methods for forecasting as shown in Figure 5. The
use of graphs helps to identifty trends, seasonal effects or cylical effects. Whereafter the right method
can be applied to forecast demand (Voudouris, Owusu, Dorne, & Lesaint, 2008).
Figure 5 Methodology tree for selecting forecasting approach (Forecasting Principles, 2007)
Côté and Tucker (2001) describe four commonly used forecasting methods in healthcare. These are the
so-called percent-adjustment forecasting method, the 12-month moving average, the trendline and the
seasonalized forecast. The method that will give the most precise forecast compared to actual demand
should be used. The choice also depends on the availability of historical data.
The percent-adjustment method uses data of the past 24 months. It compares the total demand from a
year 1 with that of year 2. The third year gets the percentage increase or decrease as found from year 1
24
to year 2. From that total expected demand for year 3 the average expected demand per month is
taken. So it doesn’t take into account the fluctuations between months.
The 12-month moving average calculates a forecast per month. The forecast for each month is the
average of the 12 months before that month. This is more accurate compared to the percent-adjustment
method, because the forecast changes per month. However, the forecast becomes less accurate when
for example a steep decline occurs over the last three months because the method smoothes this trend.
The trend line method does account for trends. In this method the slope of the trend line is measured.
With that slope the future demand is forecasted. So this method is more precise than the
aforementioned, but it does not account for seasonality.
The last method is called seasonalized forecast. This method involves adjustments for trend and
seasonality. The average over two former years is adjusted by an seasonal index per month and by the
slope of the trend. This will be a more advanced calculation when implementing in the department, but
it gives a more accurate forecast. It depends the existence of a trend or seasonal effect whether it is
needed to use this last method or not.
2.4.2 Panel sizing
The forecast in Subsection 2.4.1 is about the expected new patients based on historical data. Besides
new patients an outpatients provides care to patients already in a clinical pathway. Therefore a forecast
on demand should also be able to determine the expected demand for control patients. Methods
developed to determine this number of patients are found in literature. For family practices a panel size
can be calculated which assumes that there is a maximum number of patients that can be helped by
one health care provider (Murray, Davies, & Boushon, 2007).
Vanberkel (2011) studied panel sizing in oncology. In this panel sizing the panel size, the maximum
number of new patients a physician should follow, taking into account new patients will come back for
repeat visits, are determined. In oncology there are also patients that after discharge relapse into the
care system. So a patient can either be a new patient, an active patient or an inactive patient. After a
period the inactive patient returns to be an active patient again or else exits the care. The study is based
on the statement that the number of patients treated today are indicator for future demand.
Probabilities are used to determine the state of the patients. And a distribution is used to determine the
length of time in a certain state.
In this research the number of new patients today are also indicator for future demand. We assume that
each patient follows a clinical pathway. In the clinical pathway each of the consecutive steps are
defined and also the period of time between the steps is determined. Therefore we can take into
account the demand for control patients.
25
2.5 Conclusions
Background information on the obstetric field learns that the specialty contains different
subspecialties. The care in hospitals is called second line care and their patients come from the first
line care provided by general practitioners and obstetricians. According to literature clinical pathways
are developed to organize the care to perceive good quality of care. In this research we want to use the
pathway for improvements on the planning process. Literature endorses that clinical pathways can be
used to improve the quality of the processes. Planning is done on different levels. The focus of this
research is on the tactical level. The planning functions in MST are placed in the planning framework.
In this research specialist time will also be assumed to be the bottleneck resource which is reflected in
the fact that we focus on the planning of specialists for consultation hours. To match the capacity with
demand we need to know the expected future demand on uncomplicated pregnancies. Literature shows
that demand can be forecasted with different forecasting methods. For this research we use historical
data to forecast demand. In Chapter 3 the historical data on new patients for uncomplicated
pregnancies is analyzed. It shows that at least seasonality should be taken into account. To take into
account also the patients already in the clinical pathway we use the idea as in panel sizing. The
principle, number of patients treated today are indicator for future demand, will be used in the model
developed in this research.
26
3 Analyzing the current situation
Chapter 3 is about the current situation on the department providing an answer on the research
question: How is the current planning process organized? Section 3.1 explains the context situation
for the gynecology department. In Section 3.2, the planning process is described. Section 3.3 gives
some facts on the uncomplicated pregnancies and Section 3.4 explains the clinical pathway for this
target group. Section 3.5 will draw a conclusion from the analysis in this chapter.
3.1 The gynecology department
Outpatient departments are the departments in a hospital were patients come to visit a physician and
then go home afterwards. An outpatient department in MST operates as a so-called “result responsible
unit” (In Dutch: resultaat verantwoordelijke eenheid (RVE)). Each RVE has its own budget, needs to
reach previously set targets and has to justify its results in front of the board of the hospital (MST,
2008). Each year the production volume is determined by the board of the hospital and the physicians,
working in a partnership (In Dutch: de maatschap). The negations of the board with the insurance
companies influence these decisions.
The gynecology department of this hospital is serving the specialisms gynecology and obstetrics. Care
is delivered by gynecologists, obstetricians, echoscopists and physician assistants. The physician
capacity planning is in this paper covering different tasks for the specialists. For example the tasks to
do a ward round, doing an operating theatre session or a clinic session with consultation hours in an
outpatient department. On the VKC building a policlinic operating room (POR) is available for
physicians doing minor surgeries after which the patient can go home. Also a so-called observation
room (OBS) is available to receive emergency patients; a physician is needed on the observation room
as well. The planning on consultation hours is often a closing item. Some of the tasks can also be done
by physician assistants. They do consultation hours independently, with the help of a supervising
physician when needed.
The outpatient department for gynecology serves different sub specialism’s. In this research we focus
on the consultation hours. Different consultation hours are held for each sub specialism. This means
that the following consultation hours can be distinguished:
- Consultation gynecology - Consultation oncology
- Consultation pregnant - Consultation sexology
- Consultation high risk/ perinatology - Consultation osteoporosis
- Consultation urogyn (two specialism’s: urology and gynecology)
27
3.2 The planning process
In this research the planning processes on the tactical level of the planning framework are covered.
The focus is on the consultation hour schedule. To come to such a schedule the planner allocates
resources to the different tasks of physicians as doing ward rounds and operating theatres. After that
the planner decides on the number of consultation hours per sub specialism. As written before a
consultation hour is on average a 3 hour shift.
At the time of this study there is one employee in charge of the capacity planning for the physicians.
This employee has the knowledge for the planning in the specific situations within this department.
Three months in advance the planner aims to have finished the schedule. The planning for the
physician assistants is done by one the physicians in charge of the education of the physician
assistants, because he or she is informed of the current knowledge of the physician assistants. This
planning comes often one month in advance. The employee in charge of the planning tries to optimize
the match between the two schedules and finishes the total consulting hour schedule.
In Figure 6 the current planning process is shown. First step is to determine the available physicians.
Then ward shifts need to be filled in. Then the holidays and congresses of physicians need to be
blocked. Furthermore physicians need to be allocated to both the general OR and the policlinic OR.
After that physicians can be scheduled for consultation hours spread over different sub specialism’s.
The schedule of the physicians then needs to be combined with the schedule of physician assistants
which might result in adjustments. After that the final schedule is ready.
There are some constraints concerning the preferences of physicians regarding working hours,
consulting hours, days off, days in congress etcetera. The listed preferences beneath are taken into
account when making the consulting hour schedule:
- After a shift of clinic service there needs to be a scheduled day off.
- For part-timers this should be on an already free day because of the part-time working.
- Working hours are from 8.00-16.30.
- A physician needs to do two OR’s per month
- A weekend shift is spread over two weeks. This means working on Friday and Sunday the first
week and working on Saturday the next week.
The software used to make the planning is called Medspace. This is an internet application which is
kept by the employee in charge of the planning. Figure 7 shows a screenshot of the schedule in
Medspace. The white areas on the left normally contain the names of the resources, either physicians
or assistants. The planner uses abbreviations to fill in the schedule, which is done manually. The
system is therefore quite error-prone and needs revisions before making public.
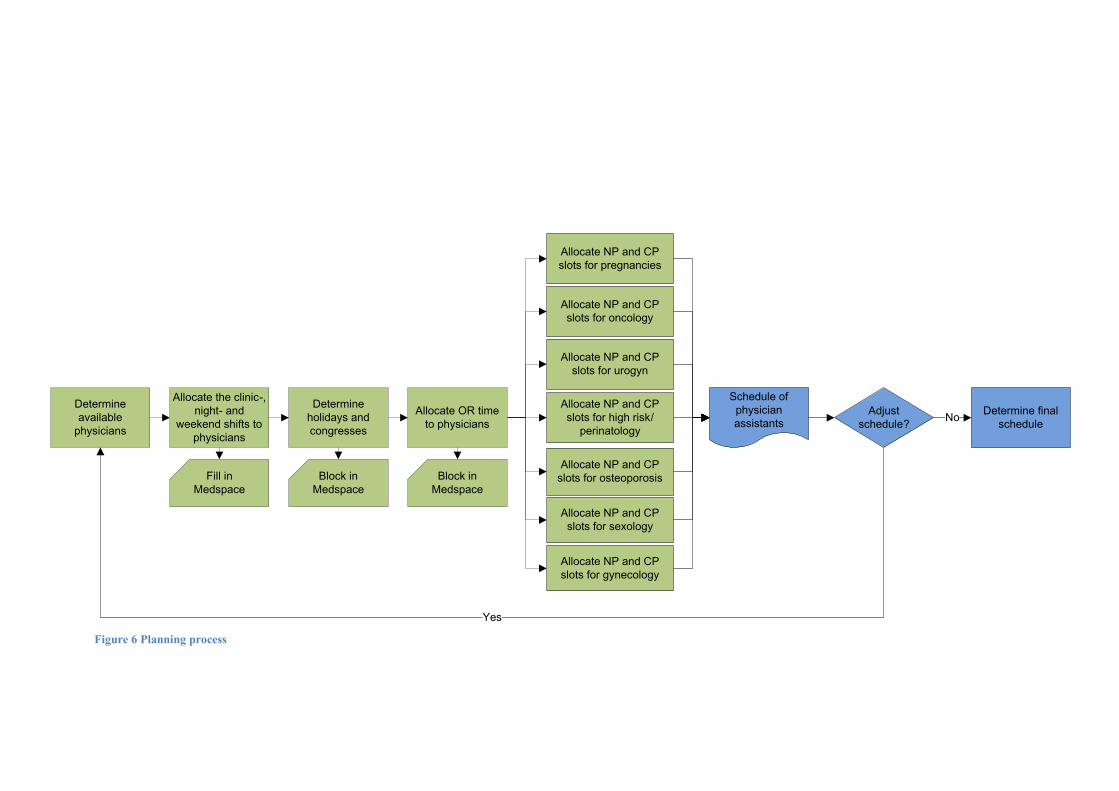
Figure 6 Planning process
Determine
available
physicians
Allocate the clinic-,
night- and
weekend shifts to
physicians
Fill in
Medspace
Determine
holidays and
congresses
Block in
Medspace
Allocate OR time
to physicians
Block in
Medspace
Allocate NP and CP
slots for gynecology
Allocate NP and CP
slots for pregnancies
Allocate NP and CP
slots for urogyn
Allocate NP and CP
slots for high risk/
perinatology
Allocate NP and CP
slots for oncology
Allocate NP and CP
slots for sexology
Allocate NP and CP
slots for osteoporosis
Schedule of
physician
assistantsAdjust
schedule?
Determine final
scheduleNo
Yes
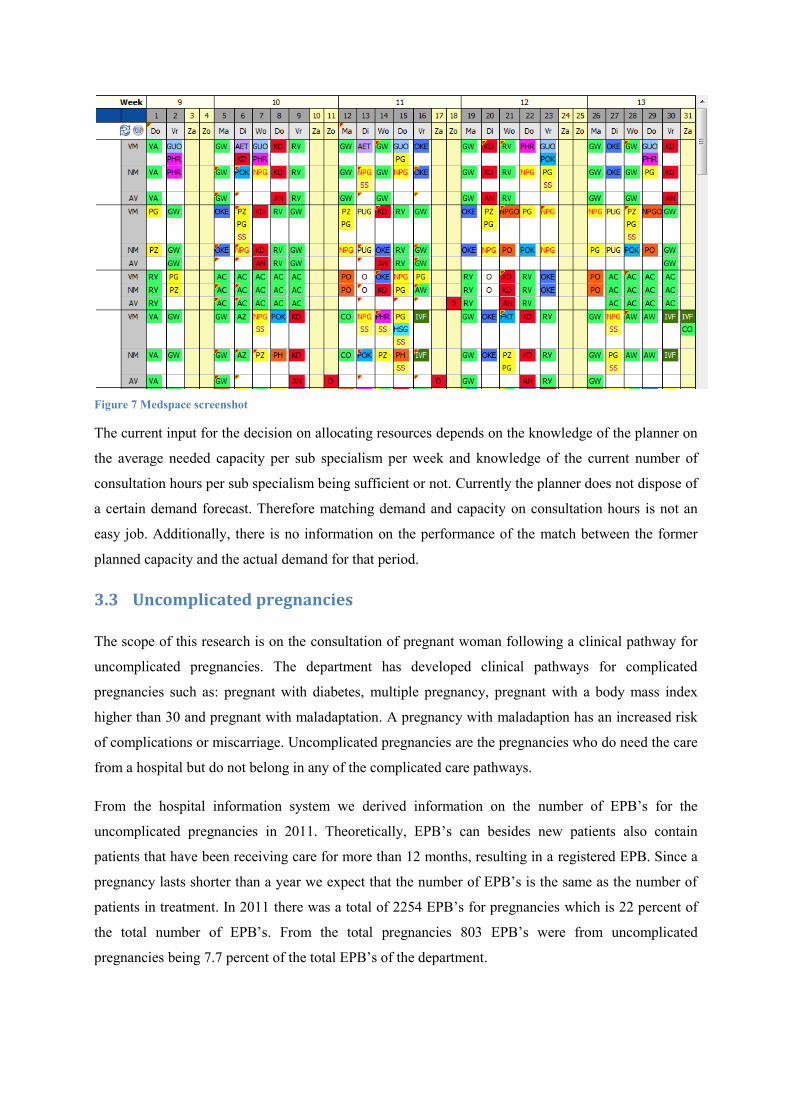
Figure 7 Medspace screenshot
The current input for the decision on allocating resources depends on the knowledge of the planner on
the average needed capacity per sub specialism per week and knowledge of the current number of
consultation hours per sub specialism being sufficient or not. Currently the planner does not dispose of
a certain demand forecast. Therefore matching demand and capacity on consultation hours is not an
easy job. Additionally, there is no information on the performance of the match between the former
planned capacity and the actual demand for that period.
3.3 Uncomplicated pregnancies
The scope of this research is on the consultation of pregnant woman following a clinical pathway for
uncomplicated pregnancies. The department has developed clinical pathways for complicated
pregnancies such as: pregnant with diabetes, multiple pregnancy, pregnant with a body mass index
higher than 30 and pregnant with maladaptation. A pregnancy with maladaption has an increased risk
of complications or miscarriage. Uncomplicated pregnancies are the pregnancies who do need the care
from a hospital but do not belong in any of the complicated care pathways.
From the hospital information system we derived information on the number of EPB’s for the
uncomplicated pregnancies in 2011. Theoretically, EPB’s can besides new patients also contain
patients that have been receiving care for more than 12 months, resulting in a registered EPB. Since a
pregnancy lasts shorter than a year we expect that the number of EPB’s is the same as the number of
patients in treatment. In 2011 there was a total of 2254 EPB’s for pregnancies which is 22 percent of
the total number of EPB’s. From the total pregnancies 803 EPB’s were from uncomplicated
pregnancies being 7.7 percent of the total EPB’s of the department.
30
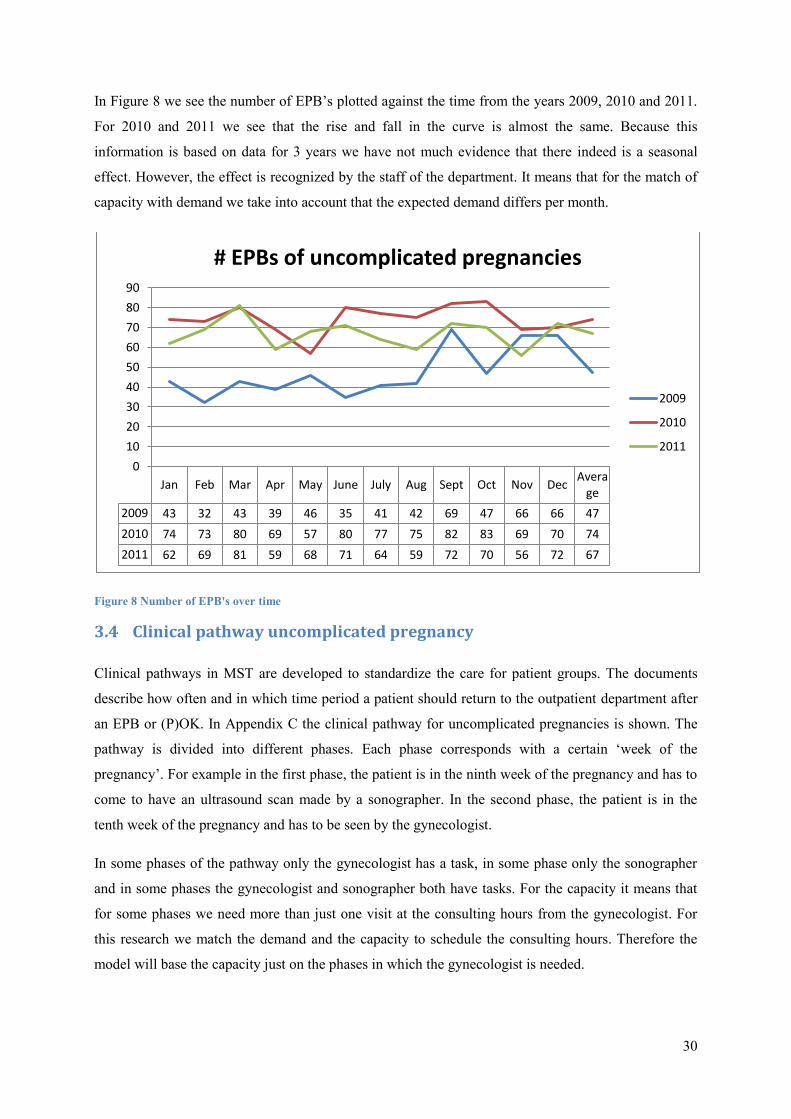
In Figure 8 we see the number of EPB’s plotted against the time from the years 2009, 2010 and 2011.
For 2010 and 2011 we see that the rise and fall in the curve is almost the same. Because this
information is based on data for 3 years we have not much evidence that there indeed is a seasonal
effect. However, the effect is recognized by the staff of the department. It means that for the match of
capacity with demand we take into account that the expected demand differs per month.
Figure 8 Number of EPB's over time
3.4 Clinical pathway uncomplicated pregnancy
Clinical pathways in MST are developed to standardize the care for patient groups. The documents
describe how often and in which time period a patient should return to the outpatient department after
an EPB or (P)OK. In Appendix C the clinical pathway for uncomplicated pregnancies is shown. The
pathway is divided into different phases. Each phase corresponds with a certain ‘week of the
pregnancy’. For example in the first phase, the patient is in the ninth week of the pregnancy and has to
come to have an ultrasound scan made by a sonographer. In the second phase, the patient is in the
tenth week of the pregnancy and has to be seen by the gynecologist.
In some phases of the pathway only the gynecologist has a task, in some phase only the sonographer
and in some phases the gynecologist and sonographer both have tasks. For the capacity it means that
for some phases we need more than just one visit at the consulting hours from the gynecologist. For
this research we match the demand and the capacity to schedule the consulting hours. Therefore the
model will base the capacity just on the phases in which the gynecologist is needed.
Jan Feb Mar Apr May June July Aug Sept Oct Nov Dec Avera
ge
2009 43 32 43 39 46 35 41 42 69 47 66 66 47
2010 74 73 80 69 57 80 77 75 82 83 69 70 74
2011 62 69 81 59 68 71 64 59 72 70 56 72 67
0
10
20
30
40
50
60
70
80
90
# EPBs of uncomplicated pregnancies
2009
2010
2011

31
3.5 Conclusions
An important task of the department of gynecology is to held consultation hours. This part of the care
has the focus of the model. The planning of the capacity of physicians is performed by one employee
in charge of the planning. The planner allocates the physicians to several tasks and blocks their
agenda’s for congresses and vacations. After that the planner decides on the distribution of the
remaining capacity of physicians to the different consultation hours. Till now this is not structurally
based on historical data. A model to forecast the future care will be an improvement on the current
planning process. Historical data on demand for uncomplicated pregnancy care learns that demand
fluctuates over the months of the year. A model for the forecast of demand should account for these
fluctuations. The way in which this is done is covered in Chapter 4. Analysis of the clinical pathway of
uncomplicated pregnancies has different phases with a different capacity needed per phase. The phases
of the pathway and the needed capacity will be input for the model in the next chapter.
32
4 Model and planning tool
In this chapter, the developed model for insight in the expected demand and the needed capacity is
described in Section 4.1. Section 4.2 is about the planning tool that is developed to make the match
between capacity and demand for ambulatory care possible. Combined with the knowledge from the
former chapters Section 4.1 and 4.2 will answer the third research question: How can we develop a
model to provide insight in the expected demand and the needed capacity to improve the match
between capacity and demand for ambulatory care? The verification and validation of the model is
also described in Section 4.2 answering the fourth research question: Is the planning tool, based on
the model, useful in improving the match between capacity and demand. Section 4.3 summarizes the
conclusions on the developed model.
4.1 Model description
The model developed provides insight in the demand and the needed capacity for the coming periods.
The purpose is that the scheme will provide knowledge for the tactical planning on how much space
and/or time is needed for consulting hours for a certain sub specialism. More concrete this means that
the model gives the expected number of required new patient (NP) slots and follow-up patient (CP)
slots per week.
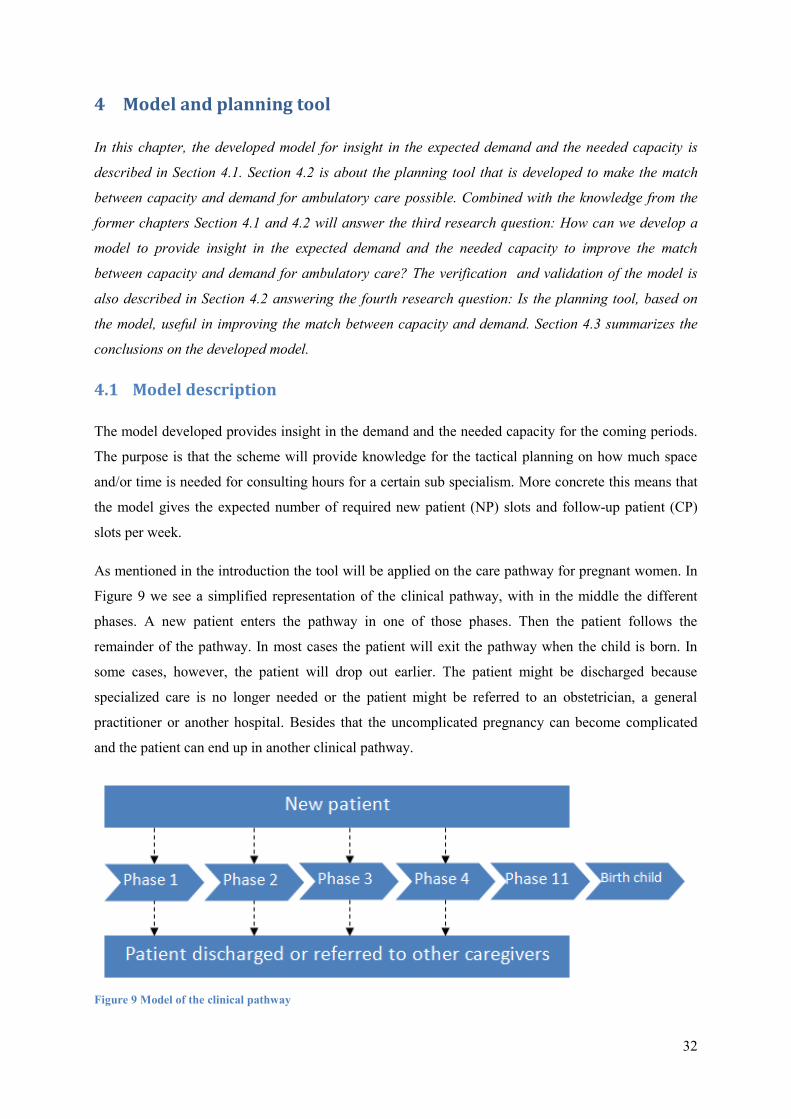
As mentioned in the introduction the tool will be applied on the care pathway for pregnant women. In
Figure 9 we see a simplified representation of the clinical pathway, with in the middle the different
phases. A new patient enters the pathway in one of those phases. Then the patient follows the
remainder of the pathway. In most cases the patient will exit the pathway when the child is born. In
some cases, however, the patient will drop out earlier. The patient might be discharged because
specialized care is no longer needed or the patient might be referred to an obstetrician, a general
practitioner or another hospital. Besides that the uncomplicated pregnancy can become complicated
and the patient can end up in another clinical pathway.
Figure 9 Model of the clinical pathway
33
The model is based on the following assumptions:
1. Every patient entering the system is always following the clinical pathway.
a. This means that we expect a patient in a certain phase to come for the next phase in
the exact week given in the clinical pathway.
b. This means that a patient never skips a phase.
c. It also means that a patient is not coming between two phases.
d. In principle, the model assumes that every patient is finishing the whole pathway,
unless the user of the tool specifies otherwise.
2. The model doesn’t account for the availability of the gynecologist who has seen the patient
before.
3. Demand is determined by the patients visiting the department and not by the number of
referrals.
4. The specialist time used per NP or CP slot is independent of the fact whether a gynecologist or
a physician assistant is doing the consultation hour.
4.1.1 Demand
The input for demand in the model consists of two components. One component of the demand is
based on the expected repeat visits of patients already in the system. Clinical pathways provide a
standard on the frequency of repeat visits and the interval between those visits. With information about
the current number of patients in a certain phase of the pathway, it is possible to calculate the expected
number of patients in a certain phase on a later time. To be able to do the calculations, we need to use
data on the week of the pregnancy instead of the phases of the clinical pathways. In the final outcome
of the model we will convert the variable ‘week of pregnancy’ into ‘phase of clinical pathway’. Let w
= 1,2,3,…, 41 be the different weeks of pregnancy in which the patient can be. Suppose we determine
the demand for care on time t based on the number of patients in the system at the previous week and
naturally also the previous week of the pregnancy. Then is the expected number of patients in
the week of the pregnancy w at time t based on with the number of patients in the system
at the previous week.
The other component is either the forecasted number of new patients per phase coming into the
process or the actual number of new patients per phase as soon as available. New patients do not
necessarily enter the clinical pathway in phase 1. Therefore we need to distinguish between the
forecasted number of new patients per phase. Lets denote as the total forecasted number of new
patients in week w at time t. As soon as there is information on the actual number of new patients per
phase in a certain week the forecasted demand will be replaced with the actual number of new patients
expressed as .
34
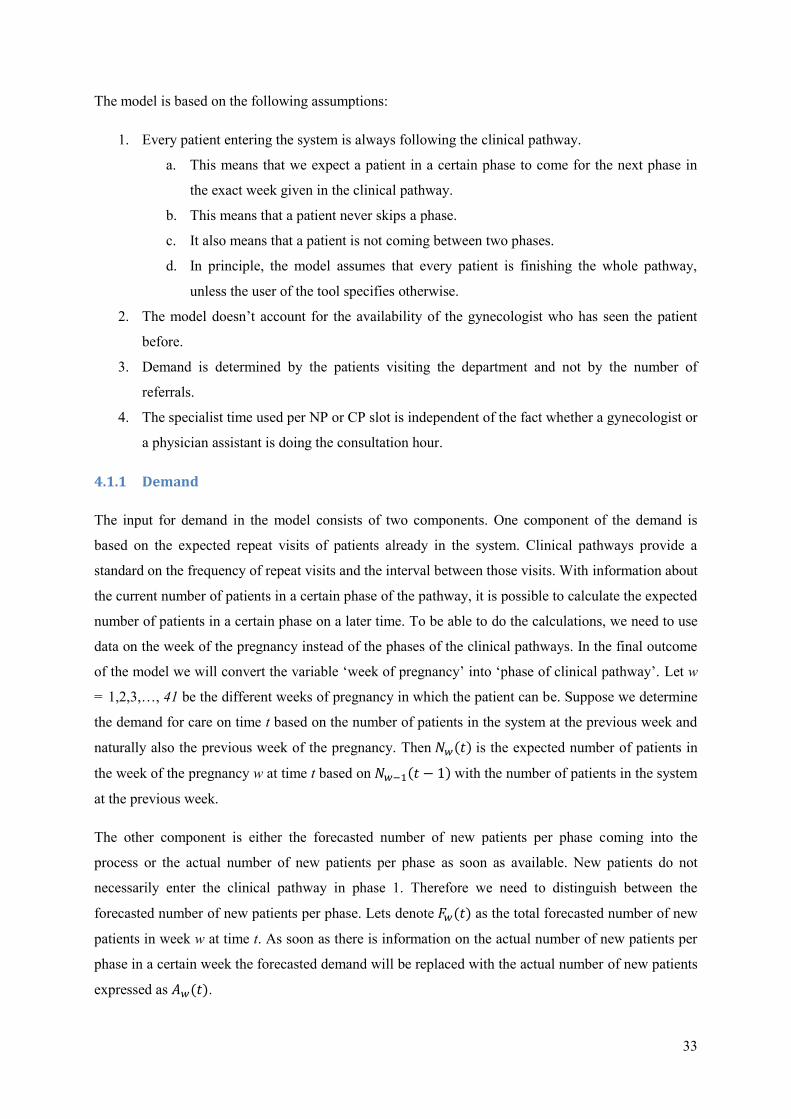
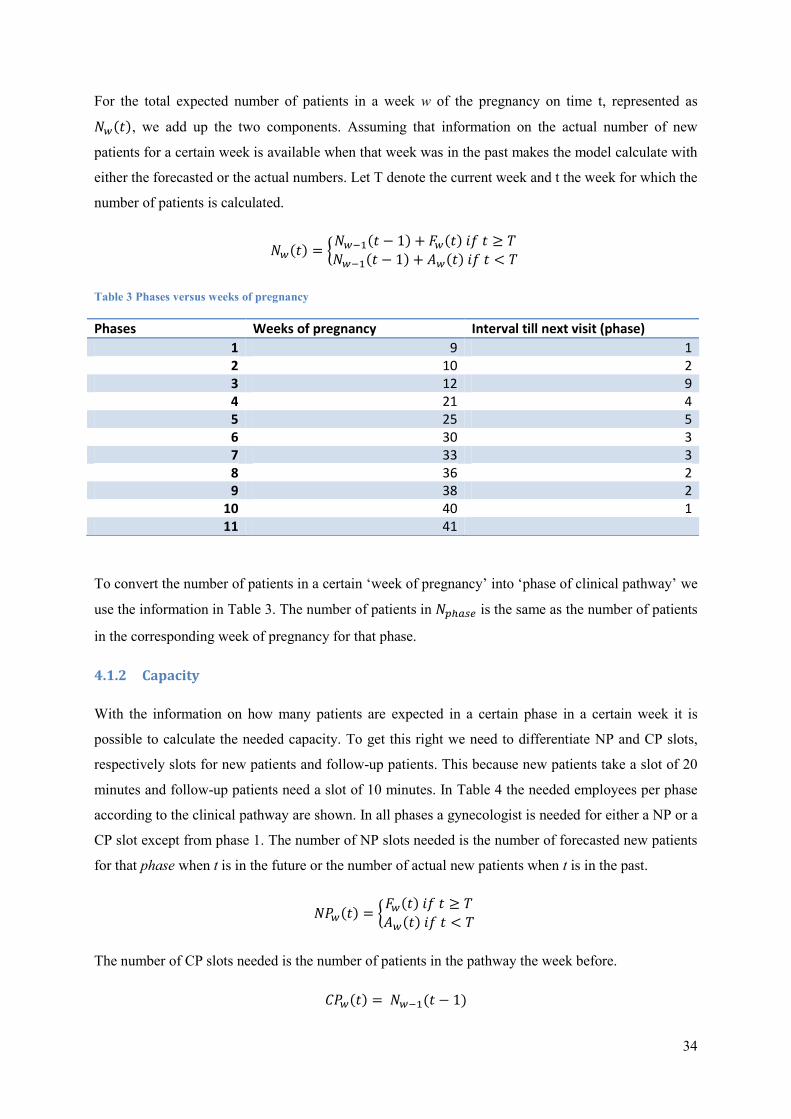
For the total expected number of patients in a week w of the pregnancy on time t, represented as
, we add up the two components. Assuming that information on the actual number of new
patients for a certain week is available when that week was in the past makes the model calculate with
either the forecasted or the actual numbers. Let T denote the current week and t the week for which the
number of patients is calculated.
Table 3 Phases versus weeks of pregnancy
To convert the number of patients in a certain ‘week of pregnancy’ into ‘phase of clinical pathway’ we
use the information in Table 3. The number of patients in is the same as the number of patients
in the corresponding week of pregnancy for that phase.
4.1.2 Capacity
With the information on how many patients are expected in a certain phase in a certain week it is
possible to calculate the needed capacity. To get this right we need to differentiate NP and CP slots,
respectively slots for new patients and follow-up patients. This because new patients take a slot of 20
minutes and follow-up patients need a slot of 10 minutes. In Table 4 the needed employees per phase
according to the clinical pathway are shown. In all phases a gynecologist is needed for either a NP or a
CP slot except from phase 1. The number of NP slots needed is the number of forecasted new patients
for that phase when t is in the future or the number of actual new patients when t is in the past.
The number of CP slots needed is the number of patients in the pathway the week before.
Phases Weeks of pregnancy Interval till next visit (phase)
1 9 1 2 10 2 3 12 9 4 21 4 5 25 5 6 30 3 7 33 3 8 36 2 9 38 2
10 40 1 11 41
35
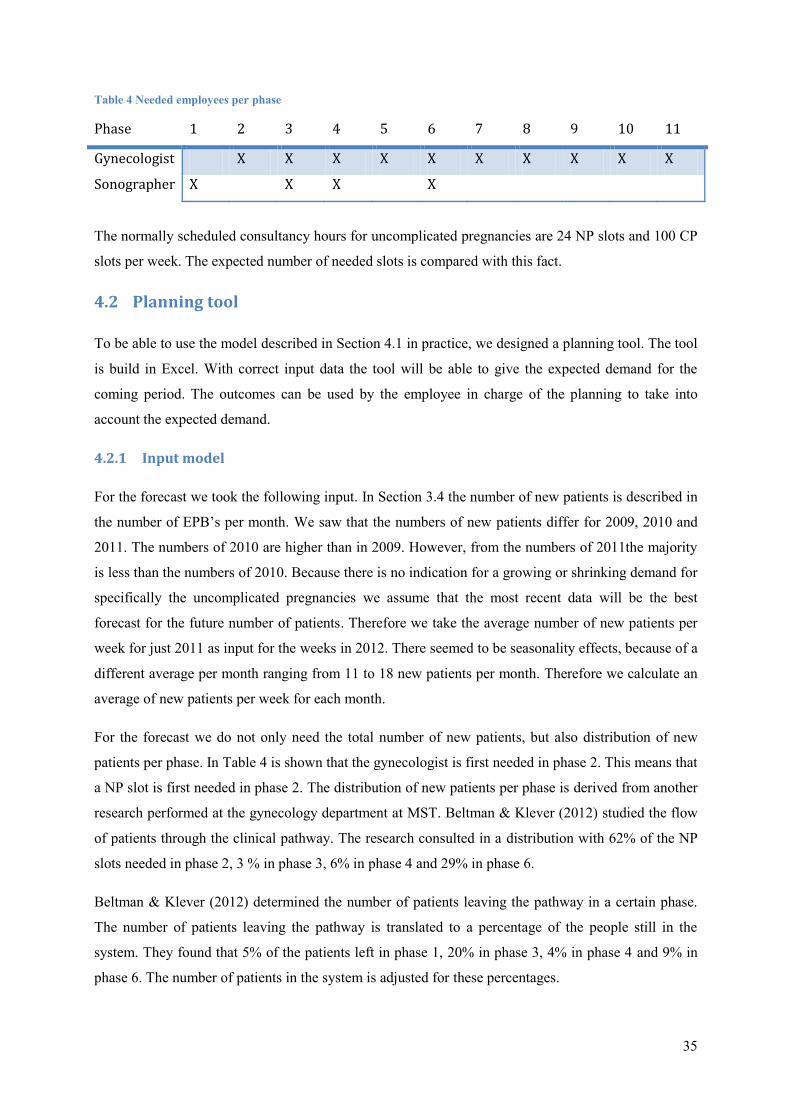
Table 4 Needed employees per phase
Phase 1 2 3 4 5 6 7 8 9 10 11
Gynecologist X X X X X X X X X X
Sonographer X X X X
The normally scheduled consultancy hours for uncomplicated pregnancies are 24 NP slots and 100 CP
slots per week. The expected number of needed slots is compared with this fact.
4.2 Planning tool
To be able to use the model described in Section 4.1 in practice, we designed a planning tool. The tool
is build in Excel. With correct input data the tool will be able to give the expected demand for the
coming period. The outcomes can be used by the employee in charge of the planning to take into
account the expected demand.
4.2.1 Input model
For the forecast we took the following input. In Section 3.4 the number of new patients is described in
the number of EPB’s per month. We saw that the numbers of new patients differ for 2009, 2010 and
2011. The numbers of 2010 are higher than in 2009. However, from the numbers of 2011the majority
is less than the numbers of 2010. Because there is no indication for a growing or shrinking demand for
specifically the uncomplicated pregnancies we assume that the most recent data will be the best
forecast for the future number of patients. Therefore we take the average number of new patients per
week for just 2011 as input for the weeks in 2012. There seemed to be seasonality effects, because of a
different average per month ranging from 11 to 18 new patients per month. Therefore we calculate an
average of new patients per week for each month.
For the forecast we do not only need the total number of new patients, but also distribution of new
patients per phase. In Table 4 is shown that the gynecologist is first needed in phase 2. This means that
a NP slot is first needed in phase 2. The distribution of new patients per phase is derived from another
research performed at the gynecology department at MST. Beltman & Klever (2012) studied the flow
of patients through the clinical pathway. The research consulted in a distribution with 62% of the NP
slots needed in phase 2, 3 % in phase 3, 6% in phase 4 and 29% in phase 6.
Beltman & Klever (2012) determined the number of patients leaving the pathway in a certain phase.
The number of patients leaving the pathway is translated to a percentage of the people still in the
system. They found that 5% of the patients left in phase 1, 20% in phase 3, 4% in phase 4 and 9% in
phase 6. The number of patients in the system is adjusted for these percentages.
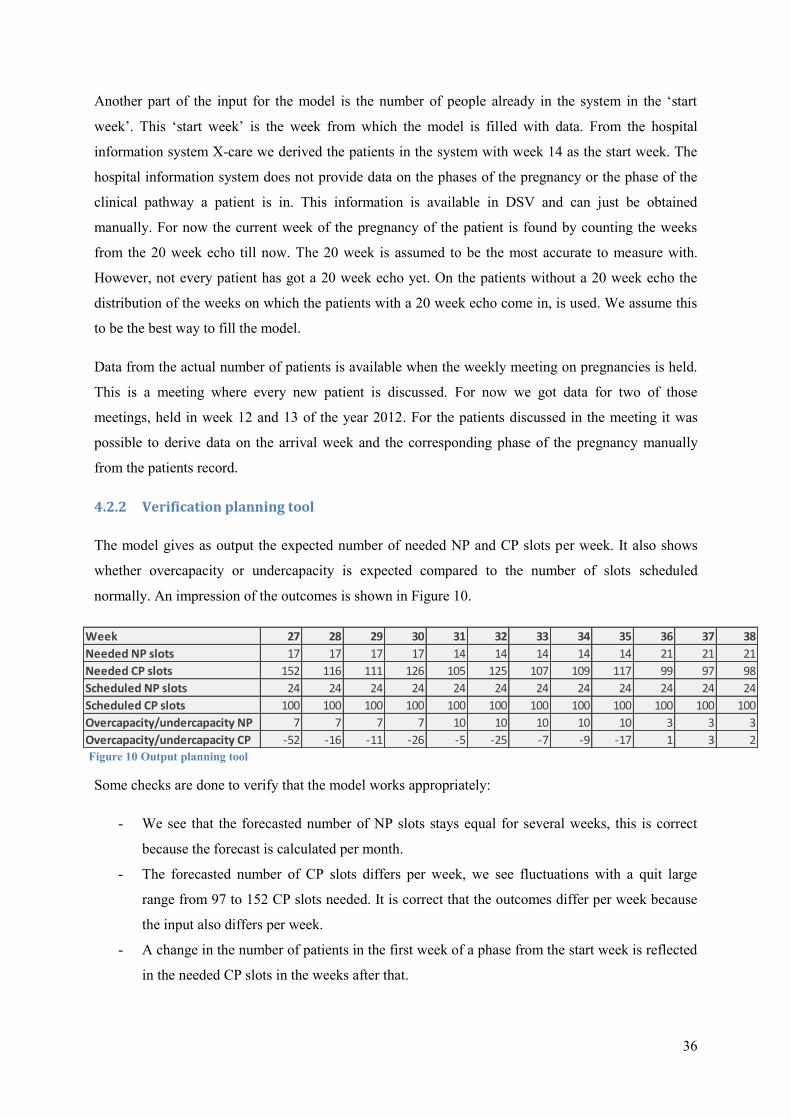
36
Another part of the input for the model is the number of people already in the system in the ‘start
week’. This ‘start week’ is the week from which the model is filled with data. From the hospital
information system X-care we derived the patients in the system with week 14 as the start week. The
hospital information system does not provide data on the phases of the pregnancy or the phase of the
clinical pathway a patient is in. This information is available in DSV and can just be obtained
manually. For now the current week of the pregnancy of the patient is found by counting the weeks
from the 20 week echo till now. The 20 week is assumed to be the most accurate to measure with.
However, not every patient has got a 20 week echo yet. On the patients without a 20 week echo the
distribution of the weeks on which the patients with a 20 week echo come in, is used. We assume this
to be the best way to fill the model.
Data from the actual number of patients is available when the weekly meeting on pregnancies is held.
This is a meeting where every new patient is discussed. For now we got data for two of those
meetings, held in week 12 and 13 of the year 2012. For the patients discussed in the meeting it was
possible to derive data on the arrival week and the corresponding phase of the pregnancy manually
from the patients record.
4.2.2 Verification planning tool
The model gives as output the expected number of needed NP and CP slots per week. It also shows
whether overcapacity or undercapacity is expected compared to the number of slots scheduled
normally. An impression of the outcomes is shown in Figure 10.
Some checks are done to verify that the model works appropriately:
- We see that the forecasted number of NP slots stays equal for several weeks, this is correct
because the forecast is calculated per month.
- The forecasted number of CP slots differs per week, we see fluctuations with a quit large
range from 97 to 152 CP slots needed. It is correct that the outcomes differ per week because
the input also differs per week.
- A change in the number of patients in the first week of a phase from the start week is reflected
in the needed CP slots in the weeks after that.
Figure 10 Output planning tool
Week 27 28 29 30 31 32 33 34 35 36 37 38
Needed NP slots 17 17 17 17 14 14 14 14 14 21 21 21
Needed CP slots 152 116 111 126 105 125 107 109 117 99 97 98
Scheduled NP slots 24 24 24 24 24 24 24 24 24 24 24 24
Scheduled CP slots 100 100 100 100 100 100 100 100 100 100 100 100
Overcapacity/undercapacity NP 7 7 7 7 10 10 10 10 10 3 3 3
Overcapacity/undercapacity CP -52 -16 -11 -26 -5 -25 -7 -9 -17 1 3 2
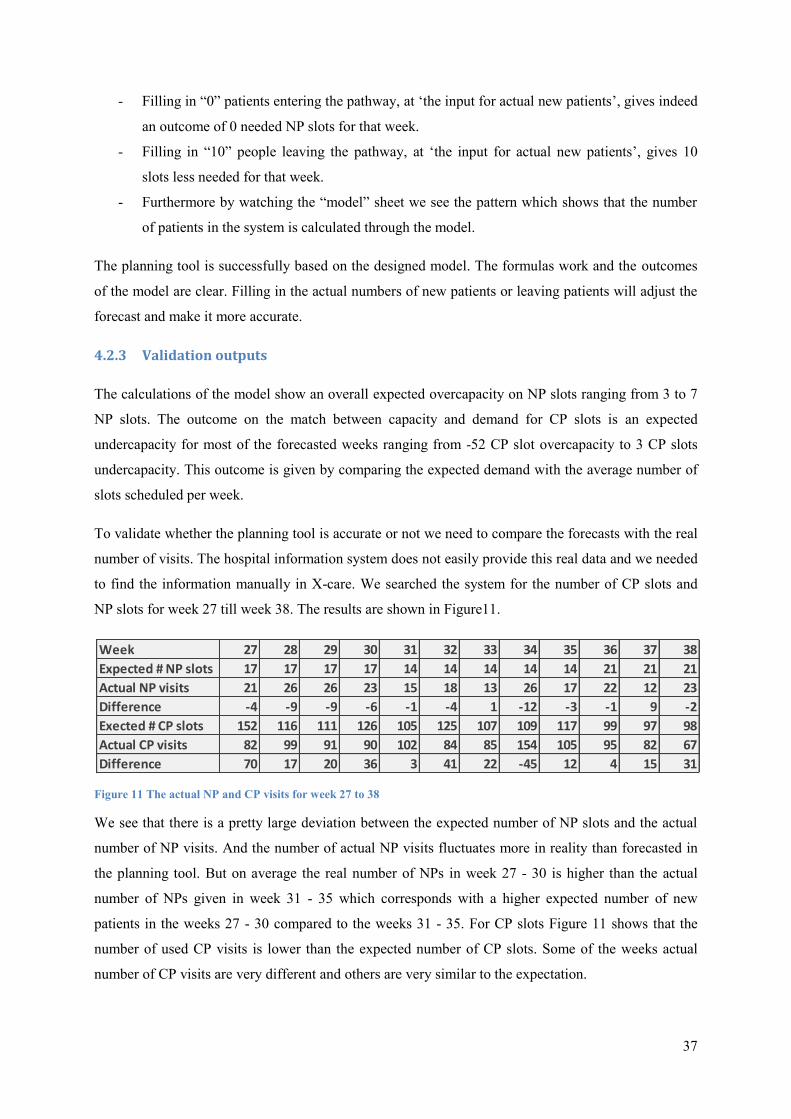
37
- Filling in “0” patients entering the pathway, at ‘the input for actual new patients’, gives indeed
an outcome of 0 needed NP slots for that week.
- Filling in “10” people leaving the pathway, at ‘the input for actual new patients’, gives 10
slots less needed for that week.
- Furthermore by watching the “model” sheet we see the pattern which shows that the number
of patients in the system is calculated through the model.
The planning tool is successfully based on the designed model. The formulas work and the outcomes
of the model are clear. Filling in the actual numbers of new patients or leaving patients will adjust the
forecast and make it more accurate.
4.2.3 Validation outputs
The calculations of the model show an overall expected overcapacity on NP slots ranging from 3 to 7
NP slots. The outcome on the match between capacity and demand for CP slots is an expected
undercapacity for most of the forecasted weeks ranging from -52 CP slot overcapacity to 3 CP slots
undercapacity. This outcome is given by comparing the expected demand with the average number of
slots scheduled per week.
To validate whether the planning tool is accurate or not we need to compare the forecasts with the real
number of visits. The hospital information system does not easily provide this real data and we needed
to find the information manually in X-care. We searched the system for the number of CP slots and
NP slots for week 27 till week 38. The results are shown in Figure11.
Figure 11 The actual NP and CP visits for week 27 to 38
We see that there is a pretty large deviation between the expected number of NP slots and the actual
number of NP visits. And the number of actual NP visits fluctuates more in reality than forecasted in
the planning tool. But on average the real number of NPs in week 27 - 30 is higher than the actual
number of NPs given in week 31 - 35 which corresponds with a higher expected number of new
patients in the weeks 27 - 30 compared to the weeks 31 - 35. For CP slots Figure 11 shows that the
number of used CP visits is lower than the expected number of CP slots. Some of the weeks actual
number of CP visits are very different and others are very similar to the expectation.
Week 27 28 29 30 31 32 33 34 35 36 37 38
Expected # NP slots 17 17 17 17 14 14 14 14 14 21 21 21
Actual NP visits 21 26 26 23 15 18 13 26 17 22 12 23
Difference -4 -9 -9 -6 -1 -4 1 -12 -3 -1 9 -2
Exected # CP slots 152 116 111 126 105 125 107 109 117 99 97 98
Actual CP visits 82 99 91 90 102 84 85 154 105 95 82 67
Difference 70 17 20 36 3 41 22 -45 12 4 15 31

38
Interesting is week 34 which forms an exception with a very high number of CP visits. The heat wave
taking place in the Netherlands could be responsible for this outlier. Therefore the high number of CP
visits is occasional. Besides that also the number of actual NP visits is very high. This shows that
filling in the actual number of patients is important for the forecast.
We can check for accuracy by using the formulas for MAD mean absolute deviation and MAPE mean
absolute percent error. These are also used when a choice has to be made for the forecasting method
(Ozcan, 2009). The MAD gives a deviation for the forecasted number patients and the MAPE gives
the error as a percentage of the actual number of patients. For the forecasted number of new patients
this results in the following rates:
and
.
For the control patients the calculations are as follows:
and
.
The lower the MAD rate, the better the forecast. We see that the forecast on NP slots is more accurate
with an error of 3.42 than the forecast on CP slots with an error of 26.33. The MAPE rate is taking into
account the size of the actual values. The difference of the accuracy of NP slots and CP slots is
softened using the MAPE rate with an error of 17 percent for NP slots and an error of 28 percent for
CP slots.
The outcomes of the model and reality are not as good as desired but we denote that validation is done
with the planning tool even though the possibility of entering actual data is not used. Because this data
is not yet available, it is not been possible to adjust the planning tool for that information. More about
the needed data is described in the implementation part in Chapter 6. We expect a reduction of the size
of the differences when real data is entered.
4.3 Conclusions
The designed model is based on the clinical pathway for uncomplicated pathways to forecast the
number of needed CP slots and NP slots for a certain week. In which the number of CP slots is based
on the number of slots in the week before. The number of NP slots is either based on a forecast or on
the actual number of new patients. The model is built in Excel which resulted in a planning tool. The
tool is validated and seems to function good. The outcomes of the model were compared to the actual
number of CP slots and NP slots actually used over 12 weeks. The outcomes of the model are not as
good as desired. The outcomes can become more accurate since it is possible to enter actual data from
former weeks in the planning tool. With entering that data as a precondition we expect the planning
tool to be very useful to obtain a better match between capacity and demand.

39
5 Conclusions
This chapter will draw conclusions on the research performed. In Section 5.1 the answers to the
research questions 1-4 will be summarized. Section 5.1 and 5.2 together give an answer on research
question 5: What are the conclusions and discussion points of this research?
5.1 Answer research questions
Not reaching the agreed production volume has been the reason behind this research. After a thorough
problem analysis the subject of the research became the mismatch between capacity and demand for
outpatient care. In the introduction we stated the following research goal:
“The aim of this study is to analyze the current tactical planning process and to develop a model that
provides information on the expected demand of care and needed capacity to support the planning on
the outpatient department with the goal to improve the match between capacity and demand.”
The focus has been on consultation hours and the capacity of physicians within the outpatient
department. Furthermore the research was funneled to just uncomplicated pregnancy care.
What relevant information can be found in literature on planning capacity and demand?
Searching literature learns that clinical pathways can be used to analyze care processes. Besides the
quality of care also the quality of the processes can be improved. Planning capacity and demand is
done on different levels. The tactical level is introduced as the planning level in focus of this research.
Specialist time is identified as a possible bottleneck resource. A better match of the specialist time
capacity with demand will help to use capacity more efficient. Demand can be forecasted with
different forecasting methods. For this research we used historical data to forecast demand. Seasonal
effects are taken into account during the development of the model. Literature on panel sizing shows
that we can also do calculations on the number of people coming for control visits. Besides forecasting
the number of new patients, the number of patients already in the clinical pathway can be input for the
forecast on control patients.
How is the current planning process organized?
The current planning process of the department is analyzed by interviewing staff and by analyzing
documents and protocols. Currently there is, on the department of Gynecology, there is one employee
in charge of the planning. The planner allocates the physicians to several tasks and blocks their time in
case of absence. The planner decides on the distribution of the remaining capacity of physicians to the
different consultation hours. This is often communicated with the head of the department. Historical
data on demand for uncomplicated pregnancy care learns that demand fluctuates over the months of
40
the year. Currently such data is not systematically used in the decision making. The clinical pathway
of uncomplicated pregnancies is introduced consisting of different phases of the care process. The
needed capacity differs per phase, while the caregivers differ per phase. This information is used in the
development of the model.
How can we use a model to provide insight in the expected demand and the needed capacity to
improve the match between capacity and demand for ambulatory care?
Based on the problem analysis and the analysis of the current situation the model is developed
calculate the expected demand and the needed specialist time capacity. The model is based on the
clinical pathway for uncomplicated pathways to forecast the number of needed CP slots and NP slots
for a certain week. In which the number of CP slots is based on the number of slots in the week before.
The number of NP slots is either based on a forecast or on the actual number of new patients. The
model is built in Excel which resulted in a planning tool.
Is the planning tool, based on the model, useful in improving the match between capacity and
demand?
The planning tool will be supportive in the decision making for the tactical planning process. The
planning tool is validated and seems to function good. The outcomes of the model were compared to
the actual number of CP slots and NP slots actually used over 12 weeks. The outcomes of the model
and reality are not as good as desired. The outcomes can become more accurate since it is possible to
enter actual data from former weeks in the planning tool. With entering that data as a precondition we
expect the planning tool to be very useful to obtain a better match between capacity and demand.
5.2 Discussing the research
As written in Chapter 4 the model some assumptions were made to be able to develop the model. One
of the assumptions is that every patient entering the clinical pathway is following that pathways as it is
defined. However, in practice some patients might not follow the pathway at all. This uncertainty
influences the planning and might give a less precise prediction. Further research was recommended to
analyze how often the path of the patient deviates from the clinical pathway and more exactly what the
deviation from that standard entails. During this research Beltman & Klever (2012) performed a study
on the patient flow within the clinical pathway of uncomplicated pregnancies. We did account for the
number of patients leaving the pathway per phase according to outcomes of this research. With that
information the model could be optimized by correcting for some deviations.
Another assumption made implies that a patient can be helped by different gynecologists. In practice
the patient often prefers to be seen by only one gynecologist. This might have influence on the
outcomes because the capacity might be more fluctuating.

41
In this research the time needed for an NP or CP slot for gynecologists or physician assistants is
assumed to be equal. However, because a physician assistant operates with supervision of a
gynecologist the time needed for the physician might differ from the time needed for an gynecologist.
The forecasted demand as input for the model is derived from the averages of patients visiting the
department. A better indicator for the demand would have been the number of received referrals. For
now we assumed that the physicians of the department see all the patients that have been referred. If
possible it would be better to keep track of all the referrals.
In the problem analysis a total of 2236 consultation hours is found to be needed to be able to reach the
agreed production volume. An approximation of the available capacity gave a total of 2722
consultation hours planned throughout the year. During the research the duration was said that a
consultation hour normally lasts for 4 hours. Analyzing the consultation hour schedules however
showed that consultation hours on mornings are often scheduled for 3,5 hours and consultations on the
afternoons are often scheduled for 2,75 hours. For the calculations the average duration of consultation
hours is used. But for the department it might be interesting to check whether this duration is a
deliberated choice or not.
42
6 Recommendations and implementation
In this chapter, Section 6.1 describes the recommendations towards the gynecology department and
Section 6.2 discusses the implementation of the planning tool. This provides an answer on research
question 6: Which recommendations can be done to the gynecology department? And answers
research question 7: How can we implement the planning tool into the planning process? The last
section, Section 6.3, gives a final conclusion on the research.
6.1 Recommendations
After this study we recommend to use the model to improve the planning process and therewith the
match between capacity and demand. The expectation is that the outcomes in terms of the accuracy of
the forecast is not optimal yet. With better registration the data as input for the model will be more
accurate, which in turn will make the forecast more accurate.
6.1.1 Pilot planning tool
Based on the conclusions of Chapter 4 we recommend the department to do a pilot on the use of the
planning tool. After half a year the outcomes of the model should be evaluated. The evaluation will
show whether the forecast gets more accurate as the actual data is entered in the tool. The department
can then make an informed decision on whether they find it worthwhile to make the effort to obtain
the right data and use it as input for the tool. Adjustments to the tool or the planning process can then
be made before implementing the use of the tool. The implementation in the planning process is
described in the next chapter.
To make the use of the planning tool easier we recommend to keep track of the phase of the clinical
pathway a patient is in. The department might want to add a function in DSV or X-care for that
purpose. The department may want to explore the possibilities of their information systems to make
data collection easier.
Determine the demand by counting the number of referrals to the department. Demand will then be
more accurate because patients moving to another caregiver before visiting the department can then be
taken into account. Weiner et al. (2009) developed a web-based system for handling referrals. Such an
application gives all the information on referrals and therewith on demand. Besides that failure by
using fax or email is avoided because all requests are handled in that application.
6.1.2 Planning process
As described in this study the physician schedule contains also the schedule of physician assistants.
The schedule of physicians is ready 3 months in advance. Therefore it should be recommended to
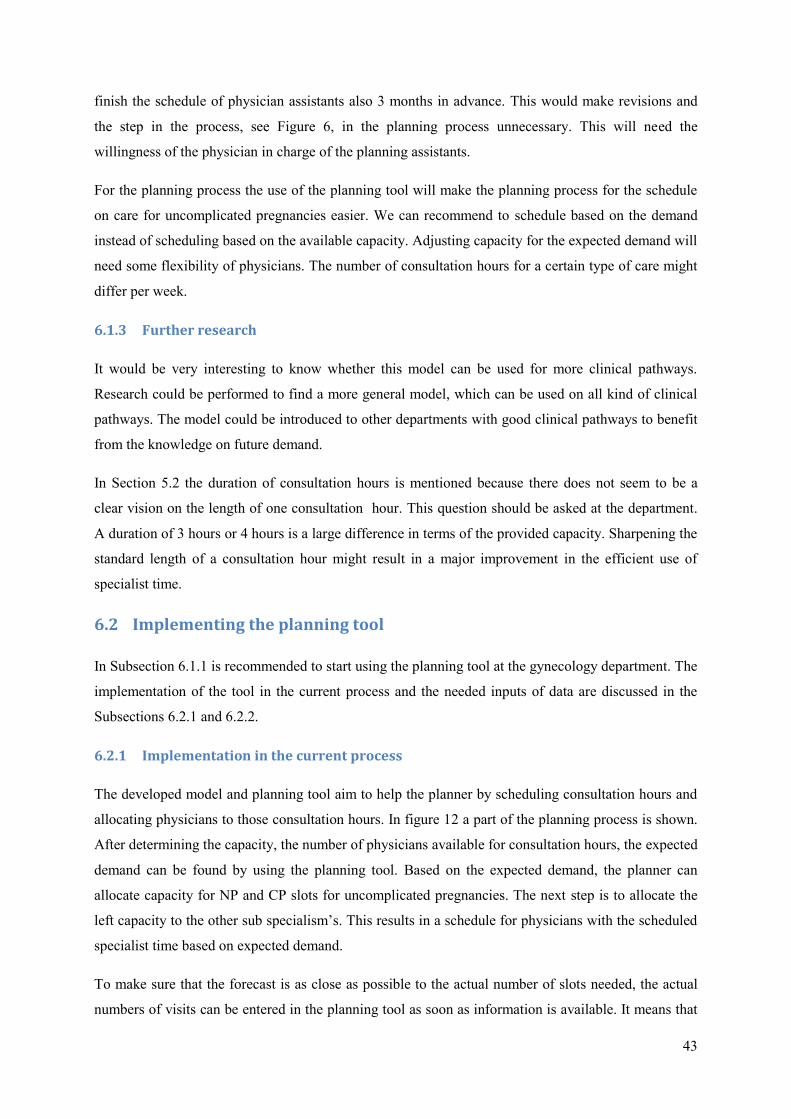
43
finish the schedule of physician assistants also 3 months in advance. This would make revisions and
the step in the process, see Figure 6, in the planning process unnecessary. This will need the
willingness of the physician in charge of the planning assistants.
For the planning process the use of the planning tool will make the planning process for the schedule
on care for uncomplicated pregnancies easier. We can recommend to schedule based on the demand
instead of scheduling based on the available capacity. Adjusting capacity for the expected demand will
need some flexibility of physicians. The number of consultation hours for a certain type of care might
differ per week.
6.1.3 Further research
It would be very interesting to know whether this model can be used for more clinical pathways.
Research could be performed to find a more general model, which can be used on all kind of clinical
pathways. The model could be introduced to other departments with good clinical pathways to benefit
from the knowledge on future demand.
In Section 5.2 the duration of consultation hours is mentioned because there does not seem to be a
clear vision on the length of one consultation hour. This question should be asked at the department.
A duration of 3 hours or 4 hours is a large difference in terms of the provided capacity. Sharpening the
standard length of a consultation hour might result in a major improvement in the efficient use of
specialist time.
6.2 Implementing the planning tool
In Subsection 6.1.1 is recommended to start using the planning tool at the gynecology department. The
implementation of the tool in the current process and the needed inputs of data are discussed in the
Subsections 6.2.1 and 6.2.2.
6.2.1 Implementation in the current process
The developed model and planning tool aim to help the planner by scheduling consultation hours and
allocating physicians to those consultation hours. In figure 12 a part of the planning process is shown.
After determining the capacity, the number of physicians available for consultation hours, the expected
demand can be found by using the planning tool. Based on the expected demand, the planner can
allocate capacity for NP and CP slots for uncomplicated pregnancies. The next step is to allocate the
left capacity to the other sub specialism’s. This results in a schedule for physicians with the scheduled
specialist time based on expected demand.
To make sure that the forecast is as close as possible to the actual number of slots needed, the actual
numbers of visits can be entered in the planning tool as soon as information is available. It means that
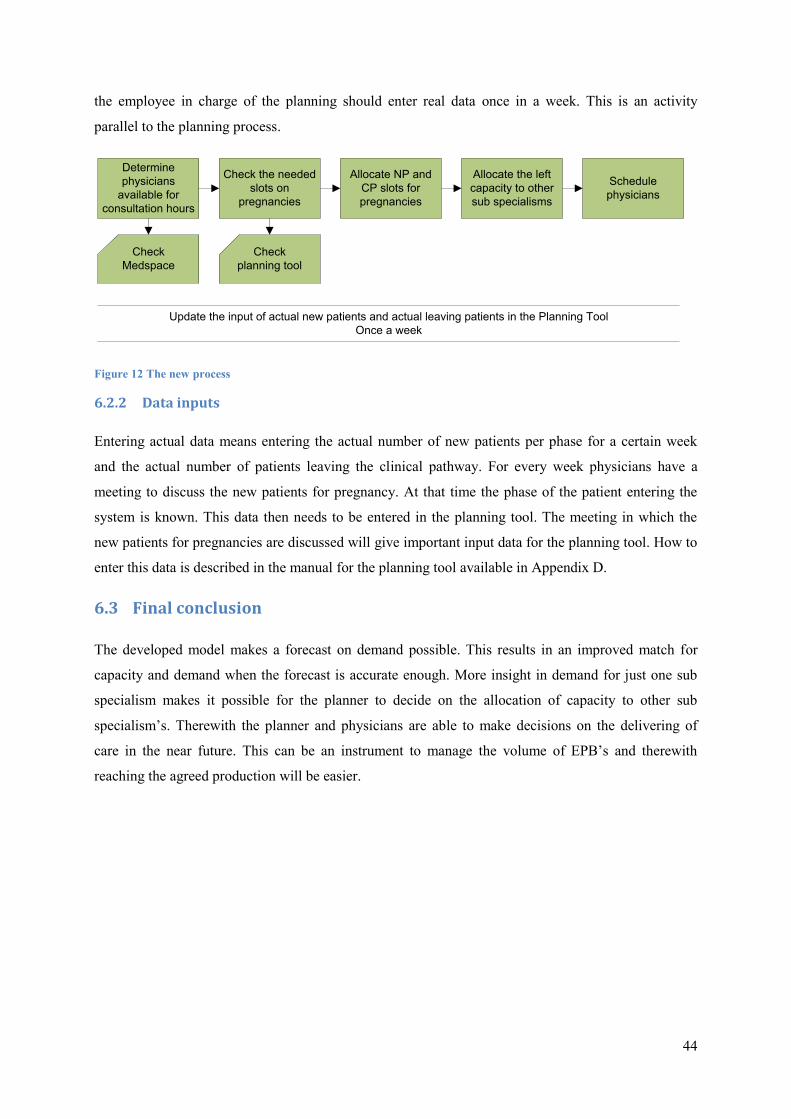
44
the employee in charge of the planning should enter real data once in a week. This is an activity
parallel to the planning process.
Figure 12 The new process
6.2.2 Data inputs
Entering actual data means entering the actual number of new patients per phase for a certain week
and the actual number of patients leaving the clinical pathway. For every week physicians have a
meeting to discuss the new patients for pregnancy. At that time the phase of the patient entering the
system is known. This data then needs to be entered in the planning tool. The meeting in which the
new patients for pregnancies are discussed will give important input data for the planning tool. How to
enter this data is described in the manual for the planning tool available in Appendix D.
6.3 Final conclusion
The developed model makes a forecast on demand possible. This results in an improved match for
capacity and demand when the forecast is accurate enough. More insight in demand for just one sub
specialism makes it possible for the planner to decide on the allocation of capacity to other sub
specialism’s. Therewith the planner and physicians are able to make decisions on the delivering of
care in the near future. This can be an instrument to manage the volume of EPB’s and therewith
reaching the agreed production will be easier.
Determine
physicians
available for
consultation hours
Check the needed
slots on
pregnancies
Check
planning tool
Check
Medspace
Allocate NP and
CP slots for
pregnancies
Allocate the left
capacity to other
sub specialisms
Update the input of actual new patients and actual leaving patients in the Planning Tool
Once a week
Schedule
physicians

45
7 References
American Board of Obstetrics and Gynecology. (2009). Inc. Bulletin for 2010-2011. Retrieved 6 11,
2012, from http://www.abog.org/bulletins/SSBUL010.PDF
Babbie, E. (2007). The practice of social research. Belmont: Thomson Wadsworth.
Bais, J., & Pel, M. (2007). The basis of the Dutch obstetric system: risk selection. Eur Clinics Obstet
Gynaecol , 209-212.
Balasubramanian, H., Banerjee, R., Denton, B., Naessens, J., & Stahl, J. (2010). Improving Clinical
Access and Continuity through Physician Panel Redesign. Journal General Internal Medicine , 1109-
1115.
Beltman, H., & Klever, R. (2012). Zorgpaden op de polikliniek gynaecology. Enschede: Universiteit
Twente.
Cayirli, T., & Veral, E. (2003). Outpatient scheduling in health care: A review of literature.
Production and Operations Management , 519-549.
Côté, M. J., & Tucker, S. L. (2001). Four methodologies to improve healthcare demand forecasting.
Healthcare financial management , 54-58.
de Meer, J., Otter, R., & Bekkema-Jager, M. (2009). Een model voor integrale oncologische
zorgpaden. In H. Hummel, J. de Meer, J. de Vries, & R. Otter, Integrale oncologische zorgpaden:
opzet en toepassing. Assen: Koninklijke van Gorcum.
Forecasting Principles. (2007). Retrieved August 11, 2012, from Forecasting Principles:
http://www.forecastingprinciples.com/paperpdf/methodology_tree_1.pdf
Gupta, D., & Denton, B. (2008). Appointment scheduling in health care: challenges and opportunities.
IIE Transactions , 800-819.
Hans, E., Houdenhoven, M., & Hulshof, P. (2011). A framework for health care planning and control.
Enschede: Department of Applied Mathematics, University of Twente.
Harper, P. (2002). A framework for operational modelling of hospital rescources. Health Care
Management Science , 165-173.
Hindle, D., Dowdeswell, B., & Yasbeck, A. (2004). Report of a survey of clinical pathways and
strategic asset planning in 17 EU countries. EU Health Property Network.

46
Huis aan Huis Enschede. (2009). Alles onder één dak: Vrouw Kind Centrum in ziekenhuis MST op
punt van beginnen. de Weekkrant 20 Mai 2009 .
Lako, C., & Rosenau, P. (2009). Demand-driven care and hospital choice. Dutch health policy toward
demand-driven care: results from a survey intho hospital choice. Health Care Anal , 20-35.
Ministerie VWS. (2011). Hoofdlijnenakkoord kostenontwikkeling ziekenhuiszorg. Retrieved
November 1, 2011, from Rijksoverheid: http://www.rijksoverheid.nl/documenten-en-
publicaties/convenanten/2011/07/05/hoofdlijnenakkoord.html
MST. (2010). Jaarverantwoording Medisch Spectrum Twente. Retrieved October 13, 2011, from
http://www.mst.nl/onzeorganisatie/jaarverantwoording_medisch_spe.pdf
MST. (2008). Medisch Spectrum Twente Jaarverantwoording. Retrieved 11 3, 2011, from
http://www.mijnmst.nl/wps/wcm/myconnect/4ba0b6004f1b610a928bdf0283fda008/Jaarverslag+2008.
pdf?MOD=AJPERES&CACHE=NONE
Murray, M., Davies, M., & Boushon, B. (2007). Panel size: how many patients can one doctor
manage? Family Practise Management , 44-51.
Nederlandse Zorgautoriteit. (2008). Algemene bepalingen en toelichting verrichtingenlijst. Retrieved
November 3, 2011, from Nederlandse Zorgautoriteit: http://www.nza.nl/binaries/13755/14184/CI-
1009.b2_toelichting.pdf
Ozcan, Y. A. (2009). Quantitative methods in health care management. San Francisco: Jossey-Bass.
van Greuningen, M., Batenburg, R., & Hansen, J. (2010). De arbeidsmarkt voor gynaecologen in
Nederland. Utrecht: NIVEL.
van Houdenhoven, M., Wullink, G., Hans, E., & Kazemier, G. (2007). A framework for Hospital
Planning and Control. In M. van Houdenhoven, Healthcare logistics: the art of balance (pp. 18-29).
Rotterdam: Erasmus Universiteit.
Vanhaecht, K., De Witte, K., & Sermeus, W. (2007). The care process organisation triangle: A
framework to better understand how clinical pathways work. Journal of Integrated Care Pathways , 1-
8.
Vanhaecht, K., Panella, M., van Zelm, R., & Sermeus, W. (2010). An overview on the history and
concept of care pathways as complex interventions. International Journal of Care Pathway , 117-123.
Vissers, J. M., van der Bij, H. J., & Kusters, R. J. (2001). Towards decision support for waiting lists:
an operations management view. Health Care Management Science , 133-142.

47
Vissers, J. (2005). Unit logistics: Allocation and utilization of resources. In J. Vissers, & R. Beech,
Health operations management: Patient flow logistics in health care (pp. 51-54). Oxon: Routledge.
Voudouris, C., Owusu, G., Dorne, R., & Lesaint, D. (2008). Service chain management: Technology
innovation for the service business. Berlin Heidelberg: Springer-Verlag.
Weiner, M., Hoyek, G., Wang, L., Dexter, P., Zerr, A., Perkins, A., et al. (2009). A Web-based
generalist-specialist system to improve scheduling of outpatient specialty consultations in an academic
center. J Gen Intern Med , 710-715.
Appendix A Mind map
Figure 13 Mind map
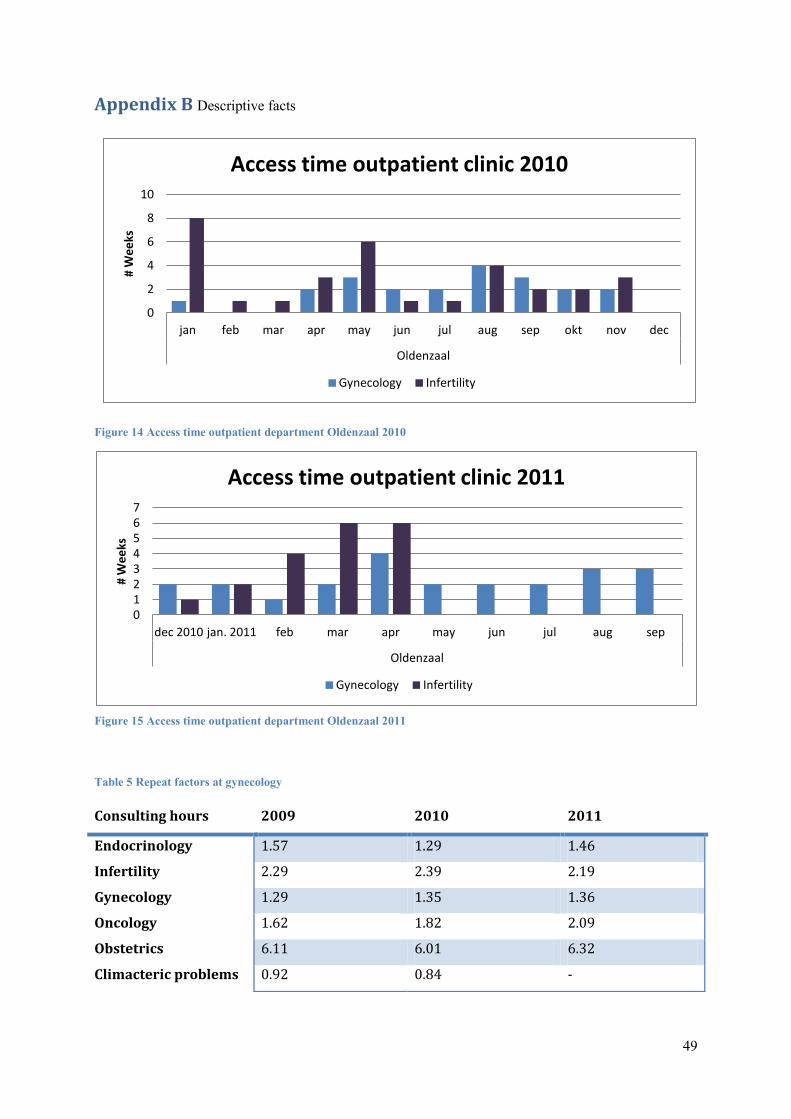
49
Appendix B Descriptive facts
Figure 14 Access time outpatient department Oldenzaal 2010
Figure 15 Access time outpatient department Oldenzaal 2011
Table 5 Repeat factors at gynecology
0
2
4
6
8
10
jan feb mar apr may jun jul aug sep okt nov dec
Oldenzaal
# W
ee
ks
Access time outpatient clinic 2010
Gynecology Infertility
0 1 2 3 4 5 6 7
dec 2010 jan. 2011 feb mar apr may jun jul aug sep
Oldenzaal
# W
ee
ks
Access time outpatient clinic 2011
Gynecology Infertility
Consulting hours 2009 2010 2011
Endocrinology 1.57 1.29 1.46
Infertility 2.29 2.39 2.19
Gynecology 1.29 1.35 1.36
Oncology 1.62 1.82 2.09
Obstetrics 6.11 6.01 6.32
Climacteric problems 0.92 0.84 -
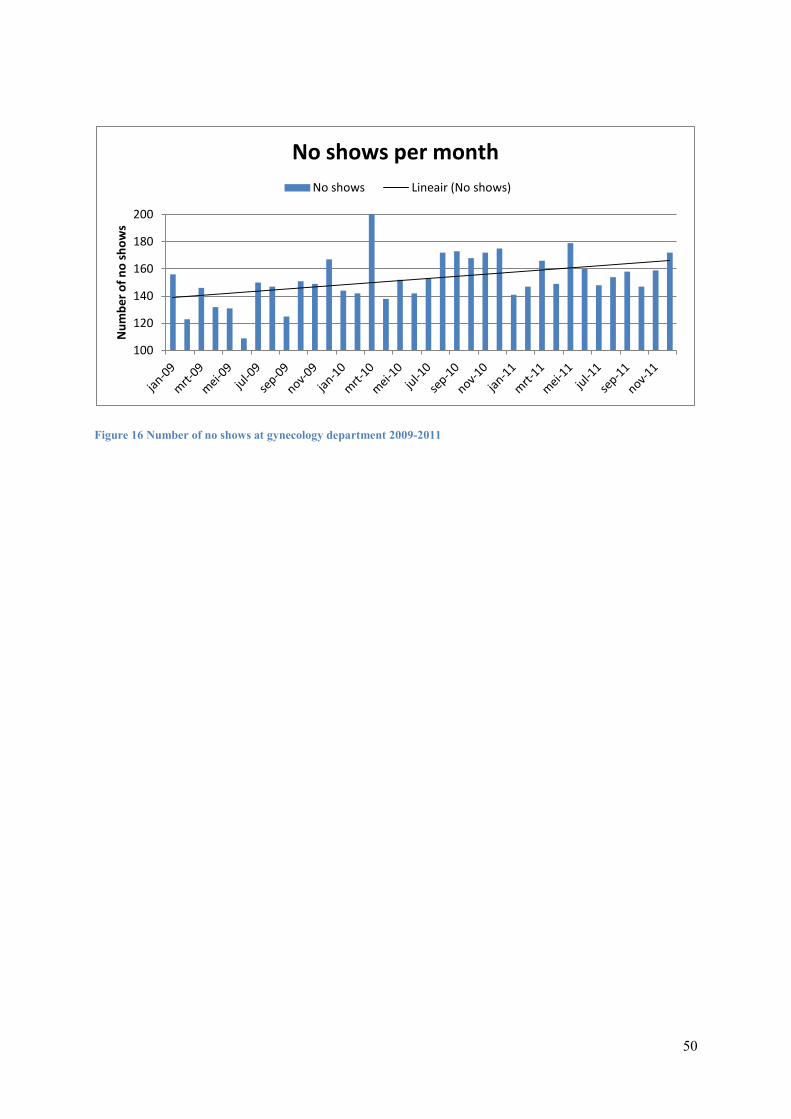
50
Figure 16 Number of no shows at gynecology department 2009-2011
100
120
140
160
180
200
Nu
mb
er
of
no
sh
ow
s
No shows per month
No shows Lineair (No shows)
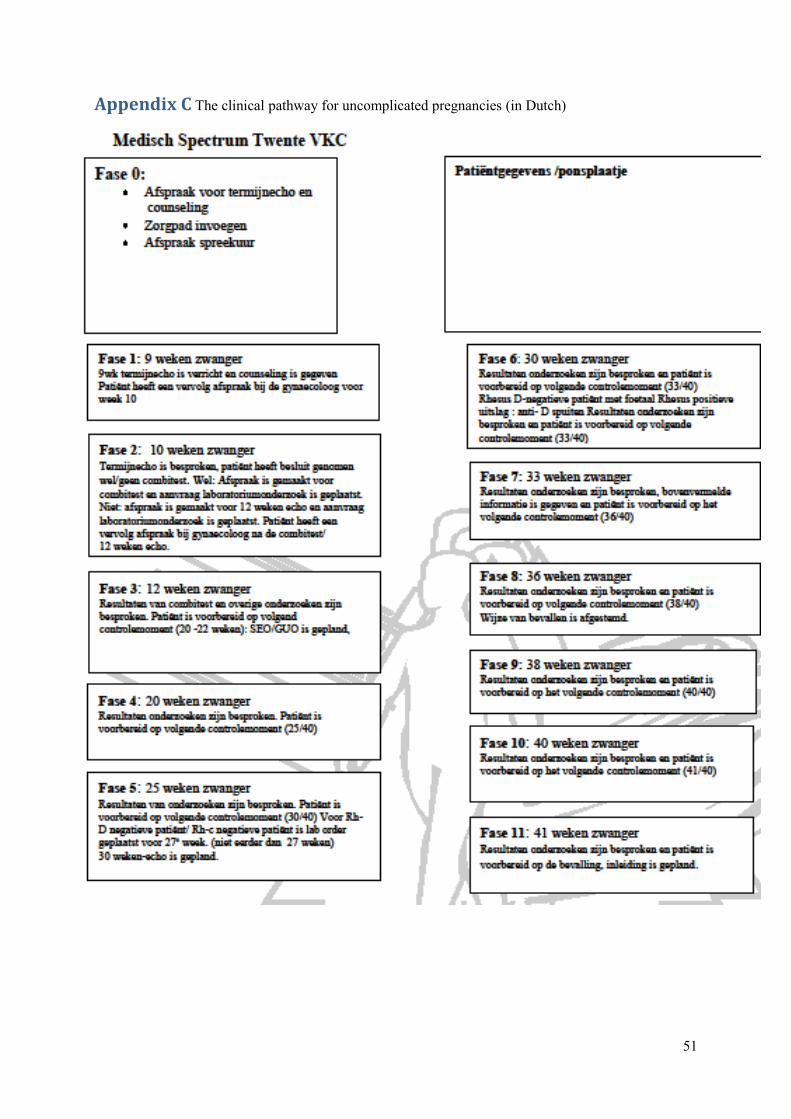
51
Appendix C The clinical pathway for uncomplicated pregnancies (in Dutch)
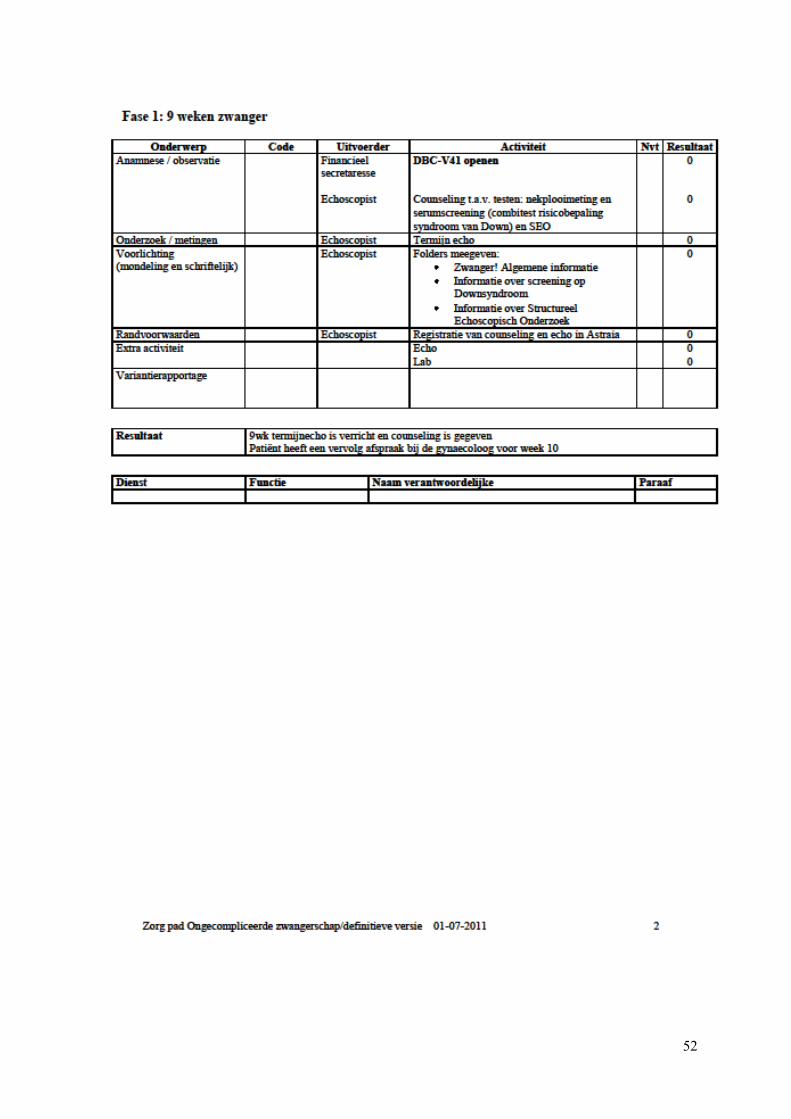
52
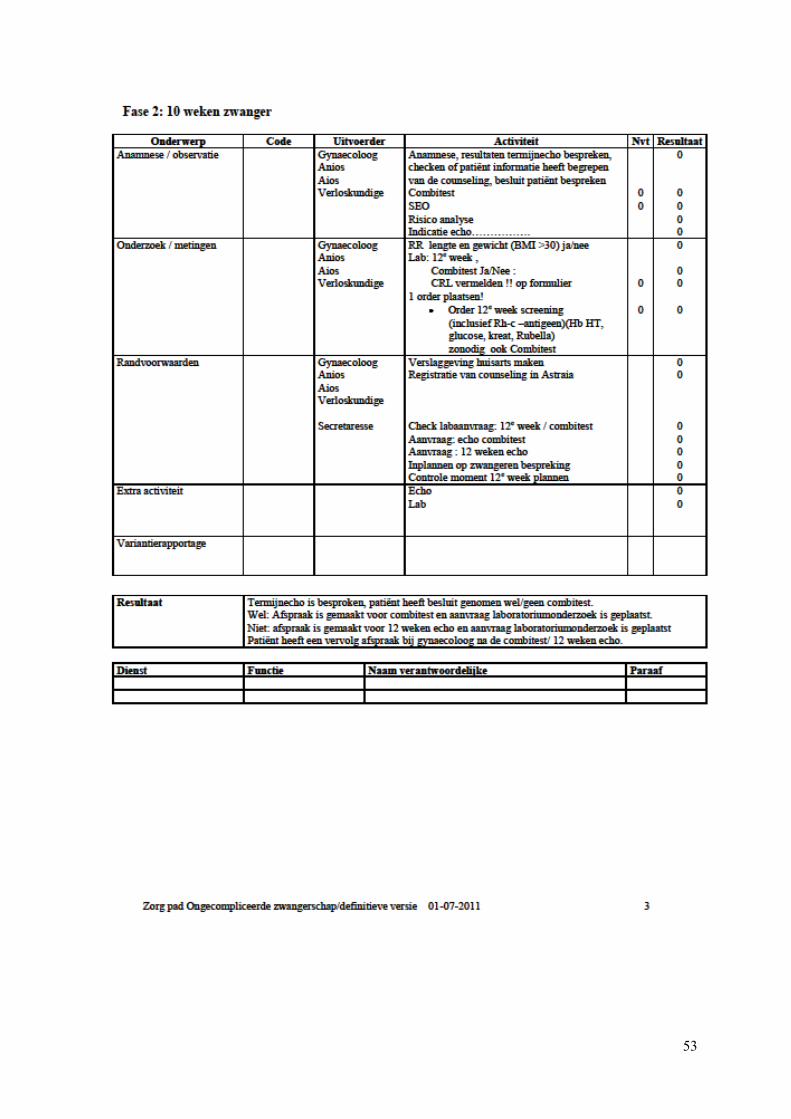
53
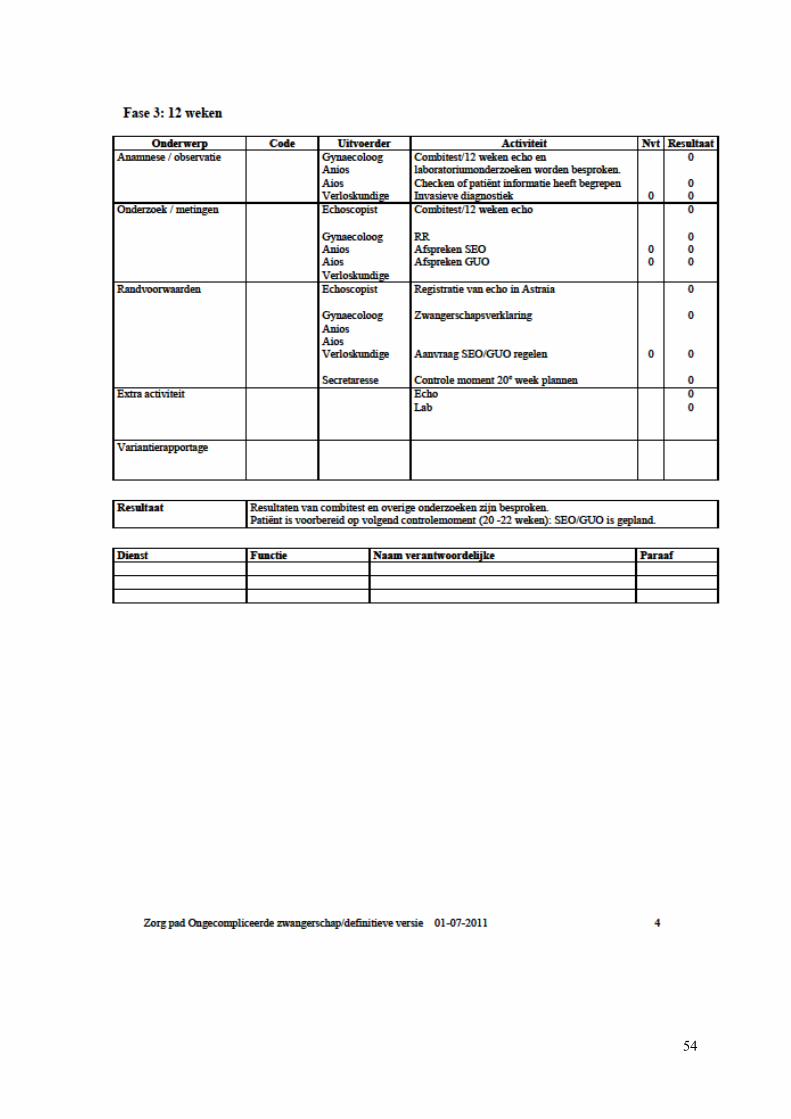
54
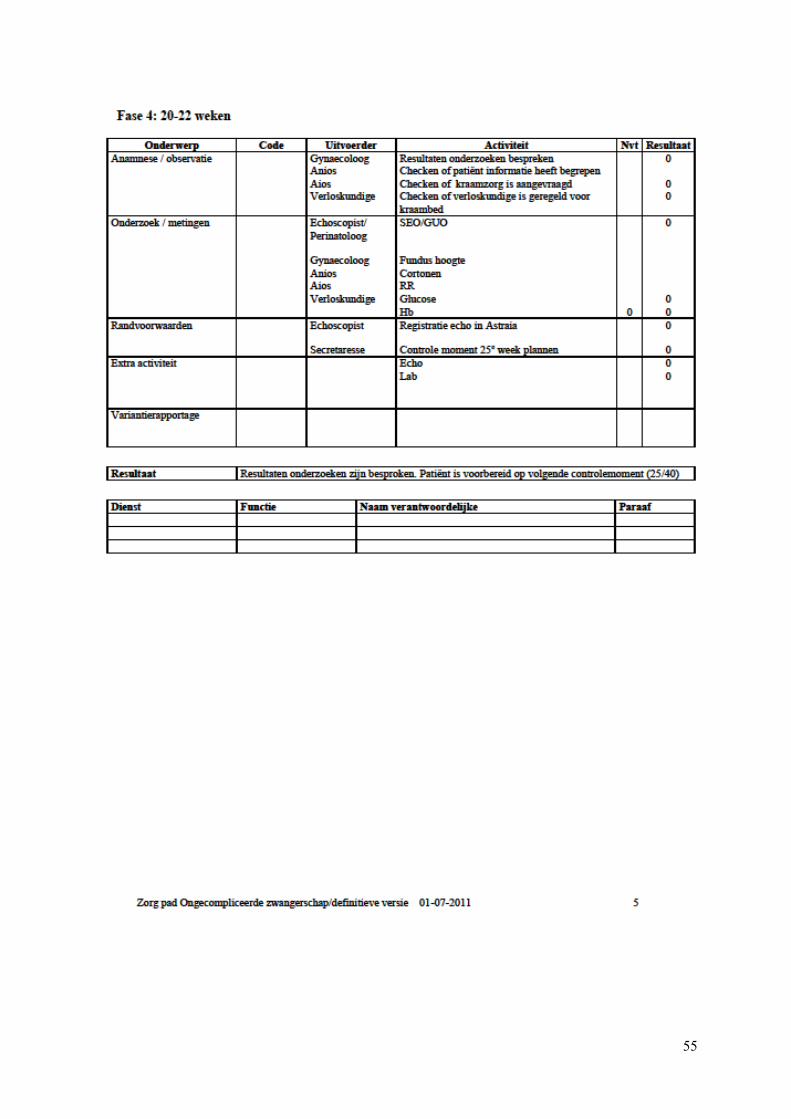
55
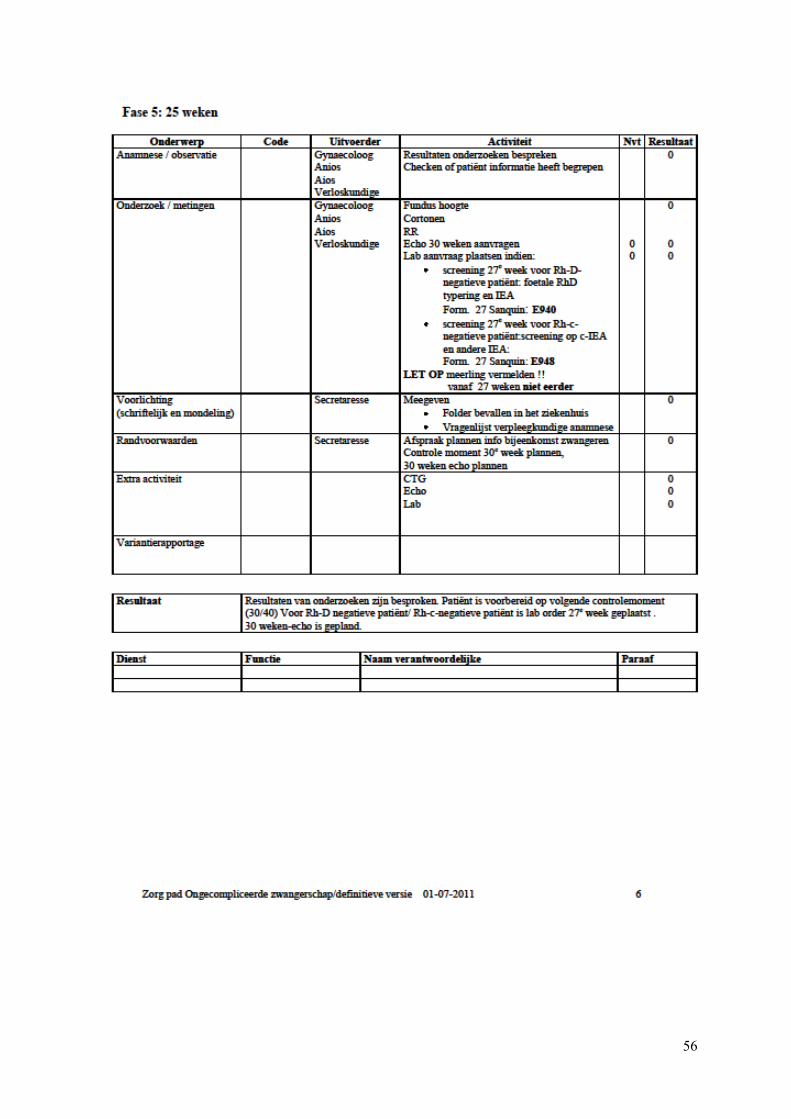
56
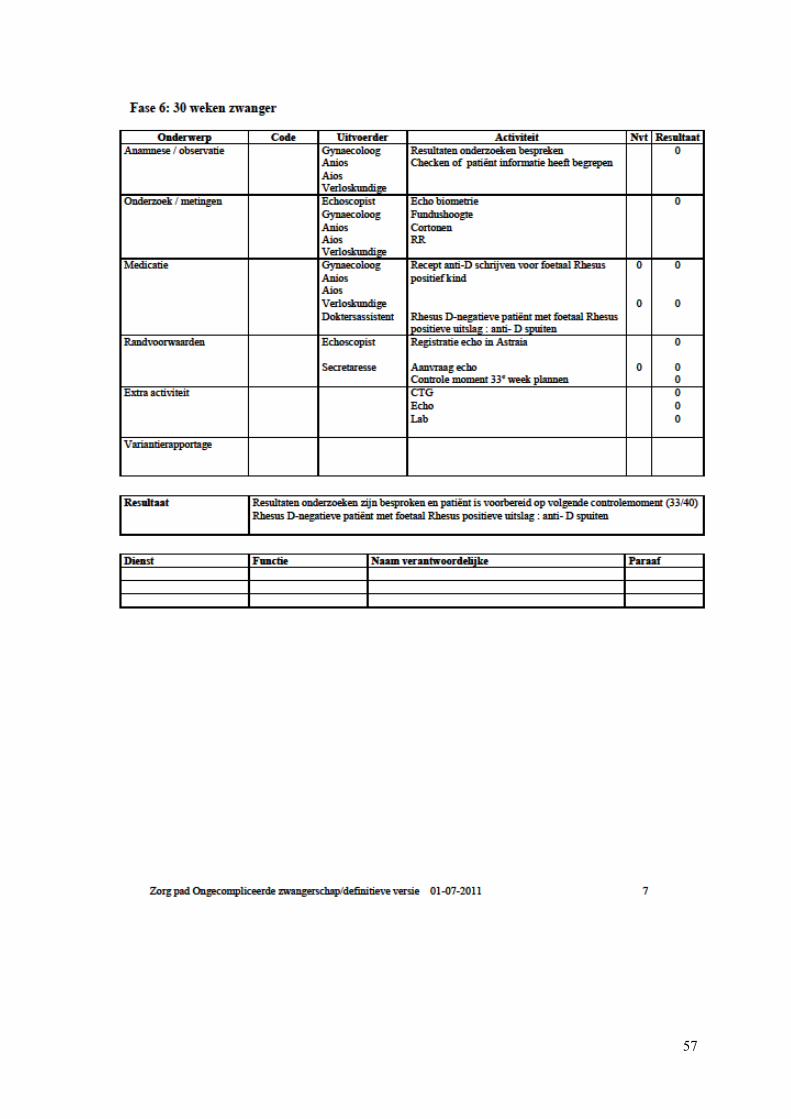
57
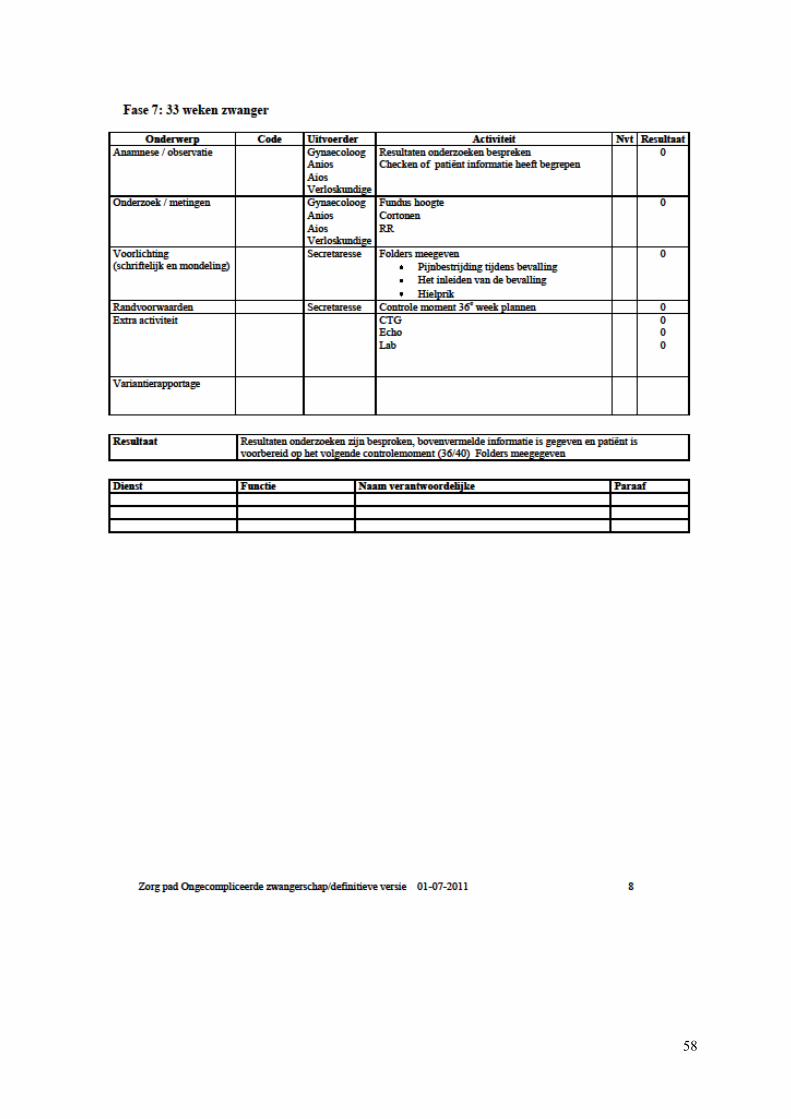
58
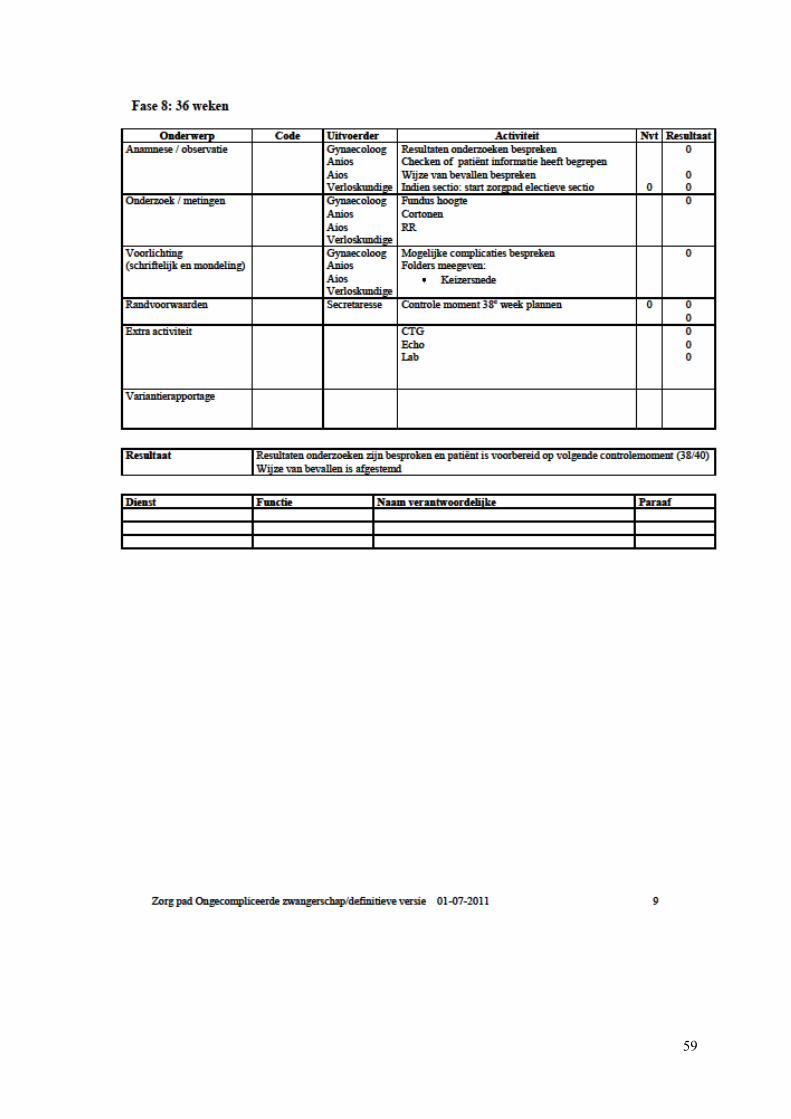
59
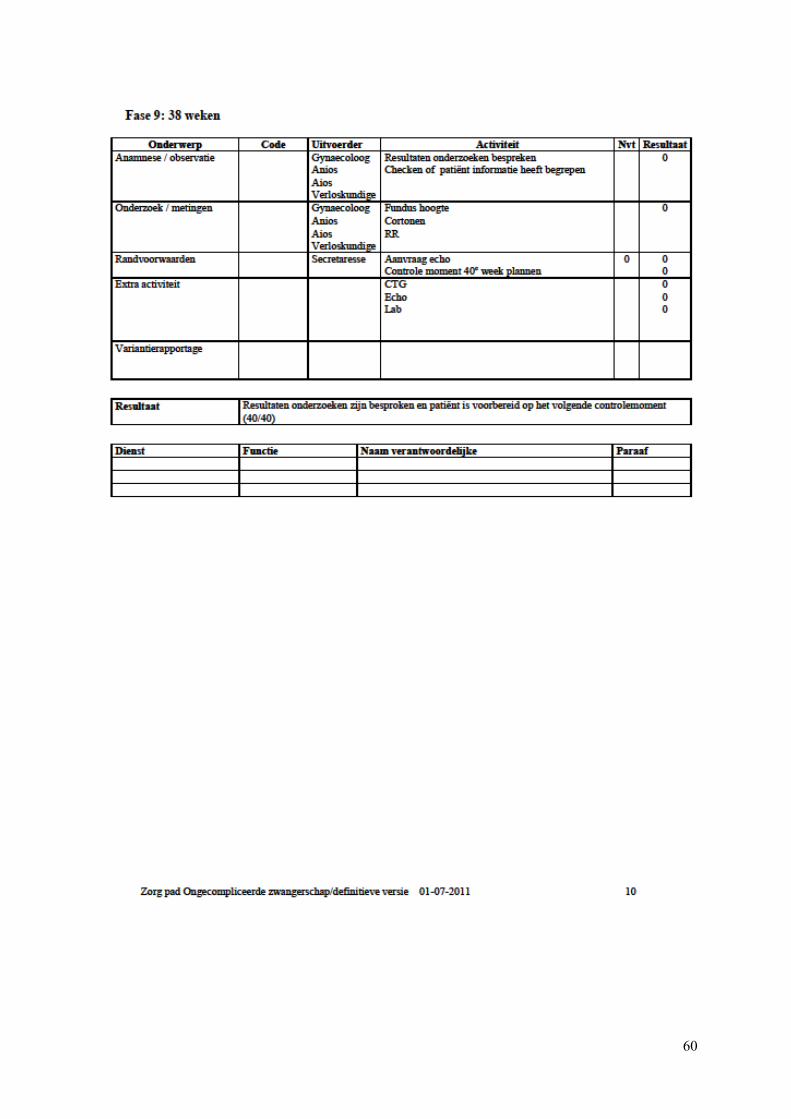
60
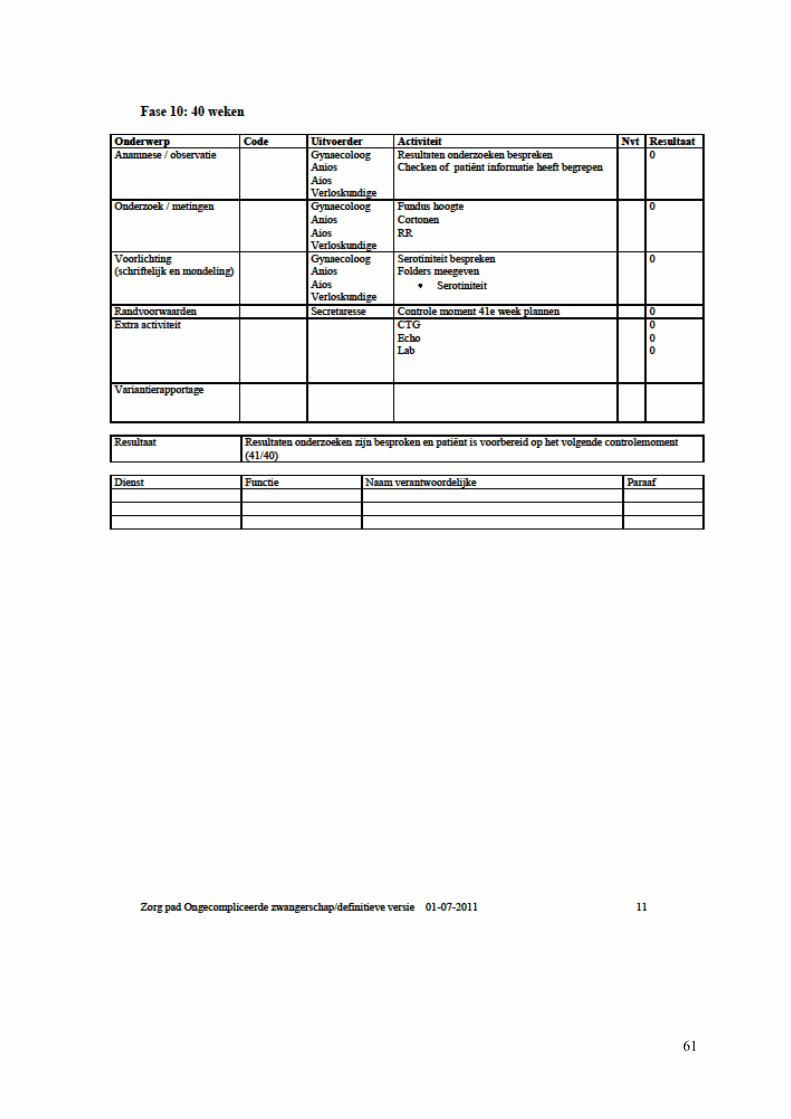
61
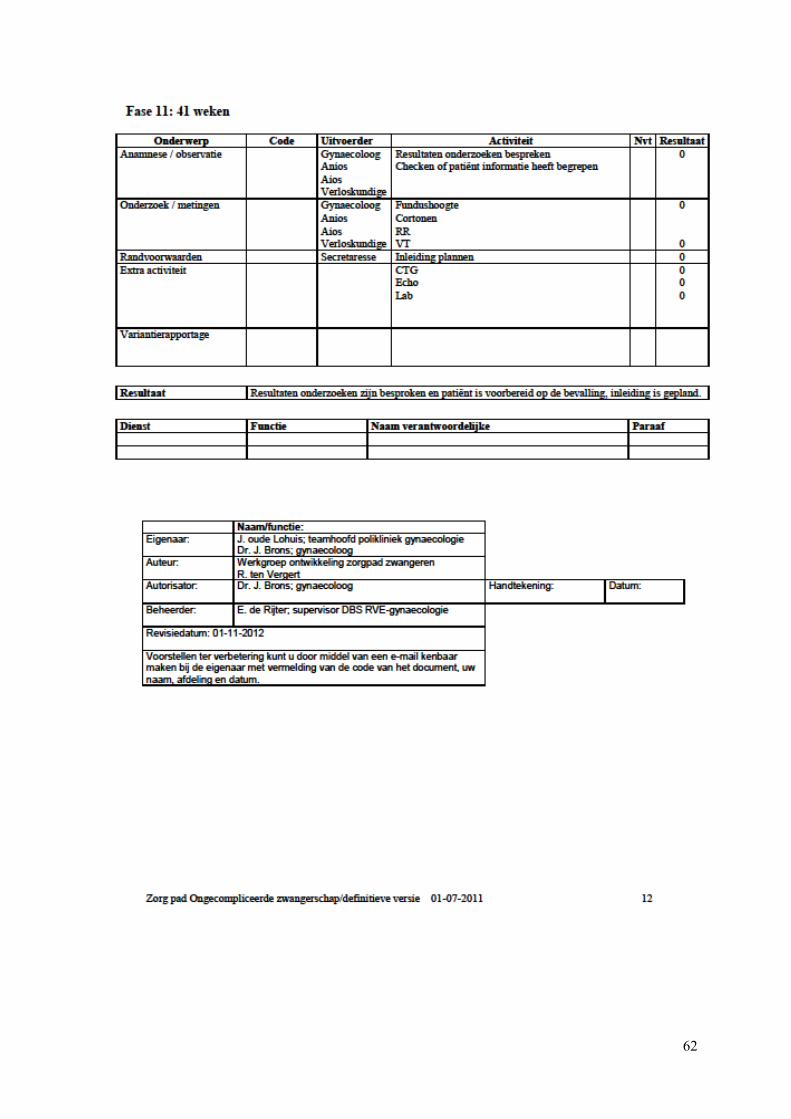
62

63
Appendix D Manual “Planning Tool 2012”
General
The planning tool is developed in an Excel spreadsheet called “Planning Tool 2012”. This Excel file is
used to forecast the expected number of NP and CP slots needed for one patient type. In this case the
calculation is done for patients with “uncomplicated pregnancy".
In the tab “Forecast Planning Tool” the outcome of the forecast is given. The planner of the
department can use this information for decision making on the tactical planning.
Input actual new patients and leaving patients
Input for actual data can be entered in the tab “Actual number of new patients”. Fill in the number of
new patients in the upper part of the sheet. Choose the right phase and the week in which the patients
were new. If there is already entered data for a certain week and phase then add the number of patients
you found to the given number in the sheet.
The lower part of the sheet is for leaving patients. Choose the right phase and the week in which the
patients left the pathway. And again, if there is already entered data for a certain week and phase then
add the number of patients you found to the given number in the sheet.
Input forecast based on history
Input for the forecast per month can be entered in the tab “Forecast per month”. This tab contains the
forecast for the average number of new patients in a week. A different number can be filled in per
month. In which the months are displayed with the numbers 1 to 12. In general this tab has to be used
once a year.
Input start week
At the time the tool is put into use the patients already in the system needs to be entered. This is
possible in the tab “Number of patients start week”. It is very important to enter the determined start
week in the sheet behind the cell with “Start week:”. Then the patients already in the system need to be
entered. At the time of the start week every patient is in a certain week of the pregnancy. Therefore the
number of patients can be entered distinguishing between the number of weeks that a patient is
pregnant.