Embed Size (px)
Citation preview

Master’s Thesis
User-Centered Design and Development of a Mobile Application for Improving Navigation on
Public Transport Systems
Michael Kober, Bakk. rer. soc. oec.
Institute for Information Systems and Computer Media (IICM) Graz University of Technology
Supervisor: Assoc. Prof. Andreas Holzinger, PhD, MSc, MPh, BEng, CEng, DipEd, MBCS
Graz, Oktober 2011

<This page is intentionally left blank>
Masterarbeit (Diese Arbeit ist in englischer Sprache verfasst)
Benutzer-fokussierte(s) Design und Entwicklung einer mobilen Applikation zur Verbesserung der
Navigation mittels öffentlicher Verkehrsmittel
Michael Kober, Bakk. rer. soc. oec.
Institut für Informationssysteme und Computer Medien (IICM) Technische Universität Graz
Betreuer: Univ.-Doz. Ing. Mag. Mag. Dr. Andreas Holzinger
Graz, Oktober 2011

A
<This page is intentionally left blank>

B
Abstract
The main aspects of this thesis include public transportation methods, billing services
and information visualization. An Android application called “The Roadmap” was
developed over a period of about two years. This application allows people within
Austria to request public transportation timetables with the help of addresses, names of
stations or the current user location. The development is an ongoing process. The
application convinced over 17.000 people to use this tool on a regular basis (over
35.000 downloads so far). In addition to normal route requests, the application allows
users to buy transportation tickets, view routes of public transportation networks and
many other useful features. The Roadmap application has also been reviewed by a
popular Austrian newspaper (Fahrplan Österreich, Standard, 2011). The design of the
user interface is a main part of this work. Also the user-friendliness has been determined
by performing a so-called SUS (System Usability Scale) Test, which assessed that the
usability of the application is definitely above average.
At the end business models and cases have been reviewed which can be applied to
mobile applications and the mobile market.
Keywords
Business, context-aware computing, location-based system, mobile application
ÖSTAT-Topics (maximum 4)
1140 50 % 1108 20 % 1150 20 % 1157 10 %
ACM Classification
D.2, H.1.2, H.3.5, H.5, H.5.2, K.4.4

C
<This page is intentionally left blank>

D
Zusammenfassung
Die Inhalte dieser Arbeit befassen sich vor allem mit den Themen “Öffentlicher
Transport”, “Bezahlsysteme” und der “Darstellung von Informationen”. Die Fahrplan
Applikation (engl. Roadmap Application) ist eine Android Applikation, welche es
Personen erlaubt den Fahrplan aller öffentlichen Verkehrsmittel innerhalb Österreichs
entweder mittels Haltestellen, Adressen oder dem aktuellen Aufenthaltsort des
Benutzers abzufragen. Obwohl es auf diesem Gebiet bisherige Projekte und
Konzeptionen gab, gab es zum Zeitpunkt des Entwicklungsstarts kein der Fahrplan
Applikation ähnliches Tool mit einem annähernd ähnlichen Funktionsumfang oder auch
auf Basis Androids. Die Applikation hat mittlerweile über 17.000 Personen überzeugt,
welche die Applikation auf regelmäßiger Basis benutzen (die Applikation wurde bisher
über 35.000 mal heruntergeladen). Zusätzlich wurde die Applikation auch in einer
bekannten österreichischen Tageszeitung erwähnt (Fahrplan Österreich, Standard,
2011). Die Art der Informationsdarstellung war ein wichtiger Aspekt während der
Umsetzung dieses Projektes. Um die Benutzerfreundlichkeit der Applikation zu testen
wurde ein SUS (System Usability Scale) Test durchgeführt. Dabei stellte sich heraus,
dass die Benutzerfreundlichkeit der Applikation weit über dem Durchschnitt bewertet
wurde. Zusätzlich werden gegen Ende der Arbeit noch Geschäftsmodelle und
Geschäftszenarios, die auf dem mobilen Markt angewendet werden können, besprochen.
Schlüsselwörter
Wirtschaft, kontextsensitive Anwendungen, standortbezogene Systeme, mobile
Applikationen
ÖSTAT-Fachgebiete (maximum 4)
1140 50 % 1108 20 % 1150 20 % 1157 10 %
ACM Klassifikation
D.2, H.1.2, H.3.5, H.5, H.5.2, K.4.4

E
<This page is intentionally left blank>
F
STATUTORY DECLARATION
I declare that I have authored this thesis independently, that I have not used other than the
declared sources / resources, and that I have explicitly marked all material which has been
quoted either literally or by content from the used sources.
Graz, 15th March 2010 ………………………………………………
First Name, Surname
EIDESSTATTLICHE ERKLÄRUNG
Ich erkläre an Eides statt, dass ich die vorliegende Arbeit selbstständig verfasst, andere
als die angegebenen Quellen/Hilfsmittel nicht benutzt, und die den benutzten Quellen
wörtlich und inhaltlich entnommene Stellen als solche kenntlich gemacht habe.
Graz, 15.März 2010 ………………………………………………
Vorname, Zuname

G
Acknowledgments
A special thanks deserves my girlfriend, Marlen Koppendorfer, for always supporting
and encouraging me and my work (at any time). Special thanks also go to my friend and
colleague Markus Fink for discussing this project, contributing to the idea of this tool
and always bringing in new features, ideas and thoughts; my parents for allowing and
financing my studies; and my supervisor Andreas Holzinger for supporting my project
and always being available when questions arose or feedback was needed.
Danksagung
Speziell möchte ich meiner Freundin Marlen Koppendorfer danken, die mich immer
und jederzeit bei meiner Arbeit unterstützt hat. Meinem Freund und Studienkollegen
Markus Fink, mit dem ich gemeinsam die Idee zur Umsetzung dieses Tools hatte und
der immer neue Ideen, Denkansätze oder Veränderungsvorschläge einbrachte. Meinen
Eltern, die es mir erlaubt und ermöglicht haben zu studieren (und auch für die
Finanzierung meines Studiums). Und meinem Betreuer Andreas Holzinger, für die
Unterstützung meines Projekts, und vor allem auch dafür, immer für Fragen zur
Verfügung gestanden zu haben.

H
Abbreviations
API Application Programming Interface
DDC Dynamic and Distributed Clustering
DOI Digital Object Identifier
GVB Grazer Verkehrsbetriebe
IA Information Alliance
IT Information Technology
LBS Location Based Systems
MMI Man-Machine Interface
NFC Near Field Communication
OS Operating System
PDA Personal Digital Assistant
PIS Passenger Information Systems
POI Point Of Interest
PUreq Position Update Requests
RAM Random Access Memory
RTPI Real-time Passenger Information
SDK Software Development Kit
SUS System Usability Scale
VM Virtual Machine
I
Table of Contents
1. Introduction and Motivation for Research ................................................................. 1
2. Theoretical Background ............................................................................................ 3 2.1. Mobile Operating Systems ............................................................................................... 3 2.1.1. Palm OS ............................................................................................................................................ 4 2.1.2. Symbian OS .................................................................................................................................... 4 2.1.3. BlackBerry OS ............................................................................................................................... 4 2.1.4. Windows Mobile .......................................................................................................................... 5 2.1.5. iPhone OS (iOS) ............................................................................................................................ 5 2.1.6. Android ............................................................................................................................................ 6
2.2. Market Shares, Platforms and other Differences .................................................... 9 2.3. Technologies and Requirements ............................................................................... 14 2.3.1. iOS .................................................................................................................................................... 14 2.3.2. Android .......................................................................................................................................... 15 2.3.3. Windows Mobile / Windows Phone 7 .............................................................................. 16
2.4. User Interfaces ................................................................................................................. 18 2.4.1. iOS .................................................................................................................................................... 18 2.4.2. Android .......................................................................................................................................... 20 2.4.3. Windows Mobile / Windows Phone 7 .............................................................................. 21 2.4.4. Personal Opinion ....................................................................................................................... 23
2.5. Differences between Mobile Platforms .................................................................... 24 2.5.1. Development Environment and Programming Language ....................................... 24 2.5.2. Market Entering Fees .............................................................................................................. 26 2.5.3. Corporate Identities ................................................................................................................. 26 2.5.4. Why I chose Android ................................................................................................................ 27
3. Related Work ........................................................................................................... 28 3.1. Passenger Needs and Mobile Passenger Information Systems ........................ 29 3.2. Examination of Public Transport Information Requirements ......................... 31 3.3. Architecture of a Passenger Information System for Public Transport
Services ........................................................................................................................................... 35 3.4. Combining GPS and GSM Cell-ID positioning for Proactive Location-based
Services ........................................................................................................................................... 36
J
3.5. Context-aware mobile service for routing the fastest subway path .............. 38 3.6. Designing a route planner to facilitate and promote cycling in Metro
Vancouver Canada ...................................................................................................................... 40 3.7. e-BusGuide - An IT-based Approach to Improve the Profitability of Bus
Transportation Systems in India ........................................................................................... 43 3.8. Experience Gained in the Development of a Route Planner for Mobile End
Devices ............................................................................................................................................ 46 3.9. KAMO - Mobile guide for the city traveler ............................................................... 47 3.10. Privacy-Aware Routing Approach for Mobile Applications ............................ 50 3.11. User-Specific Web-Based Route Planning ............................................................ 52 3.12. Advanced Public Transport Passenger Information: Findings of the
Eurobus Project ........................................................................................................................... 54 4. Materials and Methods ............................................................................................ 57 4.1. Design .................................................................................................................................. 57 4.1.1. Timetable Request .................................................................................................................... 57 4.1.2. Offline Results ............................................................................................................................. 57 4.1.3. Presets ............................................................................................................................................ 58 4.1.4. Buying Tickets ............................................................................................................................ 58 4.1.5. Network of Routes .................................................................................................................... 58 4.1.6. GPS Address Request ............................................................................................................... 58 4.1.7. User Documentation ................................................................................................................ 58
4.2. Development ..................................................................................................................... 59 4.2.1. Android .......................................................................................................................................... 59 4.2.2. Interfaces ...................................................................................................................................... 62 4.2.3. Timetable Request .................................................................................................................... 63 4.2.4. Later Results ................................................................................................................................ 65 4.2.5. Filter ................................................................................................................................................ 65 4.2.6. Results ............................................................................................................................................ 66 4.2.7. Network of Routes .................................................................................................................... 67 4.2.8. GPS Address Request ............................................................................................................... 67 4.2.9. Parsing of the Results .............................................................................................................. 68 4.2.10. Autocompletion ....................................................................................................................... 70
4.3. System Testing ................................................................................................................. 71 4.4. Use Cases ............................................................................................................................ 74

K
4.5. Scheme of the Application ............................................................................................ 79 4.6. Diagrams ............................................................................................................................ 82 4.6.1. Component Diagram ................................................................................................................ 82 4.6.2. Collaboration Diagram ............................................................................................................ 83 4.6.3. Class Diagrams ........................................................................................................................... 85
4.7. UI Design ............................................................................................................................. 94 4.7.1. Early Version of the UI (Spinner Layout) ........................................................................ 94 4.7.2. Another View introduced (AutoCompleteTextView) ................................................ 96 4.7.3. Redesign of the Results ........................................................................................................... 99 4.7.4. General UI Redesign .............................................................................................................. 102 4.7.5. Current UI Design ................................................................................................................... 103
5. Results ................................................................................................................... 107 5.1. Existing Market .............................................................................................................. 107 5.2. Distribution in the Android Market ........................................................................ 108 5.3. Facts about the application ........................................................................................ 109 5.4. Feedback .......................................................................................................................... 111 5.4.1. Feedback via Market ............................................................................................................. 111 5.4.2. Feedback via Mail ................................................................................................................... 112
5.5. Permissions ..................................................................................................................... 112 5.5.1. Verbundlinie ............................................................................................................................. 112 5.5.2. Network of Routes ................................................................................................................. 112
5.6. User Studies ..................................................................................................................... 113 5.6.1. System Usability Scale Test ................................................................................................ 113 5.6.2. SUS Results ................................................................................................................................ 117
6. Future Work ........................................................................................................... 118 6.1. Timetables in XML Format ......................................................................................... 118 6.2. Traffic Jams – Interruption Notification ................................................................ 119 6.3. Timetable-like Information ....................................................................................... 119 6.4. Real-time timetables .................................................................................................... 119 6.5. Real-time notifications ................................................................................................ 120 6.6. Bus-tracking Notifications .......................................................................................... 120 6.7. Automatically setting departure location ............................................................. 121 6.8. POI Navigation ................................................................................................................ 121 6.9. Widgets ............................................................................................................................. 121

L
6.9.1. Buying Tickets ......................................................................................................................... 121 6.9.2. Requesting Timetables (Presets) .................................................................................... 122
6.10. EuroBus project list of functions ........................................................................... 122 6.11. Multi-Language Translations .................................................................................. 123
7. Business Case ........................................................................................................ 124 7.1. Purpose ............................................................................................................................. 124 7.2. Definition ......................................................................................................................... 124 7.3. Mobile Market ................................................................................................................ 124 7.4. Business Model ............................................................................................................... 125 7.5. Mobile Advertising ........................................................................................................ 125 7.6. Business Models in Context of Mobile Advertising ............................................ 126 7.6.1. MMS Advertising Service .................................................................................................... 127 7.6.2. WAP Push Advertising Service ......................................................................................... 128 7.6.3. MMS Advertising Software ................................................................................................. 129 7.6.4. WAP Push Advertising Software ..................................................................................... 129 7.6.1. Mobile Marketing Strategies – Pull or Push? .............................................................. 130
7.7. Mobile Application Distribution Platforms .......................................................... 130 7.8. Business Models in Context of Mobile Application Distribution ................... 132 7.9. Practical Examples, ....................................................................................................... 134 7.9.1. Selling to Verbundlinie ......................................................................................................... 134 7.9.2. Winning the A1-‐Innovations Contest ............................................................................ 134 7.9.3. Selling to GVB ........................................................................................................................... 134 7.9.4. Advertisement ......................................................................................................................... 135 7.9.5. Sponsoring ................................................................................................................................ 135
8. Conclusion ............................................................................................................. 137
9. List of Figures ........................................................................................................ 139
10. List of Tables ....................................................................................................... 143
11. References ........................................................................................................... 144
12. Appendix – Full Detailed Class Diagrams .......................................................... 152
13. Appendix – Complete SUS Results ..................................................................... 172

1
1. Introduction and Motivation for Research
The idea to realize this project was created by my friend Markus Fink and me about two
years ago.
The basic idea of the Roadmap application was an application, which allows a user to
request the current timetable for trams within the area of Graz.
To request timetable information we decided to use the online website of the
Verbundlinie1. Due to the fact that this website allows users to request timetable
information for every kind of public transportation within the borders of Austria, we
quickly realized that this app has to be extended to allow timetable requests for all areas
within Austria.
Particularly in times of ecological stagnation (Alan, Charles, Karen, 2003), rising oil,
and petroleum prices (Jenkins, 1990), the future of humanity cannot be built upon the
idea that everyone owns and uses his / her own car. Furthermore, alternative energy
sources and newly developed engines with, for instance, break force recovery,
electronic units, or hybrid engines are becoming more and more popular (Plunkett,
2005). Also, public transportation should become more popular. The Roadmap
application could be the first step towards this direction.
The Roadmap application allows people to easily access timetable information for
public transport. The application is able to assist each and every person. People that do
not want to learn timetable information by heart, people that aren’t interested in viewing
timetable information displayed in a complicated way directly at the station, or people
that do not want to make use of printed timetable information profit by the use of this
application.
This app allows a user to request timetable information for public transportation at any
time and at any place. This is a huge step towards mobility and innovation for the
future. The target audience is mainly the current generation, but also people of all other
ages are attracted to this application.
1 http://www.verbundlinie.at/

2
Currently the Roadmap application is used by over 14.000 people, and soaring.

3
2. Theoretical Background
This chapter primarily focuses on background information about Android, why Android
has been chosen for this implementation, and what the main differences between
Android and the iPhone OS are. Additionally, the technologies behind the Android and
the iPhone’s OS will be examined and a short overview of the mobile operating systems
market will be given.
2.1. Mobile Operating Systems
The market of mobile operating systems includes multiple and different types of
devices. A mobile device can be seen as
• PDA (Personal Digital Assistant)
• Tablet Computer
• Or more general: Information Appliance, also called Smart Devices
(Smartphones)
(Norman, 1999)
This hypernym (Information Appliance) was coined in the late 70s. At first Jef Rasking
and later Donald Norman described that such devices are meant to fulfill three different
requirements:
1. Designed and pre-configured for a single application
2. So easy to use for untrained people that it effectively becomes unnoticeable,
„invisible“ to them
3. Able to automatically share information with others
(Norman, 1999)
Some electronic typewriters from the mid- and late 80s with screens and little memory
can be described by term 1.

4
These three facts by Donald Norman can also be applied to today’s Smartphones. Term
1 can be adapted to today’s apps within application stores.
Later on, the major companies in the IT sector recognized the importance of such
devices and most of them are also today’s big players in the business of acquiring
market shares in the mobile sector.
These companies are Google, Microsoft, Apple, Nokia, Palm, Research in Motion
(RIM) and Ericcson.
2.1.1. Palm OS
The Palm OS has been one of the losers of the changing market shares in the mobile
sector (Palm OS Market Shares, 2010). Its first appearance was in 1996 where Palm OS
1.0 was introduced. At that time Palm OS was beyond all competitors. Palm Inc was
one out of many companies which was able to deal with handwriting recognition
software (Rhodes, McKeehan, 2002).
2.1.2. Symbian OS
Nokia and the Symbian OS also belong to the loser group of this competition (IDC
Press Release, Market Share Changes, 2010). The original Symbian OS, which has been
used and licensed by many different companies (Samsung, Sony Ericcson, Benq,
Panasonic, Lenovo, LG and many more) was a major player in the mobile sector over
the last decade (Babin, 2007).
Today, Symbian OS is fighting against its own decline. In November 2010 Sony
Ericcson and Samsung published their abandonment of the Symbian platform. Now
Nokia has to deal with development as well as management on its own (ZDNet UK,
2010).
Overall, the future of Nokia and Symbian OS has become a little bit unstable.
2.1.3. BlackBerry OS
Research in Motion, well-established in the business sector, was founded in 1984. Its
first well-known products, the ‘Inter@ctive Pager”, invented in 1998, and, one year
later, the BlackBerry, were presented. RIM did not only focus on developing handsets;
it also developed OS (Blackberry OS) and its software environment.

5
Today, Research in Motion is trying to compete with the new major players in the
market, the iPhone and Android OS. RIM strives to hold its strong position while in
addition gaining more influence through the development of a new Tablet PC called
“Blackberry Playbook” (Sandler, 2010).
The three companies described above played big roles in the history of mobile devices.
Now the big players of today’s mobile sector will be reviewed:
Microsoft, Apple and Google.
2.1.4. Windows Mobile
Microsoft started the development of a mobile operating system in 1994. At first a
device called WinPAD was released which used an Operating System called “Windows
for Pen computing”. Later that year, the first Windows CE version (also called Pocket
PC) entered the market (HWM, 2002).
In 2003 the first official version of an operating system called „Windows Mobile“ was
introduced. It was known as “Windows Mobile 2003“. In the following years this
operating system was developed into Windows Mobile 6, which became the latest and
last operating system in this series (HWM, 2007).
In February 2010 Microsoft finally introduced „Windows Phone 7” (CNET.com, 2010).
With the help of this new OS, Microsoft will attempt to catch up to the new leaders in
the sector, the iPhone and Android OS (Canalys Press Release, Smartphone Analysis,
2010).
2.1.5. iPhone OS (iOS)
The iPhone OS is based on the official Mac2 operating system and has developed into an
operating system not only used in iPhones, but also in the iPod touch, the iPad and the
second generation of Apple TV, a service which allows one to watch videos and movies
over iTunes. The iPhone and its OS were first introduced in the US in June 2007. In
November of that year it became available in Europe (Damaschke, 2009).
2 Apple Macintosh – A product line of computers

6
After the iPad’s release in 2010 and because of its similarities to the previous models,
Apple decided to use a more generic and non-device specific name for its operating
system: “iOS” (Smyth, 2011).
2.1.6. Android
The information in this chapter originates from (Hashimi, Komatineni, MacLean, 2010),
(Conti, 2008) and (Butler et al., 2011).
A small company called Android Inc developed the OS Android. In the year 2005
Google acquired this company. Directly after Google acquired Android Inc, the
development of the Dalvik Virtual Machine was started. In 2007 a group of industry
leaders came together and founded the Open Handset Alliance.
Prominent Members of this alliance are:
• T-Mobile
• Motorola
• Samsung
• Sony Ericsson
• Toshiba
• Vodafone
• Intel
• Texas Instruments
The following graphic gives a short chronological overview of the development of the
Android operating system and the foundation of the Open Handset Alliance.

7
Figure 1 - Timeline Android Development (Hashimi, Komatineni, MacLean, 2010)
One of the major goals of this alliance is to innovate rapidly and respond better to
customer needs. Android has been designed to serve the needs of mobile operators,
handset manufactures and application developers.
At the end of 2007 the first version of the Android SDK was released. This was an early
version and not complete at that time.
About one year later, in September 2008, T-Mobile announced the T-Mobile G1. The
first Smartphone based on the Android platform. A few days later Google announced
the official release and availability of the Android SDK (Release Candidate 1.0).
In the following years the development of the Android platform evolved rapidly. In
April 2009, Android 1.5 (this was the first version that supported soft keyboards3) was
released directly followed by the release of Android 1.6 in September of the same year.
Also, a few months later, Android 2.0 was released which lead to a flood of Android 2.0
devices, which were released for the public before Christmas in autumn 2009. Android
2.0 newly introduced advanced search capabilities, “text to speech” and the support of
HTML 5. At the beginning of the New Year (12 January 2010) Android 2.1, codename
“Eclair“, was released. This new version allowed ‘moving’4 backgrounds, receiving
3 Keyboards only displayed on the screen – no physical keys
4 Automatically changing / animated

8
information about the signal strength, and supported multiple extensions to the Webkit5.
On the 20th of May 2010 “Froyo“ (short form of “Frozen Yoghurt“) was released with
the following improvements:
• A new kernel which needs less internal memory
• Usage of internal memory larger than 256 MB
• JIT-Compiler6
• Tethering7
• Storage facility of Apps on the SD Card
• Android Cloud to Device Messaging Framework (Possibility to include PUSH8
in custom applications)
• ChromeToPhone: Possibility to send web pages wireless from the browser to the
phone
Since the release cycles of the Android platforms are really short, one possible problem
in this procedure is the handset manufacturers. Handset manufacturers very often
modify the Android platform’s user interface by their own software. This leads to
smaller or bigger time lapses between the official release of a new Android version and
the adapted manufacturer’s user interface and software release.
5“The Webkit engine renders and executes JavaScript.” (Shashank, Elrom, 2009)
6 Just-in-time Compiler, optimizes applications for specific systems (Frischalowski, 2010)
7 Allows devices to use (share) the internet connection of mobile phone
8 Computer- automated delivery of information which is transmitted from a server to a registered client
(Dixit, Prasad, 2003)

9
2.2. Market Shares, Platforms and other Differences
The following graphic gives a visual overview of the market shares of the major
companies in the Smartphone sector.
Figure 2 - Market shares Smartphone OSs Table (Canalys Press Release, Smartphone Analysis, 2010)
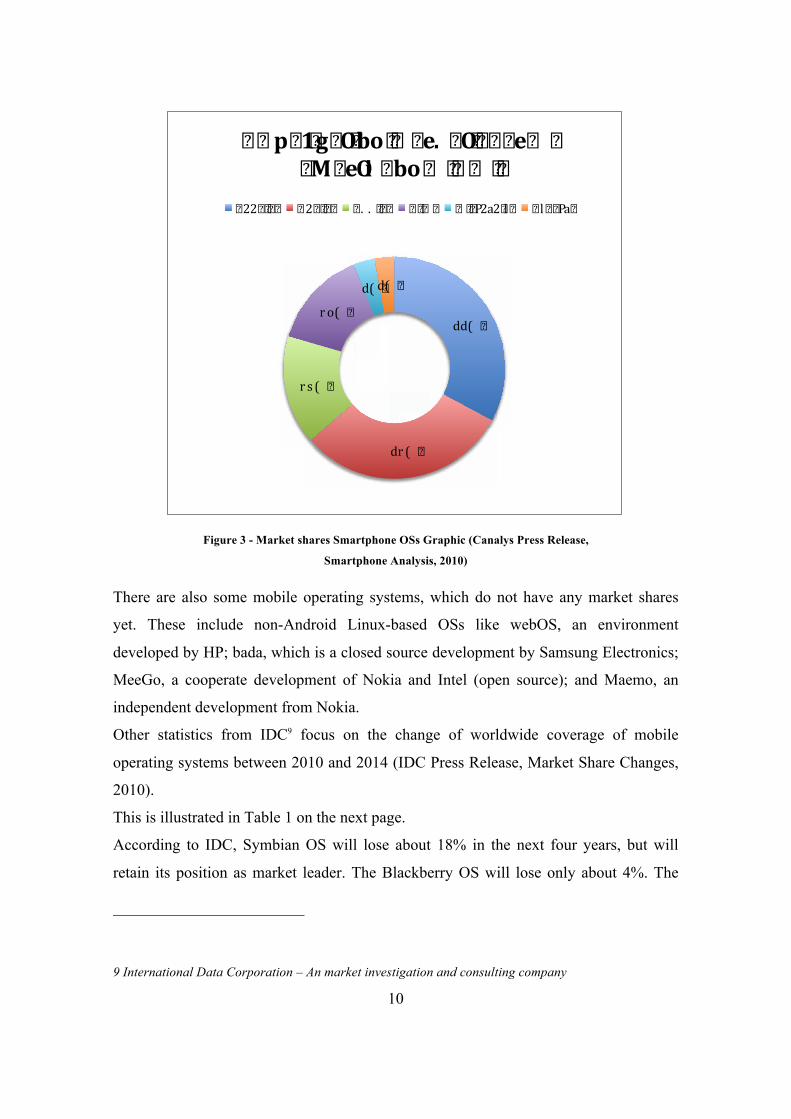
Figure 3 (on the next page) represents the current (at the time this document was
written) situation on the Smartphone sector in the United States. It can easily be seen
that Android has passed Apples iPhone OS. For now, the Symbian OS heads this market
with a market share of approximately 36.6%, followed by Android with 25.5%, iOS
with 16.7%, Blackberry OS with 14.8% and Windows Mobile with about 2.8%. All
information stems from the third Quarter, 2010 (Canalys Press Release, Smartphone
Analysis, 2010).
Statistics and forecasts say that Google, with its Android OS, will be the global
market’s number two until the year 2013. The growth and popularity of the Android OS
seems to fulfill these forecasts (IDC Press Release, Android passes iPhone, 2010).
10
Figure 3 - Market shares Smartphone OSs Graphic (Canalys Press Release,
Smartphone Analysis, 2010)
There are also some mobile operating systems, which do not have any market shares
yet. These include non-Android Linux-based OSs like webOS, an environment
developed by HP; bada, which is a closed source development by Samsung Electronics;
MeeGo, a cooperate development of Nokia and Intel (open source); and Maemo, an
independent development from Nokia.
Other statistics from IDC9 focus on the change of worldwide coverage of mobile
operating systems between 2010 and 2014 (IDC Press Release, Market Share Changes,
2010).
This is illustrated in Table 1 on the next page.
According to IDC, Symbian OS will lose about 18% in the next four years, but will
retain its position as market leader. The Blackberry OS will lose only about 4%. The
9 International Data Corporation – An market investigation and consulting company
dd( �
dr ( �
r s ( �
r o( �
d( �d( �
� p� 1 g� O bo� � e. � O� � � � e� �� M� eOi � bo� � � � � �
� 22� � � � � 2� � � � � . . � � � � � � � � � P2a2� l � l � � Pa�

11
Android operating system will increase its market share significantly and possibly
double its amount to 24.6%. Also Windows Mobile (increase of 3%) and other
operating systems, which haven’t been categorized yet, will increase their market
shares.
Referring to these forecasts, the iOS will decrease its market share from about 14.7% to
10.9%.
Operating
System 2010 Market Share 2014 Market Share
2014/2010
Change
Symbian 40.1% 32.9% -18.0%
Blackberry OS 17.9% 17.3% -3.5%
Android 16.3% 24.6% 51.2%
iOS 14.7% 10.9% -25.8%
Windows Mobile 6.8% 9.8% 43.3%
Others 4.2% 4.5% 8.3%
Total 100.0% 100.0%
Table 1 - Difference Market Shares 2010 - 2014 IDC
For mobile application developers the platform they choose to develop on is very
important.
As stated in (Prenzel, 2010), iPhone users are 66% more likely to click or make use of
advertisements than users on other platforms.
Another very important factor may also be the age of the targeted audience, as shown in
(iPhone Users Age Statistics, 2009).
Age % of Users
13-17 5 %
18-24 13 %
25-34 29 %
35-54 36 %
55+ 17 %
Table 2 - iPhone Users' Age

12
The following figure represents this data in a diagram.
Figure 4 - iPhone Users' Age
Most of the users are over 17 (to be more exact, above 24) years of age. This means
there is great potential in buying applications and spending money on software. Also,
according to reports from (iPhone Users Age Statistics, 2009), over 40% of the iPhone
users have a household income above 100.000 USD, which further supports the
likelihood of great spending in this age category. Another source says that almost twice
as many iPhone users completed at least one financial transaction on their phone each
month (iPhone Users Buy Applications, 2008).
So it is clear that iPhone users do have the spending capacity for mobile applications.
What about Android?
Firstly, while Android users are mainly male (73 %), iPhone users are nearly equal in
gender (53% male, 43% female). But the distribution of age is nearly the same
(Smartphone Users Gender, 2010).
w( �
r d( �
Wh( �ds ( �
rM( �
� � bo� � � � e k� � � � �
rdirM�
r 5iWo�
Wwido�
dwiwo�
ww) �

13
Age % of Users
17 or younger 7 %
18-24 17 %
25-34 30 %
35-44 21 %
45-54 17 %
55 or older 8 %
Table 3 - Android Users' Age
In a graphical representation this looks as follows:
Figure 5 - Android Users’ Age
This shows that there should also be enough spending capacity.
But looking at App purchases (Statistics from 2010), half of the iPhone users buy at
least one application each month, while only 21 % of the Android users do the same
(Smartphone Users Gender, 2010).
M( �
rM( �
de( �Wr ( �
rM( �
5( �
� o� eb � � � � e k� � � � �
rM� 2P� y2m � � P�
r 5iWo�
Wwido�
dwioo�
owiwo�
ww� 2P� 2� � � P�

14
2.3. Technologies and Requirements
This chapter provides a summary of how technologies are used behind mobile operating
systems and whether those operating systems have any minimum system requirements
specified.
The primary focus in this and the next chapter will be on Apple’s iOS, Google’s
Android and Microsoft’s Windows Mobile / Windows Phone OS.
2.3.1. iOS
The iOS is a derivation of the Mac OS X operating system, which is used by the
computer series of Apple. These include MacBooks, MacBook Pros and the desktop
computers like iMacs. Mac OS X and the iOS both have the same foundation; they use
the Darwin operating system as their core (Smyth, 2011).
“Darwin is a monolithic kernel built from Mach and BSD UNIX with an architecture
for dynamically loadable kernel modules for file systems, networking, and drivers.”
(AUUG et al., 2002)
Darwin itself does not have a user interface, with the exception of a command line tool.
iOS consists of four abstraction layers:
• the Core OS layer (Darwin)
• the Core Services layer (Network, Web Services, etc)
• the Media Layer
• and the Cocoa Touch layer
(Smyth, 2011)
The complete operating system needs about 500 megabytes of storage and is located on
the iPhones internal flash drive (Miller, Vandome, McBrewster, 2010).
The iOS itself has no system requirements published. This is clear because Apple is its
own hardware manufacturer and sets the requirements to its own devices before
building them. So there is no need for external people to know the system requirements
for the iOS.

15
2.3.2. Android
The information from this chapter has been acquired from (Hashimi, Komatineni,
MacLean, 2010) and (Butler et al., 2011).
The Android software platform is based on the Linux kernel 2.6 combined with the
Dalvik Virtual Machine.
In the beginning Android was confronted with low-powered handheld devices. In
performance, memory and, above all, speed, mobile phones were behind their desktop
counterparts possibly by 8 to 10 years. They were very limited in computation power
and also RAM. As a consequence of these presuppositions, Google decided to
implement its own version of the Java Virtual Machine. The key figure behind this
implementation was Dan Bornstein, who wrote the Dalvik Virtual Machine. The Dalvik
VM is able to reduce the size of its executable files by half their similar *.jar versions.
This is done by effectively reducing the space requirements and reusing duplicate
information from multiple class files. Additionally, Google has fine-tuned the Java
garbage collection and uses an assembly code generation which differs from the original
by using registers as the primary units of data storage instead of a stack. Google hopes
to achieve a 30% reduction of instructions as a result of these changes.
It must be mentioned that the result of the Dalvik Virtual Machines is not based on Java
byte code but on *.DEX files instead. This has the effect that it can not be directly
executed. First, Java class files must be converted into linkable *.DEX files.
As mentioned in the following chapter, Android uses XML to define its user interface
layouts, which are then compiled into binary files before they become resident on the
devices. This procedure is done to increase the overall system performance.
In the beginning Android did not have any system requirements defined for device
manufacturers. This changed with the introduction of Android 1.6. Since that version,
the requirements are as follows:

16
Screen QVGA (240 x 320 Pixels) Touchscreen
Sensors Accelerometer*, Compass*, GPS receiver*, Bluetooth
transceiver*
Camera 2 megapixels or more
Multimedia -
Memory Minimum 92 MB, 150 MB user storage
GPU -
Processor -
Keyboard Virtual keyboard support
Hardware
Buttons Home, Menu and Back functions available at all times
Others
Must have a USB connection that connects to a standard
USB-A port, wireless high-speed data standard capable of
supporting 200 Kbps, like EDGE, EV-DO, HSPA, 802.11g
(Android 1.6 requires Wi-Fi)
Table 4 - Android Minimum System Requirements (Minimum Hardware Requirements Android, Windows
Phone 7, 2010)
All system requirements marked with an * are not required for Android 1.6 but all
newer versions.
Compared to the Windows Phone 7 system requirements (reviewed later on), it can be
easily recognized that there have been huge improvements in mobile devices
technologies between 2008 and 2010. Microsoft used the elapsed time in Smartphone
development to launch their Windows Phone 7 with the latest hardware available.
2.3.3. Windows Mobile / Windows Phone 7
Windows Phone 7 outlined many system requirements to device manufacturers to
guarantee a smooth and responsive phone and these requirements also guarantee a
responsive system performance (Minimum Hardware Requirements Android, Windows
Phone 7, 2010).

17
Screen Capacitive Screen with 4 or more contact points, 2 screen
sizes: 480x800 WVGA or 480x320 HVGA
Sensors A-GPS, Accelerometer, Compass, Light, Proximity Sensor
Camera 5 megapixels or more, Camera with a flash and dedicated
camera button
Multimedia Common detailed specs, Codec acceleration, FM Radio
Memory Minimum 256 MB, 8 GB Flash Memory or more
GPU Direct X 9 acceleration
Processor ARMv7 Cortex / Scorpion or better
Keyboard Virtual keyboard support
Hardware
Buttons Must be fixed on the face (Start, Search, Back Button)
Others No manufacturer skins like HTC Sense or Samsung
TouchWiz
Table 5 - Windows Phone 7 Minimum System Requirements (Minimum Hardware Requirements Android,
Windows Phone 7, 2010)
Windows Phone 7 is a completely new and independent Microsoft development project.
One consequence of this is that Windows Mobile applications do not run on Windows
Phone 7. Microsoft abandoned the past in perspectives of program compatibility and
chose a new way to go. Additionally, Microsoft wanted to look at the market in a total
new way.
The target group changed from the enterprise market to the end user market. The new
target audiences are so called Life Maximizers. These are people that have both a busy
personal life and professional life (Randolph, Fairbairn, 2010).

18
2.4. User Interfaces
This chapter focuses on the differences between the various types of user interfaces
used by the different platforms.
2.4.1. iOS
Figure 6 - iPhone OS
The iOS user interface focuses on apps. The user has a grid of 4 x 5 (the fifth row
vertically is predefined). Each position in the grid exists of an application. One can
differentiate between preinstalled apps (like Messages, Mail, Calendar, Settings) and
user apps, which have been downloaded manually from the App Store.
In newer versions of the iOS (since iOS 4) users are able to group their applications into
folders, which allows increasing the individual order (Trautschold, Mazo, 2010).
The iOS user interface is very responsive, but Apple tries to equip all different types of
iPhones with the latest iOS version (iOS 4, iPhone Shares, 2011). This leads to usability
problems in some cases.
A problematic example: My girlfriend bought an iPhone 3G shortly after the first
release date. At first the UI was fast and responsive, definitely impressive, but with
increasingly more updates (lately the iOS 4.x version) the entire phone nearly became
useless. I have noticed that many people using an iPhone 3G are having these problems.
19
I have read that in the United States a woman was displeased by Apple because of a
misleading advertisement promising that the iOS 4 makes everything more efficient.
But her iPhone 3G became slower and slower. She filed her lawsuit against the
company because the official Apple support gave her two options in an attempt to solve
her problem: either buy an iPhone 4 or manually use a jailbreak10 and downgrade to an
iOS version similar or prior to 3.1.3. Through this procedure her warranty would
become obsolete (Displeased Apple User, 2011).
This means that Apple is well aware that an iPhone prior to the iPhone 3GS or iPhone 4
looses its responsiveness through newer updates. But Apple does not react nor prioritize
this situation and instead focuses on keeping its course by upgrading all manufactured
devices to a single OS version.
From the perspective of developing applications, the iPhone SDK provides two
possibilities for designing a user interface: simply by using a GUI11 Editor or to design a
GUI by code. The GUI editor is one of the most powerful GUI editors compared to the
other development environments. It reduces the amount of manually written code for
GUI implementation to a minimum because it allows choosing, setting, and aligning
GUI elements directly within the editor on a virtual device screen.
10 A jailbreak allows one to run applications on the iPhone which aren’t validated and permitted by
Apple
11 Graphical User Interface

20
2.4.2. Android
Figure 7 - Android UI
Android’s user interface differs from the iPhone’s as well as the Windows Phone 7 user
interface.
Android users are able to freely modify their homescreen. First of all, an Android
homescreen always exists of multiple homescreens (similar to the iPhone). This means
that the visible screen can be changed by wiping to the left or to the right side. As you
can see at the bottom of the illustration (Figure 7), the dots on left and also on the right
side of the screen indicate that there are two more homescreens on the left and two more
on the right side of the current screen (this is basically similar to the iPhone, but the
iPhone starts its homescreens from left to right while Android always starts at the center
screen).
Another difference to the iPhone or Windows Phone 7 is that the Android user interface
simply shows a background image. If the user wants, he or she can place any kind of
shortcut on it, i.e. to start an application or open a phone contact. If the user likes, the
whole screen can also remain blank.
One thing none of the other operating systems has is a “Widget“. Widgets can be
pictures, setting shortcuts or any type of information (calendar, phone contacts); they

21
can be anything. A widget can be of any size and content (maximum size is the size of a
homescreen). Every developer is able to implement a “Widget” of any type.
From the developer’s side creating an Android UI is more complicated than for instance
an iPhone UI. Some graphical GUI design tools do exist, but in most cases they are hard
and complicated to use. The best way to create an Android user interface for now is
with XML code.
2.4.3. Windows Mobile / Windows Phone 7
Figure 8 - Windows Phone 7 UI
The official name of the Windows Phone 7 user interface is “Metro”. It is based on
“Tiles”, which are aligned in a grid. At maximum, two entries always appear beside one
another. They are vertically aligned, so that they can be seen as represented in a kind of
table.
One major difference between Windows Phone 7 and its predecessor is that it is aimed
at the consumer market instead of the enterprise market. This also resulted in a different
and new user interface.
These tiles can be removed, modified or added by the user. After selecting such a tile
content is represented via “Hubs”. Hubs are used for showing pictures, Facebook
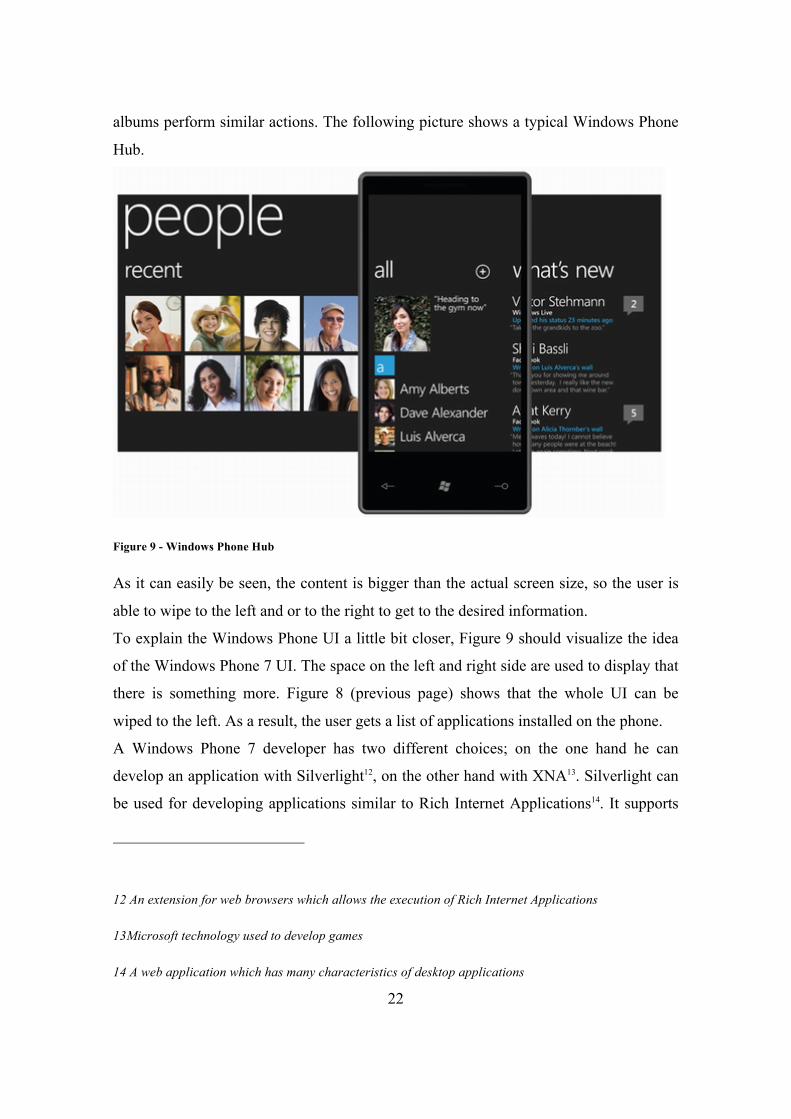
22
albums perform similar actions. The following picture shows a typical Windows Phone
Hub.
Figure 9 - Windows Phone Hub
As it can easily be seen, the content is bigger than the actual screen size, so the user is
able to wipe to the left and or to the right to get to the desired information.
To explain the Windows Phone UI a little bit closer, Figure 9 should visualize the idea
of the Windows Phone 7 UI. The space on the left and right side are used to display that
there is something more. Figure 8 (previous page) shows that the whole UI can be
wiped to the left. As a result, the user gets a list of applications installed on the phone.
A Windows Phone 7 developer has two different choices; on the one hand he can
develop an application with Silverlight12, on the other hand with XNA13. Silverlight can
be used for developing applications similar to Rich Internet Applications14. It supports
12 An extension for web browsers which allows the execution of Rich Internet Applications
13Microsoft technology used to develop games
14 A web application which has many characteristics of desktop applications

23
predefined user interface elements, such as textboxes, lists, tables and buttons. XNA can
be used when developing 2-D or 3-D games. XNA can also be used to develop regular
applications, but developers should be aware that no UI controls are available with
XNA (buttons, textboxes, lists, etc.) (Heise Developer, 2010).
2.4.4. Personal Opinion
Every user interface has its pros and cons but personally I like the Windows Phone 7
and the Android user interface a lot more than the iPhone’s.
This is based on the fact that I do not want to focus on apps using a Smartphone.
Basically the only option an iPhone can give is to manage multiple apps.
An Android phone is much more to me, because I can place a calendar on my
homescreen without having to open any apps in order to see information from my
calendar. It is directly displayed on my homescreen. Another example is the weather.
Weather information on Android devices can be visible directly on the homescreen; no
app must be opened.
Windows Phone 7 is something completely different. The Tiles represent interactive
data and can also display pictures in real-time, calendar entries, or other information
such as the weather. Therefore, in my view, Windows Phone 7 has some similarities
with Android. Windows Phone 7 simply uses a different name, but both OSs (Android
and Windows Phone 7) support the displaying of real-time information on their
homescreens (Android via Widgets and Windows Phone 7 via Tiles).
Future versions of the iPhone’s user interface will become very interesting. The
question which is of most interest is whether the iPhone will have any significant
changes in its homescreen design or continue to follow their app-focused homescreen
scheme in the future.

24
2.5. Differences between Mobile Platforms
There are many differences between the different OS types (iOS, Android, Windows
Phone). The following chapter will take a closer look at them and compare those
differences.
2.5.1. Development Environment and Programming Language
2.5.1.1. Android
The Android platform uses the software Eclipse (Eclipse, 2011) as a development
environment combined with the very common and well-known programming language
Java (Java, 2011). This has the advantage that the programming language is well-
established, well-known and the added benefit that there are currently lots of developers
out there, that know how to deal with this language.
Eclipse, in addition, is a very developer-friendly environment. It supports live
compiling and auto-completion for method names, variables and many other useful
tools which help to make a developer’s life much easier. Furthermore it actively
supports the developer with intelligent proposals. It enables automatic getter and setter
generation, code formatting, automated refactoring or automatic variable creation.
The Android SDK is available as an official Eclipse plug-in and can be downloaded
from the Android developers’ webpage from within Eclipse. Updates for the Android
platform can be directly managed within Eclipse.
Both, the software development kit and the development environment are free.
2.5.1.2. iOS
iOS uses its own manufacture’s (Apple) programming language “Objective C“. This
results in a programming language that is less known. But, as can be seen by the success
of the iPhone and the appropriate App Store, this has been in no way a drawback.
However, a programming language which is not very well-known can definitely be a
drawback. But, fortunately, this did not affect Apple. This has possibly been avoided
because of the similarity between C and Objective C. C is one of the most famous and
best-known programming languages.
The history of Objective C can be summed up very shortly:

25
Brad Cox developed Objective C in the early 80s. In 1985 the founder of Apple, Steve
Jobs, launched the firm NeXT which was aimed at developing powerful, affordable
workstations. NeXT had a powerful user interface toolkit, which had been developed in
Objective C, called NextSTEP. In 1996 NeXT was acquired by Apple and NextSTEP
was renamed Cocoa. Continuously advancing, both Objective C and Cocoa exist now
(Dalrymple, Knaster, 2009).
Xcode, the official software to develop applications for Mac OS X or the iOS is more
advanced as Eclipse in terms of resource intensiveness. Although Xcode does not
support live compiling, it has an integrated auto-completion feature but does not give
intelligent code suggestions like Eclipse.
Similar to Android, the development environment Xcode and the SDK are free.
However, not everything is equally regulated. Eclipse and the Android SDK are totally
free, while the iPhone SDK is free for iPhone developers. To become an official iPhone
developer it requires to pay an annual fee of $ 99. Xcode is being delivered on every
Mac OS X installation CD and only runs on Mac OS X, so it requires buying a Mac.
2.5.1.3. Windows Phone 7
Windows Phone 7 applications are developed in C# and VB.net. As mentioned before
applications are based on Silverlight, XNA and .NET Compact Framework 4 (Heise
Developer, 2010).
App developers can use Microsoft’s Visual Studio 2010 and Expression Blend15 as a
development environment for free. To publish apps in the Windows Phone Marketplace
a yearly fee of $ 99 must be paid. As a market provider (with Apple and Google)
Microsoft is the only company which limits the number of published apps per developer
to five. For additionally submitted apps there is an additional fee to pay of $ 19,99 (App
Hub Membership, 2010).
15 http://www.microsoft.com/expression/products/blend_overview.aspx
26
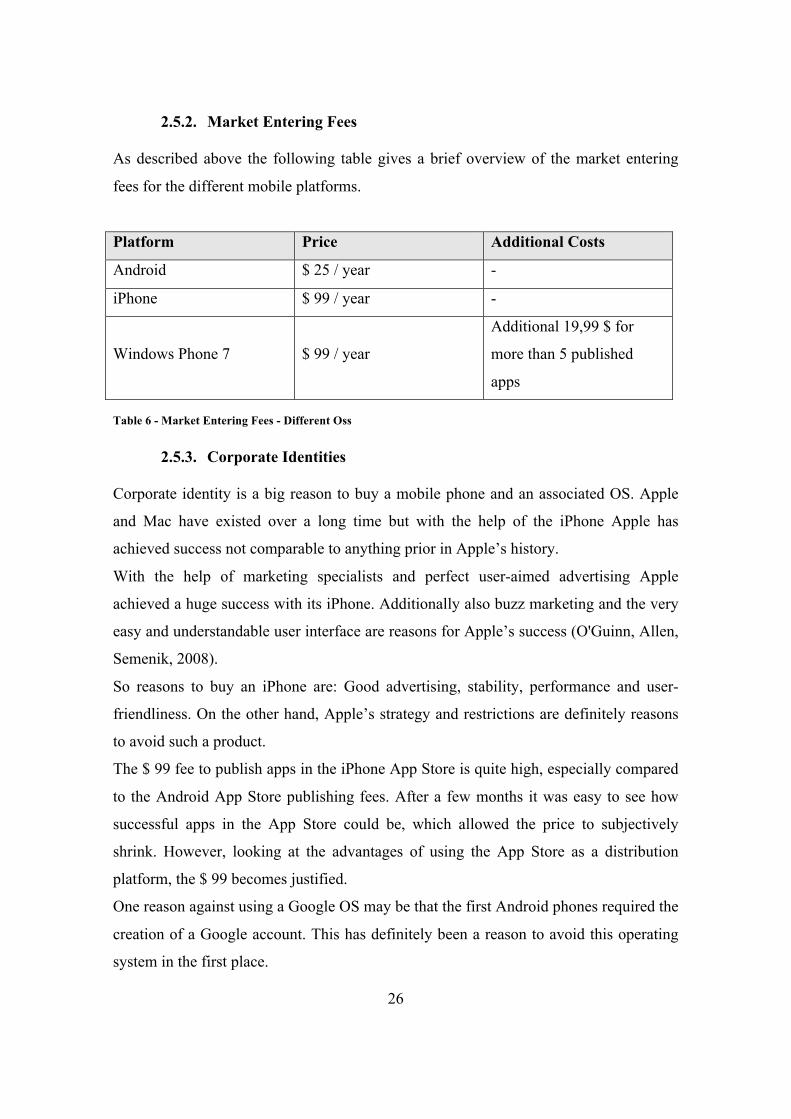
2.5.2. Market Entering Fees
As described above the following table gives a brief overview of the market entering
fees for the different mobile platforms.
Platform Price Additional Costs
Android $ 25 / year -
iPhone $ 99 / year -
Windows Phone 7 $ 99 / year
Additional 19,99 $ for
more than 5 published
apps
Table 6 - Market Entering Fees - Different Oss
2.5.3. Corporate Identities
Corporate identity is a big reason to buy a mobile phone and an associated OS. Apple
and Mac have existed over a long time but with the help of the iPhone Apple has
achieved success not comparable to anything prior in Apple’s history.
With the help of marketing specialists and perfect user-aimed advertising Apple
achieved a huge success with its iPhone. Additionally also buzz marketing and the very
easy and understandable user interface are reasons for Apple’s success (O'Guinn, Allen,
Semenik, 2008).
So reasons to buy an iPhone are: Good advertising, stability, performance and user-
friendliness. On the other hand, Apple’s strategy and restrictions are definitely reasons
to avoid such a product.
The $ 99 fee to publish apps in the iPhone App Store is quite high, especially compared
to the Android App Store publishing fees. After a few months it was easy to see how
successful apps in the App Store could be, which allowed the price to subjectively
shrink. However, looking at the advantages of using the App Store as a distribution
platform, the $ 99 becomes justified.
One reason against using a Google OS may be that the first Android phones required the
creation of a Google account. This has definitely been a reason to avoid this operating
system in the first place.

27
But through openness (Android is open-source), a very fast growing community and
customizability, many manufacturers build Android devices. There are many reasons
for buying an Android-based phone. For developers, the low price of publishing apps is
an additional pro for the Android OS (25$ per year).
Windows Phone 7, the last candidate, also has some pros and cons. Many people using
Microsoft Windows have been victims of Microsoft’s OS “Windows Vista“ or
“Windows Millennium“, which create such phenomena like “Bluescreens“ and errors
without understandable reasons.
But there are also a lot of people, which do like Microsoft, the Xbox 360, and are
attracted by Microsoft’s advertisement campaigns.
The Windows Phone OS reacts very fast and lets the user quickly navigate through the
system. It focuses on the simple Smartphone tasks such as viewing pictures, making
phone calls, browsing the web, writing short messages and so on (Windows Phone 7
Pros, 2010).
Although the Windows Phone 7 Marketplace doesn’t have so many published
applications yet, I’m sure Microsoft will continue to try to close the gap between itself
and its competitors (Windows Phone 7 Number of Applications Published, 2011).
An additional reason against Microsoft Windows Phone 7 may be that there is no
extension slot like microSD to increase the available space, like on Android devices.
Windows Phone 7 shares this disadvantage with the iPhone; both do not allow memory
extension cards.
2.5.4. Why I chose Android
My decision of choosing Android was influenced by different factors. At first, I do own
a MacBook Pro, but the concept of the iPhone has not persuaded me.
At first the development of applications with Java as programming language is more
attracting to me than developing in Objective C.
I also do like the fact that the available memory of Android devices can be extended by
external memory cards which differs from the iPhone as well as from Windows Phone
based devices.
Also the low price for publishing applications was a reason why I chose the Android.
28
3. Related Work
This chapter reviews related work to this project. The related articles and papers range
from public transport systems to route planning applications and also include passenger
information systems.
General user requirements are discussed and each presented paper will be summarized
under different aspects such as relevance to the Roadmap application and personal
opinion to the corresponding paper.
Mobile route calculation and performing routing requests is a topic often discussed all
over the world. For instance, a personal route prediction algorithm is used to facilitate
bicycling in Vancouver. This project helps in reducing the CO2 production and
increases the environmental protection. Additionally, the system is being influenced by
the amount of traffic currently present in the city (Su, Winters, Nunes, Brauer, 2010).
Many people around the world are trying to use this kind of technology to bring
improvements in the social and public sector. The first group of documents focuses on
finding typical passenger needs during trips, and the benefit a mobile route-planning
tool can create.

29
3.1. Passenger Needs and Mobile Passenger Information Systems
A mobile information system, explained in (Blake, Kießling, Unbehend et al., 2002), is
very similar to the Roadmap application. This project also focuses on mobile end-user
devices. Due to the fact that this project was published in 2002 some aspects have been
seen within a different context.
The paper focuses on three main aspects:
• Route planning
• Alerting of traffic jams
• Alternative route suggestions
Sources for real-time information included the traffic information from a local radio
station used for roadwork, an Internet source of the German ministry, and finally the
local weather data from a certain web source.
To achieve the preparation of traffic information for mobile devices XML technology
(including XSLT) was used. This allowed the presentation of the calculated results on
many different devices.
The route calculation was influenced by several factors. For instance, some people
prefer to calculate the shortest route, while others prefer the fastest. Important
differences in using the length of a route as a factor for route calculation were
encountered. Some people preferred a short route with more roadwork, while most of
the people preferred to drive a few kilometers more without roadwork. So the user has
to have the possibility of setting some preferences.
Additionally, some basic calculation rules have been introduced, e.g. dry weather is
preferable to rain.

30
Basically, the route calculation is influenced by the following preferences:
• The length of route
• The number of traffic jams
• The number of road works
• The weather conditions
To solve this route calculation problem, the project was confronted with a multi-
attribute optimization problem. As a solution the SR-Combine approach16 has been
used.
Furthermore, there are two types of information which can be distinguished: online and
offline information.
Offline information is often served hard-coded on a CD or stored in a similar way.
Online information can be accessed from around the world and generally contains the
latest information.
A Central Server Architecture (CSA) has been used to deal with the communication
between the database and the mobile clients. How the system is built is shown in Figure
10, below. This approach allows the delivery of the right information with the right
preparation. This is accomplished by using an appropriate style sheet for each registered
device. The overall server response takes up to a maximum of three seconds, which
proves this new method to be very effective and successful.
16 An explanation of the algorithm can be found in (Meersman, Tari et al., 2002)

31
Figure 10 - Central Server Architecture (CSA)
This paper is not directly connected to the context of the Roadmap application because
the Roadmap application does not have to deal with route calculation, but this concept
delivers insight into how the Verbundlinie route calculation may work. An XSLT style
of preparation for each type of mobile phone possesses very interesting aspects. There is
no need to do such a task in Android because the Android SDK is able to apply user
interface adaption, but if the Verbundlinie would serve their route data as XML, that
could be used to greatly improve the performance of the Roadmap application.
3.2. Examination of Public Transport Information Requirements
This paper focuses on defining user requirements (Caulfield, O’Mahony et al., 2007).
Most of the work is theoretical and sums up possible types of information acquisition or
information preparation. In this paper, requirements for information acquisition in
Dublin, Ireland are discussed.
First of all, there are four different locations where information for passengers is
needed.
32
These are:
• Pre-trip to destination
• At-stop
• Onboard
• Pre-trip return to origin
Secondly, there is a distinction between the general types of information systems:
1. The Internet
2. RTPI displays
3. Mobile phone technology
4. Information kiosks
5. Paper-based information
Shortly explained, the Internet means online availability of public transport routes and
timetables.
So-called RTPI displays (Real-time Passenger Information) are devices which display
the estimated time of arrival of the next public transport vehicle at the station or stop.
Mobile Phone Technology refers to PDAs, handhelds, Smartphones and similar mobile
devices.
Information Kiosks are manned or unmanned structures that provide passengers with
information on public transport. They can be equipped with RTPI displays or additional
route maps for more detailed information about the current location.
Paper-based information is very common with railway companies. The information is
detailed and can be a timetable printout. Sometimes they contain maps of routes or
information about connections.
Next, using an online survey, a passenger requirements analysis was performed. The
survey was opened for two weeks. Three out of five were women. People of every age
took part in this survey; the average age group of people was about 25.
33
The results contain very interesting information about which types of transport people
generally use: about 31% of the questioned people use buses, 6% rail, 25% try to arrive
at any destination by foot, while another 21% of the users traveled by car. The
remaining percentage is divided up among different methods of transport.
A very interesting aspect is the rating of the quality of current passenger information
systems provided at stops or stations. 68% of the users agreed that the quality of the
provided timetables was poor; moreover, 73% agreed that the quality of provided maps
was equally poor. Another 21% also agreed that there exists a lack of information,
which deters them from using public transport methods.
Another interesting part of this paper deals with the importance of attributes of public
transport information systems. The speed of the connection had the highest priority
(95% of the participants found this important), another 47% thought that the occurring
costs were important, and 38% said that costs are not important at all.
In reference to information presented on a website (the Internet), 90% of all
respondents indicated that a map with real-time information of the position of the
vehicle was important. Only 4% said that this information was not important at all. A
route-planning feature was voted as important by 73% of all respondents. Also
information about disruptions was revealed to be very important by 89% of the people.
In reference to mobile phones, the cost of receiving information on a mobile phone was
voted as very important.
Paper-based information was voted to be most important in the form of booklets, which
contain bus or railway timetables (89%). The second highest rating was found for the
combination of booklets of bus and railway timetables. The provision of maps with all
stops or stations had the third highest rating of importance (80%). Another 80% said
that there should also be more information about connecting services when arriving at a
stop or station.
Concerning RTPI displays people found information about disruptions (95%) to be most
important, followed by the estimated time of arrival (93%).
At the end of the paper the most important types of information for each part of a trip
was presented.

34
As pre-trip information from origin to destination paper-based timetables were voted as
most important before trips (48% approval). This was followed by the Internet (30%),
mobile phones (17%) and finally call-centers with a 5% approval rating.
Secondly, the at-stop / station information was discussed. RTPI displays were the most
important option with a 74% approval rating, followed by paper-based methods with
12% and finally information kiosks with 5%.
Thirdly, onboard bus / train information was presented. The results were quite similar
to those mentioned in at-stop / station information, above. RTPI displays were in first
place with 68% approval, paper-based methods were in second place with 12% approval
and other options were rated to be of very little importance.
Finally, the pre-trip organization from destination returning to origin was analyzed. At
this stage the Internet had been the most favored option in gaining information about a
return trip (64% approval). This was followed by paper-based information with the
second highest rating of importance (26% approval).
At the end of the paper issues were discussed that frustrate passengers in public
transportation (for instance, not knowing whether or not a bus has already been at the
station or stops). Also a look was taken at the opinions people have about the current
public transport system in Dublin. Interestingly 48% said that they would pay more for
a better public transport system, while 50% voted that the existing methods of public
transport are already far too expensive.
Additionally, there was a brief section asking how the implementation of real-time
information would affect public transport use. Of those involved in the survey 5% said
that they would use public transport up to 20% more often, 21% said maybe they would
use public transport 10% more often, 24% said that they would use public transport
“somewhat more often” and 50% said that this would not influence their decision in
using public transportation.
This paper has many interesting aspects as well as information relevant for developing a
customer-friendly public transportation system. It was published in 2007 along with the
surveys which took place in Dublin, Ireland. However, because not all of the
information present in this paper is relevant for the present issue, some of it has not
been presented in this summary.
35
One of the most interesting pieces of information is that most people indicated that
paper-based information is their preferred type of pre-trip information to origin.
The Roadmap application is able to display the different connections sorted (as default)
by the arriving times in minutes. But there is not yet any type of timetable lists of
particular stations.
Another important point is the calculation of a return trip, which is currently only
possible with manual user input in the Roadmap application, but not offered
automatically.
It is also very interesting that the Internet was voted just as important for getting
information about a return-trip. Somehow the Roadmap application can also bee seen as
“Internet” so this result shows that people welcome services offered online.
3.3. Architecture of a Passenger Information System for Public Transport
Services
There are different concepts of Passenger Information Systems (further on “PIS”) which
can be taken into consideration (Hiinnikainen, Laitinen, Hiimalainen, Kaisto, Leskinen
et al., 2001). However, the paper primarily focuses on a PIS called TUTPIS, which is
targeted to include timetables, travel route searching, route reservations and electronic
payment methods.
Basically, the goal of the TUTPIS system was to supply individual passengers with
customized information and services. The system allows a passenger to plan a complete
journey, using different types of transport (i.e. bus combined with train and / or
subway). As an information source several internal and external databases were used. In
addition to the arrival and departure time, there were also different types of routes
available, for instance faster or more economic routes or a route with good scenic views.
The passenger is provided with a list of possible routes and is able to choose from
among them.
Additionally, the concept of TUTPIS includes real-time information while traveling.
Telecommunication networks, WLANs and other kinds of networks provide this
information. Furthermore, the information would be displayed on fixed terminals at bus
36
stops. Users get instant notifications on accidental delays caused by traffic jams,
malfunctions or cancellations. The System is also able to automatically recalculate
routes with disturbances and provide alternatives.
The main target of the TUTPIS system was to conduct research in the design and
implementation of personalized passenger information services. A simulation model of
TUTPIS was implemented using Specification and Description Language (SDL). From
this, performance estimations for system servers, wireless network throughputs and
mobile terminals were derived.
The TUTPIS project was researched in 2001. If this project had become a reality, maybe
today’s standards would be improved.
The capabilities of the TUTPIS system can be compared to those of the Roadmap
application. The TUTPIS system can even be called more advanced, but, like the
TUTPIS system, the Roadmap application can also be used to view route information,
search a travel route, make route reservations (buy train tickets, or other public
transportation tickets) and conduct electronic payment. It also allows users to use
different types of transportation for their route calculation and presents the user
different ways to reach a desired location.
The real-time notifications can and should be seen as adaptable. This represents a big
part currently missing in the Roadmap application. How such a feature can be realized
will be discussed later on.
The next paper focuses on location-based services and how location data can be
acquired and used for public transport.
3.4. Combining GPS and GSM Cell-ID positioning for Proactive Location-
based Services
Deblauwe, Ruppel and others explain in their work which strategies are best for
geographically tracking people or devices with the smallest amount of power
consumption because power consumption for continuous tracking is still the biggest
issue with mobile tracking (Deblauwe, Ruppel et al., 2008).
Also the difference between proactive and reactive Location Based Systems (LBS) is
explained. Reactive systems can be seen as simple request-response systems. In contrast

37
to proactive systems, which have to know the detailed user position to supply the user
with location specific, detailed information (i.e. shopping offers, or friend of yours
being near your location).
Today there are many different ways to accomplish such a task using Cell-ID, EoTD,
U-TdoA, OTDoA, GPS or A-GPS (Drane, Macnaughtan, Scott et al., 1998)
(Gustafsson, Gunnarsson et al., 2005) (Sun, Chen, Liu et al., 2005).
The most common and available method today is Cell-ID positioning. It allows locating
a user with very low power consumption. Cell-ID positioning has a wide coverage but
very low accuracy. In this paper this method gets combined with GPS, which is the
most power consuming positioning method, but has the advantage of a very high
accuracy.
The main goal of this research was to provide a method for proactive (with detailed user
position) LBSs that manage to efficiently combine GPS with GSM Cell-ID positioning
to allow reducing the power consumption on a mobile terminal.
The technology used to monitor and track mobile targets is called position update
requests (PUreq). A PUreq is used in a certain geographical area. Instead of transmitting
constant location data, the PUreq method only sends location information when a
geographical area is left or entered. This reduces the number of messages transmitted to
the mobile network significantly.
In this case, a combination of GPS and GSM Cell-ID uses the approximate location in
most cases (Cell-ID) and switches to GPS (high accurate) when the monitored objects
come in close range to each other. This way power consumption can be minimized the
best way.
Tests and differently applied strategies explained in (Deblauwe, Ruppel et al., 2008)
show that the strategy with the best performance uses the already existing cells of the
GSM network. As Cell-ID the index of the corresponding grid element was used
(referred as “Strategy 3”).
Strategy 3: The list of involved terminals (the concept is being developed for tracking
mobile terminals) can be separated in two groups:
• Cell-ID list: terminals, which use the accuracy of the cell grid, which is enough
to monitor proximity.

38
• GPS-list: the proximity / separation of the terminals cannot be decided with the
help of the information of the cells they are inside.
All terminals in the Cell-ID list receive a so-called zone job. This forces the terminals to
send a new PUmsg when the current cell is left. Terminals in the GPS-list use a DDC
algorithm (Dynamic and Distributed Clustering) to calculate distance jobs which
calculate the distance to other terminals from the GPS-list within their cells.
This concept has been tested and proven with an average cell size of about 0.25km2 and
location terminals moving with a speed of 50 km/h in a predefined area.
In test cases as soon as a terminal reached the border of the test area, they returned and
got a new, randomly chosen direction. The results showed that Strategy 3 outperforms
the other presented strategies significantly.
In less than 5% of the cases GPS needed to be switched on for a maximum of ten
seconds. This means that in a suburban environment the GPS receiver can be switched
off for 13% (20 users tracked simultaneously) to 60% (with five users) of the time. In a
dense urban environment these numbers increased to 57% and 80%.
This technology and these strategies can be used to track busses, trains and other kinds
of public transport methods.
It would even be possible that a user gets notified if a bus is going to arrive at a bus
station or stop so he is able to get the arriving bus just in time.
In my opinion, this problem will become less relevant as soon as mobile power supplies
become much more efficient, or another new technology can be used for fast, low-
power-consumption location tracking.
There is definitely a lot of potential in Location Based Services for all kinds of
applications.
3.5. Context-aware mobile service for routing the fastest subway path
The paper (Kim, Lee, Oh, Choi, 2009) focuses on context-aware applications. The main
goal of context-aware applications is to gather user information without requiring the
user to perform a manual input of information.
Such information can be a location, current time, neighboring objects or personal
preferences. Such systems are used to utilize the acquired information in supporting,

39
enhancing and predicting the user’s needs. Additionally, they enhance ubiquity and
availability of information.
In the paper a system is described which uses this context-aware approach. This system
is called “Optimize Your Time System“ (OYT System, for short) and uses the current
time and location to calculate the optimal route for shortest trip-time to a specified
destination in Seoul’s subway system (Korea). Seoul’s subway system existed of 387
stations at that time.
Also other projects, which use context-aware approaches, are mentioned:
• The GUIDE system described in (Cheverst, Davies, Mitchell, Friday, Efstratiou,
2000),
• Smart-Guide (Kwon, Shin, Kim, 2006) or
• CAMP (Mandato, Kovacs, Hohl et al., 2002).
Furthermore, two core categories of context-aware applications are presented: automatic
contextual reconfiguration and context-triggered actions.
Automatic contextual reconfiguration can be described as the continuous updating of a
stored stagnant situation, while context-triggered actions can be defined as an action,
which is triggered when any changes in the context occur. Until now the user’s location
has been regarded as the most important resource for context-aware services.
To calculate the minimum-cost path from a single source to any destination the Dijkstra
algorithm is used (Dijkstra, 1959). As minimal-cost options, different values can be
applied, for instance travel time (duration), number of stops or minimal distance.
The OYT System exists of three main components:
• The Client Module,
• The Location Search Agent and
• The Subway Search Agent.
The Client Module is integrated in the user’s mobile device and receives user intents
such as destination or desired arrival time. The Location Search Agent is used to
identify the current location and searches the nearest subway station via GPS. Finally

40
the Subway Search Agent consists of a location server where all timetable information is
stored and accessed for path optimization. The discovered path will be offered to the
user through the Client Module.
The user interface of the OYT system consists of four different sections. At the top of
the screen the nearest station is detected automatically, directly below the user has to
input the favored destination. This is followed by two buttons which allow choosing
between arrival and departure time. If the corresponding textbox stays empty the
program automatically uses the current system time. Finally, the search method has to
be selected. The user can choose between the fastest subway path and another minimum
transfer paths.
The OYT system is developed in Java Micro Edition and, as mentioned above, uses a
variance of Dijkstra’s algorithm. It calculates not the shortest, but the fastest path. As
user’s context, not only the current time but also the current location influences the path
calculation.
Like the Roadmap application the OYT system uses some of the user’s contextual
information like the current time or current location to request a route to a desired
location.
Also the user interface of the OYT system is similar to the current UI in the Roadmap
application. The main features are identical. Nearest station and destination are both on
the Roadmap application’s main screen, while time specifications can be set when
requesting a scheduled data. Without any changes the Roadmap app automatically uses
the current system time for a new request.
As another feature using context-aware services, the Roadmap application could be
extended to automatically detect the user’s departure location with the help of network
positioning. This idea will be explained in detail within the next main chapter.
The next paper will present how cycling instead of public transport can be facilitated
just by offering services which allow fast and easy route calculation.
3.6. Designing a route planner to facilitate and promote cycling in Metro
Vancouver Canada

41
This paper (Su, Winters, Nunes, Brauer, 2010) focuses on promoting cycling in
Vancouver, Canada. An online route planner configured to calculate the most suitable
routes for cyclists has been described.
Because this paper primarily focuses on trips by bike the more relevant part is the used
route calculation algorithm, which uses both non-compensatory (i.e., the selection of a
route type like ‚safe’, ‚short’ or ‚fastest) and compensatory criteria (like air pollution or
most vegetation).
The user interface is based on a Google Maps interface which uses Google Maps’
representation of the maps. Additionally, the route planner uses Google Maps mashup
techniques17.
As an additional feature, the route calculator provides users with the estimated time
until arrival, saved greenhouse gas, total calories burned, mean air pollution level, total
elevation gained and mean vegetation cover. This is much more information (especially
much more useful information) than in a typical route calculator.
Also the route information can be represented in a user-friendly format. For instance
stored or saved in *.kml files which can be represented with Google Earth or as
coordinates to be uploaded on a GPS device.
The selection of origin and destination can be done with addresses, intersections or
names of popular places. Additionally, a point-and-click identification18 can be used.
Furthermore the Google Maps interface can be used to visualize cyclist activated traffic
signals, transit stations, bus stops, roads prohibited to cyclists, truck routes, public
drinking fountains, schools, community centers, parks maps of air pollution levels and
vegetation covers. This information can be used to get an overview of the different parts
of the city and to think about most suitable and cycling-friendly routes.
This cyclist route planner is the first tool of its kind using a Google Maps interface and
mashup techniques. There is a large variety of possibilities offered to the users and
many options can be chosen.
17 Mashup techniques are new way to create new content by using and mixing already existent content
18 A user selects a specific point on the map as start or destination location

42
To me the concept of such a project is very interesting. The percentage of the cycling
mode share in Canada is about 1.2% for work trips, which is extremely low compared to
10-30% of European countries.
A tool such as this would definitely have a lot of potential when utilized in mobile
phones. In my opinion many users would appreciate so many customization options and
route planning features for mobile route calculation.
The next paper discusses an introduction of an online web portal, which facilitates
public transportation and timetable information in India.

43
3.7. e-BusGuide - An IT-based Approach to Improve the Profitability of Bus
Transportation Systems in India
In (Reddy et al., 2005) the creation of an online web portal, which provides real-time
information of busses, bus schedules and arrival times of busses in India, is planned.
The system is called eBusGuide.
Real-Time in this scenario has to be explained because the data is not retrieved
automatically, instead each bus driver has to perform manual location updates.
Problems of public transport in India include unreliable timetables, missing paper
booklets and low occupancy rates.
One reason for low occupancy rates is that people typically do not know when busses
are arriving or leaving. The typical behavior of an Indian public transportation user is to
go to a bus stop and wait for some time. If no bus passes during that time, then people
try to reach the desired destination by other methods of transport.
With the help of this new and reliable system, occupancy rates should be increased and
people should gain satisfaction and trust in the public transport in India.
In comparison to other electronic, IT-based timetable providing systems this concept
does not use integrated GPS devices in busses or mobile phones to get access to the
required data. Instead it uses normal mobile phones where bus drivers perform manual
location updates in pre-defined intervals (for instance: 30 minutes). This helps the
system to automatically generate timetable information with the provided location
updates.
Users are able to access the provided timetable information with a web browser or on a
mobile phone.
Referring to (Reddy et al., 2005), mobile phone usage in India is growing constantly
and rapidly alongside the number of people which own a computer with Internet access.
This coherence increases the value of an online public transport information system.

44
The eBusGuide system is separated into three different parts:
1. Input / Output
a. Passenger
b. Bus driver
c. Administration
2. Information System
3. Users
As Input, a passenger needs to provide the desired departure location and time to
generate a timetable request. If desired, this information can also be browsed. As
mentioned before bus drivers need to perform manual information updates with their
mobile phones (the mobile phones are provided by the system provider). The
Administration is in charge of performing maintenance tasks within the system, such as
adding new routes, modifying or withdrawing existing routes, changing fares or similar
tasks.
The Information System consists of a database, middleware and a user interface (web-
based). Furthermore, the system contains information about routing, distances, pricing,
scheduling and so on.
The paper also provides a list of advantages and beneficiaries of such as system. Those
are presented on the next page.

45
Advantages of the eBusGuide System
• Increased profitability, quality of service and user satisfaction
• Conductors and bus drivers achieve more job satisfaction
• Passengers enjoy more consistent and shorter journey times together with
accurate well-presented real-time information
• The better quality of service will reduce the environmental effects of traffic due
to lower number of trips by cars or other motor vehicles
• The planning of tourism trips, picnics will be facilitated and non-regular bus
passengers will find effective assistance.
Beneficiaries of the eBusGuide System:
• Bus Transport Corporations: The profits and quality of service will increase.
• People / Society: Passengers travel safely and economically. The number of
deaths due to accidents would be reduced.
• Environment: Less environmental pollution.
• Tourism: The tourism department benefits through improvement of trip
planning.
• Government: More people traveling by bus results in less fuel consumption
With the help of profitability calculations it has been shown that the profitability can be
doubled even with only a 1% increase of passengers who make use of the public
transportation system.
In my opinion, such a system presents a huge benefit to people in India using busses or
other public transport methods, and because of the large population size, many people
are positively affected at the same time. To my mind, the system’s efficiency can be

46
increased by simply changing some of the requirements for the system. For instance, the
use of GPS receivers as explained in (Deblauwe, Ruppel et al., 2008) would reduce the
workload of the bus drivers significantly. A system that does not make use of GPS
receivers results in more work for bus drivers, which in turn would increase their
opposition to that particular system. Furthermore, putting such a system in place is often
very hard to accomplish.
Basically, such a system offers great services to citizens of India. Maybe in the future
similar systems like the Roadmap application will also be offered.
3.8. Experience Gained in the Development of a Route Planner for Mobile
End Devices
(Schmidt, Binnig et al., 2002) focuses on the development of a route planner application
prototype which has been implemented for the use on a mobile end device (PDA).
At that time such an implementation was very hard to accomplish, so a large part of the
application logics (route computation) and resources (image material for maps, route
information, etc.) had to be swapped to an external location. This procedure is called
“offline distribution”. At the end the mobile device only has to find the optimum route
out of a preset of prepared data.
Offline distribution is aimed at minimizing the computational expenditure and storage
amount on devices. The main difference to “online distribution” is that online
distribution in most cases is used when accessed or required data changes frequently (an
online connection is necessary).
The developed prototype has some similarities to the Roadmap application. Firstly,
station names are used to perform a route request. Secondly, it is targeted for PDAs,
which are a type of predecessors of today’s Smartphones.
At the end of the paper possible extensions to the existing prototype are mentioned.
Amongst others the route calculation to possible Points of Interests is mentioned. This
feature, which is also a feature of interest in the Roadmap application, is a great idea
and primarily meaningful for tourists. The Verbundlinie also offers the possibility to
perform such a routing request, but it is not yet implemented in the Roadmap
application.

47
3.9. KAMO - Mobile guide for the city traveler
Another mobile route planning device is described in (Liikka, Laht, Alahuhta,
Rosenberg et al., 2008). It is called KAMO and is used in Helsinki.
During the development, the project was designed to include three main features:
• Assistance in planning a journey
• Stop-specific timetable information
• The possibility of paying for trips using the application.
The application also includes travel news concerning the currently planned trip.
Accidents or changes within the route will be considered.
The project has been compared to several other projects in this field, but KAMO is
described as the only tool which combines real-time positioning-based monitoring of
buses combined with Near Field Communication.
Near Field Communication (short NFC) is a type of technology which allows
triggering certain actions within a device with a provided tag. It can be used to buy bus
tickets or access bus station / stop timetable information.
In (Liikka, Laht, Alahuhta et al., 2008) some other projects with similar abilities also
are mentioned. The “Transport of London” (Mobile Services, Transport For London,
2010) is a WAP-based service for mobile users, which includes a journey planner, travel
news information, timetables and maps, and a service offered by HopStop.com
(HopStop, Your Way To Go, 2010), which is an online transit guide that offers trip-
planning services for traveling by bus or subway in several cities in the United States.
Several more services are shortly explained but, in general, they are all web-based
services, providing routing information, maps or similar travel-relevant information.
One application-based service that differs from its counterparts is called the DB-
Railnavigator and is offered by the Deutsche Bahn AG. It has some features which are
similar to implementations in the Roadmap application. For instance, in addition to
supporting a learnable location list (as we will hear later, the KAMO implementation
also supports this feature), this service also provides maps, route descriptions, tourist

48
attractions and schedule deviations. Furthermore, it supports buying tickets via the
Multimedia Messaging Service (MMS) (Mobile-Apps der Deutschen Bahn, 2010).
Over the course of application development a user requirement analysis was performed.
It resulted in three main design directions for the system:
• Easy-to-use information system which provides route-planning tools,
information during the trip and services for updating information
• Possibility to pay for the trip using the mobile device
• Utility and entertainment services for travelers to use during the trip
A very important reason for implementing such a tool was also that in Helsinki almost
half of daily public transport trips include a change of vehicle. This fact makes such a
tool even more useful because people do not have to know every departure or arrival
time by heart. People are able to use the application to look up the exact arrival time
without having previous knowledge.
The development of the KAMO project consists of two main components:
• The main application developed in Java 2 Micro Edition (J2ME) MIDP 2.0 and
CLDC 1.1 profile
• The KAMO Service, the server component, which uses its own protocol to
transfer messages to its clients in order to generate the least amount of traffic
possible.
The KAMO service acts as a broker that generates data from journey planning and
journey tracking and transfers the packed data back to the user’s mobile device.
There have been two different versions of the application available, a NFC supporting
and a NFC-free version.
As input the application primarily uses a four-digit code of the desired bus stop, but also
an address or a keyword can be entered. Keywords can be “City Center” or “Airport”
which are defined in the back-end system. Additionally, touching the NFC tag with the
mobile phone can also retrieve the timetable.
49
Also, during a bus trip, the location tracking service within the application continues to
track the present location. The KAMO system is even able to notify users when they
have to leave the bus.
The third main feature of the KAMO system is journey planning. A usability test was
performed which showed that this function wasn’t clear to most of the users. Journey
planning was designed to perform a task like the Roadmap application’s “Presets” do. It
is a predefined route, which can be requested by simply tapping it (this is the
implementation in the Roadmap application). The KAMO system requires one more
user input; it additionally asks the user which departure time should be used. The
Roadmap application uses the current system time.
As mentioned above, the KAMO system saves a location entered from a user into
persistent storage. The next time a user starts to enter a previously entered location,
suggestions will automatically appear after only a few starting letters.
The KAMO system supports several user preferences like “allowed travel types”,
“restrict to only low-floor busses” or the option to search only routes with the least
number of transfers. Such options make it very easy to configure the application to
someone’s own demands.
The client receives disruption data automatically when it starts. It will be displayed to
users only once. The information is not connected to a specific route request.
The KAMO system is a very interesting project. It does use some design patterns, which
have also been applied to the Roadmap application service.
The use of the NFC technology is really advanced. Maybe the next generations of
Smartphones will make use of this concept again. Currently the iPhone 5 is being
designed to support this feature. Ticket buying as well as accessing timetable
information on bus stops / stations by simply moving the Smartphone over a tag (which
seems to be the easiest possible way to provide a user with timetable information) are
two very useful features. There is no need to enter any data. Even the application
launches (or installs) automatically.
The KAMO system also avoids the use of GPS and therefore does not need additional
energy-saving concepts or similar strategies to avoid the huge energy consumption of
GPS active services.

50
3.10. Privacy-Aware Routing Approach for Mobile Applications
In their paper, (Aleksy, Butter, 2009) focus on ensuring privacy in route planning.
To go into details of this document, client- and server-based services have to be
explained briefly.
Client-based systems use locally stored map data, which is used for route calculation.
This has the advantage that no Internet connection is required, but also the disadvantage
that this approach can lead to old and incomplete data (like TomTom or Garmin
navigation devices). Through the use of client-based systems the battery life of mobile
devices is also affected negatively because of the extensive computational requirements
(route calculation is performed locally).
On the other side, the server-based approach like Google Maps or Nokia Maps can
often provide more accurate results due to improved storage and computational
capabilities.
One disadvantage about this approach is that the user’s privacy is compromised as his
or her origin and desired destination are being transmitted to the server. Most users do
not want to be monitored by external services. Additionally, it is illegal to collect
location data without a user agreement. Another user aspect is that also most of the
users prefer the storage of user specific data on the local device instead of a central
server.
The project focused on four main aspects during execution:
1. Disconnected operation
2. Restrictions of mobile devices
3. Privacy
4. Quality of information
The Disconnected operation targets the problem of being temporarily disconnected.
This can occur for instance when travelling by car and a device shortly looses
connectivity. This issue shouldn’t affect the application or route calculation on the
device.
(2) focuses on memory constraints in mobile devices and limited calculation power.
51
To explain the term privacy in (3) the following definition (Westin, 1967) has been
used: “the claim of individuals, groups or institutions to determine for themselves when,
how, and to what extent information about them is communicated to others”.
This means the user should have the possibility to deny the transfer of information at
any time.
The quality of information targets the accuracy and up-to-date information of routes and
traffic patterns. In addition, it is also mentioned that this information is especially
required when users travel unknown regions and aren’t aware of alternative routes.
As a route calculation criterion the shortest traveling time is used because most people
prefer to reduce their traveling time on trips. The privacy aspect has been applied when
transmitting the origin and destination location to the server. Instead of transmitting the
exact location, random circles around the current location are used to disguise the exact
user location. This procedure is used for both the origin and destination locations. It also
has to be mentioned that neither the origin nor the destination are located in the center
of these circles.
It is a real pity that this paper does not explain how the route computation is performed.
After reading this paper the question arises how an exact route calculation can be
performed when not using the exact location for route calculation. Maybe this hasn’t
been mentioned to ensure the privacy aspect of this paper, but I personally think this
explanation should be included.
It is mentioned that the exact location is camouflaged, transferred to the server and the
final route is merged on the mobile device again, so it can be assumed that the mobile
device knows how to decode the camouflaged location and perform the final route
calculation exclusively for the client.
This would be the most fitting assumption for this type of route calculation.
In my opinion this is a possible solution to the privacy-awareness problem mentioned in
this paper, but users do have to take into account that the exact user location does not
infringe on privacy in such a form that results in any kind of disturbance. For instance,
the client will not receive advertisement in the mailbox or telephone calls soliciting
participation in surveys. As long as my personal feeling of privacy hasn’t been violated
in a way that produces noticeable consequences, then, in my opinion, it is legitimate to
use the user’s location for statistics or analysis on the server side. Our profit with such
52
services is that we are able to use it for free in most of cases, so the provider also has to
have some profit.
3.11. User-Specific Web-Based Route Planning
The next paper (Pressl, Mader, Wieser et al., 2010) focuses on people with disabilities.
Different to other users like blind or visually impaired people, wheelchair users have
special requirements in a route planning application. To fulfill these requirements this
web-based route planner application has been planned and prototype-a-like
implemented.
Another argument is that handicapped people are quite dependent on public transport
methods. This task hasn’t been very easy because different types of disabilities require
different kind of routes. As an example, for wheelchair users the surface of the ground
is very important, while for blind or visually impaired people crosswalks without a
traffic sign are really dangerous.
In view of all these different problems, a multi-modal and multi-criteria time-
constrained shortest path problem occurred. Due to this problem no existing shortest
path algorithm could be used. Instead, a separate approach had to be taken.
The basis of the system consisted of different data sources and a specialized route-
planning algorithm. The data sources included existing and self-created network data,
time schedules of public transport and comprehensive information (i.e. points of
interest).
The algorithm allows using special user profiles which can be created from users in the
web-based route planning application.
Furthermore a survey was performed to determine where the most obstacles for the
three main user groups (blind people, visually impaired people and wheelchair users)
existed. As responses were not very high, the groups of blind and visually impaired
people were combined.
The following table gives an overview of the top five problems for blind and visually
impaired people as well as for wheelchair users.

53
Blind and Visually Impaired People Wheelchair Users
Bus and train stops with exits at the lane Stairs and steps
Construction sites Material of path surface
Crossings without traffic lights Missing sidewalk ramps
Material of path surface Cordons and gates
Squares and parks Rails at street
Table 7 - Top Five Obstacles of Blind / Visually Impaired People and Wheelchair Users
After combining the different types of data and creating a route calculation algorithm
several problems occurred. These problems can be separated into three different
categories:
• Data is not geographically referenced
• Data is not routable
• Data is not available
Data is not geographically referenced and data is not available are self-explanatory.
But why shouldn’t data be routable? A good example for this is public transport,
because it can not be used in pedestrian sidewalk calculation. Attempts were made to
solve this problem as much as possible.
As a result of route calculation, not only the fastest route was presented, but also a
barrier-free route.
Another special feature of this project is the pre-trip training. It allows people to prepare
for their routes by listening to step-by-step guidance instructions or by navigating
forward and backward in the guidance list to learn the route virtually. This feature is
really useful and allows people with disabilities to gain confidence before their trips.
A very interesting aspect of this project is that it has been implemented in cooperation
with the city of Graz and also the Graz University of Technology.
In my opinion, such a routing application presents a huge benefit for the whole society
because it allows disabled people to gain courage as well as feel confident and secure
when moving about in public areas.

54
Nowadays such an implementation could also be ported to mobile devices, which would
allow make it possible to track a user with GPS coordinates and give him or her live
instructions on the road, or warn about crosswalks. There is definitely great potential in
such a solution.
Another very interesting aspect was that big route-calculation organizations were
mentioned within this paper like the (HaCon, Fahrplanauskunft HAFAS, 2010) or the
(Mentzdv, Elektronische Fahrplanauskunft, EFA, 2010) project.
3.12. Advanced Public Transport Passenger Information: Findings of the
Eurobus Project
The next paper focuses on the history and early progress of developing general and
unique user interfaces and requirements for public transportation (Saint-Laurent,
Chauvet & Khodja et al., 1993).
The paper referred to above was released in 1993, which is over a decade ago and can
be seen as an early requirement analysis to user interface development.
The project was called Eurobus Project and was meant to define specifications and
requirements for public transport interfaces, devices and terminals over all parts of
Europe.
The Eurobus project was designed to use EC-compatible databases (Transmodel data
model) and a geographical information system. The resulting product was supposed to
be either an interactive street terminal or a predefined tool for use on a desktop station.
Defined requirements for passenger information systems at that time were reliability
(adherence to planned schedules) and regularity.
Additionally, passenger information systems were identified as essential for public
transport and grew in popularity, which can definitely be confirmed from today’s
perspective. A list of basic features of the predecessor of the Eurobus project has been
visualized and will be shown on the next page.
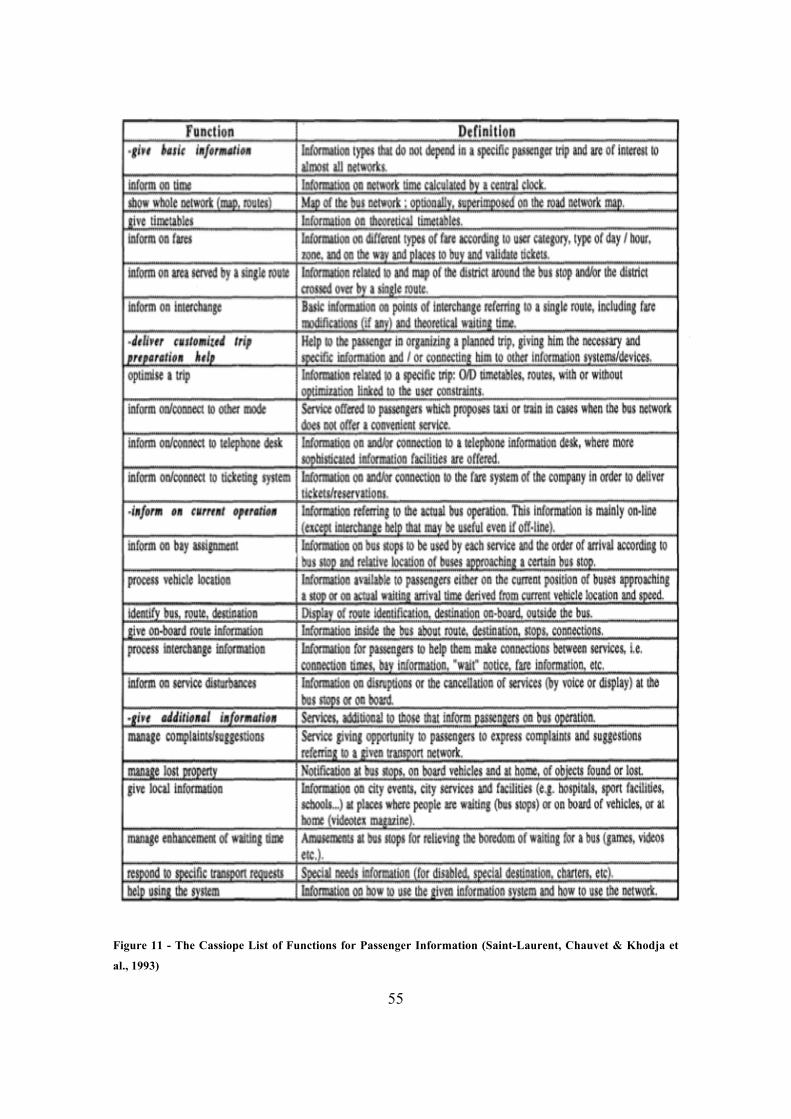
55
Figure 11 - The Cassiope List of Functions for Passenger Information (Saint-Laurent, Chauvet & Khodja et
al., 1993)

56
If you already know the specifications of the Roadmap application, then you will notice
that many of the requirements above are already fulfilled by the Roadmap application.
For instance, people who get the Roadmap application are also informed about the time
of a departure. They are able to view maps of the network of routes, and they are
informed of interchanges. But there are also some features described which aren’t
implemented yet, but would definitely bring an additional benefit for the users. For
instance, if the Roadmap application were available in other languages and configured
for the use of tourists, it would also be very useful tool for receiving information about
fares and other local (context-aware) information.
The terminals implemented during the Eurobus project encompass most of the features
described in Figure 11.
Another positive aspect of the Eurobus project was that a new common user interface
was developed in collaboration with user requests. A study was performed in which
users were asked to define their trip requirements. This data was used for the UI design.
Simultaneously, several alternative MMIs (Man-Machine Interfaces) were developed
and tested. This evaluation was based on mockups19, which were used instead of
prototypes to minimize investments.
Although the paper is quite old it contains very interesting facts about the early
development of public transport information systems and the implementation of user
interface guidelines for such applications.
The paper also contains very interesting facts about UI design and the approach used to
create a user-friendly user interface, which was very ahead of its time.
I think it’s also very interesting that even in such an early stage of public transport
information systems such detailed and specific user requirements and developments
were performed.
19 Schemes or sketches on paper which are used to test user interfaces

57
4. Materials and Methods
This chapter explains the functions of the Roadmap application. First, these functions
are described and then the application is presented with the help of diagrams.
This should give a detailed view of the application’s implementation.
4.1. Design
The design phase of a software project focuses on defining user requirements and
settings boundaries for the development phase.
This helps in staying focused and in avoiding the development of a jack-of-all-trades
device.
This chapter gives an overview of the main functions a Roadmap application should be
capable of, and also additional features, which were determined to be relevant and
necessary for this application.
4.1.1. Timetable Request
The basic function of the app is to port the service of requesting a timetable online to a
mobile platform.
The user can choose between using the name of stations (stops) or addresses for a
timetable request. During this procedure the information gained from the user input is
broadcasted to the Verbundlinie server. The request is processed online and the
resulting webpage is downloaded and examined for information retrieval on the mobile
device itself.
The app allows a user to access current timetables as well as timetables of a specific and
arbitrary point in time.
4.1.2. Offline Results
Once requested, received timetables will be automatically saved within the application.
The advantage of this is that a requested timetable is also available offline. Additionally,
the user has the possibility to save a requested timetable as ‚Favorite’, which has a
similar result as the so-called History. Favorites are also able to be viewed offline.

58
4.1.3. Presets
Users have the possibility to create presets, which allow quick downloading of a
timetable (with a single click).
Presets allow the user to skip the selection of departure and destination location,
because this information has been entered previously.
Presets request the latest available timetable for a predefined route.
4.1.4. Buying Tickets
It is possible to order and buy tickets directly within the application. This currently
works for busses, trains, and trams. A SMS code gets generated and will be
automatically sent to an official number which provides this service. The user receives
an answer via SMS. This received SMS is the user’s valid ticket.
4.1.5. Network of Routes
The user is able to view the network of routes of public transportation types within
certain cities (also offline). This allows the user to gain some overview of a city, its
stops and routes.
4.1.6. GPS Address Request
Users are able to request their current address via the device’s integrated GPS module.
Unfortunately, the Verbundlinie does not currently support the navigation based on
addresses in every part of Austria. That’s the reason why the app is preconfigured for
the use of stops instead of addresses.
4.1.7. User Documentation
Every feature of the application should be visible and understandable to the user. That’s
the reason why the Roadmap application contains a help document for every Activity20
of the app.
20 Most of the times, one, currently visible view (screen) within an Android application is called
‚Activity’

59
4.2. Development
First, this chapter gives a basic overview of Android applications, how they typically
work, and what Android does to achieve an advanced user experience. This will be
followed by a detailed explanation of basic functions of the Roadmap application, the
basic composition of the program and the related class diagrams.
Additionally, some typical user interactions are demonstrated in the form of examples
of usage.
At the end of this chapter there is a short evaluation of the program, its rating in the
Android Market and the developing experience in direct contact with end-users.
4.2.1. Android
Google supplies Android developers with a substantial framework which is well
documented and accessible online via the following URL:
http://developer.android.com/index.html.
The information contained is well-prepared and easily comprehensible due of many
practical examples. Furthermore, it is easy to discern which functions are compatible
with certain versions of Android since it’s clearly indicated on every page of
documentation.

60
4.2.1.1. Typical Course of an Android Application
An Android application contains multiple methods which are canned and often derived
from an interface which can -and in some cases must- be used and rewritten to complete
specific tasks and actions.
The easiest way to explain this issue is by looking at the following illustration. This
image illustrates the typical execution of an Android application.
As explained above, an Activity can be seen (in most cases) as one visible view to the
user.
Figure 12 - Course of an Android Activity

61
A short example: If an Android application launches, the following methods will be
called in this order:
onCreate()
onStart()
onResume()
As soon as an application leaves the visible area of the user, the method onPause() will
be called. When this happens it is recommended to save all important settings because it
is possible that Android’s integrated Memory Management will kill a background
application and all settings will be lost. This approach is also recommended by the
online documentation of the SDK21. Therefore, it is not recommended to use the
methods onStop() or onDestory().
4.2.1.2. List views in Android
To ensure an easy and fast representation of information, Android, like the iPhone OS
has developed a certain concept to display information.
In a scrollable list, already used Views22 will be reused instead of re-creating them.
21 Software Development Kit – Environment to develop an application
22 Label of text fields, pictures or groups of similar UI types

62
The following illustration explains this concept in detail:
Figure 13 - Reusability of Views in Android (Android Tales, 2010)
As soon as an already used View (in this example Item1) leaves the visible area of the
application, it will be saved automatically within the Android recycler. The Android
recycler is an internal memory management tool. At the same time a new View has to
be displayed at the bottom of the current screen. The system does not create a new view;
instead the already existing view from the recycler will be used and initialized with new
content.
This procedure is extremely conserving in resources and allows the Android system to
visualize lots of data very smoothly.
4.2.2. Interfaces
Interfaces have an important role in Android; many basic functions are delivered to
developers via interfaces.
Implementing these interfaces is most times a simple process and can be accomplished
quickly.

63
In such cases the development environment Eclipse is very useful for developers. It
automatically supports and notifies developers which interfaces have to be used, if any
at all, and which methods have to be implemented.
This facilitates the entrance into the world of developing Android applications.
The following pages focus on explaining complex procedures within the Roadmap
application, such as receiving a timetable or processing the timetable information.
4.2.3. Timetable Request
The timetable request is a simple HTTP GET request. In this kind of transmission any
kind of information can simply be appended to the URL. The official webpage of the
Verbundlinie gets downloaded and the received source code gets parsed and all
necessary information will be extracted. This procedure is explained later in this
document.

64
A timetable request (using the current time) consists of the following variables:
Parameter Type | Selection Definition
sessionID= Numerical order of type Long Saves an ID of the current
timetable request (similar to a
cookie)
With User Selection (if input was vague)
placeState_origin= Identified
list
Decides if a location has been
identified or there are multiple
matches available
nameState_origin Identified
list
Decides if a location has been
identified or there are multiple
matches available
Without User Selection (normal request):
type_origin Address
stop
crossing
Type of departure (address,
stop or junction)
type_destination Address
stop
crossing
Type of arrival (address, stop
or junction)
language= de Language setting of the
request
itdLPxx_view= detailview Show the detailed view
(directly including all
stopovers)
place_origin= String Specifies the origin location
place_destination= String Specifies the destination
location
name_origin= String Specifies the origin stop or
address
name_destination= String Specifies the destination stop
or address
Table 8 - Parameters used for the timetable GET request
Some of the parameters are only necessary if departure or arrival stop or location are
vague or haven’t been entered completely. In such a case, the user is able to choose an
entry out of a list of possible matches. The selection must be re-transmitted to the server
containing the old sessionID and all the other needed parameters.
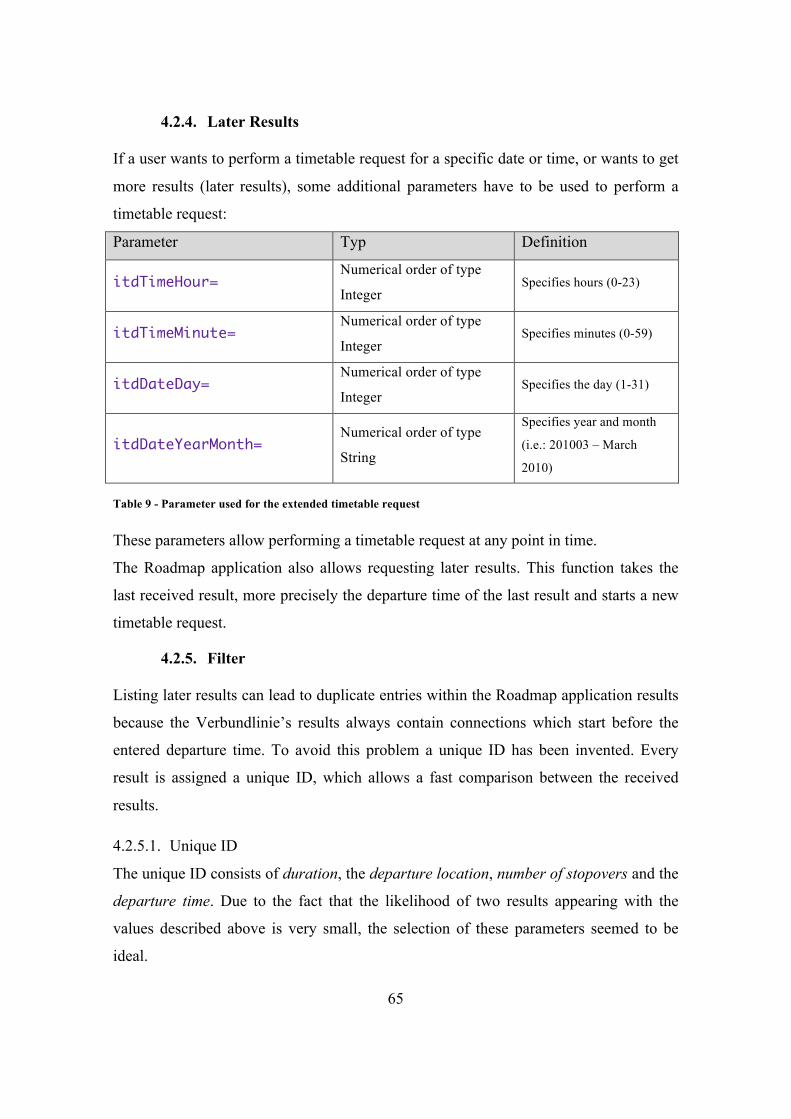
65
4.2.4. Later Results
If a user wants to perform a timetable request for a specific date or time, or wants to get
more results (later results), some additional parameters have to be used to perform a
timetable request:
Parameter Typ Definition
itdTimeHour= Numerical order of type
Integer Specifies hours (0-23)
itdTimeMinute= Numerical order of type
Integer Specifies minutes (0-59)
itdDateDay= Numerical order of type
Integer Specifies the day (1-31)
itdDateYearMonth= Numerical order of type
String
Specifies year and month
(i.e.: 201003 – March
2010)
Table 9 - Parameter used for the extended timetable request
These parameters allow performing a timetable request at any point in time.
The Roadmap application also allows requesting later results. This function takes the
last received result, more precisely the departure time of the last result and starts a new
timetable request.
4.2.5. Filter
Listing later results can lead to duplicate entries within the Roadmap application results
because the Verbundlinie’s results always contain connections which start before the
entered departure time. To avoid this problem a unique ID has been invented. Every
result is assigned a unique ID, which allows a fast comparison between the received
results.
4.2.5.1. Unique ID
The unique ID consists of duration, the departure location, number of stopovers and the
departure time. Due to the fact that the likelihood of two results appearing with the
values described above is very small, the selection of these parameters seemed to be
ideal.
66
Theoretically it would be possible that two results with the same ID exist, but as
mentioned above, the likelihood is acceptable low.
4.2.5.2. ‘Old Results’
Unlike the Verbundlinie server, the Roadmap application only lists results in the future.
For each and every result the estimated time until arrival will be calculated. If this value
is smaller than 1 minute, the result won’t be listed.
4.2.6. Results
On the result list you are able to save the data of a timetable request (location, stop or
address) as a preset.
Presets are thought to allow a user to instantly request a desired timetable. This request
can be performed without entering any kind of input, therefore it’s fast and reliable.
4.2.6.1. Order
It is possible to sort displayed results by four different travel aspects:
• Number of stops
• Duration of the trip
• Departure time
• Arrival time
To perform this task the Java Comparator23 object has been used.
23 http://download.oracle.com/javase/1.4.2/docs/api/java/util/Comparator.html
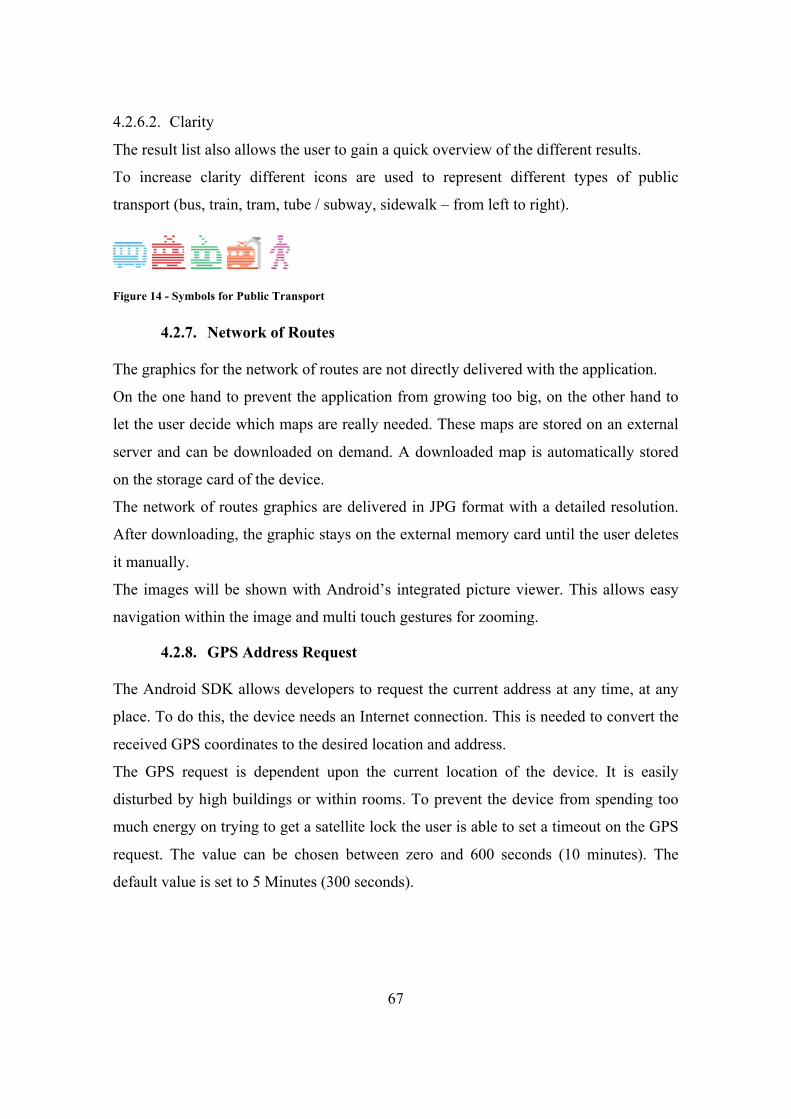
67
4.2.6.2. Clarity
The result list also allows the user to gain a quick overview of the different results.
To increase clarity different icons are used to represent different types of public
transport (bus, train, tram, tube / subway, sidewalk – from left to right).
Figure 14 - Symbols for Public Transport
4.2.7. Network of Routes
The graphics for the network of routes are not directly delivered with the application.
On the one hand to prevent the application from growing too big, on the other hand to
let the user decide which maps are really needed. These maps are stored on an external
server and can be downloaded on demand. A downloaded map is automatically stored
on the storage card of the device.
The network of routes graphics are delivered in JPG format with a detailed resolution.
After downloading, the graphic stays on the external memory card until the user deletes
it manually.
The images will be shown with Android’s integrated picture viewer. This allows easy
navigation within the image and multi touch gestures for zooming.
4.2.8. GPS Address Request
The Android SDK allows developers to request the current address at any time, at any
place. To do this, the device needs an Internet connection. This is needed to convert the
received GPS coordinates to the desired location and address.
The GPS request is dependent upon the current location of the device. It is easily
disturbed by high buildings or within rooms. To prevent the device from spending too
much energy on trying to get a satellite lock the user is able to set a timeout on the GPS
request. The value can be chosen between zero and 600 seconds (10 minutes). The
default value is set to 5 Minutes (300 seconds).

68
4.2.9. Parsing of the Results
The parser of the Roadmap application consists of a recursive algorithm, which parses
the source code step by step and searches the requested information.
To find the information the parser uses the CSS or HTML tags which normally are used
to display the webpage in an ordinary web browser.
All information has a different type of formatting. Departure location, arrival location
and even the duration has its own HTML or CSS formatting. The sequence repeats in a
specific pattern since stopovers and whole trips are always built-up in similar ways.
4.2.9.1. Received Information
Primarily, if it’s not the first request, the server transmits a sessionID, this session ID
will be extracted. This information is optional and does not have to be received.
If it is the first request, the session ID will be automatically set to zero. The session ID
will be used to verify and re-transmit changes on an ambiguous request. For instance, if
a stop or location is not clear to the server, the user has to re-enter the data (or select an
entry from the provided suggestions), and re-transmit the request to the server. This will
be explained in the following example.
If a user selects ‚Bruck Mur’ as departure location (a city in the center of Styria,
Austria), the user receives a list of several choices because the name ‚Bruck Mur’ is not
unique within Austria. So the user has to choose one of the possibilities provided by the
server. If the user chooses ‚Bruck an der Mur’ for instance, the whole request will be re-
transmitted to the server, but in this second request the sessionID received with the first
server response will be included. This allows the server to identify the new user
selection and continue the route-processing algorithm.
Next, the trip summary will be extracted. It is relatively short and is constructed like the
scheme “1. Fahrt am Mittwoch dem DD.MM.YYYY” (“1st trip on Wednesday the
DD.MM.YYYY“ – in English).
69
Subsequently, the number of zones24, departure location, departure time, a tag which
distinguishes between bus-, tram trip or sidewalk, the direction of the type of transport,
the destination location and the arrival time are displayed in this order.
After a sequence of this pack of information the algorithm tries to repeat this procedure
with the remaining document.
If the remaining document does not contain another summary (described above), the
parser aborts since there are no more trips / results contained in this document.
There is also an inner loop in the algorithm. This will be explained in the following.
A trip can exist of an arbitrary number of stopovers. This is the reason why after finding
the arrival time the algorithm tries to find another departure location as well. If the
departure location cannot be found, but instead another summary, the algorithm
automatically generates a new trip (route) instead of a stopover.
24 Zones in Austria are used to create the ticket price within different areas. A long trip crosses several
zones, which makes the ticket more expensive.
70
4.2.9.2. Abortion Criteria
In some situations, if the application receives a specific response from the server, the
extraction process will not be started. This is true in the following situations:
• There is an error within the HTML page, or the page cannot be displayed
correctly, or the system is offline
• Departure or destination location is unknown
• Departure or destination station / stop is unknown
• At a specific location no address navigation can be performed (the user has the
possibility to switch between address and stop mode)
• For the requested route no connection is available within 24 hours
• The requested time or date is outside the accessible or available timetables
• An entered parameter is vague. A user selection has to be made which
specifically defines departure, destination location or station
4.2.10. Autocompletion
If departure, destination location or station has been entered incorrectly or incompletely,
the Verbundlinie server automatically provides a list of matches which are similar to or
complete the entered name.
An Example: A user uses the Roadmap application in station mode and requests a
timetable for the city ‚Graz’ with the name of the station “Straße” (“street” - in English).
This results in a list which contains the name of every station that has ‘Straße’ (street)
anywhere in its name.

71
4.3. System Testing
The application is currently being used by over 17.000 people within Austria on a
regular basis (number of active installations). This large number of users would
typically create the need for intensive testing.
A good model for software testing should contain the following characteristics:
• The exact definition of requirements of new features is very important because
boundaries can be applied and set, and the function is clear for implementation.
• The system architecture and the performance of the implementation should be
checked.
• The different stages of development should have appropriate testing
technologies.
• After defects are fixed, the domain affected should be analyzed.
(Qian, Zheng, 2009)
Another interesting test model for software testing is the so-called “V-Model”. It has a
list of points, which should be applied to software before it can be used.
This process contains the following steps in this order:
• User requirement
• Requirement analysis and system architecture design
• Outline design
• Detailed design
• Coding
• Unit testing
• Integration testing
• Validation testing and system testing
• Acceptance testing
(Qian, Zheng, 2009)
72
Because this project was developed by a single person and consists of several thousand
lines of code, it was very hard to apply typical software design and development
strategies.
However, during the developmental and design phase of a new feature of the Roadmap
application, best possibilities for achieving desired tasks or addressing problems which
may occur during the implementation and realization were taken into account.
Thoughts about programming and development evolved many times. To specify
features also Use Cases were used.
Possibilities of aborting a process or cancelling a result have been properly handled.
As noticed by performing a SUS test on the applications usability, the application was
rated as “very user friendly”.
All new implementations are tested on a physical Android device (Android 2.2) and
new design concepts will be tested on different versions of Android as well as on
different screen sizes within the emulator. The Android emulator provided by the
Android SDK provides a perfect basis for testing applications on different Android
platform version. Different screen sizes, resolutions as well as different Android
platform versions can be set easily. It is a software development tool which allows
simulating every user environment.
The table on the next page gives an overview of which versions of Android are
currently used by the users of the Roadmap application. As it can be seen, more than
half of the users are using the latest version of Android to date, but there is also a non-
ignorable cohort of clients using the first Android version supporting a software
keyboard (Android 1.6).

73
Platform Version User Percentage
Android 2.2 57.5%
Android 2.1 31.9%
Android 1.6 5.6%
Android 2.3.3 2.4%
Android 1.5 2.0%
Android 2.3 0.4%
Android 2.0 0.0% (3 Users)
Table 10 - Used Android Platforms (Roadmap Application)

74
4.4. Use Cases
This chapter shows some typical usage examples of the Roadmap application with the
help of use cases.
Figure 15 - Use Case Diagram, Roadmap Application

75
4.4.1.1. Use Case 1 – Create -Favorite
Name Create Favorite Actor User Requirements • Internet access available
• Departure and destination location are valid Inputs Departure and destination information Outputs Results displayed in the result view Story 1. User enters departure and destination information
2. User selects a route from the result list for details 3. User saves specific trip as favorite
4.4.1.2. Use Case 2 – Rename -Favorite
Name Rename Favorite Actor User Requirements Favorite has been created Inputs New name of the favorite Outputs - Story 1. User switches to the favorite view
2. User holds down on the desire favorite 3. User selects “rename” 4. User enters new name of the favorite
4.4.1.3. Use Case 3 – Request Timetable
Name Request Timetable Actor User Requirements • Internet access available
• Departure and destination location are valid Inputs Departure and destination information Outputs Desired route information Story 1. User enters departure and destination information
2. User presses button “request timetable”

76
4.4.1.4. Use Case 4 – Start Scheduled Request
Name Start Scheduled Request Actor User Requirements • Internet access available
• Departure and destination location are valid • Desired time is within the available interval
Inputs • Departure and destination location • Date and / or time
Outputs Desired route information Story 1. User enters departure and destination location
2. User switches to scheduled request view 3. User selects date and / or time 4. User presses button “request timetable”
4.4.1.5. Use Case 5 – Set Departure Time
Name Set Departure Time Actor User Requirements Valid departure and destination information Inputs Desired time Outputs . Story 1. User enters departure and destination information
2. User switches to scheduled request view 3. User enters desired time
4.4.1.6. Use Case 6a – Create a Preset
Name Create a Preset Actor User Requirements - Inputs Departure and destination location information Outputs - Story 1. User switches to the presets view
2. User manually creates a new preset 3. User enters desired information 4. User saves invalidated preset or user saves and
validates preset

77
4.4.1.7. Use Case 6b – Create a Preset
Name Create a Preset Actor User Requirements • Internet access available
• Departure and destination location are valid Inputs Departure and destination location information Outputs Route information Story 1. User starts a timetable request
2. User presses menu on the results view 3. User selects to save information as preset
This automatically saves the information used for the timetable request (location information) in a new validated preset object.
4.4.1.8. Use Case 7a – Buy a Train Ticket
Name Buy a Train Ticket Actor User Requirements • Internet access available
• Departure and destination location are valid • Name for the ticket
Inputs • Desired departure and destination information • Number of persons, desired time • A name • Selection of class (1st or 2nd)
Outputs • Confirmation message from the service Story 1. User selects to buy a train ticket (Menu –Buy train
ticket) 2. User enters desired information 3. User sends request 4. User receives confirmation message 5. User has to answer to this message to receive a valid
ticket

78
4.4.1.9. Use Case 7b – Buy a Train Ticket
Name Buy a Train Ticket Actor User Requirements • Internet access available
• Departure and destination location are valid Inputs • Desired departure and destination information
• Number of persons, desired time • A name • Selection of class (1st or 2nd)
Outputs • Desired route information • Confirmation message from the service
Story 1. User enters departure and destination information 2. User presses button “request timetable” 3. User goes into the detailed view 4. User selects a train stopover and presses “buy ticket” 5. (Information will be entered automatically) 6. User sends request 7. User receives confirmation message 6. User has to answer to this message to receive a valid
ticket
4.4.1.10. Use Case 8 – Check the Network of Routes for Graz
Name Request Route Information Actor User Requirements • Internet access available Inputs - Outputs - Story 1. User switches to network of routes overview
2. User selects map of Graz 3. (Map of Graz will be downloaded) 4. User views map of Graz

79
4.5. Scheme of the Application
Figure 16 - Scheme of the Package: htcMobileApplications.com
Main
• Home screen of the app
• Capture of inputs
• Launch of a timetable
request
RequestHandler
• Connects to the
Verbundlinie-Server
• Parsing of the received result
ScheduledRequest
• Launches a scheduled
timetable request, contains a
certain date and time
AddEntry
• Manages adding new
stations, addresses and
locations
ResultList
• Displays a received and
prepared timetable
ResultListDetailed
• Displays specific
information to a trip or route
Classes within the Package: htcMobileApplications.com

80
Figure 17 - Scheme of the Package: htcMobileApplications.com - Part 2
WayInfo
• Saves extracted information
of received timetable
• Consists of StopOverInfos
StopOverInfo
• Contains specific
information of stopovers
• Multiple StopOverInfo
objects combine into a
WayInfo object
BuyTrainTicket
• User Interface for buying a
train ticket
MyLocationListener
• Receives GPS coordinates
and converts them into an
address
SettingsDialog
• Manages user settings within
the application
Utile
• Contains static methods
which are globally used all
over the app
Package: htcMobileApplications.com

81
Figure 18 - (left) Scheme of the Package: htcMobileApplicatioons.com.help
Figure 19 - (right) Scheme of the Package: htcMobileApplicatioons.com.maps
Figure 20 - (left) Scheme of the Package: htcMobileApplications.com.removeItemsCheckboxList
Figure 21 - (right) Scheme of the Package: htcMobileApplications.com.TabHistoryAndFavorites
Figure 22 - Scheme of the Package:
htcMobileApplications.com.TabPresets
Package:
htcMobileApplications.com.help
Manages user documentation and help
files
Package:
htcMobileApplications.com.maps
Manages network of routes, displaying
and downloading maps
Package: htcMobileApplications.com.
removeItemsCheckboxList
Contains classes which create a
specific and individual UI element,
which allows easy and fast selection
and deletion of multiple entries
(stations, stops, addresses)
Package: htcMobileApplications.com.
TabHistoryAndFavorites
Contains classes which manage
representation of request history and
favorites
Package: htcMobileApplications.com.
TabPresets
Contains classes which manage
representation and creation of request
presets

82
4.6. Diagrams
First, to give a rough overview of the application a component diagram shows the main
parts of the application.
Afterwards more detailed class diagrams follow. The corresponding full detailed class
diagrams can be found within the appendix at the end of this document.
4.6.1. Component Diagram
Figure 23 - Component Diagram, Roadmap Application
The main components of the application are displayed in Figure 23. The package
htcMobileApplications.com stores the main parts of the application, like the main UI
interfaces, scheduled requests, result “pages”, buying any kind of ticket and similar
parts.
The Package removeItemsCheckboxlist is part of a customize view element which is
generated by code. The code has been adapted from an open Internet source. This
implementation is used for deleting multiple entries of stations, locations or addresses.
The package maps manages the network of routes. It exists of two files, one managing
all network plans excluding the area of Graz. The second class is used for Graz only.
This is because the network plans of Graz are so detailed that they can not be displayed
within a single image file. That’s the reason why the network plans of Graz are
separated into six smaller graphics.
The package help contains two different files, SpecificTopic and Tips. The class
SpecificTopic is used for displaying information about a specific help topic, for instance

83
like the results page. The class Tips is used to show user tips, like how to use the GPS
address acquisition.
4.6.2. Collaboration Diagram
Figure 24 - Collaboration Diagram, Roadmap Application

84
The above diagram visualizes the complete program. A combination of a typical use
case diagram and a component diagram was used to show the interaction of the classes
between each other. Next in the document are class diagrams, where the most important
classes are described in detail.

85
4.6.3. Class Diagrams
This chapter displays overviews of the main classes within the Roadmap application.
The classes shown in this chapter contain only public variables and methods. For a more
detailed view of the classes another version of these diagrams are appended in the
appendix at the end of this document.
First, the Main Class file. The timetable receiving procedure is called within an
asynchronous task. In Android asynchronous tasks are used to not block the user
interface and to handle the calculation of intensive tasks in the background.
In this case, it’s the timetable-receiving request from the Verbundlinie server.
Most Boolean values at the end of the member section are used to save if user
introduction messages should be shown for each Activity or not.

86
Figure 25 - Class Diagram - Main

87
Figure 26 - Class Diagram - ScheduledRequest
The class ScheduledRequest acquires desired date and time and requests a timetable
using the RequestHandler.
Figure 27 - Class Diagram - RequestHandler
The RequestHandler manages the different requests, which are sent to the Verbundlinie
server. It differentiates between including a date or actual system time, using station or
address mode and many other options (Method: loadTimetable). Also the parsing of the
downloaded webpage takes place here (Method: processOutput).
The class ResultList (Figure 28 - below) manages the visualization of the results. In this
Activity a summary of the received routes is displayed. Typically a timetable request
receives between three and six different routes as a result.

88
Figure 28 - Class Diagram – ResultList
Figure 29 - Class Diagram – ResultListDetailed
The ResultListDetailed class is very similar to the ResultList class. Both use a
ListAdapter and implement a ListActivity, which is an interface provided by the SDK
used for displaying information as a list. This is explained in detail in the List views in
Android chapter, earlier in this document.
The class ResultListDetailed shows detailed information about a specific route, such as
the single stopovers, waiting time between the different types of transport, trip times,
and more.

89
Figure 30 - Class Diagram – BuyTrainTicket
This class is used to handle the input from the BuyTrainTicket Activity and sends an
SMS to the corresponding number to buy an SMS train ticket.
Figure 31 - Class Diagram – MyLocationListener
The class MyLocationListener deals with receiving and managing the received GPS
coordinates. If coordinates are received they’ll be automatically transformed into an
address.
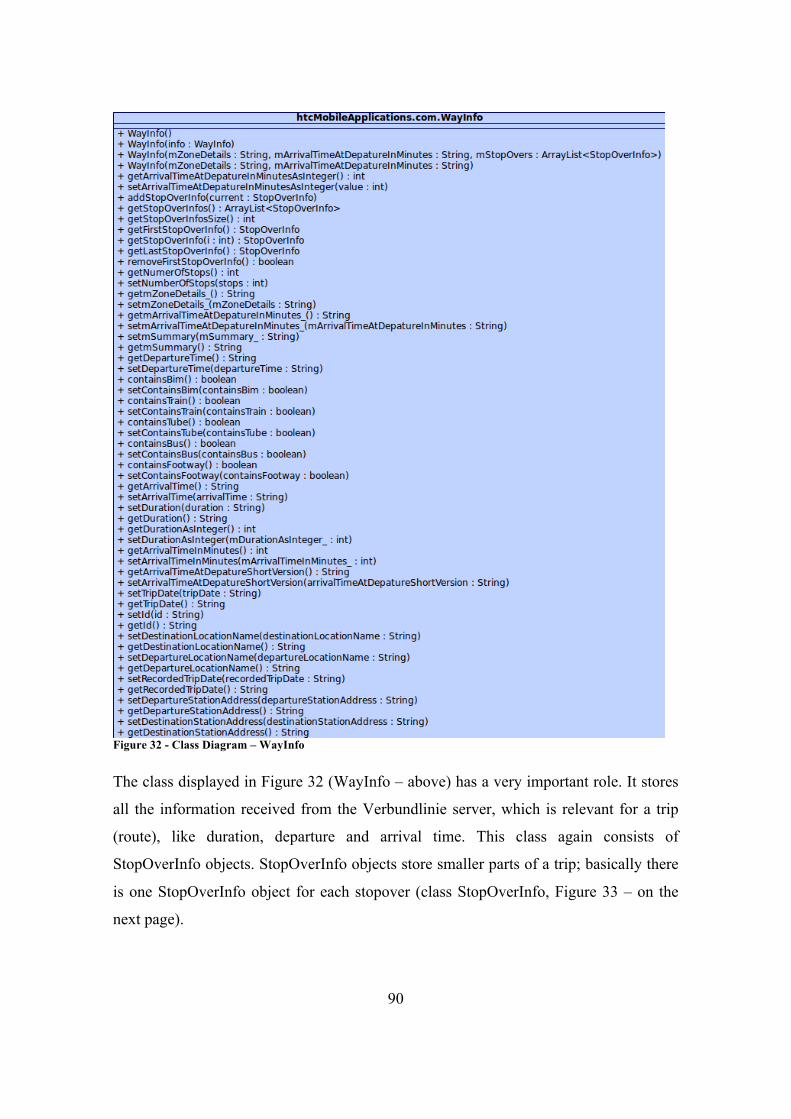
90
Figure 32 - Class Diagram – WayInfo
The class displayed in Figure 32 (WayInfo – above) has a very important role. It stores
all the information received from the Verbundlinie server, which is relevant for a trip
(route), like duration, departure and arrival time. This class again consists of
StopOverInfo objects. StopOverInfo objects store smaller parts of a trip; basically there
is one StopOverInfo object for each stopover (class StopOverInfo, Figure 33 – on the
next page).

91
Figure 33 - Class Diagram – StopOverInfo
Another class which has an important role within the Roadmap application is the class
Utils. It consists of static methods which can be accesed throughout the program. There
are methods used for saving and loading user preferences, showing user messages and
other methods which are needed all over the program.
Figure 32 and Figure 33 give a rough overview of the class Utils. Some methods have
been cut since the class is too big to be shown here.

92
Figure 34 - Class Diagram - Utils Part 1 / 2
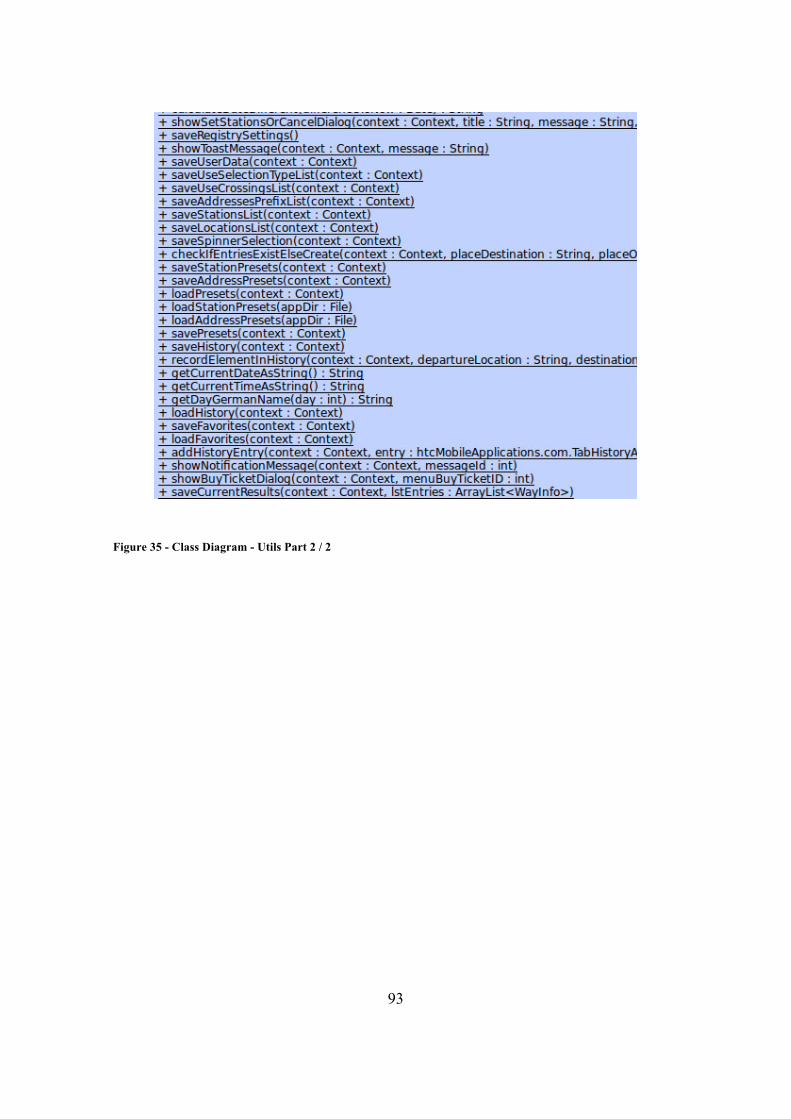
93
Figure 35 - Class Diagram - Utils Part 2 / 2

94
4.7. UI Design
In regard to user interface design the first priority is simplicity. The Keep It Small And
Simple (KISS) principle has always influenced decisions.
The user interface of the application has quite a long history and went through many
changes. An early version, which was presented to the Verbundlinie at that time (with
the addendum that the user interface can be adapted to every desired layout) is shown in
Figure 36 – 40.
4.7.1. Early Version of the UI (Spinner Layout)
As it can be seen, the first user interface included four “Spinners“25, two to select the
location and two for the name of the stations / stops. Before a station or location could
be used for a route-request it had to be added at a separate screen (Figure 38).
This view was accessible via the Menu button (present on every Android device). The
menu contained three options, “Manage Stations”, “Manage Locations” and “About”.
The result was displayed like in Figure 39. This view gave an overview of the received
results. The symbol on the left displayed the first public transport vehicle used for this
route. So if multiple types of transport were used, it wasn’t clear to the user at first
sight.
Detailed information about a trip was presented as displayed in Figure 40. This page
contained all the (basic) information needed to follow a trip: departures, arrivals, times
and locations, and the directions of a specific vehicle.
The information was rare and the visualization wasn’t the best. It was comparable to a
simple prototype, which shows what is possible from the functional perspective.
25 Spinners are similar to drop-down lists, after clicking a Spinner, you get a list of contained items.
After selecting one, the list automatically closes and the new selection is displayed.

95
Figure 36 - Main Screen, Early Version - Roadmap
Application 1
Figure 37 - Main Screen, Early Version -
Roadmap Application 2
Figure 38 - Add Entries View, Roadmap Application
Figure 39 - Result View, Early Version - Roadmap
Application

96
Figure 40 - Detailed Result View, Early Version -
Roadmap Application 5
Figure 41 - Main Screen, AutoCompleteTextView,
Roadmap Application
4.7.2. Another View introduced (AutoCompleteTextView)
Briefly after that a new view was introduced because adding stations and locations
before you can actually use them was too complicated. Given that a route request was
successful, this new view also automatically adds the entered item into a list, which
automatically suggests this location or station the next time the first letters are entered.
This view is called “AutoCompleteTextView“ and is displayed in Figure 41 (above).
To switch between the available views the user simply presses the menu button and
selects “Ansicht wechseln“ (“switch view“ – in English).
Another feature which was added at that time was the scheduled trip. Until that time the
application was only able to perform a timetable request for the current time. The
scheduled request could be started with a click on the red clock displayed in Figure 41
at the right side of the “Fahrplan abfragen“-Button (“request timetable“ – in English).
This request enables selection of a specific time and date for a timetable request.

97
Figure 42 - Address-Mode Setting – Early in the Roadmap Application
The next feature was the integration of addresses instead of stations. Address based
route calculation is currently not supported in all areas of Austria; this was the reason
why station-wise-navigation was implemented first.
At that time the user had to press “Menu“ – “Settings“ to see the in Figure 42 displayed
dialog box.
It was only able to recognize the currently active mode with the help of the changing
captions in the corresponding text fields.

98
Figure 43 - Scheduled Trip View, Roadmap Application
For instance, in station-mode the text field showed the “hint”26 “Abfahrts Haltestelle”
(“departure station” – in English). The text changed to “Abfahrts Adresse” (“departure
address” – in English) when the user switched to address-mode.
Figure 43 on the right shows what the user interface of a simple scheduled trip looked
like.
It is possible to set the time via clicking on the displayed time or by pressing the button
“Zeit einstellen” (“set time” – in English).
26 In this context a text that is written in a text field and disappears when the user enters the first letter.

99
Figure 44 - Detailed Scheduled Trip, Roadmap Application (right)
If the user hits the button “planen” (“schedule” – in German) the view extends and
shows a date plus the actual name of the day (shown in Figure 44).
The difference in button design should be disregarded, as well as the dark background
of the buttons. This is because the screenshot of Figure 44 was taken on another device
than the screenshot displayed in Figure 43. These changes have been automatically
applied due to a different device manufacturer.
The real difference between Figure 44 and Figure 43 is the “Abfahrtszeit” (“departure
time” – in English) and “Ankunftszeit” (“arrival time” – in English) on top of the view.
These buttons allow the selection of the desired time (arrival- or departure-time).
4.7.3. Redesign of the Results
The next step towards an intuitive and useful user interface was the redesign process of
the results like shown in Figure 45.
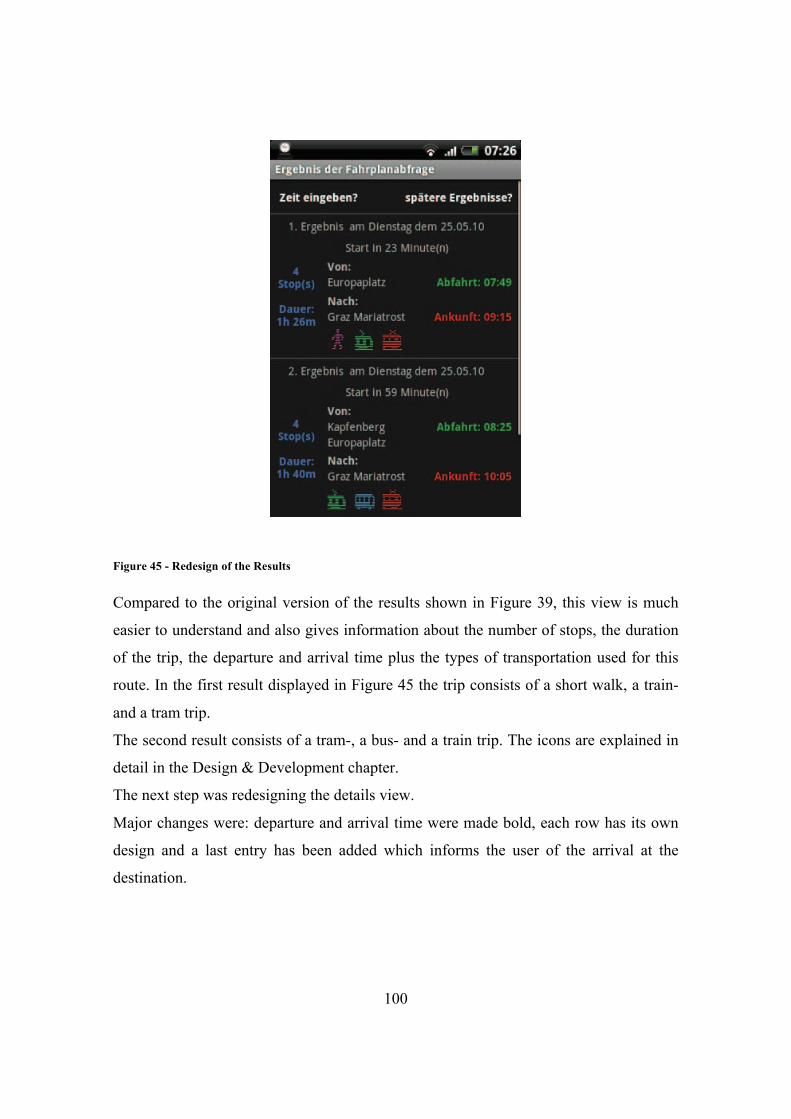
100
Figure 45 - Redesign of the Results
Compared to the original version of the results shown in Figure 39, this view is much
easier to understand and also gives information about the number of stops, the duration
of the trip, the departure and arrival time plus the types of transportation used for this
route. In the first result displayed in Figure 45 the trip consists of a short walk, a train-
and a tram trip.
The second result consists of a tram-, a bus- and a train trip. The icons are explained in
detail in the Design & Development chapter.
The next step was redesigning the details view.
Major changes were: departure and arrival time were made bold, each row has its own
design and a last entry has been added which informs the user of the arrival at the
destination.

101
Figure 46 - Redesign of the Trip Details

102
4.7.4. General UI Redesign
Figure 47 - Redesign Main View, Roadmap Application
The next phase of user interface changes was to redesign the main view of the
application.
A splash screen logo was introduced (shows for fours seconds, automatically disappears
when clicked on or a button is pressed). The red clock symbol of a scheduled request
was replaced by the calendar logo to the right of the “Fahrplan abfragen” button
(“request timetable” – in German) on the bottom of Figure 47.
Additionally, the new buttons on top were introduced: from right to left those are used
for “Favorites”, “Presets” and “History”.
The small “shuffle”-icon on the left side of this row indicates the button to switch from
station- to address-mode and back. This was applied in a later version, but this image
represents the final UI of the Roadmap application at present.
The color of the highlighted string changes (within the shuffle icon from green to blue,
currently green) to make it easier to realize which mode is currently active.
On the first run the application starts using the AutoCompleteView layout.

103
4.7.5. Current UI Design
Figure 48 - Redesign Trip Details 2
Figure 49 - Favorites, Roadmap Application
The final UI redesign process included the redesign shown in Figure 47 and Figure 45,
which is the latest design of the application’s main view and the results overview.
Additionally, the trip details have been reworked, which is shown in Figure 48 right
above (old version displayed in Figure 46).
The views of Presets, Favorites and History have been introduced with this update
(Figure 49 - 51).
To give an overview of the current stage of the Roadmap application, the following
pages contain multiple graphics of different views of the application.
Figure 52 and 54 contain a preview of the network plans overview. This view shows the
available network of routes graphics. Figure 52 shows the actual list of available
network plans, while Figure 54 shows a network plan in detail.
Figure 51 shows the Presets-view of the application. The small green dots on the left
side of the view indicate that the preset has been validated (a request was performed
successfully) while a red button indicates that this preset has not yet been validated.
Only validated presets can be requested.

104
Figure 50 - History, Roadmap Application
Figure 51 - Presets, Roadmap Application

105
Figure 52 - Map / Routes, Roadmap Application
Figure 53 - List of Support / Help Documents
Figure 54 - Displayed Network Plan, Graz
Figure 55 - Example Detailed Explanation, Usage
Instructions
106
Figure 53 shows the help / support menu. In this view, a detailed support document is
provided for every single view / part of the application. In order to easily see and
understand the purpose of the documents the corresponding icons are shown on the right
side of each row.
Figure 55 shows a part of the introduction to the Roadmap application. This view is
used to thank the user for using the Roadmap application and gives a basic introduction
to the Roadmap application’s main-view, all its icons, images and functions.

107
5. Results
To satisfy all the needs of users, close cooperation with users has been maintained since
the release of the app. This means eMail requests were processed immediately, requests,
improvement suggestions or problems were discussed with users and, in most of the
cases, implemented right away. Also, errors were fixed as fast as possible.
This direct contact with end-users is a special experience and has two different aspects.
On the one side it is possible to retrieve positive feedback directly and on the other side
you are directly confronted with user problems or complaints. Though it may not
always have been possible to answer user mails personally, user feedback was always
perceived in a positive way.
5.1. Existing Market
The Android Market, with its enormous growth, is very impressive. The growth is
currently about five times bigger than the iPhone app Store growth. Due to this fact, the
difference between the offered apps shrinks month by month. Within the last five
months (effective: September 2010) the published Android Applications grew by
60.000 to a total number of about 120.000 published applications (Butler et al., 2011)
(Strong Android Market Growth, 2010).
The distribution via the Android Market is not free, but the amount of 25€ per year is –
as mentioned earlier in this document - very appropriate and gives developers access to
a huge number of customers spread over the whole world (Google Accounts, 2010).
In comparison, the registration fee for the iPhone app Store is about four times bigger,
99€ per year. The difference is noticeable and increases the likelihood of developers
starting to develop Android applications (iOS Developer Program, 2010) (Goodman,
2010).
The Android App-Store (called “Market”) provides developers with a special web
interface, which allows the publishing of apps, refreshing descriptions, adding
screenshots, selecting languages for released applications or uploading marketing
graphics, all of which will be used if Google decides to promote your application.

108
Additionally, the developer receives an overview of how often the program has been
downloaded, how many installations are currently actively distributed and which rating
the application earned, including comments from the users.
This possibility is really useful because many users use the Android rating system to
submit problems, errors or wishes. This can exhaust a developer because he or she
should always be aware of the user’s comments. Users do this very often, so to be a
good developer it is necessary to always check the comments about the published
applications to verify whether any errors have occurred or whether wishes, suggestions
or complaints were submitted.
This procedure is necessary to ensure good customer support.
5.2. Distribution in the Android Market
As mentioned earlier the Android Market offers a really good distribution platform for
developers. With a huge amount of Android users (in the last year about 8 million
devices have been sold) it has never been so easy to implement ideas and make them
available to a target audience (Canalys Press Release, Worldwide Touchscreen
Smartphones, 2010).
Published apps are available to end-users within minutes. And those end users have the
possibility to download and use them immediately.
It is the same for updates or error fixes; these can be transmitted via the same way and
made available to the users within minutes.
For a short time users have the possibility to make their Apps auto-update-able. This has
the advantage that Apps can be automatically updated without user interaction, which
enhances the distribution process a lot (updates can be distributed much better and
faster).
With about 120.000 Apps the competition in the Android Market is growing. In
comparison to the iPhone App-Store, the Android Market offers developers more
possibilities since fewer applications are currently available.
The Roadmap application is exclusively published in the Android Market and there is
no implementation available nor planned for the iPhone App-Store.

109
5.3. Facts about the application
Currently 17.421 people (September 2011) are using the Roadmap application. As
appears in the following figure, the number of users is growing constantly:
Figure 56 – Roadmap Application, User Growth
The next illustration shows the fragmentation of the different Android platforms among
Roadmap application users.
Currently Android 2.2 is used by about half of all Roadmap app users.
Figure 57 – Roadmap Application, Platform Fragmentation
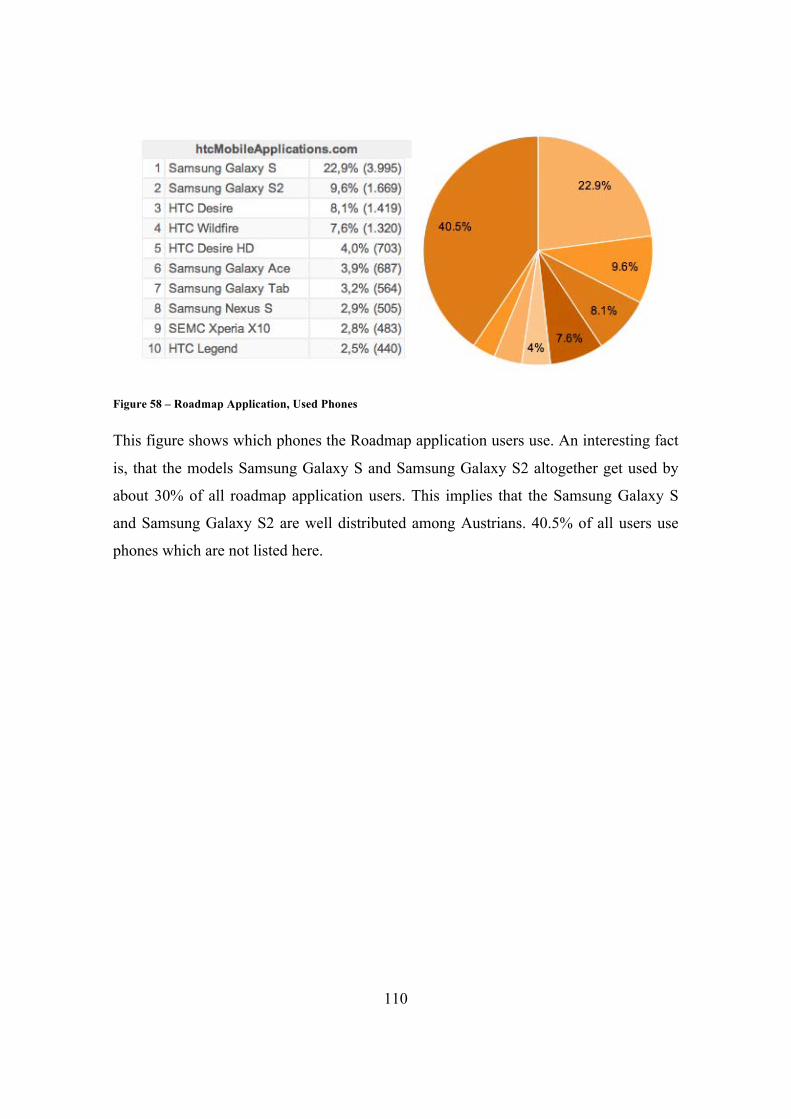
110
Figure 58 – Roadmap Application, Used Phones
This figure shows which phones the Roadmap application users use. An interesting fact
is, that the models Samsung Galaxy S and Samsung Galaxy S2 altogether get used by
about 30% of all roadmap application users. This implies that the Samsung Galaxy S
and Samsung Galaxy S2 are well distributed among Austrians. 40.5% of all users use
phones which are not listed here.

111
5.4. Feedback
As mentioned earlier the developer stays in direct contact with the customers. This
allows several possibilities to react to wishes, problems or complaints from the user’s
side.
A user has two possibilities to contact a developer. He can write a direct e-mail outside
of the App-Store or he can leave a comment with a rating within the App-Store. These
comments are primarily thought of as hints for other users. Instead many users use
comments to talk to the developers in some way. Some publish ideas, others problems,
and others try to submit complaints.
5.4.1. Feedback via Market
The rating in the Android Market allows the user to give a five-star rating and a
personal comment. Other users see these comments directly after opening the app
description in the Market. Often these comments are appropriate, but in some cases
users publish a premature comment.
Often comments are used the right way. The Roadmap application has an overall rating
of 4 out of 5 stars and has received within the last six months mostly very positive
comments.
A few negative comments originated from the beginning of the Roadmap application.
At that time the functionality was limited and the application was at a level of a
developer tool. Additionally, the user interface wasn’t really user friendly.
From time to time errors sneaked in with some updates and were published, but this
occurred only in some cases, in distributed areas of Austria.
As explained in the chapter “System Testing”, the testing of the application was not
always complete, which does not always allow us to guarantee an error-free application.
However, new versions have always been tested “as well as possible” before publishing.
Besides, user comments were always checked for improvements or errors and users
were notified through a change log of what was updated and which changes or
improvements were performed during an update.
This commitment became appreciated and lead to positive feedback many times.
112
5.4.2. Feedback via Mail
Some users took the effort to write an e-mail and inform me about problems this way.
In most of the cases the first error message or description was inaccurate and missed
many details, but in most cases users were happy to supply me with further and detailed
information about their problems or errors after they received an answer to their first
mail.
Greatest efforts have always been put into answering user request quickly and precisely.
Also if something was unclear, attempts were made to supply as exact answers as
possible. This again led to positive comments, which brought happiness back to me as
the developer, as well as to the user.
5.5. Permissions
5.5.1. Verbundlinie
Because the data of the timetables is the property of the Verbundlinie, an official
approval had to be requested.
The Roadmap application was presented at their headquarters with market analysis’,
future forecasts and customer advantages to the Verbundlinie, but they did not want to
buy the application at that time.
The Verbundlinie was convinced, however, to at least give official permission to use
their data for the use of my application.
5.5.2. Network of Routes
Several users brought the idea of an integration of graphics of network of routes to me.
To add the maps to the application the Verbundlinie was contacted the again.
After short negotiations and a first offer of about 70€ to obtain an official license, they
were convinced to allow me to use the maps without paying any fees.

113
This is the reason why graphics of networks of routes of the following transportation
types and areas are currently part of the Roadmap application:
• The Vienna tube map,
• The Vienna S-Bahn map,
• The Grazer lines,
• The train network of Styria,
• The network around Aichfeld,
• Bruck an der Mur,
• Kindberg,
• Leoben and
• Liezen
5.6. User Studies
To test the usability of the Roadmap application the System Usability Scale (SUS) test
was performed. The complete results are attended at the end of this document.
The System Usability Scale test is a very simple and short, 10 question based survey,
which asks the user about their general feelings about the application (complex,
cumbersome, easy to use). The SUS test can also be used to review systems, web pages
and nearly any other system (as well as functional systems).
5.6.1. System Usability Scale Test
John Brooke developed the System Usability Scale test in the year 1986 (Brooke, 1996).
The user questionnaire consists of 10 questions, where odd-numbered items worded
positively and even-numbered items worded negatively.
The questions are as follows:

114
1. I think that I would like to use this system frequently.
2. I found the system unnecessarily complex.
3. I thought the system was easy to use.
4. I think that I would need the support of a technical person to be able to use this
system.
5. I found the various functions in this system were well integrated.
6. I thought there was too much inconsistency in this system.
7. I would imagine that most people would learn to use this system very quickly.
8. I found the system very cumbersome to use.
9. I felt very confident using the system.
10. I needed to learn a lot of things before I could get going with this system.
The test was performed on 20 students at the campus of the Technical University of
Graz. An overview of the participants can be gained from the following graphic.
The average user age was about 25 years of age.
Figure 59 - SUS Participants - Age
The field of studies of the participants stretched from Informatics to Telematics, and
included Biomedical Engineering, Physics, Softwareengineering and Economics.

115
Figure 64 - SUS Participants - Field Of Studies
Figure 60 - SUS Participants - Gender
Figure 61 - SUS Participants – Experience
Smartphones
Figure 62 - SUS Participants – Experience Android
Figure 63 - SUS Participants – Experience iPhone

116
Figure 65 - SUS Study Overview

117
5.6.2. SUS Results
The results gained from the survey show that the Roadmap application has an above
average usability rating. Compared, an average score is 68. This has been abstracted
from over 500 studies (Measuring Usability, 2010).
The representative value for comparing it to other applications or usability studies is
80.75, which is definitely above average.
From the perspective of an observer most of the users felt very confident with the
system. Also positive credit was gained for this project and the efforts made. Some
users directly downloaded the application to their phone to start using it on a regular
basis.

118
6. Future Work
The reviewed papers in the background section have been an additional basis for some
ideas and additional features for the Roadmap application. This chapter reviews these
ideas and explains some concepts about how these ideas could be realized.
6.1. Timetables in XML Format
The implementation of XML and XSLT on the server side could be used to prepare
timetable information for a quicker transmission to mobile devices.
The advantages would be in multiple areas. The current information retrieval process is
based on parsing a HTML page for the desired information. This costs a lot of system
performance, uses a high calculation power and system memory. If the timetable
information were available in XML it would conserve for more resources and be faster.
Now a typical route request takes about two to five seconds. The integration of XML
can reduce a timetable request to about one to two seconds.
Another advantage would be that a homepage redesign of the Verbundlinie would have
no effect in requesting timetable information. Now the Verbundlinie has an agreement
with me that they are going to notify me if the homepage design changes (current
parsing uses the HTML / CSS tags to identify required information). But with the
introduction of an XML interface, the HTML or CSS structure wouldn’t have any effect
on the timetable retrieving process.
Additionally, it would also be much more structured and easier for other people to
understand the code. Now, the parsing part of the Sourcecode is built up as easy as
possible, but with cutting HTML code and searching for specific patterns it is not as
simple as it could be.
The maintenance procedure would also be much easier, because (as mentioned above)
changes in design or structure of the homepage wouldn’t have an influence on the
application. Also, new terms could easily be added to the existing scheme.
119
6.2. Traffic Jams – Interruption Notification
Another feature would be the integration of a service, which notifies users of delays or
interruptions. The information exists on the homepage of the Verbundlinie and also
within timetable requests, but due to the fact that they are hidden between timetable
information and do not occur everyday, it is very hard to test and / or find out which
tags or patterns fit best to identify disturbance messages within a route.
This feature hat not yet been implemented, but hopefully there’ll be a useful solution
soon.
6.3. Timetable-like Information
The Roadmap application currently allows users to request timetable information from
the Verbundlinie server. This can be achieved by entering departure and destination
location. The results are shown to the user in a list of possible routes. If the user selects
one, he or she receives a detailed view with information about the name of the vehicle,
its direction, the names of the stations of origin and arrival, and the departure and arrival
time. Additionally, information is also provided in regard to whether a connection will
or will not wait for arrival of the previously used vehicle.
It would be an interesting feature to get a list of departure times of a specific stop or
station. This benefits users who do not want to check a route but just want to know
when a specific vehicle leaves or arrives at a station. For this purpose, incorporating a
kind of table where departure times are listed would be the best approach.
The user should be able to choose a direction and a station and receive a list of
departure times.
This information is available within PDF documents stored on the Verbundlinie server.
The information could be parsed, extracted and stored within the application.
6.4. Real-time timetables
A very interesting feature would be real-time timetables and / or departure times. The
Verbundlinie currently does not support this feature, although it has been discussed in a
meeting. If the Verbundlinie’s system would support this feature, then the online

120
routing program would also include the real-time results, which, in turn, means that the
Roadmap application would also support this feature.
6.5. Real-time notifications
Another feature would be real-time notifications. This is a kind of extension to
“Interruption Notifications” mentioned above. This feature would recommend an
implementation of a tool on the Verbundlinie’s side of the system and an additional
service, which runs on the Android mobile phone.
An example: If the Verbundlinie is notified of an interruption or change or disturbance
in their system they’ll notify the Roadmap application users who had “subscribed” to a
specific route earlier (this could automatically happen without user interaction).
This could be used for longer trips, as a special feature for train trips, for instance.
If an interruption or problem occurs, the system knows the routes people are travelling
and could notify all users travelling a certain route.
This also prevents annoying messages for users, who are not traveling that specific
route, by allowing the messages to reach only the relevant group of users.
6.6. Bus-tracking Notifications
Another extension would be to send users a notification if a bus comes close to a
station. To be able to implement such a feature every transport vehicle needs to be
tracked and the locations have be to updated within short intervals (for real time
notifications).
The main intent is that a user will be able to subscribe a specific trip (for instance, using
the bus station in front of his home). A reminder on the mobile phone would be enough
to notify the user of an arriving bus.
If problems, interruptions, traffic jams which affect the punctuality aren’t important,
then an implementation of a service which reminds the user a pre-defined number of
minutes before the bus reaches the station, would be enough.

121
6.7. Automatically setting departure location
A GPS request to locate the user is a long procedure. A cold start of a device takes
about 20 – 30 seconds, while a warm start (the device already had a GPS lock within the
current area) takes at least 10 to 15 seconds. Also you need to have a clear view to the
sky and in most cases you have to be outside a building (Deblauwe, Ruppel et al.,
2008).
A better approach to accomplish an automatic identification of the departure location
would be through the mobile phone network. Alternatively, the last known location of a
device could also be used to be set as departure location. The location can be examined
either by triangulation within the mobile network or through the extraction from a
WLAN network.
6.8. POI Navigation
The Verbundlinie’s route calculation website does support the usage of the name of
stations / stops, addresses and points of interests.
Currently, stations / stops and addresses are implemented, but not yet the POI
navigation.
To extend the possibilities and usability of mobile public transport navigation this
implementation would be very useful, particularly for tourists.
6.9. Widgets
Another interesting part of the Android OS are Widgets. Widgets allow users to fulfill
certain tasks or actions without opening a settings page or an app. A widget can be
placed on the phone’s homescreens and often starts an interaction with the device. They
can also be used for displaying pictures, calendars or other types of information (show
the user’s current location).
Two different ideas came to me in regard to widgets.
6.9.1. Buying Tickets
A widget could be used for buying tickets. Currently the Roadmap application supports
buying tickets via SMS in some of the main cities of Austria and for train trips. This

122
implementation could also be used for a widget. For instance, the user can select the
widget, select the current location (i.e. Graz) and an SMS is sent to the corresponding
telephone number. Furthermore the user gets an SMS as answer and receives a valid
public transportation ticket with only two clicks.
6.9.2. Requesting Timetables (Presets)
Another idea for widgets would be the implementation of a timetable requesting widget.
The user is able to define “Presets“. Presets are used to enter the details of a timetable
request (location, station or address information) before a request takes place. On
demand, the route can be accessed or requested with only three clicks: by opening the
application, selecting Presets, and then clicking the desired Preset for launching the
timetable request.
An implementation of a widget could make two clicks redundant. For instance the daily
trip to work has been saved as a Preset and is added as a widget on the user’s
homescreen. On adding the widget to the homescreen, the widget asks the user, which
Preset should be used for the widget (the user can choose from a list of all user-created
Presets). After selecting the desired preset the widget is automatically added to the
homescreen.
6.10. EuroBus project list of functions
As explained in the background chapter, the EuroBus project (Saint-Laurent, Chauvet &
Khodja et al., 1993) was an early approach to identify common and generally accepted
functions of a passenger information system. This list of functions can also be used to
compare it to the features and functions of the Roadmap application.
For instance, functions like “inform on time”, “show whole network (map, routes)” or
“give timetables” have already been incorporated into the application. There are
however, additional points like “inform on fares” and “give on-board route
information”, which would be interesting to include. Additional useful information
about the destination as well as continuing connections beyond the destination are also
points that can be added to the Roadmap application in the future.
“Process interchange information” would also be a very good feature for when there’s a
stopover and you have to go from the bus station to a specific platform. It would be very

123
useful to know the exact number or name of the platform as well as the exact route to
take to get there.
Displaying information for people with disabilities, i.e. whether a route is accessible for
people with impairments, would also be of great advantage (for instance, whether a low
floor bus or tram is driving a specific route). This feature could be easily integrated if
the Verbundlinie would display such information on their homepage too.
6.11. Multi-Language Translations
If this application were to become Austria’s only and official public transport route-
request application, then its usage for tourists would be of interest.
For this purpose, the application must be translated into several languages. The Android
SDK provides a powerful feature to do so. A single file contains every text in the whole
program. This file (string.xml – an Android specific file) can be stored within a default
folder, this means that it is used by all languages, or you can create a language specific
folder for each language and provide a default language too, so that if a user language is
available, it will be used, otherwise the default language file will be used.

124
7. Business Case
The Roadmap application has lines of code totaling between 12.000 and 15.000. The
total numbers of hours spent in programming are about 2.400. Which can also be
described as 17 months of development by a regular workday of about 8 hours a day
and 140 hours a month.
If this were properly paid with at least 10 € per hour it would result in 24 000 €.
This chapter focuses on the general theory of business cases, which types of business
cases can be separated and what is the best way for mobile applications to gain the most
benefit from a project.
7.1. Purpose
As explained in (Office of Government Commerce, 2009) the purpose of a business
case is the creation of a necessary environment to assess if a given project is desirable,
rewarding and realizable (and stays that way) to create a basis, which allows thinking
about (further) investments.
A purpose of a business case can be seen as a simple cost-benefit analysis: if projects
are viable and can be seen as good enough for investing.
7.2. Definition
A business case contains the optimal collocation of funded knowledge for an evaluation
on whether a project is desirable, achievable (and stays that way, as mentioned in the
previous chapter “Purpose”) and is reasonable for (further) investments.
So, similar to the explained purpose, the definition also deals with the same problems.
7.3. Mobile Market
The market of mobile applications shows that there are constantly new sectors of
economies created. Currently mobile applications even include from collection and
collation of data for healthcare research (Blaya, Fraser, Holt, 2010) to support medical
healthcare education and clinical practice (Lindquist, Johansson, Petersson, Saveman,
Nilsson, 2008).

125
Basically mobile applications in healthcare are present everywhere.
Other sectors are social applications like the Facebook App (Facebook App, 2011),
Qype (Qype App, 2011) or also Skype (Skype App, 2011) which has an important role
in making international phone calls much cheaper than by any other method (over the
Internet it is in principle free. It just costs your basic Internet access charge).
There are tools for any kind of application like travel checklists, shopping lists or
bubble levels.
This new economy creates a totally new market for developers. It enables the sale of
applications directly to the end-user without the need of spending lots of money.
7.4. Business Model
As described in (Komulainen, Mainela et al., 2004) a business model can be explained
as a “construct which is useful in explaining an emerging empirical phenomenon such
as mobile advertising that is not fully explained by conceptual frameworks already in
existence”.
In other words, this represents the possibility to create new business cases within a new,
emerging economic sector.
So, as described above, mobile advertising can be seen as a totally new business model.
Also the distribution via App Stores is similar to this case. Additionally, it can be said
that, in most cases, business models are used to generate profit.
7.5. Mobile Advertising
First, let’s have a look at what advertising means in general.
“Advertising is a controlled form used by an identified sponsor to deliver messages
(text-based, image-based, etc.) to consumer, in an effort to influence and persuade them
to take some action (buy, try, talk about, etc.) in relation to the sponsor’s products
and/or services.” (Brenner, Unmehopa, 2008)
Mobile advertising, therefore, makes use of mobile devices. Instead printing or
presenting advertisements on large screens, mobile phones users (users of PDAs,
Smartphones, Handhelds or Tablet PCs) are used as customers. Advertisements are
presented within applications or on websites, which directly address desired end-users.

126
Mobile advertising is an important factor in today’s world of IT and makes use of both
the advertising and the software business. As mentioned in (Information Gatekeepers
Inc, 2007), mobile advertising presents a unique opportunity to directly interact with
customers.
Until now such a direct interface to customers has not been available. The best way to
present mobile advertising is by selling merchants rule-based access to millions of
subscribers.
This can be best explained through Google AdMob (Mobile Advertising, AdMob,
2010). Google provides developers with an API, which allows easy access for millions
of merchants who can select where and how advertising is conducted, as well as which
customers (age, country, gender) the advertising is meant for.
7.6. Business Models in Context of Mobile Advertising
Mobile advertising also has an important role in the perspective of business models.
(Kallio, 2004) declared in his work that there are multiple roles allocated in business
models: application provider, content provider, infrastructure provider, mobile network
operator, mobile service provider and end user.
In a practical example (using Google) those roles can be explained by:
• Application Provider (Developers)
• Content Provider (Google)
• Infrastructure Provider (Google)
• Mobile Network Provider (Individual, in Austria: Hutchinson, A1,
Orange, ...)
• Mobile Service Provider (Individual, in Austria: Hutchinson, A1,
Orange, ...)
• End-User (Customers)
Additionally, device manufacturers are also mentioned because they provide end-users
with their mobile phones, which allows this process to begin.
Mentioned in (Komulainen, Mainela, Sinisalo, Tähtinen, Ulkuniemi, 2004), four
different types of business models can be distinguished:
127
• MMS Advertising Service,
• WAP Push Advertising Service,
• MMS Advertising Software,
• WAP Push Advertising Software.
Those four scenarios will be explained in the following. As it can easily be seen, the
models differ in the type of technology which is used for delivering the mobile ads to
the mobile phones. The first type, MMS, does not charge the recipient of the
advertisement while the second technology, WAP, delivers an URL which, if opened by
the user, makes use of the GPRS connection of the device, which incurs further charges
on the mobile phones user’s account.
Each of the four scenarios makes use of the three elements of business models: the
service, the actors, and their roles
The first two approaches focus on general business (multiple companies interact with
each other), while the third and the fourth approach focus on the software industry (a
software company, called application provider, takes over multiple roles).
7.6.1. MMS Advertising Service
The MMS Advertising Service is a typical advertisement service. There is mobile
advertising service provider (MASP, in general, a company which has a large customer
base), the mobile ad providers (companies or people that are interested in making
advertisements for some product or activity) and the mobile phone users (as target
group, potential customers or consumers of those products).
The technology uses a network operator and infrastructure provider (which are possibly
the same).
A practical example would be: A company “A” creates (or assigns another company to
create) advertisements. The next step is to bring those advertisements to the consumers.
Now the mobile advertising service providers (MASP) are needed, which stay in direct
contact with possible consumers. Company “A” assigns the MASP to offer a specific
group of users pre-defined ads. Company “A” pays a fee at the MASP for offering the
advertisement to a predefined group (or number) of users.

128
Now the MASP searches their consumer base for appropriate ad-receivers, which will
then receive the desire advertisements form Company “A”.
The transmission costs are typically included in the fee paid by Company “A” to the
MASP. Afterwards the MASP carries the costs. For transmitting the MMS
advertisements, the network provider and the infrastructure provider are used.
Important facts:
• No costs for the ad-receivers
• MASP used as distributer for pre-defined ads
7.6.2. WAP Push Advertising Service
The primary difference in the MMS Advertising Service is the technology used. Instead
of MMS, now WAP technology is used. This influences the actors’ roles and thus also
the flow of money.
The MASP becomes the central actor of this business model because it owns the
complete mobile advertising software. Like in scenario one (MMS Advertising
Service), an advertiser pays an advertising agency to design and implement a mobile ad
(or does it on his own). Furthermore, the advertiser pays the MASP for the mobile
advertising services. These services include the transmission to desired consumers, the
generation of mobile ads from digital data, as well as the use of the consumer database.
The advertiser pays either a fixed price per month or a determined price per mobile-ad-
message sent.
The difference in technology also affects the type of message sent. While in MMS
messages the concrete advertisement is included, WAP messages include a so-called
service indicator (SI) message. The receiver can decide whether he or she opens the
advertisement or not. As soon as the recipient decides to browse the URL contained in
the messages, the network (for instance GPRS) connection is charged.
The MASP pays the network provider for sending the SI messages to the consumers.
• Costs for the ad-receivers (GPRS, mobile internet connection)
• MASP used as distributer for pre-defined ads

129
7.6.3. MMS Advertising Software
This scenario is based on the software industry approach, and thus software is a core
element in this scenario.
For example, a software firm acts as an intermediary between the other actors.
Again, a practical example: An application provider (software firm) hosts the mobile
advertising system. Hosting means developing the software, maintaining it and also
sending the mobile ads to the consumers. The necessary information about the
consumers (target group, age, detailed information, etc.) and their agreement for
receiving ads is updated by the consumers and the application provider himself.
In this case the role of the mobile advertisement service provider (MASP) is also
performed by the application provider, which means a potential advertiser pays the
application provider for distributing desired advertisements. Also, the mobile
advertisements are sent to the consumer by the application provider (same as in scenario
one, MMS Advertising Service).
• No costs for the ad-receivers
• Software company takes over the role of the MASP (distributer for mobile ads)
7.6.4. WAP Push Advertising Software
Similar to MMS Advertising Software, this example regards the perspective of a
software company (software industry perspective). The main difference in the MMS
Advertising Software scenario above is the type of transmission of the mobile
advertisements.
These are again transmitted via WAP Push technology, which means a service indicator
(SI) message is used to inform the consumer of a possible advertisement. The consumer
is able to choose independently whether he or she sees the advertisement or not. If the
consumer decides to browse the URL included in the message, the GPRS connection of
the mobile device is used and the consumer is charged for (possible) accruing costs.
Again, the application provider takes over the role of the MASP, is paid by an advertiser
to distribute advertisements to consumers and, again, is solely responsible for paying
the network- and infrastructure provider (Similar to scenario two, WAP Push
Advertising Service).

130
• Costs for the ad-receivers
• Software company takes over the role of the MASP (distributer for mobile ads)
Comparing these four models, it can be said that the number of actors within the first
two and the last two scenarios decreases (one company takes over several roles), which
also allows the costs to shrink. This, in turn, has a positive effect for advertisers. They
achieve their goal using less money.
(Komulainen, Mainela, Sinisalo, Tähtinen, Ulkuniemi, 2004) also asserts that this
observation can be applied to mobile advertising networks in general, which will allow
this business model to be profitable in the long run.
7.6.1. Mobile Marketing Strategies – Pull or Push?
In (Kizilok, 2009) basically two different types of mobile marketing strategies are
explained. Some campaigns may also make use of both strategies.
Pull campaigns are defined by creating a need which may not necessarily be a current
consumer need at that moment in time. For instance, while browsing the web, the
consumer sees an interesting banner and clicks on it.
In contrast, push campaigns make use of already existing lists of possible consumers
and contact these people directly.
This leads to the conclusion that in pull campaigns consumers decide on their own
whether they are interested in a specific advertisement, while in push campaigns they do
not have a choice.
7.7. Mobile Application Distribution Platforms
The three markets with the biggest impact are currently (Sharman, Raghav Rao, Raghu,
2009):
• Apple App Store
• Google Android Market
• Nokia OVI

131
These application stores can be used by developers for distributing apps directly to their
customers. Providers of these stores demand about 30% of the profit for each
application sold, which allows them to provide the necessary infrastructure.
These portals can be seen as two-sided structures which need both parties. On the one
hand developers, which contribute their ideas and developed applications, and on the
other side consumers (Smartphones users), which use and, more importantly, buy
applications.
Prior to the introduction of distribution platforms for mobile applications, developers
had to distribute their applications on their own. For instance, on web pages, servers, or
through selling them in selected stores (which required lots of investments).
Due to the change in this sector, developers are now able to distribute directly to the
end-users.
132
7.8. Business Models in Context of Mobile Application Distribution
In this chapter, different business models that can be applied for mobile application
distribution are evaluated. Some background information has already been discussed in
a previous chapter.
IPhone users are more likely to buy applications, so for the aspect of creating profit, it
can be recommended to publish applications in the iPhone App Store in order to
generate the most profit (Smartphone Users Gender, 2010).
The distribution of applications via so-called “App Stores” is definitely a new business
model when compared to previous business models such as those in the area of ringtone
or game downloads (Smyth, Institution of Electrical Engineers, 2004), Internet auctions
(Information Resources Management Association, 2000) or direct business models like
described in (Gottschalk, 2007):
• Direct to Customer
• Full-Service Provider
• Whole of Enterprise
• Virtual Community
• Value Net Integrator
• Content Provider
These business models describe different approaches to different problems.
Another article discusses different methods of generating revenue with social networks
and the use of networking.
In (Enders, Hungenberg et al., 2008) three types of models are discussed which can be
used to generate revenue in social networks:
• Advertisement Models
• Subscription Models
• Transaction Models
These models can also be applied to mobile applications. In this context it is important
to mention the so called “Long Tail”-theory. “The tail” refers to the long time aspect of
a strategy or a business model. Two strategies can be separated:

133
• Lengthen the tail or
• Fatten the tail
While “Lengthening the tail” focusses on binding users to the website and encouraging
them to invite new people, “Fattening the tail” instead focusses on generating user
content which increases the activity on the website and binds users to the website or
application.
If a user visits a new website, community page or application only once, no revenue can
be generated. Only by revisiting, communicating the URL, sharing information about
the website or application revenue can be generated.
Speaking about mobile applications, specifically the Roadmap application, transaction
models can not be applied. An advertisement model is used at the moment, but the
number of users is currently to small to generate noteworthy revenue. The pro version
of the Roadmap application could possibly implement some kind of some subscription
model, for instance traffic jam information or information about disturbances, but these
features have not yet been implemented.
With a growing user base, both, advertisement and subscription models could become
more profitable. Also a social network which discusses roadwork or other traffic
influences could generate a larger user base and more user interaction.
When the development of the Roadmap application was complete, attempts were made
to sell the application to different companies related to public transport within Austria.
The following chapter lists and discusses these trials.

134
7.9. Practical Examples,
In the course of development of this application, it has been tried to sell the developed
application to some companies that could possibly benefit from this product.
The following chapter focuses on practical examples of how this application could have
been sold.
7.9.1. Selling to Verbundlinie
The Verbundlinie is an Austrian organization that combines different sources of
timetable and routing information into a single service, which is provided on the
Internet (Verkehrsverbund Steiermark Online, 2010), and allows people to request
timetable information over all areas of Austria.
The service started in 2003 with Styria, and over the years all parts of Austria have been
integrated; parts of Lichtenstein and Slovenia are also now available.
Additionally, the website provides information about disturbances, redirections and
changes in timetables.
Unfortunately the Verbundlinie didn’t agree to buy this application.
7.9.2. Winning the A1-Innovations Contest
The A1-Innovations Contest is a competition sponsored by the largest service provider
for mobile phones and landlines within Austria.
The Roadmap application took part at this contest, but didn’t win.
(The prize money for the winner was 50 000 €.)
7.9.3. Selling to GVB
Another possibility was the GVB (Grazer Verkehrsbetriebe) (GVB, 2011), a company
which deals with public transportation in Graz and its surrounding areas and owns a
fleet of trams and busses, as well as other types of infrastructure.
The proposed price for selling the Roadmap application inclusive adaption and
maintenance for one year was 12 000€ excluding taxes.
This price was made up by calculating the time spent on development and by
considering the amount of already existing users and the good reputation of the
application in the Android Market.

135
Unfortunately the application wasn’t sold either.
7.9.4. Advertisement
Another possibility of making money is advertisement. Advertisement can be very
useful to customers, but also annoying. However, in order to create some benefit and
after putting so much effort in this application, it has been decided to integrate an
advertisement API.
Additionally, the Adfree (also pro) version of the Roadmap application was introduced
(which is ad-free and overrides some limitations of functionalities) after the integration
of advertisements to the free version.
At first, a single ad provider (AdMob) was used, but after some time and low fill-rates
(defined by how many ads are actually shown) it was decided to integrate AdWhirl and
add multiple ad providers to the application with the AdWhirl API.
Currently the Roadmap application uses two ad providers, the AdMob service and the
Millennial ad network combined via the AdWhirl interface (AdWhirl, 2010) (Mobile
Advertising, AdMob, 2010) (Mobile Advertising, Millennial Media, 2010).
The advantage of this is that if one ad network is not able to supply the application with
advertisements, then the other network will be used for ad providing.
It is possible to set the allocation ratio in the AdWhirl interface. For instance, it is
possible change the AdWhirl configuration so that you could use 60% of one network
and 40% of another if you so desired.
Another interesting point is that the AdWhirl web-interface allows you to create and
enable in-house advertisements. These are advertisements which have been created by
the developer himself in order to advertise another applications or items (maybe a pro
version of a program). The allocation ratio for this type of advertisement can be set as
well.
7.9.5. Sponsoring
The latest and newest concept was sponsoring. It is planned to contact more or less
well-known companies (from McDonalds, to smaller public transport companies) and
ask for sponsoring. The idea is to show in-house advertisements that are either created
by the sponsor or me and are placed within the Roadmap application.

136
Another possibility would be to add their names and logos in the about menu, or create
a larger splash screen during the launch procedure to show their logo or graphic there.
Companies which are planned to be contacted:
• MVG (Mürztaler Verkehrsbetriebe)
• Post AG
• McDonalds
• Several Banks
• Spar
• Stadt Graz
• Tourismusamt Stadt Graz
• Media Markt and Saturn
Other, smaller companies within the area of Graz will also be contacted.
137
8. Conclusion
Developing the Roadmap application was definitely a “rare”-in-a-lifetime chance. It
was an idea that sprang up just at the right point in time. This project expanded my
capabilities in software developing as well as my economic prowess. During
development, many different situations occurred; redesign had to be performed, large
sections of code had to be adapted. Due to the size of this project (12 000 -15 000 lines
of code), I learned that the knowledge gained at the Technical University of Graz is very
useful in the real-life development process.
For example, developing in small packages which are easily adaptable and extendable
was necessary in a project of this size. Also, using a coding standard and commenting
methods, including in-line comments for better code readability, or using Use-Cases in
the development process, proved to be very helpful.
In regard to the economic aspect of the project, if given a second chance in the same
situation, I would act differently. I would first search for a business partner and
afterwards start the development process. My friend Markus asked me once: “Why
should anyone pay for an application that is already developed?” Correct. There is no
need to. So the reverse approach would have had a larger impact.
But while concentrating on the development of the roadmap application, I have
definitely missed out on the realization of other (maybe more profitable) projects.
In comparison to other internationally successful projects, the Roadmap application can
been seen as competitive.
I think it’s really a pity that no prominent figures in Austria ever reacted to this topic.
No public entity ever expressed any care at all. An example: I accidentally contacted the
German Ministry of Public Transport. They congratulated me, wished me all the best
for my future work, and also pointed out that I had contacted the wrong ministry,
providing a direct link to the appropriate Austrian authority, I never received an answer
from the Austrian Ministry. Unfortunately, this makes a young student who is about to
enter the world of business and real life doubt the whole political situation in Austria.

138
In addition, the relatively high ranking during the SUS test shows that the Roadmap
application has been developed to cater in the best way possible to user needs and
interests.
The constitution of market shares on the mobile market is changing. Different and new
companies entered the market as well in sectors of device construction as in mobile
phone operating systems. The next years will show which changes and which operating
systems are able to come out on top.
In my opinion the Android system will definitely become the market leader, and the
iPhone will strengthen its position in the premium segment.
139
9. List of Figures
Figure 1 - Timeline Android Development (Hashimi, Komatineni, MacLean, 2010) ..... 7
Figure 2 - Market shares Smartphone OSs Table (Canalys Press Release, Smartphone
Analysis, 2010) ................................................................................................................. 9
Figure 3 - Market shares Smartphone OSs Graphic (Canalys Press Release, Smartphone
Analysis, 2010) ............................................................................................................... 10
Figure 4 - iPhone Users' Age .......................................................................................... 12
Figure 5 - Android Users’ Age ....................................................................................... 13
Figure 6 - iPhone OS ...................................................................................................... 18
Figure 7 - Android UI ..................................................................................................... 20
Figure 8 - Windows Phone 7 UI ..................................................................................... 21
Figure 9 - Windows Phone Hub ..................................................................................... 22
Figure 10 - Central Server Architecture (CSA) ............................................................. 31
Figure 11 - The Cassiope List of Functions for Passenger Information (Saint-Laurent,
Chauvet & Khodja et al., 1993) ...................................................................................... 55
Figure 12 - Course of an Android Activity ..................................................................... 60
Figure 13 - Reusability of Views in Android (Android Tales, 2010) ............................. 62
Figure 14 - Symbols for Public Transport ...................................................................... 67
Figure 15 - Use Case Diagram, Roadmap Application .................................................. 74
Figure 16 - Scheme of the Package: htcMobileApplications.com ................................ 79
Figure 17 - Scheme of the Package: htcMobileApplications.com - Part 2 ..................... 80
Figure 18 - (left) Scheme of the Package: htcMobileApplicatioons.com.help .............. 81

140
Figure 19 - (right) Scheme of the Package: htcMobileApplicatioons.com.maps ........... 81
Figure 20 - (left) Scheme of the Package:
htcMobileApplications.com.removeItemsCheckboxList ............................................... 81
Figure 21 - (right) Scheme of the Package:
htcMobileApplications.com.TabHistoryAndFavorites .................................................. 81
Figure 22 - Scheme of the Package: htcMobileApplications.com.TabPresets ............... 81
Figure 23 - Component Diagram, Roadmap Application ............................................... 82
Figure 24 - Collaboration Diagram, Roadmap Application ........................................... 83
Figure 25 - Class Diagram - Main .................................................................................. 86
Figure 26 - Class Diagram - ScheduledRequest ............................................................. 87
Figure 27 - Class Diagram - RequestHandler ................................................................. 87
Figure 28 - Class Diagram – ResultList ......................................................................... 88
Figure 29 - Class Diagram – ResultListDetailed ............................................................ 88
Figure 30 - Class Diagram – BuyTrainTicket ................................................................ 89
Figure 31 - Class Diagram – MyLocationListener ......................................................... 89
Figure 32 - Class Diagram – WayInfo ............................................................................ 90
Figure 33 - Class Diagram – StopOverInfo .................................................................... 91
Figure 34 - Class Diagram - Utils Part 1 / 2 ................................................................... 92
Figure 35 - Class Diagram - Utils Part 2 / 2 ................................................................... 93
Figure 36 - Main Screen, Early Version - Roadmap Application 1 ............................... 95
Figure 37 - Main Screen, Early Version - Roadmap Application 2 ............................... 95
Figure 38 - Add Entries View, Roadmap Application ................................................... 95

141
Figure 39 - Result View, Early Version - Roadmap Application ................................... 95
Figure 40 - Detailed Result View, Early Version -Roadmap Application 5 .................. 96
Figure 41 - Main Screen, AutoCompleteTextView, Roadmap Application .................. 96
Figure 42 - Address-Mode Setting – Early in the Roadmap Application ...................... 97
Figure 43 - Scheduled Trip View, Roadmap Application .............................................. 98
Figure 44 - Detailed Scheduled Trip, Roadmap Application (right) .............................. 99
Figure 45 - Redesign of the Results .............................................................................. 100
Figure 46 - Redesign of the Trip Details ...................................................................... 101
Figure 47 - Redesign Main View, Roadmap Application ............................................ 102
Figure 48 - Redesign Trip Details 2 ............................................................................. 103
Figure 49 - Favorites, Roadmap Application ............................................................... 103
Figure 50 - History, Roadmap Application .................................................................. 104
Figure 51 - Presets, Roadmap Application ................................................................... 104
Figure 52 - Map / Routes, Roadmap Application ......................................................... 105
Figure 53 - List of Support / Help Documents ............................................................. 105
Figure 54 - Displayed Network Plan, Graz .................................................................. 105
Figure 55 - Example Detailed Explanation, Usage Instructions .................................. 105
Figure 56 – Roadmap Application, User Growth ......................................................... 109
Figure 57 – Roadmap Application, Platform Fragmentation ....................................... 109
Figure 58 – Roadmap Application, Used Phones ......................................................... 110
Figure 59 - SUS Participants - Age .............................................................................. 114

142
Figure 60 - SUS Participants - Gender ......................................................................... 115
Figure 61 - SUS Participants – Experience Smartphones ............................................ 115
Figure 62 - SUS Participants – Experience Android .................................................... 115
Figure 63 - SUS Participants – Experience iPhone ...................................................... 115
Figure 64 - SUS Participants - Field Of Studies ........................................................... 115
Figure 65 - SUS Study Overview ................................................................................. 116
143
10. List of Tables
Table 1 - Difference Market Shares 2010 - 2014 IDC ................................................... 11
Table 2 - iPhone Users' Age ........................................................................................... 11
Table 3 - Android Users' Age ......................................................................................... 13
Table 4 - Android Minimum System Requirements (Minimum Hardware Requirements
Android, Windows Phone 7, 2010) ................................................................................ 16
Table 5 - Windows Phone 7 Minimum System Requirements (Minimum Hardware
Requirements Android, Windows Phone 7, 2010) ......................................................... 17
Table 6 - Market Entering Fees - Different Oss ............................................................. 26
Table 7 - Top Five Obstacles of Blind / Visually Impaired People and Wheelchair Users
........................................................................................................................................ 53
Table 8 - Parameters used for the timetable GET request .............................................. 64
Table 9 - Parameter used for the extended timetable request ......................................... 65
Table 10 - Used Android Platforms (Roadmap Application) ......................................... 73

144
11. References
Alan R., Charles H., Karen S. (2003) Understanding urban ecosystems: a new frontier for science and education. Heidelberg, Springer.
Alastair, S. (2009) BlackBerry planet: the story of Research in Motion and the little device that took the world by storm. Hoboken, John Wiley and Sons.
Aleksy, M., Butter, T. (2009) Privacy-Aware Routing Approach for Mobile Applications. In: Advanced Information Networking and Applications, AINA 2009, International Conference on Advanced Information Networking and Applications. Bradford, 632-637.
AUUG (2002) AUUG 2002 Conference Proceedings - Measure, Monitor, Control. AUUG Inc, 7.
Babin, S. (2007) Developing software for Symbian OS: a beginner's guide to creating Symbian OS v9 smartphone applications in C++. Hoboken, John Wiley and Sons.
Blake, W.-T., Kießling, W.& Unbehend, C. (2002) A Situation-aware Mobile Traffic Information System. In: System Sciences, 2003. Proceedings of the 36th Annual Hawaii International Conference on System Science. Hawaii.
Blaya J. A., Fraser H.S.F., Holt B. (2010) E-Health Technologies Show Promise In Developing Countries. In: Health Affairs, 29(2). 244-251
Brenner M., Unmehopa M. (2008) The open mobile alliance: delivering service enablers for next-generation applications. Hoboken, John Wiley and Sons, 421.
Brooke, J. (1996) SUS: A “quick and dirty” usability scale. In: Jordan, P. W., Thomas, B., Weerdmeester, B. A., McClelland (eds.) Usability Evaluation in Industry. United Kingdom, Taylor & Francis, 189-194.
Butler, M. (2011) Android: Changing the Mobile Landscape. In: Pervasive Computing, IEEE. IEEE Computer Society, 4-7.
Caulfield, B., O’Mahony, M. (2007) An Examination of the Public Transport Information Requirements of Users. In: Intelligent Transportation Systems, 2005. Proceedings. IEEE 2005, Dublin, 21-30.
Cheverst, K., Davies, N., Mitchell, K., Friday, A., Efstratiou, C. (2000) Developing a context-aware electronic tourist guide: Some issues and experiences. Lancaster, Distributed Multimedia Research Group.
Conti, J.P. (2008) The androids are coming [Comms]. In: Engineering & Technology, Institution of Engineering and Technology, Stevenage, 72-75.

145
Dalrymple, M., Knaster, S., (2009) Learn Objective-C on the Mac. New York, Apress.
Damaschke, G. (2009) IPhone 3G S: Telefon. Musik. Video. Internet. GPS. München, Markt und Technik
Deblauwe, N., Ruppel, P., (2008) Combining GPS and GSM Cell-ID positioning for Proactive Location-based Services. In: Mobile and Ubiquitous Systems: Networking & Services, 2007. MobiQuitous 2007. Fourth Annual International Conference on Mobile and Ubiquitous Systems: Computing, Networking and Services. Belgium, Germany, 1-7.
Dijkstra, E.W. (1959) A note on two problems in connexion with graphs. In: Numerische Mathematik 1. Heidelberg, Springer, 269–271.
Dixit, S., Prasad, R. (2003) Wireless IP and building the mobile Internet. London, Artech House.
Drane, C., Macnaughtan, M., Scott, C. (1998) Positioning GSM Telephones. In: IEEE Communications Magazine, Portland, IEEE Communications Society, 46–54.
Enders, A., Hungenberg, H., Denker, H., Mauch S. (2008) The long tail of social networking. Revenue models of social networking sites. In: European Management Journal, 2008, Volume: 26, Issue: 3, Munich, Elsevier, 199-211.
Frischalowski, D., (2010) Visual C# 2010: Einstieg für Anspruchsvolle. München, Pearson Education.
Gavalas, D., Economou, D. (2011) Development Platforms for Mobile Applications: Status and Trends. In: IEEE Software, Ottawa, IEEE Computer Society, 77-86.
Goodman, D. (2010) Learning the IOS 4 SDK for JavaScript Programmers: Create Native Apps with Objective-C and Xcode. Sebastopol, O'Reilly Media, Inc.
Gottschalk P. (2007) Business dynamics in information technology. Idea Group Inc (IGI), Calgary, USA, 67-77.
Gustafsson, F., Gunnarsson, F. (2005) Mobile positioning using wireless networks: possibilities and fundamental limitations based on available wireless network measurements. In: IEEE Signal Processing Magazine. Redmond, IEEE Signal Processing Society, 41-53.
Hashimi, S., Komatineni, S., MacLean, D., (2010) Pro Android 2. New York, Apress.
Hiinnikainen, M., Laitinen, A., Hiimalainen, T., Kaisto, I., Leskinen, K. (2001) Architecture of a Passenger Information System for Public Transport Services. In: Vehicular Technology Conference, 2001. VTC 2001 Fall. IEEE VTS 54th. Atlantic City, 698-702.

146
Holzinger A. (2010) Process Guide for Students for Interdisciplinary Work in Computer Science/Informatics. BoD – Books on Demand, Norderstedt, Germany.
Holzinger A. (2005) Usability engineering methods for software developers. In: Communications of the ACM - Interaction design and children, Volume 48 Issue 1. ACM New York, New York, USA.
Holzinger A. (2004) Rapid Prototyping for a Virtual Medical Campus Interface. In: IEEE Software, Volume 21, Issue 1. IEEE Computer Society Press Los Alamitos, CA, USA.
HWM (2002) Singapore Hardware MAG December. Singapore, SPH Magazines Pte Ltd.
HWM (2007) Singapore Hardware MAG September. Singapore, SPH Magazines Pte Ltd.
Information Gatekeepers Inc (2007) The mobile internet. Information Gatekeepers Inc, Boston, United States, 12.
Information Resources Management Association (2000) International Conference, Mehdi Khosrowpour Challenges of information technology management in the 21st century. In: 2000 Information Resources Management Association International Conference. Idea Group Inc (IGI), Calgary, USA, 561.
Jenkins, G (1990) Oil Economists' Handbook: Statistics. London, UK, Taylor & Francis.
Kallio, P. (2004) Emergence of wireless services. Business actors and their roles in networked component-based development. VTT Publications, University of Oulu, Finland, 534.
Kim, N., Lee, H.S., Oh, K.J., Choi, J.Y. (2009) Context-aware mobile service for routing the fastest subway path. Expert Systems with Applications, 36, 2, 3319-3326
Kizilok, T. (2009) Konsumentenverhalten gegenüber Mobile-Marketing: Akzeptanz und Reaktanz. Diplomica Verlag, Hamburg, Germany, 20.
Komulainen H., Mainela T., Sinisalo J., Tähtinen J., Ulkuniemi P. (2004) Business Models in the Emerging Context of Mobile Advertising. University of Oulu, Finland.
Kwon, O., Shin, J.M., Kim, S.W. (2006) Context-aware multi-agent approach to pervasive negotiation support systems. Expert System with Applications, 31, 2, 275-285

147
Liikka, J., Laht, J., Alahuhta, P., Rosenberg, M. (2008) KAMO - Mobile guide for the city traveler. In: Intelligent Environments, 2008 IET 4th International Conference. Oulu.
Lindquist A.M, Johansson P.E, Petersson G.I, Saveman B.I, Nilsson G.C. (2008) The use of the Personal Digital Assistant (PDA) among personnel and students in health care: a review. E-Health Institute, Kalmar, Sweden.
Linzmayer, O., W. (2004) Apple confidential 2.0: the definitive history of the world's most colorful company. San Francisco, No Starch Press.
Mandato, D., Kovacs, E., Hohl, F., Alikhani, H.A. (2002) CAMP: A context-aware mobile portal. In: Service Portability and Virtual Customer Environments, 2000 IEEE. Stuttgart, 52-61.
Meersman, R., Tari, Z. (2002) On the move to meaningful Internet systems 2002: CoopIS, DOA, and ODBASE: confederated international conferences, CoopIS, DOA, and ODBASE 2002: proceedings. London, Springer.
Miller, F. P., Vandome, A. F., McBrewster J. (2010) IOS (Apple). Mauritius, VDM Publishing House Ltd.
Norman, D.A., (1999) The invisible computer: why good products can fail, the personal computer is so complex, and information appliances are the solution. Cambridge, MIT Press.
O'Guinn, T., Allen C., Semenik, R. C. (2008) Advertising and Integrated Brand Promotion. Florence, USA, Cengage Learning, 262-263.
Office of Government Commerce (2009) Erfolgreiche Projekte managen mit PRINCE2. United Kingdom, The Stationery Office, 23.
Plunkett, J. W. (2005) Plunkett's Renewable, Alternative and Hydrogen Energy Industry Almanac. Houston, USA, Plunkett Research, Ltd.
Prenzel I. (2010) Applicability of Mobile Marketing in the Marketing Mix of Trade Fair Organizers. Munich, Germany, GRIN Verlag, 15.
Pressl, B., Mader, C., Wieser, M. (2010) User-Specific Web-Based Route Planning. In: ICCHP'10 Proceedings of the 12th international conference on Computers helping people with special needs: Part I. Berlin, Heidelberg, Springer, 280-287.
Qian H., Zheng C. (2009) A Embedded Software Testing Process Model. In: Computational Intelligence and Software Engineering, 2009, International Conference on Computational Intelligence and Software Engineering. IEEE eXpress Conference Publishing, Wuhan, China.

148
Randolph, N., Fairbairn, C., (2010) Professional Windows Phone 7 Application Development: Building Windows Phone Applications and Games Using Silverlight and XNA. Hoboken, John Wiley and Sons.
Reddy, P.K. (2005) e-BusGuide An IT-based Approach to Improve the Profitability of Bus Transportation Systems in India. In: IETE Technical Review, Vol. 22, No. 5, 351-355.
Rhodes, N., McKeehan, J. (2002) Palm OS programming: the developer's guide. Sebastopol, O'Reilly Media, Inc.
Sandler C. (2010) Brilliant BlackBerry Apps For Dummies. Hoboken, John Wiley and Sons.
Saint-Laurent, B., Chauvet, C.& Khodja, F. (1993) Advanced Public Transport Passenger Information: Findings of the Eurobus Project. In: Paiviafnen J. & Reeki D., H., M. (Eds) Vehicle Navigation and Information Systems Conference, 1993, Proceedings of the IEEE-IEE
Schmidt, A., Binnig, C. (2002) Experience Gained in the Development of a Route Planner for Mobile End Devices. In: Proceedings Communications, Internet, and Information Technology, 42-47.
Sharman R., Raghav Rao H., Raghu T. S. (2009) Exploring the Grand Challenges for Next Generation E-business: 8th Workshop on E-business, Web. In: Band 52 von Lecture Notes in Business Information Processing Series, Revised Selected Papers. Heidelberg, Springer, 189.
Shashank, T., Elrom, E., (2009) AdvancED Flex 4. New York, Apress.
Smyth P. (2004) Mobile and wireless communications: key technologies and future applications. IET, Edison, USA.
Band 9 von BT communications technology series. Peter Smyth, Los Angeles, United States, 318.
Smyth, N. (2011) iPhone iOS 4 Development Essentials. eBookFrenzy.
Su, J.G., Winters, M., Nunes, M., Brauer, M. (2010) Designing a route planner to facilitate and promote cycling in Metro Vancouver Canada. In: Transportation Research Part A: Policy and Practice, 495-505.
Sun, G., Chen, J., Liu, W.G. (2005) Signal Processing Techniques in Network-aided Positioning. In: IEEE Signal Processing Magazine. Redmond, IEEE Signal Processing Society, 12–23.
Trautschold, M., Mazo, G. (2010) IPhone 4 Made Simple; New York, Apress.
Westin, A. (1967) Privacy and Freedom. New York, New York : Atheneum.

149
AdWhirl (2010) viewed December 22 2010, http://www.adwhirl.com/
Android Tales (2010) viewed December 222010, http://android.amberfog.com/?p=296
App Hub Membership (2010) viewed December 22 2010, http://create.msdn.com/en-us/home/membership
Canalys Press Release, Worldwide Touchscreen Smartphones (2010) viewed at December 22 2010, http://www.canalys.com/pr/2010/r2010021.html
Canalys Smartphone Analysis (2010) viewed at March 5 2010, http://www.canalys.com/pr/2011/r2011013.html
CNET.com (2010) viewed at March 5 2010, http://www.cnet.com/windows-phone-7/
Displeased Apple User (2011) viewed at May 10 2011, http://trendsupdates.com/apple-inc-gets-sued-for-ios-4-update-on-apple-iphone-3g-7-iphone-3gs/
Eclipse (2011) viewed at August 23 2011, http://www.eclipse.org/
Facebook App (2011) viewed at 10 05 2011, http://www.facebook.com/iphone
Fahrplan Österreich, Standard (2011) viewed at 17 07 2011, http://derstandard.at/1310511228085/Mobil-Schwarzfahren-20-Mit-Apps-und-Internet-Kontrollen-entgehen
Google Accounts (2010) viewed at December 22 2010, http://market.android.com/publish/
GVB (2011) viewed at 14 05 2011, http://gvb.at/
HaCon, Fahrplanauskunft HAFAS (2010) viewed December 14 2010, http://www.hacon.de/hafas/
Heise Developer (2010) viewed December 22 2010, http://www.heise.de/developer/artikel/Programmierwerkzeuge-fuer-Windows-Phone-7-1094929.html
HopStop, Your Way To Go (2010) viewed 22 December 2010, www.HopStop.com
IDC Press Release, Android passes iPhone (2010) viewed December 22 2010, http://www.idc.com/about/viewpressrelease.jsp?containerId=prUS22176610§ionId=null&elementId=null&pageType=SYNOPSIS
IDC Press Release, Market Share Changes (2010) viewed at December 22 2010, http://www.idc.com/about/viewpressrelease.jsp?containerId=prUS22486010§ionId=null&elementId=null&pageType=SYNOPSIS
150
iOS Developer Program (2010) viewed at December 22 2010, http://developer.apple.com/programs/ios/
iOS 4, iPhone Shares (2011) viewed at 11 07 2011, http://allappnews.com/cult-of-mac/after-one-year-ios-4-dominates-95-of-iphones/
iPhone Users Age Statistics (2009) viewed at 13 05 2011, http://blog.nielsen.com/nielsenwire/online_mobile/iphone-users-watch-more-video-and-are-older-than-you-think/
iPhone Users Buy Applications (2008) viewed at 13 05 2011, http://gigaom.com/apple/profile-of-an-iphone-user-interesting-statistics-about-yourself/
Java (2011) viewed at August 23 2011, http://java.com/
Mentzdv, Elektronische Fahrplanauskunft, EFA (2010) viewed December 14 2010, http://www.mentzdv.de
Measuring Usability (2010) viewed at April 14 2010, http://www.measuringusability.com/sus.php
Minimum Hardware Requirements Android, Windows Phone 7 (2010), viewed December 22 2010, http://asia.cnet.com/crave/2010/11/04/minimum-hardware-requirements-for-android-windows-phone-7-compared/
Mobile Advertising, AdMob (2010) viewed December 22 2010, http://www.admob.com/
Mobile Advertising, Millennial Media (2010) viewed December 22 2010, http://www.millennialmedia.com/
Mobile Services, Transport For London (2010) viewed 22 December 2010, http://www.tfl.gov.uk/tfl/livetravelnews/mobileservices/
Mobile-Apps der Deutschen Bahn (2010) viewed 22 December 2010, www.bahn.de/railnavigator
Plam OS Market Shares (2010) viewed at 15 07 2011, http://www.dailytech.com/Microsoft+Palm+Plunge+in+Smartphone+Market+Share+Android+is+Big+Winner/article17883.htm
Qype App (2011) viewed at 10 05 2011, http://www.qype.com/go-mobile
Standard (2011) viewed at 17 07 2011, http://standard.at
Skype App (2011) viewed at 10 05 2011, http://www.skype.com/intl/de/get-skype/on-your-mobile/download/iphone-for-skype/
151
Smartphone Users Gender (2010) viewed at 13 05 2011, http://tech.fortune.cnn.com/2010/02/25/6-ways-iphone-and-android-users-differ/
Strong Android Market Growth (2010) viewed December 22 2010, http://kurier.at/techno/2021506.php
Verkehrsverbund Steiermark Online (2010) viewed December 22 2010, http://www.verbundlinie.at/
Windows Phone 7 Number of Applications Published (2011) viewed at 11 07 2011, http://www.t3.com/news/windows-phone-7-apps-now-number-more-than-25-000?=58121
ZDNet UK (2010), viewed March 6 2010, http://www.zdnet.co.uk/news/mobile-devices/2010/09/25/sony-ericsson-abandons-symbian-for-android-and-wp7-40090267/
zhaw School Of Engineering (2010), viewed December 22 2010, http://www.engineering.zhaw.ch/de/engineering/newsdetail/news/arbeit-an-europaeischem-forschungsprojekt-promise-aufgenommen.html
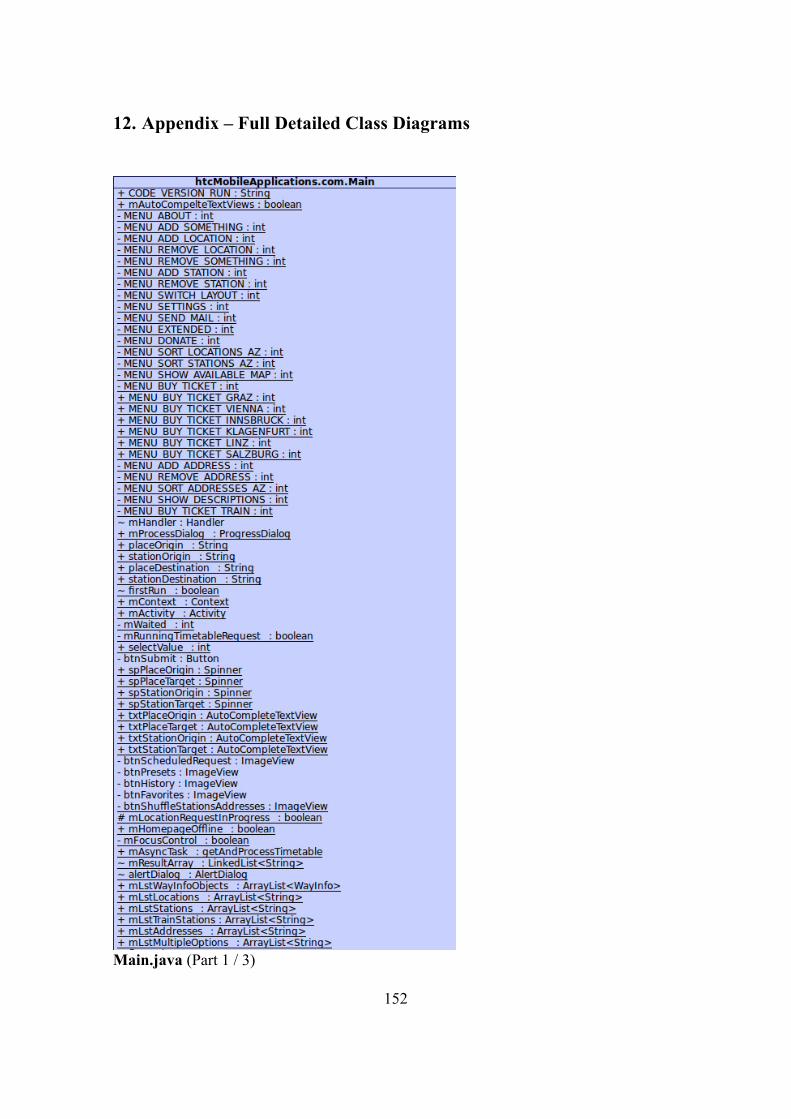
152
12. Appendix – Full Detailed Class Diagrams
Main.java (Part 1 / 3)

153
Main.java (Part 2 / 3)

154
Main.java (Part 3/3)

155
AddEntry.java
BuyTrainTicket.java

156
Constants.java

157
HelpTopics.java
SpecificTopic.java
Tips.java
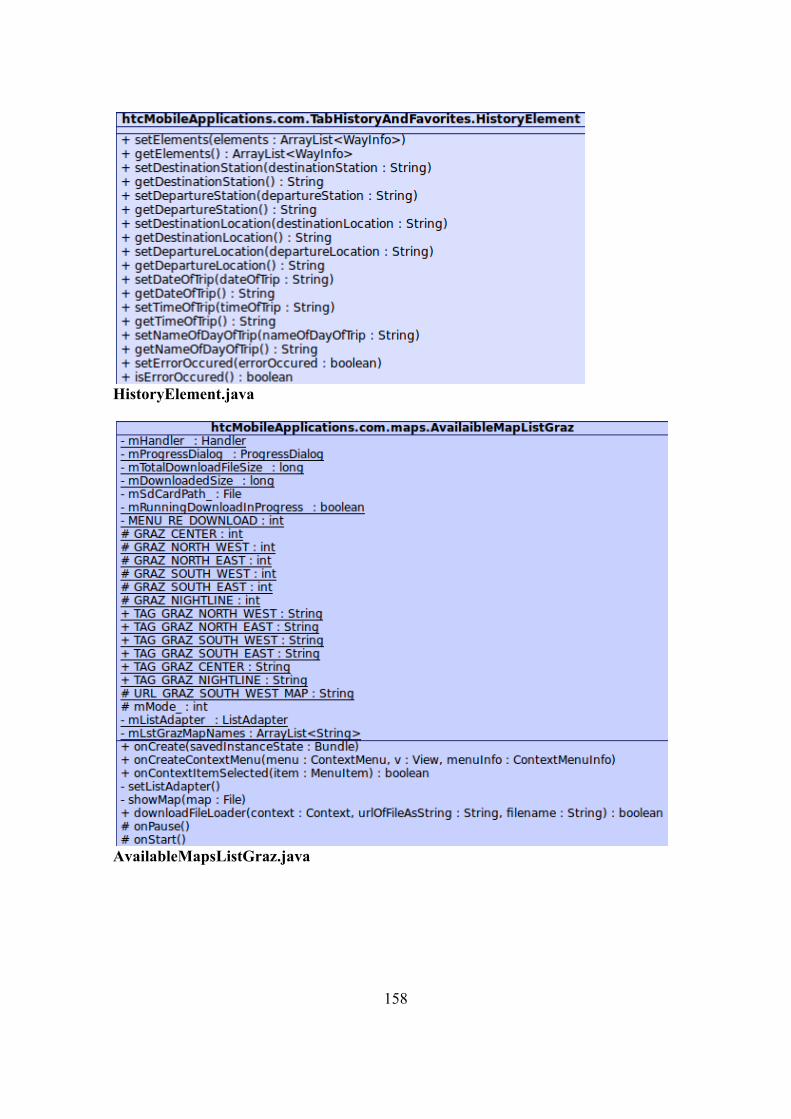
158
HistoryElement.java
AvailableMapsListGraz.java

159
AvailableMapsList.java
MyLocationListener.java
ExtendedCheckBox.java

160
ExtendedCheckBoxList.java
ExtendedCheckBoxListAdapter.java
ExtendedCheckBoxListView.java

161
RequestHandler.java

162
ResultList.java

163
ResultListDetailed.java

164
ScheduledRequest.java
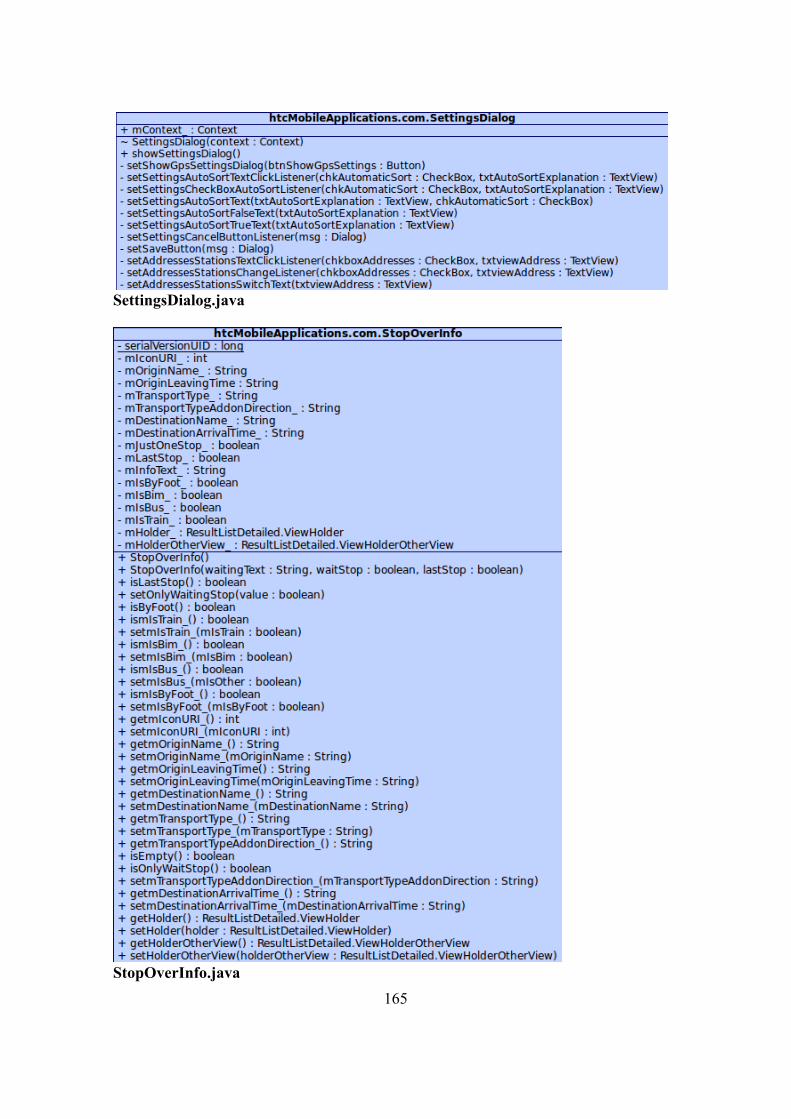
165
SettingsDialog.java
StopOverInfo.java

166
FavoriteElement.java
HistoryElement.java

167
TabFavorites.java
TabHistory.java
TabOverviewFavoritesAndHistory.java
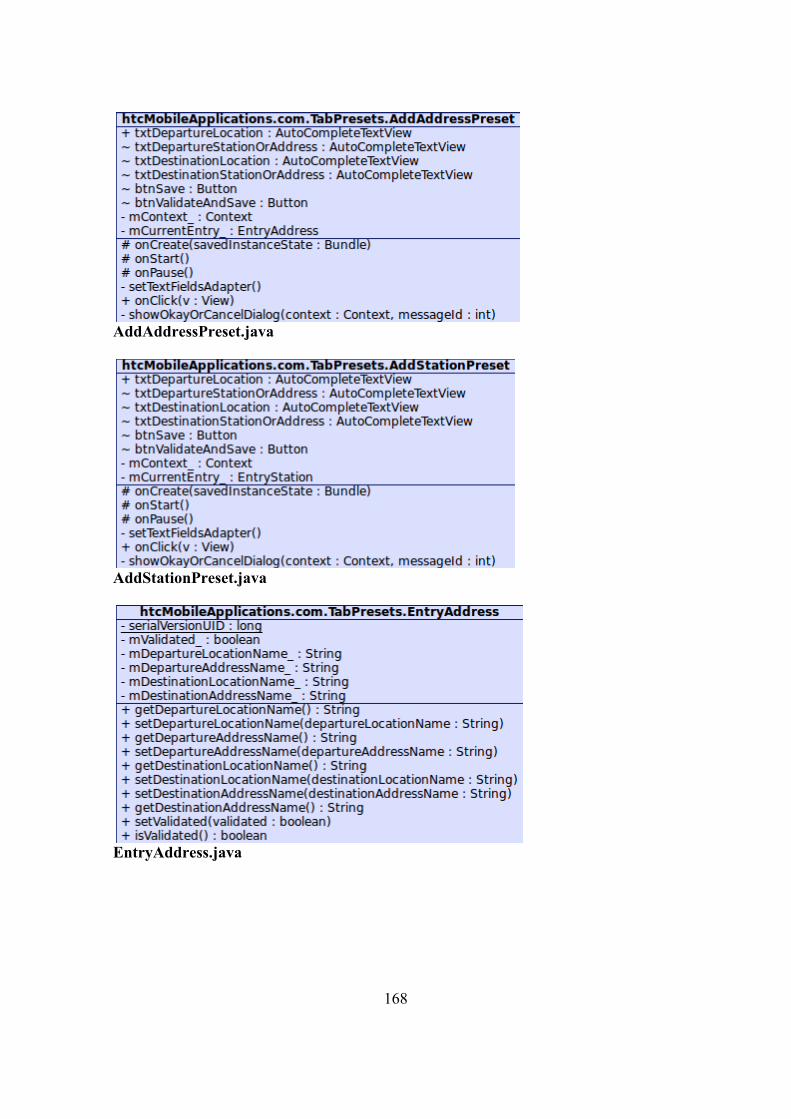
168
AddAddressPreset.java
AddStationPreset.java
EntryAddress.java

169
EntryStation.java
TabAddressesPresetsList.java
TabOverviewPresets.java
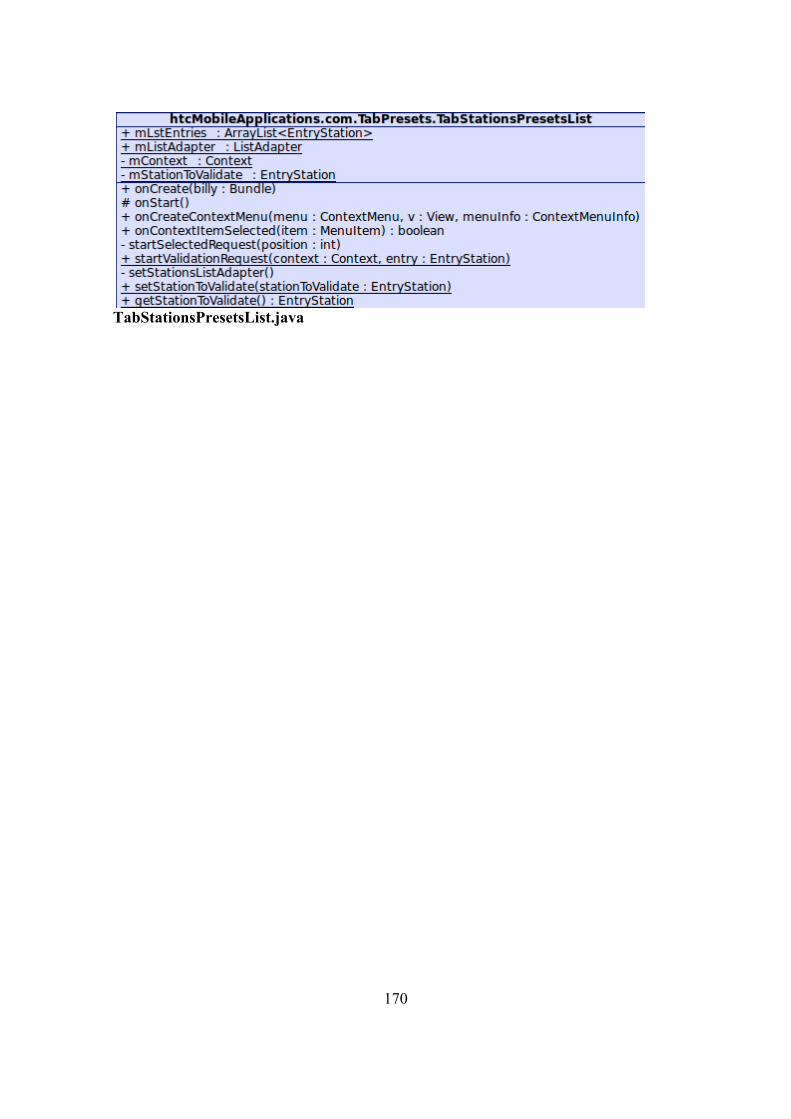
170
TabStationsPresetsList.java
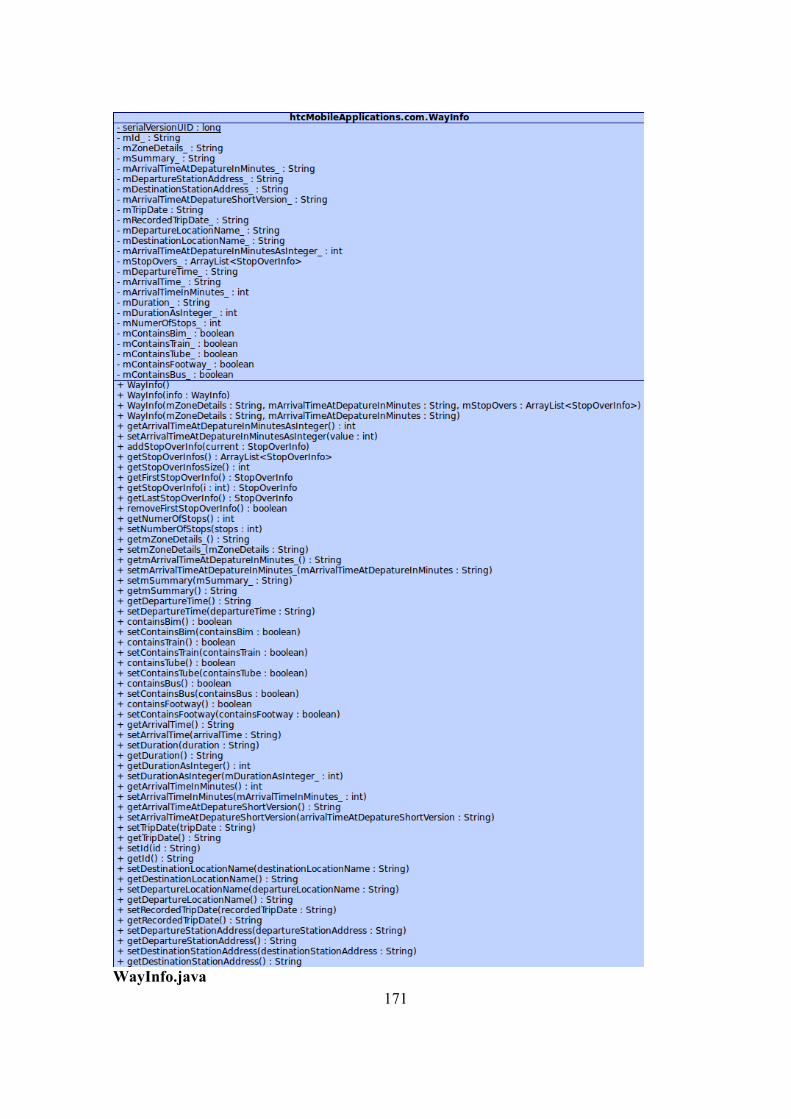
171
WayInfo.java

172
13. Appendix – Complete SUS Results
Name / Alias Marion Gender (m/f) F Branch of studies Engineering Age 27 Experience with Smartphones No Experience with Android No Experience with iPhones No 1 – Strongly disagree / 5 – Strongly agree Value in brakets at the end of a questions was the current user rating. 1. I think that I would like to use this system frequently. (3)
2. I found the system unnecessarily complex. (2)
3. I thought the system was easy to use. (3)
4. I think that I would need the support of a technical person to be able to use this
system. (3)
5. I found the various functions in this system were well integrated. (4)
6. I thought there was too much inconsistency in this system. (2)
7. I would imagine that most people would learn to use this system very quickly.
(5)
8. I found the system very cumbersome to use. (2)
9. I felt very confident using the system. (3)
10. I needed to learn a lot of things before I could get going with this system. (3)

173
Name / Alias Michael Gender (m/f) M Branch of studies Engineering Age 22 Experience with Smartphones Yes Experience with Android No Experience with iPhones Yes 1 – Strongly disagree / 5 – Strongly agree Value in brakets at the end of a questions was the current user rating. 1. I think that I would like to use this system frequently. (4)
2. I found the system unnecessarily complex. (4)
3. I thought the system was easy to use. (4)
4. I think that I would need the support of a technical person to be able to use this
system. (2)
5. I found the various functions in this system were well integrated. (5)
6. I thought there was too much inconsistency in this system. (2)
7. I would imagine that most people would learn to use this system very quickly.
(5)
8. I found the system very cumbersome to use. (2)
9. I felt very confident using the system. (4)
10. I needed to learn a lot of things before I could get going with this system. (2)

174
Name / Alias Elke Gender (m/f) F Branch of studies Informatics Age 23 Experience with Smartphones Yes Experience with Android Yes Experience with iPhones No 1 – Strongly disagree / 5 – Strongly agree Value in brakets at the end of a questions was the current user rating. 1. I think that I would like to use this system frequently. (4)
2. I found the system unnecessarily complex. (1)
3. I thought the system was easy to use. (5)
4. I think that I would need the support of a technical person to be able to use this
system. (1)
5. I found the various functions in this system were well integrated. (5)
6. I thought there was too much inconsistency in this system. (1)
7. I would imagine that most people would learn to use this system very quickly.
(3)
8. I found the system very cumbersome to use. (1)
9. I felt very confident using the system. (5)
10. I needed to learn a lot of things before I could get going with this system. (1)

175
Name / Alias Thomas Gender (m/f) M Branch of studies Informatics Age 26 Experience with Smartphones Yes Experience with Android No Experience with iPhones Yes 1 – Strongly disagree / 5 – Strongly agree Value in brakets at the end of a questions was the current user rating. 1. I think that I would like to use this system frequently. (4)
2. I found the system unnecessarily complex. (2)
3. I thought the system was easy to use. (5)
4. I think that I would need the support of a technical person to be able to use this
system. (1)
5. I found the various functions in this system were well integrated. (4)
6. I thought there was too much inconsistency in this system. (2)
7. I would imagine that most people would learn to use this system very quickly.
(5)
8. I found the system very cumbersome to use. (3)
9. I felt very confident using the system. (4)
10. I needed to learn a lot of things before I could get going with this system. (2)

176
Name / Alias Stefan Gender (m/f) M Branch of studies Informatics Age 23 Experience with Smartphones Yes Experience with Android Yes Experience with iPhones Yes 1 – Strongly disagree / 5 – Strongly agree Value in brakets at the end of a questions was the current user rating. 1. I think that I would like to use this system frequently. (4)
2. I found the system unnecessarily complex. (1)
3. I thought the system was easy to use. (5)
4. I think that I would need the support of a technical person to be able to use this
system. (5)
5. I found the various functions in this system were well integrated. (4)
6. I thought there was too much inconsistency in this system. (1)
7. I would imagine that most people would learn to use this system very quickly.
(5)
8. I found the system very cumbersome to use. (4)
9. I felt very confident using the system. (4)
10. I needed to learn a lot of things before I could get going with this system. (1)

177
Name / Alias Johannes Gender (m/f) M Branch of studies Engineering Age 21 Experience with Smartphones Yes Experience with Android No Experience with iPhones No 1 – Strongly disagree / 5 – Strongly agree Value in brakets at the end of a questions was the current user rating. 1. I think that I would like to use this system frequently. (4)
2. I found the system unnecessarily complex. (2)
3. I thought the system was easy to use. (3)
4. I think that I would need the support of a technical person to be able to use this
system. (2)
5. I found the various functions in this system were well integrated. (4)
6. I thought there was too much inconsistency in this system. (1)
7. I would imagine that most people would learn to use this system very quickly.
(4)
8. I found the system very cumbersome to use. (4)
9. I felt very confident using the system. (4)
10. I needed to learn a lot of things before I could get going with this system. (1)

178
Name / Alias Dominik Gender (m/f) M Branch of studies Engineering Age 21 Experience with Smartphones Yes Experience with Android Yes Experience with iPhones Yes 1 – Strongly disagree / 5 – Strongly agree Value in brakets at the end of a questions was the current user rating. 1. I think that I would like to use this system frequently. (4)
2. I found the system unnecessarily complex. (2)
3. I thought the system was easy to use. (4)
4. I think that I would need the support of a technical person to be able to use this
system. (1)
5. I found the various functions in this system were well integrated. (5)
6. I thought there was too much inconsistency in this system. (2)
7. I would imagine that most people would learn to use this system very quickly.
(4)
8. I found the system very cumbersome to use. (1)
9. I felt very confident using the system. (5)
10. I needed to learn a lot of things before I could get going with this system. (2)
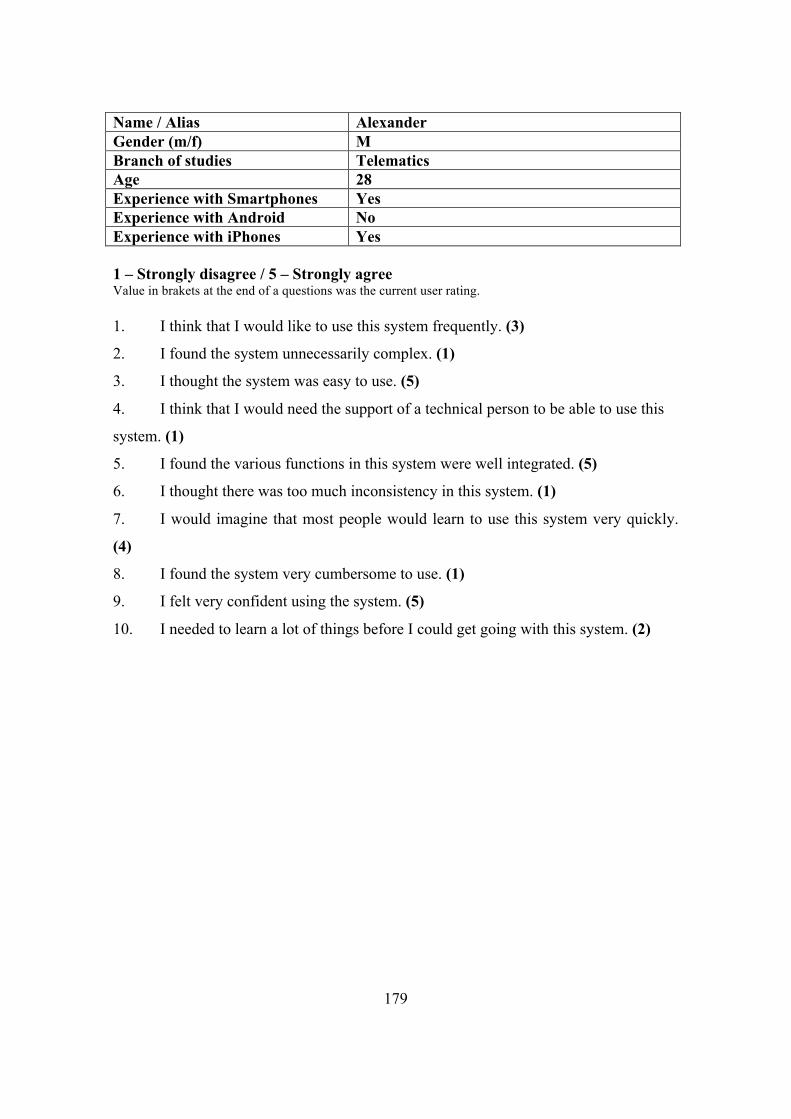
179
Name / Alias Alexander Gender (m/f) M Branch of studies Telematics Age 28 Experience with Smartphones Yes Experience with Android No Experience with iPhones Yes 1 – Strongly disagree / 5 – Strongly agree Value in brakets at the end of a questions was the current user rating. 1. I think that I would like to use this system frequently. (3)
2. I found the system unnecessarily complex. (1)
3. I thought the system was easy to use. (5)
4. I think that I would need the support of a technical person to be able to use this
system. (1)
5. I found the various functions in this system were well integrated. (5)
6. I thought there was too much inconsistency in this system. (1)
7. I would imagine that most people would learn to use this system very quickly.
(4)
8. I found the system very cumbersome to use. (1)
9. I felt very confident using the system. (5)
10. I needed to learn a lot of things before I could get going with this system. (2)

180
Name / Alias Mock Gender (m/f) M Branch of studies Telematics Age 24 Experience with Smartphones Yes Experience with Android No Experience with iPhones Yes 1 – Strongly disagree / 5 – Strongly agree Value in brakets at the end of a questions was the current user rating. 1. I think that I would like to use this system frequently. (4)
2. I found the system unnecessarily complex. (2)
3. I thought the system was easy to use. (3)
4. I think that I would need the support of a technical person to be able to use this
system. (2)
5. I found the various functions in this system were well integrated. (4)
6. I thought there was too much inconsistency in this system. (1)
7. I would imagine that most people would learn to use this system very quickly.
(4)
8. I found the system very cumbersome to use. (2)
9. I felt very confident using the system. (3)
10. I needed to learn a lot of things before I could get going with this system. (1)
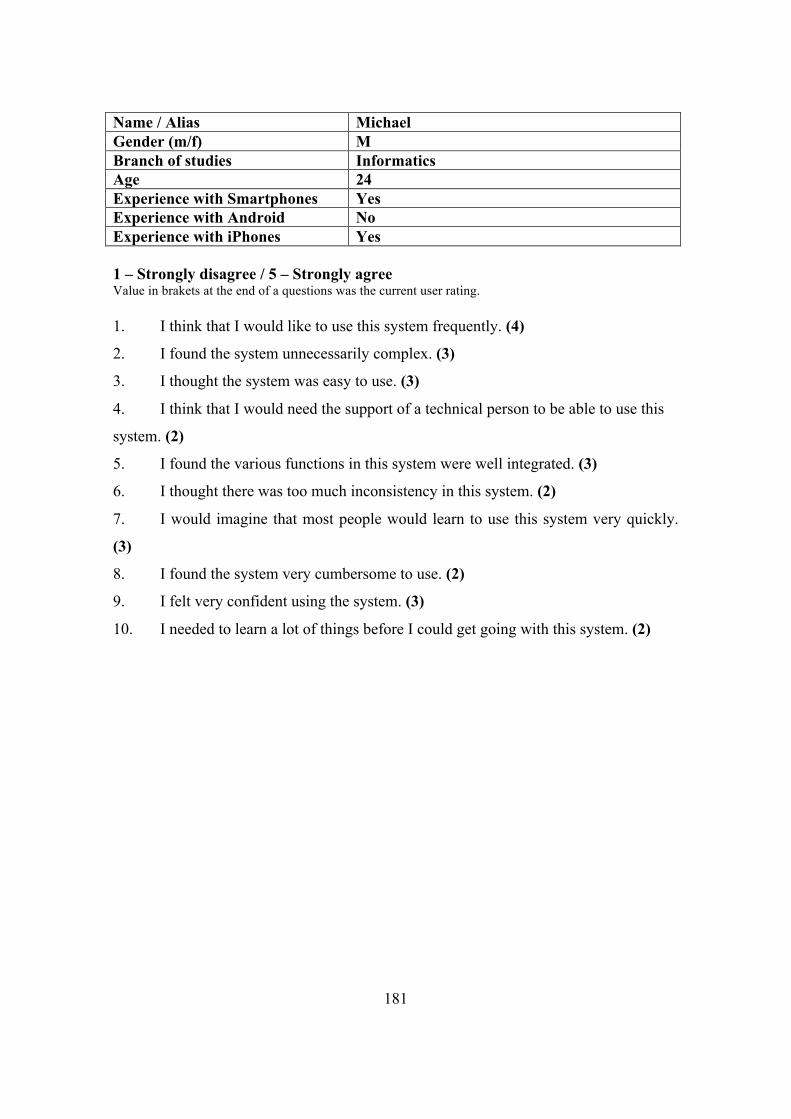
181
Name / Alias Michael Gender (m/f) M Branch of studies Informatics Age 24 Experience with Smartphones Yes Experience with Android No Experience with iPhones Yes 1 – Strongly disagree / 5 – Strongly agree Value in brakets at the end of a questions was the current user rating. 1. I think that I would like to use this system frequently. (4)
2. I found the system unnecessarily complex. (3)
3. I thought the system was easy to use. (3)
4. I think that I would need the support of a technical person to be able to use this
system. (2)
5. I found the various functions in this system were well integrated. (3)
6. I thought there was too much inconsistency in this system. (2)
7. I would imagine that most people would learn to use this system very quickly.
(3)
8. I found the system very cumbersome to use. (2)
9. I felt very confident using the system. (3)
10. I needed to learn a lot of things before I could get going with this system. (2)

182
Name / Alias Eva Gender (m/f) F Branch of studies Biomedical Engineering Age 20 Experience with Smartphones Yes Experience with Android No Experience with iPhones Yes 1 – Strongly disagree / 5 – Strongly agree Value in brakets at the end of a questions was the current user rating. 1. I think that I would like to use this system frequently. (3)
2. I found the system unnecessarily complex. (2)
3. I thought the system was easy to use. (4)
4. I think that I would need the support of a technical person to be able to use this
system. (1)
5. I found the various functions in this system were well integrated. (4)
6. I thought there was too much inconsistency in this system. (2)
7. I would imagine that most people would learn to use this system very quickly.
(4)
8. I found the system very cumbersome to use. (4)
9. I felt very confident using the system. (4)
10. I needed to learn a lot of things before I could get going with this system. (1)

183
Name / Alias Martin Gender (m/f) M Branch of studies Informatics Age 21 Experience with Smartphones Yes Experience with Android Yes Experience with iPhones No 1 – Strongly disagree / 5 – Strongly agree Value in brakets at the end of a questions was the current user rating. 1. I think that I would like to use this system frequently. (2)
2. I found the system unnecessarily complex. (1)
3. I thought the system was easy to use. (5)
4. I think that I would need the support of a technical person to be able to use this
system. (2)
5. I found the various functions in this system were well integrated. (5)
6. I thought there was too much inconsistency in this system. (2)
7. I would imagine that most people would learn to use this system very quickly.
(5)
8. I found the system very cumbersome to use. (3)
9. I felt very confident using the system. (4)
10. I needed to learn a lot of things before I could get going with this system. (1)

184
Name / Alias Theresa Gender (m/f) W Branch of studies Telematics Age 20 Experience with Smartphones Yes Experience with Android Yes Experience with iPhones Yes 1 – Strongly disagree / 5 – Strongly agree Value in brakets at the end of a questions was the current user rating. 1. I think that I would like to use this system frequently. (5)
2. I found the system unnecessarily complex. (1)
3. I thought the system was easy to use. (5)
4. I think that I would need the support of a technical person to be able to use this
system. (1)
5. I found the various functions in this system were well integrated. (5)
6. I thought there was too much inconsistency in this system. (1)
7. I would imagine that most people would learn to use this system very quickly.
(5)
8. I found the system very cumbersome to use. (1)
9. I felt very confident using the system. (5)
10. I needed to learn a lot of things before I could get going with this system. (1)

185
Name / Alias Sebastian Gender (m/f) M Branch of studies Telematics Age 21 Experience with Smartphones Yes Experience with Android Yes Experience with iPhones Yes 1 – Strongly disagree / 5 – Strongly agree Value in brakets at the end of a questions was the current user rating. 1. I think that I would like to use this system frequently. (4)
2. I found the system unnecessarily complex. (1)
3. I thought the system was easy to use. (5)
4. I think that I would need the support of a technical person to be able to use this
system. (1)
5. I found the various functions in this system were well integrated. (5)
6. I thought there was too much inconsistency in this system. (1)
7. I would imagine that most people would learn to use this system very quickly.
(5)
8. I found the system very cumbersome to use. (4)
9. I felt very confident using the system. (4)
10. I needed to learn a lot of things before I could get going with this system. (1)

186
Name / Alias Philipp Gender (m/f) M Branch of studies Software Engineering and Economy Age 20 Experience with Smartphones Yes Experience with Android No Experience with iPhones Yes 1 – Strongly disagree / 5 – Strongly agree Value in brakets at the end of a questions was the current user rating. 1. I think that I would like to use this system frequently. (3)
2. I found the system unnecessarily complex. (1)
3. I thought the system was easy to use. (5)
4. I think that I would need the support of a technical person to be able to use this
system. (1)
5. I found the various functions in this system were well integrated. (4)
6. I thought there was too much inconsistency in this system. (1)
7. I would imagine that most people would learn to use this system very quickly.
(5)
8. I found the system very cumbersome to use. (1)
9. I felt very confident using the system. (4)
10. I needed to learn a lot of things before I could get going with this system. (1)

187
Name / Alias Caterina Gender (m/f) W Branch of studies Software Engineering and Economy Age 19 Experience with Smartphones No Experience with Android No Experience with iPhones No 1 – Strongly disagree / 5 – Strongly agree Value in brakets at the end of a questions was the current user rating. 1. I think that I would like to use this system frequently. (3)
2. I found the system unnecessarily complex. (3)
3. I thought the system was easy to use. (4)
4. I think that I would need the support of a technical person to be able to use this
system. (1)
5. I found the various functions in this system were well integrated. (2)
6. I thought there was too much inconsistency in this system. (3)
7. I would imagine that most people would learn to use this system very quickly.
(3)
8. I found the system very cumbersome to use. (2)
9. I felt very confident using the system. (3)
10. I needed to learn a lot of things before I could get going with this system. (4)

188
Name / Alias Dominik Gender (m/f) M Branch of studies Software Engineering And Economy Age 22 Experience with Smartphones Yes Experience with Android Yes Experience with iPhones No 1 – Strongly disagree / 5 – Strongly agree Value in brakets at the end of a questions was the current user rating. 1. I think that I would like to use this system frequently. (4)
2. I found the system unnecessarily complex. (1)
3. I thought the system was easy to use. (4)
4. I think that I would need the support of a technical person to be able to use this
system. (1)
5. I found the various functions in this system were well integrated. (4)
6. I thought there was too much inconsistency in this system. (2)
7. I would imagine that most people would learn to use this system very quickly.
(5)
8. I found the system very cumbersome to use. (1)
9. I felt very confident using the system. (4)
10. I needed to learn a lot of things before I could get going with this system. (2)

189
Name / Alias Gerald Gender (m/f) M Branch of studies Physics Age 33 Experience with Smartphones Yes Experience with Android No Experience with iPhones No 1 – Strongly disagree / 5 – Strongly agree Value in brakets at the end of a questions was the current user rating. 1. I think that I would like to use this system frequently. (4)
2. I found the system unnecessarily complex. (1)
3. I thought the system was easy to use. (4)
4. I think that I would need the support of a technical person to be able to use this
system. (1)
5. I found the various functions in this system were well integrated. (4)
6. I thought there was too much inconsistency in this system. (2)
7. I would imagine that most people would learn to use this system very quickly.
(5)
8. I found the system very cumbersome to use. (2)
9. I felt very confident using the system. (4)
10. I needed to learn a lot of things before I could get going with this system. (1)
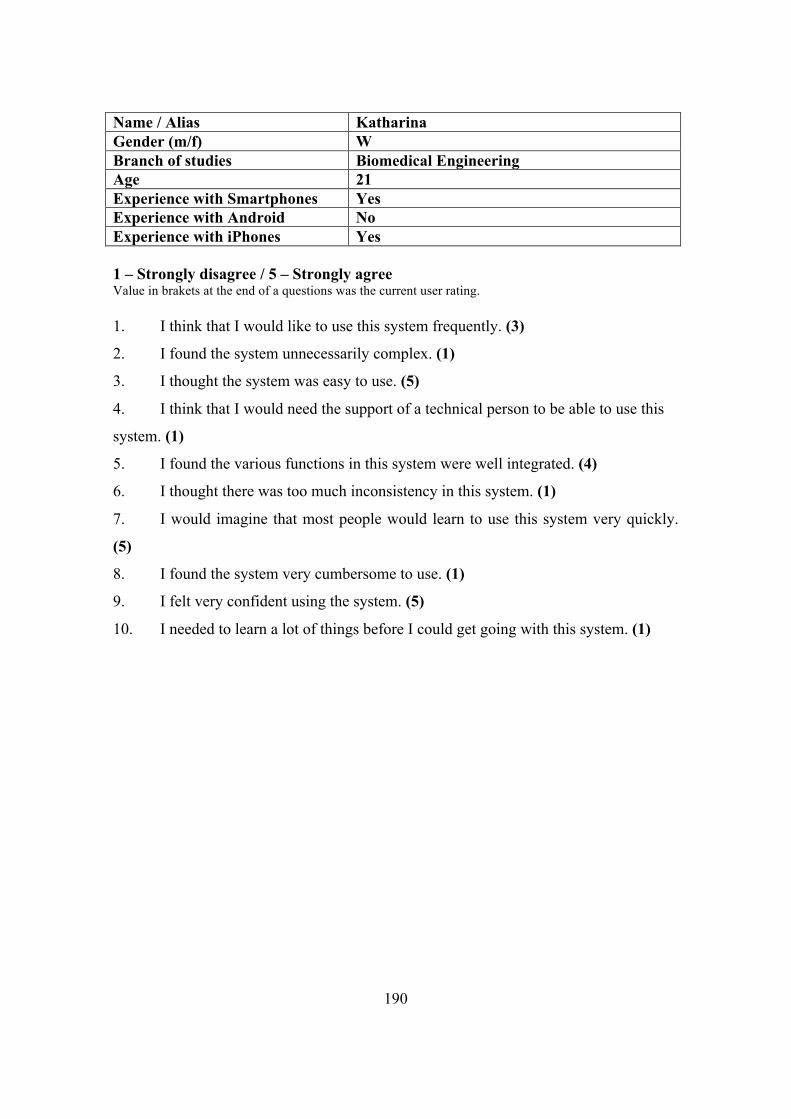
190
Name / Alias Katharina Gender (m/f) W Branch of studies Biomedical Engineering Age 21 Experience with Smartphones Yes Experience with Android No Experience with iPhones Yes 1 – Strongly disagree / 5 – Strongly agree Value in brakets at the end of a questions was the current user rating. 1. I think that I would like to use this system frequently. (3)
2. I found the system unnecessarily complex. (1)
3. I thought the system was easy to use. (5)
4. I think that I would need the support of a technical person to be able to use this
system. (1)
5. I found the various functions in this system were well integrated. (4)
6. I thought there was too much inconsistency in this system. (1)
7. I would imagine that most people would learn to use this system very quickly.
(5)
8. I found the system very cumbersome to use. (1)
9. I felt very confident using the system. (5)
10. I needed to learn a lot of things before I could get going with this system. (1)

191
Name / Alias Thorsten Gender (m/f) M Branch of studies Informatics Age 28 Experience with Smartphones Yes Experience with Android Yes Experience with iPhones Yes 1 – Strongly disagree / 5 – Strongly agree Value in brakets at the end of a questions was the current user rating. 1. I think that I would like to use this system frequently. (4)
2. I found the system unnecessarily complex. (2)
3. I thought the system was easy to use. (5)
4. I think that I would need the support of a technical person to be able to use this
system. (1)
5. I found the various functions in this system were well integrated. (5)
6. I thought there was too much inconsistency in this system. (1)
7. I would imagine that most people would learn to use this system very quickly.
(4)
8. I found the system very cumbersome to use. (1)
9. I felt very confident using the system. (5)
10. I needed to learn a lot of things before I could get going with this system. (1)


![[2015/2016] User-centred design](https://img.pdfslide.us/doc/110x75/58efafb91a28abf42a8b462b/20152016-user-centred-design.jpg)