Embed Size (px)
Citation preview
MASTERARBEIT
Titel der Masterarbeit
Development of novel products on basis of Sacha Inchi – Use of press cakes and hulls
Vefasserin
Julia Jagersberger, Bsc
angestrebter akademischer Grad
Master of Science (MSc)
Wien, 2013
Studienkennzahl lt. Studienblatt: A 000 000
Studienrichtung lt. Studienblatt: Masterstudium Ernährungswissenschaften
Betreuer: Ao. Univ. Prof. i.R. Dipl.-Ing. Dr. techn., Berghofer, Emmerich

1
THANKSGIVING
At this point I would like to thank all those who have supported me during this work
and during my whole study.
My thanks go to Prof. Emmerich Berghofer who has left me this interesting topic and
Dr. Regine Schönlechner who has supervised me in a very competent and
straightforward way.
Above all, I would like to thank my parents who have supported me personally and
financially throughout my life.
2
TABLE OF CONTENTS
LIST OF TABLES
IMAGE INDEX
EQUATION INDEX
1. Introduction ........................................................................................................ 10
2. Sacha Inchi .......................................................................................................... 11
2.1 Oil content and fatty acid composition of Sacha Inchi seeds and oil ..................... 11
2.2 Protein and carbohydrate content of Sacha Inchi seeds (SIS) ............................... 13
2.3 Mineral composition of Sacha Inchi seeds ............................................................. 14
2.4 Physicochemical properties of Sacha Inchi oil (SIO) ............................................... 15
2.5 Oxidative stability of Sacha Inchi oil ....................................................................... 15
2.6 Thermal properties of Sacha Inchi oil ..................................................................... 17
3. Oil and press cake production ............................................................................. 18
3.1 Pressing .................................................................................................................. 18
3.2 Solvent extraction .................................................................................................. 23
3.3 Refining process after hot pressing or solvent extraction ..................................... 23
3.6 Extruder technology ............................................................................................... 24
3.6.1 Dry extrusion ........................................................................................................... 25
3.6.2 Extrusion-expelling-method .................................................................................... 26
4. Composition of press cakes from selected plants ................................................. 27
4.1 Soy .......................................................................................................................... 27
4.2 Canola ..................................................................................................................... 28
4.3 Flaxseed .................................................................................................................. 30
4.4 Peanut .................................................................................................................... 32
4.5 Sunflower ............................................................................................................... 32
5. Food uses of press cakes and hulls ....................................................................... 33
5.1 Soy .......................................................................................................................... 33
5.2 Flaxseed .................................................................................................................. 34
5.3 Canola ..................................................................................................................... 36
5.4 Peanut .................................................................................................................... 37
5.5 Sunflower ............................................................................................................... 37
3
6. Task-setting ........................................................................................................ 39
7. Materials and methods ....................................................................................... 40
7.1 Raw materials ......................................................................................................... 40
7.2 Preparation of samples .......................................................................................... 42
7.3 Methods of examination ........................................................................................ 42
7.3.1 Determination of the dry matter (dm) ................................................................... 42
7.3.1.1 Principle .......................................................................................................... 42
7.3.1.2 Equipment and materials ................................................................................ 42
7.3.1.3 Procedure ........................................................................................................ 43
7.3.1.4 Calculation....................................................................................................... 43
7.3.2 Determination of the ash content .......................................................................... 43
7.3.2.1 Principle .......................................................................................................... 43
7.3.2.2 Equipment and materials ................................................................................ 44
7.3.2.3 Procedure ........................................................................................................ 44
7.3.2.4 Calculation....................................................................................................... 44
7.3.3 Determination of the protein content .................................................................... 45
7.3.3.1 Principle .......................................................................................................... 45
7.3.3.2 Equipment and materials ................................................................................ 45
7.3.3.3 Chemicals and reagents .................................................................................. 46
7.3.3.4 Procedure ........................................................................................................ 47
7.3.3.5 Calculation....................................................................................................... 47
7.3.4 Determination of the fat content ........................................................................... 48
7.3.4.1 Principle .......................................................................................................... 48
7.3.4.2 Equipment and materials ................................................................................ 48
7.3.4.3 Chemicals and reagents .................................................................................. 48
7.3.4.4 Procedure ........................................................................................................ 49
7.3.4.5 Calculation....................................................................................................... 49
7.3.5 Determination of the total starch content (Megazyme Kit, Amyloglucosidase/α-
Amylase Method, K-TSTA 07/11) ........................................................................... 50
7.3.5.1 Principle .......................................................................................................... 50
7.3.5.2 Equipment and materials ................................................................................ 50
7.3.5.3 Chemicals and reagents .................................................................................. 51
7.3.5.4 Procedure ........................................................................................................ 51
4
7.3.5.5 Calculation....................................................................................................... 52
7.3.6 Determination of the resistant starch content (Megazyme Kit, Resistant Starch, K-
RSTAR 08/11) .......................................................................................................... 53
7.3.6.1 Principle .......................................................................................................... 53
7.3.6.2 Equipment and materials ................................................................................ 53
7.3.6.3 Chemicals and reagents .................................................................................. 54
7.3.6.4 Procedure ........................................................................................................ 54
7.3.6.5 Calculation....................................................................................................... 56
7.3.7 Determination of the insoluble and soluble dietary fibre (Megazyme Kit, Total
dietary fibre, AOAC Method 991.43, K-TDFR 05/12) ............................................. 57
7.3.7.1 Principle .......................................................................................................... 57
7.3.7.2 Equipment and materials ................................................................................ 57
7.3.7.3 Chemicals and reagents .................................................................................. 58
7.3.7.4 Procedure ........................................................................................................ 58
7.3.7.5 Calculation....................................................................................................... 60
7.3.8 Determination of the total phenols (Singleton et al., 1974) ................................... 60
7.3.8.1 Principle .......................................................................................................... 60
7.3.8.2 Equipment and materials ................................................................................ 60
7.3.8.3 Chemicals and reagents ................................................................................. 61
7.3.8.4 Procedure ........................................................................................................ 62
7.3.8.5 Calculation....................................................................................................... 62
7.3.9 Determination of the glucose content .................................................................... 63
7.3.9.1 Principle .......................................................................................................... 63
7.3.9.2 Equipment and materials ................................................................................ 64
7.3.9.3 Chemicals and reagents .................................................................................. 64
7.3.9.4 Procedure ........................................................................................................ 64
7.3.9.5 Calculation....................................................................................................... 65
7.3.10 Determination of water absorption index (WAI) and water solubility index (WSI)
(according to Anderson et al., 1969) ...................................................................... 66
7.3.10.1 Principle....................................................................................................... 66
7.3.10.2 Equipment and materials ............................................................................ 66
7.3.10.3 Chemicals and reagents .............................................................................. 67
7.3.10.4 Procedure .................................................................................................... 67
5
7.3.10.5 Calculation ................................................................................................... 67
7.3.11 Determination of the viscosity (Rapid Visco Analyser, RVA 4500) ......................... 68
7.3.11.1 Principle....................................................................................................... 68
7.3.11.2 Equipment and materials ............................................................................ 68
7.3.11.3 Procedure .................................................................................................... 69
7.3.12 Determination of the protein solubility (Bradford method, 1976) ......................... 69
7.3.12.1 Principle....................................................................................................... 69
7.3.12.2 Equipment and materials ............................................................................ 69
7.3.12.3 Chemicals and reagents .............................................................................. 70
7.3.12.4 Procedure .................................................................................................... 70
7.3.12.5 Calculation ................................................................................................... 72
7.3.13 Extrusion cooking .................................................................................................... 72
7.3.13.1 Raw materials .............................................................................................. 72
7.3.13.2 Procedure .................................................................................................... 72
7.3.14 Production of granola bars ..................................................................................... 73
7.3.14.1 Raw materials .............................................................................................. 73
7.3.14.2 Procedure .................................................................................................... 73
7.3.15 Production of biscuits ............................................................................................. 74
7.3.15.1 Raw materials .............................................................................................. 74
7.3.15.2 Procedure .................................................................................................... 74
7.3.16 Production of noodles ............................................................................................. 75
7.3.16.1 Raw materials .............................................................................................. 75
7.3.16.2 Procedure .................................................................................................... 75
7.3.17 Production of beverages ......................................................................................... 76
7.3.17.1 Raw materials .............................................................................................. 76
7.3.17.2 Procedure .................................................................................................... 76
7.3.18 Physical measurements of the products ................................................................. 77
7.3.18.1 Determination of the expansion index and bulk density of snack basis
products ...................................................................................................... 77
7.3.18.2 Determination of the spreading factor of the biscuits ............................... 77
7.3.18.3 Determination of the texture of the extrudates, biscuits and noodles ...... 77
7.3.18.4 Determination of the functional properties of the noodles ....................... 79
7.3.19 Sensory evaluation .................................................................................................. 80
6
7.3.20 Statistics .................................................................................................................. 85
8. Experimental procedure ...................................................................................... 86
8.1 Extrusion cooking ................................................................................................... 86
8.2 Production of biscuits ............................................................................................. 87
8.3 Production of noodles ............................................................................................ 89
8.2.1 Pre-experiments ...................................................................................................... 90
8.2.2 Main experiment ..................................................................................................... 90
8.4 Production of a beverage ....................................................................................... 91
8.5 Production of granola bars ..................................................................................... 87
9. Results and discussion ......................................................................................... 93
9.1 Determination of the chemical composition and physical properties ................... 93
9.2 Extrusion cooking ................................................................................................... 96
9.2.1 Expansion of snack basis products .......................................................................... 96
9.2.2 Texture of snack basis products .............................................................................. 97
9.3. Production of granola bars ..................................................................................... 98
9.3.1 Sensory analysis ...................................................................................................... 99
9.4 Production of biscuits ........................................................................................... 100
9.4.1 Spreading factor of the biscuits ............................................................................ 100
9.4.2 Texture of the biscuits .......................................................................................... 100
9.4.3 Sensory analysis .................................................................................................... 102
9.5 Production of noodles .......................................................................................... 105
9.5.1 Texture and functional properties of the noodles ................................................ 105
9.5.2 Sensory analysis .................................................................................................... 108
9.6 Production of a beverage ..................................................................................... 110
9.6.1 Sensory analysis .................................................................................................... 111
10. Conclusion ...................................................................................................... 114
11. Summary ........................................................................................................ 116
12. Zusammenfassung .......................................................................................... 118
REFERENCES...........................................................................................................120
7
LIST OF TABLES
Tab. 1: Chemical composition of the seedsa [GUTIÉRREZ et al., 2011] 14
Tab. 2: Mineral composition of the seedsa [GUTIÉRREZ et al., 2011] 14
Tab. 3: Physicochemical properties of Sacha Inchi oila [GUTIÉRREZ et al., 2011] 15
Tab. 4: Peroxide value (PV), free fatty acid (FFA), and fatty acid composition for the different oil samples studied during a 20 day oxidative stability test, after [MAURER et al, 2012] 16
Tab. 5: Quality comparison of meals obtained by solvent-extracted, extruded-expelled, and screw-pressed soybeans.*[mod. after (WANG, 2011)] 28
Tab. 6: Feed values and ingredients of rape expeller cake [FERCHAU, 2000] 29
Tab. 7: Nutrient composition of canola meal relative to soybean meal [BONNARDEAUX, 2007] 30
Tab. 8: Chemical composition of flaxseed cake [GUTIÉRREZ et al., 2010] 31
Tab. 9: Potential applications of flaxseed proteins in food [RABETAFIKA, 2011] 36
Tab. 10: Composition of the flour mixtures (incl. fat content) used for extrusion cooking 86
Tab. 11: Binding agent for the granola bar 87
Tab. 12: Recipe for the granola bars 87
Tab. 13: Basic recipe of biscuits 88
Tab. 14: Recipes of biscuits with different percentages of Sacha Inchi flour 88
Tab. 15: Recipes of biscuits with different percentages of Sacha Inchi press cake 89
Tab. 16: Composition of the noodles with 30% Sacha Inchi flour at different water contents 90
Tab. 17: Composition of noodles with 10 and 20% Sacha Inchi flour at different water contents 90
Tab. 18: Composition of the beverages with Sacha Inchi flour or press cake and maize flour 91
Tab. 19: Chemical composition and physical properties 96
Tab. 20: Results of physical measurements of the extruded products (with SI flour) 97
Tab. 21: Results of physical measurements of the extruded products (comparison SI flour - press cake) 98
Tab. 22: Sensory evaluation of the granola bar (one mixture) 99
Tab. 23: Results of physical measurements of the biscuits (SI flour and press cake) 101
Tab. 24: Results of physical measurements of all biscuits (pure wheat flour, SI flour and press cake ) 102
Tab. 25: Mean sensory ratings for consumer acceptance of the bisuits 103
Tab. 26: Results of physical measurements of the noodles 107
Tab. 27: Comparing of the breaking force Fmax [N] of the noodles at a specific water content 108
Tab. 28: Functional properties of the noodles 108
Tab. 29: Mean sensory ratings for consumer acceptance of the noodles 109
Tab. 30: Mean sensory ratings for consumer acceptance of the beverages 112
8
IMAGE INDEX
Fig. 1: Sacha Inchi plant [ANONYM, 2012] 11
Fig. 2: Overview over the decentralized cold pressing process [FERCHAU, 2000] 21
Fig. 3: Scetch of a complete cold pressing installation [FERCHAU, 2000] 22
Fig. 4: Sacha Inchi press cake, flour, seeds and hulls 40
Fig. 5: Production flow chart of Sacha Inchi protein powder [Agroindustrias Osho S.A.C.] 41
Fig. 6: Absorption of ferulic acid 63
Fig. 7: Reflectometer 65
Fig. 8: Texture Analyser (with light knife blade) 79
Fig. 9: Sensor evaluation sheet of the granola bar 81
Fig. 10: Sensor evaluation sheet of the biscuits 82
Fig. 11: Sensor evaluation sheet of the noodles 83
Fig. 12: Sensor evaluation sheet of the beverages 84
Fig. 13: Sacha Inchi extrudates (with 20% SI flour) 86
Fig. 14: Sacha Inchi biscuits 89
Fig. 15: Sacha Inchi noodles 91
Fig. 16: Two samples of sterilised beverages 92
Fig. 17: Line chart of breaking force (Fmax N) of all extrudates 98
Fig. 18: Results of the sensory acceptance of the granola bar 99
Fig. 19: Line chart of breaking force (Fmax N) of SI flour and press cake biscuits 101
Fig. 20: Line chart of spreading factor of SI flour and press cake biscuits 102
Fig. 21: Spider web of the sensory evaluation of the SI flour biscuits 104
Fig. 22: Spider web of the sensory evaluation of the SI press cake biscuits 105
Fig. 23: Line chart of breaking force (Fmax N) of the noodles 107
Fig. 24: Results of the sensory acceptance of the noodles 110
Fig. 25: Results of the sensory acceptance of the beverages 113
9
EQUATION INDEX
Eq. 1 43
Eq. 2 44
Eq. 3 45
Eq. 4 47
Eq. 5 47
Eq. 6 49
Eq. 7 52
Eq. 8 56
Eq. 9 56
Eq. 10 60
Eq. 11 60
Eq. 12 63
Eq. 13 63
Eq. 14 65
Eq. 15 65
Eq. 16 67
Eq. 17 68
Eq. 18 68
Eq. 19 68
Eq. 20 72
Eq. 21 72
Eq. 22 75
Eq. 23 80
Eq. 24 80
10
1. Introduction
Within the framework of the GIZ-project “Peru Biodiverso”, this master`s thesis took
place in cooperation between the University of Natural Resources and Life Sciences,
Vienna and the company Agroindustrias Osho S.A.C., Peru.
The project “Peru Biodiverso” started in 2007 and wants to boost value added chains
and products through the connection of sustainable use of the biodiversity with
strategies to reduce poverty. In this context the Peruvian agriculture tries to open up
industrial use of the side products of different plants like Sacha Inchi (Inca peanut).
The aim of this work was to analyse the chemical and functional properties of Sacha
Inchi, to use the press cakes and hulls of the plant for developing new products and to
shorten the industrial oil- and protein extraction time by standardizing or optimising
the provided technology.
Because of the unique composition of Sacha Inchi seeds, there is high potential for
applications in the food and pharmaceutical industries. The oil is rich in omega-3, -6
and -9 fatty acids and has a high digestibility. It contains antioxidants such as vitamin E
and is rich in essential and non-essential amino acids.
Thus, it is necessary to investigate the unknown parts of the plants such as hulls and
press cakes, to use all by-products and to satisfy the great demand for this product.
Currently, Sacha Inchi oil (for exterior and interior application), oil capsules and Sacha
Inchi toasted almonds (seeds) are available on the market.
11
2. Sacha Inchi
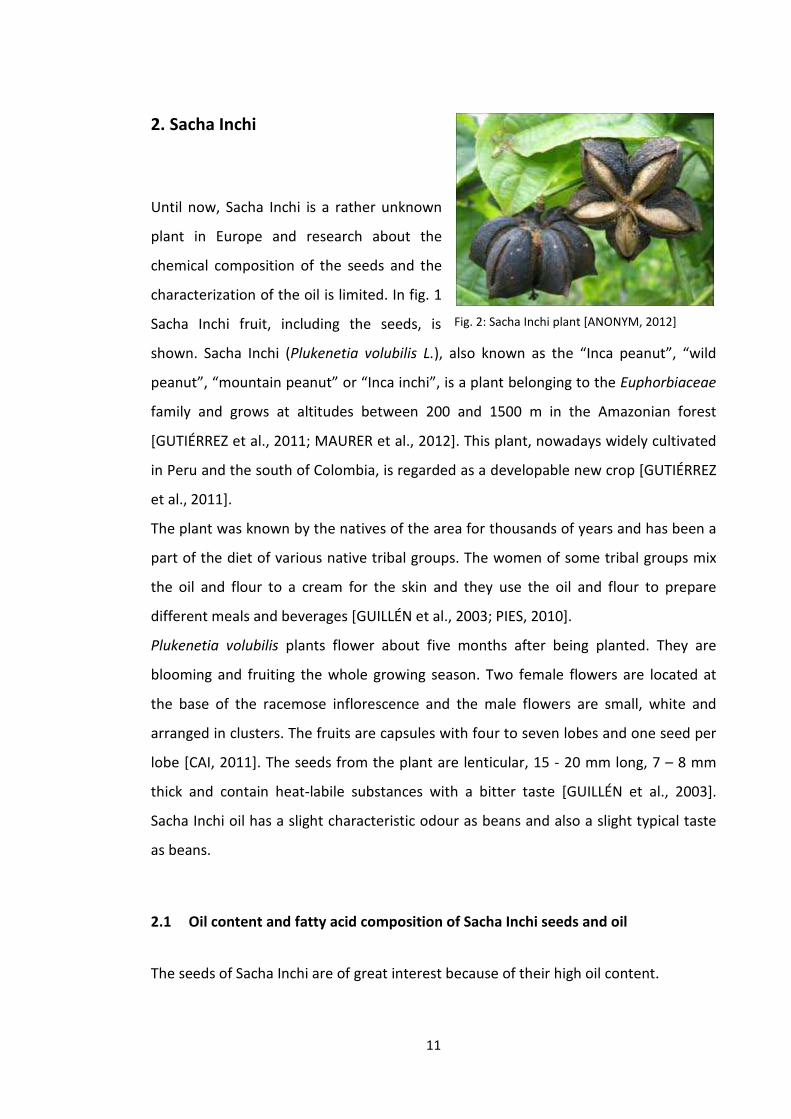
Until now, Sacha Inchi is a rather unknown
plant in Europe and research about the
chemical composition of the seeds and the
characterization of the oil is limited. In fig. 1
Sacha Inchi fruit, including the seeds, is
shown. Sacha Inchi (Plukenetia volubilis L.), also known as the “Inca peanut”, “wild
peanut”, “mountain peanut” or “Inca inchi”, is a plant belonging to the Euphorbiaceae
family and grows at altitudes between 200 and 1500 m in the Amazonian forest
[GUTIÉRREZ et al., 2011; MAURER et al., 2012]. This plant, nowadays widely cultivated
in Peru and the south of Colombia, is regarded as a developable new crop [GUTIÉRREZ
et al., 2011].
The plant was known by the natives of the area for thousands of years and has been a
part of the diet of various native tribal groups. The women of some tribal groups mix
the oil and flour to a cream for the skin and they use the oil and flour to prepare
different meals and beverages [GUILLÉN et al., 2003; PIES, 2010].
Plukenetia volubilis plants flower about five months after being planted. They are
blooming and fruiting the whole growing season. Two female flowers are located at
the base of the racemose inflorescence and the male flowers are small, white and
arranged in clusters. The fruits are capsules with four to seven lobes and one seed per
lobe [CAI, 2011]. The seeds from the plant are lenticular, 15 - 20 mm long, 7 – 8 mm
thick and contain heat-labile substances with a bitter taste [GUILLÉN et al., 2003].
Sacha Inchi oil has a slight characteristic odour as beans and also a slight typical taste
as beans.
2.1 Oil content and fatty acid composition of Sacha Inchi seeds and oil
The seeds of Sacha Inchi are of great interest because of their high oil content.
Fig. 2: Sacha Inchi plant [ANONYM, 2012]
12
As GUILLÉN et al. (2003) reported, Sacha Inchi seeds (SIS) have high oil contents (35 –
60%), including a good fatty acid composition with a high amount of unsaturated fatty
acids. Comparing to other studies, the oil content was higher than those reported by
BONDIOLI and DELLA BELLA (2006) (34.42%), but lower than those found by HAMAKER
et al. (1992) and FOLLEGATTI-ROMERO et al. (2009) (approximately 54%).
These differences could be explained through different subspecies, geographical and
climate conditions, harvesting time of the seeds or through the extraction method. The
oil content of Sacha Inchi is comparable with seeds of linseed, safflower, canola, or
peanut [GUTIÉRREZ et al., 2011].
The fatty acid (FA) composition of Sacha Inchi oil (SIO), which has a bright yellow
colour, can be used to evaluate the stability and nutritional quality of fats and oils. The
oil is very rich in alpha-linolenic (ω-3) and linoleic (ω-6) acids, approximately 50% and
34%, respectively [MAURER et al., 2012]. Low levels of oleic (9.1%), palmitic (4.4) and
stearic (2.4) acids were found from GUTIÉRREZ et al. (2011).
These results are in good agreement with other studies such as FOLLEGATTI-ROMERO
et al. (2009) or FANALI et al. (2011). HAMAKER et al. (1992) and GUILLÉN et al. (2003)
showed lower levels for alpha-linolenic acid, 45.2% and 47.4%, respectively.
Generally, all results are similar and differences could occur because of the different
subspecies, geographical and climate conditions, harvesting time of the seeds, like
mentioned before, or because of the quantification method used during the analyses
[GUTIÉRREZ et al., 2011].
With this concentration of alpha-linolenic acid, Sacha Inchi could be a good source of
this essential fatty acid and also could be used as food supplement [GUTIÉRREZ et al.,
2011].
SIO has an amount of polyunsaturated fatty acids (PUFA) about 84% of the total fatty
acids and an monounsaturated (MUFA) and saturated (SFA) fatty acids amount of
about 9% and 7%, respectively [GUTIÉRREZ et al., 2011].
13
The unsaturated fatty acids are important to provide protection against different
diseases, like coronary heart disease (through reducing the levels of total and low
density lipoprotein cholesterol), hypertension, rheumatoid arthritis, cancer and others
[GUTIÉRREZ et al., 2011; GUILLÉN et al., 2003].
SIO has a relatively similar fatty acid profile like sea buckthorn seed oil, only the
content of alpha-linolenic acid is higher in SIO. Comparing with linseed oil, the content
of linoleic acid in SIO is approximately double than in linseed oil, but the concentration
of alpha-linolenic is a little lower [GUTIÉRREZ et al., 2011].
2.2 Protein and carbohydrate content of Sacha Inchi seeds (SIS)
Sacha Inchi contains a full protein with respect to the amino acid requirements of
adults [SATHE et al., 2002]. The protein content of SIS is approximately 27% and it is
rich in amino acids such as cysteine, tyrosine, threonine and tryptophan [MAURER et
al., 2012]. This content is similar to those from sesame seed (approximately 25%),
sunflower (24%) and peanut (23%) [GUTIÉRREZ et al., 2011].
Except for histidine, Sacha Inchi has all of the essential amino acids in adequate
amounts, when compared with the FAO/WHO recommended amino acid pattern.
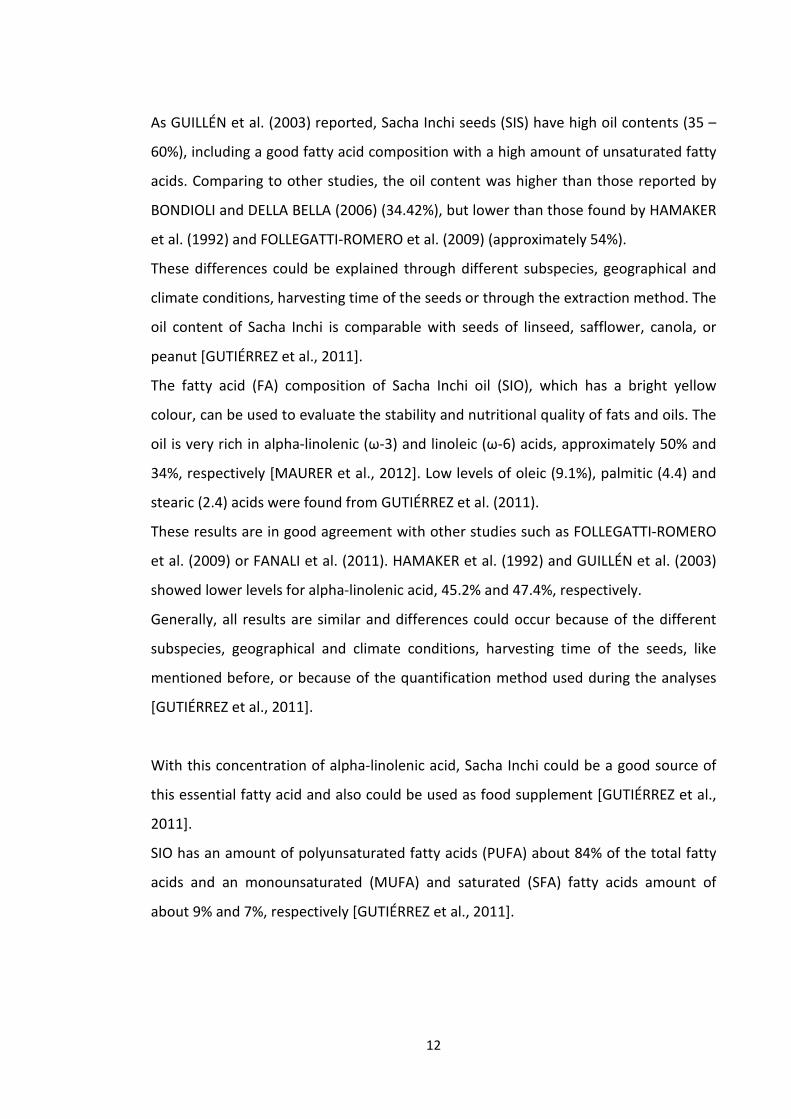
GUTIÉRREZ et al. (2011) showed that the total carbohydrate value of the seeds is
relatively low (30.9%), because of the high content of crude oil and protein.
SIS has a caloric value of 576 kcal/100 g sample, calculated from the contents of fat,
protein and carbohydrate [GUTIÉRREZ et al., 2011].
In tab. 1 the average chemical composition of the seeds is shown.
Tab. 1: Chemical composition of the seeds
aValues are means ± standard deviations of triplicate determinations.
2.3 Mineral composition of
In tab. 2 the mineral content of SIS is presented
dietary essential minerals, like potas
magnesium with 3210 mg/kg, calcium with 2406 mg/kg
zinc with 49 mg/kg.
The soil composition has an impact on the mineral composition of seeds, but when
comparing with other seed oils such as cottonseed, linseed, peanut and safflower, SIS
show the highest concentration of Zn and the lowest conc
The content of calcium
seeds (2406 vs. 2140 mg/kg)
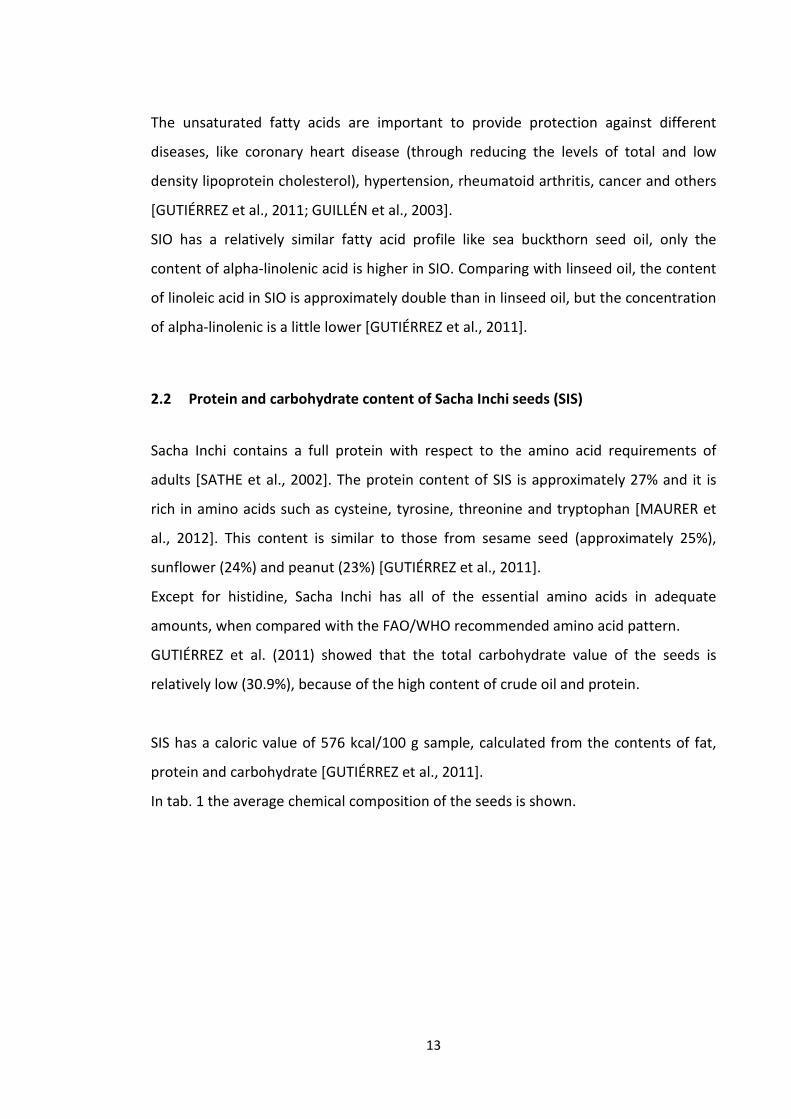
Tab. 2: Mineral composition of
aValues are means ± standard deviations of triplicate determinations.
14
Chemical composition of the seedsa [GUTIÉRREZ et al., 2011]
± standard deviations of triplicate determinations.
Mineral composition of Sacha Inchi seeds
mineral content of SIS is presented. They contain significant
dietary essential minerals, like potassium, which was detected as
magnesium with 3210 mg/kg, calcium with 2406 mg/kg, iron with 103.5 mg/kg
Minor amounts of sodium and cooper were found in the seeds.
The soil composition has an impact on the mineral composition of seeds, but when
comparing with other seed oils such as cottonseed, linseed, peanut and safflower, SIS
show the highest concentration of Zn and the lowest concentration of Na, Cu and Fe.
The content of calcium was similar to the one reported by SMITH
(2406 vs. 2140 mg/kg) [GUTIÉRREZ et al., 2011].
: Mineral composition of the seedsa [GUTIÉRREZ et al., 2011]
standard deviations of triplicate determinations.
. They contain significant amounts of
as the highest amounts,
, iron with 103.5 mg/kg and
cooper were found in the seeds.
The soil composition has an impact on the mineral composition of seeds, but when
comparing with other seed oils such as cottonseed, linseed, peanut and safflower, SIS
entration of Na, Cu and Fe.
reported by SMITH (2007) for safflower
15
2.4 Physicochemical properties of Sacha Inchi oil (SIO)
With a density value of 0.9187 g/cm³ at 25 °C, SIO has a mildly higher value than other
vegetable oils, like corn oil, cottonseed oil and soybean oil. This occurs because of the
high content of unsaturated fatty acids, which is also responsible for the relatively high
viscosity (35.4 mPa.s) [GUTIÉRREZ et al., 2011].
Compared to other oils, also the refractive index of the oil is higher (1.4791 at 25 °C),
due to the number of double bonds, which increases together with the refractive
index. GUTIÉRREZ et al. (2011) also investigated that SIO is not a very good blocker
against UV-B radiation at useful concentrations, because of the low absorbance shown
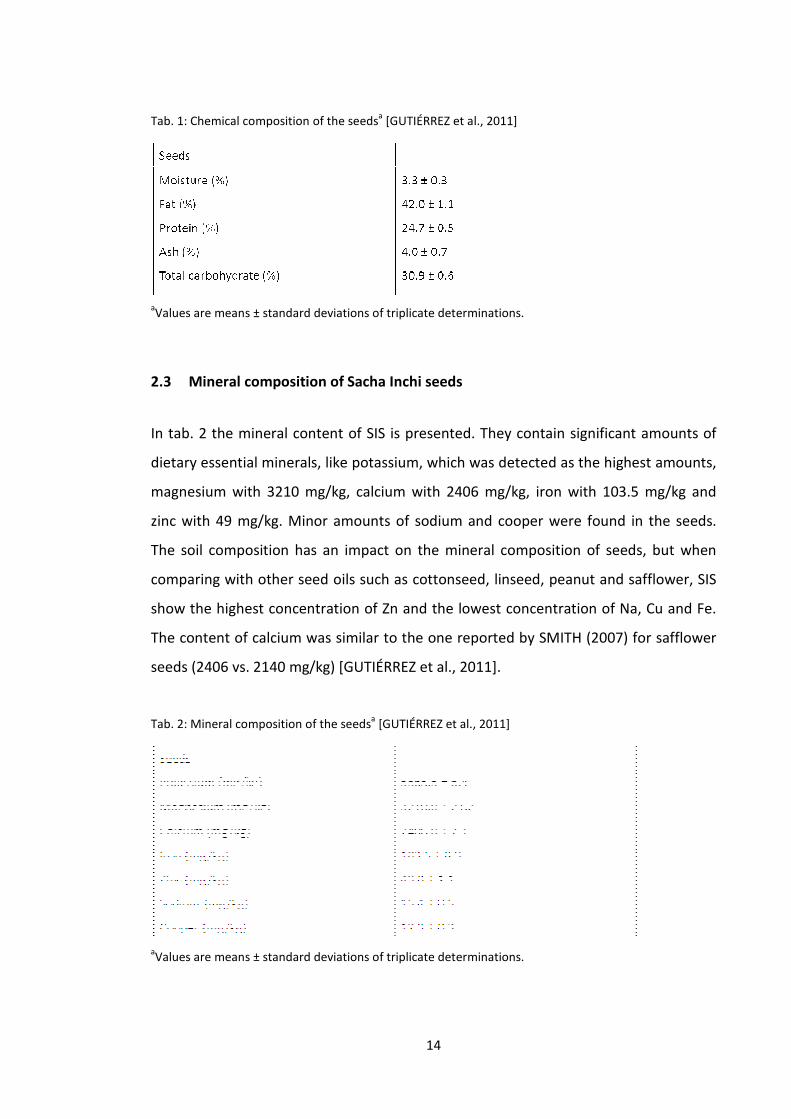
in UV-B. In tab. 3 the physicochemical properties of SIO are shown.
Tab. 3: Physicochemical properties of Sacha Inchi oila [GUTIÉRREZ et al., 2011]
Crude oil
Iodine value (g I2/100 g)
Saponification value (mg KOH/g)
Refractive index at 25 °C
Density at 25 °C (g/cm3)
Viscosity at 20 °C (mPaxs)
193.1 ± 1.0
185.2 ± 0.5
1.4791 ± 0.0009
0.9187 ± 0.02
35.4 ± 0.4
aValues are means ± standard deviations of triplicate determinations.
2.5 Oxidative stability of Sacha Inchi oil
Because of the high content of unsaturated fatty acids, SIO is very susceptible to
peroxidation under mild environmental conditions. Furthermore, composition
differences play a crucial role in oxidation rates [MAURER et al., 2012].
FANALI et al. (2011) showed that γ-Tocopherol, which is one parameter making the oil
more stable to oxidation, turned out to be the most abundant among the tocopherols
found in SIO (more than 50% of the entire tocopherol content).
16
Furthermore, the polyphenolic content is a parameter for the oxidative stability of
polyunsaturated fatty acids. FANALI et al. (2011) found 21 phenolic compounds and 15
of them, belonging to phenyl alcohol, flavonoid, secoiridoid and lignin classes, were
positively identified.
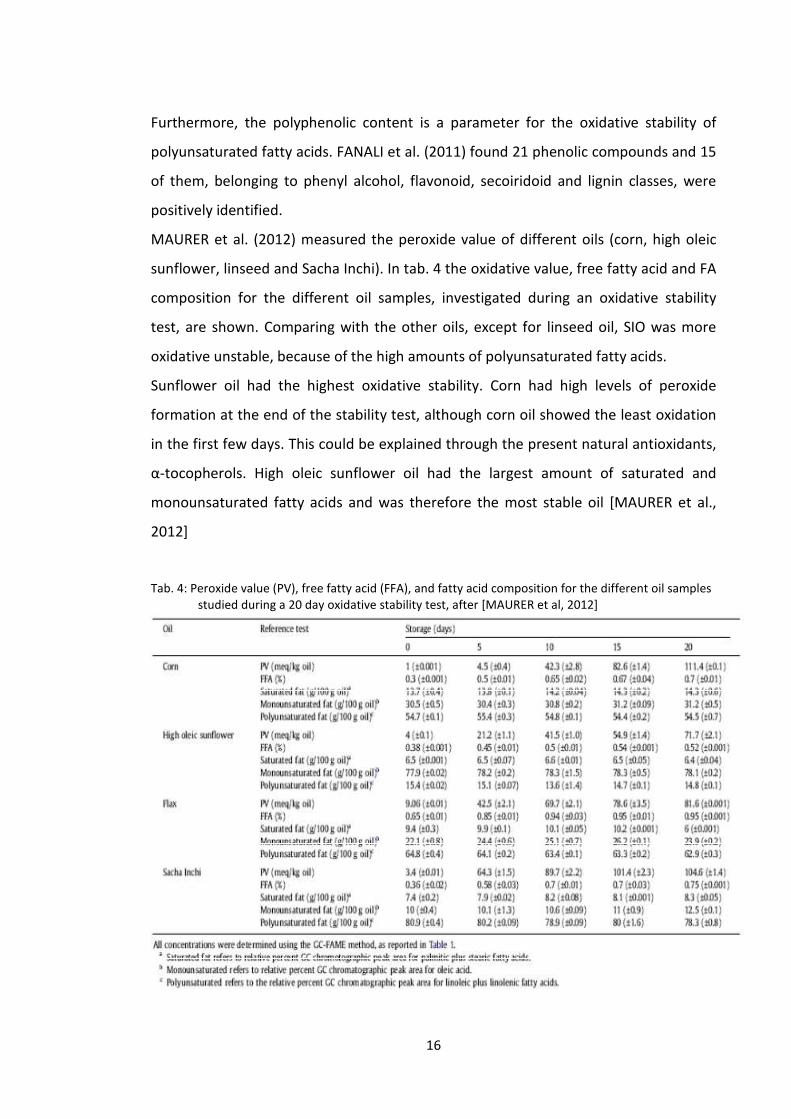
MAURER et al. (2012) measured the peroxide value of different oils (corn, high oleic
sunflower, linseed and Sacha Inchi). In tab. 4 the oxidative value, free fatty acid and FA
composition for the different oil samples, investigated during an oxidative stability
test, are shown. Comparing with the other oils, except for linseed oil, SIO was more
oxidative unstable, because of the high amounts of polyunsaturated fatty acids.
Sunflower oil had the highest oxidative stability. Corn had high levels of peroxide
formation at the end of the stability test, although corn oil showed the least oxidation
in the first few days. This could be explained through the present natural antioxidants,
α-tocopherols. High oleic sunflower oil had the largest amount of saturated and
monounsaturated fatty acids and was therefore the most stable oil [MAURER et al.,
2012]
Tab. 4: Peroxide value (PV), free fatty acid (FFA), and fatty acid composition for the different oil samples studied during a 20 day oxidative stability test, after [MAURER et al, 2012]
17
2.6 Thermal properties of Sacha Inchi oil
The thermal properties are important for the industrial engineering or technological
processes. GUTIÉRREZ et al. (2011) used a differential scanning calorimeter (DSC 2910
TA Instruments) to determine the melting profiles of crude SIO. They investigated one
minor low-temperature endothermic transition at about -45 °C and one pronounced
endothermic transition at -18.5 °C with a melting enthalpy of 23.2 ± 1.4 J/g. In
comparison with other vegetable oils, the melting enthalpy of crude SIO was lower.
The solid fat content of SIO decreased as temperature increased. SIO melted
completely at temperatures above -5 °C, because of the high content of unsaturated
fatty acids. In the investigated temperature range (between -50 and 40 °C), the specific
heat capacity for crude SIO ranged from 1.1 to 3.2 J/g °C.
18
3. Oil and press cake production
Vegetable oils and fats are gained from seeds and fruits of different plant species.
Important for the extraction is a maximum recovery with an extensive preservation of
natural quality properties [KRIST et al., 2008].
Generally, it is distinguished between pressing and hot extraction.
3.1 Pressing
Pressing is the most commonly used methodology. The cleaned, peeled and crushed
material is pressed in hydraulic presses. During cold pressing, the according primary
product is milled to mash. This occurs under gently mechanical pressure, at relative
low temperatures between 40 and 60 °C. With this method, a high quality and natural
finish oil occurs, which is the most valuable edible oil. Usually, the process is carried
out in several stages. The oilseed is first pressed without supply of heat. Then, after
cold pressing, the oil seed is heated and pressed for the second time. After pressing,
substances are present in the oil, which affect the colour, smell and taste of the oil
unfavourably [KRIST et al., 2008].
An advantage of hot pressing is that the oil is less viscous, proteins are clotting and
largely mucilages and gums are dropped out. Hot pressing is particularly important for
oils, which are more viscous such as SIO. By heat treatment, oils get less viscous and
thus, they can be separated easily from the solid material. Another advantage is that
the oil yield is increased by five to eight%, comparing with cold pressing [KRIST et al.,
2008].
Cold-pressed oils are not refined after pressing and so valuable materials are
preserved and degradation products, which must be removed again from hot-pressed
oils, cannot be found in cold-pressed oils [KRIST et al., 2008].
Disadvantages of cold pressing are that not fat products and residues of pesticides,
heavy metals and polycyclic hydrocarbons can still be present. These oils are not very
heat-stable because of their high content of polyunsaturated fatty acids and so,
19
through heat, harmful decomposition products can arise. Furthermore, cold-pressed
oils turn rancid very easily and thus they have a low shelf-life [KRIST et al., 2008].
An example for cold pressing is the decentralised production of cold pressed vegetable
oil, which creates useful animal feed in form of press cakes. This kind of pressing is
usually used for oil fruits like olives. Low investment costs and low logistical expenses
are advantageous. Also short local transportation distances and stimulation of local
economy are an advantage. The energy consumption with 80 kWh/t seed is relatively
low (six times lower than for industrial extraction). The press cakes have a higher feed
value (12 until 17% oil content) and chemical solvents or thermal conditions of the
seeds are not used [FERCHAU, 2000].
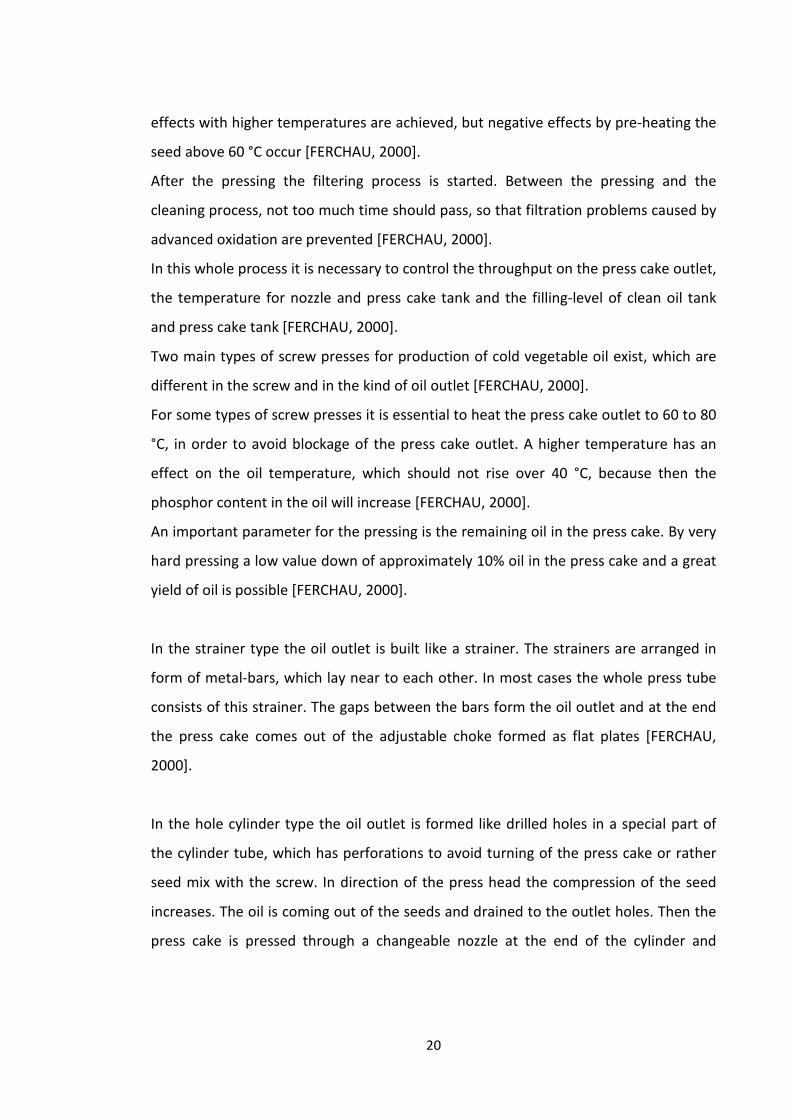
In fig. 2 the process of decentralised cold pressing from the oil seed until to the press
cake or the clean plant oil is shown.
To get a good oil quality, the pre-treatment of the seed is important. A low phosphor
content, the temperature and the humidity of the seeds are important. The phosphor
is a component of the seed that goes into the press cake during cold pressing and not
into the oil. This undesirable content is minimised with reduced seed humidity, the
yield of oil rises and the content of solids in the oil increases then. Higher humidity of
the seed will increase the throughput and decrease the oil yield.
With humidity of the seeds between 6.5 and 7.5%, the capacity, the yield of oil and the
content of phosphor and solids in raw oil is optimized [FERCHAU, 2000].
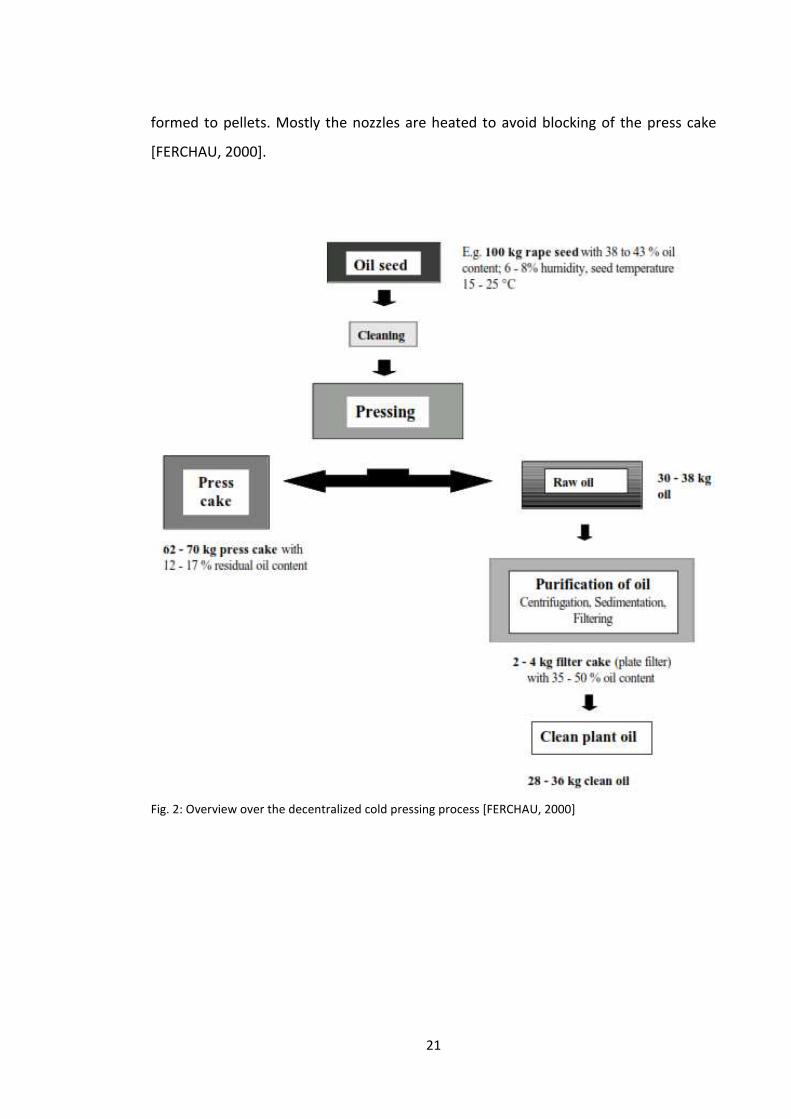
Fig. 3 shows the sketch of a complete cold pressing installation.
A complete oil mill includes a main storage of the seed, which is placed outside or
inside the building. The buffer silo is above the press and inside this silo the seed will
be warmed up to room temperature before falling into the press by gravity.
Subsequently, the cleaning process follows, where the seeds are cleaned from stones,
plant parts or metal pieces. The seed is then pre-warmed to about 20 °C. No positive
20
effects with higher temperatures are achieved, but negative effects by pre-heating the
seed above 60 °C occur [FERCHAU, 2000].
After the pressing the filtering process is started. Between the pressing and the
cleaning process, not too much time should pass, so that filtration problems caused by
advanced oxidation are prevented [FERCHAU, 2000].
In this whole process it is necessary to control the throughput on the press cake outlet,
the temperature for nozzle and press cake tank and the filling-level of clean oil tank
and press cake tank [FERCHAU, 2000].
Two main types of screw presses for production of cold vegetable oil exist, which are
different in the screw and in the kind of oil outlet [FERCHAU, 2000].
For some types of screw presses it is essential to heat the press cake outlet to 60 to 80
°C, in order to avoid blockage of the press cake outlet. A higher temperature has an
effect on the oil temperature, which should not rise over 40 °C, because then the
phosphor content in the oil will increase [FERCHAU, 2000].
An important parameter for the pressing is the remaining oil in the press cake. By very
hard pressing a low value down of approximately 10% oil in the press cake and a great
yield of oil is possible [FERCHAU, 2000].
In the strainer type the oil outlet is built like a strainer. The strainers are arranged in
form of metal-bars, which lay near to each other. In most cases the whole press tube
consists of this strainer. The gaps between the bars form the oil outlet and at the end
the press cake comes out of the adjustable choke formed as flat plates [FERCHAU,
2000].
In the hole cylinder type the oil outlet is formed like drilled holes in a special part of
the cylinder tube, which has perforations to avoid turning of the press cake or rather
seed mix with the screw. In direction of the press head the compression of the seed
increases. The oil is coming out of the seeds and drained to the outlet holes. Then the
press cake is pressed through a changeable nozzle at the end of the cylinder and
21
formed to pellets. Mostly the nozzles are heated to avoid blocking of the press cake
[FERCHAU, 2000].
Fig. 2: Overview over the decentralized cold pressing process [FERCHAU, 2000]
22
Fig. 3: Sketch of a complete cold pressing installation [FERCHAU, 2000]
23
3.2 Solvent extraction
Extraction of the crushed seeds is carried out with the aid of solvents (e.g. hexane,
ether, etc.). Solvent extraction with hexane is the standard practice in today`s modern
processing facilities.
Three relevant steps in solvent extraction take place: seed preparation, oil extraction,
and removal of the solvents from the oil and meal [WANG, 2011].
Seed preparation normally includes drying, cleaning, cracking, optional dehulling or
decortication, conditioning, and optional flaking of the seeds [WANG, 2011].
The advantage of the extraction process is that the yield is higher for the respective oil
than after pressing. However, the solvent needs to be removed from the oil by a
refining process, so that the oil does not differ in flavour from the pressed oil [KRIST et
al., 2008].
Solvent extraction and pressing are also used combined. At first, oil seeds are pressed,
but not completely, and so a high-quality edible oil is obtained. The residual oil is then
extracted from the pomace, but in this way no protein-rich oil cakes are achieved [ROT
und KORMANN, 2000].
3.3 Refining process after hot pressing or solvent extraction
Refined oils are oils, which have been neutralised, deodorised, discoloured and
steamed. These oils are refined by treatment with alkalis, in which the free acids are
bound and by subsequent washing the bound fatty acids are removed. Also with
glycerin oils can be esterified and thereby they can be neutralized [KRIST et al., 2008].
To remove an undesired colour, the respective oils are bleached with solid adsorbents,
such as aluminium silicate or activated carbon. During water vapor distillation, carried
out under vacuum, undesired aroma components are separated [KRIST et al., 2008].
Many important ingredients such as minor components of fat are removed by the
refining process of the oil. But in this process also materials such as pesticide, heavy
metals and mold residues are removed [KRIST et al., 2008].
24
Refined oils generally are largely odourless and tasteless. They have a longer shelf life
and are more heat-stable [KRIST et al., 2008].
3.6 Extruder technology
Already in the mid-30`s first extruded food was found on the market in the USA.
Common products are breakfast cereals, snacks, noodles and sweet products. Also
instant powder (e.g. sauces, baby food or pudding) and meat substitute products on
alternative protein base can be extruded [SCHUCHMANN, 2005].
Various components can be mixed and degassed in an extruder and at the same time
raw materials can be crushed coarsely. In the production of extruded foods, usually
water must be mixed in by the use of a pre-moistener. Afterwards the products are
compressed and by thermal and mechanical energy they are heated to temperatures
above glass transition temperature or even gelatinization- and melting temperature.
This means that they are malleable and possibly (pre)cooked [SCHUCHMANN, 2005].
In cooking extrusion starch is gelatinized or melted and proteins are denatured. At the
same time an extruder can be used as a continuous reactor to inactivate allergenic and
toxic components. This high-temperature short-time process mostly guarantees
process conditions in which essential ingredients are less contaminated. At the same
time the product can be pasteurized or even sterilized. At the end of the process, the
product is pressed through a forming die, whereby it is molded and expanded
depending on process conditions. Thus, an extruder can be used for the production of
dense or porous particle structures. Due to the exceeded boiling point during the
expansion, the extruded pellet is also pre-dried [SCHUCHMANN, 2005].
Because cooking extrusion process is operated at lower water concentrations,
comparing to conventional cooking technology, drying energy can be saved
[SCHUCHMANN, 2005].
In sum, extrusion can provide many functions such as texture alteration, thermal
treatment, partial dehydration, homogenization, protein denaturing, gelatinization,
25
destruction of micro-organisms and some toxic compounds, grinding, hydration,
expansion, shearing, mixing and shaping [RIAZ].
Different kinds of extruder are existing: single screw extruder, twin screw extruder and
some special types like “turbo-extruder” and “multi-screw- or planetary roller
extruder” [SCHUCHMANN, 2005].
Extruder normally consists of a dosing and entering area with a high volume, where
raw materials are not yet compacted and they can be removed quickly. The basic
product mechanical handling is achieved by a screw construction, in which the free
product volume decreases along the screw from the dosing to the nozzle. Dry or pre-
humidified solid raw materials are added in the first casing part and then liquid
ingredients (like water) follow [SCHUCHMANN, 2005].
In the kneading area, the free product volume continues to decrease by decreasing
screw pitch and the product is compacted. In this area, also steam can be injected or it
can be degassed [SCHUCHMANN, 2005].
In the cooking extrusion the boiling zone follows and the product is further
compressed. The product density can reach up to 1800 g/l in front of the nozzle.
[SCHUCHMANN, 2005]. Then, the product is conveyed through the nozzle, formed
there and possibly expanded. In the production of dense pellets, a further forming
zone follows the boiling zone, in which temperature and pressure are reduced, before
the product is forced through the nozzle [SCHUCHMANN, 2005].
3.6.1 Dry extrusion
Dry extruders are single screw machines, normally used for the processing of whole or
ground soybeans, because of the high content of oil in the beans. Heat is generated
through friction to cook and dehydrate the material [RIAZ].
These extruders consist of a delivery system, a preconditioner (optional), an extruder
barrel (with die or nose cone) and a shaping and cutting device (for pellets or for
26
texturized protein). Temperatures up to 135 – 150 °C occur in the extruder barrel due
to heat and pressure. This is necessary to denature the anti-nutritional factors and to
make the oil more stable [RIAZ].
Twin screw extruders can be used variable. They produce a smoother, non-pulsating
flow of product and have better mixing effects and heat transfer. Therefore, they are
found frequently in the production of high quality food [SCHUCHMANN, 2005].
3.6.2 Extrusion-expelling-method
Using dry extrusion as a pre-treatment is also an option for mechanical extraction of oil
(usually applied to soybeans). Extrusion prior to expelling highly increases the
throughput of the expeller. The coupling of dry extrusion with mechanical expelling of
oil from the material, in order to obtain oil and cake for human food, is used. In this
method, the semi-fluid extrudate, obtained by appropriate extrusion conditions,
should be expelled immediately, while the extrudate is still in this condition.
Extrusion is a proper method of tissue disruption and heating by a single step, where
less time is required, comparing to conventional expelling. This high temperature,
short time treatment has a great impact on the retention of the nutritional value of the
products [NELSON et al., 1987].
The expeller is responsible for two functions. On the one hand, it continues to disrupt
the tissues and it releases hot oil within the matrix. On the other hand, it forces the oil
out under pressure [NELSON et al., 1987].
Under the experimental conditions from NELSON et al. (1987), press cake with 50%
protein, 6% residual oil and 90% inactivation of trypsin inhibitors was obtained.
In this way, the low fat cake can be easily ground, without usual problems associated
with milling of whole beans. Another advantage is that the expelled oil is oxidatively
more stable [NELSON et al., 1987].
27
4. Composition of press cakes from selected plants
Press cakes, obtained by cold pressing, are more valuable in residual oil and are
therefore more useful for animal food proposes than press cakes which are obtained
by warm pressing or normal industrial extraction with solvents [FERCHAU, 2000].
The raw press cakes can be used as valuable protein fodder, which is rich in fat. Press
cakes are widely used in agriculture and achieve the highest value when they are used
as animal fodder. For farmers it is important to produce the press cakes by themselves,
to go in the direction of self-supply, self-control and to get an additional income. The
cold pressed cakes of local oil seeds have the potential to replace imported soy bean
meal [FERCHAU, 2000].
Cows, pigs, chicken, sheep and horses are fed with these cakes and by this way they
get important nutrients and energy. The filter cake from plate filters is also a valuable
fodder with an oil content of 35 – 50%. After pressing, the cakes have a temperature of
between 40 and 60 °C and have to be cooled for cold, dark and dry silo-storage
[FERCHAU, 2000].
4.1 Soy
Soybean press cakes are by-products of cold and hot press oil production. By
extrusion-expelling method, using short technological process, the soy press cakes
achieve a composition of 50% protein, 6% residual oil and 90% inactivation of trypsin
inhibitors. Press cakes are mainly used as animal feed and the most important
indicator of anti-nutritional factor destruction for soybean press cake is the urease
enzyme content and activity [NELSON et al., 1987; TUCU and FLESER, 2007]. Soybean
oil is the most valuable plant oil. The protein of soybean contains a considerable
quantity of lysine and the value of protein is limited by the low content of methionine
and cysteine [BANASZKIEWICZ, 2011]. Press cakes also can be utilized in form of meals
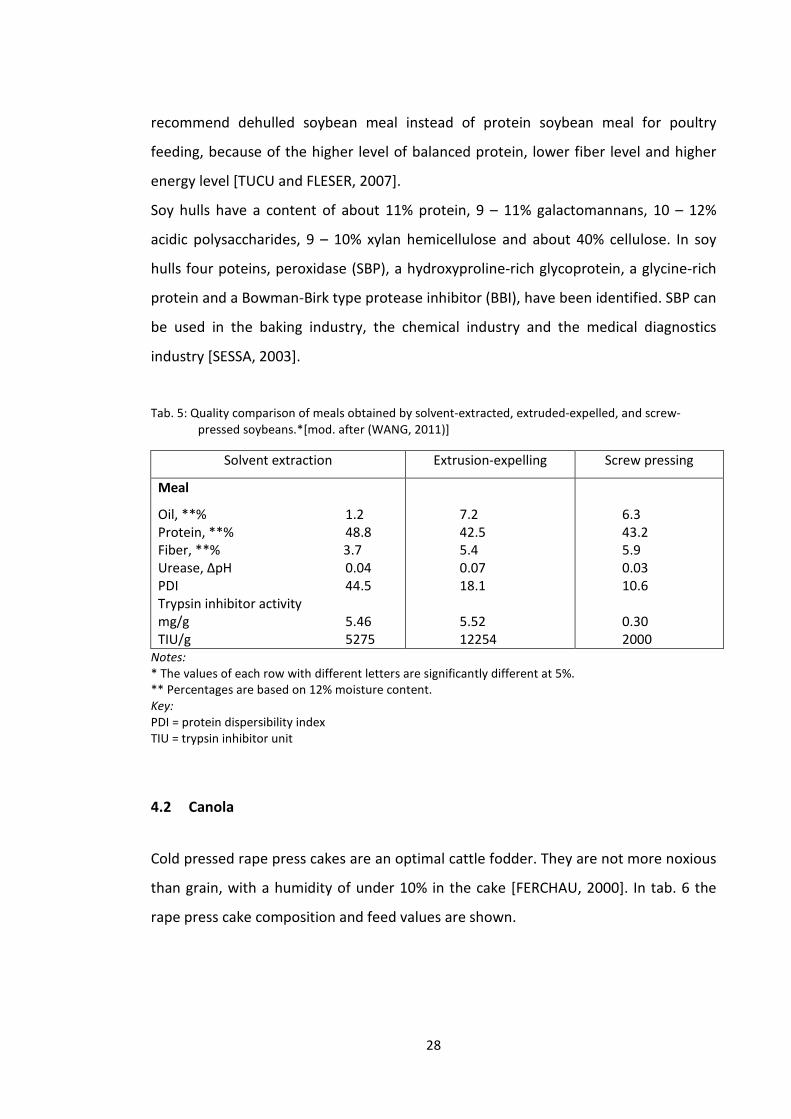
for animal feeding. These meals are mainly used in poultry and pigs nutrition. In tab. 5
the quality of meals obtained by different methods is compared. Many nutritionists
28
recommend dehulled soybean meal instead of protein soybean meal for poultry
feeding, because of the higher level of balanced protein, lower fiber level and higher
energy level [TUCU and FLESER, 2007].
Soy hulls have a content of about 11% protein, 9 – 11% galactomannans, 10 – 12%
acidic polysaccharides, 9 – 10% xylan hemicellulose and about 40% cellulose. In soy
hulls four poteins, peroxidase (SBP), a hydroxyproline-rich glycoprotein, a glycine-rich
protein and a Bowman-Birk type protease inhibitor (BBI), have been identified. SBP can
be used in the baking industry, the chemical industry and the medical diagnostics
industry [SESSA, 2003].
Tab. 5: Quality comparison of meals obtained by solvent-extracted, extruded-expelled, and screw-pressed soybeans.*[mod. after (WANG, 2011)]
Solvent extraction Extrusion-expelling Screw pressing
Meal
Oil, **% 1.2 Protein, **% 48.8 Fiber, **% 3.7 Urease, ∆pH 0.04 PDI 44.5 Trypsin inhibitor activity mg/g 5.46 TIU/g 5275
7.2 42.5 5.4 0.07 18.1 5.52 12254
6.3 43.2 5.9 0.03 10.6
0.30 2000
Notes:
* The values of each row with different letters are significantly different at 5%. ** Percentages are based on 12% moisture content. Key:
PDI = protein dispersibility index TIU = trypsin inhibitor unit
4.2 Canola
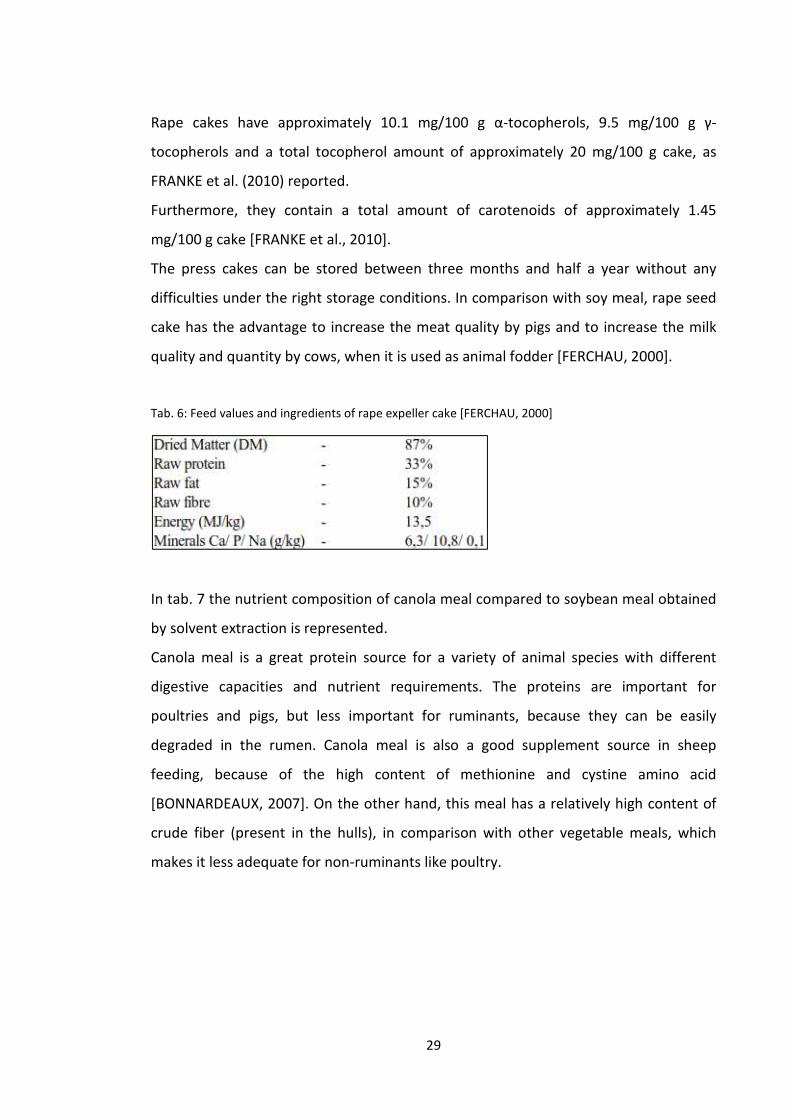
Cold pressed rape press cakes are an optimal cattle fodder. They are not more noxious
than grain, with a humidity of under 10% in the cake [FERCHAU, 2000]. In tab. 6 the
rape press cake composition and feed values are shown.
29
Rape cakes have approximately 10.1 mg/100 g α-tocopherols, 9.5 mg/100 g γ-
tocopherols and a total tocopherol amount of approximately 20 mg/100 g cake, as
FRANKE et al. (2010) reported.
Furthermore, they contain a total amount of carotenoids of approximately 1.45
mg/100 g cake [FRANKE et al., 2010].
The press cakes can be stored between three months and half a year without any
difficulties under the right storage conditions. In comparison with soy meal, rape seed
cake has the advantage to increase the meat quality by pigs and to increase the milk
quality and quantity by cows, when it is used as animal fodder [FERCHAU, 2000].
Tab. 6: Feed values and ingredients of rape expeller cake [FERCHAU, 2000]
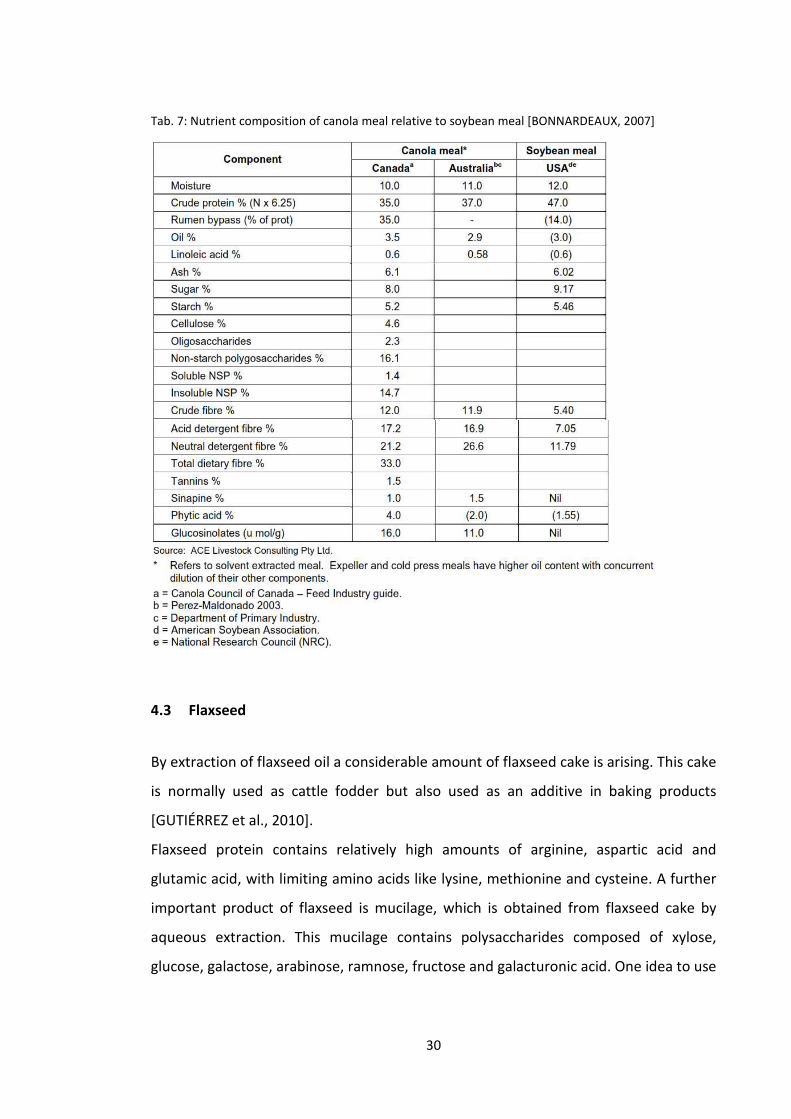
In tab. 7 the nutrient composition of canola meal compared to soybean meal obtained
by solvent extraction is represented.
Canola meal is a great protein source for a variety of animal species with different
digestive capacities and nutrient requirements. The proteins are important for
poultries and pigs, but less important for ruminants, because they can be easily
degraded in the rumen. Canola meal is also a good supplement source in sheep
feeding, because of the high content of methionine and cystine amino acid
[BONNARDEAUX, 2007]. On the other hand, this meal has a relatively high content of
crude fiber (present in the hulls), in comparison with other vegetable meals, which
makes it less adequate for non-ruminants like poultry.
30
Tab. 7: Nutrient composition of canola meal relative to soybean meal [BONNARDEAUX, 2007]
4.3 Flaxseed
By extraction of flaxseed oil a considerable amount of flaxseed cake is arising. This cake
is normally used as cattle fodder but also used as an additive in baking products
[GUTIÉRREZ et al., 2010].
Flaxseed protein contains relatively high amounts of arginine, aspartic acid and
glutamic acid, with limiting amino acids like lysine, methionine and cysteine. A further
important product of flaxseed is mucilage, which is obtained from flaxseed cake by
aqueous extraction. This mucilage contains polysaccharides composed of xylose,
glucose, galactose, arabinose, ramnose, fructose and galacturonic acid. One idea to use
31
flaxseed polysaccharides is to substitute chemical additives for food conservation
[GUTIÉRREZ et al., 2010].
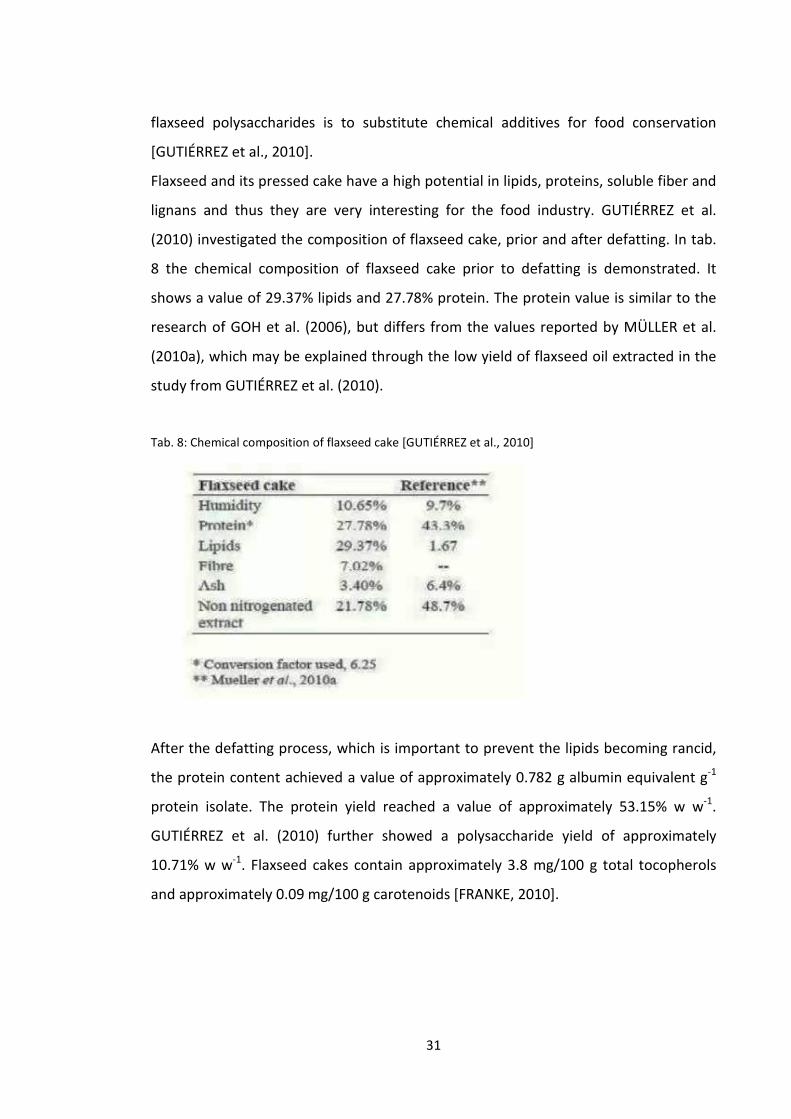
Flaxseed and its pressed cake have a high potential in lipids, proteins, soluble fiber and
lignans and thus they are very interesting for the food industry. GUTIÉRREZ et al.
(2010) investigated the composition of flaxseed cake, prior and after defatting. In tab.
8 the chemical composition of flaxseed cake prior to defatting is demonstrated. It
shows a value of 29.37% lipids and 27.78% protein. The protein value is similar to the
research of GOH et al. (2006), but differs from the values reported by MÜLLER et al.
(2010a), which may be explained through the low yield of flaxseed oil extracted in the
study from GUTIÉRREZ et al. (2010).
Tab. 8: Chemical composition of flaxseed cake [GUTIÉRREZ et al., 2010]
After the defatting process, which is important to prevent the lipids becoming rancid,
the protein content achieved a value of approximately 0.782 g albumin equivalent g-1
protein isolate. The protein yield reached a value of approximately 53.15% w w-1.
GUTIÉRREZ et al. (2010) further showed a polysaccharide yield of approximately
10.71% w w-1. Flaxseed cakes contain approximately 3.8 mg/100 g total tocopherols
and approximately 0.09 mg/100 g carotenoids [FRANKE, 2010].
32
4.4 Peanut
According to a study by RIAZ and CHEEWAPRAMONG (2009), approximately 50% of the
original oil in the peanuts could be removed by dry extrusion. In this study, extrudates
were pressed immediately after extrusion by using a continuous screw press. After
that, the peanut press cakes had a composition of 8% oil, 47% protein and 6%
moisture. The protein dispersibility index (PDI) dropped to 66% in the extrudates and
press cakes through heat treatment during extrusion and pressing. The heat treatment
did not affect the reaction of the trypsin inhibitor, but 26% of the trypsin inhibitor
activity in the press cakes was destroyed only by dry extrusion and screw pressing
[RIAZ and CHEEWAPRAMONG, 2009].
If aflatoxin can be kept away from the press cake, the cakes may be used for animal
feed or ground into flour for human consumption. When they are unacceptable, they
are used as fertilizer [DEAN et al., 2011].
4.5 Sunflower
Sunflower press cake is a high-protein source, obtained after pressing of sunflower oil
by cold extraction. It is used in the production of combined fodders with a great
feeding value, which makes it possible to introduce a smaller amount of press cake
into combined fodder. The quality of proteins is rather higher than the quality of grain
crops and with a fat content of seven to 10% (up to 15%) it has high feeding and
energetic value. Sunflower press cake has a raw protein content of up to 38% and a
raw fiber content of up to 18% [ANONYM, 2010]. Furthermore, it has a high content of
vitamin E, 8.3 mg/100 g α-tocopherol and 0.5 mg/100 g β-tocopherol, high content of
phospholipids, vitamins of group B and β-carotene [FRANKE, 2010].
33
5. Food uses of press cakes and hulls
Consumers are becoming more and more interested in healthful foods and are open to
new ingredients, such as press cakes and hulls in form of flours, grits, protein
concentrates or textured proteins. This chapter gives an overview of various food uses
of by-products from different plants.
5.1 Soy
The supplement industry is increasingly using commercial ingredients from soy, in form
of capsules and tablets and the functional foods industry is using these ingredients for
manufacturing bars, bread, crisp bread, breakfast cereals, dairy products and
beverages. Soy bean proteins are used in many different forms in human foods, such
as infant formulas, flours, protein isolates and concentrates and textured fibers. Soy
protein is highly digestible and contains all essential amino acids for human nutrition.
When soy proteins are utilized in combination with other protein sources, such as
meat, milk or cereal grains (with most applications for defatted soy flours and grits),
they have benefical effects on human nutrition and health, like prevention of cancer,
diabetes and obesity [SINGH et al., 2008].
Studies showed, when using beef, fish and 50:50 mixtures of beef, fish or milk and soy
protein isolate, the values for the three animal-soy protein mixtures are equal with
those of the all-beef or fish controls [SINGH et al., 2008].
Untextured, full-fat soy flours and grits are used as a source material for soymilk, tofu
and other special foods and the toasted soy flour is preferred in ground meats,
cookies, crackers and cereal applications, as well as in milk replacers and fermentation
media. Types, which are more dispersible, are used in bakery products like bread,
cakes, doughnuts or pancakes. Defatted soy flours are mainly used in bakery
applications and sweet goods. With a concentration of 1 to 3% of defatted soy flour in
bread or buns, absorption increases, crumb body and resiliency improves, crust colour
enhances and toasting characteristics improve. The soluble versions are used largely in
34
pancake and cake mixes. Powdered soy protein concentrates, which have much
improved flavour characteristics, compared to usual soy flours, are used in emulsion-
type meat products, bakery products, nutritional powder drinks, soup bases, baby
foods, cereals, dry food mixes, milk replacers, pet foods and snacks. Soy protein
isolates have emulsifying and emulsion stabilizing properties, they are really good
binders of fat and water and are good adhesive agents and because of all these
functions, they are used in processed meat products, in patties, loaves and sausages.
Textured soy protein products such as meat-like products, are an excellent alternative
to meat. They are formed mainly by thermoplastic extrusion of defatted soy flour or
soy protein concentrates derived from solvent extraction of soybeans. By using a
continuous increase in barrel temperature and screw speed of a single-screw
laboratory scale extruder, the expansion, water absorption index, water hydration
capacity and hardness of the extruded products, increase. And with higher barrel
temperature and higher screws speeds, the highest specific volume was found in a
study from RUEDA et al. (2004). Examples of textured or structured soy protein
products are beef patties, sausages, chili, pizza toppings, taco fillings, meatloaf mixes,
frozen dinners, vegetarian foods, hot snacks and canned minced hams [SINGH et al.,
2008].
A study from ALVAREZ et al. (2012) investigated the addition of soy protein isolate on
viscoelastic properties, large deformation measurements and microstructure of
mashed potatoes, which could be useful for technological applications in soy protein
isolate-enriched mashed potatoes.
5.2 Flaxseed
A study researched a flaxseed oil cake from a South African factory. Dietary fiber had
emerged as the main carbohydrate in the cake and calcium, magnesium, phosphorus
and potassium were found. An amount of 58.5 to 59.7% of omega-3 fatty acids from
the oil in the press cake was measured and also after six months storage at 20 °C,
peroxide levels were under the threshold limits. Bread samples, which included 10 and
35
15% of this flaxseed oil cake, contained between 38 and 47.3% protein, 12.8 and 26.1%
crude fat and 3.7 and 5.1% ash [OGUNRONBI et al., 2011].
This product would be excellent for an application in brown bread and flaxseed oil
industries, also represented by the acceptance of the consumer sensory panel in this
study [OGUNRONBI et al., 2011].
Another study investigated the application of bioactive substances from flaxseed to
increase the nutritional value of wheat bread. They identified the defatted flaxseed as
the most valuable product from nutritional point of view in the bread samples. The
test showed also, that the best quality obtained the samples of bread produced with
roasted flaxseed and the samples produced with dried flaxseed had the same quality
as the control. When they used additives of defatted flaxseed, the quality of bread was
less good than the control. They significantly improved the taste and texture
properties of bread crumb by using defatted flaxseed in granules [ZEMDIRBYSTE,
2009].
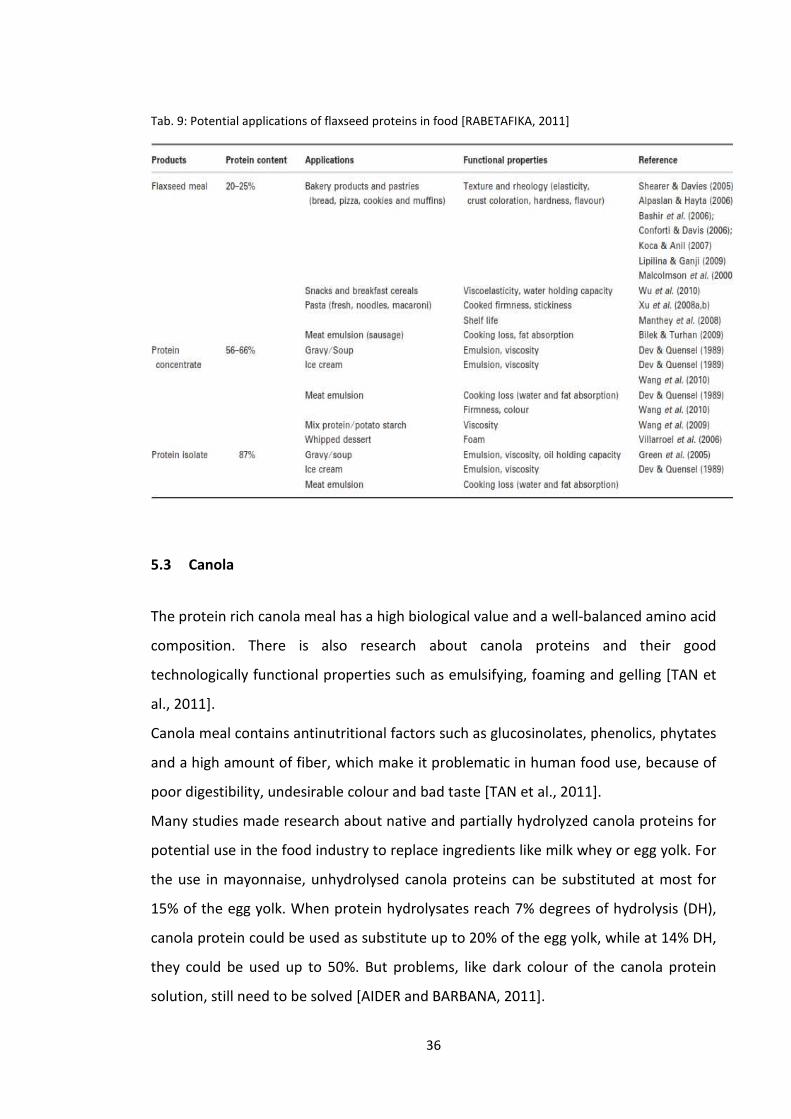
Flaxseed proteins are used as techno-functional ingredients in many food formulations
such as bakery products, pastries, meat emulsions, sauces or ice creams. In tab. 9
potential applications of flaxseed proteins in foods are listed. To increase the
nutritional value of gluten-free products, flaxseed meal can be used as addition. By
adding flaxseed meal to snacks and breakfast cereals extruded products, the
viscoelasticity of extruded pastes can be increased. Because of the antifungal
properties of flaxseed proteins, the shelf-life in fresh pasta and macaroni is improved,
when adding up to 15% of flaxseed meal. Flaxseed proteins are also used as emulsifier
and stabilizer in ice creams, sauces and meat emulsions [RABETAFIKA, 2011].
In meat emulsion products, some parameters such as appearance, flavour, tenderness
and juiciness are affected negative by adding flaxseed meal and because of this, a
maximum concentration of 6% of flaxseed meal is tolerated by the consumer panel.
But generally, flaxseed proteins have positive effects on flax-based products and do
not influence sensory properties [RABETAFIKA, 2011].
36
Tab. 9: Potential applications of flaxseed proteins in food [RABETAFIKA, 2011]
5.3 Canola
The protein rich canola meal has a high biological value and a well-balanced amino acid
composition. There is also research about canola proteins and their good
technologically functional properties such as emulsifying, foaming and gelling [TAN et
al., 2011].
Canola meal contains antinutritional factors such as glucosinolates, phenolics, phytates
and a high amount of fiber, which make it problematic in human food use, because of
poor digestibility, undesirable colour and bad taste [TAN et al., 2011].
Many studies made research about native and partially hydrolyzed canola proteins for
potential use in the food industry to replace ingredients like milk whey or egg yolk. For
the use in mayonnaise, unhydrolysed canola proteins can be substituted at most for
15% of the egg yolk. When protein hydrolysates reach 7% degrees of hydrolysis (DH),
canola protein could be used as substitute up to 20% of the egg yolk, while at 14% DH,
they could be used up to 50%. But problems, like dark colour of the canola protein
solution, still need to be solved [AIDER and BARBANA, 2011].
37
Canola protein hydrolysates were also studied as a potential ingredient in meat
formulations. They are effective in enhancing the water holding capacity and cooking
yield. In another study a canola protein concentrate was used as addition to replace
casein in a sausage formulation and this resulted in improved taste, good texture and
characteristic aroma. Furthermore, a study reported the generation of meat-like
flavourings from canola. In this case, the control of pH and temperature was very
important during the generation of flavouring. The best results were reached at 160 °C
and pH 4.0 [AIDER and BARBANA, 2011].
5.4 Peanut
Peanut belongs to one of the most important oil and protein producing crops in the
world. The variety of by-products, which contain functional compounds such as
proteins, fiber and polyphenolics are amazing. The by-products are produced from
crush peanut processes and harvested peanut, including peanut meal, skin, hull and
vine [ZHAO et al., 2011].
Products, which are used all over the world, are boiled peanuts, roasted full-fat or
partially defatted peanuts, peanut butter, grits, flours, defatted peanuts, protein
concentrates and protein isolates. There are many food applications such as fortified
breads, bakery products, snacks, meat products, extended milks, cheese and curd type
products [LUSAS, 1979].
5.5 Sunflower
A study from ROSSI (1988) showed, that ground-beef patties replacing 15%, 30% and
45% of their meat content with textured sunflower meal, had higher juice retention
than only the all-beef samples. The chewiness decreased with higher percentage of
substitution. Regarding the overall quality, no significant difference was researched
between the all-meat samples and the blended patties containing 15% and 30%
rehydrated sunflower extrudate.
38
Another study from SALGADO et al. (2012) researched the functional properties of
sunflower protein concentrates with different content of phenolic compounds. They
obtained these concentrates from sunflower oil cake. The concentrates showed high
water solubility and moderate water-holding capacities. Foams and emulsions of
different stability at different pH and self-supporting gels produced by thermal
induction, were obtained. Phenolic compounds were not only responsible for
antioxidant activity and changing colour of the protein products, they also reduced the
stability of the emulsion and the hardness of protein gels. But they did not influence
the water holding capacity, the water solubility or the foaming properties and because
of this, sunflower protein products may be used as functional ingredients in foods
[SALGADO et al., 2012].
39
6. Task-setting
At the beginning of this work a comprehensive literature research was carried out.
The task was to analyse the chemical composition (fat, protein, starch, glucose, ash,
water, dietary fibre, soluble and insoluble dietary fibre, resistant starch, total phenols)
and functional properties (water absorption index and water solubility index, viscosity,
protein solubility) of the flour, press cakes, seeds and hulls of Sacha Inchi.
The development of new products should be proposed on the basis of Sacha Inchi hulls
and additionally, a formulation of a dietary supplement, produced from the protein-
rich press cakes of Sacha Inchi, should be produced. Because of the chemical analyses,
the hulls were not used in the production of new products.
Furthermore, in order to shorten the industrial oil- and protein extraction time, the
extrusion-expelling-technology of Sacha Inchi is aimed to be optimised and
standardised. In the course of the master`s thesis, this could not be performed,
because there was no option to use extrusion-expelling technology.
40
7. Materials and methods
7.1 Raw materials
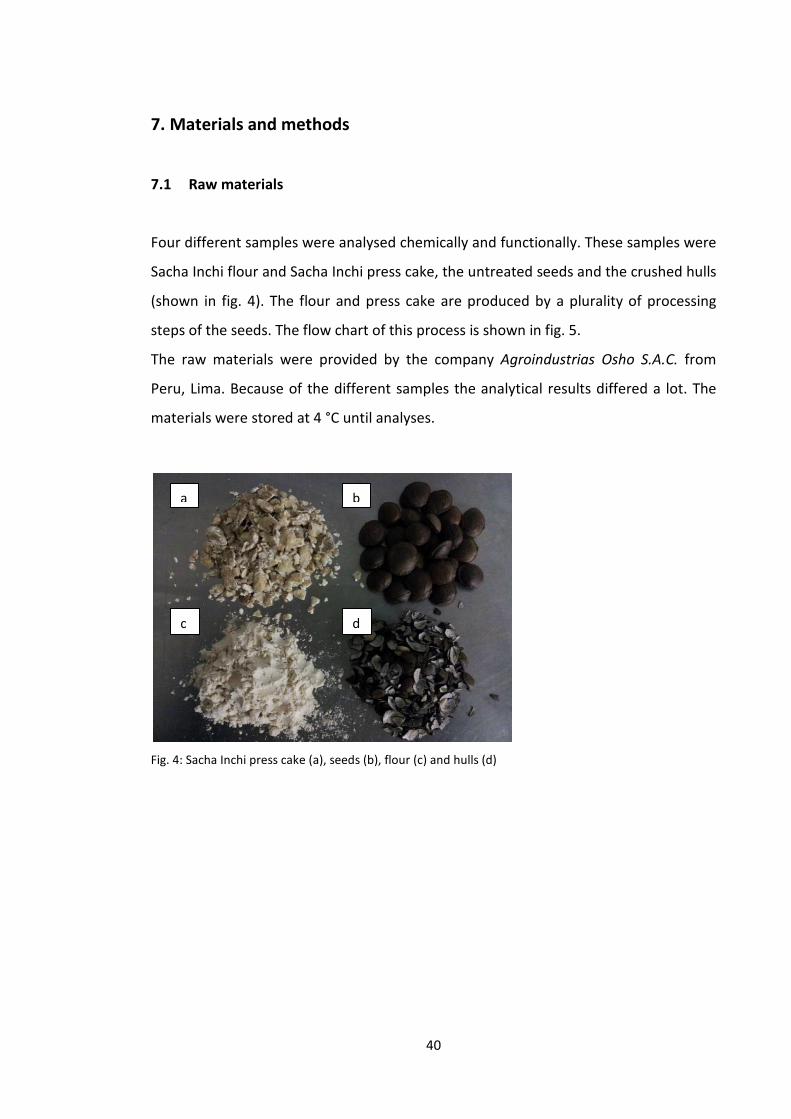
Four different samples were analysed chemically and functionally. These samples were
Sacha Inchi flour and Sacha Inchi press cake, the untreated seeds and the crushed hulls
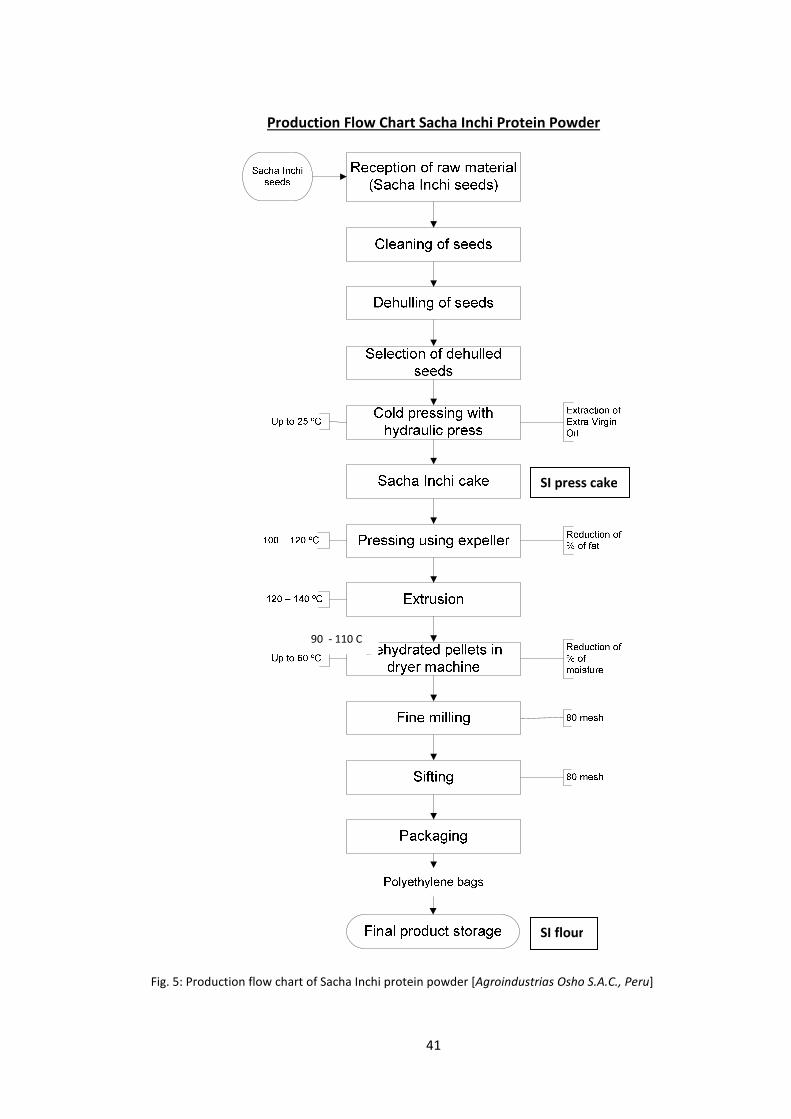
(shown in fig. 4). The flour and press cake are produced by a plurality of processing
steps of the seeds. The flow chart of this process is shown in fig. 5.
The raw materials were provided by the company Agroindustrias Osho S.A.C. from
Peru, Lima. Because of the different samples the analytical results differed a lot. The
materials were stored at 4 °C until analyses.
Fig. 4: Sacha Inchi press cake (a), seeds (b), flour (c) and hulls (d)
a b
c d
41
Production Flow Chart Sacha Inchi Protein Powder
Fig. 5: Production flow chart of Sacha Inchi protein powder [Agroindustrias Osho S.A.C., Peru]
90 - 110 C
SI press cake
SI flour
42
7.2 Preparation of samples
The flour did not have to be prepared, it was homogenous enough. The press cake and
hulls were pre-milled in a commercial blender and then milled to powder in a knife mill
(250 µm). Also the whole seeds were pre-milled in a commercial blender, but they
could not be milled in a knife mill, because of the high fat content. So, after pre-milling
they were milled in a grinder and this was the reason for the more granular sample, in
comparison to the others.
Equipment
• Commercial blender (Gollnow, Germany, Type: MX5010, No. 796222)
• Knife mill (Retsch Ges.m.b.H and Co KG, Germany, Type: ZM100 (sieve insert
250 µm))
• Grinder (DeLonghi GmbH, Type: KG40, Ser.Nr. 23120S900058)
7.3 Methods of examination
7.3.1 Determination of the dry matter (dm)
7.3.1.1 Principle
The dry matter is the sum of all non-volatile components in a food, such as lipids,
carbohydrates, proteins and minerals. The mass loss of the sample is determined by
drying to constant weight in a drying oven at 105 °C.
7.3.1.2 Equipment and materials
• Analytical balance, accuracy: ± 0.1 mg (Sartorius AG, Germany, BP210S)
• Drying oven 105 °C (Loading Modell 100 - 800, Memmert GmbH & Co. KG,
Germany)
43
• Desiccator with silica gel
• Aluminium dishes (310033)
• Spoon
7.3.1.3 Procedure
The tare of the pre-dried aluminium dishes was determined and about 3 to 4 g of each
of the four samples were weighed into the dishes (triple determination). In the drying
oven the prepared samples were dried at 105 °C to constant weight (overnight). After
drying, the dishes were removed carefully from the drying oven and placed in a
desiccator to cool to room temperature and finally, they were weighed.
7.3.1.4 Calculation
The dry matter was calculated according to eq. 1.
���������[%] = ����������[�]���������[�]�������������[�] * 100
(Eq. 1)
7.3.2 Determination of the ash content
7.3.2.1 Principle
The mineral residue of combustion is called ash. By direct incineration a complete
destruction of the organic substances occur. The amount of the ash is then related to
the dry substance.
44
7.3.2.2 Equipment and materials
• Analytical balance, accuracy: ± 0.1 mg (Sartorius AG, Germany, BP210S)
• Desiccator with silica gel
• Muffle furnace (Carbolite, England, Type: 11/6B)
• Porcelain crucible
• Rapid incinerator (Type: SVR/E, Fab.No. 158296, 220 V, 2500 W)
• Crucible tongs
• Gloves
• Spoon
7.3.2.3 Procedure
First, the porcelain crucible were annealed in the muffle furnace at 700 °C for 1 h,
cooled again in the desiccator and weighed. About 2 g of each sample was weighed
into the porcelain crucible (triple determination).
The crucibles were pre-incinerated in the rapid incineration until no more smoke
occurred and the colour of the samples had changed to grey. Then, the samples were
annealed in the muffle furnace at 700 °C until the constant weight is reached and the
colour of the samples had changed to light grey or white.
Consequently, the samples were cooled in the desiccator, weighed and finally, the ash
was calculated according to eq. 2.
7.3.2.4 Calculation
��ℎ[%] = ����������[�]�������� ����� �! �"��[�]�������������[�] * 100
(Eq. 2)
45
The ash in the dry matter was calculated according to eq. 3.
��ℎ#$%�[%] = ash[%] ∗ 100dm[%]
(Eq. 3)
7.3.3 Determination of the protein content
7.3.3.1 Principle
The protein content was determined using the total nitrogen determination according
to Kjeldahl. The nitrogen content of the proteins is varying only a little and thus, for
analytical detection of the total- and crude protein content, the nitrogen percentage
after digestion of the organic matter with sulfuric acid is determined. By means of a
factor, the protein content is calculated. The weighed sample is digested in a Kjeldahl
flask, while the organic components of the sample are removed and the nitrogen is
converted into ammonium sulfate.
R-NH2 + H2SO4�(NH4)2SO4 + R-H
By addition of a strong base, ammoniac is released from the solution, which is driven
with water vapor into a boric acid solution.
(NH4)2SO4 + 2 NaOH � NH3 + Na2SO4 + H2O
This is followed by titration with hydrochloric acid solution.
NH3 + HCl +H2O � NH4Cl + H3O+
7.3.3.2 Equipment and materials
• Analytical balance, accuracy: ± 0.1 mg (Sartorius AG, Germany, BP210S)
46
• Digestion system (BÜCHI Labortechnik AG, Switzerland, Type K-437, Fab.No.
05000000345)
• Scrubber (BÜCHI Labortechnik AG, Switzerland, Type B-414, Fab.No.
1000005531)
• Distillation apparatus (BÜCHI Labortechnik AG, Switzerland, Type KjelFlex K-
360, Fab.No. 0900000061)
• Titrator (Metrohm AG, Switzerland, Type 775 Dosimat, SN: 1.775.0010)
• EM dispenser (Hirschmann Laborgeräte GmbH & Co. KG, Germany)
• Dispenser for H2SO4 (Bibby Sterilin Ltd. 10-60 ml)
• Kjeldahl flasks
• Erlenmeyer flasks
• Plastic cups
• Glass beads
• Gloves
• Spatula
7.3.3.3 Chemicals and reagents
• Sodium hydroxide 32% (pure, Carl Roth GmbH, Germany)
• Indicator (mixed indicator according to SHER, Part No. 003512, BÜCHI
Labortechnik AG, Switzerland)
• Hydrochloric acid 0.1 mol/l (Tritisol, No. 1.09973.0001, Merck, Germany)
• Kjeldahl tablets (BÜCHI Labortechnik AG, Switzerland, Tablets Missouri)
• Boric acid 99.8% (No. 9643.1, Merck KGaA, Germany)
• Sulphuric acid 95/98% (chemically pure, No. 20685.364, VWR, France)
47
7.3.3.4 Procedure
Approximately 2 g ± 0.1 mg of each sample were weighed using plastic cups and
reweighed into the Kjeldahl flasks (triple determination). Two Kjeldahl tablets and one
glass bead were added to each sample. Then, 20 ml sulphuric acid was added to each
Kjeldahl flask and the flasks were put into the digestion system. The samples were
heated slowly and gradually from 150 °C up to 420 °C (1 h at 420 °C). The digestion was
carried out until a clear solution was arising.
Distillation
The digestion was distilled after addition of 40 ml water, 60 ml sodium hydroxide
and 20 ml boric acid. A few drops of indicator were given to each Erlenmeyer
flask. During distillation the liquid turned from green to blue.
Titration
After distillation, the water vapor distillate contained ammoniac (alkaline) and
the titration was conducted with 0.1 molar hydrochloric acid.
From the titration amount the percentage of nitrogen and the percentage of
protein were calculated according to eq. 4 and 5.
7.3.3.5 Calculation
.�/��#$[%] = 012345678129:;[5;]∗<=.??@5A⋰551;∗?,<551;⋰5;∗<??��D���[�]∗<??? * F
(Eq. 4)
1 ml 0.1 Molar hydrochloric acid corresponds to 0.1 mmol respectively 1.4 mg nitrogen (molecular mass:
14 g). So, if 10 ml are titrated, it would correspond to 14 g nitrogen.
Concentration HCl = 0.1 mmol/ml
F = Factor 6.25
.�/��#$#$%�[%] =Protein [%] * <??
�D[%]
(Eq. 5)
48
7.3.4 Determination of the fat content
7.3.4.1 Principle
During the determination of fat according to Soxhlet, the fat is dissolved with a
suitable solvent, isolated and weighed. By this method, the total fat amount is
determined.
7.3.4.2 Equipment and materials
• Analytical balance, accuracy: ± 0.1 mg (Sartorius AG, Germany, BP210S)
• Heating mantle 250 ml (Horst GmbH, Germany)
• Drying oven 105 °C (Loading Modell 100 - 800, Memmert GmbH & Co. KG,
Germany)
• Desiccator with silica gel
• Extraction thimble (VWR, Whatman, UK)
• Round bottom flasks
• Soxhlet extractor (Omnilab GmbH & Co. KG, Germany, Food Alyt RS 60)
• Cotton wool (Rauscher GmbH & Co. KG, Austria)
• Glass beads
• Spoon
• Scale
7.3.4.3 Chemicals and reagents
• Petroleum spirit (Carl Roth GmbH, Germany, Art.-Nr.: CP44.3)
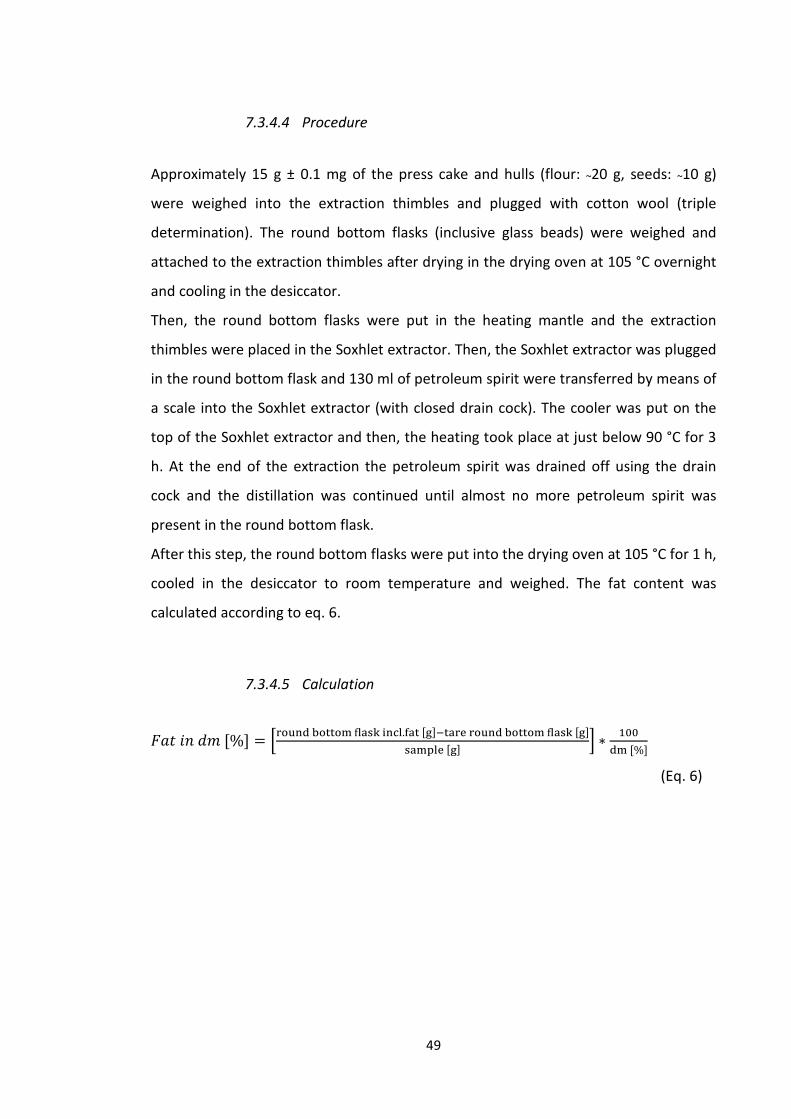
49
7.3.4.4 Procedure
Approximately 15 g ± 0.1 mg of the press cake and hulls (flour: ~20 g, seeds: ~10 g)
were weighed into the extraction thimbles and plugged with cotton wool (triple
determination). The round bottom flasks (inclusive glass beads) were weighed and
attached to the extraction thimbles after drying in the drying oven at 105 °C overnight
and cooling in the desiccator.
Then, the round bottom flasks were put in the heating mantle and the extraction
thimbles were placed in the Soxhlet extractor. Then, the Soxhlet extractor was plugged
in the round bottom flask and 130 ml of petroleum spirit were transferred by means of
a scale into the Soxhlet extractor (with closed drain cock). The cooler was put on the
top of the Soxhlet extractor and then, the heating took place at just below 90 °C for 3
h. At the end of the extraction the petroleum spirit was drained off using the drain
cock and the distillation was continued until almost no more petroleum spirit was
present in the round bottom flask.
After this step, the round bottom flasks were put into the drying oven at 105 °C for 1 h,
cooled in the desiccator to room temperature and weighed. The fat content was
calculated according to eq. 6.
7.3.4.5 Calculation
E��#$%�[%] = F��!��"����D ���G�� �.H��[�]�������!��"����D ���G[�]��D���[�] I ∗ <??
�D[%]
(Eq. 6)
50
7.3.5 Determination of the total starch content (Megazyme Kit,
Amyloglucosidase/α-Amylase Method, K-TSTA 07/11)
7.3.5.1 Principle
The assay is specific for α-glucans (including starch, glycogen, phytoglycogen and non-
resistant maltodextrins).
Thermostable α-amylase hydrolyses starch into soluble maltodextrins (branched and
unbranched).
Starch + H2O ----α-Amylase, pH 7.0 or 5.0, 100 °C----� maltodextrins
Amyloglucosidase (AMG) quantitatively hydrolyses maltodextrins to D-glucose.
Maltodextrins ----AMG----� D-glucose
D-glucose is oxidized to D-gluconate with the release of one mole of hydrogen
peroxide (H2O2) which is quantitatively measured in a colourimetric reaction
employing peroxidase and the production of a quinoneimine dye.
D-glucose + 02 +H20 ----glucose oxidase---� D-gluconate + H202
2 H202 + p-hydroxybenzoic acid + 4-aminoantipyrine ----peroxidase--� quinoneimine dye
+ 4 H20
7.3.5.2 Equipment and materials
• Analytical balance, accuracy: ± 0.1 mg (Sartorius AG, Germany, BP210S)
• Spectrophotometer (Hitachi U-1100, Japan, Part.No. 118-0312)
• Glass test tubes (round bottomed, 16 * 120 mm)
• Pipettors (Eppendorf AG, 100 µl, 1000 µl, 5000 µl)
• Thermostated water bath (set at 50 °C, Haake D8, Germany, Type: 000-5584,
No. 882403)
51
• Boiling water bath (Company for laboratory techniques, Germany, Type: 1031,
No. 10565493e)
• Centrifuge (Eppendorf AG, Germany, Type: Centrifuge 5810 R)
• Volumetric flasks (100 ml)
• Vortex mixer (Janke & Kunkel, IKA-Laborbedarf, Labor partner, Vienna)
• Macro-cuvettes (10x10x45, Greiner Bio-One GmbH, Item No. 614101)
• Stop clock
• Spatula
7.3.5.3 Chemicals and reagents
• Ethanol 78% (diluted, Agrar-Alkohol, Vienna, UN1170, C-K25V)
• Thermostable α-amylase (Megazyme Kit, Total starch)
• Sodium acetate buffer (100 mM, pH 5.0)
• Amyloglucosidase (Megazyme Kit, Total starch)
• GOPOD reagent (Glucose Determination Reagent)
• D-glucose standard solution (1 mg/ml, Megazyme Kit, Total starch)
7.3.5.4 Procedure
Approximately 100 mg ± 0.1 mg of each sample were weighed into glass test tubes
(triple determination) and 0.2 ml of aqueous ethanol (78%) was added to each tube to
wet the sample and aid dispersion. The tubes were stirred on a vortex mixer.
Immediately 3 ml of thermostable α-amylase (diluted 1:30 in 100 mM sodium acetate
buffer, pH 5.0) were added. Then, the tubes were incubated in a bowling water bath
for 6 min (vigorously stirring all 2 min). Accordingly, the tubes were placed in a water
bath at 50 °C, 0.1 ml amyloglucosidase was added and then, the tubes were stirred and
incubated at 50 °C for 30 min. Subsequent, the entire contents of the test tube were
transferred to a 100 ml volumetric flask (tubes were rinsed with distilled water),
adjusted with distilled water and mixed. Then, an aliquot of the solution was
52
centrifuged at 3.000 rpm for 10 min and 0.1 µl of the clear, undiluted filtrate (duplicate
aliquot) was transferred to the bottom of a glass test tube. Then, 3 ml of GOPOD
reagent were added to each tube and incubated at 50 °C for 20 min.
Preparation of D-glucose control and reagent blank solution:
D-glucose control: 0.1 ml of D-glucose standard solution (1 mg/ml) and 3.0 ml of
GOPOD Reagent.
Reagent blank solution: 0.1 ml of water and 3.0 ml of GOPOD
The samples were transferred into macro-cuvettes and for each sample (including D-
glucose control) the absorbance at 510 nm was read against the reagent blank. The
starch content was calculated according to eq. 7.
7.3.5.5 Calculation
J���Kℎ#$%�[%] = L∆A ∗ F ∗ FV0.1 ∗ 1
1000 ∗ 100Q ∗ 0.9S ∗ 100%�[%]
(Eq. 7)
∆A = absorptionsample − blank
F = 100/glucose-control - blank
FV = final volume (100 ml)
0.1 = volume of sample analysed
1/1000 = conversion of sample analysed
100/W = factor to express “starch” as a percentage of sample weight [mg]
0.9 = 162/180 (adjustment from free D-glucose to anhydro D-glucose)
53
7.3.6 Determination of the resistant starch content (Megazyme Kit, Resistant
Starch, K-RSTAR 08/11)
7.3.6.1 Principle
The two enzymes, α-amylase and amyloglucosidase (AMG), solubilise and hydrolyse
non-resistant starch to D-glucose during incubating the samples in a shaking water
bath for 16 h at 37 °C. By addition of ethanol the reaction is terminated and the
resistant starch (RS) is recovered as a pellet on centrifugation. Then, this is washed two
times by suspension in aqueous ethanol and after this step, centrifugation follows.
Free liquid is removed and RS in the pellet is dissolved in 2 M KOH by vigorously
stirring in an ice-water bath. The obtained solution is neutralised with acetate buffer
and with AMG the starch is quantitatively hydrolysed to glucose. D-glucose is
measured with glucose oxidase/peroxidase reagent (GOPOD), which is a measure of
the RS content. The non-resistant starch is determined by pooling the original
supernatant and the washings, adjusting the volume to 100 ml and measuring the D-
glucose content with GOPOD.
7.3.6.2 Equipment and materials
• Analytical balance, accuracy: ± 0.1 mg (Sartorius AG, Germany, BP210S)
• Centrifuge (Eppendorf AG, Germany, Type: Centrifuge 5810 R)
• Spectrophotometer (Hitachi U-1100, Japan, PartNo. 118-0312)
• Vortex mixer (Janke & Kunkel, IKA-Laborbedarf, Labor partner, Vienna)
• Tube rotator for reaction tubes (VWR International, Belgium)
• Tubes - screw cap (50 ml, 15 ml, Greiner Bio-One GmbH, Cat.No. 227261)
• Pipettors (Eppendorf AG, 100 µl, 1000 µl, 5000 µl)
• Thermostated water bath (set at 50 °C, Haake D8, Germany, Type: 000-5584,
No. 882403)
54
• Shaking water bath (set at 37 °C, Company for laboratory techniques, Germany,
Type: 1031, No. 10565493e)
• Volumetric flasks (100 ml)
• Magnetic stirrer (Heidolph MR 3001K, 800 W)
• Magnetic stirrer bars
• Glass test tubes (round bottomed, 16 * 120 mm)
• Macro-cuvettes (10x10x45, Greiner Bio-One GmbH, Item No. 614101)
• Stop clock
• Spatula
7.3.6.3 Chemicals and reagents
• Ethanol 96% (non-denaturated, Agrar-Alkohol, Vienna, UN1170, C-K25V)
• Ethanol 50% (denaturated, Carl Roth GmbH, Germany, Art.No. 7342.1)
• IMS (industrialised methylised spirit, denaturated, Carl Roth GmbH, Germany,
Art.No. 7342.1)
• Sodium maleate buffer (0.1 M, pH 6.0)
• Sodium acetate buffer (1.2 M with pH 3.8; 100 mM with pH 4.5 )
• Pancreatic α-amylase (Megazyme Kit, Resistant starch)
• AMG (diluted, 300 U/ml)
• AMG (Megazyme Kit, Resistant starch)
• D-glucose standard solution (1 mg/ml, Megazyme Kit, Resistant starch)
• KOH (2 M, LOBA Feinchemie, Art.No. 59208, Austria)
• GOPOD Reagent (Glucose Determination Reagent)
7.3.6.4 Procedure
Approximately 100 mg ± 0.1 mg of each sample were weighed into 15 ml screw cap
tubes (triple determination). In the 50 ml tube 0.3 g pancreatic α-amylase and 30 ml
55
0.1 M sodium maleate buffer (pH 6.0) were pooled and mixed for 5 min on a tube
rotator. Then, 0.3 ml diluted AMG were added to the solution, mixed on a vortex mixer
and centrifuged at 1,500 x g for 10 min. 4 ml from the supernatant were added to each
sample, mixed on a vortex mixer and incubated for exactly 16 h in a shaking water bath
at 37 °C. Then, the tubes were removed from the water bath and 4 ml ethanol (96%)
were added to each tube, mixed on a vortex mixer and centrifuged without tube caps
at 1,500 x g for 10 min. After centrifugation, the supernatants were decanted carefully
and the residues were re-suspended with 2 ml ethanol (50%), stirred on a vortex
mixer, and followed by 6 ml IMS. The tubes were mixed again and centrifuged at 1,500
x g for 10 min. The supernatants were decanted and this suspension and centrifugation
step was done once more. After decantation of the supernatants to each tube a
magnetic stirrer bar was put and the residues were re-suspended with 2 M KOH. For
dissolving the residue, the samples were stirred for 20 min in an ice-water bath over a
magnetic stirrer.
Subsequently, 8 ml of 0.1 M sodium acetate buffer (pH 3.8), followed by 0.1 ml AMG
solution were added to the tubes, mixed and placed in a water bath at 50 °C for 30 min
with intermittent mixing on a vortex mixer. The Sacha Inchi samples contain less than
10% RS and because of this, dilution is not necessary and so they were centrifuged
directly after the water bath at 1,500 x g for 10 min. Then, 0.1 ml of each supernatant
were transferred into glass test tubes and after this step, 3 ml GOPOD reagent were
added to each tube and incubated for 20 min in a water bath at 50 °C.
Preparation of D-glucose standard and reagent blank solution:
D-glucose control: 0.1 ml of D-glucose standard solution (1 mg/ml) and 3.0 ml of
GOPOD reagent.
Reagent blank solution: 0.1 ml of 100 mM sodium acetate buffer (pH 4.5) and 3.0 ml of
GOPOD reagent.
The samples were transferred into macro-cuvettes and for each sample (including D-
glucose control) the absorbance at 510 nm were read against the reagent blank. The
RS content was calculated according to eq. 8.
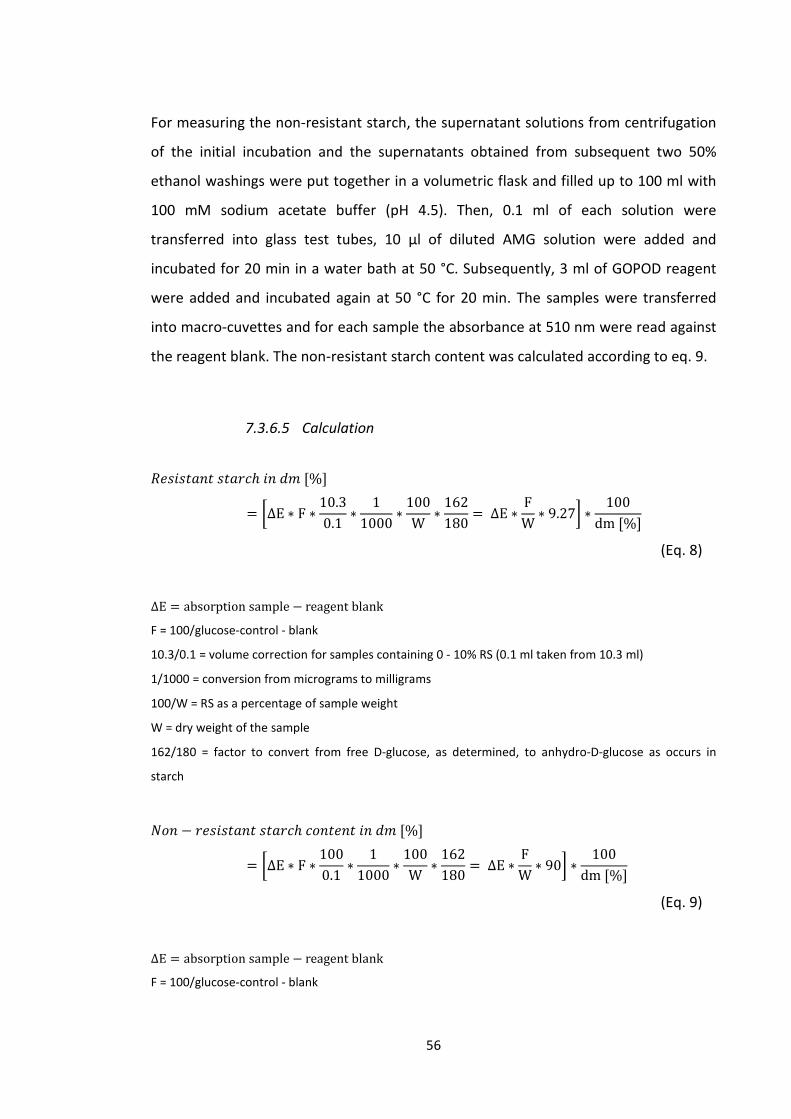
56
For measuring the non-resistant starch, the supernatant solutions from centrifugation
of the initial incubation and the supernatants obtained from subsequent two 50%
ethanol washings were put together in a volumetric flask and filled up to 100 ml with
100 mM sodium acetate buffer (pH 4.5). Then, 0.1 ml of each solution were
transferred into glass test tubes, 10 µl of diluted AMG solution were added and
incubated for 20 min in a water bath at 50 °C. Subsequently, 3 ml of GOPOD reagent
were added and incubated again at 50 °C for 20 min. The samples were transferred
into macro-cuvettes and for each sample the absorbance at 510 nm were read against
the reagent blank. The non-resistant starch content was calculated according to eq. 9.
7.3.6.5 Calculation
_��#���$�����Kℎ#$%�[%]= L∆E ∗ F ∗ 10.30.1 ∗ 1
1000 ∗ 100W ∗ 162180 = ∆E ∗ FW ∗ 9.27S ∗ 100
dm[%]
(Eq. 8)
∆E = absorptionsample − reagentblank
F = 100/glucose-control - blank
10.3/0.1 = volume correction for samples containing 0 - 10% RS (0.1 ml taken from 10.3 ml)
1/1000 = conversion from micrograms to milligrams
100/W = RS as a percentage of sample weight
W = dry weight of the sample
162/180 = factor to convert from free D-glucose, as determined, to anhydro-D-glucose as occurs in
starch
h/$ − ���#���$�����KℎK/$��$�#$%�[%]= L∆E ∗ F ∗ 1000.1 ∗ 1
1000 ∗ 100W ∗ 162180 = ∆E ∗ FW ∗ 90S ∗ 100
dm[%]
(Eq. 9)
∆E = absorptionsample − reagentblank
F = 100/glucose-control - blank
57
100/0.1 = volume correction (0.1 ml taken from 100 ml)
1/1000 = conversion from micrograms to milligrams
100/W = RS as a percentage of sample weight
162/180 = factor to convert from free D-glucose, as determined, to anhydro-D-glucose as occurs in
starch
7.3.7 Determination of the insoluble and soluble dietary fibre (Megazyme Kit,
Total dietary fibre, AOAC Method 991.43, K-TDFR 05/12)
7.3.7.1 Principle
The four samples are subjected to sequential enzymatic digestion by heat-stable α-
amylase, protease and amyloglucosidase. Insoluble dietary fibre (IDF) is filtered and
then, the residue is washed with warm distilled water. The filtrate and water washings
together are precipitated with 96% ethanol for soluble dietary fibre (SDF)
determination. Then, the precipitate is filtered and dried and both residues are
corrected for protein, ash and blank for the final calculation of SDF and IDF values.
7.3.7.2 Equipment and materials
• Analytical balance, accuracy: ± 0.1 mg (Sartorius AG, Germany, BP210S)
• Analytical balance (Precisa 3100 C, Sitzerland)
• Muffle furnace (Carbolite, England, Type: 11/6B)
• Drying oven 105 °C (Loading Modell 100 - 800, Memmert GmbH & Co. KG,
Germany)
• Desiccator with silica gel
• Glass crucible (ROBU Glasfilter-Geräte, 30 ml, Art.No. 20302)
• Beaker (400 ml, 600 ml Borosilicate 3.3)
• Shaking water bath (Company for laboratory techniques, Germany, Type: 1031,
No. 10565493e)
58
• Magnetic stirrer (Heidolph MR 3001K, 800 W)
• Magnetic stirrer bars
• Vacuum pump (Vacuumbrand, Type: MZ 2C, Germany)
• Filtering flask
• Rubber ring adaptors for use on filtering flask
• pH meter (Knick, Germany, Type: 911pH, No. 1341113)
• Pipettors (Eppendorf AG, 20 µl, 100 µl, 1000 µl, 5000 µl)
• Dispenser for buffer (Bibby Sterilin Ltd. 10-60 ml)
• Spatula and rubber spatula
7.3.7.3 Chemicals and reagents
• Ethanol 96% (non-denaturated, Agrar-Alkohol, Vienna, UN1170, C-K25V)
• Ethanol 78% (diluted, Agrar-Alkohol, Vienna, UN1170, C-K25V)
• α-amylase (heat stable, Megazyme Kit, Total dietary fibre)
• Protease (50 mg/ml, Megazyme Kit, Total dietary fibre)
• Amyloglucosidase (Megazyme Kit, Total dietary fibre)
• Celite (Serva GmbH, Type: 545)
• MES/TRIS buffer (0.05 M each, pH 8.2)
• Hydrochloric acid solution, 0.561 N (diluted, Carl Roth GmbH, Germany, Art.No.
4625.2)
• Deionised water
7.3.7.4 Procedure
First, approximately 1 g ± 0.1 mg of each of the 4 samples were weighed and
transferred into a beaker (triple determination). To measure any contribution from
reagents to residue, two blanks were running along with the samples. After, 40 ml
MES/TRIS buffer solution (pH 8.2) were added to each sample and stirred on a
59
magnetic stirrer until samples were completely dispersed in solution. Then, 50 µl heat-
stable α-amylase solution were added while stirring and then the samples were placed
in a shaking water bath at 95 °C for 35 min.
After removing the samples from the water bath, they were cooled to 60 °C (with 10
ml distilled water) and 100 µl protease solution were added to each sample.
Subsequently, they were put into a shaking water bath at 60 °C for 30 min and after
removing the samples from the water bath, approximately 5 ml of 0.561 N HCl solution
were dispensed into the sample while stirring (pH between 4.1 and 4.8). Then, 200 µl
amyloglucosidase were added and the samples were placed again in a shaking water
bath at 60 °C for 30 min. After this step, the filtration followed. For the filtration, the
glass crucibles (two for each sample), including the Celite, had to be pre-incinerated in
the muffle furnace at 525 °C for 3 h, cooled in the desiccator and weighed. 5 ml
distilled water were added to the glass crucibles to wet and redistribute the bed of
Celite and then, suction was applied. Then, the enzyme mixture from each sample was
filtered through the crucible into a filtration flask and the residue was washed with 20
ml distilled water (at 70 °C) and 20 ml 96% ethanol, to transfer everything to crucible.
The crucibles, containing the IDF, were dried overnight in 105 °C oven. The SDF
solution was transferred from the filtration flask to a 600 ml beaker, weighed and the
ethanol content (96%, heated to 60 °C) was calculated by multiplication the weight of
the SDF solution with 5 and minus 20 (because of the 20 ml ethanol before). After the
ethanol was added to each SDF solution, the solution was let to stand for 1 h to form
the precipitate. The second filtration followed by adding 15 ml 78% ethanol to the
glass crucibles to wet and redistribute the bed of Celite. Subsequently, suction was
applied and the solution for each sample was filtered through the crucibles. Then, the
residue was washed with 15 ml 78% ethanol and 15 ml 96% ethanol, to transfer all
remaining particles to crucible. The crucibles, containing the SDF, were dried overnight
at 105 °C.
After cooling all crucibles (IDF and SDF) in a desiccator, they were weighed and one
residue from each type of fibre was analysed for protein and the second residue of the
duplicate was analysed for ash content. Protein analyses were done by using Kjeldahl
60
method. For ash analysis, the crucibles were pre-incinerated in the rapid incineration
until no more smoke occurred (approximately for one hour). Then, the samples were
annealed in the muffle furnace at 525 °C for 3 h, cooled in the desiccator and weighed.
The calculation for IDF and SDF was done by using eq. 10 and 11. Total dietary fibre
content is the sum of IDF and SDF.
7.3.7.5 Calculation
IDF and SDF [%] = ((mean residue [mg] - ((((protein [%] + ash [%])/100) * mean
residue) - blank)/(((sample weight 1 [g] + sample weight 2 [g]/2) * 1000)) * 100
(Eq. 10)
t�E �$% J�E #$ %� [%] = IDF respectively SDF [%] ∗ 100
%� [%]
(Eq. 11)
7.3.8 Determination of the total phenols (Singleton et al., 1974)
7.3.8.1 Principle
The determination of the total phenol content was performed by means of the Folin-
Ciocalteu phenol reagent. It consists of a mixture of sodium molybdate and sodium
tungstate and by the reaction of phenolic components a blue colouration, that can be
determined photometrically, is occurring.
7.3.8.2 Equipment and materials
• Analytical balance, accuracy: ± 0.1 mg (Sartorius AG, Germany, BP210S)
• Centrifuge (Eppendorf AG, Germany, Type: Centrifuge 5430)
• Centrifuge (Eppendorf AG, Germany, Type: Centrifuge 5810 R)
61
• Vortex mixer (Janke & Kunkel, IKA-Laborbedarf, Labor partner Vienna)
• Tube rotator for reaction tubes (VWR International, Belgium)
• Spectrophotometer (Hitachi U-1100, Japan, PartNo. 118-0312)
• Magnetic stirrer (Heidolph MR 3001K, 800 W)
• Magnetic stirrer bars
• Tubes - screw cap (50 ml, Greiner Bio-One GmbH, Germany, Cat.No. 227261)
• Pipettors (Eppendorf AG, 100 µl, 1000 µl)
• Volumetric flask (1000 ml)
• Erlenmeyer flasks (50 ml)
• Thermostated water bath (set at 50 °C, Haake D8, Germany, Type: 000-5584,
No. 882403)
• Folded filters (Munktell & Filter GmbH, Germany, Grade: 15, 150 mm, Art.No.
4.00303.150)
• Funnels
• Scale
• Reaction tubes (2 ml, PP, graduated, Cat.No. 623 201, Greiner Bio-One GmbH,
Germany)
• Macro-cuvettes (10x10x45, Greiner bio-one, Item No. 614101)
• Spatula
• Stop clock
7.3.8.3 Chemicals and reagents
• Methanol (Carl Roth GmbH, Germany, Art.No. 7342.1)
• Hydrochloric acid (fuming 37%, Carl Roth GmbH, Germany, Art.No. 4625.2)
• Ferulic Acid (Fluka Chemie GmbH, Belgium, EcNo. 2086797)
• Folin-Ciocalteu phenol reagent (diluted 1:10, Sigma-Aldrich Chemie GmbH,
Germany, F9252-500ML)
• Sodium carbonate (anhydrous, Carl Roth GmbH, Germany, Art.No. A135.2)
62
7.3.8.4 Procedure
Approximately 2.5 g ± 0.1 mg of each sample were weighed into 50 ml tubes (triple
determination) and the solvent was prepared for the extract.
Solvent:
85 parts of ethanol + 15 parts of 1 M HCl in 1000 ml volumetric flask.
Then, 20 ml of the solvent were added to each sample, mixed on a vortex mixer and
then they were mixed for 20 min on a tube rotator. Subsequently, the tubes were
centrifuged at 4000 rpm for 5 min and the supernatants were filtered through folded
filters into 50 ml Erlenmeyer flasks. This step was conducted twice. So, at the end, two
supernatants were concentrated in the 50 ml Erlenmeyer flask and the flask has been
made up to the mark with solvent. Then, 0.120 ml of each sample extract were
transferred into 2 ml reaction tubes and 0.600 ml diluted Folin-Ciocalteu reagent were
added to each reaction tube and mixed on a vortex mixer. After 2 min, 0.960 ml
Na2CO3 were added to the solution, mixed on a vortex mixer and incubated in a water
bath at 50 °C for 5 min. The samples changed their colour to blue. The samples of the
hulls got dark blue and so the extract had to be diluted (1:3 dilution). The samples of
the flour and press cake were not limpid and so they were diluted 1:2. The diluted and
undiluted solutions and the blanks were transferred into macro-cuvettes and
measured photometrically at 760 nm. The calculation was conducted according to eq.
12 and 13. For the calculation, the absorption of ferulic acid, shown in fig. 6 was
needed.
7.3.8.5 Calculation
a: ferulic acid equivalents [mg/ml]: (absorption sample - absorption blank)/4.8721 *
dilution factor
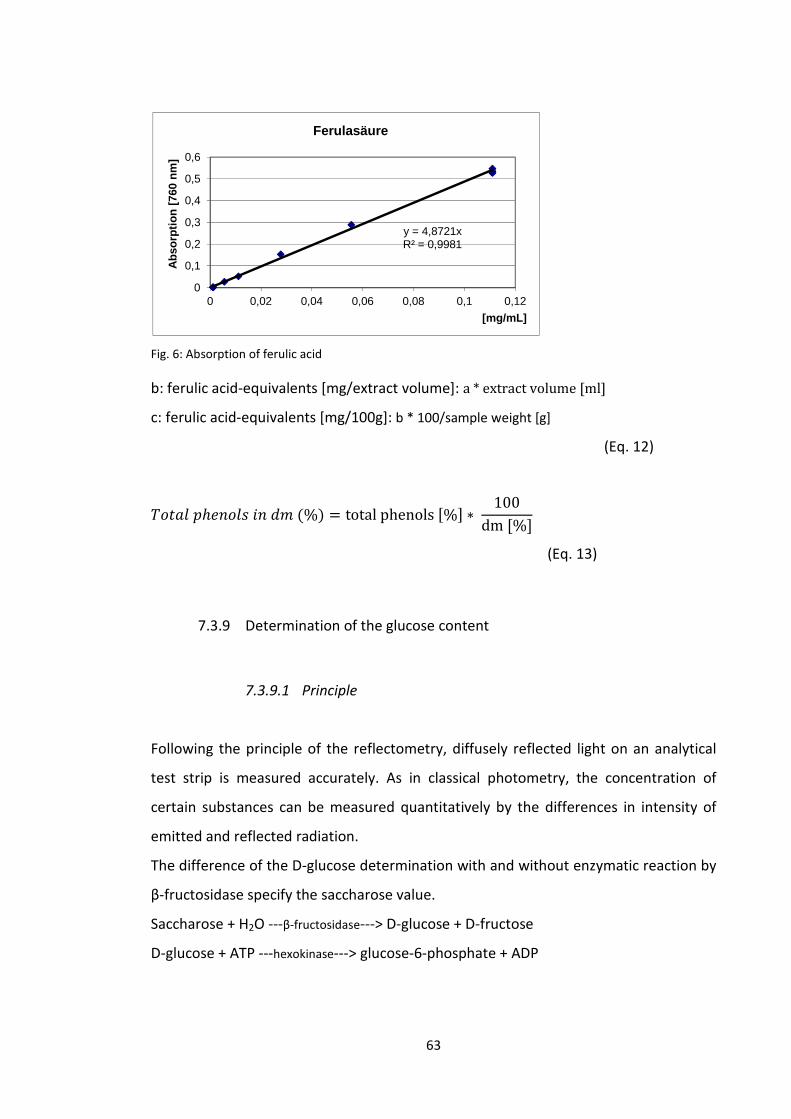
63
Fig. 6: Absorption of ferulic acid
b: ferulic acid-equivalents [mg/extract volume]: a * extract volume [ml]
c: ferulic acid-equivalents [mg/100g]: b * 100/sample weight [g]
(Eq. 12)
x/��yzℎ�$/y�#$%�(%) = totalphenols[%] ∗ 100dm[%]
(Eq. 13)
7.3.9 Determination of the glucose content
7.3.9.1 Principle
Following the principle of the reflectometry, diffusely reflected light on an analytical
test strip is measured accurately. As in classical photometry, the concentration of
certain substances can be measured quantitatively by the differences in intensity of
emitted and reflected radiation.
The difference of the D-glucose determination with and without enzymatic reaction by
β-fructosidase specify the saccharose value.
Saccharose + H2O ---β-fructosidase---> D-glucose + D-fructose
D-glucose + ATP ---hexokinase---> glucose-6-phosphate + ADP
y = 4,8721xR² = 0,9981
0
0,1
0,2
0,3
0,4
0,5
0,6
0 0,02 0,04 0,06 0,08 0,1 0,12
Abs
orpt
ion
[760
nm
]
[mg/mL]
Ferulasäure
64
Glucose-6-phosphate + NAD+ ---glucose-6-phosphate dehydrogenase---> gluconate-6-P +
NADH + H+
7.3.9.2 Equipment and materials
• Analytical balance, accuracy: ± 0.1 mg (Sartorius AG, Germany, BP210S)
• Reflectometer (RQflex plus, Merck KGaA, Germany)
• Analytical test strips (Reflectoquant 1.16720.0001, glucose-test, 1-100 mg/l,
Merck KGaA, Germany)
• Pipettors (Eppendorf AG, 1000 µl, 5000 µl)
• Volumetric flasks (100 ml)
• Erlenmeyer flasks (100 ml)
• Folded filters (Munktell & Filter GmbH, Germany, Grade: 15, 150 mm, Art.No.
4.00303.150)
• Spatula
• Funnel
• Scale
7.3.9.3 Chemicals and reagents
• Carrez reagent I (3.60 g K4 [Fe(CN)6] * 3 H2O/1000 ml)
• Carrez reagent II (7.20 g ZnSO4 * 7 H2O/100 ml)
• Sodium hydroxide (1 M)
• Deionised water
7.3.9.4 Procedure
Ten g ± 0.1 mg of each sample were weighed and transferred in 100 ml volumetric
flasks (triple determination). Then, 50 ml deionised water were added and swirled.
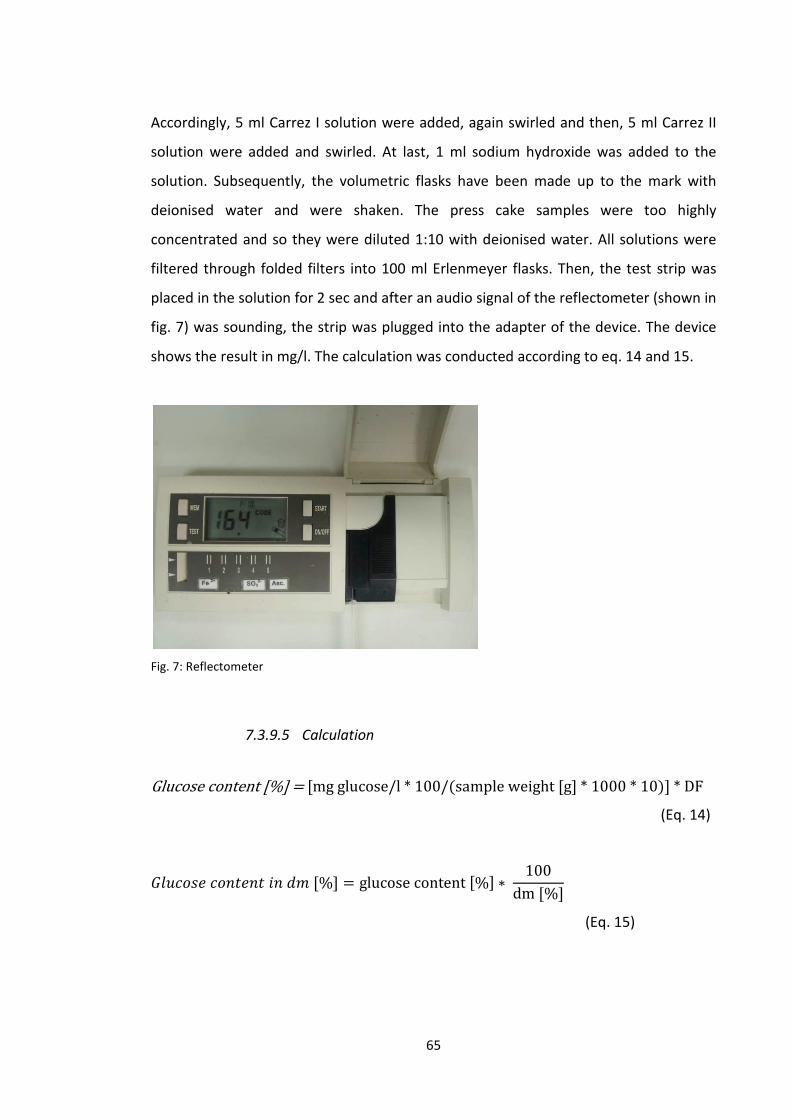
65
Accordingly, 5 ml Carrez I solution were added, again swirled and then, 5 ml Carrez II
solution were added and swirled. At last, 1 ml sodium hydroxide was added to the
solution. Subsequently, the volumetric flasks have been made up to the mark with
deionised water and were shaken. The press cake samples were too highly
concentrated and so they were diluted 1:10 with deionised water. All solutions were
filtered through folded filters into 100 ml Erlenmeyer flasks. Then, the test strip was
placed in the solution for 2 sec and after an audio signal of the reflectometer (shown in
fig. 7) was sounding, the strip was plugged into the adapter of the device. The device
shows the result in mg/l. The calculation was conducted according to eq. 14 and 15.
Fig. 7: Reflectometer
7.3.9.5 Calculation
Glucose content [%] = [mg glucose/l * 100/(sample weight [g] * 1000 * 10)] * DF
(Eq. 14)
|y}K/�� K/$��$� #$ %� [%] = glucose content [%] ∗ 100
dm [%]
(Eq. 15)
66
7.3.10 Determination of water absorption index (WAI) and water solubility
index (WSI) (according to Anderson et al., 1969)
7.3.10.1 Principle
The water absorption index (WAI) measures the volume occupied by the starch
granule after swelling in excess of water and the water solubility index (WSI)
determines the amount of free molecules leached out from the starch granule in
addition to excess water.
7.3.10.2 Equipment and materials
• Analytical balance, accuracy: ± 0.1 mg (Sartorius AG, Germany, BP210S)
• Drying oven 105 °C (Loading Modell 100 - 800, Memmert GmbH & Co. KG,
Germany)
• Desiccator with silica gel
• Tubes - screw cap (50 ml, Greiner Bio-One GmbH, Germany, Cat.No. 227261)
• Vortex mixer (Janke & Kunkel, IKA-Laborbedarf, Labor partner Vienna)
• Centrifuge (Type: Centrifuge 5810 R, Eppendorf AG, Germany)
• Scale
• Thermostated water bath (set at 30 °C, Type: 000-5584, No. 882403, Haake D8,
Germany)
• Aluminium dishes (310033)
• Spatula
• Spoon
• Glass rods
67
7.3.10.3 Chemicals and reagents
• Sea sand (SiO2, pure, Art.No. 8441.2, Carl Roth GmbH, Germany)
• Deionised water
7.3.10.4 Procedure
First, the empty 50 ml tubes were weighed. Then, approximately 2.5 g ± 0.1 mg of each
sample were weighed into the tubes (triple determination) and suspended with 30 ml
deionised water. The suspension was mixed on a vortex mixer and put into a water
bath at 30 °C for 30 min with intermittent mixing on a vortex mixer every 5 min.
Subsequently, the tubes were centrifuged at 3000 x rpm for 10 min. For measuring the
WSI, the supernatants were transferred into the pre-dried and weighed aluminium
dishes and rubbed with sea sand. In the drying oven the supernatants were dried at
105 °C to constant weight (overnight). After drying, the dishes were removed carefully
from the drying oven and placed in a desiccator to cool to room temperature and
finally, they were weighed. The weight of dry soluble solids in the supernatant was
expressed as a percentage of the original weight of sample. The calculation for WSI
was done by using eq. 16 and 17.
For measuring the WAI, the gels were weighed. The weight of gel obtained after
removal of the supernatant was expressed as weight of obtained gel per gram sample.
The calculation for WAI was done by using eq. 18 and 19.
7.3.10.5 Calculation
WSI [wb] = (Wss/Wds) * 100
(Eq. 16)
Wss = weight of dry solids of supernatant (g)
Wds = weight of dry sample (g)
68
WSI [%, db] = WSI (wb) * 100/dm [%]
(Eq. 17)
WAI [wb] = Wg/Wds
(Eq. 18)
Wg = weight of the gel (g)
Wds = weight of dry sample (g)
WAI [g/g, db] = WAI (wb) * 100/dm [%]
(Eq. 19)
7.3.11 Determination of the viscosity (Rapid Visco Analyser, RVA 4500)
7.3.11.1 Principle
The RVA is a cooking, stirring viscometer with ramped temperature and variable shear
capability optimized for testing the viscous properties. With the program TCW 3, which
is linked to the RVA, reports from the open project file can be generated. The analysis
contains the conditions of each test, the analysis results for each data set and the
graph.
7.3.11.2 Equipment and materials
• Analytical balance, accuracy: ± 0.1 mg (Sartorius AG, Germany, BP210S)
• Rapid Visco Analyser (RVA 4500, SN 2112748-45A, Perten Instruments,
Australia)
• Cans for RVA
• Paddle
• Spatula
69
7.3.11.3 Procedure
First, the moisture content of each sample had to be entered in the program, to
receive the contents of water and sample to weigh in. Then, the required quantity of
water was weighed into a can for each sample (triple determination) and
subsequently, the sample was weighed and dispensed into the can. The sample weight
was approximately 3 g ± 0.1 mg for each sample. A paddle was inserted into the can
and jogged up and down to break up any lumps in the sample. Subsequently, the
sample was transferred into the RVA and approximately after 10 min the results were
shown.
The final viscosity was shown in zentipoise (cP, 1 cP = 1 mPa.s = 0.001 Pa.s).
7.3.12 Determination of the protein solubility (Bradford method, 1976)
7.3.12.1 Principle
The Bradford method is used for quantification of protein content in solutions.
Coomassie brilliant blue is forming a complex with proteins, which can be measured
photometrical at 595 nm.
7.3.12.2 Equipment and materials
• Analytical balance, accuracy: ± 0.1 mg (Sartorius AG, Germany, BP210S)
• Analytical balance, accuracy: ± 0,01 mg (Sartorius AG, Germany, CP225D)
• Centrifuge (Eppendorf AG, Germany, Type: Centrifuge 5430)
• Pipettors (Eppendorf AG, 20 µl, 100 µl, 200 µl, 1000 µl)
• Vortex mixer (Janke & Kunkel, IKA-Laborbedarf, Labor partner Vienna)
• Volumetric flask (100 ml)
• Tube rotator for reaction tubes (VWR International, Belgium)
70
• Reaction tubes (2 ml, PP, graduated, Cat.No. 623 201, Greiner Bio-One GmbH,
Germany)
• Multichannel pipette (Eppendorf AG, Germany)
• Microtiter plates 96 wells (Transparent Polystyren, Greiner Bio-One GmbH,
Germany)
• Photometer (NanoQuant infinite M299 PRO, Tecan Group Ltd., Switzerland)
• Spatula
7.3.12.3 Chemicals and reagents
• Phosphate buffer (50mM, pH: 7, 0.1 M NaCl)
• Sodium dihydrogen phosphate monohydrate (Merck KGaA, Germany, Art.No.
6346)
• Sodium chloride (VWR International, Belgium, Art.No. 27810.295)
• Di sodium hydrogen phosphate dihydrate (Merck KGaA, Germany, Art.No.
6580)
• Coomassie-brilliant blue solution - Roti Quant (Carl Roth GmbH, Germany,
Art.No. K015.3) stored at 4 °C
• Bovine serum albumen, BSA (Carl Roth GmbH, Germany, Art.No. 8076.1) stored
at 4 °C
7.3.12.4 Procedure
First, the phosphate buffer was produced by pooling 0.29 g sodium dihydrogen
phosphate monohydrate, 0.51 g di sodium hydrogen phosphate dihydrate and 0.58 g
sodium chloride into a 100 ml volumetric flask. The pH was adjusted to 7.0 with di
sodium hydrogen phosphate dihydrate and then the volumetric flask was filled with
deionised water to the desired volume. Approximately 90 mg ± 0.01 mg of each
sample (triple determination) were weighed into 2 ml reaction tubes, followed by
addition of 1.8 ml of the buffer solution. Then, the samples were mixed on a vortex
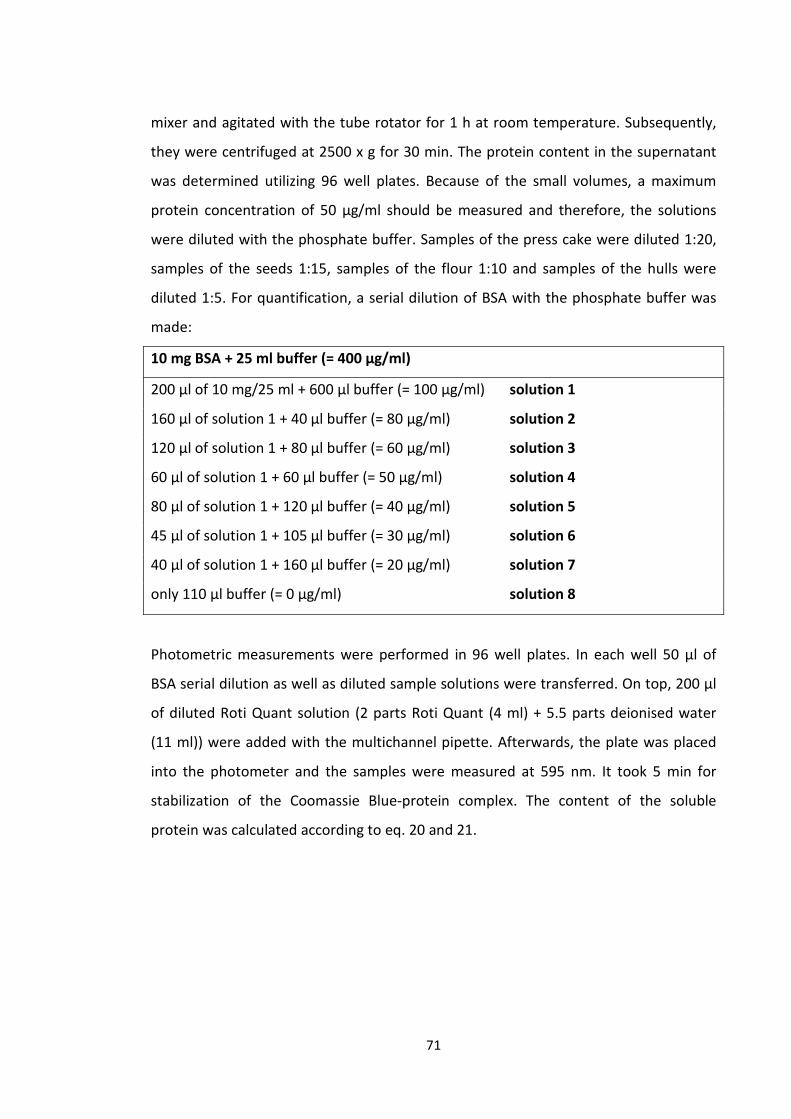
71
mixer and agitated with the tube rotator for 1 h at room temperature. Subsequently,
they were centrifuged at 2500 x g for 30 min. The protein content in the supernatant
was determined utilizing 96 well plates. Because of the small volumes, a maximum
protein concentration of 50 µg/ml should be measured and therefore, the solutions
were diluted with the phosphate buffer. Samples of the press cake were diluted 1:20,
samples of the seeds 1:15, samples of the flour 1:10 and samples of the hulls were
diluted 1:5. For quantification, a serial dilution of BSA with the phosphate buffer was
made:
10 mg BSA + 25 ml buffer (= 400 µg/ml)
200 µl of 10 mg/25 ml + 600 µl buffer (= 100 µg/ml) solution 1
160 µl of solution 1 + 40 µl buffer (= 80 µg/ml) solution 2
120 µl of solution 1 + 80 µl buffer (= 60 µg/ml) solution 3
60 µl of solution 1 + 60 µl buffer (= 50 µg/ml) solution 4
80 µl of solution 1 + 120 µl buffer (= 40 µg/ml) solution 5
45 µl of solution 1 + 105 µl buffer (= 30 µg/ml) solution 6
40 µl of solution 1 + 160 µl buffer (= 20 µg/ml) solution 7
only 110 µl buffer (= 0 µg/ml) solution 8
Photometric measurements were performed in 96 well plates. In each well 50 µl of
BSA serial dilution as well as diluted sample solutions were transferred. On top, 200 µl
of diluted Roti Quant solution (2 parts Roti Quant (4 ml) + 5.5 parts deionised water
(11 ml)) were added with the multichannel pipette. Afterwards, the plate was placed
into the photometer and the samples were measured at 595 nm. It took 5 min for
stabilization of the Coomassie Blue-protein complex. The content of the soluble
protein was calculated according to eq. 20 and 21.
72
7.3.12.5 Calculation
Soluble protein [mg/g sample] = [(mean protein [µg/ml] * dilution)/(sample
weight [mg]/1.8)]
(Eq. 20)
J/y}�y� z�/��#$ #$ %� [%] =100
dm [%]
(Eq. 21)
7.3.13 Extrusion cooking
7.3.13.1 Raw materials
Sacha Inchi flour and press cake (Agroindustrias Osho S.A.C., Lima, Peru); maize flour
(Caj. Strobl Naturmühle GesmbH, Art.No. 161209, Austria)
7.3.13.2 Procedure
The snack basis products were produced with a conical twin screw extruder (CM 45-
Food Extruder, Cincinnati Milacron GmbH, BJ 1986, No. 16944/14, Vienna, Austria)
with four different heating zones, at temperatures of 80, 110, 130 and 160 °C,
respectively. The diameter of the die was 2 mm and the speed of the main engine was
240 rpm. Screw speed was 82 rpm. The mass temperature was between 130 and 140
°C and the temperature inside the screw was 70 °C. When the material was leaving the
extruder, it was pressed through the die and cut to the desired size. Due to the
difference of temperature and pressure expansion of the flour was achieved. The
extrudates were packed and stored at room temperature (for further analyses they
were put in a conditioning chamber at 20 °C and 50% RH)
73
7.3.14 Production of granola bars
7.3.14.1 Raw materials
Binding agent: fat (100% pure coconut fat, Nusett), wheat flour W 700 (Rosenfellner
Mühle GmbH, Art.No. 104250, Austria), wheat starch (Cerestar HandelsgesmbH,
Austria), lecithin (Metarin P, Lucas Meyer GmbH, Hamburg, Germany), crystal sugar
(Agrana GmbH, Austria), starch syrup (Anna Gold Handels GmbH, 4715, Vienna,
Austria), honey (Grandessa Blütenhonig, APIS Lebensmittel GmbH, Austria), salt
(iodised table salt, Salinen Austria AG); flavour ingredients: almonds (Happy Harvest,
VOG AG Austria), coconut flakes (Happy Harvest, VOG AG Austria, origin: Indonesia),
dried apple pieces (iss echt steirisch, AGERVITA Handels GmbH, Austria); extruded
products (with 30% Sacha Inchi flour and 70% maize flour)
7.3.14.2 Procedure
First, the binding agent for the granola bars was produced. The coconut fat and the
emulsifier (lecithin) were melted in a pot. All other ingredients (wheat flour, water,
wheat starch, crystal sugar, starch syrup, honey and salt) were put together in a high
pot and heated until the mixture had a Brix content of about 88-87 °Brix (Pocket
Refractometer, Atago Co., Ltd). This is important, because the hydrophilic part of the
binding agent has to have a very low water content in order to be mixed with the
hydrophobic part of the binding agent. After heating and constantly stirring the
mixture up to the appropriate Brix content, the hydrophobic part (fat and lecithin) was
added.
The dry components (extrudates, crushed almonds, coconut flakes and dried apples)
were weighed and mixed. Then, the binding agent was added at a temperature of
about 80 °C and stirred intensely. Immediately after this step, the granola bar mixture
was put into plastic pots and pressed slightly with a press to provide better cohesion.
Then, they were transferred onto baking sheets and baked in a pre-heated oven (Type
74
UT5042E, Heraeus, Germany) at 170 °C for 8 min. After cooling to room temperature,
they were cut to bars, packed in plastic bags and stored at room temperature.
7.3.15 Production of biscuits
7.3.15.1 Raw materials
Sacha Inchi flour and press cake (Agroindustrias Osho S.A.C., Lima, Peru); wheat flour
W 700 (Rosenfellner Mühle GmbH, Art.No. 104250, Austria); margarine (bellasan,
Senna Nahrungsmittel GmbH & Co KG, Vienna, Austria); sugar (crystal sugar, Agrana
GmbH, Austria); baking powder (sodium bicarbonate, bella, Instantina GmbH, Austria);
salt (iodised table salt, Salinen Austria AG); guar flour (KUK, Handels GmbH, Austria);
vanilla sugar (bella, Instantina GmbH, Austria); eggs (Gnaser Frischeiproduktion
Ges.m.b.H, Goldland, Austria, weight class L)
7.3.15.2 Procedure
Sugar, fat and eggs were transferred into a kitchen machine (BEAR Varimixer, AS
Wodschow & Co, Denmark, RN10 VL-2) and stirred with a whisk for 10 min until it got
creamy. Afterwards, salt, baking powder, vanilla sugar and guar flour were added and
stirred again. Then, the flour, respectively the press cake, was added and kneaded with
a dough hook for 3 min until a smooth dough developed. After a 30 min. rest of the
dough at 20 °C and 50% air humidity, the dough was rolled with a rolling pin (3 mm
thick) and cut (5 cm diameter). The biscuits were baked in a pre-heated oven (Type
UT5042E, Heraeus, Germany) at 175 °C for 11 min. Then, they were cooled to room
temperature, packed and stored in a conditioning chamber. All recipes were baked
twice.
75
7.3.16 Production of noodles
7.3.16.1 Raw materials
Sacha Inchi flour (Agroindustrias Osho S.A.C., Lima, Peru); wheat semolina (Caj. Strobl
Naturmühle GesmbH, Linz-Ebelsberg, Art.No. 111012, Austria)
7.3.16.2 Procedure
The dry components were put together and stirred with a kitchen machine (Bear
Varimixer, AS Wodschow & Co, Denmark, RN10 VL-2) for 1 min at level 1. Then, water
was added slowly and the dough was kneaded for 15 min at level 2. Subsequently, the
dough was pressed in a pasta press (Model P3, La Monferrina, Italy, Teflonmatrix for
band noodles) to ribbon noodles and then, they were dried in a drying oven (Memmert
GmbH & Co. KG, Germany) at 60 °C overnight. On the next day, they were cooled to
room temperature, packed and stored in at room temperature. For the appropriate
water content the moisture content of the dry components had to be measured and
used for the calculation of the amount of water to be added. The amount of water was
calculated according to eq. 22.
� =H
<?? ∗ (weight lourg� + weightfurtheringredientg�p − F1 − f/100
(Eq. 22)
F = weight flour [g] * moisture flour [%]/100 + weight further ingredient [g] * moisture
further ingredient [%]/100
w = amount of added water [ml]
f = desired dough moisture [%]
F = total water content of all dry ingredients [g]
76
7.3.17 Production of beverages
7.3.17.1 Raw materials
Sacha Inchi flour and press cake (Agroindustrias Osho S.A.C., Lima, Peru); maize flour
(Caj. Strobl Naturmühle GesmbH, Art.No. 161209, Austria)
7.3.17.2 Procedure
Three kg of the flour were mixed with 15 l water and milled in a cutter (A. Stephan &
Söhne, wet mill, Microcut, Germany). The mixture was put in a steam-heated
processing plant (FRYMA-Maschinen AG, Switzerland, Type: DT-50, Fab.No. M16323)
and was heated up to 90 °C for 15 min. For the production of a pure Sacha Inchi
beverage, no enzymes were necessary, because Sacha Inchi has almost no starch and
so, saccharification was not possible. But for the production of Sacha Inchi-maize
beverage, 3 ml Termamyl enzyme (Type L, AYNO2192, Novozymes A/S, Denmark) was
added before heating up to 90 °C. Then, the mixture was cooled to 60 °C and 3 ml
AMG (Amyloglucosidase, AMS30053, Novozymes A/S, Denmark) was added to the
Sacha Inchi-maize beverage. Subsequently, the temperature was kept at 60 °C for 3 h
(Sacha Inchi drink), respectively 4 h (Sacha Inchi-maize drink) and the mixture was
homogenized. In the first hour of homogenization the homogenizer was hold at 200
bar and after one hour regulated to 300 bar. After homogenization, the drink was
heated to 95 °C for 15 min and then, cooled to 38 °C. Subsequently, the beverage was
filled into plastic bags and stored deep frozen at -30 °C. For using the beverage for
further analyses, it had to be sterilised at 121 °C for 20 min. (Varioklav
Dampfsterilisatoren, Type 400, H + P Labortechnik GmbH, Germany) and after
sterilisation stored at 4 °C.
77
7.3.18 Physical measurements of the products
7.3.18.1 Determination of the expansion index and bulk density of snack
basis products
By using a sliding calliper, the diameter of the extrudate was measured. For every
composition, 10 measurements were done. To achieve the expansion index, the
diameter of the extrudate (mm) was divided by the diameter of the die (mm).
Bulk density was measured in gram per liter. A pot with a volume of 5 l was weighed
and then filled with the extrudates and again weighed. This was done three times for
each composition. The expansion index and the bulk density describe the expansion of
the snack basis products.
7.3.18.2 Determination of the spreading factor of the biscuits
By using a sliding calliper, the diameter and height of the biscuits were measured. It
was done at 10 biscuits for each composition. For measuring the spreading factor, the
ratio of diameter to height was calculated.
7.3.18.3 Determination of the texture of the extrudates, biscuits and
noodles
The texture of the snack basis products, biscuits and noodles were measured by using
the Texture Analyser TA-XT2i® (Stable Micro SystemsTM Co., GB), by means of a load
cell of 5 kg. As a measure for the breaking force of the snack basis products, the
maximum positive force (Fmax in N) in the measuring curve, that occurred when the
single extrudate balls were compressed and broken at constant speed with a test plate
(compressing disk made of aluminium, d = 100 mm, HDP/90), was determined . Before
measuring, the extrudates were conditioned at 20 °C and 50% RH. Settings of the
Texture Analyser: Test method: force in direction of compression, breaking test; test
speed: 0.1 mm/s; post test speed: 10 mm/s; distance of breakage and test distance: 3
78
mm and 4 mm (at 10 and 20% Sacha Inchi flour extrudates and 10% Sacha Inchi press
cake extrudate) and 2 mm and 3 mm, respectively (at 30 and 40% Sacha Inchi flour
extrudates); trigger value: 0.20 N. After the setting of the parameters, the Texture
Analyser was calibrated using a 2 kg standard weight (for each product the same). Ten
balls of each recipe were measured.
As a measure for the breaking force and thus for the crispiness of the biscuits, the
maximum positive force (Fmax in N) in the measuring curve, that was necessary for the
insertion of a measuring probe (SMS P/2) into the center of the biscuit, was
determined. Before measuring, the biscuits were conditioned at 20 °C and 50% RH.
Settings of the Texture Analyser: Test method: force in direction of compression,
breaking test; test speed: 0.2 mm/s; post test speed: 10 mm/s; distance of breakage
and test distance: 1 mm and 5 mm; trigger value: 0.10 N. For each recipe, 20
measurements were done.
The biting process of the noodles during the measurement should be imitated as far as
possible, by cutting the cooked noodle with a knife made from perspex (light knife
blade, thickness: 1 mm, Code A/LKB-F). The criterion is the achievement of an al dente
character. The firmness equates to the maximum positive force (Fmax in N) in the
measuring curve. Settings of the Texture Analyser: Test method: force in direction of
compression, simple test; test speed: 0.1 mm/s; post test speed: 10 mm/s; distance of
breakage and test distance: 1 mm and 1.1 mm; trigger value: 0.02 N. The noodles were
cooked with the optimal cooking time, strained and washed with water for 30 sec.
Immediately after this step, they were transferred into a beaker and filled with water
(at room temperature) to stop the cooking process. Ten measurements for each recipe
were conducted. In fig. 8 the Texture Analyser is demonstrated.
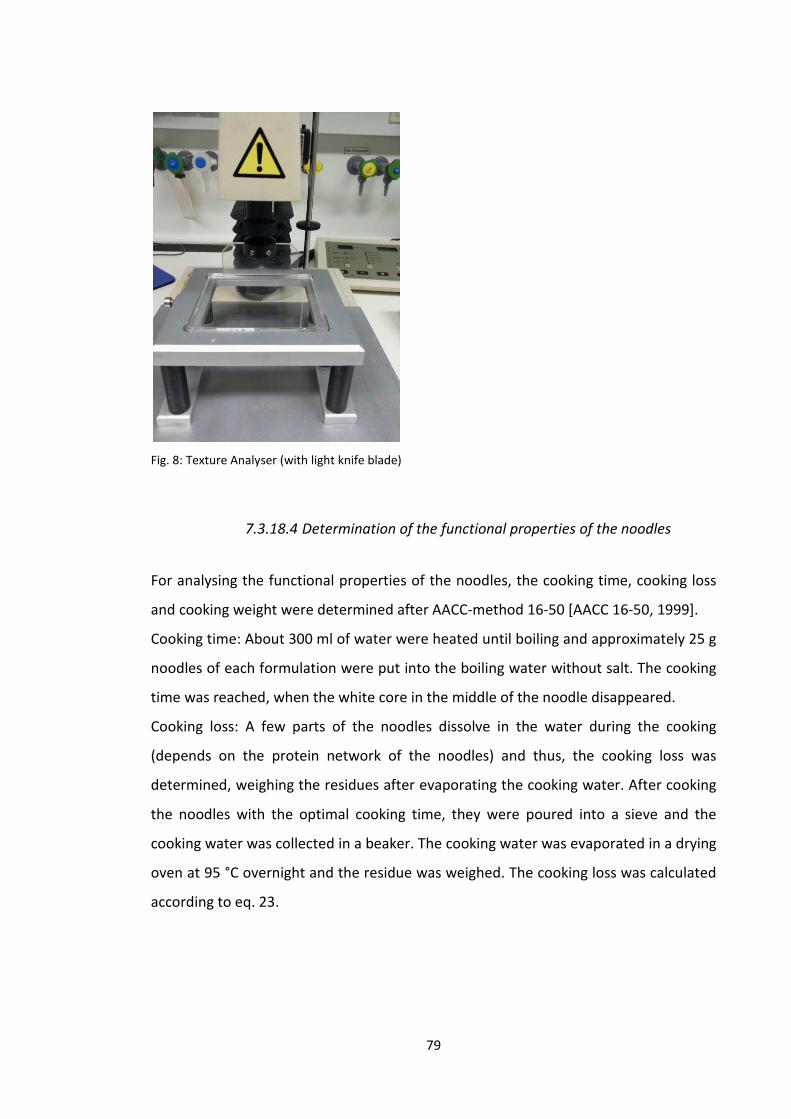
79
Fig. 8: Texture Analyser (with light knife blade)
7.3.18.4 Determination of the functional properties of the noodles
For analysing the functional properties of the noodles, the cooking time, cooking loss
and cooking weight were determined after AACC-method 16-50 [AACC 16-50, 1999].
Cooking time: About 300 ml of water were heated until boiling and approximately 25 g
noodles of each formulation were put into the boiling water without salt. The cooking
time was reached, when the white core in the middle of the noodle disappeared.
Cooking loss: A few parts of the noodles dissolve in the water during the cooking
(depends on the protein network of the noodles) and thus, the cooking loss was
determined, weighing the residues after evaporating the cooking water. After cooking
the noodles with the optimal cooking time, they were poured into a sieve and the
cooking water was collected in a beaker. The cooking water was evaporated in a drying
oven at 95 °C overnight and the residue was weighed. The cooking loss was calculated
according to eq. 23.
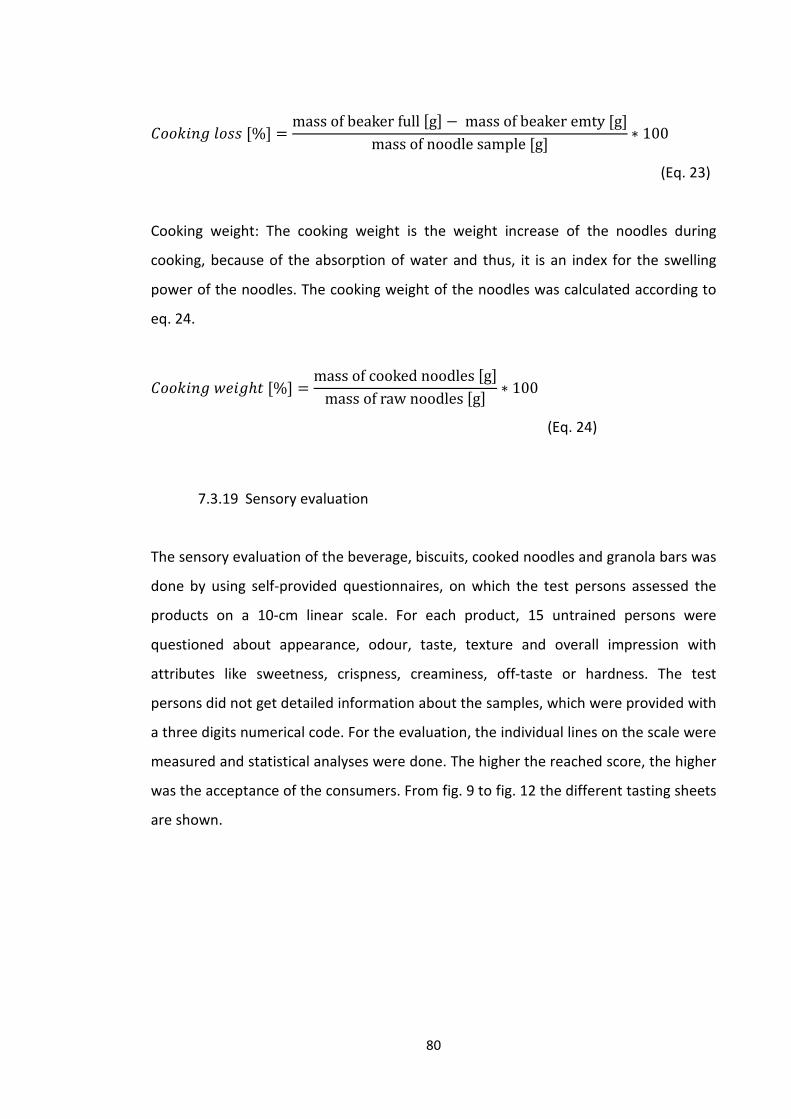
80
�//�#$�y/��[%] = massofbeakerfull[g] − massofbeakeremty[g]massofnoodlesample[g] ∗ 100
(Eq. 23)
Cooking weight: The cooking weight is the weight increase of the noodles during
cooking, because of the absorption of water and thus, it is an index for the swelling
power of the noodles. The cooking weight of the noodles was calculated according to
eq. 24.
�//�#$���#�ℎ�[%] = massofcookednoodles[g]massofrawnoodles[g] ∗ 100
(Eq. 24)
7.3.19 Sensory evaluation
The sensory evaluation of the beverage, biscuits, cooked noodles and granola bars was
done by using self-provided questionnaires, on which the test persons assessed the
products on a 10-cm linear scale. For each product, 15 untrained persons were
questioned about appearance, odour, taste, texture and overall impression with
attributes like sweetness, crispness, creaminess, off-taste or hardness. The test
persons did not get detailed information about the samples, which were provided with
a three digits numerical code. For the evaluation, the individual lines on the scale were
measured and statistical analyses were done. The higher the reached score, the higher
was the acceptance of the consumers. From fig. 9 to fig. 12 the different tasting sheets
are shown.

81
Please rate the sample for appearance, odour, taste, texture and overall impression. Do your evaluation
by a vertical line at the bar.
appearance
not appealing appealing
comment:
odour
not appealing appealing
comment:
taste
not appealing appealing
off-taste no off-taste
comment:
texture
soft crispy
comment:
overall impression
� ☺
comment: THANK YOU!
Fig. 9: Sensor evaluation sheet of the granola bar
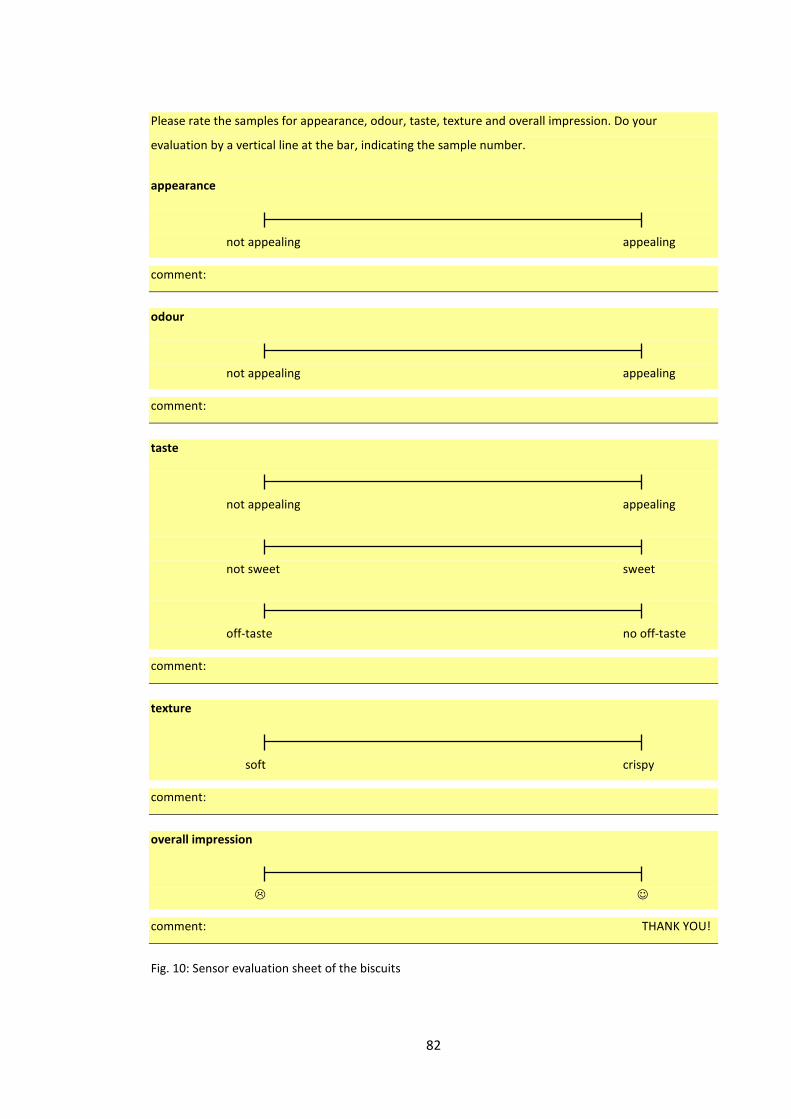
82
Please rate the samples for appearance, odour, taste, texture and overall impression. Do your
evaluation by a vertical line at the bar, indicating the sample number.
appearance
not appealing appealing
comment:
odour
not appealing appealing
comment:
taste
not appealing appealing
not sweet sweet
off-taste no off-taste
comment:
texture
soft crispy
comment:
overall impression
� ☺
comment: THANK YOU!
Fig. 10: Sensor evaluation sheet of the biscuits
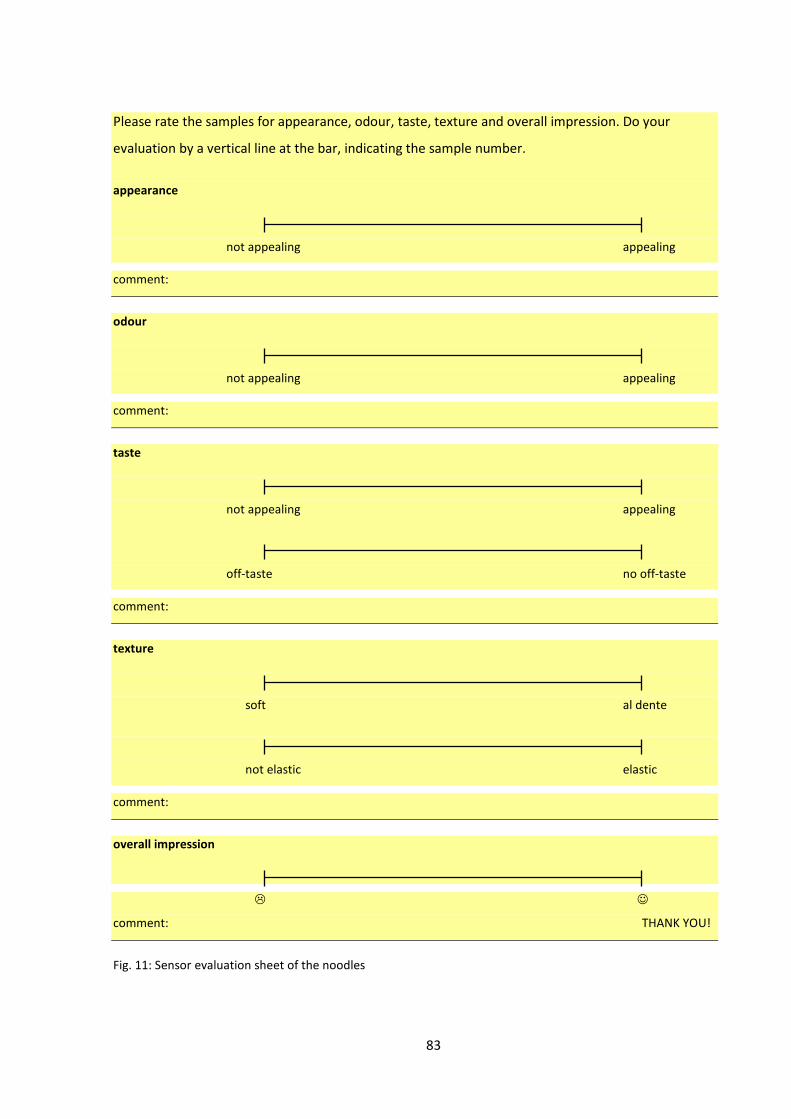
83
Please rate the samples for appearance, odour, taste, texture and overall impression. Do your
evaluation by a vertical line at the bar, indicating the sample number.
appearance
not appealing appealing
comment:
odour
not appealing appealing
comment:
taste
not appealing appealing
off-taste no off-taste
comment:
texture
soft al dente
not elastic elastic
comment:
overall impression
� ☺
comment: THANK YOU!
Fig. 11: Sensor evaluation sheet of the noodles
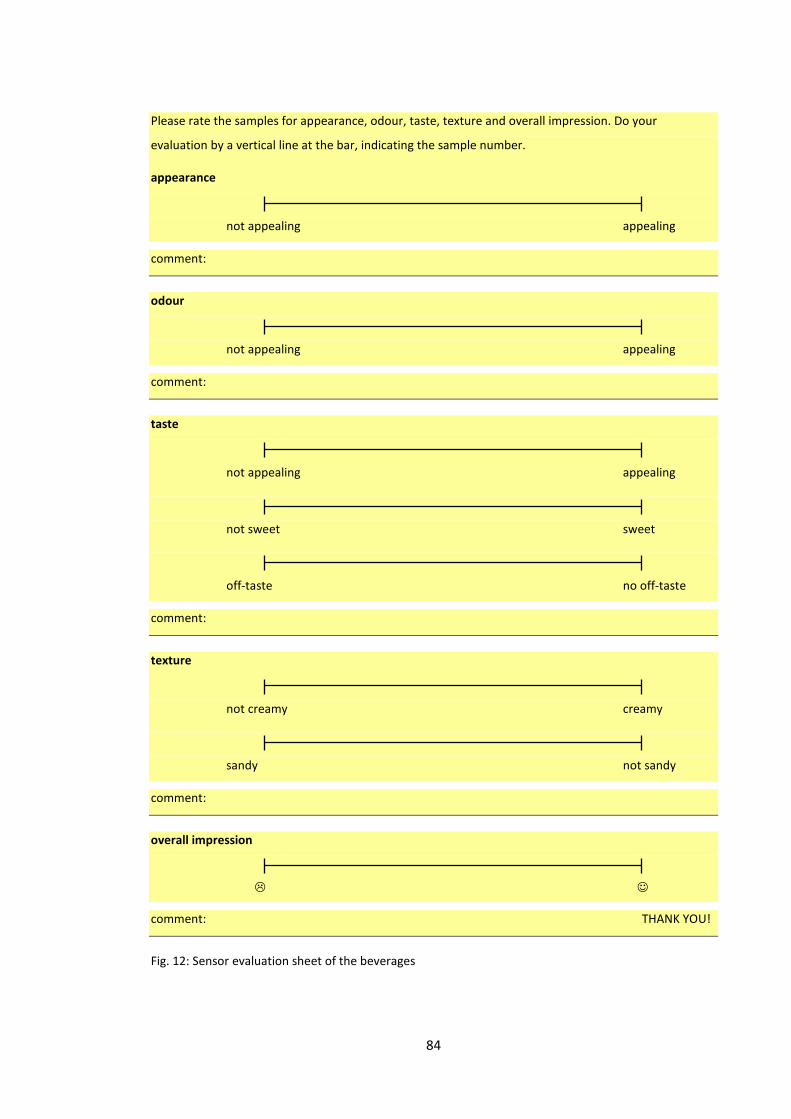
84
Please rate the samples for appearance, odour, taste, texture and overall impression. Do your
evaluation by a vertical line at the bar, indicating the sample number.
appearance
not appealing appealing
comment:
odour
not appealing appealing
comment:
taste
not appealing appealing
not sweet sweet
off-taste no off-taste
comment:
texture
not creamy creamy
sandy not sandy
comment:
overall impression
� ☺
comment: THANK YOU!
Fig. 12: Sensor evaluation sheet of the beverages
85
7.3.20 Statistics
The statistical evaluation of the texture measuring, rate of expansion and sensory
characteristics was done by means of StatGraphics® Plus for Windows version 4.0 and
version 5.0, respectively (©Statistical Graphics Corp.; USA). The results were
statistically analysed, using ANOVA (Multiple F-test) and Fisher`s least significant
difference (LSD) test (Multiple Range Test). Statistically significant differences were
indicated by means of a letters coding. Same letters are indicating a homogenous
group and thus, no significant difference. Different letters designate a statistically
significant difference of the results.
The arithmetic means were calculated by the Excel function =mean() or they were
taken from the Statgraphics Summary Statistics.
The standard deviation was calculated by the Excel function =Stabw() and the variation
coefficient was calculated by the Excel function =Stabw()/mean() * 100.
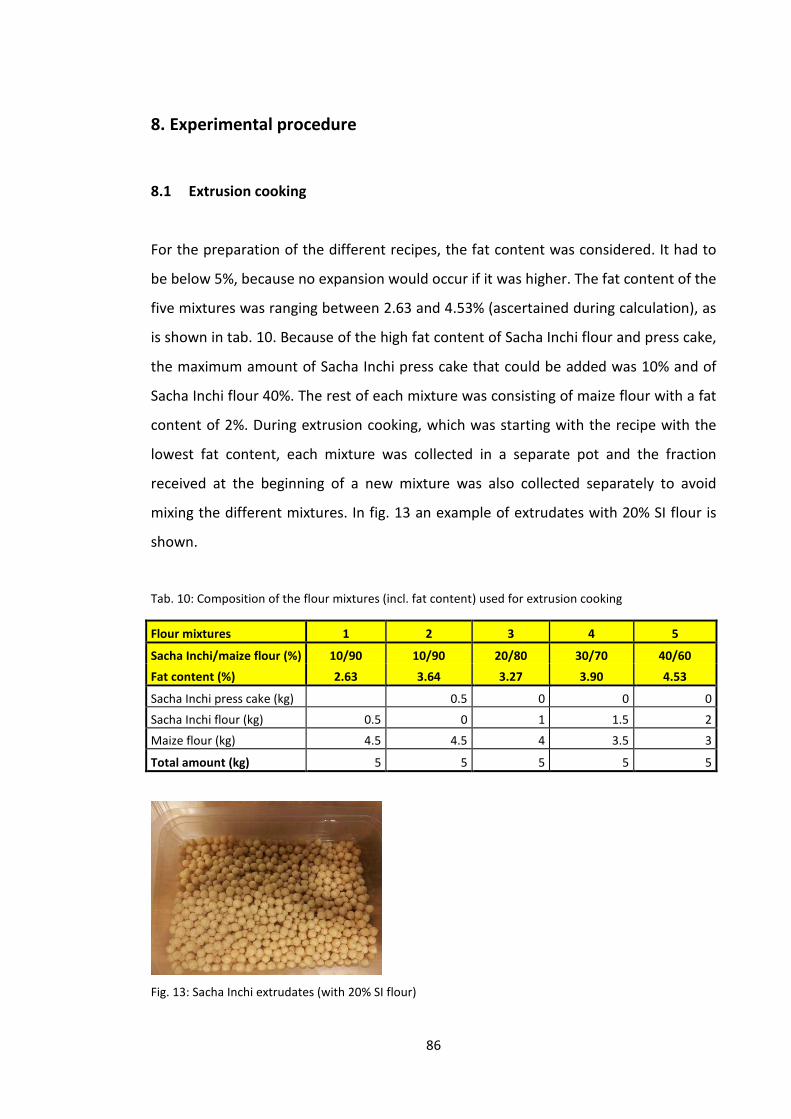
86
8. Experimental procedure
8.1 Extrusion cooking
For the preparation of the different recipes, the fat content was considered. It had to
be below 5%, because no expansion would occur if it was higher. The fat content of the
five mixtures was ranging between 2.63 and 4.53% (ascertained during calculation), as
is shown in tab. 10. Because of the high fat content of Sacha Inchi flour and press cake,
the maximum amount of Sacha Inchi press cake that could be added was 10% and of
Sacha Inchi flour 40%. The rest of each mixture was consisting of maize flour with a fat
content of 2%. During extrusion cooking, which was starting with the recipe with the
lowest fat content, each mixture was collected in a separate pot and the fraction
received at the beginning of a new mixture was also collected separately to avoid
mixing the different mixtures. In fig. 13 an example of extrudates with 20% SI flour is
shown.
Tab. 10: Composition of the flour mixtures (incl. fat content) used for extrusion cooking
Flour mixtures 1 2 3 4 5
Sacha Inchi/maize flour (%) 10/90 10/90 20/80 30/70 40/60
Fat content (%) 2.63 3.64 3.27 3.90 4.53
Sacha Inchi press cake (kg) 0.5 0 0 0
Sacha Inchi flour (kg) 0.5 0 1 1.5 2
Maize flour (kg) 4.5 4.5 4 3.5 3
Total amount (kg) 5 5 5 5 5
Fig. 13: Sacha Inchi extrudates (with 20% SI flour)
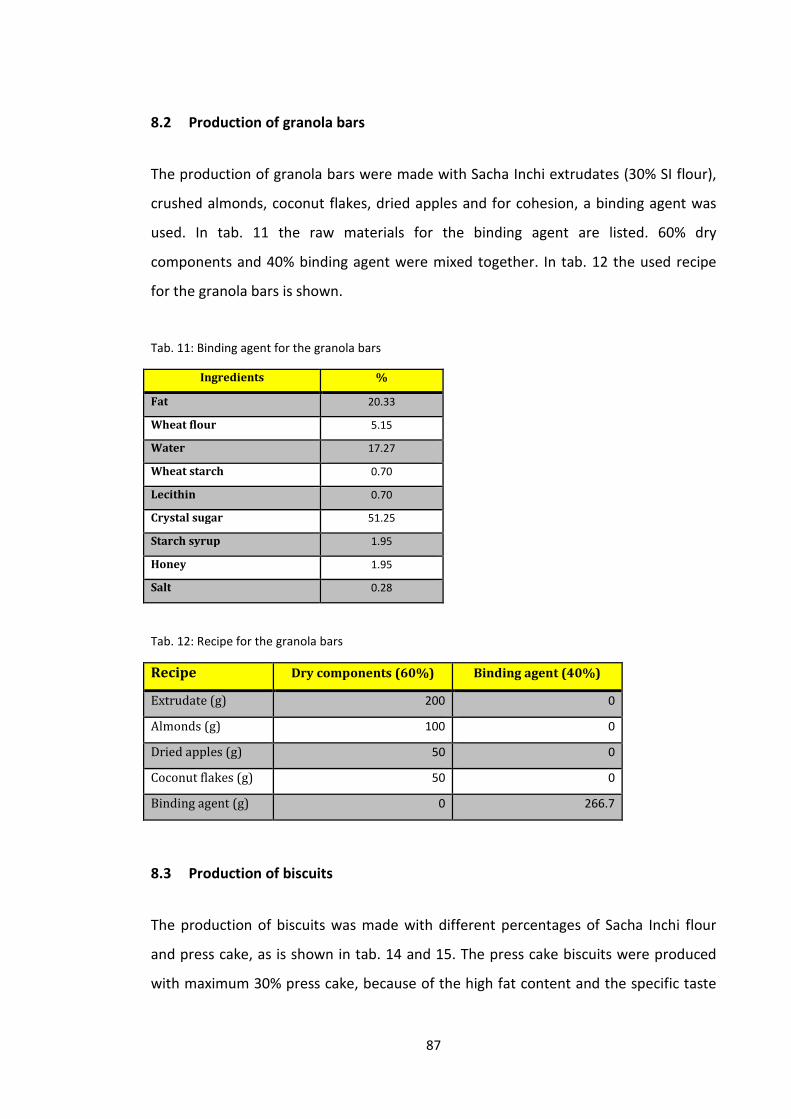
87
8.2 Production of granola bars
The production of granola bars were made with Sacha Inchi extrudates (30% SI flour),
crushed almonds, coconut flakes, dried apples and for cohesion, a binding agent was
used. In tab. 11 the raw materials for the binding agent are listed. 60% dry
components and 40% binding agent were mixed together. In tab. 12 the used recipe
for the granola bars is shown.
Tab. 11: Binding agent for the granola bars
Ingredients %
Fat 20.33
Wheat flour 5.15
Water 17.27
Wheat starch 0.70
Lecithin 0.70
Crystal sugar 51.25
Starch syrup 1.95
Honey 1.95
Salt 0.28
Tab. 12: Recipe for the granola bars
Recipe Dry components (60%) Binding agent (40%)
Extrudate (g) 200 0
Almonds (g) 100 0
Dried apples (g) 50 0
Coconut flakes (g) 50 0
Binding agent (g) 0 266.7
8.3 Production of biscuits
The production of biscuits was made with different percentages of Sacha Inchi flour
and press cake, as is shown in tab. 14 and 15. The press cake biscuits were produced
with maximum 30% press cake, because of the high fat content and the specific taste
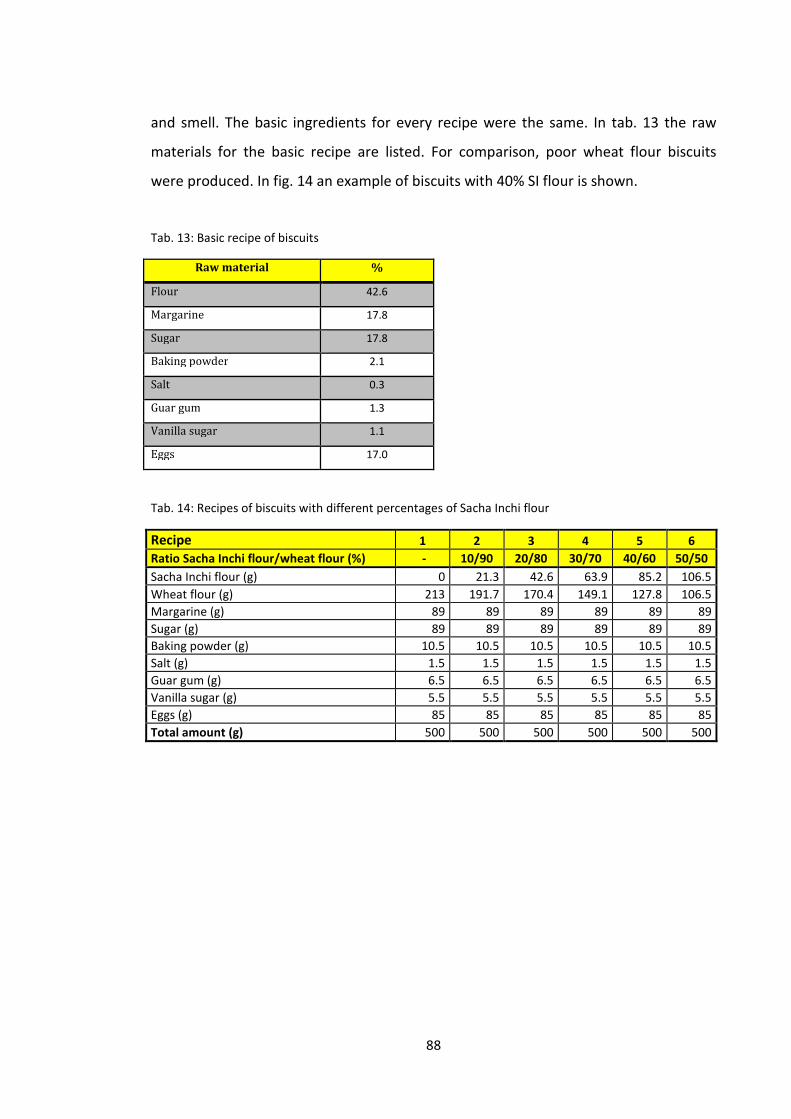
88
and smell. The basic ingredients for every recipe were the same. In tab. 13 the raw
materials for the basic recipe are listed. For comparison, poor wheat flour biscuits
were produced. In fig. 14 an example of biscuits with 40% SI flour is shown.
Tab. 13: Basic recipe of biscuits
Raw material %
Flour 42.6
Margarine 17.8
Sugar 17.8
Baking powder 2.1
Salt 0.3
Guar gum 1.3
Vanilla sugar 1.1
Eggs 17.0
Tab. 14: Recipes of biscuits with different percentages of Sacha Inchi flour
Recipe 1 2 3 4 5 6
Ratio Sacha Inchi flour/wheat flour (%) - 10/90 20/80 30/70 40/60 50/50
Sacha Inchi flour (g) 0 21.3 42.6 63.9 85.2 106.5
Wheat flour (g) 213 191.7 170.4 149.1 127.8 106.5
Margarine (g) 89 89 89 89 89 89
Sugar (g) 89 89 89 89 89 89
Baking powder (g) 10.5 10.5 10.5 10.5 10.5 10.5
Salt (g) 1.5 1.5 1.5 1.5 1.5 1.5
Guar gum (g) 6.5 6.5 6.5 6.5 6.5 6.5
Vanilla sugar (g) 5.5 5.5 5.5 5.5 5.5 5.5
Eggs (g) 85 85 85 85 85 85
Total amount (g) 500 500 500 500 500 500
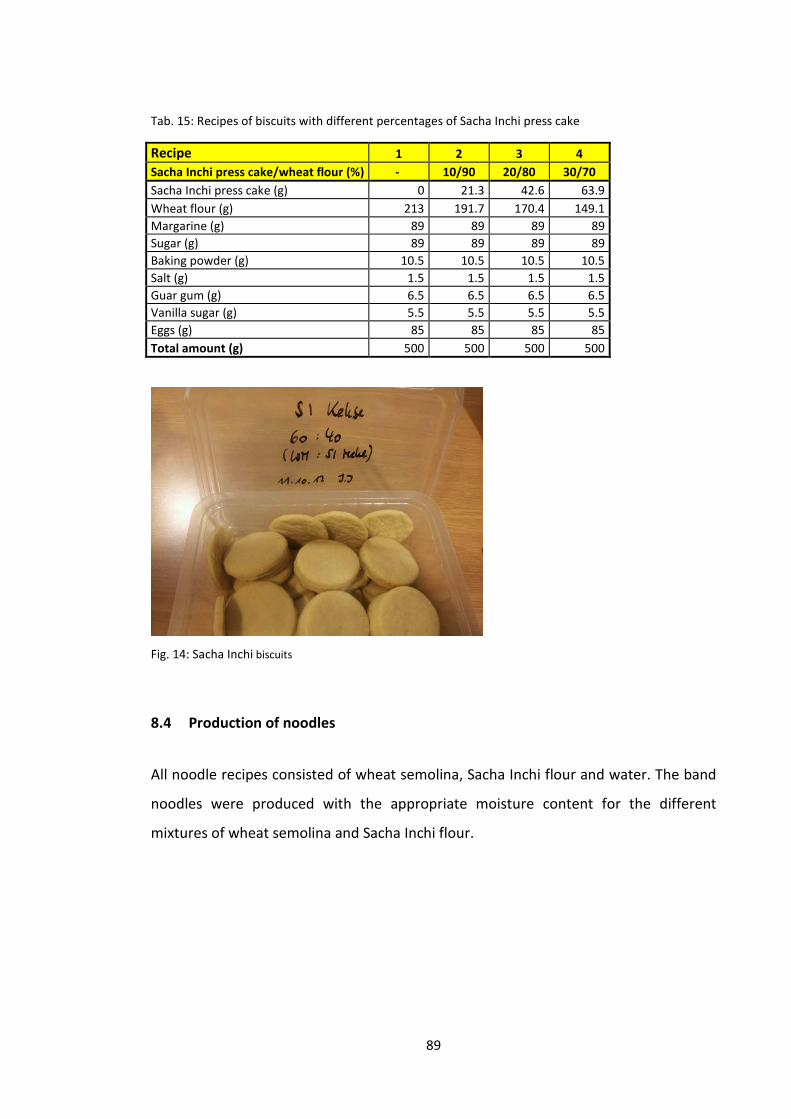
89
Tab. 15: Recipes of biscuits with different percentages of Sacha Inchi press cake
Recipe 1 2 3 4
Sacha Inchi press cake/wheat flour (%) - 10/90 20/80 30/70
Sacha Inchi press cake (g) 0 21.3 42.6 63.9
Wheat flour (g) 213 191.7 170.4 149.1
Margarine (g) 89 89 89 89
Sugar (g) 89 89 89 89
Baking powder (g) 10.5 10.5 10.5 10.5
Salt (g) 1.5 1.5 1.5 1.5
Guar gum (g) 6.5 6.5 6.5 6.5
Vanilla sugar (g) 5.5 5.5 5.5 5.5
Eggs (g) 85 85 85 85
Total amount (g) 500 500 500 500
Fig. 14: Sacha Inchi biscuits
8.4 Production of noodles
All noodle recipes consisted of wheat semolina, Sacha Inchi flour and water. The band
noodles were produced with the appropriate moisture content for the different
mixtures of wheat semolina and Sacha Inchi flour.
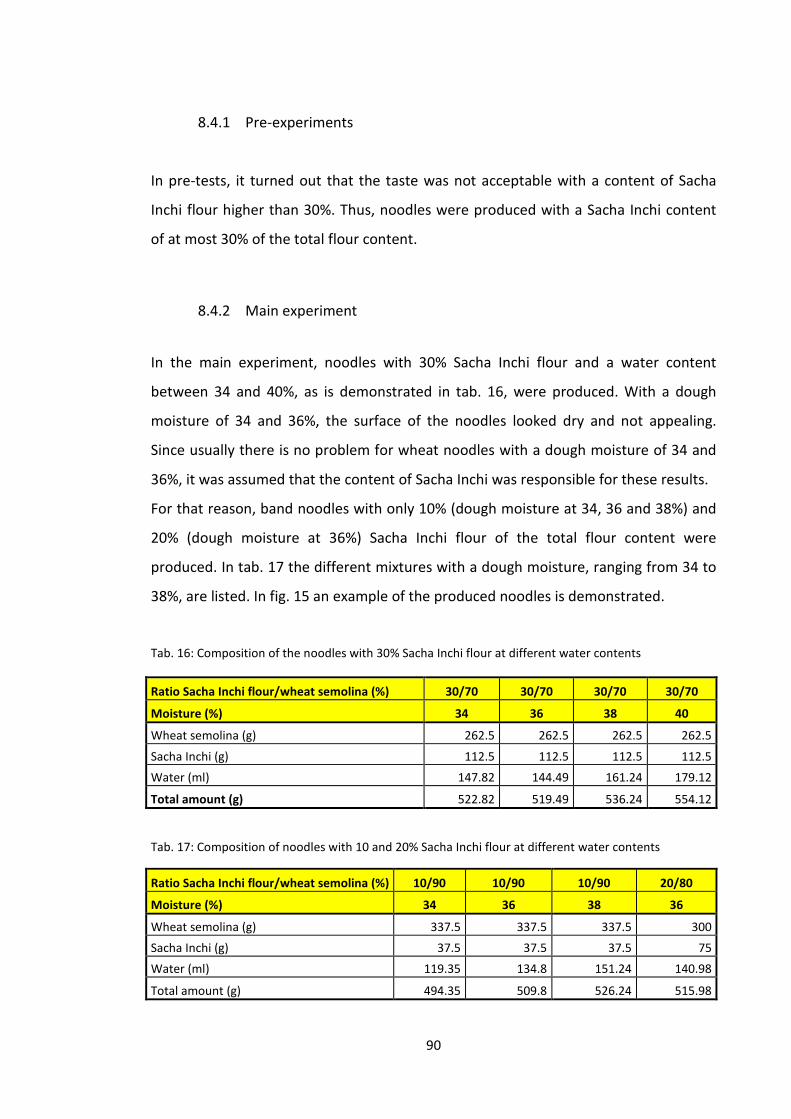
90
8.4.1 Pre-experiments
In pre-tests, it turned out that the taste was not acceptable with a content of Sacha
Inchi flour higher than 30%. Thus, noodles were produced with a Sacha Inchi content
of at most 30% of the total flour content.
8.4.2 Main experiment
In the main experiment, noodles with 30% Sacha Inchi flour and a water content
between 34 and 40%, as is demonstrated in tab. 16, were produced. With a dough
moisture of 34 and 36%, the surface of the noodles looked dry and not appealing.
Since usually there is no problem for wheat noodles with a dough moisture of 34 and
36%, it was assumed that the content of Sacha Inchi was responsible for these results.
For that reason, band noodles with only 10% (dough moisture at 34, 36 and 38%) and
20% (dough moisture at 36%) Sacha Inchi flour of the total flour content were
produced. In tab. 17 the different mixtures with a dough moisture, ranging from 34 to
38%, are listed. In fig. 15 an example of the produced noodles is demonstrated.
Tab. 16: Composition of the noodles with 30% Sacha Inchi flour at different water contents
Ratio Sacha Inchi flour/wheat semolina (%) 30/70 30/70 30/70 30/70
Moisture (%) 34 36 38 40
Wheat semolina (g) 262.5 262.5 262.5 262.5
Sacha Inchi (g) 112.5 112.5 112.5 112.5
Water (ml) 147.82 144.49 161.24 179.12
Total amount (g) 522.82 519.49 536.24 554.12
Tab. 17: Composition of noodles with 10 and 20% Sacha Inchi flour at different water contents
Ratio Sacha Inchi flour/wheat semolina (%) 10/90 10/90 10/90 20/80
Moisture (%) 34 36 38 36
Wheat semolina (g) 337.5 337.5 337.5 300
Sacha Inchi (g) 37.5 37.5 37.5 75
Water (ml) 119.35 134.8 151.24 140.98
Total amount (g) 494.35 509.8 526.24 515.98
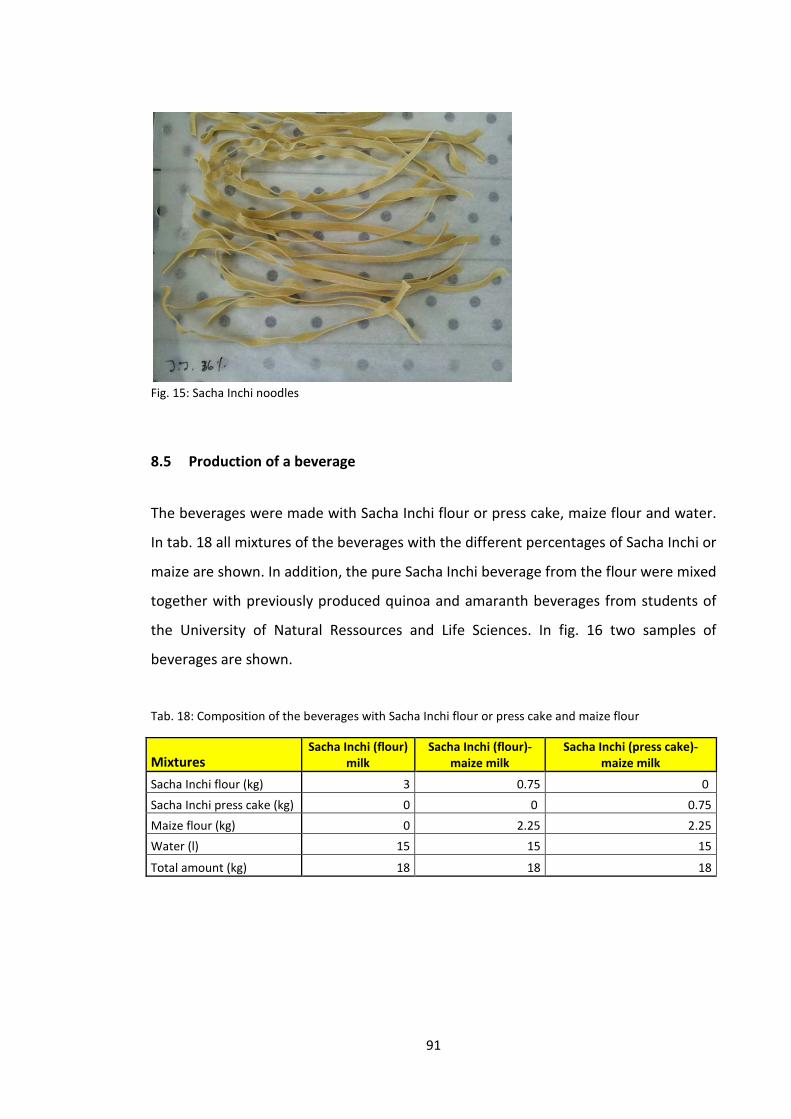
91
Fig. 15: Sacha Inchi noodles
8.5 Production of a beverage
The beverages were made with Sacha Inchi flour or press cake, maize flour and water.
In tab. 18 all mixtures of the beverages with the different percentages of Sacha Inchi or
maize are shown. In addition, the pure Sacha Inchi beverage from the flour were mixed
together with previously produced quinoa and amaranth beverages from students of
the University of Natural Ressources and Life Sciences. In fig. 16 two samples of
beverages are shown.
Tab. 18: Composition of the beverages with Sacha Inchi flour or press cake and maize flour
Mixtures Sacha Inchi (flour)
milk
Sacha Inchi (flour)-
maize milk
Sacha Inchi (press cake)-
maize milk
Sacha Inchi flour (kg) 3 0.75 0
Sacha Inchi press cake (kg) 0 0 0.75
Maize flour (kg) 0 2.25 2.25
Water (l) 15 15 15
Total amount (kg) 18 18 18
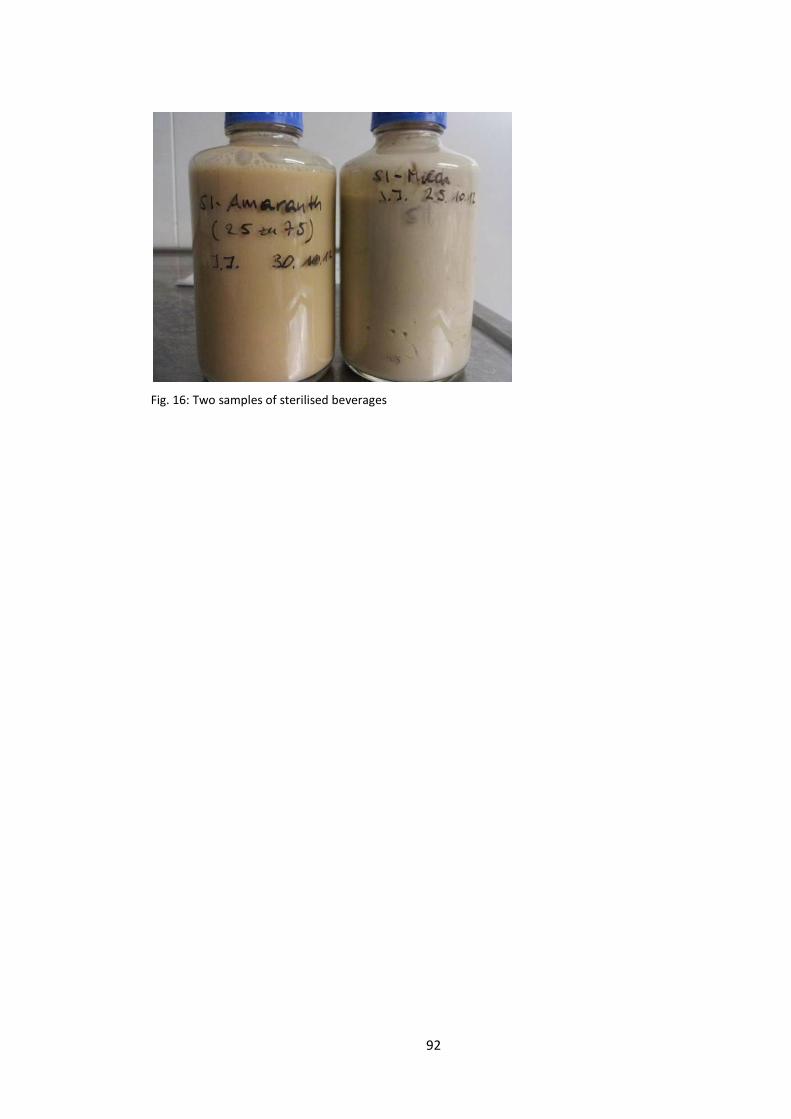
92
Fig. 16: Two samples of sterilised beverages
93
9. Results and discussion
9.1 Determination of the chemical composition and physical properties
In tab. 19 all results of the chemical and functional analyses are shown in % dry matter
(except of viscosity and protein solubility).
The dry solid content is differing a lot between the four samples (flour, press cake,
seeds and hulls) which were stored under the same conditions (at 4 °C). The dry matter
content is an important parameter for further studies, to normalize their results and to
describe the result, regardless of the water content. The results for dry matter were
ranging between 96.72% (3.28% moisture) in the flour and 90.47% (9.53% moisture) in
the hulls. The press cake had a dry matter content of 92.30% (7.7% moisture) and the
seeds a content of 91.33% (8.67% moisture). In the literature, a lower water content in
the seeds (3.3%) was investigated (Tab. 1) [GUTIÉRREZ et al., 2011]. The water content
in the flour was comparable with the value, investigated by the company
Agroindustrias Osho S.A.C., Peru (max 6%). Sacha Inchi cake had compared with rape
expeller cake (13% moisture) [FERCHAU, 2000] a lower water content.
The determined fat content of 8.61% in the flour is comparable with the content
investigated by Agroindustrias Osho S.A.C., Peru (max. 9%). During press cake and flour
processing, the fat content decreases through pressing and thus, the fat values in the
end product, the flour (after expelling), are much lower. In the seeds, the fat content
achieved a value of 40.48%, which is in the range of the determined oil contents from
GUILLÉN et al. (2003) (35 - 60%). The fat content in the press cake and hulls reached
19.90 and 3.85%. The fat content in Sacha Inchi flour was a little higher than the
content in soybean flour (using extrusion-expeller method) [GUNSTONE et al., 2011].
In the Sacha Inchi press cake, the fat content was higher than in low fat soybean cake
[NELSON, 1987], rape expeller cake [FERCHAU, 2000] or sunflower cake (obtained by
cold extraction) [ANONYM, 2010].
The highest protein values were achieved in the flour and press cake (56.63 and
51.76%). The protein value in the flour is comparable with the value, investigated from
94
the company Agroindustrias Osho S.A.C., Peru (min. 55%). The seeds had a protein
content of 22.01%, which is comparable with the determined protein content from
GUTIÉRREZ et al. (2011) (24.7%), but lower than the protein content investigated from
MAURER et al. (2012) (27%). The hulls had the lowest content with a value of 9.46%.
The protein value is dependent on the species and fertilization (soil) and thus, different
percentages are possible. The protein values in Sacha Inchi flour were higher than the
values in soybean flour (obtained by solvent extraction) [BONNARDEAUX, 2007] and
also Sacha Inchi press cake contained more protein than rape expeller cake [FERCHAU,
2000] or flaxseed (prior defatting), but less after defatting [GUTIÉRREZ et al., 2010].
Low fat soybean cake had almost the same protein values [NELSON, 1987] than Sacha
Inchi cake.
All samples contained almost no starch. The content was ranging between 0.03% in the
press cake and 1.21% in the hulls. The seeds reached a value of 0.05%. Thus, the
production of usually starch-containing grain products is a challenge and
saccharification of the pure Sacha Inchi beverage was not possible. Sacha Inchi flour
(0.04%) had in comparison with canola and soybean meal (obtained by solvent
extraction, 5.2 respectively 5.46%) a very low starch content.
In all four samples almost no glucose was present. 0.002% were included in the flour,
0.11% in the press cake, 0.05% in the seeds and 0.01% in the hulls.
The ash content in the flour and press cake was almost the same (5.73 and 5.07%), as
expected. Comparing to the literature, the ash content in the seeds (2.43%) was lower
than the investigated value from GUTIÉRREZ et al. (2011) (4.0%). The hulls had the
lowest ash content (1.40%). The different contents in the seeds could occur by reason
of changed climate or vegetal conditions.
The insoluble dietary fibre content was much higher in the hulls with 84.82% than in all
other samples and thus, also the total dietary fibre content was the highest in the hulls
(85.44%), followed by the press cake (25.29%), the flour (25.27%) and the seeds
(22.16%). The soluble dietary fibre content was lower in the flour (2.28%) than the
values investigated by Agroindustrias Osho S.A.C., Peru (3 - 7%).
95
The resistant starch content was ranging between 0.01% (non-resistant starch: 1.54%)
in the flour and 0.3% (non-resistant starch: 2.28%) in the seeds.
With a value of 853.83 mg/100 g, the total phenol content in the hulls was the highest,
followed by the press cake (311.87 mg/100 g), the seeds (156.44 mg/100 g) and the
flour (155.41 mg/100 g). This showed that heat treatment decreased the total phenol
content. The phenol content was lower in the end product (SI flour), when all
processing steps were traversed by Sacha Inchi press cake into flour (shown in the
production flow chart in fig. 5).
The water absorption index (WAI) in the flour and press cake was 3.21 and 4.39 g/g,
respectively. The seeds and hulls had an index of 2.37 and 2.67 g/g. The water
solubility index (WSI) was much lower in the seeds with 1.92% than the value in the
flour (12.39%), followed by the value in the hulls (23.09%). The press cake with a
percentage of 26.22% had the highest water solubility index.
In the press cake and seeds, the viscosity was rather high (149.33 and 82.67 cP),
compared to Sacha Inchi oil [GUTIÉRREZ et al., 2011] (35.4 cP). The flour had a viscosity
of 10.33 cP and the hulls of only 4.33 cP.
The protein solubility was the highest in the press cake with 38.00 mg/g, followed by
the seeds (20.52 mg/g), the flour (10.66 mg/g) and the hulls (4.85 mg/g).
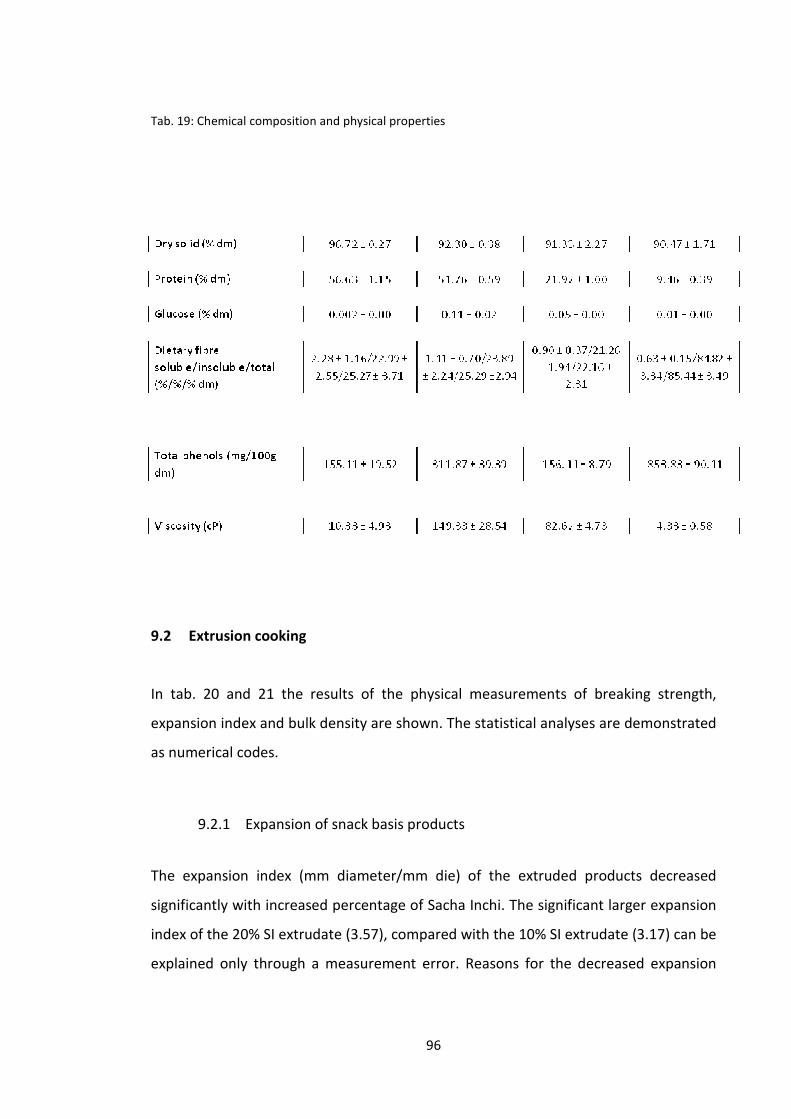
Tab. 19: Chemical composition and physical properties
9.2 Extrusion cooking
In tab. 20 and 21 the results of
expansion index and
as numerical codes.
9.2.1 Expansion of snack basis products
The expansion index (mm diameter/mm die) of the extruded products decreased
significantly with increased
index of the 20% SI extrudate (3.57), compared with the 10% SI extrudate (3.17) can be
explained only through a measurement error.
96
Chemical composition and physical properties
Extrusion cooking
the results of the physical measurements of
bulk density are shown. The statistical analyse
Expansion of snack basis products
The expansion index (mm diameter/mm die) of the extruded products decreased
with increased percentage of Sacha Inchi. The significant larger
0% SI extrudate (3.57), compared with the 10% SI extrudate (3.17) can be
explained only through a measurement error. Reasons for the d
urements of breaking strength,
he statistical analyses are demonstrated
The expansion index (mm diameter/mm die) of the extruded products decreased
The significant larger expansion
0% SI extrudate (3.57), compared with the 10% SI extrudate (3.17) can be
the decreased expansion
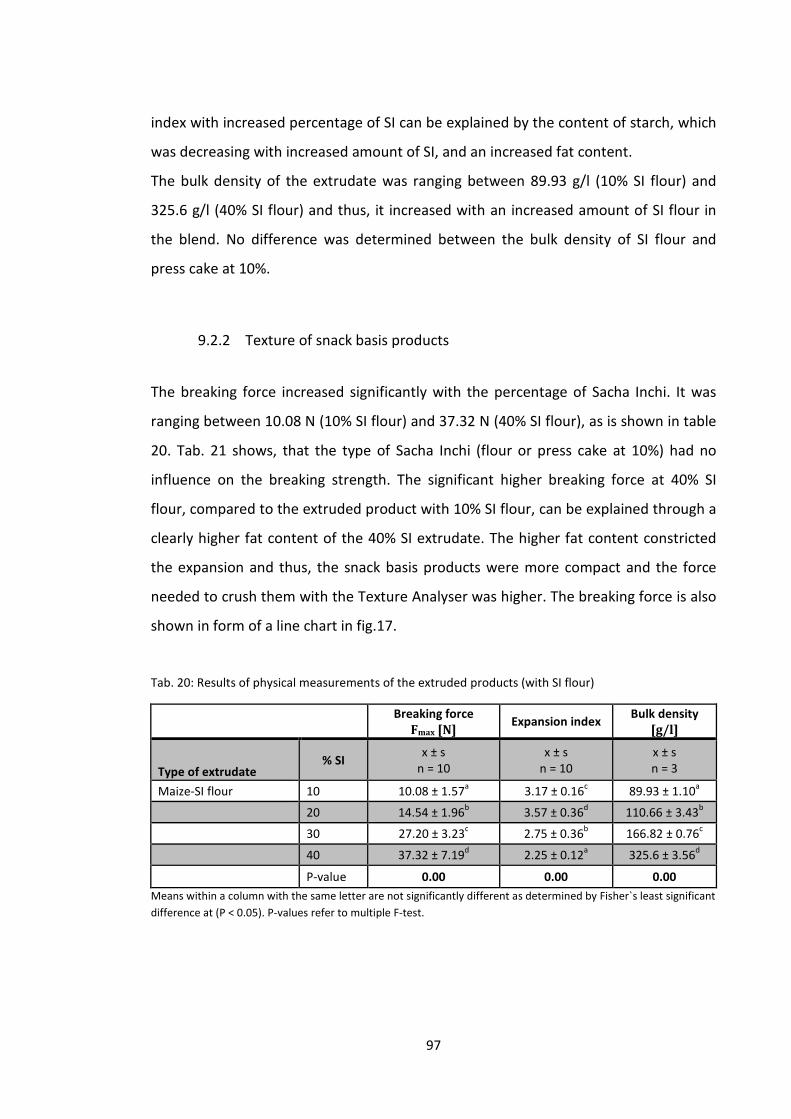
97
index with increased percentage of SI can be explained by the content of starch, which
was decreasing with increased amount of SI, and an increased fat content.
The bulk density of the extrudate was ranging between 89.93 g/l (10% SI flour) and
325.6 g/l (40% SI flour) and thus, it increased with an increased amount of SI flour in
the blend. No difference was determined between the bulk density of SI flour and
press cake at 10%.
9.2.2 Texture of snack basis products
The breaking force increased significantly with the percentage of Sacha Inchi. It was
ranging between 10.08 N (10% SI flour) and 37.32 N (40% SI flour), as is shown in table
20. Tab. 21 shows, that the type of Sacha Inchi (flour or press cake at 10%) had no
influence on the breaking strength. The significant higher breaking force at 40% SI
flour, compared to the extruded product with 10% SI flour, can be explained through a
clearly higher fat content of the 40% SI extrudate. The higher fat content constricted
the expansion and thus, the snack basis products were more compact and the force
needed to crush them with the Texture Analyser was higher. The breaking force is also
shown in form of a line chart in fig.17.
Tab. 20: Results of physical measurements of the extruded products (with SI flour)
Breaking force
Fmax [N] Expansion index
Bulk density
[g/l]
Type of extrudate % SI
x ± s n = 10
x ± s n = 10
x ± s n = 3
Maize-SI flour 10 10.08 ± 1.57a 3.17 ± 0.16
c 89.93 ± 1.10
a
20 14.54 ± 1.96b 3.57 ± 0.36
d 110.66 ± 3.43
b
30 27.20 ± 3.23c 2.75 ± 0.36
b 166.82 ± 0.76
c
40 37.32 ± 7.19d 2.25 ± 0.12
a 325.6 ± 3.56
d
P-value 0.00 0.00 0.00
Means within a column with the same letter are not significantly different as determined by Fisher`s least significant
difference at (P < 0.05). P-values refer to multiple F-test.
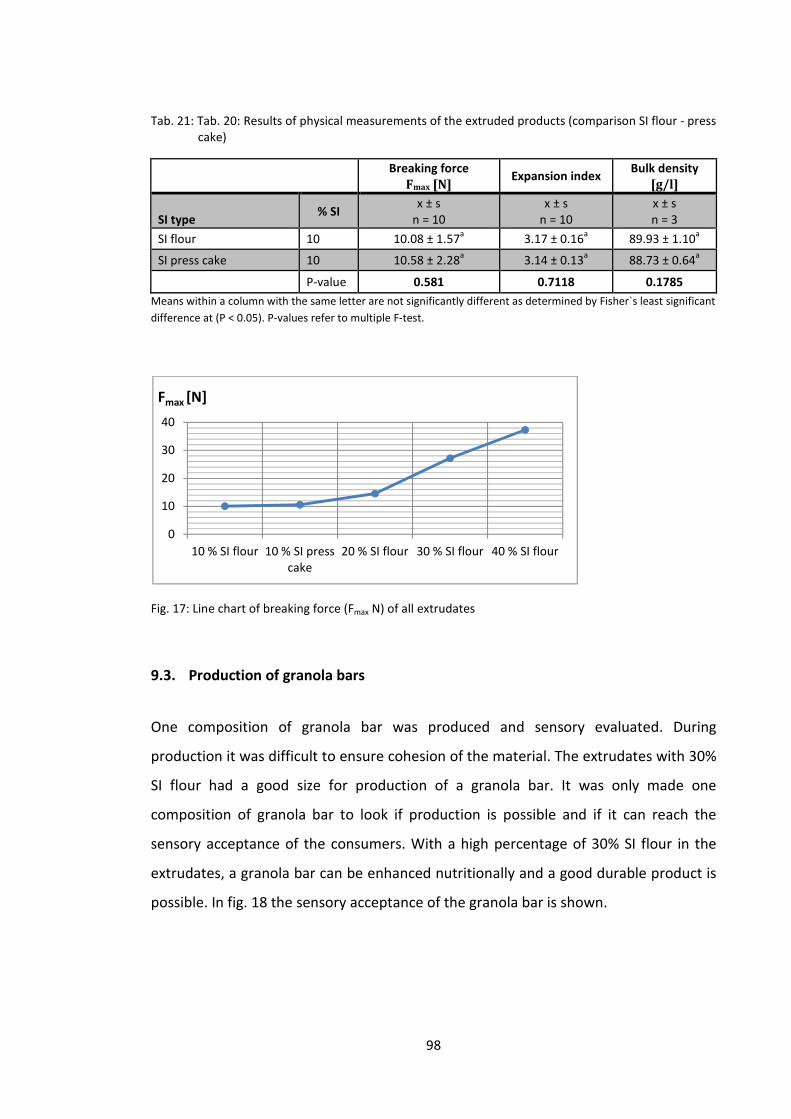
98
Tab. 21: Tab. 20: Results of physical measurements of the extruded products (comparison SI flour - press cake)
Breaking force
Fmax [N] Expansion index
Bulk density
[g/l]
SI type % SI
x ± s n = 10
x ± s n = 10
x ± s n = 3
SI flour 10 10.08 ± 1.57a 3.17 ± 0.16
a 89.93 ± 1.10
a
SI press cake 10 10.58 ± 2.28a 3.14 ± 0.13
a 88.73 ± 0.64
a
P-value 0.581 0.7118 0.1785
Means within a column with the same letter are not significantly different as determined by Fisher`s least significant
difference at (P < 0.05). P-values refer to multiple F-test.
Fig. 17: Line chart of breaking force (Fmax N) of all extrudates
9.3. Production of granola bars
One composition of granola bar was produced and sensory evaluated. During
production it was difficult to ensure cohesion of the material. The extrudates with 30%
SI flour had a good size for production of a granola bar. It was only made one
composition of granola bar to look if production is possible and if it can reach the
sensory acceptance of the consumers. With a high percentage of 30% SI flour in the
extrudates, a granola bar can be enhanced nutritionally and a good durable product is
possible. In fig. 18 the sensory acceptance of the granola bar is shown.
0
10
20
30
40
10 % SI flour 10 % SI press cake
20 % SI flour 30 % SI flour 40 % SI flour
Fmax [N]
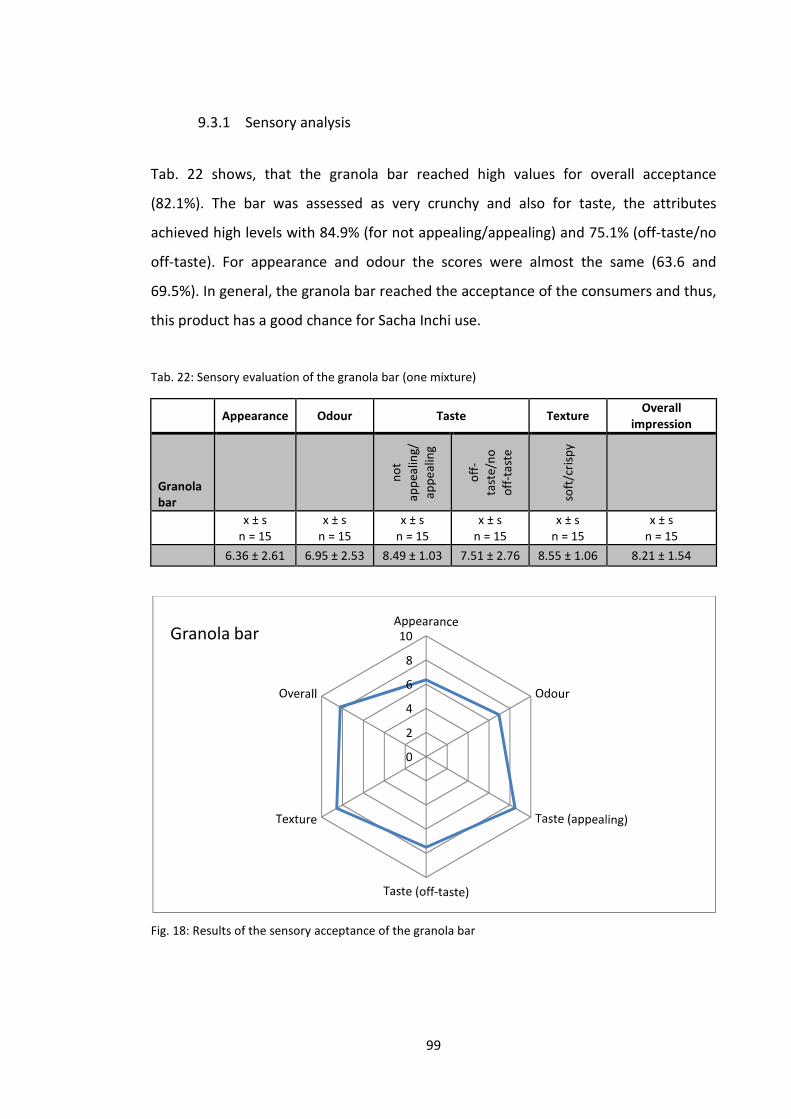
99
9.3.1 Sensory analysis
Tab. 22 shows, that the granola bar reached high values for overall acceptance
(82.1%). The bar was assessed as very crunchy and also for taste, the attributes
achieved high levels with 84.9% (for not appealing/appealing) and 75.1% (off-taste/no
off-taste). For appearance and odour the scores were almost the same (63.6 and
69.5%). In general, the granola bar reached the acceptance of the consumers and thus,
this product has a good chance for Sacha Inchi use.
Tab. 22: Sensory evaluation of the granola bar (one mixture)
Appearance Odour Taste Texture
Overall
impression
Granola
bar
no
t
app
ealin
g/
app
ealin
g
off
-
tast
e/n
o
off
-tas
te
soft
/cri
spy
x ± s n = 15
x ± s n = 15
x ± s n = 15
x ± s n = 15
x ± s n = 15
x ± s n = 15
6.36 ± 2.61 6.95 ± 2.53 8.49 ± 1.03 7.51 ± 2.76 8.55 ± 1.06 8.21 ± 1.54
Fig. 18: Results of the sensory acceptance of the granola bar
0
2
4
6
8
10Granola bar
100
9.4 Production of biscuits
In tab. 23 and 24 the results of physical measurements of the breaking force and the
spreading factor (diameter [mm]/high [mm]) are shown and the statistical analyses are
demonstrated as numerical codes. During production, there were no differences
between the biscuits. The results of the sensory evaluation (the higher the score, the
higher the acceptance of the consumer), including the statistical analysis as numerical
codes, are shown in tab. 25.
9.4.1 Spreading factor of the biscuits
In the group of SI flour blends, the spreading factor increased significantly with the
percentage of SI flour (7.49 at 10% until 8.34 at 50% flour), as is shown in tab. 23. This
was only depending on the height (which was decreasing with increasing percentage of
SI flour), the diameter had no influence on the spreading factor. In the group of SI
press cake blends, the spreading factor was not statistically significant different. The
percentage of SI press cake had no influence on the height, the diameter or the
spreading factor. Comparing the two groups of blends, the spreading factor was lower
in the press cake group than in the flour group and thus, it can be concluded, that the
driving force in the press cake samples was higher. The pure wheat flour biscuits
reached the significant highest levels in height (7.14 mm) and lowest in spreading
factor (7.03).
9.4.2 Texture of the biscuits
The breaking force was ranging between 2.36 N (10% SI flour) and 2.71 N (50% SI flour)
in the group of SI flour blends and between 2.85 N (10% press cake) and 4.97 N (30% SI
press cake) in the group of SI press cake blends. The more SI was added, the harder
were the biscuits. All press cake biscuits were significant harder than the flour biscuits,
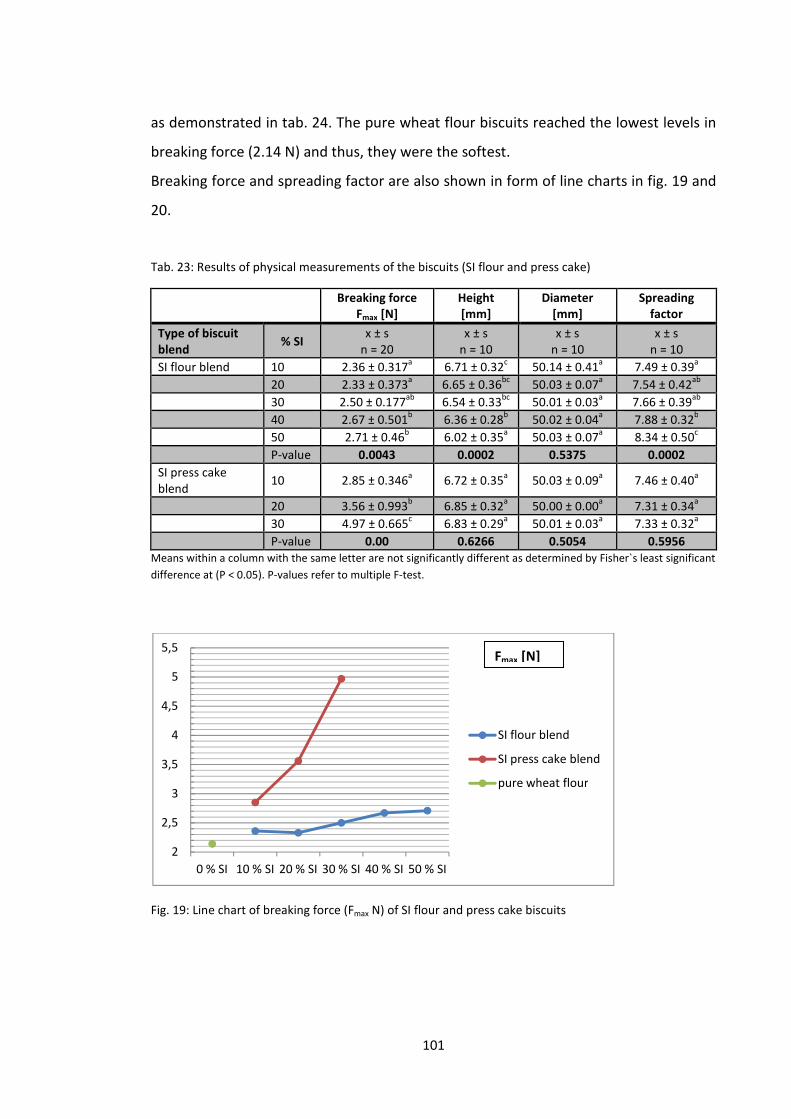
101
as demonstrated in tab. 24. The pure wheat flour biscuits reached the lowest levels in
breaking force (2.14 N) and thus, they were the softest.
Breaking force and spreading factor are also shown in form of line charts in fig. 19 and
20.
Tab. 23: Results of physical measurements of the biscuits (SI flour and press cake)
Breaking force
Fmax [N]
Height
[mm]
Diameter
[mm]
Spreading
factor
Type of biscuit
blend % SI
x ± s n = 20
x ± s n = 10
x ± s n = 10
x ± s n = 10
SI flour blend 10 2.36 ± 0.317a 6.71 ± 0.32
c 50.14 ± 0.41
a 7.49 ± 0.39
a
20 2.33 ± 0.373a 6.65 ± 0.36
bc 50.03 ± 0.07
a 7.54 ± 0.42
ab
30 2.50 ± 0.177ab
6.54 ± 0.33bc
50.01 ± 0.03a 7.66 ± 0.39
ab
40 2.67 ± 0.501b 6.36 ± 0.28
b 50.02 ± 0.04
a 7.88 ± 0.32
b
50 2.71 ± 0.46b 6.02 ± 0.35
a 50.03 ± 0.07
a 8.34 ± 0.50
c
P-value 0.0043 0.0002 0.5375 0.0002
SI press cake blend
10 2.85 ± 0.346a 6.72 ± 0.35
a 50.03 ± 0.09
a 7.46 ± 0.40
a
20 3.56 ± 0.993b 6.85 ± 0.32
a 50.00 ± 0.00
a 7.31 ± 0.34
a
30 4.97 ± 0.665c 6.83 ± 0.29
a 50.01 ± 0.03
a 7.33 ± 0.32
a
P-value 0.00 0.6266 0.5054 0.5956
Means within a column with the same letter are not significantly different as determined by Fisher`s least significant
difference at (P < 0.05). P-values refer to multiple F-test.
Fig. 19: Line chart of breaking force (Fmax N) of SI flour and press cake biscuits
2
2,5
3
3,5
4
4,5
5
5,5
0 % SI 10 % SI 20 % SI 30 % SI 40 % SI 50 % SI
SI flour blend
SI press cake blend
pure wheat flour
Fmax [N]
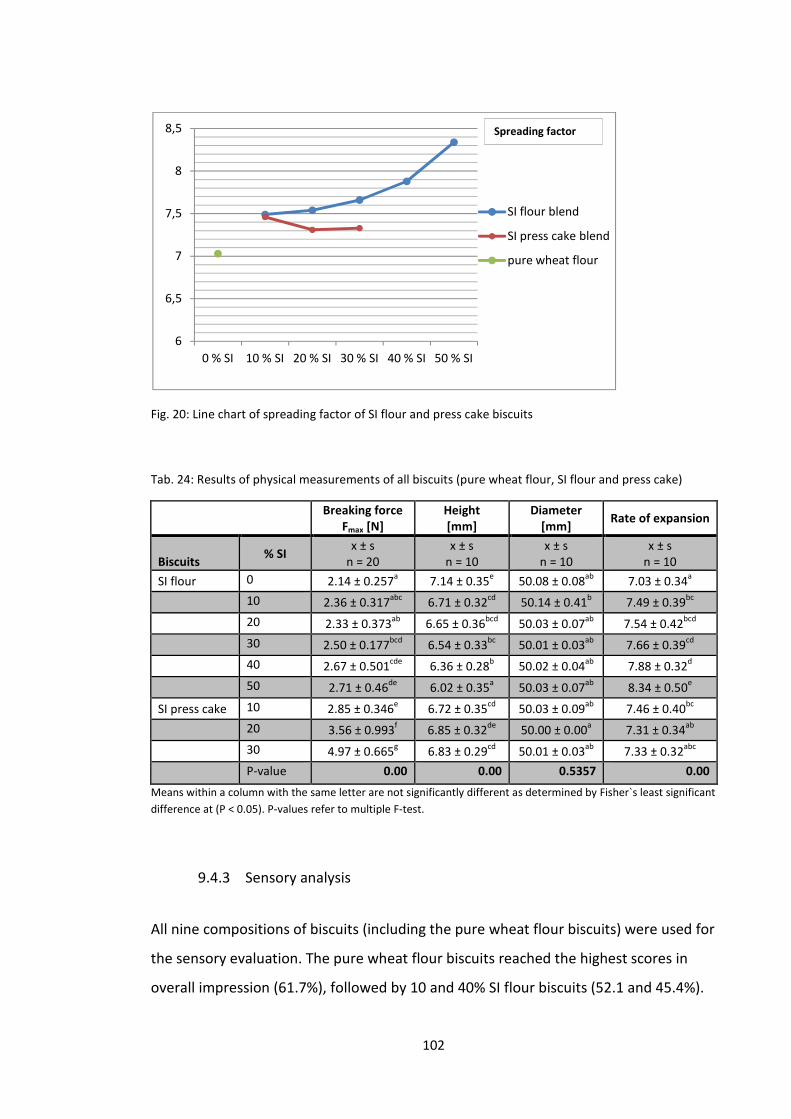
102
Fig. 20: Line chart of spreading factor of SI flour and press cake biscuits
Tab. 24: Results of physical measurements of all biscuits (pure wheat flour, SI flour and press cake)
Breaking force
Fmax [N]
Height
[mm]
Diameter
[mm] Rate of expansion
Biscuits % SI
x ± s n = 20
x ± s n = 10
x ± s n = 10
x ± s n = 10
SI flour 0 2.14 ± 0.257a 7.14 ± 0.35
e 50.08 ± 0.08
ab 7.03 ± 0.34
a
10 2.36 ± 0.317abc
6.71 ± 0.32cd
50.14 ± 0.41b 7.49 ± 0.39
bc
20 2.33 ± 0.373ab
6.65 ± 0.36bcd
50.03 ± 0.07ab
7.54 ± 0.42bcd
30 2.50 ± 0.177bcd
6.54 ± 0.33bc
50.01 ± 0.03ab
7.66 ± 0.39cd
40 2.67 ± 0.501cde
6.36 ± 0.28b 50.02 ± 0.04
ab 7.88 ± 0.32
d
50 2.71 ± 0.46de
6.02 ± 0.35a 50.03 ± 0.07
ab 8.34 ± 0.50
e
SI press cake 10 2.85 ± 0.346e 6.72 ± 0.35
cd 50.03 ± 0.09
ab 7.46 ± 0.40
bc
20 3.56 ± 0.993f 6.85 ± 0.32
de 50.00 ± 0.00
a 7.31 ± 0.34
ab
30 4.97 ± 0.665g 6.83 ± 0.29
cd 50.01 ± 0.03
ab 7.33 ± 0.32
abc
P-value 0.00 0.00 0.5357 0.00
Means within a column with the same letter are not significantly different as determined by Fisher`s least significant
difference at (P < 0.05). P-values refer to multiple F-test.
9.4.3 Sensory analysis
All nine compositions of biscuits (including the pure wheat flour biscuits) were used for
the sensory evaluation. The pure wheat flour biscuits reached the highest scores in
overall impression (61.7%), followed by 10 and 40% SI flour biscuits (52.1 and 45.4%).
6
6,5
7
7,5
8
8,5
0 % SI 10 % SI 20 % SI 30 % SI 40 % SI 50 % SI
SI flour blend
SI press cake blend
pure wheat flour
Spreading factor
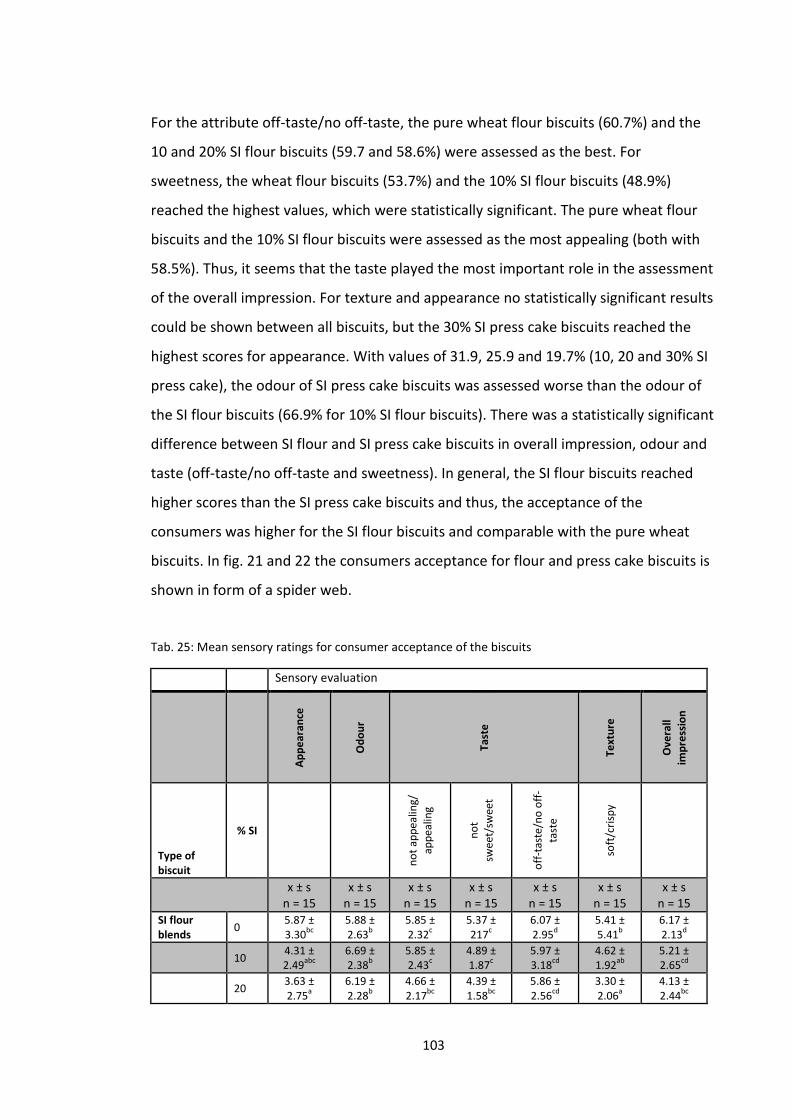
103
For the attribute off-taste/no off-taste, the pure wheat flour biscuits (60.7%) and the
10 and 20% SI flour biscuits (59.7 and 58.6%) were assessed as the best. For
sweetness, the wheat flour biscuits (53.7%) and the 10% SI flour biscuits (48.9%)
reached the highest values, which were statistically significant. The pure wheat flour
biscuits and the 10% SI flour biscuits were assessed as the most appealing (both with
58.5%). Thus, it seems that the taste played the most important role in the assessment
of the overall impression. For texture and appearance no statistically significant results
could be shown between all biscuits, but the 30% SI press cake biscuits reached the
highest scores for appearance. With values of 31.9, 25.9 and 19.7% (10, 20 and 30% SI
press cake), the odour of SI press cake biscuits was assessed worse than the odour of
the SI flour biscuits (66.9% for 10% SI flour biscuits). There was a statistically significant
difference between SI flour and SI press cake biscuits in overall impression, odour and
taste (off-taste/no off-taste and sweetness). In general, the SI flour biscuits reached
higher scores than the SI press cake biscuits and thus, the acceptance of the
consumers was higher for the SI flour biscuits and comparable with the pure wheat
biscuits. In fig. 21 and 22 the consumers acceptance for flour and press cake biscuits is
shown in form of a spider web.
Tab. 25: Mean sensory ratings for consumer acceptance of the biscuits
Sensory evaluation
Ap
pe
ara
nce
Od
ou
r
Ta
ste
Te
xtu
re
Ov
era
ll
imp
ress
ion
Type of
biscuit
% SI
no
t ap
pea
ling/
app
ealin
g
no
t
swee
t/sw
eet
off
-tas
te/n
o o
ff-
tast
e
soft
/cri
spy
x ± s n = 15
x ± s n = 15
x ± s n = 15
x ± s n = 15
x ± s n = 15
x ± s n = 15
x ± s n = 15
SI flour
blends 0
5.87 ± 3.30
bc
5.88 ± 2.63
b
5.85 ± 2.32
c
5.37 ± 217
c
6.07 ± 2.95
d
5.41 ± 5.41
b
6.17 ± 2.13
d
10
4.31 ± 2.49
abc
6.69 ± 2.38
b
5.85 ± 2.43
c
4.89 ± 1.87
c
5.97 ± 3.18
cd
4.62 ± 1.92
ab
5.21 ± 2.65
cd
20
3.63 ± 2.75
a
6.19 ± 2.28
b
4.66 ± 2.17
bc
4.39 ± 1.58
bc
5.86 ± 2.56
cd
3.30 ± 2.06
a
4.13 ± 2.44
bc
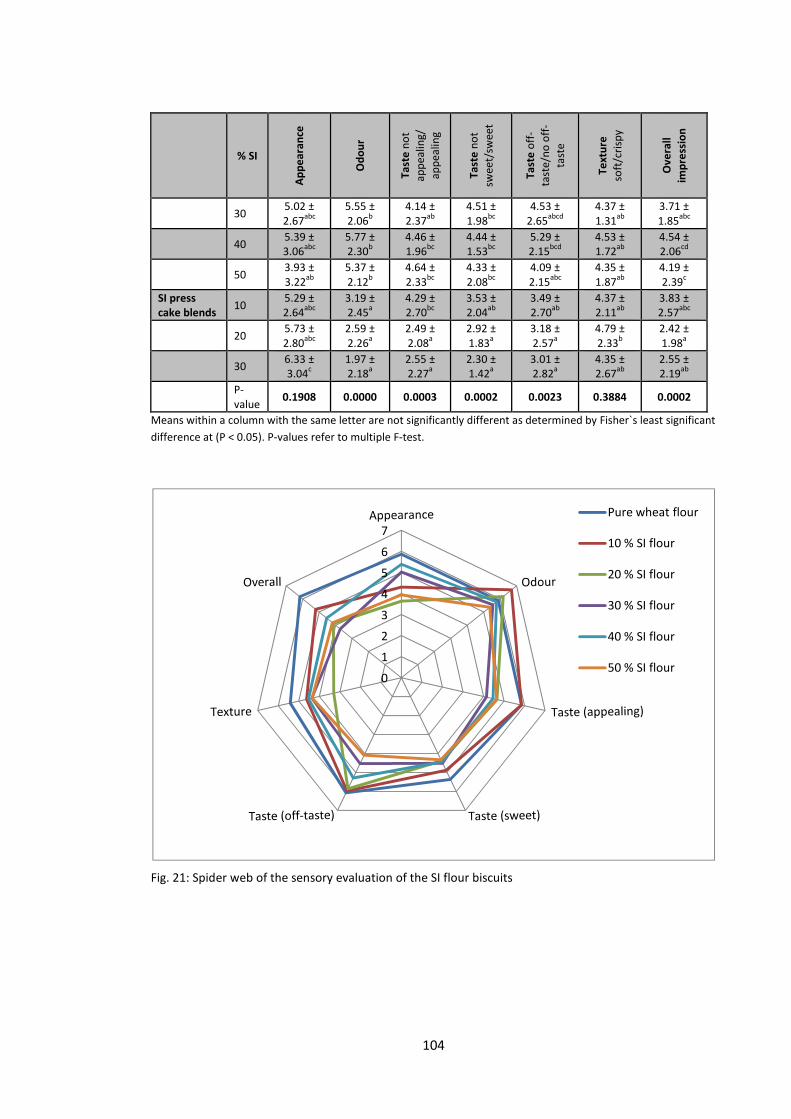
104
% SI
Ap
pe
ara
nce
Od
ou
r
Ta
ste
no
t
app
ealin
g/
app
ealin
g
Ta
ste
no
t
swee
t/sw
eet
Ta
ste
off
-
tast
e/n
o o
ff-
tast
e
Te
xtu
re
soft
/cri
spy
Ov
era
ll
imp
ress
ion
30
5.02 ± 2.67
abc
5.55 ± 2.06
b
4.14 ± 2.37
ab
4.51 ± 1.98
bc
4.53 ± 2.65
abcd
4.37 ± 1.31
ab
3.71 ± 1.85
abc
40
5.39 ± 3.06
abc
5.77 ± 2.30
b
4.46 ± 1.96
bc
4.44 ± 1.53
bc
5.29 ± 2.15
bcd
4.53 ± 1.72
ab
4.54 ± 2.06
cd
50
3.93 ± 3.22
ab
5.37 ± 2.12
b
4.64 ± 2.33
bc
4.33 ± 2.08
bc
4.09 ± 2.15
abc
4.35 ± 1.87
ab
4.19 ± 2.39
c
SI press
cake blends 10
5.29 ± 2.64
abc
3.19 ± 2.45
a
4.29 ± 2.70
bc
3.53 ± 2.04
ab
3.49 ± 2.70
ab
4.37 ± 2.11
ab
3.83 ± 2.57
abc
20
5.73 ± 2.80
abc
2.59 ± 2.26
a
2.49 ± 2.08
a
2.92 ± 1.83
a
3.18 ± 2.57
a
4.79 ± 2.33
b
2.42 ± 1.98
a
30 6.33 ± 3.04
c
1.97 ± 2.18
a
2.55 ± 2.27
a
2.30 ± 1.42
a
3.01 ± 2.82
a
4.35 ± 2.67
ab
2.55 ± 2.19
ab
P-value
0.1908 0.0000 0.0003 0.0002 0.0023 0.3884 0.0002
Means within a column with the same letter are not significantly different as determined by Fisher`s least significant
difference at (P < 0.05). P-values refer to multiple F-test.
Fig. 21: Spider web of the sensory evaluation of the SI flour biscuits
0
1
2
3
4
5
6
7
Pure wheat flour
10 % SI flour
20 % SI flour
30 % SI flour
40 % SI flour
50 % SI flour
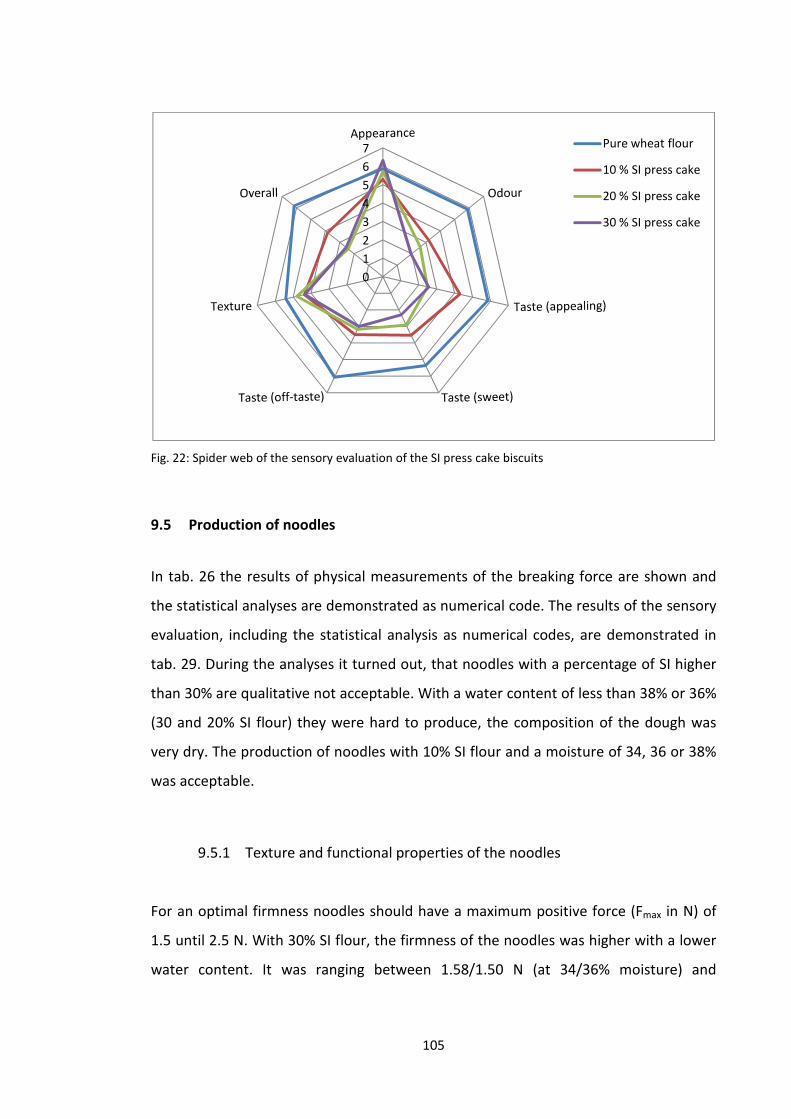
105
Fig. 22: Spider web of the sensory evaluation of the SI press cake biscuits
9.5 Production of noodles
In tab. 26 the results of physical measurements of the breaking force are shown and
the statistical analyses are demonstrated as numerical code. The results of the sensory
evaluation, including the statistical analysis as numerical codes, are demonstrated in
tab. 29. During the analyses it turned out, that noodles with a percentage of SI higher
than 30% are qualitative not acceptable. With a water content of less than 38% or 36%
(30 and 20% SI flour) they were hard to produce, the composition of the dough was
very dry. The production of noodles with 10% SI flour and a moisture of 34, 36 or 38%
was acceptable.
9.5.1 Texture and functional properties of the noodles
For an optimal firmness noodles should have a maximum positive force (Fmax in N) of
1.5 until 2.5 N. With 30% SI flour, the firmness of the noodles was higher with a lower
water content. It was ranging between 1.58/1.50 N (at 34/36% moisture) and
0
1
2
3
4
5
6
7 Pure wheat flour
10 % SI press cake
20 % SI press cake
30 % SI press cake
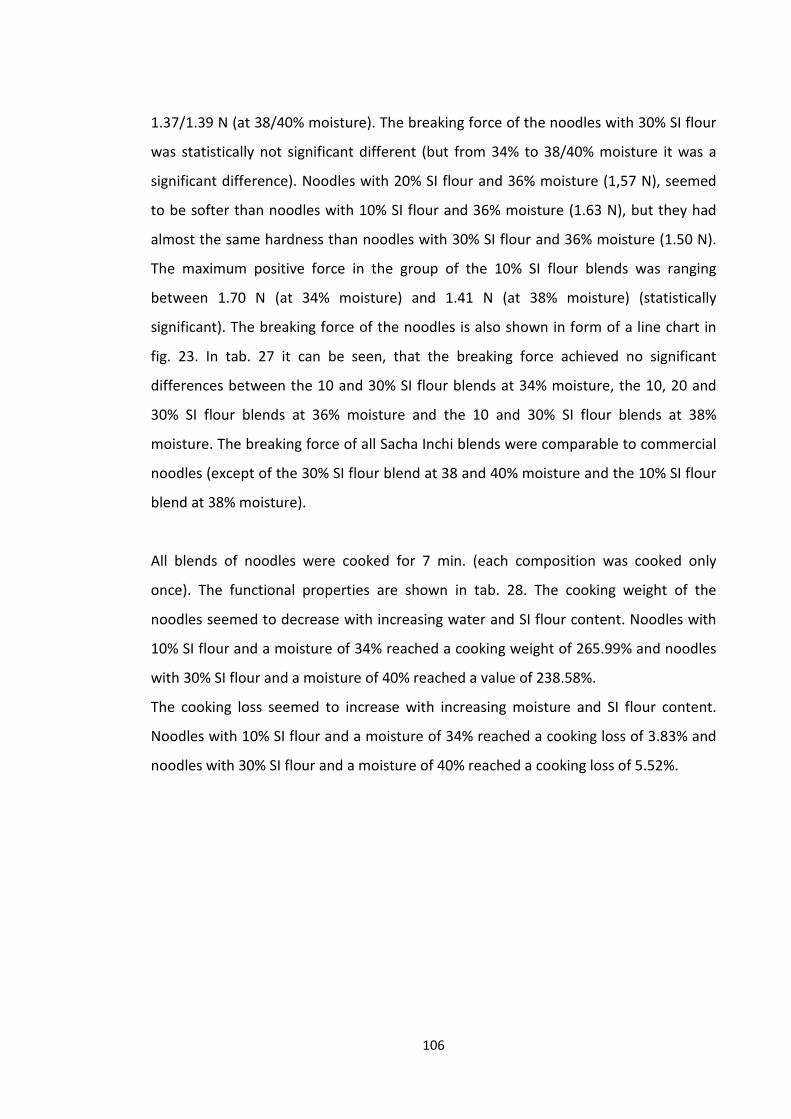
106
1.37/1.39 N (at 38/40% moisture). The breaking force of the noodles with 30% SI flour
was statistically not significant different (but from 34% to 38/40% moisture it was a
significant difference). Noodles with 20% SI flour and 36% moisture (1,57 N), seemed
to be softer than noodles with 10% SI flour and 36% moisture (1.63 N), but they had
almost the same hardness than noodles with 30% SI flour and 36% moisture (1.50 N).
The maximum positive force in the group of the 10% SI flour blends was ranging
between 1.70 N (at 34% moisture) and 1.41 N (at 38% moisture) (statistically
significant). The breaking force of the noodles is also shown in form of a line chart in
fig. 23. In tab. 27 it can be seen, that the breaking force achieved no significant
differences between the 10 and 30% SI flour blends at 34% moisture, the 10, 20 and
30% SI flour blends at 36% moisture and the 10 and 30% SI flour blends at 38%
moisture. The breaking force of all Sacha Inchi blends were comparable to commercial
noodles (except of the 30% SI flour blend at 38 and 40% moisture and the 10% SI flour
blend at 38% moisture).
All blends of noodles were cooked for 7 min. (each composition was cooked only
once). The functional properties are shown in tab. 28. The cooking weight of the
noodles seemed to decrease with increasing water and SI flour content. Noodles with
10% SI flour and a moisture of 34% reached a cooking weight of 265.99% and noodles
with 30% SI flour and a moisture of 40% reached a value of 238.58%.
The cooking loss seemed to increase with increasing moisture and SI flour content.
Noodles with 10% SI flour and a moisture of 34% reached a cooking loss of 3.83% and
noodles with 30% SI flour and a moisture of 40% reached a cooking loss of 5.52%.
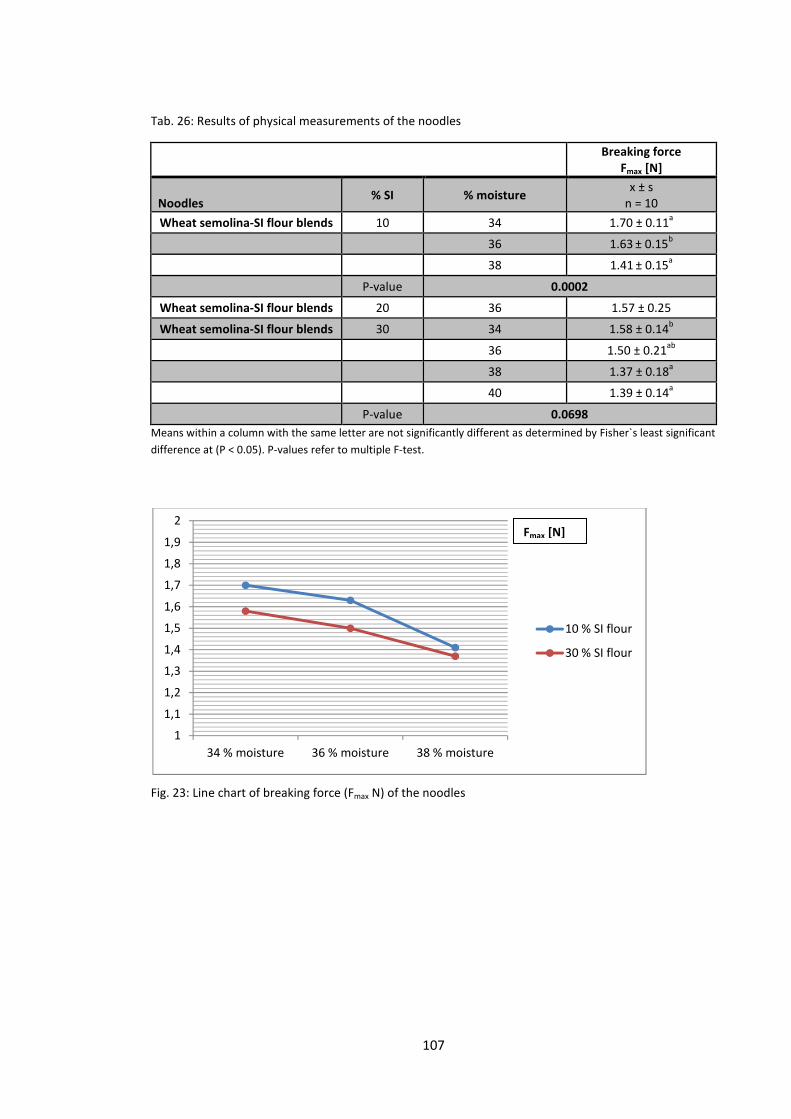
107
Tab. 26: Results of physical measurements of the noodles
Breaking force
Fmax [N]
Noodles % SI % moisture
x ± s n = 10
Wheat semolina-SI flour blends 10 34 1.70 ± 0.11a
36 1.63
± 0.15
b
38 1.41
± 0.15
a
P-value 0.0002
Wheat semolina-SI flour blends 20 36 1.57 ± 0.25
Wheat semolina-SI flour blends 30 34 1.58 ± 0.14b
36 1.50 ± 0.21
ab
38 1.37 ± 0.18
a
40 1.39 ± 0.14
a
P-value 0.0698
Means within a column with the same letter are not significantly different as determined by Fisher`s least significant
difference at (P < 0.05). P-values refer to multiple F-test.
Fig. 23: Line chart of breaking force (Fmax N) of the noodles
1
1,1
1,2
1,3
1,4
1,5
1,6
1,7
1,8
1,9
2
34 % moisture 36 % moisture 38 % moisture
10 % SI flour
30 % SI flour
Fmax [N]
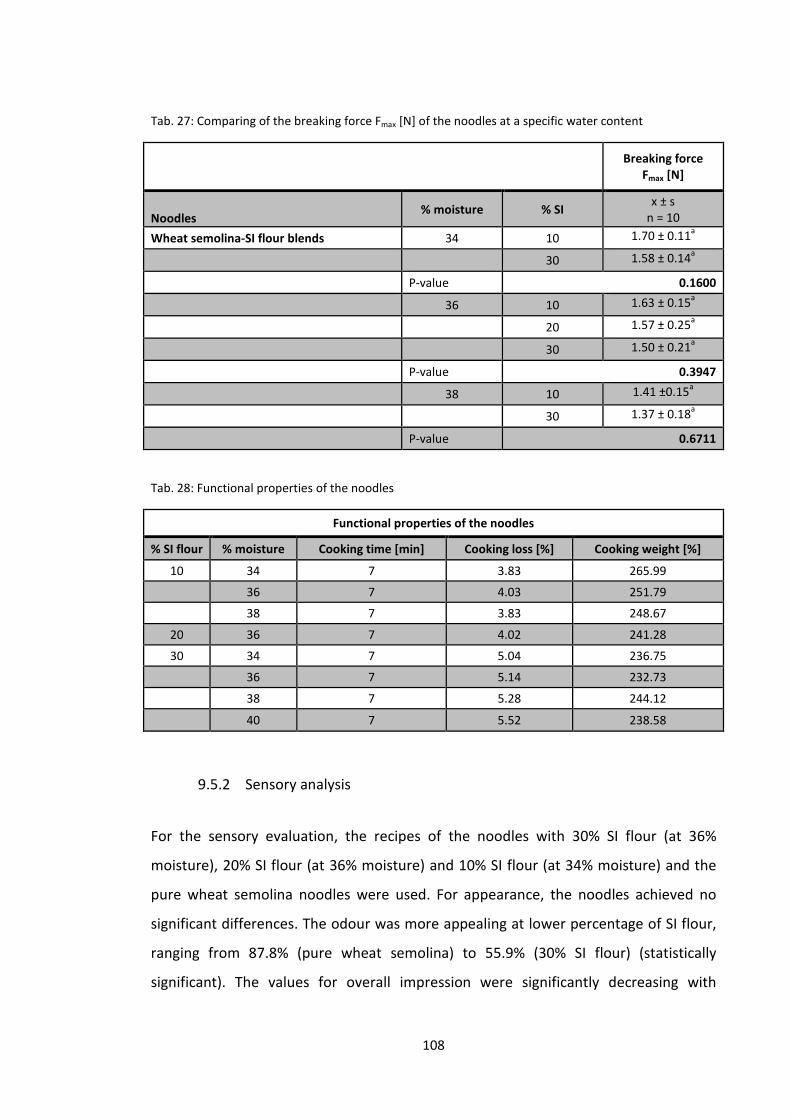
108
Tab. 27: Comparing of the breaking force Fmax [N] of the noodles at a specific water content
Breaking force
Fmax [N]
Noodles % moisture % SI
x ± s n = 10
Wheat semolina-SI flour blends 34 10 1.70 ± 0.11a
30 1.58 ± 0.14a
P-value 0.1600
36 10 1.63 ± 0.15a
20 1.57 ± 0.25a
30 1.50 ± 0.21a
P-value 0.3947
38 10 1.41 ±0.15a
30 1.37 ± 0.18a
P-value 0.6711
Tab. 28: Functional properties of the noodles
Functional properties of the noodles
% SI flour % moisture Cooking time [min] Cooking loss [%] Cooking weight [%]
10 34 7 3.83 265.99
36 7 4.03 251.79
38 7 3.83 248.67
20 36 7 4.02 241.28
30 34 7 5.04 236.75
36 7 5.14 232.73
38 7 5.28 244.12
40 7 5.52 238.58
9.5.2 Sensory analysis
For the sensory evaluation, the recipes of the noodles with 30% SI flour (at 36%
moisture), 20% SI flour (at 36% moisture) and 10% SI flour (at 34% moisture) and the
pure wheat semolina noodles were used. For appearance, the noodles achieved no
significant differences. The odour was more appealing at lower percentage of SI flour,
ranging from 87.8% (pure wheat semolina) to 55.9% (30% SI flour) (statistically
significant). The values for overall impression were significantly decreasing with
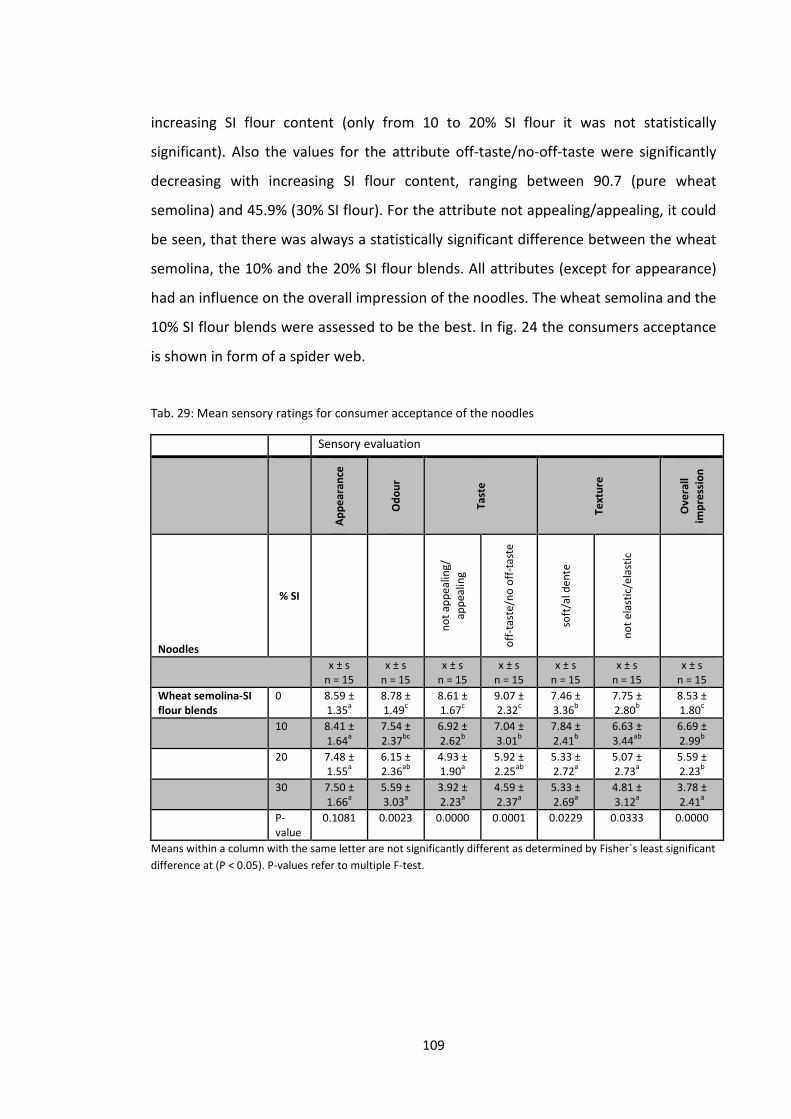
109
increasing SI flour content (only from 10 to 20% SI flour it was not statistically
significant). Also the values for the attribute off-taste/no-off-taste were significantly
decreasing with increasing SI flour content, ranging between 90.7 (pure wheat
semolina) and 45.9% (30% SI flour). For the attribute not appealing/appealing, it could
be seen, that there was always a statistically significant difference between the wheat
semolina, the 10% and the 20% SI flour blends. All attributes (except for appearance)
had an influence on the overall impression of the noodles. The wheat semolina and the
10% SI flour blends were assessed to be the best. In fig. 24 the consumers acceptance
is shown in form of a spider web.
Tab. 29: Mean sensory ratings for consumer acceptance of the noodles
Sensory evaluation
Ap
pe
ara
nce
Od
ou
r
Ta
ste
Te
xtu
re
Ov
era
ll
imp
ress
ion
Noodles
% SI
no
t ap
pea
ling/
app
ealin
g
off
-tas
te/n
o o
ff-t
aste
soft
/al d
ente
no
t el
asti
c/el
asti
c
x ± s n = 15
x ± s n = 15
x ± s n = 15
x ± s n = 15
x ± s n = 15
x ± s n = 15
x ± s n = 15
Wheat semolina-SI
flour blends
0 8.59 ± 1.35
a
8.78 ± 1.49
c
8.61 ± 1.67
c
9.07 ± 2.32
c
7.46 ± 3.36
b
7.75 ± 2.80
b
8.53 ± 1.80
c
10 8.41 ± 1.64
a
7.54 ± 2.37
bc
6.92 ± 2.62
b
7.04 ± 3.01
b
7.84 ± 2.41
b
6.63 ± 3.44
ab
6.69 ± 2.99
b
20 7.48 ± 1.55
a
6.15 ± 2.36
ab
4.93 ± 1.90
a
5.92 ± 2.25
ab
5.33 ± 2.72
a
5.07 ± 2.73
a
5.59 ± 2.23
b
30 7.50 ± 1.66
a
5.59 ± 3.03
a
3.92 ± 2.23
a
4.59 ± 2.37
a
5.33 ± 2.69
a
4.81 ± 3.12
a
3.78 ± 2.41
a
P-value
0.1081 0.0023 0.0000 0.0001 0.0229 0.0333 0.0000
Means within a column with the same letter are not significantly different as determined by Fisher`s least significant
difference at (P < 0.05). P-values refer to multiple F-test.
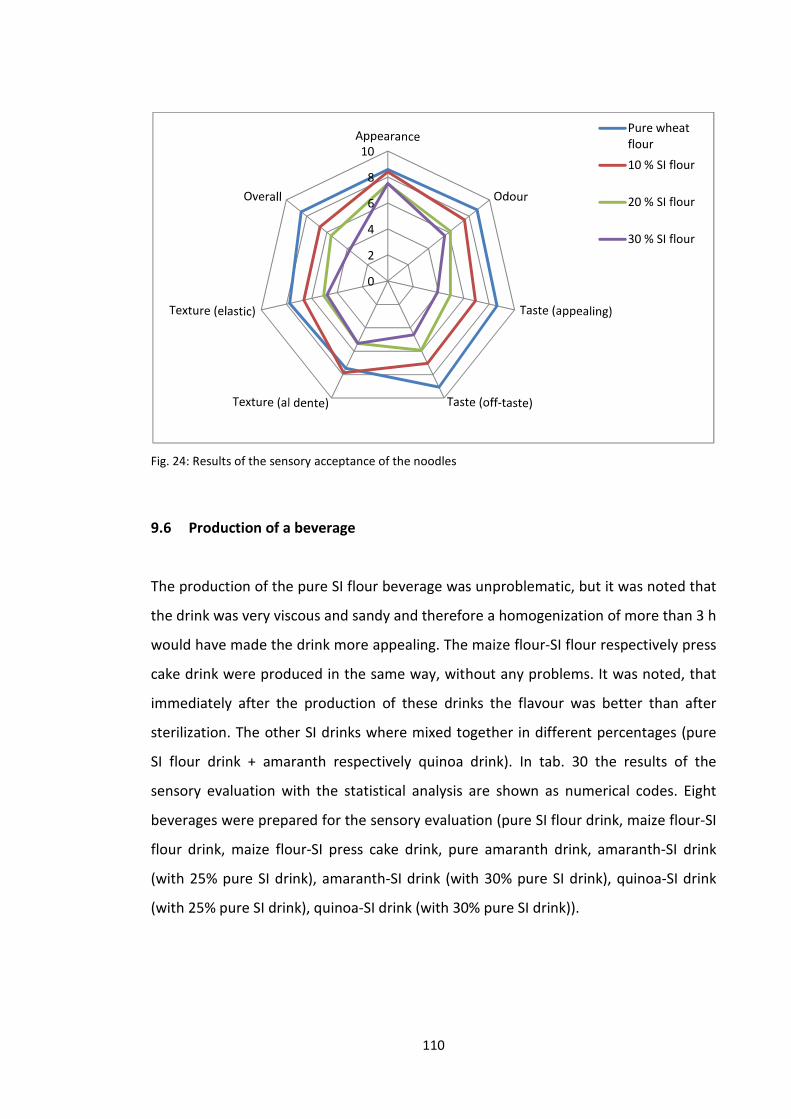
110
Fig. 24: Results of the sensory acceptance of the noodles
9.6 Production of a beverage
The production of the pure SI flour beverage was unproblematic, but it was noted that
the drink was very viscous and sandy and therefore a homogenization of more than 3 h
would have made the drink more appealing. The maize flour-SI flour respectively press
cake drink were produced in the same way, without any problems. It was noted, that
immediately after the production of these drinks the flavour was better than after
sterilization. The other SI drinks where mixed together in different percentages (pure
SI flour drink + amaranth respectively quinoa drink). In tab. 30 the results of the
sensory evaluation with the statistical analysis are shown as numerical codes. Eight
beverages were prepared for the sensory evaluation (pure SI flour drink, maize flour-SI
flour drink, maize flour-SI press cake drink, pure amaranth drink, amaranth-SI drink
(with 25% pure SI drink), amaranth-SI drink (with 30% pure SI drink), quinoa-SI drink
(with 25% pure SI drink), quinoa-SI drink (with 30% pure SI drink)).
0
2
4
6
8
10
Pure wheat flour
10 % SI flour
20 % SI flour
30 % SI flour
111
9.6.1 Sensory analysis
Taste (appealing/not appealing), texture (both properties) and overall impression
showed statistical significance between the beverages. For overall impression, the
maize flour-SI press cake drink (32.9%), followed by the pure amaranth drink (28.9%),
was judged best, but only statistically significant related to the pure SI drink (6.6%). All
beverages reached almost the same scores for overall impression, except for the pure
Sacha Inchi drink, which was judged the worst. In all sensory attributes (except for
creaminess) the pure SI beverage was judged the worst. Maize flour-SI press cake drink
reached the highest levels in two attributes for taste (appealing/not appealing (38.3%)
and off-taste/no off-taste (40.7%)), thus it seems, that these attributes had the
greatest influence in the assessment of the overall impression. The pure amaranth and
the amaranth-SI drink (25%) reached higher values in appearance (statistically not
significant). The quinoa-SI drink (25%) was assessed as the creamiest (65.2%) and the
pure amaranth drink was judged to be the least sandy (72.1%). For appearance, odour
and sweetness no statistically significant differences could be shown between the
beverages. In general, all beverages only reached low scores and therefore do not
meet the demands of the (European) consumers. It is to say, that Europeans are not
familiar with the flavour of Sacha Inchi, but all SI beverages included a rather high
amount of Sacha Inchi. This is maybe one reason for these results. The consumers
acceptance is shown in form of a spider web in fig. 25.
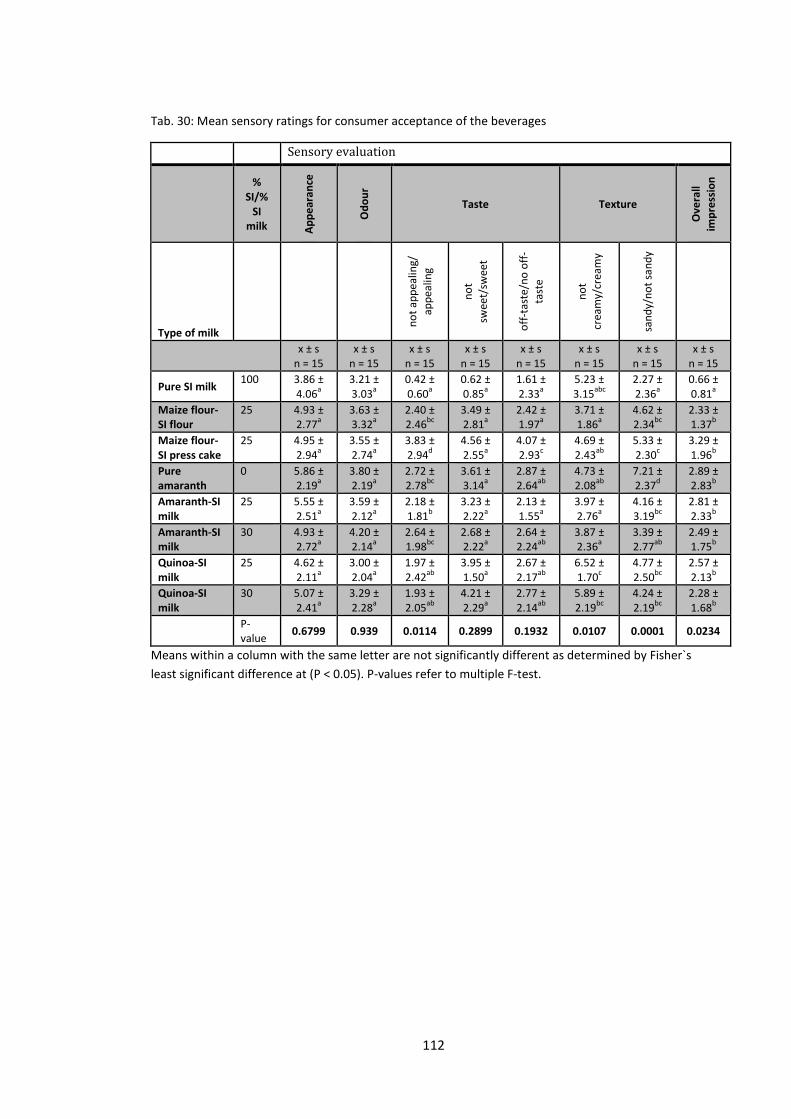
112
Tab. 30: Mean sensory ratings for consumer acceptance of the beverages
Means within a column with the same letter are not significantly different as determined by Fisher`s
least significant difference at (P < 0.05). P-values refer to multiple F-test.
Sensory evaluation
%
SI/%
SI
milk Ap
pe
ara
nce
Od
ou
r
Taste Texture
Ov
era
ll
imp
ress
ion
Type of milk
no
t ap
pea
ling/
app
ealin
g
no
t
swee
t/sw
eet
off
-tas
te/n
o o
ff-
tast
e
no
t
crea
my/
crea
my
san
dy/
no
t sa
nd
y
x ± s n = 15
x ± s n = 15
x ± s n = 15
x ± s n = 15
x ± s n = 15
x ± s n = 15
x ± s n = 15
x ± s n = 15
Pure SI milk 100 3.86 ±
4.06a
3.21 ± 3.03
a
0.42 ± 0.60
a
0.62 ± 0.85
a
1.61 ± 2.33
a
5.23 ± 3.15
abc
2.27 ± 2.36
a
0.66 ± 0.81
a
Maize flour-
SI flour
25 4.93 ± 2.77
a
3.63 ± 3.32
a
2.40 ± 2.46
bc
3.49 ± 2.81
a
2.42 ± 1.97
a
3.71 ± 1.86
a
4.62 ± 2.34
bc
2.33 ± 1.37
b
Maize flour-
SI press cake
25 4.95 ± 2.94
a
3.55 ± 2.74
a
3.83 ± 2.94
d
4.56 ± 2.55
a
4.07 ± 2.93
c
4.69 ± 2.43
ab
5.33 ± 2.30
c
3.29 ± 1.96
b
Pure
amaranth
0 5.86 ± 2.19
a
3.80 ± 2.19
a
2.72 ± 2.78
bc
3.61 ± 3.14
a
2.87 ± 2.64
ab
4.73 ± 2.08
ab
7.21 ± 2.37
d
2.89 ± 2.83
b
Amaranth-SI
milk
25 5.55 ± 2.51
a
3.59 ± 2.12
a
2.18 ± 1.81
b
3.23 ± 2.22
a
2.13 ± 1.55
a
3.97 ± 2.76
a
4.16 ± 3.19
bc
2.81 ± 2.33
b
Amaranth-SI
milk
30 4.93 ± 2.72
a
4.20 ± 2.14
a
2.64 ± 1.98
bc
2.68 ± 2.22
a
2.64 ± 2.24
ab
3.87 ± 2.36
a
3.39 ± 2.77
ab
2.49 ± 1.75
b
Quinoa-SI
milk
25 4.62 ± 2.11
a
3.00 ± 2.04
a
1.97 ± 2.42
ab
3.95 ± 1.50
a
2.67 ± 2.17
ab
6.52 ± 1.70
c
4.77 ± 2.50
bc
2.57 ± 2.13
b
Quinoa-SI
milk
30 5.07 ± 2.41
a
3.29 ± 2.28
a
1.93 ± 2.05
ab
4.21 ± 2.29
a
2.77 ± 2.14
ab
5.89 ± 2.19
bc
4.24 ± 2.19
bc
2.28 ± 1.68
b
P-value
0.6799 0.939 0.0114 0.2899 0.1932 0.0107 0.0001 0.0234
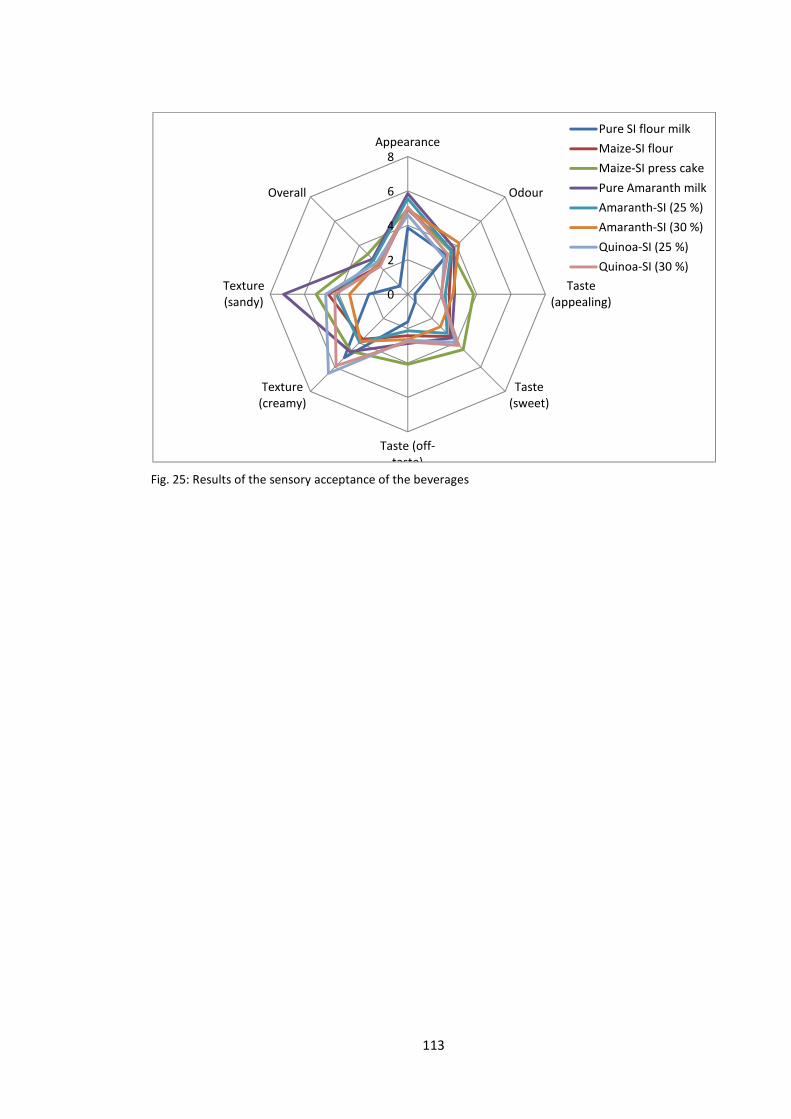
113
Fig. 25: Results of the sensory acceptance of the beverages
0
2
4
6
8Appearance
Odour
Taste (appealing)
Taste (sweet)
Taste (off-taste)
Texture (creamy)
Texture (sandy)
Overall
Pure SI flour milk
Maize-SI flour
Maize-SI press cake
Pure Amaranth milk
Amaranth-SI (25 %)
Amaranth-SI (30 %)
Quinoa-SI (25 %)
Quinoa-SI (30 %)
114
10. Conclusion
Of particular note is the high protein content in Sacha Inchi flour and press cake. The
high fat content in the flour and press cake is also considerable, but for this reason, the
production of products like snack basis products was more difficult. A really low starch
content made the production of typically starchy products more difficult.
Because of the composition of Sacha Inchi hulls, which have a high content of phenols
and a fat and protein spectrum, which is of little interest, they were excluded from
further experiments.
From the flour, the by-product of SI oil production after extrusion-expelling, snack
basis products (incl. granola bar), biscuits, noodles and drinks were produced and from
the press cake, a by-product after cold oil pressing, only extrudates, biscuits and a
drink were produced. Because of the high fat content of the press cake, noodles were
not produced.
The production of snack basis products worked well in combination with maize flour
and the taste of the pure extrudates was good. With an amount of up to 30% SI flour
(for press cake only up to 10%), the snack basis products could be included in the
extrusion cooking blend for satisfying. The granola bar was produced with the 30% SI
flour extrudate and reached high values in sensory acceptance.
With a higher level of SI flour or press cake, the biscuits were more crispy, but the
height of the biscuits decreased with the amount of SI flour (valid only for the SI flour
biscuits). The sensory acceptance of SI flour biscuits was comparable to wheat biscuits.
For the press cake biscuits it was worse, they reached lower levels than SI flour
biscuits.
The physical properties of the noodles were better with a lower moisture content and
lower SI flour content, but the production itself was more difficult with a lower
moisture level. Almost all attributes of sensory evaluation of the noodles were strongly
dependent on the percentage of SI flour. They were assessed better with lower
amount of SI, but the blend with 10% SI flour was still ok and could be interesting for SI
flour use.

115
The sensory evaluation of the different beverages has revealed, that there is still a
great need for improvement. After production, the drinks should be modified further,
in order to improve their taste and sensory quality.
The best product results were achieved by using the extruder technology and
therefore, it should be done more research in this direction (as examples: using spices
and other ingredients during extrusion or changing the extruder settings).
Due to the high protein content of SI flour and press cake, a beverage in the form of a
protein drink is also very interesting.
116
11. Summary
In this work, four different samples (flour, press cake, seeds and hulls) of the plant
Sacha Inchi (Plukenetia volubilis L.), which were provided by the company
Agroindustrias Osho S.A.C., Peru, were analysed concerning their chemical and
functional properties. Subsequently, different products from the press cake and the
flour of the press cake were produced.
The contents of fat, protein, starch, glucose, ash, water, dietary fibres (soluble and
insoluble), resistant starch and total phenols were investigated. Furthermore, the
water absorption and water solubility index, the viscosity and the protein solubility
were analysed. Based on these analyses, snack basis products (incl. granola bar),
biscuits, noodles and beverages were produced from Sacha Inchi flour. From the press
cake extrudates, biscuits and a drink were produced. Then, physical measurements
and a sensory evaluation of these products were done.
The flour and press cake reached the highest protein levels with values of 56.63 and
51.76%. The fat content was the highest in the seeds with a value of 40.48%. The press
cake and flour achieved fat contents of 19.90 and 8.61%. The samples contained
almost no starch (ranged from 0.03% in the press cake to 1.21% in the hulls). The
phenol content was by far the highest in the hulls (853.83 mg/100 g), press cake
(311.87 mg/100 g), seeds (156.44 mg/100 g) and flour (155.41 mg/100 g) followed.
The breaking force of the snack basis products increased significantly with the amount
of SI flour (10% - 10.08 N and 40% - 37.32 N). Also the bulk density and expansion
index increased respectively decreased significantly with increased SI flour. Between SI
flour and press cake (at 10%) no differences were observed. The granola bar reached
with 82.1% high sensory scores for overall impression. The sensory characteristics of SI
flour biscuits were comparable with wheat biscuits and the breaking force (2.36 N at
10% to 2.71 N at 50%) and spreading factor (7.49 at 10% to 8.34 at 50%) were
significant increasing with increasing SI flour. The breaking force of the 10% SI flour
noodles at different moisture contents was statistically significant (1.70 N at 34%
moisture and 1.41 at 38% moisture) and the 30% SI flour blends reached no
statistically significant difference for breaking force. The functional properties of the

117
noodles seemed to deteriorate with increasing SI flour and moisture content (cooking
loss/cooking weight: 3.83%/265.99% at 10% SI flour and 34% moisture and
5.52%/238.58% at 30% SI flour and 40% moisture). The more SI flour was included in
the noodles, the worse they were assessed for sensory characteristics. The beverages
reached in all sensory attributes almost the same scores (except for creaminess), only
the pure SI flour drink, this was assessed the worst.
118
12. Zusammenfassung
In dieser Arbeit wurden vier verschiedene Rohstoffe (Mehl, Presskuchen, Samen und
Schalen) von der Pflanze Sacha Inchi (Plukenetia volubilis L.), die von der Firma
Agroindustrias Osho S.A.C., Peru zur Verfügung gestellt wurden, hinsichtlich ihrer
chemischen und funktionellen Eigenschaften analysiert. Anschließend wurden
verschiedene Produkte aus dem Presskuchen und dem daraus resultierenden Mehl
produziert.
Die Gehalte von Fett, Protein, Stärke, Glucose, Asche, Wasser, Ballaststoffen (lösliche
und unlösliche), resistenter Stärke und Gesamtphenolen wurden ermittelt. Weiterhin
wurden der Wasserabsorptions- und Wasserlöslichkeitsindex, die Viskosität und die
Proteinlöslichkeit untersucht.
Basierend auf diesen Analysen wurden aus dem Mehl Extrudate (inkl. Müsliriegel),
Kekse, Nudeln und Getränke hergestellt. Aus dem Presskuchen wurden Extrudate,
Kekse und ein Getränk hergestellt. Danach wurden physikalische Messungen und eine
sensorische Beurteilung dieser Produkte durchgeführt.
Mehl und Presskuchen erreichten mit Werten von 56,63 und 51,76 % die höchsten
Proteingehalte. In den Samen war der Fettgehalt mit einem Wert von 40,48 % am
höchsten. Presskuchen und Mehl erreichten Fettgehalte von 19,90 und 8,61 %. Die
Proben enthielten nahezu keine Stärke (lagen im Bereich von 0,03 % im Presskuchen
bis 1,21 % in den Schalen). Der Phenolgehalt war in den Schalen mit Abstand am
höchsten (853,83 mg/100 g), gefolgt von Presskuchen (311,87 mg/100 g), Samen
(156,44 mg/100 g) und Mehl (155,41 mg/100 g).
Die Bruchfestigkeit der Extrudate erhöhte sich signifikant mit der Menge an SI Mehl
(10 % - 10,08 und 40 % N - 37,32 N). Auch das Schüttgewicht und der Expansionsindex
stiegen bzw. fielen signifikant mit steigendem Gehalt an SI Mehl. Zwischen SI Mehl und
Presskuchen (10 %) wurden keine Unterschiede beobachtet. Der Müsliriegel erreichte
mit 82,1 % hohe sensorische Werte für den Gesamteindruck. Die sensorischen
Eigenschaften von Keksen mit SI Mehl waren vergleichbar mit Weizenkekse und die
Bruchfestigkeit (2,36 N bei 10 % bis 2,71 N bei 50 %) und der Ausdehnungsgrad (7,49
119
bei 10 % bis 8,34 bei 50 %) erhöhten sich signifikant mit zunehmendem Gehalt an SI
Mehl. Die Bruchfestigkeit der 10 % SI Mehl Nudeln bei verschiedenen
Feuchtigkeitsgehalten war statistisch signifikant (1,70 N bei 34 % Feuchtigkeit und 1,41
bei 38 % Feuchtigkeit) und die Mischungen mit 30 % SI Mehl erreichten keinen
statistisch signifikanten Unterschied in der Bruchfestigkeit. Die funktionellen
Eigenschaften der Nudeln schienen sich mit zunehmendem Gehalt an SI Mehl und
zunehmender Feuchtigkeit zu verschlechtern (Kochverlust/Kochgewicht: 3,83
%/265,99 % bei 10 % SI Mehl und 34 % Feuchtigkeit und 5,52 %/238,58 % bei 30 % SI
Mehl und 40 % Feuchtigkeit). Umso mehr SI Mehl in den Nudeln enthalten war, umso
schlechter wurden sie in ihren sensorischen Eigenschaften beurteilt. Die Getränke
erzielten in allen sensorischen Eigenschaften fast die gleichen Werte (mit Ausnahme
der Cremigkeit), außer das Getränk aus reinem SI Mehl, dieses wurde am
schlechtesten beurteilt.
120
REFERENCES
AACC 16-50. Pasta and noodle cooking quality-firmness. AACC approved methods (9th
Ed.). St. Paul, MN, USA, 1999.
AIDER M, BARBANA CH. Canola proteins: composition, extraction, functional
properties, bioactivity, applications as a food ingredient and allergenicity – A
practical and critical review. Trends Food Sci Tech 2011; 22: 21-39.
ALVAREZ M D, FERNÁNDEZ C, OLIVARES M D, CANET W. A rheological characterisation
of mashed potatoes enriched with soy protein isolate. Food Chem 2012; 133: 1274-
1282.
ANONYM. Sunflower press cake. Russoya 2010. Online at:
http://www.russoya.ru/e_prod8.htm, 15.05.2012.
ANONYM. Sacha Inchi Öl. Online at: http://www.inkanatural.com/de/arti.asp?ref=das-
sacha-inchi-ol, 15.12.2012.
BANASZKIEWICZ T. Nutritional value of soybean meal. In: Soybean and Nutrition (El-
Shemy H, Hrsg). In Tech, 2011; 1-20.
BARTKIENE E, JUODEIKIENE G, VIDMANTIENE D, ZABORSKIENE G, BAŠINSKIENE L,
KUNKULBERGA D. The use of flaxseed in the production of wheat bread.
Zemdirbyste 2009; 96: 181-196.
BONNARDEAUX J. Uses for canola meal. Department of Agriculture and Food, 2007; 1-
10.
CAI Z Q. Shade delayed flowering and decreased photosynthesis, growth and yield of
Sacha Inchi (Plukenetia volubilis) plants. In d Crop Prod2011; 1235-1237.
DEAN L L, DAVIS J P, SANDERS T H. Groundnut (Peanut) Oil. In: Vegetable Oils in Food
Technology: Composition, Properties and Uses (Gunstone F D, Hrsg). Blackwell
Publishing Ltd., 2011; 225-242.
FANALI C, DUGO L, CACCIOLA F, BECCARIA M, GRASSO S, DACHÀ M, DUGO P,
MONDELLO L. Chemical characterization of Sacha Inchi (Plukenetia volubilis L.) oil. J
Agric Food Chem 2011; 59: 13043-13049.
121
FERCHAU E. Equipment for decentralised cold pressing of oil seeds. Folkecenter for
Renewable Energy 2000. Online at:
http://www.folkecenter.net/mediafiles/folkecenter/pdf/dk/efdcpos_ef.pdf,
14.05.2012.
FRANKE S, FRÖHLICH K, WERNER S, BÖHM V, SCHÖNE F. Analysis of carotenoids and
vitamin E in selected oilseeds, press cakes and oils. Eur J Lipid Sci Tech 2010; 112:
1122-1129.
GUILLÉN M D, RUIZ A, CABO N, CHIRINOS R, PASCUAL G. Characterization of Sacha
Inchi (Plukenetia volubilis L.) oil by FTIR spectroscopy and 1H NMR. Comparison with
linseed oil. J Am Oil Chem Soc 2003; 80: 755-762.
GUTIÉRREZ L, ROSADA L, JIMÉNEZ Á. Chemical composition of Sacha Inchi seeds and
characteristics of their lipid fraction. Grasas Y Aceites 2011; 62: 76-83.
GUTIÉRREZ C, RUBILAR M, JARA C, VERDUGO M, SINEIRO J, SHENE C. Flaxseed and
flaxseed cake as a source of compounds for food industry. Soil Sci Plant Nutr 2010;
10: 454-463.
KRIST S, BUCHBAUER G, KLAUSBERGER C. Die Gewinnung pflanzlicher Öle und Fette
aus heutiger Sicht. In: Lexikon der pflanzlichen Fette und Öle (Krist S, Buchbauer G,
Klausberger C, Hrsg). Springer Verlag, Wien, 2008; 3-4.
KRIST S, BUCHBAUER G, KLAUSBERGER C. Die Reinigung fetter Pflanzenöle und
pflanzlicher Fette. In: Lexikon der pflanzlichen Fette und Öle (Krist S, Buchbauer G,
Klausberger C, Hrsg). Springer Verlag, Wien, 2008; 5.
KRIST S, BUCHBAUER G, KLAUSBERGER C. Nachteile von kaltgepresstem Öl. In: Lexikon
der pflanzlichen Fette und Öle (Krist S, Buchbauer G, Klausberger C, Hrsg). Springer
Verlag, Wien, 2008; 6.
KRIST S, BUCHBAUER G, KLAUSBERGER C. Vorteile von kaltgepresstem Öl. In: Lexikon
der pflanzlichen Fette und Öle (Krist S, Buchbauer G, Klausberger C, Hrsg). Springer
Verlag, Wien, 2008; 5-6.
LUSAS E W. Food uses of peanut protein. J Am Oil Chem Soc 1979; 56: 425-430.
122
MAURER N E, HATTA-SAKODA B, PASCUAL-CHAGMAN G, RODRIGUEZ-SAONA L E.
Characterization and authentication of a novel vegetable source of omega-3 fatty
acids, Sacha Inchi (Plukenetia volubilis L.) oil. Food Chem 2012; 134: 1173-1180.
NELSON A I, WIJERATNE W B, YEH S W, WEI T M, WEI L S. Dry extrusion as an aid to
mechanical expelling of oil from soybeans. J Am Oil Chem Soc 1987; 64: 1341-1347.
OGUNRONBI O, JOOSTE P J, ABU J O, VAN DER MERWE B. Chemical composition,
storage stability and effect of cold-pressed flaxseed oil cake inclusion on bread
quality. J Food Process Pres 2011; 35: 64-79.
PRADO I M, GIUFRIDA W M, ALVAREZ V H, CABRAL V F, QUISPE-CONDORI S, SALDAN᷉A
M D A, CARDOZO-FILHO L. Phase equilibrium measurements of Sacha Inchi oil
(Plukenetia volubilis) and CO2 at high pressures. J Am Oil Chem Soc 2011; 88: 1263-
1269.
RABETAFIKA H N, REMOORTEL V V, DANTHINE S, PAQUOT M, BLECKER CH. Flaxseed
proteins: food uses and health benefits. Int J Food Sci Tech 2011; 46: 221-228.
RIAZ M N. Low cost extrusion expelling-technology for TVP production. Food Protein
R&D Center. Online at:
http://www.wishh.org/workshops/intl/southafrica/sept06/riaz2-sept06.pdf,
14.05.2012.
RIAZ M N, CHEEWAPRAMONG P. Characterization of partially defatted peanut flour
using dry extruder and screw pressing. International Journal of Food Properties
2009; 12: 427-437.
ROSSI M. Textured sunflower protein for use as a meat extender. Food Sci Technol
1988; 21: 267-270.
ROTH L, KORMANN K. Gewinnung von Ölen und Fetten. In. Ölpflanzen, Pflanzenöle:
Fette, Wachse, Fettsäuren, Botanik, Inhaltsstoffe, Analytik (Roth L, Kormann K,
Hrsg). Ecomed Verlag, Landsberg, 2000; 13-26.
SALGADO P R, ORTIZ S E M, PETRUCCELLI S, MAURI A N. Functional food ingredients
based on sunflower protein concentrates naturally enriched with antioxidant
phenolic compounds. J Am Oil Chem Soc 2012; 89: 825-836.
123
SATHE S K, HAMAKER B R, SZE-TAO K W C, VENKATACHALAM M. Isolation, purification,
and biochemical characterization of a novel water soluble protein from Inca Peanut
(Plukenetia volubilis L.). J Agric Food Chem 2002; 50: 4906-4908.
SCHUCHMANN H P. Extrusion von Lebensmitteln. In: Lebensmittelverfahrenstechnik:
Rohstoffe, Prozesse, Produkte (Schuchmann H P, Schuchmann H, Hrsg). Wiley-VCH
Verlag, 2005; 189-218.
SESSA D J. Processing of soybean hulls to enhance the distribution and extraction of
value-added proteins. J Sci Food Agric 2003; 84: 75-82.
SINGH P, KUMAR R, SABAPATHY S N, BAWA A S. Functional and edible uses of soy
protein products. Compr Rev Food Sci F 2008; 7: 14-28.
TAN S H, MAILER R J, BLANCHARD CH L, AGBOOLA S O. Canola proteins for human
consumption: extraction, profile, and functional properties. J Food Sci 2011; 76: 16-
28.
TUCU D, FLESER T. Optimization of soybean press cake treatments and processing.
Agriculturae Conspectus Scientificus 2007; 72: 195-198.
WANG T. Soybean Oil. In: Vegetable Oils in Food Technology: Composition, Properties
and Uses (Gunstone F D, Hrsg). Blackwell Publishing Ltd., 2011; 59-105.
ZHAO X, CHEN J, DU F. Potential use of peanut by-products in food processing: a
review. J Food Sci Tech 2011.
124
CURRICULUM VITAE
Julia Jagersberger
PERSONAL DETAILS
Place of Birth: Vienna
Marital Status: unmarried
WORK EXPERIENCE
Aug 2011 Work experience at Rauch Fruchtsäfte GmbH & Co OG (product development)
Sep 09 - Jul 12 Minor employment (from Sep 11 part-time) at Rewe International AG (quality management)
Jul 09 – Sep 09 Internship at Rewe International AG (quality management)
Jul 08 Promotion for vegetables, LGV-Frischgemüse (at Billa stores)
Jul 07 Österreichische Nationalbank OeNB (Euro-Bus, Shilling- Euro- Exchange)
EDUCATION
Oct 10 – Jan 13 University of Vienna Course of Studies: Nutritional Sciences, Master`s degree programme
Oct 06 – Jul 10 University of Vienna Course of Studies: Nutritional Sciences Degree Awarded: Bachelor`s
Title of Degree: “Organoleptic tests in the product development as well as in the quality control”
01 – 06: Institution of Higher Education for Economy and Social Management, Seegasse
99 – 01: Institution of Higher Education for Wine- and Fruit-growing, Klosterneuburg
95 - 99: BG/BRG Laa/Thaya