Embed Size (px)
Citation preview

I.M.J. Schaminée
0724159
15-05-2013
Portfolio Management KPIs
Master Thesis

i
Management summary
“Without an effective portfolio management process in place, the business suffers many evils: poor-
quality projects, too many short terms and lower-risk projects, too many projects for the resources at
hand, ultimately resulting in pipeline gridlock, and an investment portfolio that does not mirror the
strategic priorities of the business” (Cooper et al., 1999, p. 351).
Bicore is a business service provider specialized in innovation management, including R&D portfolio
management. Besides providing services, Bicore provide a software platform, named Flightmap, which is
a web based portfolio management tool for portfolios of complex projects. With Flightmap, the progress
of the project funnel can easily be monitored and managed, and it provides uniform decision support.
The customers of Bicore are quite satisfied with Flightmap, but have asked more insight in the
drivers behind a successful portfolio. In other words, customers want Key Performance Indicators (KPIs)
that demonstrate the quality of a portfolio which helps them to analyze and optimize their portfolio.
After a discussion with the CTO of Bicore it has been decided the scope of this thesis will be limited
to the definition and implementation of KPIs that help evaluate the quality of the portfolio. In other
words, answer Bicore’s main question:
Which portfolio KPIs should we add to Flightmap to provide our customers insights in the quality of
their portfolio and help them with creating an optimal portfolio?
This has been done by first conducting a literature study resulting in two tables that enumerate the
goals, criteria, and KPIs that are often used for gate and portfolio decisions. Secondly, interviews were
held to get a better understanding of what KPIs are required to be added to Flightmap to perform
proper portfolio management.
The interviews have led to both a qualitative insight in how portfolio management is applied as well
as a quantitative insight in the priories for implementation in Flightmap. This quantitative insight has
been created by letting the interviewees rank the KPIs from the two tables that resulted from the
literature study. These interviews resulted in a list of most important KPIs and some additional expert
information that could be considered for implementation into Flightmap.

ii
The results of the interviews have been used to analyze the gaps between what is currently offered
by Flightmap and what should be offered based on the empirical analysis. Based on this gap-analysis the
following five key performance indicators have been selected for implementation in Flightmap:
1. Resource utilization; to express the risk that the required resources could exceed the
available resources
2. KPI for balance; to demonstrate how well the actual balance of the portfolio fits the desired
balance
3. Non-economic value creation; to demonstrate the strategic fit of a portfolio
4. Productivity index; to maximize the productivity of the portfolio
5. Growth target; to express the percentage of the target that will be achieved with the
current portfolio
These five selected key performance indicators have been defined in mathematical formulae where
possible after which they were ready for implementation into Flightmap. Two KPIs, KPI for balance and
the productivity index, have been implemented during this project which made it possible to evaluate
them. The evaluation of these two key performance indicators proved that they work properly and can
be rolled out for customer use.
Implementing these key performance indicators into Flightmap will provide customers more and
better tools to improve the quality of their portfolio and help them with creating an optimal portfolio.
There are some limitations that should be acknowledged. First, the number of interviews is limited.
Although the nine interviews have generated much valuable data which have been analyzed, it does not
guarantee that the results are generalizable for the total population. Second, due to the limited time
available to execute this master thesis, the customers have not been involved in the test phase.
iii
Preface
This master thesis is the result of my graduation project conducted to complete the master study
Innovation Management at the Eindhoven University of Technology (TU/e). This thesis has been
conducted at Bicore, a business service provider specialized in innovation management, including R&D
portfolio management, wherefore they provide a software platform named Flightmap.
My research focused on key performance indicators that indicate the quality of a new product
development (NPD) portfolio. I experienced the time that I worked on my thesis at Bicore as a very
pleasant time and a great personal development where I learned much about project and portfolio
management. This would not have been able without the help of many people.
First of all I want to thank my two supervisors from the Eindhoven University of Technology, Fred
Langerak and Bob Walrave, who helped me with managing the project and keeping it on the right track
and give valuable advice and feedback on my literature study and the master thesis itself.
Secondly, I would like to thank my company supervisor Jac Goorden and other colleagues from
Bicore, in particular Maarten Kluitman. They always made time for discussion and advice and were very
willing to share their thoughts.
Special thanks go to my dad who, despite his busy job, always found time to give advice and help me
during my entire study. His knowledge and experience contributed to a great personal development
over the last couple of years.
Finally I want to thank my family, friends, and especially my girlfriend for all their patience and their
intellectual, financial, and mental support. They provided many memorable moments and pleasant
distraction during my study.
Ivo Schaminée
March 2013

iv
Table of Contents Management summary ........................................................................................................................... i
Preface ................................................................................................................................................... iii
1. Introduction .................................................................................................................................. 1
1.1. Empirical context .................................................................................................................. 1
1.2. Methodology ......................................................................................................................... 3
1.3. Outline of the report ............................................................................................................. 7
2. Theoretical analysis ....................................................................................................................... 8
2.1. Introduction .......................................................................................................................... 8
2.2. Stage-Gate® ......................................................................................................................... 11
2.3. NPD Portfolio management ................................................................................................ 16
2.4. Comparison of Gate -and Portfolio KPIs ............................................................................. 23
2.5. Conclusions on the literature study .................................................................................... 25
3. Empirical analysis ........................................................................................................................ 26
3.1. Introduction ........................................................................................................................ 26
3.2. Results of the interviews ..................................................................................................... 27
3.3. Gap-analysis ........................................................................................................................ 34
3.4. Conclusion ........................................................................................................................... 38
4. Design .......................................................................................................................................... 39
5. Implementation and evaluation ................................................................................................. 47
5.1. Introduction ........................................................................................................................ 47
5.2. Implementation .................................................................................................................. 47
5.3. Evaluation............................................................................................................................ 49
5.4. Conclusion on implementation and evaluation .................................................................. 52
6. Conclusions ................................................................................................................................. 53
6.1. Empirical contribution......................................................................................................... 53
6.2. Theoretical contribution ..................................................................................................... 54
6.3. Limitations and further research ........................................................................................ 55
References ............................................................................................................................................ 56
Appendix 1: Interview .......................................................................................................................... 58
Appendix 2: Additional sources for chapter 2 ...................................................................................... 59
v
List of figures Figure 1, Funnel diagram in Flightmap ................................................................................................... 2
Figure 2, Regulative cycle of van Aken (2007) ........................................................................................ 3
Figure 3, Outline of the report ............................................................................................................... 7
Figure 4, Process levels of the NPD management process (McGrath, 2004) ......................................... 8
Figure 5, An overview of a Typical Stage-Gate® System for Major New Product Developments
(Cooper, 2008) ......................................................................................................................... 9
Figure 6, Next Generation Stage-Gate® (Cooper, 2008) ...................................................................... 11
Figure 7, The dominant portfolio method employed -the best vs. worst (Cooper et al., 2001) .......... 20
Figure 8, Comparison of gate and portfolio KPIs .................................................................................. 23
Figure 9, Expertise of the interviewees ................................................................................................ 26
Figure 10, Revenue plotted in the “portfolio over time graph” in Flightmap ...................................... 36
Figure 11, Bubble diagram (left) and balance diagram (right) in Flightmap ........................................ 37
Figure 12, Efficient frontier (investorpedia.com, 17-04-2013) ............................................................ 40
Figure 13, Funnel in Flightmap ............................................................................................................. 41
Figure 14, Actual and desired distribution of projects ......................................................................... 42
Figure 15, Visualization of the funnel in Flightmap .............................................................................. 49
Figure 16, Project list in Flightmap ranked on NPV (left), and on Cost Productivity Index (right) ....... 49
Figure 17, Portfolio composition menu in Flightmap ........................................................................... 50
Figure 18, Portfolio list in Flightmap .................................................................................................... 50
Figure 19, Difference of NPV and PI rank method ............................................................................... 50
Figure 20, Funnel diagram of the 2 alternative portfolios in Flightmap .............................................. 51
Figure 21, Desired distribution input field in Flightmap ...................................................................... 51
Figure 22, Representation of the field of study ................................................................................... 54
List of tables Table 1, Distribution of the candidates in the sample ........................................................................... 5
Table 2, Overview of the most frequently used evaluation criteria (Tzokas et al., 2004) ................... 12
Table 3, Overview of Gate goals, criteria and KPIs (references are listed in appendix 2) .................... 14
Table 4, Portfolio goals with suitable methods .................................................................................... 19
Table 5, Overview of PPM goals, criteria, and KPIs (references are listed in appendix 2) ................... 21
Table 6, Overview of Gate goals, criteria, and KPIs ranked by the interviewees (references are listed
in appendix 2) ........................................................................................................................ 29
Table 7, Overview of PPM goals, criteria, and KPIs ranked by the interviewees (references are listed
in appendix 2) ........................................................................................................................ 31
Table 8, Gap analysis of gate KPIs ........................................................................................................ 34
Table 9, Gap analysis of portfolio KPIs ................................................................................................. 36
Table 10, Project distribution data over three markets ....................................................................... 43
Table 11, Project distribution data over four phases ........................................................................... 44

1
1. Introduction
“Managing new product development (NPD) is, to a great extent, a process of separating the
winners from the losers.” (Cooper et al., 1995, p. 374)
Managing the NPD process is separated by Cooper et al. (2005) in two different parts namely doing
the right projects and doing the projects right. Doing the projects right is all in the scope of project
management and doing the right projects is a result of performing good portfolio management. Both of
these aspects will be investigated in this thesis.
This chapter will first describe the empirical context which will lead to the problem definition.
Secondly, the methodology will be described leading to a detailed outline of the report.
1.1. Empirical context
Bicore is a business service provider specialized in innovation management, including R&D portfolio
management. The mission of Bicore is to improve the ‘Return on Open Innovation’ (ROI) in the high-tech
industry in the Benelux. This is accomplished by offering practical and professional services, based on
market knowledge and methods for innovation and alliance management. The consultants of Bicore
provide an independent and complete picture of the current innovation portfolio status of their
customers.
The knowledge of these consultants and existing literature about project and portfolio management
has been used by Bicore to develop a software tool. This software platform, Flightmap, is a web based
portfolio management tool for portfolios of complex projects (see figure 1). With Flightmap, the
progress of the project funnel can easily be monitored and managed, and it supports transparent,
traceable, and efficient decision making.

2
The first version of
Flightmap was launched in
2010 and contained the
fundamentals of project
management (Stage-Gate®)
and portfolio management.
This version was
implemented at Bicore’s lead
customer, Océ, which
evaluated Flightmap and
provided feedback for
possible improvements.
One of the main improvements that was considered after the launch of Flightmap 1.0 was improving
the project level information with data quality. This has been formulated as a graduation project and
was conducted by Maarten Kluitman in 2011. The developed data quality checks have been included in
Flightmap 2.0. After the launch of Flightmap 2.0, new customers, including DAF, have started to use
Flightmap.
Some customers, and in particular DAF, suggested some improvement which mainly focus on the
usability. Therefore, in June 2012, Flightmap 3.0 has been launched which improved the configuration
and portfolio analysis features. After these improvements, the lack of portfolio indicators has become
clear. Investigating existing literature from portfolio management experts such as Cooper, McGrath did
not offer a specific solution.
It became clear that there are still many opportunities to further improve Flightmap especially with
respect to portfolio management. The customers of Bicore are satisfied with Flightmap, but have asked
more insight in the drivers behind a successful portfolio. To provide customers with these insights and
improve Flightmap, it has been decided that this graduation thesis will be conducted to define and
implement key performance indicators (KPIs) that help to evaluate the quality of the portfolio. Bicore’s
main question that should be addressed in this thesis is:
Which portfolio KPIs should we add to Flightmap to provide our customers insights in the quality of
their portfolio and help them with creating an optimal portfolio?
Figure 1, Funnel diagram in Flightmap

3
1.2. Methodology
Although this research is aimed at contributing to the scientific knowledge base, the primary goal is
to design a solution for the practical business problem. Therefore this study will follow a science-based
design approach which is characterized by its practical goal based on scientific knowledge. In this way,
the research will be practically relevant and academically rigorous. To conduct a science-based design
approach, the regulative cycle of van Aken (2007) has been used (see figure 2).
This model consists of five steps. First,
the business problem will be defined. Second,
the problem will be analyzed, which has been
done in this thesis by conducting a literature
study, performing interviews, and performing
a gap-analysis. Third, a plan of action will be
developed, which is a design to improve
Flightmap. After, in the evaluation step, the
design will be implemented in Flightmap.
Finally, the implemented design will be
evaluated. Now, the cycle applied to the project will be described in more detail.
Problem definition
The problem definition phase started with discussions with Jac Goorden, the CTO of Bicore. During
these conversations it became clear that there are still many opportunities to further improve Flightmap
especially with respect to portfolio management. As described before, the customers of Bicore have
asked more insight in the drivers behind a successful portfolio. In other words, they want KPIs that
demonstrate the quality of a portfolio which helps them to analyze and optimize their portfolio.
From these conversations it was concluded that, for this thesis, the scope would be limited to the
definition and implementation of KPIs that could help with the evaluation of the quality of the portfolio.
Bicore’s main question is:
Which portfolio KPIs should we add to Flightmap to provide our customers insights in the quality of
their portfolio and help them with creating an optimal portfolio?
Figure 2, Regulative cycle of van Aken (2007)

4
Analysis and diagnoses
Now that the problem was defined, the analysis and diagnoses phase could be started with a
literature study. To familiarize with project and portfolio management, some recent master theses and
some major publications in the field of project and portfolio management have been read.
A basic insight was established, and a deeper understanding was created by searching for more
literature. This was done in two ways. First, the references that were used in the material that was read,
were explored. The material that could help to address the research questions were downloaded from
scientific search engines such as Google scholar, ABI/inform, and ScienceDirect. Secondly, these search
engines were used to find more scientific literature about this topic using key words such as “project
portfolio management”, “project management”, and “Stage-Gate®” in combination with the words “key
performance indicators”, “criteria”, and “goals”. Executing both of these approaches led to a large
amount of interesting literature which was mainly based on title information. To validate the literature,
a quick scan has been performed which consist out of scanning the abstract and where necessary the
intro and conclusions. This led to an interesting amount of literature which helped to get insight in
relevant goals, criteria, and KPIs relevant for the Stage-Gate® process and portfolio management.
The literature study provided more insights into the defined research questions and resulted in 2
tables that enumerate the goals, criteria, and KPIs that are often used for gate and portfolio decisions.
This literature study has been reviewed by the CTO of Bicore and the graduate mentor of the TUe and
can be found in chapter 2.
The insight gained from the literature study has been used to formulate questions applied in
interviews conducted with key customers of Flightmap as well as with key experts in the domain of
portfolio management. Creating a sample has been done by defining characteristics that the sample
should contain to gain valuable information from different perspectives. The main characteristics were
that it should contain academic and practical experts with knowledge about portfolio management, R&D
project management, marketing, and finance. Furthermore the sample should represent some
customers of Bicore with experience with Flightmap and some experts that have much experience in
project portfolio management (PPM). Besides, the sample should contain a business and mathematical
perspective to represent different areas of expertise within the field of portfolio management.
After defining these characteristics, a sample was created with the CTO of Bicore. Customers and
relations of Bicore were selected till the sample represents the defined characteristics. Table 1

5
demonstrates the characteristics of the sample and the interviews (Int.) that represent these
characteristics.
Experience in PPM
Experience in Flightmap
Mathematic perspective
Business perspective
Theory
Professor in NPD Int. 6, 9 N.A. Int. 9 Int. 6
Practice
Portfolio manager Int. 3, 7, 9 Int. 3 Int. 3, 9 Int. 3, 7
R&D project manager Int. 4, 5, 9 Int. 5 Int. 4, 8 Int. 4, 5
Marketing Int. 2 Int. 2 - Int. 2
Finance Int. 1, 8 Int. 8 Int. 8, 9 Int. 1
Table 1, Distribution of the candidates in the sample
The CTO of Bicore first introduced the project by sending the candidates an email, after which I
contacted each of them by phone to make an appointment for the interview. All of the candidates were
enthusiastic about the project and wanted to participate in the interview. Unfortunately, the contacted
professor in NPD management was with maternity leave which lead to an interview with a colleague
professor of hers.
These interviews were held to get a better understanding of what KPIs should to be added to
Flightmap to perform proper portfolio management. The discussions have led to both a qualitative
insight in how portfolio management is applied as well as a quantitative insight in the priories for
implementation in Flightmap. This quantitative insight has been created by letting the interviewees
score the KPIs from the two tables that were the result of the literature study. These interviews resulted
in a list of the most important KPIs and some additional expert information that could be considered for
implementation into Flightmap.
The interviews were semi-structured with the idea to ask only a few open ended questions which
left room for the interviewees to tell about the processes in their firm or where they were specialized in.
In these questions, they were led to provide information about the project and portfolio management
process and the KPIs that they use or found valuable. Appendix 1 provides the interview questions which
were used as guidance during the interviews. The interview consisted of 3 parts. The first part was some
general information which could be useful in the analysis phase to trace specific answers. The second

6
part of the interview concerned the project or Stage-Gate® process and the third part concerned
portfolio management. In these two parts the relative priorities of the KPIs that resulted from the
literature study were discussed.
The results of the interviews have been used for an analysis of the gaps between what is currently
offered by Flightmap and what is most valued by the interviewees. The KPIs within Flightmap are
assessed by evaluating to what extent the KPIs from the literature study have been implemented in
Flightmap. Afterwards, the most valued KPIs that resulted from the interviews were compared to the
KPIs that are not provided by Flightmap. The results of these interviews and the gap analysis can be
found in chapter 3.
Plan of action
This gap-analysis was the input for the “plan of action” phase, where a design was created to
improve Flightmap. From this gap-analysis, five KPIs were selected for implementation in Flightmap.
During the “plan of action” phase these five selected key performance indicators have been defined in
mathematical formulae where possible.
Intervention
The intervention steps that followed consisted of implementing the design into the demo version of
Flightmap. Part of the implementation could be done by configuring Flightmap, another part had to be
designed by software engineers based on my specifications. The test of the implemented functionality
was done by me and reviewed by the project manager and CTO of Bicore.
Evaluation
In the evaluation phase, a test case was used to test whether the KPIs deliver the required insights
to manage the portfolio. These results were reviewed with the CTO of Bicore to get initial evidence
whether the intervention actually resulted in an improvement.
7
1.3. Outline of the report
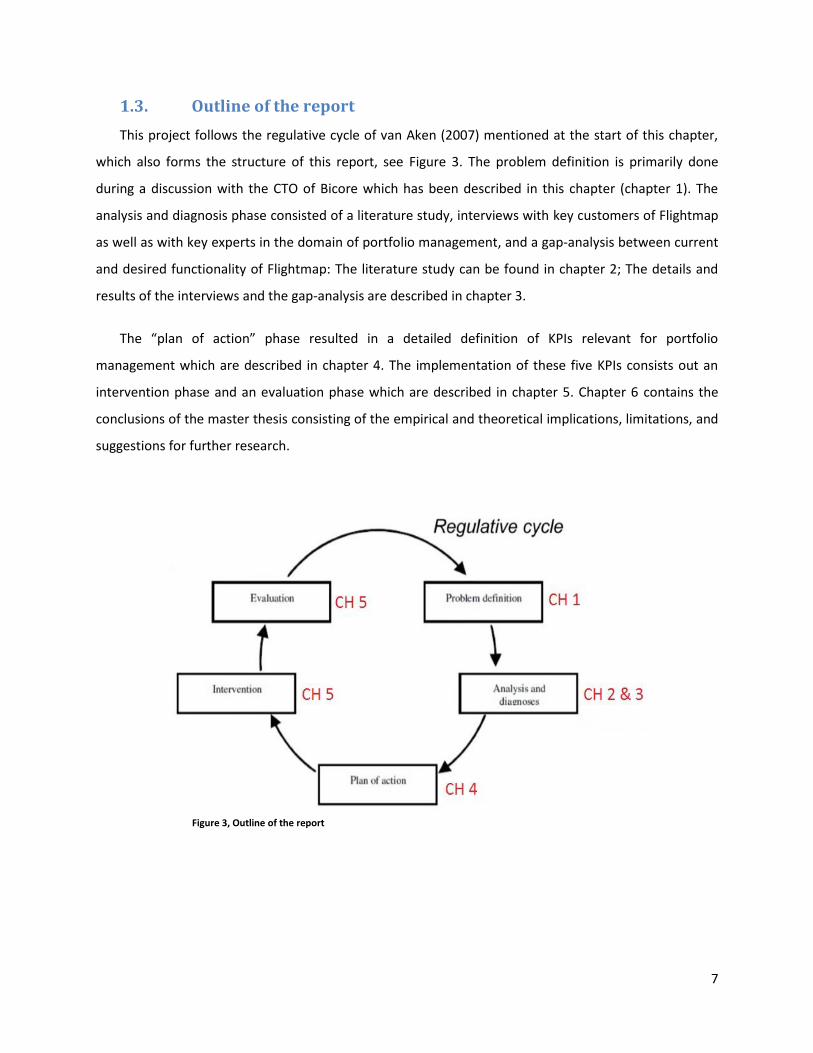
This project follows the regulative cycle of van Aken (2007) mentioned at the start of this chapter,
which also forms the structure of this report, see Figure 3. The problem definition is primarily done
during a discussion with the CTO of Bicore which has been described in this chapter (chapter 1). The
analysis and diagnosis phase consisted of a literature study, interviews with key customers of Flightmap
as well as with key experts in the domain of portfolio management, and a gap-analysis between current
and desired functionality of Flightmap: The literature study can be found in chapter 2; The details and
results of the interviews and the gap-analysis are described in chapter 3.
The “plan of action” phase resulted in a detailed definition of KPIs relevant for portfolio
management which are described in chapter 4. The implementation of these five KPIs consists out an
intervention phase and an evaluation phase which are described in chapter 5. Chapter 6 contains the
conclusions of the master thesis consisting of the empirical and theoretical implications, limitations, and
suggestions for further research.
Figure 3, Outline of the report

8
2. Theoretical analysis
In this chapter, the analyzed theory will be discussed. In the introduction, the New Product
Development (NPD) process will be described in more detail and the research questions will be
presented. In sub-chapter 2.2 the project management process, in particular the Stage-Gate® process,
gate objectives, and gate-criteria will be analyzed. Sub-chapter 2.3 will focus on the NPD portfolio
management process. This sub-chapter will elaborate on the objectives of Portfolio management, the
four goals of portfolio management, and the most used portfolio management methods which help to
achieve these four goals. Conclusively, the gate and portfolio KPIs will be compared in sub-chapter 2.4.
Finally, there will be a conclusion in which the research questions will be answered.
2.1. Introduction
New product development can be defined as the transformation of market opportunities into
products available for sale (Krishnan et al., 2001). “Developing the ‘right’ new products is critical to the
firm’s success and is often cited as key to a sustained competitive advantage” (Kavadias et al., 2007, p.
135). To successfully commercialize new products, a clear, well defined new product development
process should be in place (Cooper, 2012).
The NPD management process can,
just like any other complex management
process, be segmented in different
management levels. McGrath (2004)
defined 3 levels for this management
process. These 3 levels are, as can be seen
in Figure 4, product strategy, portfolio and
financial management, and pipeline management. Product strategy is the highest level of the framework
and this is where the company creates strategies in the form of product line plans, platform strategies,
and technology roadmaps. When this strategy is developed, portfolio management can be conducted.
Portfolio management is the process of analyzing the characteristics of R&D projects, technology, and
other innovation efforts currently funded and underway in order to link them to the business and
product strategy. This is also called strategic balancing (McGrath, 2004).
Archer et al. (1999) suggest a two-step process for portfolio management, the second level in the
NPD management process. In the first step, the relative total benefit of each project is determined. This
Product strategy
Portfolio and Financial Management
Pipeline Management
Figure 4, Process levels of the NPD management process (McGrath, 2004)
9
means that the relative value of each project is determined in comparison with the rest of the projects.
This can be done with methods such as pairwise comparison, Q-Sort, and analytic hierarchy process AHP
for smaller sets of projects and with scoring models for larger sets of projects. In the second step, all
project interactions, resources and other constraints should be included in the optimization process of
the overall portfolio, based on the relative total benefits of each project calculated in step 1.
Furthermore, portfolio selection is a strategic decision about the balance among the selected projects
such as risk, size of projects, and short term vs. long term. This is important because having too many
high risk or large projects could be dangerous due to the fact that failure of several of these projects
may cause serious damage to the organization, but too many low risk projects may not lead to the
financial return that is typical for high risk projects. Too many long term projects may cause financing or
cash flow problems due to a large value of death.
The lowest level of McGrath’s (2004) model, pipeline management, covers determining priorities
and assigning resources to the projects. Most best-practice companies use a robust idea-to-launch
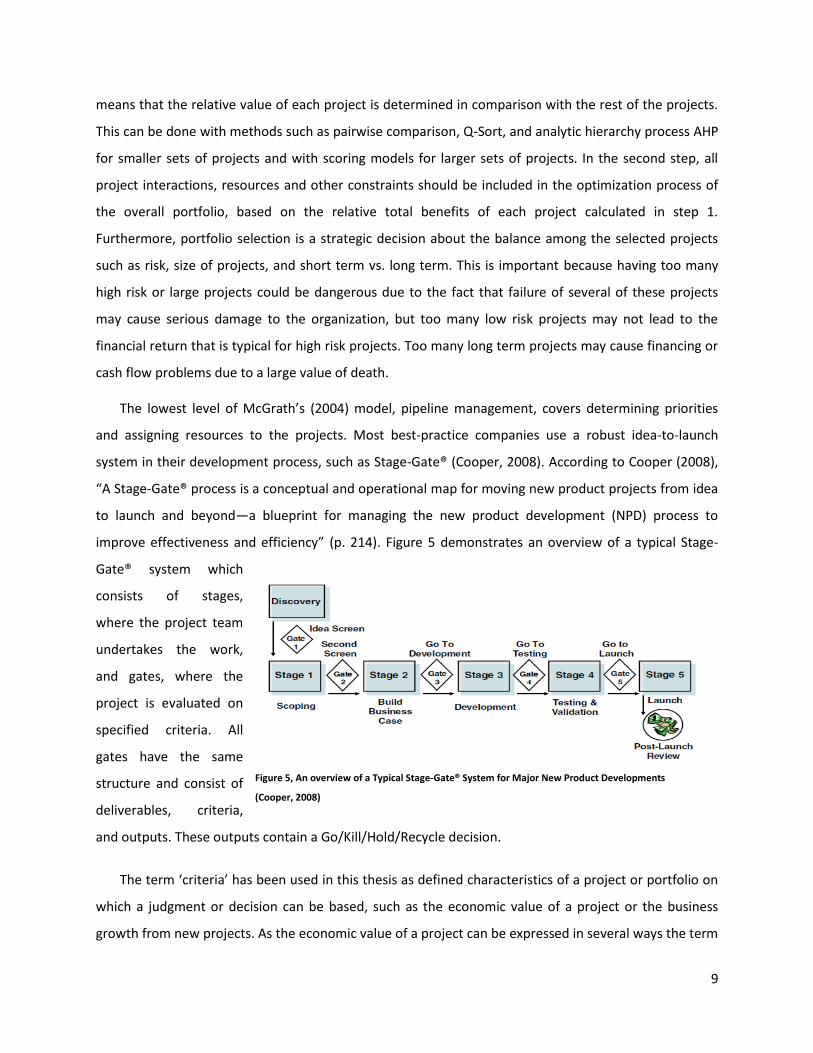
system in their development process, such as Stage-Gate® (Cooper, 2008). According to Cooper (2008),
“A Stage-Gate® process is a conceptual and operational map for moving new product projects from idea
to launch and beyond—a blueprint for managing the new product development (NPD) process to
improve effectiveness and efficiency” (p. 214). Figure 5 demonstrates an overview of a typical Stage-
Gate® system which
consists of stages,
where the project team
undertakes the work,
and gates, where the
project is evaluated on
specified criteria. All
gates have the same
structure and consist of
deliverables, criteria,
and outputs. These outputs contain a Go/Kill/Hold/Recycle decision.
The term ‘criteria’ has been used in this thesis as defined characteristics of a project or portfolio on
which a judgment or decision can be based, such as the economic value of a project or the business
growth from new projects. As the economic value of a project can be expressed in several ways the term
Figure 5, An overview of a Typical Stage-Gate® System for Major New Product Developments
(Cooper, 2008)
10
Key Performance Indicator (KPI) has been used in this thesis as quantifiable measure of a criterion. A KPI
can be described by a formula and is expressed by a number, which makes it possible to compare
projects or portfolios, such as Net Present Value (NPV) or sales rate from new projects which are
quantifiable measures of the criterion economic value of a project and the business growth from new
projects respectively.
Flightmap contains many KPIs to analyze projects and support decisions in the gate process but
provides less KPIs that support decision making in the portfolio meetings. The customers of Bicore are
quite satisfied with Flightmap, but encounter the missing KPIs on portfolio level and have asked more
insight in the drivers behind a successful portfolio. In other words, customers want KPIs that
demonstrate the quality of a portfolio which helps them to analyze and optimize their portfolio.
As described before, it has been decided that the scope of this thesis will be limited to the definition
and implementation of key performance indicators that help to evaluate the quality of the portfolio. As
it has become clear that the NPD management process consists out of a product strategy, a Stage-Gate®
process, and portfolio management which aligns the projects with the strategy, this literature study has
focused on the criteria that should be used for Gate-decisions and for portfolio decisions. To address
this, three research questions have been defined:
1. What are good Gate criteria / KPIs within the scope of the project to determine if the projects
should have a Go/Kill/Hold/Recycle decision?
2. What are good portfolio criteria / KPIs that will lead to an optimal portfolio?
3. Are there similarities between the gate -and portfolio KPIs?
The first and second research question will explore which gate and portfolio criteria and KPIs are
known in scientific literature. These KPIs are used in a later stage of the research to prioritize them by
ranking them during interviews and to analyze the disparity between the highly prioritized KPIs and the
KPIs that are present in Flightmap. An answer to these two research question can be found in de first
two sub-chapters.
The third research question is important to examine whether gate and portfolio decisions can be
made on the same criteria or should be based on different criteria and why that should be. In the final
sub-chapter, the research questions will be answered.
11
2.2. Stage-Gate®
This sub-chapter will focus on finding an answer to the first research question. In order to achieve
this, the definition of the Stage-Gate® process should be clear. A Stage-Gate® process is, as defined by
Cooper (2008), “a conceptual and operational map for moving new product projects from idea to launch
and beyond—a blueprint for managing the NPD process to improve effectiveness and efficiency” (p.
214). As mentioned above and illustrated by figure 6, a Stage-Gate® system consists of stages where the
project team undertakes the work, and gates were the project is evaluated on specified criteria.
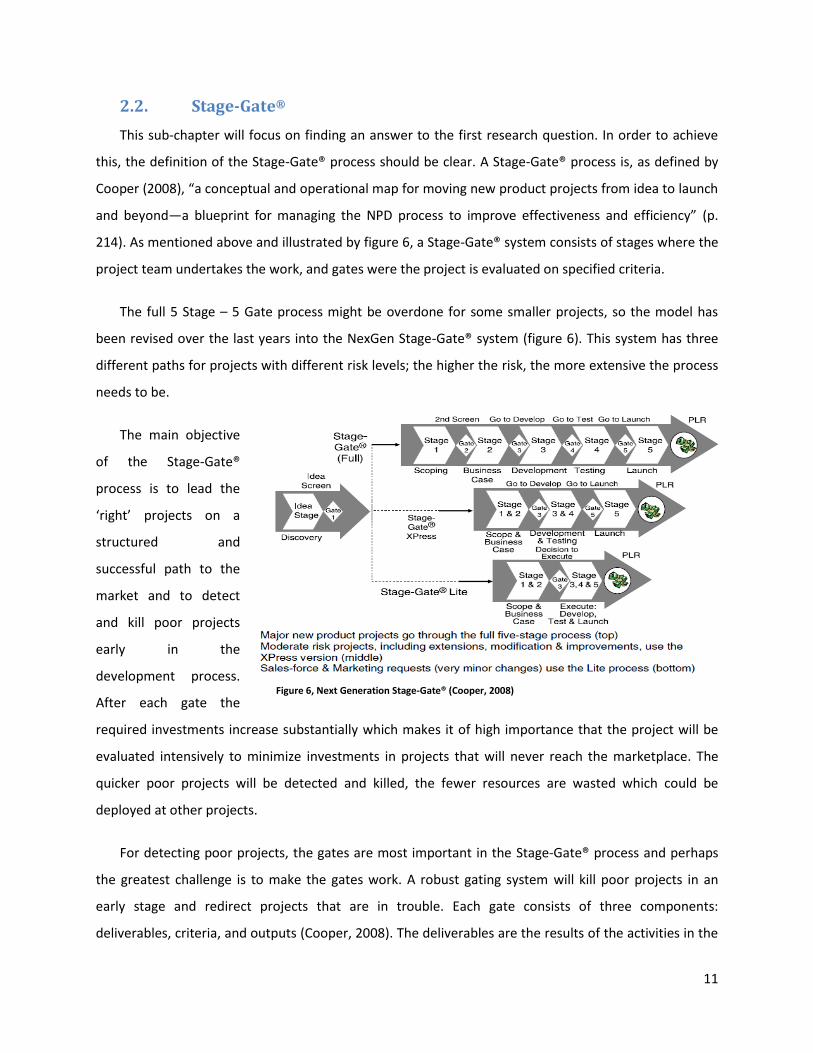
The full 5 Stage – 5 Gate process might be overdone for some smaller projects, so the model has
been revised over the last years into the NexGen Stage-Gate® system (figure 6). This system has three
different paths for projects with different risk levels; the higher the risk, the more extensive the process
needs to be.
The main objective
of the Stage-Gate®
process is to lead the
‘right’ projects on a
structured and
successful path to the
market and to detect
and kill poor projects
early in the
development process.
After each gate the
required investments increase substantially which makes it of high importance that the project will be
evaluated intensively to minimize investments in projects that will never reach the marketplace. The
quicker poor projects will be detected and killed, the fewer resources are wasted which could be
deployed at other projects.
For detecting poor projects, the gates are most important in the Stage-Gate® process and perhaps
the greatest challenge is to make the gates work. A robust gating system will kill poor projects in an
early stage and redirect projects that are in trouble. Each gate consists of three components:
deliverables, criteria, and outputs (Cooper, 2008). The deliverables are the results of the activities in the
Figure 6, Next Generation Stage-Gate® (Cooper, 2008)

12
stages and will be presented by the project leader and/or the team. What these project deliverables
should be is decided in the previous gate. The criteria include must-meet criteria and should-meet
criteria against which the project is judged. The output of the gates is a Go/Kill/Hold/Recycle decision.
This decision includes an approved timeline, committed resources, and defined deliverables for the next
gate (Cooper, 2008).
Recent research of Cooper et al. (2012) on effective gates demonstrates that the defined Go/Kill
criteria are most indicative of the difference between the best and the worst performers.
To evaluate projects in the gate-meetings, they will be evaluated according to a set of criteria. Hart
et al. (2003) and Tzokas et al. (2004) have investigated gate evaluation criteria per stage used in
practice. Table 2 gives an overview of the most frequently used evaluation criteria per gate by
companies in the Netherlands and in the United Kingdom.
Table 2, Overview of the most frequently used evaluation criteria (Tzokas et al., 2004)
The results of the research of Hart et al. (2003) and Tzokas et al. (2004) demonstrate that each gate
has different gate criteria. This can be logically explained by the fact that each stage contains different
tasks and competencies and therefore should be evaluated with different criteria. This result also
implies that criteria such as technical feasibility, product uniqueness, customer acceptance, market
potential, and intuition are more used in the first two stages to spend only resources on ideas that are
technical feasible and attractive to the market. In the business analysis gate, the critical decision should
be made whether a large increase of resources should be committed to the project. In this decision,
financial criteria such as meeting sales and profit objectives, margin (Hauser et al., 1997), and sales in
units (Griffin et al., 1993) are used more often. During and after the development process, product
performance, quality, and customer acceptance & satisfaction are considered more important, while a
focus on customer acceptance & satisfaction, margin and sales in units are the most used criteria after
13
launch. Further findings that are worth mentioning are that financial dimensions are heavily used in the
business analysis stage and after that gain more importance at the launch gates, and that the product
performance dimension is often used in the product and market testing gates.
The research of Hart et al. (2003) and Tzokas et al. (2004) is based on the frequency of use of gate
criteria and therefore does not give empirical evidence of the actual importance of these gate criteria.
Consequently, the importance of these criteria should, as also noted by Hart et al. (2003), be
investigated in further research.
Griffin et al. (1996) relate criteria to the businesses strategy instead of the different gates. Although
they investigate criteria to measure product success after launch, this is most likely highly correlated
with gate-criteria because they share the same goal, namely product success. They found that
businesses with different strategies indeed use some different criteria but also found some similarities
between them. Customer satisfaction seems important for all strategies, but for more radical product,
customer acceptance will be more important. Profit goals seem to be the most important financial
measure, with internal Rate of Return (IRR) and Return On Investment (ROI) additionally for radical
innovations. Firms with a cost reduction strategy focus more on margin goals than on profits to keep the
costs as low as possible. Competitive advantage seems to be the most important performance measure
except for the cost reduction strategy where the focus will be more on performance and quality.
From these findings, it can be concluded that there are some significant results as to which gate
criteria within the scope of the project can be used to determine if the project should have a
Go/Kill/Hold/Recycle decision. On top of that, a distinction can be made between different criteria
corresponding to the different gates and to different strategies. Nevertheless, the effect of these criteria
and the stage they are used in on product performance should be investigated in further research.
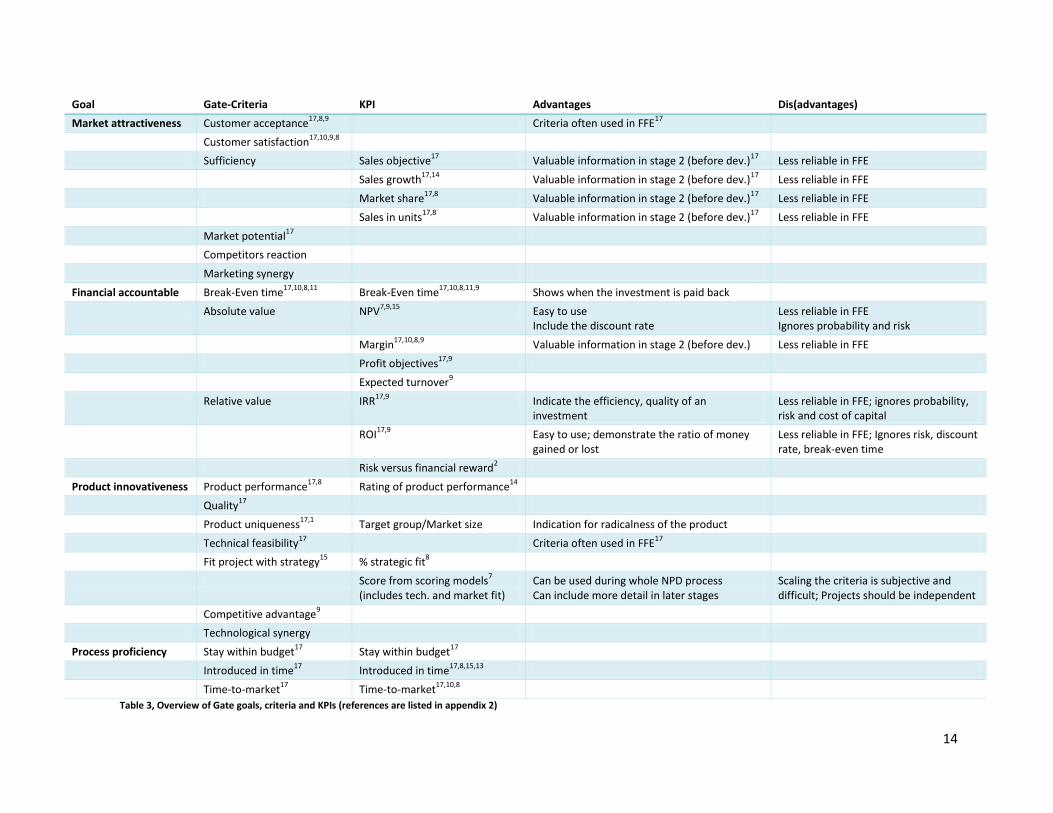
Table 3 gives an overview of different gate-criteria, the KPIs that can be used, and advantages and
disadvantages associated with the use of these KPIs. The goals in the table are derived from the
categories that Tzokas et al. (2004) use and the critical NPD success factors (Henard et al., 2001), namely
market, financial, product, and process. Intuition (Tzokas et al. 2004) also seems to be a significant
aspect (Kester, 2009), but is out of the scope of this project as this project focuses on fact based criteria
and KPIs. The criteria and KPIs found in the literature concerning gates are assigned to these four goals.
Additionally, some advantages and disadvantages of the different criteria and KPIs are added.
14
Goal Gate-Criteria KPI Advantages Dis(advantages)
Market attractiveness Customer acceptance17,8,9
Criteria often used in FFE17
Customer satisfaction17,10,9,8
Sufficiency Sales objective17
Valuable information in stage 2 (before dev.)17
Less reliable in FFE
Sales growth17,14
Valuable information in stage 2 (before dev.)17
Less reliable in FFE
Market share17,8
Valuable information in stage 2 (before dev.)17
Less reliable in FFE
Sales in units17,8
Valuable information in stage 2 (before dev.)17
Less reliable in FFE
Market potential17
Competitors reaction
Marketing synergy
Financial accountable Break-Even time17,10,8,11
Break-Even time17,10,8,11,9
Shows when the investment is paid back
Absolute value NPV7,9,15
Easy to use Include the discount rate
Less reliable in FFE Ignores probability and risk
Margin17,10,8,9
Valuable information in stage 2 (before dev.) Less reliable in FFE
Profit objectives17,9
Expected turnover9
Relative value IRR17,9
Indicate the efficiency, quality of an investment
Less reliable in FFE; ignores probability, risk and cost of capital
ROI17,9
Easy to use; demonstrate the ratio of money gained or lost
Less reliable in FFE; Ignores risk, discount rate, break-even time
Risk versus financial reward2
Product innovativeness Product performance17,8
Rating of product performance14
Quality17
Product uniqueness17,1
Target group/Market size Indication for radicalness of the product
Technical feasibility17
Criteria often used in FFE17
Fit project with strategy15
% strategic fit8
Score from scoring models7
(includes tech. and market fit) Can be used during whole NPD process Can include more detail in later stages
Scaling the criteria is subjective and difficult; Projects should be independent
Competitive advantage9
Technological synergy
Process proficiency Stay within budget17
Stay within budget17
Introduced in time17
Introduced in time17,8,15,13
Time-to-market17
Time-to-market17,10,8
Table 3, Overview of Gate goals, criteria and KPIs (references are listed in appendix 2)
15
Conclusions on Stage-Gate®
The objective of this sub-chapter was to find an answer to the research question “What are good
Gate criteria / KPIs within the scope of the project to determine if the projects should have a
Go/Kill/Hold/Recycle decision?”. Several different gate-criteria that could be used in order to make this
decision were found in the literature and were included in an overview table (table 3).
The research of Hart et al. (2003) and Tzokas et al. (2004) demonstrates that criteria such as
technical feasibility, product uniqueness, customer acceptance, market potential, and intuition are more
often used in the first two stages to spend only resources on ideas that are technical feasible and
attractive to the market. In the business analysis gate, financial criteria such as meeting sales and profit
objectives, margin (Hauser et al., 1997), and sales in units (Griffin et al., 1993) are used more often.
During and after the development process, product performance, quality, and customer acceptance and
satisfaction are considered more important, while a focus on customer acceptance and satisfaction,
margin, and sales in unit are the most used criteria after launch.
Further findings that are worth mentioning are that financial dimensions are heavily used in the
business analysis stage and after that gain more importance at the launch gates, and that the product
performance dimension is often used in the product and market testing gates.
The most notable conclusion which was derived from the literature is that the criteria and KPIs that
should be used vary significantly per gate and the business strategy that is applied. In other words, the
criteria and KPIs are strongly dependent on the goals that need to be achieved.
16
2.3. NPD Portfolio management
This sub-chapter will focus on answering the second research question which concerns good
portfolio criteria (KPIs) that will lead to an optimal portfolio. The term portfolio management is
borrowed from the investment community where this profession has been executed for many years.
Every development project that a company starts can be seen as an investment just the same as a stock
market investment. An investor in the stock market needs to ensure that he has the right balance and
mix of investments in his portfolio and should have a systematic portfolio management system that
helps with selecting the right investments. Due to scarce resources and high competitive rivalry it should
be clear that it is also of high importance for a company to work on the right projects and allocate the
resources to the right projects. Working on the right projects is often cited as the key to a sustainable,
competitive advantage (Chao et al, 2007). Managers that can define the right NPD strategy for the
company, can select the winning NPD projects, and achieve the ideal portfolio balance will win in the
long run (Cooper et al., 1999).
“Without an effective portfolio management process in place, the business suffers many evils: poor-
quality projects, too many short terms and lower-risk projects, too many projects for the resources at
hand, ultimately resulting in pipeline gridlock, and an investment portfolio that does not mirror the
strategic priorities of the business” (Cooper et al., 1999, p. 351).
Portfolio management is the management process linking the business and product strategy to the
management of R&D projects, technology, and other innovation efforts currently funded and ongoing.
This management process thus entails deciding which projects to continue, abandon, or to put on hold.
Cooper et al. (2001) state that portfolio management has the following four goals:
Goal 1: Maximize the value of your portfolio
This goal entails striving to select those projects that lead to the maximum financial or commercial
value in terms of business objectives that is possible with the projects in the pipeline. This objective can
be achieved by ranking projects and include projects into the portfolio until you run out of resources.
Several methods can be used to rank these projects.
First of all, financial methods such as NPV, productivity index (PI), and Expected Commercial Value
(ECV) are often used. The NPV is the easiest metric to use but does not take the constraining resources
into account. To yield a higher overall value of the portfolio, the productivity index can be used because
17
it divides the NPV by the constraining resource. Both the NPV and productivity index neglect risk and
therefore disfavor high risk projects. Furthermore, the reliability is depending on the input data which
becomes more reliable from gate two till the end of the funnel. The ECV may be a realistic alternative as
it takes the technical and commercial risk into account and thus will not disfavor risky projects. This
metric remains sensitive for improper input date and therefore should be used after gate two.
Secondly, scoring models can be used as an alternative to the financial methods. Scoring models
yield project attractiveness scores by rating the projects against a set of scaled criteria. This project
score is most often used to rank and prioritize projects and rarely used to make Go/Kill decisions where
the score is compared to a cut-off criterion. Scoring models are an appropriate method to use in
addition to financial criteria because it is possible to rank projects on multiple economic and non-
economic criteria. A drawback is that scaling criteria is subjective and is experienced as difficult which
results in erroneous decisions. Nevertheless, businesses that use scoring models obtain a higher value
portfolio than other businesses (Cooper, 2002). One should be warned for oversimplification and
disruptive results when there is interdependence between projects but the fact that this method can
include non-economic factors makes it more useful in the early stages.
Goal 2: Seek balance in your portfolio
The second goal concerns striving reduce risk by creating a balanced portfolio. Balance can be
achieved in terms of several parameters such as “long term projects versus short ones; or high risk
versus low risk; and across various markets, technologies, product categories, and project types (e.g.,
new products, improvements, cost reductions, maintenance and fixes, and fundamental research)”
(Cooper et al., 2001, p. 4). This balance can be checked by informative displays such as bubble diagrams
and pie charts. Bubble diagrams display three variables; two of these variables are plotted on the X and
Y axes and the third variable is represented by the size of the bubbles. The well-known and by far most
used bubble diagram is the risk-reward diagram which plots the reward, like NPV of IRR, against the
probability of technical and commercial success. The third variable can represent for example the annual
resources or strategic fit.
The advantage of a bubble diagram is that it depicts the current state of the portfolio and how the
resources are allocated. As bubble diagrams will be used to depict the entire portfolio--and thus
demonstrate all the projects in the NPD funnel--the reliability of the different bubbles can differ
significantly as they are dependent on the data which becomes more reliable during the process.

18
Another drawback is that a bubble diagram is a relative tool which means that it shows the position in
respect to other projects, for example, a project can have a high NPV compared to other projects which
give the impression of a good project, but it may be that the overall NPV of all projects is very low.
These drawbacks make bubble diagrams more useful for informational purposes than for decisions-
making.
Next to bubble diagrams, pie-charts are often used to visualize the balance of the portfolio. Popular
pie-charts visualize a breakdown by project type, market or segment, and by product line or category
(Cooper et al., 2001).
Goal 3: Your portfolio must be strategically aligned
Strategic alignment of the portfolio means that the projects should be “on strategy” (Cooper et al.,
2001, p. 4) and that the distribution of resources across projects, technologies, areas, markets, etc.
should mirror the strategic priorities (Joshi et al., 2003). To achieve strategic alignment, strategic
buckets can be used.
Chao et al. (2007) define a strategic bucket as a collection of NPD programs that are affiliated with a
particular strategy. The dimensions of these buckets will be defined by the top-management and can
vary greatly per business. The most popular dimensions are to define buckets are type of market, type
of development, and product line (Cooper et al, 2001). Each bucket has its own budget or resource
capacity. All projects will be assigned to a single bucket until the resources of that bucket are depleted
(Barczak et al., 2009). For ranking the projects within the bucket, financial criteria are often used. The
advantage of using strategic buckets is that entirely different projects are not competing against each
other for the same, mostly scarce resources and it will simplify the scope of the portfolio decisions.
Furthermore, it will provide a strategically aligned portfolio and will not disfavor high risk projects. The
drawback of this method is that the difficult task arises to put projects into buckets. Nevertheless, top
performers use strategic buckets more often than the rest (Cooper et al., 1998, Chao et al. 2004, Barczak
et al., 2009).
A second method to achieve strategic alignment is to use top-down product roadmaps. The top-
down product roadmap is based on the question: “given that you have selected several areas of
strategic focus - markets, technologies or product types - what major initiatives must you undertake in
order to be successful here?” (Cooper et al., 2001, p. 5). The projects that will be selected to achieve the
goal form a product roadmap which is 100% strategically driven. Furthermore, product roadmaps are

19
very useful in communicating the strategy into the organization and creating a common understanding
about it (Phaal, 2003).
Finally, a bottom-up approach can be used which is based on the “gates dominate” Stage-Gate®
approach. This approach is based on the claim that good Gate-decisions on individual projects will
improve your portfolio. To achieve good Gate-decision, a scoring model or checklist can be used. To
achieve strategic alignment with this method, strategic questions should be included in the scoring
model.
Goal 4: Pick the right number of projects
The last objective of portfolio management is to pick the right number of projects. According to
Cooper et al. (2001), most companies have too many projects in their portfolio considering their limited
resources. Too many projects in the portfolio creates pipeline gridlock which means that projects end up
in a queue. To prevent pipeline gridlock, resource constrains can be applied to value maximization
methods and to bubble diagrams (counting the sum of the areas). In this way, pipeline gridlock will be
prevented during achieving goal 1 and will be monitored at goal 2 of portfolio management. A second
method to prevent pipeline gridlock is to conduct a resource capacity analysis; comparing the resource
demand with the required resources. When the required resources exceed the demand, a project limit
should be implemented. Software tools such as MS-Project can assist in performing such analyses.
As can be seen in the description of these four goals, each goal has its own methods to reach the
goals and every method has its own purpose and its own advantages and disadvantages. Table 4 shows
an overview of the four different project portfolio management (PPM) goals and the methods that can
be used to achieve these goals.
Financial methods
Business strategy
Scoring model
Bubble diagram Checklist
Value maximization X X
Balance X
Strategic alignment X X X
Portfolio load X X Table 4, Portfolio goals with suitable methods
Taking into account that no single method will give the best results, it should be clear that the use of
multiple methods should yield better results because more objectives will be reached. Cooper et al.
(2001) measured that the top performers use on average 2.43 methods, half of them use more than 3
methods, while the worst performers only use 1.83 methods, and half of them use only one method.

20
One even more
remarkable
result from this
research is the
difference
between the
dominant
methods of the
best and worst
performers,
see figure 7
(Cooper et al., 2001).
Remarkable in these results is that the best performers rely much less on financial methods as the
dominant method than average or worst businesses. This implies that financial methods, despite of their
popularity, yield less remarkable results than many businesses expect they do. One last conclusion that
can be drawn is that best performers rely much more on strategic methods and align their portfolio and
allocate resources based on their business strategy.
After discovering the objectives of portfolio management and the methods how to achieve them,
we can finally focus on the question: What are good Key Performance Indexes (KPIs) that will lead to an
optimal portfolio?
As seen in this sub-chapter, there exist different methods with KPIs that support achievement of the
PPM goals. In more detail, financial KPIs and scores from scoring models support the goal to maximize
the portfolio value (Cooper et al. 2001, Lombard 2003), sales and turnover rate, growth targets,
percentage of projects that fit the strategy and scores from score models support the strategic
alignment goal (Killen et al. 2008, Griffin et al. 1996). A percentage of projects on hold and resource
utilization indicates portfolio gridlock (Lombard 2003). Table 5 shows an overview of the PPM goals,
criteria and KPIs that was found in the literature. This table is also extended with the advantages and
disadvantages of the different criteria and KPIs.
Figure 7, The dominant portfolio method employed -the best vs. worst (Cooper et al., 2001)

21
PPM Goal Criteria KPI Advantages Dis(advantages)
Maximize portfolio value
7,13
Absolute value creation NPV7,9,15
Easy to use Include the discount rate
4
Less reliable in FFE; Ignores probability and risk
4; Disfavor long, new-product projects
4
ECV7,15
Deals with risk and probability of success4 Less reliable in FFE; Difficult to use
(especially under uncertainty) 12
Relative value creation PI3 Create higher portfolio value than just NPV
4
Takes resource constraint into account4
Less reliable in FFE Ignores probability and risk
IRR17,9
Indicate the efficiency, quality of an investment
Less reliable in FFE; Ignores probability, risk and cost of capital
ROI17
Easy to use; Demonstrate the ratio of money gained or lost
Less reliable in FFE; Ignores risk, discount rate, break-even time
Non-economic value creation Score from scoring models2
Can be used during whole NPD process Can include more detail in later stages
Scaling the criteria is subjective and difficult; Projects should be independent
Balance7,13
long term vs. short projects,15
Reduce risk
high risk vs. low risk7 Reduce risk
across various markets7 Reduce risk
across various technologies7,15
Reduce risk
across various product categories7,15
Reduce risk
across various project types (e.g., new products, improvements, cost reductions, maintenance and fixes, and fundamental research)
7,15
Reduce risk
Pipeline balance16
Reduce risk
Alignment with strategy
7,5
Strategic fit15,13
% of projects that fit the strategy
10,16
Score from scoring models2
(includes tech. and market fit) Can be used during whole NPD process Can include more detail in later stages
Scaling the criteria is subjective and difficult; Projects should be independent
Growth from new products14
Sales rate from new products
1,6
Easy to use Measurement after launch
Turnover from new products
Turnover rate from new products
10,16,11,9,6
Easy to use Measurement after launch
Sufficiency Growth targets9
Portfolio gridlock7 Sufficient resources
1,15 80% occupation
Sufficient nr. Of projects15,13
% projects on hold
Table 5, Overview of PPM goals, criteria, and KPIs (references are listed in appendix 2)

22
Conclusions on NPD portfolio management
The objective of this sub-chapter was to find an answer to the second research question which
concerns good portfolio criteria (KPIs) that will lead to an optimal portfolio. Several different KPIs were
found in the literature and were included in an overview table (table 5).
A result of the literature review is that there are no KPIs for the balance goals, the only tool that
support this goal is the bubble diagram which visualizes the balance. A second result is that there are no
KPIs that demonstrate the extent to which the goal is achieved.
Exploring discussions on Linked-In groups, such as the PPM Projects Portfolio Management and
Strategic Portfolio Management group, supports the notion that there is a need on portfolio KPIs. One
article from Matheson (2012) in particular describes Coca-Cola’s three portfolio criteria explained by
John Hodgson, director of Innovation Pipeline Management at Coca-Cola.
The three basic criteria for Coca-Cola are:
“Aligned; does your portfolio have projects that move the company in the necessary direction?
Sufficient; is there enough investment to deliver on the goals?
Balanced; does the portfolio respond to the company’s span of needs? For example, projects
that will deliver in different time frames (Coca-Cola has a fairly operational portfolio that targets
70% in 0-12 months, 20% in 12-24 months and 10% in 24+ months)” (Matheson, 2012).
The fact that there is discussion about portfolio KPIs and that the above mentioned criteria are
already in use by a highly regarded firm, prove that it would be interesting to conduct more research
about portfolio KPIs. Reviewing research conducted by the Research-Technology Management (RTM)
journal and the many benchmarking articles used in this chapter, confirms that the optimal portfolio
metrics are still not discovered. Even a recent presentation on May 10, 2012 at the DAAG (Menke, 2012)
confirms that the best practices and pitfalls that were found in the somewhat aging scientific literature
are still present. This gap in the literature confirms that there should be more research in this area.
23
2.4. Comparison of Gate -and Portfolio KPIs
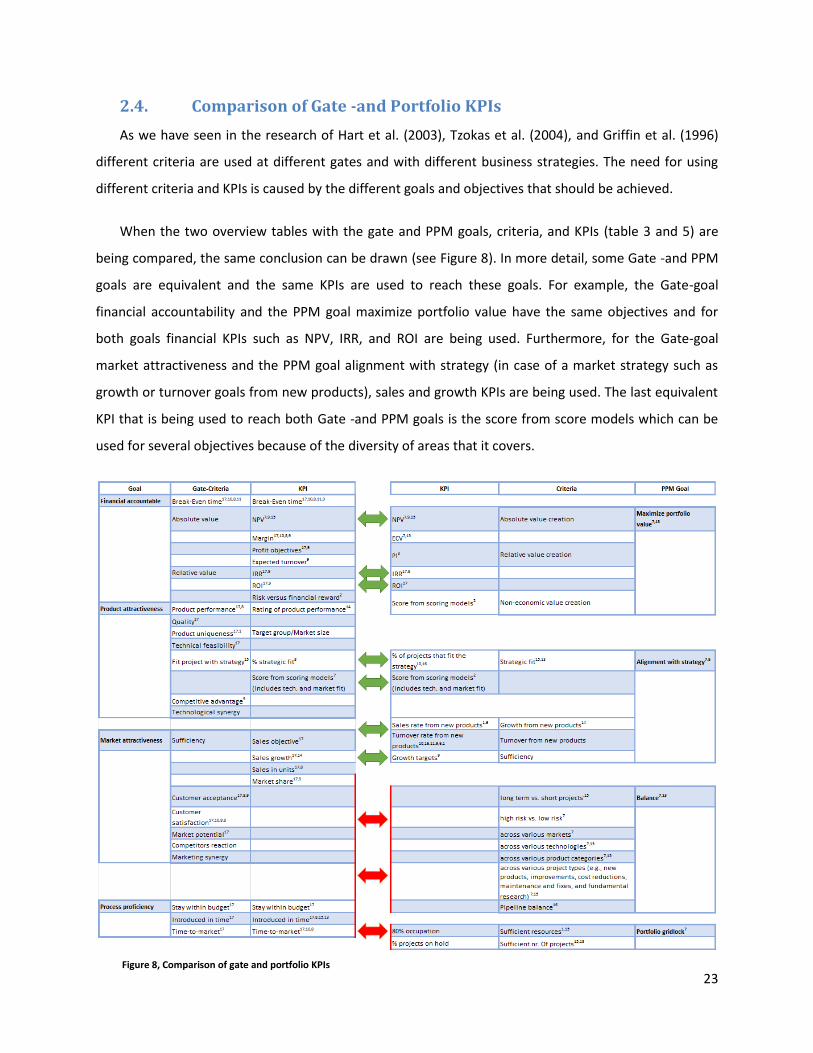
As we have seen in the research of Hart et al. (2003), Tzokas et al. (2004), and Griffin et al. (1996)
different criteria are used at different gates and with different business strategies. The need for using
different criteria and KPIs is caused by the different goals and objectives that should be achieved.
When the two overview tables with the gate and PPM goals, criteria, and KPIs (table 3 and 5) are
being compared, the same conclusion can be drawn (see Figure 8). In more detail, some Gate -and PPM
goals are equivalent and the same KPIs are used to reach these goals. For example, the Gate-goal
financial accountability and the PPM goal maximize portfolio value have the same objectives and for
both goals financial KPIs such as NPV, IRR, and ROI are being used. Furthermore, for the Gate-goal
market attractiveness and the PPM goal alignment with strategy (in case of a market strategy such as
growth or turnover goals from new products), sales and growth KPIs are being used. The last equivalent
KPI that is being used to reach both Gate -and PPM goals is the score from score models which can be
used for several objectives because of the diversity of areas that it covers.
Figure 8, Comparison of gate and portfolio KPIs
24
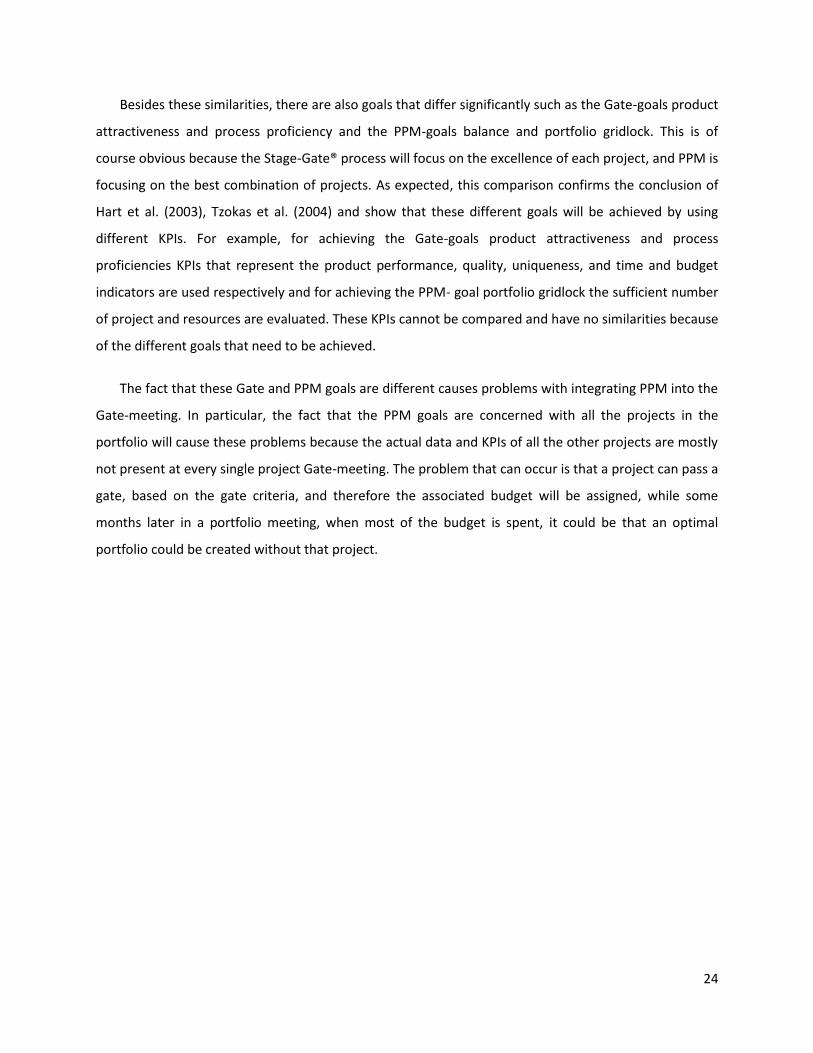
Besides these similarities, there are also goals that differ significantly such as the Gate-goals product
attractiveness and process proficiency and the PPM-goals balance and portfolio gridlock. This is of
course obvious because the Stage-Gate® process will focus on the excellence of each project, and PPM is
focusing on the best combination of projects. As expected, this comparison confirms the conclusion of
Hart et al. (2003), Tzokas et al. (2004) and show that these different goals will be achieved by using
different KPIs. For example, for achieving the Gate-goals product attractiveness and process
proficiencies KPIs that represent the product performance, quality, uniqueness, and time and budget
indicators are used respectively and for achieving the PPM- goal portfolio gridlock the sufficient number
of project and resources are evaluated. These KPIs cannot be compared and have no similarities because
of the different goals that need to be achieved.
The fact that these Gate and PPM goals are different causes problems with integrating PPM into the
Gate-meeting. In particular, the fact that the PPM goals are concerned with all the projects in the
portfolio will cause these problems because the actual data and KPIs of all the other projects are mostly
not present at every single project Gate-meeting. The problem that can occur is that a project can pass a
gate, based on the gate criteria, and therefore the associated budget will be assigned, while some
months later in a portfolio meeting, when most of the budget is spent, it could be that an optimal
portfolio could be created without that project.
25
2.5. Conclusions on the literature study
The objective of this literature research was to answer the three research questions stated in the
introduction. The first research question concerned good gate criteria within the scope of the project
that help with determining whether the project should have a Go/Kill/Hold/Recycle decision. Sub-
chapter 2.2 covered several gate-criteria that could be used in order to make this decision and table 3
demonstrates an overview of these criteria and KPIs. A remarkable conclusion that was derived from the
literature is that the criteria and KPIs that should be used differ significantly per gate and across the
business strategy that is applied. In other words, the used criteria and KPIs are strongly dependent on
the goals that need to be achieved. It can be concluded that the overview of gate-criteria in table 3 form
the answer on the first research question but one should pay attention to assigning criteria to each gate.
The second research question was about good portfolio criteria and KPIs that will lead to an optimal
portfolio. Four PPM goals were found in the literature, namely maximize the value, find balance, align
with the strategy, and avoid portfolio gridlock. To reach these four goals, several different methods
could be used such as financial methods, strategic methods, bubble diagrams, and scoring models. Table
5 demonstrates an overview of these goals, criteria and the KPIs that are used most often to reach these
goals which forms the answer to the second research question. One remarkable conclusion that can be
drawn is that there are no KPIs that demonstrate how well the portfolio is balanced but only methods
such as bubble diagrams and pie charts that visualize the balance of a portfolio. This means that the user
should compare the visualization with its own definition of a well-balanced portfolio which is of course
user dependent. In this case, KPIs that demonstrate how well the portfolio is balanced related to the
different balance goals or to the business strategy can be of high value and should be investigated in
further research.
The last research question was about the similarities between the gate -and portfolio KPIs. Here the
literature clearly demonstrates that the criteria and KPIs used are dependent on the goal that should be
achieved. The fact that some gate- and PPM goals are to some extent equivalent results in similarities
between gate- and PPM KPIs. Even more, for the gate- and PPM goals that differ from each other,
different KPIs are used to reach these goals. These different goals and KPIs make it also difficult to
combine the gate- and PPM meetings. The answer on the third research question is that there are
similarities between Gate- and PPM KPIs but they are related to the goals that need to be achieved.

26
3. Empirical analysis
This chapter describes the empirical analysis which has been conducted in this master thesis. First,
the introduction describes how this analysis was performed. Second, the results of the interviews are
presented. Lastly, a gap-analysis has been conducted to explore the KPIs that should be in Flightmap
based on the empirical analysis but that are currently not included.
3.1. Introduction
The two tables that resulted from the literature study gave a good impression of what was known in
the scientific literature and enumerated the goals, criteria, and KPIs that are often used for gate and
portfolio decisions. These results could not yet be used for conducting a gap-analysis in Flightmap
because it was not known which KPIs are valued most by Bicore’s customers and experts in the field of
portfolio management. Therefore an empirical analysis was planned, consisting of interviews and a gap-
analysis.
As described in subchapter 1.2; Methodology, the sample for the
interviews consists of nine academic and practical experts with
extensive knowledge in the fields of portfolio management, R&D
project management, marketing, and finances. Furthermore, the
sample represents a diverse experience with Flightmap and project
portfolio management (PPM), from a business, financial, or
mathematical perspective. The names and businesses have been
anonymized but Figure 9 demonstrates expertise of the interviewees.
These interviews were held to get a better understanding of what KPIs are required to be added to
Flightmap to perform proper portfolio management. The discussions have led to both a qualitative
insight in how portfolio management is applied as well as a quantitative insight in the priorities for
implementation in Flightmap. This quantitative insight has been created by letting the interviewees rank
the KPIs from the two tables that resulted from the literature study (Table 3 and 5).
The interviews were, as described in subchapter 1.2, semi-structured and consisted of three phases
(see appendix 1). In the first phase, some general questions were asked such as experience, firm size,
and business sector to make it possible to compare the results based on these characteristics in a later
stage. The second and third phases were concerned about the Stage-Gate® and portfolio management
Figure 9, Expertise of the interviewees
27
process. Here the interviewees told about this process, the KPIs that they prefer to use, and the criteria /
KPIs that resulted from the literature study were scored.
The scoring part consisted of two phases. First, the interviewees had to distribute 10 points across
the gate and the PPM goals to identify the importance of these goals. This constant sum scaling method
was used to encourage the interviewees to compare the importance of the different goals instead of
marking them all as important. This has been done to get information about the way in which they apply
portfolio management; what is the goal they want to achieve. This gave some extra information about
whether the firm is for instance financially or strategically driven. Second, the interviewees scored the
KPIs, on a scale from 1 to 5, to define the importance of the individual KPIs that were found during the
literature study.
In the interviews, the KPIs that the interviewees like to use but which did not result from the
literature study were discussed. These gate- and portfolio KPIs are listed in this chapter but were not
ranked during the interviews. This choice has been made because the KPIs that were mentioned in the
last interviews could not be ranked in the first interviews. In other words, the interviewees that
mentioned these KPIs are prejudiced about these KPIs, otherwise they would not mention them, which
could negatively influence the investigation when not the entire sample was able to score these KPIs. As
these KPIs were not ranked, they were not included in the gap analysis. This does not mean, however,
that they should not be considered for the improvement of Flightmap.
The results of the interviews with a list of most important KPIs and some additional information and
KPIs that could be valuable for implementation into Flightmap can be found in the following sub-
chapter. The KPIs that were scored by the interviewees were used in a gap analysis which can be found
in sub-chapter 3.3.
3.2. Results of the interviews
As the interviews contain a discussion on Stage-Gate® and on portfolio management, the results of
the interviews are therefore also divided into these two categories. First, the results on Stage-Gate® will
be discussed, second, the results of portfolio management. These results also include the tables that
resulted from the literature study extended with the scores of the respondents and a mean score per
KPI with deviation. Lastly, some additional conclusions that resulted from the interviews will be
presented.

28
Findings with regard to Stage-gate®
The most importance goals that companies are striving to achieve within gate meetings have been
determined, as explained in the introduction, by letting the interviewees distribute 10 points among the
goals that were derived from the literature study (see table 6). From the four Gate-goals that were
mentioned in the table, financial accountability (with a mean value of 3.071 points) is valued as the most
important followed by product attractiveness (mean of 2.786 points) and process proficiency (mean of
2.286). The least important turned out to be market attractiveness (mean of 1.857). The low score of
market attractiveness can be caused by the prevailing (unfavorable) economic conditions where
extensive market research will be eliminated by budget cuts (Interview 1). Remarkable is that there is a
low standard deviation of these mean values which emphasizes that most of the interviewees share this
view. This is in contrast to the PPM-goals where the opinions of the interviewees, also demonstrated by
the standard deviations in the table, were much more diverse.
When looking at which KPIs are the most favorable to reach the most important goal, financial
accountability, it can be gathered that the financial criteria NPV, margin and ROI (with a mean score of
3.86, 3.8, and 3.8 respectively) are the most valued. It should be noted that the score of the NPV has a
high variation (1.5) which means a high diversity in the opinions of the interviewees. This may be caused
by the different projects and industries in which the interviewees are involved, as it became clear that
the NPV ignores probability and risk.
Measuring the second most importing goal, product attractiveness, can be done most favorable
with criteria such as quality, product uniqueness, and fit with strategy (mean score of 4.2, 3.7, and 3.75
respectively). Quality is found to be the most important incentive that represents product attractiveness
by most interviewees.
In the process goal, the criteria “staying within budget” (mean score of 4.0) and “introduced in time”
(mean score of 4.3) are important. Time to market (mean score of 3.3) is valued as less important which
can be caused by the fact that the sample consist more out of B2B companies. In B2C, companies have a
fixed window of introduction, the retailers are not going to change the set-up of the shop in the high
season, so they should be ready by then. Time windows are very fixed. In B2B there is slightly more
flexibility and it is often more important to come with a quality product than to absolutely meet the
deadline.

29
Table 6, Overview of Gate goals, criteria, and KPIs ranked by the interviewees (references are listed in appendix 2)

30
Lastly, investigating the market attractiveness market goal shows that the most important criteria
are customer acceptance, customer satisfaction, and market potential (with a mean score of 4.4, 3.6,
and 4.0 respectively).
During the semi-structured interviews some additional criteria were mentioned that the
interviewees found valuable and which they felt were missing from the table that was derived from the
literature. The additional criteria that were mentioned in the interviews are:
o Competitors comparison (Int. 1, 5, 3)
o Strategic business drivers (Int. 5, 7)
o After-sales margin (Int. 2)
o Brand, market fit (Int. 1)
o Commercial feasibility (Int. 1)
o Customer need (Int. 1, 8, 9)
o Time to cash positive (affordable loss) (Int. 1)
o Competitors time to market (Int. 1)
o Profitability index (PI) (or profit investment ratio) (Int. 2, 4, 5)
As mentioned before, these criteria were not included in the ranking process because the choice has
been made to clarify the importance of the KPIs through conducting interviews instead of creating a
complete list of KPIs. Therefor this list of KPIs will not take part in the final design but represent a
valuable source for improvements of Flightmap that Bicore can consider to implement.
Findings with regard to PPM
In the PPM-table the most importance goals that companies are striving for within portfolio
meetings have been determined, as described in the introduction, by letting the interviewees distribute
10 points among the goals that were derived from the literature study (see table 7). From the four PPM-
goals, maximize portfolio value (with a mean score of 3.375) was found to be the most important
followed by alignment, balance, and portfolio gridlock (with a mean score of 2.75, 2, and 1.875
respectively). Notable is that the variation of these scores is much larger (variation of three goals exceed
1.5) than at the Gate-Goals (variation of all goals below 1.4) which demonstrates that there is a lot more
division in this area. This can be caused by the fact that KPIs are dependent on the type of industry, the
business strategy, and the revenue model of a company. This is in line with the conclusion of Griffin et
al. (1996) who found empirical evidence that a distinction can be made between the uses of different
criteria corresponding to different business strategies. It can also be caused, as stated in the literature
study, that the era of portfolio management KPIs is less mature which could cause more division.
Nevertheless, further research should be conducted to explain the variation in these scores.

31
Table 7, Overview of PPM goals, criteria, and KPIs ranked by the interviewees (references are listed in appendix 2)
32
Looking at which KPIs are the most favorable to reach the most important goal, maximize portfolio
value, it can be gathered that the NPV, PI, and non-economic value creation (with a mean score of 3.6,
3.5, and 3.8) are the most valued in practice. One should consider the high variation which
demonstrates diversity between the scores of the respondents. In other words there is not one KPI that
all respondents prefer to use to maximize the value of the portfolio.
Achieving the second most important goal, alignment with strategy, is mostly achieved by
measuring the percentage of projects that fit the strategy, scores from scoring models, or growth targets
(with mean scores of 4.3, 3.7, and 3.5 respectively). Determining whether a project fits the strategy
seems to be a difficult task, but is conducted by two interviewees (int. 5 and 7) by defining some
business drivers that represent the strategy and rank the projects among these drivers. Business drivers
that can be used are strategy and type of industry dependent but one can think of:
Does this project reduce the CO2 footprint of our company?
Does this project improve the changes on the market that the company wants to enter?
Does this project improve the competitive advantage?
The projects can be ranked by these business drivers by using a Likert scale or numeric value which
represents the alignment with the strategy. This value can then be used to determine the strategic fit of
the portfolio, maximize the strategic value of the portfolio, or it can be visualized in a bubble diagram.
Balancing the portfolio seems to be important but it is used sparsely. Several interviewees (int. 5, 7,
and 9) noticed that they should pay more attention to balance than they currently do. Important
balancing criteria are high risk vs. low risk, across various project types (e.g., new products,
improvements, cost reductions, maintenance and fixes, and fundamental research), and pipeline
balancing (with mean scores of 3.9, 3.5, and 3.5 respectively).
To prevent portfolio gridlock, most companies like to use a utilization limit to prevent overloading
the portfolio. Nevertheless, there is less knowledge about the maximum utilization value and this value
is not dependent on the kind of projects and their characteristics in the pipeline (e.g., level of risk).
Additional criteria that were mentioned in the interviews are:
o Competitors comparison (Int. 1, 5)
o Strategic business drivers (Int. 5, 7)
o Balance in disruptiveness (Int. 1)

33
Additional conclusions derived from the interviews
As the interviews were semi-structured, as to get as much information about the project and
portfolio management process within firms as possible, and the interviewees were encouraged to talk
about their knowledge and the processes they prefer, much additional information was received that
seems very valuable to consider when conducting portfolio management and developing a tool like
Flightmap. This additional information is therefore presented here:
Scoring models are valuable (Int. 6), but it is very dangerous to use a mean of the scores.
Therefore the scores should be viewed separately and the deviation should be demonstrated
together with the mean (e.g., a red flag when the deviation is high). (Int. 1, 3)
When projects become more radical, the criteria become softer, more subjective, and more
quantitative. (Int. 1, 6)
Divide criteria and projects to Must-do, Should-do, and Could-do is a popular method
experienced as very valuable for prioritization and to reduce risk. (Int. 2, 3, 6, 7)
Compare many project (or bubbles) is undoable for humans. They can only compare 2 projects
with each other. Software can do this and can be a valuable tool. (Int. 1, 3)
Multi criteria ranking is also very valuable (Int. 6). In multi criteria ranking, the projects will not
only be ranked on NPV but a second (or more) criteria such as risk will be taken into account.
When ranking on NPV and risk, the value of the portfolio will be maximized while the risk will be
reduced. As this is undoable for people, it would be valuable to build it into a software package.
The distribution of a bubble diagram is always judged by a person and thus depends on his
opinion. A KPI that demonstrate how well the portfolio is balanced can be very valuable and
software with this KPI can detect unbalanced areas. A Gini-coefficient can for example be used
to measure statistical dispersion.
One should take into account that the process should be transparent (in particular when a
software program, a scoring model, or KPIs such as a Gini-coefficient are used). (Int. 1, 3, 8)
Garbage in - garbage out
Important to calibrate the input because of 3 errors:
1. Project managers don’t like their project to be killed so make up numbers to
make their project more attractive
2. It is hard to be consistent with subjective criteria
3. Every person judges differently
This can be solved by peer reviews or use of champions knowing all projects. (Int. 1)

34
Balance and strategy is more important by assigning buckets or creating BU’s. Within the bucket
or BU, maximize value and portfolio gridlock is more important. (Int. 2, 4)
A front-loaded pipeline is very important in order to make correct decisions and to select the
right projects for your portfolio. (Int. 4, 5)
3.3. Gap-analysis
The results of the interviews have been used to execute an analysis of the gaps between what is
currently offered by Flightmap and what is required based on the empirical analysis. The column
“Important” in table 8 denotes with the number 1 which KPIs the interviewees find the most important.
The most important KPIs are the KPIs with a mean score above the median of 3.58. This method will lead
to selecting 50% of the most important KPIs.
The KPIs within
Flightmap are evaluated
by defining the degree of
representation of the KPIs
that resulted from the
literature study within
Flightmap. This was done
by exporting a list with all
the KPIs that are currently
present in Flightmap and
compare it to the
literature study. These
results can be found in
the Column “Flightmap”.
This is done by assigning a
-, +/-, +, or ++ sign to the
KPIs which mean
respectively not present,
low presence, medium
presence, and high Table 8, Gap analysis of gate KPIs
35
presence in Flightmap. High presence has been used when the KPI directly present in Flightmap.
Medium presence has been used when a KPI can be measured similarly in Flightmap, such as introduced
in time which can be measured in Flightmap with EarnedValueSPItime or EarnedValueSPIcost. The KPIs
that are marked as low presence are KPIs that are not in Flightmap but can be derived from another KPI
or graph. This can been used, for instance, for the KPI “break even time” which is not present in
Flightmap but can be deducted from the cumulative cashflow graph. These KPIs are in some extent
present in Flightmap but not in a desirable manner. The not present group denotes the KPIs that are not
present in Flightmap and cannot be easily deducted from other KPIs or graphs.
As can be seen in this table, Flightmap represents most of the KPIs pretty well, but focuses more on
financial criteria than on the other criteria. Although the focus lies more on financial criteria, Flightmap
contain KPIs that can be used to achieve all four defined gate goals.
The most important KPIs that resulted from the interviews, denoted with a 1 in the column
“Important”, were compared to the KPIs that were not or low present in Flightmap, denoted with a - or
+/- in the column “Flightmap”. The results indicating the gap of important KPI that are not in Flightmap
can be found in the column “focus”, where the number 1 denotes that the KPI should be preferably
included into Flightmap.
This comparison shows that Flightmap can improve on the following eight valuable Gate-criteria:
Customer acceptance
Customer satisfaction
Market share
Market potential
Rating of product performance
Quality
Product uniqueness
Fit with strategy
These eight improvements also confirm the statement that Flightmap in particular represents
financial criteria, and should focus more on other criteria.
The same has been done for the PPM KPIs. In table 9, the column “important” again denotes the
most important KPIs with the number 1. Here the most important KPIs are those with a mean score
higher than the median of 3.33. The representation of the KPIs in Flightmap has also been assessed and
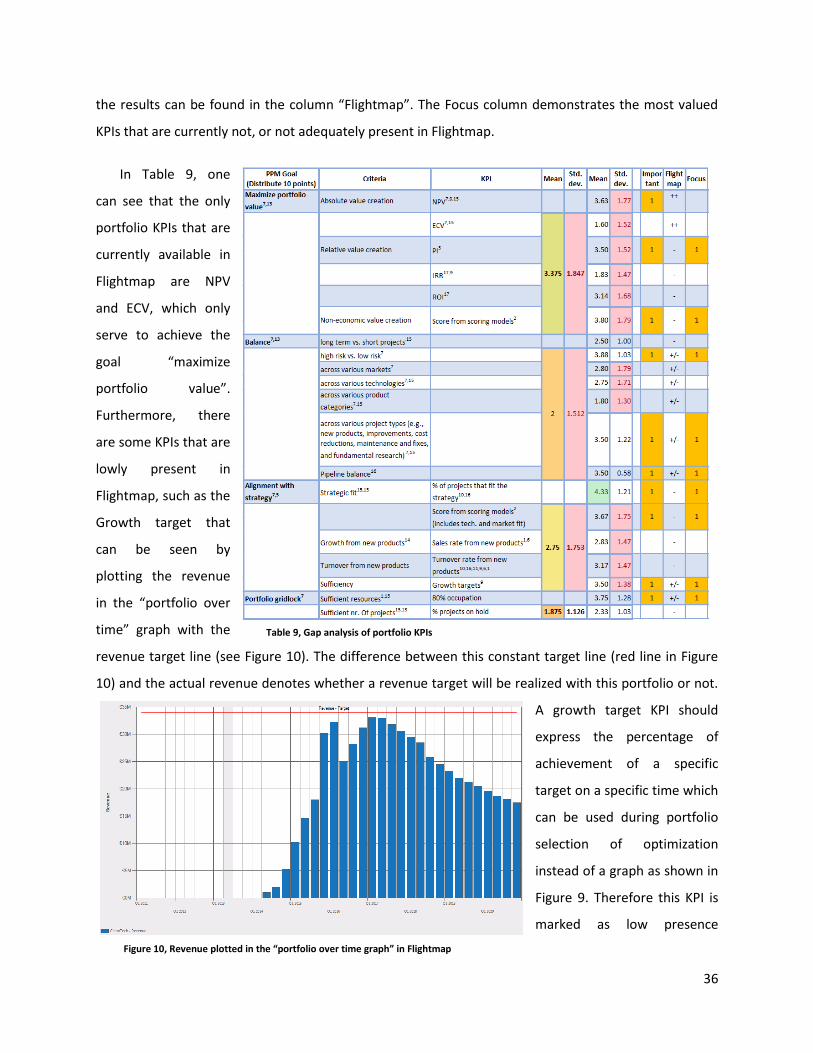
36
the results can be found in the column “Flightmap”. The Focus column demonstrates the most valued
KPIs that are currently not, or not adequately present in Flightmap.
In Table 9, one
can see that the only
portfolio KPIs that are
currently available in
Flightmap are NPV
and ECV, which only
serve to achieve the
goal “maximize
portfolio value”.
Furthermore, there
are some KPIs that are
lowly present in
Flightmap, such as the
Growth target that
can be seen by
plotting the revenue
in the “portfolio over
time” graph with the
revenue target line (see Figure 10). The difference between this constant target line (red line in Figure
10) and the actual revenue denotes whether a revenue target will be realized with this portfolio or not.
A growth target KPI should
express the percentage of
achievement of a specific
target on a specific time which
can be used during portfolio
selection of optimization
instead of a graph as shown in
Figure 9. Therefore this KPI is
marked as low presence
Table 9, Gap analysis of portfolio KPIs
Figure 10, Revenue plotted in the “portfolio over time graph” in Flightmap
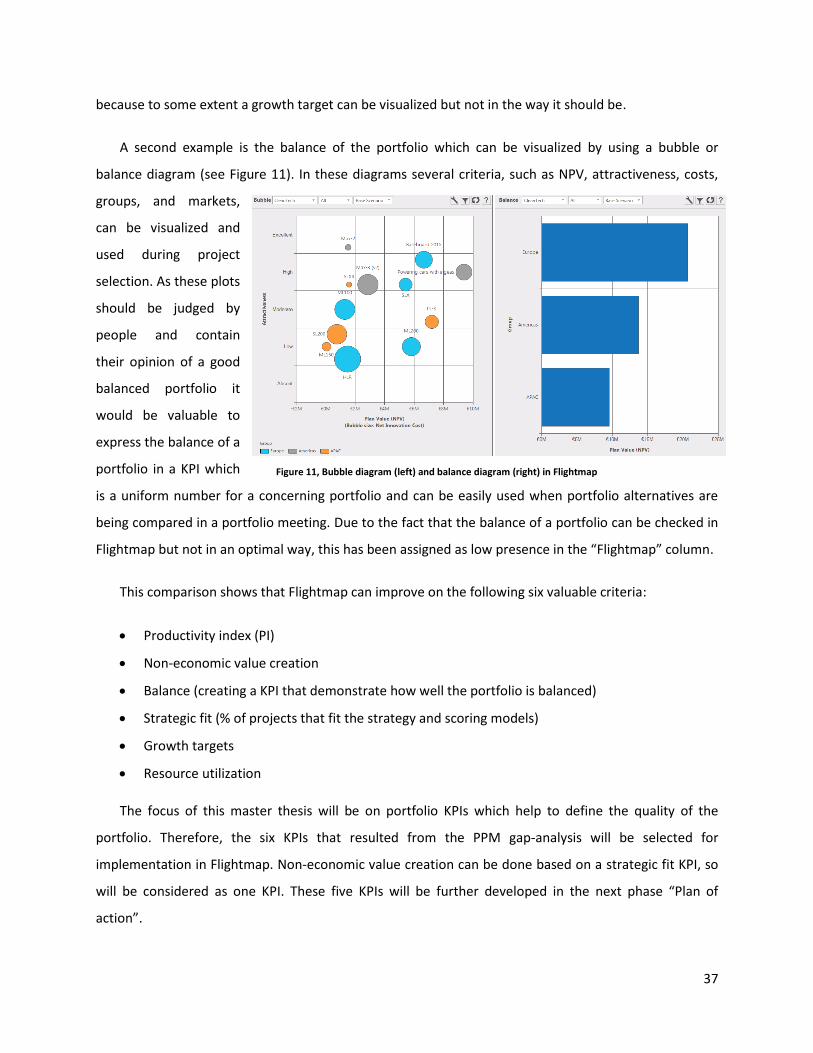
37
because to some extent a growth target can be visualized but not in the way it should be.
A second example is the balance of the portfolio which can be visualized by using a bubble or
balance diagram (see Figure 11). In these diagrams several criteria, such as NPV, attractiveness, costs,
groups, and markets,
can be visualized and
used during project
selection. As these plots
should be judged by
people and contain
their opinion of a good
balanced portfolio it
would be valuable to
express the balance of a
portfolio in a KPI which
is a uniform number for a concerning portfolio and can be easily used when portfolio alternatives are
being compared in a portfolio meeting. Due to the fact that the balance of a portfolio can be checked in
Flightmap but not in an optimal way, this has been assigned as low presence in the “Flightmap” column.
This comparison shows that Flightmap can improve on the following six valuable criteria:
Productivity index (PI)
Non-economic value creation
Balance (creating a KPI that demonstrate how well the portfolio is balanced)
Strategic fit (% of projects that fit the strategy and scoring models)
Growth targets
Resource utilization
The focus of this master thesis will be on portfolio KPIs which help to define the quality of the
portfolio. Therefore, the six KPIs that resulted from the PPM gap-analysis will be selected for
implementation in Flightmap. Non-economic value creation can be done based on a strategic fit KPI, so
will be considered as one KPI. These five KPIs will be further developed in the next phase “Plan of
action”.
Figure 11, Bubble diagram (left) and balance diagram (right) in Flightmap

38
3.4. Conclusion
It can be concluded that valuable information has been gathered during the interviews. Scoring the
KPIs resulted in a quantitative insight in the priorities of the KPIs. The semi-structured approach fostered
a great insight in the area of project and portfolio management.
A remarkable observation that resulted from the semi-structured interviews was that the goals that
were attempted to be achieved with portfolio management differ between levels in the organizational
structure and are furthermore dependent on the business strategy. Within one organization, two
interviews were held. The first interview was on executive level, the second on department level. The
first interviewee was very market and strategically oriented, while the second one was more relying on
financial criteria because the budget and the strategy were already defined. Furthermore, one
organization, which was market leader in its market, relied much more on strategic criteria and the
roadmaps of their customers to sustain their position.
The gap- analysis that was performed demonstrates that the KPIs that were found to be important
but are not currently present in Flightmap. As the main objective of this project is to improve the set of
KPIs that can be used to improve the quality of the portfolio, the design will focus on the KPIs that
resulted from the portfolio gap analysis, namely:
1. Resource utilization
2. Balance KPI
3. Non-economic value creation
4. Productivity index (PI)
5. Growth targets
The detailed design of these KPIs can be found in the following chapter.

39
4. Design
In this chapter, the design of the five KPIs that resulted from the gap-analysis will be discussed. The
five selected KPIs—Resource Utilization, KPIs for Balance, Non-economic value creation, Productivity
Index, and Growth Target—will be defined in detail in the following sub-chapters, where possible by
mathematical formulae that can be used to implement them into Flightmap.
1. Resource utilization
The correct resource utilization (e.g., man-hours, money) in a certain portfolio is important for
several reasons. Underutilized resources seem to be a waste, but high capacity utilization will cause
queues and high costs leading to solvency issues when the value of death becomes too large
(Reinertsen, 2009). Therefore it is important to visualize the degree of resource utilization within the
portfolio. In other words, it would be valuable to express the risk that the required resources could
exceed the available resources. This risk could be labeled as the portfolio solvency.
The portfolio solvency can be visualized when the uncertainty in resource demand in each project
has been defined. This uncertainty can be calculated from a resource profile that should become an
input field in Flightmap. This can be done in two ways:
1. For all resources that will be entered into Flightmap, a worst and a best case scenario can be
given.
2. The Flightmap user can insert the level of planning uncertainty by selecting the level of
uncertainty (e.g., high, medium, low).
When the uncertainty of the resources per project is known, a Monte Carlo analysis can be used to
calculate the total resources needed to execute the portfolio based on the best and worst case resource
profiles of the projects. The probability distribution that results from the analysis can be used to
calculate the risk that the required resources could exceed the available resources.
The risk of exceeding the resource target can be used during the process of portfolio selection.
When multiple portfolio scenarios will be discussed in a portfolio meeting, the portfolio solvency can be
taken into account to reduce the risk of exceeding the resource target and preventing portfolio gridlock.

40
2. KPI for balance
To design a KPI that expresses the balance of the portfolio concerning some criteria in a bubble
diagram, first thoughts were to use a Gini-coefficient to demonstrate the distribution of the bubbles.
The Gini-coefficient was designed to measure income inequality in a society (Gini, 1909). In the design
phase, this measure seems not applicable to use because an optimal distribution is not the goal of the
balance in a bubble diagram. In other words, a bubble diagram that visualizes risk and return with an
optimal distribution is unattractive because it includes projects with a high risk and low return.
In finance, the balance between risk and
reward of a portfolio is often optimized using
the efficient frontier diagram (see Figure 12).
With this graph, a trade-off can be made
between risk and reward and a portfolio can
be chosen that fits the risk profile of the user.
This method is helpful to make this trade-off
but is not the KPI that demonstrate the
balance of the portfolio among different
criteria.
As no balancing KPIs have been found, a KPI has been developed that compares the actual balance
in the portfolio with the desired balance. This KPI can be applied on a variety of portfolio characteristics
but after a discussion with the CTO of Bicore it has been decided to firstly implement them on the
following three characteristics as they are found to be the most valuable:
Cost, and Count by stage (e.g., Ideation, Feasibility, Development, Introduction)
Value, Cost, and Count by risk profile (e.g., low, medium, high)
Value, Cost, and Count by market (e.g., Europe, US, APAC)
The intention of this balance KPI is not to define the best balance of a portfolio as this differ for
every company and change over time. As the desired balance is mostly defined by the top management,
this balance KPI is designed to demonstrate how well the actual balance of the portfolio fit the desired
balance which is useful in comparing different portfolio compositions and in choosing the best portfolio.
Figure 12, Efficient frontier (investorpedia.com, 17-04-2013)

41
Figure 13 visualizes
the projects in a funnel
which gives an overview
of the number of
projects in each phase,
in each market, and the
risk that is involved
determined by a risk
input field per project.
The problem that occurs
is defining whether
these projects are
balanced properly. Therefore the balance KPI has been developed to improve the insights of the balance
among different portfolio balance criteria.
During development of a balance KPI the link has been made to linear regression, the goal of which
is to minimize the sum of square residuals. This is often done by minimizing the sum of squares of the
differences between the variables and a model (regression line). Gathering more information about the
sum of square method led to the Root-mean-square deviation method that is often used to measure the
difference between predicted values and actual values. This perfectly fits the goal of this KPI: to measure
the difference between the actual and desired balance. Calculating this balance KPI can thus be done by
calculating the Root Mean Square deviation with the standard RMSD formula:
√∑
The delta that has been used to calculate the RMSD is the difference between the percentage of
actual distribution and the percentage of desired distribution. Because the delta will always be a
number between -100% and +100%, the calculated RMSD will result in a number between 0% and 100%,
where 100% will display the largest deviation. Transforming this into a KPI that demonstrates the
amount of fit in percentage, where 100% will display the best fit, will be done in the following way:
Figure 13, Funnel in Flightmap

42
After testing this formula with different scenarios it appears that the generated KPI did not entirely
fit the expectations. For example, when the total amount of projects should be equally distributed
among 2 phases (N=2), and the actual distribution seems to be 100% of the project in 1 phase, the KPI
was calculated as follows:
√
√
√
This result in a balance KPI of (100 - 50 =) 50%.
This seems illogical as the differences between the
actual and desired values are maximal and thus
should result in a KPI of 0%. This led to an
adjustment of the formula which takes the maximal
deviation that can appear with a particular set of
desired distribution (DD) into account. The
maximum deviation that can appear is when 100%
of the projects are in the phase were the least
projects were desired ( ), see Figure 14.
Calculating the maximal desired distribution has been done in the following way:
√
∑
√
∑
The balance KPI reflected to the maximal desired distribution will then be calculated as follows:
0%
20%
40%
60%
80%
100%
1 2
Phases
DesiredDistribution
ActualDistrubution
Figure 14, Actual and desired distribution of projects
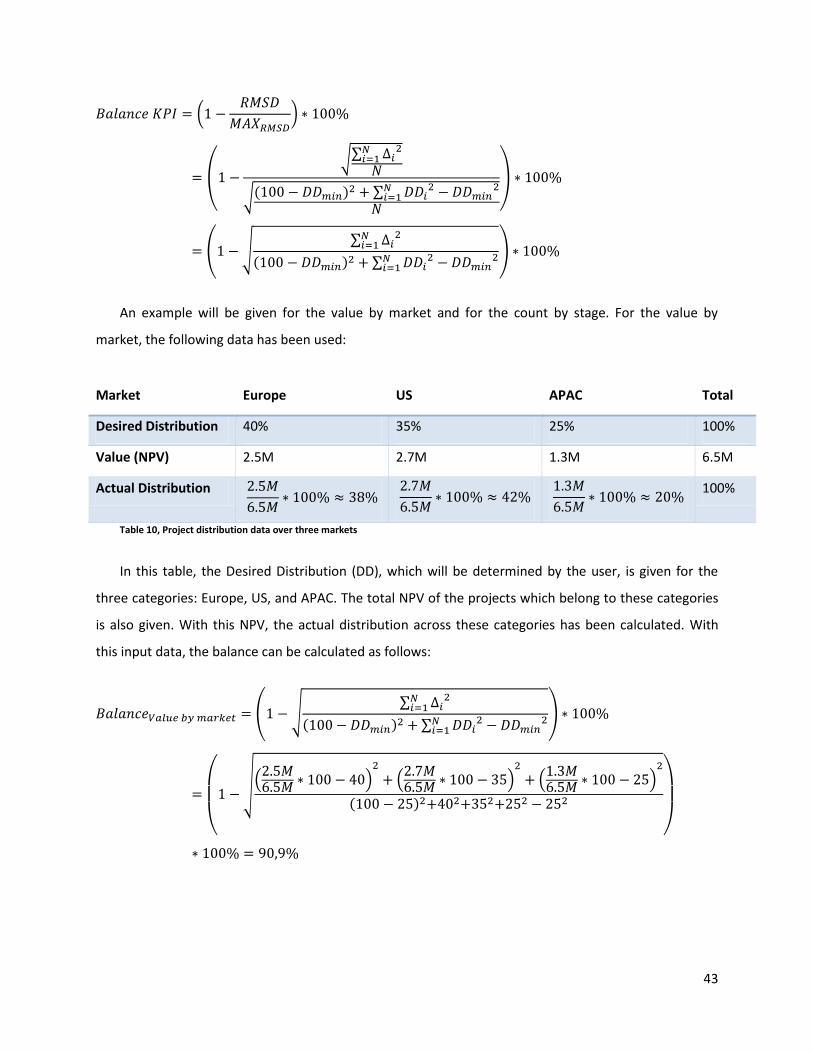
43
(
)
(
√∑
√ ∑
)
( √∑
∑
)
An example will be given for the value by market and for the count by stage. For the value by
market, the following data has been used:
Market Europe US APAC Total
Desired Distribution 40% 35% 25% 100%
Value (NPV) 2.5M 2.7M 1.3M 6.5M
Actual Distribution
100%
Table 10, Project distribution data over three markets
In this table, the Desired Distribution (DD), which will be determined by the user, is given for the
three categories: Europe, US, and APAC. The total NPV of the projects which belong to these categories
is also given. With this NPV, the actual distribution across these categories has been calculated. With
this input data, the balance can be calculated as follows:
( √∑
∑
)
(
√(
)
(
)
(
)
)

44
For the second example, count by stage, the following data has been used:
Stage Ideation Feasibility Development Introduction Total
Desired Distribution 40% 30% 20% 10% 100%
Count 18 14 12 4 48
Actual Distribution
100%
Table 11, Project distribution data over four phases
This table shows the desired distribution across four stages: Ideation, Feasibility, Development, and
Introduction. The number of the projects in each stage is given as well, by which the actual distribution
has been calculated. With this data, the balance has been calculated as follows:
( √∑
∑
)
(
√((
)
( )
( )
( )
)
)
3. Non-economic value creation
Defining the non-economic value of a product is often done with a scoring model often focusing on
business strategy. A score that demonstrates how well the project fits with the business strategy can be
useful for several purposes. It can be used as leading indicator to rank projects on a different scale than
the financial criteria that are often used to maximize the portfolio on strategic value, and it can be used
as lagging indicator to examine whether it is able to reach the overall business goals with the current
portfolio.
Determining whether a project fits the strategy seems to be a difficult task, but is conducted by
some interviewees by defining some business drivers that represent the strategy and rank the projects
among these drivers. Business drivers that can be used are strategy and type of industry dependent but
one can think of:

45
Does this project help reducing the CO2 footprint of our company?
Does this project improve the changes on the market that the company wants to enter?
Does this project improve the competitive advantage?
The projects can be ranked on these business drivers by using a Likert scale or numeric value which
represents how well the project fits the strategy. This value can then be used to determine the strategic
fit of the portfolio, maximize the strategic value of the portfolio, or it can be visualized in a bubble
diagram.
Implementing this into Flightmap has to be done by encouraging Bicore’s customers to define some
business drivers. A portfolio manager should therefore be obligated to fill in at least two drivers that link
the portfolio to the business strategy. There should be at least two because then the non-economic
values can be visualized in a 2-D graph. Each project in the portfolio should then be scored against these
drivers by the project manager. With this data the strategic fit of a portfolio can be visualized in a bubble
diagram and non-economic values can be used in a project selection phase.
4. Productivity index (PI)
The productivity index is a KPI which is designed to maximize the productivity of the portfolio. This
criterion is calculated by taking the NPV, or the KPI that needs to be maximized, and dividing it by the
constraining resource, for example the man-hours or the development costs. All the projects can then
be ranked on this index until you run out of resources or investments. This method yields a higher
overall value for the portfolio and prevents pipeline gridlock (Cooper et al., 2005).
The productivity index for the NPV will be calculated as followed:
These formulas can easily be implemented into Flightmap and can be used to rank projects in the
project selection phase.

46
5. Growth target
Measuring the business growth can be done in several ways. This design will focus on two growth
targets: profit and revenue. Both of these KPIs are not present in Flightmap and can be calculated from
data that is already available.
The revenue forecast and profit forecast of the project in a portfolio are available and can be
compared with a target. A revenue target is already offered in Flightmap, a profit target can be included.
The growth target can then be calculated in the following way:
Both of these indicators express the percentage of the target that will be achieved with the current
portfolio. The time in the formulae represents the time wherefore the target is defined by the customer.
Conclusions on the design
The objective of this chapter was to design the five KPIs that resulted from the gap-analysis. The five
selected KPIs—Resource Utilization, KPIs for Balance, Non-economic value creation, Productivity Index,
and Growth Target—should provide the customers of Bicore insights in the quality of their portfolio and
help them with creating an optimal portfolio. The KPIs have been defined in more detail and have been
formulated mathematically where possible. The implementation of these five designed KPIs into
Flightmap will be discussed in the following chapter.

47
5. Implementation and evaluation
This chapter describes the implementation and evaluation of the five KPIs that resulted from the gap
analysis that was performed in chapter three and were designed in the previous chapter.
5.1. Introduction
The development department of Bicore was tasked with implementing the KPIs. Implementing all
KPIs did not fit the development planning, so the project leader, who is responsible for the planning of
the development of Flightmap, made a selection of KPIs that would be implemented during this project
and of KPIs that will be implemented in a later stage.
The KPIs that were developed for non-economic value creation and the growth target have not been
chosen for implementation during this master project and will be implemented in a later stage.
The KPI that was developed to express the risk of exceeding the resource target, labeled as the
portfolio solvency, has been evaluated by de development department. The uncertainty in the resource
profiles per project was already known in Flightmap and was used for a sensitivity analysis. Therefore no
changes to the input fields need to be made, and the available input data could be used as input for a
Monte Carlo analysis. The actual implementation of a Monte Carlo analysis appears to be too much
work to fit in the development planning of the upcoming weeks, and thus will be implemented in a later
stage.
The KPI for balance and the Productivity index have been implemented in Flightmap and will be
discussed in the following subchapter in more detail. After the implementation, these two KPIs have
been evaluated by creating a test case to test whether the KPIs deliver the required insights to manage
the portfolio. This evaluation phase will be described in more detail in subchapter 5.3.
5.2. Implementation
This subchapter describes the discussions that were conducted with the development department
during the implementation of the two selected KPIs.
KPI for balance
As Flightmap is developed to maintain multiple portfolios which are commonly used with multiple
divisions within a firm, the project leader suggested that it would be useful to calculate the balance KPI

48
within the portfolio and across all portfolios. This would be useful because the balance over several
divisions may be different from the balance of the separate divisions. To calculate the balance KPI across
all portfolios, it would be necessary to create an input page for the desired balance across all portfolios.
This can be extended with a desired balance proposal that is based on the resource distribution per
division or bucket. This input page is planned to be developed for the upcoming version of Flightmap
which means that an input field for the desired balance across all portfolios will not be realized during
this project. For now, the mean of the desired values of the separate portfolios will be used as desired
value to calculate the balance across all portfolios.
Flightmap supports a function to enable or disable projects in a portfolio to create different portfolio
compositions. With this function, the end user can compare different alternate portfolios. The balance
KPI will be shown at each alternate to support the decision of choosing a portfolio.
During the intervention phase, the software engineer suggested that it would be valuable to
visualize the desired values in the balance graph. This would be useful to trace back the cause of an
imbalance. This can be done by adding a column with the desired balance value next to the column that
represents the actual value in a column graph, as could be seen in Figure 14 (Page 42). This additional
feature will be implemented, due to time constrains, in a later stage.
Productivity index (PI)
The Productivity index has been implemented into Flightmap for the resources and for the
development costs. For the productivity index calculated by resources, the Full Time Employees (FTE)
number has been used instead of the persons by days:
For the productivity index calculated by development costs, the “Net innovation costs” have been
used:
The “Net Innovation Costs” consist of all project costs minus the income that has been received during
the development phase such as external funding and pre-sales.

49
5.3. Evaluation
In this subchapter, the two implemented KPIs will be evaluated: the balance KPI (cost across groups)
and the Productivity index. These KPIs will be evaluated both during a test case to indicate whether the
implemented KPIs deliver the required insights to manage the portfolio.
For the evaluation, a test portfolio with
11 projects was created based on random
data. Figure 15 shows the funnel wherein all
the projects are projected. This Funnel shows
the stage in which the projects are on the X-
axis and the risk that is involved on the Y-
axis. Furthermore, the size of the projects
are representing the “Net Innovation Costs”
of each project and the color shows to what
group the project belongs. Projects can be
grouped for instance by market, region,
industry etc.
One of the applications of Flightmap is creating a valuable portfolio within a specific budget. To test
the Productivity index, we assume first in this case that a budget of 17 million euro is available. The total
cost of all the projects is 21,3 million euro. Ranking the projects on economic value is frequently done on
NPV, so in this case the NPV will be compared with the Productivity index. The figure below shows the
project list, on the left sorted by the NPV and on the right sorted by Productivity index.
Figure 15, Visualization of the funnel in Flightmap
Figure 16, Project list in Flightmap ranked on NPV (left), and on Cost Productivity Index (right)
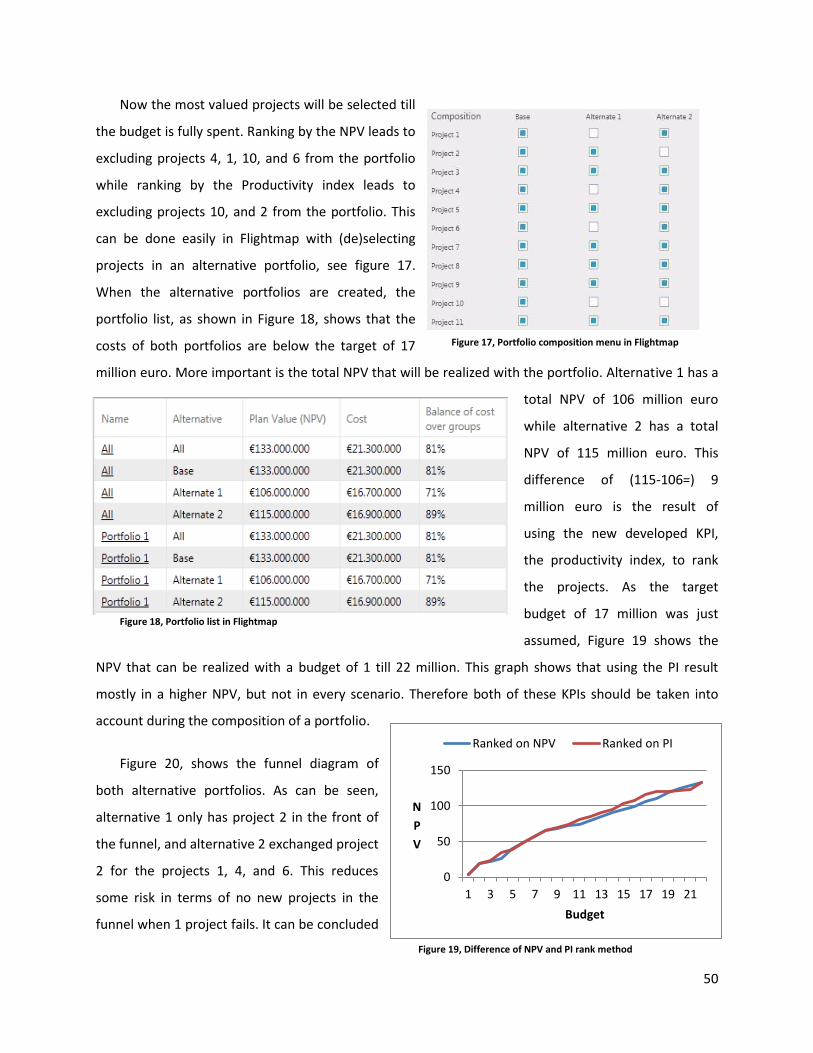
50
Now the most valued projects will be selected till
the budget is fully spent. Ranking by the NPV leads to
excluding projects 4, 1, 10, and 6 from the portfolio
while ranking by the Productivity index leads to
excluding projects 10, and 2 from the portfolio. This
can be done easily in Flightmap with (de)selecting
projects in an alternative portfolio, see figure 17.
When the alternative portfolios are created, the
portfolio list, as shown in Figure 18, shows that the
costs of both portfolios are below the target of 17
million euro. More important is the total NPV that will be realized with the portfolio. Alternative 1 has a
total NPV of 106 million euro
while alternative 2 has a total
NPV of 115 million euro. This
difference of (115-106=) 9
million euro is the result of
using the new developed KPI,
the productivity index, to rank
the projects. As the target
budget of 17 million was just
assumed, Figure 19 shows the
NPV that can be realized with a budget of 1 till 22 million. This graph shows that using the PI result
mostly in a higher NPV, but not in every scenario. Therefore both of these KPIs should be taken into
account during the composition of a portfolio.
Figure 20, shows the funnel diagram of
both alternative portfolios. As can be seen,
alternative 1 only has project 2 in the front of
the funnel, and alternative 2 exchanged project
2 for the projects 1, 4, and 6. This reduces
some risk in terms of no new projects in the
funnel when 1 project fails. It can be concluded
Figure 18, Portfolio list in Flightmap
0
50
100
150
1 3 5 7 9 11 13 15 17 19 21
N
P
V
Budget
Ranked on NPV Ranked on PI
Figure 19, Difference of NPV and PI rank method
Figure 17, Portfolio composition menu in Flightmap

51
that the risk of developing no new projects is better balanced in alternative 1. This risk analysis can be
easily done by comparing the balance of the projects in 2 funnels, but not all balancing can be checked
easily by visualization. In this case, the projects were divided in three different groups.
An input field has been created to fill in the desired group distribution target into Flightmap, see
Figure 21. These groups can be
used to indicate for instance
different markets or areas.
In this case the actual costs across different groups will be compared with the desired distribution,
but different balance targets can be configured. In the funnels in Figure 20, one could not tell to what
degree the portfolio is balanced as desired, for example if the costs correspond with the defined
buckets. The “Balance of cost over groups” column in Figure 18, gives the degree of balance of the
different alternate portfolios. Now one can see that including all projects will have 81% fit, that
alternative 1 has 71% fit, and that alternative 2 has 89% fit with the distribution target. In this case the
alternative with the highest NPV (with a budget of 17 million) has a good fit with the desired
distribution, so this strengthens the choice for this alternative. This KPI is useful in comparing portfolios
and offers the opportunity to involve the balance of the portfolio in the decision making process.
Figure 20, Funnel diagram of the 2 alternative portfolios in Flightmap
Figure 21, Desired distribution input field in Flightmap

52
5.4. Conclusion on implementation and evaluation
This chapter describes the implementation process of the KPIs that resulted from the gap analysis.
As implementing all KPIs did not fit into the development planning, two KPIs has been chosen for
implementation during this project: KPI for balance and Productivity index.
After the implementation of these two KPIs, they have been evaluated by a test case. It can be
concluded that, in this case, the PI was valuable and supported in creating a portfolio with a higher NPV.
Nevertheless, Figure 19 demonstrated that, at some budget constraint, ranking on the NPV results in a
higher portfolio value. Therefore, both of these KPIs should be taken into account during composition of
the portfolio.
In this case, the balance KPI gives a clear impression of the fit with the desired distribution.
Configuring some distribution targets can give, because of this balance KPI, valuable insights in different
portfolios which can be evaluated in a portfolio meeting.
The results of the test case were evaluated with the project manager and the CTO of Bicore to
validate whether these results fit their expectations. They were satisfied with the results, and will
implement these 2 KPIs in the upcoming update. After this update, the customers of Bicore can evaluate
the KPI when executing their PPM process.
53
6. Conclusions
This chapter contains the conclusions of the master thesis consisting of the empirical and theoretical
implications, limitations, and suggestions for further research.
6.1. Empirical contribution
The objective of this master thesis was to define and implement key performance indicators that
help to evaluate the quality of the portfolio. In other words, the objective was to answer Bicore’s main
question:
Which portfolio KPIs should we add to Flightmap to provide our customers insights in the quality of
their portfolio and help them with creating an optimal portfolio?
This was done first by conducting a literature study resulting in two tables that enumerate the goals,
criteria, and KPIs that are often used for gate and portfolio decisions. Secondly, interviews were held to
get a better understanding of what key performance indicators are required to be added to Flightmap to
perform proper portfolio management.
The interviews have led to both a qualitative insight in how portfolio management is applied as well
as a quantitative insight in the priories for implementation in Flightmap. This quantitative insight was
created by letting the interviewees rank the KPIs from the two tables that resulted from the literature
study. These interviews resulted in a list of most important criteria / KPIs and some additional expert
information that could be considered for implementation into Flightmap.
The results of the discussions were used to do an analysis of the gaps between what is currently
offered by Flightmap and what is what is required based on the empirical analysis. The KPIs within
Flightmap were assessed by evaluating to what extent the KPIs from the literature study were already
implemented in Flightmap. After, the high priority KPIs that resulting from the interviews were
compared to the KPIs that were not or hardly present in Flightmap.
Based on this gap-analysis the following five KPIs were selected for implementation in Flightmap:
Resource utilization
KPI for balance
Non-economic value creation
Productivity index
Growth target
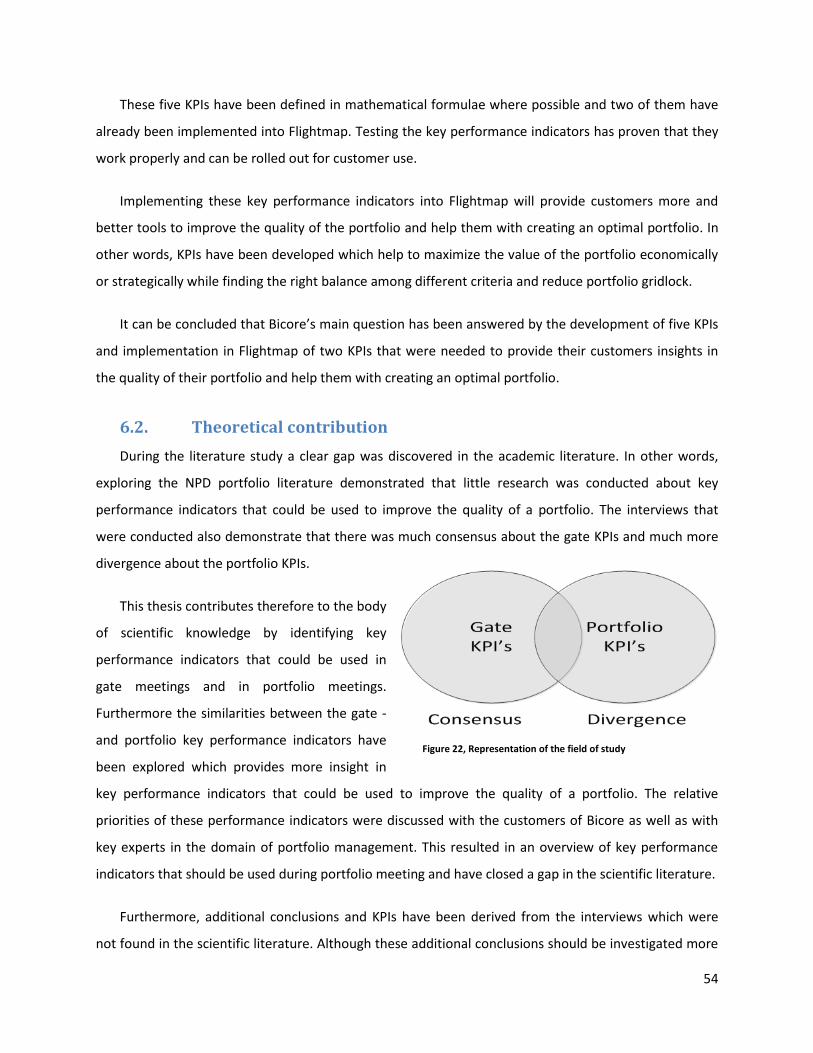
54
These five KPIs have been defined in mathematical formulae where possible and two of them have
already been implemented into Flightmap. Testing the key performance indicators has proven that they
work properly and can be rolled out for customer use.
Implementing these key performance indicators into Flightmap will provide customers more and
better tools to improve the quality of the portfolio and help them with creating an optimal portfolio. In
other words, KPIs have been developed which help to maximize the value of the portfolio economically
or strategically while finding the right balance among different criteria and reduce portfolio gridlock.
It can be concluded that Bicore’s main question has been answered by the development of five KPIs
and implementation in Flightmap of two KPIs that were needed to provide their customers insights in
the quality of their portfolio and help them with creating an optimal portfolio.
6.2. Theoretical contribution
During the literature study a clear gap was discovered in the academic literature. In other words,
exploring the NPD portfolio literature demonstrated that little research was conducted about key
performance indicators that could be used to improve the quality of a portfolio. The interviews that
were conducted also demonstrate that there was much consensus about the gate KPIs and much more
divergence about the portfolio KPIs.
This thesis contributes therefore to the body
of scientific knowledge by identifying key
performance indicators that could be used in
gate meetings and in portfolio meetings.
Furthermore the similarities between the gate -
and portfolio key performance indicators have
been explored which provides more insight in
key performance indicators that could be used to improve the quality of a portfolio. The relative
priorities of these performance indicators were discussed with the customers of Bicore as well as with
key experts in the domain of portfolio management. This resulted in an overview of key performance
indicators that should be used during portfolio meeting and have closed a gap in the scientific literature.
Furthermore, additional conclusions and KPIs have been derived from the interviews which were
not found in the scientific literature. Although these additional conclusions should be investigated more
Figure 22, Representation of the field of study

55
extensively in further research, it can be argued with caution that there may be a gap in the scientific
literature.
Finally, aside from identifying these key performance indicators, mathematical formulae have been
developed which makes it possible to implement and use the key performance indicators. The approach
to calculate the risk of a portfolio concerning its resources and the balance among different categories
are new to the world and contribute to the body of scientific knowledge.
6.3. Limitations and further research
There are a number of limitations that should be acknowledged. The first limitation is that the
number of interviews was limited. Although the nine interviews have generated much valuable data
which have been analyzed, it does not guarantee that the results are generalizable for the total portfolio
management business, both on the provider’s and customer’s side.
A second limitation was the exclusion of the validation by the customers. The design has been
implemented and tested, but the limited time that was available to execute this master thesis was too
short to involve the customers into the test phase and receive their feedback on the design.
The last limitation is related to the concerns of some experts about the transparence that could
become at risk by implementing key performance indicators that are not fully understood by the users.
This has not been tested and remains open for further research.
The semi-structured interviews showed that the goals that were attempted to be achieved with
portfolio management and the preferred KPIs that were used differ between the levels in the
organizational structure and between different business models. This has only been observed and has
not been investigated in more detail and therefore will also be open for further research.
The additional information that resulted from the interviews, such as multi criteria ranking or
transparency in software tools, together with the KPIs that resulted from the literature study and the
interviews that were not implemented, can be used to explore more improvements for Flightmap. This
can also be input for further research to explore to what extent this will improve Flightmap.
Discussing the suggestions for further research with the CTO of Bicore has led to a new master
project concerning the transparency in software tools. This project will be executed in September 2013
by a master student of the study Innovation Management at the Eindhoven University of Technology.
56
References
Archer, N., Ghasemzadeh, F., 1999. An integrated framework for project portfolio selection,
International Journal of Project Management Vol. 17, No. 4, pp. 207-216
Barczak, G., Griffin, A., Kahn, K.B., 2009. Perspective: trends and drivers of success in NPD practices:
results of the 2003 PDMA best practices study, Journal of Product Innovation Management, vol. 26, pp.
3–23
Chao, R., Kavadias, S., 2004. A theoretical framework for managing the new product development
portfolio: when and how to use strategic buckets, Management Science, vol. 54, pp. 907-921
Cooper, R.G., 2008. Perspective: the Stage Gate® idea-to-launch process- update, what’s new, and
nexgen systems, Product Innovation Management, vol. 24, pp. 213-132
Cooper, R.G., Edgett, S.J., 2001. Portfolio management for new products: picking the winners, Product
Development institute, http://www.stage-gate.net/downloads/working_papers/wp_11.pdf
Cooper, R.G., Edgett, S.J., 2005. Lean, Rapid and Profitable New Product Development, Product
development Institute
Cooper, R.G., Edgett, S.J., 2006. 10 ways to make better portfolio and project selection decisions, Stage
Gate® International, http://www.stage-gate.net/downloads/working_papers/wp_24.pdf
Cooper R.G., Edgett S.J., 2012. Best Practices in the Idea-to-Launch Process and Its Governance,
Research-technology management, Vol. 55, No. 2, pp. 43-54
Cooper R.G., Edgett, S.J., Kleinschmidt, E.J., 1998. Best practices for managing R&D portfolios, Research
and Technology Management, Vol. 41, No. 4, pp. 20-33
Cooper, R.G., Edgett, S.J., Kleinschmidt, E.J., 1999. New product portfolio management: practices and
performance, Journal of Product innovation Management, vol. 16, pp. 333-351
Cooper, R.G., Edgett, S.J., Kleinschmidt, E.J., 2001. Portfolio management for new product development:
results of an industry practices study, R&D Management, vol. 31, pp. 361- 380
Cooper, R.G., Edgett, S.J., Kleinschmidt, E.J., 2002. Optimizing the stage-gate process: What best –
practice companies do- II, Research Technology Management, vol. 2, pp 43-49
Cooper, R.G., Kleinschmidt, E.J., 1995. Benchmarking the firm’s critical success factors in new product
development, Journal of Product innovation Management, vol. 12, pp. 374-351
Faulkner, T.W., 1996. Applying “option thinking” to R&D valuation, Research Technology Management,
vol. 39, pp. 50-56
Gini, C.,1909. Concentration and dependency ratios (in Italian). English translation in Rivista di Politica
Economica 87(1997), 769–789 (1909)
Griffin, A., Page, A.L., 1996. PDMA Success measurement Project: Recommended Measures for Product
Development Success and Failure, Journal of Product Innovation Management, Vol. 13, pp. 478-496
57
Hart, S., Hultink, E. J., Tzokas, N. and Commandeur, R., 2003. Industrial Companies’ Evaluation Criteria in
New Product Development Gates, the Journal of Product Innovation Management, 20: 22-36
Henard, D.H., Szymanski, D.M., 2001. Why some new products are more successful than others, Journal
of Marketing Research, vol.38, pp. 362-275
Joshi, M.P., Kathuria, R., Porth, S.J., 2003. Alignment of strategic priorities and performance: an
integration of operation and strategic management perspectives, Journal of Operations Management,
vol. 21, pp. 353-369
Kavadias, S., Chao, R., 2007. Resource allocation and new product development portfolio management,
Handbook of New Product Development Research, Oxford: Elsevier/Butterworth
Kester, L., Hultink, E.J., Lauche, K., 2009. Portfolio decision-making genres: a case study, Journal of
Engineering and Technology Management, vol. 26, pp. 327-341
Killen C.P., Hunt R.A., Kleinschmidt E.J., 2008. Project portfolio management for product innovation,
International Journal of Quality & Reliability Management, Vol. 25 Iss: 1 pp. 24-38
Krishnan, V., Ulrich, K.T., 2001. Product development decisions: a review of the literature, Management
Science, Vol. 47, No. 1, 1-21
Lombard, A.A., 2003. EIRMA Working group 59 seminar on project portfolio management, Victoria hotel
Amsterdam
Matheson, D., 2012. Coca-cola’s three portfolio criteria,
http://smartorg.com/2012/06/5685/?goback=%2Egde_3020699_member_128199126
McGrath, M.E., 2004. Next generation product development, New York: McGraw-Hill
Menke, M.M., 2012. Project portfolio management best practices; summary of results, DAAG 2012
Montoya-Weiss, M.M., Calantone, R., 1994. Determinants of new product performance: a review and
meta-analysis, Journal of Product Innovation Management, vol. 11, pp. 397-417
Phaal R., Farrukh C., Mitchell R., Probert D., 2003. Technology roadmapping: Starting-up roadmapping
fast, Research Technology Management, vol. 46, pp.52
Reinertsen, D.G., 2009. The principles of product development flow, Celeritas publishing, California
Tzokas N., Hultink E.J., Hart S., 2004. Navigating the new product development process, industrial
marketing management, vol. 33, pp. 619-626
Van Aken J.E., Berends J.J., van der Bij J.D., 2007, Problem solving in organization, Cambridge University
Press, Cambridge
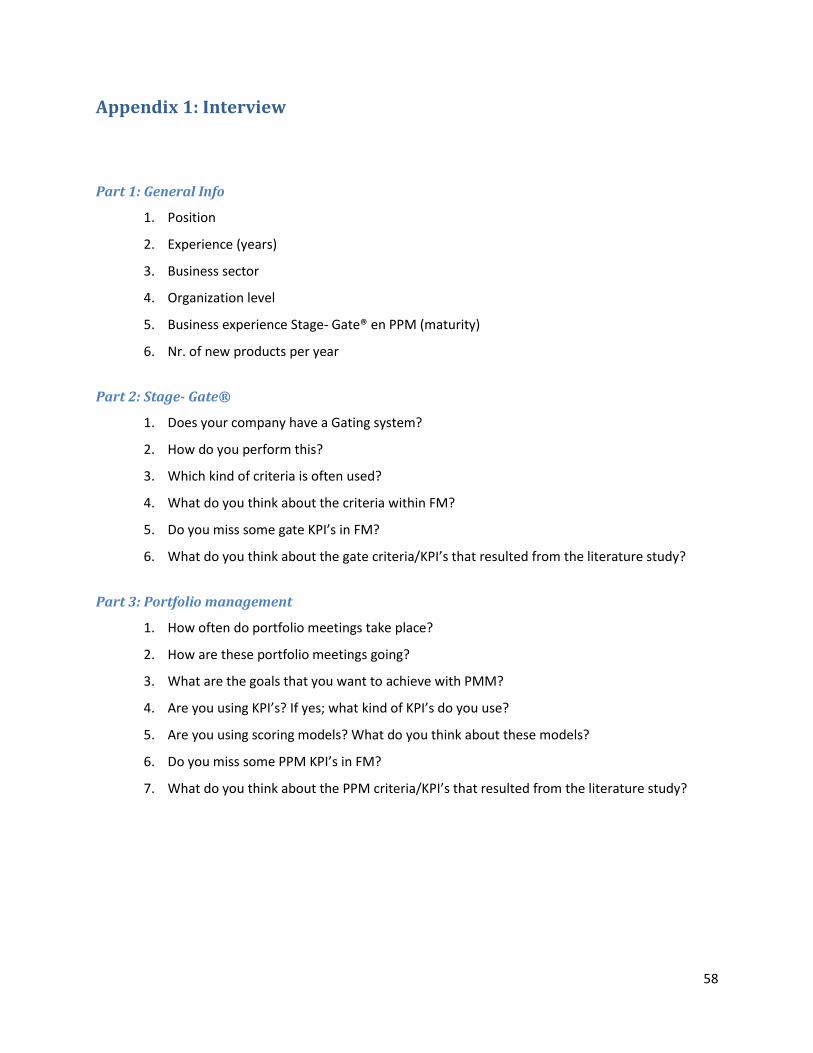
58
Appendix 1: Interview
Part 1: General Info
1. Position
2. Experience (years)
3. Business sector
4. Organization level
5. Business experience Stage- Gate® en PPM (maturity)
6. Nr. of new products per year
Part 2: Stage- Gate®
1. Does your company have a Gating system?
2. How do you perform this?
3. Which kind of criteria is often used?
4. What do you think about the criteria within FM?
5. Do you miss some gate KPI’s in FM?
6. What do you think about the gate criteria/KPI’s that resulted from the literature study?
Part 3: Portfolio management
1. How often do portfolio meetings take place?
2. How are these portfolio meetings going?
3. What are the goals that you want to achieve with PMM?
4. Are you using KPI’s? If yes; what kind of KPI’s do you use?
5. Are you using scoring models? What do you think about these models?
6. Do you miss some PPM KPI’s in FM?
7. What do you think about the PPM criteria/KPI’s that resulted from the literature study?
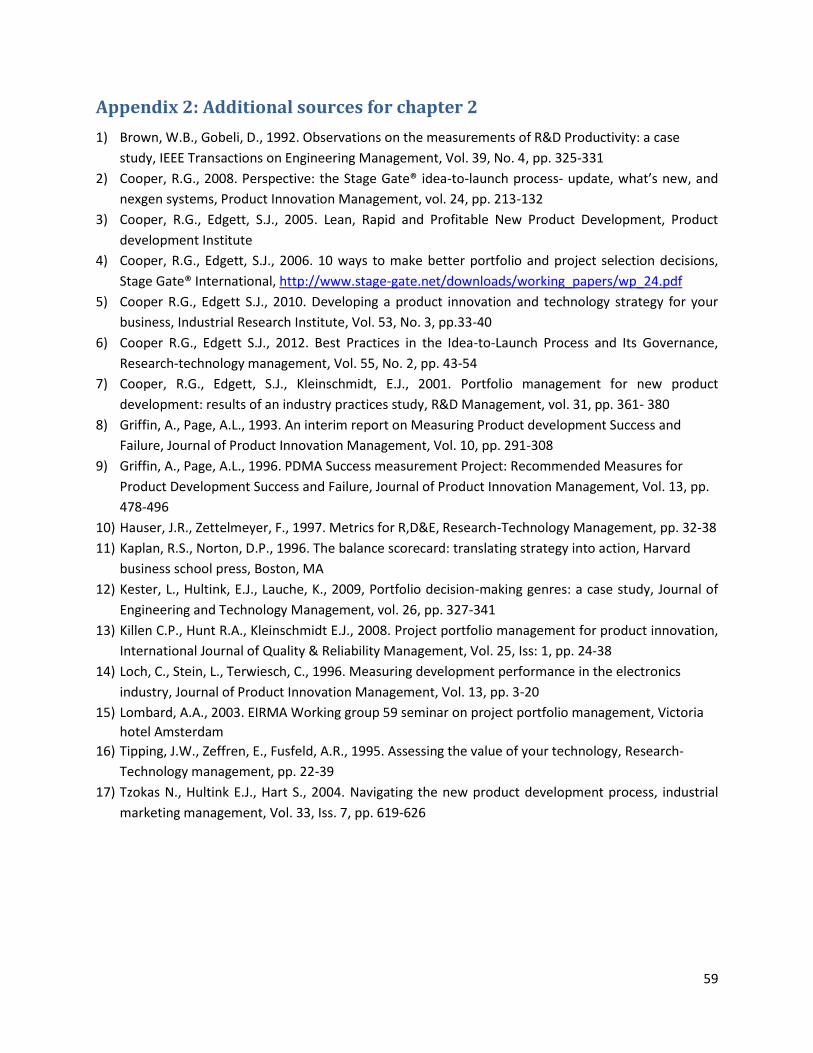
59
Appendix 2: Additional sources for chapter 2
1) Brown, W.B., Gobeli, D., 1992. Observations on the measurements of R&D Productivity: a case
study, IEEE Transactions on Engineering Management, Vol. 39, No. 4, pp. 325-331
2) Cooper, R.G., 2008. Perspective: the Stage Gate® idea-to-launch process- update, what’s new, and
nexgen systems, Product Innovation Management, vol. 24, pp. 213-132
3) Cooper, R.G., Edgett, S.J., 2005. Lean, Rapid and Profitable New Product Development, Product
development Institute
4) Cooper, R.G., Edgett, S.J., 2006. 10 ways to make better portfolio and project selection decisions,
Stage Gate® International, http://www.stage-gate.net/downloads/working_papers/wp_24.pdf
5) Cooper R.G., Edgett S.J., 2010. Developing a product innovation and technology strategy for your
business, Industrial Research Institute, Vol. 53, No. 3, pp.33-40
6) Cooper R.G., Edgett S.J., 2012. Best Practices in the Idea-to-Launch Process and Its Governance,
Research-technology management, Vol. 55, No. 2, pp. 43-54
7) Cooper, R.G., Edgett, S.J., Kleinschmidt, E.J., 2001. Portfolio management for new product
development: results of an industry practices study, R&D Management, vol. 31, pp. 361- 380
8) Griffin, A., Page, A.L., 1993. An interim report on Measuring Product development Success and
Failure, Journal of Product Innovation Management, Vol. 10, pp. 291-308
9) Griffin, A., Page, A.L., 1996. PDMA Success measurement Project: Recommended Measures for
Product Development Success and Failure, Journal of Product Innovation Management, Vol. 13, pp.
478-496
10) Hauser, J.R., Zettelmeyer, F., 1997. Metrics for R,D&E, Research-Technology Management, pp. 32-38
11) Kaplan, R.S., Norton, D.P., 1996. The balance scorecard: translating strategy into action, Harvard
business school press, Boston, MA
12) Kester, L., Hultink, E.J., Lauche, K., 2009, Portfolio decision-making genres: a case study, Journal of
Engineering and Technology Management, vol. 26, pp. 327-341
13) Killen C.P., Hunt R.A., Kleinschmidt E.J., 2008. Project portfolio management for product innovation,
International Journal of Quality & Reliability Management, Vol. 25, Iss: 1, pp. 24-38
14) Loch, C., Stein, L., Terwiesch, C., 1996. Measuring development performance in the electronics
industry, Journal of Product Innovation Management, Vol. 13, pp. 3-20
15) Lombard, A.A., 2003. EIRMA Working group 59 seminar on project portfolio management, Victoria
hotel Amsterdam
16) Tipping, J.W., Zeffren, E., Fusfeld, A.R., 1995. Assessing the value of your technology, Research-
Technology management, pp. 22-39
17) Tzokas N., Hultink E.J., Hart S., 2004. Navigating the new product development process, industrial
marketing management, Vol. 33, Iss. 7, pp. 619-626