Embed Size (px)
Citation preview
supervisors:
PRIVATISATION AT
TANZANIA HARBOURS AUTHORITY
CASE STUDY: GRAIN TERMINAL
Y.H.M. van de Ven
M.Sc. thesis
October 1996
Tanzania Harbeurs Authority: M.A. F. Nkya
Eindhoven University of Technology:
Rotterdam Municipal Port Management:
Dr. ir. P.E. Lapperre Drs. H.C.J.J. Gaillard
Dr. ir. H.S. Hanekamp
Technology Development Sciences Faculty of Technology Management Eindhoven University of Technology
PREFACE
In the momings I used to walk to the office with Kimaro. We were late and had much totalk about. The part of the Kilwa Road from the house to the office was too short. Each morning we slowed down our pace when the cross road where we would part, approached. Wetried to complete the conversation, but each moming we failed. After a while, we fmished the conversation artificially, promising each other to continue it later that day. But only the next moming we remembered the importance of the subject...
Thanks to Kimara and his ndugu (relatives), my stayin Dar es Salaam became so very special. They gave me the chance to live among Tanzanians, withall the inconveniences of the non-luxurious life Tanzanians live. And with all the valuable experiences I would never have taken part in, without becoming ndugu of these people. All memhers of this family made my stay unforgettable and I think back with melancholy about them.
Other people I would like to thank are Florence Nkya, my field supervisor, and Moshi Mtambalika. Both ladies became good friends during my stay, with whomIspent many, but not enough, hours. To all the other people of the planning department I am grateful, but I want to mention one special woman in particular: Mrs. Abdallah, whose loud laughter could be heard all over the department
In the Netherlands Mr. Hanekamp and Mr. Seignette should be complimented for their help and interest in my thesis. From the staff of Technology Development Sciences at the Eindhoven University of Technology I owe Paul Lapperreaword of appreciation for his patience and suggestions during the writing of this report, although I have to mention that he regularly promised to break my neck. F ortunately I leamed fast, so I got the chance to fmish this thesis. Mr. Gaillard I want to thank for his guidance and relativating eye winks.
A very special Dutch friend in Tanzania has notbeen mentioned yet: Jan-Peter. I owe him as much as I owe the Kimaro-family. The words Waarom, zeg mij waarom ... (from the songMy way, translated by Mr. Hazes) nostalgy and sweet memories.
Last but not least, I want to express gratitude to all friends whosent me mail. Everyone who has stayed abroad fora langer time, will understand how heartwarming it is to receive a message from 'home'.
this report is dedicated toA rnabeland Amber
lll
CONTENTS
PREFACE ......................................................................... iii
TABLE OF CONTENTS ................................................................. v
LIST OF TABLES .................................................................... vii
INTRODUCTION . . . . . . . . . . . . . . . . . . . . . . . . . . . . . . . . . . . . . . . . . . . . . . . . . . . . . . . . . . . . . . . . . . . . ix
CHAPTER I THEORETICAL FRAMEWORK . . . . . . . . . . . . . . . . . . . . . . . . . . . . . . . . . . . . . . . . . . . . . . 1 1.1 problem setting . . . . . . . . . . . . . . . . . . . . . . . . . . . . . . . . . . . . . . . . . . . . . . . . . . . . . . . . . . . . 1 1.2 research questions . . . . . . . . . . . . . . . . . . . . . . . . . . . . . . . . . . . . . . . . . . . . . . . . . . . . . . . . . . 5 1.3 methodology .............................................................. 8
CHAPTER 11 PRIV A TISING THA-GRAIN TERMINAL BY MEANS OF JOINT VENTURE ............... 9 2.1 privatisation: general government policy ........................................ 9 2.2 privatisation: THA-policy ................................................... 12 2.3 joint ventures and their characteristics ......... 0 ••••••••••••••••••••••••••••••• 14 2.4 privatisation: THA-grain terminal ............................................. 16 2.5 conclusions .............................................................. 21
CHAPTER lil IMPROVING CARGO THROUGHPUT OF THA-GRAIN TERMINAL .................... 25 3.1 characteristics Dar es Salaam portand bench mark organisation ..................... 25 3.2 dry bulk handling: bench mark organisation ..................................... 30 3.3 dry bulk handling: THA-grain terminal ........................................ 35 3.4 analysis dry bulk handling bench mark organisation and THA ...................... 3 7 3.5 performance indicators ..................................................... 39 3. 6 logistical analysis grain terminal . . . . . . . . . . . . . . . . . . . . . . . . . . . . . . . . . . . . . . . . . . . . . . 44 3.7 cultural aspectsof joint venture execution ........................... 0 •••••••••• 60
CHAPTER IV SUMMARY, CONCLUSIONS AND RECOMMENDATIONS ......................... 65 4.1 summary ................................................................ 65 4.2 conclusions .............................................................. 67 4.4 recommendations .......................................................... 70
REFERENCES ....................................... 0 •••••••••••••••••••••••••••••• 72
APPENDICES
appendix A
appendixB
appendixC
A-1: bistorical perspectives of port development in East Africa
B-1: performance contract and it's evaluation B-2: types of investments known by IPC
C-1: dry bulk shipping Rotterdam and Dar es Salaam C-2: description documents C-3: summary of Statements ofFacts C-4: summary ofHofstede's theories and indices
V

LIST OF TABLES
table 1.1 table 1.2
table 2.1 table 2.2 table 2.3 table 2.4 table 2.5 table 2.6 table 2.7
table 3.1 talbe 3.2 table 3.3
table 3.4 table 3.5 table 3.6 table 3.7 table 3.8 table 3.9 table 3.10 table 3.11
table 3.12
table 3.13
table 4.1 table 4.2 table 4.3 table 4.4 table 4.5
imports and exports of Tanzania by THA .................................. 3 process facts . . . . . . . . . . . . . . . . . . . . . . . . . . . . . . . . . . . . . . . . . . . . . . . . . . . . . . . . . 6
divestiture and ownership according to PSRC .............................. 11 types of joint ventures and their characteristics . . . . . . . . . . . . . . . . . . . . . . . . . . . . . 16 aims and conditions for new grain terminal joint venture ..................... 21 current division ofresponsibilities THA-grain terminaland Nectar ............. 22 proposed interim division ofresponsibilities THA-grain terminaland Nectar ..... 23 proposed fmal division ofresponsibilities THA-grain terminaland Nectar ....... 23 fulfillment of government aims ......................................... 25
characteristics ports of Rotterdam and Dar es Salaam ........................ 25 trends dry bulk in ports of Rotterdam and Dar es Salaam ..................... 30 dry bulk handling in ports of Rotterdam and Dar es Salaam;
differences and similarities ....................................... 37 financial port performance indicators ..................................... 40 operational port performance indicators . . . . . . . . . . . . . . . . . . . . . . . . . . . . . . . . . . 41 financial port performance indicators (Rotterdam and Dar es Salaam) ........... 42 operational port performance indicators (Rotterdam and Dar es Salaam) ......... 42 performance indicators performance contract THA and government ............ 44 materials management decisions ........................................ 45 cause and importance of delays ......................................... 55 scores of Tanzania, Great Brittain and the Netherlands
on the four dimensions of culture ................................... 60 key differences between Nectar-GM & Nectar and THA-grain terminal
general norm and workplace (PDI) ................................. 61 key differences between Nectar-GM & Nectar and THA-grain terminal
general norm and workplace (UAI) ................................. 61
aims and conditions for new grain terminal joint venture ..................... 66 current division ofresponsibilities THA-grain terminaland Nectar ............. 67 proposed interim division ofresponibilities THA-grain terminaland Nectar ...... 67 proposed fmal division ofresponsibilities THA-grain terminaland Nectar ....... 68 logistical constraints and how to upgrade them ............................. 70
VIl
INTRODUCfiON
Within the faculty of Technology Management at the Eindhoven University of Technology, the research group Technology Development Sciences is undertaking research activities in Tanzania, which give insight in the industrialisation process. This M.Sc thesis, which focuses on the privatisation of Tanzania Harbours Authority (THA), fits in the faculty's research activities. The research is a case study of the privatisation of a part of the port in Dar es Salaam, the grain terminal.
The first chapter is a theoretica} frame work, in which the problem setting is described. General infonnation about Tanzania, THA and the port in Dar es Salaam can be found in this chapter. Then two research questions are fonnulated:
1. Through what form ofjoint venture can the THA-grain terminal best be privatised in view ofthe government's aims?
2. How can the cargo throughput ofthe THA-grain terminalbe improved?
Chapter two deals with the first question. The aims of all organisations involved in the privatisation are descri bed. Then a the di vision of responsibilities for a new joint venture is proposed. This proposed joint venture is checked against the government aims.
Chapter three deals with the impravement of the cargo throughput. By comparison with the bench mark organisation, the differences and similarities become clear. A logistical theory was used to detect and remedy the operational constraints. The cultural constraints are dealt with in the last paragraph of this chapter.
The fourth chapter consists of an executive summary, conclusions and recommendations.
lX
CHAPTER I THEORETICAL FRAME WORK
1.1 PROBLEM SETTING
Tanzania
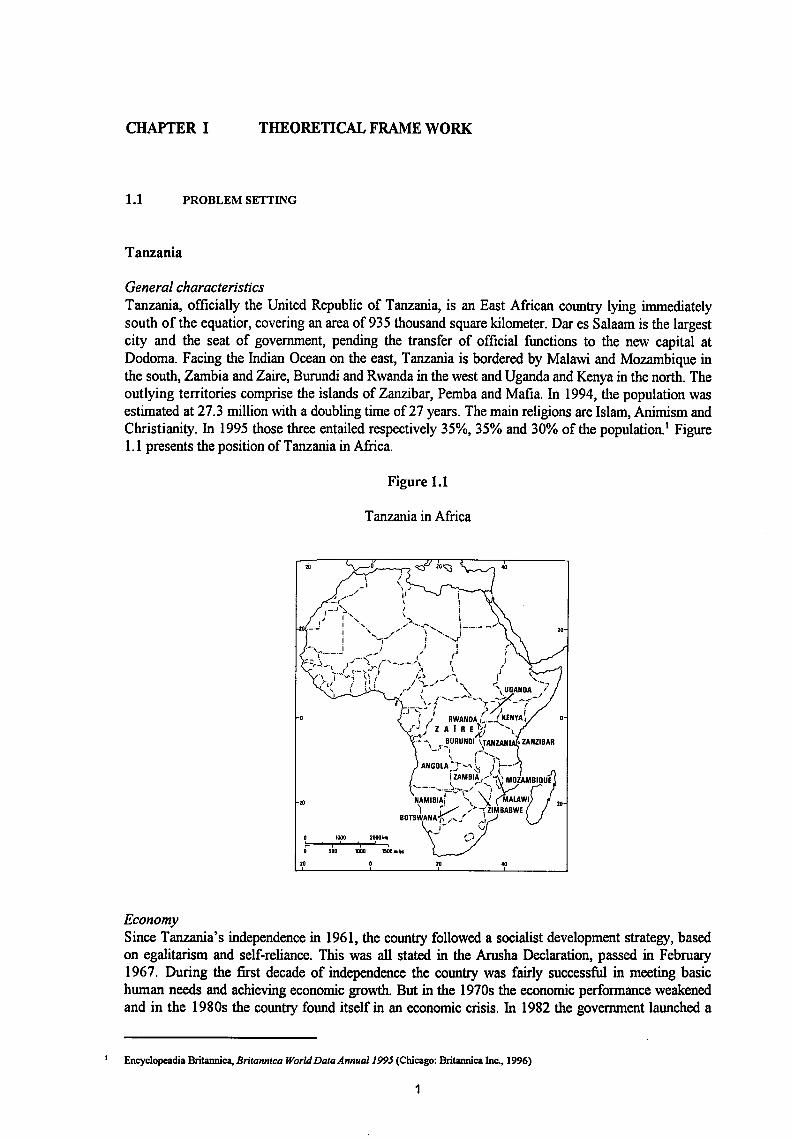
General characteristics Tanzania, officially the United Republic of Tanzania, is an East African country lying immediately south of the equatior, covering an area of 935 thousand square kilometer. Dar es Salaam is the largest city and the seat of government, pending the transfer of official functions to the new capita} at Dodoma. F acing the Indian Ocean on the east, Tanzania is hordered by Malawi and Mozambique in the south, Zambia and Zaire, Burundi and Rwanda in the west and Uganda and Kenya in the north. The outlying territories comprise the islands of Zanzibar, Pemba and Mafia. In 1994, the population was estimated at 27.3 million with a doubling time of 27 years. The main religions are Islam, Animismand Christianity. In 1995 those three entailed respectively 35%, 35% and 30% of the population.1 Figure 1.1 presents the position of Tanzania in Africa.
Figure 1.1
Tanzania in Africa
"
20
20
1000
500 1000 1500mdts
20 20 ..
Economy Since Tanzania's independenee in 1961, the country foliowed a socialist development strategy, based on egalitarism and self-reliance. This was all stated in the Arusha Declaration, passed in February 1967. During the frrst decade of independenee the country was fairly successful in meeting basic human needs and achieving economie growth. But in the 1970s the economie performance weakened and in the 1980s the country found itself in an economie crisis. In 1982 the geveroment launched a
Encyclopeadia Britannica, Britannica World Data Annual1995 (Chicago: Britannica Inc., 1996)
1

Structural Adjustment Programme (SAP), which covered a three year-period (1983-85) and which was meant to improve public sector fmances, reduce inflation and imprave external and internal balances. Efforts to raise the production of both industry and agriculture were made by giving incentives. The SAP resulted in a smaller economie growth than predicted, which was mainly due to lack of foreign currency which limited the country's import capacity. In July 1986 an extension of the SAP was adopted, the Economie Recovery Programme and this resulted in agreements with the International Monetary Fund and the World Bank in 1989. The chronic balance of payments crisis, the economie recession and pressure from the Internatioal Monetary Fund and aid donors were the stimula for the changestoa more liberal policy.
According to the World Bank classification, Tanzania is in the group of "low-income economies". Ranking these countries in ascending order of GDP per capita, Tanzania becomes second, basedon the 1992 data. The GDP per capita was US$ 110 in 1992, with an average annual growth rate of 0.0% over the period 1980-1992. These are low in comparison to the averages for alllow income countries (excluding China and India), which are US$ 370 and 1.2 percent respectively.2
Befare the liberalisation started, the economy of Tanzania was based largely on agriculture and it still is. Cultivated land is extremely limited although the agricultural sector accounts for more than one-half of the GDP and employs more than four-fifths of the work force. Production fluctuates considerably, with serious shortfalls occurring largely as a result of drought and shortages of fuels and machinery.
T otal imparts in 1993 amounted more than trice the value oftotal exports? Machinery and transport equipment, basic manufactures and fuel belang to the most important import goods, while coffe, catton and sisal are the main export goods. Tanzania suffers from a serious lack of foreign exchange. Chief trading partners include the United Kingdom, Germany, the Netherlands, Japan and Italy.
lnfrastructure Because of the immense size of Tanzania and it's widely scattered population, transport in general plays an important role. The transport infrastructure is very important for the social and economical development of the country. In the past, the need to offer landlocked countries an access to a major seaport existed. This all gives an additional dimension to the planning, development and operation of transport services in the country. The transport infrastructure camprises a raad network of some 55,000 kilometers, two railway systems, two international and twenty minor airports, an oil pipeline between Dar es Salaam and Ndola in Zambia and three main ocean ports (Dar es Salaam, Tanga and Mtwara). 4 The mainport in Dar es Salaam is very important for Tanzania's import and export as almast all intercontinental import and export is done via the port, which is assumed to be about 85%. The remaining imparts and exports are done via road and rail connections. The landlocked countries such as Zambia, Zaïre, Burundi, Rwanda and Malawi are also significant users of the Dar es Salaam port for foreign trade.
Tanzania Harbours Authority
Tanzanian harbours With the collapse ofthe East African Community in 1977, the government of Tanzania established the Tanzania Harbours Authority (THA) bylegislation. THA was made responsible to develop, improve, maintain, operate and regulate the harbours of Tanzania and also to construct and operate new portsas
2 The World Bank, World Development Report 1 994; Jnfrastructure for development (Washington: The World Bank, 1994, p.126)
3 Encyclopeadia Britannica, Britannica book ofthe year 1995 (Chicago: Britannica loc., 1996, p.727)
• Koenders, P., Development of a traffic planning system at Tanzania Railways Corporation (TRC); effects of liberali.zation polides on Tanzania Railways Corporation (Eindhoven: Eindhoven University of Technology, 1994, p. 4)
2

and when required. THA is responsible for the three major ocean ports situated in Dar es Salaam, Tanga and Mtwara. The three ports function as separate administrative and operational units, managed by port managers, under the supervision ofthe Director General ofTHA. Tanga and Mtwara handle a limited tonnage, most traffic (90 to 95%) is handled by Dar es Salaam port.5 Seaships as well as coasters are handled and the ports do serve Tanzania as well as it's neighbouring countries. The Tanzanian ports are meant for cargo throughput mainly, no value adding activities are known, but the bagging of grain, sugar and fertiliser. Those commodities are within THA known as free flowing commodities, but from now they will be called dry bulk. In appendix A-1, a part of an artiele is copied in which the rustorical perspectives of port development in East Africa and the rise of the modem East African port system are described.
The role ofTanzania Harbours Authority Until now Tanzania Harbours Authority {THA) has been a parastatal entreprise. Since the liberalisation process in Tanzania started, pressure has increased to commercialise and privatise (sections of) THA. In 1993 the Presidential Parastatal Sector Reform Commission was founded with the aim to determine precisely how the process will proceed and how to overcome practical problems that all parastatal reform programmes must face.
Organogram THA The organisation structure of THA is shown in figure 1.2. THA is the sheltering organisation which sets out a policy and the headquarters is situated in Dar es Salaam, adjacent to the port.
Figure 1.2
Organisation structure Tanzania Harbours Authority
Board or Di rectors
----.., '---~-----r I
Tanzania Harbours Authority,AnnualReports 1984-1993 (Dar es Salaam: THA, 1985-1995)
3
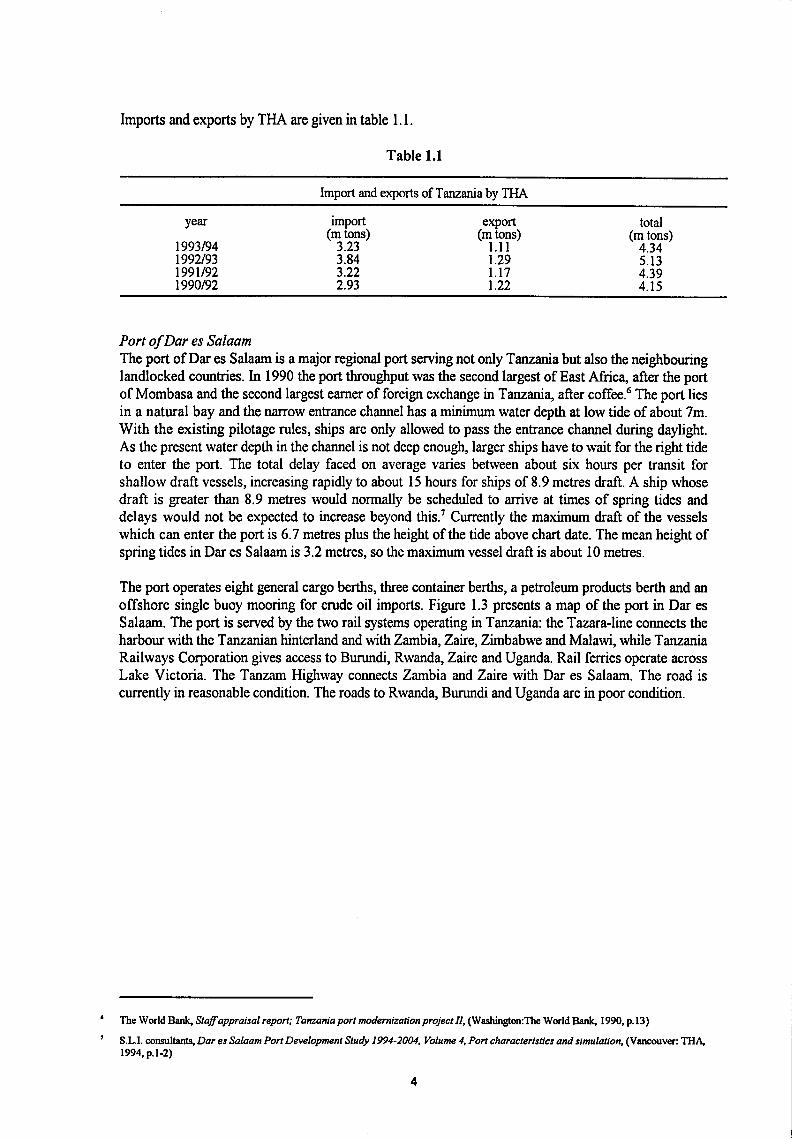
Imparts and exports by THA are given in table l.I.
Table 1.1
Import and exports of Tanzania by THA
year import export (m tons) (m tons)
1993/94 3.23 1.11 1992/93 3.84 1.29 1991/92 3.22 1.17 1990/92 2.93 1.22
Port of Dar es Sa/aam
total (m tons)
4.34 5.13 4.39 4.15
The port of Dar es Salaam is a major regional port serving not only Tanzania but also the neighbouring landlocked countries. In 1990 the port throughput was the second largest of East Africa, after the port of Mombasa and the second largest eamer of foreign exchange in Tanzania, after coffee.6 The port lies in a natura! bay and the narrow entrance channel bas a minimum water depth at low tide of about 7m. With the existing pilotage rules, ships are only allowed to passtheentrance channel during daylight. As the present water depth in the channel is not deep enough, larger ships have to wait for the right tide to enter the port. The total delay faced on average varies between about six hours per transit for shallow draft vessels, increasing rapidly toabout 15 hours forshipsof 8.9 metres draft. A ship whose draft is greater than 8.9 metres would normally be scheduled to arrive at times of spring tides and delays would not be expected to increase beyond this.7 Currently the maximumdraftof the vessels which can enter the port is 6. 7 metres plus the height of the tide above chart date. The mean height of spring tides in Dar es Salaam is 3.2 metres, so the maximum vessel draft is about 10 metres.
The port operates eight general cargo berths, three container berths, a petroleum products berth and an offshore single buoy moaring for crude oil imports. Figure 1.3 presents a map of the port in Dar es Salaam. The port is served by the two rail systems operatingin Tanzania: the Tazara-line connects the harbour with the Tanzanian hinterland and with Zambia, Zaïre, Zimbabwe and Malawi, while Tanzania Railways Corporatien gives access to Burundi, Rwanda, Zaïre and Uganda. Rail ferries operateacross Lake Victoria. The Tanzam Highway connects Zambia and Zaïre with Dar es Salaam. The road is currently in reasanabie condition. The roads to Rwanda, Burundi and Uganda are in poor condition.
• The World Bank, Staf! appraisal report; Tanzania port modernization project//, (Washington:The World Bank, 1990, p.13)
S.L.I. consultants, Dar es Salaam Port Development Study 1994-2004, Volume 4, Port characteristics and simulation, (V ancouver: THA. 1994, p.1-2)
4

Privatisation policy
Sand
C:) Coral
: •: •: Mangrove
Figure 1.3
Dar es Salaarn-port
N
1
T
At independenee in 1961 the gaverrunent introduced a policy of socialism and self reliance. In the Arusha Declaration, written in 1976, the development goal was described as rapid and self reliant economie growth through state control of the cammanding heights of the economy. Numerous parastatal enterprises were established and this resulted in economie growth. But at the end of the 1970s the growth in the parastatal sector becarne negative and mid 1980s the sector even becarne loss making. As it was clear that previous policies had failed, the socialism policy was adjusted toa more liberal one. Commercialisation and privatisation of the parastatal sector becarne a point of focus and in 1992 the Presidential Parastatal Sector Reform Commission (PSRC) was founded to manage the implementation of policy in parastatal reform. The PSRC publisbed a masterplan of reform for the parastatal sector, which was set in the context of the broader reforms which were introduced from the mid 1980s onwards.
The PSRC categorised all parastatals in three groups: social service institutions, public utilities and commercial enterprises. For each group a major strategy was developed which had to be detailed for each company.
Part of the current liberalisation policy in Tanzania is the commercialisation and privatisation of parastatal enterprises. Tanzania Harbours Authority is a parastatal which in future has to operate on a more commercial basis. At least parts ofthe organisation have to be privatised. The THA-management as well as the people from PSRC involved are especially interested in the privatisation of the Grain Terminal. The choice made by those two organisations is to privatise the Grain Terminal by creating a joint venture in which THA brings in the facilities and the partner knowledge and the management.
Goals of the research
The goals of the research is to recommend to THA the best possible joint venture structure to privatise the THA-grain terminaland the best possible ways to imprave the cargo throughput ofthe THA-grain terminal.
5

1.2 RESEARCH QUESTIONS
Research question 1: Through what form of joint venture can the THA-grain terminal best be privatised in view of the gaverrunent's aims?
The sub questions are: • What form of joint ventures are known and what are their characteristics? • What are the aims of the THA-grain terminal joint venture in view of the gaverrunent aims for
privatisation? • What are the existing laws and regulations in Tanzania with respect to joint ventures? • What are the fmancial aspects relevant to joint ventures in Tanzania? • What structures do exist for the settlements of disputes?
And as competitiveness between ports largely depends on the pace of cargo throughput, the other research question is:
Research question 2: How can the cargo throughput ofthe THA-grain terminalbe improved?
• How are dry bulk cammodities handled in a bench mark organisation (Rotterdam Municipal Port Management)?
• How are dry bulk cammodities in generaland grain in particular handled at THA in Dar es Salaam? • What are the performance indicators relevant to increasing the troughput ofTHA-grain terminal? • What is the actual performance in relation to the indicators identified for THA-grain terminal?
Conceptual definitions
Commersialisation An enterprise remains under state ownership, but the efficiency of the business is increased by measures. The ownership structure of public enterprises remains unchanged. Commercialisation is aften a step preceding privatisation. It is aften implemented in areas where it is difficult to attract private investors, or where full privatisation is not (yet) desired for other reasons. A further advantage lies in the relatively rapid implementation, and thus in the possibility for quick realisation of efficiency improvements. In case of THA, commercialisation is defmed as fellows: operation of port units by THA staf! and management but with the introduetion of aggressive bottorn line management. THA 's existing managers would have overall control over their operations including the power to select staf! and workforce memhers and maintain equipment.8 In THA's vision commercialisation should praeeed immediately as a precursor to privatisation.
Privatisation Transfer of farmer state assets to private owners, aften with the intention to increase the campany's efficiency and profits. In case of THA, with privatisation is meant eperation of a port unit by a private contractor through a long term contractual arrangement with THA. 9
S.L.I. consultants, Dar es Salaam Port Development Study 1994- 2004; Volume 3; Port operations and terminal management, (Vancouver: THA, 1994, p. 8-2)
See footnote 8.
6
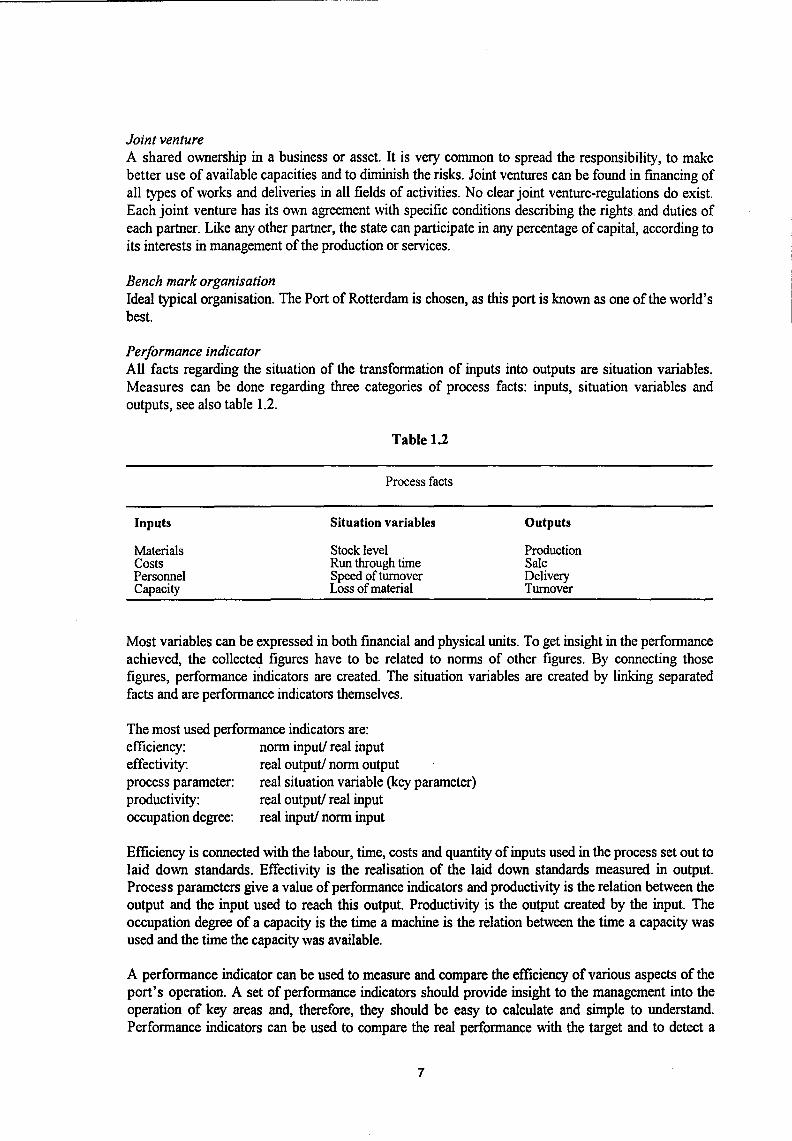
Joint venture A shared ownership in a business or asset. lt is very common to spread the responsibility, to make better use of available capacities and to diminish the risks. Joint ventures can be found in financing of all types of works and deliveries in all fields of activities. No clear joint venture-regulations do exist. Each joint venture has its own agreement with specific conditions descrihing the rights and duties of each partner. Like any other partner, the state can participate in any percentage of capital, according to its interests in management of the production or services.
Bench mark organisation !deal typical organisation. The Port of Rotterdam is chosen, as this port is known as one of the world's best.
Performance indicator All facts regarding the situation of the transformation of inputs into outputs are situation variables. Measures can be done regarding three categones of process facts: inputs, situation variables and outputs, see also table 1.2.
Inputs
Materials Costs Personnet Capacity
Table 1.2
Process facts
Situation variables
Stock level Run through time Speed of turnover Loss of material
Outputs
Production Sale Delivery Turnover
Most variables can be expressed in both financial and physical units. To get insight in the performance achieved, the collected figures have to be related to norms of other figures. By connecting those figures, performance indicators are created. The situation variables are created by linking separated facts and are performance indicators themselves.
The most used performance indicators are: efficiency: norm input/ real input effectivity: real output/ norm output process parameter: real situation variabie (key parameter) productivity: real output/ real input accupation degree: real input/ norm input
Efficiency is connected with the Iabour, time, costs and quantity of inputs used in the process set out to laid down standards. Effectivity is the realisation of the laid down standards measured in output. Process parameters give a value of performance indicators and productivity is the relation between the output and the input used to reach this output. Productivity is the output created by the input. The accupation degree of a capacity is the time a machine is the relation between the time a capacity was used and the time the capacity was available.
A performance indicator can be used to measure and compare the efficiency of various aspects of the port's operation. A set of performance indicators should provide insight to the management into the operation of key areas and, therefore, they should be easy to calculate and simple to understand. Performance indicators can be used to compare the real performance with the target and to detect a
7
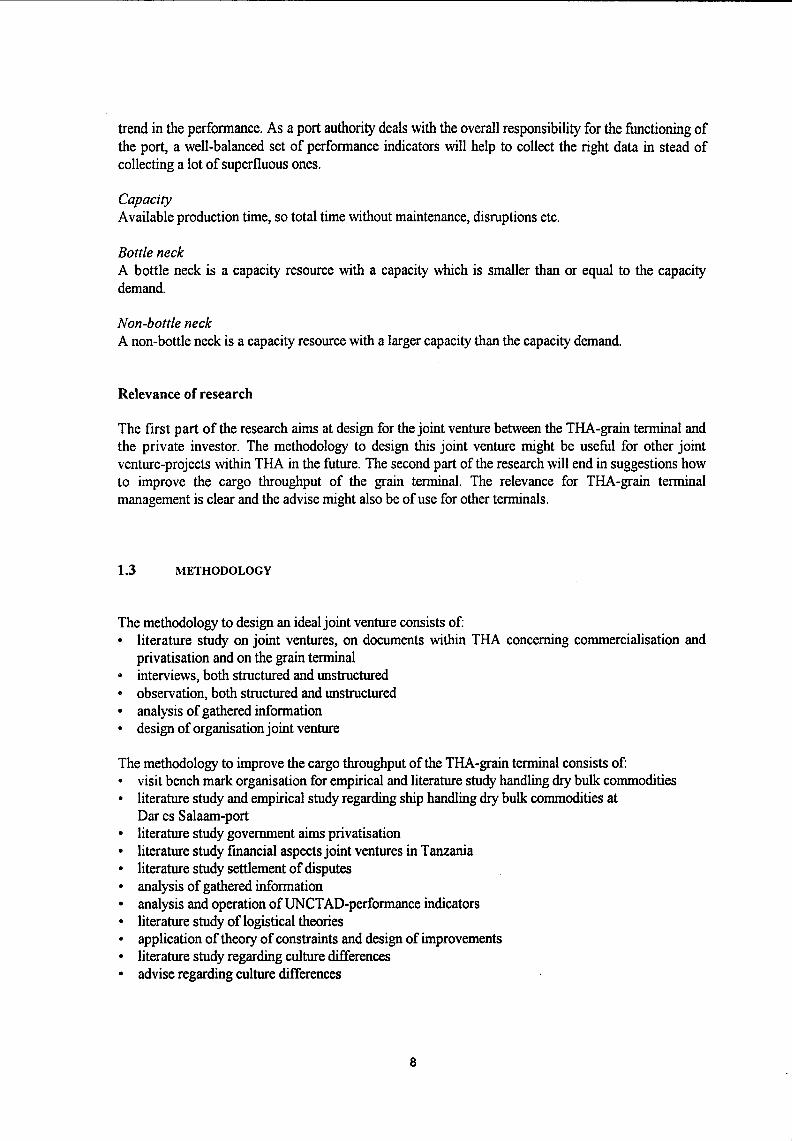
trend in the performance. As a port authority deals with the overall responsibility for the functioning of the port, a well-balanced set of performance indicators will help to collect the right data in stead of collecting a lot of superfluous ones.
Capacity A vailable production time, so total time without maintenance, disruptions etc.
Bottie neck A bottie neck is a capacity resource with a capacity which is smaller than or equal to the capacity demand.
Non-bottie neck A non-bottie neck is a capacity resource with a larger capacity than the capacity demand.
Relevanee of research
The first part of the research aims at design for the joint venture between the THA-grain terminal and the private investor. The methodology to design this joint venture might be useful for other joint venture-projects within THA in the future. The second part of the research will end in suggestions how to improve the cargo throughput of the grain terminal. The relevanee for THA-grain terminal management is clear and the advise might also be of use for other terminals.
1.3 METHODOLOGY
The methodology to design an ideal joint venture consists of: • literature study on joint ventures, on doeurneuts within THA concerning commercialisation and
privatisation and on the grain terminal • interviews, both structured and unstructured o observation, both structured and unstructured • analysis of gathered information • design of organisation joint venture
The methodology to improve the cargo throughput of the THA-grain terminal consists of: • visit bench mark organisation for empirica! and literature study handling dry bulk cernmodities • literature study and empirica! study regarding ship handling dry bulk cernmodities at
Dar es Salaam-port • literature study government aims privatisation • literature study fmancial aspects joint ventures in Tanzania • literature study settiement of disputes • analysis of gathered information • analysis and eperation ofUNCTAD-performance indicators • literature study of logistical theories • application of theory of constraints and design of improvements • literature study regarding culture differences • advise regarding culture differences
8
CHAPTER 11 PRIVATISING THA-GRAIN TERMINAL BY MEANS OF A JOINT VENTURE
To find the best way of privatising the THA-grain terminal, the gaverrunent policies regarding privatisation in general and of THA in particular are set out. As the Parastatal Sector Reform Commission decided that the grain terminal has to be privatised by means of a joint venture, the characteristics of joint ventures and the laws and regulations regarding joint ventures and foreign investments are studied. Only now a proposal for the division of responsibilities for the THA-grain terminal joint venture can be developed.
2.1 PRIVATISATION: GENERAL GOVERNMENT POLICY 10•11
Ristory
At independenee in 1961 the gaverrunent owned only three business enterprises while social services were shared by the gaverrunent and non-gaverrunental organisations. The private sector was very small and it was believed that private initiative would not be sufficient to create economie growth. Economie differences between ethnic groups and foreigners were very substantial and it was perceived that the concentration of economie power in a few individuals or ethnic groups and uneven distribution of wealth was a souree of inequality and for that reason potentially vulnerable to social tension. This situation was unacceptable. So the gaverrunent introduced a policy of socialism and self reliance, adopted in the Arusha Declaration in 1976. The development goal was rapid and selfreliant economie growth through state control ofthe cammanding heights ofthe economy. This led to the establishment of numerous parastatal enterprises in all sectors of the economy and resulted in rapid economie growth. At the end of the 1970s the parastatal sector did not generate the expected savings, tax revenues and exports and the growth became negative. Mid 1980s the parastatal sector even became loss-making, using public resources which could he used far better. In 1992 the Presidential Parastatal Sector Reform Commission (PSRC) was founded to manage the implementation of policy in parastatal reform. In 1993 the Parastatal Privatisation and Reform Masterplan was publisbed which set out the policies and procedures which are being foliowed today. Implementation has continued from 1993 onwards. The parastatal reform program is set in the context of the braader reforms which were introduced from the mid 1980s onwards, since it had become clear that previous policies had failed. The gradual liberalisation of internal and external trade, of agricultural marketing, foreign exchange transactions, prices, interest rates and of the financial sector have led to greater reliance on individual initiative and corporate accountability than on the gaverrunent
Objectives
The emphasis of the reform of parastatals is on improving the efficiency of all parastatal enterprises. The following are the primary objectives which have been defmed in the government's policy statement on Parastatal Sector Reform:
10 Presidential Parastatal Sector Reform Commission, Parastatal privatisation and reform; Masterplan, The United Republic ofTanzania (Dar es Salaam: Govemment Printers, 1993).
11 Presidential Parastatal Sector Reform Commission, 1994 review and action plan for 1995 and beyond, The United Republic of Tanzania (Dar es Salaam: Govemment Printers, 1995).
9

• improve the operational efficiency of enterprises that are currently in the parastatal sector, and their contribution to the national economy
• reduce the burden of parastatal enterprises on the government budget • expand the role of the private sector in the economy, permitting the government to concentrate
public resources on its role as provider of basic public services, including health, education and social infrastructure
• encourage wider participation by the people in the ownership and management of business PSRC's role will be to transform through commercialisation, restructuring and divestiture, the performance of most significant enterprises in the parastatal sector within five years and to eosure liquidation of all non-viabie parastatal enterprises as soon as possible.
The secondary objectives ofthe PSRC are to: • create a more market-oriented economy • secure enhanced access to foreign markets, to capital and to technology • promote the development of the cap i tal market • preserve the goal of self-reliance
At the same time, the process of commercialisation and restructuring will be designed to ensure that the remaining parastatals will become responsive to their markets, cost-conscious and profit oriented.
Constraints
The parastatal reform program is part of the structural adjustment program. As Tanzania has hardly any experience with privatisation a number of obstacles are to be expected. At least the following four constraints have to be dealt with. First, fmding capital will be difficult in any low-income country and especially in Tanzania, as it has been a socialist country. So hardly any private capital is locally available to invest in the parastatals. Foreign investors mostly prefer greenfield investments to buying a going concern. So stimulating foreign investors has to be a main point to eosure successful reforms.
Second, privatisation will cause redundancy. Although in the long term privatisation will turn the parastatals to profitable concerns that will employ many people, most parastatals are not doing very well now. This means that many employees will be redundant, as the current profits are not sufficient to pay the salaries of the employed.
Third, the existing policy uncertainty is a constraint. The PSRC is founded to reduce the uncertainties that may exist by setting out policies and procedures that will guide the process.
Finally, many specialists are involved in a single privatisation process as each reform differs from others. This means that services of lawyers, accountants, valuers, public servants, business analysts and deal-makers are needed and there seems to be a short supply in these services.
Strategy for reform
The Parastatal Sector Reform Commission categorised parastatals in three groups: social service institutions, public utilities and commercial enterprises. The social service institutions are not meant to make profits. These will be the subject of cost reduction and efficiency improvement programs. Public utilities will be expected to make profit and will be subject to cost reduction, efficiency improvement and performance monitoring programs. Non-commercial activities will beundertaken only ifthe utility is compensated for losses. Parts of the utilities busmesses may be split off and sold before divesture and private investors can contribute to the development of essential facilities. Privatisation of certain functions, for example, railway hotels or subcontracting certain Tanesco functions, did already start.
10
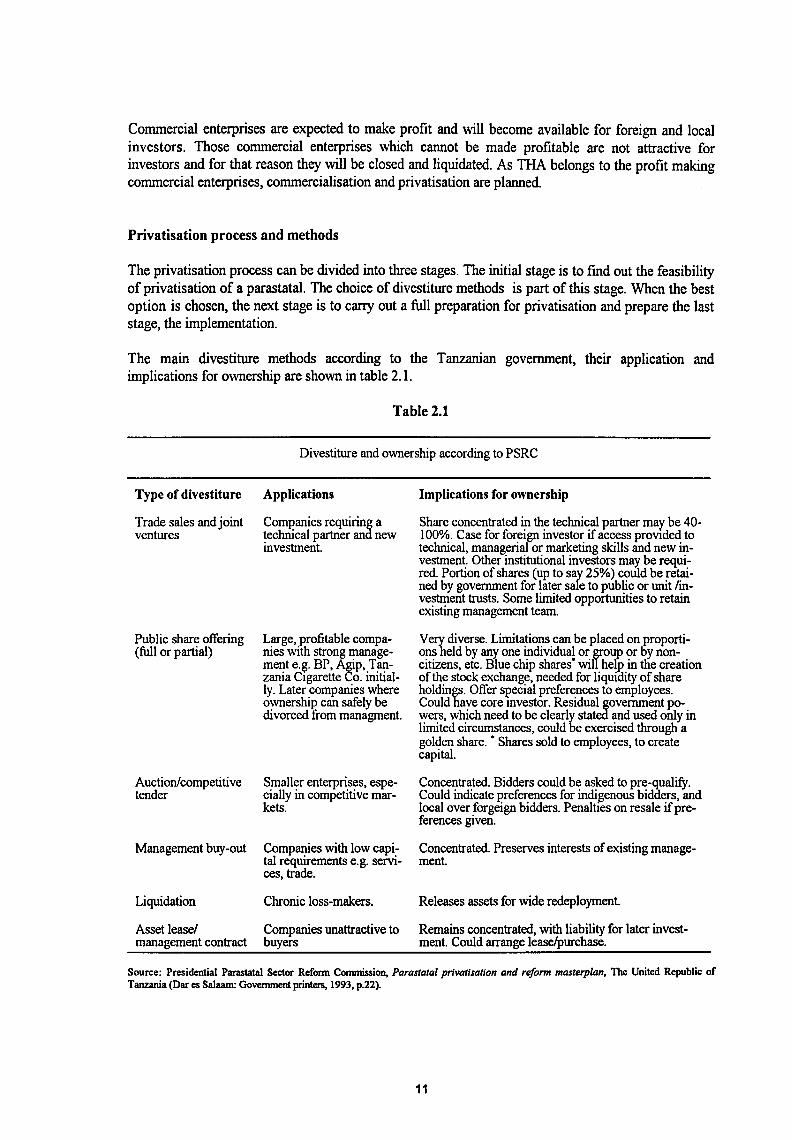
Commercial enterprises are expected to make profit and will become available for foreign and local investors. Those commercial enterprises which cannot be made profitable are not attractive for investors and for that reason they will be closed and liquidated. As THA belongs to the profit making commercial enterprises, commercialisation and privatisation are planned.
Privatisation process and methods
The privatisation process can be divided into three stages. The initia! stage is to fmd out the feasibility of privatisation of a parastataL The choice of divestiture methods is part of this stage. When the best option is chosen, the next stage is to carry out a full preparation for privatisation and prepare the last stage, the implementation.
The main divestiture methods according to the Tanzanian government, their application and implications for ownership are shown in table 2.1.
Type of divestiture
Trade sales and joint ventures
Public share offering (full or partial)
Auction/competitive tender
~anagementbuy-out
Liquidation
Asset lease/ management contract
Table 2.1
Divestiture and ownership according to PSRC
Applications
Companies requiring a technica! partner and new in vestment
Large, profitable companies with strong management e.g. BP, Agip, Tanzania C1garette Co. initially. Later companies where ownership can safely be divorced from rnanagment
Smaller enterprises, especially in competitive markets.
Companies with low capital requirements e.g. services, trade.
Chronic !oss-makers.
Companies unattractive to buyers
Implications for ownership
Share concentrated in the technica! partner may be 40-100%. Case for foreign investor if access prov1ded to technica!, managerial or marketing skilis and new investment. Other institutional investors may be required. Portion of shares (up to say 25%) could be retained by government for later sale to public or unit finvestment trusts. Some limited opportunities to retain existing management team.
Very diverse. Limitations can be placed on proportions held by any one individual or group or by noncitizens, etc. Blue chip shares· will help in the creation of the stock exchange, needed for liquidity of share holdings. Offer special preferences to employees. Could have core mvestor. Residual government powers, which need to be clearly stated and used only in limited circumstances, could be exercised through a golden share. • Shares sold to employees, to create cap i tal.
Concentrated. Bidders could be asked to pre-qualify. Could indicate preferences for indigenous bidders, and local over forgeign bidders. Penalti es on resale if preferences given.
Concentrated. Preserves interests of existing management.
Releases assets for wide redeployment.
Remains concentrated, with liability for later investment. Could arrange lease/purchase.
Source: Presidential Parastatal Sector Refonn Commission, Parastatal privatisation and reform masterplan, The United Republic of Tanzania (Dar es Salaam: Govemment printers, 1993, p.22).
11

The above classification slightly differs from the one used by the World Bank.12 In this classification, Vuylsteke mentions 7 methods of privatisation. Some equal the govemment divestiture methods; i.e. public offering of shares, new private investment in a state owned enterprise (SOE), sale of government or SOE assets, management buy out (Vuylsteke adds employee buy out to this method), lease and management contract. The differences are two methods not mentioned by the PSRC and one by the World Bank. Private sale of shares to identified purchaser(s) and reorganisation or break up into component parts, which in fact is a step up to privatisation, are missing in the PSRC list while the World Bank did not mention liquidation as a method.
2.2 PRIVATISATION: THA-POLICY 13
Government polides regarding THA
The PSRC bas prepared an initia! assessment of the parastatals to be given priority in the reform and restructuring program. For these companies privatisation is not an immediate option, THA belongs to this group. A key element in this program is the introduetion of performance contracts. A performance contract is a formally signed document, negotiated and agreed upon between govemment and management. The contract defines improved commercial performance objectives as well as obligations of the responsible ministry and specifies how non-commercial objectives (if any) will be financed. The contract can also define any restructuring needed to prepare the way for a future organisational, Iabour or financial restructuring. In October 1994, such a contract was concluded between the govemment and THA. The contract applies for a period of three years, starting July 1994 and is reviewed annually. The performance measures, targets and incentives are to be negotiated and agreed annually. In the contract the mission of THA is defined: The mission of the THA as a commercial organisation is to provide theservices required to promote and accommodate maritime-related commercial activities on a commercial basis by generating reasonable return on investment to sustain growth of the harbours for the benefit of the customers, employees and the national economy. 14 In the contract THA's scope of activities is restricted and the board, management and employees accept full responsibility for the performance of THA. Observations made clear that, although the politica! basis exists, among the workers hardly any pubtic support is to be noticed. People are asked to do more work in the same time and take responsibility for it, while many others are to be dismissed because of the creation of a more effective organisation. Details about the performance contract and it's evaluation is presented in appendix B-1.
Current situation
In May 1994 S.L.I. Consultants (a joint venture of Sandwell Inc., N.D. Lea International Ltd. and International Rail Consultants) presented the fmal report ofthe Port Development Study 1994 -2004 of the Port of Dar es Salaam.15 The study gives detailed traffic forecasts, operational analyses, preliminary engineering and hydrological investigations as well as fmancial and economie options available to THA. The objective of the study was to fmd out which improvements and expansions are required in the port of Dar es Salaam to enable it to handle the anticipated traffic in the year 2004.
12 Vuylsteke, C., Techniques ofPrivatization ofstate-owned enterprises, volume 1 (Washington: The World Bank, 1989).
13 Ministry ofTransport, Performance Contract between The Government ofthe United Republic o[Tanzania and Tanzania Harbours Authority (Dar es Salaam: The Govemment Printers, 1994).
14 See footnote 13.
" S.L.I. consultants, Dar es Salaam Port Development Study 1994- 2004 (Vancouver: THA, 1994).
12
In its study S.L.I. Consultants use, in consultatien with THA, the following defmition of privatisation: operation of a port unit by a private contractor through a long term contractual arrangement with THA. 16 Commercialisation is defined as follows: operation of port units by THA sta.ff and management but with the introduetion of aggressive bottorn line management. THA's existing managers would have overall control over their operations including the power to select sta.ff and workforce memhers and maintain equipment. In the same report it is explained that commercialisation should praeeed immediately as a precursor to privatisation. According to those definitions, the THAgrain terminal is commercialised with maintenance and service contracted to a stevedoring company.
July 1995, a consortium of consultants, which were selected by the World Bank to carry out a commercialisation study for THA, started their project in Dar es Salaam. The port of Dar es Salaam was divided in several business units which all are described. The current fmancial performance was measured as well as market factors and prospects. End of October 1995 an interim report17 was published, April 1996 the fmal report was said to be fmished in May 1996.
Within THA, no vision about commercialisation nor privatisation was developed, and the results of this commercialisation study will be used to form a company policy. As THA is still a parastatal enterprise, the government policy, designed by PSRC, is a guide to privatisation.
Responsibilities THA-headquarter
In the Commercialisation Study some interesting remarks about the organisation and management of THA are made.18 The current division of functions and responsibilities between THA-headquarter and the port units does not meet the requirements for an efficient organisation. THA' s management is highly centralised and much of the decision making is done at headquarter's level rather than in the ports, although the headquarter management is not involved in day-to-day operations. Decisions are generated in committees or boards in the headquarter without direct personal responsibility, while those who will be responsible for the physical operations later on are not even consulted.
At this moment the Marketing Department is a part of THA headquarter and does not exist at port level. THA's current Marketing Directorate has only existed since five years. Before, it was a one-man department, with administrative activities. The current department is divided into three sections: promotion, customer services and research & information. There is no clear individual responsibility for specific sections of the market. The organisation does not have a vision on the organisation of marketing aspects in the future.
The World Bank consultants remarked about this situation that a commercialised organisation will need an overall Marketing Department for general port promotion as well as marketing on the level of the business units. The headquarter's marketing section has to be an organisation which is specialised in those marketing aspects which affects all business units. The section has to specialise itself on marketing of THA as organisation, on market research and the planning and strategie marketing. For each operaticnat unit, the sales and marketing activities will also become a very important component. In a commercialised situation with decentralisation of responsibility from THA-headquarter to the business units, the managers of the units will have the responsibility for their economie performance. So the responsibility also covers good and reliable services to their customers. The marketing sections m the different business units have to be responsible for the operational aspects of sales and
,. SLI Consultants, Dar es Salaam Port Development Study 1994- 2004; Volume 3; Port operations and terminal management (Vancouver: THA, 1994, p. 8-2).
17 Kienbaum Development Services GmbH, HPC Hamburg Port Consulting GmbH, BCS, lnterfmas, Commercialisation study; Interim report (Hamburg: THA, 1995).
11 Kienbaum Development Services GmbH, et al, Commercialisation study:Interim report (Hamburg: THA, 1995, p.29-32).
13

marketing, like acquisition, customer satisfaction and solving of problems. So the problems can be solved near the souree and the contact with the clients will be direct.
Privatisation of harbours in general
Even in the USA, the sound in the doctrine of free enterprise, seaports are not run only by private bodies. The economical characteristics ofports are the reason for this:19
• large initial minimum capacity needed for technica} and economical reasons • expansion of the capacity only possible by leaps for same reasons • both initial capacity and expansion need very large investments, which either can not be paid by
private investors or are not attractive to them because of the very long term and life time of the capacity
• realisation of optimal capacity at once gives substantialloss of interest caused by underuse • gradual realisation of optimal capacity gives extra costs (no use of economiesof scale) • capacity bas a long life time without an alternative use • high fixed costs are connected to the long incorporation of cap i tal while the variabie costs are low
Other important facts are the influence of the port on the national economy; the port might be the motor of other economie activities in a region, and a seaport is a conneetion to the other parts of the world. Last but not least, a sea portoften gives a kind of monopoly (locally and regionally) and an oligopoly on regional, national and international hinterland. In the past, the profits sametimes were one of the most important incomes of a govemment.
The national port politics might either be business economical or social economical. lf it is business economie al, the govemment acts like an enterprise. So the tariffs of the port services cover the costs made and eventually even create profit This policy does not influence competition. The social economical policy does influence the port competition, as no profit has to be made.
V erhoeff distinguishes govemment production of port services in infrastructural services (i.e. offering of berths, quays and places to load and unlaod goods), suprastructural services (i.e. stevedoring, warehousing etc.) and additional services (cargadoring, expediting etc.).20 This corresponds with the division of production factors in land (in case of ports also water), capital(goods) and Iabour. Of course a certain harbour service needs mostly more than one of those product factors, but as indicator of the dominant product factor this comparison is useful. In most other literature a harbour service is divided into: • port facilities, which comprise the various physical assets that together constitute the port, such as
breakwaters, quays etc. and • port services, which lend life to these facilities, i.e. pilotage, cargo handling etc. This division is more technically oriented than economically.
2.3 JOINT VENTURES AND THEIR CHARACfERISTICS
Definitions T o get a useful definition of the concept joint venture, a couple of existing defmitions are given and compared. According to the PSRC a joint venture is a collaboration with a trade partner which is expected to bring in significant expertise in production, marketing, management and the capacity to expand business. Joint ventures combinecomponentsof other (divestiture) methods, typically partial
19 Thomson, J. M.,Modern transport economics (Hannondsworth: Penguin, 1974, p. 37-39).
"' Verhoeff, J.M., Vervoers-en haveneconomie: tussen actie en abstractie (Leiden/Antwerpen: Stenfert Kroese B.V., 1981, p. 184).
14

trade sale and management contracts. A joint venture partner would be expected tobring significant expertise in production, marketing, management and the capacity to expand business. 21 According to Hall a joint venture could be any arrangement by which two or more parties come together and combine resources to accomplish a specific commercial purpose for gain.22 A joint venture may, or may not, involve the contri bution of equity. Raaijmakers' definition of joint venture is an enterprise in which at least two companies fmancially participate and co-operate according to a mutual arrangement. This arrangement means an obligation to contribution (mostly a part oftheir activities). The companies keep their economical and juridical independence. 23
Van Hilten recognises four original characteristics of joint ventures: juridical and economical independenee of the partners, the jointness of the enterprise, participation in the fmancing and the contri bution of know how. Three important characteristics of joint ventures are derived: the possibility to unite unlike partners, the large risk dispersal, and the large extent of applicability of the joint enterprise. Van Hilten 's definition of a joint venture is a form of co-operation of some companies which all keep their independenee and which might be extended by some other economical subjects. The co-operation happens according to a common, fully differentiated enterprise, by brioging in know how and participation in the capital stock.24 According to the OECD the termjoint venture refers toa variety of forms of interfirm relationships, usually distinct both from cartels and from mergers between firms. 25
Unlike a carte!, a joint venture often involves a new project or the creation of a new process or product. Unlike a total merger, a joint venture involves only a partial and often temporary integration of the parents' functions, teaving the parents free to continue as separate operational units.
Used definition Important characteristics in the reviewed definitions are the co-operation, juridical independenee and economical independence. A useful definition of the concept joint venture is shared interest in therefore an enterprise run by at least two companies which stay independent economically as well as juridically and which have a shared interest in the business.
Types ofjoint ventures OECD has made a classification of the main functional categones of joint ventures. Although hardly any joint venture fits exactly in a single functionallevel, categorisation according to the predominant functional aspects is useful for illustrative and analytica! purposes. The classification is given in table 2.2.
11 Parastatal Sector Refonn Conunission, Parastatal privatisation and reform masterplan, The United Republic of Tanzania (Dar es Salaam: Govemment Printers, 1993, p. 22).
u Duane Hall, R.,The internationaljoint venture (Boston: Praeger publishers, 1984, p. 19).
23 Raaijrnakers, M.J.G.C., dissertation (Tilburg: Catholic University of Brabant, 1976, p. 52-62).
.. Hitten, H. W. van, De joint venture als vorm van samenwerking ten opzichte van enkele andere vormen (Apeldoorn: TVVS, 1970, p. 217-218).
23 Organisation for Economie Co-operation and Development, Competition policy andjoint ventures (Paris: OECD, 1986, p. 93).
15

Table 2.2
Types of joint ventures and their characteristics
Type
Productionmanufacturing
Buying and selling
Service
Research and development
Natura! resource exploration and exploitation
Engineering and construction
International aspects of joint ventures
Characteristics
Objective: common production or penetration of a new geographical market or manufac~g new products or providing new servtces.
Joint buying: partners buy unilaterally. This may gtve buying power.
Joint selling: selling on behalf of memhers. To gam access to new markets and existing distribution channels.
Particular for trading and associated services. Linked with the development of new technologies.
Basic or applied research, commercial development or a combination of these elements.
Mining.
International trade, notably intrade between smalland medium-sized enterprises and the developing countries and in theEast-West economie context.
Specific problems may arise such as the definition of relevant markets and questions of jurisdiction.
Application
This type of joint venture can cover a very broad variety of sectors and products and involves parties from various countries. For example: steel industry, chemica! industry, Japanese firms often involved in manufacturing ofhigh-technology products.
Sometimes used in international trade to countervail the market power of foreign suppliers. Often exclusive selling agreement covering all or part ofthe products and markets of the parties, accompanied by the fixing of pnces and terms of sale.
Relatively new (ca. 20 years old). T o encourage service enterprises to increase efficiencies through inter-frrrn cooperation.
Set up by very different types of enterprises, not only m high-technology sectors but also in a large variety of industries. They involve both state-owned and private enterprises.
Major company having fmancial means and expertise and a small company holding a mineral claim.
Often form of turnkey contract: constructor is responsible for the construction of an operational plant in one host country.
Source: Organisation for Economie Co-operation and Development, Competition policy and joint ventures (Paris: 1986, p 12-18).
2.4 PRIV ATISA TION: THA-GRAIN TERMINAL
The grain terminal is nota separate terminal but part ofthe general cargo terminal. However, the bulk grain handling is located on a self contained site and is concentrated around gate 4. It cernprises storage silos, bagging plants and associated workshops. lts activities are the bagging of bulk comrnodities, rnostly grain and sornetirnes sugar or fertiliser, both in the terminal and at the quayside and their storage in the silos. The bagging capacity is over 1,500 tonnes per day. In the past the authority rented private services for bagging of grain or fertilizers, but this becarne too expensive. As THA did not have any experience in the bagging services and, more important, THA is, according to
16

it's foundation act, not allowed to conetude demurrage and despatch contracts26 which are usual in stevedoring of free flowing commodities, the management decided to involve a private company and the British consultancy Nectar Shipping and Projects Ltd. was contracted. The responsibilities for the grain terminal are strictly separated. THA contributes space, machines, equipment and general Iabour. Nectar is responsible for discharging and bagging at performance rates which are agreed with World Food Programe (WFP). IfNectar performs less, the company is demurraged. The responsibility for the maintenance and servicing of the machines, spare parts included is Nectar's, and the consultant should also train THA-staff in maintenance and operation of equipment. Another task is the marketing of THA-services, to win business. Where demand exceeds the available capacity, Nectar is responsible to arrange the needed equipment. Penalties for delays are also on Nectar's account. The revenues of the grain terminal are sharedon a fifty-fifty basis between THA and Nectar, before costs are subtracted.
Aims of joint venture THA-grain terminal
The PSRC decided that the THA-grain terminal would become a joint venture in 1995. In the third annex of the Review and Action Plan for 1995 and Beyond all divestures being prepared for 1996 onwards are mentioned per ministry. At the Ministry of Communications and Transport nothing about THA is reported. All mentioned corporations for action are to be privatised by share sale in 1996.
In order to achieve a higher level of efficiency and competitiveness, THA and PSRC decided to involve private participation in the management of the grain terminal. The objectives of this private participation are formulated inthetender document and overlap each other.27 The frrst aim was the impravement of profitability by rnanaging the terminal as a commercially viabie business entity. This should create a higher contribution towards the overall profitability of the authority. Secondly, the participation is expected to improve the efficiency of the grain terminal, and this way it will become more competitive than similar facilities available in the region. The third aim is to maximise utilisation of the facility. A private operator will help to market the facility in a more agressive way. To fmd a suitable partner, THA invited bids via a tender. Nectar won the bids.
Laws and regulations with regard to joint ventures
The Investment Promotion Centre (IPC) was established in june 1990, in order to promote, coordinate, regulate and monitore foreign and local investments. The betonging act repeals the Foreign In vestment Proteetion Act. 28 Reason to found the IPC was the liberalisation program, which was meant to promote rapid economie development and growth. Tanzania owned many natura} resources which are to be explored with help of private investment. The task of the IPC is to design an institutional framework for investors to operate within and provide them with incentives and guarantees in order to encourage investments particularly in areas of national priority. The IPC is meant to give effect to the deliberalisation policy and to enact a more comprehensive legislation to govem investments in all areas.
According to the Investment Promotion Centre, a joint venture is an association, whether incorporated or unincorporated, between foreign investors and local co-operative or parastatal organisations, foreign
"' Demurrage: reimbursement the charterer bas to pay to shipowner in case of exceeding agreed toading time or unloading time. In case of bulk grain han<l1ing in Dar es Salaam, the stevedoor is made responsible for the toadingor unloading time, and for the fme. Despatch money: reimbursement paid by shipowner to charterer, in case offaster toadingor unloading than planned. As a rule, despatch money amounts SO% of demurrage. Again in Dar es Salaam, the stevedoor is made responsible.
:rr Tanzania Harbours Authority, Tender documentsJor porticipation in the management ofthe grain terminal at the port of Dar es Salaam (Dar es Salaam: THA, 1994).
11 lnvestment Promotion Centre, The National fnvestment (Promotion and Protection) Act, Principal Legislation, no. 10 of 1990, revised edition 1992 (Dar es Salaam: Government Printers, 1992).
17
investors and local private investors, dornestic private investors and local parastatal and, or cooperative organisations, for the purpose of making an investment jointly in an enterprise in respect of which an application may be made for a Certificate of Approval. Otherwise, no laws and regulations exist.
Other aspects relevant to joint ventures: finance and Iabour
Foreign lnvestments In 1963 an act was adopted to give proteetion to certain Foreign Investments.29 In this act it was arranged that a foreign national30 was only allowed to have investments in Tanganyika after application to the Minister of Finance. The minister had to consider every application made and only when the enterprise would stimulate the economie development or benefit the country otherwise, a certificate of approval was issued to the applicant.
In 1990 the Investment Promotion Centre was founded, which is an ammendment of the Foreign Investments (Protection) Act.31 In this act, joint venture is described as an association, whether incorporated or unincorporated, between foreign investors and local cooperative or parastatal organisations, foreign investors and local private investors, dornestic private investors and local parastatal and, or cooperative oranisations, for the purpose of making an investment jointly in an enterprise in respect ofwhich an application may be madefora Certificate of Approval.
In this act three types of in vestment areas are known, which are dealt with here. Further details are set out in appendix B-2. First group enclose the priority areas for investment. THA-grain terminal belongs to this group, covered by the sector transit trade, as its activities relate to the transit of goods to neighbouring countries. Other sectors are agriculture and livestock development, natural resources, tourism, manufacturing industries, petroleum and mining, construction and transport. The second group contains the controlled and reserved areas. Controlled areas shall normally be reserved for public investment or joint public and private enterprises, as the areas are of major economie importance. Exceptions may be made for some sectors. The reserved areas are of strategie importance and for this reason exclusively reserved for investment by the public sector, except where speciallicenses may be granted. The third group of areas is reserved for local investors. All sectors which only need small investments belang to this group, like eperation of taxis, ice-cream making, bakeries etc. In some of those areas, to be stipulated by IPC, foreign investors with less than two hundred and fifty thousand US dollars will be excluded.
According to part 3, section 9 of the Foreign Investments (Protection) Act any local and foreign investor is allowed to invest in a new enterprise, but some conditions have to be fulfilled. First is that the investments have to be another area than in the ones reserved exclusively for the public sector or local investors. Then the investor has to apply for a Certificate of Approval, the application has to be accompanied by a statement on the likely contribution of the enterprise to objectives set by the IPC.
29 The Republic ofTanganyika, Foreign Investment (Protection) Act, Act 1963, no. 40 (Dar es Salaam: Govemment Printers, 1963).
"' Foreign national: a person who is nota citizen ofTanganyika, and includes a body corporate not being a body incorporated in Tanganyika.
31 Investment Promotion Centre, The National Jnvestment (Promotion and Protection) Act, Principal Legislation, no. 10 of 1990, revised edition 1992 (Dar es Staam: Gaverrunent Printers, 1992, p. S).
18
The major objectives are: • maximisation of foreign exchange earnings and savings • enhancement of import substitution activities which achieve identifiable substantial foreign
exchange savings • expansion of food production • achlevement of a high degree of technology transfer • creation of employment opportunities and the development of human resources • the efficient utilisation, expansion and diversification of the productive capacity of existing
enterprises • provision of services or production of goods which improve linkages between the various sectors of
theeconomy
Additional objectives are: • capital, technical skilis and raw materials available to the applicant • local materials' supplies and services to be used by the applicant • interests and conditions of service of the Iabour employed or to be employed by the applicant • general promotion and development of enterprises within Tanzania and the need to generate
constructive competition among enterprises • potential demand, both within the United Republic and elsewhere, for the product or services of the
enterprises • siting or proposed siting of the enterprise in relation to the availability of power, fuel, Iabour,
transport, raw materials, land and water • promotion of balanced and equitable growth throughout the country • interests of potential consumers from investment in the enterprise being undertaken
The application will be submitted to the ministry, government department or agency with sectoral responsibility for enterprises of such nature. The institute to which the application is sent has to respond to the IPC with any comments on the request. Then the IPC will grant or refuse the application subject to the degree of meeting the objectives mentioned above.
Foreign valuta With the introduetion ofthe liberalisation policy the exchange rate was decontrolled. For joint ventures no special rules regarding foreign exchange exist. Like other companies, joint ventures are responsible for foreign exchange needed to pay their foreign expenses.
Fiscal aspects According to section 2lofthe Foreign Investments (Protection) Act, for an approved new company the whole of the tax payable with respect to the gains and profits shall be remitted for five years. After this period the tax shall be chargeable at rates which depend on the type of enterprise. Per June 16th 1995, this artiele changed: import duties on machinery and equipment necessarily required for the establishment of an approved enterprise and imported for use solely and exclusively in such approved enterprise is per this date set on 5%, also the payment on sales is set on 5%. Since this new tariff is set, no negotiations about the tariffs are possible anymore. Newly founded companies can receive a tax holiday of 5 years.
If the approved enterprise is the rehabilitation or expansion of an existing enterprise or where an approved enterprise is rehabilitated, the tax calculated for the enterprise shall be calculated and charged on the income in respect of the total dividends, royalties or interest paid. Import duties for all machinery, equipment spare parts, materials and supplies necessarily required for operation of the enterprise, are set on 5%. No special taxes for foreign enterpreneurs do exist.
19

Staff2
According to the law, recrutement should happen under local qualified citizens. Only in case of no suitable locals available, foreigners may he employed. The Security of Employment Act provides for the establishment of JUWATA Field Branch Committee {Tanzania Worker's Organisation) which have to he consulted in all cases in which an employer intends to take disciplinary action against an employee, and no employer may impose a disciplinary penalty without frrst consulting the JUW A TA Field Banch Committee. Where there is no such Field Branch the employer has to inform the Labour Officer of the area as well as the local JUW ATA OfficiaP3 In case an employee commits an offence, the workers union and the management of the corporatien meet. If the employee is found guilty the appointing authority deals with the case.
2.5 CONCLUSIONS
Table 2.3 presents the aims and conditions for a new grain terminal joint venture. The table will serve as a starting point for the discussions about the best possible form of joint venture.
Aims govemment
AimsTHA
Aims THA-grain terminal
Table 2.3
Aims and conditions for new grain terminal joint venture
• improve operational efficiency • improve profitability
expand role of private sector • encourage wider participation by people in ownership and management
create more market oriented economy • to enhance access toforeign capita! and technology
develop capita! market • preserve self relierree
commercial enterprises become available for foreign and local investors
• long term contractual arrangement with private contractor reasonable return on investment (what is reasonable?)
• temporary private participation in mgt GT, to achieve: !ncreasing pr<?fitability 1mprove efficiency maximise utilisation of facility
n The Association ofTanzania Employers, Solient things you should know about the Iabour laws (Dar es Salaam: 1988).
33 Ministry of Justice, The SecurityofEmploymentAct; Act No. 62 of 1964- Cap, Alnendment by Act 45 ofl969 and No. 1 of1975 (Dar es Salaam: Govemment Printers, 1976).
20

I I
Aims IPC
Laws and Regulations
Financial aspects • foreign investments
• foreign valuta
• fiscal aspects
StatT
Aims and conditions for new grain terminal joint venture
• maximisation of foreign exchan&e eamings and savings enhancement of import substitut10n actiVIties whlch achleve identifiable substantial foreign exchange savings
• expansion of food I?roductlon achlevement of a htgh degree oftechnology transfer creation of employment opportunities and the development of human resources
• e~ci.ent utilisat~on, expanston and diversification ofthe productive capacity of eX!stmg enterpnses
• provision of services or production of goods whlch improve linkages between the various sectors of the economy
• capital, technical skilis and raw materials available to the applicant local materials' supplies and services to be used by the apphcant
• interests. and condtbons of service of the labour employed or to be employed by the apphcant
• general promotion and development of enterprises within Tanzania and the need to generate constructive competition among enterprises potential demand, both within the United Republic and elsewhere, for the product or services of the enterprises
• siting or proposed siting ofthe enterprise in relation to the availability of power, fi.iel, labour, transport, raw materials, land and water promotion ofbalanced and equitable growth throughout the country
• mterests of poten ti al consumers from mvestment in the enterprise being undertaken
• investments only allowed in certain areas; see also appendix B-2 Certificate of Approval needed (granted by IPC, only when aims are met)
• any foreign investor is allowed to invest in new enterprises, except certain are as
• no speciallegislation
• newly found enterprises receive a 5 year tax holiday after tax holiday, import duties on machinery and equipment required (for use only) 5%
• tax on sales: 5% • no special taxes for foreign entrepreneurs
• recrutement among local qualified citizens, unless impossible
In 1984 Nectar Shipping and Projects Ltd. was involved in the grain terminal with a bagging contract for quay si de bagging of grain and fertiliser. When at the end of the 1980's the grain silo and three bagging units were provided by a Dutch aid program, the campany's contract changed into a management contract for all bagging operations in the port. THA's responsibility are the main production factors: space, general1abour and machines and equipment, while Nectar is responsible for discharging and bagging, maintenance and service of the equipment and training the THA -staff in maintenance and operation of the equipment. Also marketing of the terminal to bring in customers belongs to Nectar's tasks. Officially the company has no responsibility for the management ofthe silo itself, but in practice Nectar provides management assistence to silo operations. Recently, THA decided to operate the terminal on a joint venture basis and Nectar won the bids. In April 1996 the negotiations between the two parties and the PSRC had not started yet. Despite the contract, Nectar pays for Iabour itself, as the staff paid by THA in practice is not available. In the current situation, the Tanzanian management is fmally responsible for the grain terminaland Nectar is operating under this management. Informally, however, the role ofthe Nectar representative in the management ofthe silo is prominent. Nectar has provided management assistance to silo operations and helped with spare parts supply, etc. Because of the formal structures, however, Nectar has no official voice in important situations, i.e. in meetings with important clients.
The will ofprivatisation is inseparable from the wish to improve the terminal's profitability, efficiency and utilisation. This implies that the current system does not fully satisfy and the division of responsibilities should be reviewed.
21
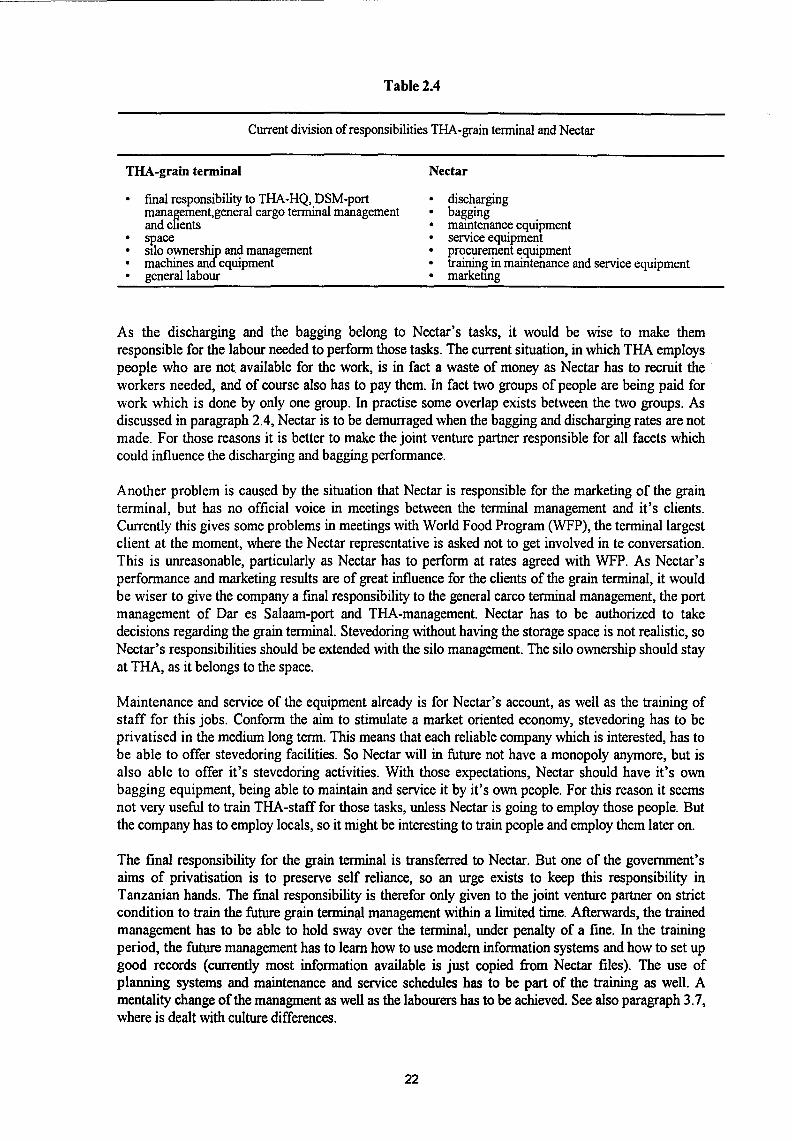
Table 2.4
Current division ofresponsibilities THA-grain tenninal and Nectar
THA-grain terminal
• final responsibility to THA-HQ, DSM-port management,general cargo terminal management and clients
• SP.ace stlo ownership and management machines and equipment
• generallabour
Nectar
• discharging bagging .
• mamtenance eqmpment • service equipment • praeurement equipment
training in maintenance and service equipment • marketmg
As the discharging and the bagging belong to Nectar's tasks, it would be wise to make them responsible for the Iabour needed to perfarm those tasks. The current situation, in which THA employs people who are not available for the work, is in fact a waste of money as Nectar bas to reeruit the workers needed, and of course also bas to pay them. In fact two groups of people are being paid for work which is done by only one group. In practise some overlap exists between the two groups. As discussed in paragraph 2.4, Nectar is to be demurraged when the bagging and discharging rates are not made. F or those reasans it is better to make the joint venture partner responsible for all facets which could influence the discharging and bagging performance.
Another problem is caused by the situation that Nectar is responsible for the marketing of the grain terminal, but bas no official voice in meetings between the terminal management and it's clients. Currently this gives some problems in meetings with World Food Program (WFP), the terminallargest elient at the moment, where the Nectar representative is asked not to get involved in te conversation. This is unreasonable, particularly as Nectar bas toperfarm at rates agreed with WFP. As Nectar's performance and marketing results are of great influence for the clients of the grain terminal, it would be wiser to give the company a final responsibility to the general carco terminal management, the port management of Dar es Salaam-port and TRA-management. Nectar bas to be authorized to take decisions regarding the grain terminal. Stevedoring without having the staragespace is not realistic, so Nectar's responsibilities should be extended with the silo management. The silo ownership should stay at THA, as it belongs to the space.
Maintenance and service of the equipment already is for Nectar's account, as wellas the training of staff for this jobs. Conform the aim to stimulate a market oriented economy, stevedoring bas to be privatised in the medium long term. This means that each reliable company which is interested, bas to be able to offer stevedoring facilities. So Nectar will in future nothave a monopoly anymore, but is also able to offer it's stevedoring activities. With those expectations, Nectar should have it's own bagging equipment, being able to maintain and service it by it's own people. For this reason it seems not very useful to train THA-staff for those tasks, unless Nectar is going to employ those people. But the company bas to employ locals, so it might be interesting to train people and employ them later on.
The final responsibility for the grain terminal is transferred to Nectar. But one of the government's aims of privatisation is to preserve self reliance, so an urge exists to keep this responsibility in Tanzanian hands. The fmal responsibility is therefor only given to the joint venture partner on strict condition to train the future grain terminal management within a limited time. Afterwards, the trained management bas to be able to hold sway over the terminal, under penalty of a fme. In the training period, the future management bas to leam how to use modem information systems and how to set up good records (currently most information available is just copied from Nectar files). The use of planning systems and maintenance and service schedules bas to be part of the training as well. A mentality change of the rnanagment as well as the labourers bas to be achieved. See also paragraph 3. 7, where is dealt with culture differences.
22

In table 2.5 it is shown how the elivision of responsibilities between the THA-grain terminal and Nectar has to he temporarily, to create the fmal situation, shown in table 2.6.
Table 2.5
Proposed interim division ofresponsibilities THA-grain terminaland Nectar
THA-grain terminal
• sr.ace • stlo ownership • machines and equipment
Nectar
• fmal responsibility to THA-HQ, DSM-port management, general cargo terminal management and clients
• silo-management discharging
• bagging mamtenance of equipment
• service of equipment • procurement equipment • generallabour • training future grain terminal management
marketmg
(• training in maintenance and servicing equipment)
Table 2.6
Proposed final division ofresponsibilities THA-grain terminaland Nectar
THA-grain terminal
• fmal responsibility to THA-HQ, DSMport management and general cargo terminal management
• sr.ace sllo ownership
Nectar
• final responsibility to clients • silo management
machines and equipment • discharging • bagging
maintenance of equipment • service of equipment • procurement equipment
generallabour • marketing
Checking proposed joint venture against government aims
Checking the proposedjoint venture against the government's privatisation aims, one will fmd that the impravement of operational efficiency and profitability will stand a chance to met. Nectar is a commercial enterprise, so it' s aims will he increasing efficiency to decrease the costs to improve the profitability. According to the proposal, in the short term Nectar will he the only company rnanaging stevedoring activities, so the aim to expand the role of the private sector will not he met. In the medium long term, however, it is advised to privatise stevedoring, which meets two other aims put by the govemment: expansion of the role of the private sector and creation of a more market oriented economy. The goal to preserve self relience is only met in the medium long term, like the aim to encourage wider participation by people in management, as the advise in the proposal is to hand over the fmal responsibility to Nectar in the short term. After the management being trained for the jobs, the responsibility will he transferred to employees of THA again. Wider participation of people in ownership is an aim which will not he met at all. The joint venture will make the discharging in the grain terminal of Dar es Salaam port more efficient. Creating more similar joint ventures will make the
23

overall port operations more efficient and profitable. Between those who are in port business, this will be known very soon and for this reason it will become easier to attract foreign capital and technology. This might also develop the Tanzanian capital market The joint venture proposed already is a commercial enterprise which became available for foreign and local investors.
In table 2.7 an overview ofthe way in which the proposal will meet the gevemement aims is given.
Table 2.7
Fulfillment of govemment aims
Government aims Short Medium Long Notmet term long term
term
imprave operational efficiency • • • imprave profitability • • • expand role of private sector • encourage wider participation by people in
o ownershtp • o management • • • create more market oriented economy • • to enhance access to foreign capita! and technology • • develop capita! market • preserve self relience • • commercial enterprises become available for foreign and • • • local investors
Additional measures
To meet the goal of wider participation in ownership by people, sale of shares could be a solution. But because of the strategie importance of the port for the whole country (see also paragraph 2.2) this does oot seem to make sense. Another argument against this measure is the lack of private capita! in the country.
To expand the role ofthe private sector, alocal stevedore could be subsidized by the govemment to operate at the terminal. Neither does this initiative seem to be valuable: these kind of measures work against the goal to create a market oriented economy and subsidizing often creates weak companies. Only temporarily subsidizing might assist.
In Tanzania, privatisation of banks has not started yet. Beginning 1996, only 2 small private banks existed, all other banks are still govemment owned. lt is impossible to develop a capita! market without the banking system being privatised. Without privatised banks, no stock exchange is possible and for this reason wider participation in ownership will be fiction.
24

: -
CHAPTERIII IMPROVING CARGO THROUGHPUT OF THA-GRAIN TERMINAL
T o assess the efficiency and productivity of the procedures and performance of Dar es Salaam port, this port is compared with port of Rotterdam, the benchmark organisation. The port of Rotterdam is known as one of the world's best ones and for this reason chosen as the bench mark organisation. To create some insight in the functioning of both ports, their characteristics are listed. As this report focuses on Dar es Salaam's grain terminal, the import and export procedures of both ports regarding the specified free flowing cammodities (grain, sugar, fertiliser) are described. Then the port performance indicators of the United Nations Conference on Trade and Development (UNCTAD) are described and when the two harbours are compared on basis of these indicators, the differences between both ports become clear. 34 The operational constraints are found and elevated with help of a logistical theory. The cultural constraints are found and elevated by use of literature.
3.1 CHARACfERISTICS DAR ES SALAAM PORTAND BENCH MARK ORGANISATION
Both the ports in Rotterdam and Dar es Salaam are important in their region. In 1990 the port throughput in Dar es Salaam was the second largest of East Africa while port of Rotterdam is the largest in Europe. Nevertheless enormous differences between the ports exist. This becomes clear when camparing the main characteristics ofthe ports, which is done in table 3.1.
Table 3.1
Characteristics ports of Rotterdam and Dar es Salaam
Charaderistics Port of Rotterdam Dar es Salaam port
Tra/flC
no. ofships
tota1 throughput (tons) • import • export • transit • entrepot slorage
tota1 throughput • container (!'EU) • generalcargo~ons) • dry bulk (grain, sugar,fert.) • bulk liquids (tons)
• sea ships • inland ships
294,300,000
30,000 • deep sea ships 250,000 dry cargo
tankers
86,373 48,426
154,362 117,283
4,574,000 71,200,000 87,700,000
133,400,000
• coasta1 ships drycargo tankers
4,840,800
34 United Nations Conference on Trade and Development, Port Performance Indicators (Geneva: UNCTAD, 1976).
25
500 100
3,900 100
2,134,300 553,800
2,152,700
92,200 1,259,200
287,700 2,304,900

Characteristics portsof Rotterdam and Dar es Salaam
Charaderistics Port of Rotterdam Dar es Salaam port
turn roundtime (days) no information • deep sea general cargo 4.6
• deep sea tankers 3.3 • dry cargo coasters 2.3 • tanker coasters 2.3
Economie
value added by tota~ort complex by grain terminal (* mln . of 1987) f 9,909.1 U$ 1,500,000
economie activities • cargo transhipment and transit . cargo transhipment and transit . distribution (re-grouting, pro- . bagging of dry bulk cargo cessing, re-packmg, abelhng, pricing and testing to starage) . chemica! industry
contribution to GDP 1994 2.1% 1992/93 0.47%
various cammodities • imparts mach. & transp. equipm. 31.6% mach.& transp. equipm. 46.0%
food, beverages, tobacco 12.3% basic manufactures 16.3% chemieals & eh em. prod. 10.7% fuel 10.2% mineral fuels 8.6% chemieals 8.8% textiles 7.0% metals 5.5% metals & met. prod. 6.7% food 5.4% raw materials, oils, fats 4.7% other 7.8% other 11.4%
• exports mach. & transp. eluipm 23.8% coffee 25.9% food, beverages,to acco 20.5% cotton 23.6% chemieals & chem. prod. 15.9% sisal 1.4% mineral fuels 8.6% other 49.1% metals & met. prod. 6.2% textiles 4.8% other 20.2%
country of origin cammodities Germany 28.8% United Kingdom 16.2% • imparts Belgium/Luxembourg 14.2% West Germany 10.5% United Kingdom 8.6% Japan 10.5% France 7.9% Italy 8.5% United States 7.6% Sweden 3.8% Other 32.9% The Netherlands 3.5%
Other 47.0%
• exports Germany 28.8% West Germany 22.6% Belgium-Luxembourg 14.3% United KinÎdom 16.6% France 10.6% The Nether ands 6.9% United Kingdom 9.2% Singapore 5.9% Italy 6.4% Italy 5.2% Other 20.7% Japan 4.8%
Other 38.0%
26

Charaderistics
Organisational
ownership
employment
Functional
transit traffic (%)
destination transit traffic
Trends
sea shipping
cargo transhipment
value added
Characteristics ports of Rotterdam and Dar es Salaam
Port of Rotterdam
Port of Rotterdam is managed and operated by the municipal government. The state owns and maintains the maritime entrance and the connecting waterways. The local council appoints the rnanaging director. The town council owns the port's plots and basins. Investments for 0ry and wet port infrastructure are paid by Rotterdam Municipal Port Management (RMPM)/the town councll. The port infrastructure is rented or leased on base of long term contracts. RMPM exploits the traffic escort and nautic management. Transhipment conpanies are all private and are responsible for the costs of superstructure. Rents and harbour dues belong to the most important revenues.
Dar es Salaam port
THA is a state owned enterprise ~d J?.O private companit:s are actmg m the port, performmg port services, but Nectar. The Tanzanian government appoints the managing director in consultation with the board of directors. All infrastructure and superstructure is owned by THA and maintenance is of course for THA' s account. Where demand exceeds the available capacity of the grain terminals machinery, Nectar is responsible to arrange the needed equipment. Nectar also is responsible for the maintenance of all bulk and bagging machinery and equipment.
RMPM direct in Port of R' dam indirect
1,100 THA, in port 67,200 indirect
300,000
8,000 no information
excl. entrepot storage incl. entrepot storage
European Community Other European countries Other
53% 38%
48.3% 4.6%
47.1%
Zambia Zaïre, Burundi, Rwanda Malawi Uganda Zimbabwe
44%
71.6% 19.1% 7.9% 1.3% 0.1%
o expansion of world fleet o increase in scale of ships
o increase in container capacity
1989- 1993 o slight decrease dry bulk o increase liquid bulk o slight increase general cargo o increasing containerisation o slight decrease in ship calls
o increasing value added by Distrip~rt. Foodport and Chemieals Mamport
27
1989- 1992 o break bulk (grain and fertilizer)
stable, but peak from 1992, caused by emergency grain de-1iveries for World Food Program(WFP)
o strong increase ofliquid bulk (25%)
o almost doubling of container cargo
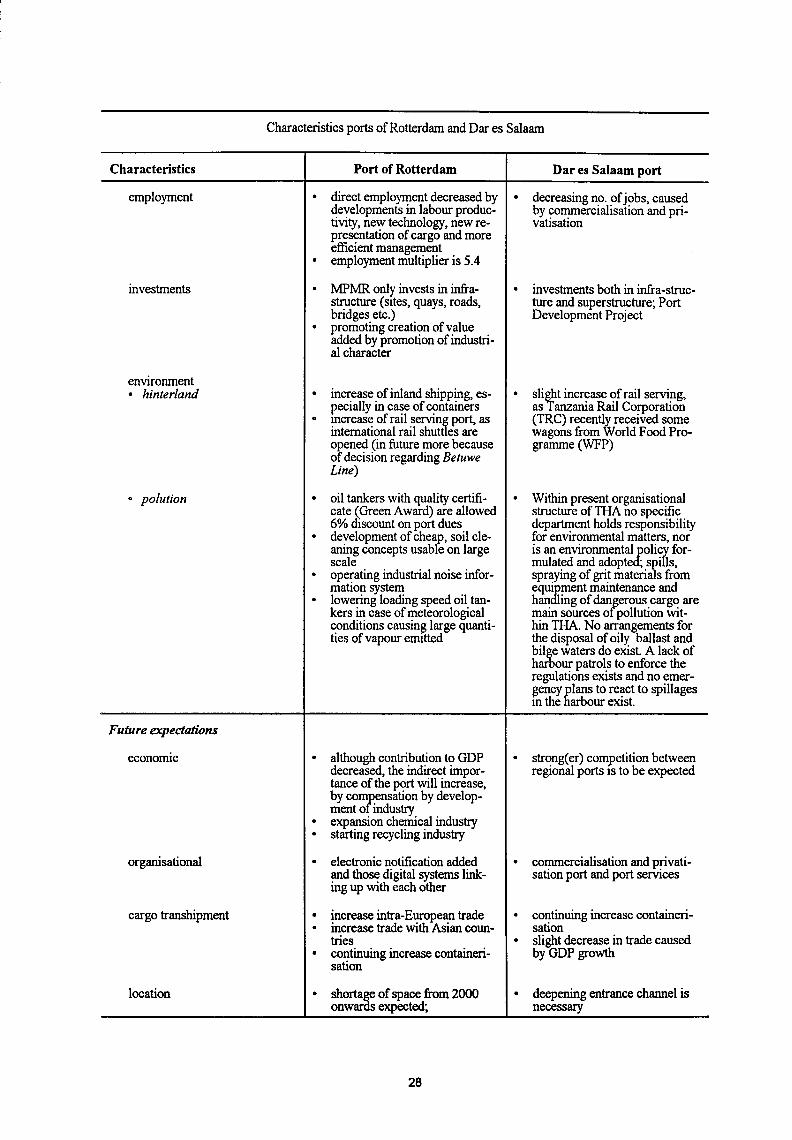
Characteristics portsof Rotterdam and Dar es Salaam
Characteristics Port of Rotterdam Dar es Salaam port
employment • direct employment decreased by . decreasing no. of jobs, caused developments in Iabour produc- by ~o~ercialisation and pri-tivity, new technology, new re- vausat10n presentation of cargo and more efficient management . employment multiplier is 5.4
investments . l\t1PMR only invests in infra- . investments both in infra-struc-structure (sttes, quays, roads, ture and superstructure; Port bridges etc.) Development Project
• promoting creation ofvalue added by promotion ofindustri-al character
environment . hinterland . increase of inland shipping, es- • sli~t increase of rail serving, pecially in case of containers as anzania Rail Corporation . mcrease of rail servin~ port, as (TRC) recently received some international rail shutt es are wagons from World Food Pro-opened (in future more because gramme (WFP) of decision regarding Betuwe Line)
• polution . oil tankers with quality certifi- . Within present organisational cate (Green Award) are allowed structure of THA no specific 6% discount on port dues department holds responsibility . development of cheap, soil cle- for environmental matters, nor aning concepts usabie on large is an environmentalJolicfi for-scale mulated and adopte ; s~i Is, . operating industrial noise infor- spraying of grit materia s from mation system equ~ment maintenance and . lowering loading speed oil tan- han ling of dan~erous cargo are kers in case of meteorological main sourees o pollution wit-conditions causing large quanti- hin THA. No arrangements for ties of vapour emttted the disposal of oily ballast and
bil~e waters do exist. A lack of har our patrols to enforce the regulations exists and no emer-gency Elans to react to spillages m the arbour exist.
Future expectations
economtc . although contribution to GDP . strong(er) competition between decreased, the indirect impor- regionat ports ts to be expected tance of the port will increase, by comfïensation by develop-ment o industry
• expansion chemica} industry . starting recycling industry
organisational • electrooie notification added • commercialisation and privati-and those digital systems link- sation port and port services ing up with each other
cargo transhipment • increase intra-European trade . continuing increase containeri-. increase trade with Asian coun- sation tri es • slight decrease in trade caused
• continuing increase containeri- by GDP growth sation
location • shortage of space from 2000 • deepening entrance channel is onwards expected; necessary
28
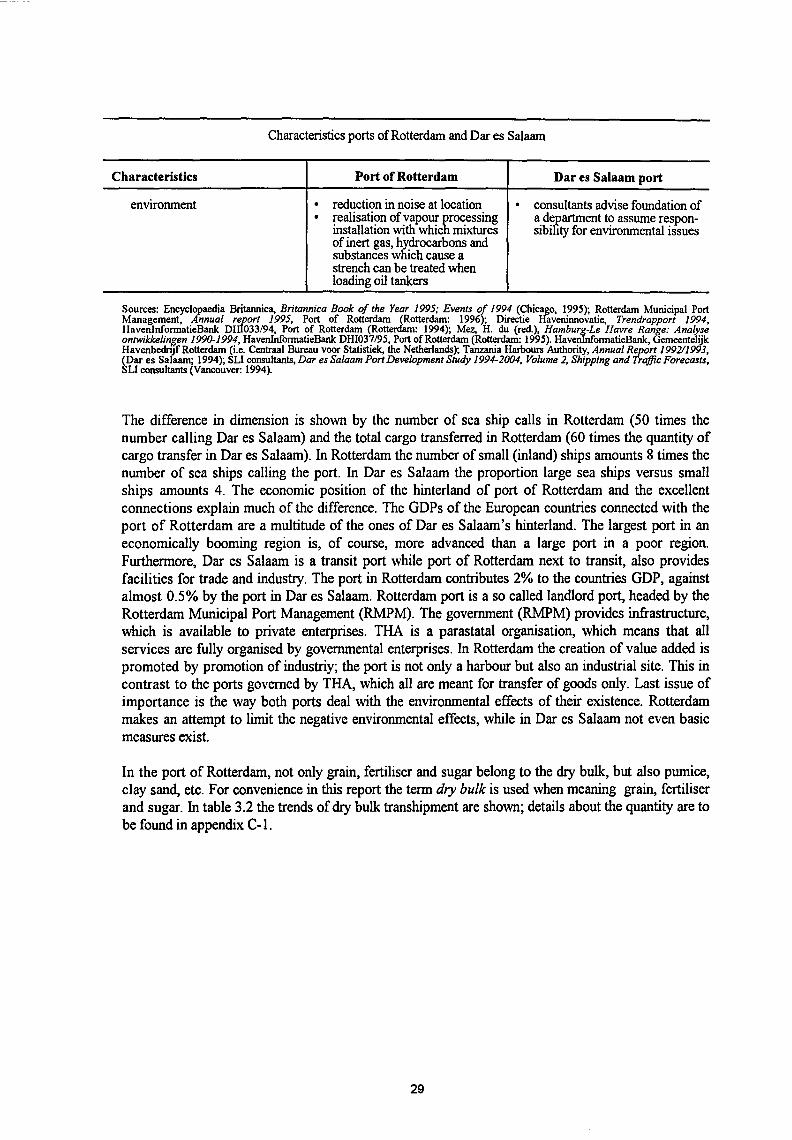
Charaderistics
environment
Characteristics portsof Rotterdam and Dar es Salaam
Port of Rotterdam
reduction in noise at location • realisation of vapour processing
instanation with which mixtures of inert gas, hydrocarbons and substances which cause a strench can be treated when toading oil tankers
Dar es Salaam port
• consultants advise foundation of a department to assume responsibility for environmental issues
Sources: Encyclopaedia Britannica, Britannica Book of the Year 1995; Events of 1994 (Chicago, 1995); Rotterdam Municipal Port Management, Annual report 1995, Port of Rotterdam (Rotterdam: 1996); Directie Haveninnovatie, Trendrapport 1994, HaveninformatieBank DHI033/94, Port of Rotterdam (Rotterdam: 1994); Mez, H. du (red.), Hamburg-Le Havre Range: Analyse ontwikkelingen 1990-1994, HaveninformatieBank DHI037/95, Port of Rotterdam (Rotterdam: 1995). HavenlnformatieBank, Gemeentelijk Havenbedrijf Rotterdam (i.e. Centraal Bureau voor Statistiek, the Netherlands); Tanzania Harbours Authority, Annual Report 1992/1993, (Dar es Salaam; 1994); SU consultants, Dar es Salaam Port Development Study 1994-2004, Volume 2, Shipping and Traffic Forecasts, SLI consultants (Vancouver: 1994).
The difference in dimension is shown by the nwnber of sea ship calls in Rotterdam (50 times the nwnber calling Dar es Salaam) and the total cargo transferred in Rotterdam (60 times the quantity of cargo transfer in Dar es Salaam). In Rotterdam the nwnber of small (inland) ships amounts 8 times the nwnber of sea ships calling the port. In Dar es Salaam the proportion large sea ships versus small ships amounts 4. The economie position of the hinterland of port of Rotterdam and the excellent connections explain much of the difference. The GDPs of the European countries connected with the port of Rotterdam are a multitude of the ones of Dar es Salaam's hinterland. The largest port in an economically booming region is, of course, more advanced than a large port in a poor region. Furthermore, Dar es Salaam is a transit port while port of Rotterdam next to transit, also provides facilities fortrade and industry. The port in Rotterdam contributes 2% to the countries GDP, against almost 0.5% by the port in Dar es Salaam. Rotterdam port is aso called landlord port, headed by the Rotterdam Municipal Port Management (RMPM). The government (RMPM) provides infrastructure, which is available to private enterprises. THA is a parastatal organisation, which means that all services are fully organised by governmental enterprises. In Rotterdam the creation of value added is promoted by promotion of industriy; the port is not only a harbeur but also an industrial site. This in contrast to the ports govemed by THA, which all are meant for transfer of goods only. Last issue of importance is the way both ports deal with the environmental effects of their existence. Rotterdam makes an attempt to limit the negative environmental effects, while in Dar es Salaam not even basic measures exist.
In the port of Rotterdam, not only grain, fertiliser and sugar belong to the dry bulk, but also pwnice, clay sand, etc. For convenience in this report the term dry bulk is used when meaning grain, fertiliser and sugar. In table 3.2 the trends of dry bulk transhipment are shown; details about the quantity are to be found in appendix C-1.
29

Table 3.2
Trends dry bulk in portsof Rotterdam and Dar es Salaam
Trends in Rotterdam
• improving position in Europe
• decreasing transhipment
Trends at THA
• increase import of grains
• slight increase of fertilizer
Cause
• Iarger ships, which have a deeper draft, so the possible ports to caii. beco~e. more limited. Also, port of Rotterdam is cheapest ophon as 1t IS a sea port
• satisfaction human consumption European agriculture policy: smaiier live stock, import duties on foreign grains
Cause
• most grains are imported by the World Food Program (WFP) and sent to the refugee camps near the border or to neighbouring countries
• used primarily in Tanzania, Zambia, Malawi and Burundi; caused by increase of food production
3.2 DRY BULK HANDLING: BENCH MARK ORGANISATION
Most bulk shipping in Europe is done by tramp shipping: shipping of cargo overseas between ports and on conditions which are agreed in a charter party. This means unregular transport without a fixed route. Grain and other free flowing commodities are almost only shipped by tramp shipping. As only the procedures regarding handling of eertaio free flowing commodities are of interest for this research, only tramping procedures are described. Many doeurneuts are involved, which are described in appendix C-2. As this appendix is made on a fold out sheet, the descriptions can easily be hold next to the text.
Handling inward cargo
A shipbroker's office daily receives a shipping listwithall ships to be expected soon. The shipbroker sends a notification to the harbour service35
, with facts about the ship, it's draft, berth and the kind of cargo. Before arrival, the shipbroker receives the manifest, bill of lading, stowage plan and hatchlist, as well as a specification of the dangerous cargo and the expected time of arrival. The shipbroker sends a message to the harbour co-ordination centre (HCC)36
• HCC and customs give ship and cargo permission toenter the port when nothing is inconsistent with admittance. For the stevedoor it is often hardly possible to reserve a mooring place in advance; the berth is most often only known just before arrival. The shipbroker's operational department has to contact several organisations before the ship can enter. Of course the stevedoor has to be contacted about the expected time of arrival and the expected time of sailing, which is the ship' s ultimate time of departure.
" Harbeur service is a department ofRMPM. The harbeur master is the head ofthe harbeur service. Tasks which belong to department are allocation of herthing places to ships and preserve orderand safety.
36 HCC is a department ofRMPM which co-ordinates the shipping traffic in Port of Rotterdam.
30

Once the ship is approaching the Nieuwe Waterweg, the captain announces the expected time of arrival via Scheveningen Radio to Koninklijke Scheepsagentuur Dirkzwagerl7
• Dirkzwager notities HCC of the arrival of the ship and HCC informs the customs, Pilot Maas, tug service, boatman association and the river police. Customs notities immigration ofticers.
Custom officers enter the ship after berthing, but in case of some other commodities, custom officers enter the ship at the Nieuwe Waterweg, performing the checks against documents while the ship is still sailing. Clearence of the cargo means checking documents which contain information about the load. In case of dangerous cargo aboard, this has to he mentioned to HCC and the tonnage has to he declared. After agreement those documents are signed by the customs and the ship.
Pilot Maas sends a river pilot to the ship. The harbour service also sends a port pilot. The river pilot boards just before entering the Nieuwe Waterweg, the port pilot, with help of tug service, takes over to berth. River pilots as well as port pilots were in the past employed by either government and local authority but since 1988 both groups are privatised. Tug service helps the ship manoeuvre in the port and the boatmen make sure that the ship is berthed at the right place, cable and uncable the ship. Immigration officers and people who do the environment and safety check, enter the ship after berthing. Only when a problem is identitied before berthing, so the procedures will take some time, the officers board the ship before it enters the port, so the problems can he solved while the tug and pilot services manoeuvre the ship to the quay. A boarding clerk38 boards the ship. The river police checks the crew and any possible passengers. In case of dangerous cargo aboard, this had to he mentioned to HCC before arrival, and the tonnage has to he declared. The cargo is controlled by surveyors under the authority of the receiver. The veterinary services check the quality when the cargo is meant for life animals. When all formalities are fultilled, the stevedoor has to accept the work. When the stevedoor does not trust the quality of the commodity, he has to send a controller as well. The cargo also is controlled by surveyors under the authority of the receiver.
Before ship arrival the overseas agent sends the shipbroker a manifest and a copy of the Bill of Lading. Those documents are the basis ofthe Notify Address (3 copies), Freight List (lcopy), Unloading List and Freight Note. Copies of the Notify Address are sent to the notify party and the consignee. Both the notify address and the consignee have to inform the shipbroker about the name of the receiver. The Freight List is sent to the boarding officer, maritime customs and pilots. One ofthe Unloading Listsis sent to the stevedoor, who compiles an Outturn Report on basis ofthis document. This Outturn Report is daily updated and the shipbroker sends this to the ship owner.
The Freight Note is sent to the receiver, who, after paying the hili, exchanges the original Bill of Lading for a Notify Address. The Bill of Lading is stamped, so it can not he traded anymore, and sent to the overseas agent, where it is filed. After arrival ofthe goods, the Notify Address is exchanged for the cargo, after payment of charges.
In the port of Rotterdam, many stevedoring companies operate, each of them is responsible for their own activities. A visit to European Bulk Services (EBS), the largest stevedoor specialised in diy bulk cargo, made clear how this stevedoor handles agribulk, the type of commodities which corresponds to the bulk handled by the grain terminal in Dar es Salaam. The equipment of the terminal where agribulk is transhipped can he found in box 3.1. In case ofneed, equipment from other EBS-owned terminals can he brought over, but this will hardly ever happen.
31 Koninklijke Scheepsagentuur Dirkzwager, briefly Dirkzwager, registeres all incoming and outgoing ships.
31 In tramp shipping a boarding clerk is responsible for the clearence of goods (either inwards and outwards) and he keeps contact with the ship's agent Clearance of goods is the responsibility ofthe ship's authority and the customs; the shipbroker manages the agent's affairs; so the boarding clerk assists the captain with the customs formalities on hebalf ofthe ship broker. Arranging busbandry matters for the ship's company also belongs to the tasks.
31
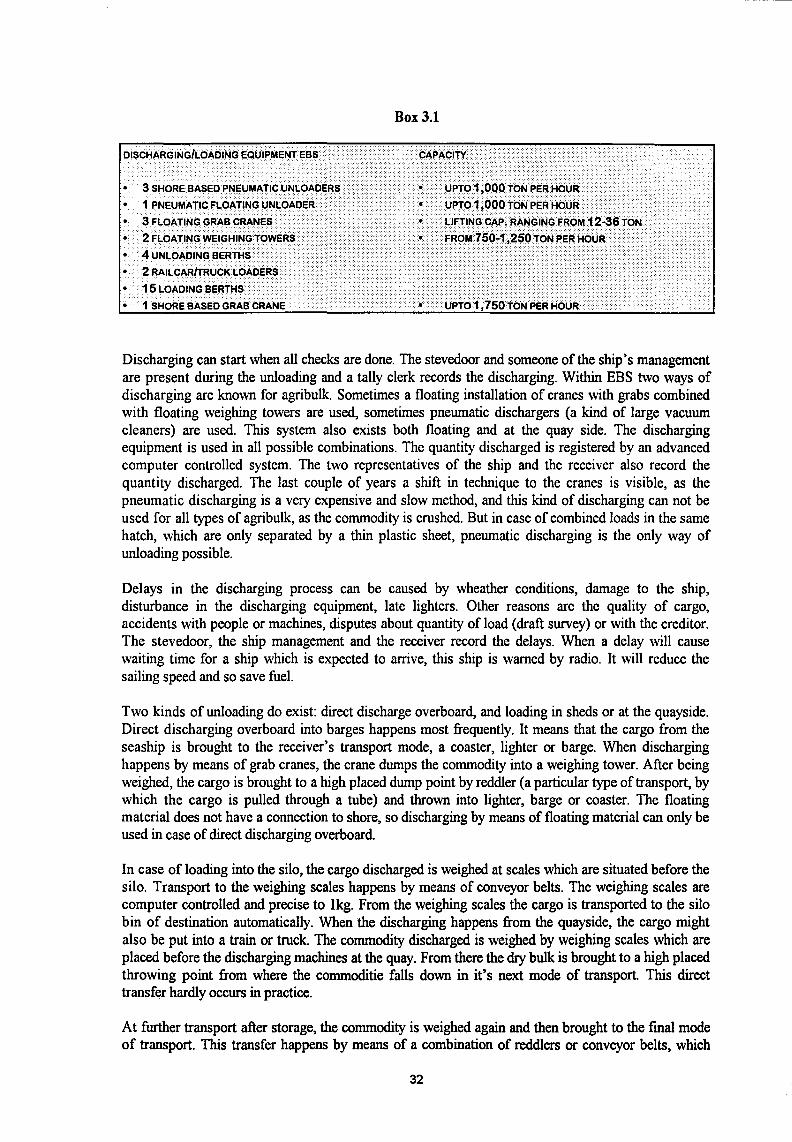
Box3.1
OISëHARGUIIG/LOADING EQlJIPMENT ËBS ... ···•··· ..... · ·•·•· · .. ·.·•· ·.· ... · êAPAêiÎ:Y > · .... ":<::··· .. ·. :::::::::::>>: :. ·· .. ··:.·: ... :;.:._:_:·_·:· .. ·. :>.:·.:.:._::_:_ .. ·::::::.:::::::::::::.::::::::· .. ·:.·
• 3 SHORE BASED;~EUMATIC.UNLOADERS••• /·······••••••··•···•·• • 1 PNEUMATICFLOÀTINGÛNl.OADER <··
• •••••••••••••• UPT01,~·~0 •• TON.PER.HO~~·····. ·· • ··• ·•··•·· ül'l-o'1,ooó'TC>N f,E:k ~ooR·> .· ..
• 3FLOATINGGRABCRANES ···•·•····· • ···.2fl.oA~ING~EIG~I~GTOWERS > > .. ·
LIFTING c.t~.f>. RANGING ~ROM 1246 TON •... • ..... . ·.· ..• H FRor47so~t.25oroNPER~~~R .···
••••••••••••••••••••••••••••••••••••••••••••••••••••••••••••••••••••••••••••••••••••••••••••••••••••••••••••••••••••••••••••••••••••••••••••••••••••••••••••••••••••••••••••••• • •• ••
.. •·•·•• •••••••••••••• UPT0•1•,.750 •• TON••iER.HbUR····························
. . . ..
• 2 RAILCAR/TRUCK LÖ~D~~S ····• • 15 LOADING BERTHS . . .
• 1 SHORE BASED GRAS CRÁNE
Discharging can start when all checks are done. The stevedoor and someone of the ship' s management are present during the unicading and a tally clerk records the discharging. Within EBS two ways of discharging are known for agribulk. Sametimes a floating installation of eranes with grabs combined with floating weighing tewers are used, sametimes pneumatic dischargers (a kind of large vacuum cleaners) are used. This system also exists both floating and at the quay side. The discharging equipment is used in all possible combinations. The quantity discharged is registered by an advanced computer controlled system. The two representatives of the ship and the receiver also record the quantity discharged. The last couple of years a shift in technique to the eranes is visible, as the pneumatic discharging is a very expensive and slow method, and this kind of discharging can not be used for all types of agribulk, as the commodity is crushed. But in case of combined leads in the same hatch, which are only separated by a thin plastic sheet, pneumatic discharging is the only way of unicading possible.
Delays in the discharging process can be caused by wheather conditions, damage to the ship, disturbance in the discharging equipment, late lighters. Other reasens are the quality of cargo, accidents with people or machines, disputes about quantity of lead (draft survey) or with the creditor. The stevedoor, the ship management and the receiver record the delays. When a delay will cause waiting time for a ship which is expected to arrive, this ship is warned by radio. It will reduce the sailing speed and so save fuel.
Two kinds of unicading do exist: direct discharge overboard, and loading in sheds or at the quayside. Direct discharging overboard into barges happens most frequently. It means that the cargo from the seaship is brought to the receiver's transport mode, a coaster, lighter or barge. When discharging happens by means of grab cranes, the crane dumps the commodity into a weighing tower. After being weighed, the cargo is brought toa high placed dump point by reddier (a particular type of transport, by which the cargo is pulled through a tube) and thrown into lighter, barge or coaster. The floating material does not have a conneetion to shore, so discharging by means of floating material can only be used in case of direct discharging overboard.
In case of loading into the silo, the cargo discharged is weighed at scales which are situated befere the silo. Transport to the weighing scales happens by means of conveyor beits. The weighing scales are computer controlled and precise to lkg. From the weighing scales the cargo is transported to the silo bin of destination automatically. When the discharging happens from the quayside, the cargo might also be put into a train or truck. The commodity discharged is weighed by weighing scales which are placed befere the discharging machines at the quay. From there the dry bulk is brought to a high placed throwing point from where the cernmoditie falls down in it's next mode of transport. This direct transfer hardly occurs in practice.
At further transport after storage, the commodity is weighed again and then brought to the fmal mode of transport. This transfer happens by means of a combination of reddlers or conveyor beits, which
32
transport the cargo to a high placed throwing point from which it falls down into the transport mode, most aften a lighter or coaster, sametimes a train and vety seldom a truck. In case of dumping in a train, the throwing point is fixed and the (computer controlled) locomotive moves the next wagon under the dumping place. So, delivety happens S)1lchronically with discharging from storage.
When the agribulk is for transit, the forwarding agent is responsible for further transport. The bulk might nat have a destination yet, so it has to be stared in the port. The transport from the port is most aften organised by the receiver and sametimes by the seller.
The ship broker has to see that no cargo is delivered without the receiver having shown the relevant document. After collection of the arrival notice at the shipbroker, the receiver sets out for customs, to deelare the document. This means that the document is provided with a number and the import duties and any possible excise taxes are to be paid. The receiver may collect his cargo if the document agrees with the facts written in the cargo list, the goods are debited from the cargo list and the receiver takes delivety of the goods in exchange of the arrival notice.
Handling outward cargo
When the forwardingagent hooks a laad, a Certificate ofLoading (6 copies), a Booking List (2 copies) and a Loading List (3 copies) are prepared. One copy of each document is filed by the forwarding agent. The copies of the Loading list are sent to the stevedoor and the ship. The copy of the Booking List is for the shipowner. When the stevedoor accepts the cargo, a copy ofthe Certificate ofLoading is signed and filed by the forwarding agent. The shipbroker checks the cargo and signs a copy of the Certificate of Loading. After loading of the cargo, the three other copies are signed by the ship' representative. One is for the shipbroker and is used for inspeetion of the cargo. Another copy serves as a receipt for the ship and the last one is for the stevedoor. After receiving the Notice of Readiness, the loading can start.
When the cargo is hooked, a Billof Lading (5 copies) is compiled, stamped and numbered. One copy is used to compile a Cargo Manifest (4 copies), another copy is used to calculate the freight rate and to compile the Freight Manifest, which is sent to the overseas agent. The original Bill of Lading and two copies, to one the ship broker's Certificate ofLoading is attached are sent to the agent.
The copies of the Cargo Manifest are signed by the ship's representative, whofiles one copy, an other copy is filed by the forwarding agent, and the last two copies are sent to the ship owner and the overseas agent.
Storage, forwarding, etc. belang to the responsibilities of the companies chosen by the ship's agent. RMPM does not mix in this business. Ship arrival procedures are similar to the ones described above. After ship arrival, all custom checks have to be done. The quantity of cargo loaded has to correspond with the Manifest. Most aften, the cargo to be transhipped is transported to the port befare ship arrival. Starage most aften happens in silos, but if those are full, the commodity is put into barges. The quantity is registered by the automised starage and unloading equipment and by the agent's representative. To clear the ship and the cargo, the ship's agent has to proveto the customs that the ship has export right and a destination. The customs of the country in which the goods are imported send a message to the customs in the port, to make sure that no goods get 'lost'.
Loading of sea ships is most aften done out of the silo storage. The ship is berthed and the cargo is weighed with the same weighing scales as used with discharging. Then it is, with conveyor beits, brought to throwing points and from there dumped in the hatches. A representative of the buyer controls the loading process and the quantity loaded and takes a sample of the cargo for the receiver. When the loading is done from coasters or lighters, floating grab eranes are used, which dump the
33

commodity in the floating weighing tower. From there it is brought to a high place of throwing, from where it falls into the sea ship. Like during imports, all kind of combinations of equipment are used to load a ship. After finishing the loading, the ship can depart as soon as the port pilots have boarded.
3.3 DRY BULK HANDLING: THA-GRAIN TERMINAL
Destription of the grain terminal
The grain terminal's activities are discharging, the bagging of bulk cammodities either in the terminal and at the quayside and storage of the cargo. The silo camprises two receiving lines and two discharging lines, all of a capacity of 125 mt per hour. There are three mobile bagging lines with automatic weighing and sewing capacity of 40 mt per hour, ten trucks (DAF), a central truck toading point and a truck weighing bridge. In 1989, the grain terminal was built with help from the Dutch government. The storage capacity ofthe silo is 30,000 metric tons (mt) and consists of24 main and 14 interstice bins. Each cellis self contained. The shed next to the silo can hold 1500 mt ofbagged grain. Adjacent to the silo, a bagging plant is built, but this plant has been out of order for a coup Ie of years now.
Between 1992 and 1993 an average of 110,000 mt of grain was handled by the terminal ofwhich 55% was for the dornestic and 45% was for neighbouring landlocked countries. From the forms to be found in appendix C-3 (silo operations and operations of bulk cargo bagged by THA/Nectar) it becomes clear that grain is the main commodity handled by the terminal, the last couple of years no sugar bas been transhipped via this terminal and a maximum of 20% fertiliser on yearly basis. In 1995 no fertiliser has been transhipped at all.
Handling inward cargo
Every day the port management receives a daily shipping list. Before ship arrival the ship's agent Nasaco informs the portabout the date the ship will call the port. Nasaco sends the Billof Lading, the Manifest, the stowage plan and betonging batch list, a dangerous cargo list, a list with all heavy lift cargo and a break-down of the cargo country by country to the port. A copy of the Bill of Lading is sent to the owner of the goods or his forwarding agent, who has to pay freight rates.
When the ship arrives at the port, it bas to await daylight and the right tide. Especially large ships can only be handled at certain times because of the port's narrow and undeep entrance channel. At the right tide the pilots board the ship and with help of tugs the ship is guided through the channel to the planned berth. At the berth the ship awaits the boarding officers, i.e. custom officers, immigration officers and health officers. The boarding officers check the documents and when this is done the discharging may start, as Nasacosent a Notice ofReadiness. Ifthis Notice is not received, discharging officially can not start. In practice, this notice is often received very late and Nectar starts discharging without this notice.
The ship's agent sends a copy ofthe Billof Lading to the owner ofthe goods. The owner ofthe goods visits the ship's agent with the Bill of Lading and payment of the freight rates is checked. Then the forwarding agent goes to the Customs to fulfill the customs formalities and import entry and receives a declaration and disposal order (D&DO). These documents are sent to THA Revenue Office, for payment of port dues, where payment of port charges fmds place. Then the D&DO is sent to the central documentation office, which matches the document with the ship 's Manifest. One copy of the document is filed, another is given to the forwarding agent and the third is sent to the Delivery Office.
34

At the delivery office, the agent surrenders the D&DO fora Gate Pass, after signing the D&DO, to confrrm that he has received the goods. Then the port can be left.
As soon as the ship has arrived, the weight of the cargo is checked by measuring the draft of the ship. This is done by a draft surveyor, appointed by the ship owner. In case of grain and sugar imports, a representative of the Food Department of the Ministl)' of Agriculture inspects the quality. In case of fertiliser, the Ministl)' of Agriculture inspects the quality of the cargo. A custom's officer should be present during the discharging but in practice is not. Times of delays and it's causes are noted by a representative of Nasaco and by Nectar, the bagging company. As Nasaco's representatives are only working during the day hours, the notes of Nectar are copied the next day. After fmishing the unloading, the draft surveyor measures the draft of the ship again and the difference between the drafis befare and after discharging indicates the weight of the cargo unloaded. After the discharging the ship has to wait for daylight and the right tide. The pilots and the tugs lead the vessel through the channel and the ship can depart. An overview of the discharging is shown in tigure 3.1.
Figure 3.1
Overview of discharging process
c @-rn'-_l_-+--===-r=====--.-i
~e====---___j
TRANSPORT
BYROAD
OR RAIL
ttanspott by tru bagging
crane with gtab
DAFtruck S sttainer
The discharging of the grain is done by eranes with grabs. During discharging a tally clerk verities the quantity of cargo received against the ship's Manifest. The grain terminal does not possess eranes but uses the ones owned by the general cargo terminal. The number of eranes operated during discharging depends on the ship, but if possible three eranes are used. Depending on the contract concluded, a part of the grain is bagged at the quay while an other part will stay bulk. The grain bagged at the quay is brought from the ship's hold to the hopper (a funnel) of one of the three bagging plants. Bagging is done in movable plants, which register the number of bags and their weight automatically. Although the number of bags produced should be counted during the bagging operation, in practice the tigure at the machine, which also counts the number of bags, is read and registered. Every one hour a couple of bags are weighed manually, to check wether the balance ofthe plant is still correct. The bagged grain is loaded on the trailer by manpower, full trailers are temporarily stared in a shed. The grain terminal disposes one shed. When this one is full, other sheds, further from the quay side, have to be found and permis si on for storage has to be arranged. The fmal mode of transport depends on the destination of
35

the grain; when it is meant for foreign countries the transport will he done by rail. As the grain terminal is not served by one of the railway systems, all cargo is loaded on trailers. If the cargo is meant for a foreign country and wagons are available, the cargo will he transferred from the trailer to the wagons. Grain meant for Tanzania is transported by trucks. The remaval of the cargo is the business of the importer. Nectar works out all datacollectedat the end of each ship handled. So does THA, but very aften the figures collected by Nectar are used for the TRA-reports.
The cargo which at the moment has to stay as bulk is put into hoppers by grabs. Trucks undemeath the hoppers collect it. The full trucks drive to the weighbridge near the silo, where the weight of the cargo is registered. If the grain is to he stared in the silo, the trucks bring their cargo to the dump pit, from where it is automatically stared in one of the compartments. In case of direct delivery, the starage in the silo will he left out. The grain stared in the silo might he transported as bulk or he bagged later on. The bagging plant of the silo should he used to bag the stared grain, but as it has been out of order for the last few years, the movable bagging plants are used. In addition, the movable plants are cheaper in use than the one adjecent to the silo.
No figures are available conceming the average starage time in the silo. Officially, the frrst 10 days starage after fmishing the discharging are free of charge. With World Food Program (WFP) a free starage period of 60 days is agreed. From then on a fee is charged ofUS$1.- per mt per day. In practice THA doesnotcharge for the silo facility and especially WFP stores it's grains for long periods.
F or the administration of the grain terminal, the weight loaded in and discharged from the silo is calculated by clerks who note the figures on a form and calculate the difference. The operatien officer uses the figures to fill in the Daily Report on Silo Operatiens and the Silo Cargo Plan, to keep in touch with the quantity of grain in the silo. The last two forms are filed in the operatien officer's office.
Handling outward cargo
In practice no dry bulk cammodities are exported via Dar es Salaam port. Bagged cammodities are shipped via the general cargo terminal, so the grain terminal does not deal with exports of grain, nor with the documentation. However, the grain terminal terminal's procedures are the same as those ofthe general cargo terminal, as the grain terminal is a more or less independent part of that terminal. The described goods flow and betonging documentation are deduced from the general cargo terminal procedures.
Befare outward cargo will be received by the port, Nasaco sends a letter to THA export office with a general description of each shipment of cargo, the shipping order number, weight of shipment, name and expected time of arrival of the vessel, the country of origin and port and country of destination. The export office prepares an Export Acceptance and Shipment form (EAS) on basis ofthis letter,just prior to the receipt or toading of the cargo to the ship, a Loading List is compiled by the export office as well. The Loading List and the EAS-forms and copies of the Shipping Order are forwarded to the records clerk, responsible for the grain terminal. The records clerk issues the EAS farm to the tally clerk, who is assigned to record the cargo receipt and loading. All port charges for outwards cargo must he paid in advance of the receipt and loading. After completion of toading of cargo to the ship, the records clerk presents the Shipping Orders and EAS farms to the vessel and obtains the captain's signature for receipt of the cargo which has been loaded. The export office uses the Shipping Order and EAS form to prepare an Outturn Report, of which copies are issued to customs, Nasaco and the THA revenue office as confrrmation of the quantity and condition of cargo which was actually loaded.
As soon as the cargo is received at the port, it will he inspected by customs and then he stared in the terminal, where it awaits the ship' s arrival. When the ship has arrived and all formalities are fulfilled, the cargo is brought to the quay side and loaded in the vessel.
36

When the ship has arrived and the fonnalities are passed (see inwards cargo), the loading can start. The bulk cargo will be discharged from the silo, dumped in trucks which are weighed at the weighing bridge and drive to the quay side. Grab eranes will transfer the cargo and after completion of the loading, the ship has to await daylight and the right tide, before pilots board and the ship departs.
3.4 ANALYSIS DRY BULK HANDLING BENCH MARK ORGANISATION AND THA
In table 3.3 all differences and similarities regarding handling of dry bulk cargo in the ports of Rotterdam and Dar es Salaam are summarised.
ship arrival
discharging and storage inward cargo
Table3.3
Dry bulk handling in portsof Rotterdam and Dar es Salaam differences and similarities
Port of Rotterdam
• no entering restrictions • in case of delays which influence
next ship, this ship is wamed by radio; fuel can be saved by reducmg speed
• ptlots enter ship when still sailing customs and other officials enter after herthing
• veterinary service (in case of grain) and river police enter after herthing
• discharging may start after receipt of Notice ofReadmess
• discharging, bagging and storage by private stevedoor
• grab eranes preferred, only when needed, pneumatic discharging eranes partly computer controlled bagging happens iûter storage, just before delivery
• weighing happens automatically
• from discharging, further transport happens automatically; either to silo or next transport mode; terminal is rail served
• transport from silo to next transport mode happens automatically; the cargo is weighed again
• process is capita! intensive rather than Iabour intensive
• enough storage space for dry bulk available; either m silo's or barges
37
Dar es Salaam port
await right tide in conneetion with depth entrance channel
• await daylight in conneetion with working hours pilots
• customs and other officials enter after herthing
• custom officers and health officers (in case of grain) and immigration officers enter after herthing
• discharging should only start after receipt of Notice of Readiness, but often starts without this notice
• discharging and bagging co-ordinated by private stevedoor, silo owned byTHA
• grab eranes
• eranes controlled by manpower bagging happens at quay side, direct after discharging
• weighing happens straight after bagging or before storage in silo
• transport to silo by trucks, straight delivery happens very seldom
• discharging from silo by dumping cargo in trucks, in case of rail wagons, transfer from truck to wagon needed
• process is Iabour intensive, labourers are given incentives for their performance
• enough storage space for bulk car~o, grain terminal itself has not enough space for storage ofbagged cargo. other sheds have to be found and permission to use them

documentation inward carg\o
storage and toading outward cargo
documentation outward cargo
departure
Dry bulk handling in portsof Rotterdam and Dar es Salaam differences and similarities
Port of Rotterdam
• Manifest and Bill of Lading are basis for port porcedures, Freight Noteis document which can be surrendered against Notify Address. After payment of freight rates, duties and taxes, it can be exchanged for goods
• there is outward cargo outward cargo mostly bulk starage in silo befare loading custom check befare loading
• discharging and weighing at once automised transport to next mode of transport ( conveyor belt, etc.)
• loading may start after receipt of Notice ofReadiness
• cargo dumped from belt into ship
• Booking List and Loading List are sent to prepared by forwarding agent
• Certificate of Loading is given by customs
• Outturn Report
• no limitations • departure with pilots aboard
Dar es Salaam port
• Manifest and Bill of Lading used to prepare document (D&DO), which, after payment of freight rates, duties and taxes, can be surrendered Gate Pass. After arrival, Gate Pass can be exchanged for goods
• currently no outward cargo outward cargo would be bulk only starage in silo befare loading customs check befare loading
• weighing cargo after discharging transport silo to quay by trucks
• toading may start after receipt of Notice of Readiness
o loading by grab eranes
• facts send by Nasaco are same facts as mentioned on Booking List and Loading List in Rotterdam
• Export Acceptence and Shipping (EAS) form 1s given by customs (in fact Certificate of Loading) Outturn Report is sameasin Rotterdam
• await daylight await right tide
• departure with pilots aboard
In Dar es Salaam, between ship arrival and the frrst grab of discharging much time is lost due to waiting time for the right tide and day light and procedures which only startafter berthing. The frrst two causes can not he helped ovemight, but the procedures could start when the ship is waiting for the right tide, so discharging could start immediately after berthing. In both ports discharging may only start after receipt of a Notice of Readiness, given by the ship's agent. Discharging by grab eranes is common, although in Rotterdam sometimes pneumatic machines are used. The transport of bulk cargo from the ship to the silo or next mode of transport in Rotterdam happens by conveyor beits and reddlers, while in Dar es Salaam trucks are used. In Dar es Salaam, bagging happens at the quay side, straight after discharging and after silage, while in Rotterdam the cargo is only bagged after storage. In Rotterdam the discharging process is largely automised, while in Dar es Salaam many workers are involved. Both terminals have at their disposal enough silo space. In Dar es Salaam, the grain terminal management in practice does not charge the users for silo space. The bagged bulk is stored in sheds and the terminal's capacity to store bagged bulk is limited. Other sheds, probably far from the quay side, have to he found and permission for storage has to he arranged. In practice no outward good flows of dry bulk cargo exists in Dar es Salaam, so the described procedures are not real. Most facts are deduced from the general cargo procedures. No remarks have to he made regarding ship departure.
The documentation flow in both ports hardly differs: under other names, the same documents are prepared. The documentation procedures of the grain terminal are simpte and work effectively. But the documentation and information is being operated manually, so the procedures are Iabour intensive and time consuming.
The slow removal of bagged oommodities causes congestion in the port. The cargo is stored in sheds betonging to the general cargo terminal, where it blocks these sheds. Although the congestion is not caused by THA, the consequences are for the port.
38

3.5 PERFORMANCE INDICATORS
According to a report of the United Nations Conference on Trade and Development (UNCTAD), congestion is mostly not caused by the ports but by more cargo coming into the port area than goes out for a long time. 39 Causes of the congestion are inadequate transport, delays caused by Customs and govemment departments, lack of adequate warehousing facilities outside the port area and importers' financial problems. Although port authorities are not responsible for collecting cargo from their ports but the importers, it does benefit the port to encourage a smooth flow of cargo. Congestion in a port causes problems as the working space in sheds and open storage areas becomes limited. The sheds will be overstawed which causes a risk to damage the cargo and mechanica! equipment can not move freely anymore. This results in delay of loading or unloading which affects the turn-round time. Port performance indicators can be used to measure and compare the efficiency of various aspects of the port's operation. They should provide insight toport managementinto the operation ofkey areas and, therefore, they should be easy to calculate and simple to understand. Performance indicators can be used to compare the real performance with the target and to detect a trend in the port's performance. All inputs in a process (land, capita! and Iabour) should be set out in standards in such a way that the relation between input and output (i.e. productivity) becomes clear. As a port authority deals with the overall responsibility for the functioning of the port, a well-balanced set of performance indicators will help to collect the right data in stead of collecting a lot of superfluous data.
Performance indicators of the United Nations
According to the UNCTAD40 a set of indicators should exist for each category of cargo since the port provides different facilities according to the way cargo is handled. The suggested cargo categones are break-bulk general (or conventional) cargo, unitized cargo, liquid bulk and dry bulk like ore, grain, cement and fertilizer. Two kind of performance indicators are to be distinguished: the fmancial and the operational ones.
The jinancial performance indicators only take into account the costs and revenues associated with the transfer of cargo to or from ships in the calculation of the various indicators. Thus cost and revenue generated from the transit storage and warehousing function and from the delivery and receipt of cargo via these storage areas are excluded. This decision is based on the fact that cargo handling to or from vessels takes place during a well-defmed period of time, the time when the ship is at berth, while for the same ship the delivery of discharged cargo from storage areas within the port can extend over a period of months. Thus a separate group of indicators should be developed for the transit storage and warehousing areas that are not linked to the particular ship eaU. The port area should be divided into berth groups which are areas or sub-areas, each handling a different cargo class. The important elements per berth group are: • ship revenue related to the berth group • cargo revenue related to the cargo handling; services of the berth group • Iabour costs • capita! equipment costs The ship revenue originates from berth occupancy charges or port dues.
An extremely important indicator, financially as wellas operationally, is the monthly volume of cargo handled. The following indicators should he calculated each month for the ships sailing from each berth group:
,. United Nations Conference on Trade and Development, Manual on a uniform system of port stafistics and performance indicators (Geneva: UNCTAD, 1983, p. 8.13).
"' United Nations Conference on Trade and Development, Port Performance Indicators (Geneva: UNCTAD, 1976, p.3).
39

Table 3.4
Financial port performance indicators
Financial Port Performance Indicator
total tonnage worleed
berth occupancy revenueperton of cargo
cargo handling revenueperton of cargo
Iabour expenditure per ton of cargo
capita/ equipment expenditure per ton of cargo
total contribution
contri bution per ton of cargo
Definition
total tonnage worked in a certain period (a year)
total berth occupancy revenue produced, divided by tonnage worked used definition: harbour dues divided by tonnage worleed
total revenue produced from transferring cargo to or from ships, from or to storage areas, divided by tonnage worked used definition: total operating income divided by tonnage
worleed
total direct Iabour expenditure for transfer of cargo to or from ships, from or to storage areas, divided by tonnage worked used defmition: total direct Iabour expenditure divided by
tonnage worleed {direct Iabour expenditure unknown)
total amortization and interest allocated to and maintenance and eperating costs incurred for the berth group, excluding the costs of transit sheds and warehouses, divided by tonnage worked. used definition: total expenditure minus personnet costs
divided by tonnage worleed
berth occupancy and cargo handling revenues minus Iabour and capita! equipment expenditure used definition: net result profits and loss account
total contribution divided by tonnage worked
Important operational information to maintain is the number of ship arrivals and a breakdown of the ship's time in port for each class of cargo. These data are of prime concern to the ship owners and operators for the setting of freight rates and thus of direct concern to shippers and consignees who must pay the freight rate. Perhaps the most complicated and intricate problem existing in the transport field today, is the tum-round time of ships in ports. An excellent indicator to maintain port effectiveness is the quantity of cargo worked per ship hour in port. To maintain this indicator, information on the arrival time, departure time and tons loaded/discharged for each ship must be recorded. In addition, the time of berthing, ship length and location of herthing should be noted. The various ship times must be accurately defmed and then consistently recorded. In addition to the above information, data on the total hours at berth during which the ship was worked and on the total gross gang-hours worked should be recorded, to permit measurement ofthe intensity ofworking. From these records the following averages can be calculated on a monthly basis for each berth group servicing a cargo class:
40

Table 3.5
Operational port performance indicators
Operational Port Performance Indicator
arrival rate
waiting time
service time
turn-round time
tonnage pership
fraction of time berthed ships worked
number of gangs employed pership per shift
tonsper ship hourinport
tonsper ship hourat berth
fraction of time gangs idle
Definition
number of ships arriving during a month, divided by number of days in the month
total time between arrival and herthing for all herthing ships, divided by number of herthing ships
total time between herthing and departure for all ships, divided by number of ships
total time between arrival and departure for all ships, divided by number of ships
total tonnage worked for all ships divided by number of ships
total time that hertbed ships were actually worked, for all ships, divided by the total time between herthing and departure of all ships
total gross gang time, divided by total time that hertbed ships were actually worked, for all ships, divided by the total time between herthing and departure of all ships
total tonnage worked, divided by total time between herthing and departure
total tonnage worked, divided by total time between herthing and departure
total idle gang time, divided by total gross gang time
Performance indicators of port of Rotterdam and Dar es Salaam: an abortive comparison
Neither the ports of Rotterdam nor Dar es Salaam port, use the above described performance indicators. Nevertheless, most fmancial indicators could be deduced from other sources. But many of the operational indicators could not be found. RMPM only provides facilities, so many of the indicators fall outside the management's area of influence. Not RMPM, but single, independent companies are responsible for the performances. At Dar es Salaam port, many operational figures are recorded, but not the ones needed to fill in table 3.5. For the grain terminal, some ofthe lacking figures could be deduced from 9 Statements ofFacts. All figures are converted into U$. In table 3.6 and 3.7 the indicators found are presented. 41
•• Sources: Rotterdam Municipal Port Management,Annual report 1995, Port of Rotterdam (Rotterdam: RMPM, 1996); Directie Haveninnovatie, Trendrapport 1994, Port of Rotterdam (Rotterdam: HavenlnfonnatieBank DHI033/94, 1994); Tanzania Harbours Authority, Annual report 1992/1993 (Dar es Salaam: THA, 1994); Tanzania Harbours Authority, Operations of bulk cargo bagged by THAINectar at shore sidelsilo 1995, (Dar es Salaam: THA, 1996); Tanzania Harbours Authority, Silo operations 1995 (Dar es Salaam: THA, 1996); Unpublished infonnation given by relevant departments in Dar es Salaam port.
41

Table 3.6
Financial port performance indicators
Financial Port Performance Indicator
tota/tonnage worked
berth occupancy revenueperton of cargo
cargo hand/ing revenueperton of cargo
Iabour expenditure per ton of cargo
capita/ equipment expenditure per ton of cargo
total contri bution (net result)
contri bution per ton of cargo
Port of Rotterdam2
1995 ($1=/1,60)
294,300,000
$0.89
$ 1.44
$0.22
$ 1.11
$ 28,769,375
$0.10
Dar es Salaam ~ort 1993
( 1 = Tsh452)
4,840,800
not avai1able
$ 12.12
$3.19
$6.17
$7,170,600
$ 1.48
Grain terminal DSM 1995
300,100
not avai1ab1e
handling U$ 8.-bagging U$ 5.-
$ 1.063
not avai1ab1e
not avai1ab1e
not avai1ab1e
1 Source: Bank of Tanzania, Economie Bulletin ofthe quarter ended 31 st December 1995, Vol. XXIII, no. 2, rate exchange bureaus; 2 THA only has one common Balance Sheet and Profits and loss account, so all figures represent an average ofTHA, not of Dar es Salaarn port; 3
Labour costs paid by THA; Nectar also pays for Iabour
Table 3.7
Operationa1 port performance indicators
Operational Port Performance Indicator Portof Dar es Salaam Grain terminal Rotterdam port DSM
arrival rate 767/ day 13/ day 0,05/day
waiting time not avai1ab1e1 12 hrs2 not avai1ab1e
service time not avai1ab1e1 not avai1ab1e 166 hrs3
turn-round time not avai1ab1e1 not avai1able deep sea general cargo 4.6 deep sea tankers 3.3 dry cargo coasters 2.3 tanker coasters 2.3
tonnage pership 1050 1050 13,1003
fraction of time berthed ships worked not avai1ab1e1 not avai1ab1e 75W
number of gangs employed pership per shift not available1 not available 33
tonsper ship hourinport not available1 not available not available
tonsper ship hourat berth not available1 not available 793
fraction of time gangs idle not available1 not available 25W
1 not available as RMPM is not responsible forthese perfonnances; rnany independent companies deal with them; 1 estimation ( depending on volume ship waiting time _varies between 6 and 15 hours, rapidly increasmg with growth of volume); 3 based on only 9 statements of facts, for summary also see appendtx C-3.
42

The cargo handling revenue per ton of cargo in Dar es Salaam is a multitude of Rotterdam; so are the Iabour and capital expenditures. Also the contribution per ton of cargo in Dar es Salaam is higher than in Rotterdam. Some remarks should be made. The exchange rate ofthe Tanzanian shilling (1993) is not charged for the market rate, although the rate calculated with is the one used in exchange bureaus, it is stillnota realistic exchange rate. Although salaries and wages in the Netherlands are much higher than in Tanzania, the Tanzanian Iabour expenditures per ton of cargo are higher. In Rotterdam port much equipment replaces the work which is done manually in the Tanzanian ports. As in Rotterdam no equipment owned by stevedoors is taken into account, it might be presumed that the capital equipment expenditure per ton of cargo in reality is much higher than the figure found in the table. Hardly any of the operational performance indicators could be included in the table, but for the arrival rate and tonnage per ship. The arrival rate of Rotterdam port accounts 60 times the rate of Dar es Salaam. Surprisingly, the tonnage pership is equal in both ports, although the port of Rotterdam can receive the largest sea ships. The number of small ships calling Rotterdam amounts to eight times the number of sea ships (see §3.1) and probably compensates the volume of the large sea ships.There are several reasons why the tonnage per ship calling for the grain terminal is much higher than the average figure of Dar es Salaam. Most dry bulk is delivered by deep sea ships, while the other terminals also receive coasters which bring cargo either inwards or outwards. The dry bulk is only coming inwards, further distribution happens by land transport.
The portscan not be compared without some consideration: Rotterdam port is the world's largest port (measured intons transhipped) and serves an enormous and rich hinterland, while Dar es Salaam is situated in a poor part of the world. In Rotterdam the number of ship calls is much higher than in Dar es Salaam. Also, the port of Dar es Salaam is almost only used for transhipment, against the port of Rotterdam, which also includes industrial activities. The port of Dar es Salaam is a state owned enterprise and all tasks, but discharging of dry bulk, is performed by civil servants. RMPM is not responsible for port operations and, therefore, not responsible for expenditures made for those operations (like wages and salaries for Iabour, and depreciation of stevedoring equipment). The contri bution per ton of cargo in Rotterdam is the total contribution divided by the tonnaged worked in Rotterdam port. lt does not include the contribution earned by the stevedoring companies. In Dar es Salaam, where only one independent stevedoor is active in a small part of the port, the figure (U$ 1.48) comprehends the overall contribution, inclusive the contribution earned by stevedoring activities.
Performance indicators within THA
In 1994 a performance contract between THA and the government was concluded. The contract is a formal statement of intentions and obligations between the government and THA. lt aims at promoting best performance of THA consistent with its role and objectives as a state owned enterprise with builtin mechanisms for assessing fairly the performance of THA which, depending on the results, will earn THA management appropriate rewards. The performance measures are separated in two groups: financial performance and port operations and quality of service. For the port of Dar es Salaam, the unit costs arealso a performance indicator. In table 3.8 the indicators are summarised.
43
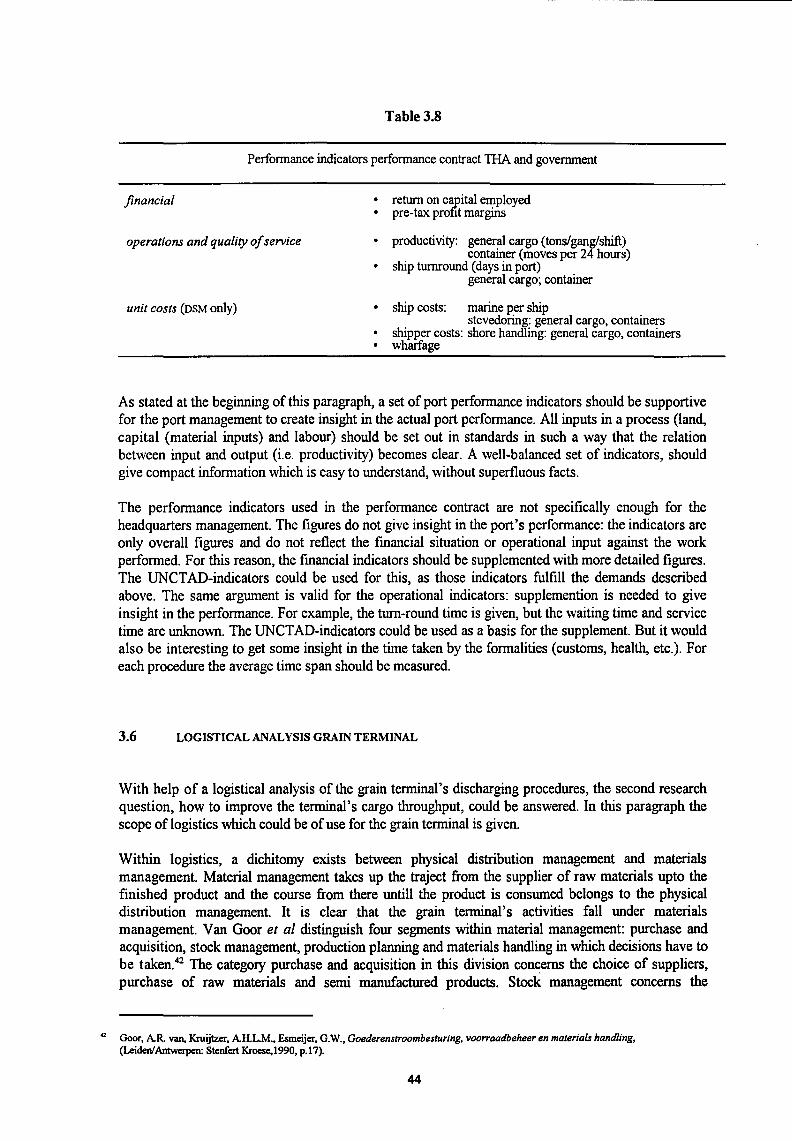
Table 3.8
Performance indicators performance contract THA and govemment
financial
operations and quality of service
unit costs (DSM only)
• return on capital en:tPloyed pre-tax profit margms
• productivity: general cargo (tons/ganglshift) container (moves per 24 hours)
• ship turnround (days in port) general cargo; container
• ship costs: marine pership stevedoring: general cargo, containers
• shipper costs: shore handling: general cargo, containers whanage
As stated at the beginning of this paragraph, a set of port performance indicators should be supportive for the port management to create insight in the actual port performance. All inputs in a process (land, capital (material inputs) and Iabour) should be set out in standards in such a way that the relation between input and output (i.e. productivity) becomes clear. A well-balanced set of indicators, should give compact information which is easy to understand, without superfluous facts.
The performance indicators used in the performance contract are not specifically enough for the headquarters management. The figures do not give insight in the port's performance: the indicators are only overall figures and do not reileet the financial situation or operational input against the work performed. For this reason, the financial indicators should be supplemented with more detailed figures. The UNCTAD-indicators could be used for this, as those indicators fulfill the demands described above. The same argument is valid for the operational indicators: supplemention is needed to give insight in the performance. For example, the turn-round time is given, but the waiting time and service time are unknown. The UNCTAD-indicators could be used as a basis for the supplement. But it would also be interesting to get some insight in the time taken by the formalities (customs, health, etc.). For each procedure the average time span should be measured.
3.6 LOGISTICAL ANALYSIS GRAIN TERMINAL
With help of a logistical analysis of the grain terminal's discharging procedures, the second research question, how to improve the terminal's cargo throughput, could be answered. In this paragraph the scope of logistics which could be of use for the grain terminal is given.
Within logistics, a dichitomy exists between physical distribution management and materials management. Material management takes up the traject from the supplier of raw materials upto the finished product and the course from there untill the product is consumed belongs to the physical distribution management. It is clear that the grain terminal's activities fall under materials management. Van Goor et al distinguish four segments within material management: purebase and acquisition, stock management, production planning and materials handling in which decisions have to be taken. 42 The category purebase and acquisition in this division concerns the choice of suppliers, purebase of raw materials and semi manufactured products. Stock management concerns the
41 Goor, AR. van, Kruijtzer, AH.L.M., Esmeijer, G.W., Goederenstroombesturing, voo"aadbeheer en materials handling, (Leiden/ Antwerpen: Stenfert Kroese,l990, p.17).
44

management of the purchased materials from the warehouse untill the central warehouse, where the finished products are stored. With production planning is meant the material requirement planning, acquirement of orders and management of the production process. Materials handling is the transport within the process, the handling of raw and semi manufactured materials untill they are stored as finished product. This model is used to create an overview of the tasks and the responsibles within the discharging process of the grain terminal. As discharging is not an ordinary production process in which a product is manufactured from raw materials, it can be concluded that the category purchasing and acquisition is not present in the proces. Preparatien of the raw materials normally belongs to the materials handling. In case of discharging ships, this category is not satisfying, as guidance of the ship and fulfilling all formalities can not be done by the stevedoor or the grain terminal's management. For this reason a segment is added, called production preparation. So also within the grain terminal's logistics, four segments are known. In table 3.9 the segments and their responsibles are mentioned in sequence of the process.
segment
production preparation
production planning
materials handling
stock management
Table3.9
Materials management decisions
meaning within discharging process
pilotage, fulfilling formalities
management of discharging, storage and possibly bagging
handling of discharged grain till storage
storage after discharging
responsibility within grain terminal
THA, customs and ministries
Nectar
NectarffHA
THA
In fact, the bagging process is a special kind of production process, in which decisions regarding production planning, material handling and stock management have to be taken. The raw material is bulk grain in a ship and the fmished product is discharged grain, either in bulk or in bags. Both production planning and materials handling are involved in this. Nectar is responsible for both sections. Besides, discharging and bagging, another product is sold by the terminal: storage space for bulk cargo. The responsibility for storage falls under the authority of the TRA-management. The intake of cargo in the silo still belongs to the frrst two categones and is supervised by Nectar.
Possible methods to improve the goodsflow
The terminal's goods flow in fact is a production process. For the improvement of this kind of processes, several approaches exist. Three classical ones and a newer one are summarised and discussed below, and a choice for the best approach applicable to the grain terminal is made.
The frrst classical approach relates to the decisions regarding goods co-ordination of parts and of the finished products. This method is known as Material Requirements Planning (MRP-l). With help of this technique several production stages are steered by the demand for fmished products. A bill of materials is used to translate the, by the market ascertained, demand for fmished products to the dependent need of raw matenals and semi manufactured products. So the market demand is the starting point, from there it is calculated what finished products have to be produced at a certain time. Next step is to calculate when the semi manufactured products have to be produced and when raw materials and components have to be ordered. The technique takes stock, work in process and flow times into consideration. MRP was developed to steer a proliferation of product variances with many parts.
45

Disadvantage of MRP-1 is the one way traftic: in the calculations which translate the demanded finished products to raw material needs the capacity requirement and availability are not taken into consideration. Manufacturing Resources Planning (MRP-11) was developed to solve this problem. This addition to MRP-1 translates the market demand in a production planning for the fmished products.
The second approach is developed at Toyota and is known as kanban or Justin Time (Jil). It is a method which concentrates on streamlining of the primary process and searches for improvements in the process to simplify the process management, to decrease the flowing times and to reduce the stocks, especially work in process. JiT is developed for production of large quantities with relatively little variances. Year after year smal! improvements are realised on an existing production system. The system started out of the need to work with scarce means (materials, location, etc.) and to become competitive in the existing world markets. The system is developed to create a 'mix-flexibility', which means that differentproductscan be manufactured. JiT helps to simplify the steering ofthe production process. lt is a pull-theory : the production of finished products needs semi manufactured products; production of semi manufactured products needs supplementing stocks of raw materials, etc. In the JiT system, stocks of workin process are taken away, so disruptions can beseen clearly, which should motivate the employees to solve the problems. Total quality control is the basic assumption, which is being realised by making the employees responsible for undertaking action in the production process in case of trouble. Also improvements of the system have to be invented by the employees. The most important goals of JiT are productivity increase and reduction of setups and stocks of work in process, a more market tuned production and increase of flexibility.
The third classica! approach focuses on capacity problems and not on the goods, and is known as Optimised Production Technology (OPI) or Theory ofConstraints (ToC). With ToC, the theory is meant and OPT is the betonging software system. In fact, in the theory the good points of both MRP and JiT are combined with new ideas. The theory starts with the point that the only real goal of a production company is making money and, for that reason, the whole company should be designed to meet this goal. Net profit, return on investments and cash flow express the extent to which the goal of making money is reached. Increasing throughput, decreasing inventory (all the money that the system has invested in purchasing things which it intends to sell) and decreasing operational expenses influence the goal positively and for that reason should be reached. As the bottie necks determ the production, the use of those bottie necks should be optimised. All other capacities are subordinated to the bottie necks. The non-bottie neck resources rather not function all the time, as this will create stock of work in process. The overcapacity on the non-bottie neck resources is needed to help the bottie necks producing optima! and to plan the goodsflow. The MRP system is used to calculate the requirements and the use of the other capacities.
A new steering concept, known as Method of Integra/ Steering (MIS), is developed by Hoekstra en Romme. 43 Integral steering means planning and control of the total goods flow from delivery of raw material and semi manufactured parts till delivery at the customers. The method can be used for processes of all kind of complexity: in between input and output of the traject a complex production and delivery system or a simple storage and distribution system and everything in between can be found. The theory is focused on enlarging a company's flexibility by pushing back stocks as far as possible in the process, so all elient specifications (i.e. products and delivery time) can be met without keeping much stock. The places in the process where stock has to be kept, are called uncouple points. So, only when custommers demand products, the goods needed for the production are given free from those uncouple points. To determine the places of the uncouple points the demanded delivery time is weighed against the flow time. This means that the place of the uncouple points is determined by the demanded delivery time: when customers expect receipt within 14 days, the flow time from the uncouple point untill delivery should be 14 days at most. lf it is more, the uncouple point should be
0 Hoekstra, Sj., Ronune, J.H.J.M., Op weg naar integrale logistieke structuren (Deventer: Kluwer, 1985).
46

-------------------
situated more to the end of the process, so the materials stocked will he stocked more processed than before. If the flow time is less then the demanded time, the uncouple point should he placed more backwards in the process. Advantage ofthis metbod is that particular specifications can he met without keeping all kinds of varieties of the product in stock.
Not all theories are applicable to the existing situation within the grain terminal. The MRP system was developed for complex production processes. Calculations are made to fmd the quantities of raw materials and semi manufactured products needed. In case of the grain terminal, the market demand is exactly known, as the raw material is delivered by the elient No semi manufactured products are needed, so extensive calculations are unnecessary. For this reason, the theory is nota (frrst) choice for the grain terminal. JiT is a metbod which requires initiatives from the employees. From observations it became clear that employees within the terminal did notshow initiatives easily, even when requested. Experiences with JiT showed that a strong hierarchy and betonging status aspects will restriet the functioning of the system.44 However, the THA-grain terminal is a strongly layered organisation. (In paragraph 3.7 these remarks are studied in some depth.) For these reasons, the JiT-theory is not applicable to the terminal. The ToC metbod is a theory which stickstoa company's basic goal: making money. Efficient use ofthe available capacities is a way to reach this goal. The theory can he applied to each production organisation, so also to THA and the THA-grain terminal. According to Gelders and Van Wassenhove, most principles ofToC can also he found in the JiT-theory.45 But those principles can not he found explicitly within this theory: JiT is a metbod of trial and error, while ToC is more structured. As TRA's grain terminal should become more commercial, it could he useful to apply the T oC to the grain terminal. The metbod of integral steering can not he applied to the grain terminal, as the terminal has a very special production process. No stocks are kept for unexpected market demand, as clients deliver cargo themselves to the terminal. So the uncouple point is already put back in the production process as far as possible. Production only starts when the elient asks for it, which is at the ship 's arrival. F or this reason, the system of integral steering can not he applied to the grain terminal.
The Theory of Constraints is the best solution for the grain terminal. In the following, this theory is elaborated upon.
Theory of Constraints
The Theory of Constraints (ToC) is a logistical theory of ongoing improvement, developed by Goldratt and Pazgal and explained in a well known book.46 The frrst principle of the theory is that the goal of each (commercial) company is generating money, bothnowand in the future. All actions undertaken in the company are subordinate to this goal. So not reducing costs, but making money is the goal of the company. Although this all seems very logica!, in the past many managers did not act according to this principle. Realising that the goal is to make money, three common measurements have to he redefmed:
throughput:
inventory:
operational expense:
the rate at which the system generates money through sa/es
all the money that the system has invested in purchasing things which it intends to sell
all the money the system spends in order to turn inventory into throughput
.. Sluis, L, JJT and TOC: uitwisseling van ideeln en implementatie-ervaringen, (Deventer: Kluwer Bedrijfswetenschappen, Tijdschrift voor Inkoop en Logistiek, 1993, p.34-40).
•• Gelders, L., Wassenhove, L van, Produktiebesturingssystemen: een vergelijking van MRP, Kanban en OPT (Antwerpen: Economisch en Sociaal Tijdschrift, volume of 1984, no. 6, p.665-677).
46 Cox, J., Goldratt, E.M., The goal; a process of ongoing improvement (Worcester: Gower, 1989).
47

Those measurements are very different from the traditional defmitions, because Goldratt believes that it is better not to take the value added into account. This eliminates the confusion over whether a dollar spent is an investment or an expense. Everything managed in an organisation is covered by those measurements. When the pace of the throughput increases, the net profit, the return on investment and the cash flows increase as well. A decreasing inventory and a decrease of the operating expenses also both cause an increase of those three performance indicators. So it is important to control those.
A company only has two types of capacities: bottie neck capacities and non-bottie neck capacities. A capacity resource can he a machine, a person, tools, space, etc. Each company only has a few bottie necks. Those bottie necks restriet the goods flow and have to he kept working as much as possible. The non-bottie necks have superfluous capacity which can he used to make a planning more flexible. It is not useful to use those non-bottie necks full time, as this will create more inventory, and so work against the goal. The frrst two rules of ToC are clear now: • the utilisation of a non-bottie neck resource is not determined by it's own potential, but by some
other constraint in the system • activating a resource is not synonymous with utilising a resource
In traditional theories, setup times are seen as lost time and decreasing the turn over. ToC explains that setup time is only lost time at a bottie neck, as during the setup the goods flow can not continue. So setups have to he avoided at bottie neck machines. But at non-bottie neck machines, setup time is not lost time as those machines have superfluous capacity. In fact, as long as the costs of Iabour and material are not high, a non-bottie neck machine should he setup as much as possible. This will not affect the goods flow, but small batches decrease the workin progress and so decrease the operational expenses. This gives the next two rules of the theory: • an hour lost at a bottie neck is an hour lost for the total system • an hour saved at a non-bottie neck is a mirage
The traditional economical lot size formula weighs setup costs against stock costs. But an hour less spent for setup is only valuable for bottie necks. Second point of criticism is that stock costs are paid per item, while setup costs are for the production capacity. Within ToC two kinds of lot sizes are known: a transfer lot size, the batch which is transported to the next capacity resource, and a process lot size, which is the quantity ofthe batch which is processed. The processlot size depends ofpriority, available capacity, etc. So the process lot size has to he adapted !O the situation of that particular moment. This is the basis for the next two rules: • the transfer batch may not and many times should not he equal to the process batch • a process batch should he variabie and not fixed
Traditionally, priority and capacity are approached sequentially. The part with the longest flow time is planned to he made frrst and only then capacity is considered. So priority and capacity are not approached sequentially and unrealistic planning can take place and discrepancy between the output of calculations and reality. The seventh rule is therefore: • capacity and priority need to he considered simultaneously and not sequentially
Other theories presurne that operating times capacities vary, but that adding up all averages of operating times will give the total flow time. This would he true, if all operations were independent. But in practice, sequentia! steps in a process arenotindependent and large deviations can arise. The existence of unsteadiness which can work cummulative, has to he admitted, so the unsteadinesses can he isolated and minimised. This is meant with the eighth rule: • Murphy is not an unknown, and his damage can he isolated and minimised
As unsteadiness will always exist, it is better to keep capacity differences, so the constraints are easily to he identified and planned. If possible, bottie necks should he situated in the front of the production process. Bottie necks in the last stage might create stock of work in process. And of course,
48

interuptions at bottie necks should be avoided. So safety stock or safety times have to be put before the bottie neck, so these will never be idle because of disroption of a delivery capacity. This is all summarised in the next rule: • plant capacity should not be balanced, the flow should be balanced
The last rule concerns the accounting standards: as each hour savedat a non-bottie neck is a mirage (rule 4), no rewards should be given for the classica! efficiency principles, which measure the number of operating hours and non-operating hours. For the goal, the generating of money, the occupation degree of non-bottie necks is of no interest. So rule ten has to be taken seriously: • the sum of local optimums is not equal to the optimum of the whole.
Summarising, balancing the flow is the only way to reduce inventory and bottie necks are not seen as a problem but as a handle to synchronise the flow. Everything else within the organisation has to be subordinated to the bottie necks, the goods given free, the use of non-bottie necks and the accounting system. As not only capacity resources but also other sources, like the market demand, can be the souree which limit the flow, in the hook the word bottie neck is replaced by constraint.41
The theory elaborated upon leads to an iterative process: step 1 identify the system's constraint(s) step 2 decide how to exploit the system's constraint(s) step 3 subordinate everything else to the above decision step 4 elevate the system's constraint(s) step 5 if in the previous steps a constraint has been broken, go back to step 1,
but do not allow inertia to cause a system' s constraint
Applying the theory of constraints to the grain terminal, the five steps should be followed.
Step 1: identify the system's constraints
First step is the identification of the system's constraints. As presented above, constraints can be physical bottie necks, but also caused by other sources, like the organisation and cultural differences. All types of constraints, but the cultural ones, are dealt with in this paragraph. Paragraph 3.7 focuses on cultural differences as a constraint.
The system' s constraints can be identified by making a capacity resource profile, or by observation and analysis of the cargo flows and delays during the production process. 48 The easiest way to spot a bottie neck is walking the floor and looking for piles of inventory. The grain terminal's process is not an ordinary, continue production process: interuption of the goods flow causes a interuption in the supply. Therefore, inventory can oot pile up and the inventory-spotting method can oot work in this environment. Insight in the cargo flow and delays are neerled to get insight in the process. An overview of the cargo flow will show the position of the capacities resources and their connections, while the delay analysis gives insight in the process: a capacity resource can become a constraint because of the number and time span of break downs, which decrease the availability.
By analysis of the cargo flow insight in the process will be obtained. Systematic handling analysis, an organised, systematical and logica! method, developed by Muther and Hagenäs, is used as basis for the
41 Cox, J., Goldratt, E.M., The Goal; supplement, (Worcester: Gower, 1989, p. 299).
•• Vollum, R.,Managing constraintsfor optimumfactory synchronization (Falls Church: The American Prodution and Ioventory Control Society (APICS), 1988).
49
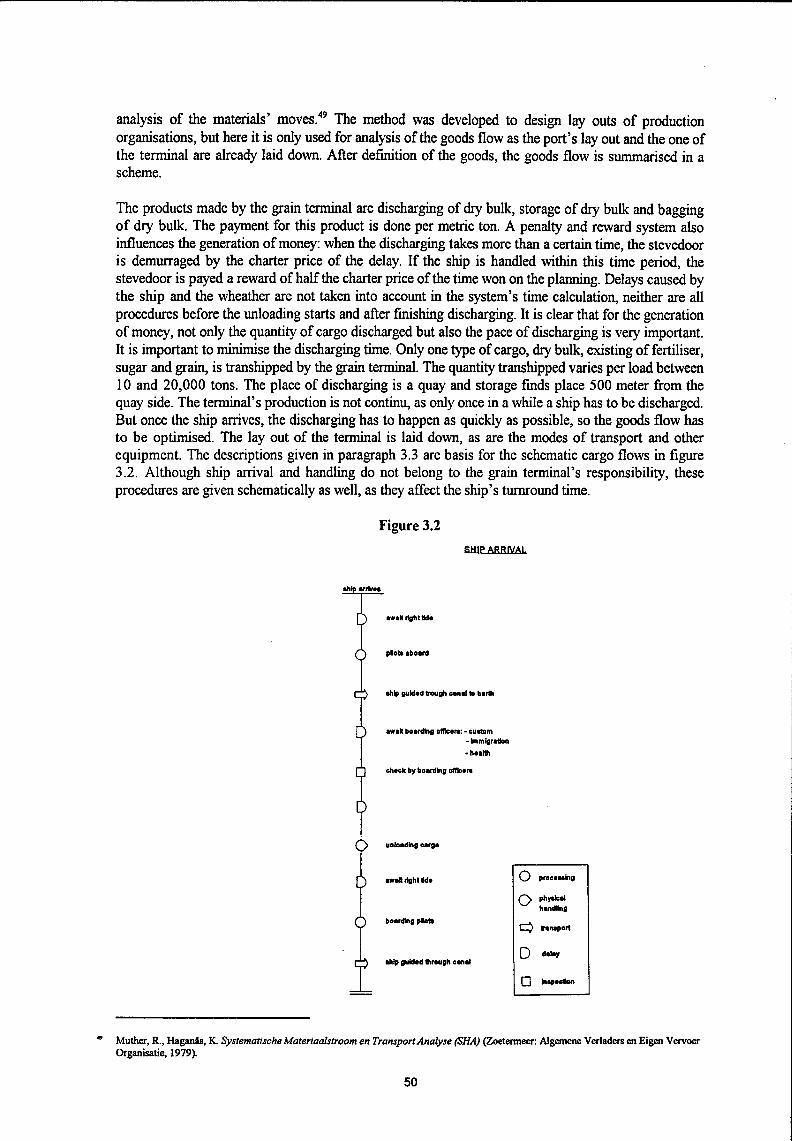
analysis of the materials' moves. 49 The method was developed to design lay outs of production organisations, but here it is only used for analysis ofthe goods flow as the port's lay out and the one of the terminal are already laid down. After deftnition of the goods, the goods flow is summarised in a scheme.
The products made by the grain terminal are discharging of dry bulk, storage of dry bulk and bagging of dry bulk. The payment for this product is done per metric ton. A penalty and reward system also influences the generation of money: when the discharging takes more than a certain time, the stevedoor is demurraged by the charter price of the delay. lf the ship is handled within this time period, the stevedoor is payed a reward of half the charter price of the time won on the planning. Delays caused by the ship and the wheather arenottaken into account in the system's time calculation, neither are all procedures before the unloading starts and after fmishing discharging. It is clear that for the generation of money, not only the quantity of cargo discharged but also the pace of discharging is very important. It is important to minimise the discharging time. Only one type of cargo, dry bulk, existing of fertiliser, sugar and grain, is transhipped by the grain terminal. The quantity transhipped varies per load between I 0 and 20,000 tons. The place of discharging is a quay and storage fmds place 500 meter from the quay si de. The terminal's production is not continu, as only once in a while a ship has to be discharged. But once the ship arrives, the discharging has to happen as quickly as possible, so the goods flow has to be optimised. The lay out of the terminal is laid down, as are the modes of transport and other equipment. The descriptions given in paragraph 3.3 are basis for the schematic cargo flows in ftgure 3.2. Although ship arrival and handling do not belong to the grain terminal's responsibility, these procedures are given schematically as well, as they affect the ship 's turnround time.
Figure 3.2
SHIP AR RIYAL
owolrlghttido
plolil oboard
ohlp guldod trough canol to beril
nalt boareling otncerw.: .. custom -inm!Qrotlon
• health
chock by boording olllcore
unloodlng .. rgo
owol rlghlldo
boording plota
ohlp guldd llrough canal
0 proceoolng
0 physlcol handllng
q nnoport
D doloy
., Muther, R., Haganäs, K. Systematische Materiaalstroom en Transport Analyse (SHA) (Zoetenneer: Algemene Verladers en Eigen Vervoer Organisatie, 1979).
50

Ü bagging
shlp arrlves
~ck welghtcargo
9 check quality cargo
0 unloading from ship into hopper
transport to silo
GRAIN TERMINAL
Goods flow: lmports
6 handlmg on b'Ucks weighing atweighing bridge
unloading
storage (sllage)
handling
bagging
handling
handling (loading in trucks)
transport to shed weighing atweighing bridge
storage
0 processing
to railway wagons
0 physical handling
transport to fin al destination cl transport
D inspeetion
v storage
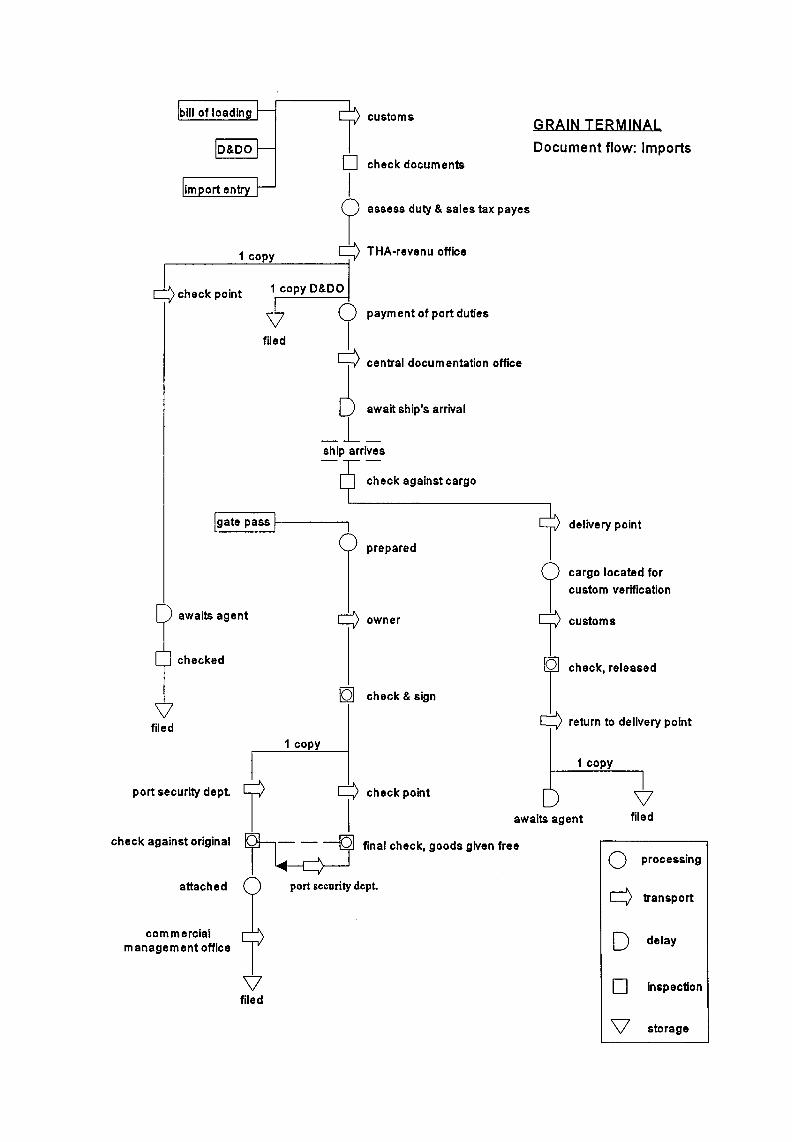
bill of loading customs
0 check documents
I ?. ••••ss duty & oales tax pa yes
1 copy y THA-revenu office .-------~~------~
Q check point 1 copy D&DO
v filed
1 payment of port duties
T central documentation office
D await ship's arrival _l_ ship arrives
check against cargo
jgate pass f-j ------,1
awaits agent I:~::··
checked
IQ] check & sign
filed 1 copy
port security dept. Q Q check point
GRAIN TERMINAL
Document flow: lmports
delivery point
cargo located for custom verification
customs
y return to delivery point
1 copy
v I awaits agent filed
check against original
attached
commercial management office
final check, goods given free
v filed
0 processing
q transport
D delay
0 inspeetion
v storage

GRAIN TERMINAL
Goods flow: Exports
arrival cargo
storage in silo
loading on trucks
transport to quay
loading ship by eranes with grab
transport to port of destination
0 physical
handring
Q transport
V storage

filed (by agent)
exportentry
agent revenue office
I E:!e~rm 1-1------1( )- _prepared_
I I I I I I I I I I
customs (by agent) GRAIN TERMINAL
Document flow: Experts checked & released
THA revenue office
payment of port dues
THA export office
prepared
read & attached
Joading point
checked
,----, engagement list 5 sets
await ship's arrival
I shiR'S arrival
Joading cargo 0- - - - -I recorded on EAS form
copy
THA revenue
office
engagement list
prepared
export office
chief of ship
check & sign against shipping order
exports office
V EASform awalt preparatien
outturn report
read & attached 0 q
D
D
v export office
processing
transport
delay
inspeetion
storage

At the basis of the delay analysis of the grain tenninallogistics are nine Statements of Facts of two ships which called the port in November 1994 and seven ships which called the port in 1995. The seven ships which called the port in 1995 represented 42% ofthe totalfree flowing commodity imports in that year, in which a total of 20 ships were involved. lt was impossible to obtain the other Statements of Facts. The nine documents are used fora delay analysis. Analysing the documents gave some problems as notall documents were very detailed and some parts were unreadable. Also the interpretation of the figures was not unambiguous as the effect of a delay on the whole discharging traject is not always clearly noted on the documents. In case of a defect in one ofthe bagging plants, it is clear that one bagging line is out of order during the delay. Rain causes delays in all discharging activities, but the affect of a delay caused by transport is less unequivocal. Although there are no trailers available, the bagging can start or continue anyhow and the bags will be put on the trailer later on. Of course, this causes some delay in the process, but not in the bagging process. But when the discharged grain has to stay bulk, and the trucks are delayed, the whole discharging process is delayed. (For this reason truck drivers receive a premium for each time collecting grain at the quay side.) Delays caused by transport are interpreted as delays affecting only one line. A summary of the delays is shown in appendix C-3, as well as all delay times and their causes per ship. A summary of the causes of the delays is shown in sequence ofimportance in table 3.10.
Table 3.10
Causes and importance of delays
Sequence Cause delay Delay (hrs) Delay (%)
I labour 104.5 26.6 2 rain 81.7 20.7 3 transport 81.3 20.6 4 power 46.0 11.7 5 o~erational 34.3 8.7 6 s p 20.9 5.3 7 crane 14.1 3.6 8 others 10.5 2.7 9 shunting 0.4 0.1
Totaal 393.7 100.0
Source: 9 Statements ofFacts
The 400 hours of delay take 25% of the total berth time of the nine ships (for details see the appendix) and the categones Iabour, rain and transport account for two-third of the delay time. With regard to delays falling under 'Iabour' some remarks can be made. Allocation of the gangs causes part of the delays, but more important are the waiting times: the workers often arrive late so the gangs cannot start in time. From the Statements ofFacts can be deduced that allocation ofthe gangs is possible in only 10 minutes and probably it can be done even faster. But in practice allocation takes often over 20 minutes, and together with the waiting time a shift of workers often takes 30 minutes to one hour. A very few times a gang did notshow up at all and twice a delay was caused due to no crane driver showing up. To motivate gangs, a bonus is paid when a certain quantity is madeduringa shift. No charges are made for arriving late.
The delays caused by rain are unavoidable when using grab eranes for discharging, as the commodities should stay dry and the weather can not be influenced.
Most delays falling under 'transport' are caused by waiting time for trailers, according to the Statements of Facts no delays were caused by late trucks: the bonus paid to the truck drivers for each load is probably reason for that. A negative side effect of the premium system is that the drivers drive irresponsible. Once a delay was caused by a truck drivers strike, more money was their stake.
55

Power cuts happen only incidentally, but last quite long and influence the whole bagging process. The bagging plants, the eranes and the silo work on electricity. The bagging units have a back up generator and also the eranes have a back up. However, it takes some time before this is connected. The grain terminal cannot take any commodities in case of a power cut. Discharging contracts contain a clause in which is stated that the ship's eranes have to function, but still delays are caused by the cranes. Two more remarks have to he made: frrst, the capacity of the power stations in Dar es Salaam were expanded in the end of 1995. Since then, power cuts occurred only vecy incidentally and last shorter.50
Second, the power cuts and the bad weather are nowadays closely connected.
Delays due to operational causes account for almost 10%. Break downs of one of the bagging machines and absence of bags are the reasons. (Break downs of the equipment can only partly he prevented by in time-maintenance. Better planning could help that all articles needed for bagging are in time at the place were they are needed.)
All delays caused by the ship are on account of the ship and THA nor Nectar can exert any influence on these delays.
Maintenance andrepair ofthe equipment is for Nectar's account, including the grabs. Break downs of the crane and the grabs happen occasionally.
Delays caused by other reasons are due to late officers and Ramadan.
Shunting does not need any explanation.
Jdentification ofthe constraints
Within the system, two constraints are found outside the discharging process. The frrst is the demand for discharging services: checking the arrival data of ships, it becomes clear that only a vecy small part of all potential production time is used for production. The second constraint is the entrance: by Jack of sufficient depth and wideness of the entrance channel, ships cannot enter the port as soon as they arrive. The regulation that ships can only enter the port by day light also contibutes towards congestion.
Within the discharging process constraints are found as well. According to the theocy, operational constraints can he traeed by the quantity of work waiting before the capacity resource.
The ship is discharged by cranes. The eranes dump the commodity into large hoppers, which end into either the bagging plant or the trucks. So when the eranes cannot function, the whole discharging system cannot work. Even when by contract it is arranged that the ship's eranes have to he operational, a failure of the shore eranes cause delay, as the time to bring the ship' s crane into operation is lost. The eranes have a back up in case of power cuts. As becomes clear from the Statements of Facts, in practice, failure of the eranes only incidently happens, but most often take quite a long time span. Sometimes a bagging plant has to he moved toanother crane, which also causes delay. For this reason it can he concluded that the shore eranes are a bottie neck.
When the grain has to he bagged, the hoppers deliver the cargo to the bagging plants. In case of one of the bagging plants being out of order, the whole discharging process following this hopper is constipated for the time of the delay. Observations made clear that disruptions within bagging plants occurred regularly. This is confrrmed by the delay analysis. The discharging routes cannot work faster, because of this delay, so it becomes clear that also the bagging plants are a bottie neck. The bags
,. Infonnation given by Nectar representative.
56
produced by the plants are put onto trailers by manpower. In case of no trailer available, the bags can be stored temporarily at the quayside and transferred as soon as the trailer arrives. This will cost more man hours than planned, but it will notaffect the pace ofbagging, nor the pace of discharging. For this reason this transfer to trailers and the trailers themselves are non-bottie neck resources, but the extra manpower neerled works against the goal of generating money. This applies also for the storage of the trailers in sheds. The last stage in the system, the transfer from the sheds to the fmal destination is a bottie neck neither, as the pace of delivery does not directly influence the goal of the work done: generating money. As stated before, congestion is never good for a port.
The cargo with the silo as temporary destination, is dumped from hoppers into trucks. The truck capacity might be a bottie neck, but in practice is not. Mostoften of all ten trucks which are available, only five are used for the cargo transfer from ship to silo. In case of power cuts, the silo can not take in commodity and for that reason the discharging will he delayed. In fact, power service is a constraint. The truck drivers receive a bonus per load transported, which makes them eager to hurry. If the cargo is bagged after silage, this bagging is a bottie neck neither, as the pace of delivery does not influence the goal of the work done. Storage of the bulk cargo is not a bottie neck, as the silo is large enough. Storage even works in favour ofthe goal as long as the tariffs for storage are charged. Unfortunately, in practice those tariffs are not charged.
Summarised, the constraints are the market demand for discharging services by the grain terminaland the port's entrance channel and within the discharging process, the power service, eranes and bagging plants.
Step 2: decide how the constraints are exploited
After recognising the the system's constraints, the second step in the process is to decide how the constraints are exploited. With regard to the demand, the marketing activities have to be revised. It might be possible to attract in more ships with free flowing commodities. Another possibility is to start export of dry bulk as well and even start bagging before loading the ship.
Currentiy ships can only enter the port at the right tide and during day light. To optimise this constraint, the 'opening times' ofthe channel should be made as long as possible. Of course, the tide cannot be influenced, nor the day light. But the pilots can board the ship from just before sun rise untill dawn. Working times have to be expanded when ships are expected to arrive.
The power service is a constraint which falls outside the grain terminal's area of influence, for this reason nothing useful can be said about optimising this constraint.
With regard to the operational bottie necks, it is important to optimise the use of the bottie necks. Exodus at the bottie necks has to be avoided, as has all unnecessary workat the bottie necks. For the eranes no reduction of the work is possible, but some work performed by the bagging plants during discharging might be shifted in time. As most, if not all, bags are stored in sheds for a period, the bagging could be done partially from the silo as well. In this stage bagging is not a bottie neck anymore. Shifting part of the bagging activities is only possible by using {part of) the overcapacity of the trucks. lt might even be better to use less bagging lines, so more hopperscan be used to dump the commodity in trucks. Calculation will easily prove whether this allegation is true.
57

-------------
Step 3: subordinate everything to the exploitation of the constraints
As it is very important to keep the system's bottie necks operating, attention is going frrst to the system 's constraints. Per constraint measures have to be taken in the system, to ensure that each constraint is exploited maximally.
F or marketing no particular instructions cao be given, but with regard to the entrance channel, all procedures have to start as soon as the ship starts entering the port. All boarding officers have to be ready to enter the ship as soon as it is hertbed and the discharging equipment and the gangs should be ready for action as well. Interesting time savings are possible when the all boarding officers, the customs, health and immigration officers, board the ship together with the pilots.
Power service does oot belong to the terminal's or even THA's responsibility, so taking measures is not an option. The effect of power cuts cao be minimised by generators which are kept ready during the discharging process.
In the operating system everything bas to be organised to avoid disturbances in the operation of the bottie necks. Trimming gangs have to makesure the eranes cao grab the grain uniterupted, and bags, yam to stitch the bags and other requirements have to be available in all bagging plants all the time. As explained above, the only place where inventory is allowed and even is planned, is before the bottie necks. Workers should be in time, so the time span taken by shifting of gangs is minimised and breaks can not be allowed at the system. lt is better to fill up the breaks by other workers than just stopping the bagging activities. Failure of the shore eranes should be absorbed by keeping the ship's eranes prepared for action. Preventive maintenance of the bagging plants and the grabs between the ship calls is also very important. Investments in the preventive maintenance of the bottie necks will easily earn themselves back, as an hour lost at a bottie neck is an hour lost at the whole system.
Step 4: elevate the system's constraints
T o optimise the bagging system, the constraints have to be elevated. Methods to upgrade the constraints are discussed below per constraint.
Elevation of the marketing system is not easily to reach. The marketing for the grain terminal is contracted to Nectar and executed by the headquarters in Great Brittain. This department should try to find more work for the terminal in Dar es Salaam.
The capacity of the entrance channel cao only be elevated by large investments in equipment to make it possible for the pilots to workat night time as welland in infrastructure (deepening and widening of the channel). When the pilots are able to work in nightshifts as well, interesting savings might be possible, but all other officers should be available for workas well. Waiting time cao be reduced this way. Also when the night shifts cao not be implemented, boarding together with the pilotsoreven as soon as the ship arrives at the port, the officers cao enter the ship. So after herthing the discharging cao start immediately.
Increasing the capacity of the operational system is less expensive. By bringing the ship 's eranes into action parallel, the crane capacity cao be increased, though it is oot sure whether this option is useful. Keeping the ship 's eranes as standby capacity, in case of faiture or power cut, is useful. Setting another hopper might be a possibility to increase the discharging capacity, as more trucks cao be delivered.
Purchasing another bagging plant would be the only possibility to increase the bagging capacity.
58

As the goal of the port enterprise is generating money as much as possible, it is clear that the cheapest options should be executed first. Only when the constraint still Jacks capacity, more expensive measures can be taken. Some of the recommendations, the most expensive ones, will influence the whole port, and not only the grain terminal. Decisions regarding these constraints can be considered by the TRA-management.
Step 5: if in the previous steps a constraint bas been broken, go back to step 1, but do not allow inertia to cause a system's constraint
It must be mentioned that the process has to be repeated endlessly, as it is iterative. Because the proposed changes are not executed, the process is only passed through once. An increase in throughput might possibly create new bottie necks, but most enterprises have so much extra capacity that it takes an enormous increase in throughput before this happens. It is not likely that streamlining the discharging flow creates a new bottie neck in this stage. The measures mentioned above to elevate the capacity resource of the entrance channel will solve this constraint, but the operational bottie necks might still stay bottie necks. New bottie necks can originate when bulk throughput in the terminal increases. lf the bagging after silage also becomes a constraint, the silo's bagging plant should be made operational. It is a waste of money not to use this plant and this also increases the throughput of the silo.
By situating two trailers near the bagging plants, no Jack of trailers can come into being. This measure avoids superfluous lugging with the bags and it must be possible to arrange, as the trailers are in the port anyway, otherwise they should not be available later on in the process.
Additional remarks
With regard to THA's policy some remarks can be made. Optimising the use of bottie necks and elevation of the constraints bas first concern, but streamlining the other parts of the discharging process also is important. This benefits the port in the form of a smooth flow of cargo. Congestion in a port causes problems as the working space in sheds and open storage areas becomes limited. Organising a smooth cargo flow might prevent the storage areas becoming a bottie neck and is attractive for importers as well. For this reason, THA should co-operate with both railway companies. Joint investments in the transport system could he a possibility, so an overall package can he offered to clients. This might enlarge THA's over all market share in East Africa, not only ofthe grain terminal. Streamlining all procedures regarding the incoming ships before discharging can start, also shortens the turn-round time ofthe ships. Each reduction effects the turn-round time directly.
Investments in the widening and deepening of the entrance channel are necessary to develop the port in Dar es Salaam and to keep pace with the competitors. The entrance channel is a bottie neck. Deepening of the berths is also unavoidable in the long run.
A change in mentality of workers and employees should be managed into a more responsible one. It is important that changes in mentality fmd place on all levels. Everyone bas to beoome oost conscious and, more important, everyone bas to work in the direction of the goal. A premium system combined with education at alllevels might work. Not charging costomers for silage works against the goal by lacking income. So it is important to send bills to the costomers and make sure they are paid.
59

3.7 CULTURE AND CHANGING SITUATIONS
In the previous paragraphs the bottie necks in the cargo throughput of the THA-grain terminal were identified and ways and means to deal with thes bottie necks were recommended. What is not yet touched upon is how changes in the system and procedures have to he managed in the light of the differences in cultural background between the main actors involved. For the ultimate success of proposed changes, this is certainly a valid point: Hofstede's national cultural and organisational dimensions and indexes are used to get some insight in this matter.51 A summary of Hofstede's theories and indices is presented in appendix C-4.
Hofstede calculated various indicators for various countries and these are important in the light of the cultural differences between the actors involved in the THA grain terminal. The frrst actor country is Tanzania, since THA' s management and the grain terminal's management is T anzanian. The second actor country is Great Britain, since Nectar is British owned. The third actor country is the Netherlands, since Nectar's general management in Dar es Salaam is Dutch. For these three actor countries Hofstede has calculated four indexes: power distance index (PDI), individualism index (IDV), masculinity index (MAS) and uncertainty avoidanee index (UAI). In table 3.11 the scores ofthe indexes are divided into three groups: low, middle and high. As the score on PDI varies between 11 and 104, the low category includes all scores from 11 to 42. The middle and high score include 43 to 73 and 7 4 to 104 respectively. The categorisation for the other indexes is done in the same way.
PDI
IDV
MAS
UAI
Table 3.11
Scores of Tanzania, Great Brittain and the Netherlands on the four dimensions of culture
Tanzania the Netherlands
middle low
low high
middle low
middle middle
Great Britaio
low
high
high
low
Source: Hofstede, G., Cultures and or_ganisations; software ofthe mimi, Institute for Research on Intercultural Cooperation (IRIC) (London: McGraw-Hill Book Company Limited, 1991, p.26, SS, 84, 113).
F or the functioning of organisations the PDI and UAI scores are of particwar importance since they relate directly to management structure and management attitudes and since the differences between the actors in scores are significant.
Now 1ooking again at the key differences between the actors, see appendix C-4, tables 1 and 4, the following is found. With respect to PDI, the Dutch manager, from here indicated as Nectar-GM, and the enterprise Nectar have the following in common (see table 3.12).
51 Hofstede, G., Culture 's consequences; international differences in work-related values (London/Beverly Hills: Sage publications, 1980); Hofstede, G., Cultures and organisations; software ofthe mind, Institute for research on intercultural cooperation (IRIC) (London: McGraw-Hill Book Company, 1991).
60

Table 3.12
Key differences between Nectar-GM & Nectar and THA-grain tenninal general norm and workplaee
(PDI)
Nectar-GM & Nectar (both scored low) THA-grain terminal (middle)
I. inequalities among people should be minimized I. inequalities among people are both expected and desrred
2. there should be, and there is to some extent, 2. less powerful people should be dependent on the interdependence between less and more powerful powerful; in prachce, less powerfiil people are people polarized between dependenee and
more educated persons hold less authoritarian counterdependenee
3. 3. both more and less educated persons show almost values than less educated persons equally authoritarian values
4. hierarchy in organisations means an inequality of 4. hierarchy in organisations reflects the existential roles, established for convenienee inequality between hif!er-ups and lower-downs
5. decentralisation is popular 5. centralisation is popu ar 6. narrow salary range between top and bottorn of 6. wide salary range between top and bottorn of
or~anisation or~anisation 7. su ordinates expect to be consulted 7. su ordinates expect to be told what to do 8. the ideal boss is a resourceful dernocrat 8. the ideal boss is a benevolent autocrat or good
father 9. privileges and status symbols are frowned upon 9. brivileges and status symbols for managers are
oth expected and popular
Source: Hofstede, G., Cultures and organizations; software of the mind, Institute for Research on Intercultural Cooperation (IRIC) (London: McGraw-Hill Book Company L1mited, 1991, p.37).
The Nectar representative and the THA-grain terminal have the following in common with respect to their attitude to uncertainty avoidanee (see table 3.13):
Table 3.13
Key differences between THA-grain tenninal & Nectar-GM and Nectar general norm and workplace
(U AI)
Nectar (weak uncertainty avoidance)
1. uncertainty is a normal feature of life and each day is accepted as it comes
2. low stress; subjective feeling ofwell-being 3. agression and emotions should not be shown
4. comfortable in ambiguous situations and with unfamiliar risks
5. what is different, is curious 6. there should not be more rules than is strictly
necessary 7. time is a framework for orientation 8. comfortable feeling when lazy; hard-working only
whenneeded 9. precision and punctuality have to be leamed 10. toleranee of deviant and innovative ideas and
behavior 11. motivation by achlevement and esteem or
belongingness
THA-grain terminal & Nectar-GM (middle risk avoidance)
1. the uncertainty inherent in life is felt as a continuous threat which must be fought
2. high stress; subjective feeling of anxtety 3. aggression and emotions may at proper times and
places be ventilated 4. acceptanee offamiliar risks; fear of ambiguous
situations and ofunfamiliar risks 5. what is different, is dangerous 6. emotional need for ru1es, even if these will never
work 7. time is money 8. emotional need to be busy; inner urge to work hard
9. precision and punctuality come naturally 10. suppression of deviant ideas and behaVIor;
resistanee to innovation 11. motivation by security and esteem or
belongingness
Source: Hofstede, G., Cultures and organizations; software of the mind, Institute for Research on Intercu1tural Cooperation (IRIC) (l..ondon: McGraw-Hill Book Company Lnnited, 1991, p.125).
61

With regard to the differences in power distance, advise is given how to deal with the culture differences deduced from Hofstede's fmdings. At each point, the preferred situation and the current situation (perceived by observations) are described. 1. In Tanzania, inequalities among people are both expected and desired, so it would be unwise to
minimise the inequality. The Nectar GM has to realise this perception of inequality. In practice, the Nectar GM does knowhow to deal with this inequality.
2. The knowledge regarding the dependenee of Tanzanian lower educated employees can not be translated in concrete instructions.
3. In Tanzania, both more and less educated persons show almost equal authoritarian values. This must be realised when dealing with higher placed people in the THA-organisation, like the grain terminal management. In practice, the Nectar GM doesknowhow to deal with the authoritarian values ofthe Tanzanian management.
4. Hierarchy in organisations reflects the existing inequality between people, so the Nectar GM has to understand that he should not try to level out the distances between bimself and his Tanzanian employees too much. In practice the Nectar GM does know how to deal with the authoritarian values ofthe Tanzanian management.
5. Although centralisation is popular in Tanzania, the grain terminal should notmeet in this point. The grain terminal is too large and ponderous to be steered centrally. Also centralisation disagrees with THA' s current policy of privatisation and decentralisation.
6. In Tanzania, a wide salary range between top and bottorn of the organisation exists. This range is much smaller in the Netherlands and Great Britain, but it is not practical to introduce a narrow salary range. So, in Tanzania, the Tanzanian scale should be maintained. In practice, the Tanzanian range is respected.
7. The Tanzanian subordinates expect to be told what to do, so the Nectar management should reekon with the fact that no initiatives can be expected from the Tanzanian employees. Tasks to be performed have to be laid down clearly and imposed. In practice, the Nectar staff sametimes expects some initiative taken by the workers.
8. Although in Tanzanian eyes the ideal boss is a benevolent autocrat or good father, the Nectar GD should rather be a resourcefut dernocrat In practice, he is.
9. Privileges and status symbols formanagers are both expected and popular in Tanzania, so the Nectar GM should fulfill the expectations. Observations made clear that the Nectar manager already enjoys some status symbols: he has a car with a driver, wears correct dothing and has both a mobile telephone and a walky talky. The other Nectar employees also enjoy some status symbols.
Also with regard to the differences in uncertainty avoidance, advise is given how to deal with the culture differences deduced from Hofstede's findings. At each point, the preferred situation and the current situation (perceived by observations) are described. 1. In Tanzania the uncertainty inherent in life is slightly feit as a continuous threat which must be
fought. This knowledge can not be translated into a direct guideline for Nectar. 2. The stress feit by Tanzanian employees will give subjective feeling of anxiety. Again no direct
guidelines can be made up from this knowledge. 3. Agression and emotions may at proper times and places be ventilated. This knowledge again can
not be translated into guidelines for Nectar. 4. The Tanzanians accept familiar risks but slightly fear ambiguous situations and unfamiliar risks.
This means that Nectar should create a kind of certainty in it's workplace. So the employees must besure about their bosses expectations, that they belong to the fixed Nectar-crew or not, when they are expected to work, etc.
5. Tanzanians feel what is different as dangerous. This can be translated in the same advise as given in point 4.
6. The Tanzanian employees feel a slight need for rules. Translation to the workplace gives that it must be clear to the employees what is acceptable and what is not. So existing rules have to be
62
made clear and lived at consequently. From observation it seems that the feit need for rules is not realised by the Nectar GM. lf it is, the rules are oot used consequently.
7. According to Hofstede, Tanzanian people subscribe the statement that time is money. Observations do not agree with this point. 52
8. The supposed emotional need to be busy and inner urge to work hard, neither is observed among the Tanzanian employees.50
9. The statement that precision and punctuality come naturally. Again, observations do oot agree with this point.50 But if Hofstede's assumption is true, it can be used by giving clear orders. The orders will be executed well. Nectar could use this knowledge, by making sure all orders given are perfectly understood by the employees.
1 O.Suppression of deviant ideas and behavior and a resistance to innovation is attributed to the Tanzanian employees. No concrete guidelines can be deduced from this statement.
ll.According to Hofstede, the Tanzanians are motivated by security andesteemor belongingness. This can be used by Nectar by creating some security in the workplace. Creating a group feeling -we work for Nectar- may create the feeling of belongingness. This can be done by giving the employees little token which express the group. When Nectar had bagged 100,000 tonsin total, tshirst were given to their fixed employees. This is a good way to create the group feeling.
Summarising the guidelines deduced from Hofstede's research, Nectar has to realise that their Tanzanian subordinates expect to be told what to do and will not take many initiatives. But when orders are given clearly and in detail, the employees will fulfill their tasks well. For the employees feelings of security and belongingness are very important, this can be used by Nectar. The company should work with a fixed group of people and provide them with job security. Giving the people symbols ofthe group, like for example t-shirts, will help to create feeling ofbelongingness.
n I suspect that Hofstede has mixed up his tables.
63
CHAPTERIV SUMMARY, CONCLUSIONS AND RECOMMENDATIONS
4.1 SUMMARY
Research questions
The following main research questions were formulateel prior to the research: 1. Through what form of joint venture can the THA-grain terminal best be privatised in view of the
government aims? 2. How can the cargo throughput ofthe THA-grain terminalbe improved? For both main research questions, relevant sub questions were formulateel.
Methodology with respect to identification best joint venture form
The methodology with respect to the identification of the best joint venture included the following steps: • Review ofthe policy ofthe Tanzanian government with respect to privatisation
Literature used to fmd the government policy regarding privatisation were two publications by the Parastatal Sector Reform Commission (PSRC): Parastatal privatisation and reform: Masterplan and 1994 review and action planfor 1995 and beyond. From these documents the government's aims with respect to privatisation became clear: improving the efficiency of all parastatal enterprises. The joint venture to be designeel had to meet those aims as well as possible. Six main divestiture methods are known by the government, of which one is a joint venture.
• Review of the policy of the T anzanian government with respect to the privatisation of THA The government policies regarding privatisation of THA are briefly described in the PSRC publications mentioned: in the long term THA bas to be privatised, but step by step. Condusion of a performance contract is a step in the direction of commercialising and privatising. PSRC decided that the THA-grain terminal is the frrst part ofTHA to be privatised and a joint venture was chosen as divestiture method. Within THA no policy regarding privatisation exists, the TRA-management was waiting for the outcome of the Commercialisation Study, performeel by consultants of the World Bank. Their report was not fmished yet, but the facts and statements from the interim report were used. From other literature it became clear that, due to the economical characteristics of harbours, it is unwise to privatise seaports fully.
• Review of ways and means to create joint ventures Through literature study, the characteristics of joint ventures were found and baseel on these the following defmition was developed: a joint venture is an enterprise run by at least two companies which stay independent economically as well as juridically, and which have a shareel interest in the business. From literature, seven types of joint ventures were distinguished. Those were put in a table with their characteristics and application specification. Only one type, the production and manufacturingjoint venture, is applicable to the THA-grain terminal.
• Review of relevant aspects focuseel on the privatisation ofthe THA-grain terminal Within THA, the grain terminal is to be privatiseel fust, by means of a joint venture. THA' s aims with respect to the grain terminal joint venture were studied, and all laws and regulations with regard to joint ventures, as well as the fmancial and Iabour aspects. Information publisheel by THA, the Investment Promotion Centre and Ministry of Justice were useel. The aims of all organisations
65

involved in the privatisation and all information found regarding joint ventures were put in a table and the current division of responsibilities between TRA-terminal management and the private stevedoor Nectar, which will become the joint venture partner, were maped. Analysis of those facts was the following step.
Methodology with respect to improvement cargo throughput THA-grain terminal
The methodology with respect to the impravement of the cargo throughput of the THA-grain terminal included the following steps: • General comparison of Dar es Salaam and Rotterdam ports
From both ports important information was collected with regard to the traffic, economie importance, organisational structure, functional features, trends and future expectations.
• Comparison of Dar es Salaam and Rotterdam ports focusing on dry bulk cernmodities The goods flow of the dry bulk was described for both the port of Rotterdam and Dar es Salaam. Ship arrival procedures, discharging, bagging and transport were described in detail, as wellas all exports procedures. Also the belonging documentation was described.
• ldentification of useful harbour performance indicators and their application to Dar es Salaam and Rotterdam ports Congestien in portsis a serious problem, which should be tackled. The United Nations Conference on Trade and Development {UNCTAD) developed a set of port performance indicators, which reileet the situation of a port. The set consists oftwo parts: fmancial and operational indicators. For both ports the indicators were calculated and compared as far as possible.
• Identification of a suitable method to improve the goods flows of THA-grain terminal To find a suitable method to analyse and improve the goods flow, four logistical theories applicable to the grain terminal's production process were studied: Material Requirements Planning (MRP-1), Justin Time (JiT), the Theory of Constraints (ToC) and the Method of Integral Steering (MIS). The ToC was chosen asthebest method to improve the grain terminal's process.
• Application ofthe suitable method (Theory ofConstraints) The Theory of Constraints leads to an iterative, five step process, which was applied to the grain terminal only once. In the first step the system' s constraints were identified and in the second step it was decided how those constraints are to be exploited. Next step was subordination of all other capacities to the exploitation of the other constraints. Then the elevation of the constraints was considered. Then it was checked whether a eenstraint had been broken.
• Identification of possible cultural bottie necks in the THA-grain terminal organisation, using Hofstede' s method Hofstede developed a method to measure a country's culture in four indexes: for all countries involved in the grain terminal management he calculated the indexes. Two of the indexes were particularly interesting for working situations: the Power Distance Index (POl) and Uncertainty A voidance Index (U AI). The conclusions Hofstede drew, because of the scores of Tanzania, were compared with observations. The outcome was used as a basis on which guidelines how to deal with the cultural differences were developed for the Nectar management.
66

4.2 CONCLUSIONS
Best joint venture form
The review of the general and specific (THA and THA-grain terminal) privatisation aims of the government of Tanzania and a scan of other relevant aspects with respect to privatisation through joint venture constructions, revealed the following aims and aspects (see table 4.1).
Aims government
AimsTHA
Aims THA-grain terminal
Aims IPC
Laws and Regulations
Table 4.1
Aims and conditions for new grain terminal joint venture
improve operational efficiency improve profitability expand role of private sector encourage wider participation by people in O"Mlership and management create more market oriented economy to enhance access to foreign capita! and technology develop capita! market preserve self relience commercial enterprises become available for foreign and local investors
long term contractual arrangement with private contractor reasonable return on investment (what is reasonable?)
tempormy private participation in mgt GT, to achieve: !ncreasing pr<?fitability 1mprove efficiency maximise utilisation of facility
maximisation of foreign exchange earnings and savings enhancement of import substitut10n activlties which achieve identifiable substantial foreign exchange savings expansion of food productJ.on achievement of a h1gh degree of technology transfer creation of employment opportunities and the development ofhuman resources efficient utilisation, expans10n and diversification of the productive capacity of existing enterprises provision of services or production of goods which improve linkages between the various sectors of the economy capita!, technica! skilis and raw matenals available to the applicant local materials' supplies and services to be used by the apphcant interests and cond1hons of service ofthe Iabour employed or to be employed by the applicant general promotion and development of enterprises within Tanzania and the need to generate constructive competition among enterprises potential demand, both within the United Republic and elsewhere, for the product or services of the enterprises siting or proposed siting ofthe enterprise in relation to the availability of power, fuel, Iabour, transport, raw materials, land and water promotion ofbalanced and equitable growth throughout the country mterests of potential consumers from mvestment in the enterprise being undertaken
investments only allowed in certain areas; see also appendix B-2 Certificate of Approval needed (granted by IPC, only when aims are met)
67

Financial aspects • foreign investments
• foreign valuta
• fiscal aspects
Staff
Aims and conditions for new grain terminal joint venture
• any foreign investor is allowed to invest in new enterprises, except eertaio areas
• no speciallegislation
• newly found enterprises receive a 5 year tax holiday after tax holiday, import duties on machinery and equipment required (for use only) 5%
o tax on sales: S% o no special taxes for foreign entrepreneurs
o recrutement among local qualified citizens, unless impossible
It is obvious that the current agreement between THA and Nectar is not optimal tomeet the goals set by THA as well as possible. The profitability is directly linked with efficiency and the use of the terminal. Improverneut of the operational efficiency can only he reached when the people responsible for the performance are also responsible for all facets which could influence the performance. In the current contract, the responsibilities are mixed. Nectar is responsible for discharging and baggig, but not for all facets which influence the performance: e.g. Iabour, machines and equipment. Nor has the company final responsibility to it's clients. The utilisation ofthe grain terminal can only he optimised by good marketing ofthe terminal. Another example of mixed responsibilities is the fact that Nectar is responsible for marketing of the terminal, i.e. attracting clients, but not for the management of the terminal's silo.
The THA-grain terminal joint venture should materialise in two steps, starting from the present, unsatisfactory, situation (see tables 4.2, 4.3 and 4.4).
Table4.2
Current division ofresponsibilities THA-grain terminaland Nectar
THA-grain terminal
o fmal responsibility to THA-headquarter, Dar es Salaam-port management,general cargo terminal management and clients
o sr.ace s1lo ownership and management machines and equipment generallabeur
68
Nectar
o discharging o bagging . • mamtenance eqmpment o service equipment
preeurement equipment o training in maintenance and service equipment
marketmg

Table 4.3
Proposed interim division ofresponsibilities THA-grain terminaland Nectar
THA-grain terminal
• sr.ace • silo ownership • machines and equipment
Nectar
• fmal responsibility to THA-headquarter, Dar es Salaam-port management, general cargo terminal management and clients silo-management
• discharging bagging
• mamtenance of equipment service of equipment
• praeurement equipment generallabour
• training future grain terminal management • marketmg
(• training in maintenance and servicing equipment)
Table 4.4
Proposed final division ofresponsibilities THA-grain terminaland Nectar
THA-grain terminal
• final responsibility to THA-head quarter, Dar es Salaam-port management and general cargo terminalmanagement
• SP.ace silo ownership
Nectar
• final responsibility to clients • silo management
machines and equipment • discharging • bagging
mamtenance of equipment • service of equipment
praeurement equipment • generallabour
marketing
Two of the govemment aims will not be met with the fmal division of responsibilities: the aim to encourage wider participation by people in ownership and the aim to develop the Tanzanian capital market The first point can only be met by sale of shares, but because of the strategie importance of the port for the whole country, this is not a good option for the THA-grain terminal. Lack of private capitalis another argument against this solution. As in Tanzania privatisation ofbanks has not started yet, it is impossible to develop a capital market
Impravement of cargo throughput
Harbour performance indicators Comparison of the ports of Rotterdam and Dar es Salaam made clear that differences are too large for a useful comparison. This is due to the differences in dimeosion - the port of Rotterdam is much larger than the port of Dar es Salaam -, the character of the port - in Rotterdam industrial activities around the port are stimulated, while Dar es Salaam is concentraled on transhipment only -, the economie situation ofthe hinterland- Rotterdarn's hinterland is, economically, much larger than Dar es Salaam's hinterland-, the organisational structure- Rotterdam is a landlord port, Dar es Salaam is state owned. Notall UNCTAD port performance indicators could be found, and a comparison without very carefut some considerations is of little use.
69

Theory ofConstraints T o choose the best logistical theory to improve the cargo throughput, a comparison between four logistical production theories was made. The terminal's particular features were taken into consideration: the market demand is exactly known, as the raw material is delivered by the elient This implicates that no stocks have to be kept for unexpected market demand. Another feature is that no semi manufactured products are needed. Due totheir culture, Tanzanian employees do not easily show initiatives and organisations are strongly layered. These arguments were taken into consideration when eliminating the logistical theories. The Theory of Constraints was the only one which survived the selection.
Operational constraints in the organisation of cargo throughput Applying the iterative process to the grain terminal, the following constraints were found: the market demand, the port's entrance channel, the power service, eranes and bagging plants. It must be mentioned that the process has to be repeated endlessly, as it is iterative. Because the proposed changes are not executed, the process can only be passed through once, but it is not likely that streamlining the discharging flow creates a new constraint in this stage.
The Theory of Constraints provided good handle to identify the constraints and elevate them systematically. The method involves staff members, but in case of the THA-grain terminal the white Nectar people will probably be the only ones who come up with ideas. If the method is introduced seriously, the iterative process is repeated endlessly and so the management stays involved in improving the process. ·
Cultural constraints in the organisation of cargo throughput With the help of Hofstede's method the following characteristics of the THA organisation were identified with reference to power distance: inequalities desired among people, authoritarian values on all levels, hierarchy in the organisation, centralisation preferred, wide salary range, subordinates expect to be told what to do, a boss should be a good father and privileges are both expected and desired. With regard to uncertainty avoidance, also differences were found: fear for ambiguous situations and unfamiliar risks, need for rules and motivation by security andesteemor belongingness. As we will see, the cultural bottie necks can conflict with the characteristics ofthe other actors.
Hofstede's method can only be used in combination with observations. Unthinkingly copying his findings would give serious errors: not all features for Tanzania were found during the observation period.
4.3 RECOMMENDATIONS
Best joint venture form
The best joint venture form for the THA-grain terminal, is the current co-operation, modified as indicated in the tables presented earlier.
Improverneut of cargo throughput
In table 4.5 all logistical bottie necks are listed, with recommendations regarding their exploitation and elevation. As the iterative process is only gone through once, it is emphasized that the management should go through the process repeatingly.
70

Constraints
• market demand
• port's entrance channel
• power service
• eranes
• bagging plants
Table 4.5
Logistical constraints and how to upgrade them
Exploitation
• revise marketing ; try to attract more ships
• start export of dry bulk
• optimise 'opening times' by expanding werking times pilots and boarding officers ready to enter ship at herthing
• boarding officers enter ship withpilots discharging equipment and personen ready at herthing
keep generators ready during discharging process
• trimming gangs have to avoid exodus
• ship' s eranes prepared for action
• preventive rnainterrance
• bags and stitching yam have to be available
• workers have to be in time, no breaks for the plants
• shift part of the bagging actiVIties to after storage
• preventive rnainterrance
Elevation
• try to attract more ships
• invest in equiP.ment which makes it poss1ble to pilot without daylight and adapt werking times boarding officers
• invest in deepening and widening entrance channel
. --
• use ship 's eranes increase no. of hoppers
• purcasing another bagging capacity
Depending on the expenses, not all elevations are realistic to execute. Some of the recommendations, the most expensive ones, will influence the whole port, and not only the grain terminal. Decisions regarding these constraints can be considered by the TRA-management.
Solving cultural bottie necks The cultural bottie necks found have to be dealt with by the Nectar management. The following recommendations could be ofuse: Nectar has to realise that their Tanzanian subordinates expect to be told what to do and will take few initiatives. But when orders are given clearly and detailed, the employees will fulfill their tasks well. For the employees feelings of security and belongingness are very important, this can be used by Nectar. The company should work with a fixed group of people and provide them with job security. A feeling of belongingness can be created by giving the people small token, like t-shirts.
Further research
Hofstede's theories are suitable for the identification of possible cultural constraints. It would be interesting to investigate how the theories can be operationalised into concrete advise for the grain terminal's rnanagment
71

REFERENCES
Association of Tanzania Employers, The, Salient things you should know about the Iabour laws (Dar es Salaam: ATE, 1988).
Bank of Tanzania, Economie Bulletin of the quarter ended 31st December 1995, Dar es Salaam: Bank of Tanzania, 1996).
Cox, J., Goldratt, E.M., The goal: a processof ongoing impravement (Worcester: Gower, 1989).
Cox, J., Goldratt, E.M., The goal: supplement (Worcester: Gower, 1989).
Duane Hall, R., The internationaljoint venture (Boston: Praeger publishers, 1984).
Encyclopeadia Britannica, Britannica book ofthe year 1995 (Chicago: Britannica Inc., 1996).
Encyclopeadia Britannica, Britannica World Data Annua/1995 (Chicago: Britannica Inc., 1996).
Gelders, L., Wassenhove, L. van, Produktiebesturingssystemen: een vergelijking van MRP, Kanban en OPT(Antwerpen: Economisch en Sociaal Tijdschrift, 1984).
Goor, A.R. van, Kruijtzer, A.H.L.M., Esmeijer, G.W., Goederenstroombesturing, voorraadbeheer en materials handling (Leiden/Antwerpen: Stenfert Kroese, 1990).
Hilten, H.W. van, De joint venture als vorm van samenwerking ten opzichte van enkele andere vormen (Apeldoorn: TVVS, 1970).
Hoekstra, Sj., Romme, J.H.J.M., Op weg naar integrale logistieke structuren (Deventer: Kluwer Bedrijfswetenschappen, 1985).
Hofstede, G., Culture 's consequences: international differences in work-related values (London/ Beverly Hills: Sage publications, 1980).
Hofstede, G., Cultures and organisations: software ofthe mind, Institute for research on intercultural cooperation (IRIC) (London: McGraw-Hill Book Company, 1991).
Hoyle, B., Charlier, J., Inter-port competition in developing countries: an East African case study, Joumal of Transport Geography, Volume 3, No.2, (New York: Elsevier Science Ltd., 1995).
Investment Promotion Centre, The National fnvestment (Promotion and Protection) Act, Principal Legislation, no. 10 of 1990 (Dar es Salaam: Govemment Printers, 1992).
Kienbaum Development Services, HPC Hamburg Port Consulting GmbH, BCS, Interfmas, Commercialisation study: Interim report, (Hamburg: THA, 1995).
Koenders, P., Development of a trajjic planning system at Tanzania Railways Corporanon (1RC): effects of liberalization policies on Tanzania Railways Corporation (Eindhoven, Eindhoven University ofTechnology, 1994).
Ministry of Justice, Foreign fnvestment (Protection) Act, Act 1963, no. 40 (Dar es Salaam: The Republic ofTanganyika, 1963).
72

Ministry of Justice, The security of employment act; Act no. 62 of 1964-Cap, Amenciment by Act 45 of 1969 and no. 1 of 1975 (Dar es Salaam: Geverrunent Printers, 1976).
Ministry of Transport, Performance contract between The Government of the United Republic of Tanzania and Tanzania Harbours Authority (Dar es Salaam: Geverrunent Printers, 1994).
Muther, R., Haganäs, K., Systematische Materiaalstroom en Transport Analyse (SHA) (Zoetermeer: Algemene Verladers en Eigen Vervoer Organisatie, 1979).
Organisation for Economie Co-operation and Development, Competition policy and joint ventures (Paris: OECD, 1986).
Presidential Parastatal Sector Reform Commission, Parastatal privatisation and reform: Masterplan, The United Republic of Tanzania (Dar es Salaam: Goverrunent Printers, 1993).
Presidential Parastatal Sector Reform Commission, 1994 review and action plan for 1995 and beyond, The United Republic of Tanzania (Dar es Salaam: Goverrunent Printers, 1995).
Rotterdam Municipal Port Management, Annual report 199 5 (Rotterdam: RMPM, 1996).
Directie Haveninnovatie, Trend rapport 1994, (Rotterdam: HaveninformatieBank DHI033/94, 1994).
S.L.I. consultants, Dar es Sa/aam Port Development Study 1994-2004, Volume 1: Executive summary (V ancouver: THA, 1994 ).
S.L.I. consultants, Dar es Sa/aam Port Development Study 1994-2004, Volume 2: Shipping and trajjic forecasts (V ancouver: THA, 1994).
S.L.I. consultants, Dar es Sa/aam Port Development Study 1994-2004, Volume 3: Port operations and terminal management (Vancouver: THA, 1994).
S.L.I. consultants, Dar es Sa/aam Port Development Study 1994-2004, Volume 4: Port characteristics and silulation (Vancouver: THA, 1994).
Sluis, L., JIT and TOC: uitwisseling van ideeën en implementatie-ervaringen (Deventer: Kluwer Bedrijfswetenschappen, Tijdschrift voor inkoop en logistiek, 1993).
Tanzania Harbours Authority, Annual Report 1983184, Dar es Salaam: THA, 1984).
Tanzania Harbours Authority,Annual Report 1988189, Dar es Salaam: THA, 1989).
Tanzania Harbours Authority, Annual Report 1989/90, Dar es Salaam: THA, 1990).
Tanzania Harbours Authority, Annual Report 1990/91, Dar es Salaam: THA, 1991).
Tanzania Harbours Authority,Annual Report 1991/92, Dar es Salaam: THA, 1992).
Tanzania Harbours Authority,Annua/ Report 1992/93, Dar es Salaam: THA, 1994).
Tanzania Harbours Authority, Tender documents for participation in the management ofthe grain terminal at the port of Dar es Sa/aam (Dar es Salaarn: THA, 1994).
Thomson, J.M.,Modern transport economics (Harmondsworth: Penguin, 1974).
73

United Nations Conference on Trade and Development,Manual on a uniform system of port stafistics and performance indicators (Geneva: UNCTAD, 1983).
United Nations Conference on Trade and Development, Port Performance Indicators (Geneva: UNCTAD, 1976).
Verhoef, J.M., Vervoers-en haveneconomie: tussen actie en abstractie (Leiden/Antwerpen: Stenfert Kroese B.V., 1981).
Vollum, R.B., Managing constraints for optimum Jactory synchronization (Falls Church: The American Production and Inventory Control Society (APICS), 1988).
Vuylsteke, C., Techniques of Privatization of state-owned enterprises, volume 1 (Washington: The World Bank, 1989).
The World Bank, Staf! appraisa/ report: Tanzania port modernisation project II (Washington: The World Bank, 1990).
The World Bank, World Development Report 1994: Infrastructure for development (Washington: The World Bank, 1994).
74

Appendices

APPENDIX A-1 BACKGROUND INFORMATION ABOUT PORT DEVELOPMENT IN EAST AFRICA
To give some insight in the history of East African ports and the influence of the past in the present, part of the artiele Inter-port competition in developing countries: an East Africal case study is publisbed integrally taken over below. 1 The figures can be found at the end of the article.
Historica( perspectives
The chronological development of port activity on the East African coast may be divided into two periods of very unequal length, the frrst stretching from the frrst millennium AD to the mid-19th century and the second from the later 19th century to the present day. Both periods illustrate the processes of inter-port competition and port concentration, but in different ways. The coastal zone of Kenya and Tanzania (figure 1) now constitutes the maritime facade of a developing region of considerable economie potential, and forms a vital outward-looking link with the rest of the world. This orientation is, in a sense, largely a product of the last 200 years, for during all the long preceding centuries the coastlands were for trading purposes little more than part of the western shore of the Indian Ocean, dependent in commercial terms upon the seasonal reversal of winds bringing sailing vessels from the north-east between November and March, and facilitating their return from early April. Within this coastal environment successive generations built up widely differing hierarcbies of seaports, which comprised important if rather peripheral elements within the widespread network of trading towns and ports stretching in medieval times from eastem Africa through south-westem Asia to China.
The earliest surviving description of the extemal trade relations of East Africa is to be found in the Periplus ofthe Erythraean Sea (Huntingford, 1976), a guide to the commerce ofthe Red Sea and the Indian Ocean written at some time in the frrst or second century AD by a Greek trader living in Alexandria. The hook describes a voyage along the East African coast and mentions, inter a/ia, the trading port of Rhapta which was subsequently described as a 'metropolis' in Ptolemy's Geographia (Stevenson, 1932). The site of Rhapta, which seems to have been East Africa's frrst focus of port concentration, has never been satisfactorily identified, although it has commonly been associated with the Rufiji delta in Tanzania. In early medieval times port activity was quite widely dispersed along the Kenya coast, and several locations -including Pate, Manda, Lamu, Malindi and Mombasa- were seaports of significance, whereas Kilwa was the only major commercial centre on the coast of Tanzania. In a context of interport competition, each of these ports probably dominated in turn varying areas of coast and hinterland, their fluctuating comparative importance reflecting their varying fortunes in trade and in warfare. Most trading eentres were based on defensive islands which conferred a clear advantage. Mombasa Island is known to have been settled as a maritime trading post in the 11 th century, and it began to take shape as a town with the Shirazi migrations (from southem Arabia and southem Persia) in the 13th century.
The late Middle Ages were marked by a much fuller development of Islamic civilization, with rapid urban expansion and trade development especially in the 14th century, possibly associated with improved environmental and political conditions. The full development of Arab settlements and their trade and culture on theEast African coast in the 15th century, dominated by Mombasa, immediately preeerled a period of decline. At the end of that century, and from the south, 'the resless energy of western Europe intruded upon the East African coast like an unseasonable monsoon for which the inhabitants were totally unprepared' (ingham, 1962, p.6). The Portuguese programme of African coastal exploration culminated in the celebrated voyage of Vasco de Gama to India in 1497-99. He was impressed by the port and town of Mombasa, but received a warmer welcome at Malindi, where he erected a padrào or stone cross and found a pilot to guide him across to Calicut.

APPENDIX A-1
In spite of competition from a variety of other ports along the East African coast, Mombasa had clearly emerged by the 16th century as a centre of sustained port dominance, as no other port along this coast possessed its combination of positive situation and site factors. Soon the 13th century Shirazi town, on the eastern side of the island facing the Old Mombasa Harbour, was paralleled and eventually superseded by the Portuguese town of the 16th and 17th centuries. Which today provides the essential framework of the traditional urban core. The overall effect of Portuguese intervention on the East African coast was, however, negative; Mombasa maintained an attitude of open revolt against their authority from the time of Da Gama's first arrival in 1497 until their fmal withdrawal to the south earlyin the 18th century. The impressive Fort Jesus now stands as the only substantial physical monument to Portuguese rule (Kirkman, 1964), and as a mark of Mombasa's long-continued importance as a maritime trade centre and as a port city of significance.
Whereas the 18th century was a period of rather low-level, dispersed port activity on the East African coast, the 19th century brought significant changes. The rising tide of Arab-controlled slave trading severely disrupted the economie and social fabric of the hinterlands, and the offshore island of Zanzibar (selected by the Omani Arabs as a regional emporium, and today part of Tanzania) became the chief centre of trade and innovation. The re-entry of Europeans on the East African scene in the later 19th century coincided with important technological changes: the opening of the Suez Canal (1869), the change from sail to steam as a means of propulsion of vessels, the rapidly increasing size of ships, and the growing importance of railways. A combined result of these innovations was that in the early European colonial period arterial railways were built from port sites (Mombasa, Tanga and Dar es Salaam) selected fortheir ability to accommodate larger steamers in a context of increasing trade with Europe via Suez, and fortheir relationships with potentially productive runterlands (Hili, 1949, 1957; Ramaer, 1978; Amin et al, 1986) (Figure 2).
In Kenya, Mombasa was the principal beneficiary in this process of port concentration whereby a traditionally fluid port pattem became crystallized as more capacious, sheltered, deep-water harbours replaced the minor inlets and open shorelines previously used by smaller vessels. In Tanzania, the German authorities selected Tanga and Dar es Salaam as the ocean termini of their railways to the interior. The intention to build railways, themselves powerful agents of innovation and economie transformation in the hinterlands, was the immediate cause of concentratien of interestand activity on appropriate modern deep-water seaports. This process of rail construction from selected port sites took place in many colonial territories around the world, and not only effected a marked degree of port concentration but also set the scene for subsequent inter-port competition. Mombasa and Dar es S alaam were both particularly fortunate at this point in time, for their general geographical location and their specific site conditions enabled each to establish and maintain a central place in the modern economie life of the East African coastal zone.
The rise of the modern East African port system
The modernprocessof port concentratien in East Africa effectively took place in the 1890s, when the beginnings of modern port development coincided with the start of railway construction to the hinterlands. The point of departure for the modern port of Mombasa was the purebase in 1895 of land near Kilindini Harbour as a base from which to direct the building of the railway through interior Kenya to Lake Victoria. Using Mombasa as an initial base, Britain had assumed political control of Kenya in 1895, and (as elsewhere) a standard procedure was to consolidate that control with an outline transport infrastructure, beginning with a railway to the interior from a selected port site. Mombasa was the obvious choice, as an established town, with a deep-water harbour of recognized potential. From these beginnings, the port of Mombasa has grown throughout the 20th century, starting with lighterage wharves at Mbaraki and proceeding upstream from 1926 to 1958 with deep-water general cargo berths along the noth-western shore of the island. From the 1960s to the present day, additional deepwater berths and various farms of specialized quayage including a container terminal and oil-reception
ii

APPENDIX A-1
facilities have been added on the mainland at Kipevu. There are long-term plans to extend these facilities, in the context of a maritime industrial development area, along the southem side of Port Reitz.
The degree of port concentration experienced in Tanzania during colonial and post-colonial times has been less marked. In German East Africa (1895-1919) it was originally intended to build three railways from different coastal ports: a norhem line from Tanga towards Kilimanjaro; a centralline from Dar es Salaam to Lake Tanganyika; and a southem line from Kilwa towards Lake Malawi. The third of these was never built, although the modem Tanzania-Zambia railway (completed in 1975) is in a sense its present-day equivalent; and there were laso proposals to extend the centralline towards Rwanda, and the norhem line to Lake Victoria (Gillman, 1942). The intention was to create a more wide-spread diffusion of port activity, economie exploitation and politica} control, and to avoid the apparent overconcentration on Mombasa shown by the British in Kenya.
Tanga was the frrst of the modem seaports of the East African mainland to he developed, its primary role being to serve the agricultural economy of the northem part of the territory, initially based on coffee and rubber, later on sisal. A small jetty was built in 1892 to receive imported railway construction materials, and this marks the beginning of the modem process of port development on this site. The port has not, however, grown very substantially, for two main interrelated reasons: there are no deepwater facilities (other than a specialized fertilizer jetty); and the hinterland, although productive in cash-erop terms, is geographically limited. The Tanga-Arusha railway has notbeen extended to its proposed terminus at Musoma on Lake Victoria, despite politica} interest reiterated by Uganda. In a more prosperous economy than that of modem Tanzania, it is possible that Tanga might have been expanded as a deep-water port; the fact that it has not done so illustrates not only its own intrinsic weakness but also the overriding power of maritime factors in encouraging port concentration on larger centres, in this case the primary Tanzanian seaport of Dar es Salaam. Barge carriers would he an appropriate technica} innovation at Tanga, as insome West African ports (hilling, 1983), but these expensive vessels are not used in East Africa at present.
Dar es Salaam has actually captured most of Tanga's potential trafiic aftera link was opened in 1963 between the northem and central lines, from Korogwe to Ruvu (Hoyle, 1965; O'Connor, 1965). Previously much ofthis traffic was diverted to Mombasa along the Voi-Moshi feeder line completed in 1924, whose use has been marginal after the collapse of theEast African Community in 1977 and the correlative break-up ofthe East African Railways Corporation as wellas ofthe East African Harbours Corporation that ended regional cooperation in the field of transport. Both before and after these events, Tanga offers a good example ofthe 'shadow effect' arising from the opening of branch lines to major ports 'siphoning' the hinterland of a minor one. In the container era, this is an even more limiting factortoport growth; a comparable case is that of the new port of Taichung, 'sandwiched' between Keelung and Kaoshiung on Taiwan's west coast (Todd and Hsueh, 1990; Todd, 1993).
The Germans originally chose Bagamoyo, seaward terminus of the trans-Tanzanian Arab caravan trade route to Lake T anganyika and beyond, as their chief port and seat of govemment. By 1891 it became obvious, however, that the sheltered harbour at Dar es Salaam, where a new Arab portand town had been founded in 1867, was more suitable. lt was thus from Dar es Salaam that the construction ofthe central railway began in 1905, reaching Kigoma in 1914. During the pre-First World War years, the Germans established a port-hinterland system with clear objectives, a logical structure and considerable potential for further development. Moreover, the system was designed toserve not only German East Africa (which included Rwanda and Burundi, then known as Ruanda-Urundi) but also eastem Zaïre (formerly Belgian Congo) and, ultimately, Zambia and Malawi (Rance and Van Dongen, 1958).
When, after the defeat of Germany, Tanganyika emerged as a League ofNations territory, the role of Dar es Salaam as a port serving extra-territoria! areas was recognized by the incoming British administration. In 1921 sites at Dar es Salaam and Kigoma were leased to the Belgian Govemment to
iii

APPENDIX A-1
facilitate traffic flows to and from the then Belgian Congo. This link was further underscored when, in 1956, three deep-water berths were opened at Dar es Salaam, one of which was financed by the Belgian government; and a commission was established to facilitate traffic flows through the port to and from Zaïre, Rwanda and Burundi. The growth of Dar es Salaam has been stimulated from the later 1960s onwards by increases in Zambian traffic, and additional deep-water berths were constructed in the 1970s with fmancial support from the Zambian government.
Two further elements in the diffusion of modem port activity on the Tanzanian coast remain. One is the port of Zanzibar, which continues to serve the economy of the offshore islands but no longer fulfils its 19th-century role as a regional emporium (Hoyle, 1983). The other is the deep-water port of Mtwara, in the far south of Tanzania, which was opened in 1954 (Brookfield, 1955) together with a short railway to serve an ill-conceived agricultural development scheme focussed upon groundnut production (hogendom and Scott, 1983). The scheme failed, the railway was removed in 1963, and the harbour and port facilities at Mtwara remaio seriously underutilized. From time to time, as pressure on the prima te T anzanian port has increased, suggestions have been made that some traftic might be diverted to Mtwara or to Tanga. Shipping companies, however, and land transport organizations, have not generally supported this idea. Although modem port development in Tanzania is more diffuse than in Kenya, the degree of concentration on the primate port is in many ways just as strong.
[ 1] Hoyle, B., Charlier, J., Inter-port competition indeveloping countries: an East African casestudy, Joumal of Transport Geography, Volume 3, No.2, (Elsevier Science Ltd, 1995, p.89-95).
"'•v : ~'9 '" ."d •8 1
-M•O'IRo.a I - "··-.-, i -OdP.p-:
o So•m
KENVA
Figure I The coast of Kenya and Tanzania
iv

APPENDIX A-1
ZAMBIA
0 c9
Main Road
--+--+- Railway
SU DAN
Oil Pipeline
International Boundary
/
• Major Airport
e Other Airport
KR Kenya Railways
UR Uganda Railways
TRC Tanzania Railways
(
.r ._. _,.. MOZAMBIQUE
TAZARA Tanzania-Zambia Railway
...-.. .--· ., -·--1
/
I I I
I I
\ sOMALlA
I
INDIAN OCEAN
SNCZ Société Nationale des Chemins de Fer Zaïrois
TAZAMA Tanzania-Zambia Pipeline
0 100 200 300km
I Kisurn u I location of iniand container depot [~~a location of proposed inland container depot
Figure 2 TheEast African transport systcm
V

APPENDIX B-1 PERFORMANCE CONTRACT AND EVALUATION
Performance contracts - an outline
A performance contract is a formally signed document, negotiated and agreed between government and management. The contract includes clear specifications of the: • enterprise's commercial objectives, and how non-commercial objectives, if any, will be fmanced • performance standards and indicators for performance measurement • enterprises' undertaking to government, based on a formal action plan to remedy any deficiencies in
performance • limits of management authority • government' s undertakings to the enterprise • planning and budget approval procedure • process for monitoring contract compliance • management incentives and sanctions for non-performance • procedures for arbitration and settiement of disputes
Prerequisites for successful negotiations and adherence to a contract require: • clear and authoritative analysis ofthe enterprise's problems • recognition, by government, of the problems • commitment to action • agreement to place relations on a stabie long-term basis • greater management autonomy, subject to performance monitoring
The main issues that arise in the implementation of contracts centre on: • deciding who should represent the parties contract • identifying and satisfying contract prerequisites • setting appropriate targets • establishing processes for monitoring, review and arbitration • setting management authority limits
Representation ofthe parties to the contract can be a difficult and emotive issue, because the contract may require major changes in the attitude of government and the role and constitution of the enterprise' s Board of Directors.
On the government side, representation may be made through the parent ministry or · through a committee drawn from several interested ministries. Where government has been closely involved in running a public enterprise, the introduetion of a performance contract probably requires bigger changes of attitude for the line ministry than for the enterprise. If the spirit of the contract is observed, the govemment's power to interfere in the day-to-day operations of the enterprise will be reduced~ otherwise it is impossible to hold management responsible for unsatisfactory performance.
On the enterprise side, the executive management team must be able to determine policy and commit the enterprise to a contract. Frequently performance contracts result in a change in board memhership to insure at least a majority of executive directors.
Contract prerequisites - the action required in preparation for contract drafring and negotiation includes: • preparation of a corporate plan by enterprise management • quantification and planned settiement of mutual indebtedness • agreement on the defmition and classification of commercial and non-commercial objectives • agreement on the principle of rewards and sanctions and acceptance by government that rewards for

APPENDIX B-1
better than expected performance may exceed normal public service pay level • agreement on the appointment of an independent chairman or mediator. A mediator is required
during the contract negotiations and to assist in resolving any subsequent disputed
Setting targets - experience bas shown that reporting, monitoring and performance evaluation become unnecessarily difficult if too many indicators are selected. On the other hand a single indicator may lead to too narrow a management focus, particularly if a mix of fmancial, operational and service targets is to be met. It is important to ensure that the indicators reflect management's ability to manage. Where there is relative commercial freedom and a competitive market, profit-related measures are best (with adjustment for social obligations), but profit is rarely a good yardstick ifit is influenced by factors ouside management's control- for example, control over price setting.
Monitoring, review and arbitration - to ensure adequate performance monitoring and review, the enterprise will need to report in a prescribed format to the agency appointed by government for the purpose. The enterprise therefore needs adequate accounting and management information systems. The review body must have people with relevant industry sector experience to interpret the reports and to build rapport with enterprise management. The ~eview body must be seen not as a watchdog but as a supportive group, objective but sympathetic to the enterprise's problems.
Management authority limits - a performance contract is aften arranged for an enterprise that is classified as strategically important and that is intended to remain in the public sector for the forseeable future. Government is therefore likely to want to retain control over some features of the enterprise's operations. These may include prices, quality and coverage of services to consumers and the level of users charges; in some countries controls may extend to personnel procedures and pay scales. As shareholder, government will also wantsome control over capital expenditure and level of borrowing. Same limits to management's authority will have to be included in the contract. These may be resisted by management, who will tend to view them as limitations totheir 'commercial' outlook and autonomy. The need is for balance between gaveroment's right to ensure consistency with its macro economie and social objectives and the freedom and motivation of managers.
Source: Presidential Parastatal Sector Reform Cornrnission, Parastatal privatisation and reform: Masterplan (Dar es Salaam: Gaverrunent Printers, 1993).
ii

! !
I
I
/ILL f'ORTS
FINANCIJIL PERFORMANCE
a). Actun on caphal employed ..
b). Pre 13X p-oflt marcins
DAR ES SJILAAM PORT
OPERATIONS & QUAUTY OF SERVICE
(a} Praductivity
-GenQrgo {Tons/GallJ/ShffQ
-Containe" (moves per 24 trs}
b}. Shlp llrn-round (days In po
-Gen ca-go ~ -~-Qxnaine' -
) c). Unit Casts
~ Shipcosts
- Marine (per ship) S - Sl!Neá:l"ing
" . Gen Cërgo (per dwt) $
• Container (per TEU)S
i~ $hipper casts
- Sten handling
. Gencargo • Container (per iEU)
- VJharfage
• All ca-oo (per dwll
J TANGAPOOT
I Ui"t:AATIU'I::i & QUPUTY CF SERVICE
a). ProduC1ivity
-GenCërgo (T~ilt)
b}. Ship llrn-round(days In por
-Gen Ca-go -. ! MlWAAA PORT
OPEAATIONS & QUPUTY OF SERVICE
a). Productivlty -
-Gen Ca-go (Tons.Gang/Shlf\)
APPENDIX B-1
TANZANIA HARBOURS AUTHORITY PalFORMANeE AN/ILYSIS (1992i9J)
pUT Tl.JR'; POINTS '1, "-VAU\BL[
ACTU/IL TARGET TAAGET 11.33 7.32 154 •. 76 - 20
3.880.035.645 7.925.706.000 48.96 15 35 -
pur TUR- POINTS ')> ~VAL.ABU
ACTU/IL TARGET TAAGET
171.20 140.00 122.29 4.00 240.40 286.00 63.47 7.00
)
3.80 4.00 105.26 3.00 .2.10 <:;lrO 51UIS 6.00
-
53.12 69.76 131.36 2.00
1.35 o.n 57.04 2.00
46.76 34.86 74.59 12.00
1.28 1-.41 110.16 2.00 161.18 115.10 71.41 10.00
1.55 5.12 330.32 2.00 50.00
UUI IUHrl ~~~~ ')>
ACTU/IL TARGET TARGET
193.80 170.00 114.00 6.00
1.80 2.00 111.11 4.00 10.00
-PUTTUR- POINTS
')> A.VAl.ABU .ACTU/IL TARGET TAAGET
- --
80.00 110.00 72.73 2.50
b). Shlp llrn-rounCI(days In po- I)
-GcnCroo 3.60 4.00 111.11 2.50 5.00
GAAND .I OT liL 100.00
iii
ANNO< 02
TOT/IL
SCORE 30.96
7.34 36.30
TOT AL
SCORE
..
4.89 5.84
3.16 -5.33
-
2.63
1.14
8.95
l
2.20 7.14
6.61 47.90
lUl .PL.
SCORE
6.84
~.44
11.28
TOT/IL
SCORE
1'.82
2.78 -4.60
102.08

APPENDIX B-1
TANZANIA HARBOURS /\LJTHORITY EV/\LUATION OF PERFOF1MANCE TARGETS
1'. I_ L P 0 I! T S ·1 ' .,. s...-f·\. ~ .....
Month... 1 D'-1 >
o) Return on capita! employee!
b) Pre- tax profit margins ( EX_I'I~I':~~E il ,w;;: (IFI_~ I_:\ 1 ?'l i~'l
OAR ES S/\U\1\M OPEn/\TIONS & OU/\UTY OF SEnVICE a) Productivily • - Gen Cnrgo (Tonz/Gnng/Shift)
- Contniner (moves per 24 hrs)
b) ShiJ1 turnro.und (days in port) - Gen. Cêtrao
Conti1incrs
l H l!T CO ~;r!; ,11 Sl11p cost:; ... r•!lilrinc (per ::;hip) s
Stcvrwon11~
- Gen Cargo (per clwt) :5 - Containers (per TEU) S
b) Shippcr cost<; - share handling
-Gen Cargo $ - Contnmcr::; {per ·rEU) :3
' i ·-----· . - --· .. _1
L--------~ I ,
_!. -- .. ·- -··-' --
1\CTUJ\L
!. J;;3.lt'1-I - ·-
3:)<:;.'.;~~ , ..
., , .. '+· C.l-_
i -·
2.. :2.7-
i
!-- ·-·· --· . - . -- --! ; __ ---- ______ ! I ; ' I ' I I I
! I ' __ , 1 .•
T/d1C[i , .. . •.;
1:3.90
12.50; I
TA11GET
1<10.00
288.00
•LOO: :2.40
0.77 3·i.88.
1.41 ;
11 S. 10
---·· -- -- -- ·- ---- __ .J ______ ---. ....... _ _L ______ ,. ___ ..
'ANGA PORT . OP'r::RÄTió'NS '& ÖU/\LITY OF SERVICE
... ~- A'ëi'LJAL ___ r_TÄiiGËT ·- J
-- --··· ---~--- - - ·-· ----~- ------ -...
a) Productivity • - Gen Curgo (Tons/G~ilrJ/Shifl) t'' ~ · b) Ship turnround (day::: in port) *'
- Gen. CéHG~' .1· '5:;;
' '
MTWJ\R/\ POilT
Î 70.0(J
2.00'
. OPËniü'tö~ïs .& ÖÜ/\ÜI'Y. 1\crlii\C~!-TÄ!ÏGET ·--: OF SEI\V!CI:
a) Productivili' • ; - Gen CnnJO (Tonr.iG<angiSI11ft) 1 Q :.1..· u;:. i 110.00;
b) Ship turnrou mi (day:; in port) " 1 I
- ~-~~-- Cnr~~ . .. . . .. . _L~---~ ... ~· ~~~J.._ . _ 4.00:
SOURCE: .. Oircctorélte of Planning ( ~~L"\ {h..;. w . ) "' Oin;!ctomtc of Finance
iv

APPENDIX B-Il AREASOF INVESTMENT KNOWN BY IPC
Three areas for investment are known by IPC: priority areas, controlled and reserved areas and activities reserved for local investors. The last type of areas is exclusively reserved for Tanzanians.
natoral resources
tourism
manufacturing industries
petroleum and mining
construction
transport
transit trade
controlled areas
reserved areas
Priority areas for investment
forestry, ~shing ~d fish farming, game eropping for conunercial purposes, wlldlife ranching
operation of taurist hotels, other accomodations, taurist transportation (mcluding raad transport, air charters and oceangoing vessels), provision of services related to tourism, such as taurist safaris (mei. licensed hunting, restaurants and photographic services)
animal feed processing, agro-based industries, beverages, textiles, leather goods, steel and metal engineering, cement and ceranucs, electrical engmeering, printing and publishing, pharmaceutical, fish processing and c~g. fish n~ts. pac~g. general processing, botties and glass ware, pamts, automobve engmeermg
the exploration and production of: oil and gas, gold, diamonds, gemstones, and all other mmerals, metallic and non-metallic
hotels and other taurist accomodation, residential houses, conunercial buildings, warehouses, industrial sheds, estates and factory buildings
roads haulage, coastal shipping, air charters and air lines
activities relating to the transit of goods to neighbouring countries, and to the re-export of goods have value added in Tanzania
Controlled and reserved areas
investments large enough to qualify for the application of incentive packages under this policy statement and which are in the following areas of maJ~r ~conomic unp~~ance. T!lls area ~hall normally be reserved for pubhc mvestment or JOmt pubhc and pnvate enterpnses, though exceptions may he made: iron and steel production, machine tools manufacture, chemical fertilizer and pesticides production, airlines
the following areas of strategie importance are reserved exclusively for investment by the public sector, except where speciallicenses may he granted. IPC will, from time to time, advice the gaveroment on such areas: the manufacture, marketing and distribution of armaments and explosives of all types, the generation and distribution of electricity in urban areas or through the national grid, the provision of public water for dornestic and industnal purposes; the building and operabon of all railways; radio and television oroadcasting; postal and teleconununications services (but not necessarily the procuetnon of equipment and accessanes thereof); insurance and assurance services; banks

exclusively reserved areas
areas which foreign investors with less than US$ 250,000 or some other amount which may be stipulated by IPC from time to time will be excluded
APPENDIX B-Il
Activities reserved for local investors
retail or wholesale trade; product brokerage; business representation for foreign companies; operation of public relations business; operation of taxis; barher shops, hairdressing and beauty salons; butchenes; ice-cream making and parlours
travel agencies; car hire service; bakeries, confectioneries and good processmg for the local market; tailoring of garments for the dornestic market; buildings repair and decaration units; manufacture of house and office fumiture for the dornestic market
ii

APPENDIX C-1 DRY BULK SHIPPING ROTTERDAM AND DAR ES SALAAM
Transhipment of dry bulk (mt) in portsof Rotterdam and Dar es Salaam
Port of Rotterdam Dar es Salaam port
1994 tot al 3,952,300 tata/ 247,700 grains 2,671,100 grains fertiliser 1,276,700 fertiliser sugar 4,500 sugar
1995 total 3,684,200 total 202,000 2,493,600 grams 1,186,100 fertiliser
4,600 sugar
Source: Bulk grain/fertilizer handling returns- 1994, 1995, THA-grain terminal; Haven Informatie Bank, RMPM, 1994, 1995.
193,800 53,900
202,000

APPENDIX C-11 DOCUMENTS INVOLVED IN BOTH INWARD AND OUTWARD CARGO
Bill of Lading This document belongs to the transport agreement and has three functions: • prove of receipt ofload • transport agreement between transporter and keeper of Bill of Lading • gives keeper of Bill of Lading right to the load
Certificate of Shipment In the Certificate of Shipment is written exactly which goods for transport are transhipped with a eertaio ship. Is handed out after departure.
Certificate of Loading Document given out when export is allowed.
Certificate of Origin This document is asked for by the buyer in case of goods from a eertaio country for which lower import tariffs apply.
Declaration and Disposal Order Document which cao be surrendered against goods (via other document: Gate Pass)
Export Acceptance and Shipping form Custom' s document which is handed out when export is allowed.
Freight Note Document which cao be surrendered against the goods (via other document: Notify Address)
Manifest On the Manifest, data regarding the shipment are stated. Most often, data regarding the cargo and the freight are given on separate documents: Freight Manifest and Cargo Manifest. Freight Manifest: document used to calculate the freight rate. Information on the document:
weight in kilo's, freight tons, rate of freight, charges, etc. Cargo Manifest: document with cargo information, like: number and kind of packages, gross
weight, measurement volume of cargo and other remarks regarding the cargo.
Outturn Report Report on which all discharging facts are stated: date of discharging, quantity of discharging and way of discharging. This report is written after the discharging.
Shipping Order Document with general description of each shipment of cargo, the order number, weight of shipment, name and expected time of arrival of the vessel, the country of origin and port and country of destination.
Unloading List On this list all facts regarding the coming discharging are stated: quantity of discharging, type of cargo, etc.

APPENDIX C-111 SUMMARY OF STATEMENTS OF FACTS
Arrival Name Tons No. of Tons/gang Tot. berth Delay time Date discharged gangs (m tons) time (hrs)"' (hrs) (%)
14-11-94 M.V. Al Baky 13.740 75 183 210 23,2 11 '1
17-11-94 M.V. Ektor 19.950 92 217 240 38,0 15,8
25-01-95 M.V. Soya 9.800 42 233 133 32,1 24,2
27-02-95 M.V. Rokos Vergatlis 14.118 70 202 193 51,2 26,5
5-04-95 M.V. Seapace 9.000 54 167 158 48,6 30,8
30-05-95 M.V. Lamda 12.318 69 179 198 43,6 22,0
20-06-95 M. V. Promina 15.000 41 366 n.a. 26,4 n.a.
11-03-95 M.V. Her An 13.150 54 244 190 56,7 29,9
12-05-95 M.V. Overseas Hariette 10.683 73 146 177 73,9 41,8
Totaal 117.759 570 207 1497 393,7 24,5
• Time from berthing till last grab discharged Note: with delay calculations in% M.V. Promina is excluded
eau se delay time time av. berth time/ship (hrs) (%) hours 166
1 ra in 81,7 20,7 days 6,9 2 ship 20,9 5,3 3 shunting 0,4 0,1 tonsiship hr berth 4 transport 81,3 20,6 79 5 Iabour 104,5 26,6 6 operational 34,3 8,7 % time gangs idle 7 crane 14,1 3,6 0,262922 8 power 46,0 11,7 9 others 10,5 2,7
393,7 100,0
At the next pages a summary of the statements of facts of each of the nine ships can be found.
The total delay is calculated as follows: (delay/no. of lines in operation) * no. of lines delayed The causes of the delays is given in figures; the legend is shown below. Sametimes further explanatio is given, but not all Statements of Facts were so detailed.
Note: Delays veroorzaakt door transport zijn niet erg betrouwbaar, omdat het niet duidelijk is in hoeverre de lijnen werkelijk stilgelegd worden!
appendix c-3
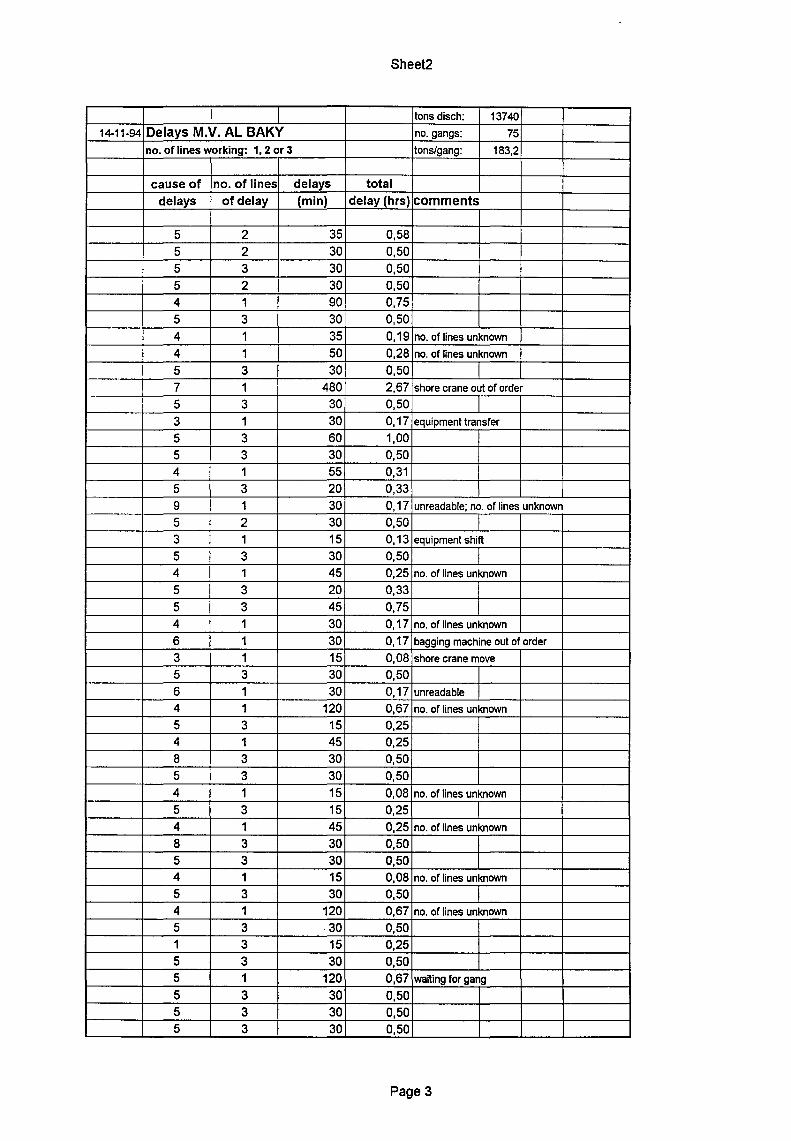
Sheet2
tons disch: 13740
14-11-94 Delays M.V. AL BAKY no. gangs: 75
no. of ti nes working: 1, 2 or 3 tons/gang: 183,2
cause of no.oflines delays tot al delays of delay (min) delay (hrs) comments
5 2 35 0,58
5 2 30 0,50
5 3 30 0,50
5 2 30 0,50 4 1 90 0,75
5 3 30 0,50
4 1 35 0,19 no. of lines unknown
4 1 50 0,28 no. of Jines unknown
5 3 30 0,50
7 1 480 2,67 shore crane out of order
5 3 30 0,50
3 1 30 0,17 equipment transfer
5 3 60 1,00
5 3 30 0,50 4 1 55 0,31
5 3 20 0,33 9 1 30 0,17 unreadable; no. of lines unknown
5 2 30 0,50 3 1 15 0,13 equipment shift
5 3 30 0,50 4 1 45 0,25 no. of lines unknown
5 3 20 0,33
5 3 45 0,75 4 1 30 0,17 no. of lines unknown
6 1 30 0,17 bagging machine out of order
3 1 15 0,08 shore crane move
5 3 30 0,50 6 1 30 0,17 unreadable
4 1 120 0,67 no. of lines unknown
5 3 15 0,25 4 1 45 0,25 8 3 30 0,50 5 3 30 0,50 4 1 15 0,08 no. of lines unknown
5 3 15 0,25 4 1 45 0,25 no. of lines unknown
8 3 30 0,50 5 3 30 0,50 4 1 15 0,08 no. of lines unknown
5 3 30 0,50 4 1 120 0,67 no. of lines unknown
5 3 30 0,50 1 3 15 0,25 5 3 30 0,50 5 1 120 0,67 waiting for gang
5 3 30 0,50 5 3 30 0,50 5 3 30 0,50
Page 3
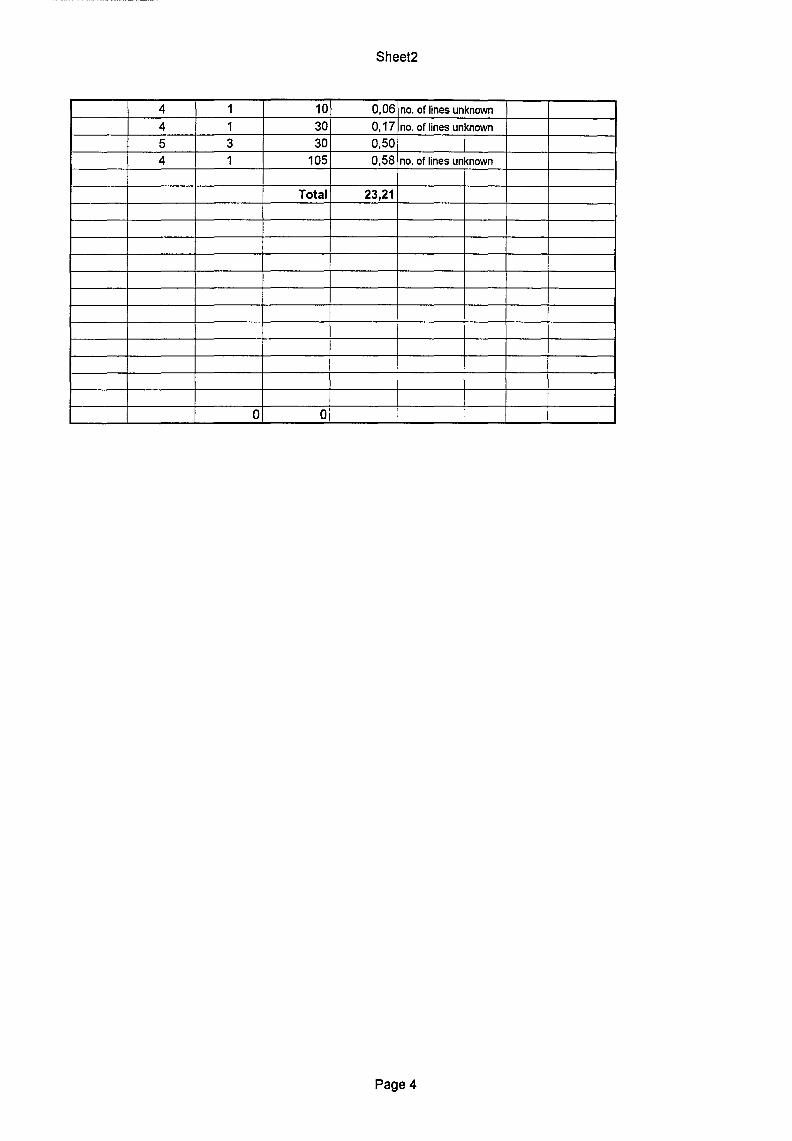
Sheet2
4 1 10 0,06 no. of lines unknown
4 1 30 0,17 no. of lines unknown
5 3 30 0,50 4 1 105 0,58 no. of lines unknown
Total 23,21
0 0
Page4

Sheet3
tons disch. 19950
17-11-94 Delays M.V. Ektor no.gangs 92 no. of lines werking: 1 or 3 tons/gang 217
cause of no. of lines delays tot al delays of delay (min) delay (hrs)
5 3 15 0,25 6 1 95 0,53 4 3 10 0,17 4 1 90 1,50 4 1 105 1,75 4 1 165 0,92 4 1 60 0,33 5 3 30 0,50 5 3 30 0,50 4 2 30 0,75 5 2 15 0,50 4 3 80 1,33 5 3 25 0,42 4 1 30 0,17 4 1 35 0,19 5 3 30 0,50 5 2 35 0,58 5 2 30 0,33 5 3 35 0,58 4 1 30 0,17 5 3 30 0,50 4 1 130 0,72 5 3 30 0,50 5 3 30 0,50 5 4 30 0,50 5 4 30 0,50 5 4 20 0,33 8 4 76 1,27 5 4 30 0,50 4 3 40 0,50 4 1 35 0,15 4 1 60 0,25 4 1 55 0,23 5 4 30 0,50
4;8 4 330 5,50 5 4 10 0,17 4 3 25 0,31 4 2 30 0,25 4 2 60 0,50 5 4 30 0,50 4 2 50 0,42 4 2 40 0,33 4 1 30 0,13 5 4 15 0,25 5 4 15 0,25 4 1 30 0,13 8 4 30 0,50
Page 5
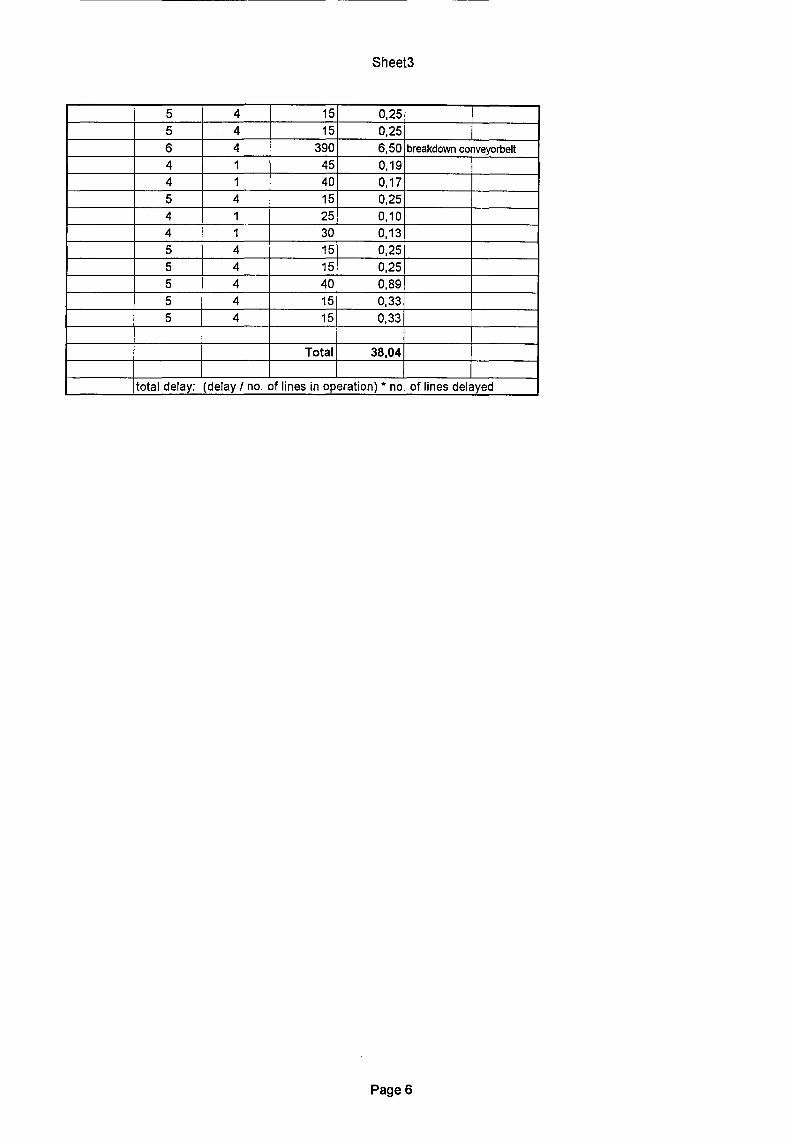
Sheet3
5 4 15 0,25
5 4 15 0,25
6 4 390 6,50 breakdown conveyorbelt
4 1 45 0,19
4 1 40 0,17
5 4 15 0,25
4 1 25 0,10
4 1 30 0,13
5 4 15 0,25
5 4 15 0,25
5 4 40 0,89
5 4 15 0,33
5 4 15 0,33
Total 38,04
total delay: (delay I no. of lines in operation) * no. of lines delayed
PageS

Sheet4
tons disch: 9800
25-01-95 Delays M.V. Soya· na. gangs: 42
tons/gang 233
cause of no.oflines delays total delays of delay (min) delay (hrs)
2 3 90 1,50 waiting for ship
2 3 50 0,83 preparing ship
9 3 30 0,50 waiting for health officers
6 3 35 0,58 opening the hatches
5 3 30 0,50
6 1 180 1,00 empty bags bis
6 1 80 0,44 preparing plant
6 3 300 5,00 black out gt; unknown delay!
8 3 15 0,25
5 3 45 0,75
6 1 25 0,14 bagging plant out of order
5 3 30 0,50
4 3 45 0,75
5 3 30 0,50
5 3 45 0,75
5 3 40 0,67
4 1 50 0,28 na. of lines unknown
4 1 45 0,25 na. of lines unknown
6 1 35 0,19 bagging machine out of order
4 1 20 0,11 na. of lines unknown
5 3 20 0,33
4 2 80 0,89 na. of lines unknown
5 3 40 0,67
8 3 75 1,25 5 3 60 1,00
4 1 15 0,08 na. of lines unknown
5 3 40 0,67
8 3 120 2,00 7 1 135 0,75 crane out of order
5 3 330 5,50 lack of crane drivers
5 3 30 0,50 6 1 105 0,58 conveyor belt out of order
6 3 110 1,83 awaiting for bags
5 3 30 0,50
Total 32,06
Page 7

SheetS
!ons disch: 14118
28-02-95 Delays M.V. Rokos Vergottis no. gangs: 70
!ons/gang: 202
cause of no. of lines delays tot al
delays of delay (min) delay (hrs)
2 3 180 3,00 ship arrival
9 3 30 0,50 awaiting health officer
4 3 240 4,00 no trucks available
5 3 15 0,25
5 4 30 0,50
4 4 60 1,00
5 4 35 0,58
9 4 60 1,00 ramadan meal break
1 4 165 2,75
5 4 15 0,25
5 2 35 0,58
4 2 55 0,92 no trucks
5 4 30 0,50
9 4 60 1,00 ramadan meal break
5 4 15 0,25
1 4 100 1,67
5 4 30 0,50
4 2 30 0,25
4 1 45 0,19
5 4 35 0,58
4 2 10 0,08 4 1 15 0,06
1 4 75 1,25
4 4 45 0,75
5 4 20 0,33
5 4 30 0,50 8 2 410 3,42 8 2 90 0,75 8 4 270 4,50 4 2 40 0,67 1 2 70 1 '17 5 4 35 0,58 lew tonnage due to no trimming gangs!
8 4 240 4,00
1 4 60 1,00 5 1 45 0,19 awaiting for share crane driver
5 1 30 0,13 awaiting for share crane driver
5 2 35 0,58 5 2 25 0,42 lew tonnage due to no trimming gangs
5 2 35 0,58 5 2 15 0,25 8 2 195 3,25 5 2 30 0,50 1 2 105 1,75 4 1 30 0,25 5 2 35 0,58 5 2 15 0,25 4 2 160 2,67
Page 8

SheetS
I 5
I 1
I TJ .::::1
Page 9

SheetS
tons disch: 9000
5-04-95 Delays M.V. Seapace no. gangs: 54 no. of lines werking: 2 or 3 tons/gang: 167
cause of no. of lines delays tot al delays of delay (min) delay (hrs)
2 3 480 8,00 vessel no werking
5 3 30 0,50
9 3 90 1,50 waiting for agricult. officer order
5 3 35 0,58 5 2 15 0,25
5 2 30 0,50 5 2 30 0,50 4 1 30 0,25 4 1 50 0,42 5 2 30 0,50 6 1 45 0,38 waiting for pallets
5 2 60 1,00 4 1 35 0,29 1 2 45 0,75 5 3 15 0,25 1 3 340 5,67 5 3 35 0,58
6 3 70 1 '17 preparing bagging machines
1 3 125 2,08 5 3 30 0,50 5 3 540 9,00 no labourers!
5 3 40 0,67 6 3 65 1,08 preparing bagging machines
1 3 60 1,00 7 1 30 0,17 crane out of order
1 3 30 0,50 7 1 5 0,03 crane out of order
1 3 60 1,00 5 3 30 0,50 1 3 15 0,25 5 3 30 0,50 4 1 30 0,17 5 3 45 0,75 7 1 435 2,42 crane out of order (impossible to work?) Crane from hatch
5 3 20 0,33 5 3 30 0,50 7 1 45 0,25 grab out of order
5 3 45 0,75 5 3 30 0,50 1 3 60 1,00 7 1 50 0,28 crane out of order hatch
5 3 30 0,50 1 3 20 0,33 6 1 80 0,44 one plant machine out of order
Total 48,58
Page 10

Sheet7
lens disch: 12318
30-05-95 Delays M.V. LAMBDA no. gangs: 69 no. of lines working: 2 or 3 lens/gang: 179
cause of no. of lines delays total delays of delay (min) delay (hrs)
2 3 180 3,00 awaiting ship arrival
9 3 40 0,67 awaiting port health officers
2 3 20 0,33 preparing ship
9 3 210 3,50 awailing health officer
2 3 90 1,50 awaiting ship's order
4 3 300 5,00
5 3 30 0,50
6 3 150 2,50 awailing for emply bags
8 3 30 0,50
5 3 30 0,50
5 3 30 0,50 4 2 40 0,44
4 3 150 2,50 stop discharging due to no trailer!!!
5 3 30 0,50
6 3 170 2,83 awaiting empty bags
8 3 30 0,50
5 3 15 0,25
5 3 20 0,33
5 3 30 0,50
4 1 60 0,33 no. of lines unknown
5 3 30 0,50
6 1 15 0,08 no. of lines unknown
5 3 30 0,50
8 3 45 0,75
5 3 50 1,25
4 1 20 0,17
4 1 10 0,08
4 1 40 0,33
4 1 30 0,25 4 1 30 0,25
4 1 20 0,17 4 1 30 0,25
5 3 15 0,25
4 1 30 0,17 4 1 25 0,14 4 1 105 0,58 4 1 80 0,44 5 3 30 0,50 8 3 55 0,92 5 3 15 0,25 4 1 75 0,42 5 3 30 0,50 4 1 75 0,42 4 1 130 0,72 5 3 30 0,50 6 1 65 0,36 bagging plant belt break down
8 3 115 1,92
Page 11

Sheet7
5 3 10 0,17 4 1 30 0,17 5 3 30 0,50 4 1 125 0,69 5 2 35 0,58 5 2 15 0,25 7 1 60 0,50 share crane out of order
1;5 2 45 0,75
8 2 15 0,25 5 1 20 0,33
Total 43,56
Page 12

~~~~~~~~~~~~-------- -----------------~~~~~~~~~~~~~~~~~~~~~~~~~~~-
Sheets
20-06-95 Delays M.V. Promina tons disch: 15000
no. of lines working: 1 or 3 no. of gangs: 41
tons/gang: 366 cause of no. of lines delays tot al
delays of delay (min) delay (hrs)
5 3 10 0,17
4 3 105 1,75
5 3 35 0,58
4 3 45 0,75
4 3 120 2,00 4 3 60 1,00
5 3 5 0,08
4 3 45 0,75 8 1 105 0,58
8 1 180 0,58
5 3 35 1,00 4 3 75 1,25
5 3 40 0,67 4 3 90 1,50
5 3 10 0,17
5 3 60 1,00
5 3 35 0,58
4 1 65 0,36
5 3 30 0,50
4 3 50 0,83 town trucks
5 3 40 0,67 partly late arrival, partly allocation
4 3 40 0,67
5 3 60 1,00 late arrival
4 3 480 8,00
Total 26,44
Page 13
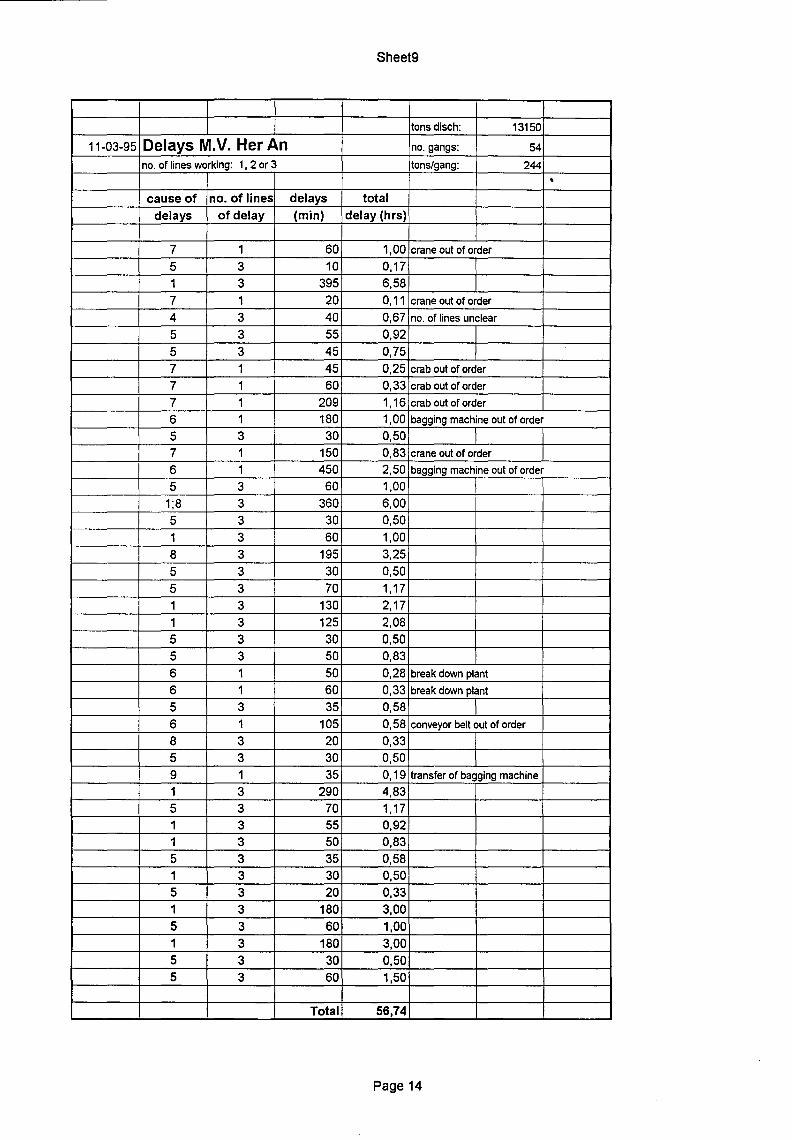
Sheet9
tons disch: 13150
11-03-95 Delays M.V. Her An no. gangs: 54
no. of lines werking: 1, 2 or 3 tons/gang: 244
• cause of no. of lines delays tot al
delays of delay (min) delay (hrs)
7 1 60 1,00 crane out of order
5 3 10 0,17 1 3 395 6,58 7 1 20 0,11 crane out of order
4 3 40 0,67 no. of lines unclear
5 3 55 0,92 5 3 45 0,75 7 1 45 0,25 crab out of order
7 1 60 0,33 crab out of order
7 1 209 1,16 crab out of order
6 1 180 1,00 bagging machine out of order
5 3 30 0,50 7 1 150 0,83 crane out of order
6 1 450 2,50 bagging machine out of order
5 3 60 1,00 1;8 3 360 6,00 5 3 30 0,50 1 3 60 1,00 8 3 195 3,25 5 3 30 0,50 5 3 70 1,17 1 3 130 2,17 1 3 125 2,08 5 3 30 0,50 5 3 50 0,83 6 1 50 0,28 break down plant
6 1 60 0,33 break down plant
5 3 35 0,58 6 1 105 0,58 conveyor belt out of order
8 3 20 0,33 5 3 30 0,50 9 1 35 0,19 transfer of bagging machine
1 3 290 4,83 5 3 70 1,17 1 3 55 0,92 1 3 50 0,83 5 3 35 0,58 1 3 30 0,50 5 3 20 0,33 1 3 180 3,00 5 3 60 1,00 1 3 180 3,00 5 3 30 0,50 5 3 60 1,50
Total 56,74
Page 14

Sheet10
tons disch: 10683
10-05-95 Delays M.V. Overseas Hariette no. gangs: 73
no. of lines werking: 2 or 3 tons/ gang 146
cause of no.oflines delays total delays of delay (min) delay (hrs)
2 2 15 0,25 waiting for ship arrival
9 2 45 0,75 waiting for port health and immigration officers
5 2 30 0,50 6 2 90 1,50 preparing plant machines
7 1 210 1,75 crab out of order
2 2 150 2,50 5 3 30 0,50 6 1 60 0,33 preparing plant machines
4 3 90 1,50 4 1 75 0,42 no. of lines unclear
4 1 75 0,42 no. of lines unclear
4 1 60 0,33 no. of lines unclear
5 3 30 0,50 4 3 105 1,75 4 3 58 0,97 1 3 20 0,33 1 3 15 0,25 1 3 20 0,33 4 3 70 1 '17 8 3 45 0,75 6 1 90 0,50 bagging machine out of order
5 2 35 0,58 6 1 45 0,38 waiting for bit
6 1 15 0,13 belt out of order
6 1 45 0,38 waiting for bit
6 1 60 0,50 belt out of order
4 1 60 0,33 4 1 30 0,17 4 1 30 0,17 4 1 60 0,33 4 1 10 0,06 4 1 20 0,11 5 3 40 0,67 4 1 30 0,17 9 1 60 0,33 late start
4 1 15 0,08 4 1 35 0,19 4 1 50 0,28 5 2 10 0,17 4 1 30 0,25 4 1 45 0,38 1 2 160 2,67 1 3 225 3,75 5 3 45 0,75 8 2 65 0,72 5 3 35 0,58 4 1 125 0,69 no. of lines unclear
Page 15

Sheet10
4 1 100 0,56 no. of lines unclear
4 1 45 0,25 no. of lines unclear
8 3 15 0,25 5 3 25 0,42 1 3 25 0,42 1 3 150 2,50 1 3 330 5,50 5 3 25 0,42 1 3 60 1,00 5 3 25 0,42 8 3 25 0,42 8 3 15 0,25 8 3 30 0,50 1 3 60 1,00 4 1 45 0,25 no. of lines unclear
4 1 120 0,67 1 3 330 5,50 5 3 15 0,25 5 3 35 0,58 8 3 35 0,58 1 3 20 0,33 1 3 30 0,50 1 3 45 0,75 8 3 5 0,08 5 3 15 0,25 4 1 10 0,06 no. of lines unclear
4 1 0 0,00 unreadable
4 1 0 0,00 unreadable
1 3 0 0,00 unreadable
5 3 30 0,50 4 3 60 1,00 no. of lines unclear
8 3 210 3,50 5 3 45 0,75 1 3 45 0,75 5 3 15 0,25 1 3 10 0,17 1 3 105 1,75 1 3 60 1,00 4 3 85 1,42 no. of lines unclear
7 1 205 1,14 crane out of order
8 3 30 0,50 5 3 30 0,50 8 3 30 0,50 7 1 90 0,50 crane out of order
5 3 30 0,50 4 3 10 0,17 9 3 30 0,50 waiting for the cargo to be trimmed from the hatch
1 3 155 2,58 4 1 20 0,11 no. of lines unclear
Total 73,88
Page 16

APPENDIX C-IV CULTURE AND ENTERPRISES
GENERAL
Vérité en-deça des Pyrénées, erreur au-de/à
Blaise Pascal, 1623-16621
In his hook Culture 's consequences Hofstede explores the differences in thinking and social action that exist between memhers of 40 different modern nations. 2 He argues that people carry 'mental programs', which are developed in the family in early childhood and reinforeed in schools and organisations, and that these mental programs contain a component of national culture. Hofstede identifies four main dimensions along which dominant value systems in the 40 countries can be ordered and which affect human thinking, organisations and institutions in predictabie ways. In those 40 countries employees co-operated in the research. Hofsterles next hook, a sequel to his earlier work, was written to help in dealing with the differences in thinking, feeling and acting ofpeople around the globe. 3 Again the dimensions were measured, this time employees of 50 countries and three geographical regions were involved in the survey. Both hooks show that although the variety in people's mind is enormous, there is a structure in this variety which can serve as a basis for mutual understanding. The hooks deal with culture differences. Culturehere does not mean 'civilisation' or 'refinement of the mind', as it is often used, but is meant as the way anthropologists use it, as a collective phenomenon.
What is culture?
Culture is a collective phenomenon, because it is at least partly shared with people who live or lived within the same social environment, which is where it was learned. According to Hofstede culture is covered by bymbols, heroes, rituals and values. In figure I these are illustrated as the skins of an onion, indicating that symbols represent the most superficial and values the deepest manifestations of culture, with heroes and rituals in between.
Figure 1 The 'onion diagram': manifestations of culture at different levels of depth
There are truths on this side ofthe Pyrenees which are falsehoods on the other
Hofstede, G., Culture 's consequences; International diffèrences in work-related values (Beverly Hills-London: Sage Publications 1980).
Hofstede, G., Cultures and organizations; Software ofthe mind, lnstitute for Research on Intercultural Cooperation (IRlC) (London: McGraw-Hill Book Company, 1991).

APPENDIX C-IV
Social anthropology has developed in the flrst half ofthe twentieth century and with it's development it became clear that people in all societies, modem or traditional, face the same basic problems. In 1954 two Americans, the sociologist Alex lnkeles and the psychoiogist Daniel Levinson, published a broad survey of the English language literature on national culture. They found four issues as common basic problems worldwide, with consequences for the functioning of societies, of groups within those societies, and of individuals within those groups: relation to authority, conception of self in particular the relationship between individual and society and the individual's concept of masculinity and femininity and ways of dealing with conflicts, including the control of agression and the expression of feelings [Inkeles and Levinson, 1969, p.447]. Twenty years later Hofstede collected data about the values of people in over 50 countries around the world. A statistica! analysis of the answers on questions about the values of matebed groups in different countries revealed common problems, but with solutions differing from country to country, in the following areas: • social inequality, including the relationship with authority; • the relationship between the individual and the group; • concepts of masculinity and femininity: the social implications of having been bom as a boy or a
girl; • ways of dealing with uncertainty, relating to the control of aggression and the expression of
emotions.
Culture expressed in four dimensions
Hofstede found four dimensions of cultures. A dirneusion is an aspect of a culture that can he measured relative toother cultures. The basic problem areas correspond to dirnensions which Hofstede named power distance (from small to large), collectivism versus individualism, femininity versus masculinity and uncertainty avoidanee (from weak to strong). Each of these terms existed already in some part of the social sciences and they seemed to apply reasonably well to the basic problem area each dirneusion stands for. Tagether they forma four-dirnensional model of differences among national cultures. Each country in this model is characterized by a score on each of the four dimensions. The scores are relative and oot absolute, a country's scoreexpresseshow this particular country scores compared to the other countries. Recently a flfth dirneusion of differences among national cultures was identifled: a long-term orientation in life to a short-term orientation. This dirneusion was discovered by a Canadian, when he was located in the Far East for many years. He studied people's values around the world using a questionnaire composed by Chinese people. This discovery shows that even the minds of the researchers studying culture are biased by their own cultural framework. This flfth dirneusion will he kept out ofthe focus in this essay.
The flrst dirneusion Hofstede measured was power distance, which is defmed as the extent to which the less powerfut memhers of institutions and organisations within a country expect and accept that power is distributed unequally. Institutions are defmed as the basic elements of society like the family, school and the community and with organisations the places where people work are meant. Power distance reflects the range of answers found in the various countries to the basic question of how to handle the fact that people are unequal. The power distance score of a certain country is a relative score to that of other countries. From the mean scores Hofstede developed a power distance index (PDI), which can he calculated for each country.
The secoud dirneusion is a measurement of the degree of individualism in society. Individualism pertains to societies in which the ties between individuals are loose: everyone is expected to look after himself and his or her immediate family. Collectivism as its opposite pertains to societies in which people from berth onwards are integrated into strong, cohesive ingroups, which throughout people's
11
APPENDIX C-IV
lifetime continue to proteet them in exchange for unquestioning loyalty. With the help of a statistica! analysis, the countries' scores are expressed in an individualism index (IDV).
Masculinity versus femininity is the third dimension of societal culture. Masculinity pertains to societies in which social gender roles are clearly distinct (i.e., men are supposed to be assertive, tough and focused on material success whereas women are supposed to be more modest, tender and concerned with the quality oflife). Femininity pertains to societies in which social gender roles overlap (i.e., both men and women are supposed to be modest, tender and concerned with the quality of life). The countries' scores are expressed in the masculinity index (MAS). This dimension is the only one on which the men and women among the group tested scored consistently different, except, in countries at the extreme feminine pole.
Uncertainty avoidance, from strong to weak, is Hofstede's last dimension and defmed as the extent to which the memhers of a culture feel threatened by uncertain or unknown situations. The countries' scores are expressed in the uncertainty avoidanee index (UAI). The UAI is independent of accupation and sex, but there is a correlation between age and the UAI.
The effects of the dimensions in the work place
Although the research report's interest is primarily the consequences of the each dimension for functioning of organisations, not only the consequences in society and the workplace, but also in families and schools are summarized in tables. This is because most people grow up in a family structure and experience their frrst 'cultural programming' within family structures and school system. Later in life, the parent-child and teacher-student relation is complemented with a boss-subordinate relation. For that reason it should not surprise anybody when attitudes towards parents, especially fathers, and towards teachers, which are part of the mental programming, are transferred towards bosses. The tables can be found after discussion of the consequences of cultural differences in the work place.
In the large power distance situation society exists of many layers, and people from lower layers do not expect to be treated as equal by people from higher layers. In the work place this means that superiors and subordinates consider each other as existentially unequal: the hierarchical system is feit to be based on this existential inequality. Organisations centralise power as much as possible in a few hands. Subordinates are expected to be told what to do. In the small power distance society less layers are known and the layers are seen as unwanted. People are supposed to be equal toeach other, unless their position is unequal. The consequences of this attitude in work places are that subordinates and superiors consider each other as existentially equal: the hierarchical system is just an inequality of roles, established for convenience and roles may be changed. Organisations are fairly decentralised, with flat hierarchical pyramids and limited numbers of supervisory personnel. In table 1, these and other aspects which go with the power distance are summarized. It has to be said that within countries with a high PDI, Hofstede found that the large power distance applied to all employees, those with high-status as wellas those with low status. In countries with a smal! power distance, these middle and higher status employees scored significantly lower on PDI than less educated employees. Those employees prefered a power distance almost as high as their colleagues in the large PDI countries.
111

APPENDIX C-IV
Table 1
Key differences between small and large power distance societies general norm, family, school and workplace
(PDI)
small power distance
inequalities among people should be minimized
there should be, and there is to some extent, interdependence between less and more powerful people
parents treat children as equals; children treat parents as equals teachers expect initiatives from students in class teachers are experts who transfer impersonal truths students treat teachers as equals more educated persons hold less authoritarian values than less educated persons hierarchy in organisations means an inequality of roles, established for convenience decentralisation is popular narrow salary range oetween top and bottorn of organisation subordinates expect to be consulted the ideal boss is a resourcefut dernocrat
privileges and status symbols are frowned upon
large power distance
inequalities among people are both expected and destred less powerful people should be dependent on the powerful; in pracuce, less powerful people are polarized between dependenee and counterdependenee parents teach children obedience; children treat parents with respect teachers are expected to take all initiatives in class
• teachers are gurus who transfer personal wisdom students treat teachers with respect both more and less educated persons show almost equally authoritarian values hierarchy in oranisations reflects the existential inequality between higher-ups and lower-downs centralisation is popufar
• wide salary range between top and bottorn of organisation subordinates expect to be told what to do the ideal boss is a benevolent autocrat or good father privileges and status symbols for managers are both expected and popular
Source: Hofstede, G., Cultures and organizations; software of the mimi, Institute for Research on lntercultural Cooperation (IRIC) (London: McGraw-Hill Book Company Limited, 1991, p.37).
lV

APPENDIX C-IV
In an individualist culture, people look after themselves and their nuclear family only. People are supposed to develop an identity and leam to think for themselves. For employees this means that they act according to their own interest and that work should be organised in such a way that this selfinterest and the employer's interest coincide. In a collectivist culture, people are bom into extended families or other ingroups from which the people derive their identity. In exchange for loyalty the group will proteet people. If an employer in a collectivist country does not respect the societal norm to treat their employees as ingroup members, the employees will not repay the employer in terms of loyalty. The key differences in general, in the family structures and in the workplace between collectivist and individualist societies are shown in table 2.
Table 2
Key ditierences between collectivist and individualist societies general norm, family, school and workplace
(IDV)
collectivist
people are bom into extended families or other mgroups which continue to proteet them in exchange for loyalty identity is based in the social network to which one belongs
• children leam tothink in termsof 'we' harmony should always be maintained and direct confrontations avoided high -context communication trespassing leads to shame and loss of face for self and group purpose of education is learning how to do diplomas provide entry to higher status groups
• relationship employer-employee is perceived in moral terms, like a family link hiring and promotion decisions take employees' ingroup into account management is management of groups relationship prevails over task
individualist
everyone grows up to look after himlherself and hislher immediate (nuclear) family only
identity is based in the individual
children leam to think in terms of 'I' speaking one' s mind is a characteristic of an honest person !ow-context communication
• trespassing leads to guilt and loss of self-respect
purpose of education is Iearning how to leam dipiomas increase economie worth andlor selfrespect
• relationship employer-employee is a contract supposed to be based on mutual advantage hiring and promotion decisions are supposed to be based on skilis and rules only
• management is management of individuals task prevails over relationship
Source: Hofstede, 0., Cultures and organizations; software of the min<!, Institute for Research on Intercultural Cooperation (IRIC) (London: McGraw-Hill Book Company Limited, 1991, p.67).
V

APPENDIX C-IV
In feminine cultures, quality of life and caring for others are dominant values, while in masculine cultures material success and progress are most important. As mentioned above, this dimension is the only one on which the men and the women in group tested scored consistently different. The only exception was found in countries at the extreme feminine pole. The consequences of a feminine culture in the workplace are that people workin order to live, against people wholive in order to work in masculine cultures. In feminine cultures, conflicts are solved by compromise and negotiation, while in masculine cultures they are foutht out. The key differences are shown in table 3.
Table 3
Key differences between feminine and masculine societies general norm, family, school and workplace
(MAS)
feminine
dominant values in society are caring for others and preservalion people and warm relationships are important everybody is supposed to be modest
o both men and women are allowed to be tender and to be concemed with relationships in the family, both fathers and mothers deal with facts and feelings both boys and girls are allowed to cry but neither should fight sympathy for the weak
o average student is the norm failing in school is a minor accident friendliness in teachers appreciated boys and girls study same subjects work in order to live managers use intuition and strive for consensus stress on equality, solidarity and quality ofwork life
resolution of conflicts by compromise and negotiation
masculine
o dominant values in society are material success and progress
o money and things are important men are supposed to be assertive, ambitious and tough women are supposed to be tender and to take care of relationships in the family, fathers deal with facts and mothers with feelings girls cry, boys don't; boys should fight back when attacked, girls should not fight
o sympathy for the strong best student is the norm failing in school is a disaster brilliance in teachers appreciated boys and girls study different subjects live in order to work
o managers expected to be decisive and assertive stress on equity, competition among colleagues, and perfomance resolution of conflicts by fighting them out
Source: Hofstede, 0., Cultures and organizations; software of the mimi, Institute for Research on Intercultural Cooperation (IRIC) (London: McGraw-Hill Book Company Limited, 1991, p.96).
VI

APPENDIX C-IV
Uncertainty avoidanee in which culture differences can be expressed. In countries with a low UAI, people feel comfortable in ambiguous situations and with unfamiliar risks. There should be no more rules than are strictly necessary and the ones which exist are respected. In the working place, people feel comfortable when being lazy and work only hard when this is necessary. Precision and punctuality have to be learned. In countries with a high score on uncertainty avoidance, people have fear of ambiguous situations and of unfamiliar risks. There is an emotional need for rules, even if these are unpractical, not used or unfeasible. People work hard by an inner urge and are precise and punctual. In table 4, more keydifferences are given.
Table 4
Key differences between weak and strong uncertainty avoidanee societies general nonn, famil_y ~ school and workplace
(U Al)
weak uneertainty avoidanee
uncertainty is a nonnal feature of life and each day is accepted as it comes low stress; subjective feeling ofwell-being agression and emotions should not be shown
cornfortable in ambiguous situations and with unfamiliar risks lenient rules for children on what is dirty and taboo what is different, is curious students cornfortable with open-ended learning situations and concemed with good discussion teachers may say 'I don't know' there should not be more rules than is strictly necessary time is a framework for orientation cornfortable feeling when lazy; hard-working only whenneeden precision and punctuality have to be leamed toleranee of deviant and innovative ideas and behavior
• motivation by achievement and esteem or belongingness
strong uneertainty avoidanee
• the uncertainty inherent in life is felt as a continuous threat which must be fought high stress; subjective feeling of anxtety aggression and emotions may at proper times and places be ventilated acceptance of familiar risks; fear of ambiguous situations and of unfamiliar risks tight rules for children on what is dirty and taboo w'hat is different, is dangerous students cornfortable in structured learning situations and concemed with the right answers
• teachers supposed to have all the answers • emotional need for rul es, even if these will never
work • time is money
emotional need to be busy; inner urge to work hard
precision and punctuality come naturally suppression of deviant ideas and behav10r; resistance to innovation motivation by security and esteem or belongingness
Source: Hofstede, 0., Cultures and organizations; software of the mimi, lnstitute for Research on Intercultural Cooperation (IRIC) (London: McGraw-Hill Book Company Limited, 1991, p.125).
From the four dimensions of national culture, power distance and uncertainty avoidanee in particular affect people's functioning in organisations. In each organisation the power distribution is important (who bas the power to decide what). What rules or procedures have to be foliowed to attain the desired goals also is of great importance. By plotting power distance and uncertainty avoidanee against each other, the position of a country in the diagram should teil how organisational problems in a country would be solved.
Vll