Embed Size (px)
Citation preview
Eindhoven, August 2015
by Valerio van den Broek
BSc Management, Economics, and Industrial Engineering – Polytechnic University of Milan Student identity number 0871411
In partial fulfilment of the requirements for the degree of
Master of Sc ience in Operations Management and Logist ics
Supervisors:
dr. Oktay Türetken, TU/e IS
dr. Tarkan Tan, TU/e OPAC
Sytze Dijkstra, Accenture
Going greener through BPM:
A method for assessing processes environmental footprint and supporting
continuous improvement

TUE. School of Industrial Engineering
Series Master Theses Operations Management and Logistics
Subject headings: Business Process Management, BPM, Sustainability, Green BPM

i
Abstract Human-‐caused global environmental changes have been recognized to alter the structure and
function of the Earth. Awareness among individuals and organizations has grown bringing to a general consciousness about the problem, and regulations on corporative reporting initiatives have started
spreading. The idea behind this thesis is that methods and techniques offered by Business Process Management can support organisations in achieving sustainability. An environmental extension of Business Process Model & Notation 2.0 (BPMN 2.0) is proposed, together with a methodology for its
application. Implementation on a Business Process Management System (BPMS) considering integration with the organization ERP is considered, and a case study in the semiconductor industry is conducted.

ii

iii
Acknowledgements PURE INSPIRATION, AMAZING PROCESS, WONDERFUL
PEOPLE I am proud to present this research, started from a simple question during class hours, which has
raised many other that came up along the process. The questions emerged have eventually brought to an extensive investigation, that has covered different fields, and has encompasses widespread skills.
Some of them already belonged to my field of expertise, some other were developed during the research period.
The opportunities that were offered to me in this period have been countless. The experience
gained in a competitive environment as Accenture has been extremely stimulating, and the challenges faced have continuously raised my motivation. But it hasn’t been always a bed of roses, and I truly have to thanks a bunch of people if I made it until here.
The guidance of the people that conducted me in this research period has been unequalled. From one side my university mentor, Oktay, that has continuously pushed me seeking answers for unanswered questions, and my second supervisor Tarkan, for his useful feedbacks. From the other, my
manager at Accenture, Sytze, that has spurred me to deliver instruments that could be helpful in practice, for the business, and for the environment.
Then there have been all the people that supported me in this challenging process, which has
shown to have plenty of obstacles and to be fulled with uncertainty. My parents, Laura and Peter, always ready to give a word of comfort, and all the relatives that have been always wishing me good
luck. The best friends I have been walking this period hand by hand with, facing all the same difficulties with each own project, Anna and Vittorio, and all the others that have been cheering and stimulating, besides giving me always a good time. The amazing colleagues that have been with me for
these seven months, standing shoulder by shoulder on the field for the daily battles, especially Manon, Tijmen, Cindy, Tariq and Ayham, helping sometimes with a useful clue, and many times with laughs and jokes.
Without all of you this work would not have been possible. Thanks!
iv
Executive summary
Introduction & Background
World-‐wide population increase matched with increasing living standards, have
enhanced the use of natural resources and raised pollutants emissions in the atmosphere. Awareness is growing within individuals and
governments have taken action on the issue: among others the Netherlands (Neslen, 2015), the EU (The European Parliament, 2014), and
the USA (Office of the Press Secretary, 2015). Common practise is reporting about the Green House Gases (GHGs) produced: sometimes
voluntary, mostly required by regulations.
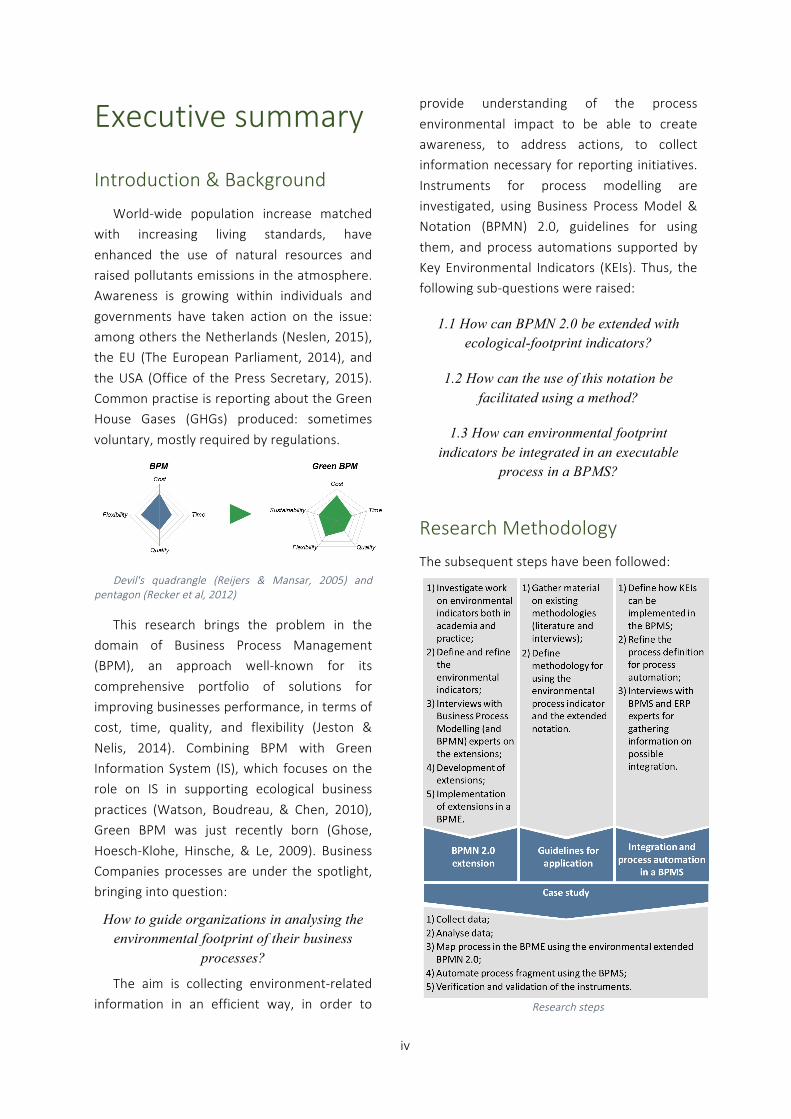
Devil's quadrangle (Reijers & Mansar, 2005) and pentagon (Recker et al, 2012)
This research brings the problem in the domain of Business Process Management (BPM), an approach well-‐known for its
comprehensive portfolio of solutions for improving businesses performance, in terms of cost, time, quality, and flexibility (Jeston &
Nelis, 2014). Combining BPM with Green Information System (IS), which focuses on the role on IS in supporting ecological business
practices (Watson, Boudreau, & Chen, 2010), Green BPM was just recently born (Ghose,
Hoesch-‐Klohe, Hinsche, & Le, 2009). Business Companies processes are under the spotlight, bringing into question:
How to guide organizations in analysing the environmental footprint of their business
processes?
The aim is collecting environment-‐related information in an efficient way, in order to
provide understanding of the process
environmental impact to be able to create awareness, to address actions, to collect information necessary for reporting initiatives.
Instruments for process modelling are investigated, using Business Process Model & Notation (BPMN) 2.0, guidelines for using
them, and process automations supported by Key Environmental Indicators (KEIs). Thus, the following sub-‐questions were raised:
1.1 How can BPMN 2.0 be extended with ecological-footprint indicators?
1.2 How can the use of this notation be facilitated using a method?
1.3 How can environmental footprint indicators be integrated in an executable
process in a BPMS?
Research Methodology
The subsequent steps have been followed:
Research steps
v
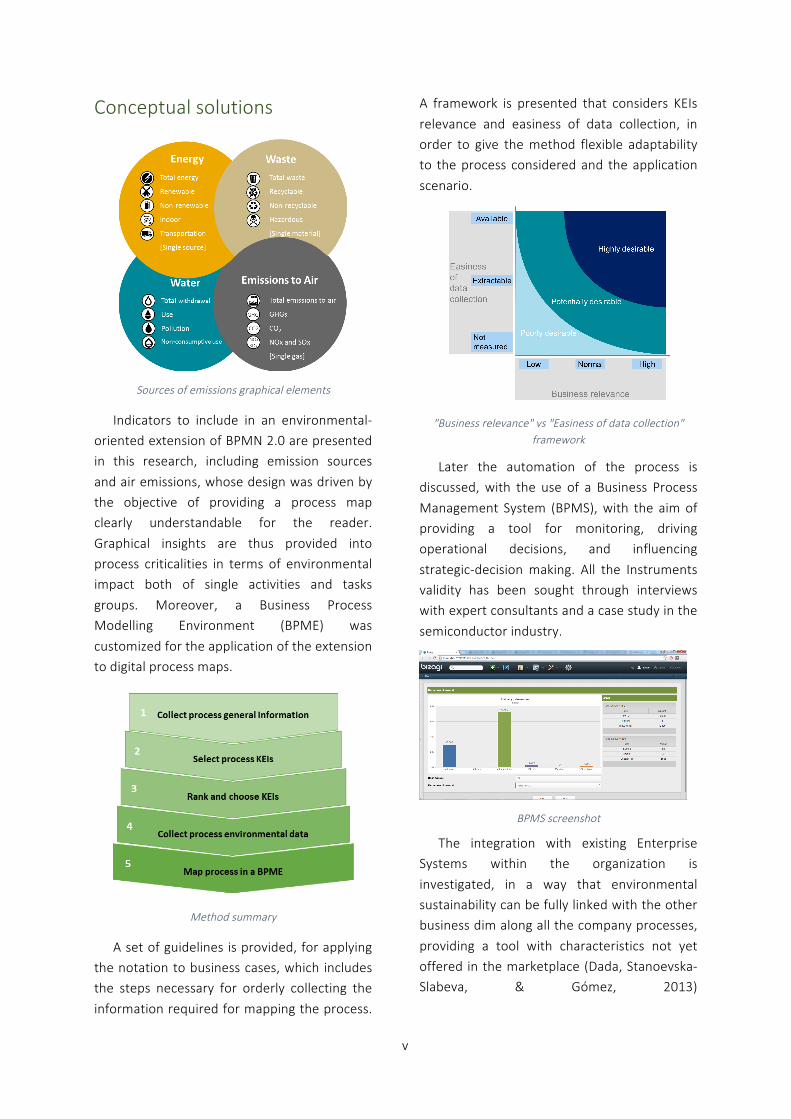
Conceptual solutions
Sources of emissions graphical elements
Indicators to include in an environmental-‐oriented extension of BPMN 2.0 are presented in this research, including emission sources
and air emissions, whose design was driven by the objective of providing a process map clearly understandable for the reader.
Graphical insights are thus provided into process criticalities in terms of environmental impact both of single activities and tasks
groups. Moreover, a Business Process Modelling Environment (BPME) was
customized for the application of the extension to digital process maps.
Method summary
A set of guidelines is provided, for applying the notation to business cases, which includes the steps necessary for orderly collecting the
information required for mapping the process.
A framework is presented that considers KEIs
relevance and easiness of data collection, in order to give the method flexible adaptability to the process considered and the application
scenario.
"Business relevance" vs "Easiness of data collection" framework
Later the automation of the process is discussed, with the use of a Business Process
Management System (BPMS), with the aim of providing a tool for monitoring, driving operational decisions, and influencing
strategic-‐decision making. All the Instruments validity has been sought through interviews with expert consultants and a case study in the
semiconductor industry.
BPMS screenshot
The integration with existing Enterprise Systems within the organization is
investigated, in a way that environmental sustainability can be fully linked with the other business dim along all the company processes,
providing a tool with characteristics not yet offered in the marketplace (Dada, Stanoevska-‐Slabeva, & Gómez, 2013)
vi
Table of Contents Abstract ......................................................................................................................................................... i
Acknowledgements .................................................................................................................................... iii
Executive summary ..................................................................................................................................... iv
List of tables .............................................................................................................................................. viii
List of figures ............................................................................................................................................... ix
Abbreviations .............................................................................................................................................. ix
1. Introduction ............................................................................................................................................. 1
1.1 Research objective ............................................................................................................................. 2 1.2 The research partner: Accenture ...................................................................................................... 4 1.3 Thesis structure ................................................................................................................................. 4
2. Background & Literature review ............................................................................................................. 5
2.1 Green BPM ......................................................................................................................................... 5 2.2 Process modelling .............................................................................................................................. 7 2.3 Environment and Information Systems .......................................................................................... 10 2.4 Literature review summary ............................................................................................................. 12
3. Research Methodology .......................................................................................................................... 13
3.1 Research Questions ......................................................................................................................... 13 3.2 Research Methods ..................................................................................................................... 14
4. Conceptual solutions ............................................................................................................................. 18
4.1 BPMN 2.0 environmental extension ............................................................................................... 18 4.1.1 Key Environmental Indicators (KEIs) investigation .................................................................. 18
4.1.2 Environmental impact categories ............................................................................................ 18
4.1.3 Quantitative processes environmental measures: KEIs .......................................................... 19
4.2 Proposed Method ............................................................................................................................ 22 4.2.1 Collect process general information ........................................................................................ 23
4.2.2 KEIs selection ............................................................................................................................ 23
4.2.3 Ranking and choice ................................................................................................................... 24
4.2.4 Process environmental data collection .................................................................................... 27
4.2.5 Enriching the process model with environmental-‐footprint indicators (Map process in a BPME) ................................................................................................................................................. 32
4.3 Implementation on BPMS ............................................................................................................... 36 5. Case Study .............................................................................................................................................. 38
5.1 Case organization ............................................................................................................................ 39 5.2 Conduct, data collection, analysis ................................................................................................... 39
5.2.1 Collect process general information ........................................................................................ 39
5.2.2 Select process KEIs ................................................................................................................... 40
5.2.3 Rank and choose KEIs ............................................................................................................... 41
5.2.4 Collect process environmental data ........................................................................................ 44
vii
5.2.5 Map the process in a BPME ..................................................................................................... 46
5.2.6 Build running application ......................................................................................................... 50
5.3 Results and discussion ..................................................................................................................... 53 5.3.1 Methodology ............................................................................................................................ 53
5.3.2 Process map .............................................................................................................................. 53
5.3.3 BPMS ......................................................................................................................................... 54
6. Conclusions ............................................................................................................................................ 56
6.1 Main findings ................................................................................................................................... 56 6.2 Limitations ....................................................................................................................................... 57 6.3 Future Research ............................................................................................................................... 58
References ................................................................................................................................................. 59
7. Appendix ................................................................................................................................................ 67
7.1 ARIS Architect & Designer 9.7 ......................................................................................................... 67 7.1.1 Software choice ........................................................................................................................ 67
7.1.2 Software implementation ........................................................................................................ 67
7.2 Bizagi Studio 10.6 ............................................................................................................................ 69 7.2.1 Modelling process .................................................................................................................... 70
7.2.2 Modelling data .......................................................................................................................... 70
7.2.3 Define forms ............................................................................................................................. 71
7.2.4 Define business rules ................................................................................................................ 71
7.2.5 Integrate (define integration interfaces) ................................................................................. 73
7.2.6 Building queries ........................................................................................................................ 73
7.3 APISpark ........................................................................................................................................... 74 7.4 Delivery emissions modelling in Excel ............................................................................................. 74
7.4.1 Computing emissions for AIR scenario .................................................................................... 74
7.4.2 Computing emissions for SEA scenario .................................................................................... 76
7.5 Green House Gas (GHG) Protocol ................................................................................................... 78 7.6 KEIs investigation ............................................................................................................................. 79
7.6.1 Indexes and grey literature ...................................................................................................... 79
7.6.2 Academic literature .................................................................................................................. 79

viii
List of tables Table 1 Research steps ____________________________________________________________________ 14 Table 2 BPMN extension (Recket et al., 2012) ___________________________________________________ 8 Table 3 List of KEIs ________________________________________________________________________ 22 Table 4 "Easiness of data collection" possible values _____________________________________________ 25 Table 5 AHP -‐ The fundamental scale (Saaty, 1990) ______________________________________________ 26 Table 6 Sources of emissions graphical elements ________________________________________________ 32 Table 7 Guide-‐table for compiling activity information ___________________________________________ 36 Table 8 KEIs chosen _______________________________________________________________________ 41 Table 9 KEIs Business Relevance calculation ____________________________________________________ 43

ix
List of figures Figure 1 Triple Bottom Line (Brown & Dillard, 2008) ______________________________________________ 2 Figure 2 BPM Lifecycle (BPM Center, 2015) _____________________________________________________ 5 Figure 3 Green BPM areas of impact __________________________________________________________ 6 Figure 4 Devil's quadrangle (Reijers & Mansar, 2005) and pentagon (Recker et al, 2012) _________________ 6 Figure 5 Core set of BPMN elements (OMG, 2005) ________________________________________________ 8 Figure 6 Sources of electricity supplied in the Netherlands ________________________________________ 29 Figure 7 General process outline for handling containers at container terminals (Vis & De Koster, 2003) ____ 31 Figure 8 Line of reasoning for KEIs individuation ________________________________________________ 18 Figure 9 "System" definition (Svoboda, 1995) __________________________________________________ 19 Figure 10 "Business relevance" vs "Easiness of data collection" framework ___________________________ 25 Figure 11 Activities with numerical values (left) and percentages (right) _____________________________ 33 Figure 12 Activity-‐groups emissions indicators __________________________________________________ 35 Figure 13 Gateway with occurrences on out-‐going paths _________________________________________ 35 Figure 14 Methodology summary ____________________________________________________________ 23 Figure 15 Bizagi screenshot: inserting delivery details ____________________________________________ 37 Figure 16 Bizagi screenshot: visualizing shipment details _________________________________________ 37 Figure 17 Scoring KEIs on the "Business Relevance" dimension _____________________________________ 42 Figure 18 Weights given to choice parameters __________________________________________________ 42 Figure 19 "Business relevance"-‐"Easiness of data collection" framework results _______________________ 43 Figure 20 KEIs selected ____________________________________________________________________ 43 Figure 21 Possible destinations ______________________________________________________________ 47 Figure 22 Worflow fragment in Bizagi ________________________________________________________ 50 Figure 24 Bizagi screenshot 3 _______________________________________________________________ 51 Figure 25 Bizagi screenshot: operational decisions support ________________________________________ 51 Figure 26 Bizagi screenshot: strategic-‐decisions support __________________________________________ 52 Figure 27 ARIS Roles and responsibilities ______________________________________________________ 68 Figure 28 Bizagi process model ______________________________________________________________ 70 Figure 29 Bizagi data model ________________________________________________________________ 70 Figure 30 Bizagi screenshot 5 _______________________________________________________________ 71
Abbreviations BPM Business Process Management
BPME Business Process Modelling Environment
BPMS Business Process Management System
CO2 Carbon Dioxide
GHG Greenhouse Gas
API Application Programming Interface
1
1. Introduction The ever-‐increasing world-‐wide population, accompanied by the ever increasing living standards
have enhanced the use of natural resources and raised pollutants emissions in the atmosphere. Human-‐caused global environmental changes have been recognized to alter the structure and
function of the Earth, considered as a system. Awareness among individuals and organizations has grown bringing to a general consciousness about the problem. There is a growing need for a more eco-‐sustainable way of doing business, with both normative and ethical concerns.
The concentration of atmospheric carbon dioxide in the atmosphere has been monitored continuously since 1957 (Keeling, et al., 1989), and an exponential increase in tropospheric concentration throughout the records have been identified. This increase has been proved, through
the analysis of air bubbles trapped in Greenland and Antarctic ice cups, not to be a natural fluctuation (Raynaud, et al., 1993). We can clearly state that we are dealing with an unusual event in recent Earth history, and it is intimately related with the proliferation of human population and the increase of
energy and resources consumption. Fossil fuel combustion has been proved to be the most notable source of it (Vitousek, 1994).
Figure 1 Global Warming (Luis Prado, The Noun Project)
The most important cause of increasing concentrations of greenhouse gases methane and nitrous oxide in the atmosphere is land use change. (Matson & Vitousek, 1990). Land use also influences
climate by modifying the ways solar energy is partitioned. Deforestation causes local increase of temperature and decrease of humidity. These, in turn, can negatively affect forests regeneration (Uhl & Kauffman, 1990). It is a fact that 12-‐15 million hectares of forest are lost each year (WWF, 2015).
Generally speaking CO2 production and deforestation are two interdependent problems that are harming human health, and should be the most important concern for every human. Organisations, due to their large impact on natural resources, on air quality, and on the environment in general, are
considered to be at the forefront of this campaign. Moving to more sustainable practices is probably the most frequent theme in annual reports, and the terms `green` or `sustainable` appear more and more recurrently. An important role is played by consumers, since awareness among final customers
is growing, and company´s image in term of `greenness` is becoming more and more relevant when choosing products or services.
Several regulations have been established by governments worldwide, such as: a law issued by the
Environmental Protection Agency (EPA) that makes Green House Gases (GHGs) emissions reports
2
mandatory for some USA companies (US Environmental Protection Agency, 2013), and similar
initiatives of both the European Parliament (2014) and of the UK Parliament (Department for Environment, Food & Rural Affairs, 2013).
From the recent news, Urgenda has suited, with other 900 co-‐plaintiffs, the Dutch government
for setting not ambitious emissions cutting plans for 2020 (Neslen, 2015). With its trial win, on the 24th of June 2015, it forces the Netherlands to cut its emissions by 25% compared to 1990’s, instead of the 14-‐17% cut previously promised. For the first time the lawsuit was brought under human rights laws,
and the curt of Den Haag agreed. Just few months later, on the other side of the Ocean, in the USA, the President Barack Obama has announced the Clean Power Plan that sets reduction of carbon dioxide emissions by 32 percent from 2005 level by 2030 (Office of the Press Secretary, 2015)
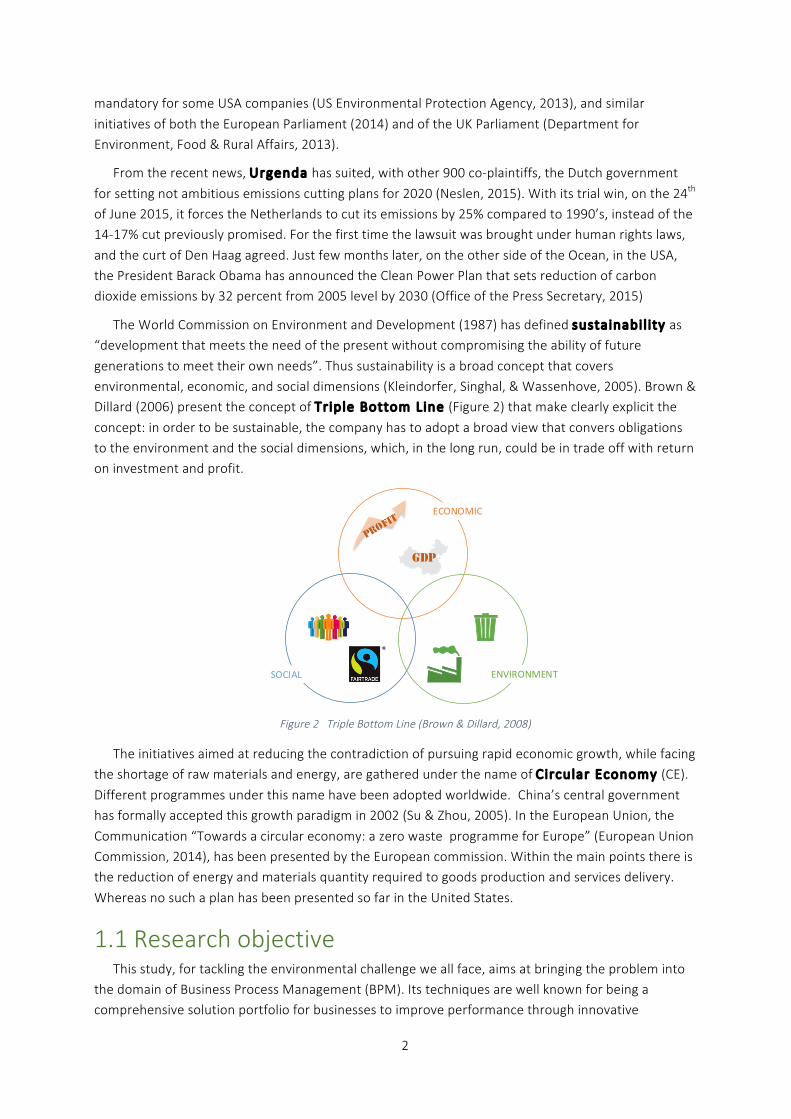
The World Commission on Environment and Development (1987) has defined sustainabi l i ty as “development that meets the need of the present without compromising the ability of future
generations to meet their own needs”. Thus sustainability is a broad concept that covers environmental, economic, and social dimensions (Kleindorfer, Singhal, & Wassenhove, 2005). Brown & Dillard (2006) present the concept of Tr ip le Bottom Line (Figure 2) that make clearly explicit the
concept: in order to be sustainable, the company has to adopt a broad view that convers obligations to the environment and the social dimensions, which, in the long run, could be in trade off with return on investment and profit.
Figure 2 Triple Bottom Line (Brown & Dillard, 2008)
The initiatives aimed at reducing the contradiction of pursuing rapid economic growth, while facing the shortage of raw materials and energy, are gathered under the name of Circular Economy (CE).
Different programmes under this name have been adopted worldwide. China’s central government has formally accepted this growth paradigm in 2002 (Su & Zhou, 2005). In the European Union, the
Communication “Towards a circular economy: a zero waste programme for Europe” (European Union Commission, 2014), has been presented by the European commission. Within the main points there is the reduction of energy and materials quantity required to goods production and services delivery.
Whereas no such a plan has been presented so far in the United States.
1.1 Research objective This study, for tackling the environmental challenge we all face, aims at bringing the problem into
the domain of Business Process Management (BPM). Its techniques are well known for being a comprehensive solution portfolio for businesses to improve performance through innovative
ECONOMIC
ENVIRONMENT
GDP
SOCIAL
3
transformations. Its focus is on cost, time, and quality efficient processes (Jeston & Nelis, 2014). The
high level of expertise reached in this field provides the instruments to reduce the environmental impact of enterprises’ ecological footprint. Another approach proposed by researchers is named Green Information System (IS), and considers the role of IS in supporting ecological business practices
(Watson, Boudreau, & Chen, 2010). The practice of combining the two approaches is a process-‐oriented methodology called Green Business Process Management, and has had a relatively short history; the term has been used for the first time in 2009 (Ghose, Hoesch-‐Klohe, Hinsche, & Le, 2009).
This research, besides its academic contribution, going one step further in the Green BPM research stream, brings improvement to the practice, providing organizations instruments and techniques that would improve the environmental impact of their business. The focus was on guiding organizations
analysing the environmental impact of their processes. In detail, a process representation technique, Business Process Model and Notation (BPMN) 2.0 (OMG, 2005) was extended, proposing process-‐
oriented environmental indicators inspired by the academic literature and frameworks from the practise, in order to improve the understandability of the ecological footprint, in a way that an eco-‐oriented redesign is facilitated. The attention is put on two stages of the BPM lifecycle (Dumas, La
Rosa, Mendling, & Reijers, 2013): Design and Evaluation. The aim is to tackle the production of carbon dioxide alongside organizational operations as: high-‐energy consumption processes, processes that cause the production of relevant waste quantities, or that consume high amount of water.
Furthermore, in order to guide the application of the notation (the extended BPMN 2.0), a methodology was developed. After interviewing the BPMN 2.0 experts, a set of guidelines was created with the aim of guiding the organization in understanding the environmental impact of its business
processes, and facilitating its applicability to business cases.
Finally, the integration of process environmental indicators in a Business Process Management System (BPMS), besides cost, time, and quality parameters, was studied. How this can be achieved is
explained, and, in detail, all the functionalities that can be provided to the user are illustrated. An example is provided, in which the intercommunication with other enterprise applications, as an Enterprise Resource Planning (ERP), is simulated using interfaces that connect with web-‐services.
for guiding brainstorming sessions aimed at environmental footprint reduction, and for analysing process emissions at design time
This research proposes a conceptual model that will help organizations getting awareness about
the environmental impact of their activities. Using eco-‐indicators in process models, can bring benefit to: the analysis of process emissions at design time, brainstorming sessions aimed at environmental footprint reduction, operational decisions-‐making process providing a wider dashboard of indicators,
and informing employees about the negative impact that business has on the environment. This attitude is the basic factor for implementing long-‐term Green BPM (Opitz, Krüp, & Kolbe, 2014).
The extended notation would:
• Improve insight about the workflow, highlighting areas in which it does well, areas where
more data is required, and areas of potential concern. Consequently, efforts to improve environmental performance can be prioritized;
• Provide information that can be used to make further environmental/economic
improvements in the workflow, such as process improvement, better selection of raw
materials, energy sources, stock and production locations, and waste management routes;
4
• Provide data that can be used to achieve transparency, responding to requests for
information, and calculate contributions to particular impact categories.
The instrument proposed in this research work is not a substitution of more detailed tools such as Life Cycle Assessments (LCAs), which appear to be highly time and budget consuming, but it is proposed as a high decisional tool that would guide the management in defining area of focus in the sustainability
initiatives for better impacting the environmental footprint reduction. This is done through a prioritization of activities established on their impact on the environment, based on criteria individuated by the management itself in a preliminary step. After this high level analysis, since the
area of interest would have been individuated, either more detailed instruments (such as LCAs) could be used, but limited to a more restricted extent, to analyse the impact of the different alternatives, or possible improvements could be suggested by sustainability experts. In this way the cost related to the
global analysis could be reduced.
1.2 The research partner: Accenture This thesis work was produced in collaboration with the multinational management consultancy,
technology services, and outsourcing company Accenture plc, headquartered in Dublin, with more than 320’000 employees worldwide. As the largest consulting firm as measured by revenues, the
Research Sustainability department in Amsterdam accepted a collaboration with the TU Eindhoven for the completion of this project. The strong sustainability and IT capabilities of the organization gave a valuable contribution to this research, since the expertise of consultants with experience in the areas
of investigation was used as one of the means of validation for the instruments produced, and for confirming the implementability of the solutions proposed. Moreover, through Accenture a company was individuated for conducting an analysis on a real case.
1.3 Thesis structure This thesis is composed of six main parts. After the Introduction, Background and related research
is presented, followed by an explanation of the Research Methodology. Later the Conceptual solution is proposed, and the Case study presented, ending with Conclusions. In the Background and Related research section, information about the environmental problem is presented, later the reasons of the
application of sustainability in the business domain are explained. The approach proposed, Green BPM, is thus introduced with a focus on an envrironmental-‐oriented BPMN 2.0 extension and a
contingent integration with BPMSs. In the Conceptual solution the instruments proposed by this thesis are extensively presented, and later their application to a Case study is described. The Conclusions end this work, presenting its limitations, and recommendations for further research.
5
2. Background & Literature review
2.1 Green BPM Several approaches have been put into use in order to assess the environmental aspects and
potential impacts associated with business, different levels of analysis. At a macro level, when considering one, or multiple economies, the Environmentally-‐Extended Input-‐Output Analysis (EEIOA)
(Kitzes, 2013) reflects production and consumption. For assessing the environmental aspects and potential impacts related to a product, a service, or a process, the Life Cycle Analysis (LCA) (Lenzen, 2002) is another well-‐known approach in the literature. This, although it is an extremely valuable tool
for the development of a robust design for environment of business and industrial processes, it has shown to be time and cost-‐requiring, due to its high level of complexity (Sarigiannis, 1996). Just relatively recently, Business Process Management (BPM), which has generally received much
attention both from the academia and the industry (Fettke, 2009), has been used for evaluating environmental consequences of processes’ activities. The Process Analysis (PA) requires a breakdown of the activities of a process, and the contribution of the supply chain to process inputs (Lenzen,
2002).
With the term “business process” are named the work practices within organizations, aimed at creating value (Porter, 1985). They are “a collection of activities that take one or more kinds of input
and creates an output that is of value to the customer” (Hammer & Champy, 1993). These activities determine cost, profit, and nevertheless saying, the environment.
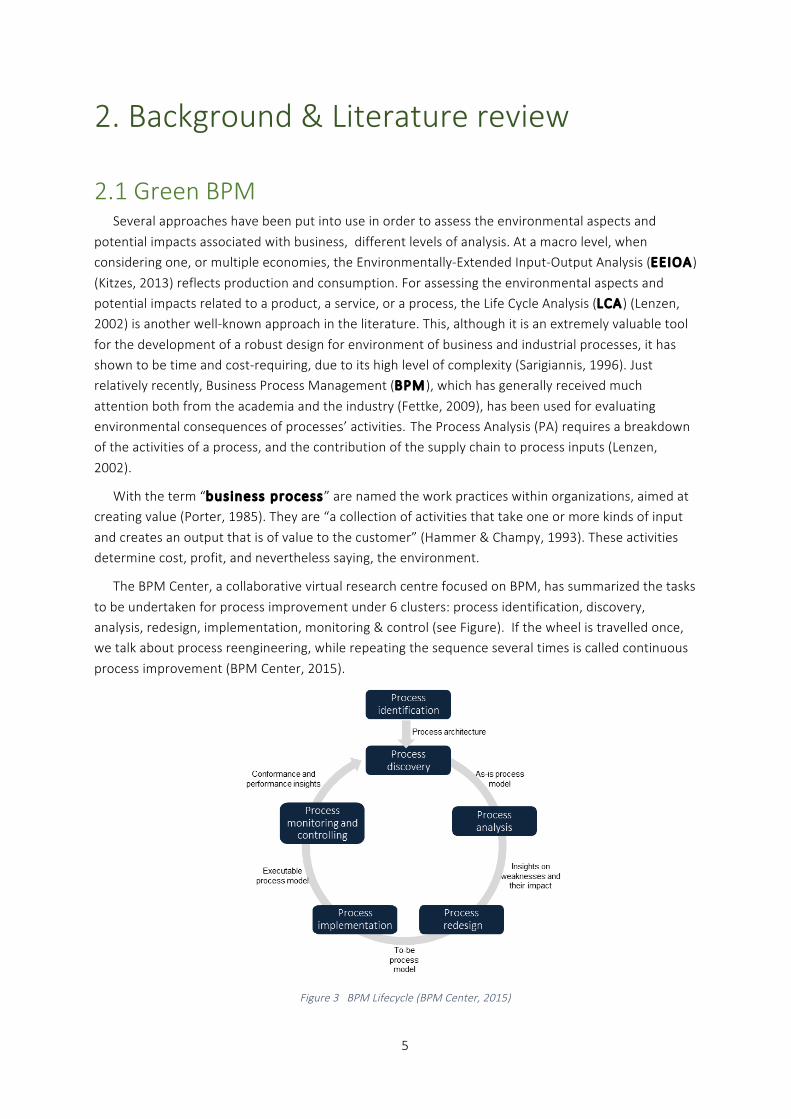
The BPM Center, a collaborative virtual research centre focused on BPM, has summarized the tasks
to be undertaken for process improvement under 6 clusters: process identification, discovery, analysis, redesign, implementation, monitoring & control (see Figure). If the wheel is travelled once, we talk about process reengineering, while repeating the sequence several times is called continuous
process improvement (BPM Center, 2015).
Figure 3 BPM Lifecycle (BPM Center, 2015)
6
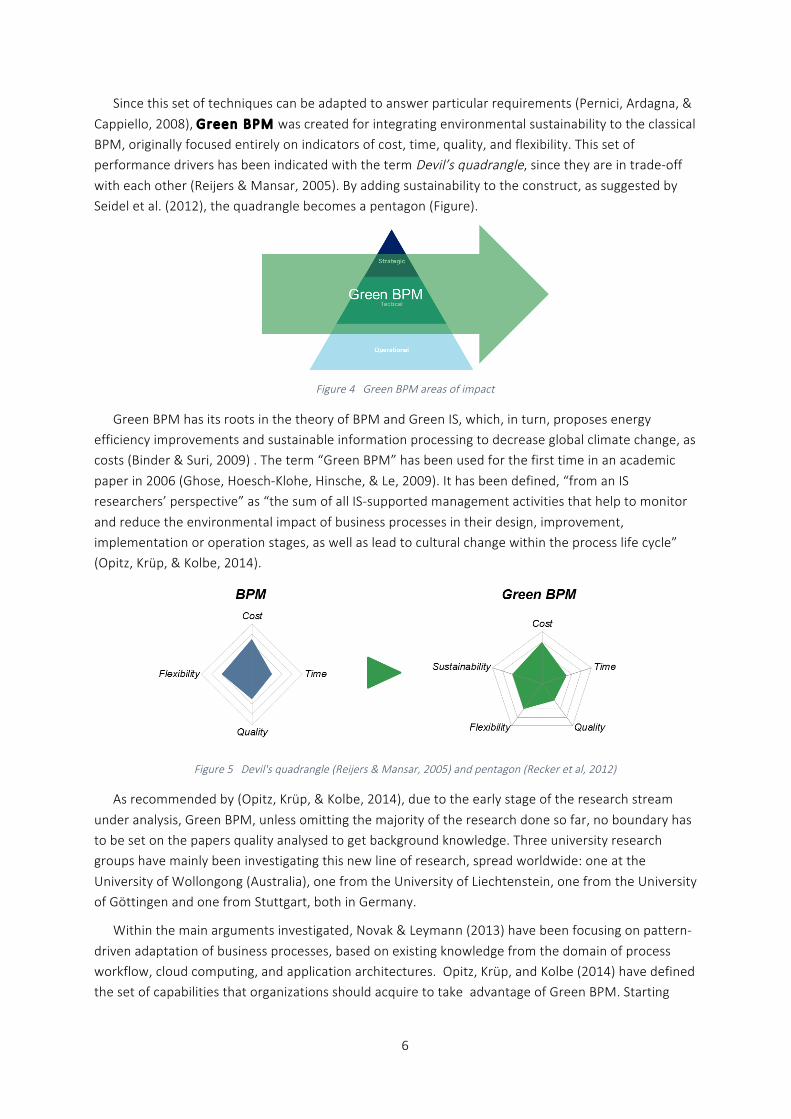
Since this set of techniques can be adapted to answer particular requirements (Pernici, Ardagna, &
Cappiello, 2008), Green BPM was created for integrating environmental sustainability to the classical BPM, originally focused entirely on indicators of cost, time, quality, and flexibility. This set of performance drivers has been indicated with the term Devil’s quadrangle, since they are in trade-‐off with each other (Reijers & Mansar, 2005). By adding sustainability to the construct, as suggested by Seidel et al. (2012), the quadrangle becomes a pentagon (Figure).
Figure 4 Green BPM areas of impact
Green BPM has its roots in the theory of BPM and Green IS, which, in turn, proposes energy efficiency improvements and sustainable information processing to decrease global climate change, as costs (Binder & Suri, 2009) . The term “Green BPM” has been used for the first time in an academic
paper in 2006 (Ghose, Hoesch-‐Klohe, Hinsche, & Le, 2009). It has been defined, “from an IS researchers’ perspective” as “the sum of all IS-‐supported management activities that help to monitor
and reduce the environmental impact of business processes in their design, improvement, implementation or operation stages, as well as lead to cultural change within the process life cycle” (Opitz, Krüp, & Kolbe, 2014).
Figure 5 Devil's quadrangle (Reijers & Mansar, 2005) and pentagon (Recker et al, 2012)
As recommended by (Opitz, Krüp, & Kolbe, 2014), due to the early stage of the research stream
under analysis, Green BPM, unless omitting the majority of the research done so far, no boundary has to be set on the papers quality analysed to get background knowledge. Three university research groups have mainly been investigating this new line of research, spread worldwide: one at the
University of Wollongong (Australia), one from the University of Liechtenstein, one from the University of Göttingen and one from Stuttgart, both in Germany.
Within the main arguments investigated, Novak & Leymann (2013) have been focusing on pattern-‐
driven adaptation of business processes, based on existing knowledge from the domain of process workflow, cloud computing, and application architectures. Opitz, Krüp, and Kolbe (2014) have defined the set of capabilities that organizations should acquire to take advantage of Green BPM. Starting
7
from the available literature on Green BPM, they individuated six different green factors: attitude,
strategy, governance, modelling, optimizing, and monitoring.
2.2 Process modelling In particular, model l ing, involves the design of processes, and represents an important operative
element both for BPM and Green BPM (Ghose, Hoesch-‐Klohe, Hinsche, & Le, 2009). It has been
defined as the time period when a process description is defined and/or modified electronically and/or manually (WfMC, Workflow managment coalition, 1999). While Fernández et al. (2010) have described it as “the group of technologies that allow to model those business aspects necessary for a
correct performance of the business process applications”. It can be simply described as the set of activities aimed at producing a description of reality that allows the reader to understand the essence of the process as clearly as possible.
During the last decade several languages and tools for process modelling were generated. Among the most known, UML 2.0 (Unified Modelling Language), Business Process Execution Language (BPEL), and Business Process Model and Notation (BPMN) 2.0. At the moment, the last mentioned, which has
been designed especially for business process modelling, is the most widely used language that uses a graphical notation (OMG, 2009), and it is the industry standard for process modelling (Seidel S. ,
Recker, Pimmer, & vom Brocke, 2010). Moreover, it is the most suitable for monitoring energy efficiency key performance indicators (KPIs) in business processes (Opitz, Erek, Langkau, Kolbe, & Zarnekow, 2012), it is non-‐proprietary, so that it can be adapted, and it is not bounded to any specific
tool. Also the Object Management Group (2009), suggest BPMN 2.0 as the most suitable model language to design an extension for. It combines elements from several predecessors, as the XML Process Definition Language (XPDL) (WFMC, 2002) and the Activity Diagrams from the Unified
Modelling Notation (UML) (OMG, 2002). It is a complex language, constantly evolving, currently at its 2.0 version, subject to revisions and extensions. Its first aim is to provide a notation understandable by business users. Its core element is a single business process diagram called Business Process Diagram
(BPD). While it offers the reader facilitated understandability, it also offers a variegated and detailed expression of business processes. Refer to (White, Introduction to BPMN, 2004) for further details.
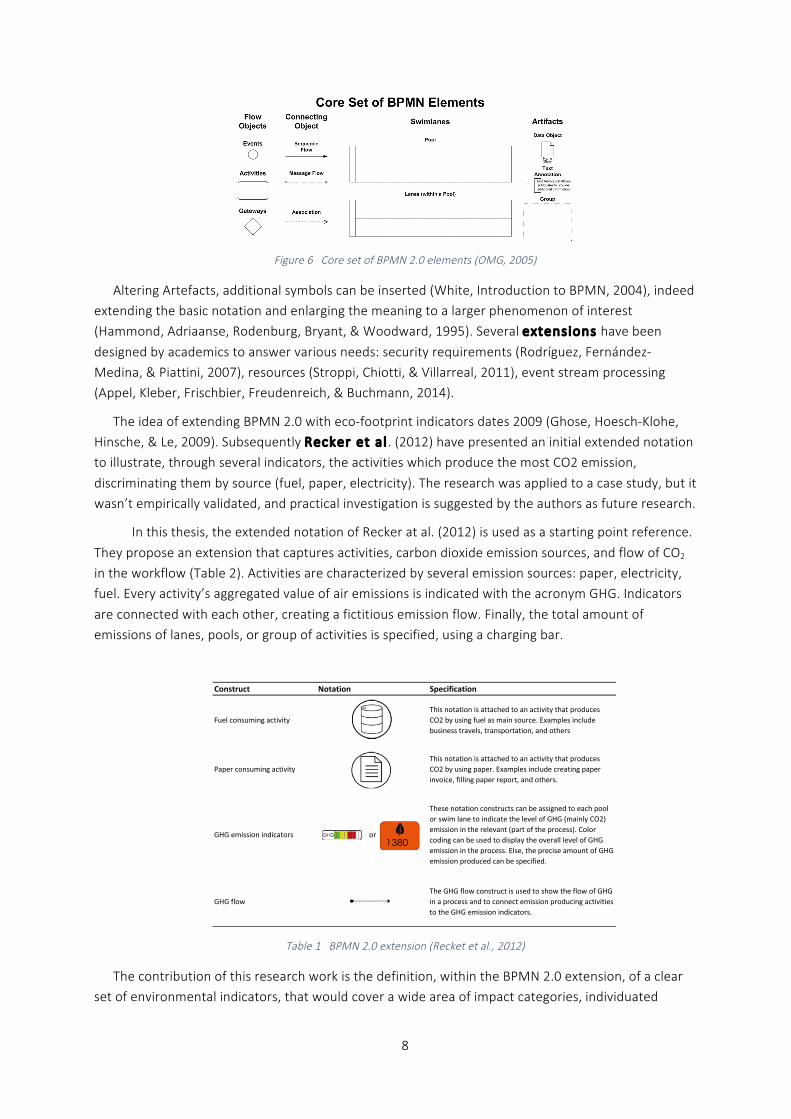
Four categories of graphical elements are used to build diagrams:
-‐ Flow Objects, indicate all the possible actions within a business process (Events, Activities, Gateways);
-‐ Connecting Objects (Sequence Flows, Association, Message Flow);
-‐ Swimlanes, gather all the elements related to a single primary modelling entity (Pools, Lanes); -‐ Artefacts, provide additional information for the reader without affecting the flow
(Annotation, Group);
-‐ Data (Data Input/Output, Data Store, Messages, and Collection Data Objects).
8
Figure 6 Core set of BPMN 2.0 elements (OMG, 2005)
Altering Artefacts, additional symbols can be inserted (White, Introduction to BPMN, 2004), indeed extending the basic notation and enlarging the meaning to a larger phenomenon of interest (Hammond, Adriaanse, Rodenburg, Bryant, & Woodward, 1995). Several extensions have been
designed by academics to answer various needs: security requirements (Rodríguez, Fernández-‐Medina, & Piattini, 2007), resources (Stroppi, Chiotti, & Villarreal, 2011), event stream processing (Appel, Kleber, Frischbier, Freudenreich, & Buchmann, 2014).
The idea of extending BPMN 2.0 with eco-‐footprint indicators dates 2009 (Ghose, Hoesch-‐Klohe, Hinsche, & Le, 2009). Subsequently Recker et a l . (2012) have presented an initial extended notation to illustrate, through several indicators, the activities which produce the most CO2 emission,
discriminating them by source (fuel, paper, electricity). The research was applied to a case study, but it wasn’t empirically validated, and practical investigation is suggested by the authors as future research.
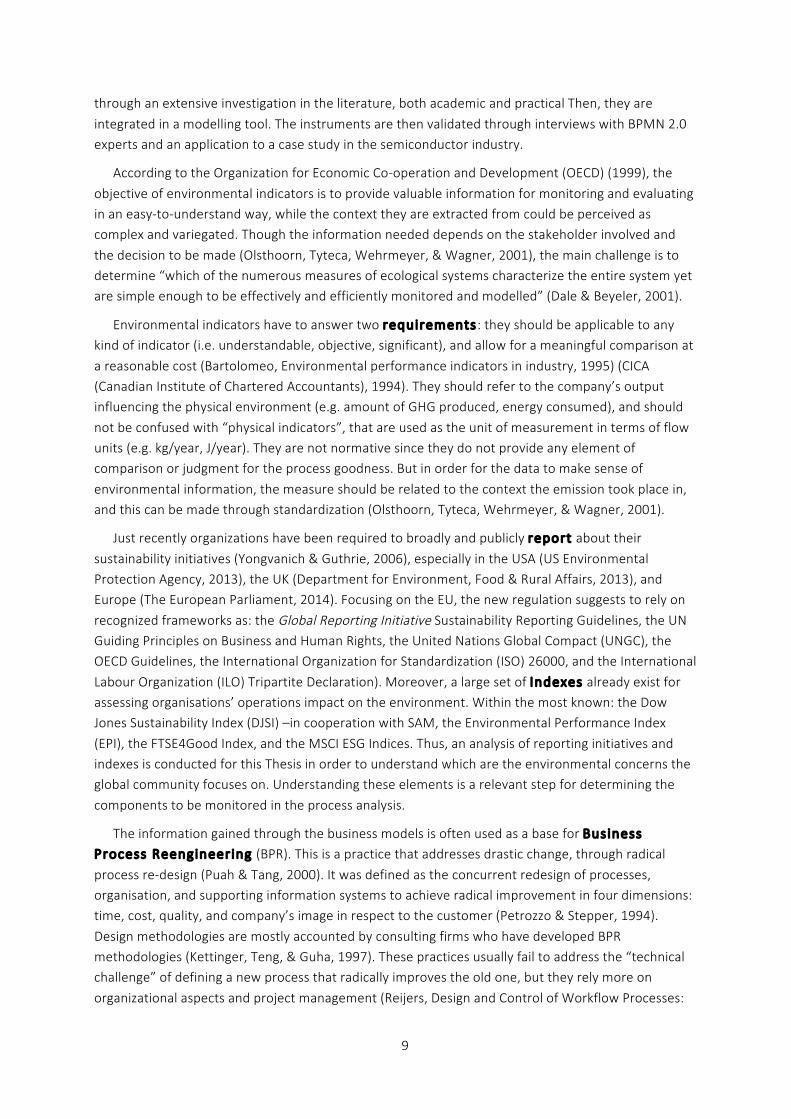
In this thesis, the extended notation of Recker at al. (2012) is used as a starting point reference.
They propose an extension that captures activities, carbon dioxide emission sources, and flow of CO2 in the workflow (Table 2). Activities are characterized by several emission sources: paper, electricity, fuel. Every activity’s aggregated value of air emissions is indicated with the acronym GHG. Indicators
are connected with each other, creating a fictitious emission flow. Finally, the total amount of emissions of lanes, pools, or group of activities is specified, using a charging bar.
Table 1 BPMN 2.0 extension (Recket et al., 2012)
The contribution of this research work is the definition, within the BPMN 2.0 extension, of a clear set of environmental indicators, that would cover a wide area of impact categories, individuated
Construct Notation Specification
Fuel consuming activityThis notation is attached to an activity that produces CO2 by using fuel as main source. Examples include business travels, transportation, and others
Paper consuming activityThis notation is attached to an activity that produces CO2 by using paper. Examples include creating paper invoice, filling paper report, and others.
GHG emission indicators or
These notation constructs can be assigned to each pool or swim lane to indicate the level of GHG (mainly CO2) emission in the relevant (part of the process). Color coding can be used to display the overall level of GHG emission in the process. Else, the precise amount of GHG emission produced can be specified.
GHG flowThe GHG flow construct is used to show the flow of GHG in a process and to connect emission producing activities to the GHG emission indicators.
9
through an extensive investigation in the literature, both academic and practical Then, they are
integrated in a modelling tool. The instruments are then validated through interviews with BPMN 2.0 experts and an application to a case study in the semiconductor industry.
According to the Organization for Economic Co-‐operation and Development (OECD) (1999), the
objective of environmental indicators is to provide valuable information for monitoring and evaluating in an easy-‐to-‐understand way, while the context they are extracted from could be perceived as complex and variegated. Though the information needed depends on the stakeholder involved and
the decision to be made (Olsthoorn, Tyteca, Wehrmeyer, & Wagner, 2001), the main challenge is to determine “which of the numerous measures of ecological systems characterize the entire system yet are simple enough to be effectively and efficiently monitored and modelled” (Dale & Beyeler, 2001).
Environmental indicators have to answer two requirements: they should be applicable to any kind of indicator (i.e. understandable, objective, significant), and allow for a meaningful comparison at
a reasonable cost (Bartolomeo, Environmental performance indicators in industry, 1995) (CICA (Canadian Institute of Chartered Accountants), 1994). They should refer to the company’s output influencing the physical environment (e.g. amount of GHG produced, energy consumed), and should
not be confused with “physical indicators”, that are used as the unit of measurement in terms of flow units (e.g. kg/year, J/year). They are not normative since they do not provide any element of comparison or judgment for the process goodness. But in order for the data to make sense of
environmental information, the measure should be related to the context the emission took place in, and this can be made through standardization (Olsthoorn, Tyteca, Wehrmeyer, & Wagner, 2001).
Just recently organizations have been required to broadly and publicly report about their
sustainability initiatives (Yongvanich & Guthrie, 2006), especially in the USA (US Environmental Protection Agency, 2013), the UK (Department for Environment, Food & Rural Affairs, 2013), and Europe (The European Parliament, 2014). Focusing on the EU, the new regulation suggests to rely on
recognized frameworks as: the Global Reporting Initiative Sustainability Reporting Guidelines, the UN Guiding Principles on Business and Human Rights, the United Nations Global Compact (UNGC), the OECD Guidelines, the International Organization for Standardization (ISO) 26000, and the International
Labour Organization (ILO) Tripartite Declaration). Moreover, a large set of Indexes already exist for assessing organisations’ operations impact on the environment. Within the most known: the Dow Jones Sustainability Index (DJSI) –in cooperation with SAM, the Environmental Performance Index
(EPI), the FTSE4Good Index, and the MSCI ESG Indices. Thus, an analysis of reporting initiatives and indexes is conducted for this Thesis in order to understand which are the environmental concerns the global community focuses on. Understanding these elements is a relevant step for determining the
components to be monitored in the process analysis.
The information gained through the business models is often used as a base for Business Process Reengineering (BPR). This is a practice that addresses drastic change, through radical
process re-‐design (Puah & Tang, 2000). It was defined as the concurrent redesign of processes, organisation, and supporting information systems to achieve radical improvement in four dimensions: time, cost, quality, and company’s image in respect to the customer (Petrozzo & Stepper, 1994).
Design methodologies are mostly accounted by consulting firms who have developed BPR methodologies (Kettinger, Teng, & Guha, 1997). These practices usually fail to address the “technical challenge” of defining a new process that radically improves the old one, but they rely more on
organizational aspects and project management (Reijers, Design and Control of Workflow Processes:
10
Business Process Management for the Service Industry, 2005). For this reason practitioners usually
end with using best practices.
Within the Green BPM stream of research Ghose, Hoesh-‐Klohe, Hinsche & Le (2009) have reported the lack of an approach that helps organizations assessing carbon emissions from a process
perspective, in a way that carbon-‐aware process reengineering is given.
Effort has been put in recent years in applying information systems to heterogeneous and distributed environments. Business Process Management Systems (BPMSs) have been defined as
“information systems dealing with the definition, administration, customization and evaluation of tasks evolving from business processes as well as from organizational structures” (Karagiannis, 1995). A role played by these systems is managing the workflow: defining and controlling it, transferring data,
and integrating legacy systems, and external applications (Silver, 1995). More simply delegating business tasks to the right people, at the right time, and delivering the right information resources
(Karagiannis, 1995).
Other software is used solely for modelling purposes, usually named Business Process Modelling Software (BPMS). In the following parts of this work they will be named Business Process Modelling
Environments (BPMEs) in order to avoid misunderstandings with Business Process Management Systems (BPMS).
2.3 Environment and Information Systems Evaluation of environmental performances is becoming more common among companies, but the
attention of academics, on the role of IS in reducing business environmental footprint, has been low. Just recently an agenda to address the IS research effort in respect to the subject has been drawn up (Watson, Boudreau, & Chen, 2010).
The sophistication level of these solutions depends on the effort the organizations is putting on tracking its impact on the environment (Dada, Staake, & Fleisch, Towards continous environmental improvements across the product life cycle, 2010):
• Companies in the early learning phase usually use spreadsheet-‐based homemade solutions. • Other firms extended their accounting capabilities customizing traditional company costing
tools with environmental indicators, at product-‐level. • Specialized LCA tools are used for impact analysis on a product-‐level. • The most advanced solution, which is getting more and more popularity, are special purpose
Environment Performance Indicator (EPI) management tools, namely Corporate Environmental Management Information Systems (CEMIS), which offer the possibility of collecting , analysing, processing, and archiving environmental information relevant at a corporate level, at a high level of aggregation (Rautenstrauch, 1999).
The fallacy of these specialized tools is that they are mainly aimed at establishing legal compliance for implementing standards like ISO 14001, and do not support any sustainability concept (Dada, Stanoevska-‐Slabeva, & Gómez, 2013). They are not targeted at a general business audience, or at
operational personnel that makes decision on a daily basis, but rather at environmental roles. Moreover, these solutions are not designed for a multi-‐partner network that could bring the possibility of inter-‐organizational collection and the benefit of leveraging indicators.
11
On the other hand, although not initially designed for tackling environmental issues, Enterprise
Resource Planning (ERP) systems have brought to relevant savings in terms of costs, materials, and indirectly carbon footprint, since their introduction. ERP are “information systems that integrate processes in an organization using a common database and shared reporting tools” (Dredden &
Bergdolt, 2007). They help different parts of the organization sharing knowledge and taking advantage of all the benefits of timeless information sharing.
A properly selected and implemented ERP system has shown to be capable of significant benefits:
inventory and raw materials costs, lead-‐time for customer, production cost and time reduction, just to mention some (Deutsch, 2008) (Main, 1990). However the costs linked to the implementation of these information systems can be substantially high (Ragowsky & Somers, 2002). Although massive
investments and high expectations, that have pushed organizations worldwide to invest more than $79 billion just in 2004 (Carlino, Nelson, & Smith, 2000), most of the ERP implementation fail
(Ragowsky & Somers, 2002).
The interesting possibility given by enterprise systems, is to interact with external software, exposing (i.e. making available) their data through web services, using internet protocols (SAP, 2015).
In this research, the role that Business Process Management System (BPMS) could have in orchestrating business processes is investigated, in a way that environmental indicators are considered. BPMSs “aim to help business goals to be achieved with high efficiency by means of
sequencing work activities invoking appropriate human and/or information resources associated with these activities” (Shi, Yang, Xiang, & Wu, 1999). They execute a multitude of process models, and several distributed activities, storing state information about the process model, the process model
instance in execution, and the state of the BPMS themselves in Database Management Systems (DBMS). Research in this field has been focused on making BPMS more object oriented, supporting synchronous cooperation, user mobility, transaction control in workflow execution, and
interconnecting heterogeneous BPMSs. This latter necessity is due to the multitude of systems usually implemented in organizations, where the single department commonly applies a different BPMS. Gartner (2015) research affirms that most organizations have more than four automation tools in their
current environment.
The large amount of data required for execution requires the use of distributed collections, and information deriving from different sources. This is done thanks to Web-‐services, application
accessible to other applications using the Web (72). They have been defined as “a software application identified by a URI, whose interfaces and bindings are capable of being defined, described, and discovered as XML artefacts. A Web service supports direct interactions with other software agents
using XML-‐based messages exchanged via Internet-‐based protocols” (212). One implementation is represented by programs accessible with stable Application Program Interfaces (APIs), published with information on the service directories.
Business processes within companies are mostly automated, but the same does not happen in processes across companies, sometimes carried out manually. Through the use of Web-‐services, thus, inter-‐organization communications can be facilitated in order to achieve a fully automated business.
12
2.4 Literature review summary Green BPM is a process-‐centred approach, relatively new, aimed at reducing the environmental
issues and potential impacts linked with business, merging the strength of the classical BPM theory with environmental sustainability principles. Research has been conducted on all the phases of the BPM Lifecycle: emission measuring approaches, pattern driven adaptation of business processes,
process re-‐engineering guidelines, re-‐design tools, and capabilities necessary for application in practice.
Green Modelling is one of the capabilities organizations should acquire to benefit from Green BPM.
BPMN 2.0, recognized as the most suitable modelling language for an environmental-‐oriented extension, has been extended by Recker et al. (2012) to indicate activities carbon dioxide emissions. In this research, a clear set of environmental indicators is presented, and integrated in a BPME, to
facilitate environmental process mapping.
In helping organization assessing their carbon dioxide emissions, Ghose et al. (2009) have reported the lack of an approach with a process perspective. The investigation carried out in this research
provides guidelines for this quest.
Information Systems play a big role, both in the implementation of classical BPM principles, and in
sustainability initiatives mainly for enforcing standards or establishing legal compliance. In this research their role is analysed and an application tool is proposed for operational and strategic decision-‐making support, in order to guarantee the offered Quality of service (QoS) (Kyriazis, Tserpes,
Menychtas, Litke, & Vavarigou, 2008).
The icons inserted in this work are taken from
13
3. Research Methodology
3.1 Research Questions Summarizing, the collection of eco-‐information should be carried out to provide understanding
about the environmental performances of activities within processes, in a way that the management, aware of the criticalities, can decide whether concentrating initiatives on reducing the impact of the
single activity, or, through a wider perspective, the processes can be redesigned as a whole. The focus of this research work is on how organizations should approach processes analysis, using activities environmental output as a driver. Several studies have presented the problem of the substantial cost
associated to this kind of analysis, and the time needed for them. For instance Goedkoop & Spriensma (2001) about LCA. Miettinen & Hämäläinen (1997), in a study on the benefits from decision analysis in environmental LCAs, suggest involving decision makers in the early stages of the analysis process,
letting them selecting the impact categories they consider important. In this way the emissions inventory used for the analysis would not be complete, but would target the data collection resources and cut the cost of the analysis.
Therefore, inspired by the same idea, the primary goal of this study is to provide a method for the investigation of processes’ environmental footprint, designed so as to have a limited impact on the organization’s budget, and a short implementation time. Thus, the main question this research
attempts to answer is:
1. How to guide organizations in analysing the environmental footprint of their business processes?
The business process management lifecycle initiates with process modelling, to allow gaining insight into the way processes are performed. The graphical representation is the key to gain knowledge about the environmental impact of process activities. Therefore, there is a need to extend
a business process-‐modelling notation to include information about the process use of natural resources and its impact on the environment. The modelling language BPMN 2.0 was chosen for this extension as it has become an industry standard in representing process information in models, and
an initial work on an environmental-‐based extension has been presented by Recker et al. (2012). The focus is on which indicators should be used in an environmental-‐footprint extension of BPMN 2.0. Thus the first research sub-‐question this thesis would attempt to answer is:
1.1 How can BPMN 2.0 be extended with environmental-‐footprint indicators?
Since no generalization can be drawn on how companies, belonging to different industries, impact the environment, guidelines on the application of the designed notation should be provided, so that
the analysis is tailored to a single business case. In this way, the proposed notation would be more effective and easier to use. Thus the second sub-‐question of this study is:
1.2 How can the use of the environmental extension be facilitated using a method?
As a natural consequence of the questions rose above, a practical field research is carried out, investigating how this notation and the method proposed can be applied in a real-‐life business.
14
Since the use of BPMSs is spreading in the industry (Pandey, Karunamoorthy, & Buyya, 2011), how
to integrate environmental indicators into a BPMS is investigated. The set of environmental indicators cannot be the only driver in the decision making process, thus it is considered as part of a wider dashboard that includes performance indexes belonging to the classical business theory. Nevertheless
all the aspects of the Triple Bottom Line (economic, social, and environmental effects) are considered. To achieve the proposed objective, business processes have to be executable, meaning that the actual behaviour of the participants in the business transactions is modelled. The third sub-‐question is then:
1.3 How can environmental-‐footprint indicators be integrated in an executable process in a BPMS?
A case study is conducted in order to test the practical functionalities of the proposed approach.
For this reason, a specific business process in the semiconductor industry is chosen, in order to be mapped, analysed, and implemented in a BPMS. For the selection, a meaningful example was sought,
which would include the use of different sources of emissions. The process sought had an high degree of activities ran in-‐house, due to the difficulties in monitoring third parties activities.
3.2 Research Methods The methods implemented to conduct the investigation relevant for the presented questions, aim at
resulting in a research that would conform to the criteria of rigor and relevance (Shrivastava, 1987). Though, it is important highlighting that, in a research domain with a very short legacy, such as Green BPM, not an absolute compliance with the requirements for rigor is understandable (Opitz, Krüp, & Kolbe, 2014).
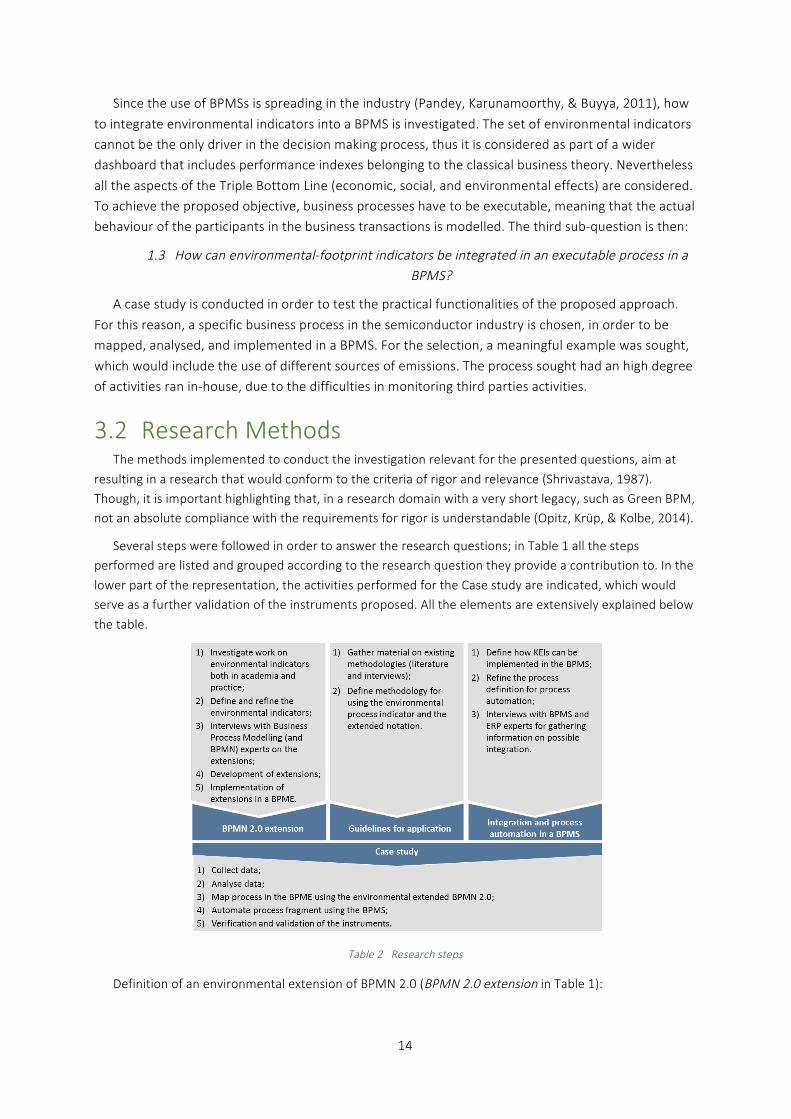
Several steps were followed in order to answer the research questions; in Table 1 all the steps performed are listed and grouped according to the research question they provide a contribution to. In the
lower part of the representation, the activities performed for the Case study are indicated, which would serve as a further validation of the instruments proposed. All the elements are extensively explained below
the table.
Table 2 Research steps
Definition of an environmental extension of BPMN 2.0 (BPMN 2.0 extension in Table 1):
15
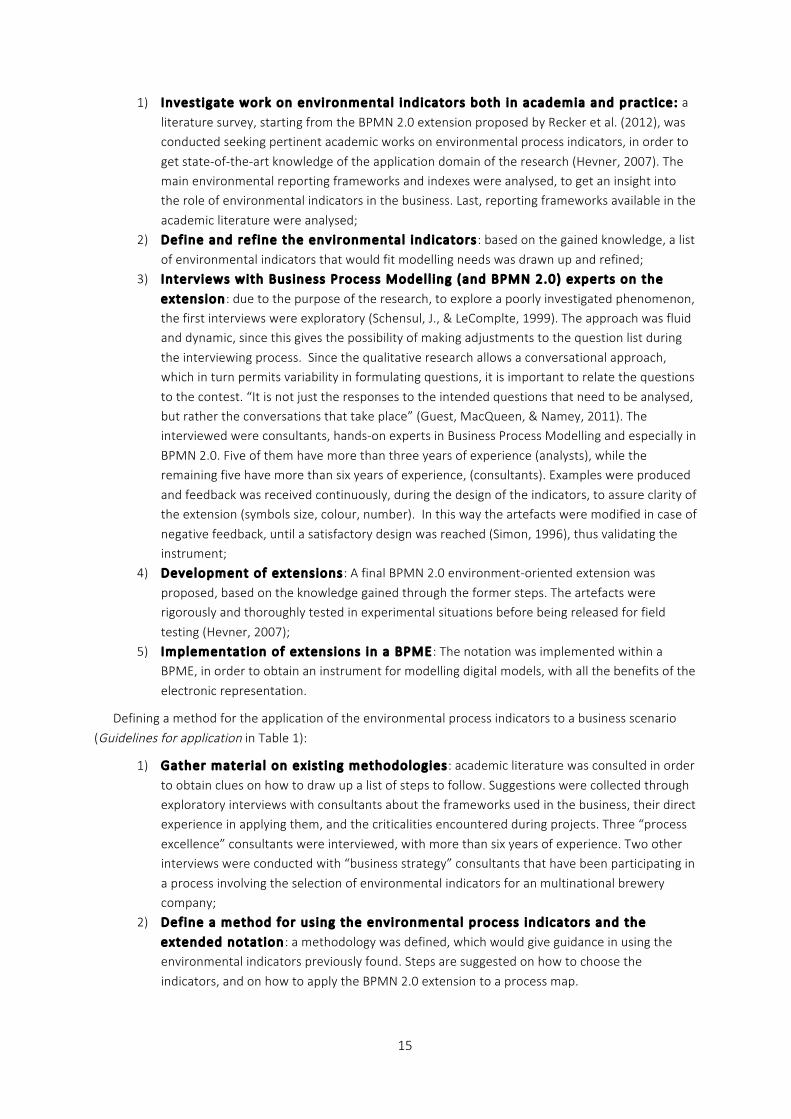
1) Invest igate work on environmental indicators both in academia and pract ice: a
literature survey, starting from the BPMN 2.0 extension proposed by Recker et al. (2012), was conducted seeking pertinent academic works on environmental process indicators, in order to
get state-‐of-‐the-‐art knowledge of the application domain of the research (Hevner, 2007). The main environmental reporting frameworks and indexes were analysed, to get an insight into the role of environmental indicators in the business. Last, reporting frameworks available in the
academic literature were analysed; 2) Define and ref ine the environmental indicators : based on the gained knowledge, a list
of environmental indicators that would fit modelling needs was drawn up and refined; 3) Interviews with Business Process Model l ing (and BPMN 2.0) experts on the
extension: due to the purpose of the research, to explore a poorly investigated phenomenon, the first interviews were exploratory (Schensul, J., & LeComplte, 1999). The approach was fluid and dynamic, since this gives the possibility of making adjustments to the question list during
the interviewing process. Since the qualitative research allows a conversational approach, which in turn permits variability in formulating questions, it is important to relate the questions
to the contest. “It is not just the responses to the intended questions that need to be analysed, but rather the conversations that take place” (Guest, MacQueen, & Namey, 2011). The interviewed were consultants, hands-‐on experts in Business Process Modelling and especially in
BPMN 2.0. Five of them have more than three years of experience (analysts), while the remaining five have more than six years of experience, (consultants). Examples were produced
and feedback was received continuously, during the design of the indicators, to assure clarity of the extension (symbols size, colour, number). In this way the artefacts were modified in case of
negative feedback, until a satisfactory design was reached (Simon, 1996), thus validating the instrument;
4) Development of extensions: A final BPMN 2.0 environment-‐oriented extension was
proposed, based on the knowledge gained through the former steps. The artefacts were rigorously and thoroughly tested in experimental situations before being released for field
testing (Hevner, 2007); 5) Implementation of extensions in a BPME: The notation was implemented within a
BPME, in order to obtain an instrument for modelling digital models, with all the benefits of the
electronic representation.
Defining a method for the application of the environmental process indicators to a business scenario
(Guidelines for application in Table 1):
1) Gather materia l on exist ing methodologies: academic literature was consulted in order
to obtain clues on how to draw up a list of steps to follow. Suggestions were collected through exploratory interviews with consultants about the frameworks used in the business, their direct experience in applying them, and the criticalities encountered during projects. Three “process
excellence” consultants were interviewed, with more than six years of experience. Two other interviews were conducted with “business strategy” consultants that have been participating in
a process involving the selection of environmental indicators for an multinational brewery company;
2) Define a method for using the environmental process indicators and the
extended notation: a methodology was defined, which would give guidance in using the environmental indicators previously found. Steps are suggested on how to choose the
indicators, and on how to apply the BPMN 2.0 extension to a process map.
16
Development of a BPMS solution integrating KEIs (Integration and process automation in a BPMS in Table 1):
1) Define how KEIs can be implemented in the BPMS: the instruments that can be
developed in the BPMS are analysed in order to understand how environmental information can be integrated in the model execution, to inform the operator involved in the process execution, to store information about the process instances for periodic data review. For the
investigation BPMSs manuals were used; 2) Refine the process definit ion for process automation: in a BPMS, the tasks
represented can have different functions: there are user tasks, manual tasks, script tasks, and service tasks. In detail, service tasks are included for interfacing with external applications.
These tasks are fully automated and they can, for instance, invoke web-‐services in a way that information can be retrieved from external databases. For this reason, for making a process executable, additional tasks have to be included in the process model.
3) Interviews with BPMS and ERP experts for gathering information on a possible integrat ion: in order to gather information about the implementation of KEIs in a real case
scenario, i.e. within an organization’s BPMS, and the integration with Enterprise Systems, interviews are carried out. The feasibility of the proposal was assured, conducting semi-‐structured interviews with experts from the delivery centres of the consultancy company
where this project was carried out. Team leaders (two) and project managers (two) were interviewed. One team leader and one project manager are experts in the implementation of
the KEIs within BPMSs, and one team leader and one project manager are experienced in the integration of BPMSs and ERP systems.
After conducting design science research, according to the Relevance Cycle suggested by Hevner (2007), the output should be returned into the environment for study and evaluation in the application domain. A case study was developed with an Accenture’s client, proposing a project that would have been
advantageous both for the client and the objectives of this research. A case study is an empirical examination that investigates a contemporary phenomenon in a real-‐life context, in which multiple sources
of evidence are used, and boundaries between phenomenon and context are not obvious (Remenyi, Williams, Money, & Swartz, 1998). It provides the advantage of getting a feedback from a real scenario, obtaining actual results to the proposed activity or process function. The method used when drawing
conclusions from empirical facts is named induction (Stenbacka, 2001). It is most frequent in the field of hermeneutic research, whereas understanding and interpretation represent few of the main reasoning.
Interpretation leads research from an empirical basis to theory.
In this thesis work, the aim of using a case study is to test in a real scenario the instruments proposed,
getting deeper knowledge about limits and boundaries of their application. The implementation itself is a validation of the idea presented, showing the applicability of the approach. A process was chosen within the organization in order to be able to analyse activities that would use different sources of emissions, to
obtain a variegated map. For this reason both logistic activities, and production operations were included in the scope. The steps followed in executing the case study were the following:
1) Collect data: information was gathered about the process under analysis. First the material publicly available was analysed, in order to get background knowledge about the organization and its processes. Face-‐to-‐face and phone-‐interviews were later carried out, in order to select, rank,
and choose the KEIs to use in the analysis, and later to collect the data needed for the graphical representation. Emails were used for data sharing. First three interviews were conducted,
respectively with a responsible of sustainability of the organization whose process was under
17
analysis, and the two process owners, both with a technical background. Each of them is
responsible for part of the total process under analysis: the logistic part, and the operations. The same people were later contacted for validating the KEIs chosen and were asked to score them
according to the framework proposed in this research. Later the relevant people were contacted for gathering the data. Several people were reached during this phase, due to the difficulties in obtaining some information. Thus datasets were received and assumptions were made for
compensating the lack of some details. In order to get insights into the information systems used in the company (BPMSs and ERP systems), several consultants that performed project for the same
client were interviewed; 2) Analyse data: the information acquired was processes and organized, in order to obtain the level
of detail necessary for the map. Since different sources of information were used, the process map level of detail had to be adapted to the lowest level of detail among all the data received, in order to achieve homogeneity. Information about operations was solely aggregated, while, about logistic
activities, information about carbon dioxide was calculated based on the activities carried out to deliver the machinery to the destination plants;
3) Map process in BPME using the environmental extended BPMN 2.0: the process was mapped using the customized BPME, containing the environmental indicators that are part of the notation previously implemented. Exemplification was pursued throughout the process, with the
aim of obtaining an easy-‐to-‐follow process. This made possible an information-‐rich, in-‐depth, within-‐case analysis (Eisenhardt, 1989).
4) Automate process fragment using the BPMS: finally, a process fragment was automated using the BPMS. This implementation on software aims at showing the feasibility of using
environmental indicators, besides the indicators belonging to the classic BPM theory, in a business scenario, within a BPMS. Interfaces are created in order to communicate with web-‐services, with the objective of showing the possibility, for the tool, of communicating with external systems,
within (e.g. ERP systems) or outside (e.g. Google APIs) the organization, in order to obtain data. 5) Verif icat ion and val idation of the instruments: the workflow drawn up and configured in
the BPMS, in a way that it can be executed, was verified and validated. The two processes, verification and validation, respectively mean “building the model correctly” and “building the correct model” (Chung, 2004). They are taken from the theory behind simulation, but we can
assume their validity for process model execution too. To be verified, the model has to:
• Include all the required components;
• Be able to run without any warning or error
In order to attain verification, the tool was presented to the process owner, as the person with the most complete knowledge about the process. While, to be valid, the requirements are:
• Collect high-‐quality information and data on the system (interviews, datasets,
assumptions);
• Validate the overall model output.
The tool was thus illustrated to BPMS experts with more than five years of experience, of the
delivery centres of the company were this research was carried out. Thus, they were required feedback about the goodness of the model.
Research reliability is thus assured by using several sources for evidence, replicating the findings in
several cases, and establishing an evidence chain (Yin, 2003).
18
4. Conceptual solutions This investigation investigates how BPMN 2.0 can be extended in a way to account for processes
environmental impact. Questioning how to apply the notation in practice, what to represent, and how to represent it, has showed the need for application guidelines that have been thus developed. The whole
work has brought to a method and several instruments to model business processes environmental footprint, and their integration with BPMSs. These are orderly presented in the following paragraphs.
4.1 BPMN 2.0 environmental extension
4.1.1 Key Environmental Indicators (KEIs) investigation Investigating which indicators is meaningful representing in an environmental extension of BPMN
2.0, is aimed at providing better understanding of activities environmental footprint within business
processes. One of the benefits would be making process designer aware of processes environmental sustainability performances at design time. BPMN 2.0, although generally well-‐suited for business process modelling, particularly suits this need due to its construct specialization and type aggregation (Wahl &
Sindre, 2009).
The main objective, in developing the notation, through all the design phases, was providing the
reader information graphically, through the process map, in a way that it can be easily transmitted. Information can be obtained in different ways: different symbols can be implemented, either to indicate
emission sources, or emissions themselves.
The concept behind extension mechanisms is that they allow domain-‐specific concepts representation beyond the general purposes of the modelling language. BPMN 2.0, as already said, allows
extension by addition, which consists of attaching new elements to the predefined ones (Selic, 2007).
Given the non-‐generalization of a list of Key Environmental Indicators (KEIs) relevant for all
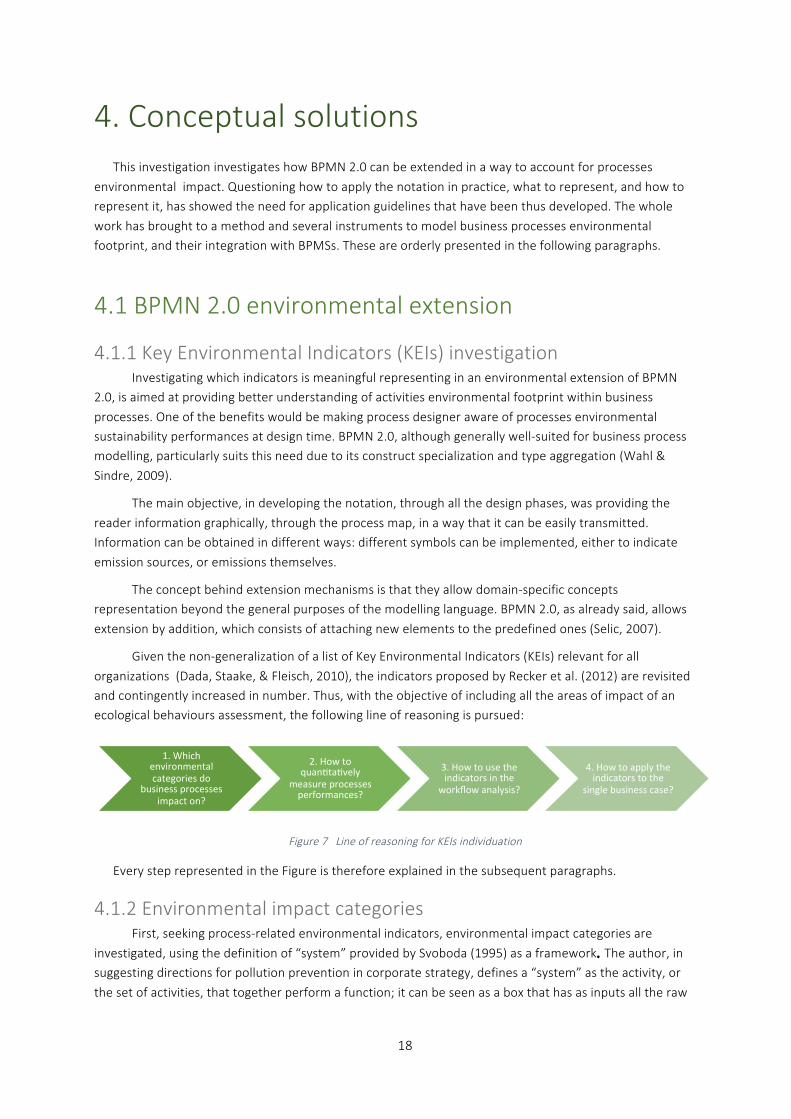
organizations (Dada, Staake, & Fleisch, 2010), the indicators proposed by Recker et al. (2012) are revisited and contingently increased in number. Thus, with the objective of including all the areas of impact of an ecological behaviours assessment, the following line of reasoning is pursued:
Figure 7 Line of reasoning for KEIs individuation
Every step represented in the Figure is therefore explained in the subsequent paragraphs.
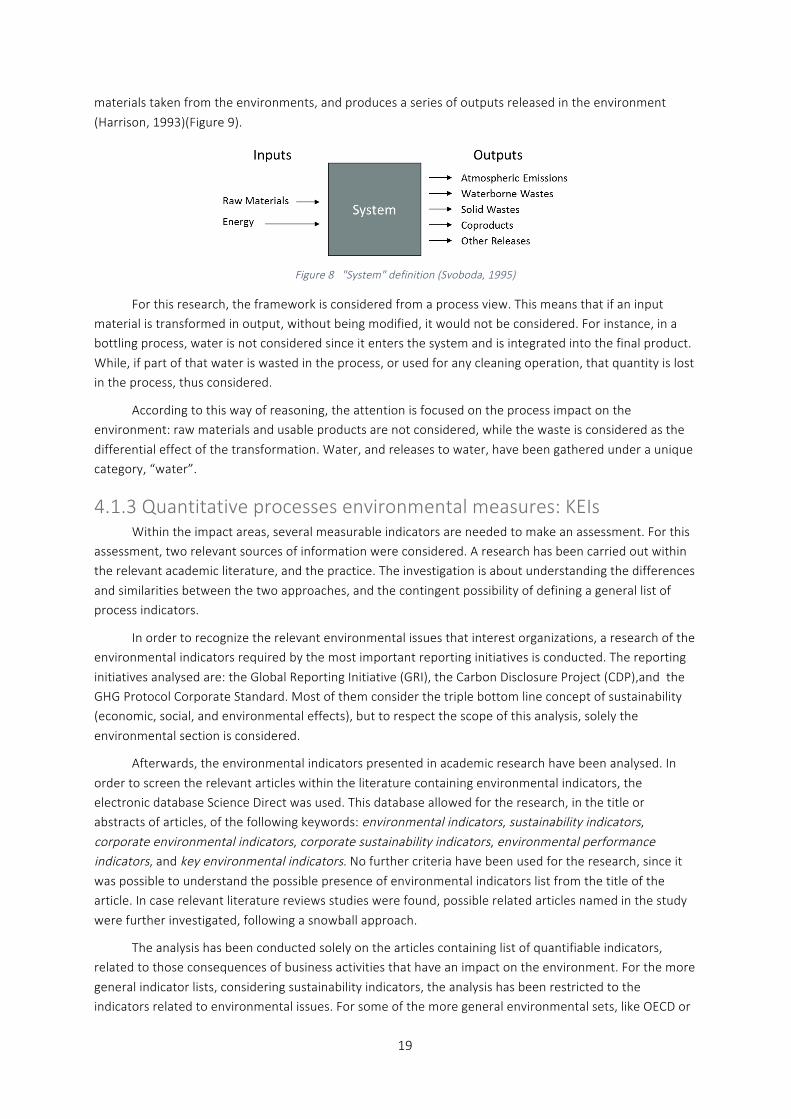
4.1.2 Environmental impact categories First, seeking process-‐related environmental indicators, environmental impact categories are
investigated, using the definition of “system” provided by Svoboda (1995) as a framework. The author, in suggesting directions for pollution prevention in corporate strategy, defines a “system” as the activity, or
the set of activities, that together perform a function; it can be seen as a box that has as inputs all the raw
1. Which environmental categories do
business processes impact on?
2. How to quan=ta=vely
measure processes performances?
3. How to use the indicators in the
workflow analysis?
4. How to apply the indicators to the
single business case?
19
materials taken from the environments, and produces a series of outputs released in the environment
(Harrison, 1993)(Figure 9).
Figure 8 "System" definition (Svoboda, 1995)
For this research, the framework is considered from a process view. This means that if an input material is transformed in output, without being modified, it would not be considered. For instance, in a bottling process, water is not considered since it enters the system and is integrated into the final product.
While, if part of that water is wasted in the process, or used for any cleaning operation, that quantity is lost in the process, thus considered.
According to this way of reasoning, the attention is focused on the process impact on the environment: raw materials and usable products are not considered, while the waste is considered as the
differential effect of the transformation. Water, and releases to water, have been gathered under a unique category, “water”.
4.1.3 Quantitative processes environmental measures: KEIs Within the impact areas, several measurable indicators are needed to make an assessment. For this
assessment, two relevant sources of information were considered. A research has been carried out within the relevant academic literature, and the practice. The investigation is about understanding the differences
and similarities between the two approaches, and the contingent possibility of defining a general list of process indicators.
In order to recognize the relevant environmental issues that interest organizations, a research of the environmental indicators required by the most important reporting initiatives is conducted. The reporting
initiatives analysed are: the Global Reporting Initiative (GRI), the Carbon Disclosure Project (CDP),and the GHG Protocol Corporate Standard. Most of them consider the triple bottom line concept of sustainability (economic, social, and environmental effects), but to respect the scope of this analysis, solely the
environmental section is considered.
Afterwards, the environmental indicators presented in academic research have been analysed. In
order to screen the relevant articles within the literature containing environmental indicators, the electronic database Science Direct was used. This database allowed for the research, in the title or abstracts of articles, of the following keywords: environmental indicators, sustainability indicators, corporate environmental indicators, corporate sustainability indicators, environmental performance indicators, and key environmental indicators. No further criteria have been used for the research, since it was possible to understand the possible presence of environmental indicators list from the title of the article. In case relevant literature reviews studies were found, possible related articles named in the study
were further investigated, following a snowball approach.
The analysis has been conducted solely on the articles containing list of quantifiable indicators, related to those consequences of business activities that have an impact on the environment. For the more
general indicator lists, considering sustainability indicators, the analysis has been restricted to the indicators related to environmental issues. For some of the more general environmental sets, like OECD or
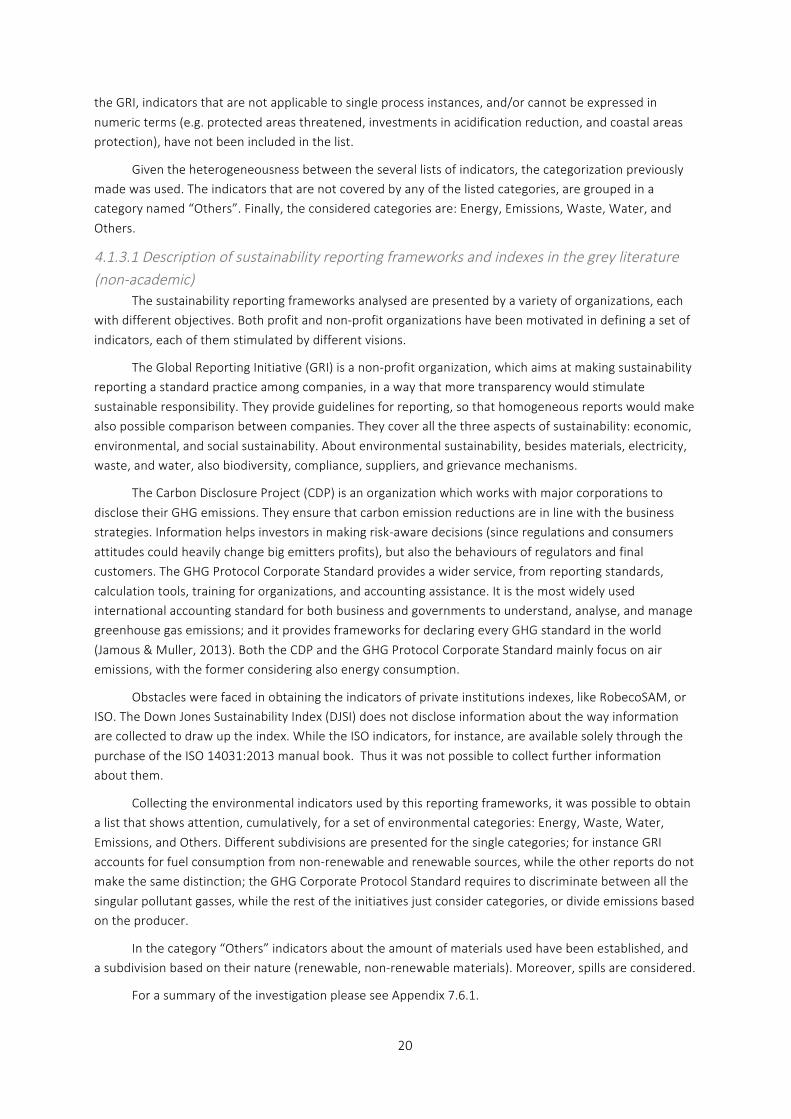
20
the GRI, indicators that are not applicable to single process instances, and/or cannot be expressed in
numeric terms (e.g. protected areas threatened, investments in acidification reduction, and coastal areas protection), have not been included in the list.
Given the heterogeneousness between the several lists of indicators, the categorization previously made was used. The indicators that are not covered by any of the listed categories, are grouped in a category named “Others”. Finally, the considered categories are: Energy, Emissions, Waste, Water, and
Others.
4.1.3.1 Description of sustainability reporting frameworks and indexes in the grey literature (non-‐academic)
The sustainability reporting frameworks analysed are presented by a variety of organizations, each with different objectives. Both profit and non-‐profit organizations have been motivated in defining a set of
indicators, each of them stimulated by different visions.
The Global Reporting Initiative (GRI) is a non-‐profit organization, which aims at making sustainability reporting a standard practice among companies, in a way that more transparency would stimulate
sustainable responsibility. They provide guidelines for reporting, so that homogeneous reports would make also possible comparison between companies. They cover all the three aspects of sustainability: economic,
environmental, and social sustainability. About environmental sustainability, besides materials, electricity, waste, and water, also biodiversity, compliance, suppliers, and grievance mechanisms.
The Carbon Disclosure Project (CDP) is an organization which works with major corporations to
disclose their GHG emissions. They ensure that carbon emission reductions are in line with the business strategies. Information helps investors in making risk-‐aware decisions (since regulations and consumers
attitudes could heavily change big emitters profits), but also the behaviours of regulators and final customers. The GHG Protocol Corporate Standard provides a wider service, from reporting standards,
calculation tools, training for organizations, and accounting assistance. It is the most widely used international accounting standard for both business and governments to understand, analyse, and manage greenhouse gas emissions; and it provides frameworks for declaring every GHG standard in the world
(Jamous & Muller, 2013). Both the CDP and the GHG Protocol Corporate Standard mainly focus on air emissions, with the former considering also energy consumption.
Obstacles were faced in obtaining the indicators of private institutions indexes, like RobecoSAM, or ISO. The Down Jones Sustainability Index (DJSI) does not disclose information about the way information are collected to draw up the index. While the ISO indicators, for instance, are available solely through the
purchase of the ISO 14031:2013 manual book. Thus it was not possible to collect further information about them.
Collecting the environmental indicators used by this reporting frameworks, it was possible to obtain a list that shows attention, cumulatively, for a set of environmental categories: Energy, Waste, Water,
Emissions, and Others. Different subdivisions are presented for the single categories; for instance GRI accounts for fuel consumption from non-‐renewable and renewable sources, while the other reports do not make the same distinction; the GHG Corporate Protocol Standard requires to discriminate between all the
singular pollutant gasses, while the rest of the initiatives just consider categories, or divide emissions based on the producer.
In the category “Others” indicators about the amount of materials used have been established, and a subdivision based on their nature (renewable, non-‐renewable materials). Moreover, spills are considered.
For a summary of the investigation please see Appendix 7.6.1.
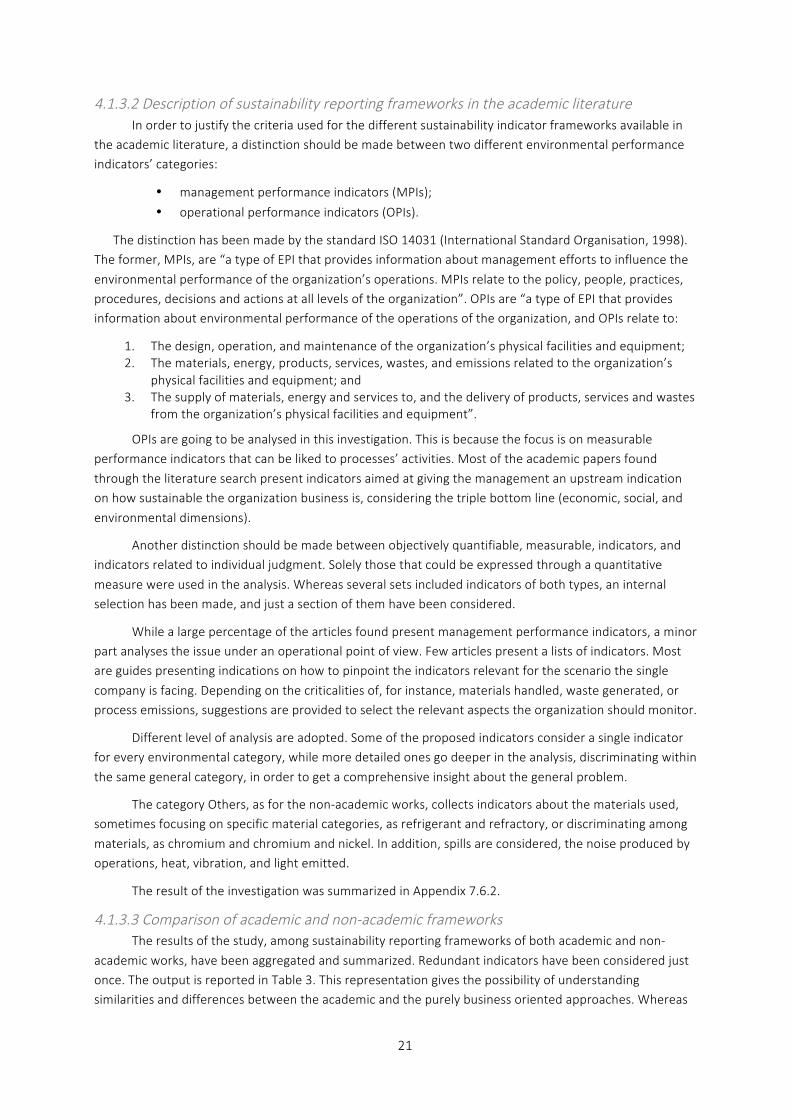
21
4.1.3.2 Description of sustainability reporting frameworks in the academic literature In order to justify the criteria used for the different sustainability indicator frameworks available in
the academic literature, a distinction should be made between two different environmental performance indicators’ categories:
• management performance indicators (MPIs);
• operational performance indicators (OPIs).
The distinction has been made by the standard ISO 14031 (International Standard Organisation, 1998). The former, MPIs, are “a type of EPI that provides information about management efforts to influence the
environmental performance of the organization’s operations. MPIs relate to the policy, people, practices, procedures, decisions and actions at all levels of the organization”. OPIs are “a type of EPI that provides information about environmental performance of the operations of the organization, and OPIs relate to:
1. The design, operation, and maintenance of the organization’s physical facilities and equipment; 2. The materials, energy, products, services, wastes, and emissions related to the organization’s
physical facilities and equipment; and 3. The supply of materials, energy and services to, and the delivery of products, services and wastes
from the organization’s physical facilities and equipment”.
OPIs are going to be analysed in this investigation. This is because the focus is on measurable performance indicators that can be liked to processes’ activities. Most of the academic papers found
through the literature search present indicators aimed at giving the management an upstream indication on how sustainable the organization business is, considering the triple bottom line (economic, social, and
environmental dimensions).
Another distinction should be made between objectively quantifiable, measurable, indicators, and indicators related to individual judgment. Solely those that could be expressed through a quantitative
measure were used in the analysis. Whereas several sets included indicators of both types, an internal selection has been made, and just a section of them have been considered.
While a large percentage of the articles found present management performance indicators, a minor part analyses the issue under an operational point of view. Few articles present a lists of indicators. Most are guides presenting indications on how to pinpoint the indicators relevant for the scenario the single
company is facing. Depending on the criticalities of, for instance, materials handled, waste generated, or process emissions, suggestions are provided to select the relevant aspects the organization should monitor.
Different level of analysis are adopted. Some of the proposed indicators consider a single indicator for every environmental category, while more detailed ones go deeper in the analysis, discriminating within
the same general category, in order to get a comprehensive insight about the general problem.
The category Others, as for the non-‐academic works, collects indicators about the materials used, sometimes focusing on specific material categories, as refrigerant and refractory, or discriminating among
materials, as chromium and chromium and nickel. In addition, spills are considered, the noise produced by operations, heat, vibration, and light emitted.
The result of the investigation was summarized in Appendix 7.6.2.
4.1.3.3 Comparison of academic and non-‐academic frameworks The results of the study, among sustainability reporting frameworks of both academic and non-‐
academic works, have been aggregated and summarized. Redundant indicators have been considered just once. The output is reported in Table 3. This representation gives the possibility of understanding similarities and differences between the academic and the purely business oriented approaches. Whereas
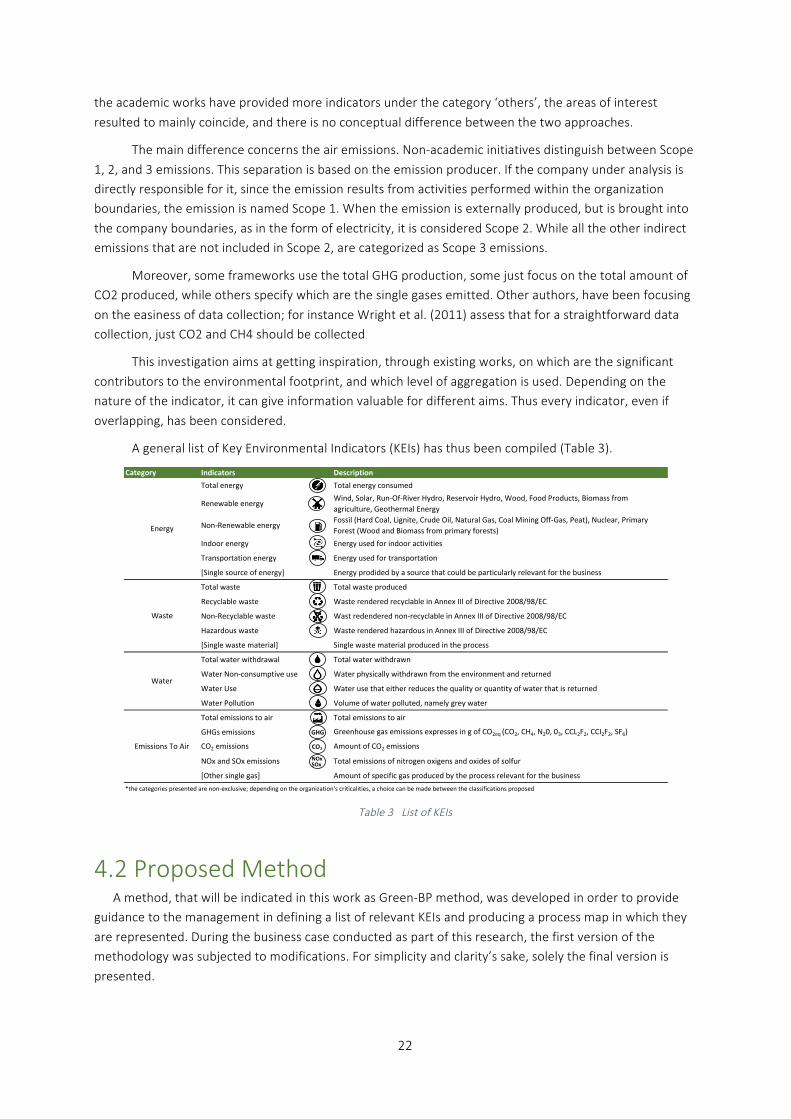
22
the academic works have provided more indicators under the category ‘others’, the areas of interest
resulted to mainly coincide, and there is no conceptual difference between the two approaches.
The main difference concerns the air emissions. Non-‐academic initiatives distinguish between Scope
1, 2, and 3 emissions. This separation is based on the emission producer. If the company under analysis is directly responsible for it, since the emission results from activities performed within the organization boundaries, the emission is named Scope 1. When the emission is externally produced, but is brought into
the company boundaries, as in the form of electricity, it is considered Scope 2. While all the other indirect emissions that are not included in Scope 2, are categorized as Scope 3 emissions.
Moreover, some frameworks use the total GHG production, some just focus on the total amount of CO2 produced, while others specify which are the single gases emitted. Other authors, have been focusing
on the easiness of data collection; for instance Wright et al. (2011) assess that for a straightforward data collection, just CO2 and CH4 should be collected
This investigation aims at getting inspiration, through existing works, on which are the significant
contributors to the environmental footprint, and which level of aggregation is used. Depending on the nature of the indicator, it can give information valuable for different aims. Thus every indicator, even if
overlapping, has been considered.
A general list of Key Environmental Indicators (KEIs) has thus been compiled (Table 3).
Table 3 List of KEIs
4.2 Proposed Method A method, that will be indicated in this work as Green-‐BP method, was developed in order to provide
guidance to the management in defining a list of relevant KEIs and producing a process map in which they
are represented. During the business case conducted as part of this research, the first version of the methodology was subjected to modifications. For simplicity and clarity’s sake, solely the final version is
presented.
Category Indicators DescriptionTotal energy Total energy consumed
Renewable energyWind, Solar, Run-‐Of-‐River Hydro, Reservoir Hydro, Wood, Food Products, Biomass from agriculture, Geothermal Energy
Non-‐Renewable energyFossil (Hard Coal, Lignite, Crude Oil, Natural Gas, Coal Mining Off-‐Gas, Peat), Nuclear, Primary Forest (Wood and Biomass from primary forests)
Indoor energy Energy used for indoor activities
Transportation energy Energy used for transportation
[Single source of energy] Energy prodided by a source that could be particularly relevant for the business
Total waste Total waste produced
Recyclable waste Waste rendered recyclable in Annex III of Directive 2008/98/EC
Non-‐Recyclable waste Wast redendered non-‐recyclable in Annex III of Directive 2008/98/EC
Hazardous waste Waste rendered hazardous in Annex III of Directive 2008/98/EC
[Single waste material] Single waste material produced in the process
Total water withdrawal Total water withdrawn
Water Non-‐consumptive use Water physically withdrawn from the environment and returned
Water Use Water use that either reduces the quality or quantity of water that is returned
Water Pollution Volume of water polluted, namely grey water
Total emissions to air Total emissions to air
GHGs emissions Greenhouse gas emissions expresses in g of CO2eq (CO2, CH4, N20, 03, CCL2F2, CCI2F2, SF6)
CO2 emissions Amount of CO2 emissions
NOx and SOx emissions Total emissions of nitrogen oxigens and oxides of solfur
[Other single gas] Amount of specific gas produced by the process relevant for the business*the categories presented are non-‐exclusive; depending on the organization's criticalities, a choice can be made between the classifications proposed
Waste
Water
Energy
Emissions To Air
GHG
CO2
X
NOxSOx
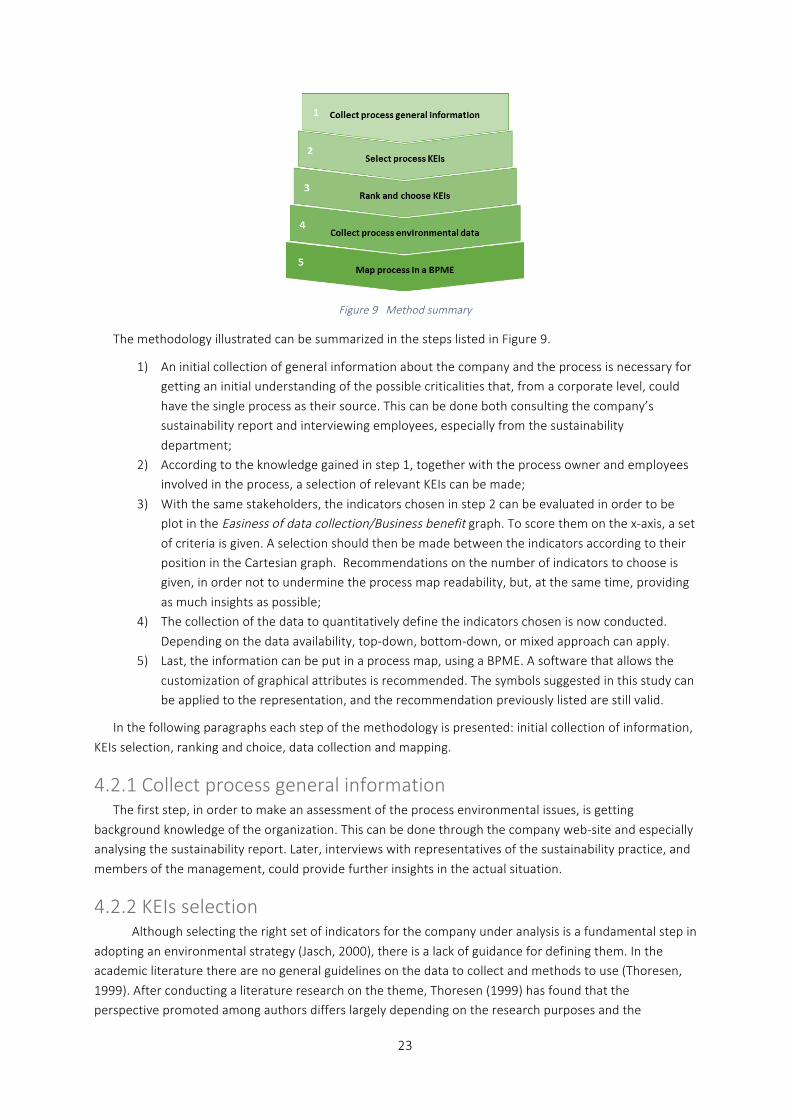
23
Figure 9 Method summary
The methodology illustrated can be summarized in the steps listed in Figure 9.
1) An initial collection of general information about the company and the process is necessary for getting an initial understanding of the possible criticalities that, from a corporate level, could
have the single process as their source. This can be done both consulting the company’s sustainability report and interviewing employees, especially from the sustainability
department; 2) According to the knowledge gained in step 1, together with the process owner and employees
involved in the process, a selection of relevant KEIs can be made;
3) With the same stakeholders, the indicators chosen in step 2 can be evaluated in order to be plot in the Easiness of data collection/Business benefit graph. To score them on the x-‐axis, a set
of criteria is given. A selection should then be made between the indicators according to their position in the Cartesian graph. Recommendations on the number of indicators to choose is given, in order not to undermine the process map readability, but, at the same time, providing
as much insights as possible; 4) The collection of the data to quantitatively define the indicators chosen is now conducted.
Depending on the data availability, top-‐down, bottom-‐down, or mixed approach can apply. 5) Last, the information can be put in a process map, using a BPME. A software that allows the
customization of graphical attributes is recommended. The symbols suggested in this study can be applied to the representation, and the recommendation previously listed are still valid.
In the following paragraphs each step of the methodology is presented: initial collection of information,
KEIs selection, ranking and choice, data collection and mapping.
4.2.1 Collect process general information The first step, in order to make an assessment of the process environmental issues, is getting
background knowledge of the organization. This can be done through the company web-‐site and especially analysing the sustainability report. Later, interviews with representatives of the sustainability practice, and
members of the management, could provide further insights in the actual situation.
4.2.2 KEIs selection Although selecting the right set of indicators for the company under analysis is a fundamental step in
adopting an environmental strategy (Jasch, 2000), there is a lack of guidance for defining them. In the academic literature there are no general guidelines on the data to collect and methods to use (Thoresen,
1999). After conducting a literature research on the theme, Thoresen (1999) has found that the perspective promoted among authors differs largely depending on the research purposes and the
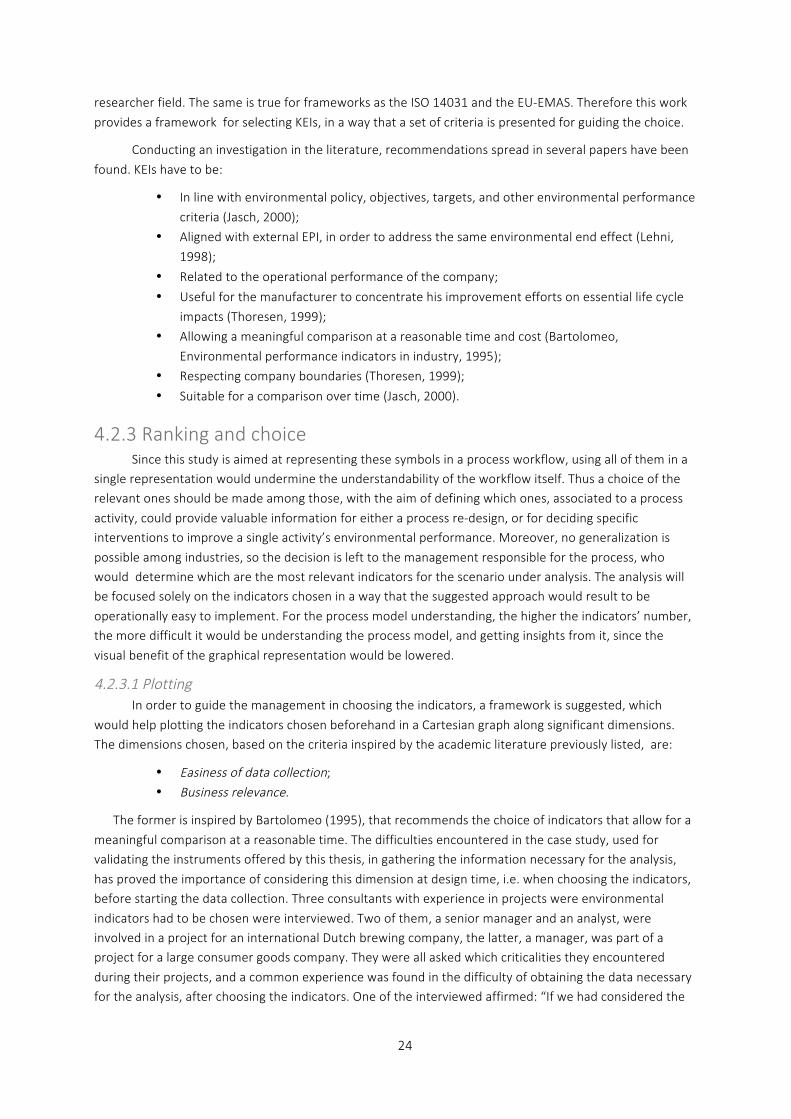
24
researcher field. The same is true for frameworks as the ISO 14031 and the EU-‐EMAS. Therefore this work
provides a framework for selecting KEIs, in a way that a set of criteria is presented for guiding the choice.
Conducting an investigation in the literature, recommendations spread in several papers have been
found. KEIs have to be:
• In line with environmental policy, objectives, targets, and other environmental performance
criteria (Jasch, 2000);
• Aligned with external EPI, in order to address the same environmental end effect (Lehni,
1998);
• Related to the operational performance of the company;
• Useful for the manufacturer to concentrate his improvement efforts on essential life cycle
impacts (Thoresen, 1999);
• Allowing a meaningful comparison at a reasonable time and cost (Bartolomeo,
Environmental performance indicators in industry, 1995);
• Respecting company boundaries (Thoresen, 1999);
• Suitable for a comparison over time (Jasch, 2000).
4.2.3 Ranking and choice Since this study is aimed at representing these symbols in a process workflow, using all of them in a
single representation would undermine the understandability of the workflow itself. Thus a choice of the relevant ones should be made among those, with the aim of defining which ones, associated to a process
activity, could provide valuable information for either a process re-‐design, or for deciding specific interventions to improve a single activity’s environmental performance. Moreover, no generalization is
possible among industries, so the decision is left to the management responsible for the process, who would determine which are the most relevant indicators for the scenario under analysis. The analysis will be focused solely on the indicators chosen in a way that the suggested approach would result to be
operationally easy to implement. For the process model understanding, the higher the indicators’ number, the more difficult it would be understanding the process model, and getting insights from it, since the
visual benefit of the graphical representation would be lowered.
4.2.3.1 Plotting In order to guide the management in choosing the indicators, a framework is suggested, which
would help plotting the indicators chosen beforehand in a Cartesian graph along significant dimensions. The dimensions chosen, based on the criteria inspired by the academic literature previously listed, are:
• Easiness of data collection; • Business relevance.
The former is inspired by Bartolomeo (1995), that recommends the choice of indicators that allow for a
meaningful comparison at a reasonable time. The difficulties encountered in the case study, used for validating the instruments offered by this thesis, in gathering the information necessary for the analysis,
has proved the importance of considering this dimension at design time, i.e. when choosing the indicators, before starting the data collection. Three consultants with experience in projects were environmental
indicators had to be chosen were interviewed. Two of them, a senior manager and an analyst, were involved in a project for an international Dutch brewing company, the latter, a manager, was part of a project for a large consumer goods company. They were all asked which criticalities they encountered
during their projects, and a common experience was found in the difficulty of obtaining the data necessary for the analysis, after choosing the indicators. One of the interviewed affirmed: “If we had considered the
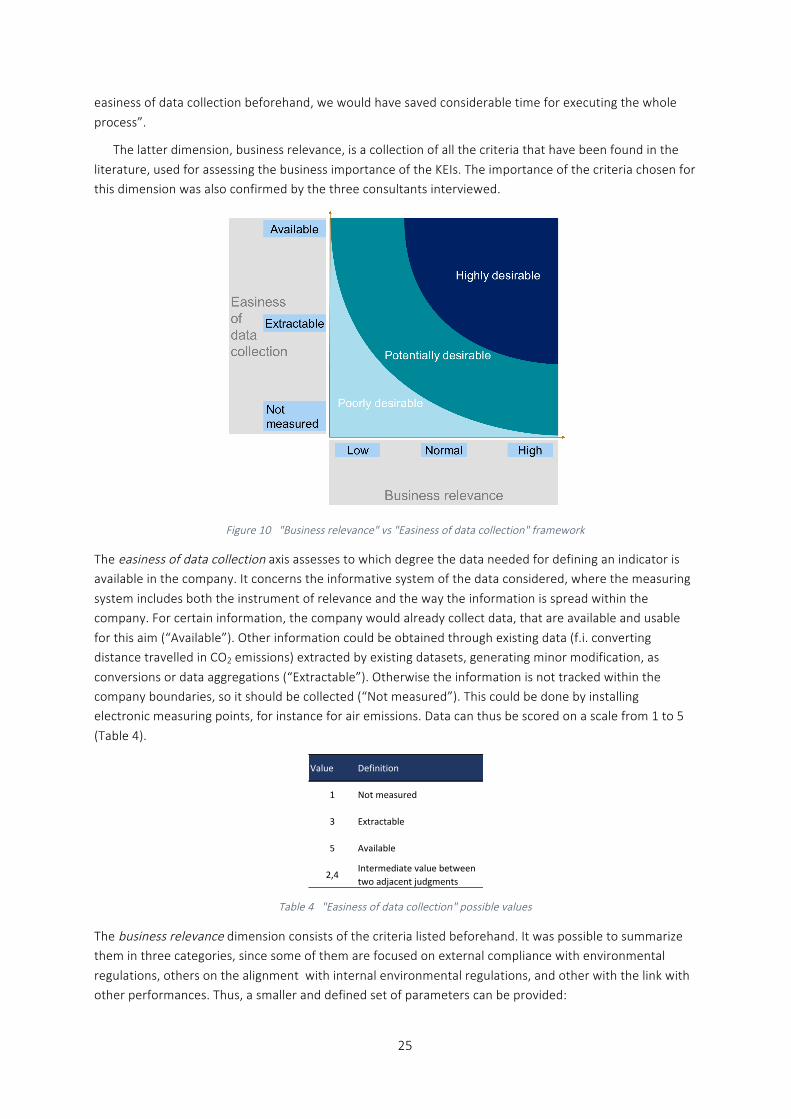
25
easiness of data collection beforehand, we would have saved considerable time for executing the whole
process”.
The latter dimension, business relevance, is a collection of all the criteria that have been found in the
literature, used for assessing the business importance of the KEIs. The importance of the criteria chosen for this dimension was also confirmed by the three consultants interviewed.
Figure 10 "Business relevance" vs "Easiness of data collection" framework
The easiness of data collection axis assesses to which degree the data needed for defining an indicator is available in the company. It concerns the informative system of the data considered, where the measuring
system includes both the instrument of relevance and the way the information is spread within the company. For certain information, the company would already collect data, that are available and usable
for this aim (“Available”). Other information could be obtained through existing data (f.i. converting distance travelled in CO2 emissions) extracted by existing datasets, generating minor modification, as
conversions or data aggregations (“Extractable”). Otherwise the information is not tracked within the company boundaries, so it should be collected (“Not measured”). This could be done by installing electronic measuring points, for instance for air emissions. Data can thus be scored on a scale from 1 to 5
(Table 4).
Table 4 "Easiness of data collection" possible values
The business relevance dimension consists of the criteria listed beforehand. It was possible to summarize them in three categories, since some of them are focused on external compliance with environmental
regulations, others on the alignment with internal environmental regulations, and other with the link with other performances. Thus, a smaller and defined set of parameters can be provided:
Value Definition
1 Not measured
3 Extractable
5 Available
2,4Intermediate value between two adjacent judgments
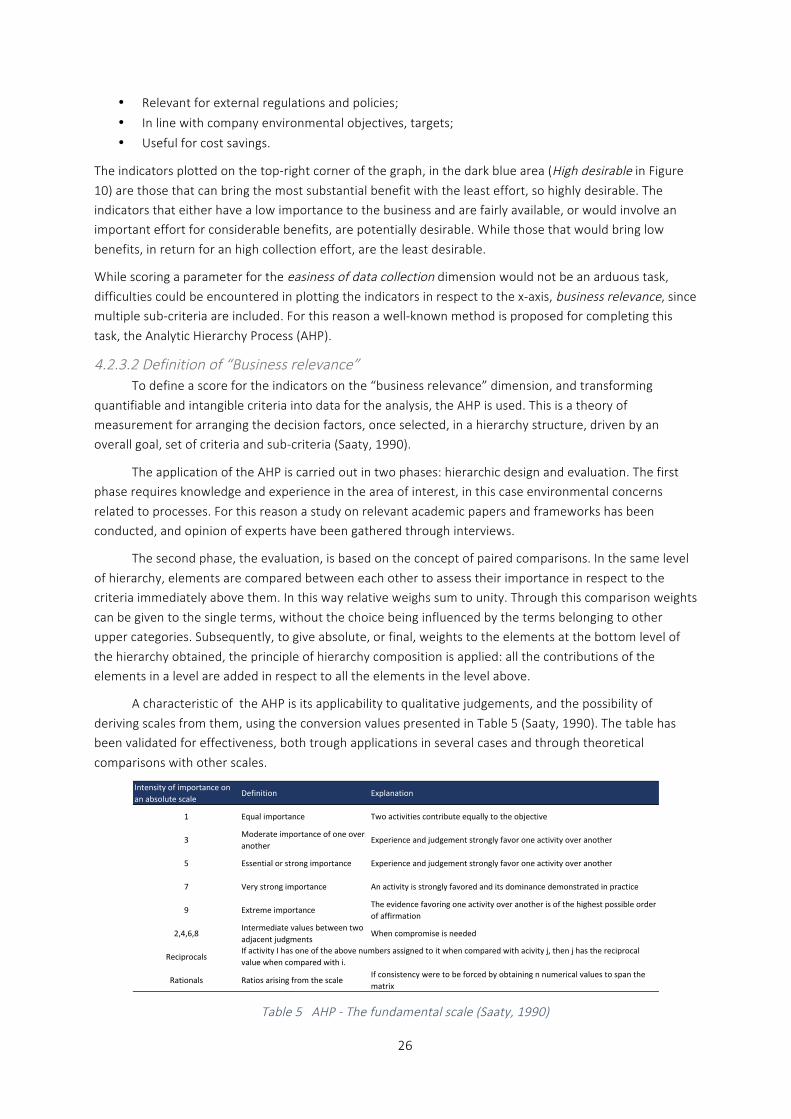
26
• Relevant for external regulations and policies;
• In line with company environmental objectives, targets;
• Useful for cost savings.
The indicators plotted on the top-‐right corner of the graph, in the dark blue area (High desirable in Figure 10) are those that can bring the most substantial benefit with the least effort, so highly desirable. The indicators that either have a low importance to the business and are fairly available, or would involve an important effort for considerable benefits, are potentially desirable. While those that would bring low
benefits, in return for an high collection effort, are the least desirable.
While scoring a parameter for the easiness of data collection dimension would not be an arduous task,
difficulties could be encountered in plotting the indicators in respect to the x-‐axis, business relevance, since multiple sub-‐criteria are included. For this reason a well-‐known method is proposed for completing this
task, the Analytic Hierarchy Process (AHP).
4.2.3.2 Definition of “Business relevance” To define a score for the indicators on the “business relevance” dimension, and transforming
quantifiable and intangible criteria into data for the analysis, the AHP is used. This is a theory of measurement for arranging the decision factors, once selected, in a hierarchy structure, driven by an overall goal, set of criteria and sub-‐criteria (Saaty, 1990).
The application of the AHP is carried out in two phases: hierarchic design and evaluation. The first phase requires knowledge and experience in the area of interest, in this case environmental concerns
related to processes. For this reason a study on relevant academic papers and frameworks has been conducted, and opinion of experts have been gathered through interviews.
The second phase, the evaluation, is based on the concept of paired comparisons. In the same level
of hierarchy, elements are compared between each other to assess their importance in respect to the criteria immediately above them. In this way relative weighs sum to unity. Through this comparison weights
can be given to the single terms, without the choice being influenced by the terms belonging to other upper categories. Subsequently, to give absolute, or final, weights to the elements at the bottom level of
the hierarchy obtained, the principle of hierarchy composition is applied: all the contributions of the elements in a level are added in respect to all the elements in the level above.
A characteristic of the AHP is its applicability to qualitative judgements, and the possibility of
deriving scales from them, using the conversion values presented in Table 5 (Saaty, 1990). The table has been validated for effectiveness, both trough applications in several cases and through theoretical
comparisons with other scales.
Table 5 AHP -‐ The fundamental scale (Saaty, 1990)
Intensity of importance on an absolute scale
Definition Explanation
1 Equal importance Two activities contribute equally to the objective
3Moderate importance of one over another
Experience and judgement strongly favor one activity over another
5 Essential or strong importance Experience and judgement strongly favor one activity over another
7 Very strong importance An activity is strongly favored and its dominance demonstrated in practice
9 Extreme importanceThe evidence favoring one activity over another is of the highest possible order of affirmation
2,4,6,8Intermediate values between two adjacent judgments
When compromise is needed
Reciprocals
Rationals Ratios arising from the scaleIf consistency were to be forced by obtaining n numerical values to span the matrix
If activity I has one of the above numbers assigned to it when compared with acivity j, then j has the reciprocal value when compared with i.
27
In order to rank the KEIs use the Analytic Hierarchy Process (definition at (Vargas, 1990), a focus on how
to translate qualitative judgements into numerical ones (R. & Palmer, 1986)). To assess single activities’ scores, use this to give weights to the different factors:
• Elicitation within the higher level of categories (Energy, waste, water, emissions to air): arrange the elements in a matrix and assess judgments. Question to ask: of the two criteria being compared, which is considered more important by the management with the overall goal of “improving the process environmental footprint”?.
• Calculate the vector of priorities of the matrix of pairwise comparison, that is the principal eigenvector of the matrix. It provides the relative priority of the criteria measured on a ratio scale.
After the application of the AHP, every indicator would have a certain weight, that would be used for assessing the single activity environmental impact.
4.2.3.3 Selection Based on the Cartesian graph built following the considerations expressed beforehand, a selection of
the indicators to draw on the process map can be made.
The suggestion is to keep the number of indicators relatively low, around 4 or 5, in order to benefit the most from the graphical insights given by the notation, without undermining the understandability of the process model. The number could be higher, depending on the frequency of appearance of every
indicator in the map, i.e. the number of activities whose sources of emissions are the same.
4.2.4 Process environmental data collection After the assessment of the environmental indicators that are relevant to measure, the data collection
can start, with a clear objective. In this section, first general information about data collection in business processes is presented, illustrating several approaches available in the academic literature, later
information about the data analysis for some indicators is presented.
4.2.4.1 Data collection Different data collection techniques can be used in combination, to analyse primary and secondary
data. Primary data is data collected by the analyst, while secondary data is data collected beforehand by someone else, commonly for other purposes. Using multiple techniques and sources gives the possibility of
getting triangulation of the empirical data, in a way that reliability is assured (Eisenhardt, 1989).
For the data collection, the difference between dynamic and stat ic KEIs should be taken into
account. According to the principles of industrial economy, costs can be divided in two groups: variable and fixed costs (Garrison, Noreen, & Brewer, 2003). The distinction is based on the dependency on the product or service’s quantity used by the business. The same categorization exists for the environmental indicator,
which can be divided in two main groups: dynamic and static KEIs (Nowak, Leymann, Schumm, & Wetzstein, 2011). The first category includes those indicators which vary in proportion to the good or
service either used or produced (e.g. waste produced in a production process) ; while the second does not depend on the actual usage (e.g. electricity needed for running a server, which has a constant consumption, independent from the number of instances).
The difference between Scope 1, 2, and 3 emissions is illustrated here, since it is used in the graphical representation. The GHG Protocol (Bhatia & Ranganatha, 2014) presents Scope 1 and 2 emissions as falling
within a company’s boundary, while Scope 3 emissions do not. Scope 1 emissions are direct emissions, emitted by sources owned or controlled by the company, while Scope 2 emissions are indirect emissions,
and account for the consumption of purchased electricity and heat. Scope 3 emissions are an effect of the activities of the company, but are not produced by resources owned by it.
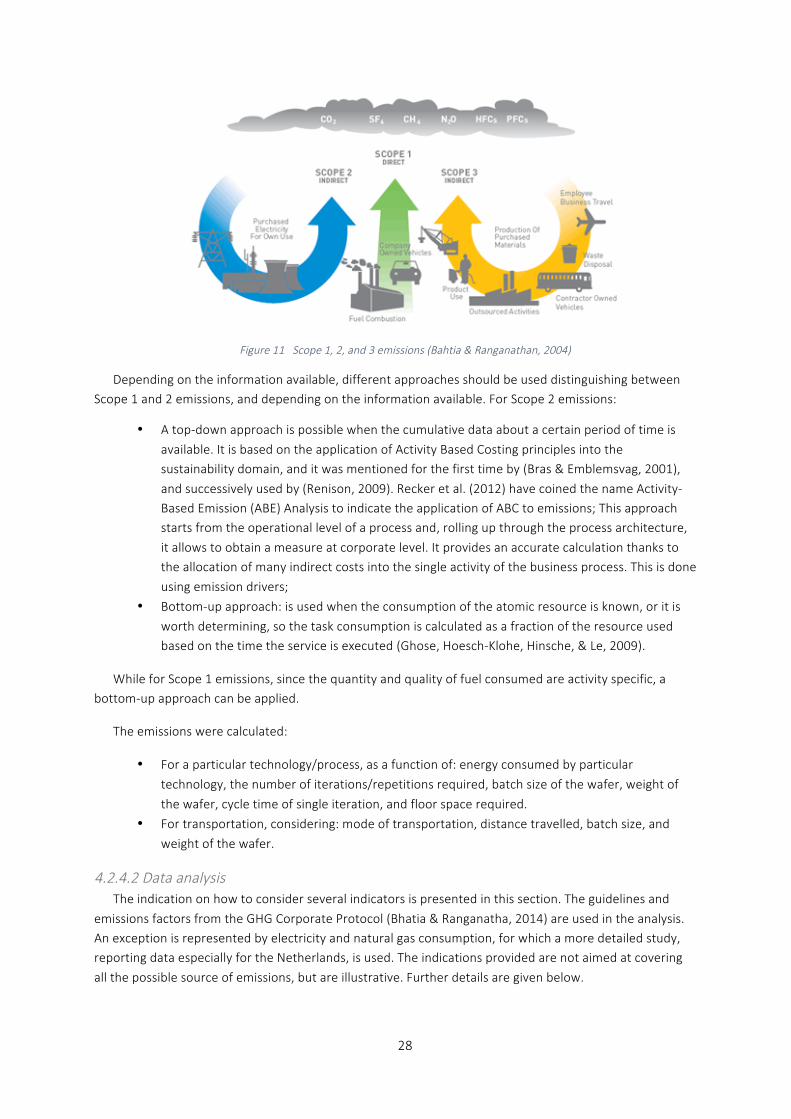
28
Figure 11 Scope 1, 2, and 3 emissions (Bahtia & Ranganathan, 2004)
Depending on the information available, different approaches should be used distinguishing between Scope 1 and 2 emissions, and depending on the information available. For Scope 2 emissions:
• A top-‐down approach is possible when the cumulative data about a certain period of time is
available. It is based on the application of Activity Based Costing principles into the sustainability domain, and it was mentioned for the first time by (Bras & Emblemsvag, 2001),
and successively used by (Renison, 2009). Recker et al. (2012) have coined the name Activity-‐Based Emission (ABE) Analysis to indicate the application of ABC to emissions; This approach starts from the operational level of a process and, rolling up through the process architecture,
it allows to obtain a measure at corporate level. It provides an accurate calculation thanks to the allocation of many indirect costs into the single activity of the business process. This is done
using emission drivers;
• Bottom-‐up approach: is used when the consumption of the atomic resource is known, or it is
worth determining, so the task consumption is calculated as a fraction of the resource used based on the time the service is executed (Ghose, Hoesch-‐Klohe, Hinsche, & Le, 2009).
While for Scope 1 emissions, since the quantity and quality of fuel consumed are activity specific, a bottom-‐up approach can be applied.
The emissions were calculated:
• For a particular technology/process, as a function of: energy consumed by particular
technology, the number of iterations/repetitions required, batch size of the wafer, weight of
the wafer, cycle time of single iteration, and floor space required.
• For transportation, considering: mode of transportation, distance travelled, batch size, and
weight of the wafer.
4.2.4.2 Data analysis The indication on how to consider several indicators is presented in this section. The guidelines and
emissions factors from the GHG Corporate Protocol (Bhatia & Ranganatha, 2014) are used in the analysis. An exception is represented by electricity and natural gas consumption, for which a more detailed study, reporting data especially for the Netherlands, is used. The indications provided are not aimed at covering
all the possible source of emissions, but are illustrative. Further details are given below.
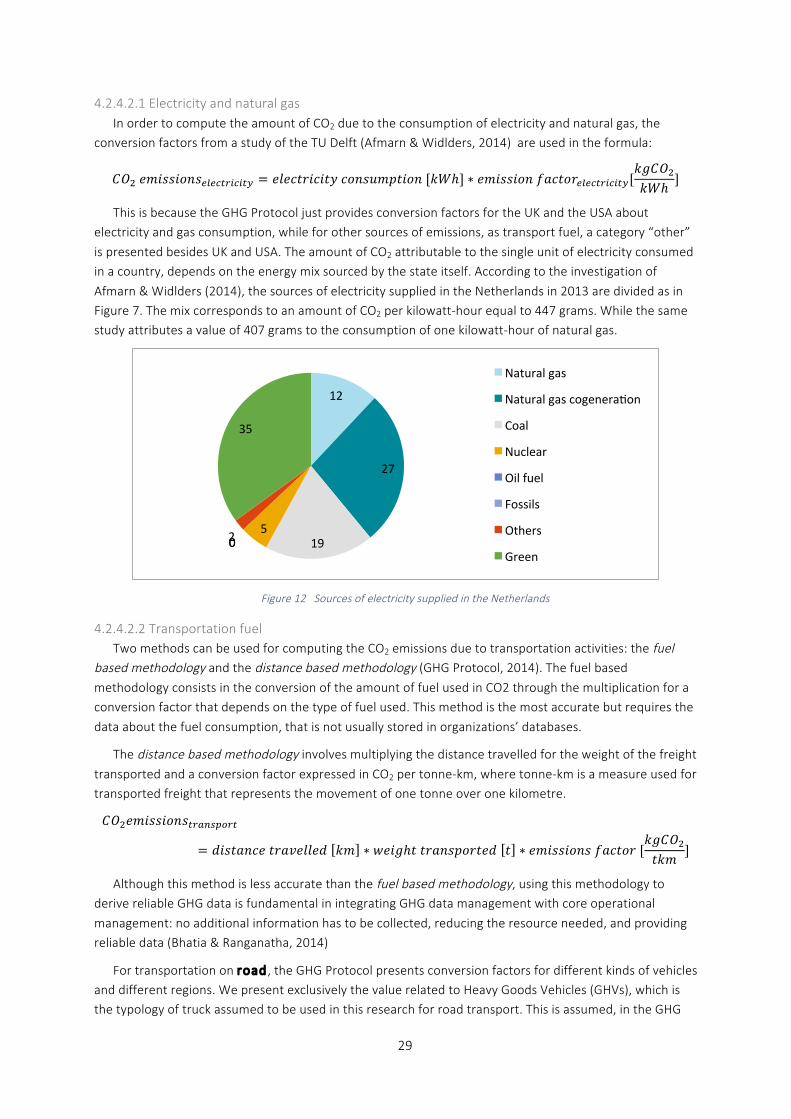
29
4.2.4.2.1 Electricity and natural gas In order to compute the amount of CO2 due to the consumption of electricity and natural gas, the
conversion factors from a study of the TU Delft (Afmarn & Widlders, 2014) are used in the formula:
𝐶𝑂! 𝑒𝑚𝑖𝑠𝑠𝑖𝑜𝑛𝑠!"!#$%&#&$' = 𝑒𝑙𝑒𝑐𝑡𝑟𝑖𝑐𝑖𝑡𝑦 𝑐𝑜𝑛𝑠𝑢𝑚𝑝𝑡𝑖𝑜𝑛 [𝑘𝑊ℎ] ∗ 𝑒𝑚𝑖𝑠𝑠𝑖𝑜𝑛 𝑓𝑎𝑐𝑡𝑜𝑟!"!#$%&#&$'[𝑘𝑔𝐶𝑂!𝑘𝑊ℎ
]
This is because the GHG Protocol just provides conversion factors for the UK and the USA about electricity and gas consumption, while for other sources of emissions, as transport fuel, a category “other”
is presented besides UK and USA. The amount of CO2 attributable to the single unit of electricity consumed in a country, depends on the energy mix sourced by the state itself. According to the investigation of
Afmarn & Widlders (2014), the sources of electricity supplied in the Netherlands in 2013 are divided as in Figure 7. The mix corresponds to an amount of CO2 per kilowatt-‐hour equal to 447 grams. While the same study attributes a value of 407 grams to the consumption of one kilowatt-‐hour of natural gas.
Figure 12 Sources of electricity supplied in the Netherlands
4.2.4.2.2 Transportation fuel Two methods can be used for computing the CO2 emissions due to transportation activities: the fuel
based methodology and the distance based methodology (GHG Protocol, 2014). The fuel based methodology consists in the conversion of the amount of fuel used in CO2 through the multiplication for a conversion factor that depends on the type of fuel used. This method is the most accurate but requires the
data about the fuel consumption, that is not usually stored in organizations’ databases.
The distance based methodology involves multiplying the distance travelled for the weight of the freight
transported and a conversion factor expressed in CO2 per tonne-‐km, where tonne-‐km is a measure used for transported freight that represents the movement of one tonne over one kilometre.
𝐶𝑂!𝑒𝑚𝑖𝑠𝑠𝑖𝑜𝑛𝑠!"#$%&'"!
= 𝑑𝑖𝑠𝑡𝑎𝑛𝑐𝑒 𝑡𝑟𝑎𝑣𝑒𝑙𝑙𝑒𝑑 𝑘𝑚 ∗ 𝑤𝑒𝑖𝑔ℎ𝑡 𝑡𝑟𝑎𝑛𝑠𝑝𝑜𝑟𝑡𝑒𝑑 𝑡 ∗ 𝑒𝑚𝑖𝑠𝑠𝑖𝑜𝑛𝑠 𝑓𝑎𝑐𝑡𝑜𝑟 [𝑘𝑔𝐶𝑂!𝑡𝑘𝑚
]
Although this method is less accurate than the fuel based methodology, using this methodology to derive reliable GHG data is fundamental in integrating GHG data management with core operational
management: no additional information has to be collected, reducing the resource needed, and providing reliable data (Bhatia & Ranganatha, 2014)
For transportation on road, the GHG Protocol presents conversion factors for different kinds of vehicles and different regions. We present exclusively the value related to Heavy Goods Vehicles (GHVs), which is the typology of truck assumed to be used in this research for road transport. This is assumed, in the GHG
12
27
19 5
0 0 2
35
Natural gas
Natural gas cogenera=on
Coal
Nuclear
Oil fuel
Fossils
Others
Green
30
protocol, of having an utilization factor of 40%, meaning that 40% of its capacity is actually utilized on
average. This corresponds to a conversion factor of 0.297 kg/short ton mile, equal to 0.203 kg CO2/tkm.
For transportation by air , Beings 747 are the planes assumed to be used by the GHG Protocol. The
distance travelled is computed as the Great Circle Distance (GCD, the shortest distance between two points on the surface of a sphere) plus 9% surplus , to take into account non-‐direct routes, i.e. the distance travelled besides the GCD. Studies suggest that this surplus should depend on the distance travelled, since
it would be higher for short-‐haul flights and lower for long-‐haul flights, but the GHG Protocol does not consider this distinction. The emission factors by weight distance proposed, for the region “Other” (than
UK and US), are:
• Air – short haul 1.47389 CO2 kilograms/tonne kilometre (< 1000 km); • Air – long haul 0.61324 CO2 kilograms/tonne kilometre.
Values differ depending on flight distance, according to (Blinge, 2005), because taxi out, take off and climb phases account for a relevant part of the total CO2 produced by the plane: 50% for short routes
(981km) and 35% for long ones (1192km). In the cruise phase the 40% and 55% of CO2 are produced, respectively. While the descent, approach, landing and taxi in phases account for the remaining 10%. Taxi time, which last on average 26 minutes, 2’500 kg of CO2 are produced.
The GHG Protocol gives conversion values for different kind of ships. Here we give only the value associated to Large Container Vessels with a deadweight equal to 20’000 tons, which, for the region
“Other” (than UK and USA), is equal to 0.048 kilograms per ton kilometre, assuming an utilization of 70%.
Among the solutions available for keeping containers temperature steady, there is refrigerated
containers, which is increasingly becoming more predominant (Wild, 2008). Reefers, as refrigerated containers are called, have mostly self-‐contained mechanical vapour refrigeration unit inside the insulated container. This requires an external source of electricity to run the refrigeration system. As an average
energy consumption rate, the value of 2.7kW per Twenty-‐Feet Equivalent (TEU) assessed by Wild (2008) is used. This value is recommended for both air and sea transportation:
𝐶𝑂!𝑒𝑚𝑖𝑠𝑠𝑖𝑜𝑛𝑠!"#!$%"!&'$()
= 𝑝𝑜𝑤𝑒𝑟 𝑐𝑜𝑛𝑠𝑢𝑚𝑝𝑡𝑖𝑜𝑛 𝑘𝑊 ∗ 𝑡𝑖𝑚𝑒 ℎ ∗ 𝑒𝑚𝑖𝑠𝑠𝑖𝑜𝑛 𝑓𝑎𝑐𝑡𝑜𝑟!"#!$%"!&'$()[𝑘𝑔𝐶𝑂!𝑘𝑊ℎ
]
4.2.4.2.3 Handling operations Handling operations are considered when computing the emissions due to logistic activities:
• Loading and unloading trucks, if done with a LPG-‐powered forklift, produces 10.2 Kg CO2/h
(Johnson, 2008), less than the electric version. The time assumed to be necessary to complete
every loading or unloading operation is assumed to be equal to ten minutes.
𝐶𝑂! 𝑒𝑚𝑖𝑠𝑠𝑖𝑜𝑛𝑠!"#$%&!' = 𝑡𝑖𝑚𝑒 ℎ ∗ 𝑒𝑚𝑖𝑠𝑠𝑖𝑜𝑛 𝑓𝑎𝑐𝑡𝑜𝑟!"#$%&!'[𝑘𝑔𝐶𝑂!ℎ
]
• While airport emissions globally make up about 3 percent of total non-‐road emissions (EPA, US, 2003), no data was available in the academic literature for the operations carried out by
ground support equipment (GSE) for handling the cargo. Neither other sources could provide this information (Blinge, 2005). There are not considered in the calculations.
• Port activities represent 2-‐6% of the total emissions produced during the total sea journey
(Streets, 2000). though academic attention has been focusing on the them, few studies attempted assessing a value for air emissions attributable to a unit of freight (for ton of freight
handled or for container). Though several studies investigate the energy consumption of Cargo Handling Equipment (CHE), as container cranes, reach stackers, yard tractors (f.i. (Shin &
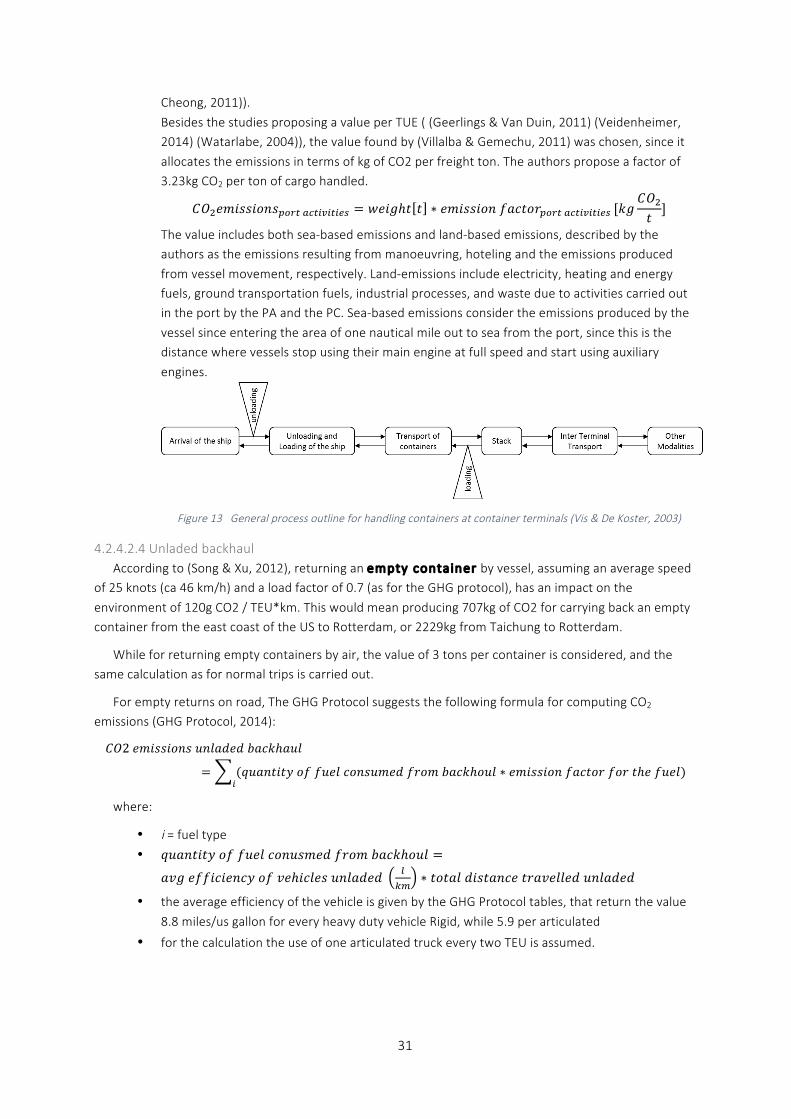
31
Cheong, 2011)).
Besides the studies proposing a value per TUE ( (Geerlings & Van Duin, 2011) (Veidenheimer, 2014) (Watarlabe, 2004)), the value found by (Villalba & Gemechu, 2011) was chosen, since it
allocates the emissions in terms of kg of CO2 per freight ton. The authors propose a factor of 3.23kg CO2 per ton of cargo handled.
𝐶𝑂!𝑒𝑚𝑖𝑠𝑠𝑖𝑜𝑛𝑠!"#$ !"#$%$#$&' = 𝑤𝑒𝑖𝑔ℎ𝑡 𝑡 ∗ 𝑒𝑚𝑖𝑠𝑠𝑖𝑜𝑛 𝑓𝑎𝑐𝑡𝑜𝑟!"#$ !"#$%$#$&' [𝑘𝑔𝐶𝑂!𝑡]
The value includes both sea-‐based emissions and land-‐based emissions, described by the authors as the emissions resulting from manoeuvring, hoteling and the emissions produced
from vessel movement, respectively. Land-‐emissions include electricity, heating and energy fuels, ground transportation fuels, industrial processes, and waste due to activities carried out in the port by the PA and the PC. Sea-‐based emissions consider the emissions produced by the
vessel since entering the area of one nautical mile out to sea from the port, since this is the distance where vessels stop using their main engine at full speed and start using auxiliary
engines.
Figure 13 General process outline for handling containers at container terminals (Vis & De Koster, 2003)
4.2.4.2.4 Unladed backhaul According to (Song & Xu, 2012), returning an empty container by vessel, assuming an average speed
of 25 knots (ca 46 km/h) and a load factor of 0.7 (as for the GHG protocol), has an impact on the
environment of 120g CO2 / TEU*km. This would mean producing 707kg of CO2 for carrying back an empty container from the east coast of the US to Rotterdam, or 2229kg from Taichung to Rotterdam.
While for returning empty containers by air, the value of 3 tons per container is considered, and the same calculation as for normal trips is carried out.
For empty returns on road, The GHG Protocol suggests the following formula for computing CO2 emissions (GHG Protocol, 2014):
𝐶𝑂2 𝑒𝑚𝑖𝑠𝑠𝑖𝑜𝑛𝑠 𝑢𝑛𝑙𝑎𝑑𝑒𝑑 𝑏𝑎𝑐𝑘ℎ𝑎𝑢𝑙
= (𝑞𝑢𝑎𝑛𝑡𝑖𝑡𝑦 𝑜𝑓 𝑓𝑢𝑒𝑙 𝑐𝑜𝑛𝑠𝑢𝑚𝑒𝑑 𝑓𝑟𝑜𝑚 𝑏𝑎𝑐𝑘ℎ𝑜𝑢𝑙 ∗ 𝑒𝑚𝑖𝑠𝑠𝑖𝑜𝑛 𝑓𝑎𝑐𝑡𝑜𝑟 𝑓𝑜𝑟 𝑡ℎ𝑒 𝑓𝑢𝑒𝑙)!
where:
• i = fuel type • 𝑞𝑢𝑎𝑛𝑡𝑖𝑡𝑦 𝑜𝑓 𝑓𝑢𝑒𝑙 𝑐𝑜𝑛𝑢𝑠𝑚𝑒𝑑 𝑓𝑟𝑜𝑚 𝑏𝑎𝑐𝑘ℎ𝑜𝑢𝑙 =
𝑎𝑣𝑔 𝑒𝑓𝑓𝑖𝑐𝑖𝑒𝑛𝑐𝑦 𝑜𝑓 𝑣𝑒ℎ𝑖𝑐𝑙𝑒𝑠 𝑢𝑛𝑙𝑎𝑑𝑒𝑑 !!"
∗ 𝑡𝑜𝑡𝑎𝑙 𝑑𝑖𝑠𝑡𝑎𝑛𝑐𝑒 𝑡𝑟𝑎𝑣𝑒𝑙𝑙𝑒𝑑 𝑢𝑛𝑙𝑎𝑑𝑒𝑑
• the average efficiency of the vehicle is given by the GHG Protocol tables, that return the value
8.8 miles/us gallon for every heavy duty vehicle Rigid, while 5.9 per articulated
• for the calculation the use of one articulated truck every two TEU is assumed.
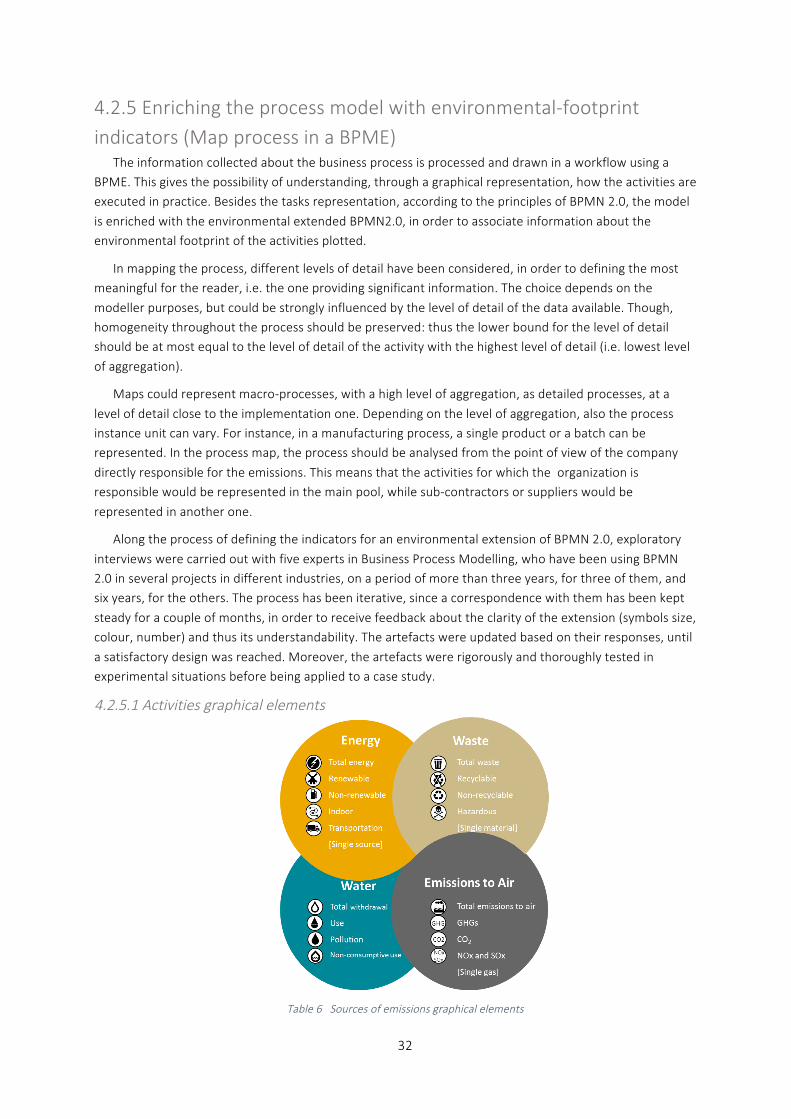
32
4.2.5 Enriching the process model with environmental-‐footprint indicators (Map process in a BPME)
The information collected about the business process is processed and drawn in a workflow using a BPME. This gives the possibility of understanding, through a graphical representation, how the activities are executed in practice. Besides the tasks representation, according to the principles of BPMN 2.0, the model
is enriched with the environmental extended BPMN2.0, in order to associate information about the environmental footprint of the activities plotted.
In mapping the process, different levels of detail have been considered, in order to defining the most meaningful for the reader, i.e. the one providing significant information. The choice depends on the
modeller purposes, but could be strongly influenced by the level of detail of the data available. Though, homogeneity throughout the process should be preserved: thus the lower bound for the level of detail should be at most equal to the level of detail of the activity with the highest level of detail (i.e. lowest level
of aggregation).
Maps could represent macro-‐processes, with a high level of aggregation, as detailed processes, at a
level of detail close to the implementation one. Depending on the level of aggregation, also the process instance unit can vary. For instance, in a manufacturing process, a single product or a batch can be represented. In the process map, the process should be analysed from the point of view of the company
directly responsible for the emissions. This means that the activities for which the organization is responsible would be represented in the main pool, while sub-‐contractors or suppliers would be
represented in another one.
Along the process of defining the indicators for an environmental extension of BPMN 2.0, exploratory
interviews were carried out with five experts in Business Process Modelling, who have been using BPMN 2.0 in several projects in different industries, on a period of more than three years, for three of them, and six years, for the others. The process has been iterative, since a correspondence with them has been kept
steady for a couple of months, in order to receive feedback about the clarity of the extension (symbols size, colour, number) and thus its understandability. The artefacts were updated based on their responses, until
a satisfactory design was reached. Moreover, the artefacts were rigorously and thoroughly tested in experimental situations before being applied to a case study.
4.2.5.1 Activities graphical elements
Table 6 Sources of emissions graphical elements
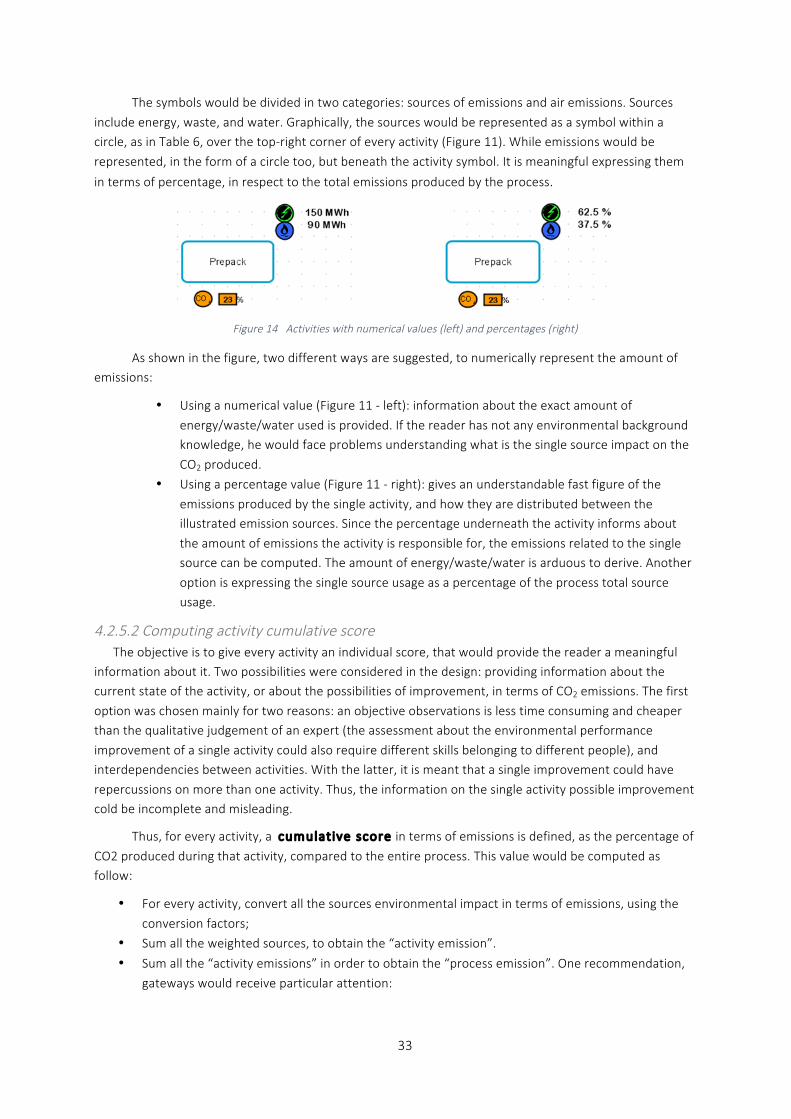
33
The symbols would be divided in two categories: sources of emissions and air emissions. Sources
include energy, waste, and water. Graphically, the sources would be represented as a symbol within a circle, as in Table 6, over the top-‐right corner of every activity (Figure 11). While emissions would be
represented, in the form of a circle too, but beneath the activity symbol. It is meaningful expressing them
in terms of percentage, in respect to the total emissions produced by the process.
Figure 14 Activities with numerical values (left) and percentages (right)
As shown in the figure, two different ways are suggested, to numerically represent the amount of emissions:
• Using a numerical value (Figure 11 -‐ left): information about the exact amount of
energy/waste/water used is provided. If the reader has not any environmental background knowledge, he would face problems understanding what is the single source impact on the
CO2 produced.
• Using a percentage value (Figure 11 -‐ right): gives an understandable fast figure of the
emissions produced by the single activity, and how they are distributed between the illustrated emission sources. Since the percentage underneath the activity informs about
the amount of emissions the activity is responsible for, the emissions related to the single source can be computed. The amount of energy/waste/water is arduous to derive. Another
option is expressing the single source usage as a percentage of the process total source usage.
4.2.5.2 Computing activity cumulative score The objective is to give every activity an individual score, that would provide the reader a meaningful
information about it. Two possibilities were considered in the design: providing information about the current state of the activity, or about the possibilities of improvement, in terms of CO2 emissions. The first
option was chosen mainly for two reasons: an objective observations is less time consuming and cheaper than the qualitative judgement of an expert (the assessment about the environmental performance
improvement of a single activity could also require different skills belonging to different people), and interdependencies between activities. With the latter, it is meant that a single improvement could have
repercussions on more than one activity. Thus, the information on the single activity possible improvement cold be incomplete and misleading.
Thus, for every activity, a cumulat ive score in terms of emissions is defined, as the percentage of
CO2 produced during that activity, compared to the entire process. This value would be computed as follow:
• For every activity, convert all the sources environmental impact in terms of emissions, using the
conversion factors;
• Sum all the weighted sources, to obtain the “activity emission”.
• Sum all the “activity emissions” in order to obtain the “process emission”. One recommendation,
gateways would receive particular attention:
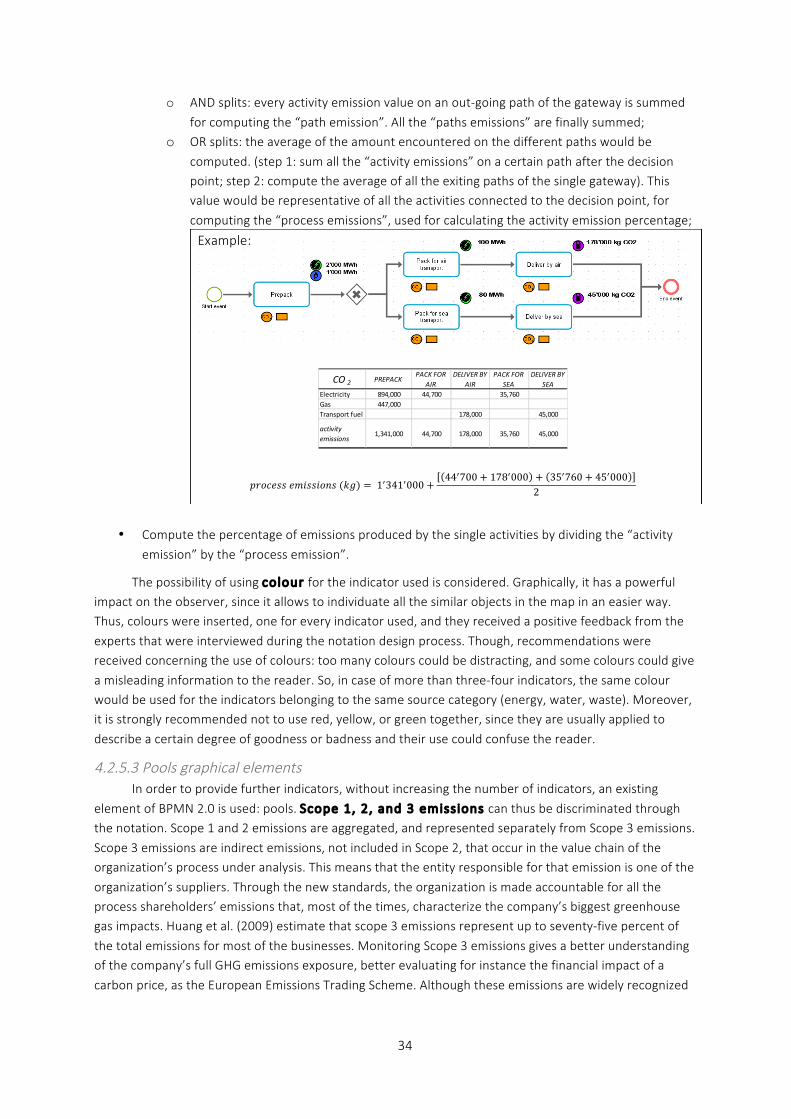
34
o AND splits: every activity emission value on an out-‐going path of the gateway is summed
for computing the “path emission”. All the “paths emissions” are finally summed; o OR splits: the average of the amount encountered on the different paths would be
computed. (step 1: sum all the “activity emissions” on a certain path after the decision point; step 2: compute the average of all the exiting paths of the single gateway). This value would be representative of all the activities connected to the decision point, for
computing the “process emissions”, used for calculating the activity emission percentage;
𝑝𝑟𝑜𝑐𝑒𝑠𝑠 𝑒𝑚𝑖𝑠𝑠𝑖𝑜𝑛𝑠 (𝑘𝑔) = 1!341!000 +44!700 + 178!000 + 35!760 + 45!000
2
• Compute the percentage of emissions produced by the single activities by dividing the “activity
emission” by the “process emission”.
The possibility of using colour for the indicator used is considered. Graphically, it has a powerful impact on the observer, since it allows to individuate all the similar objects in the map in an easier way. Thus, colours were inserted, one for every indicator used, and they received a positive feedback from the
experts that were interviewed during the notation design process. Though, recommendations were received concerning the use of colours: too many colours could be distracting, and some colours could give
a misleading information to the reader. So, in case of more than three-‐four indicators, the same colour would be used for the indicators belonging to the same source category (energy, water, waste). Moreover, it is strongly recommended not to use red, yellow, or green together, since they are usually applied to
describe a certain degree of goodness or badness and their use could confuse the reader.
4.2.5.3 Pools graphical elements In order to provide further indicators, without increasing the number of indicators, an existing
element of BPMN 2.0 is used: pools. Scope 1, 2, and 3 emissions can thus be discriminated through the notation. Scope 1 and 2 emissions are aggregated, and represented separately from Scope 3 emissions.
Scope 3 emissions are indirect emissions, not included in Scope 2, that occur in the value chain of the organization’s process under analysis. This means that the entity responsible for that emission is one of the
organization’s suppliers. Through the new standards, the organization is made accountable for all the process shareholders’ emissions that, most of the times, characterize the company’s biggest greenhouse gas impacts. Huang et al. (2009) estimate that scope 3 emissions represent up to seventy-‐five percent of
the total emissions for most of the businesses. Monitoring Scope 3 emissions gives a better understanding of the company’s full GHG emissions exposure, better evaluating for instance the financial impact of a
carbon price, as the European Emissions Trading Scheme. Although these emissions are widely recognized
CO 2 PREPACKPACK FOR
AIRDELIVER BY
AIRPACK FOR
SEA DELIVER BY
SEAElectricity 894,000 44,700 35,760Gas 447,000Transport fuel 178,000 45,000
activity emissions
1,341,000 44,700 178,000 35,760 45,000
Example:
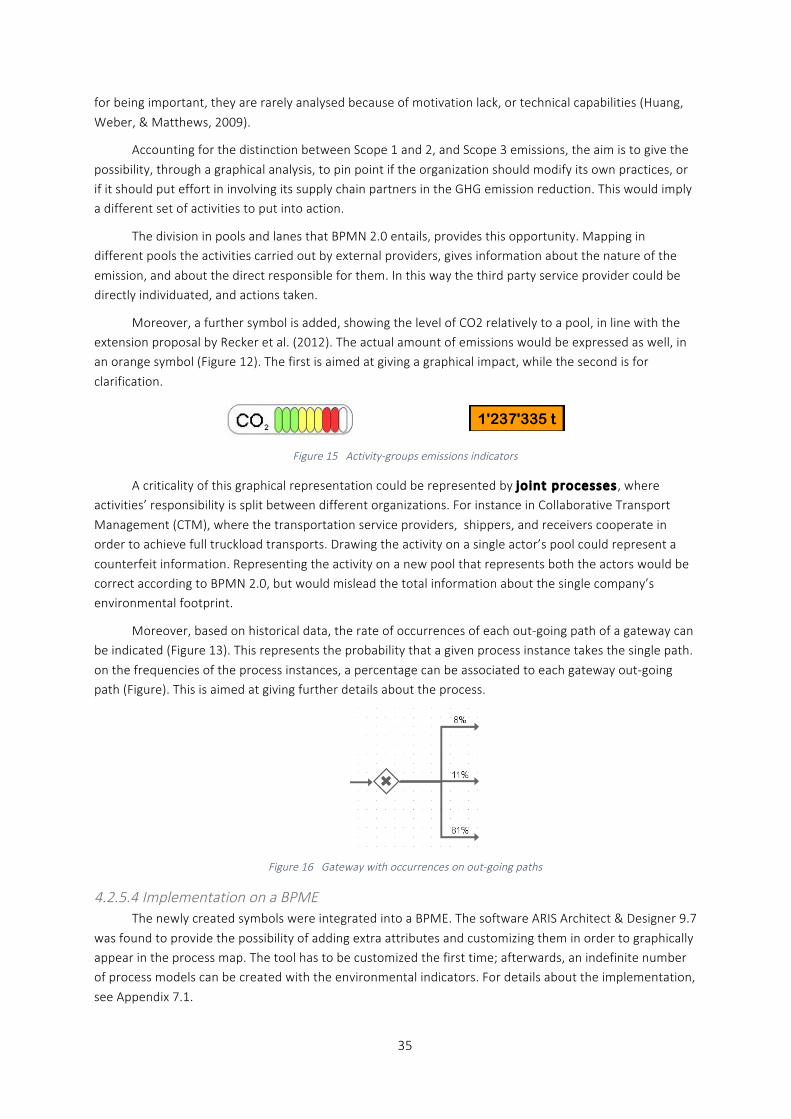
35
for being important, they are rarely analysed because of motivation lack, or technical capabilities (Huang,
Weber, & Matthews, 2009).
Accounting for the distinction between Scope 1 and 2, and Scope 3 emissions, the aim is to give the
possibility, through a graphical analysis, to pin point if the organization should modify its own practices, or if it should put effort in involving its supply chain partners in the GHG emission reduction. This would imply a different set of activities to put into action.
The division in pools and lanes that BPMN 2.0 entails, provides this opportunity. Mapping in different pools the activities carried out by external providers, gives information about the nature of the
emission, and about the direct responsible for them. In this way the third party service provider could be directly individuated, and actions taken.
Moreover, a further symbol is added, showing the level of CO2 relatively to a pool, in line with the extension proposal by Recker et al. (2012). The actual amount of emissions would be expressed as well, in an orange symbol (Figure 12). The first is aimed at giving a graphical impact, while the second is for
clarification.
Figure 15 Activity-‐groups emissions indicators
A criticality of this graphical representation could be represented by jo int processes, where activities’ responsibility is split between different organizations. For instance in Collaborative Transport
Management (CTM), where the transportation service providers, shippers, and receivers cooperate in order to achieve full truckload transports. Drawing the activity on a single actor’s pool could represent a
counterfeit information. Representing the activity on a new pool that represents both the actors would be correct according to BPMN 2.0, but would mislead the total information about the single company’s environmental footprint.
Moreover, based on historical data, the rate of occurrences of each out-‐going path of a gateway can be indicated (Figure 13). This represents the probability that a given process instance takes the single path.
on the frequencies of the process instances, a percentage can be associated to each gateway out-‐going path (Figure). This is aimed at giving further details about the process.
Figure 16 Gateway with occurrences on out-‐going paths
4.2.5.4 Implementation on a BPME The newly created symbols were integrated into a BPME. The software ARIS Architect & Designer 9.7
was found to provide the possibility of adding extra attributes and customizing them in order to graphically appear in the process map. The tool has to be customized the first time; afterwards, an indefinite number of process models can be created with the environmental indicators. For details about the implementation,
see Appendix 7.1.
1'237'335 t
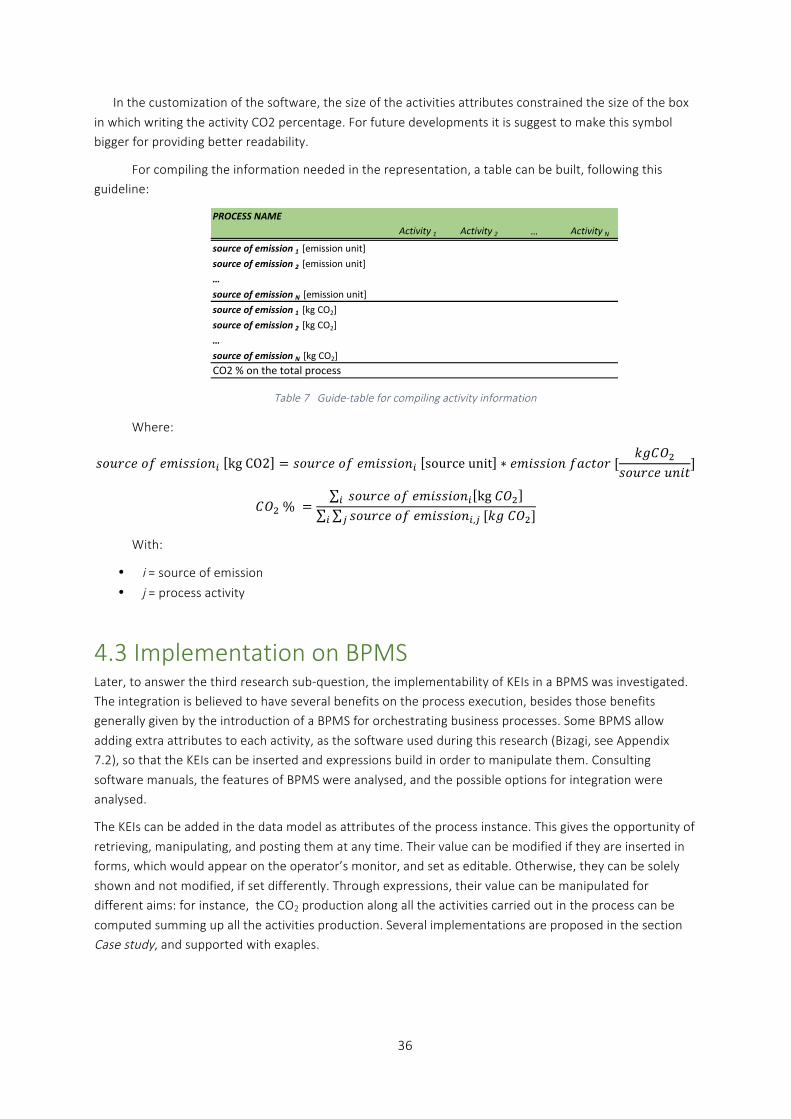
36
In the customization of the software, the size of the activities attributes constrained the size of the box
in which writing the activity CO2 percentage. For future developments it is suggest to make this symbol bigger for providing better readability.
For compiling the information needed in the representation, a table can be built, following this guideline:
Table 7 Guide-‐table for compiling activity information
Where:
𝑠𝑜𝑢𝑟𝑐𝑒 𝑜𝑓 𝑒𝑚𝑖𝑠𝑠𝑖𝑜𝑛! kg CO2 = 𝑠𝑜𝑢𝑟𝑐𝑒 𝑜𝑓 𝑒𝑚𝑖𝑠𝑠𝑖𝑜𝑛! source unit ∗ 𝑒𝑚𝑖𝑠𝑠𝑖𝑜𝑛 𝑓𝑎𝑐𝑡𝑜𝑟 [𝑘𝑔𝐶𝑂!
𝑠𝑜𝑢𝑟𝑐𝑒 𝑢𝑛𝑖𝑡]
𝐶𝑂! % = 𝑠𝑜𝑢𝑟𝑐𝑒 𝑜𝑓 𝑒𝑚𝑖𝑠𝑠𝑖𝑜𝑛! kg 𝐶𝑂!!
𝑠𝑜𝑢𝑟𝑐𝑒 𝑜𝑓 𝑒𝑚𝑖𝑠𝑠𝑖𝑜𝑛!,!!! [𝑘𝑔 𝐶𝑂!]
With:
• i = source of emission
• j = process activity
4.3 Implementation on BPMS Later, to answer the third research sub-‐question, the implementability of KEIs in a BPMS was investigated. The integration is believed to have several benefits on the process execution, besides those benefits generally given by the introduction of a BPMS for orchestrating business processes. Some BPMS allow
adding extra attributes to each activity, as the software used during this research (Bizagi, see Appendix 7.2), so that the KEIs can be inserted and expressions build in order to manipulate them. Consulting
software manuals, the features of BPMS were analysed, and the possible options for integration were analysed.
The KEIs can be added in the data model as attributes of the process instance. This gives the opportunity of
retrieving, manipulating, and posting them at any time. Their value can be modified if they are inserted in forms, which would appear on the operator’s monitor, and set as editable. Otherwise, they can be solely
shown and not modified, if set differently. Through expressions, their value can be manipulated for different aims: for instance, the CO2 production along all the activities carried out in the process can be
computed summing up all the activities production. Several implementations are proposed in the section Case study, and supported with exaples.
PROCESS NAMEActivity 1 Activity 2 … Activity N
source of emission 1 [emission unit]source of emission 2 [emission unit]…source of emission N [emission unit]source of emission 1 [kg CO2]source of emission 2 [kg CO2]…source of emission N [kg CO2]CO2 % on the total process
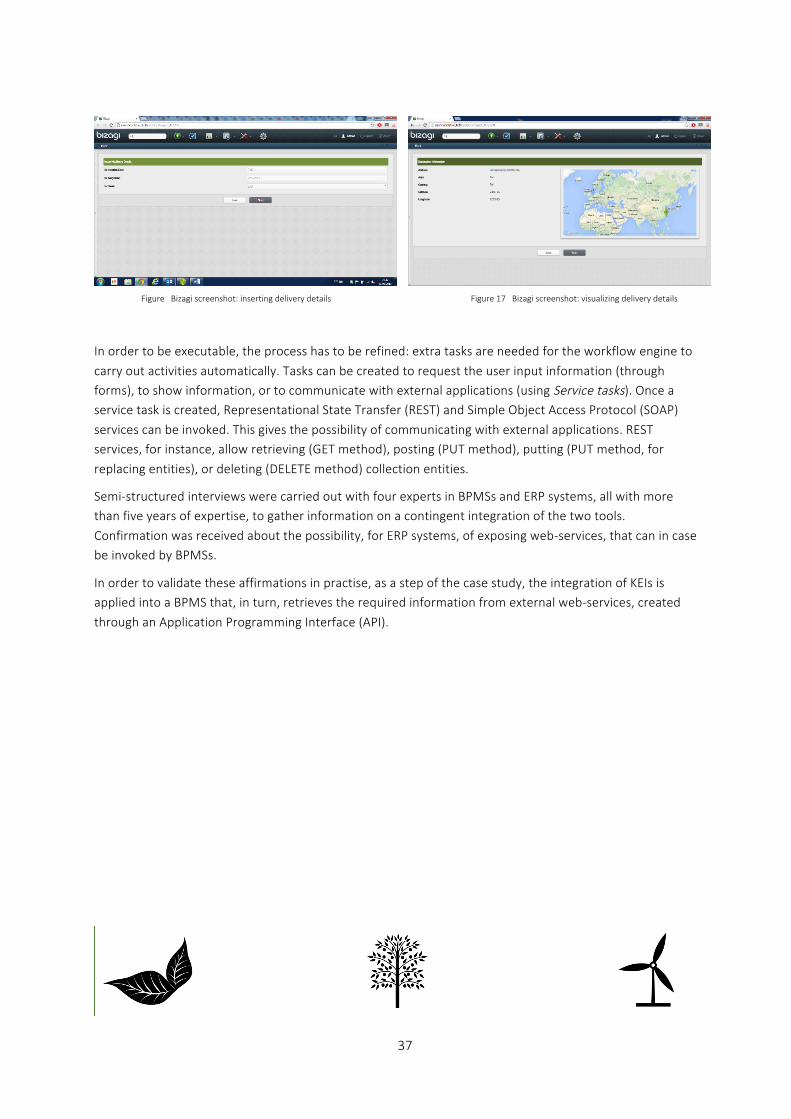
37
Figure Bizagi screenshot: inserting delivery details Figure 17 Bizagi screenshot: visualizing delivery details
In order to be executable, the process has to be refined: extra tasks are needed for the workflow engine to
carry out activities automatically. Tasks can be created to request the user input information (through forms), to show information, or to communicate with external applications (using Service tasks). Once a service task is created, Representational State Transfer (REST) and Simple Object Access Protocol (SOAP)
services can be invoked. This gives the possibility of communicating with external applications. REST services, for instance, allow retrieving (GET method), posting (PUT method), putting (PUT method, for
replacing entities), or deleting (DELETE method) collection entities.
Semi-‐structured interviews were carried out with four experts in BPMSs and ERP systems, all with more than five years of expertise, to gather information on a contingent integration of the two tools.
Confirmation was received about the possibility, for ERP systems, of exposing web-‐services, that can in case be invoked by BPMSs.
In order to validate these affirmations in practise, as a step of the case study, the integration of KEIs is applied into a BPMS that, in turn, retrieves the required information from external web-‐services, created
through an Application Programming Interface (API).
38
5. Case Study The aim of the case study is to provide further elements of validation. This is to pinpoint
representational shortcomings of the presented technique and understanding potential opportunities that it could offer. In this way a more sophisticated, revised technique can be designed that would
produce models of higher quality.
An organization was sought among Accenture clients, in order to get access to highly environmental impacting processes. The project was proposed to several managers within Accenture
that, in case, would have presented the project to their direct clients.
The company that accepted the project1 is a supplier of photolithography systems for the semiconductor industry, based in the Netherlands. With more than 11’000 employees worldwide, and
annual revenues of more than 5 billion, the company produces more than 100 machines a year. Depending on the cyclical industrial dynamics, the sales can overcome 200 units. The final product, considered as unit of this research analysis, has a market price around €70 million. Of it, just few
components are produced internally, while most of them are supplied by business partners worldwide. In this way the organization is able to focus its effort entirely in the customization of the product for the clients. As imaginable, a strong partnerships with suppliers play a key role in this
business model, and strong logistic capabilities are necessary to make the business run smoothly.
The first step for getting an insight into the organization was the analysis of their annual report, and especially of the section about sustainability, that was written in line with the GRI
recommendations. Although this first insight gave a picture of the performances of the company in terms of impact on the environment, talks and exchanges of e-‐mails with several employees gave further clues about perception of sustainability within the company. It emerged that the preservation
of the environment is not certainly the leading business driver, but rather a constraint, due to regulations, which raise environmental concerns in an indirect manner.
The data collection aimed at environmental sustainability programs, is done quarterly, and it
does not have direct repercussions on the employees, but it is communicated to the sustainability directors from the managers in the various departments, like facility managers and waste managers. The idea that emerged is that sustainability is considered as an important aspect just by the top
management, but an organizational culture aware of it has not been established.
After getting to know which processes could have been analysed, the choice was made proactively and proposed to the client. Thus clear boundaries for the investigation were set, and the
stakeholders of the project informed about the details and the project plan. Information about logistic activities were disclosed, while the possibility of obtaining detailed data about operations was not given. Just aggregated data about macro-‐phases of the process was disclosed. The granularity of the
data provided thus represented a constrain for this project.
The process chosen includes part of the machinery assembly tasks, the delivery to the final customer, and the return of the empty containers after the machine has been installed at the client
site. The installation itself is our of scope, due to the impossibility of obtaining data. While the
1 Due to confidentiality policies and to establish access, the case company was assured confidentiality and
anonymity. For this reason the company is not named and data presented in this thesis is fictitious.
39
activities analysed are: assembly, final assembly, testing, packing, delivering, and returning the empty
containers. The process occurs yearly between 100 and 200 times, depending on the demand.
5.1 Case organization After finding the client, first any process and company related material publicly available was
investigated, in order to get background information. Initial exploratory interviews were conducted especially with Accenture consultants working at the client site, in order to get insight into the
company activities. With this information, the process boundaries were defined, and the data collection process started.
The macro-‐process analysed can be generally divided in two parts: the set of operations conducted
within the company plant, and the logistic operations. More visibility was offered for the logistic section, while for the internal operations, the company’s no-‐disclosing information policies made the
investigation not easy.
Within this project, a collaboration was established with an Accenture group operating at the client site, working on a business case concerning the possibility of delivering new machines by sea. Some
calculations, valuable for this project were thus shared with the group in exchange of help in obtaining information. For this reason, in the process maps, this scenario is considered besides the as-‐is situation in which machineries are delivered exclusively by air.
The method proposed in the 3rd chapter of this research work was applied to the chosen process, in order to verify its usefulness in a real case scenario. The analysis, besides investigating solely the environmental impact of the activities, gathered also information about time and cost, in order to
obtain a broader picture of the business, considering as many dimensions as possible of the Devil’s pentagon (collection of all the dimensions covered by Green BPM: cost, time, quality, flexibility, and sustainability).
After the data collection, the backend work was conducted, including: analysing data, mapping the process in a BPME and reproducing a fragment using a BPMS. Data validation was later done through further interviews.
5.2 Conduct, data collection, analysis In this section, the application of the guidelines previously proposed to the real scenario is
illustrated. Modifications were applied during the business case. With the aim of offering an easy read, the drawbacks are avoided and just the final version is presented. The further paragraphs correspond
with the methodology steps that were followed.
5.2.1 Collect process general information First, information publicly available was collected online in order to get some background
knowledge about the process under analysis. The latest sustainability report of the company was analysed in order to get insight into the company’s environmental assessment, its plans for the future, and vision. Later, exploratory interviews were conducted with several members of the team of
consultants working at the client site, to get a deeper understanding into the company and its
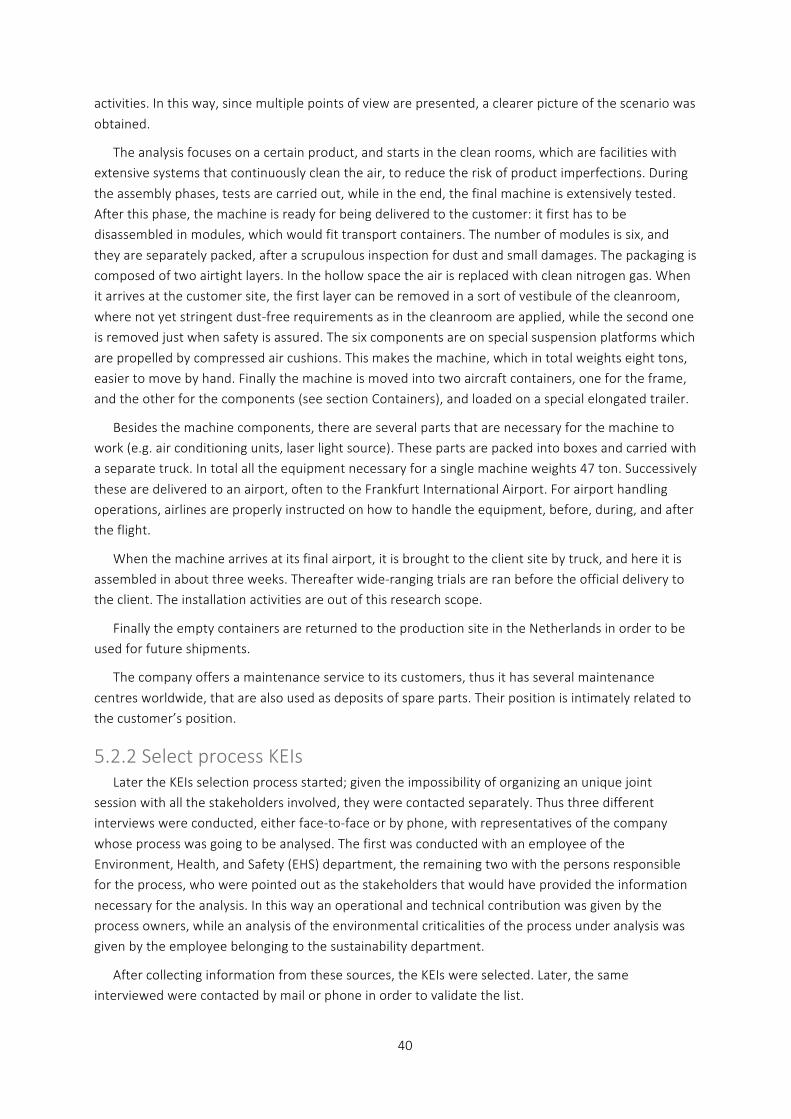
40
activities. In this way, since multiple points of view are presented, a clearer picture of the scenario was
obtained.
The analysis focuses on a certain product, and starts in the clean rooms, which are facilities with extensive systems that continuously clean the air, to reduce the risk of product imperfections. During
the assembly phases, tests are carried out, while in the end, the final machine is extensively tested. After this phase, the machine is ready for being delivered to the customer: it first has to be disassembled in modules, which would fit transport containers. The number of modules is six, and
they are separately packed, after a scrupulous inspection for dust and small damages. The packaging is composed of two airtight layers. In the hollow space the air is replaced with clean nitrogen gas. When it arrives at the customer site, the first layer can be removed in a sort of vestibule of the cleanroom,
where not yet stringent dust-‐free requirements as in the cleanroom are applied, while the second one is removed just when safety is assured. The six components are on special suspension platforms which
are propelled by compressed air cushions. This makes the machine, which in total weights eight tons, easier to move by hand. Finally the machine is moved into two aircraft containers, one for the frame, and the other for the components (see section Containers), and loaded on a special elongated trailer.
Besides the machine components, there are several parts that are necessary for the machine to work (e.g. air conditioning units, laser light source). These parts are packed into boxes and carried with a separate truck. In total all the equipment necessary for a single machine weights 47 ton. Successively
these are delivered to an airport, often to the Frankfurt International Airport. For airport handling operations, airlines are properly instructed on how to handle the equipment, before, during, and after the flight.
When the machine arrives at its final airport, it is brought to the client site by truck, and here it is assembled in about three weeks. Thereafter wide-‐ranging trials are ran before the official delivery to the client. The installation activities are out of this research scope.
Finally the empty containers are returned to the production site in the Netherlands in order to be used for future shipments.
The company offers a maintenance service to its customers, thus it has several maintenance
centres worldwide, that are also used as deposits of spare parts. Their position is intimately related to the customer’s position.
5.2.2 Select process KEIs Later the KEIs selection process started; given the impossibility of organizing an unique joint
session with all the stakeholders involved, they were contacted separately. Thus three different interviews were conducted, either face-‐to-‐face or by phone, with representatives of the company
whose process was going to be analysed. The first was conducted with an employee of the Environment, Health, and Safety (EHS) department, the remaining two with the persons responsible for the process, who were pointed out as the stakeholders that would have provided the information
necessary for the analysis. In this way an operational and technical contribution was given by the process owners, while an analysis of the environmental criticalities of the process under analysis was given by the employee belonging to the sustainability department.
After collecting information from these sources, the KEIs were selected. Later, the same interviewed were contacted by mail or phone in order to validate the list.
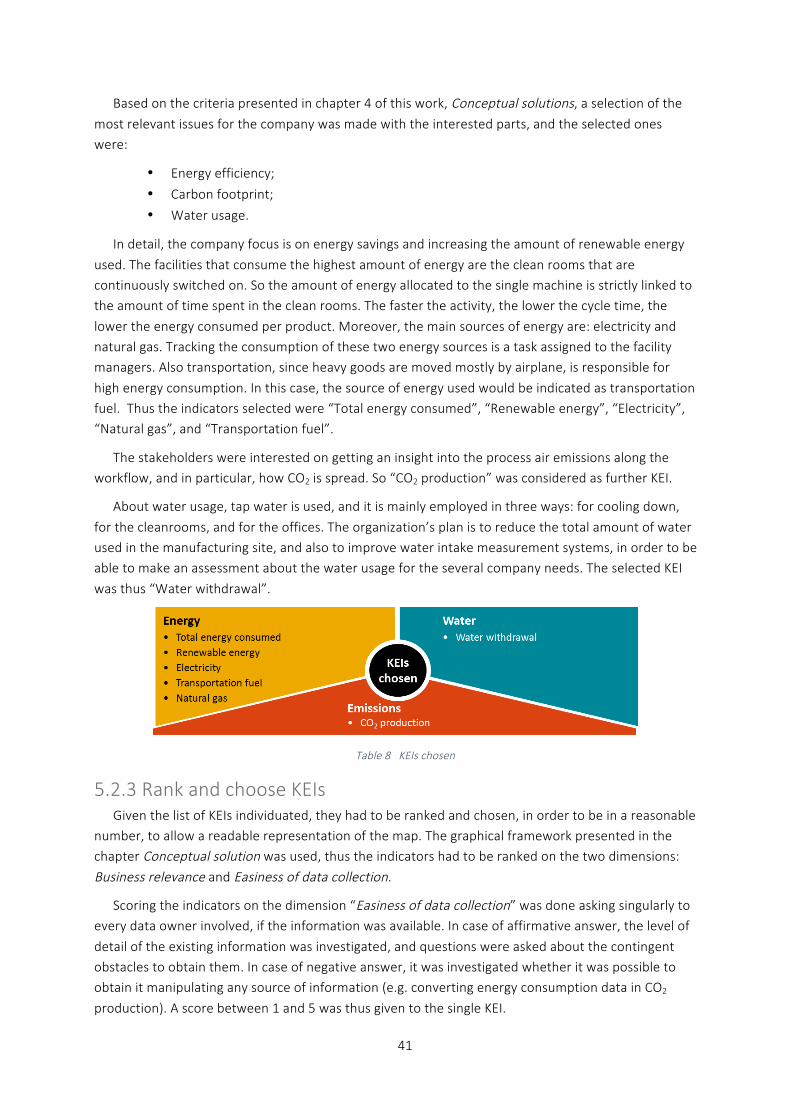
41
Based on the criteria presented in chapter 4 of this work, Conceptual solutions, a selection of the most relevant issues for the company was made with the interested parts, and the selected ones were:
• Energy efficiency;
• Carbon footprint;
• Water usage.
In detail, the company focus is on energy savings and increasing the amount of renewable energy
used. The facilities that consume the highest amount of energy are the clean rooms that are continuously switched on. So the amount of energy allocated to the single machine is strictly linked to the amount of time spent in the clean rooms. The faster the activity, the lower the cycle time, the
lower the energy consumed per product. Moreover, the main sources of energy are: electricity and natural gas. Tracking the consumption of these two energy sources is a task assigned to the facility managers. Also transportation, since heavy goods are moved mostly by airplane, is responsible for
high energy consumption. In this case, the source of energy used would be indicated as transportation fuel. Thus the indicators selected were “Total energy consumed”, “Renewable energy”, “Electricity”, “Natural gas”, and “Transportation fuel”.
The stakeholders were interested on getting an insight into the process air emissions along the workflow, and in particular, how CO2 is spread. So “CO2 production” was considered as further KEI.
About water usage, tap water is used, and it is mainly employed in three ways: for cooling down,
for the cleanrooms, and for the offices. The organization’s plan is to reduce the total amount of water used in the manufacturing site, and also to improve water intake measurement systems, in order to be able to make an assessment about the water usage for the several company needs. The selected KEI
was thus “Water withdrawal”.
Table 8 KEIs chosen
5.2.3 Rank and choose KEIs Given the list of KEIs individuated, they had to be ranked and chosen, in order to be in a reasonable
number, to allow a readable representation of the map. The graphical framework presented in the chapter Conceptual solution was used, thus the indicators had to be ranked on the two dimensions:
Business relevance and Easiness of data collection.
Scoring the indicators on the dimension “Easiness of data collection” was done asking singularly to every data owner involved, if the information was available. In case of affirmative answer, the level of
detail of the existing information was investigated, and questions were asked about the contingent obstacles to obtain them. In case of negative answer, it was investigated whether it was possible to obtain it manipulating any source of information (e.g. converting energy consumption data in CO2
production). A score between 1 and 5 was thus given to the single KEI.
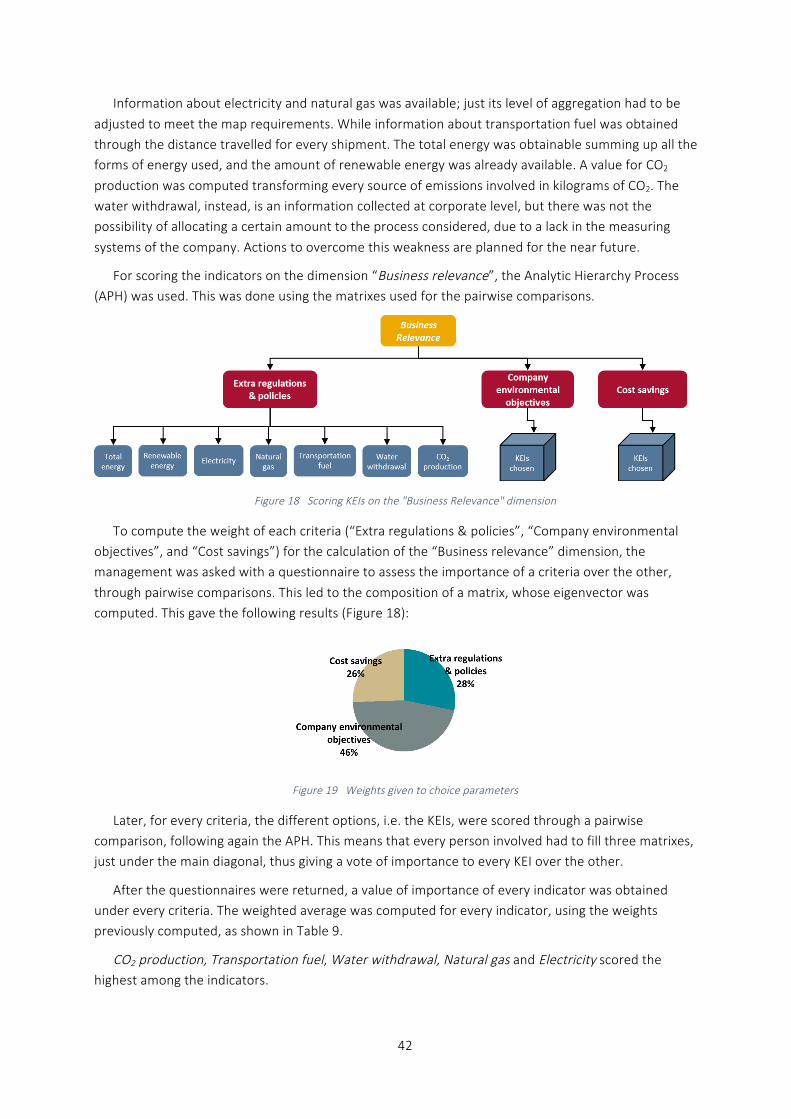
42
Information about electricity and natural gas was available; just its level of aggregation had to be
adjusted to meet the map requirements. While information about transportation fuel was obtained through the distance travelled for every shipment. The total energy was obtainable summing up all the forms of energy used, and the amount of renewable energy was already available. A value for CO2
production was computed transforming every source of emissions involved in kilograms of CO2. The water withdrawal, instead, is an information collected at corporate level, but there was not the possibility of allocating a certain amount to the process considered, due to a lack in the measuring
systems of the company. Actions to overcome this weakness are planned for the near future.
For scoring the indicators on the dimension “Business relevance”, the Analytic Hierarchy Process (APH) was used. This was done using the matrixes used for the pairwise comparisons.
Figure 18 Scoring KEIs on the "Business Relevance" dimension
To compute the weight of each criteria (“Extra regulations & policies”, “Company environmental objectives”, and “Cost savings”) for the calculation of the “Business relevance” dimension, the management was asked with a questionnaire to assess the importance of a criteria over the other,
through pairwise comparisons. This led to the composition of a matrix, whose eigenvector was computed. This gave the following results (Figure 18):
Figure 19 Weights given to choice parameters
Later, for every criteria, the different options, i.e. the KEIs, were scored through a pairwise comparison, following again the APH. This means that every person involved had to fill three matrixes, just under the main diagonal, thus giving a vote of importance to every KEI over the other.
After the questionnaires were returned, a value of importance of every indicator was obtained under every criteria. The weighted average was computed for every indicator, using the weights previously computed, as shown in Table 9.
CO2 production, Transportation fuel, Water withdrawal, Natural gas and Electricity scored the highest among the indicators.
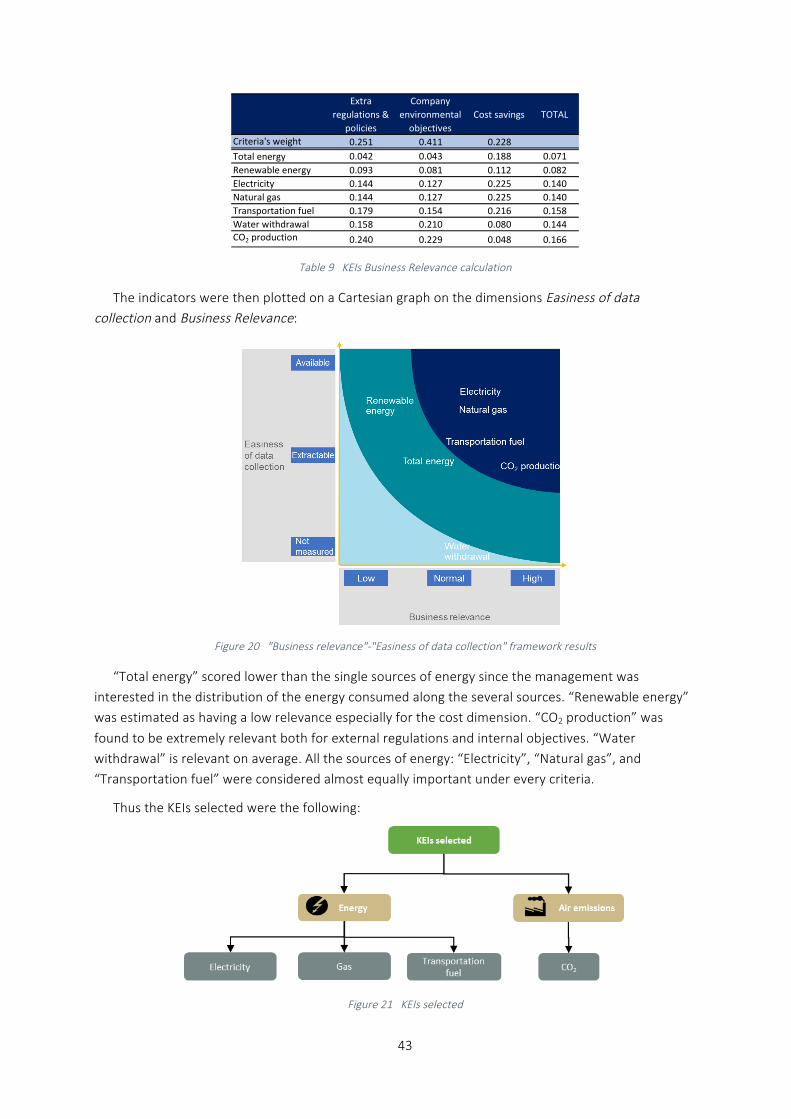
43
Table 9 KEIs Business Relevance calculation
The indicators were then plotted on a Cartesian graph on the dimensions Easiness of data collection and Business Relevance:
Figure 20 "Business relevance"-‐"Easiness of data collection" framework results
“Total energy” scored lower than the single sources of energy since the management was interested in the distribution of the energy consumed along the several sources. “Renewable energy” was estimated as having a low relevance especially for the cost dimension. “CO2 production” was
found to be extremely relevant both for external regulations and internal objectives. “Water withdrawal” is relevant on average. All the sources of energy: “Electricity”, “Natural gas”, and “Transportation fuel” were considered almost equally important under every criteria.
Thus the KEIs selected were the following:
Figure 21 KEIs selected
Extra regulations &
policies
Company environmental objectives
Cost savings TOTAL
Criteria's weight 0.251 0.411 0.228Total energy 0.042 0.043 0.188 0.071Renewable energy 0.093 0.081 0.112 0.082Electricity 0.144 0.127 0.225 0.140Natural gas 0.144 0.127 0.225 0.140Transportation fuel 0.179 0.154 0.216 0.158Water withdrawal 0.158 0.210 0.080 0.144CO2 production 0.240 0.229 0.048 0.166
44
5.2.4 Collect process environmental data Since a process map of the process considered did not exist, information were gathered from maps
with different levels of detail, and especially interviews with different stakeholders. While, in obtaining
quantitative data, historical transactions were analysed, in order to get reliable data for the process mapping.
Different data collection techniques were used in combination, to analyse primary and secondary
data. A bottom-‐up approach was used for the logistic activities and a top-‐down approach for the operations.
The collection of environmental data, for the process considered can be divided in two categories:
operations and logistics.
5.2.4.1 Operations The model of machinery that is being analysed is known to be decomposed in six modules before
being shipped. The total machine’s weight is 47 tonnes.
The data collected is related to the plant single clean rooms, where the machine modules are assembled and tested. Information about the electricity consumption, for running the machines, and
gas consumption, for air conditioning, was received from a Facility manager. While electricity is used for enlighten and powering the machines, the latter is used for temperature control and stabilization of humidity, since the product handled is extremely temperature sensible.
Given the information about the rooms, that are functioning 24/7 due to the eventual setup costs that a turning off would imply, plus the risk associated to that, and the information about the time a machinery spends in every room, four macro phases were individuated. Each phase may imply the use
of different rooms. Thus a top-‐down approach was used for calculating the time needed for running every machine in each clean room, using time as a driver, both for electricity and gas consumption.
5.2.4.2 Logistics The delivery of the machines to the final customer is considered. The shipment is currently carried
out by truck and plane. In the process model suggested, the possibility of delivering the final product by sea is considered too, since this opportunity is under the current analysis of an Accenture team.
Thus all the deliveries from the company production site to the clients site have been analysed for the two scenarios: shipment by boat, and shipment by plane. For modelling purposes, the position of the closest maintenance centre was used instead of the position of the actual client.
For every mean of transport analysed, the distance based methodology is used. Thus the distance travelled is multiplied for a conversion factor expressed in CO2 per tonne-‐km and the weight of the goods transported.
Besides the transportation itself, the emissions produced in handling operations is considered:
when loading/unloading or when shifting from one transport mode to another is required. For all the information on the conversion factor used, all the details about the calculation made to model the transportation process, refer to Appendix 7.4.
5.2.4.2.1 Air scenario
The current scenario is the delivery of the machineries by plane. Strategically, all the maintenance plants are located close to an airport. So all the closest airports were found online, then latitude and
45
longitude were retrieved using a VBA, accessing a Google API. If the destination is not located either in
the Netherlands or in Belgium, the delivery happens by air, otherwise directly by truck.
It has been assumed that the delivery happens with a direct flight if it is within the continent. While if it is outside Europe, the containers are shipped by truck to Frankfurt Airport, the closest
intercontinental hub, then delivered to the closest intercontinental airport to the actual destination. Finally, they are delivered by plane to the closest airport, and delivered by truck for the last part of the journey. A list of the airports considered can be found in Appendix 7.4.1.
Different planes are assumed to be used for intercontinental and continental routes. Boeing 747F for continental routes, and Boeing 777F for intercontinental ones. This choice influences the cruise speed, equal respectively to 851 and 905 km/h.
For transporting high value, complex, and exclusive products, a dedicated solution has been designed for transportation by plane. Customized Unit Load Devices (ULDs), answering the needs of
high-‐tech lithographic industry, are produced by a Dutch manufacturing company specialized in dedicated solutions for air cargo. These special containers answer the requirements of all the world’s airlines and aircrafts. The models used are severely insulated, refrigerated, and with internal tie down
interfaces for ensuring a safe transport. Although the brand and model of containers used were known, it was not possible obtaining information about the energy consumption for air conditioning, due to information confidentiality of the company providing the containers. The containers used have
roughly the same volume of intermodal twenty-‐feet transportation containers. For this reason the value of 2.7kw per TUE presented by Wild (2008) is used.
5.2.4.2.2 Sea scenario
For computing the emissions related to the sea scenario, since it is not currently operated, assumptions were made on how this would be organized. Thus, all the information presented in this paragraph are based on suppositions.
The machinery is transported to the closest port to the production site, the Port of Rotterdam. This is true for all the deliveries, except those whose destination is the north of Europe (Netherlands, Germany, Belgium, and France), for which it would not make sense to use the sea as means of
transport. A list of ports was defined, based on the closeness to the maintenance plants, using Google Maps (see Appendix 7.4.2). Based on the geodesic distances between all the plants and all the ports listed, the closest port was associated to every plant. Several plants have the same port as destination
of the journey by cargo boat. Later travel times and distances were estimated using the website SeaRates (http://www.searates.com/reference/portdistance). While, using a VBA that accesses a Google API, the geolocation of starting and destination points were retrieved, and, the land journey
details (distance and time) between the ports and the plants were calculated using the same method, accessing a Google API.
Inland emissions were calculated using the conversion factors for freight provided by the GHG
Protocol, assuming the use of articulated Heavy Goods Vehicles (HGV). While sea emissions were calculated assuming that the containers are refrigerated and summing the emissions produced during port operations. For computing the energy consumed for cooling down the containers, the
transportation time was used. The boats are assumed to be Large Container Vessels.
The machine volume is used to compute the number of intermodal transportation containers (TUE, twenty-‐foot equivalent unit) needed for shipping a machinery. The number of intermodal
46
transportation TEU needed for shipping the machines is supposed to be equal to 8, since its internal
capacity is 31.47m3, for a total of 251.73 m3 that can contain the machinery.
For the empty containers return trip, the containers are assumed to be empty. The number of Twenty-‐foot Equivalent Units (TEU) necessary for the transportation were calculated considering the
amount of space needed equal to the capacity of the containers currently used. Since articulated HGV are assumed to be used, two TEU are considered to be carried with every truck.
In computing the total journey time, no waiting time in ports is considered since reference values
were not available in the scientific literature.
5.2.4.2.3 Air conditioning during transportation The temperature of the container, for sensible equipment, has to be maintained within safety
boundaries. For this reason the container has to be isolated and refrigerated: the containers currently used for air transportation are refrigerated and the containers for sea transportation are assumed to
be refrigerated too. For the calculation, the hourly consumption of electricity of the containers was multiplied for the time spend during the whole journey.
5.2.4.2.4 Handling activities
The handling activities for loading a truck leaving the production plant, unloading a track at the delivery point, and to move the containers between every transportation mean are considered. Solely port activities are not, due to unavailability of information in the literature.
For loading and unloading the truck at the production site and for the delivery to the customer, a forkl i ft is assumed to be used. While for port activities, which produce between 2-‐6% of the total emissions during the journey by sea, all the activities within the port boundaries are considered,
including approaching the ports and manoeuvrings. For further details on the calculation, please refer to Section 4.2.4.2.3.
5.2.5 Map the process in a BPME In order to transfer the knowledge gained through this research to the practice, and especially to
the case study under analysis, a Business Process Modelling Environment (BPMS) was configured. The software ARIS Architect & Designer 9.7, offered by Software AG, is used for modelling purposes, and
gives the possibility of adding new attributes, and designing the corresponding icons that would appear in the workflow. It supports different notations and, among the others, it offers the possibility of modelling processes using BPMN 2.0. According to a research conducted by Opitz et al. (2012),
which investigated 70 vendors in the marketplace, it is the most suitable software for monitoring energy efficiency key performance indicators.
The software was first customized in order to include all the environmental attributes proposed b
this research and the corresponding symbols. Further details about ARIS, the reasons behind its choice, and the customization applied, see Appendix 7.1.
In the maps, a gateway splits the shipments in three different activities, depending on the
destination chosen. Since the machineries are delivered worldwide, the emissions due to every shipment may vary considerably depending on the destination (green, yellow, and red area). For the separation, the shipment time was chosen as driver. This is because the decision between shipping a
machinery by air or sea would strongly depend on the time available before the promised delivery date. The separation in areas is shown in the Figure 23.
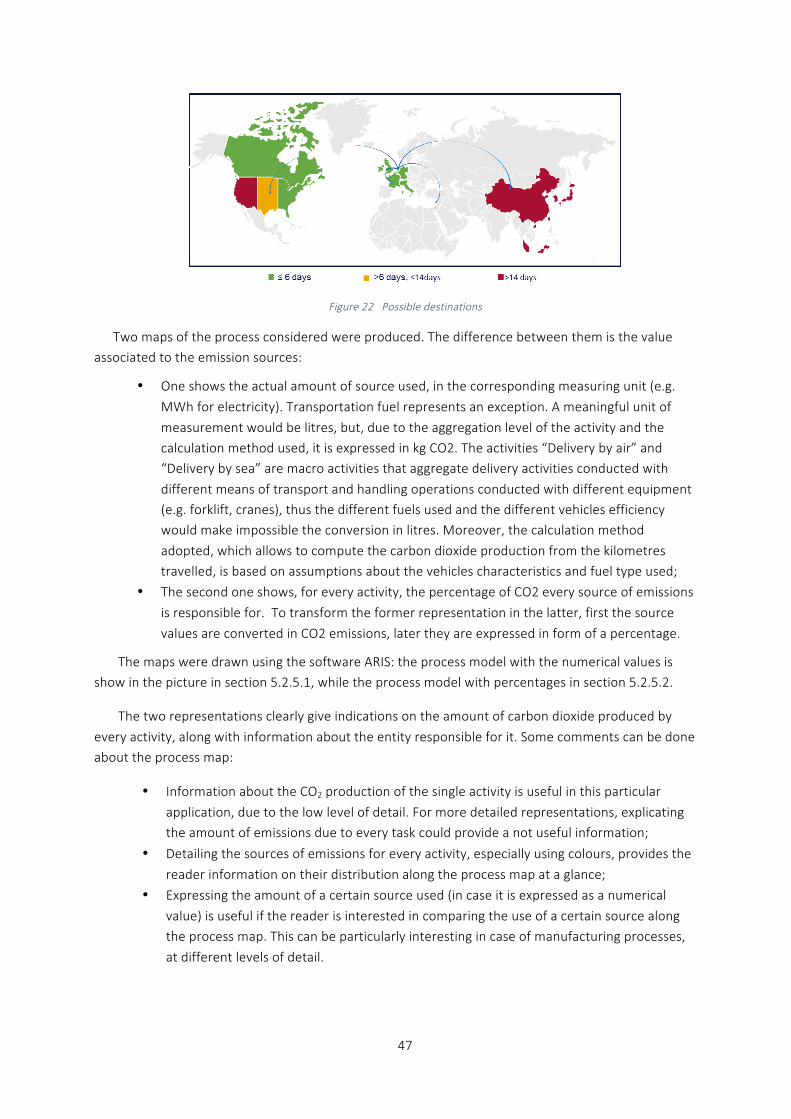
47
Figure 22 Possible destinations
Two maps of the process considered were produced. The difference between them is the value associated to the emission sources:
• One shows the actual amount of source used, in the corresponding measuring unit (e.g.
MWh for electricity). Transportation fuel represents an exception. A meaningful unit of
measurement would be litres, but, due to the aggregation level of the activity and the calculation method used, it is expressed in kg CO2. The activities “Delivery by air” and “Delivery by sea” are macro activities that aggregate delivery activities conducted with
different means of transport and handling operations conducted with different equipment (e.g. forklift, cranes), thus the different fuels used and the different vehicles efficiency would make impossible the conversion in litres. Moreover, the calculation method
adopted, which allows to compute the carbon dioxide production from the kilometres travelled, is based on assumptions about the vehicles characteristics and fuel type used;
• The second one shows, for every activity, the percentage of CO2 every source of emissions
is responsible for. To transform the former representation in the latter, first the source
values are converted in CO2 emissions, later they are expressed in form of a percentage.
The maps were drawn using the software ARIS: the process model with the numerical values is show in the picture in section 5.2.5.1, while the process model with percentages in section 5.2.5.2.
The two representations clearly give indications on the amount of carbon dioxide produced by
every activity, along with information about the entity responsible for it. Some comments can be done about the process map:
• Information about the CO2 production of the single activity is useful in this particular
application, due to the low level of detail. For more detailed representations, explicating the amount of emissions due to every task could provide a not useful information;
• Detailing the sources of emissions for every activity, especially using colours, provides the
reader information on their distribution along the process map at a glance;
• Expressing the amount of a certain source used (in case it is expressed as a numerical
value) is useful if the reader is interested in comparing the use of a certain source along the process map. This can be particularly interesting in case of manufacturing processes,
at different levels of detail.
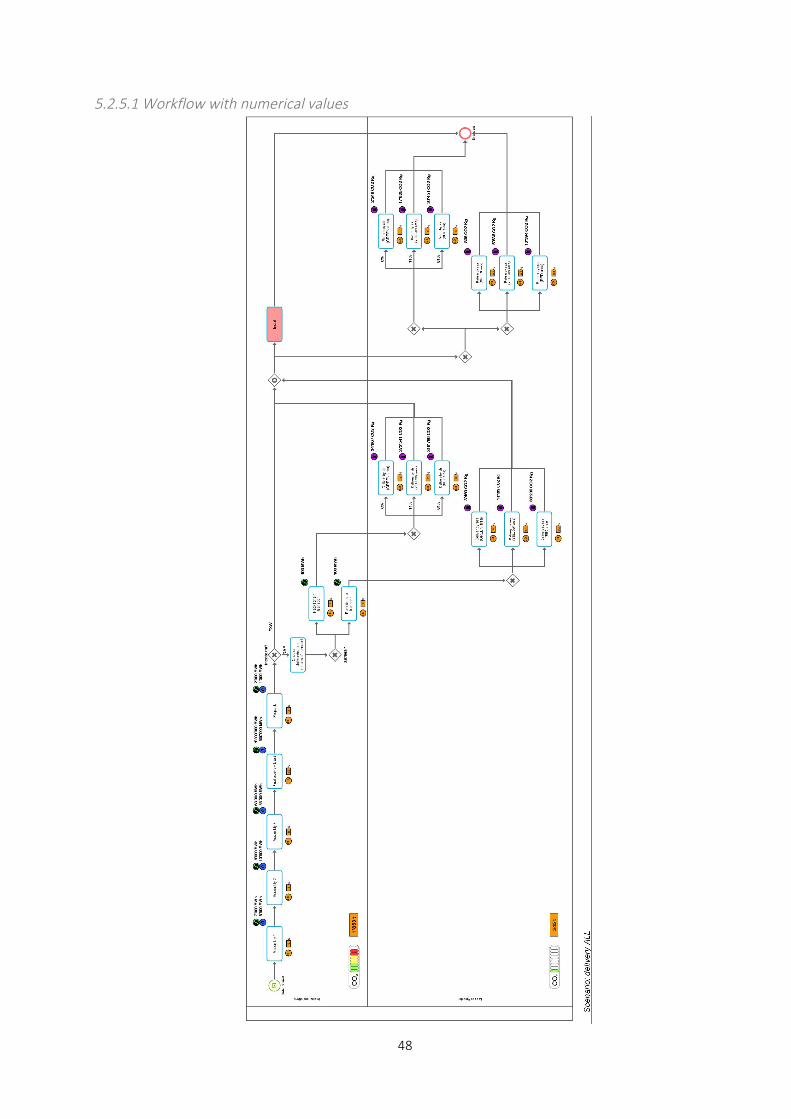
48
5.2.5.1 Workflow with numerical values
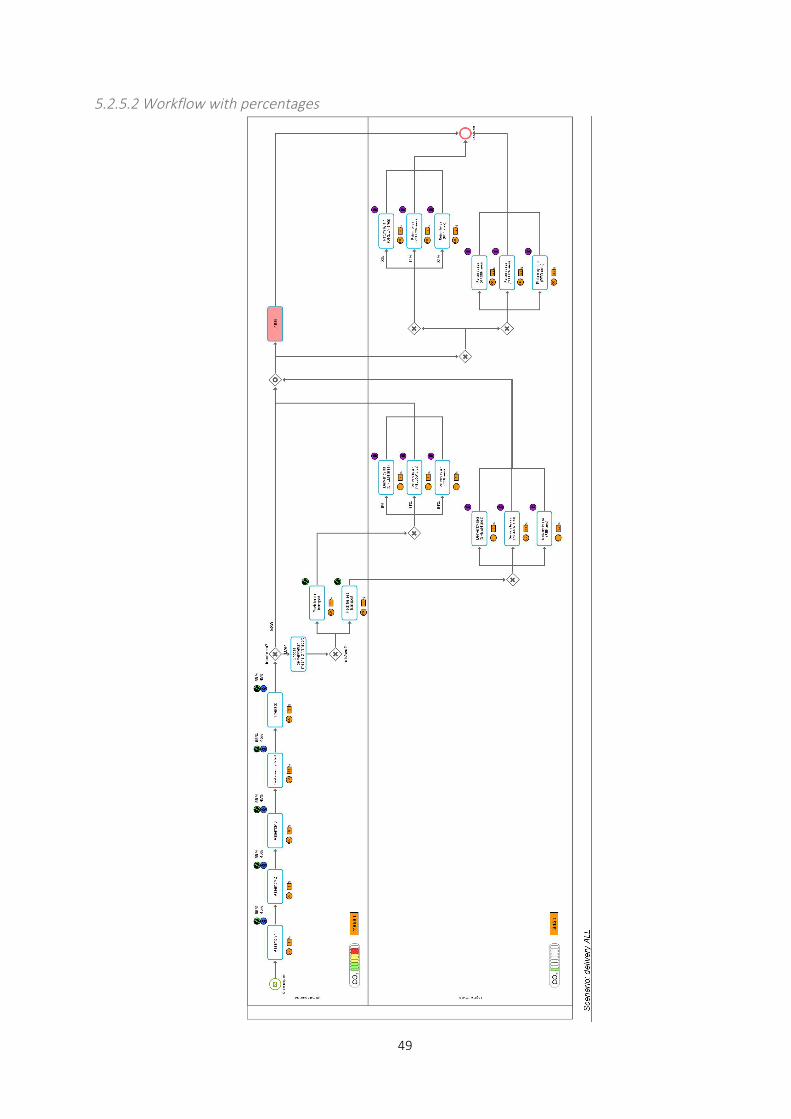
49
5.2.5.2 Workflow with percentages
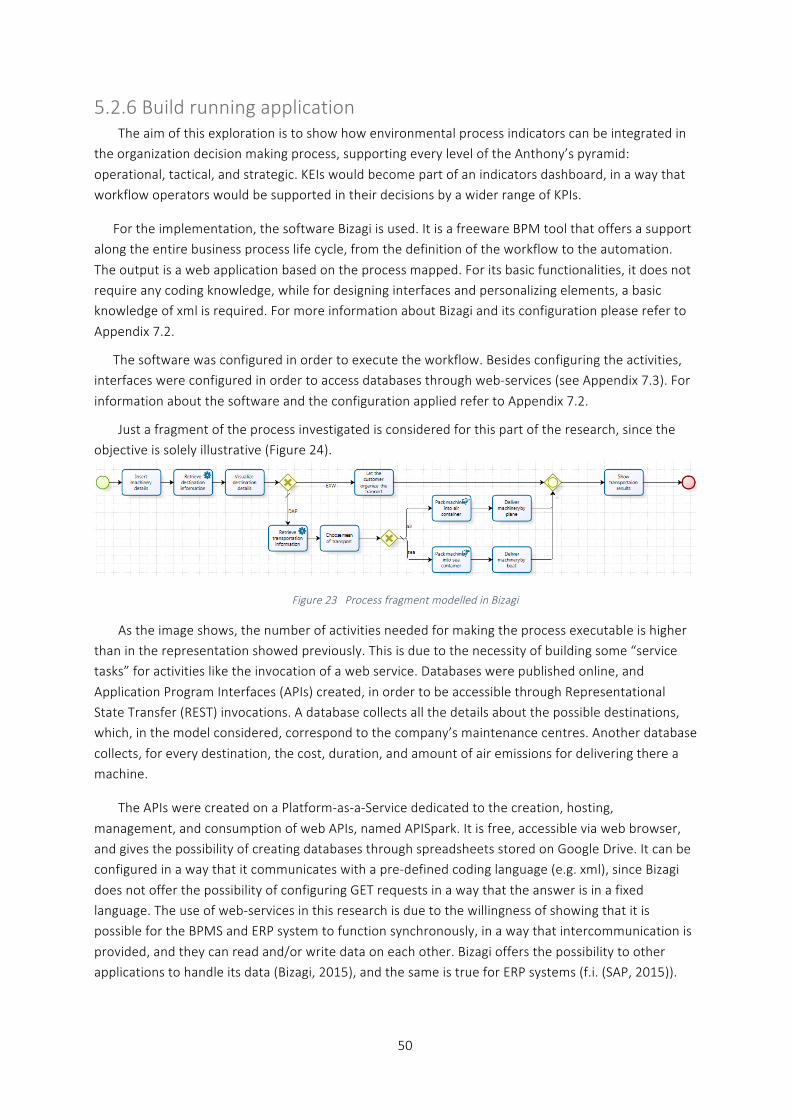
50
5.2.6 Build running application The aim of this exploration is to show how environmental process indicators can be integrated in
the organization decision making process, supporting every level of the Anthony’s pyramid:
operational, tactical, and strategic. KEIs would become part of an indicators dashboard, in a way that workflow operators would be supported in their decisions by a wider range of KPIs.
For the implementation, the software Bizagi is used. It is a freeware BPM tool that offers a support along the entire business process life cycle, from the definition of the workflow to the automation.
The output is a web application based on the process mapped. For its basic functionalities, it does not require any coding knowledge, while for designing interfaces and personalizing elements, a basic knowledge of xml is required. For more information about Bizagi and its configuration please refer to
Appendix 7.2.
The software was configured in order to execute the workflow. Besides configuring the activities, interfaces were configured in order to access databases through web-‐services (see Appendix 7.3). For
information about the software and the configuration applied refer to Appendix 7.2.
Just a fragment of the process investigated is considered for this part of the research, since the objective is solely illustrative (Figure 24).
Figure 23 Process fragment modelled in Bizagi
As the image shows, the number of activities needed for making the process executable is higher than in the representation showed previously. This is due to the necessity of building some “service tasks” for activities like the invocation of a web service. Databases were published online, and
Application Program Interfaces (APIs) created, in order to be accessible through Representational State Transfer (REST) invocations. A database collects all the details about the possible destinations, which, in the model considered, correspond to the company’s maintenance centres. Another database
collects, for every destination, the cost, duration, and amount of air emissions for delivering there a machine.
The APIs were created on a Platform-‐as-‐a-‐Service dedicated to the creation, hosting,
management, and consumption of web APIs, named APISpark. It is free, accessible via web browser, and gives the possibility of creating databases through spreadsheets stored on Google Drive. It can be configured in a way that it communicates with a pre-‐defined coding language (e.g. xml), since Bizagi
does not offer the possibility of configuring GET requests in a way that the answer is in a fixed language. The use of web-‐services in this research is due to the willingness of showing that it is possible for the BPMS and ERP system to function synchronously, in a way that intercommunication is
provided, and they can read and/or write data on each other. Bizagi offers the possibility to other applications to handle its data (Bizagi, 2015), and the same is true for ERP systems (f.i. (SAP, 2015)).
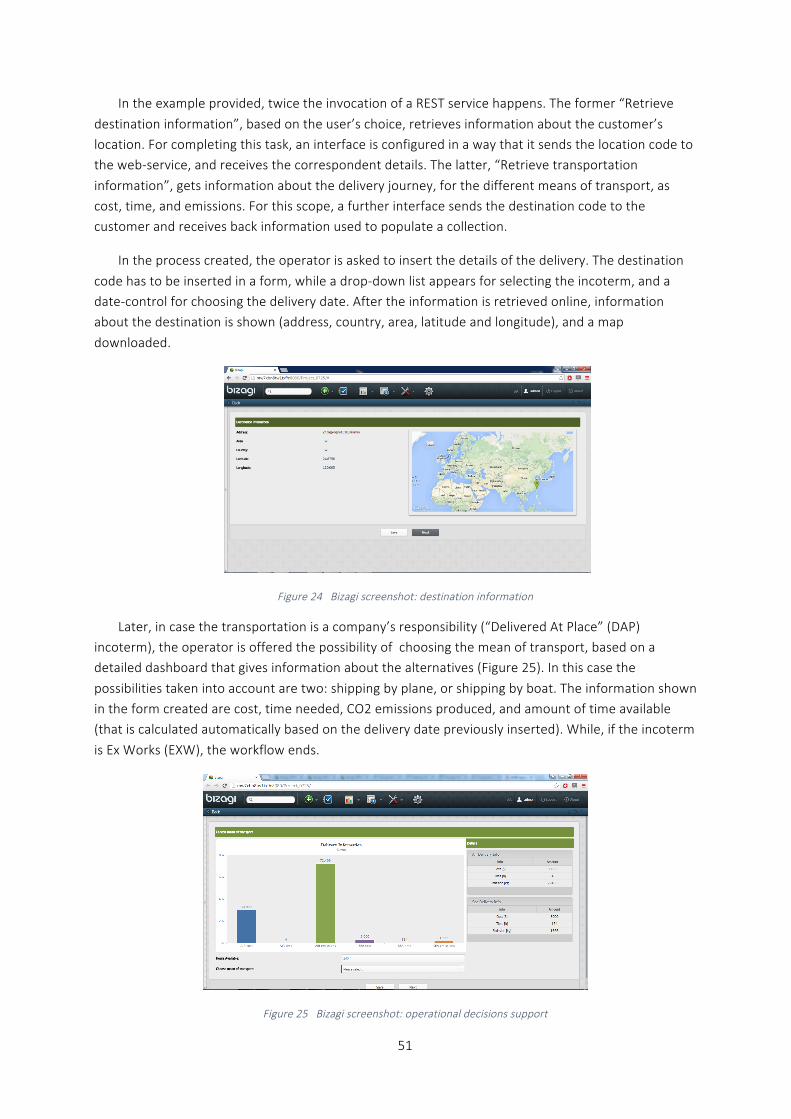
51
In the example provided, twice the invocation of a REST service happens. The former “Retrieve
destination information”, based on the user’s choice, retrieves information about the customer’s location. For completing this task, an interface is configured in a way that it sends the location code to the web-‐service, and receives the correspondent details. The latter, “Retrieve transportation
information”, gets information about the delivery journey, for the different means of transport, as cost, time, and emissions. For this scope, a further interface sends the destination code to the customer and receives back information used to populate a collection.
In the process created, the operator is asked to insert the details of the delivery. The destination
code has to be inserted in a form, while a drop-‐down list appears for selecting the incoterm, and a date-‐control for choosing the delivery date. After the information is retrieved online, information about the destination is shown (address, country, area, latitude and longitude), and a map
downloaded.
Figure 24 Bizagi screenshot: destination information
Later, in case the transportation is a company’s responsibility (“Delivered At Place” (DAP) incoterm), the operator is offered the possibility of choosing the mean of transport, based on a detailed dashboard that gives information about the alternatives (Figure 25). In this case the
possibilities taken into account are two: shipping by plane, or shipping by boat. The information shown in the form created are cost, time needed, CO2 emissions produced, and amount of time available (that is calculated automatically based on the delivery date previously inserted). While, if the incoterm
is Ex Works (EXW), the workflow ends.
Figure 25 Bizagi screenshot: operational decisions support
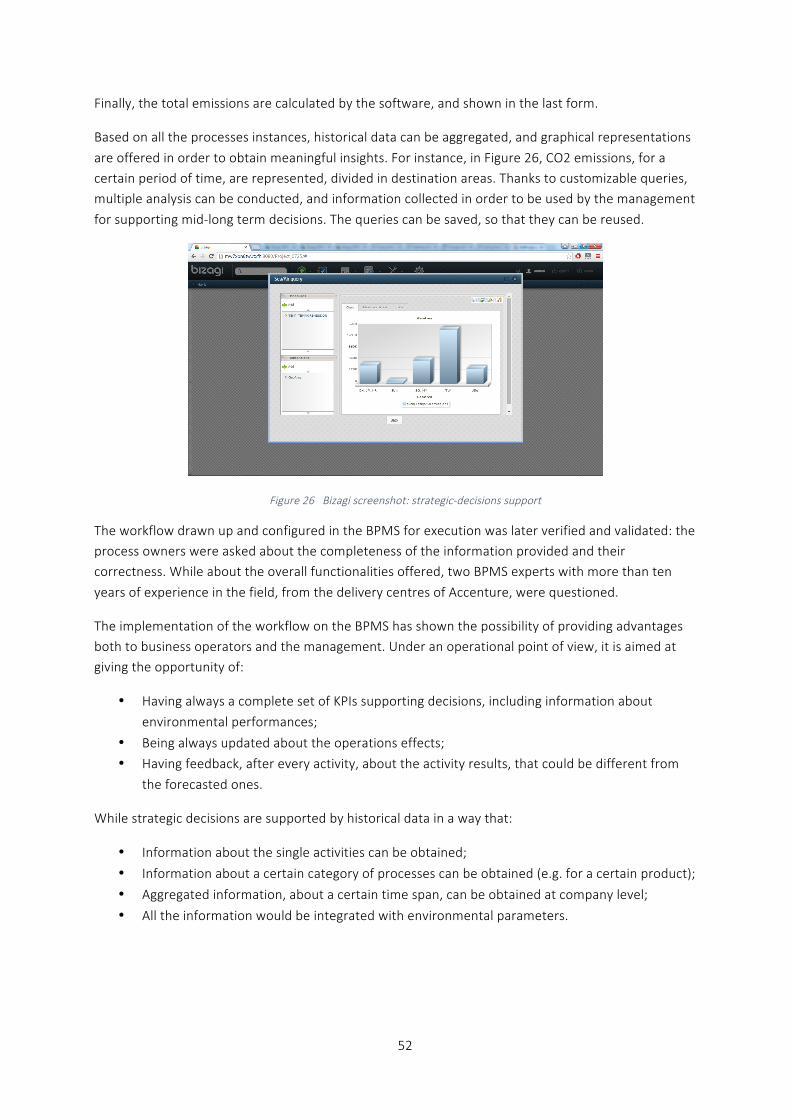
52
Finally, the total emissions are calculated by the software, and shown in the last form.
Based on all the processes instances, historical data can be aggregated, and graphical representations
are offered in order to obtain meaningful insights. For instance, in Figure 26, CO2 emissions, for a certain period of time, are represented, divided in destination areas. Thanks to customizable queries, multiple analysis can be conducted, and information collected in order to be used by the management
for supporting mid-‐long term decisions. The queries can be saved, so that they can be reused.
Figure 26 Bizagi screenshot: strategic-‐decisions support
The workflow drawn up and configured in the BPMS for execution was later verified and validated: the process owners were asked about the completeness of the information provided and their correctness. While about the overall functionalities offered, two BPMS experts with more than ten
years of experience in the field, from the delivery centres of Accenture, were questioned.
The implementation of the workflow on the BPMS has shown the possibility of providing advantages both to business operators and the management. Under an operational point of view, it is aimed at giving the opportunity of:
• Having always a complete set of KPIs supporting decisions, including information about
environmental performances;
• Being always updated about the operations effects;
• Having feedback, after every activity, about the activity results, that could be different from
the forecasted ones.
While strategic decisions are supported by historical data in a way that:
• Information about the single activities can be obtained;
• Information about a certain category of processes can be obtained (e.g. for a certain product);
• Aggregated information, about a certain time span, can be obtained at company level;
• All the information would be integrated with environmental parameters.
53
5.3 Results and discussion
5.3.1 Methodology The consecution of the steps guides the process fluently, without the necessity of repeating any
step. The first step involving the collection of background knowledge about the company operations and main environmental issues, has proved to be effective in providing the analysis the instruments
necessary for guiding the management in choosing the relevant KEIs.
In ranking the environmental indicators, giving high importance to the easiness of data collection, has proved to be effective in the execution of the case study, and the usefulness of including such
criteria in the selection has been confirmed from similar experiences by different experts. Depending on the time available for the assessment, the choice of including indicators for which no measurement exists at the time of the decision, is strongly influenced by this dimension. A short implementation
period would lead to the choice of the indicators on the top-‐right corner of the Benefit-‐Easiness graph, maybe including other indicators on the top graph side. While for longer and more detailed analysis, the possibility of including indicators on the middle-‐right part and bottom-‐right corner of the graphs
can be considered too.
Selecting few indicators to be used in the process map proved to improve the model readability. Including more symbols in the workflow has been tested, but has clearly shown to confuse the
observer, that was disoriented by the different colours.
Finally, mapping the process in the Business Process Modelling Environment (BPME), was done. The introduction of the graphical attributes in the tool has proved to facilitate the representation of
the map. If the customization is carried out once, it gives the possibility of using the same symbols if the mapping process is reiterated or if several workflows have to be represented. The frameworks for computing the activity cumulative scores were of further help in the execution.
5.3.2 Process map Significant effort was put in creating a self-‐explanatory notation. The symbols used within circles
were taken from The Noun Project (2015), a library of free sharable icons symbolizing objects and
concepts, whose aim is to facilitate and simplify communication worldwide. Moreover, the use of different colours for every symbol is aimed at providing a good graphical insight. Hence, it is believed that presenting environmental footprint indicators in this way will help users to better understand the
information contained in the map at a glance.
Expressing the amount of single emission source, for each activity, as a percentage or as a numeric value has shown to bring different information, and to be beneficial depending on the objective
pursued. In case the main source of emission is sought, the first option is the best, while if a more complete information is required, the latter would fit better. From the case considered, since the proportion of electricity and gas used in the clean rooms is constant, the representation appears to be
useful since it provides this information; on the other hand, the representation with the numerical values gives an idea about the actual values of electricity and gas specifically used.
Also indicating the activity rate of emission of the total process has proved its benefits: the distribution of emissions appears clear along the workflow, and the most impacting activities can clearly be individuated. This does not give any information about the rate of improvement achievable,
54
which would probably be a more valuable information, but the process to assess it requires deep
knowledge of all the process activities, the technology used, and of the possible alternatives to lower carbon emissions.
Another consideration about expressing the CO2 emission for the single task, is related to the level
of detail of the representation. In case of an higher level of detail, this representation could undermine the comprehensibility of the model, providing a not useful information. While in case of a low level of detail, as in this case study, the map appears clear and the information obtainable useful.
The same information, about the distribution of emissions along the process, at a higher level of aggregation, was given by the division in pools, and the indication of the emissions related to each of them. This has clearly given information on the entity directly responsible for the emission: if the
organization responsible for the process, or any of its business partners. In the latter case, the most impacting among them can be determined, and actions taken to impact it.
Associating the indicators proposed for pools and lanes to groups of activities, as suggested by Recker et al. (2012), has not be implemented due to the low level of detail of the map, but it is recommendable for more detailed applications, i.e. with a higher level of detail.
As a further investigation, it would be interesting integrating the environmental extension with further details about the activities, as the cost associated to them, or the Full Time Equivalents (FTEs) required. Providing a wider range of indicators could be more beneficial for understanding possible
links between costs and air emissions, and improvements could be beneficial on both of them. Specific intervention projects could thus be addressed given the information provided by the map.
5.3.3 BPMS Making the process executable in a BPMS has shown the possible benefits of using a workflow
engine for the process implementation. Besides the overall gains due to the implementation of such a system for orchestrating the business processes, as reduction of costs, lead times and other intangible
benefits, also improvements towards the environment can be achieved. Through the functionalities that were developed within the BPMS, as the calculation of the total process emissions, the possibility of showing the operator several alternatives’ emissions when different possibilities are available, and
the possibility of monitoring the emissions over time, this solution would provide the following benefits:
• Information monitoring and collection over time for continuous improvement;
• Technical support for regulations and environmental frameworks;
• Operational decisions support;
• Strategic decision-‐making process backed by a complete dashboard of KPIs;
• Feedback instrument for information and motivation of employees;
• Wide view on the business constraints (cost, time, environment).
Spreading information within the company about the environmental impact of the organization’s operations, and employees’ own decisions, is an action aimed at creating awareness. This should influence the inclination of the single employee, and the company as a global entity. Opitz et al. (2014)
have defined it “Green attitude”, and have recognized it as the basic factor for implementing long-‐term Green BPM.
55
Moreover, using the functionality of the BP software to communicate with external applications
through web-‐services, has shown the opportunity of tying together the BPMS and the Enterprise Resource Planner (ERP). This solution, since it is using data already existing in the company information systems, does not require big efforts in terms of time and finances.
In the case study under analysis, information was gathered about the information systems used within the organization. Tools by different providers are used for different purposes, in different departments, but a BPM approach is not widespread in the company. The tool used for the
manufacturing activities has been investigated deeper in detail, collecting information on the data acquired during process execution. Information strictly relevant for process completion is collected, as the materials involved, the tools used, the machineries operated. No information about electricity
consumption is collected with the same approach.
Four experts with knowledge about ERP systems and BPMSs were interviewed from the
Technology delivery centres in order to get confirmation about the implementability of the instruments proposed at a company scale. The integration of the KEIs in an organization BPMSs, and the integration of the latter with an ERP system were assured by the interviewed, who could not
provide estimation on the time and the budget needed for a contingent implementation since they are strongly linked with the size of the process and the ERP used.
The organization, thus, would not have to switch the main enterprise system, which, according to
several studies, is a challenging initiative, few time successful (Ragowsky & Somers, 2002). More data, though, should be collected and inserted in the system. For instance, parameters like the weight of the containers, the type of fuel used by the different vehicles, the amount of energy linked to the
single activity, were found to be difficult to retrieve during the case study, since not of daily usage by the organization’s employees, but necessary for calculating the environmental impact of operating the business.
Last, the implementability of the solution proposed in the company, where the case study was conducted, was investigated. Experts with specific knowledge of the ERP modules used in the company were contacted and asked both about the possibility of inserting extra attributes and starting
monitoring them along the processes, as those proposed in this research (KEIs), and about the possible integrations between those models and a BPMS. Confirmation was received, due to the Service Oriented Architecture (SOA), common to several enterprise systems in the marketplace. A
contingent problem that could raise, although it is not the case, f the ERP modules belong to different software providers (e.g. SAP and Oracle), is that the system could have different databases. This configuration, since databases represent the lowest level of a SOA, could represent a criticality in
implementing the solution.
56
6. Conclusions
6.1 Main findings The research question of this thesis was defined as follow: “How to guide organizations analysing
their processes environmental footprint?”. This was answered by responding three sub-‐questions. Each of them has a merit in itself and, therefore, makes a contribution on its own. They are discussed
singularly in the following paragraphs.
1.1 How can BPMN 2.0 be extended with ecological-‐footprint indicators?
The investigation, about the indicators to include in an environmental extension of BPMN 2.0,
contributes to the research in this research stream, bringing one step further the initial work presented by Recker et al. (2012). The focus, during this investigation, was put both on the definition of a list of indicators to use in a representation, and how to include them in a process map. It is based
on a literature review study that covered frameworks from both the academic and the practise. The instrument produced provide graphical insights on the process criticalities in terms of environmental impact, highlighting their distribution along the workflow. Suggestions are provided on how to express
the indicators, in order to provide the reader with high quality information, without undermining the map understanding. Moreover, the use of the notation was brought into a BPME, which was customized in order to include the symbols in the digital representation. The instrument was validated
both through interviews with BPMN 2.0 experts and the application on a case study. The map can be used for communication objectives, for guiding brainstorming sessions aimed at environmental footprint reduction, and for analysing process emissions at design time.
1.2 How can the use of this notat ion be faci l i tated using a method?
Due to the lack of an approach that helps organization assessing carbon emissions from a process perspective, a set of guidelines has been provided. This aims at being a direction for using the notation
presented in this work and, in general, for assessing a business process impact on the environment. The method for selecting the indicators to plot in the process map represents a management tool for conceptualizing and assessing KEIs in business terms. It includes the steps necessary to orderly obtain
the information necessary for mapping the process under analysis, with relevant environmental information. Several frameworks are provided in order to assist the assessment, as a list of common indicators and criteria for choosing the strategically useful ones. The criteria proposed are aimed at
adapting the investigation level of detail to the time available and the information obtainable. In detail, the framework “Business relevance – Easiness of data collection”, to select the environmental indicators, provides a tool that can be applied to any scenario in which the selection of environmental
indicators is involved. Suggestions are illustrated to make the best possible use from the instruments used. Validation was assured both through interviewing experts with experience in similar projects, and applying it to a case study.
1.3 How can environmental footprint indicators be integrated in an executable process in a BPMS?
How to make the process executable on a BPMS is the last contribution brought by this
investigation. Different implementations on a BPMS are presented, and each of them is aimed at
57
bringing a different benefit to the business. The instrument provided would help organizations
monitoring their emissions, along with the classical business dimensions (cost, time, quality, flexibility), and providing a broader set of indicators for supporting decision-‐making. The state of the art in the BPMS industry was investigated, as the applicability of this concept holistically in a real business
scenario, eventually integrated with the existing organization’s ERP system. This cannot be achieved using software available in the marketplace since no tool addressing operational personnel provides environmental information (Dada, Stanoevska-‐Slabeva, & Gómez, 2013). The same is true for strategic
decisions support, because all the specialized tools have as main object legal compliance and are targeted at specific environmental roles within the organization. The software marketplace at the present moment offers tools, like Credit360, targeted to the management responsible for reporting.
The possibility of integration with ERP systems is offered, but at a high cost. While the solution proposed by this thesis would offer the benefit of being completely integrated with the operations,
and offering a complete dashboard of indicators for every business process, comprehensive of environmental indicators.
6.2 Limitations The findings of this study are subjected to limitations. The instruments presented, the
methodology, the notation, and the implementation on a BPMS, were tested on a single case study.
This is meant to be a form of validation of the applicability and implementability of the approach, but a higher number of applications would be more significant. Not being able to empirically validate the usability and usefulness of the BPMN extension represents a limit for the validity of the instrument
proposed.
In performing the case study, analysing a process from an external perspective, from an external consultant point of view, also represented a limitation in the data collection process. Moreover, an
high degree of aggregation has been used in the process analysis, and the investigation, in the specific case, has been targeting exclusively energy sources of CO2. Others, like waste produced or water consumed, were not considered, due to the company’s choice.
In the calculation, several assumptions have been used, in case real data was not available. The emissions related to the transportation tasks were computed through the kilometres travelled, while more precise knowledge would be achievable through transportation fuel consumption data. The GHG
Corporate Protocol recommendations were used in the calculations, implying that the results are subjected to parameters and assumptions made by them. And for using the extended notation in a digital representation, the software ARIS Architect & Designer resulted one of the only options in the
marketplace to support extra attributes graphically. Since the software is licensed, authorization should be required to use it.
The answer at the third research question provides some insights about how the integration of KEIs
into a BPMS could bring benefits, and an example is provided, integrating the indicators in a BPMS installed on a single computer, but an implementation at a company level would be more relevant, in order to affirm the solution advantages.
However, since multiple interviews for getting recommendations were conducted with experienced employees, all of them participated in projects in several industries, multiple sources of information were used. According to Yin (2003), multiple source for evidence provide the research a
certain degree of reliability. In conducting the case study, internal validity was assured by managing
58
interviews with different employees, overlapping questions among them, in order to attain internal
validity.
6.3 Future Research Organizations providing conversion factors could consider the possibility provide the data openly
through web-‐services, in a way that organizations could integrate those information in their Enterprise Systems
The limitations presented beforehand serve as a foundation for recommendations regarding potential further research. The instruments presented could be tested on more business cases, especially in different industries, in order to prove their validity. The methodology, thanks to the
validation offered by interviews, appears to be applicable in different scenarios. The application of the mapping extension, that includes environmental indicators, is suggested, in order to obtain further proof of its usefulness. Conducting business cases with a higher level of detail in the representation is
also recommended, to obtain a further degree of generalizability. Moreover, in this research just energy indicators were used. In a further application, KEIs belonging to different sources of emissions
are suggested to be chosen. Moreover, the integration of factors as time and cost, in the same extension, could be interesting both for the academic research, and the application to business cases.
The possibility of realizing the implementation of KEIs within a BPMS at a company level has been
presented in this thesis. It would be a meaningful contribution to this stream of research realizing this work in practice, in order to analyse the effects that it would have on the emissions of an organization, both through the impact on operational and strategic decisions-‐making. On the operational side,
informing the operator about the emissions his/her decision would produce, would make him/her aware of the negative effect of business on the environment, and could modify his/her behaviour. At a strategic level, mid-‐long term decisions would take into account air emissions together with indicators
of cost, time, and quality, with the possibility of setting targets and monitoring them with dashboards always up to date.
The dream of a Green Enterprise is just relatively far. One step at a time makes it more and more
concrete.
59
References Afmarn, M. R., & Widlders, L. M. (2014). Achtergrondegegevens stroometikettering 2013. Delft: CE.
Appel, S., Kleber, P., Frischbier, S., Freudenreich, T., & Buchmann, A. (2014). Modeling and execution of event stream processing in business processes. Information Systems, 46, 140-‐156.
Bartolomeo, M. (1995). Environmental performance indicators in industry. In Nota di Lavoro 41.95. Milan: Fondazione Eni Enrico Matei.
Bartolomeo, M. (1995). Environmental performance indicators in industry. Milan: Fondazione Eni
Enrico Mattei.
Bhatia, P., & Ranganatha, J. (2014). The Greenhouse Gas Protocol -‐ A Corporate Accounting and Reporting Standard. World Business Council for Sustainable Development and the World
Resources Institute.
Binder, W., & Suri, N. (2009). Green Computing: Energy Consumption Optimized Service Hosting. In M. Nielsen, A. Kucera, P. B. Miltersen, C. Palamidessi, P. Tuma, & F. Valencia, SOFSEM 2009. LNCS, vol. 5404 (pp. 117-‐128). Heidelberg: Springer.
Bizagi. (2015). Bizagi BPM Suite V10.6 -‐ User guide. Retrieved from http://help.bizagi.com/bpmsuite/en/
Blinge, M. (2005). Cost Effective Measures to Reduce CO2 emissions in the air freight section. Goteborg: Transport Research Institute.
BPM Center. (2015). Retrieved from http://bpmcenter.org/
Bras, B., & Emblemsvag, J. (2001). Activity-‐Based Cost and Environmental Management. Massachusetts: Kluwer Academic Publishers.
Brown, D., Dillard, J., & Marshall, R. S. (2006). Triple bottom line: a business metaphor for a social construct (Documents de Teball). Barcelona, Spain: Universitat Autonoma de Barcelona.
Carlino, J., Nelson, S., & Smith, N. (2000). AMR researc predicts enterprise applications market will reach $78 billion by 2004. Boston: AMR Research.
Chung, C. (2004). Simulation modeling handbook: a practical approach. Houston: CRC Press LLC.
CICA (Canadian Institute of Chartered Accountants). (1994). Reporting on environmental performance. Toronto, Ontario.
Dada, A., Staake, T., & Fleisch, E. (2010). Towards continous environmental improvements across the product life cycle. 16th Americas conference on information systems. Lima: Peru.
Dada, A., Stanoevska-‐Slabeva, K., & Gómez, J. M. (2013). Organizations' Environmental Performance Indicators. Berlin Heidelberg: Springer.
Dale, V. H., & Beyeler, S. (2001). Challenges in the development and use of ecological indicators. Ecological Indicators 1.
Davis, R. (2008). ARIS design platform: advanced process modelling and administration. Springer Science & Business Media.
60
Davis, R., & Brabander, E. (2007). ARIS design platform: getting started with BPM. Springer Science & Business Media.
Department for Environment, Food & Rural Affairs. (2013). Environmental Reporting Guidelines: including mandatory greenhouse gas emissions reporting guidance. Retrieved from
https://www.gov.uk/government/publications/environmental-‐reporting-‐guidelines-‐including-‐mandatory-‐greenhouse-‐gas-‐emissions-‐reporting-‐guidance
Deutsch, C. H. (2008, November 8). Software that can make a grown company cry. New York Times, 13.
Dredden, G., & Bergdolt, J. C. (2007). Enterprise Resource Planning. Air Force Journal of Logistics, 31(2), 48.
Dumas, M., La Rosa, M., Mendling, J., & Reijers, H. A. (2013). Fundamentals of Business Process Management. Berlin, Germany: Springer. Retrieved from http://bpmcenter.org/
Eisenhardt, K. M. (1989). Building Theories from Case Study Research. Academy of Management Review, 532-‐550.
EPA, US. (2003). National air quality and emissions trends report. Research triangle park, United States Environmental Protection Agency.
European Union Commission. (2014). Towards a circular economy: A zero waste programme for Europe. Retrieved 2015, from EUR-‐Lex: http://eur-‐lex.europa.eu/legal-‐
content/EN/TXT/?qid=1415352499863&uri=CELEX:52014DC0398R%2801%29
Fernández, H., Elias, P., García-‐Diaz, V., G-‐Bustelo, C. P., Martínez, O., & Lovelle, J. (2010). SBPMN -‐ An easier business process modeling notation for business users. Computer Stardards & Interfaces, 32, 18-‐28.
Fettke, P. (2009). How Conceptual Modeling Is Used. Communications of the AIS, 25, 571-‐592.
Garrison, R. H., Noreen, E. W., & Brewer, P. C. (2003). Managerial accounting. New York, USA: McGraw-‐Hill/Irwin.
Gartner. (2015). Market Guide for IT Process Automation.
Geerlings, H., & Van Duin, R. (2011). A new method for assessing CO 2-‐emissions from container
terminals: a promising approach applied in Rotterdam. Journal of Cleaner Production, 657-‐666.
GHG Protocol. (2014). Technical Guidance for Calculating Scope 3 Emissions. Retrieved from
http://www.ghgprotocol.org/files/ghgp/Chapter4.pdf
Ghose, A., Hoesch-‐Klohe, K., Hinsche, L., & Le, L.-‐S. (2009). Green Business Process Management: A Research Agenda. Australasian Journal of Information Systems, 103-‐117.
Goedkoop, M., & Spriensma, R. (2001). The eco-‐indicator99: A damage oriented method for life cycle impact assessment: Methodology report.
Guest, G., MacQueen, K. M., & Namey, E. E. (2011). Applied Thematic Analysis. Sage.
Hammer, M., & Champy, J. (1993). Re-‐engineering the Corporation; A Manifesto for Business Revolution. New York: Harper Business.
61
Hammond, A., Adriaanse, A., Rodenburg, E., Bryant, D., & Woodward, R. (1995). Environmental Indicators: A Systematic Approach to measuring and Reporting on Environmental Policy Performance in the Context of Sustainable Development. Washington, DC: World Resources Institute.
Harrison, C. L. (1993). Life-‐cycle assessment: Inventory guidelines and principles. Cincinnati, Ohio: EPA.
Hevner, A. R. (2007). A Three Cycle View of Design Science Research. Information Systems and Decision Sciences, 19(2), 87-‐92.
Huang, Y. A., Weber, C. L., & Matthews, H. S. (2009). Categorization of scope 3 emissions for streamlined eneterprise carbon footprint. Environmental Science & Technology, 43(22), 8509-‐8515.
International Standard Organisation. (1998). Environmental performance evaluation. ISO/DIS 14.031.
Jamous, N., & Muller, K. (2013). Environmental Performance Indicators. In A. Dada, K. Stanoevska, & J.
M. Gómez, Organizations' Environmental Performance Indicators: Measuring, Monitoring, and Management. Springer Science & Business Media.
Jasch, C. (2000). Environmental performance evaluation and indicators. Journal of Cleaner Production, 8, 79-‐88.
Jeston, J., & Nelis, J. (2014). Business Process Management. Routledge.
Johnson, E. (2008). Disagreement over carbon footprints: A comparison of electric and LPG forklifts.
Energy Policy(36), 1569-‐1573.
Karagiannis, D. (1995). BPMS: bsuiness process management systems. ACM SIGOIS Bulletin, 10-‐13.
Keeling, C. D., Bacastrow, R. B., Carter, A. F., Piper, S. C., Whorf, T. P., Heiman, M., . . . Roeloffzen, H.
(1989). A three-‐dimensional model of atmospheric CO2 transport based on observed winds: 1. Analylsis of observational data. In D. H. Peterson, Aspects of climate variability in the Pacific and the western Americas (pp. 165-‐236). Washington, D.C., USA: Geophysical Monographs.
Kettinger, W. J., Teng, J. T., & Guha, S. (1997). Business process change: a study of methodologies, techniques, and tools. MIS Quarterly, 21(1), 55-‐80.
Kitzes, J. (2013). An introduction to environmentally-‐extended input-‐output analysis. Resources, 2(4), 489-‐503.
Kleindorfer, P. R., Singhal, K., & Wassenhove, L. N. (2005). Sustainable operatinos management. Productino and Operations Management, 14(4), 482-‐492.
Kyriazis, D., Tserpes, K., Menychtas, A., Litke, A., & Vavarigou, T. (2008). An innovative workflow mapping mechanism for grids in the frame of quality of service. Future Generation Computer Systems, 24(6), 498-‐511.
Lankhorst, M. (2005). Enterprise Architecture at Work: Modeling, Communication, and Analysis. Berlin, Germany: Springer.
Lehni, M. (1998). WBSCD project on eco efficiency metrics and reporting; state-‐of-‐play report. World Buisness Council for Sustainable Development . Geneva.
62
Lenzen, M. (2002). A guide for compiling inventories in hybrid life-‐cycle assessments: some Australian
results. Journal of Cleaner Production, 10(6), 545-‐572.
Leymann, F., & Roller, D. (1999). United States of America Patent No. US5960420.
Main, J. (1990, September 24). Computers of the world, unite! Fortune, 117-‐122.
Matson, P. A., & Vitousek, P. M. (1990). Ecosystem approach to a global nitrous oxide budget. BioScience, 40, 667-‐672.
Miettinen, P., & Hämäläinen, R. P. (1997). How to benefit from decision analysis in environmental life
cycle assessment (LCA). European Journal of Opeartional Research, 102, 279-‐294.
Neslen, A. (2015, June 24). Retrieved from The Guardian: http://www.theguardian.com/environment/2015/jun/24/dutch-‐government-‐ordered-‐cut-‐
carbon-‐emissions-‐landmark-‐ruling
Novak, A., & Leymann, F. (2013). An Overview on Implicit Green Business Process Patterns. Stuttgart, Germany: Istitut für Architektur von Anwendungssystemen.
Nowak, A., Leymann, F., Schumm, D., & Wetzstein, B. (2011). An Architecture and Methodology for a Four-‐Phased Approach to Green Business Process Reengineering. In Proceedings of the International Conference on ICT as Key Technology for the Fight against Global Warming (pp. 150-‐164). Springer.
Object Management Group. (2012). Retrieved from http://bpmn.org/#tabs-‐implementers
OECD. (1999). Environmental Indicators for Agriculture: Volume 1 Concepts and Grameworks. Paris: Organisation for Economic Cooperation and Development.
Office of the Press Secretary. (2015, August 3). the White House. Retrieved from
https://www.whitehouse.gov/the-‐press-‐office/2015/08/03/fact-‐sheet-‐president-‐obama-‐announce-‐historic-‐carbon-‐pollution-‐standards
Olsthoorn, X., Tyteca, D., Wehrmeyer, W., & Wagner, M. (2001). Environmental indicators for
business: a review of the literature and standardisation methods. Journal of Cleaner Production, 9, 453-‐463.
OMG. (2002). Unified Modeling Language: Superstructure, UML Superstructure Specification v2.0, formal/05-‐07-‐04. Object Management Group.
OMG. (2005). Retrieved from OMG: http://www.omg.org/bpmn/Samples/Elements/Core_BPMN_Elements.htm
OMG. (2009). Formally Reseased Versions of Business Process Model and Notation (BPMN) Version 1.2.
Opitz, N., Erek, K., Langkau, T., Kolbe, L., & Zarnekow, R. (2012). Kick-‐starting Green Business Process
Management -‐ Suitable Modeling Languages and Key Processes for Green Performance Measurement. AMCIS 2012 Proceedings. Seattle, Washington: http://aisel.aisnet.org/amcis2012/proceedings/GreenIS/9.
Opitz, N., Erek, K., Langkau, T., Kolbe, L., & Zarnekow, R. (2012). Kick-‐starting Green Business Process Management -‐ Sutiable Modeling Languages and Key Processes for Green Performance
63
Measurement. AMCIS 2012 Proceedings. Seattle, Washington:
http://aisel.aisnet.org/amcis2012/proceedings/GreenIS/9.
Opitz, N., Krüp, H., & Kolbe, L. M. (2014). Environmentally sustainable business process management -‐ developing a green BPM readiness model.
Opitz, N., Krüp, H., & Kolbe, L. M. (2014). Green Business Process Management -‐ A Definition and Research Framework. 47th Hawaii International Conference on System Science. System Sciences (HICSS) IEEE, 2014.
Pandey, S., Karunamoorthy, D., & Buyya, R. (2011). Workflow engine for clouds. Could Computing: Principles and Paradigms, 321-‐344.
Pernici, B., Ardagna, D., & Cappiello, C. (2008). Business process design: Towards service-‐based green
information systems. In A. M. Mazzeo, R. B. Bellini, & G. M. Motta, E-‐government, ICT professionalism and competencies, service science (Lecture notes in biomathematics, Vol. 280, pp. 195-‐203) (pp. 195-‐203). Berlin, Germany: Springer.
Petrozzo, D. P., & Stepper, J. C. (1994). Successful Reengineering. New York: Van Nostrand Reinhold.
Porter, M. E. (1985). Competitive Advantage. New York, NY, USA: The Free Press.
Puah, P. K., & Tang, N. K. (2000). Business process management, a consolidation of BPR and TQM. 2000 IEEE International Concerence. 1, pp. 110-‐115. IEEE.
R., L. J., & Palmer, R. N. (1986). Subjective evaluation: Linguistic scales in pairwise comparison
methods. Civil Envgineering Systems, 3(4), 182-‐186.
Ragowsky, A., & Somers, T. M. (2002). Enterprise Resource Planning. Journal of Management Information Systems, 19(1), 11-‐15.
Rautenstrauch, C. (1999). Betriebliche Umweltinformationssysteme: Grundlagen. Springer.
Raynaud, D., Jouzel, J., Barnola, J. M., Chappellaz, J., Delmas, R. J., & Lorius, C. (1993). The ice core record of green house gases. Science, 259, 926-‐934.
Recker, J., Rosemann, M., Hjalmarsson, A., & Lind, M. (2012). Modeling and Analyzing the Carbon Footprint of Business Processes. In J. vom Brocke, S. Seidel, & J. Recker, Green Business Process Management towards the sustainable enterprise. Springer.
Reijers, H. A. (2005). Design and Control of Workflow Processes: Business Process Management for the Service Industry. Berlin: Springer-‐Verlag.
Reijers, H. A., & Mansar, L. S. (2005). Best practices in business process redesign: an overview and
qualitative evaluation of successful redesign heuristics. The International Journal of Management Science, 33(4), 283-‐306.
Remenyi, D., Williams, B., Money, A., & Swartz, E. (1998). Research in Business and Management . London: Sage.
Renison, K. (2009). Carbon footprint modeling with sas for sustainability management: Beyond calculation. Retrieved February 5, 2015, from
http://support.sas.com/resources/papers/proceedings09/343-‐2009.pdf
64
Rodríguez, A., Fernández-‐Medina, E., & Piattini, M. (2007). A BPMN extension for the modeling of
security requirements in business processes. IEICE transactions on information and systems, 90(4), 745-‐752.
Saaty, T. L. (1990). Hot to make a decision: The Analytic Hierarchy Process. European Journal of Operational Research 48, 48, 9-‐26.
SAP. (2015). ABAP web sevices. Retrieved from http://help.sap.com/saphelp_nw74/helpdata/en/48/52347a08e672d0e10000000a42189c/fra
meset.htm
SAP. (2015). SAP. Retrieved from http://help.sap.com/saphelp_nw74/helpdata/en/48/52347a08e672d0e10000000a42189c/fra
meset.htm
Sarigiannis, D. A. (1996). Computer-‐aided design for environment in the process industries. Computers & chemical engineering, S1407-‐1412.
Saunders, M., Lewis, P., & Thornhill, A. (2009). Research Methods for Business Students. Pearson Education.
Schensul, S. L., J., S. J., & LeComplte, M. D. (1999). Essential ethnographic methods: Observations, interviews, and questionnaires, ethnographers's toolkit (Vol. 2). Lanham: MD: AltaMira Press.
Seidel, S., Recker, J., & vom Brocke, J. (2012). Green Business Process Management: towards the
sustainable enterprise. In J. vom Brocke, S. Seidel, & J. Recker, Green Business Process Managament. Berlin: Springer Science & Business Media.
Seidel, S., Recker, J., Pimmer, J., & vom Brocke, J. (2010). Enablers and barriers to the organizational
adoption of sustainable business practices. 16th Americas conference on information systems. Lima, Peru.
Selic, B. (2007). Systematic approach to domain-‐specific language design using UML. Proceedings of the 10th IEEE International Symposium on Object and Component-‐Oriented Real-‐Time Distributed Computing (pp. 2-‐0). Los Alamitos: IEEE Computer Society.
Shi, M. L., Yang, G. X., Xiang, Y., & Wu, S. G. (1999). WFMS: Workflow Management Systems. Chinese Journal of Computers.
Shin, K., & Cheong, J.-‐P. (2011). Estimating transportation-‐related greenhouse gas emissions in the port of busan, S. Korea. Asian Journal of Atmospheric Environment 5.1, 41-‐46.
Shrivastava, P. (1987). Rigor and Practical Usefulness of Research in Srategic Management. Strategic Management Journal, 8(1), 77-‐92.
Silver, B. (1995). Selecting a Workflow Tool. WORKFLOW '95 -‐ Business Process Re-‐Engineering, (pp. 8-‐10). Boston, MA.
Simon, H. (1996). The Sciences of Artificial (3rd ed.). Cambridge, MA: MIT Press.
Song, D.-‐P., & Xu, J. (2012). An operational acitvity-‐based method to estimate CO2 emissions from
container shipping considering empty container reposition. Transportation Research, Part D(17), 91-‐96.
65
Stenbacka, C. (2001). Qualitative research requires quality concepts of its own. Management decision, 39(7), 551-‐556.
Streets, D. G. (2000). The growing contribution of sulfur emissions from ships in Asian waters 1988-‐1995. Atmospheric Environment, 24(26), 4425-‐4439.
Stroppi, L. J., Chiotti, O., & Villarreal, P. D. (2011). A bpmn 2.0 extension to define the resource perspective of buisness process models. XIV Iberoamerican Conference on Software Engineering, (pp. 25-‐38).
Su, Y., & Zhou, H. (2005). Promoting circular economy development a basic national policy. Northern Economy, 8-‐10.
Svoboda, S. (1995). Note on Life Cycle Analysis in Pollution Prevention in: Corporate Strategy. National Pollution Prevention Center for Higher Education, Univ. of Michigan.
The European Parliament. (2014). Directive of the European Parliament and of the Council amending Directive 2013/34/EU as regards disclosure of non-‐financial and diversity infomation by certain large undertakings and groups. Brussels: The European Parliament. Retrieved from http://register.consilium.europa.eu/doc/srv?l=EN&f=PE 47 2014 INIT
The Noun Project. (2015). The Noun Project. Retrieved from https://thenounproject.com/
Thoresen, J. (1999). Environmental performance evaluation -‐ a tool for industrial improvement. Journal of Cleaner Production, 365-‐370.
Uhl, C., & Kauffman, J. (1990). Deforestation, fire susceptibility and potential tree responses to fire in the eastern Amazon. Ecology, 71, 437-‐449.
US Environmental Protection Agency. (2013). Fact Sheet: Greenhouse Gases Reporting Program Implementation. Retrieved from http://www.epa.gov/ghgreporting/documents/pdf/2009/FactSheet.pdf
Vargas, L. G. (1990). An overview of the anlytic hierarchy process and its applications. European journal of operational research, 48(1), 2-‐8.
Veidenheimer, K. (2014). Carbon Dioxide Emission in Maritime Container Transport and comparison of European deepwater ports: CO2 Calculation Approach, Analysis and CO2 Reduction Measures: CO2 Calculation Approach, Analysis and CO2 Reduction Measures. Anchor Academic Publishing.
Villalba, G., & Gemechu, E. D. (2011). Estimating GHG emissions of marine ports-‐the case of Barcelona.
Energy Policy, 39, 1363-‐1368.
Vis, I. F., & De Koster, R. (2003). Transshipment of containers at a container terminal: An overview. European journal of operational research, 1, 1-‐16.
Vitousek, P. M. (1994). Beyond Global Warming: Ecology and Globa Change. Ecology, 75(7), 1861-‐1876.
Wahl, T., & Sindre, G. (2009). An Analytical Evaluation of BPMN Using a Semiotic Quality Framework.
In Advanced Topics in Database Research. IGI Global.
Watarlabe, Y. (2004). Evaluation of carbon dioxide emissions from container ports.
66
Watson, R. T., Boudreau, M. C., & Chen, A. J. (2010). Information Systems and Environmentally
Sustainable Development: Energy Informatics and New Directions for the IS Community. Management Information Systems Quarterly, 34(1), 22-‐38.
Watson, R. T., Boudreau, M., & Chen, A. (2010). Information systems and environmentally sustainable
development: Energy informatics and new directions for the IS community. MIS Quarterly, 23-‐38.
WCED. (1987). Our common future. Oxford, UK: Oxford University Press.
WFMC. (2002). Workflow Management Coalition Workflow Standard: Workflow Process Definition Interface -‐ XML Process Definition Language (XPDL). Lighthouse Point, Florida, USA: Workflow Management Coalition.
WfMC, Workflow managment coalition. (1999). terminology & glossary. Retrieved from WFMC-‐TC-‐1011 ver3: http://www.wfmc.org/wfmc-‐standards-‐framework.html
White, S. A. (2004). Introduction to BPMN. IBM Cooperation 2.0.
White, S. A. (2004). Introduction to BPMN. Retrieved from IBM Corporation: http://www.ebpml.org/bpmn.htm
Wild, Y. (2008). Environmental Aspects of the Transport of Reefer Containers. Carbon Footprint Workshop. Antwerp: 3rd Reefer Logistic Conference.
Wright, L. A., Kemp, S., & Williams, I. (2011). Carbon footprinting: towards a universally accepted
definition. Carbon management, 2(1), 61-‐72.
WWF. (2015). Deforestation. Retrieved from http://wwf.panda.org/about_our_earth/about_forests/deforestation/
Yin, R. (2003). Case study research: Design and methods. Beverly Hills, CA: Sage Publishing.
Yongvanich, K., & Guthrie, J. (2006). An extended performance reporting framework for social and environmental accounting. Journal of Business Strategy and the Environment, 15(5), 309-‐321.

67
7. Appendix
7.1 ARIS Architect & Designer 9.7
7.1.1 Software choice Opitz et al. (2012), in line with the work of Recker et al. (2012), adopt a process view approach
for analyzing the environmental impact of organizations’ activities. Among the investigation conducted in a three year project, started in September 2011, they have been investigation which is the most
suitable software for monitoring energy efficiency key performance indicators. They concluded an investigation among 70 vendors of BPMN 2.0 software solutions that present their products in the marketplace (Object Management Group, 2012). After screening the suitable ones, a choice was made
using the following criteria: possibility of displaying the business process and the involved IT resources in one tool, opportunity to import and export XML, including a simulation engine. The software selected is ARIS Business Architect, since it meets the requirements chosen for the analysis, and is of
common use within the enterprise (Lankhorst, 2005).
Since the criteria used in the investigation fits the scope of this research as well, ARIS is the software that will be used for this research too. Furthermore, it gives the possibility of extending the
BPMN 2.0 notation with symbols, using them as dynamic attributes. In this way an icon would be represented next to the activity in case a certain condition is satisfied. In our case that would be the
presence of a certain emission source for the considered activity.
These can be associated both to activities, lanes, groups, and pools. This is the fundamental prerequisite for this research, since the processes under analysis have to be modelled, and extra
information needs to be added to the workflow.
Through the conditional appearance choice, it is possible to set the actual value of a certain attributes and, just in case the value is set, the corresponding symbol would graphically appear.
7.1.2 Software implementation The software ARIS, in its version Architect & Designer 9.7, allows the user to design, document,
optimize, and communicate processes in order to achieve process improvements. The possibility of running analysis through simulation models is offered, and executing models using web methods.
The software is organized in modules, to give the possibility of performing different tasks and switching between them without interrupting the work. There are six modules available in ARIS
Architect:
• Home Page • Explorer • Designer • Matrix Editor • Administration • Script Editor
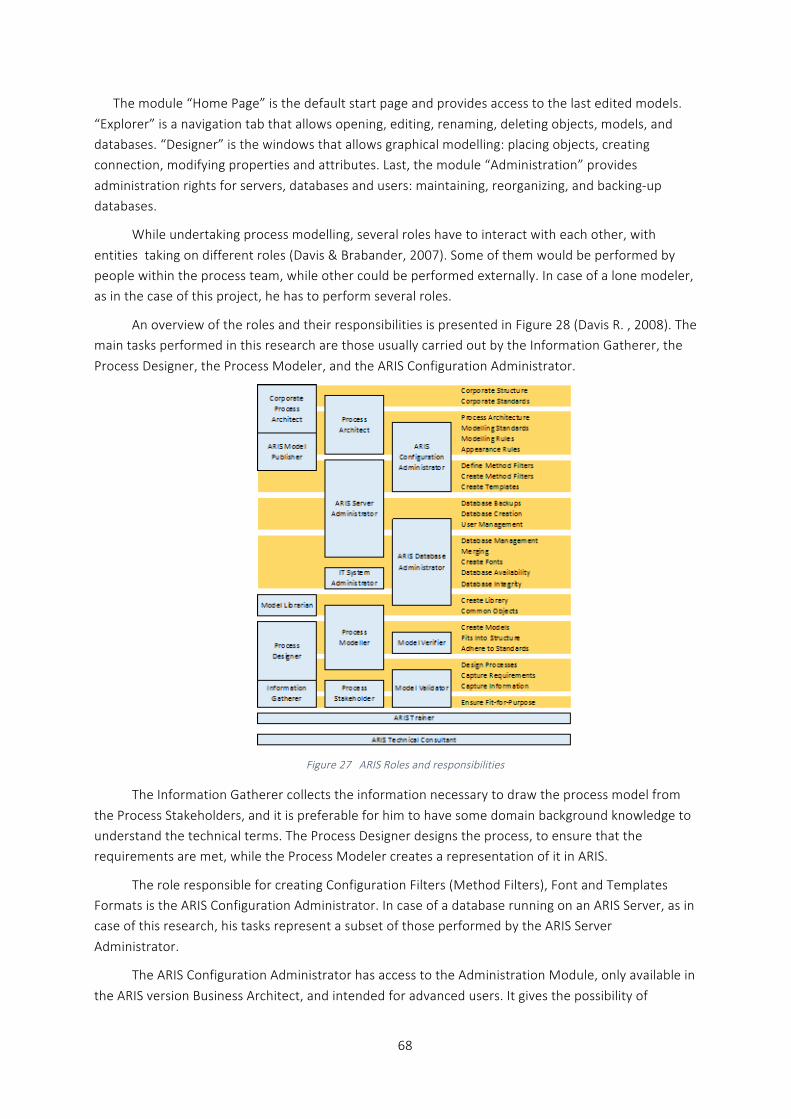
68
The module “Home Page” is the default start page and provides access to the last edited models.
“Explorer” is a navigation tab that allows opening, editing, renaming, deleting objects, models, and databases. “Designer” is the windows that allows graphical modelling: placing objects, creating connection, modifying properties and attributes. Last, the module “Administration” provides
administration rights for servers, databases and users: maintaining, reorganizing, and backing-‐up databases.
While undertaking process modelling, several roles have to interact with each other, with
entities taking on different roles (Davis & Brabander, 2007). Some of them would be performed by people within the process team, while other could be performed externally. In case of a lone modeler, as in the case of this project, he has to perform several roles.
An overview of the roles and their responsibilities is presented in Figure 28 (Davis R. , 2008). The main tasks performed in this research are those usually carried out by the Information Gatherer, the
Process Designer, the Process Modeler, and the ARIS Configuration Administrator.
Figure 27 ARIS Roles and responsibilities
The Information Gatherer collects the information necessary to draw the process model from
the Process Stakeholders, and it is preferable for him to have some domain background knowledge to understand the technical terms. The Process Designer designs the process, to ensure that the requirements are met, while the Process Modeler creates a representation of it in ARIS.
The role responsible for creating Configuration Filters (Method Filters), Font and Templates Formats is the ARIS Configuration Administrator. In case of a database running on an ARIS Server, as in case of this research, his tasks represent a subset of those performed by the ARIS Server
Administrator.
The ARIS Configuration Administrator has access to the Administration Module, only available in
the ARIS version Business Architect, and intended for advanced users. It gives the possibility of
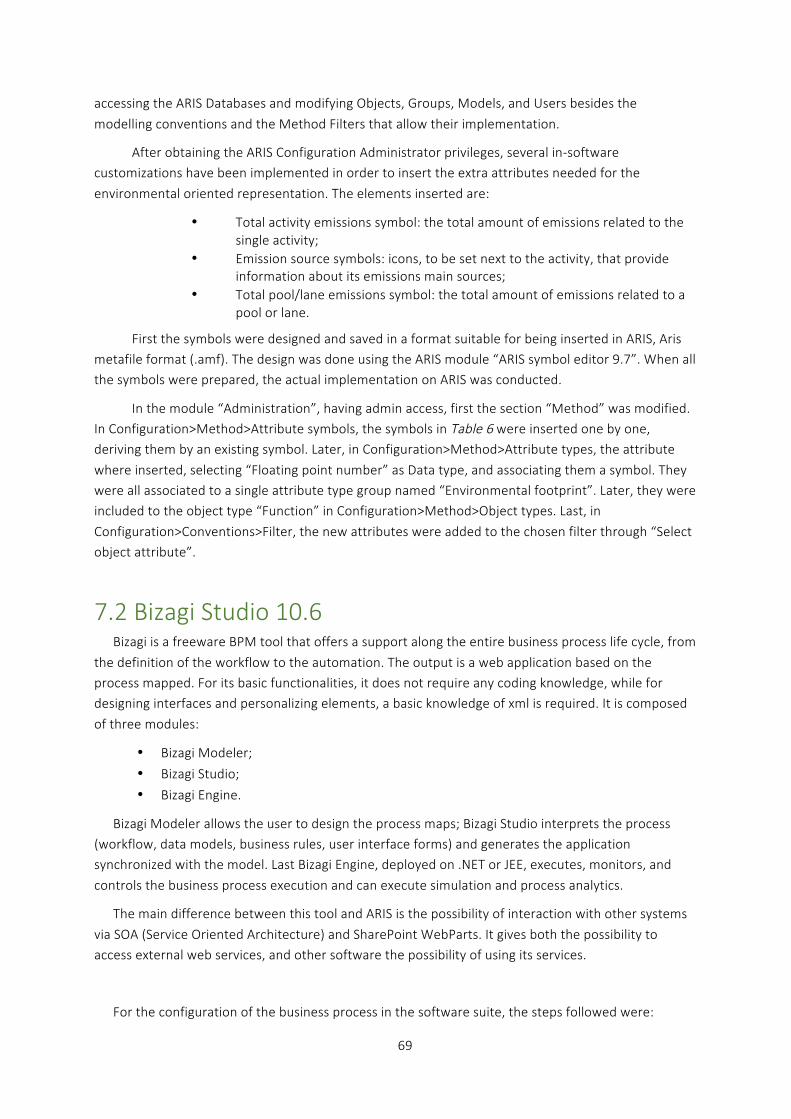
69
accessing the ARIS Databases and modifying Objects, Groups, Models, and Users besides the
modelling conventions and the Method Filters that allow their implementation.
After obtaining the ARIS Configuration Administrator privileges, several in-‐software customizations have been implemented in order to insert the extra attributes needed for the
environmental oriented representation. The elements inserted are:
• Total activity emissions symbol: the total amount of emissions related to the single activity;
• Emission source symbols: icons, to be set next to the activity, that provide information about its emissions main sources;
• Total pool/lane emissions symbol: the total amount of emissions related to a pool or lane.
First the symbols were designed and saved in a format suitable for being inserted in ARIS, Aris metafile format (.amf). The design was done using the ARIS module “ARIS symbol editor 9.7”. When all the symbols were prepared, the actual implementation on ARIS was conducted.
In the module “Administration”, having admin access, first the section “Method” was modified. In Configuration>Method>Attribute symbols, the symbols in Table 6 were inserted one by one, deriving them by an existing symbol. Later, in Configuration>Method>Attribute types, the attribute
where inserted, selecting “Floating point number” as Data type, and associating them a symbol. They were all associated to a single attribute type group named “Environmental footprint”. Later, they were included to the object type “Function” in Configuration>Method>Object types. Last, in
Configuration>Conventions>Filter, the new attributes were added to the chosen filter through “Select object attribute”.
7.2 Bizagi Studio 10.6 Bizagi is a freeware BPM tool that offers a support along the entire business process life cycle, from
the definition of the workflow to the automation. The output is a web application based on the process mapped. For its basic functionalities, it does not require any coding knowledge, while for designing interfaces and personalizing elements, a basic knowledge of xml is required. It is composed
of three modules:
• Bizagi Modeler;
• Bizagi Studio;
• Bizagi Engine.
Bizagi Modeler allows the user to design the process maps; Bizagi Studio interprets the process (workflow, data models, business rules, user interface forms) and generates the application synchronized with the model. Last Bizagi Engine, deployed on .NET or JEE, executes, monitors, and
controls the business process execution and can execute simulation and process analytics.
The main difference between this tool and ARIS is the possibility of interaction with other systems
via SOA (Service Oriented Architecture) and SharePoint WebParts. It gives both the possibility to access external web services, and other software the possibility of using its services.
For the configuration of the business process in the software suite, the steps followed were:
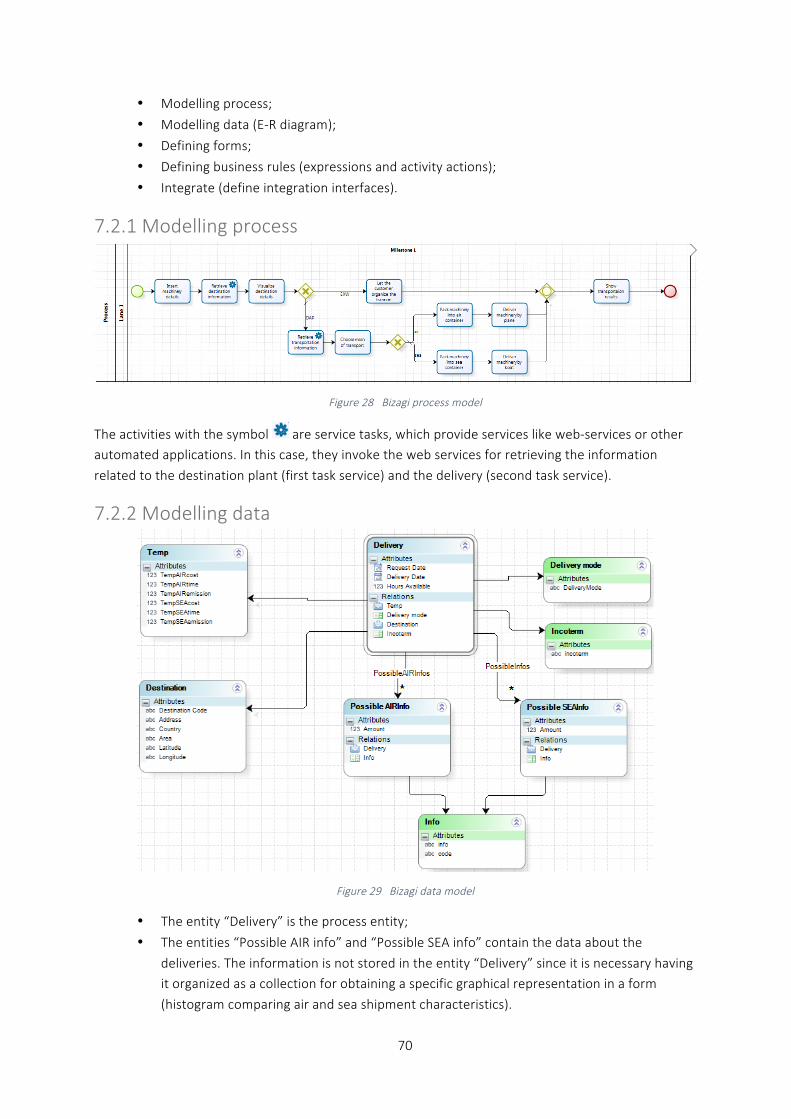
70
• Modelling process;
• Modelling data (E-‐R diagram);
• Defining forms;
• Defining business rules (expressions and activity actions);
• Integrate (define integration interfaces).
7.2.1 Modelling process
Figure 28 Bizagi process model
The activities with the symbol are service tasks, which provide services like web-‐services or other automated applications. In this case, they invoke the web services for retrieving the information
related to the destination plant (first task service) and the delivery (second task service).
7.2.2 Modelling data
Figure 29 Bizagi data model
• The entity “Delivery” is the process entity;
• The entities “Possible AIR info” and “Possible SEA info” contain the data about the
deliveries. The information is not stored in the entity “Delivery” since it is necessary having it organized as a collection for obtaining a specific graphical representation in a form
(histogram comparing air and sea shipment characteristics).
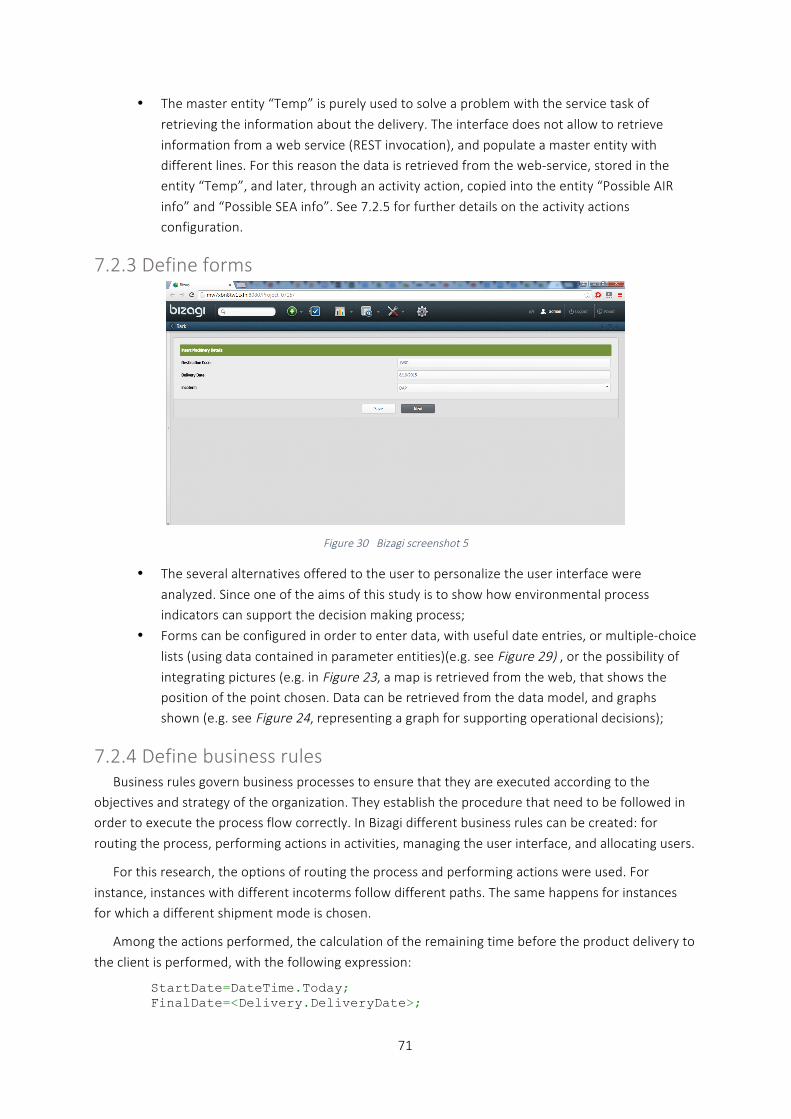
71
• The master entity “Temp” is purely used to solve a problem with the service task of
retrieving the information about the delivery. The interface does not allow to retrieve
information from a web service (REST invocation), and populate a master entity with different lines. For this reason the data is retrieved from the web-‐service, stored in the entity “Temp”, and later, through an activity action, copied into the entity “Possible AIR
info” and “Possible SEA info”. See 7.2.5 for further details on the activity actions configuration.
7.2.3 Define forms
Figure 30 Bizagi screenshot 5
• The several alternatives offered to the user to personalize the user interface were
analyzed. Since one of the aims of this study is to show how environmental process indicators can support the decision making process;
• Forms can be configured in order to enter data, with useful date entries, or multiple-‐choice
lists (using data contained in parameter entities)(e.g. see Figure 29) , or the possibility of integrating pictures (e.g. in Figure 23, a map is retrieved from the web, that shows the position of the point chosen. Data can be retrieved from the data model, and graphs shown (e.g. see Figure 24, representing a graph for supporting operational decisions);
7.2.4 Define business rules Business rules govern business processes to ensure that they are executed according to the
objectives and strategy of the organization. They establish the procedure that need to be followed in order to execute the process flow correctly. In Bizagi different business rules can be created: for
routing the process, performing actions in activities, managing the user interface, and allocating users.
For this research, the options of routing the process and performing actions were used. For
instance, instances with different incoterms follow different paths. The same happens for instances for which a different shipment mode is chosen.
Among the actions performed, the calculation of the remaining time before the product delivery to
the client is performed, with the following expression:
StartDate=DateTime.Today; FinalDate=<Delivery.DeliveryDate>;

72
<Delivery.HoursAvailable>=CHelper.getEffectiveDuration(Me,StartDate,FinalDate)*24/(8*60);
While for computing the total emissions at the end of the process, the emissions produced during all the process activities are summed together, retrieving a certain information just if a certain path
was walked:
if (<Delivery.Deliverymode.DeliveryMode> == "sea") Total = CHelper.getEntityAttrib("Packing","amount","category = 'sea'","") + <Delivery.Temp.TempSEAemission>; else Total = CHelper.getEntityAttrib("Packing","amount","category = 'air'","") + <Delivery.Temp.TempAIRemission>; <Delivery.totalemissions> = Total
For populating the table containing the information regarding the delivery, as stated before, the
data retrieved from the web-‐service and stored in the entity “Temp” is then copied in the related entity, in a way that a certain format is respected:
NewInfo=Me.newCollectionItem("Delivery.Informations"); var Type = CHelper.getEntityAttrib("typology","idtypology","Code = 1",""); var Amount = <Delivery.Temp.TempAIRcost>; NewInfo.setXPath("info",Type); NewInfo.setXPath("Amount",Amount); NewInfo=Me.newCollectionItem("Delivery.Informations"); var Type = CHelper.getEntityAttrib("typology","idtypology","Code = 2",""); var Amount = <Delivery.Temp.TempAIRtime>; NewInfo.setXPath("info",Type); NewInfo.setXPath("Amount",Amount); NewInfo=Me.newCollectionItem("Delivery.Informations"); var Type = CHelper.getEntityAttrib("typology","idtypology","Code = 3",""); var Amount = <Delivery.Temp.TempAIRemission>; NewInfo.setXPath("info",Type); NewInfo.setXPath("Amount",Amount); NewInfo=Me.newCollectionItem("Delivery.Informations"); var Type = CHelper.getEntityAttrib("typology","idtypology","Code = 4",""); var Amount = <Delivery.Temp.TempSEAcost>; NewInfo.setXPath("info",Type); NewInfo.setXPath("Amount",Amount); NewInfo=Me.newCollectionItem("Delivery.Informations"); var Type = CHelper.getEntityAttrib("typology","idtypology","Code = 5",""); var Amount = <Delivery.Temp.TempSEAtime>; NewInfo.setXPath("info",Type); NewInfo.setXPath("Amount",Amount); NewInfo=Me.newCollectionItem("Delivery.Informations"); var Type = CHelper.getEntityAttrib("typology","idtypology","Code = 6",""); var Amount = <Delivery.Temp.TempSEAemission>; NewInfo.setXPath("info",Type); NewInfo.setXPath("Amount",Amount);
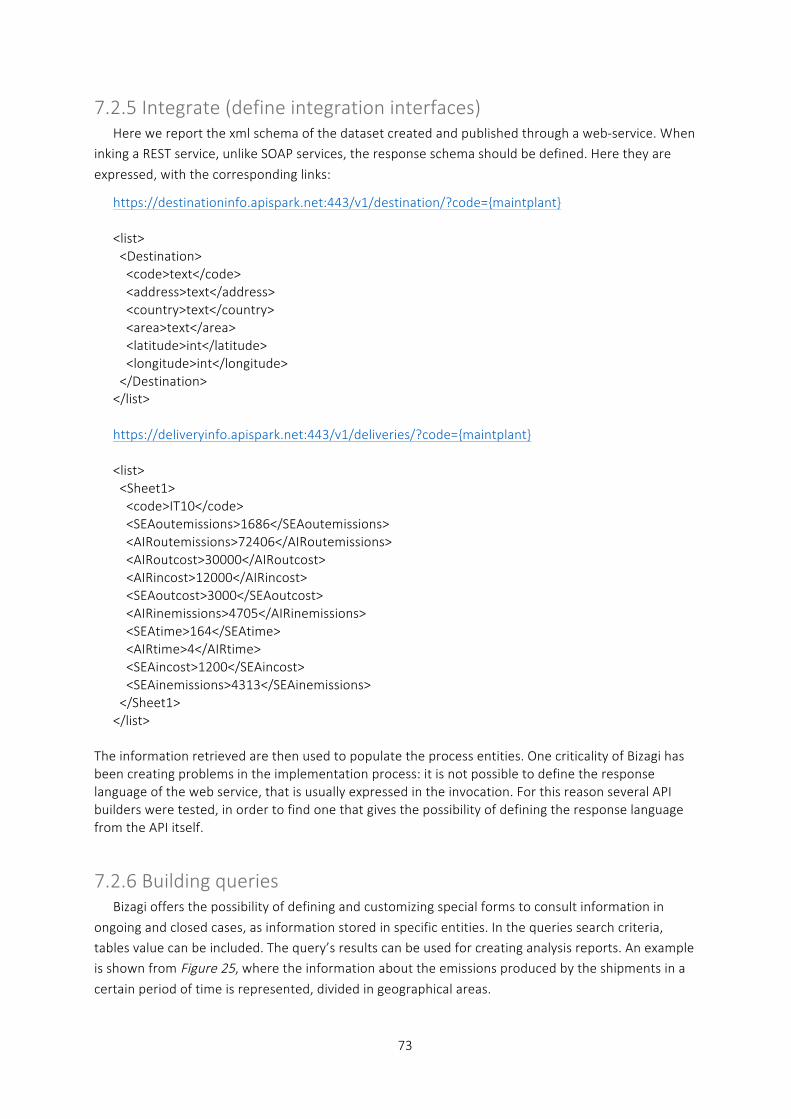
73
7.2.5 Integrate (define integration interfaces) Here we report the xml schema of the dataset created and published through a web-‐service. When
inking a REST service, unlike SOAP services, the response schema should be defined. Here they are
expressed, with the corresponding links:
https://destinationinfo.apispark.net:443/v1/destination/?code={maintplant} <list> <Destination> <code>text</code> <address>text</address> <country>text</country> <area>text</area> <latitude>int</latitude> <longitude>int</longitude> </Destination> </list>
https://deliveryinfo.apispark.net:443/v1/deliveries/?code={maintplant} <list> <Sheet1> <code>IT10</code> <SEAoutemissions>1686</SEAoutemissions> <AIRoutemissions>72406</AIRoutemissions> <AIRoutcost>30000</AIRoutcost> <AIRincost>12000</AIRincost> <SEAoutcost>3000</SEAoutcost> <AIRinemissions>4705</AIRinemissions> <SEAtime>164</SEAtime> <AIRtime>4</AIRtime> <SEAincost>1200</SEAincost> <SEAinemissions>4313</SEAinemissions> </Sheet1> </list>
The information retrieved are then used to populate the process entities. One criticality of Bizagi has been creating problems in the implementation process: it is not possible to define the response language of the web service, that is usually expressed in the invocation. For this reason several API builders were tested, in order to find one that gives the possibility of defining the response language from the API itself.
7.2.6 Building queries Bizagi offers the possibility of defining and customizing special forms to consult information in
ongoing and closed cases, as information stored in specific entities. In the queries search criteria, tables value can be included. The query’s results can be used for creating analysis reports. An example is shown from Figure 25, where the information about the emissions produced by the shipments in a
certain period of time is represented, divided in geographical areas.
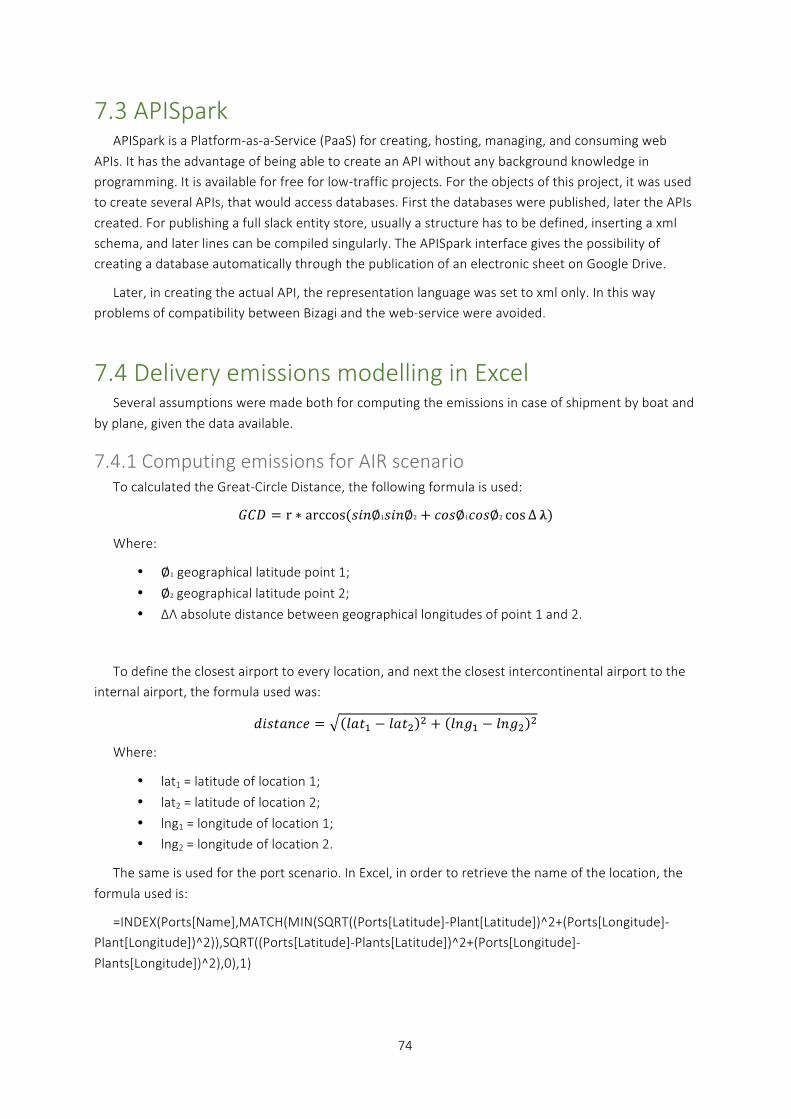
74
7.3 APISpark APISpark is a Platform-‐as-‐a-‐Service (PaaS) for creating, hosting, managing, and consuming web
APIs. It has the advantage of being able to create an API without any background knowledge in programming. It is available for free for low-‐traffic projects. For the objects of this project, it was used to create several APIs, that would access databases. First the databases were published, later the APIs
created. For publishing a full slack entity store, usually a structure has to be defined, inserting a xml schema, and later lines can be compiled singularly. The APISpark interface gives the possibility of creating a database automatically through the publication of an electronic sheet on Google Drive.
Later, in creating the actual API, the representation language was set to xml only. In this way problems of compatibility between Bizagi and the web-‐service were avoided.
7.4 Delivery emissions modelling in Excel Several assumptions were made both for computing the emissions in case of shipment by boat and
by plane, given the data available.
7.4.1 Computing emissions for AIR scenario To calculated the Great-‐Circle Distance, the following formula is used:
𝐺𝐶𝐷 = r ∗ arccos(𝑠𝑖𝑛∅1𝑠𝑖𝑛∅2 + 𝑐𝑜𝑠∅1𝑐𝑜𝑠∅2 cos∆ 𝛌)
Where:
• ∅1 geographical latitude point 1;
• ∅2 geographical latitude point 2;
• ∆Λ absolute distance between geographical longitudes of point 1 and 2.
To define the closest airport to every location, and next the closest intercontinental airport to the internal airport, the formula used was:
𝑑𝑖𝑠𝑡𝑎𝑛𝑐𝑒 = 𝑙𝑎𝑡! − 𝑙𝑎𝑡! ! + 𝑙𝑛𝑔! − 𝑙𝑛𝑔! !
Where:
• lat1 = latitude of location 1;
• lat2 = latitude of location 2;
• lng1 = longitude of location 1;
• lng2 = longitude of location 2.
The same is used for the port scenario. In Excel, in order to retrieve the name of the location, the
formula used is:
=INDEX(Ports[Name],MATCH(MIN(SQRT((Ports[Latitude]-‐Plant[Latitude])^2+(Ports[Longitude]-‐Plant[Longitude])^2)),SQRT((Ports[Latitude]-‐Plants[Latitude])^2+(Ports[Longitude]-‐
Plants[Longitude])^2),0),1)
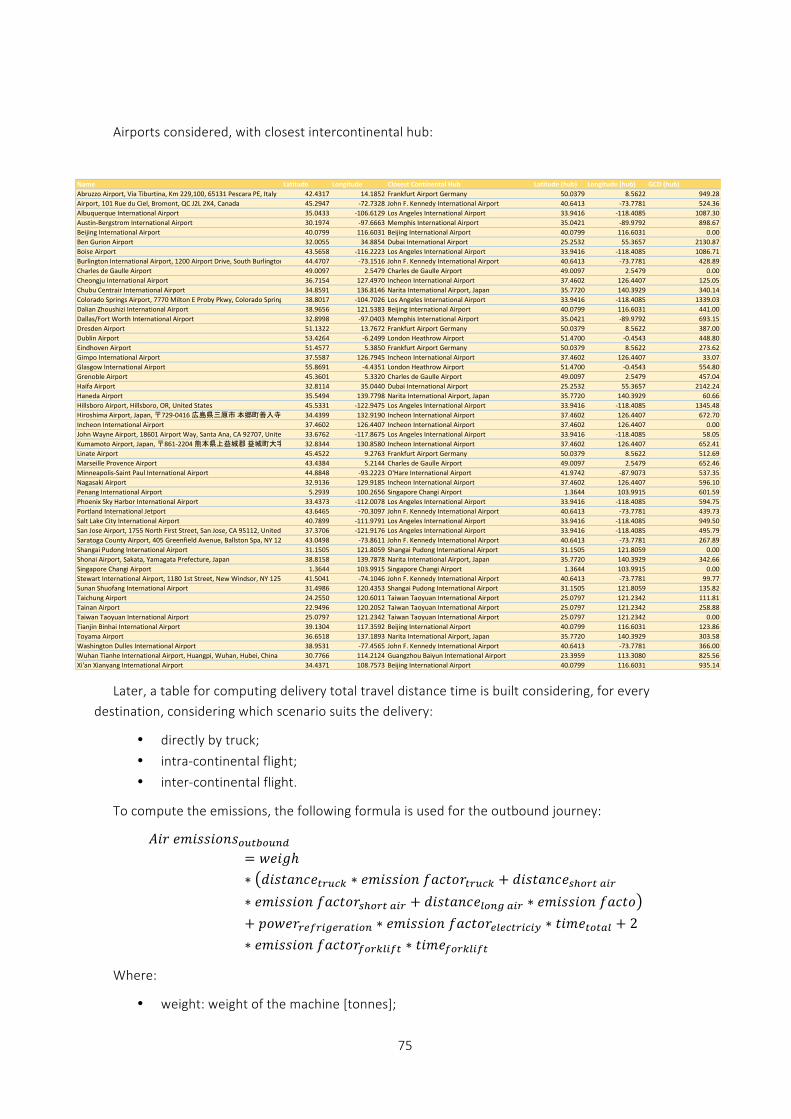
75
Airports considered, with closest intercontinental hub:
Later, a table for computing delivery total travel distance time is built considering, for every destination, considering which scenario suits the delivery:
• directly by truck;
• intra-‐continental flight;
• inter-‐continental flight.
To compute the emissions, the following formula is used for the outbound journey:
𝐴𝑖𝑟 𝑒𝑚𝑖𝑠𝑠𝑖𝑜𝑛𝑠!"#$!"%&= 𝑤𝑒𝑖𝑔ℎ∗ 𝑑𝑖𝑠𝑡𝑎𝑛𝑐𝑒!"#$% ∗ 𝑒𝑚𝑖𝑠𝑠𝑖𝑜𝑛 𝑓𝑎𝑐𝑡𝑜𝑟!"#$% + 𝑑𝑖𝑠𝑡𝑎𝑛𝑐𝑒!!!"# !"#∗ 𝑒𝑚𝑖𝑠𝑠𝑖𝑜𝑛 𝑓𝑎𝑐𝑡𝑜𝑟!!!"# !"# + 𝑑𝑖𝑠𝑡𝑎𝑛𝑐𝑒!"#$ !"# ∗ 𝑒𝑚𝑖𝑠𝑠𝑖𝑜𝑛 𝑓𝑎𝑐𝑡𝑜+ 𝑝𝑜𝑤𝑒𝑟!"#!$%"!&'$() ∗ 𝑒𝑚𝑖𝑠𝑠𝑖𝑜𝑛 𝑓𝑎𝑐𝑡𝑜𝑟!"!#$%&#&' ∗ 𝑡𝑖𝑚𝑒!"!#$ + 2∗ 𝑒𝑚𝑖𝑠𝑠𝑖𝑜𝑛 𝑓𝑎𝑐𝑡𝑜𝑟!"#$%&!' ∗ 𝑡𝑖𝑚𝑒!"#$%&!'
Where:
• weight: weight of the machine [tonnes];
Name Latitude Longitude Closest Continental Hub Latitude (hub) Longitude (hub) GCD (hub)Abruzzo Airport, Via Tiburtina, Km 229,100, 65131 Pescara PE, Italy 42.4317 14.1852 Frankfurt Airport Germany 50.0379 8.5622 949.28Airport, 101 Rue du Ciel, Bromont, QC J2L 2X4, Canada 45.2947 -‐72.7328 John F. Kennedy International Airport 40.6413 -‐73.7781 524.36Albuquerque International Airport 35.0433 -‐106.6129 Los Angeles International Airport 33.9416 -‐118.4085 1087.30Austin-‐Bergstrom International Airport 30.1974 -‐97.6663 Memphis International Airport 35.0421 -‐89.9792 898.67Beijing International Airport 40.0799 116.6031 Beijing International Airport 40.0799 116.6031 0.00Ben Gurion Airport 32.0055 34.8854 Dubai International Airport 25.2532 55.3657 2130.87Boise Airport 43.5658 -‐116.2223 Los Angeles International Airport 33.9416 -‐118.4085 1086.71Burlington International Airport, 1200 Airport Drive, South Burlington, VT 05403, United States44.4707 -‐73.1516 John F. Kennedy International Airport 40.6413 -‐73.7781 428.89Charles de Gaulle Airport 49.0097 2.5479 Charles de Gaulle Airport 49.0097 2.5479 0.00Cheongju International Airport 36.7154 127.4970 Incheon International Airport 37.4602 126.4407 125.05Chubu Centrair International Airport 34.8591 136.8146 Narita International Airport, Japan 35.7720 140.3929 340.14Colorado Springs Airport, 7770 Milton E Proby Pkwy, Colorado Springs, CO 80916, United States38.8017 -‐104.7026 Los Angeles International Airport 33.9416 -‐118.4085 1339.03Dalian Zhoushizi International Airport 38.9656 121.5383 Beijing International Airport 40.0799 116.6031 441.00Dallas/Fort Worth International Airport 32.8998 -‐97.0403 Memphis International Airport 35.0421 -‐89.9792 693.15Dresden Airport 51.1322 13.7672 Frankfurt Airport Germany 50.0379 8.5622 387.00Dublin Airport 53.4264 -‐6.2499 London Heathrow Airport 51.4700 -‐0.4543 448.80Eindhoven Airport 51.4577 5.3850 Frankfurt Airport Germany 50.0379 8.5622 273.62Gimpo International Airport 37.5587 126.7945 Incheon International Airport 37.4602 126.4407 33.07Glasgow International Airport 55.8691 -‐4.4351 London Heathrow Airport 51.4700 -‐0.4543 554.80Grenoble Airport 45.3601 5.3320 Charles de Gaulle Airport 49.0097 2.5479 457.04Haifa Airport 32.8114 35.0440 Dubai International Airport 25.2532 55.3657 2142.24Haneda Airport 35.5494 139.7798 Narita International Airport, Japan 35.7720 140.3929 60.66Hillsboro Airport, Hillsboro, OR, United States 45.5331 -‐122.9475 Los Angeles International Airport 33.9416 -‐118.4085 1345.48Hiroshima Airport, Japan, 〒729-‐0416 広島県三原市 本郷町善入寺64-‐31 34.4399 132.9190 Incheon International Airport 37.4602 126.4407 672.70Incheon International Airport 37.4602 126.4407 Incheon International Airport 37.4602 126.4407 0.00John Wayne Airport, 18601 Airport Way, Santa Ana, CA 92707, United States33.6762 -‐117.8675 Los Angeles International Airport 33.9416 -‐118.4085 58.05Kumamoto Airport, Japan, 〒861-‐2204 熊本県上益城郡 益城町大字小谷1802-‐232.8344 130.8580 Incheon International Airport 37.4602 126.4407 652.41Linate Airport 45.4522 9.2763 Frankfurt Airport Germany 50.0379 8.5622 512.69Marseille Provence Airport 43.4384 5.2144 Charles de Gaulle Airport 49.0097 2.5479 652.46Minneapolis-‐Saint Paul International Airport 44.8848 -‐93.2223 O'Hare International Airport 41.9742 -‐87.9073 537.35Nagasaki Airport 32.9136 129.9185 Incheon International Airport 37.4602 126.4407 596.10Penang International Airport 5.2939 100.2656 Singapore Changi Airport 1.3644 103.9915 601.59Phoenix Sky Harbor International Airport 33.4373 -‐112.0078 Los Angeles International Airport 33.9416 -‐118.4085 594.75Portland International Jetport 43.6465 -‐70.3097 John F. Kennedy International Airport 40.6413 -‐73.7781 439.73Salt Lake City International Airport 40.7899 -‐111.9791 Los Angeles International Airport 33.9416 -‐118.4085 949.50San Jose Airport, 1755 North First Street, San Jose, CA 95112, United States 37.3706 -‐121.9176 Los Angeles International Airport 33.9416 -‐118.4085 495.79Saratoga County Airport, 405 Greenfield Avenue, Ballston Spa, NY 12020, United States43.0498 -‐73.8611 John F. Kennedy International Airport 40.6413 -‐73.7781 267.89Shangai Pudong International Airport 31.1505 121.8059 Shangai Pudong International Airport 31.1505 121.8059 0.00Shonai Airport, Sakata, Yamagata Prefecture, Japan 38.8158 139.7878 Narita International Airport, Japan 35.7720 140.3929 342.66Singapore Changi Airport 1.3644 103.9915 Singapore Changi Airport 1.3644 103.9915 0.00Stewart International Airport, 1180 1st Street, New Windsor, NY 12553, United States41.5041 -‐74.1046 John F. Kennedy International Airport 40.6413 -‐73.7781 99.77Sunan Shuofang International Airport 31.4986 120.4353 Shangai Pudong International Airport 31.1505 121.8059 135.82Taichung Airport 24.2550 120.6011 Taiwan Taoyuan International Airport 25.0797 121.2342 111.81Tainan Airport 22.9496 120.2052 Taiwan Taoyuan International Airport 25.0797 121.2342 258.88Taiwan Taoyuan International Airport 25.0797 121.2342 Taiwan Taoyuan International Airport 25.0797 121.2342 0.00Tianjin Binhai International Airport 39.1304 117.3592 Beijing International Airport 40.0799 116.6031 123.86Toyama Airport 36.6518 137.1893 Narita International Airport, Japan 35.7720 140.3929 303.58Washington Dulles International Airport 38.9531 -‐77.4565 John F. Kennedy International Airport 40.6413 -‐73.7781 366.00Wuhan Tianhe International Airport, Huangpi, Wuhan, Hubei, China 30.7766 114.2124 Guangzhou Baiyun International Airport 23.3959 113.3080 825.56Xi'an Xianyang International Airport 34.4371 108.7573 Beijing International Airport 40.0799 116.6031 935.14
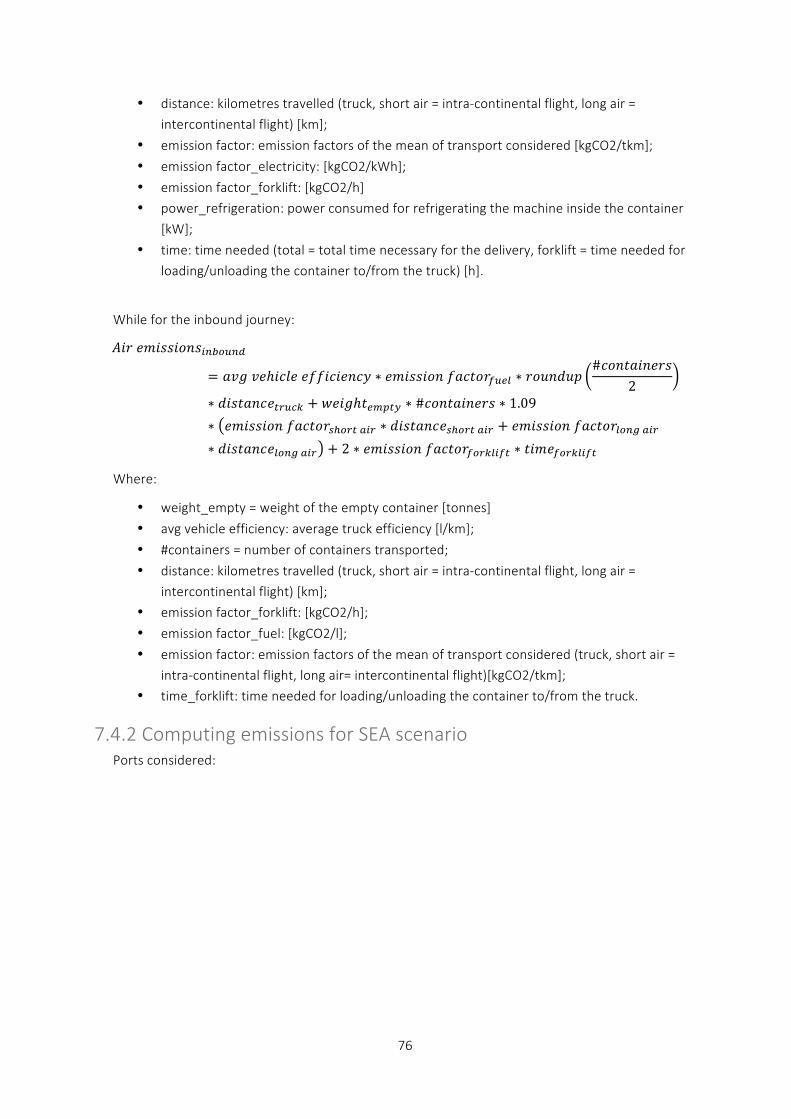
76
• distance: kilometres travelled (truck, short air = intra-‐continental flight, long air =
intercontinental flight) [km];
• emission factor: emission factors of the mean of transport considered [kgCO2/tkm];
• emission factor_electricity: [kgCO2/kWh];
• emission factor_forklift: [kgCO2/h]
• power_refrigeration: power consumed for refrigerating the machine inside the container
[kW];
• time: time needed (total = total time necessary for the delivery, forklift = time needed for
loading/unloading the container to/from the truck) [h].
While for the inbound journey:
𝐴𝑖𝑟 𝑒𝑚𝑖𝑠𝑠𝑖𝑜𝑛𝑠!"#$%!"
= 𝑎𝑣𝑔 𝑣𝑒ℎ𝑖𝑐𝑙𝑒 𝑒𝑓𝑓𝑖𝑐𝑖𝑒𝑛𝑐𝑦 ∗ 𝑒𝑚𝑖𝑠𝑠𝑖𝑜𝑛 𝑓𝑎𝑐𝑡𝑜𝑟!"#$ ∗ 𝑟𝑜𝑢𝑛𝑑𝑢𝑝#𝑐𝑜𝑛𝑡𝑎𝑖𝑛𝑒𝑟𝑠
2∗ 𝑑𝑖𝑠𝑡𝑎𝑛𝑐𝑒!"#$% + 𝑤𝑒𝑖𝑔ℎ𝑡!"#$% ∗ #𝑐𝑜𝑛𝑡𝑎𝑖𝑛𝑒𝑟𝑠 ∗ 1.09∗ 𝑒𝑚𝑖𝑠𝑠𝑖𝑜𝑛 𝑓𝑎𝑐𝑡𝑜𝑟!!!"# !"# ∗ 𝑑𝑖𝑠𝑡𝑎𝑛𝑐𝑒!!!"# !"# + 𝑒𝑚𝑖𝑠𝑠𝑖𝑜𝑛 𝑓𝑎𝑐𝑡𝑜𝑟!"#$ !"#∗ 𝑑𝑖𝑠𝑡𝑎𝑛𝑐𝑒!"#$ !"# + 2 ∗ 𝑒𝑚𝑖𝑠𝑠𝑖𝑜𝑛 𝑓𝑎𝑐𝑡𝑜𝑟!"#$%&!' ∗ 𝑡𝑖𝑚𝑒!"#$%&!'
Where:
• weight_empty = weight of the empty container [tonnes]
• avg vehicle efficiency: average truck efficiency [l/km];
• #containers = number of containers transported;
• distance: kilometres travelled (truck, short air = intra-‐continental flight, long air =
intercontinental flight) [km];
• emission factor_forklift: [kgCO2/h];
• emission factor_fuel: [kgCO2/l];
• emission factor: emission factors of the mean of transport considered (truck, short air =
intra-‐continental flight, long air= intercontinental flight)[kgCO2/tkm];
• time_forklift: time needed for loading/unloading the container to/from the truck.
7.4.2 Computing emissions for SEA scenario Ports considered:
77
In the calculations of the emissions produced in case the delivery happens by sea,
• directly by truck;
• by container vessel.
For the outbound journey:
𝑆𝑒𝑎 𝑒𝑚𝑖𝑠𝑠𝑖𝑜𝑛𝑠!"#$!"%&= 𝑤𝑒𝑖𝑔ℎ𝑡∗ 𝑑𝑖𝑠𝑡𝑎𝑛𝑐𝑒!"#$% ∗ 𝑒𝑚𝑖𝑠𝑠𝑖𝑜𝑛 𝑓𝑎𝑐𝑡𝑜𝑟!"#$% + 𝑑𝑖𝑠𝑡𝑎𝑛𝑐𝑒!"##"$∗ 𝑒𝑚𝑖𝑠𝑠𝑖𝑜𝑛 𝑓𝑎𝑐𝑡𝑜𝑟!"##"$ + 𝑡𝑖𝑚𝑒!"!#$ ∗ 𝑝𝑜𝑤𝑒𝑟!"#!$%"!&'$()∗ 𝑒𝑚𝑖𝑠𝑠𝑖𝑜𝑛 𝑓𝑎𝑐𝑡𝑜𝑟!"!"#$%"%#& + 2 ∗ 𝑒𝑚𝑖𝑠𝑠𝑖𝑜𝑛𝑠!"#$ !"#$%&'!() + 𝑒𝑚𝑖𝑠𝑠𝑖𝑜𝑛𝑠!"#$%&!'∗ 𝑡𝑖𝑚𝑒!"#$%&!'
Where:
• weight: weight of the machine [tonnes];
• distance: kilometres travelled (truck, vessel) [km];
Country Name Latitude LongitudeBE Port of Antwerpen 51.2700 4.3367DE Port of Hamburg, Hamburg 53.5233 9.9389FR Port of Marseille 43.2944 5.3678FR Gran Port Maritime de Rouen 49.4439 1.1033HK Shanghai International Port 31.2464 121.4957HK Wuhan Port International 30.5931 114.3054HK Port of Tianjin 38.9822 117.7462HK Port of Wuxi 32.1234 120.0627HK Beiliang Port, Jinzhou, Dalian 39.0505 121.7828IE Dublin Port 53.3511 -‐6.2145IL Port of Ashdod, Ashdod 31.8239 34.6471IL Port of Haifa 32.8250 35.0003IT Civitavecchia Port, Italy 42.1062 11.7757IT Port of Genova 44.4028 8.9167JP Kobe Port Tower 34.6826 135.1867JP Port of Nagasaki 41.1783 -‐8.6443JP Tokyo Port 35.6176 139.7786JP Jinzu-‐gawa Toyama, Japan 36.7500 137.2167JP Hiroshima, Hiroshima Prefecture, Japan 34.3852 132.4553JP Akita, Akita Prefecture, Japan 39.7200 140.1026JP Yatsushiro, Yatsushiro Prefecture, Japan 32.5074 130.6017JP Nagasaki, Nagasaki Prefecture, Japan 32.7503 129.8777KR Port of Inchon 37.5587 126.7945KR Port of Masan 24.8208 66.9945MY Port of Penang, Penang 5.4191 100.3447NL Port of Rotterdam, Rotterdam 51.9555 4.4399SG Port of Singapore 1.2506 103.8208TW Port of Taichung, Taiwan 24.2875 120.5121TW Port of Kaohsiung, Kaohsiung 22.5746 120.3448UK Liverpool Waterfront 53.4043 -‐2.9950UK Port of South Schields, UK 54.9790 -‐1.4452US Port of Tacoma, Tacoma 47.2655 -‐122.4123US Port of Los Angeles 33.7215 -‐118.2439US Port of New York 43.1802 -‐70.6077US Duluth Seaway Port 46.7573 -‐92.1017US Port of San Francisco, US 37.7970 -‐122.3952US Port of San Diego, US 32.7338 -‐117.1933US Port of Houston Authority, 111 east loop N, Houston, TX 77029 29.7300 -‐95.2724US Port of Miami 25.7787 -‐80.1780CA Port of Montreal, Montreal, QC H1V, Canada 45.547 -‐73.53
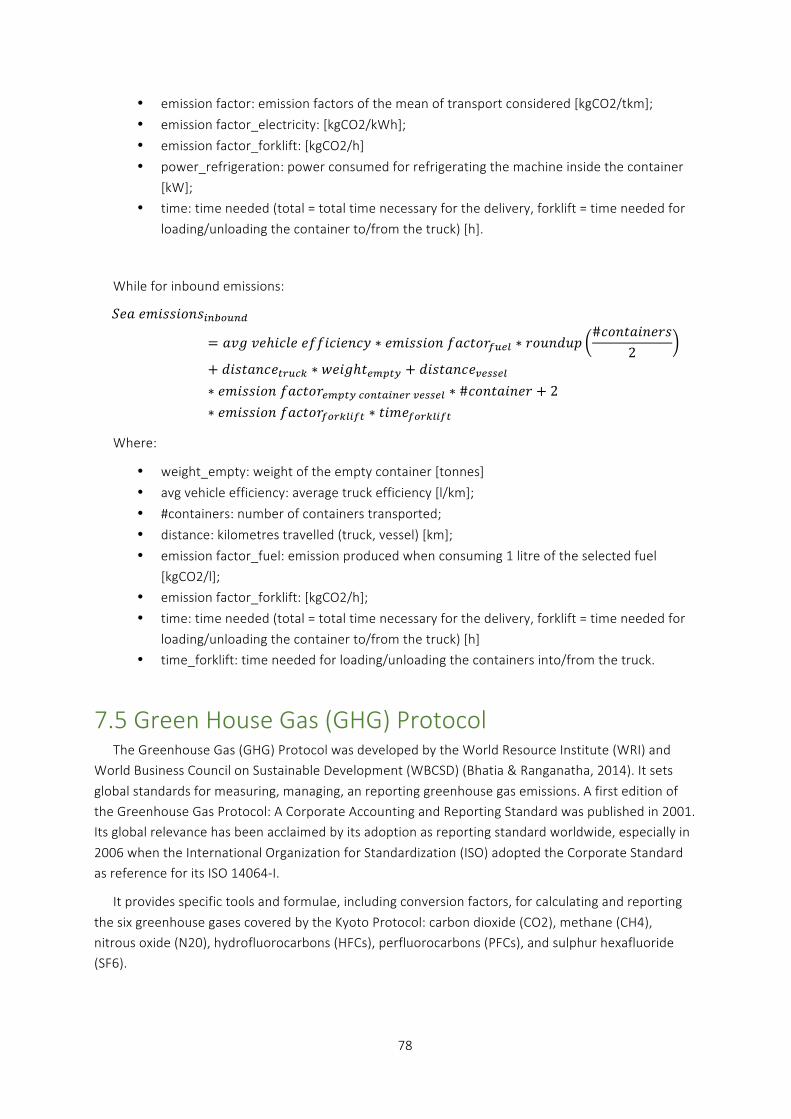
78
• emission factor: emission factors of the mean of transport considered [kgCO2/tkm];
• emission factor_electricity: [kgCO2/kWh];
• emission factor_forklift: [kgCO2/h]
• power_refrigeration: power consumed for refrigerating the machine inside the container
[kW];
• time: time needed (total = total time necessary for the delivery, forklift = time needed for
loading/unloading the container to/from the truck) [h].
While for inbound emissions:
𝑆𝑒𝑎 𝑒𝑚𝑖𝑠𝑠𝑖𝑜𝑛𝑠!"#$%"&
= 𝑎𝑣𝑔 𝑣𝑒ℎ𝑖𝑐𝑙𝑒 𝑒𝑓𝑓𝑖𝑐𝑖𝑒𝑛𝑐𝑦 ∗ 𝑒𝑚𝑖𝑠𝑠𝑖𝑜𝑛 𝑓𝑎𝑐𝑡𝑜𝑟!"#$ ∗ 𝑟𝑜𝑢𝑛𝑑𝑢𝑝#𝑐𝑜𝑛𝑡𝑎𝑖𝑛𝑒𝑟𝑠
2+ 𝑑𝑖𝑠𝑡𝑎𝑛𝑐𝑒!"#$% ∗ 𝑤𝑒𝑖𝑔ℎ𝑡!"#$% + 𝑑𝑖𝑠𝑡𝑎𝑛𝑐𝑒!"##"$∗ 𝑒𝑚𝑖𝑠𝑠𝑖𝑜𝑛 𝑓𝑎𝑐𝑡𝑜𝑟!"#$% !"#$%&#'( !!""!# ∗ #𝑐𝑜𝑛𝑡𝑎𝑖𝑛𝑒𝑟 + 2∗ 𝑒𝑚𝑖𝑠𝑠𝑖𝑜𝑛 𝑓𝑎𝑐𝑡𝑜𝑟!"#$%&!' ∗ 𝑡𝑖𝑚𝑒!"#$%&!'
Where:
• weight_empty: weight of the empty container [tonnes]
• avg vehicle efficiency: average truck efficiency [l/km];
• #containers: number of containers transported;
• distance: kilometres travelled (truck, vessel) [km];
• emission factor_fuel: emission produced when consuming 1 litre of the selected fuel
[kgCO2/l];
• emission factor_forklift: [kgCO2/h];
• time: time needed (total = total time necessary for the delivery, forklift = time needed for
loading/unloading the container to/from the truck) [h]
• time_forklift: time needed for loading/unloading the containers into/from the truck.
7.5 Green House Gas (GHG) Protocol The Greenhouse Gas (GHG) Protocol was developed by the World Resource Institute (WRI) and
World Business Council on Sustainable Development (WBCSD) (Bhatia & Ranganatha, 2014). It sets
global standards for measuring, managing, an reporting greenhouse gas emissions. A first edition of the Greenhouse Gas Protocol: A Corporate Accounting and Reporting Standard was published in 2001. Its global relevance has been acclaimed by its adoption as reporting standard worldwide, especially in
2006 when the International Organization for Standardization (ISO) adopted the Corporate Standard as reference for its ISO 14064-‐I.
It provides specific tools and formulae, including conversion factors, for calculating and reporting
the six greenhouse gases covered by the Kyoto Protocol: carbon dioxide (CO2), methane (CH4), nitrous oxide (N20), hydrofluorocarbons (HFCs), perfluorocarbons (PFCs), and sulphur hexafluoride (SF6).
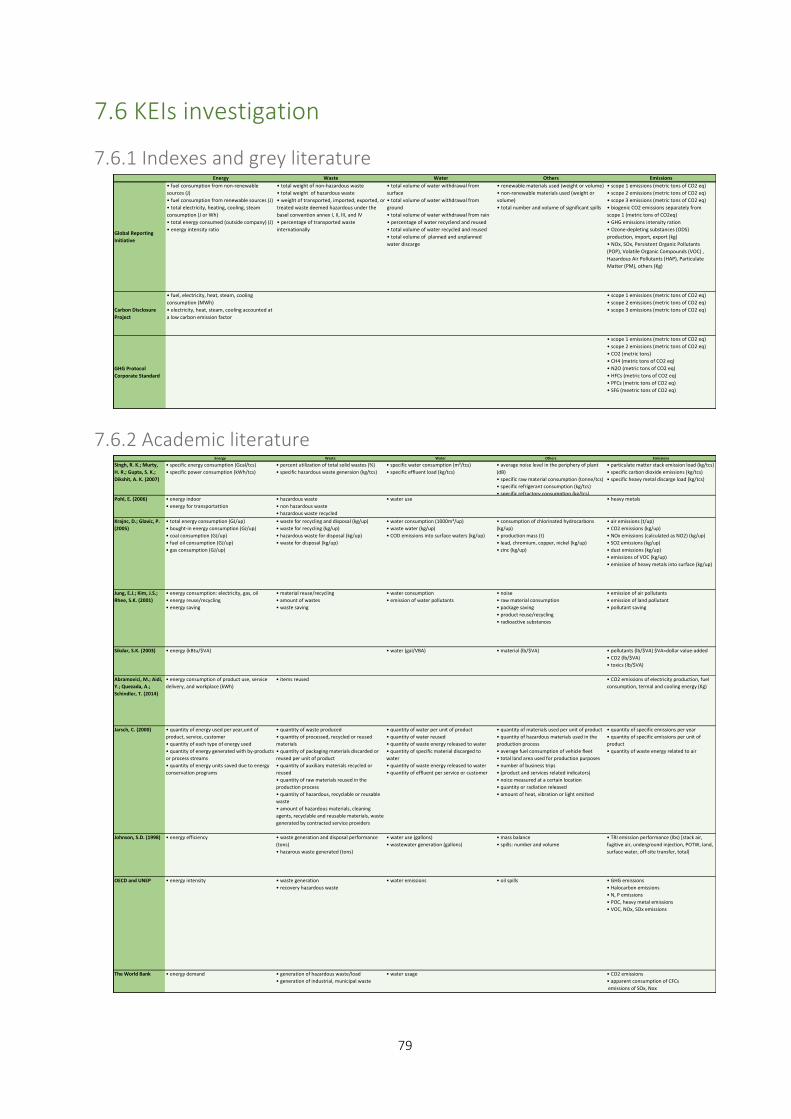
79
7.6 KEIs investigation
7.6.1 Indexes and grey literature
7.6.2 Academic literature
Energy Waste Water Others Emissions
Global Reporting Initiative
• fuel consumption from non-‐renewable sources (J)• fuel consumption from renewable sources (J)• total electricity, heating, cooling, steam consumption (J or Wh) • total energy consumed (outside company) (J)• energy intensity ratio
• total weight of non-‐hazardous waste• total weight of hazardous waste• weight of transported, imported, exported, or treated waste deemed hazardous under the basel convention annex I, II, III, and IV• percentage of transported waste internationally
• total volume of water withdrawal from surface• total volume of water withdrawal from ground• total volume of water withdrawal from rain• percentage of water recyclend and reused• total volume of water recycled and reused• total volume of planned and unplanned water discarge
• renewable materials used (weight or volume)• non-‐renewable materials used (weight or volume)• total number and volume of significant spills
• scope 1 emissions (metric tons of CO2 eq)• scope 2 emissions (metric tons of CO2 eq)• scope 3 emissions (metric tons of CO2 eq)• biogenic CO2 emissions separately from scope 1 (metric tons of CO2eq)• GHG emissions intensity ration• Ozone-‐depleting substances (ODS) production, import, export (kg)• NOx, SOx, Persistent Organic Pollutants (POP), Volatile Organic Compounds (VOC) , Hazardous Air Pollutants (HAP), Particulate Matter (PM), others (Kg)
Carbon Disclosure Project
• fuel, electricity, heat, steam, cooling consumption (MWh)• electricity, heat, steam, cooling accounted at a low carbon emission factor
• scope 1 emissions (metric tons of CO2 eq)• scope 2 emissions (metric tons of CO2 eq)• scope 3 emissions (metric tons of CO2 eq)
GHG Protocol Corporate Standard
• scope 1 emissions (metric tons of CO2 eq)• scope 2 emissions (metric tons of CO2 eq)• CO2 (metric tons)• CH4 (metric tons of CO2 eq)• N2O (metric tons of CO2 eq)• HFCs (metric tons of CO2 eq)• PFCs (metric tons of CO2 eq)• SF6 (meetric tons of CO2 eq)
Energy Waste Water Others Emissions
Singh, R. K.; Murty, H. R.; Gupta, S. K.; Dikshit, A. K. (2007)
• specific energy consumption (Gcal/tcs)• specific power consumption (kWh/tcs)
• percent utilization of total solid wastes (%)• specific hazardous waste generaion (kg/tcs)
• specific water consumption (m³/tcs)• specific effluent load (kg/tcs)
• average noise level in the periphery of plant (dB)• specific raw material consumption (tonne/tcs)• specific refrigerant consumption (kg/tcs)• specific refractory consumption (kg/tcs)
• particulate matter stack emission load (kg/tcs)• specific carbon dioxide emissions (kg/tcs)• specific heavy metal discarge load (kg/tcs)
Pohl, E. (2006) • energy indoor• energy for transportattion
• hazardous waste• non hazardous waste• hazardous waste recycled• non hazardous waste recycled
• water use • heavy metals
Krajnc, D.; Glavic, P. (2005)
• total energy consumption (GJ/up)• bought-‐in energy consumption (GJ/up)• coal consumption (GJ/up)• fuel oil consumption (GJ/up)• gas consumption (GJ/up)
• waste for recycling and disposal (kg/up)• waste for recycling (kg/up)• hazardous waste for disposal (kg/up)• waste for disposal (kg/up)
• water consumption (1000m³/up)• waste water (kg/up)• COD emissions into surface waters (kg/up)
• consumption of chlorinated hydrocarbons (kg/up)• production mass (t)• lead, chromium, copper, nickel (kg/up)• zinc (kg/up)
• air emissions (t/up)• CO2 emissions (kg/up)• NOx emissions (calculated as NO2) (kg/up)• SO2 emissions (kg/up)• dust emissions (kg/up)• emissions of VOC (kg/up)• emission of heavy metals into surface (kg/up)
Jung, E.J.; Kim, J.S.; Rhee, S.K. (2001)
• energy consumption: electricity, gas, oil• energy reuse/recycling• energy saving
• material reuse/recycling• amount of wastes• waste saving
• water consumption• emission of water pollutants
• noise• raw material consumption• package saving• product reuse/recycling• radioactive substances
• emission of air pollutants• emission of land pollutant• pollutant saving
Sikdar, S.K. (2003) • energy (kBtu/$VA) • water (gal/VBA) • material (lb/$VA) • pollutants (lb/$VA) $VA=dollar value-‐added• CO2 (lb/$VA)• toxics (lb/$VA)
Abramovici, M.; Aidi, Y.; Quezada, A.; Schindler, T. (2014)
• energy consumption of product use, service delivery, and workplace (kWh)
• items reused • CO2 emissions of electricity production, fuel consumption, termal and cooling energy (Kg)
Jarsch, C. (2000) • quantity of energy used per year,unit of product, service, customer• quantity of each type of energy used• quantity of energy generated with by-‐products or process streams• quantity of energy units saved due to energy conservation programs
• quantity of waste produced• quantity of processed, recycled or reused materials• quantity of packaging materials discarded or reused per unit of product• quantity of auxiliary materials recycled or reused• quantity of raw materials reused in the production process• quantity of hazardous, recyclable or reusable waste• amount of hazardous materials, cleaning agents, recyclable and reusable materials, waste generated by contracted service providers
• quantity of water per unit of product• quantity of water reused• quantity of waste energy released to water• quantity of specific material discarged to water• quantity of waste energy released to water• quantity of effluent per service or customer
• quantity of materials used per unit of product• quantity of hazardous materials used in the production process• average fuel consumption of vehicle fleet• total land area used for production purposes• number of business trips• (product and services related indicators)• noice measured at a certain location• quantity or radiation released• amount of heat, vibration or light emitted
• quantity of specific emissions per year• quantity of specific emissions per unit of product• quantity of waste energy related to air
Johnson, S.D. (1998) • energy efficiency • waste generation and disposal performance (tons)• hazarous waste generated (tons)
• water use (gallons)• wastewater generation (gallons)
• mass balance• spills: number and volume
• TRI emission performance (lbs) [stack air, fugitive air, underground injection, POTW, land, surface water, off-‐site transfer, total)
OECD and UNEP • energy intensity • waste generation• recovery hazardous waste
• water emissions • oil spills • GHG emissions• Halocarbon emissions• N, P emissions• POC, heavy metal emissions• VOC, NOx, SOx emissions
The World Bank • energy demand • generation of hazardous waste/load• generation of industrial, municipal waste
• water usage • CO2 emissions• apparent consumption of CFCs emissions of SOx, Nox• N, P emissions