Embed Size (px)
Citation preview
Master’s DissertationEngineering
Acoustics
Report TVBA
-5061O
LIVER O
LSSON A
COU
STIC PERFORM
AN
CE OF TIM
BER VO
LUM
E ELEMEN
TS
OLIVER OLSSON
ACOUSTIC PERFORMANCE OF TIMBER VOLUME ELEMENTS

DEPARTMENT OF CONSTRUCTION SCIENCES
DIVISION OF ENGINEERING ACOUSTICS
ISRN LUTVDG/TVBA--20/5061--SE (1-68) | ISSN 0281-8477
MASTER’S DISSERTATION
Supervisor: DELPHINE BARD, Associate Professor, Div. of Engineering Acoustics, LTH, Lund. Assistant Supervisor: Dr NIKOLAOS-GEORGIOS VARDAXIS, Div. of Engineering Acoustics, LTH, Lund.
Examiner: Dr ERLING NILSSON, Div. of Engineering Acoustics, LTH, Lund.
Copyright © 2020 by Division of Engineering Acoustics,Faculty of Engineering LTH, Lund University, Sweden.
Printed by V-husets tryckeri LTH, Lund, Sweden, June 2020 (Pl).
For information, address:Division of Engineering Acoustics,
Faculty of Engineering LTH, Lund University, Box 118, SE-221 00 Lund, Sweden.
Homepage: www.akustik.lth.se
OLIVER OLSSON
ACOUSTIC PERFORMANCE OF TIMBER VOLUME ELEMENTS

I
Abstract The thesis investigates the acoustic performance of light weight timber constructions known as timber volume elements and vibration insulation methods employed in these. Common materials used in light weight timber floor constructions and different floor configurations consisting of these materials were also studied. The study consists of impact sound and air-borne sound insulation measurements performed on a cross laminated timber floor in laboratory and two vertically adjacent timber volume elements in factory conditions. This thesis finds that even though elastomer intermediate layers perform better than wood based intermediate layers, especially for higher frequencies. The increase in acoustic performance provided by utilizing elastomer based intermediate layers is not that high if compared to the increased financial costs it brings. From the measurements performed in factory conditions it is concluded that the tested timber volume elements can reach sound classes up to sound class B for impact sound insulation and sound class D for air-borne sound insulation. Air-borne sound insulation did not satisfy requirements for sound class C and therefore limited the overall grade of the timber volume elements. This was however a result of leakage produced by a poor seal on the door of the sending room. With small efforts the grade of most factory configurations could be upgraded to sound class C. Furthermore it is concluded that for the floor configurations measured in laboratory, the addition of mass provided by the different material layers is the greatest contribution factor to increased acoustic performance. Key words: Impact sound insulation, Air-borne sound insulation, Cross laminated timber, CLT, Timber Volume Element, Vibration Insulation

III
Foreword and acknowledgements This report was written by the author to complement theoretical knowledge acquired during his time at LTH with practical knowledge and to learn more of the basics of the acoustician profession and measurement techniques used by acousticians. The project commenced in December 2019 and was presented in the beginning of June 2020. The main focus of the report was the acoustic performance of Timber Volume Elements. The acoustic performance of timber construction elements such as cross laminated timber slabs and other non-timber building elements that are commonly used to construct Timber Volume Elements was also examined. Measurements were performed in the acoustics laboratory at LTH and in factory conditions in Älvängen, Sweden. First of all I want to express my great gratitude to my supervisor Nikolas-Georgios Vardaxis for his continuous support and knowledge. And for always bringing me back to the ground when I got lost in the mass of information available to a new acoustician. I also want to express my appreciation to Delphine Bard and Klas Hagberg for making this thesis possible and for allowing me to perform so many measurements on such interesting cases. I also want to thank Delphine Bard yet again for pointing me in the right direction during my time at LTH.

V
Table of Contents
Abstract .............................................................................................................................. I
Foreword and acknowledgements .................................................................................... III
1 Introduction ............................................................................................................... 1
1.1 Background ................................................................................................................... 1
1.2 Light-weight timber constructions and CLT .................................................................... 2
1.3 Objective ....................................................................................................................... 4
1.4 The study case ............................................................................................................... 5
1.5 Methodology ................................................................................................................. 6
2 Theory ........................................................................................................................ 7
2.1 Sound and vibrations ..................................................................................................... 7
2.2 Harmonic waves ............................................................................................................ 8
2.3 SDOF systems ................................................................................................................ 8
2.4 Impedance .................................................................................................................. 10
2.5 Sound and vibrations in fluids and solids ..................................................................... 11
2.6 Air-borne sound .......................................................................................................... 12 2.6.1 Sound reduction index, R .............................................................................................................. 13 2.6.2 Normalized level difference, Dn .................................................................................................... 14 2.6.3 Standardized level difference: Air-borne sound, 𝐷′𝑛𝑇 ................................................................. 14 2.6.4 Weighted sound reduction index, Rw ........................................................................................... 15 2.6.5 Spectrum adaptation term for air-borne sound, C 50-3150 .............................................................. 15
2.7 Structure-borne sound ................................................................................................ 17 2.7.1 Normalized impact sound level, 𝐿𝑛 .............................................................................................. 18 2.7.2 Standardized level difference: Impact sound, 𝐿′𝑛𝑇 ..................................................................... 18 2.7.3 Weighted impact sound reduction index, Lw ................................................................................ 19 2.7.4 Spectrum adaptation term for impact sound, CI,50-2500 ................................................................. 19
2.8 Evaluation of acoustic performance: regulations and sound classes ............................. 20
2.9 Reverberation time, 𝑻𝟔𝟎 ............................................................................................. 21 2.9.1 Equivalent absorption area ........................................................................................................... 22
2.10 General ....................................................................................................................... 23 2.10.1 Pink Noise ................................................................................................................................ 23 2.10.2 Octave bands and third-octave bands (Cremer & Heckl, 1973) ............................................... 23 2.10.3 Loudness level and weighted sound pressure levels ............................................................... 23 2.10.4 Standing waves in rectangular rooms ...................................................................................... 25 2.10.5 Diffuse field conditions ............................................................................................................ 26 2.10.6 Critical frequency ..................................................................................................................... 26
3 Measurement procedures ........................................................................................ 27
VI
3.1 Reverberation time ..................................................................................................... 27 3.1.1 General ......................................................................................................................................... 27 3.1.2 Measurement procedure: Reverberation time ............................................................................ 28
3.2 Air-borne sound insulation .......................................................................................... 29 3.2.1 General ......................................................................................................................................... 29 3.2.2 Measurement procedure: Air-borne sound insulation ................................................................. 29
3.3 Impact sound insulation .............................................................................................. 32 3.3.1 General ......................................................................................................................................... 32 3.3.2 Measurement procedure: Impact sound insulation ..................................................................... 32
4 Implementation ....................................................................................................... 35
4.1 Laboratory measurements at Lund University ............................................................. 35
4.2 Measurements of timber volume elements in factory conditions ................................ 38
5 Results ..................................................................................................................... 43
5.1 Cross Laminated Timber floor in laboratory with different coverings ........................... 43
5.2 Measurements of Timber Volume Elements ................................................................ 48
5.3 Timber volume element bare CLT floor compared to laboratory bare CLT floor ............ 51
6 Discussion ................................................................................................................ 53
6.1 Lab CLT floor with different coverings and how they affect measurements .................. 53
6.2 Difference in acoustic performance in timber volume elements for elastomer and wood based intermediate layers ....................................................................................................... 53
6.3 Comparison of Timber volume element CLT floor and laboratory CLT floor .................. 54
6.4 Summary ..................................................................................................................... 55
7 Improvements .......................................................................................................... 57
8 Further studies ......................................................................................................... 59
9 Bibliography ............................................................................................................. 61
10 Annex ................................................................................................................... 63
10.1 Annex A: Timber Volume Element ............................................................................... 63
10.2 Annex B: Floating Floor ................................................................................................ 64
10.3 Annex C: Laboratory Measurement Setup, LTH ............................................................ 65
10.4 Annex D: Factory measurement setup, Älvängen ......................................................... 66
10.5 Annex E: Intermediate Layers, Factory conditions, Älvängen ....................................... 67
1
1 Introduction 1.1 Background Timber has long been one of the main construction materials but with the rise of modern society and the creation and densification of urban environments timber has been phased out in favor of construction materials that pose less of a fire hazard. As of 1994 new legislation set by Boverket (Boverket, 1994) allows the construction of multi-story buildings utilizing timber in the load bearing structure in Sweden. Before 1994 load bearing structures made of timber were not allowed in multi-story buildings because of the fire hazard it posed. In the light of new fire resistant treatments of timber and modern construction technology this is no longer the case. Because of this new legislation research on timber construction technologies has risen substantially in universities, research centers and the private industry (Vardaxis, 2014). New research together with harder environmental legislation and financial incentive has increased the use of timber as a load bearing construction material and many multi-storey buildings consisting of timber based material have been produced as of late. One of the favored construction methods for timber based multi-storey structures is a modular approach where CLT plates are used to form light and sturdy timber volume elements. These modules can then be arranged in different ways to achieve the preferred purpose of the building (Svenskt trä, 2017). Vibration reduction linings, commonly consisting of different types of elastomer are usually implemented between adjacent timber volume elements. Satisfactory load transfer between construction elements in multi-storey buildings require stiff connections. For great acoustic performance the transfer of vibrations between construction elements needs to be halted, calling for decoupling of elements. This creates a conflict between structural design and acoustics which requires innovative solutions. A lack of experience and precedence in timber construction has led to issues with acoustic performance in multi-story housing apartments. Older standardizations for determining acoustic performance fail to encompass the differences between timber and construction materials subjected to more research such as concrete, which can lead to unsatisfactory sound insulation in timber constructions. The heavy mass of concrete construction elements leads to issues with higher frequency vibrations, large amount of research and practice has led to many standardized solutions to achieve satisfactory acoustic performance in concrete buildings (Negreira, 2016). This has yielded classifications where performance at low frequencies are neglected. The usual spectrum for analysis in building acoustics lies between 100-3150 hz. In Sweden this spectrum has been widened to 50-3150 Hz. As of today Sweden is the only country where acoustic performance is evaluated below 100 Hz (Hagberg, 2018). The light-weight nature of timber makes it more susceptible to excitation sources that create vibrations in the lower frequency spectrum e.g. human foot fall than heavy-weight construction materials. This property is one of the main challenges to achieving good acoustic performance in multi-storey timber structures. (Negreira, 2016) (Hagberg, 2018)
2
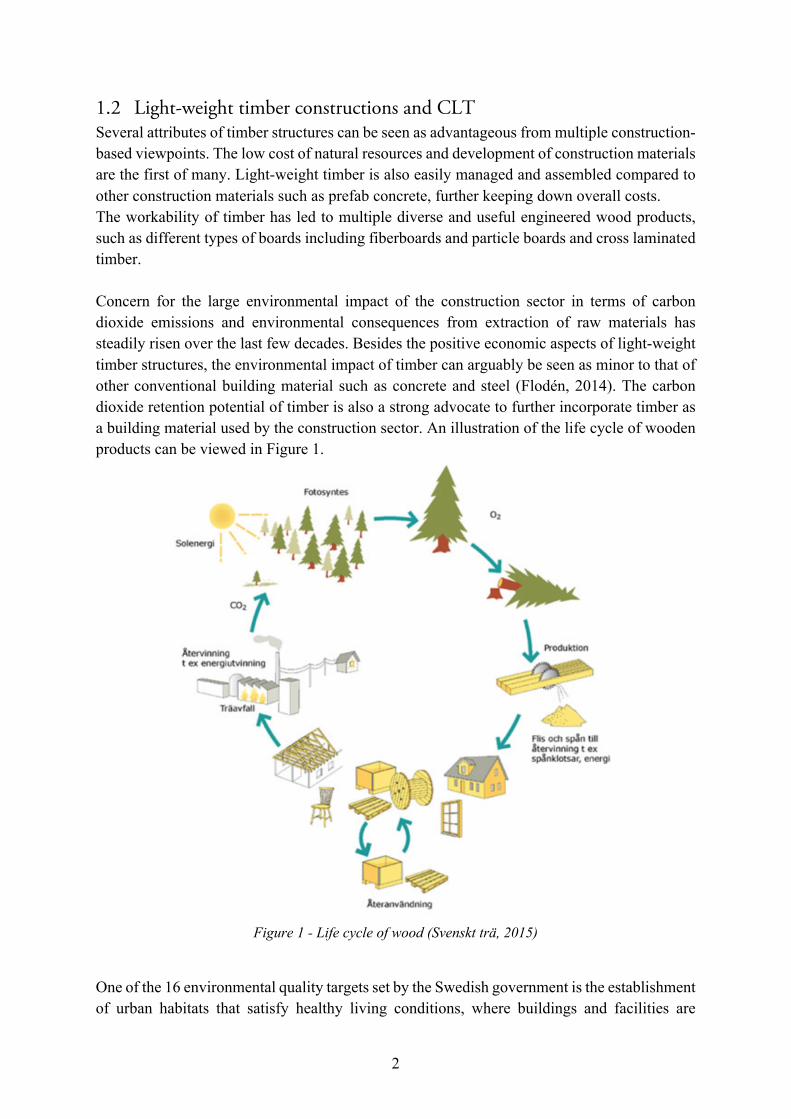
1.2 Light-weight timber constructions and CLT Several attributes of timber structures can be seen as advantageous from multiple construction-based viewpoints. The low cost of natural resources and development of construction materials are the first of many. Light-weight timber is also easily managed and assembled compared to other construction materials such as prefab concrete, further keeping down overall costs. The workability of timber has led to multiple diverse and useful engineered wood products, such as different types of boards including fiberboards and particle boards and cross laminated timber. Concern for the large environmental impact of the construction sector in terms of carbon dioxide emissions and environmental consequences from extraction of raw materials has steadily risen over the last few decades. Besides the positive economic aspects of light-weight timber structures, the environmental impact of timber can arguably be seen as minor to that of other conventional building material such as concrete and steel (Flodén, 2014). The carbon dioxide retention potential of timber is also a strong advocate to further incorporate timber as a building material used by the construction sector. An illustration of the life cycle of wooden products can be viewed in Figure 1.
Figure 1 - Life cycle of wood (Svenskt trä, 2015)
One of the 16 environmental quality targets set by the Swedish government is the establishment of urban habitats that satisfy healthy living conditions, where buildings and facilities are
3
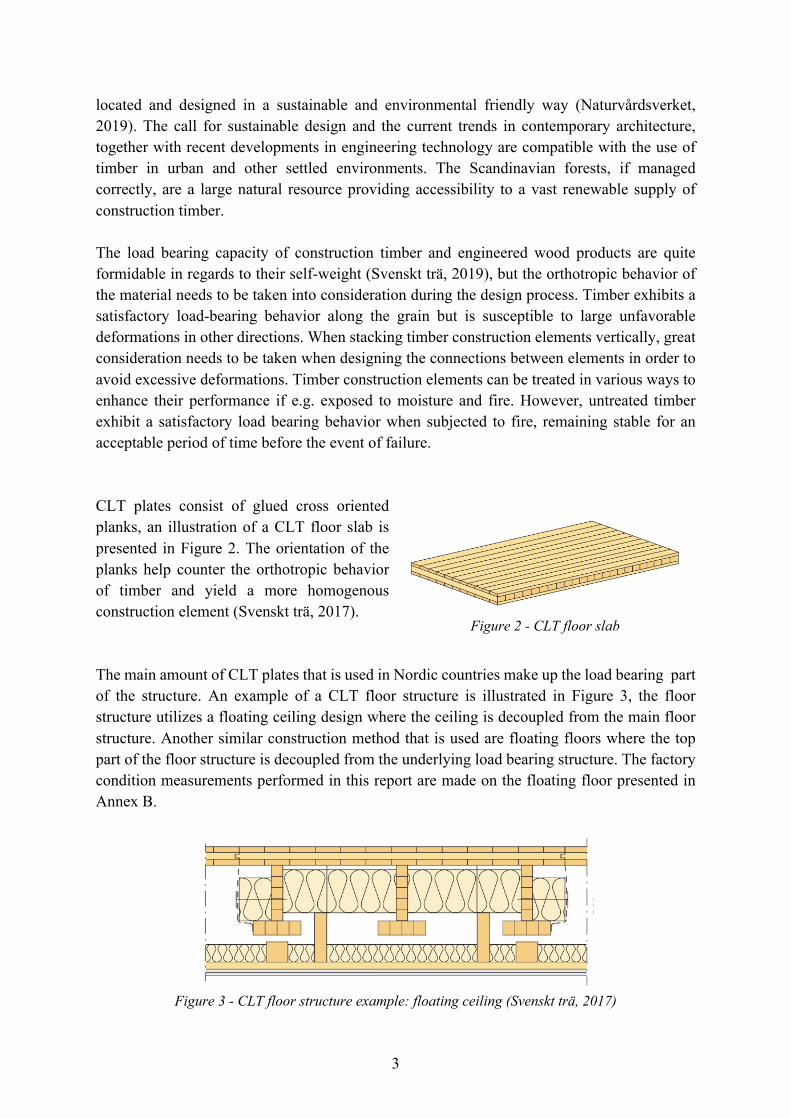
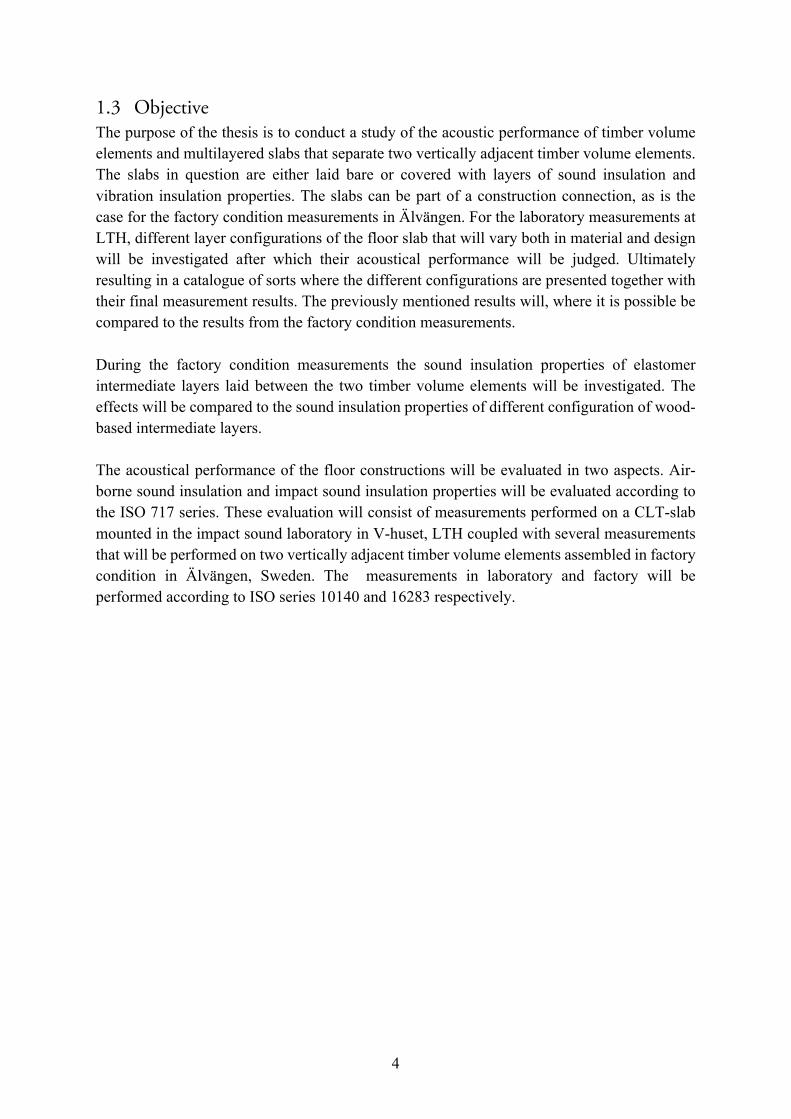
located and designed in a sustainable and environmental friendly way (Naturvårdsverket, 2019). The call for sustainable design and the current trends in contemporary architecture, together with recent developments in engineering technology are compatible with the use of timber in urban and other settled environments. The Scandinavian forests, if managed correctly, are a large natural resource providing accessibility to a vast renewable supply of construction timber. The load bearing capacity of construction timber and engineered wood products are quite formidable in regards to their self-weight (Svenskt trä, 2019), but the orthotropic behavior of the material needs to be taken into consideration during the design process. Timber exhibits a satisfactory load-bearing behavior along the grain but is susceptible to large unfavorable deformations in other directions. When stacking timber construction elements vertically, great consideration needs to be taken when designing the connections between elements in order to avoid excessive deformations. Timber construction elements can be treated in various ways to enhance their performance if e.g. exposed to moisture and fire. However, untreated timber exhibit a satisfactory load bearing behavior when subjected to fire, remaining stable for an acceptable period of time before the event of failure. CLT plates consist of glued cross oriented planks, an illustration of a CLT floor slab is presented in Figure 2. The orientation of the planks help counter the orthotropic behavior of timber and yield a more homogenous construction element (Svenskt trä, 2017). The main amount of CLT plates that is used in Nordic countries make up the load bearing part of the structure. An example of a CLT floor structure is illustrated in Figure 3, the floor structure utilizes a floating ceiling design where the ceiling is decoupled from the main floor structure. Another similar construction method that is used are floating floors where the top part of the floor structure is decoupled from the underlying load bearing structure. The factory condition measurements performed in this report are made on the floating floor presented in Annex B.
Figure 3 - CLT floor structure example: floating ceiling (Svenskt trä, 2017)
Figure 2 - CLT floor slab
4
1.3 Objective The purpose of the thesis is to conduct a study of the acoustic performance of timber volume elements and multilayered slabs that separate two vertically adjacent timber volume elements. The slabs in question are either laid bare or covered with layers of sound insulation and vibration insulation properties. The slabs can be part of a construction connection, as is the case for the factory condition measurements in Älvängen. For the laboratory measurements at LTH, different layer configurations of the floor slab that will vary both in material and design will be investigated after which their acoustical performance will be judged. Ultimately resulting in a catalogue of sorts where the different configurations are presented together with their final measurement results. The previously mentioned results will, where it is possible be compared to the results from the factory condition measurements. During the factory condition measurements the sound insulation properties of elastomer intermediate layers laid between the two timber volume elements will be investigated. The effects will be compared to the sound insulation properties of different configuration of wood-based intermediate layers. The acoustical performance of the floor constructions will be evaluated in two aspects. Air-borne sound insulation and impact sound insulation properties will be evaluated according to the ISO 717 series. These evaluation will consist of measurements performed on a CLT-slab mounted in the impact sound laboratory in V-huset, LTH coupled with several measurements that will be performed on two vertically adjacent timber volume elements assembled in factory condition in Älvängen, Sweden. The measurements in laboratory and factory will be performed according to ISO series 10140 and 16283 respectively.
5
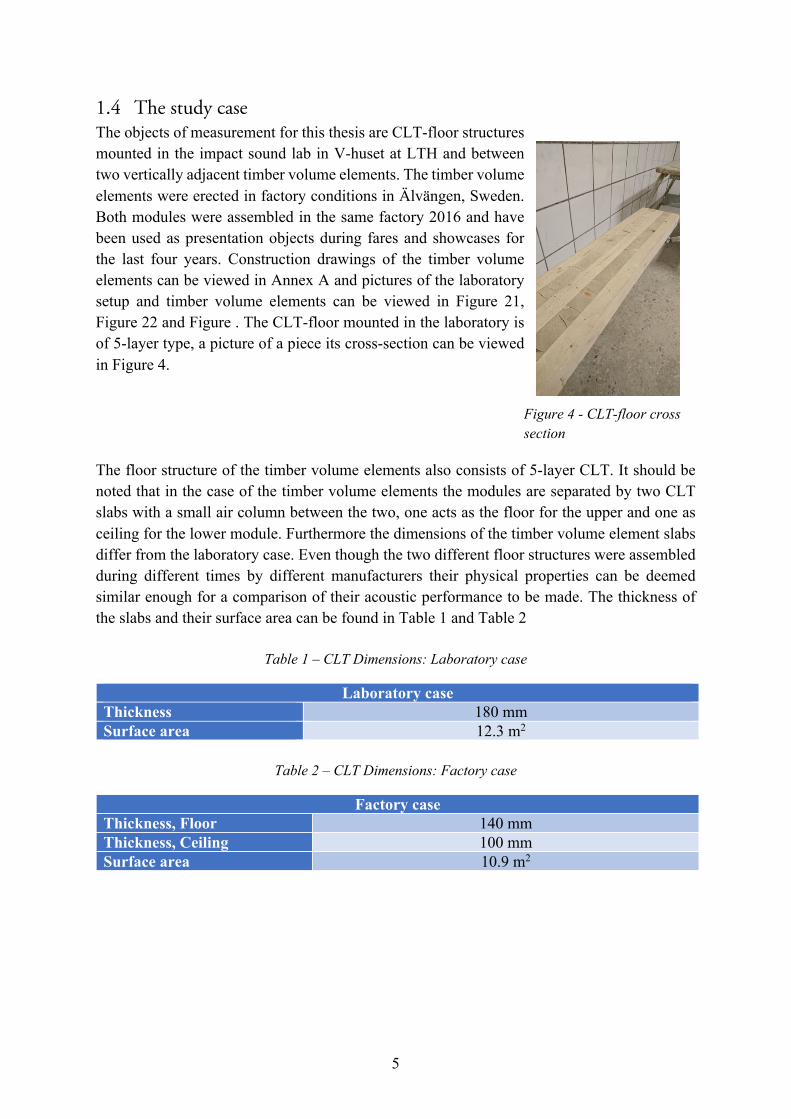
1.4 The study case The objects of measurement for this thesis are CLT-floor structures mounted in the impact sound lab in V-huset at LTH and between two vertically adjacent timber volume elements. The timber volume elements were erected in factory conditions in Älvängen, Sweden. Both modules were assembled in the same factory 2016 and have been used as presentation objects during fares and showcases for the last four years. Construction drawings of the timber volume elements can be viewed in Annex A and pictures of the laboratory setup and timber volume elements can be viewed in Figure 21, Figure 22 and Figure . The CLT-floor mounted in the laboratory is of 5-layer type, a picture of a piece its cross-section can be viewed in Figure 4. The floor structure of the timber volume elements also consists of 5-layer CLT. It should be noted that in the case of the timber volume elements the modules are separated by two CLT slabs with a small air column between the two, one acts as the floor for the upper and one as ceiling for the lower module. Furthermore the dimensions of the timber volume element slabs differ from the laboratory case. Even though the two different floor structures were assembled during different times by different manufacturers their physical properties can be deemed similar enough for a comparison of their acoustic performance to be made. The thickness of the slabs and their surface area can be found in Table 1 and Table 2
Table 1 – CLT Dimensions: Laboratory case
Laboratory case Thickness 180 mm Surface area 12.3 m2
Table 2 – CLT Dimensions: Factory case
Factory case Thickness, Floor 140 mm Thickness, Ceiling 100 mm Surface area 10.9 m2
Figure 4 - CLT-floor cross section
6
Regarding the laboratory measurements the different layers to be placed on top of the CLT slab consist of the following materials.
- Vibration insulation mats of various thickness and density - Plywood boards - Gypsum boards - Parquet floor
For the factory measurements the floor will consist of different intermediate layers of vibration reduction material that are placed between the timber volume elements. A floating floor constructed on top of the upper CLT slab which is decoupled from all adjacent structures. Linoleum and parquet floor covering will be placed over the floating floor. Finally the bare CLT slab of the upper module will be tested. The intermediate layers of elastomer previously mentioned in chapter 1.3 will be of varying stiffness. Wooden planks of various shapes will be used for experiments with wood-based intermediate layers instead of elastomer layers.
1.5 Methodology The methodology of this thesis consists of an initial literature study where sources of many different origins were consulted. The different sources originated from the following backgrounds.
• Other previously conducted Master theses • Doctorate dissertations • Scientific articles • Industry sources • Research papers • Educational books • International standards, ISO
Measurements followed when the literature study was still on-going. The measurements where conducted between February and the beginning of March in laboratory and factory settings. When the measurement where completed extensive analysis of the results was carried out between March and May.
7
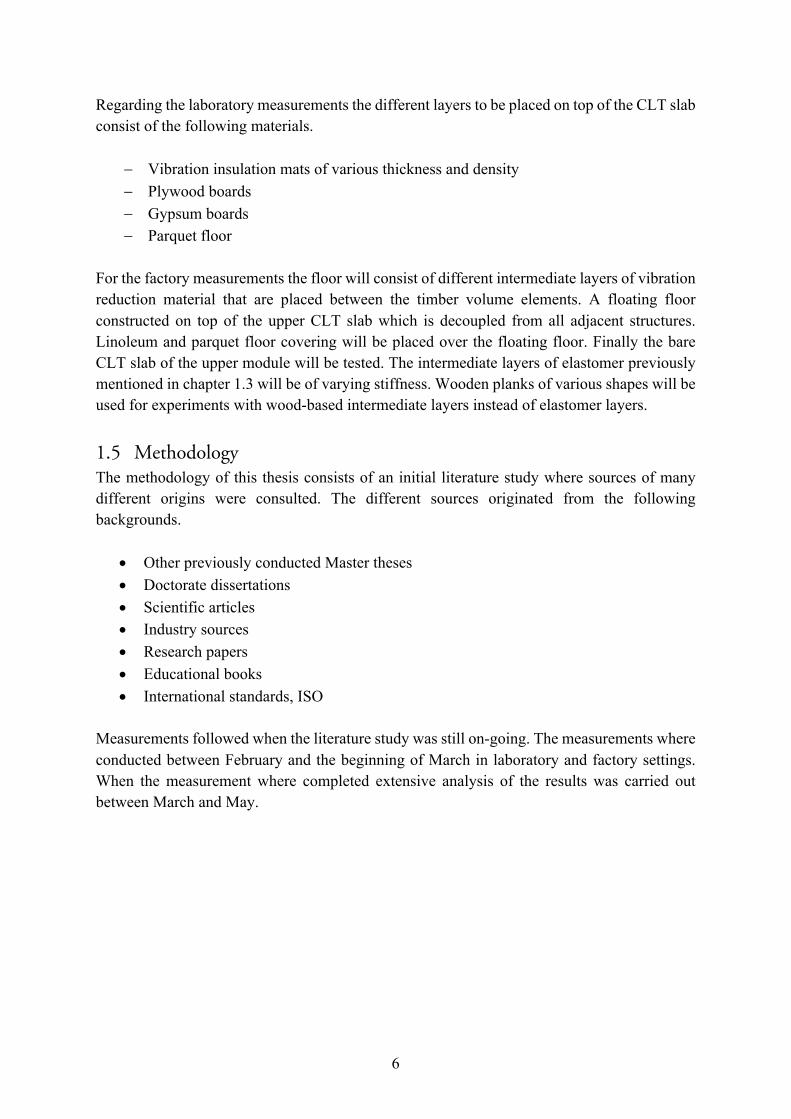
2 Theory 2.1 Sound and vibrations Sound and vibrations are dynamic phenomena and can be referred to as oscillatory movements. Sound waves are oscillations in air pressure traveling through the air in wave form, while vibrations are oscillations in mechanical systems. An oscillation can be described as a repetitive variation in time of some sort of quantity around an equilibrium. Depending on the properties of the system the vibrations are taking place in and their frequency vibrations can appear as wave motions of different kinds. (Hopkins, 2007) The generation of sound usually has its origin in processes involving mechanical energy, sound waves appear when this mechanical energy is transformed into acoustical energy. An example of this process in building acoustics is when a building element is excited into vibration by e.g. an impact, friction or even when a soundwave traveling through the air impinges on the element. The vibration in the building element can in turn transfer its motion to an adjacent medium such as e.g. air and create a sound field because of the volume displacement or another connecting element and propagate the original vibration. (Vigran, 2008) Sound can travel along many paths through a structure as illustrated in Figure 5. For sound insulation between two rooms one must consider the following paths. Direct path: sound passing through the common partition. Flanking: sound passing around the borders of the common partition, e.g. through boundary elements adjacent to the common partition. Structure-borne: vibration in structure caused by an excitation source, e.g. elevator shaft. (Vigran, 2008) (Cremer & Heckl, 1973)
Figure 5 - Flanking transmission paths (Vigran, 2008)
8
2.2 Harmonic waves Harmonic waves are a repeating motion that varies between a specified maximum and minimum value around an equilibrium. Superposition is valid for harmonic waves and makes them highly suitable for modeling different oscillatory motion in physics. Three important properties of a harmonic wave is its frequency, f period, T and wavelength l. Where the frequency, f describes the number of repetitions per second, the period, T the time it take to complete one repetition and the wavelength, l the length a wave travels during one complete repetition (Chopra, 2006). The three properties are closely related in the following manner 𝑓 = !
" [Hz] (2.1)
𝑇 = !
# [s] (2.2)
𝜆 = 𝑐 ∙ 𝑓[m] (2.3)
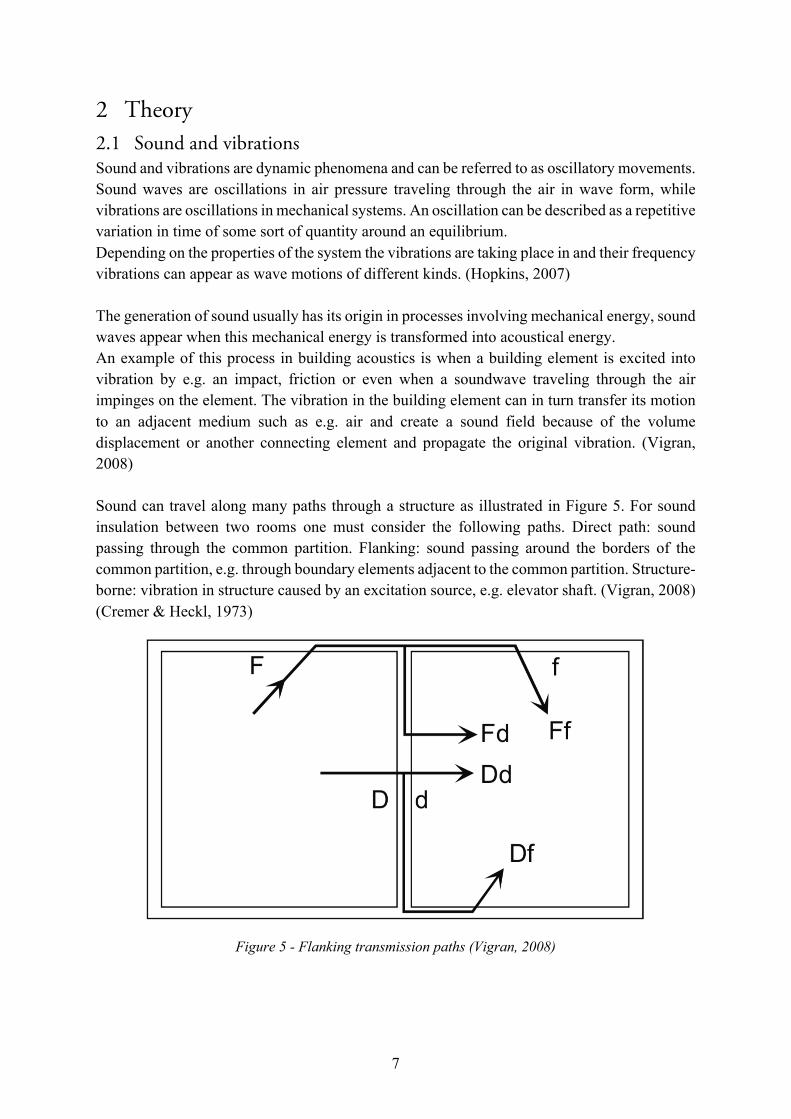
Where c is the propagation speed of the wave. The amplitude of a harmonic wave is the peak value of the wave. In the harmonic wave presented in Figure 6 the amplitude is represented by the vertical axis.
Figure 6 – Wavelength (Kleiner, 2012)
Repeating harmonic signals can be modeled as sinusoidal waves, this is employed in acoustics to mathematically describe the behavior of soundwaves.
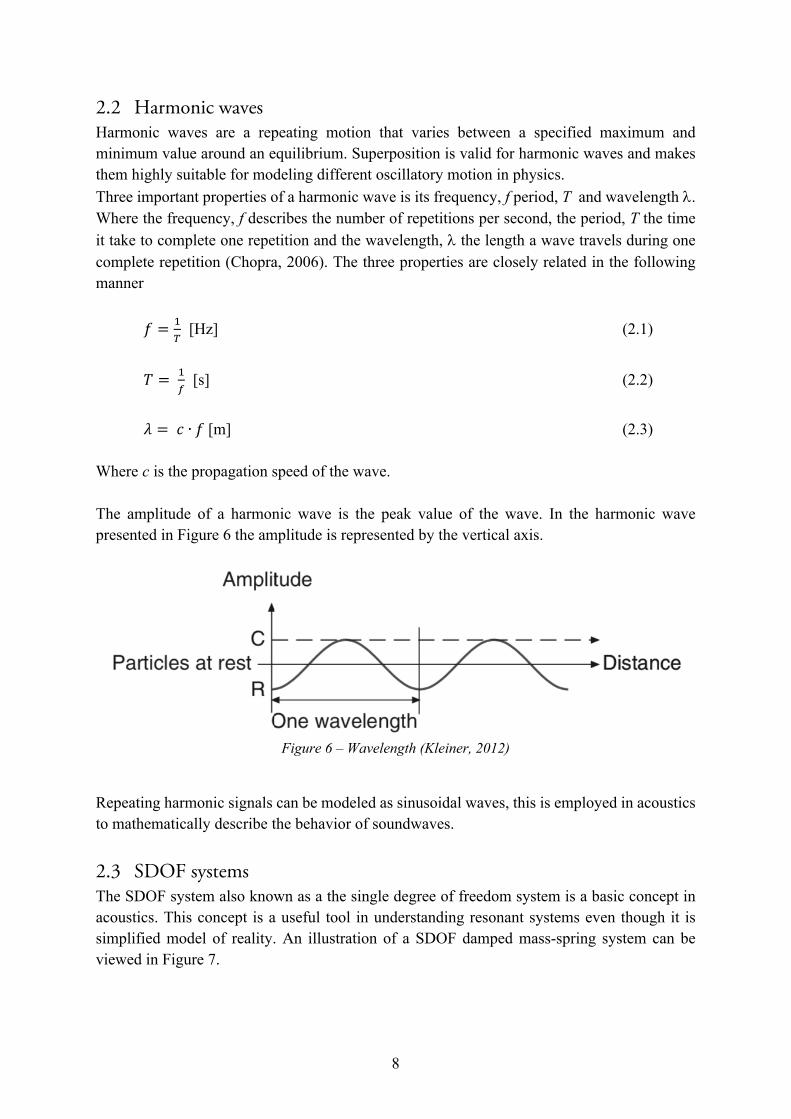
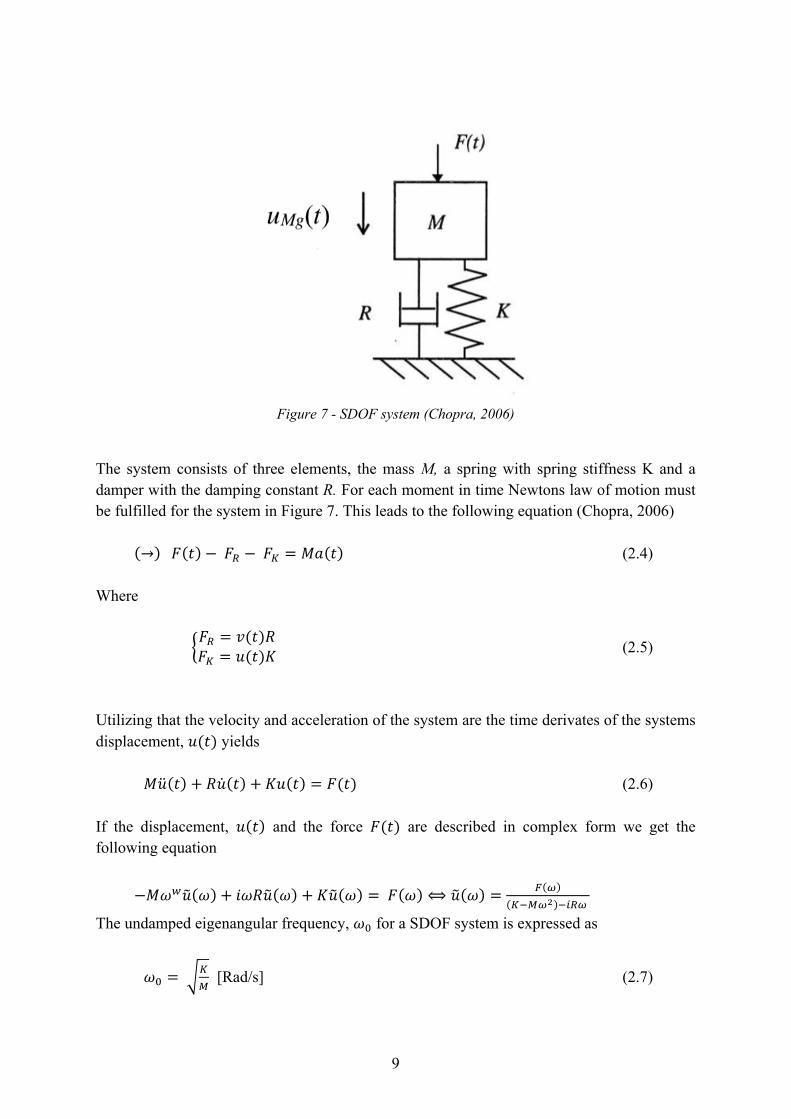
2.3 SDOF systems The SDOF system also known as a the single degree of freedom system is a basic concept in acoustics. This concept is a useful tool in understanding resonant systems even though it is simplified model of reality. An illustration of a SDOF damped mass-spring system can be viewed in Figure 7.
9
Figure 7 - SDOF system (Chopra, 2006)
The system consists of three elements, the mass M, a spring with spring stiffness K and a damper with the damping constant R. For each moment in time Newtons law of motion must be fulfilled for the system in Figure 7. This leads to the following equation (Chopra, 2006)
(→)𝐹(𝑡) −𝐹$ −𝐹% = 𝑀𝑎(𝑡) (2.4)
Where
0𝐹$ = 𝑣(𝑡)𝑅𝐹% = 𝑢(𝑡)𝐾 (2.5)
Utilizing that the velocity and acceleration of the system are the time derivates of the systems displacement, 𝑢(𝑡) yields
𝑀�̈�(𝑡) + 𝑅�̇�(𝑡) + 𝐾𝑢(𝑡) = 𝐹(𝑡) (2.6)
If the displacement, 𝑢(𝑡) and the force 𝐹(𝑡) are described in complex form we get the following equation
−𝑀𝜔&𝑢9(𝜔) + 𝑖𝜔𝑅𝑢9(𝜔) + 𝐾𝑢9(𝜔) = 𝐹(𝜔) ⟺ 𝑢9(𝜔) = '())(%+,)!)+-$)
The undamped eigenangular frequency, 𝜔/ for a SDOF system is expressed as
𝜔/ =<%,
[Rad/s] (2.7)
10
If the equation for the undamped eigenangular frequency is inserted into the previous equation for the complex amplitude and it is normalized with respect to the driving force we get the following equation (Chopra, 2006)
01())'2())
= !,()"!+)!)+-$)
(2.8)
From this equation three very important conclusions can be drawn.
1. If the driving frequency approaches the resonance frequency of the system the amplitude will increase greatly and the size of the damping constant will determine the size of the amplitude.
2. If the driving frequency is below the resonance frequency the spring stiffness will dictate systems response.
3. If the driving frequency is above the resonance frequency the mass of the system will dictate the systems response.
2.4 Impedance Another quotient that is of interest is the mechanical impedance, Z of a system. The impedance can be calculated as (Chopra, 2006)
𝑍(𝜔) = '2())34())
[kg/(m2·s)] (2.9)
Where 𝑣9(𝜔) is the complex amplitude of the velocity of the system. For vibration insulation in buildings a difference in impedance between two mediums can be used to halt the spread of vibrations. This change of impedance can be achieved by two means. Firstly: by changing the geometry of the cross section or its orientation with regards to the connecting elements or secondly: by a change in material. With the change of impedance the energy of the wave is reflected back instead of being transmitted further into the structure (Hörnwall, 2019). This effect is utilized with the application of elastomer intermediate layers mentioned in chapter 1.3 where the change of material from CLT to elastomer creates a change of impedance which should lead to better vibration isolation.
11
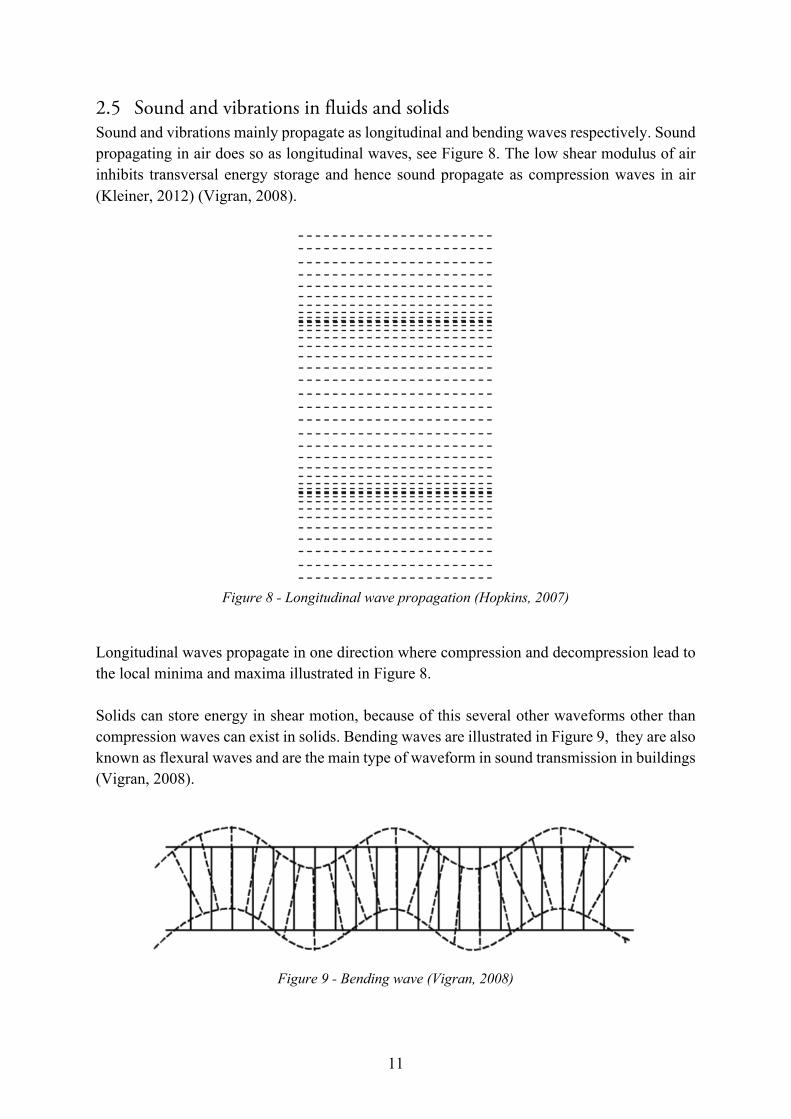
2.5 Sound and vibrations in fluids and solids Sound and vibrations mainly propagate as longitudinal and bending waves respectively. Sound propagating in air does so as longitudinal waves, see Figure 8. The low shear modulus of air inhibits transversal energy storage and hence sound propagate as compression waves in air (Kleiner, 2012) (Vigran, 2008).
Figure 8 - Longitudinal wave propagation (Hopkins, 2007)
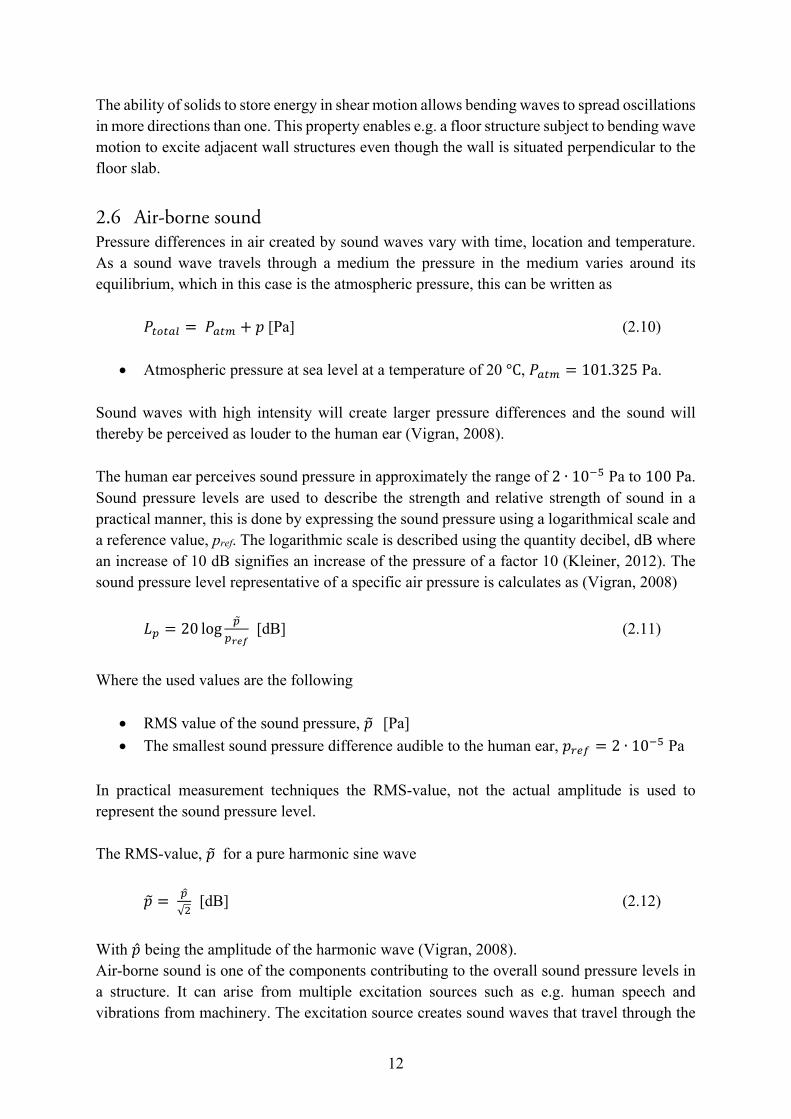
Longitudinal waves propagate in one direction where compression and decompression lead to the local minima and maxima illustrated in Figure 8. Solids can store energy in shear motion, because of this several other waveforms other than compression waves can exist in solids. Bending waves are illustrated in Figure 9, they are also known as flexural waves and are the main type of waveform in sound transmission in buildings (Vigran, 2008).
Figure 9 - Bending wave (Vigran, 2008)
12
The ability of solids to store energy in shear motion allows bending waves to spread oscillations in more directions than one. This property enables e.g. a floor structure subject to bending wave motion to excite adjacent wall structures even though the wall is situated perpendicular to the floor slab.
2.6 Air-borne sound Pressure differences in air created by sound waves vary with time, location and temperature. As a sound wave travels through a medium the pressure in the medium varies around its equilibrium, which in this case is the atmospheric pressure, this can be written as 𝑃56578 =𝑃759 + 𝑝[Pa] (2.10)
• Atmospheric pressure at sea level at a temperature of 20 °C, 𝑃759 = 101.325 Pa. Sound waves with high intensity will create larger pressure differences and the sound will thereby be perceived as louder to the human ear (Vigran, 2008). The human ear perceives sound pressure in approximately the range of 2 ∙ 10+: Pa to 100 Pa. Sound pressure levels are used to describe the strength and relative strength of sound in a practical manner, this is done by expressing the sound pressure using a logarithmical scale and a reference value, pref. The logarithmic scale is described using the quantity decibel, dB where an increase of 10 dB signifies an increase of the pressure of a factor 10 (Kleiner, 2012). The sound pressure level representative of a specific air pressure is calculates as (Vigran, 2008) 𝐿; = 20 log ;4
;#$% [dB] (2.11)
Where the used values are the following
• RMS value of the sound pressure, 𝑝9 [Pa] • The smallest sound pressure difference audible to the human ear, 𝑝<=# = 2 ∙ 10+: Pa
In practical measurement techniques the RMS-value, not the actual amplitude is used to represent the sound pressure level. The RMS-value, 𝑝9 for a pure harmonic sine wave 𝑝9 = ;>
√@ [dB] (2.12)
With �̂� being the amplitude of the harmonic wave (Vigran, 2008). Air-borne sound is one of the components contributing to the overall sound pressure levels in a structure. It can arise from multiple excitation sources such as e.g. human speech and vibrations from machinery. The excitation source creates sound waves that travel through the
13
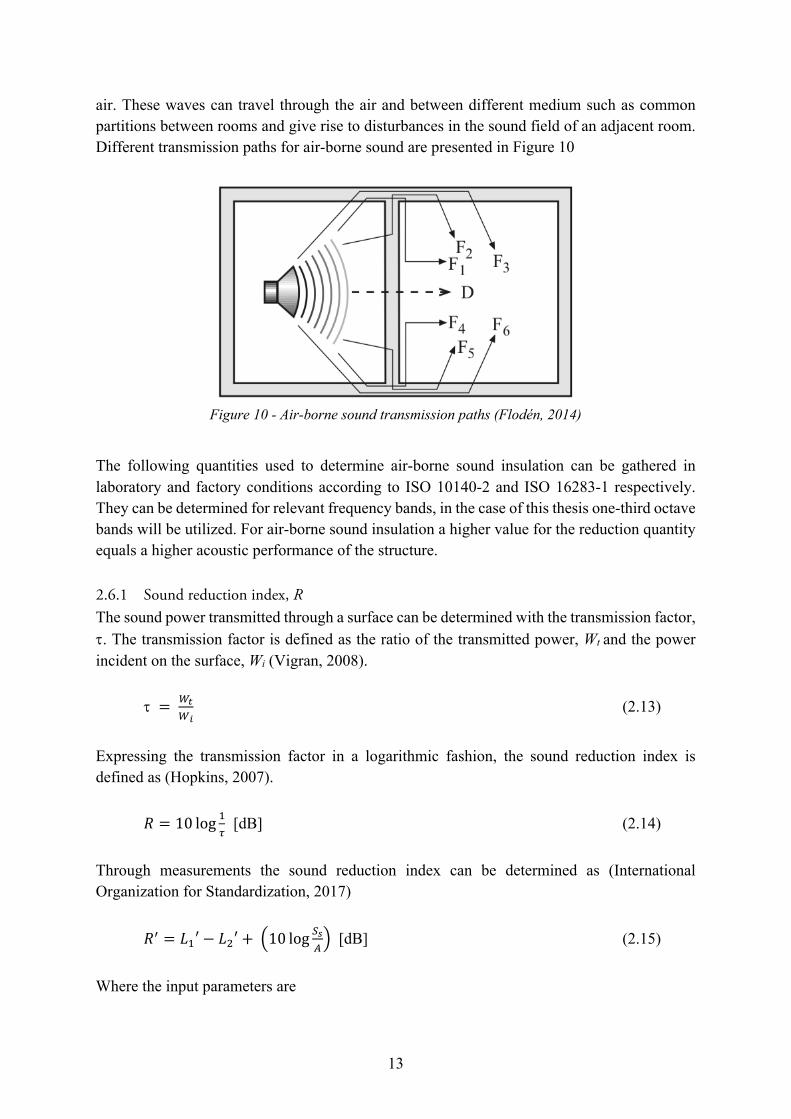
air. These waves can travel through the air and between different medium such as common partitions between rooms and give rise to disturbances in the sound field of an adjacent room. Different transmission paths for air-borne sound are presented in Figure 10
Figure 10 - Air-borne sound transmission paths (Flodén, 2014)
The following quantities used to determine air-borne sound insulation can be gathered in laboratory and factory conditions according to ISO 10140-2 and ISO 16283-1 respectively. They can be determined for relevant frequency bands, in the case of this thesis one-third octave bands will be utilized. For air-borne sound insulation a higher value for the reduction quantity equals a higher acoustic performance of the structure. 2.6.1 Sound reduction index, R The sound power transmitted through a surface can be determined with the transmission factor, t. The transmission factor is defined as the ratio of the transmitted power, Wt and the power incident on the surface, Wi (Vigran, 2008).
t = A&A'
(2.13)
Expressing the transmission factor in a logarithmic fashion, the sound reduction index is defined as (Hopkins, 2007).
𝑅 = 10 log !B [dB] (2.14)
Through measurements the sound reduction index can be determined as (International Organization for Standardization, 2017)
𝑅C = 𝐿!′ − 𝐿@′ + N10 logD(EO [dB] (2.15)
Where the input parameters are
14
• Average sound pressure levels in the source room, L1’ [dB] • Average sound pressure levels in the receiving room, L2’ [dB] • Equivalent sound absorption in the receiving room, A [m2] • Area of the separating element, Ss [m2]
2.6.2 Normalized level difference, Dn The difference in space and time average sound pressure levels between two adjacent rooms, normalized with regards to the equivalent sound absorption area in the receiving room. Evaluated as (International Organization for Standardization, 2017) 𝐷F =𝐿! − 𝐿@ − 10log
EE"
[dB] (2.16)
Where the input parameters are
• Average sound pressure levels in the source room, L1 [dB] • Average sound pressure levels in the receiving room, L2 [dB] • Equivalent sound absorption in the receiving room, A [m2] • Reference absorption area, A0 = 10 m2
2.6.3 Standardized level difference: Air-borne sound, 𝐷′F" A level difference standardized to a reference value of the reverberation time in the receiving room, calculated as (International Organization of Standardization, 2014) 𝐷′F" = 𝐷C + log "
""[dB] (2.17)
• The difference between two sound pressure levels, L’i measured in-situ,
𝐷C =𝐿′! − 𝐿′@ [dB] (2.18) • Reference reverberation time for dwellings, 𝑇/ = 0.5s • Reverberation time in the receiving room, 𝑇 [S]
15
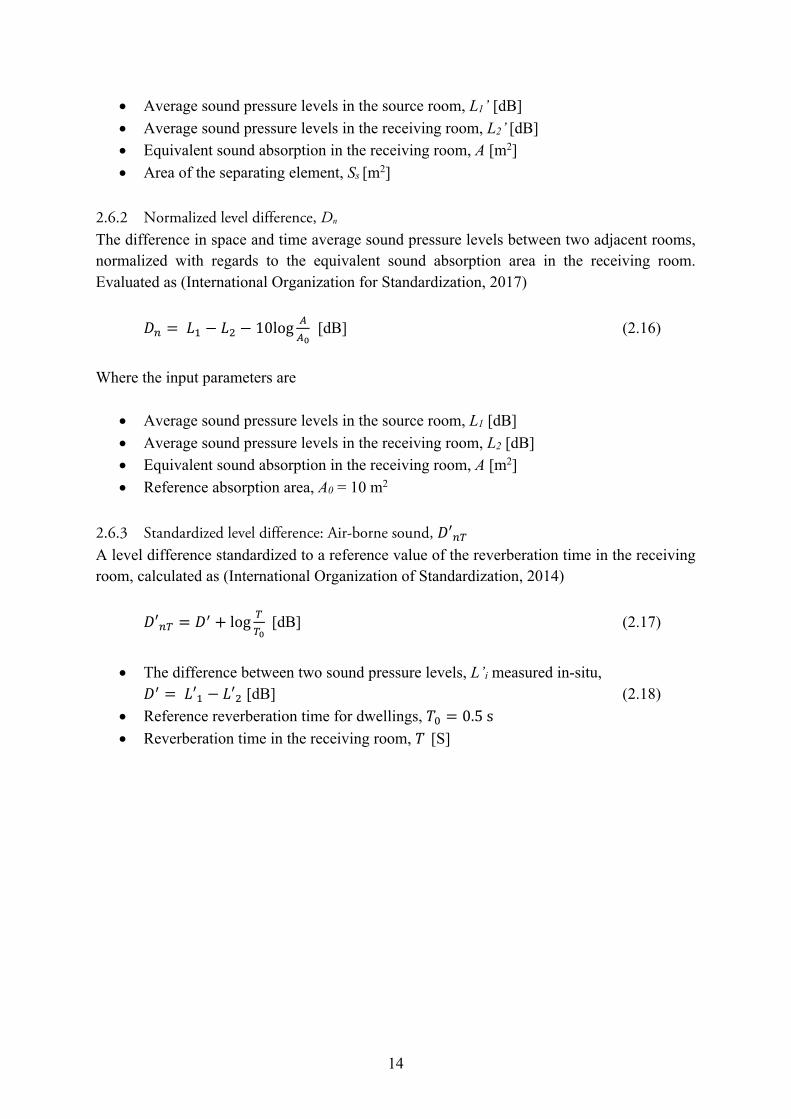
2.6.4 Weighted sound reduction index, Rw The weighted sound reduction index, Rw is a standardized value used to describe the transmission loss through a partition. It is used as an estimation of the acoustic performance of partitions and is extrapolated using a standardized reference curve illustrated in Figure 11. The procedure to calculated the weighted sound reduction index entails a comparison of either the apparent sound reduction index, the standardized level difference or the normalized level difference and the reference curve in third-octave bands. The reference curve is shifted towards the measured curve until the sum of unfavorable deviations is as large as possible, but no larger than 32 dB. Unfavorable deviations appear when the measured curve is lower than the reference curve. This ultimately yields the weighted sound reduction index Rw, Rn,w or RnT,w (International Organization for Standardization, 2013).
Figure 11 - Reference curve: Air-borne sound reduction (International Organization for
Standardization, 2013)
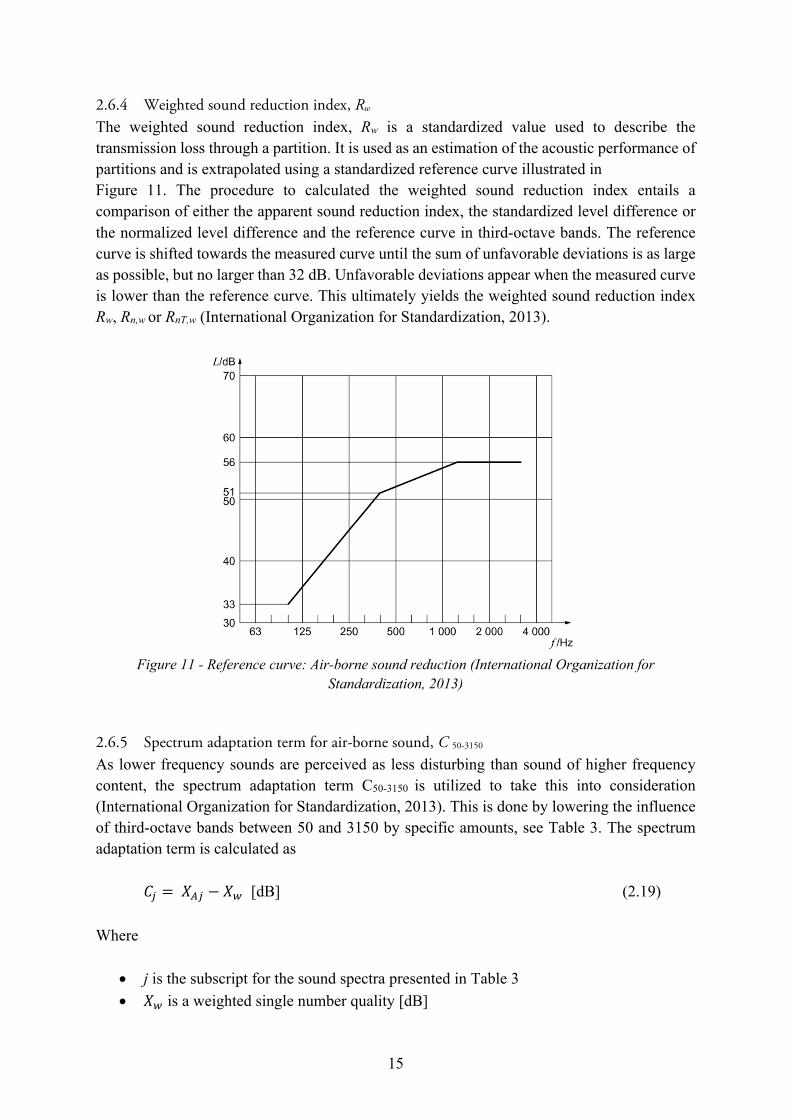
2.6.5 Spectrum adaptation term for air-borne sound, C 50-3150 As lower frequency sounds are perceived as less disturbing than sound of higher frequency content, the spectrum adaptation term C50-3150 is utilized to take this into consideration (International Organization for Standardization, 2013). This is done by lowering the influence of third-octave bands between 50 and 3150 by specific amounts, see Table 3. The spectrum adaptation term is calculated as
𝐶G =𝑋EG − 𝑋& [dB] (2.19) Where
• j is the subscript for the sound spectra presented in Table 3 • 𝑋& is a weighted single number quality [dB]
16
And 𝑋GE is calculated as
𝑋GE = −10 log∑10HI')+J'K/!/ [dB] (2.20)
In which
• i is the subscript for third-octave bands • 𝐿-G are the levels from Table 3 at the frequency i for the spectrum j [dB] • The sound reduction value chosen for the particular measurement, 𝑋- [dB]
Table 3 - Sound level spectra for calculation of air-borne adaptation term (International
Organization for Standardization, 2013)
To yield a final evaluation of the air-borne sound insulation used for this thesis, 𝐷′F",&,:/+N!:/ the spectrum adaptation term is added to the weighted air-borne sound reduction index accordingly
𝐷′F",&,:/+N!:/ = 𝐷′F",& +𝐶:/+N!:/ [dB] (2.21)
17
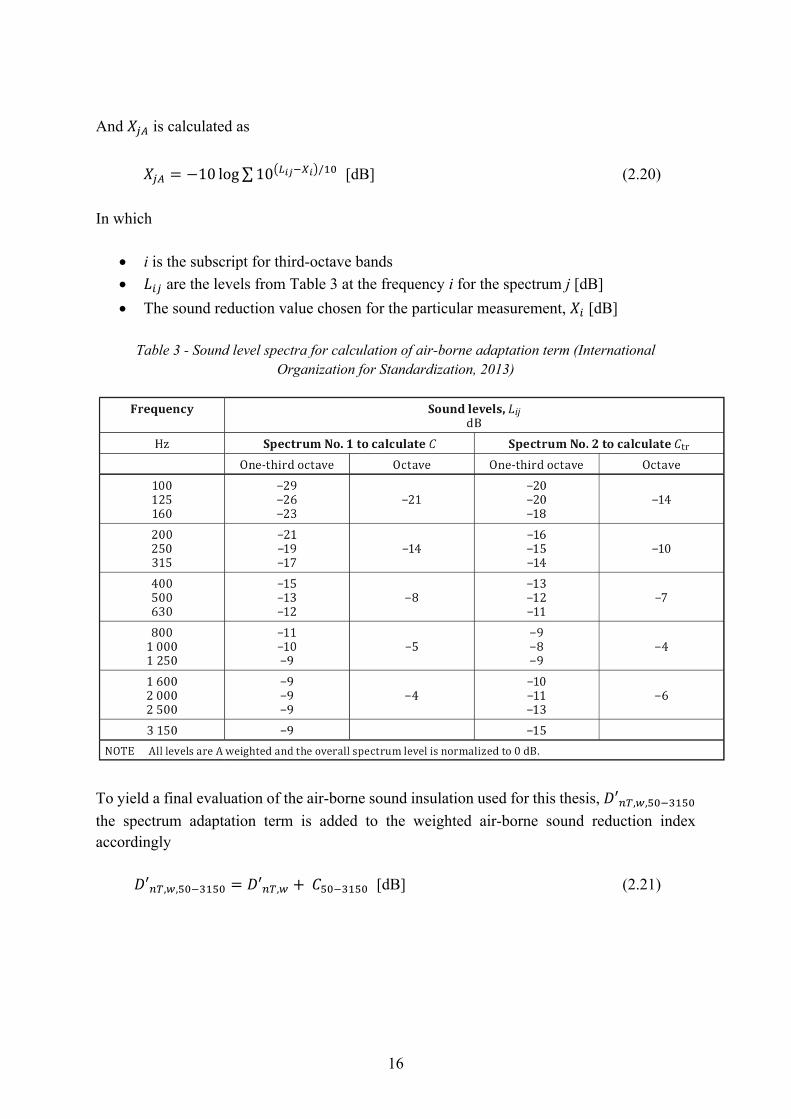
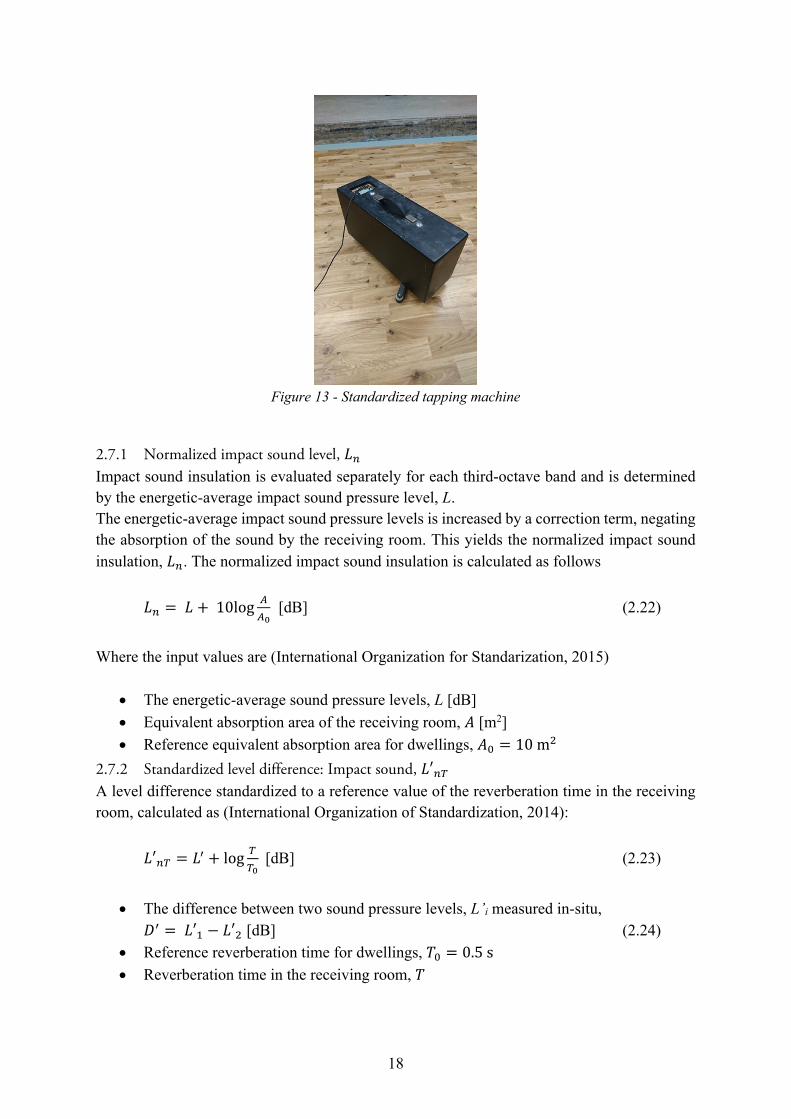
2.7 Structure-borne sound Through the excitation of a common partition by e.g. foot fall or vibrations from machinery, sound can travel between rooms and create disturbances. Vibrations in the structure can travel directly through the common partition and create disturbances in the sound field of the adjacent room or through flaking transmissions between structural elements connected to the partition in contact with the excitation source. Through efforts to achieve standardization of measurements a standardized excitation sources for impact sound has been created. This sources, presented in Figure 13 is known as a tapping machine. It consists of six identical hammer heads that hit the ground at even intervals, meant to simulate impact sound usually encountered in buildings. Its ability to simulate naturally appearing impact sound satisfactorily is often brought up for question. However, to properly measure the amount of power that is applied to a surface analog to the process of measuring air-borne sound reduction is time consuming and very difficult. (Hopkins, 2007)
Figure 12 - Structure-borne transmission paths (Flodén, 2014)
The following quantities used to determine impact sound insulation according to (International Organization of Standardization, 2013) can be gathered in laboratory and in-situ according to ISO 10140-3 and ISO 16283-2 respectively. They can be determined for relevant frequency bands, in the case of this thesis, one-third octave bands will be utilized. For structure-borne sound a lower value of the impact sound equals a higher acoustic performance of the structure.
18
Figure 13 - Standardized tapping machine
2.7.1 Normalized impact sound level, 𝐿F Impact sound insulation is evaluated separately for each third-octave band and is determined by the energetic-average impact sound pressure level, L. The energetic-average impact sound pressure levels is increased by a correction term, negating the absorption of the sound by the receiving room. This yields the normalized impact sound insulation, 𝐿F. The normalized impact sound insulation is calculated as follows 𝐿F = 𝐿 +10log E
E" [dB] (2.22)
Where the input values are (International Organization for Standarization, 2015)
• The energetic-average sound pressure levels, L [dB] • Equivalent absorption area of the receiving room, 𝐴 [m2] • Reference equivalent absorption area for dwellings, 𝐴/ = 10m@
2.7.2 Standardized level difference: Impact sound, 𝐿′F" A level difference standardized to a reference value of the reverberation time in the receiving room, calculated as (International Organization of Standardization, 2014): 𝐿′F" = 𝐿C + log "
""[dB] (2.23)
• The difference between two sound pressure levels, L’i measured in-situ,
𝐷C =𝐿′! − 𝐿′@ [dB] (2.24) • Reference reverberation time for dwellings, 𝑇/ = 0.5s • Reverberation time in the receiving room, 𝑇
19
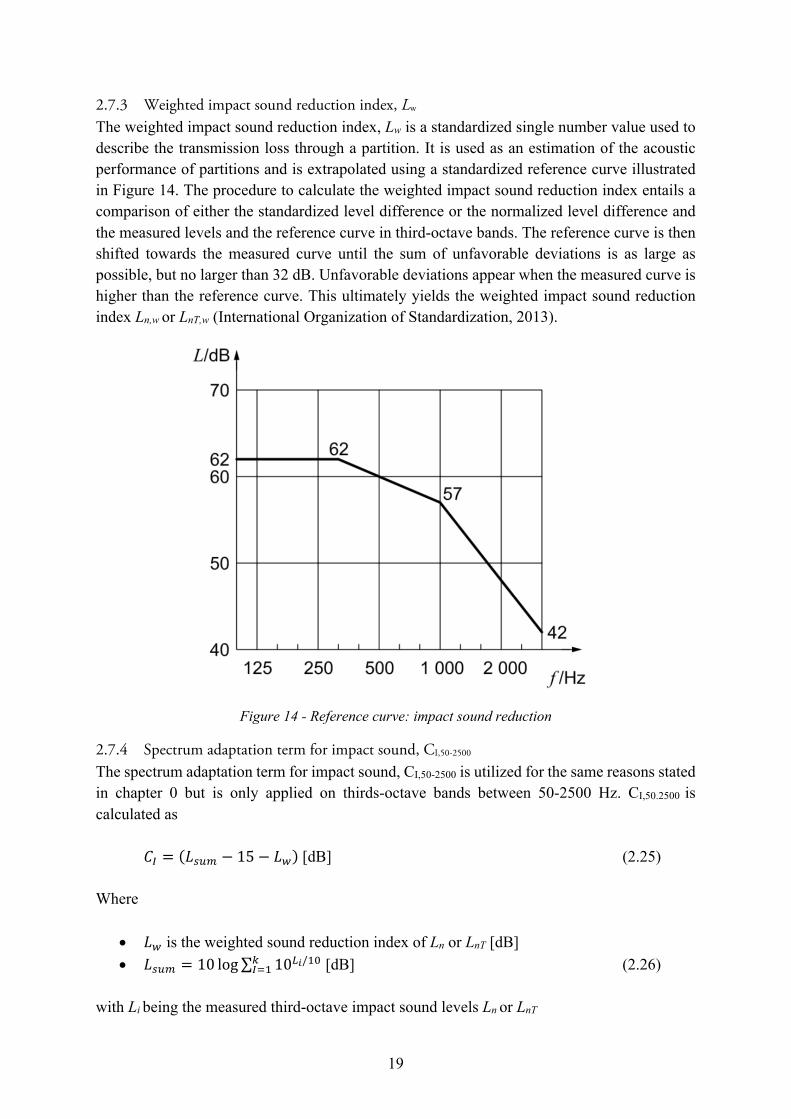
2.7.3 Weighted impact sound reduction index, Lw The weighted impact sound reduction index, Lw is a standardized single number value used to describe the transmission loss through a partition. It is used as an estimation of the acoustic performance of partitions and is extrapolated using a standardized reference curve illustrated in Figure 14. The procedure to calculate the weighted impact sound reduction index entails a comparison of either the standardized level difference or the normalized level difference and the measured levels and the reference curve in third-octave bands. The reference curve is then shifted towards the measured curve until the sum of unfavorable deviations is as large as possible, but no larger than 32 dB. Unfavorable deviations appear when the measured curve is higher than the reference curve. This ultimately yields the weighted impact sound reduction index Ln,w or LnT,w (International Organization of Standardization, 2013).
Figure 14 - Reference curve: impact sound reduction
2.7.4 Spectrum adaptation term for impact sound, CI,50-2500
The spectrum adaptation term for impact sound, CI,50-2500 is utilized for the same reasons stated in chapter 0 but is only applied on thirds-octave bands between 50-2500 Hz. CI,50.2500 is calculated as
𝐶O = (𝐿P09 − 15 − 𝐿&)[dB] (2.25) Where
• 𝐿& is the weighted sound reduction index of Ln or LnT [dB] • 𝐿P09 = 10 log∑ 10I'/!/Q
OR! [dB] (2.26)
with Li being the measured third-octave impact sound levels Ln or LnT
20
To yield a final evaluation of the impact sound insulation used for this thesis 𝐿F",&,:/+@://, the spectrum adaptation term is added to the weighted impact sound reduction index accordingly
𝐿F",&,:/+@:// = 𝐿F",& +𝐶O,:/+@:// [dB] (2.27)
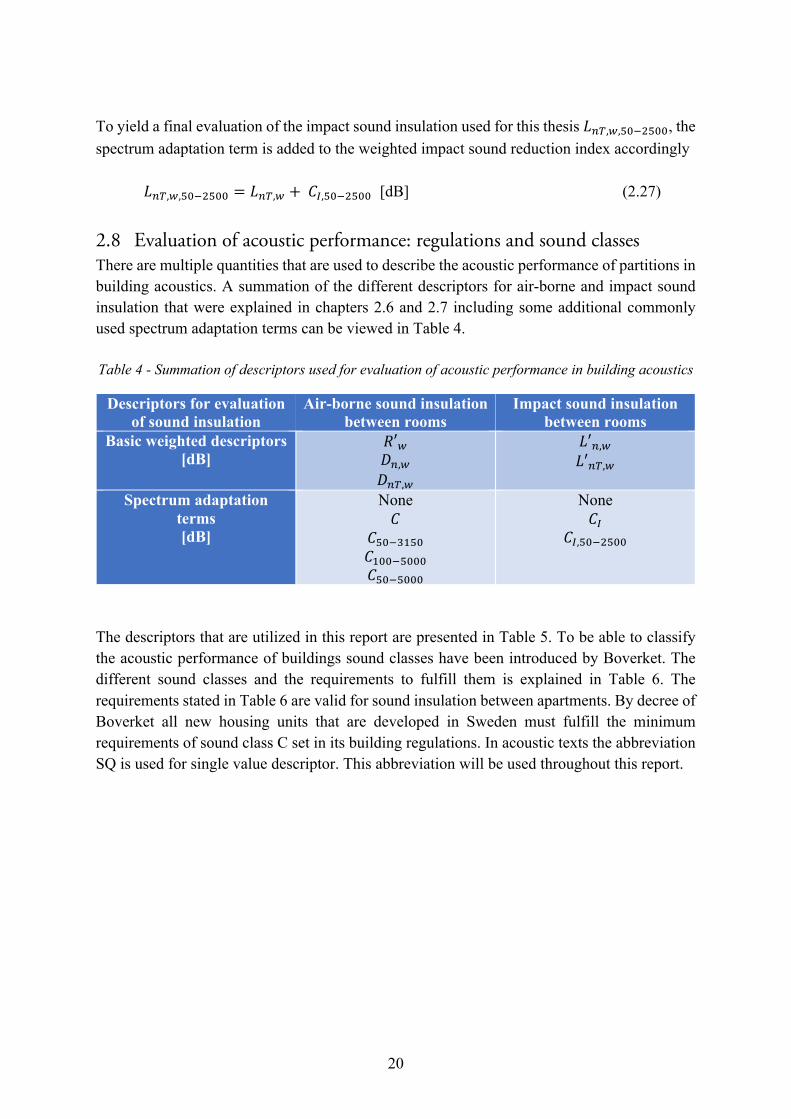
2.8 Evaluation of acoustic performance: regulations and sound classes There are multiple quantities that are used to describe the acoustic performance of partitions in building acoustics. A summation of the different descriptors for air-borne and impact sound insulation that were explained in chapters 2.6 and 2.7 including some additional commonly used spectrum adaptation terms can be viewed in Table 4. Table 4 - Summation of descriptors used for evaluation of acoustic performance in building acoustics
Descriptors for evaluation of sound insulation
Air-borne sound insulation between rooms
Impact sound insulation between rooms
Basic weighted descriptors [dB]
𝑅′& 𝐷F,& 𝐷F",&
𝐿′F,& 𝐿′F",&
Spectrum adaptation
terms [dB]
None 𝐶
𝐶:/+N!:/ 𝐶!//+:/// 𝐶:/+:///
None 𝐶O
𝐶O,:/+@://
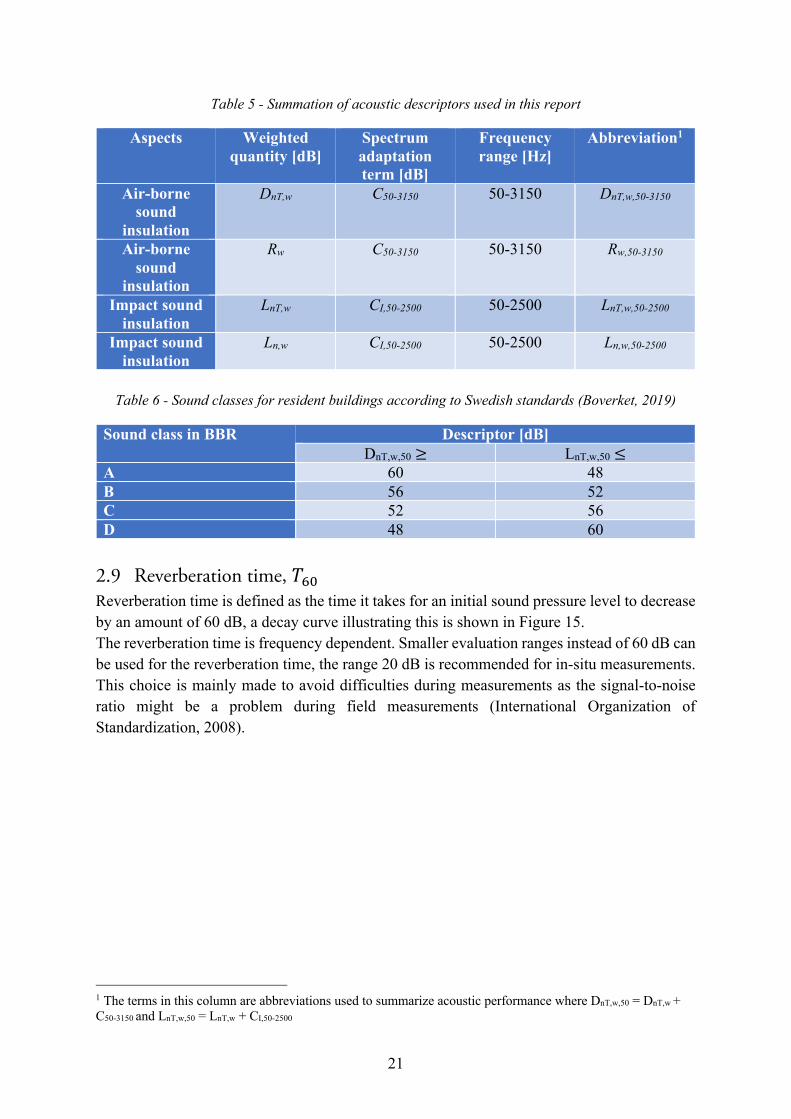
The descriptors that are utilized in this report are presented in Table 5. To be able to classify the acoustic performance of buildings sound classes have been introduced by Boverket. The different sound classes and the requirements to fulfill them is explained in Table 6. The requirements stated in Table 6 are valid for sound insulation between apartments. By decree of Boverket all new housing units that are developed in Sweden must fulfill the minimum requirements of sound class C set in its building regulations. In acoustic texts the abbreviation SQ is used for single value descriptor. This abbreviation will be used throughout this report.
21
Table 5 - Summation of acoustic descriptors used in this report
Aspects Weighted quantity [dB]
Spectrum adaptation term [dB]
Frequency range [Hz]
Abbreviation1
Air-borne sound
insulation
DnT,w C50-3150 50-3150 DnT,w,50-3150
Air-borne sound
insulation
Rw C50-3150 50-3150 Rw,50-3150
Impact sound insulation
LnT,w CI,50-2500 50-2500 LnT,w,50-2500
Impact sound insulation
Ln,w CI,50-2500 50-2500 Ln,w,50-2500
Table 6 - Sound classes for resident buildings according to Swedish standards (Boverket, 2019)
Sound class in BBR Descriptor [dB] DnT,w,50 ≥ LnT,w,50 ≤
A 60 48 B 56 52 C 52 56 D 48 60
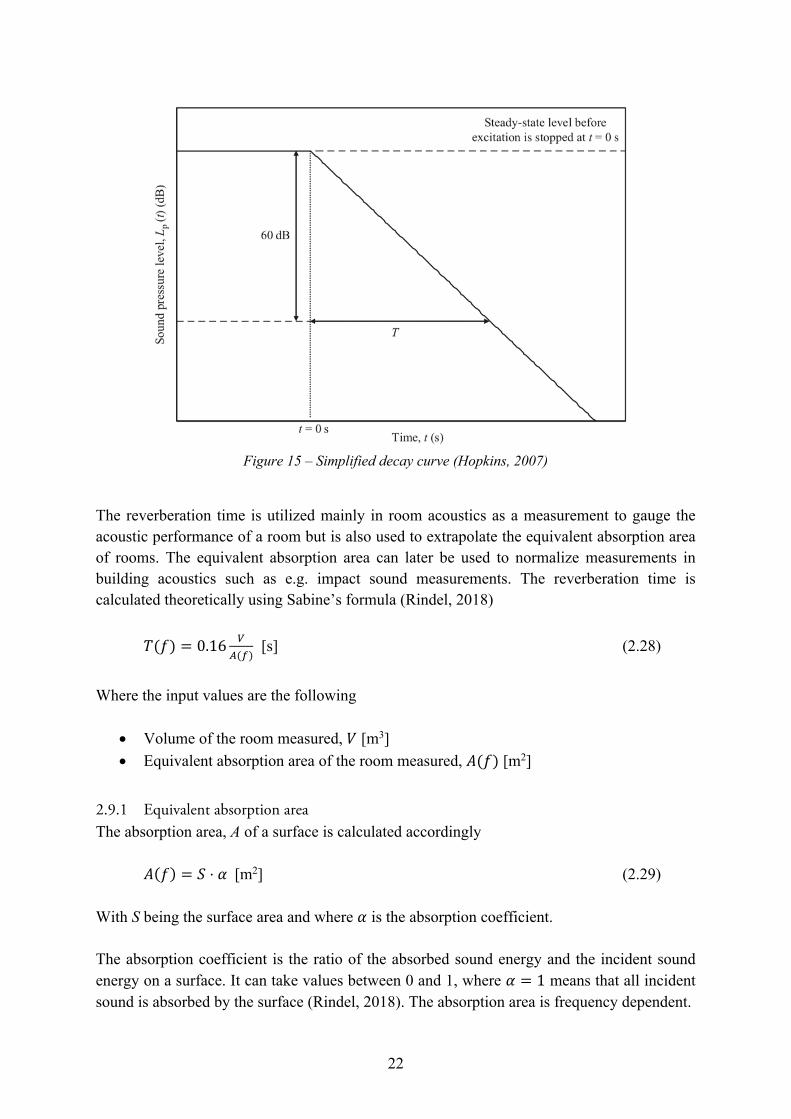
2.9 Reverberation time, 𝑇!" Reverberation time is defined as the time it takes for an initial sound pressure level to decrease by an amount of 60 dB, a decay curve illustrating this is shown in Figure 15. The reverberation time is frequency dependent. Smaller evaluation ranges instead of 60 dB can be used for the reverberation time, the range 20 dB is recommended for in-situ measurements. This choice is mainly made to avoid difficulties during measurements as the signal-to-noise ratio might be a problem during field measurements (International Organization of Standardization, 2008).
1 The terms in this column are abbreviations used to summarize acoustic performance where DnT,w,50 = DnT,w + C50-3150 and LnT,w,50 = LnT,w + CI,50-2500
22
Figure 15 – Simplified decay curve (Hopkins, 2007)
The reverberation time is utilized mainly in room acoustics as a measurement to gauge the acoustic performance of a room but is also used to extrapolate the equivalent absorption area of rooms. The equivalent absorption area can later be used to normalize measurements in building acoustics such as e.g. impact sound measurements. The reverberation time is calculated theoretically using Sabine’s formula (Rindel, 2018) 𝑇(𝑓) = 0.16 S
E(#) [s] (2.28)
Where the input values are the following
• Volume of the room measured, 𝑉 [m3] • Equivalent absorption area of the room measured, 𝐴(𝑓) [m2]
2.9.1 Equivalent absorption area The absorption area, A of a surface is calculated accordingly
𝐴(𝑓) = 𝑆 ⋅ 𝛼[m2] (2.29)
With S being the surface area and where 𝛼 is the absorption coefficient. The absorption coefficient is the ratio of the absorbed sound energy and the incident sound energy on a surface. It can take values between 0 and 1, where 𝛼 = 1 means that all incident sound is absorbed by the surface (Rindel, 2018). The absorption area is frequency dependent.
23
Using measurements of the reverberation time the equivalent absorption area of the room measured can be calculated (International Organization of Standardization, 2014) by re-writing Sabine’s formula as 𝐴(𝑓) = 0.16 S
" [m2] (2.30)
Where the input values are the following
• Volume of the measured room, 𝑉 [m3] • Reverberation time of the measured room, 𝑇T/ [s]
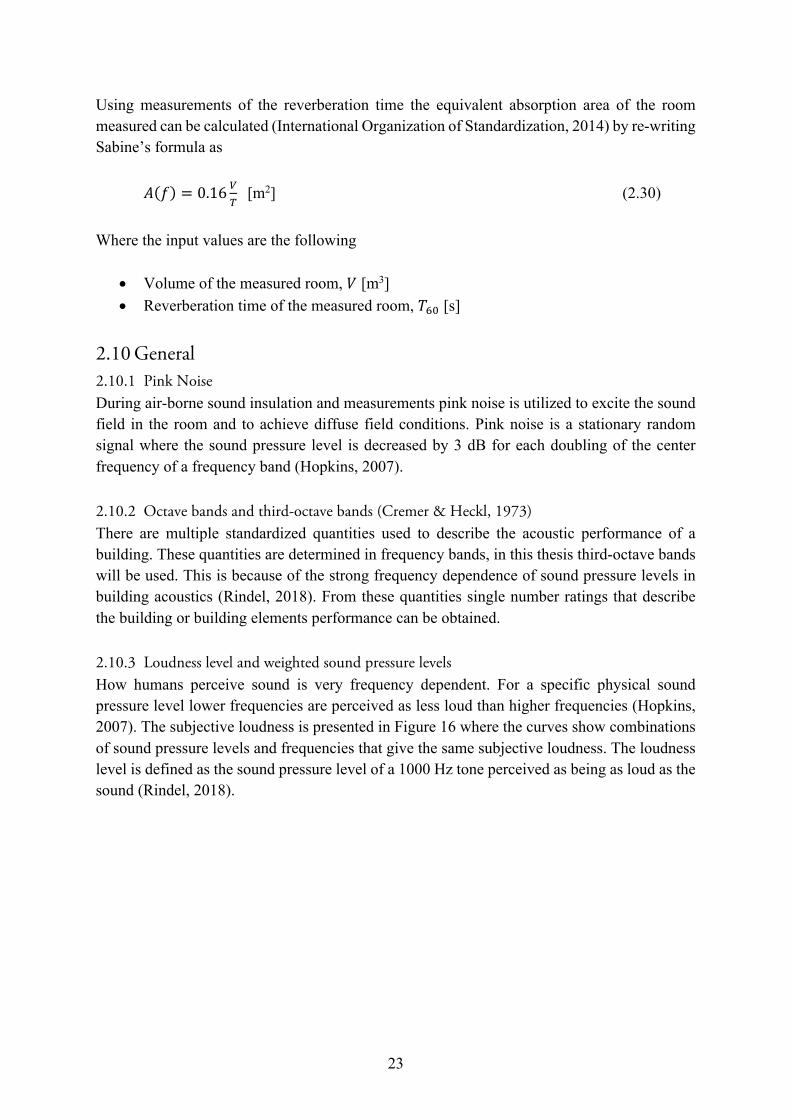
2.10 General 2.10.1 Pink Noise During air-borne sound insulation and measurements pink noise is utilized to excite the sound field in the room and to achieve diffuse field conditions. Pink noise is a stationary random signal where the sound pressure level is decreased by 3 dB for each doubling of the center frequency of a frequency band (Hopkins, 2007). 2.10.2 Octave bands and third-octave bands (Cremer & Heckl, 1973) There are multiple standardized quantities used to describe the acoustic performance of a building. These quantities are determined in frequency bands, in this thesis third-octave bands will be used. This is because of the strong frequency dependence of sound pressure levels in building acoustics (Rindel, 2018). From these quantities single number ratings that describe the building or building elements performance can be obtained. 2.10.3 Loudness level and weighted sound pressure levels How humans perceive sound is very frequency dependent. For a specific physical sound pressure level lower frequencies are perceived as less loud than higher frequencies (Hopkins, 2007). The subjective loudness is presented in Figure 16 where the curves show combinations of sound pressure levels and frequencies that give the same subjective loudness. The loudness level is defined as the sound pressure level of a 1000 Hz tone perceived as being as loud as the sound (Rindel, 2018).
24
Figure 16 - Phon curves (Rindel, 2018)
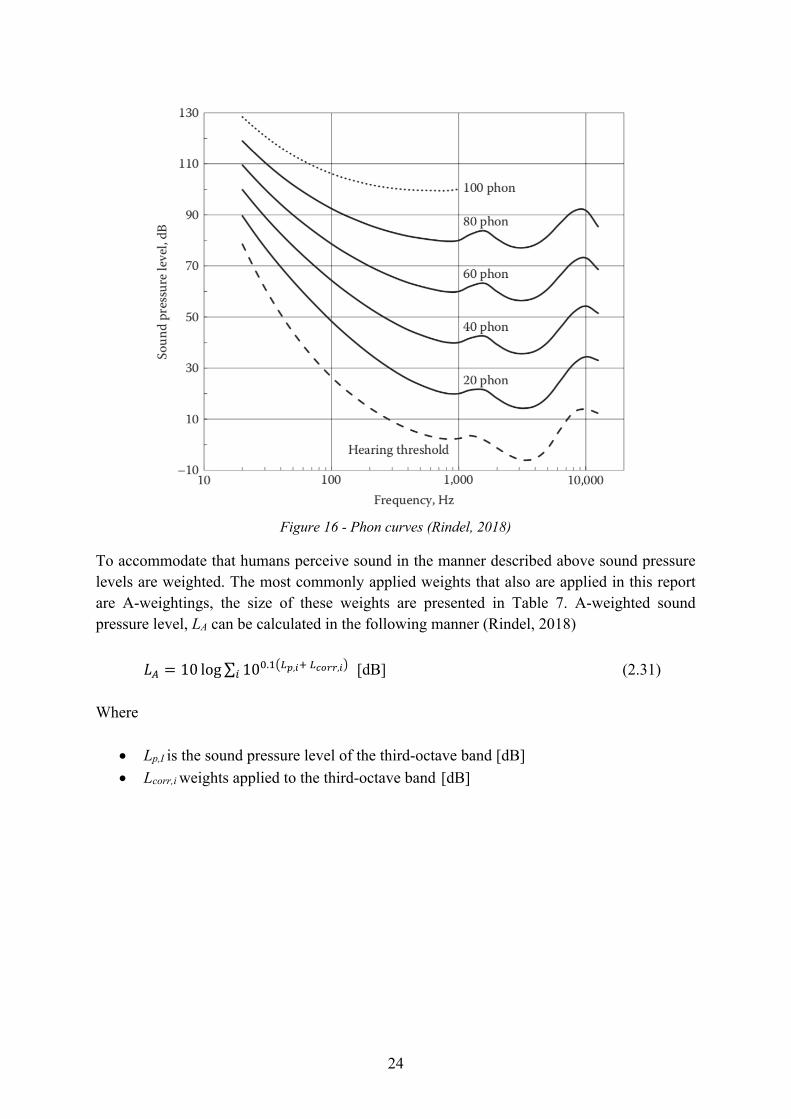
To accommodate that humans perceive sound in the manner described above sound pressure levels are weighted. The most commonly applied weights that also are applied in this report are A-weightings, the size of these weights are presented in Table 7. A-weighted sound pressure level, LA can be calculated in the following manner (Rindel, 2018)
𝐿E = 10 log∑ 10/.!HI*,'VI,-##,'K- [dB] (2.31) Where
• Lp,I is the sound pressure level of the third-octave band [dB] • Lcorr,i weights applied to the third-octave band [dB]
25
Table 7 - A-Weightings (Rindel, 2018)
2.10.4 Standing waves in rectangular rooms Standing waves, also known as modes of a room are phenomenon that occur in rectangular rooms where certain frequencies in the sound field are amplified through resonance. The frequencies that are amplified depend on the dimensions of the room, standing waves arise if a multiple of half the wave length fits between the boundary surface of a room. Each frequency corresponding to a mode is called an eigenfrequency, fn and is given by
𝑓F =W@^NF.
8.O@+ _F/
8/`@+ NF0
80O@ [Hz] (2.32)
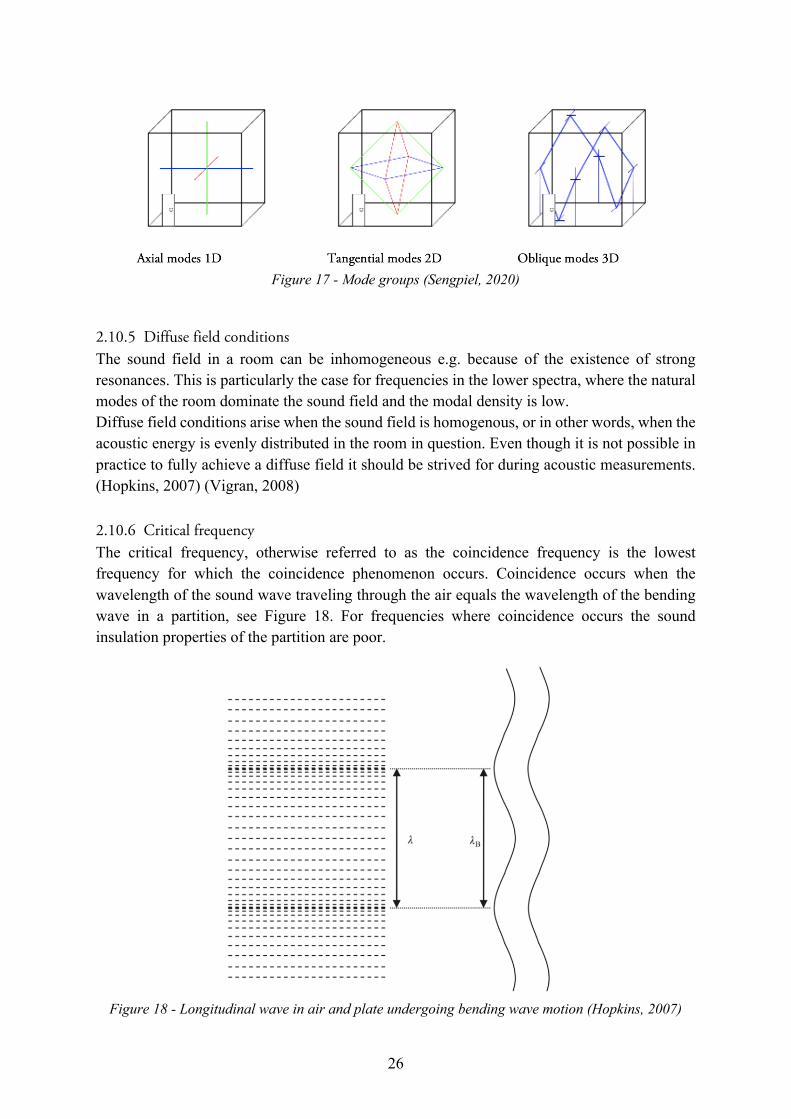
Where lx, ly and lz are the room dimensions and nx, ny and nz are number representing the mode. E.g. nx > 0 specifies a one-dimensional axial mode. The mode groups are illustrated in Figure 17. There are three different types of modes and they are axial, tangential and oblique modes. Each mode group represents sound pressure amplitude variations in different direction. Where the sound pressure amplitude in axial modes only vary in one direction while it varies in two and three directions for tangential and oblique mode groups respectively (Rindel, 2018).
26
Figure 17 - Mode groups (Sengpiel, 2020)
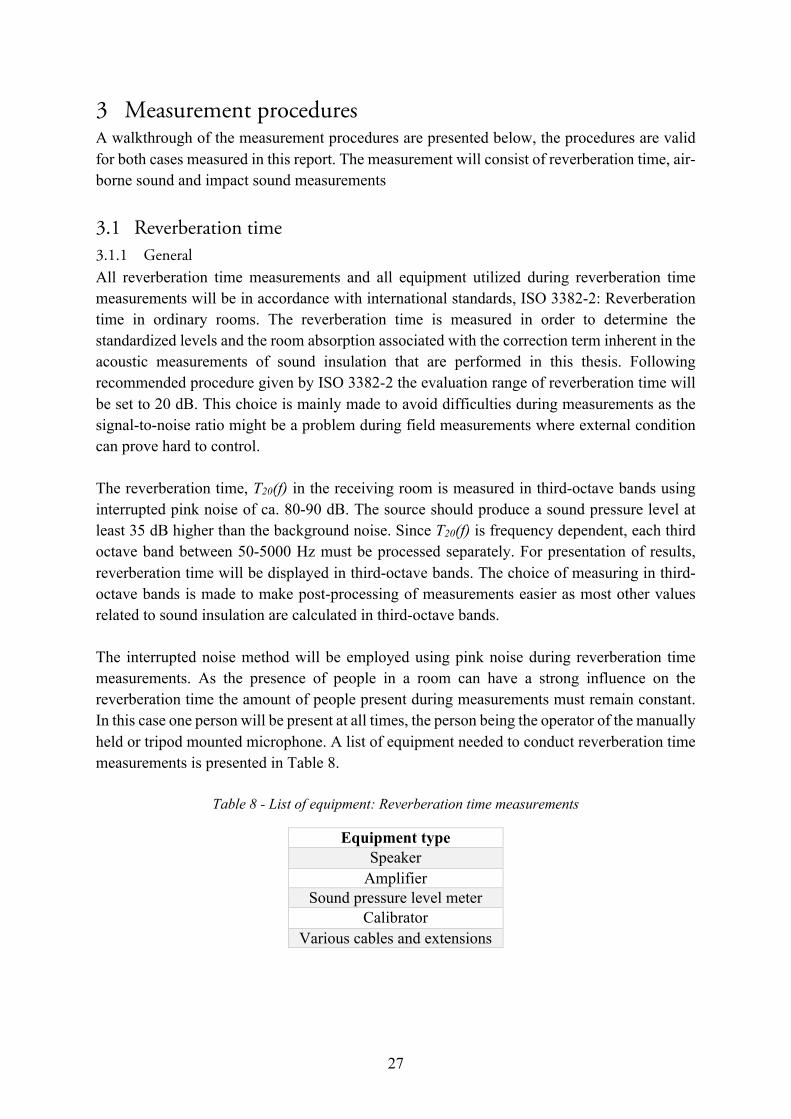
2.10.5 Diffuse field conditions The sound field in a room can be inhomogeneous e.g. because of the existence of strong resonances. This is particularly the case for frequencies in the lower spectra, where the natural modes of the room dominate the sound field and the modal density is low. Diffuse field conditions arise when the sound field is homogenous, or in other words, when the acoustic energy is evenly distributed in the room in question. Even though it is not possible in practice to fully achieve a diffuse field it should be strived for during acoustic measurements. (Hopkins, 2007) (Vigran, 2008) 2.10.6 Critical frequency The critical frequency, otherwise referred to as the coincidence frequency is the lowest frequency for which the coincidence phenomenon occurs. Coincidence occurs when the wavelength of the sound wave traveling through the air equals the wavelength of the bending wave in a partition, see Figure 18. For frequencies where coincidence occurs the sound insulation properties of the partition are poor.
Figure 18 - Longitudinal wave in air and plate undergoing bending wave motion (Hopkins, 2007)
27
3 Measurement procedures A walkthrough of the measurement procedures are presented below, the procedures are valid for both cases measured in this report. The measurement will consist of reverberation time, air-borne sound and impact sound measurements
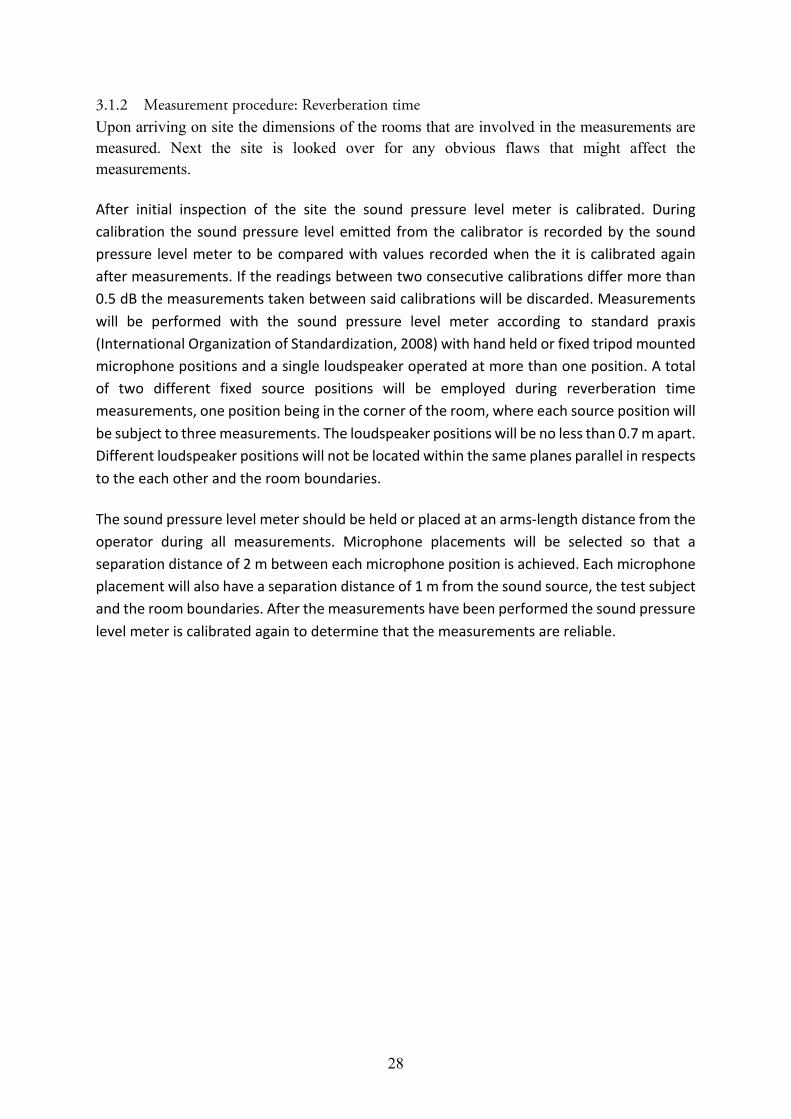
3.1 Reverberation time 3.1.1 General All reverberation time measurements and all equipment utilized during reverberation time measurements will be in accordance with international standards, ISO 3382-2: Reverberation time in ordinary rooms. The reverberation time is measured in order to determine the standardized levels and the room absorption associated with the correction term inherent in the acoustic measurements of sound insulation that are performed in this thesis. Following recommended procedure given by ISO 3382-2 the evaluation range of reverberation time will be set to 20 dB. This choice is mainly made to avoid difficulties during measurements as the signal-to-noise ratio might be a problem during field measurements where external condition can prove hard to control. The reverberation time, T20(f) in the receiving room is measured in third-octave bands using interrupted pink noise of ca. 80-90 dB. The source should produce a sound pressure level at least 35 dB higher than the background noise. Since T20(f) is frequency dependent, each third octave band between 50-5000 Hz must be processed separately. For presentation of results, reverberation time will be displayed in third-octave bands. The choice of measuring in third-octave bands is made to make post-processing of measurements easier as most other values related to sound insulation are calculated in third-octave bands. The interrupted noise method will be employed using pink noise during reverberation time measurements. As the presence of people in a room can have a strong influence on the reverberation time the amount of people present during measurements must remain constant. In this case one person will be present at all times, the person being the operator of the manually held or tripod mounted microphone. A list of equipment needed to conduct reverberation time measurements is presented in Table 8.
Table 8 - List of equipment: Reverberation time measurements
Equipment type Speaker
Amplifier Sound pressure level meter
Calibrator Various cables and extensions
28
3.1.2 Measurement procedure: Reverberation time Upon arriving on site the dimensions of the rooms that are involved in the measurements are measured. Next the site is looked over for any obvious flaws that might affect the measurements.
After initial inspection of the site the sound pressure level meter is calibrated. During calibration the sound pressure level emitted from the calibrator is recorded by the sound pressure level meter to be compared with values recorded when the it is calibrated again after measurements. If the readings between two consecutive calibrations differ more than 0.5 dB the measurements taken between said calibrations will be discarded. Measurements will be performed with the sound pressure level meter according to standard praxis (International Organization of Standardization, 2008) with hand held or fixed tripod mounted microphone positions and a single loudspeaker operated at more than one position. A total of two different fixed source positions will be employed during reverberation time measurements, one position being in the corner of the room, where each source position will be subject to three measurements. The loudspeaker positions will be no less than 0.7 m apart. Different loudspeaker positions will not be located within the same planes parallel in respects to the each other and the room boundaries.
The sound pressure level meter should be held or placed at an arms-length distance from the operator during all measurements. Microphone placements will be selected so that a separation distance of 2 m between each microphone position is achieved. Each microphone placement will also have a separation distance of 1 m from the sound source, the test subject and the room boundaries. After the measurements have been performed the sound pressure level meter is calibrated again to determine that the measurements are reliable.
29
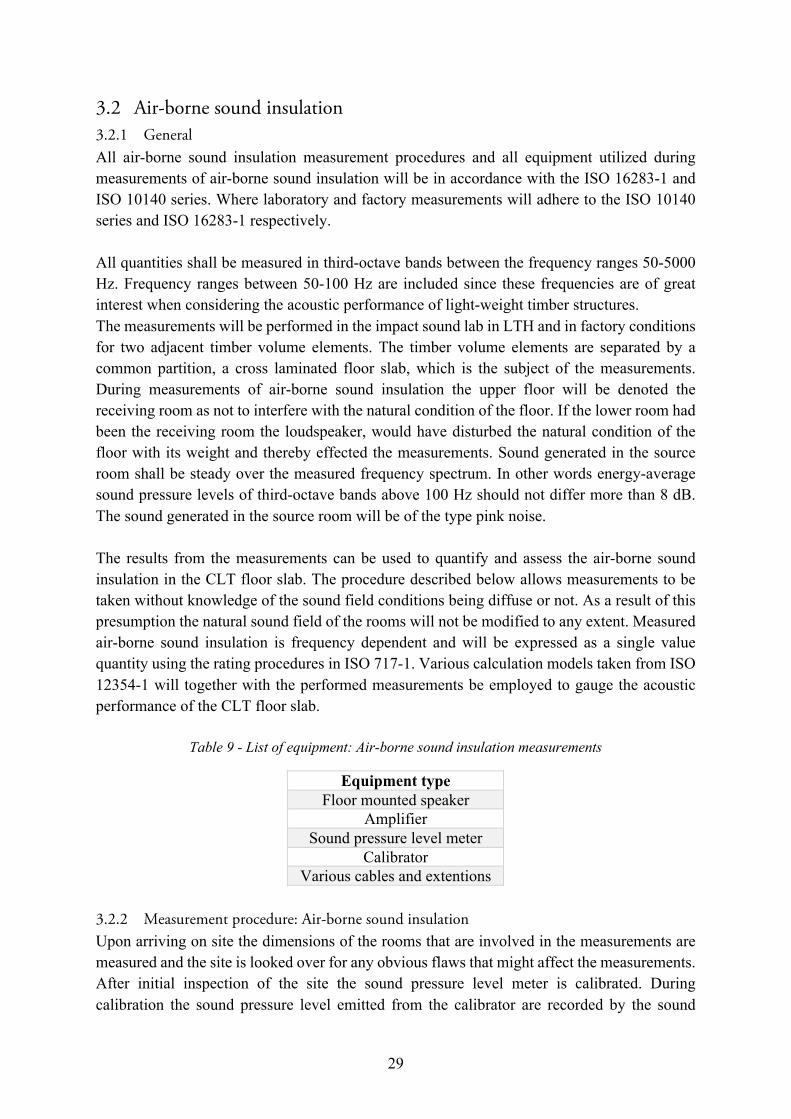
3.2 Air-borne sound insulation 3.2.1 General All air-borne sound insulation measurement procedures and all equipment utilized during measurements of air-borne sound insulation will be in accordance with the ISO 16283-1 and ISO 10140 series. Where laboratory and factory measurements will adhere to the ISO 10140 series and ISO 16283-1 respectively. All quantities shall be measured in third-octave bands between the frequency ranges 50-5000 Hz. Frequency ranges between 50-100 Hz are included since these frequencies are of great interest when considering the acoustic performance of light-weight timber structures. The measurements will be performed in the impact sound lab in LTH and in factory conditions for two adjacent timber volume elements. The timber volume elements are separated by a common partition, a cross laminated floor slab, which is the subject of the measurements. During measurements of air-borne sound insulation the upper floor will be denoted the receiving room as not to interfere with the natural condition of the floor. If the lower room had been the receiving room the loudspeaker, would have disturbed the natural condition of the floor with its weight and thereby effected the measurements. Sound generated in the source room shall be steady over the measured frequency spectrum. In other words energy-average sound pressure levels of third-octave bands above 100 Hz should not differ more than 8 dB. The sound generated in the source room will be of the type pink noise. The results from the measurements can be used to quantify and assess the air-borne sound insulation in the CLT floor slab. The procedure described below allows measurements to be taken without knowledge of the sound field conditions being diffuse or not. As a result of this presumption the natural sound field of the rooms will not be modified to any extent. Measured air-borne sound insulation is frequency dependent and will be expressed as a single value quantity using the rating procedures in ISO 717-1. Various calculation models taken from ISO 12354-1 will together with the performed measurements be employed to gauge the acoustic performance of the CLT floor slab.
Table 9 - List of equipment: Air-borne sound insulation measurements
Equipment type Floor mounted speaker
Amplifier Sound pressure level meter
Calibrator Various cables and extentions
3.2.2 Measurement procedure: Air-borne sound insulation Upon arriving on site the dimensions of the rooms that are involved in the measurements are measured and the site is looked over for any obvious flaws that might affect the measurements. After initial inspection of the site the sound pressure level meter is calibrated. During calibration the sound pressure level emitted from the calibrator are recorded by the sound
30
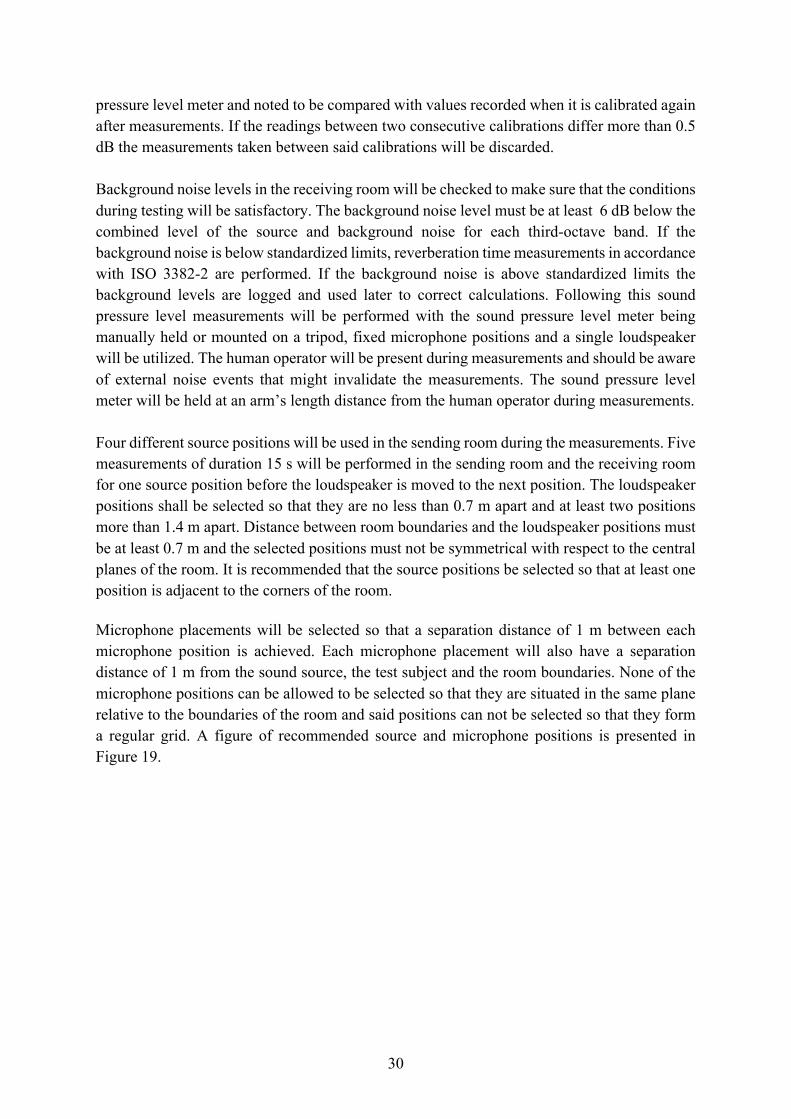
pressure level meter and noted to be compared with values recorded when it is calibrated again after measurements. If the readings between two consecutive calibrations differ more than 0.5 dB the measurements taken between said calibrations will be discarded. Background noise levels in the receiving room will be checked to make sure that the conditions during testing will be satisfactory. The background noise level must be at least 6 dB below the combined level of the source and background noise for each third-octave band. If the background noise is below standardized limits, reverberation time measurements in accordance with ISO 3382-2 are performed. If the background noise is above standardized limits the background levels are logged and used later to correct calculations. Following this sound pressure level measurements will be performed with the sound pressure level meter being manually held or mounted on a tripod, fixed microphone positions and a single loudspeaker will be utilized. The human operator will be present during measurements and should be aware of external noise events that might invalidate the measurements. The sound pressure level meter will be held at an arm’s length distance from the human operator during measurements. Four different source positions will be used in the sending room during the measurements. Five measurements of duration 15 s will be performed in the sending room and the receiving room for one source position before the loudspeaker is moved to the next position. The loudspeaker positions shall be selected so that they are no less than 0.7 m apart and at least two positions more than 1.4 m apart. Distance between room boundaries and the loudspeaker positions must be at least 0.7 m and the selected positions must not be symmetrical with respect to the central planes of the room. It is recommended that the source positions be selected so that at least one position is adjacent to the corners of the room.
Microphone placements will be selected so that a separation distance of 1 m between each microphone position is achieved. Each microphone placement will also have a separation distance of 1 m from the sound source, the test subject and the room boundaries. None of the microphone positions can be allowed to be selected so that they are situated in the same plane relative to the boundaries of the room and said positions can not be selected so that they form a regular grid. A figure of recommended source and microphone positions is presented in Figure 19.
31
o – Source positions
x – Microphone positions Figure 19 - Recommended source and microphone positions (International Organization of
Standardization, 2014)
After the measurements have been performed the sound pressure level meter is calibrated again to determine that the measurements are reliable. From the measurements various descriptors for the evaluation of air-borne sound insulation can be calculated.
32
3.3 Impact sound insulation 3.3.1 General All impact sound insulation measurements and all equipment utilized during said measurements will be in accordance with international standards, ISO 16283-2, ISO 10140-1, ISO 10140-3, ISO 10140-4 and ISO 10140-5. Measurements taken in laboratory and factory conditions will adhere to the IS0 10140 series and ISO 16283-2 respectively.All quantities shall be measured with third-octave bands between the frequency ranges 50-5000 Hz. Frequency ranges between 50-100 Hz are included since these frequencies are of great interest when considering the acoustic performance of light-weight structures. The measurements will be performed in the step sound laboratory in LTH and in factory conditions for two timber volume elements located in Gothenburg. The timber volume elements are vertically adjacent and are separated by a common partition, a cross laminated floor slab, which is the subject of the measurements. During measurements of impact sound pressure levels the upper floor will be denoted the sending room. The impact sound source utilized to assess the impact sound pressure levels during the measurements will be a standardized tapping machine, a picture of a tapping machine is presented in Figure 13. The results from the measurements can be used to quantify and assess the impact sound insulation in the CLT floor slab. The procedure described below allows measurements to be taken without knowledge of the sound field conditions being diffuse or not. As a result of this presumption the natural sound field of the rooms will not be modified to any extent. Measured impact sound insulation is frequency dependent and will be expressed in a single number value quantity using the rating procedures in ISO 717-2. Various calculation models taken from ISO 12354-2 will together with the performed measurements be employed to gauge the acoustic performance of the CLT floor slab.
Table 10 - List of required equipment: Impact sound insulation measurements
Equipment type Standardized tapping machine
Sound pressure level meter Calibrator
Various cables and extensions 3.3.2 Measurement procedure: Impact sound insulation Upon arriving on site the dimensions of the rooms that are involved in the measurements are measured and the site is looked over for any obvious flaws that might affect the measurements. After initial inspection of the site the sound pressure level meter is calibrated. During calibration the sound pressure level recorded by the sound pressure level meter from the sound level meter calibrator is noted to be compared with values recorded when it is calibrated again after measurements. If the readings between two consecutive calibrations differ more than 0.5 dB the measurements taken between said calibrations will be discarded.
33
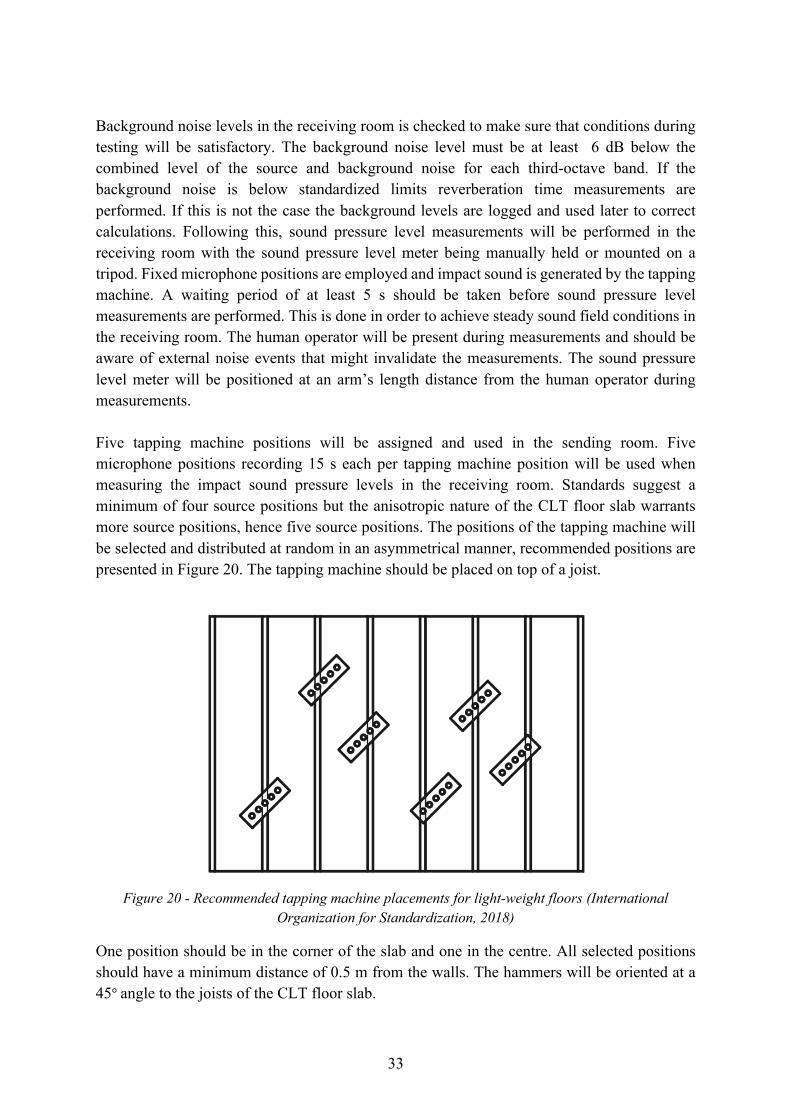
Background noise levels in the receiving room is checked to make sure that conditions during testing will be satisfactory. The background noise level must be at least 6 dB below the combined level of the source and background noise for each third-octave band. If the background noise is below standardized limits reverberation time measurements are performed. If this is not the case the background levels are logged and used later to correct calculations. Following this, sound pressure level measurements will be performed in the receiving room with the sound pressure level meter being manually held or mounted on a tripod. Fixed microphone positions are employed and impact sound is generated by the tapping machine. A waiting period of at least 5 s should be taken before sound pressure level measurements are performed. This is done in order to achieve steady sound field conditions in the receiving room. The human operator will be present during measurements and should be aware of external noise events that might invalidate the measurements. The sound pressure level meter will be positioned at an arm’s length distance from the human operator during measurements. Five tapping machine positions will be assigned and used in the sending room. Five microphone positions recording 15 s each per tapping machine position will be used when measuring the impact sound pressure levels in the receiving room. Standards suggest a minimum of four source positions but the anisotropic nature of the CLT floor slab warrants more source positions, hence five source positions. The positions of the tapping machine will be selected and distributed at random in an asymmetrical manner, recommended positions are presented in Figure 20. The tapping machine should be placed on top of a joist.
Figure 20 - Recommended tapping machine placements for light-weight floors (International
Organization for Standardization, 2018)
One position should be in the corner of the slab and one in the centre. All selected positions should have a minimum distance of 0.5 m from the walls. The hammers will be oriented at a 45°angle to the joists of the CLT floor slab.

34
Microphone placements will be selected so that a separation distance of 1 m between each microphone position is achieved. Each microphone placement will also have a separation distance of 1 m from the sound source, the test subject and the room boundaries. None of the microphone positions can be allowed to be selected so that they are situated in the same plane relative to the boundaries of the room and said positions cannot be selected so that they form a regular grid. See Figure 19.
After the measurements have been performed the sound pressure level meter is calibrated again to determine that the measurements are reliable. From the measurements various descriptors for the evaluation of impact sound insulation can be calculated.
35
4 Implementation The implementation of the measurement procedures detailed in chapter 3 is explained in this section. All procedures are based on the ISO-10140 and ISO-16283 series. Some deviations from the procedures will be present because of the conditions of testing facilities, object of measurement and equipment being utilized.
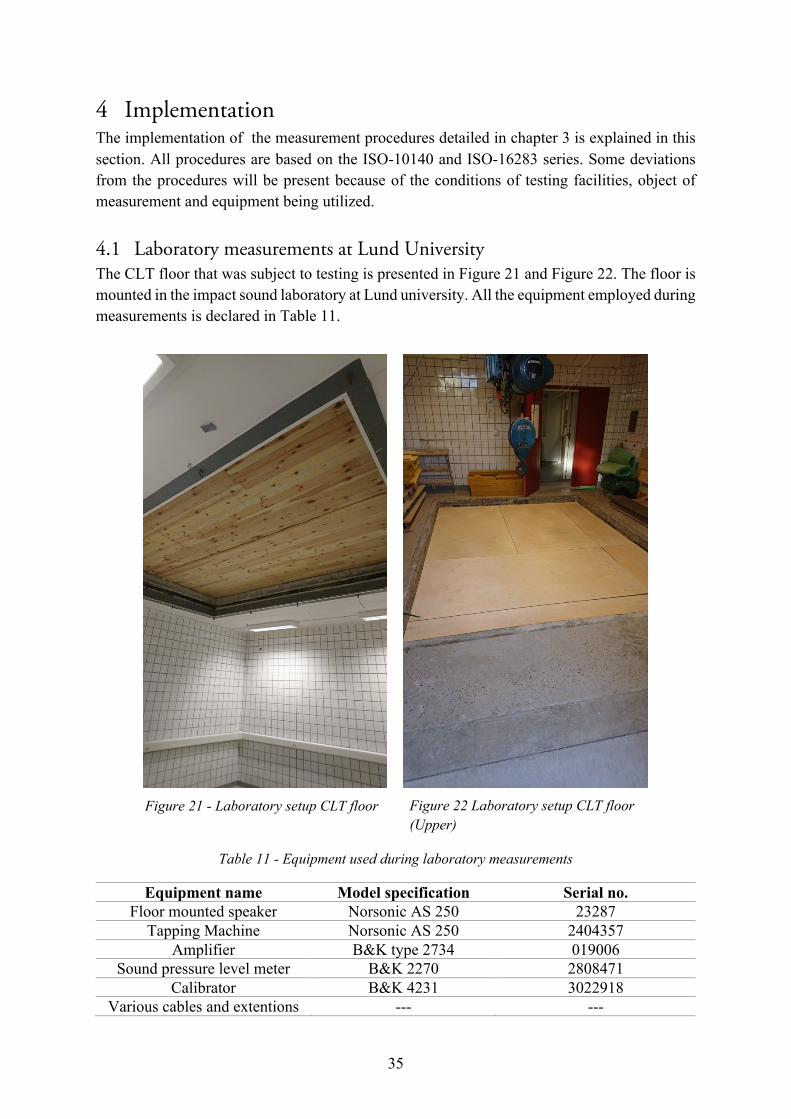
4.1 Laboratory measurements at Lund University The CLT floor that was subject to testing is presented in Figure 21 and Figure 22. The floor is mounted in the impact sound laboratory at Lund university. All the equipment employed during measurements is declared in Table 11.
Table 11 - Equipment used during laboratory measurements
Equipment name Model specification Serial no. Floor mounted speaker Norsonic AS 250 23287
Tapping Machine Norsonic AS 250 2404357 Amplifier B&K type 2734 019006
Sound pressure level meter B&K 2270 2808471 Calibrator B&K 4231 3022918
Various cables and extentions --- ---
Figure 21 - Laboratory setup CLT floor (Lower)
Figure 22 Laboratory setup CLT floor (Upper)
36
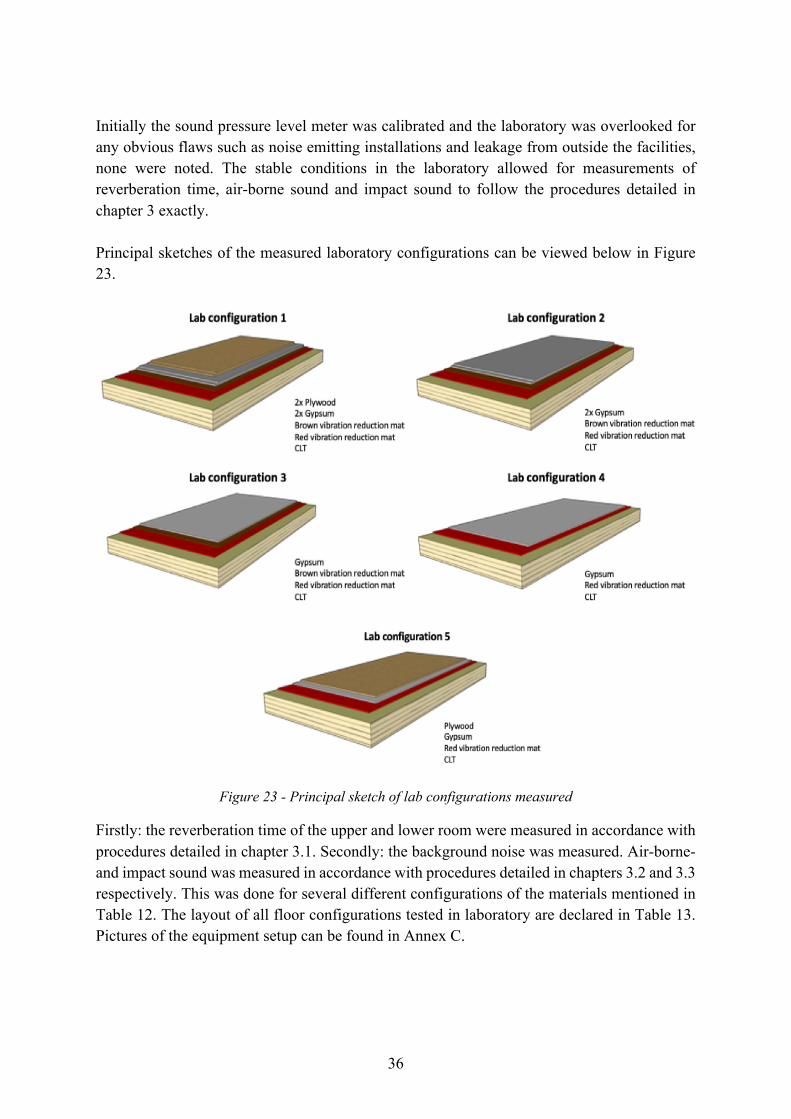
Initially the sound pressure level meter was calibrated and the laboratory was overlooked for any obvious flaws such as noise emitting installations and leakage from outside the facilities, none were noted. The stable conditions in the laboratory allowed for measurements of reverberation time, air-borne sound and impact sound to follow the procedures detailed in chapter 3 exactly. Principal sketches of the measured laboratory configurations can be viewed below in Figure 23.
Figure 23 - Principal sketch of lab configurations measured
Firstly: the reverberation time of the upper and lower room were measured in accordance with procedures detailed in chapter 3.1. Secondly: the background noise was measured. Air-borne- and impact sound was measured in accordance with procedures detailed in chapters 3.2 and 3.3 respectively. This was done for several different configurations of the materials mentioned in Table 12. The layout of all floor configurations tested in laboratory are declared in Table 13. Pictures of the equipment setup can be found in Annex C.
37
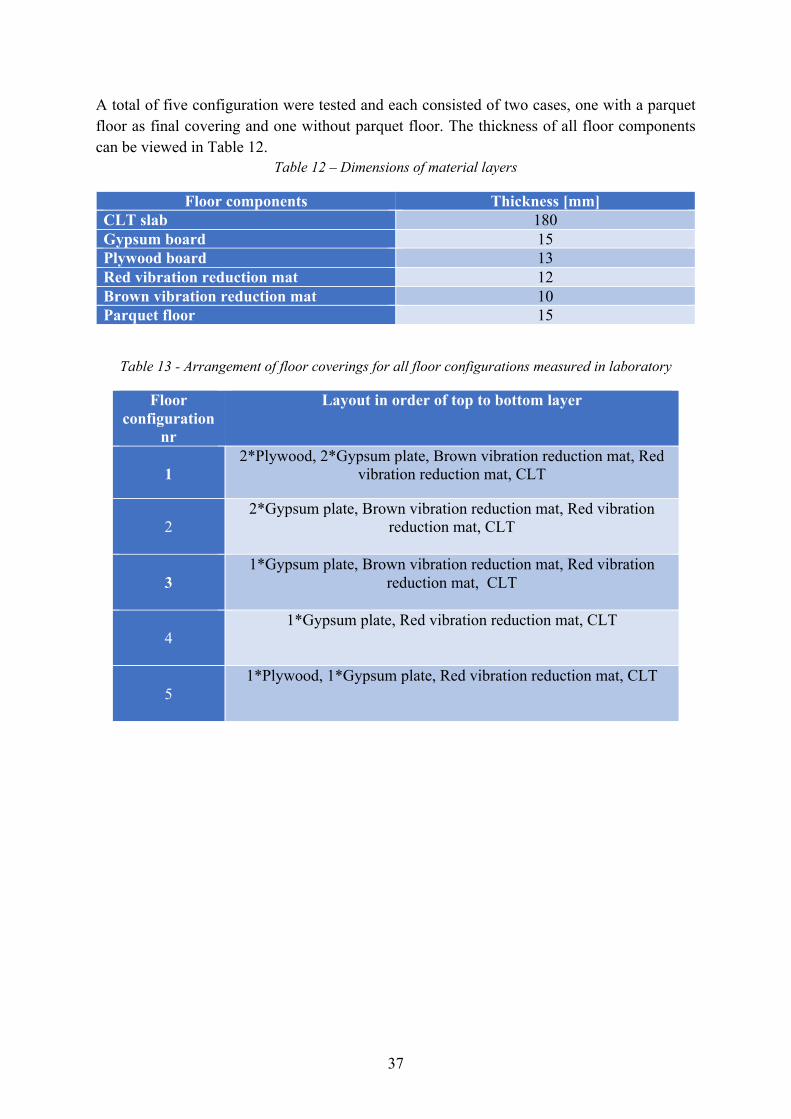
A total of five configuration were tested and each consisted of two cases, one with a parquet floor as final covering and one without parquet floor. The thickness of all floor components can be viewed in Table 12.
Table 12 – Dimensions of material layers
Floor components Thickness [mm] CLT slab 180 Gypsum board 15 Plywood board 13 Red vibration reduction mat 12 Brown vibration reduction mat 10 Parquet floor 15
Table 13 - Arrangement of floor coverings for all floor configurations measured in laboratory
Floor configuration
nr
Layout in order of top to bottom layer
1
2*Plywood, 2*Gypsum plate, Brown vibration reduction mat, Red vibration reduction mat, CLT
2
2*Gypsum plate, Brown vibration reduction mat, Red vibration reduction mat, CLT
3
1*Gypsum plate, Brown vibration reduction mat, Red vibration reduction mat, CLT
4
1*Gypsum plate, Red vibration reduction mat, CLT
5
1*Plywood, 1*Gypsum plate, Red vibration reduction mat, CLT
38
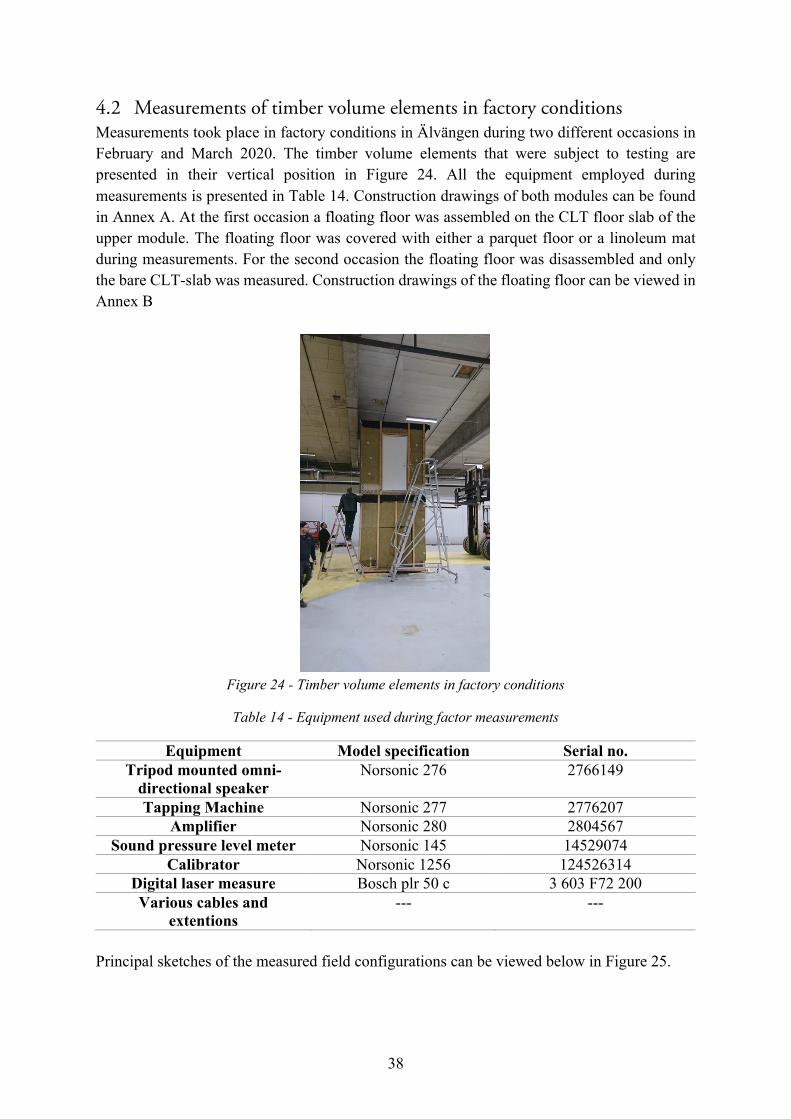
4.2 Measurements of timber volume elements in factory conditions Measurements took place in factory conditions in Älvängen during two different occasions in February and March 2020. The timber volume elements that were subject to testing are presented in their vertical position in Figure 24. All the equipment employed during measurements is presented in Table 14. Construction drawings of both modules can be found in Annex A. At the first occasion a floating floor was assembled on the CLT floor slab of the upper module. The floating floor was covered with either a parquet floor or a linoleum mat during measurements. For the second occasion the floating floor was disassembled and only the bare CLT-slab was measured. Construction drawings of the floating floor can be viewed in Annex B
Figure 24 - Timber volume elements in factory conditions
Table 14 - Equipment used during factor measurements
Equipment Model specification Serial no. Tripod mounted omni-
directional speaker Norsonic 276 2766149
Tapping Machine Norsonic 277 2776207 Amplifier Norsonic 280 2804567
Sound pressure level meter Norsonic 145 14529074 Calibrator Norsonic 1256 124526314
Digital laser measure Bosch plr 50 c 3 603 F72 200 Various cables and
extentions --- ---
Principal sketches of the measured field configurations can be viewed below in Figure 25.
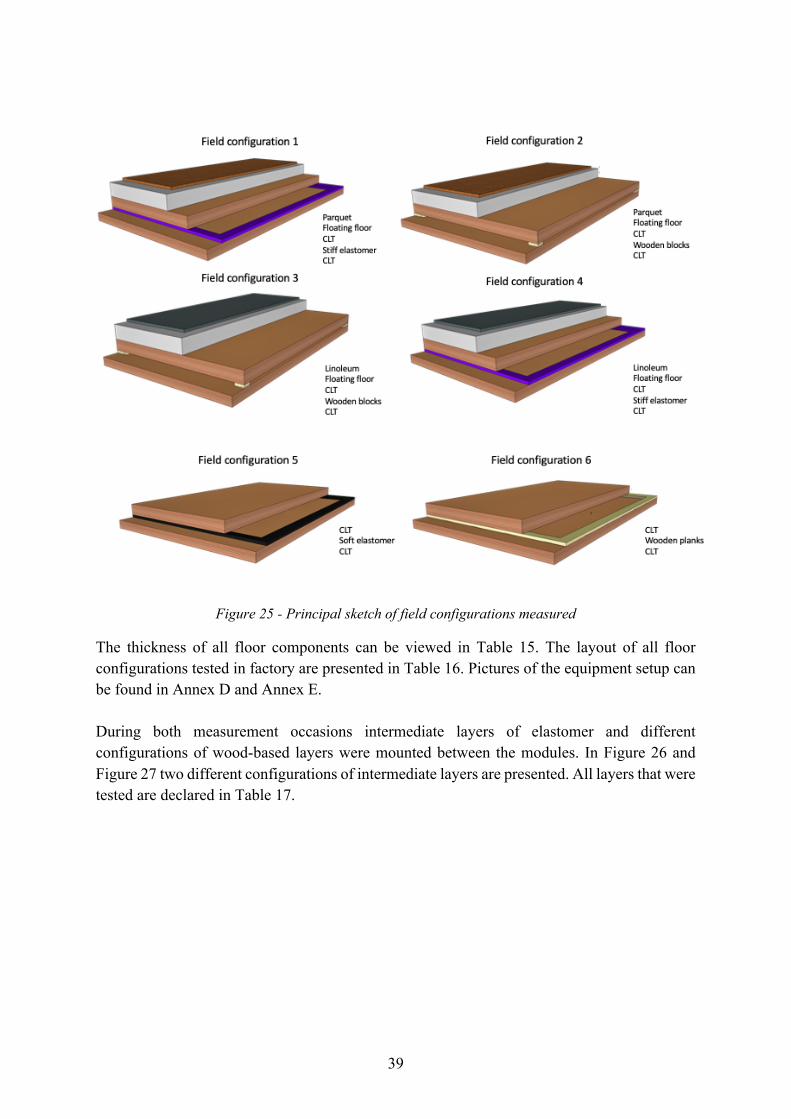
39
Figure 25 - Principal sketch of field configurations measured
The thickness of all floor components can be viewed in Table 15. The layout of all floor configurations tested in factory are presented in Table 16. Pictures of the equipment setup can be found in Annex D and Annex E. During both measurement occasions intermediate layers of elastomer and different configurations of wood-based layers were mounted between the modules. In Figure 26 and Figure 27 two different configurations of intermediate layers are presented. All layers that were tested are declared in Table 17.
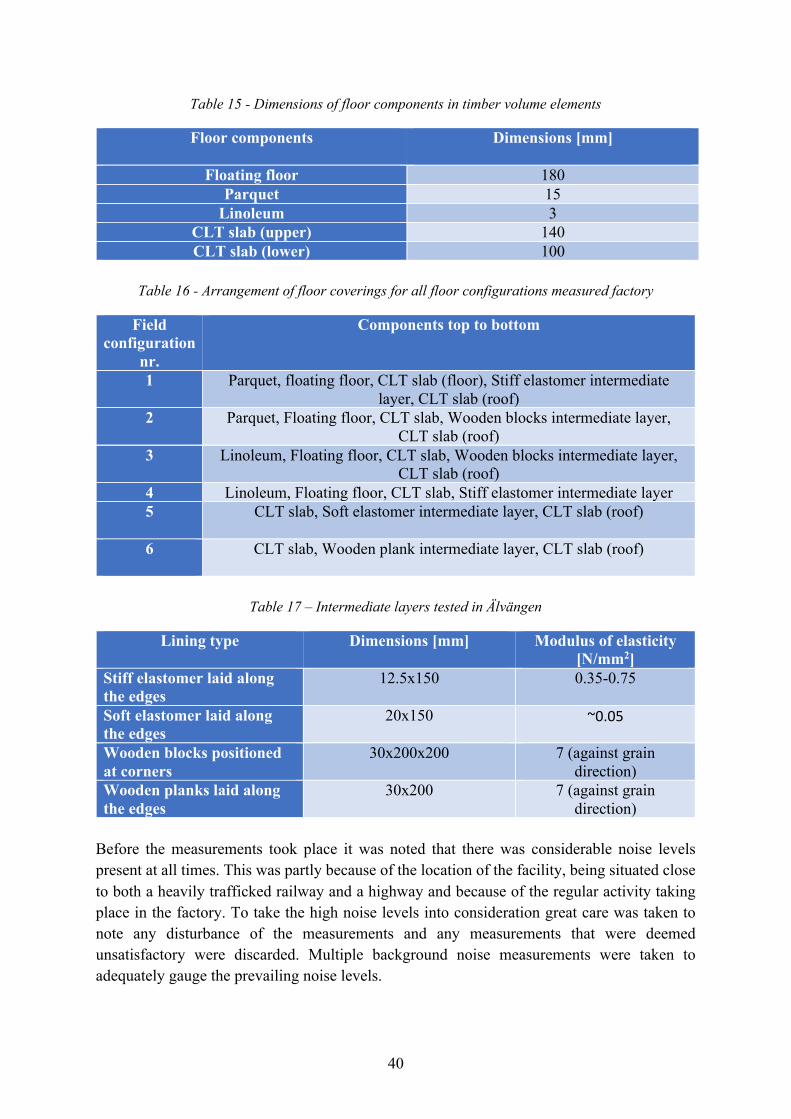
40
Table 15 - Dimensions of floor components in timber volume elements
Floor components Dimensions [mm]
Floating floor 180 Parquet 15
Linoleum 3 CLT slab (upper) 140 CLT slab (lower) 100
Table 16 - Arrangement of floor coverings for all floor configurations measured factory
Field configuration
nr.
Components top to bottom
1 Parquet, floating floor, CLT slab (floor), Stiff elastomer intermediate layer, CLT slab (roof)
2 Parquet, Floating floor, CLT slab, Wooden blocks intermediate layer, CLT slab (roof)
3 Linoleum, Floating floor, CLT slab, Wooden blocks intermediate layer, CLT slab (roof)
4 Linoleum, Floating floor, CLT slab, Stiff elastomer intermediate layer 5
CLT slab, Soft elastomer intermediate layer, CLT slab (roof)
6
CLT slab, Wooden plank intermediate layer, CLT slab (roof)
Table 17 – Intermediate layers tested in Älvängen
Lining type Dimensions [mm] Modulus of elasticity [N/mm2]
Stiff elastomer laid along the edges
12.5x150 0.35-0.75
Soft elastomer laid along the edges
20x150 ~0.05
Wooden blocks positioned at corners
30x200x200 7 (against grain direction)
Wooden planks laid along the edges
30x200 7 (against grain direction)
Before the measurements took place it was noted that there was considerable noise levels present at all times. This was partly because of the location of the facility, being situated close to both a heavily trafficked railway and a highway and because of the regular activity taking place in the factory. To take the high noise levels into consideration great care was taken to note any disturbance of the measurements and any measurements that were deemed unsatisfactory were discarded. Multiple background noise measurements were taken to adequately gauge the prevailing noise levels.
41
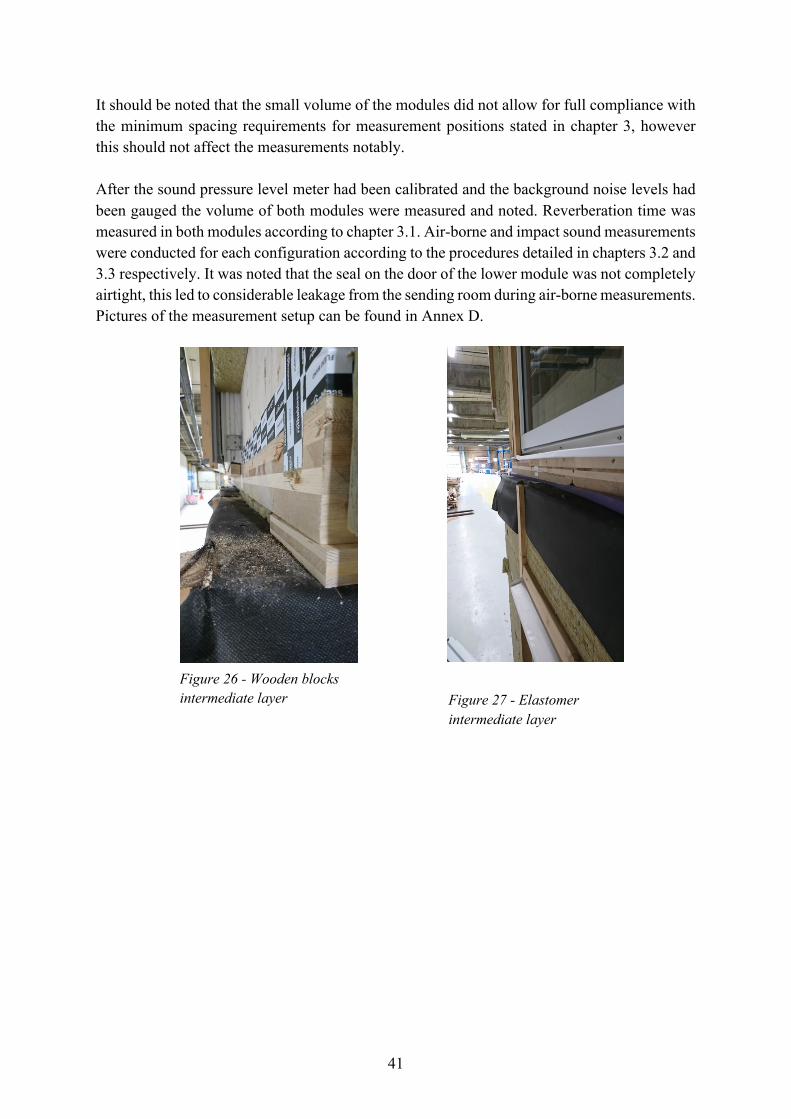
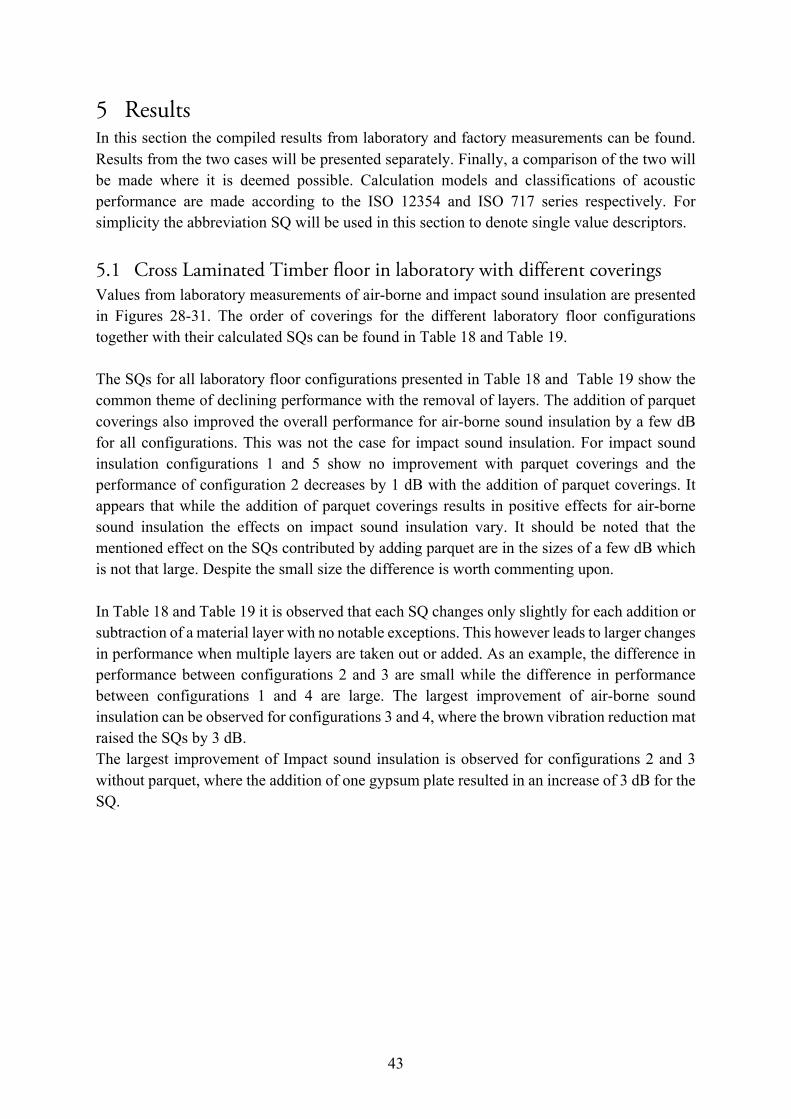
It should be noted that the small volume of the modules did not allow for full compliance with the minimum spacing requirements for measurement positions stated in chapter 3, however this should not affect the measurements notably. After the sound pressure level meter had been calibrated and the background noise levels had been gauged the volume of both modules were measured and noted. Reverberation time was measured in both modules according to chapter 3.1. Air-borne and impact sound measurements were conducted for each configuration according to the procedures detailed in chapters 3.2 and 3.3 respectively. It was noted that the seal on the door of the lower module was not completely airtight, this led to considerable leakage from the sending room during air-borne measurements. Pictures of the measurement setup can be found in Annex D.
Figure 26 - Wooden blocks intermediate layer Figure 27 - Elastomer
intermediate layer

43
5 Results In this section the compiled results from laboratory and factory measurements can be found. Results from the two cases will be presented separately. Finally, a comparison of the two will be made where it is deemed possible. Calculation models and classifications of acoustic performance are made according to the ISO 12354 and ISO 717 series respectively. For simplicity the abbreviation SQ will be used in this section to denote single value descriptors.
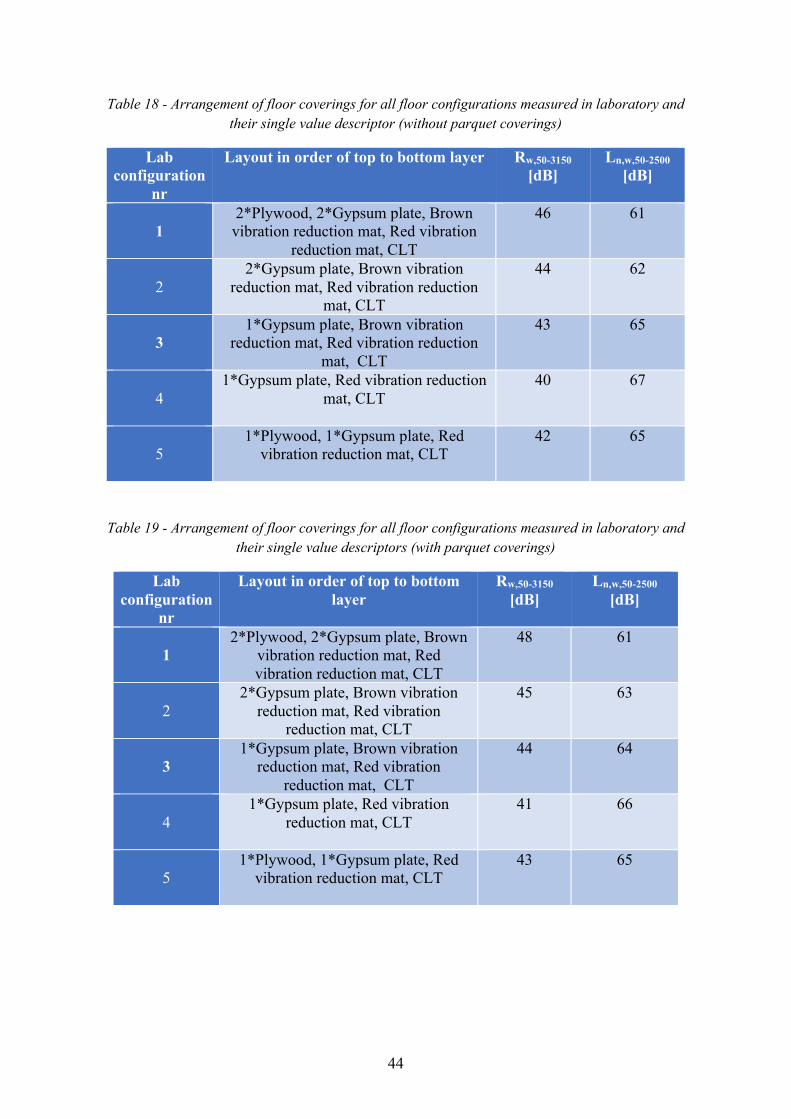
5.1 Cross Laminated Timber floor in laboratory with different coverings Values from laboratory measurements of air-borne and impact sound insulation are presented in Figures 28-31. The order of coverings for the different laboratory floor configurations together with their calculated SQs can be found in Table 18 and Table 19. The SQs for all laboratory floor configurations presented in Table 18 and Table 19 show the common theme of declining performance with the removal of layers. The addition of parquet coverings also improved the overall performance for air-borne sound insulation by a few dB for all configurations. This was not the case for impact sound insulation. For impact sound insulation configurations 1 and 5 show no improvement with parquet coverings and the performance of configuration 2 decreases by 1 dB with the addition of parquet coverings. It appears that while the addition of parquet coverings results in positive effects for air-borne sound insulation the effects on impact sound insulation vary. It should be noted that the mentioned effect on the SQs contributed by adding parquet are in the sizes of a few dB which is not that large. Despite the small size the difference is worth commenting upon. In Table 18 and Table 19 it is observed that each SQ changes only slightly for each addition or subtraction of a material layer with no notable exceptions. This however leads to larger changes in performance when multiple layers are taken out or added. As an example, the difference in performance between configurations 2 and 3 are small while the difference in performance between configurations 1 and 4 are large. The largest improvement of air-borne sound insulation can be observed for configurations 3 and 4, where the brown vibration reduction mat raised the SQs by 3 dB. The largest improvement of Impact sound insulation is observed for configurations 2 and 3 without parquet, where the addition of one gypsum plate resulted in an increase of 3 dB for the SQ.
44
Table 18 - Arrangement of floor coverings for all floor configurations measured in laboratory and their single value descriptor (without parquet coverings)
Lab configuration
nr
Layout in order of top to bottom layer
Rw,50-3150 [dB]
Ln,w,50-2500 [dB]
1
2*Plywood, 2*Gypsum plate, Brown vibration reduction mat, Red vibration
reduction mat, CLT
46 61
2
2*Gypsum plate, Brown vibration reduction mat, Red vibration reduction
mat, CLT
44 62
3
1*Gypsum plate, Brown vibration reduction mat, Red vibration reduction
mat, CLT
43 65
4
1*Gypsum plate, Red vibration reduction mat, CLT
40 67
5
1*Plywood, 1*Gypsum plate, Red vibration reduction mat, CLT
42 65
Table 19 - Arrangement of floor coverings for all floor configurations measured in laboratory and their single value descriptors (with parquet coverings)
Lab configuration
nr
Layout in order of top to bottom layer
Rw,50-3150 [dB]
Ln,w,50-2500 [dB]
1
2*Plywood, 2*Gypsum plate, Brown vibration reduction mat, Red vibration reduction mat, CLT
48 61
2
2*Gypsum plate, Brown vibration reduction mat, Red vibration
reduction mat, CLT
45 63
3
1*Gypsum plate, Brown vibration reduction mat, Red vibration
reduction mat, CLT
44 64
4
1*Gypsum plate, Red vibration reduction mat, CLT
41 66
5
1*Plywood, 1*Gypsum plate, Red vibration reduction mat, CLT
43 65
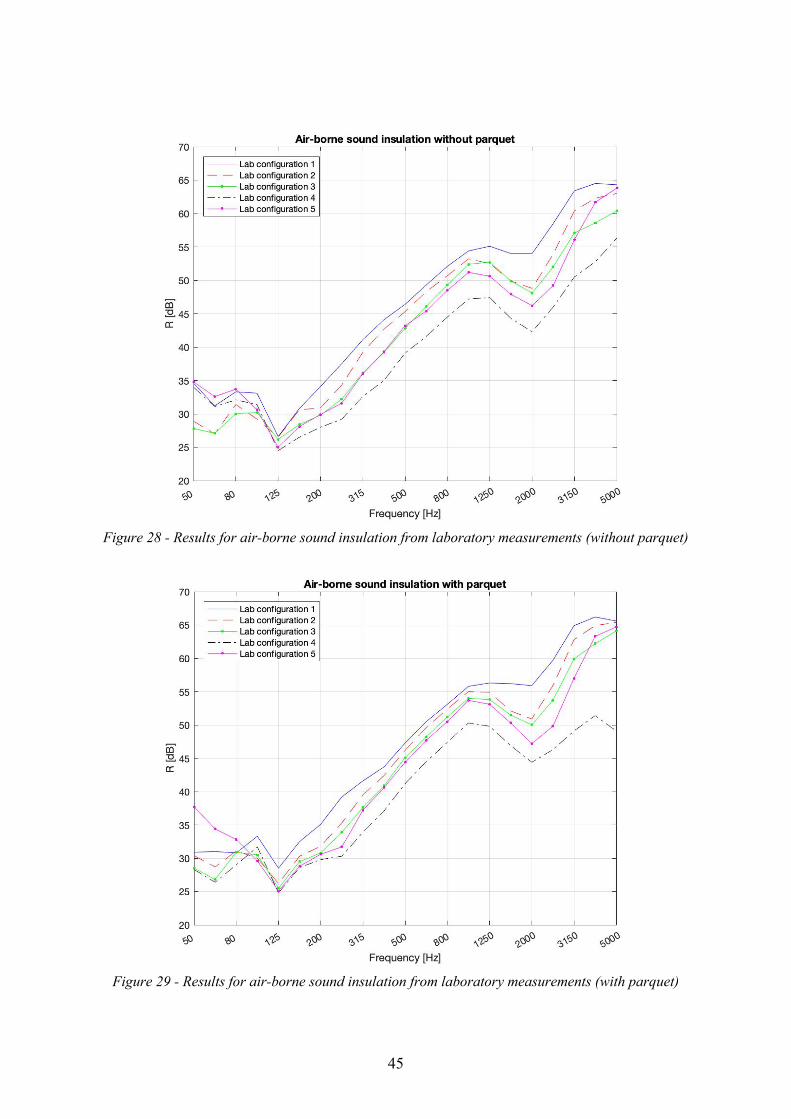
45
Figure 28 - Results for air-borne sound insulation from laboratory measurements (without parquet)
Figure 29 - Results for air-borne sound insulation from laboratory measurements (with parquet)
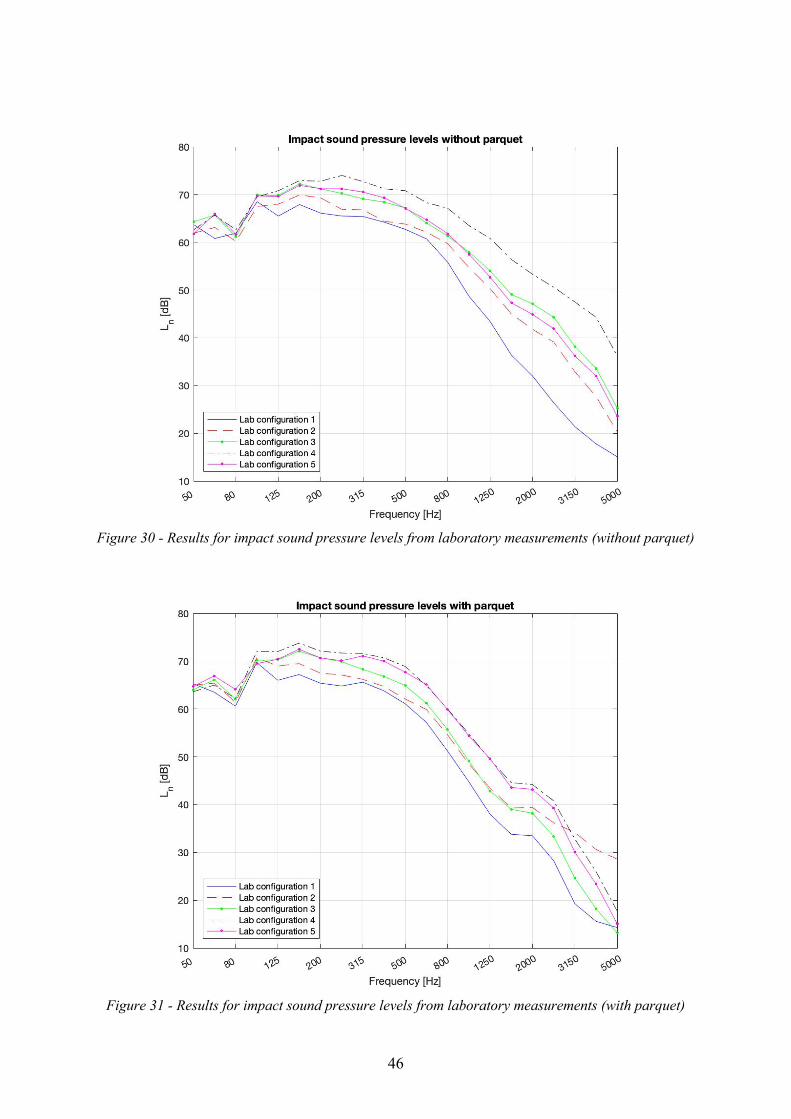
46
Figure 30 - Results for impact sound pressure levels from laboratory measurements (without parquet)
Figure 31 - Results for impact sound pressure levels from laboratory measurements (with parquet)
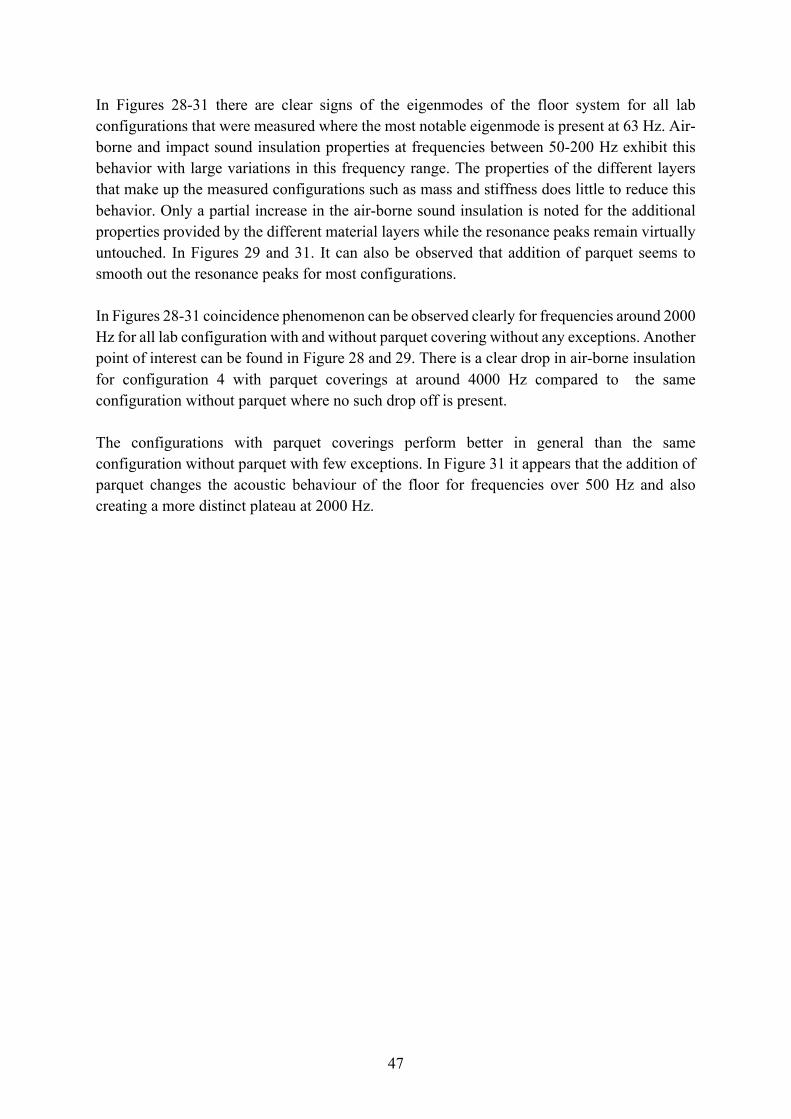
47
In Figures 28-31 there are clear signs of the eigenmodes of the floor system for all lab configurations that were measured where the most notable eigenmode is present at 63 Hz. Air-borne and impact sound insulation properties at frequencies between 50-200 Hz exhibit this behavior with large variations in this frequency range. The properties of the different layers that make up the measured configurations such as mass and stiffness does little to reduce this behavior. Only a partial increase in the air-borne sound insulation is noted for the additional properties provided by the different material layers while the resonance peaks remain virtually untouched. In Figures 29 and 31. It can also be observed that addition of parquet seems to smooth out the resonance peaks for most configurations. In Figures 28-31 coincidence phenomenon can be observed clearly for frequencies around 2000 Hz for all lab configuration with and without parquet covering without any exceptions. Another point of interest can be found in Figure 28 and 29. There is a clear drop in air-borne insulation for configuration 4 with parquet coverings at around 4000 Hz compared to the same configuration without parquet where no such drop off is present. The configurations with parquet coverings perform better in general than the same configuration without parquet with few exceptions. In Figure 31 it appears that the addition of parquet changes the acoustic behaviour of the floor for frequencies over 500 Hz and also creating a more distinct plateau at 2000 Hz.
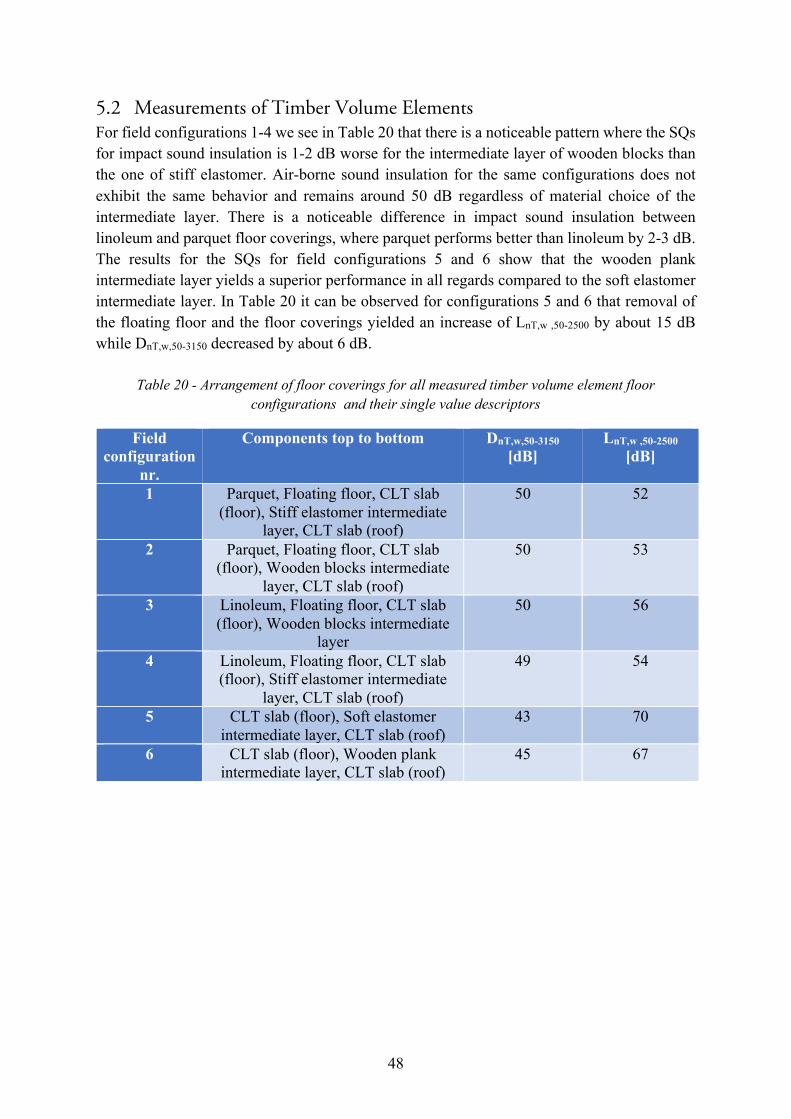
48
5.2 Measurements of Timber Volume Elements For field configurations 1-4 we see in Table 20 that there is a noticeable pattern where the SQs for impact sound insulation is 1-2 dB worse for the intermediate layer of wooden blocks than the one of stiff elastomer. Air-borne sound insulation for the same configurations does not exhibit the same behavior and remains around 50 dB regardless of material choice of the intermediate layer. There is a noticeable difference in impact sound insulation between linoleum and parquet floor coverings, where parquet performs better than linoleum by 2-3 dB. The results for the SQs for field configurations 5 and 6 show that the wooden plank intermediate layer yields a superior performance in all regards compared to the soft elastomer intermediate layer. In Table 20 it can be observed for configurations 5 and 6 that removal of the floating floor and the floor coverings yielded an increase of LnT,w ,50-2500 by about 15 dB while DnT,w,50-3150 decreased by about 6 dB.
Table 20 - Arrangement of floor coverings for all measured timber volume element floor configurations and their single value descriptors
Field configuration
nr.
Components top to bottom DnT,w,50-3150 [dB]
LnT,w ,50-2500 [dB]
1 Parquet, Floating floor, CLT slab (floor), Stiff elastomer intermediate
layer, CLT slab (roof)
50 52
2 Parquet, Floating floor, CLT slab (floor), Wooden blocks intermediate
layer, CLT slab (roof)
50 53
3 Linoleum, Floating floor, CLT slab (floor), Wooden blocks intermediate
layer
50 56
4 Linoleum, Floating floor, CLT slab (floor), Stiff elastomer intermediate
layer, CLT slab (roof)
49 54
5
CLT slab (floor), Soft elastomer intermediate layer, CLT slab (roof)
43 70
6
CLT slab (floor), Wooden plank intermediate layer, CLT slab (roof)
45 67
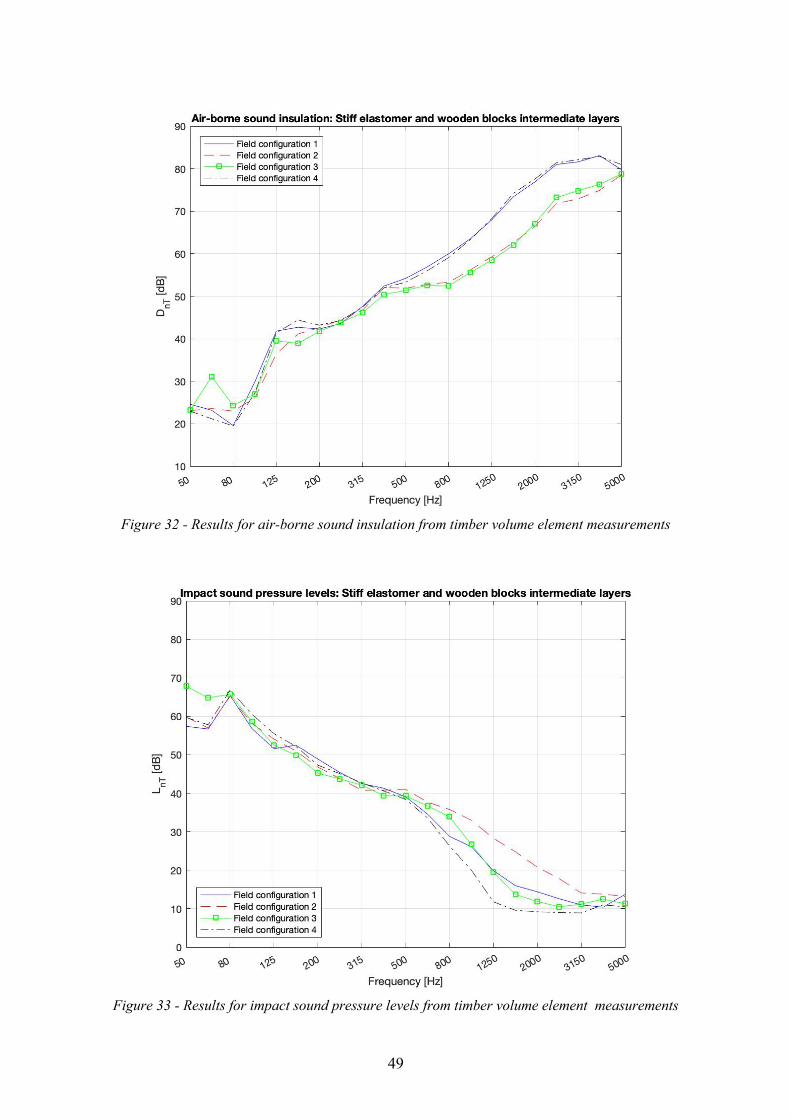
49
Figure 32 - Results for air-borne sound insulation from timber volume element measurements
Figure 33 - Results for impact sound pressure levels from timber volume element measurements
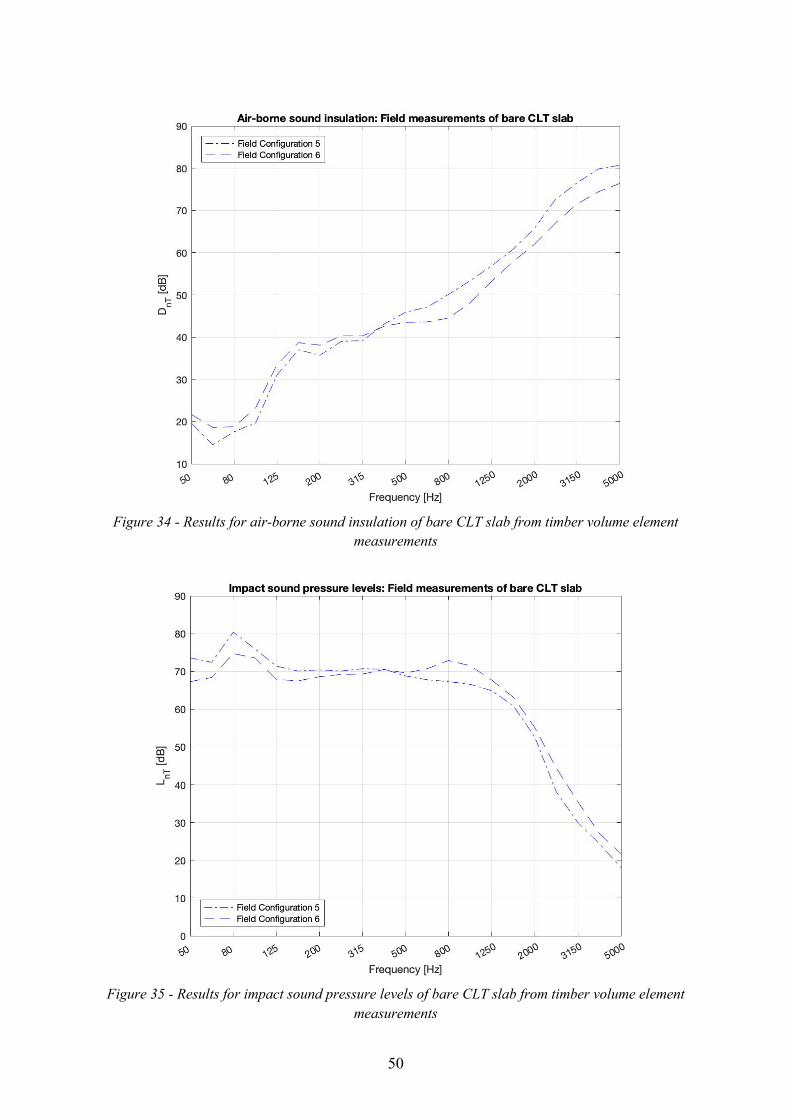
50
Figure 34 - Results for air-borne sound insulation of bare CLT slab from timber volume element
measurements
Figure 35 - Results for impact sound pressure levels of bare CLT slab from timber volume element
measurements
51
In Figure 32 it can be seen that the air-borne sound insulation remains unchanged for field configurations 1-4 whether linoleum or parquet is used as floor coverings. The difference between the wooden block and stiff elastomer intermediate layers is however noticeable. For lower frequencies in the range of 50-500 Hz little difference between configurations 1-4 can be observed. Except for configuration 3 which simultaneously shows an increase in air-borne sound insulation and decrease in impact sound insulation at frequencies 50-80 hz. For higher frequencies between 500-5000 Hz the difference in performance is clear. The stiff elastomer intermediate layer results in better air-borne sound insulation than the wooden block intermediate layer. The impact sound insulation for field configurations 1-4 that is presented in Figure 33 show less consistent results than that of the air-borne sound insulation in Figure 32. Impact sound insulation properties are similar up to around 500 Hz where the results start to deviate. For frequencies above 500 Hz configuration 4 offers the best impact sound insulation while configuration 2 has the poorest performance. Configurations 1 and 3 exhibit similar impact sound insulation properties. In Figure 34 and Figure 35 it can be seen that for both air-borne and impact sound insulation configuration 6, which consists of a wooden plank intermediate layer yield slightly better performance by a few dB for frequencies up to 500 Hz. Above 500 Hz configuration 5 with the soft elastomer intermediate layer yields the better performance with a few dB for the rest of the spectrum.
5.3 Timber volume element bare CLT floor compared to laboratory bare CLT floor
Regarding the comparative results presented in this section it should be noted that firstly: the descriptors used during laboratory and factory condition measurements are different in accordance with international standards. Secondly: the laboratory and factory floor configurations differ in both constitution and their connections to surrounding structures. The structure denoted as “Lab bare CLT” in the Figure 36 and Figure 37 is the bare CLT floor from the laboratory measurements in section 5.1
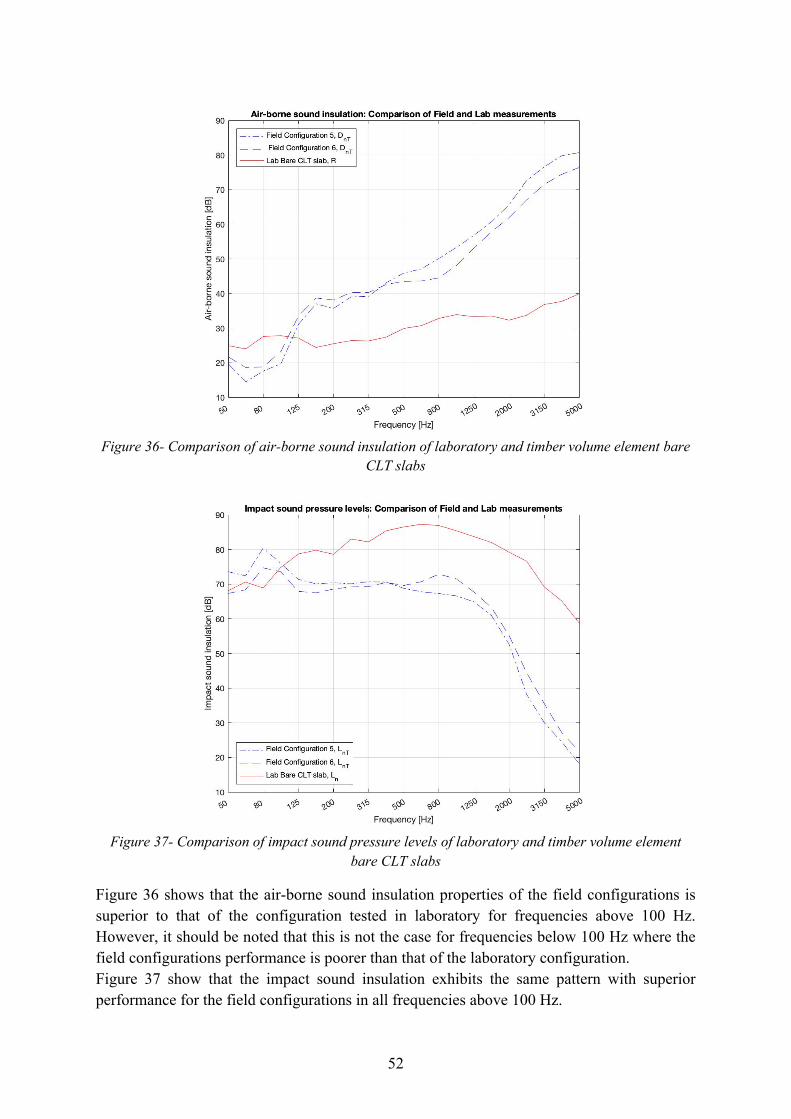
52
Figure 36- Comparison of air-borne sound insulation of laboratory and timber volume element bare
CLT slabs
Figure 37- Comparison of impact sound pressure levels of laboratory and timber volume element
bare CLT slabs
Figure 36 shows that the air-borne sound insulation properties of the field configurations is superior to that of the configuration tested in laboratory for frequencies above 100 Hz. However, it should be noted that this is not the case for frequencies below 100 Hz where the field configurations performance is poorer than that of the laboratory configuration. Figure 37 show that the impact sound insulation exhibits the same pattern with superior performance for the field configurations in all frequencies above 100 Hz.
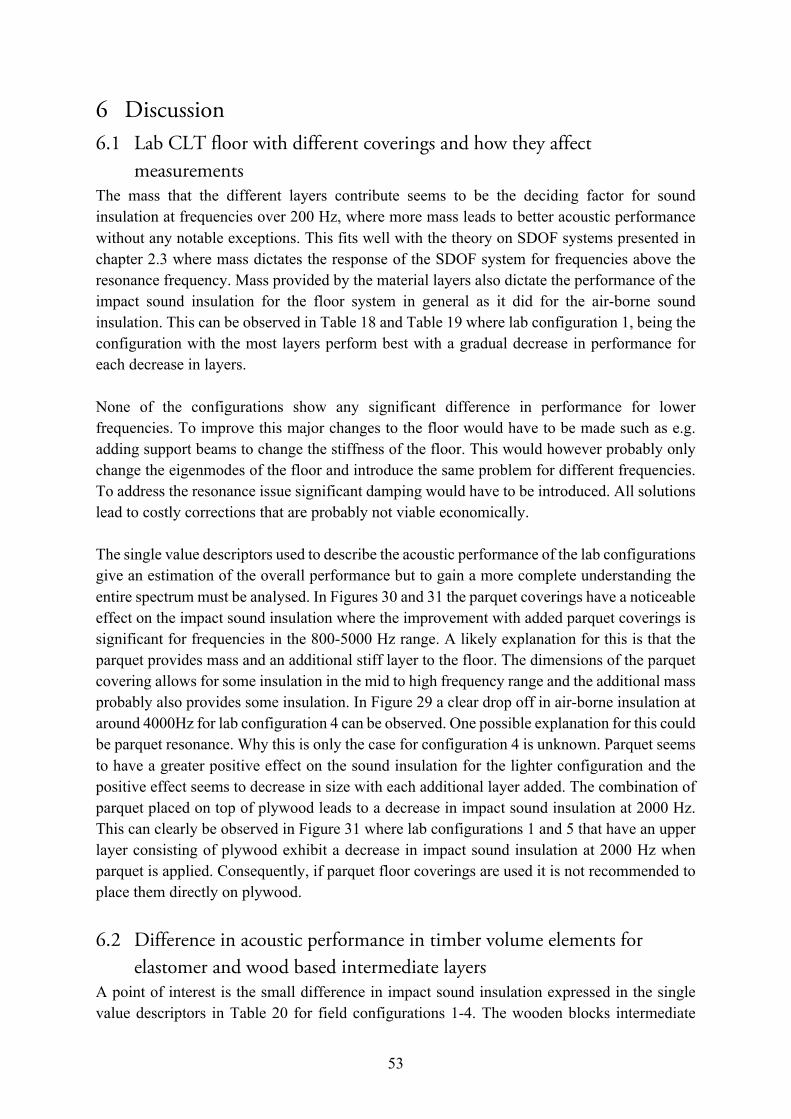
53
6 Discussion 6.1 Lab CLT floor with different coverings and how they affect
measurements The mass that the different layers contribute seems to be the deciding factor for sound insulation at frequencies over 200 Hz, where more mass leads to better acoustic performance without any notable exceptions. This fits well with the theory on SDOF systems presented in chapter 2.3 where mass dictates the response of the SDOF system for frequencies above the resonance frequency. Mass provided by the material layers also dictate the performance of the impact sound insulation for the floor system in general as it did for the air-borne sound insulation. This can be observed in Table 18 and Table 19 where lab configuration 1, being the configuration with the most layers perform best with a gradual decrease in performance for each decrease in layers. None of the configurations show any significant difference in performance for lower frequencies. To improve this major changes to the floor would have to be made such as e.g. adding support beams to change the stiffness of the floor. This would however probably only change the eigenmodes of the floor and introduce the same problem for different frequencies. To address the resonance issue significant damping would have to be introduced. All solutions lead to costly corrections that are probably not viable economically. The single value descriptors used to describe the acoustic performance of the lab configurations give an estimation of the overall performance but to gain a more complete understanding the entire spectrum must be analysed. In Figures 30 and 31 the parquet coverings have a noticeable effect on the impact sound insulation where the improvement with added parquet coverings is significant for frequencies in the 800-5000 Hz range. A likely explanation for this is that the parquet provides mass and an additional stiff layer to the floor. The dimensions of the parquet covering allows for some insulation in the mid to high frequency range and the additional mass probably also provides some insulation. In Figure 29 a clear drop off in air-borne insulation at around 4000Hz for lab configuration 4 can be observed. One possible explanation for this could be parquet resonance. Why this is only the case for configuration 4 is unknown. Parquet seems to have a greater positive effect on the sound insulation for the lighter configuration and the positive effect seems to decrease in size with each additional layer added. The combination of parquet placed on top of plywood leads to a decrease in impact sound insulation at 2000 Hz. This can clearly be observed in Figure 31 where lab configurations 1 and 5 that have an upper layer consisting of plywood exhibit a decrease in impact sound insulation at 2000 Hz when parquet is applied. Consequently, if parquet floor coverings are used it is not recommended to place them directly on plywood.
6.2 Difference in acoustic performance in timber volume elements for elastomer and wood based intermediate layers
A point of interest is the small difference in impact sound insulation expressed in the single value descriptors in Table 20 for field configurations 1-4. The wooden blocks intermediate
54
layer offered only a small surface area for the acoustic energy to pass between the modules. Even though the difference in impedance of the wooden block intermediate layer and the CLT slabs of the modules can be deemed insignificant, the small surface area of the wooden blocks and the difference in impedance provided by the air slot between the modules served to provide unexpectedly sufficient impact sound insulation. The viability to stack multiple timber volume elements using this method is questionable from a construction viewpoint as the small surface area of the blocks would quickly lead too large pressures. It would have been interesting to test field configurations 2 and 3 with the additional surface area provided by the wooden plank intermediate layer to see how the impact sound insulation would differ from the results of the wooden blocks intermediate layer. In hindsight it would also have been interesting to see how well the softer elastomer intermediate layer would have performed for the floor designs denoted as field configurations 1 and 4. The difference in impedance of the CLT slabs and the intermediate layer would then have been even larger than for that of the stiff elastomer. In Figure 32 and Figure 33 it was observed that for frequencies above 500 Hz the stiff elastomer intermediate layer performs better than the wooden blocks intermediate layer. The same behavior can be observed in Figure 34 and Figure 35, where the soft elastomer intermediate layer yields better performance than the wooden plank intermediate layer after 500 Hz. The impact sound insulation for field configurations 1 through 4 in Figure 33 show that the performance start to differ for frequencies above 500 Hz and that parquet floor coverings result in better impact sound insulation than linoleum floor coverings regardless of what intermediate layer was used. In Table 20 it can be observed that all field configurations do not pass the requirements for sound class C because of poor air-borne sound insulation. It should however be noted that for impact sound insulation field configurations 2,3 and 4 yield sound class C and field configuration 1 yields sound class B. The poor air-borne sound insulation could be attributed to the large leakage created by the poor seal on the door of the sending module. With relatively small efforts the air-borne sound insulation could probably be brought up to sound class C. The floating floor is also a necessity to fulfill the requirements for sound class C. This can clearly be seen in Table 20 where the single value descriptors for configurations 5 and 6 exhibit a large decrease in performance with the removal of the floating floor.
6.3 Comparison of Timber volume element CLT floor and laboratory CLT floor
Differences in dimension and design between laboratory and factory test objects yield large deviations in performance but a comparison was made either way to try and further the understanding of the two cases. The orientation of the CLT slabs making up one timber volume element and their connections allow for transmission of acoustic energy. If e.g. a wall is excited by a sound source both bending and longitudinal waves can propagate to adjacent slabs.
55
The connection between the modules consists of a horizontal CLT slab resting on top of another horizontal CLT slab with intermediate layers of different materials and an air slot otherwise separating the two slabs. The ability of the two elements to radiate acoustic energy between one another is rather poor. Since the difference in impedance of the air slot and the slabs is large the only valid path for the acoustic energy to travel from one module to the other is the intermediate layers. Despite the lack of flanking transmissions in laboratory, we see in Figure 36 and Figure 37 that the properties of the air slot and the connection between the modules coupled with the fact that the modules provide two CLT slabs instead of one, result in better performance for the modules than the CLT slab in laboratory. It should however be noted that the laboratory configurations perform better than the field configurations at frequencies below 100 Hz. This could be attributed to flanking transmission being present in the field configurations and not for the laboratory configurations which have a heavy concrete floor boundary, thereby heavily limiting flanking transmissions in laboratory. Another reason for the improved performance at lower frequencies for the lab configurations could be the larger thickness of the CLT slab.
6.4 Summary A few conclusions can be drawn from the laboratory measurements. The mass of the material layers played the largest part in increasing the performance. Hence heavy materials such as gypsum is a good choice of material in floor constructions. Interaction between layers can lead to unwanted results. It is for example not advisable to place parquet on plywood. The most suitable combination of materials in terms of acoustics and economy is case dependent. Factors such as financing and available space may limit design choices. As for the vibration reduction mats, they did increase performance but the size of the increase was not much larger than that of the gypsum plates. Further studies are needed to determine if they are a valid choice of construction material in floor designs. The factory measurements showed that it is an effective method to decouple the floor from the load bearing structure. The floating floor provided considerable sound insulation without taking too much space. The installation of the floor is also simple and can be done in factory before final placement of the timber volume elements. From factory measurements it can also be argued that it is not necessary to use elastomer intermediate layers to fulfill the requirements for sound class C. Wood based intermediate layers can also reach these requirements at a lower financial cost. Further studies are required to show that wood based intermediate layers can provide the needed sound insulation while also providing satisfying load bearing capacity when multiple modules are stacked vertically.

57
7 Improvements As mentioned previously the lining of the doors of the modules that were measured in factory were not creating a proper seal which led to significant leakage. This should be remedied to allow further studies of the air-borne sound insulation to be more accurate and to better gauge the acoustic performance of the modules. Another improvement of the measurement would be to investigate the acoustic performance of the timber volume elements using the same modules for tests in laboratory and field conditions. This was not practically feasible for the time frame of this report but if further studies were to be performed this would be preferred.

59
8 Further studies For further studies more emphasis should be made on investigating the connections that make up the timber volume elements. A further understanding in how the design of the modules affect the transmission of acoustic energy could be made by measuring flanking transmissions for connections in-situ. Modal analysis could be performed on the separate CLT slabs that make up the modules and on the finished modules to determine useful properties which could be used as input for computer models. Finite element models could be made to better gauge acoustic performance. This could lead to better prediction tools for gauging acoustic performance of timber volume elements instead of testing real modules which is time consuming. It would be of interest to perform measurements on several timber module elements that have been assembled into multi-storey housing to establish how it would affect the acoustic performance to connect multiple modules in a more complex grid than what was tested in this report.

61
9 Bibliography Naturvårdsverket, 2019. naturvårdsverket.se. [Online] Available at: https://www.naturvardsverket.se/Miljoarbete-i-samhallet/Sveriges-miljomal/Miljokvalitetsmalen/God-bebyggd-miljo/ Svenskt trä, 2019. www.svensktträ.se. [Online] Available at: https://www.svenskttra.se/om-tra/hallbarhet/ Kleiner, M., 2012. Acoustics and Audio Technology. Fort Lauderdale: J.Ross Publishing. Vigran, T. E., 2008. Building Acoustics. New York: Taylor & Francis. Chopra, A. K., 2006. Dynamics of Structures. Prentice Hall: Pearson. Hopkins, C., 2007. Sound Insulation. Oxford, UK: Elsevier. Negreira, J., 2016. Vibroacoustic Performance of Wooden Buildings: Prediction and Perception. Lund: Juan Negreira. Boverket, 1994. BFS 1993:57 BBR 94:1. Stockholm: Boverket. Cremer, L. & Heckl, M., 1973. Structure-Borne Sound: Structural Vibrations and Sound Radiation at Audio Frequencies. New York: Springer-Verlag Berlin Heidelberg GmbH. Rindel, J., 2018. Sound Insulation in Buildings. Boca Raton: CRC Press. Sengpiel, E., 2020. http://www.sengpielaudio.com/. [Online] Available at: http://www.sengpielaudio.com/ [Accessed 10 February 2020]. Flodén, O., 2014. Vibrations in Lightweight Structures: Efficiency and Reduction of Numerical Models. Lund : Division of Structural Mechanics, Faculty of Engineering, Lund University. Hagberg, K., 2018. Management of Acoustics in Lightweight Structures. Lund: Faculty of Engineering, LTH. Boverket, 2019. BBR, Stockholm: Boverket. Svenskt trä, 2015. www.träguiden.se. [Online] Available at: https://www.traguiden.se/om-tra/miljo/miljoeffekter/miljoeffekter/traprodukters-kretslopp/ [Accessed 05 03 2020]. Svenskt trä, 2017. KL-Trähandbok. 1 ed. Stockholm: Svenskt trä. Hörnwall, J., 2019. Acoustic performance of junctions in cross laminated timber constructions, Gothenburg: Chalmers University of Technology. International Organization of Standardization, 2008. 3382-2: Reverberation time in ordinary rooms, Stockholm: Swedish institute of Standarization. International Organization for Standardization, 2017. ISO 12354-1: Air-borne sound insulation, Stockholm: Swedish Institute of Standardization. International Organization for Standardization, 2018. ISO 16283-2: Field measurements of impact sound insulation, Stockholm: Swedish Institute of Standardization. International Organization for Standarization, 2015. ISO 12354-2: Impact sound insulation, Stockholm: Swedish Institute of Standardization.
62
International Organization of Standardization, 2014. 16283-1: Field measurements of air-born sound insulation in buildings and building elements, Stockholm: Swedish Institute of Standardization. Vardaxis, N.-G., 2014. Finite Element Modeling for Cross Laminated Timber Constructions, Gothenburg: Chalmers University of Technology. International Organization of Standardization, 2016. ISO 10140: Laboratory measurments of building elements (All parts), Stockholm: Swedish Institute of Standardization. International Organization of Standardization, 2013. ISO 717-2: Rating of sound insulation in buildings and of building elements - Part 2: Impact sound insulation, Stockholm: Swedish Institute of Standardization. International Organization for Standardization, 2013. 717-1: Rating of sound insulation in buildings and of building elements - Part 1: Air-borne sound insulation, Stockholm: Swedish Institute of Standardization.
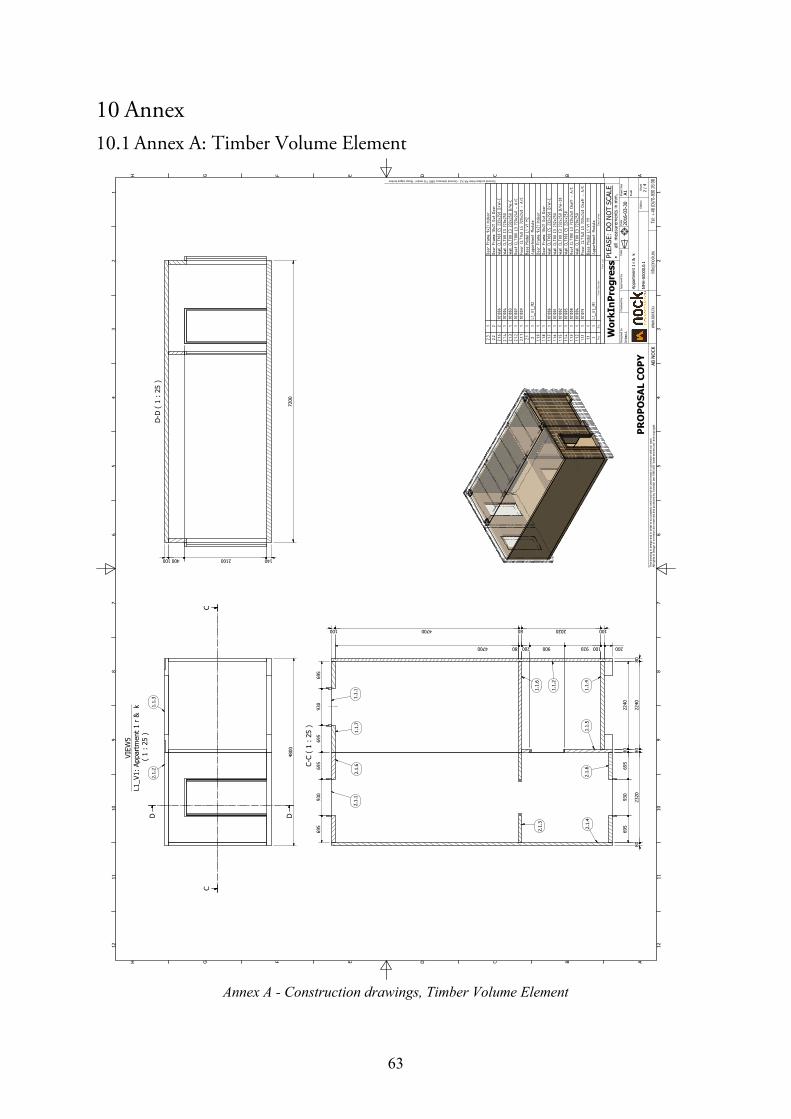
63
10 Annex 10.1 Annex A: Timber Volume Element
Annex A - Construction drawings, Timber Volume Element
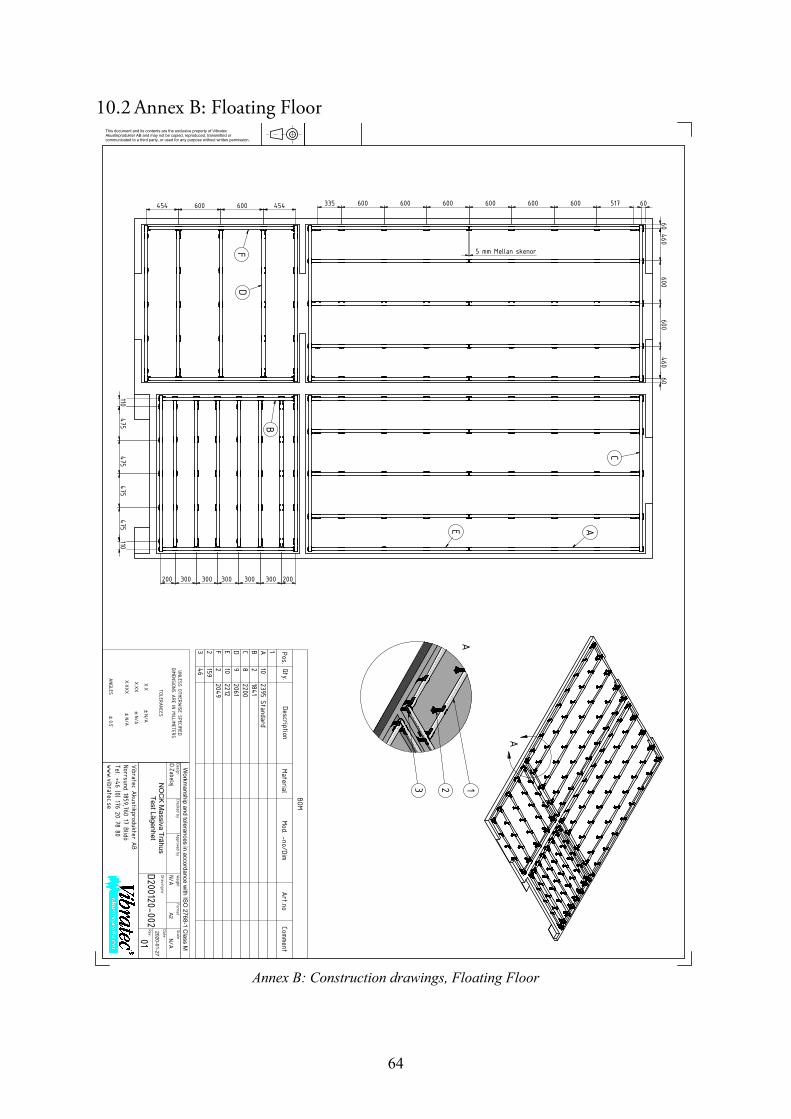
64
10.2 Annex B: Floating Floor
Annex B: Construction drawings, Floating Floor
A
A
This document and its contents are the exclusive property of Vibratec Akustikprodukter AB and may not be copied, reproduced, transmitted or communicated to a third party, or used for any purpose without written permission.
DesignChecked by
Approved by
Rev.Test Lägenhet
D.Zabelaj
NO
CK M
assiva Trähus
01
Weight
N/AFormatA2
Vibratec Akustikprodukter ABNorrsund 1859,760 17 BlidöTel. +46 (0) 176 20 78 80www.vibratec.se
Drawing.no
D200120-002
N/AScale
Date
2020-01-27
Workm
anship and tolerances in accordance with ISO
2768-1 Class M
UNLESS OTHERWISE SPECIFIED
DIMENSIONS ARE IN MILLIMETERS
TOLERANCES
X.X BN/A
X.XX BN/A
X.XXX BN/A
ANGLES B
0.5`
BOM
Pos.Qty.
DescriptionMaterial
Mod. -no/DimArt.no
Comment
1
A
102395 Standard
B2
1841
C
82200
D9
2061
E
102212
F2
2049
2
159
346
2 13
200300200 300
460600
600460
5 mm Mellan skenor
454 600 600 454
110475
475475
475
300300300
6060
60
110
517600600600600600600335AE
C
DF
B
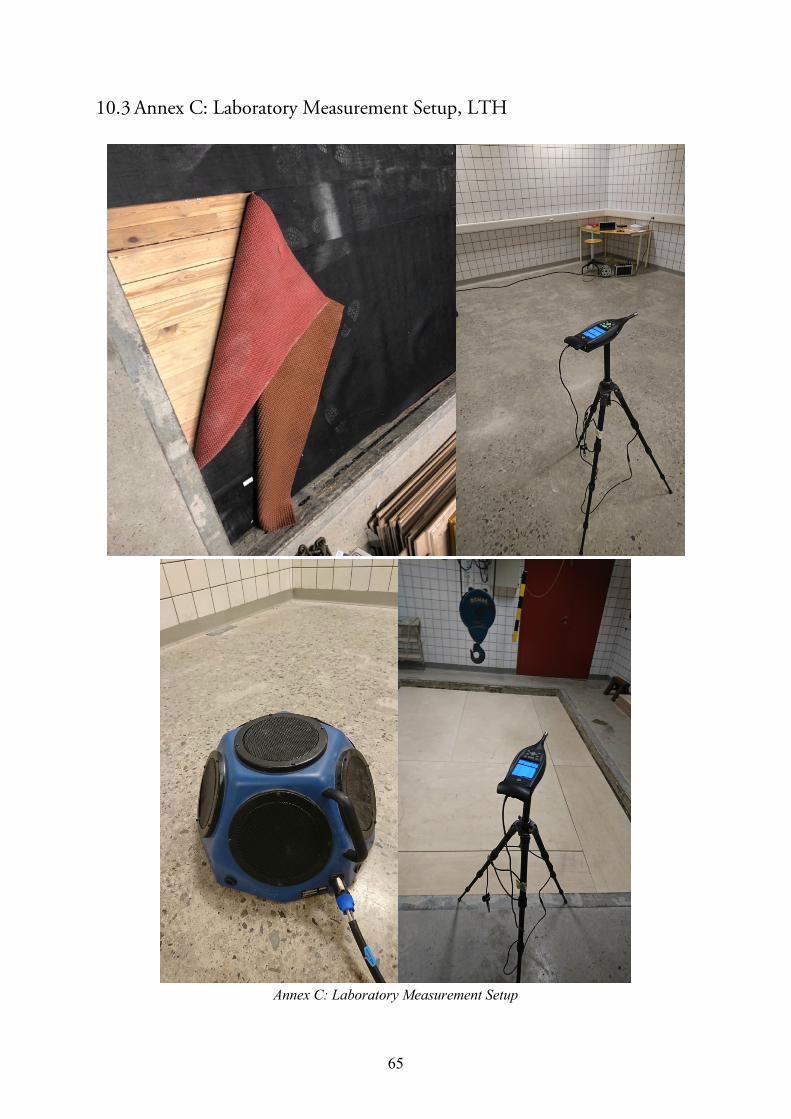
65
10.3 Annex C: Laboratory Measurement Setup, LTH
Annex C: Laboratory Measurement Setup
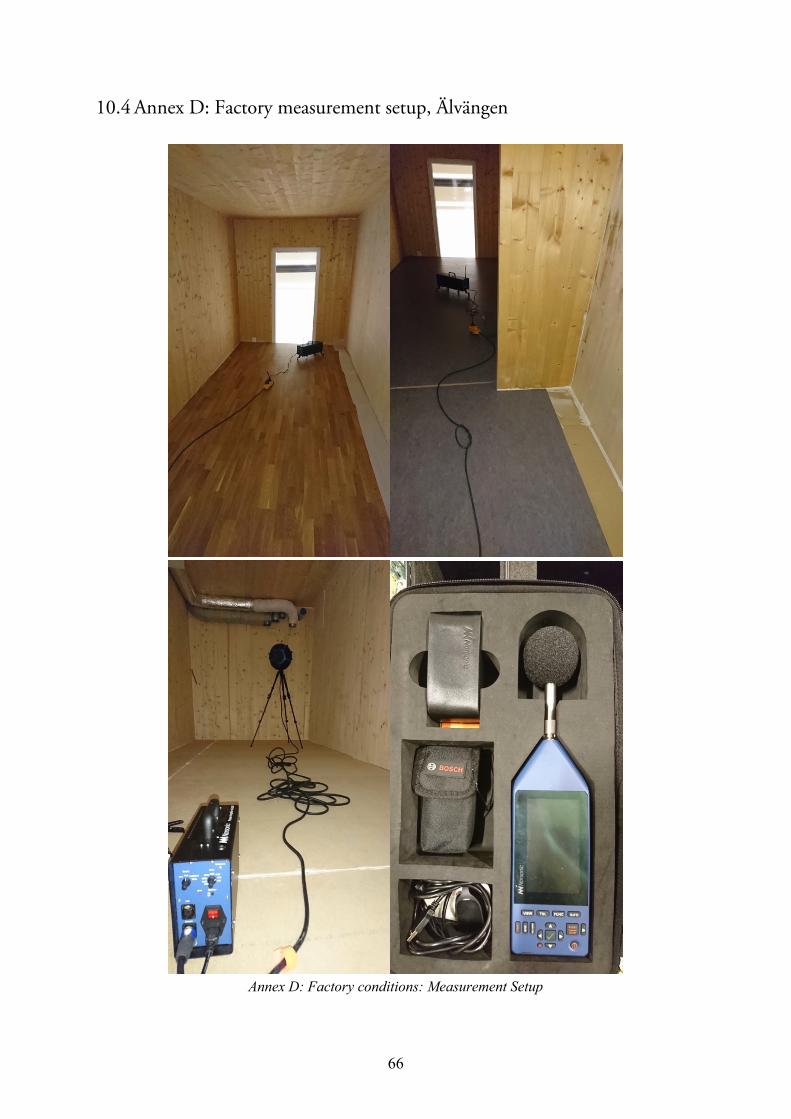
66
10.4 Annex D: Factory measurement setup, Älvängen
Annex D: Factory conditions: Measurement Setup
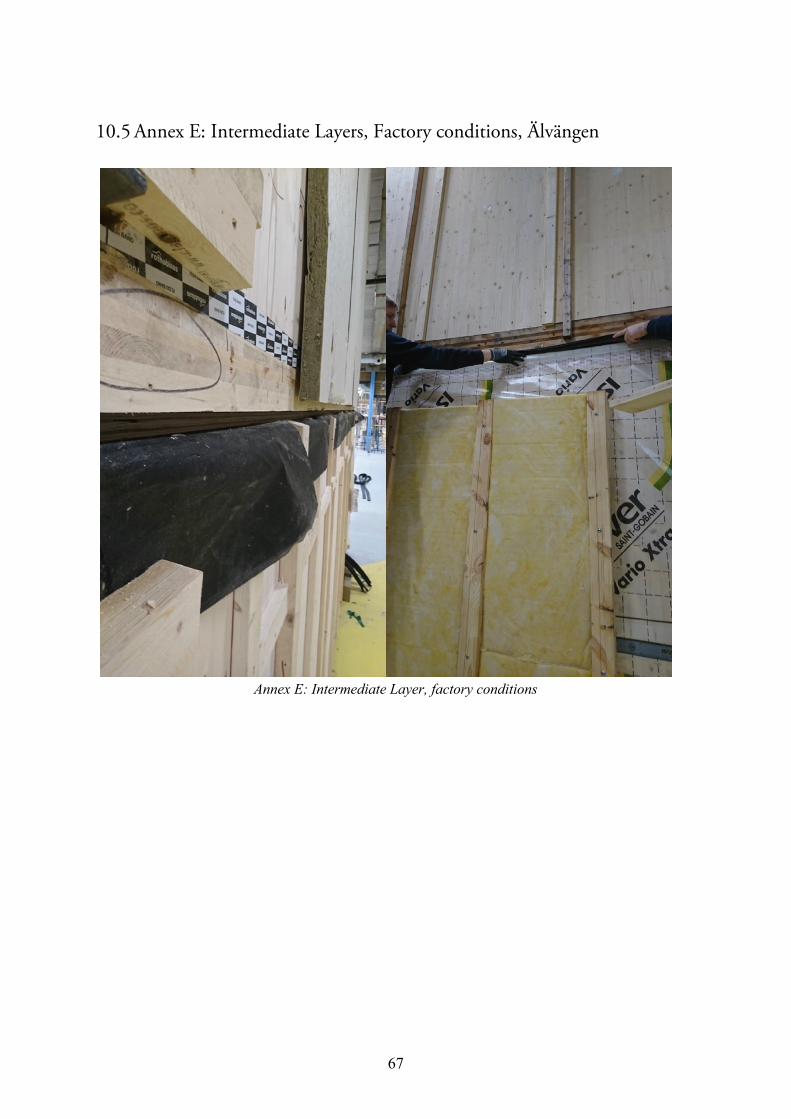
67
10.5 Annex E: Intermediate Layers, Factory conditions, Älvängen
Annex E: Intermediate Layer, factory conditions