Embed Size (px)
Citation preview

master graduation projects 2009-2010supervised by the Water engineering and ManageMent (WeM) departMent at the university of tWente
Faculty oF engineering technologyWater engineering and management


1
PREFACE This document contains the summaries of master graduation projects of 2009 and 2010 supervised by the Water Engineering and Management (WEM) department at the University of Twente. Water Engineering and Management is one of three specialisations of the master programme in Civil Engineering and Management, the other two are Transport Engineering and Management and Construction Process Management. The research focus of Water Engineering and Management is on the management of large surface water systems. The aim is to increase the understanding of natural processes in water systems and the socio-economic aspects related to these systems to develop tools that can effectively be used to support the management. The research focus is reflected in the educational programme with courses on physical processes, modelling, management aspects and policy processes. More information about the master programme can be found on: www.cem.utwente.nl The two year master programme is concluded with an individual research project. Prior to this project a preparation course is scheduled in which the student performs a literature study and writes a research proposal to prepare for the final research project. This course can also be used to get acquainted with a model or to study a specific topic relevant to the research project. The final research project is done internal in our department or external, for example at a consultancy or research institute; in all cases we prefer a link to the research of the department. Each project is supervised by at least two employees of the university and often by a third person from outside. The preparation course counts for 7.5 ECTS (European Credit Transfer System, where 1 ECTS stands for 28 hours of work), the final master project for 30 ECTS, which is equivalent to 21 weeks. In this booklet 31 summaries of final master projects finished in 2009 and 2010 are collected and ordered by graduation date. It gives a nice overview of the different topics that are being researched during the final master projects. We hope it gives you a good impression of the skills of our students and the possibilities for collaboration with external parties. If you are interested in the complete theses or theses from previous years you can find most of them at: http://www.wem.ctw.utwente.nl/onderwijs/afstuderen/afgerond/index.html If you were involved in one of the projects we would like to thank you for your contribution. The contacts with professionals outside the university are of vital importance for our educational programme. Enjoy reading. Prof.dr. Suzanne J.M.H. Hulscher Head of the department Water Engineering and Management For more information contact: Secretariat WEM P.O. Box 217 7500 AE Enschede The Netherlands Phone: +31-(0)53-489 3546 Internet: www.wem.ctw.utwente.nl

2
TABLE OF CONTENT
PLAQUEMINES SPILLWAYS Marcel van der Waart 4
INCREASING COMPLEXITY IN HYDROLOGIC MODELLING: AN UPHILL ROUTE? Han Vermue 5
DYNAMIC CONTROL OF SALT INTRUSION Marcel van den Berg 6
INDICATOR DEVELOPMENT TO DETERMINE THE STATEOF THE (SOUTH-WEST) DELTA Wilco van Bodegraven 7
THE WATER FOOTPRINT OF SUGAR AND SUGAR-BASED ETHANOL Wolter Scholten 8
MORPHOLOGICAL DEVELOPMENTS IN AGGRADING SECONDARY CHANNELS Ward Klop 9
ENERGY SCENARIOS IN A WATER PERSPECTIVE CHANGES IN WATER FOOTPRINTS RELATED TO ENERGY TRANSITIONS Sander van Lienden 10
THE EFFECTS OF JONGLEI CANAL OPERATION SCENARIOS ON THE SUDD SWAMPS IN SOUTHERN SUDAN Erwin Lamberts 11
THE CONSEQUENCES OF FUTURE CHANGE FOR THE WET HEART IN THE NETHERLANDS IN 2050 Harm-Jan van Donk 12
SIMULATION OF PRESENT AND FUTURE DISCHARGES AT THE NILE RIVER UPSTREAM LAKE NASSER Daniël Tollenaar 13
THREE DIMENSIONAL FLOW STRUCTURE IN SEMI-ENCLOSED BASINS Olav van Duin 14
THE INFLUENCE OF LATERAL DEPTH VARIATIONS ON TIDAL DYNAMICS IN SEMI-ENCLOSED BASINS Wiebe de Boer 15
WAVE BOUNDARY LAYER STREAMING Suleyman Naqshband 16
EVALUATION OF VEGETATION RESISTANCE DESCRIPTORS FOR FLOOD MANAGEMENT Alida Galema 17
VIRTUAL WATER TRADE IN THE SADC REGION Bert Kort 18
MODELLING WAVE ATTENUATION BY VEGETATION WITH SWAN-VEG Reinout de Oude 19
INFLUENCE OF UNCERTAINTIES IN DISCHARGE DETERMINATION ON THE PARAMETER ESTIMATION AND PERFORMANCE OF A HBV MODEL IN MEUSE SUB BASINS Sander van den Tillaart 20
3
REAL-TIME CONTROL OF THE SOUTH-NORTH WATER TRANSFER PROJECT WITHIN JIANGSU PROVINCE IN CHINA Meinte Vierstra 21
A COMPARISON OF WAVE-DOMINATED CROSS-SHORE SAND TRANSPORT MODELS Wing Hong Wong 22
THRESHOLDS FOR FLOOD FORECASTING AND WARNING Werner Weeink 23
INFLUENCE OF SURFACE WAVES ON SAND WAVE MIGRATION AND ASYMMETRY Steven IJzer 24
VALIDATION & IMPROVING SMAKHTIN EFR METHOD Paul Zeefat 25
TESTING SEDIMENT TRANSPORT MODELS UNDER PARTIAL TRANSPORT CONDITIONS Stephan Janssen 26
WATER SYSTEM ANALYSIS SALLANDSE WETERINGEN AND CANALS OF ZWOLLE Gert-Ruben van Goor 27
PRESENTATION OF UNCERTAINTY IN MODEL OUTPUT TO DECISION MAKERS IN FLOOD MANAGEMENT Lea Goedhart 28
VERKENNING NAAR DE WATERAANVOERMAATREGELEN OM DE ZOETWATERVOOR-ZIENING IN MIDDEN-WEST NEDERLAND TE GARANDEREN IN DE TOEKOMST Rik Bulsink 29
VIRTUAL WATER TRADE IN THE SADC REGION Marloes ter Haar 30
ON THE TIDAL DYNAMICS OF THE NORTH SEA Jorick Velema 31
FLOODED WITH WATER DEFICITS Jorik Chen 32
HOW LOW SHOULD WE GO? Erwin Sterrenburg 33
SCALE DEPENDENCY OF DUNE EROSION MODELS Peter Brandenburg 34
SPATIAL OPTIMISATION OF MARINE SAND EXTRACTION Quijntijn van Agten 35
IMPACTS OF CLIMATE CHANGE ON LOW FLOWS IN THE RHINE BASIN Jasper Bisterbosch 36
A NEW METHOD TO PREDICT THE AGGREGATE ROUGHNESS OF VEGETATION PATTERNS ON FLOODPLAINS Marloes ter Haar 30
3
REAL-TIME CONTROL OF THE SOUTH-NORTH WATER TRANSFER PROJECT WITHIN JIANGSU PROVINCE IN CHINA Meinte Vierstra 21
A COMPARISON OF WAVE-DOMINATED CROSS-SHORE SAND TRANSPORT MODELS Wing Hong Wong 22
THRESHOLDS FOR FLOOD FORECASTING AND WARNING Werner Weeink 23
INFLUENCE OF SURFACE WAVES ON SAND WAVE MIGRATION AND ASYMMETRY Steven IJzer 24
VALIDATION & IMPROVING SMAKHTIN EFR METHOD Paul Zeefat 25
TESTING SEDIMENT TRANSPORT MODELS UNDER PARTIAL TRANSPORT CONDITIONS Stephan Janssen 26
WATER SYSTEM ANALYSIS SALLANDSE WETERINGEN AND CANALS OF ZWOLLE Gert-Ruben van Goor 27
PRESENTATION OF UNCERTAINTY IN MODEL OUTPUT TO DECISION MAKERS IN FLOOD MANAGEMENT Lea Goedhart 28
VERKENNING NAAR DE WATERAANVOERMAATREGELEN OM DE ZOETWATERVOOR-ZIENING IN MIDDEN-WEST NEDERLAND TE GARANDEREN IN DE TOEKOMST Rik Bulsink 29
VIRTUAL WATER TRADE IN THE SADC REGION Marloes ter Haar 30
ON THE TIDAL DYNAMICS OF THE NORTH SEA Jorick Velema 31
FLOODED WITH WATER DEFICITS Jorik Chen 32
HOW LOW SHOULD WE GO? Erwin Sterrenburg 33
SCALE DEPENDENCY OF DUNE EROSION MODELS Peter Brandenburg 34
SPATIAL OPTIMISATION OF MARINE SAND EXTRACTION Quijntijn van Agten 35
IMPACTS OF CLIMATE CHANGE ON LOW FLOWS IN THE RHINE BASIN Jasper Bisterbosch 36

4
PLAQUEMINES SPILLWAYS THE IMPACT OF THE LOWER MISSISSIPPI RIVER LEVEES ON STORM SURGE DURING HURRICANES
Plaquemines Spillways
The Mississippi river runs through Louisiana towards the Gulf of Mexico where it becomes a bird-foot delta. Various settlements of often no more than 2 km in width exist along the lower 125 km of this river; this area is known as Plaquemines Parish. Nowadays levees protect the Parish from storm surges and high Mississippi river discharges. During major hurricane events in the Gulf of Mexico the levees block the storm surge and this leads to a build-up of surge locally but also forces the water to flow upriver towards New Orleans. By creating spillways within the levees of Plaquemines Parish the maximum water levels in and around New Orleans can be reduced during hurricanes. To gain insight into the quantitative effects of the spillways on storm surge the Advanced CIRCulation flow model (ADCIRC) has been used to perform storm surge simulations. The commonly used ADCIRC grid for Louisiana encompasses approximately two million computational nodes and therefore a parallel computing environment is required to run the model. For this study a smaller computational grid has been created with approximately one million nodes and a simplified modeling strategy has been applied in order to improve the balance between computational speed and model accuracy. The model has been validated by performing a hind-cast of hurricane Katrina. The modified grid was then used to simulate different levee alignments during three different storms. Model results show that the spillways are capable of reducing maximum surge levels locally in Plaquemines Parish as well as in regions closer to New Orleans and on the Mississippi River; the length of the spillways in the northern part of Plaquemines Parish was found to be very important for the reduction of the surge in these areas. Maximum water level differences near New Orleans between four levee alignments and the current levee alignment for a combination of three hurricanes (in m).
Removal of all levees
Only protect important settlements
Minimum Spillway Length
Medium Spillway Length
New Orleans (River) St.Bernard Parish Plaquemines Parish Jefferson Parish
–1.20–0.50
–2.70/ –0.20 –0.20
–1.10–0.50
–1.80 / +2.10 –0.20
–0.50 –0.20
–0.60 / +2.20 –0.10
–0.80–0.20
–1.70 / + 1.40 –0.30
Marcel van de Waart Graduation Date: 6 March 2009 Graduation committee: University of Twente Prof.dr. S.J.M.H. Hulscher Dr. J.P.M. Mulder Royal Haskoning Dr. M. van Ledden
Figure 1: Aerial view of southern Plaquemines Parish.
Figure 2: ADCIRC computation of water levels and flow velocities near Plaquemines Parish during a hurricane.

5
INCREASING COMPLEXITY IN HYDROLOGIC MODELLING: AN UPHILL ROUTE?
To achieve more knowledge about hydrologic processes, hydrologic models can be of use. To understand the exchange of water between domains spatially distributed, physically based and first order coupled models are useful. The MODular Hydrological Modeling System (MODHMS) is such a concept. When modelling in these kinds of models a number of problems can arise which are summarised by Beven (2001) as the problems of uncertainty, nonlinearity, equifinality and scale. The result of these problems is that a more complex model might not necessarily generate better results. Therefore it is interesting to know which complexity gives the best result. In this study several compositions of the catchment of the Astense Aa are modelled in MODHMS. Starting from a very simple model, more complexity is added to assess the influence of the complexity on model performance and hydrological behaviour. Model performance is defined as the possibility to reproduce observed spatially distributed groundwater levels and surface water discharge with the model. Using two methods the influence of complexity on model performance and hydrological behaviour is assessed. The first method includes a comparison between steps using equal parameter values. This gives insight in the actual influence of the introduced complexity. In the second method selected parameter values were optimized using a global optimization algorithm (SCEM-UA). The optimized model was then run for a validation period on which the model performance is based. Results indicated that a certain minimum amount and composition of complexity is needed to be able to describe hydrological behaviour in a reliable manner. The chosen methodology made it possible to determine the influence of complexity but was also influenced by unexpected results due to the coarse discretization. Furthermore, the optimization results are distorted due to a water balance error caused by an insufficient description of the evapotranspiration process. The optimized parameters are chosen in such a way that, given the mathematical definition of the model performance, the excess of water is distributed optimally. The water balance error occurs at every complexity step. The model performance is thus more a representation if the introduced complexity improves the possibility to better distribute the excess of water instead of describing the hydrological behaviour. The mathematical definition of the model performance proved to cause a biased result. The groundwater levels have relatively more influence on model performance than the discharge has, while an equal influence was intended.
Han Vermue Graduation Date: 25 March 2009 Graduation committee: University of Twente Dr.ir. D.C.M. Augustijn Dr.ir. M.J. Booij Waterschap Aa en Maas Ing. J. Moorman Royal Haskoning Ir. R. Velner
0 100 200 300 40022
22.5
23
23.5
24
24.5C0241
Time
Hea
d [m
]
Figure 1: Schematic overview of two different complexities.
Figure 2: Results of step 1 (plusses) and step 2 (circles) for a selected observation point.

6
DYNAMIC CONTROL OF SALT INTRUSION
Figure 1: Location of the Volkerak-Zoommeer. Figure 2: The Mark-Vliet system and the most important
locations for this study.
Originally the Volkerak-Zoommeer (figure 1) was part of the delta in the South-East of the Netherlands. It contained saltwater until it became a freshwater lake in 1987 because of the construction of the Delta Works. Nowadays, the Volkerak-Zoommeer experiences water quality problems in the form of blue-green algae. To solve this problem, two different strategies can be distinguished: freshwater and saltwater alternatives. The saltwater alternatives seem the most promising. The Mark-Vliet system (figure 2) lies in the west of Noord-Brabant, a province in the Netherlands. The Mark-Vliet system has two important functions: water supply for agriculture and shipping. The Volkerak-Zoommeer is connected to the Mark-Vliet system at two different locations. At each location a sluice and a lock are present. When the lake becomes salt in the future, saltwater can enter the system through the locks. The agricultural areas next to the Mark-Vliet system will experience problems due to this salt-intrusion. In order to reduce the salt-intrusion, the Mark-Vliet system can be flushed with freshwater. The water inlet near Oosterhout can be used for this. The goal is to achieve a desired water quality near the water inlets for agriculture. In an earlier study by Witteveen+Bos the flushing of the Mark-Vliet system has been examined. One of the recommendations of this study was to examine whether the flushing of the system can be optimized using Real Time Control. With Real Time Control the structures in the Mark-Vliet system can be controlled automatically by a computer. The adjustments in the settings of the structures – like the opening height of the drainage sluice gates – are based on actual measurements of water quality and quantity. To implement the Real Time Control strategies the Sobek computer model is used. The results show that by using Real Time Control the desired water quality near the agricultural water inlets can be achieved with a significantly smaller flushing volume than determined in the previous study. The use of water quality parameters in Real Time Control of surface water systems, as applied in this study, is an innovative and effective approach.
Marcel van den Berg Graduation Date: 9 April 2009 Graduation committee: University of Twente Prof. ir. E. van Beek Dr. ir. D.C.M. Augustijn Witteveen + Bos Ir. E.S.J. van Tuinen Ir. E.P. de Bruine

7
INDICATOR DEVELOPMENT TO DETERMINE THE STATEOF THE (SOUTH-WEST) DELTA
The Master Thesis describes the development of a set of indicators to reflect the state of the Dutch delta. Based on a literature study, an indicator development method is designed to compose the intended indicator set. The main process steps are formulating the scope, defining quality criteria, analyzing the system and formulating the indicators. An important aspect is the usage of participative approaches in the process. This method was applied in a case study about the Dutch South-West Delta (figure 1) with the purpose to give a picture of the urgent societal issues that are affected by the water and soil system. Experts and a number of intended users – decision-makers and citizens – were involved in the development process. They gave input to identify urgent societal issues, to analyse the water and soil system and to formulate potential indicators. The potential indicators are assessed by quality criteria, based on literature, and a final indicator set is selected. Furthermore, differences in mental mapping, interests and perceptions of reality between experts and intended users are assessed mapped. The final step was the evaluation of the application of the method during the case study. This was done by using four process criteria: applicability, coherence, satisfaction of the final product and enthusiasm of persons involved. On account of this evaluation, recommendations are made to adapt the indicator development method. The most important changes are a stronger emphasis on clear objectives and on sharp quality criteria, more participation – up to the level of coproduction - and explicit attention for the representativeness of the participation groups.
Wilco van Bodegraven Graduation Date: 22 April 2009 Graduation committee: University of Twente Dr. M.S. Krol Ir. R. Bijlsma Deltares Dr. J. van Deen
Figure 1: The area of the case study:the South-West Delta.
Figure 2: The structuring method used to analyse the system.
Layer model: very useful for analyses, planning and design and communication
Occupation
Speed of change
10-25 years
Networks
Speed of change
25-100 years
Groundlayer
Speed of change
50-500 yearsEnabling andconstraining public
privateRotterdam
Antwerp

8
THE WATER FOOTPRINT OF SUGAR AND SUGAR-BASED ETHANOL
The two most cultivated sugar crops are sugar cane and sugar beet. For centuries both crops have been used for the production of sucrose, generally known as table sugar. During the past decades, bio-ethanol production from sugar crops has become competitive with sugar production. In the USA, High Fructose Maize Syrups (HFMS) and maize-based ethanol are two substitutes for sugar and sugar crop-based ethanol. Crop production in general, and sugar cane production in particular, requires a lot of water. The aim of this study is to calculate the water footprint of sugar, HFMS and bio-ethanol in the main producing countries, to identify favourable production areas and possibilities, and to assess the impact on the water system in certain production areas. The water footprint is used here as indicator of water consumption in the full production chain of sugar or ethanol production. There is a large variation in the water footprint of sweeteners and ethanol produced from sugar beet, sugar cane and maize between the twenty main producing countries. Tables 1 and 2 present the water footprint of sweeteners and ethanol. There is large variation between both feedstocks and production locations. Table 1. The water footprint of cane sugar, beet sugar and HFMS 55 (m3/ton). Cane sugar Beet sugar HFMS 55 Weighted global avg. 1500 935 1125 Low Peru 870 Belgium 425 Argentina 565 High Cuba 3340 Iran 1970 India 3325 Main prod. country Brazil 1285 France 545 USA 740 Table 2. The water footprint of cane-, beet- and maize-based ethanol (l/l). Cane-based ethanol Beet-based ethanol Maize-based ethanol Weighted global avg. 2855 1355 1910 Low Peru 1670 Belgium 490 Argentina 955 High Cuba 6365 Iran 2570 India 5630 Main prod. country Brazil 2450 France 615 USA 1220 For the calculation of the grey water footprint international drinking water standards for nitrogen are applied. The contribution of the grey water footprint to the total water footprint is limited. The impact of stricter, ecological standards for nutrients and agrochemicals, on the grey and total water footprint is enormous. No international accepted standards for ecology however are available at present. The impact of the water footprint of sugar crops is assessed for the Indo-Gangetic basin in India, where sugar cane is an extensively cultivated crop as well as for the area north of the Black and Caspian Sea, where a lot of sugar beet is cultivated. Water consumption by sugar cane contributes for a considerable part to the water stress in the Indus and Ganges basins. Future developments in demography and industry, as well as climate change, will stress the basins even more. Agriculture, and especially the cultivation of thirsty crops, will put even more pressure on water resources. Although water stress is increasing in the Black and Caspian Sea area, the main problem with the rivers feeding both seas, Dnieper, Don and Volga, is pollution. Many tributaries and reservoirs, as well as the Black Sea ecosystem, are heavily polluted by contaminants from industry and excessive fertilizer application. Sugar beet, as one of the major crops in the area, shows a relatively big grey water footprint and is one of the contributors of pollution.
Wolter Scholten Graduation Date: 24 April 2009 Graduation committee: University of Twente Prof.dr.ir. A.Y. Hoekstra Dr. P.W. Gerbens-Leenes

9
MORPHOLOGICAL DEVELOPMENTS IN AGGRADING SECONDARY CHANNELS: DESIGN PARAMETERS & SEDIMENT CONTROL MEASURES
Within the framework of the program ‘Room for the River’ the number of secondary channels, which will be excavated in the floodplains of the river Rhine, is increasing. The secondary channels that are morphological active can result in major river management problems (for example strong aggradative channels). The prediction of morphological developments of secondary channels is still difficult, because the processes that determine the sediment division at river bifurcations are yet not fully described. This is the reason that the first objective of this graduate thesis is to gain more insight into the developments of secondary channels with analytical equilibrium analyses combined with numerical simulations in a 1D SOBEK-RE model. The model is using a predefined artificial secondary channel that has many similarities to one of the secondary channels in the river Waal at Gameren. The second objective is to explore the effects of (temporary) measures, which can be implemented in the water system, to solve these river management problems. These analyses showed that, dependent on the actual sediment division, the morphological developments in the secondary channel can be divided in three regimes: A) instable situations wherein the secondary channel always will be closed, B) stable situations wherein sedimentation can be expected or C) stable situations wherein erosion can be expected, till a certain equilibrium depth. For instable situations it is recommended to apply measures at the intake that will decrease the supply of sediment to the secondary channel. In other cases it is recommended to design the channel in such a way, that the in- and outflow of sediment is equal which will lead to ‘neutral’ morphological activity in the secondary channel. At the moment this can only be achieved by redesigning the secondary channel after a certain trial/monitoring period with newly developed guidelines.
Ward Klop Graduation Date: 19 June 2009 Graduation committee: University of Twente Dr.ir. J.S. Ribberink UT and Waterdienst Dr. R.M.J. Schielen Royal Haskoning Ir. G.J. Akkerman Rijkswaterstaat ON Ir. H. Havinga
Figure 1: Aerial view of a secondary channel at Gameren in the River Waal.
Geometry and location of the predefined secondary channel in the SOBEK-RE model
Upstream location [River kilometer]
Upstreamexcavation depth [m+NAP]
Length [m]
Average width [m]
Roughness height [m]
Bottom slope [-]
Secondary channel 937 0.4 2,500 55 0.18 6:100,000
Time scale 0,6 m (1 m+NAP) and 1,1 m (1,5 m+NAP) aggradation in the secondary channel
0
10
20
30
40
50
60
70
0 0,1 0,2 0,3 0,4 0,5 0,6 0,7 0,8 0,9 1 1,1 1,2 1,3 1,4 1,5 1,6 1,7 1,8
Parameter Y [-]
Tim
e sc
ale
[yea
rs]
0
1
2
3
4
5
6
7
8
9
10
Sedi
men
t su
pply
to
the
sec
onda
ry c
hann
el[%
of
tota
l sed
imen
ttra
nspo
rt o
f th
e ri
ver
Waa
Time scal e 0,5 m aggradation Interim regi mes of the morphologi cal development
Time scha le 1,1 m aggradation Sediment supply to the secondary channel
Figure 2: Time scale for 0.6 m and 1.1 m aggradation in the secondary channel (blue lines) as a function of the sediment division at the river bifurcation (parameter ‘Y’ ). An increase in the value of parameter ‘Y’ results in a decrease of the sediment supply to the secondary channel (light orange line). Hereby the sediment supply is given in percentage of the total sediment
10
ENERGY SCENARIOS IN A WATER PERSPECTIVE CHANGES IN WATER FOOTPRINTS RELATED TO ENERGY TRANSITIONS Transitions in the energy sector are occurring continuously. They are driven by the need to find more efficient, cleaner and sustainable fuels. The use of bio-energy is currently seen as an alternative that has many of these characteristics. Renewable energy from plants and trees seems very promising and countries all over the world are already heavily promoting its use. It is not strange therefore that bio-energy has a prominent role in future energy scenarios. In general, it is expected that in 2030 biomass will have the largest share of all renewables. However, the large-scale production of energy from biomass also has its complications. Issues about competition between food and energy crops and the carbon dioxide neutrality of bio-energy are already discussed plentiful. In addition, many studies have been done to examine the extent bio-energy can be used in the light of land availability, agricultural technology, biodiversity and economical development. But there are very few studies that look at the impact of bio-energy on the water system. Plants and trees need water to grow and the production of biomass is indisputably one of the largest water consumers in the world. This research aims to map the consequences of the transition to a larger share of bio-energy in total energy consumption on the water footprint of energy sectors across the globe, and subsequently assess the water stress caused by existing energy scenarios for 2030. The water footprint is a measure of how much fresh water is used to produce goods and services, in this case bio-energy. This research uses water footprint analysis to investigate the change in water demand related to a transition to bio-energy. Information about these transitions is based on specific energy scenarios. A clear distinction is made between three different bio-energy carriers. The analysis includes the consumption of first generation bio-ethanol, bio-diesel and bio-electricity and heat in nearly all countries of the world. Each of these bio-energy types uses different biomass feedstocks (i.e. energy crops) and this research examines the probable feedstock choice per type in each country. Using blue and green virtual water content data of each crop per country, a translation is then made from bio-energy consumption to water consumption. It is found that existing energy scenarios all project an absolute increase in bio-energy consumption in the future. In the global bio-energy mix, it is expected that about 91 percent is bio-electricity and heat, 6 percent is bio-ethanol and 3 percent is bio-diesel. Overall, this means that more biomass will be grown for energy purposes and, since biomass needs water to grow, the transition to bio-energy will lead to a larger water footprint of the global energy sector. Together with the blue and green water demands from other sectors, the bio-energy water footprint is compared to the blue and green water availability. For each country, a balance is made of fresh water resources and uses, enabling the determination of the water volume available for bio-energy. The comparison allows a measure of water stress to be established corresponding to the (projected) bio-energy consumption. The competition for available runoff between blue water users will likely cause blue water stress in many countries, especially in Europe, Developing Asia and the Middle East. In about half of the countries that are likely to suffer blue water stress in 2030, bio-energy consumption contributes to, or is fully responsible for, the water stress. It is expected that the green bio-energy water footprint, will cause green water stress in even more countries all over the world. The primary reason is the enormous projected increase in consumption of bio-electricity from rain fed plantation wood. This is expected to take up much of the productive green water supply in many countries. On a global level, the green bio-energy water footprint will comprise almost 40 percent of the total green water supply, whilst the blue bio-energy water footprint is expected to be about 4 percent of total available runoff for humans in 2030. Hence, energy scenarios should not only be analyzed in the context of land availability, food production, biodiversity and the carbon dioxide balance, they also need to be looked at in a water perspective. This study shows the repercussion of extensive bio-energy consumption on the fresh water resources. It advocates that countries should consider the water factor thoroughly when investigating the extent to which bio-energy can satisfy their future energy demand.
Sander van Lienden Graduation Date: 1 July 2009 Graduation committee: University of Twente Prof.dr.ir. A.Y. Hoekstra Prof.dr.ir. T.H. van der Meer Dr. P.W. Gerbens-Leenes

11
THE EFFECTS OF JONGLEI CANAL OPERATION SCENARIOS ON THE SUDD SWAMPS IN SOUTHERN SUDAN
Figure 1: The Sudd area. Figure 2: Historic water balance of the Sudd.
The Sudd, one of the largest wetland areas in the world, is faced by huge evapotranspiration rates. More than 50% of the Sudd inflow is evaporated out of the Sudd swamps, resulting in a lower water availability downstream. To enhance water availability, planners have proposed to dig a canal (Jonglei Canal) around the Sudd area, to save 4.8 Gm3 of water per year. What the effects on the swamp area in the Sudd will be is still relatively unknown. The goal of this research is to study the effects of different Jonglei canal scenarios on the Sudd swamps. The first phase of the research consisted of simulating the monthly historic water balance for the period 1961 – 2000. The model that is used describes the Sudd as a reservoir, where the input comes from the precipitation and the inflow, and the outflow from the evapotranspiration and the outflow. The results from the water balance show that the swamp size in the period 1961 – 1964 increased by almost 300 % from 15 Gm2 to around 60 Gm2. In the period 1965 – 1978 the swamp size recovered to around 42 Gm2 where it slightly decreased to 35 Gm2 by 1978. In the period 1979 – 1981 the swamp shows a sudden increase in size. This is caused by a high increase in the precipitation in that period. In the last period until 2000 the Sudd swamp size fluctuates around 30 Gm2. The second phase of the study several Jonglei canal operation scenarios have been tested. The scenarios are placed in three groups: fixed canal flows, seasonally dependent canal flows, and canal flows where the extra water volume, available downstream of the Sudd, will be 4.8 Gm3/year. The results from the fixed canal flows show a highly linear relation between the flow and the change in the permanent (16 – 26 %), seasonal (13 – 22 %) and total swamp size (15 – 25 %). The effects with seasonally dependent canal flows will be highest on the size of the seasonal swamp. The change in the size of the permanent swamp depends mainly on the total annual canal flow. The change in the seasonal swamp size depends on the canal flow in the wet period. The change on the total swamp size depends, just like the permanent swamp, on the total annual canal flow. To achieve an additional 4.8 Gm3/year water downstream of the Sudd, the average canal flow needs to be 18 Mm3/day. In a scenario with a canal flow of 26 Mm3/day in the dry period and 10 Mm3/day in the wet period, negative impacts for various stakeholders will be smallest.
Erwin Lamberts Graduation Date: 27 August 2009 Graduation committee: University of Twente Prof.ir. E. van Beek Dr. M.S. Krol
010203040506070
1961 1965 1969 1973 1977 1981 1985 1989 1993 1997
Swam
p s
ize
(G
m2)
Time (years)
Total swamp size in the Sudd area
Permanent swamp Seasonal swamp

12
THE CONSEQUENCES OF FUTURE CHANGE FOR THE WET HEART IN THE NETHERLANDS IN 2050
The Wet Heart of the Netherlands is the area that contains the IJsselmeer, Markermeer and the Randmeren. It is situated in the middle of the Netherlands and the area is of great importance to the Dutch economy. This is caused by the multifunctional characteristics of the area; the main functions are safety, agriculture, drinking water, shipping, recreation, water storage and industry. Considering the functioning of the Wet Heart it is expected that both climate change and social-economic change will have influence. These changes are anchored in scenarios, which give expectations for the year 2040 (social-economic changes) and 2050 (climate change). The future climate and socio-economic scenarios will have different consequences for the society. In this research the damage for agriculture and shipping in 2050 has been investigated. The damage for agriculture is the consequence of low groundwater levels and a shortage of irrigation water. This will cause drought damage or starvation for the crops. Shipping will suffer consequences because of low water levels in the lakes, which has a negative influence on the transport capacity of the ships. In order to quantify and make an expectation of the scenario consequences a model has been developed; which is named the PAWN – Light model. In this model the scenarios for socio-economic changes and climate change have been implemented. The data that varies between the scenarios is evaporation, precipitation and Rijn discharge (for climate scenarios) and area surfaces for the various types of land use. In the PAWN – Light model the compartments land are connected to the compartment surface water. These are connected to the IJsselmeer and Markermeer. Using the PAWN - Light model eight scenario-runs have been carried out which show that significant effects are present in the scenario results. The socio-economic scenarios have a decreasing effect on damage consequences. This is caused by the surface decrease of the agricultural areas (-10% for the Regional Communities scenario and -17% for the Global Economy scenario). The remaining fraction agriculture is equal to the fraction in the reference scenario. The climate scenarios have a larger effect on the Wet Heart. Especially the climate scenario W+ has a large effect on the consequences for the IJsselmeer system. The increase of damage for agriculture is 31%. This first indication of the PAWN – Light model is that the current policy is not capable of correcting these consequences and adapting measures should be considered to be able to cope with future changes. Considering the model it is advised to execute further calibration and validation. This way the model can give more realistic values for agricultural damage when implementing scenarios or measures for future analysis. To determine shipping damage it is advised to implement a basic damage module for shipping into the PAWN – Light model.
Harm-Jan van Donk Graduation Date: 4 September 2009 Graduation committee: University of Twente Prof.ir. E. van Beek Dr.ir. M.J. Booij Deltares Drs. M. Haasnoot

13
SIMULATION OF PRESENT AND FUTURE DISCHARGES AT THE NILE RIVER UPSTREAM LAKE NASSER
Bar graph showing annual water resources (Bm3·year-1) at the Nile River based on observations for the 1990 climate and NHSM-GCM simulations for the 2100 climate, including a low, average and high prediction.
Water managers in the Nile Basin face a challenge, dealing with scarce water resources under changing conditions. Currently downstream countries like Sudan and Egypt use more more than 50% and 90% of their long term renewable water resources which are prawn to change under upstream river developments and climate change. Where for the upstream developments a River Basin Simulation Model (RIBASIM-NILE) is developed, in this study the model is enhanced to a Nile Hydrological Simulation Model (NHSM) by simulating sub-catchment runoff by the HBV rainfall-runoff model at the locations where RIBASIM-NILE is forced by sub-catchment runoff. The NHSM is calibrated and validated over the period 1961-2000, for which observed meteorological forcing and discharges are available. Results on the scale of main river tributaries are satisfying. However, on sub-catchment scale improvements can be made. To simulate future river discharges, the NHSM is forced by meteorological variables derived from simulations of three Global Circulation Models (GCMs) under two greenhouse gas emission scenarios. Prior, bias is removed by correcting simulations for the 1961-1990 periods to the observed mean monthly climatology. Performance of NHSM-GCM combinations in representing the current hydro-climate is low, whereby remaining bias in the spatio-temporal variability of simulated rainfall is identified as the main source for improvement. Simulating 2065 and 2100 hydro-climates with NHSM-GCM reveals a random pattern which is only partly supported by literature. It is presumed that by the current method better results can be obtained by (1) using only GCMs which show a low bias in simulating the local climates, (2) correcting temporal bias in rainfall simulations on more than only observed mean monthly values and (3) increasing spatial representation of simulated rainfall by downscaling GCM simulations to the resolution of the NHSM.
Daniël Tollenaar Graduation Date: 18 September 2009 Graduation committee: University of Twente Prof. ir. E. van Beek Dr. ir. M.J. Booij Deltares Dr. J.C.J. Kwadijk

14
THREE DIMENSIONAL FLOW STRUCTURE IN SEMI-ENCLOSED BASINS
Amphidromic plot of tidal elevation η [m] (colours signify contours with the same tidal amplitude while black lines signify contours with the same tidal phase) Mofjeld, H.O. (1980). Effect of vertical viscosity on Kelvin waves. Journal of Physical Oceanography (10), pp. 1039-1050. Taylor, G.I. (1921). Tidal oscillations in gulfs and rectangular basins. Proceedings of the London Mathematical Society (20),
pp. 148-181.
Coastal areas are generally intensely used areas with high population density and economic activity. On a basin scale the tide directly determines water levels and currents in a basin. These flow characteristics furthermore determine the shape of the basin itself, for example the forming and evolution of tidal sandbanks, which in turn influences the flow pattern (this is referred to as the morphodynamic loop). Because of its importance for various human and natural activities tidal flow has been modelled with various 3D and depth-averaged (2DH) models. The first analytical 3D-model that describes tidal flow in a semi-enclosed basin using Kelvin and Poincaré modes with partial slip was created for this research. For this the method devised by Mofjeld (1980) for 3D tidal flow along a single coast with viscosity and no-slip was extended, thereby following Taylor’s approach (1921). As a reference situation the Northern Part of the North Sea was modelled and the properties of the Kelvin and Poincaré modes described (see figure below for an amphidromic plot of the elevation in m). Also the flow and shear stress properties were studied. An important conclusion was that a friction parameter for a 2DH model can be reasonably found by fitting the Kelvin dissipation factor of the 3D model with the 2DH model. Eventually this friction leads to an average error in predicting 3D longitudinal bottom shear stress amplitude with a 2DH model of 13% while the theoretically best result would have been 3%.
Olav van Duin Graduation Date: 2 October 2009 Graduation committee: University of Twente Prof.dr. S.J.M.H. Hulscher Dr.ir. P.C. Roos Delft University of Technology Dr. H.M. Schuttelaars

15
THE INFLUENCE OF LATERAL DEPTH VARIATIONS ON TIDAL DYNAMICS IN SEMI-ENCLOSED BASINS
Taylor, G.I. (1921). Tidal oscillations in gulfs and rectangular basins. Proc. of Lon. Math. Soc., Vol. 20, pp. 148-181.
Understanding tidal dynamics is important for coastal safety, navigation and ecology. Many tidal basins around the world can be classified as semi-enclosed, i.e. bounded at three sides by coasts. In this study Taylor’s (1921) classical problem of tidal wave propagation in a rotating (due to the Earth’s rotation), rectangular semi-enclosed basin of uniform depth is extended to account for basin-scale, lateral depth variations. A semi-analytical, hydrodynamic model is used to find fundamental wave solutions, i.e. modified Kelvin and Poincaré waves. The properties of the modified wave modes depend on the type of lateral depth profile and have different characteristic length scales compared to the uniform depth solutions. The solution to the Taylor problem is written as a truncated sum of the modified wave modes, where a collocation technique is applied to satisfy the no-normal flow requirement at the basin’s closed end. In general, it is found that the elevation amphidromic points (EAPs) remain on the centre line of the basin for symmetric lateral depth profiles (as for uniform depth), whereas they are laterally displaced towards the deeper side of the basin for asymmetrical profiles. In addition, the EAPs shift in longitudinal direction, due to altered Kelvin wave lengths. The current amphidromic points (CAPs) show similar shifts. Finally, a practical case is studied: the Southern North Sea with and without large-scale sand extraction, where sand extraction is represented as a large-scale shore-parallel trench (see Figure 1). It is found that adopting a realistic lateral depth profile instead of a uniform depth considerably alters the tidal amplitudes and currents. Furthermore, it is concluded that large-scale sand extraction may considerably impact on the tidal system, not only locally, but also farther away from the extraction area. In turn, this may affect the morphodynamics and, consequently, coastal safety and ecology.
Wiebe de Boer Graduation Date: 9 October 2009 Graduation committee: University of Twente Prof.dr. S.J.M.H. Hulscher Dr.ir. P.C. Roos Rijkswaterstaat Drs. A. Stolk
Figure 1: Differences in tidal currents as a result of a 8*104 Mm3 sand extraction trench (bounded by the dashed lines). The right-hand boundary is open, the other boundaries (indicated by thick black lines) are closed.

16
WAVE BOUNDARY LAYER STREAMING ANALYSIS ON WAVE BOUNDARY LAYER STREAMING AND ITS EFFECT ON BED SHEAR STRESS
Davies, A. G., Villaret, C. (1999). Eulerian drift induced by progressive waves above rippled and rough beds. Journal of
Geophysical research, Vol. 104, NO. C1, pages 1465-1488. Longuet-Higgins, M. S. (1953). Mass transport in water waves. Trans. R.Soc.London Ser. A245, pp. 535-581. Uittenbogaard, R. E. (1999). Overview of the POINT SAND MODEL. Delft Hydraulics, Z2899.10.
Cross-shore morphological development of a sea bottom is mainly determined by sediment transport close to the seabed caused by the actions of waves and currents. In addition to pure fluctuations, waves can induce steady currents such as Eulerian boundary layer streaming or boundary layer drift. The presence of such additional near-bed currents can result in additional bottom sediment transport. The aim of this study is to get insight in underlying mechanisms of Eulerian streaming and their effects on bed shear stress that is determinative for sediment transport. In this study three streaming models are compared under characteristic wave conditions in the North-Sea: a constant viscosity model (Longuet-Higgins, 1953), a time-dependent viscosity model (Davies and Villaret, 1999) and a 1-DV numerical POINT SAND model of Uittenbogaard (1999). Furthermore, two analytical models for bed shear stress are verified with bed shear stress results from the POINT SAND model: the bed shear stress model of van Rijn (2007), and Nielsen and Callaghan (2003). Van Rijn (2007) takes account for streaming by adding a positive streaming velocity, where Nielsen and Callaghan [2003] add the wave Reynolds stress to take account for streaming. In this study it is shown that above flat beds the streaming velocities are onshore-directed near the sea bed as well as away from the bed. This is the result of the dominant, positive contribution of the wave Reynolds stress to streaming compared to the negative contribution of the wave component of mean turbulent Reynolds stress (see Figure 1). The study also showed that a better representation of the bed shear stress is given by the model of Nielsen and Callaghan (2003) compared to the model of van Rijn (2007).
Suleyman Naqshband Graduation Date: 12 October 2009 Graduation committee: University of Twente Dr.ir. J.S. Ribberink Ir. W.M. Kranenburg Drs. J.L.M. Schretlen
0
2.5
5
7.5
10
0 0.05 0.1
u/U1
LH53DV99PSM
Figure 1: Onshore streaming near the sea bed induced by progressive waves

17
EVALUATION OF VEGETATION RESISTANCE DESCRIPTORS FOR FLOOD MANAGEMENT
For prediction of the behaviour of water levels in rivers, computational river flow models are used. An important parameter of these models is the (hydraulic) resistance. The presence of vegetation has a major effect on this flow resistance. Different methods are available to calculate the resistance with a simplified representation of the vegetation. The aim of this research is to identify the practical suitability of different vegetation resistance methods, by compiling a data set of flow experiments and to use this data set to evaluate the ranges of applicability of different (existing) vegetation resistance methods. For submerged rigid vegetation, seven vegetation resistance methods are selected from literature. For flexible vegetation such methods are lacking. Methods defined for rigid vegetation are often also used to determine the resistance of more complex flexible vegetation. Therefore, the seven theoretical descriptors for rigid vegetation are also compared with data of flexible vegetation. An existing dataset was used, supplemented by new data from literature. One of the main uncertainties in the flow experiments is the determination of the drag coefficient (especially for flexible vegetation) and the slope. A scheme is developed which can be used to deal with unknown values for the slope and the drag coefficient. Consistency in determining these parameters makes data different sets easier to compare with each other. All methods perform well in predicting water levels and velocities for rigid vegetation, except one which shows large deviations for higher water levels (>1 m). The performance of the seven descriptors in predicting the water levels for flexible vegetation is more divers. Three methods perform equally well for flexible vegetation. It is expected that more accurate results could be achieved for flexible vegetation, when the blockage area for natural plants with side-branches and foliage, and the flexibility are taken into account in the drag coefficient. For further research more laboratory experiments are required especially for higher water levels, and to investigate the influence of flexibility, side branches and leaves on the drag coefficient.
Alida Galema Graduation Date: 30 October 2009 Graduation committee: University of Twente Dr.ir. D.C.M. Augustijn Dr. F. Huthoff

18
VIRTUAL WATER TRADE IN THE SADC REGION A GRID-BASED APPROACH
Many areas in the world are water scarce and likely to become water scarcer. Therefore research is carried out on water stress and water quality. Most of these studies, however, focus on water efficient production and neglect the effects of consumption and virtual water flows related to trade. The water footprint (WF) concept considers all three aspects and makes it possible to analyze the effects of water allocation, trade and consumption on water scarcity more thoroughly. The water footprint is the total volume of fresh water used to produce a commodity. The goal of this study is to increase knowledge for national and regional water management by applying the WF computation method for crops in a spatially-explicit way and by analyzing the impacts of water consumption and international virtual water trade on water scarcity. The Southern African Development Community (SADC) region is analyzed because it is one of the most water insecure regions in the world. The method for calculating the WF of commodities is based on the approach of Hoekstra and Chapagain (2008). New in this study is that spatially explicit data, the actual crop evapotranspiration based on the water stress coefficient and a vertical soil water balance as described by Allen et al. (1998) are used to compute the WF of crops. Also water pollution (grey WF) is included. The study considers water consumption of the SADC related to both production and consumption and quantifies virtual water trade. It accounts for water use for 22 crops, 8 animal categories and industry for the period 1996-2005. The study shows that the WFs of crop and livestock products are high for most SADC nations compared to the global average WFs. Compared to the global average industrial WF related to production, the SADC countries have very low WFs except for Madagascar, Malawi, Zambia and Zimbabwe. Virtual water flows related to trade are important for the SADC. The WF of consumption exists for 11% of virtual water from imported products. About 9% of the WF related to production is meant for export products. Especially agricultural products are traded between the SADC and other regions in the world. The SADC saves 7 Gm3/yr due to virtual water imported through trade. Intra-SADC trade in crops, livestock and industrial products makes up 24%, 44% and 16% of total virtual water flows related to trade in these products respectively and is dominated by South Africa and Zimbabwe. SADC’s WF of consumption (772 m3/capita/yr) is low compared to the global average WF (1243 m3/capita/yr) and exists for 99% of agricultural products, 1% of industrial products and 0.4% of domestic water consumption. Although, at the national level the study did not show SADC countries to be water scarce, the spatially explicit study shows that in total 27 areas in Angola, Madagascar, Mozambique, Namibia, South Africa, Tanzania and Zimbabwe are water scarce and depend on water from other areas or groundwater.
Bert Kort Graduation Date: 12 February 2010 Graduation committee:University of Twente Prof.dr.ir. A.Y. Hoekstra M.M. Mekonnen, MSc.

19
MODELLING WAVE ATTENUATION BY VEGETATION WITH SWAN-VEG MODEL EVALUATION AND APPLICATION TO THE NOORDWAARD POLDER
Mendez, F.J., Losada, I.J., [2004]. An empirical model to estimate the propagation of random breaking and nonbreaking waves over vegetation fields, Coastal Engineering 51, pp. 103-118.
In the Noordwaard polder a vegetation field is proposed in front of a planned dike to damp waves such that the desired dike height can be reduced. To investigate the impact of vegetation on waves, a version of the wave model SWAN was used in which the description for wave attenuation as derived by Mendez and Losada [2004] was implemented. This SWAN-VEG model was tested by performing a sensitivity analysis and by calibration and validation on experimental flume data. The sensitivity analysis showed that more, wider, higher or less flexible vegetation result in a lower wave height behind the vegetation field, as expected. SWAN-VEG appears only suitable to describe waves with a wave period of 2 seconds or longer. Calibration of the model for the drag coefficient gave reasonable correlations between predicted and measured wave attenuation and was confirmed by validation. It shows the model is able to describe the experimental results with one drag coefficient per species. Application of SWAN-VEG to the Noordwaard polder shows that a field of willows of 100 m in length is able to reduce waves of up to 1.1 meter in height, generated under extreme conditions, by 70%. A drawback of SWAN-VEG is a uniform wind speed over the entire area, causing wave growth inside the vegetation field. Compensating for this effect results in a wave height reduction of 80%. These results demonstrate that a field of willows reduces wave heights sufficiently to allow a lower dike that fits better into the landscape while maintaining the required safety standard. Table 1: Calculated maximum wave heights per location with and without vegetation.
Location Wind direction [°]
Wind speed [m/s]
Wave height without vegetation [m]
Wave height with vegetation [m]
1 292.5 33.9 0.80 0.28 2 292.5 33.9 0.94 0.30 3 270 35.2 1.00 0.35
Reinout de Oude Graduation Date: 5 February 2010 Graduation committee: University of Twente Dr.ir. D.C.M. Augustijn Dr. K.M. Wijnberg Deltares Ir. F. Dekker Drs. M.B. de Vries
Figure 1: Schematisation of Noordwaard as inundation area with location of dikes and levees.

20
INFLUENCE OF UNCERTAINTIES IN DISCHARGE DETERMINATION ON THE PARAMETER ESTIMATION AND PERFORMANCE OF A HBV MODEL IN MEUSE SUB BASINS
Water institutes from all over the world have an important task of predicting future short-term and long-term discharges and water levels in river basins for water management regarding floods and droughts. Before a model is applicable to a certain river basin, it has to be calibrated and validated. In the calibration process a set of parameters is searched for which the model approximates the measured discharge best, given sets of measured input data series. A lumped version of the HBV model is used in this research. It uses observed precipitation, temperature and potential evapotranspiration as input and the observed discharge for the calibration. The effect of input uncertainty on calibration is significant and is already studied in previous research. The influence of uncertainties in the observed discharge on the parameter estimation and performance of the HBV model is investigated, applied to the Ourthe and Chiers which are two sub basins of the Meuse river. First, the different types of error sources in discharge series are identified where systematic and random errors are distinguished, and errors in measurement and Q-h relations used in deducing discharges. After that, observed discharge data series are adapted in a way that the series include these errors. A realistic scenario is developed, which contains different error sources that are expected to occur in these basins. Subsequently the HBV model is calibrated for each of the discharge data series. For these calibrations, the automatic global searching method SCEM-UA is used together with a combined objective function, which emphasizes on both the water balance and the shape of the hydrograph. Results show that model performance for the Ourthe is better compared to the Chiers basin. Furthermore it is observed that errors in discharge series that have a systematic character have much influence on model performance in both basins, while random errors and errors that are a result of processes in the hydrograph do not show much influence. The figure shows that with a certain positive systematic error (a positive value for BALANCE), the model performance increases with respect to the original situation. Regarding the influence of the errors on model parameters it is concluded that if a significant influence on model performance is present, model parameters are influenced as well. The water balance related parameters are mainly influenced by systematic errors, while other parameters do not show an obvious pattern.
Sander van den Tillaart Graduation Date: 29 April 2010 Graduation committee: University of Twente Dr. M.S. Krol Dr.ir. M.J. Booij
-0.3 -0.2 -0.1 0 0.1 0.2 0.30.6
0.65
0.7
0.75
0.8
0.85
0.9
BALANCE
obje
ctiv
e fu
nctio
n y

21
REAL-TIME CONTROL OF THE SOUTH-NORTH WATER TRANSFER PROJECT WITHIN JIANGSU PROVINCE IN CHINA
China is currently working on the construction of the massive South-North Water Transfer Project (SNWTP), the largest project of its kind ever undertaken (transfer of 44.8 billion m3 of water per year; over 300 million expected benefiting people). The project corresponds to China’s severe water scarcity and geographically uneven south-north distribution. The 'Jiangsu water transfer system' is a 411 km long section of this project and will divert as much as 8.9 billion m3/year (up to 500 m3/s ) from the lower Yangtze River reach uphill through an existing network of canals and lakes in the direction of the Yellow River and Beijing. In order to fulfill these functions, controllable structures, such as gates, weirs and pump stations are used. Real-time control (i.e. daily management) of such a complex water system with multiple, conflicting objectives is preferably done by an advanced controller such as Model Predictive Control (MPC). In this thesis MPC is developed for the Jiangsu water transfer system and the performance is assessed. MPC is a control algorithm that makes explicit use of a simplified process model (internal model) of the real system to obtain control actions by minimizing an objective function over a prediction horizon. In order to put the performance of MPC into perspective, classical control [Proportional-Integral control (PI)] has been developed for comparison in the test scenarios. The research showed that the complex Jiangsu system can successfully be modeled using a 1D-hydraulic model and can be controlled using MPC. The results show that MPC outperforms classical PI control under all scenarios, however on some goals the improvement is minor or almost nil. MPC keeps water levels within a bandwidth of 0.16 meters from target level under all circumstances and therefore never exceeds minimum or maximum allowed water levels. The higher the flows through the canals, the larger the water level deviations. With good disturbance predictions the performance of MPC on water levels is further improved. MPC is not able to significantly reduce operational costs without making sacrifices on other objectives. The limits of MPC have been reached; a large time step (1 hour) and a short prediction horizon (1-2 days) are required to enable MPC on a system this large. Almost perfect disturbance predictions have been used, thus performance on the real system might be lower. On the other hand the quality of the process model can be improved to improve the performance. It is recommended to do further research by testing MPC parallel to the real water system and compare the performance to current control. Furthermore it is desirable to develop a user interface that allows water managers to simply implement new control objectives.
Meinte Vierstra Graduation Date: 27 April 2010 Graduation committee: University of Twente (UT) Prof.ir. E. van Beek Waterdienst and UT Dr. R.M.J. Schielen Waterdienst Ir. J.P.F.M. Janssen Delft University of Technology Dr.ir. P. van Overloop

22
A COMPARISON OF WAVE-DOMINATED CROSS-SHORE SAND TRANSPORT MODELS
Due to the increasing amount of activities in the coastal areas, it is becoming more and more important to be able to predict the morphological developments in these areas. For this purpose many sand transport models have been developed. Most of the existing cross-shore sand transport models for coastal areas are based on data measured in experiments conducted in oscillatory flow tunnels (OFT). In these experiments boundary layer streaming, which is a steady current induced by surface waves, does not occur. Boundary layer streaming could be relevant for cross-shore sediment transport, since the current is present close to the bed and it is constant in one direction. In the recent years three practical wave-dominated cross-shore sand transport models have been developed that include boundary layer streaming. The objectives of this study are i) identifying which model is the most suitable for predicting wave dominated cross-shore sand transport and ii) gaining more understanding of the influences of the boundary layer streaming on the model performances under surface wave conditions. To reach the objectives, the sand transport predictions of the models of Nielsen (2006), Van Rijn (2007) and a new transport model, the SANTOSS model (recently developed by the University of Twente and the University of Aberdeen), are compared with a large dataset of measured sand transports in OFT experiments and surface wave experiments. Furthermore, model intercomparisons are carried out to assess which model gives the best performance in cross-shore sand transport predictions under different conditions. This study shows that only the model of Nielsen is not able to perform well under surface wave conditions; the model overestimates the sand transport under these conditions. The two other model perform well under surface wave conditions. Furthermore, this study shows that only the model of Van Rijn is not able to perform well under acceleration skewed (sawtooth shaped) wave conditions. The two other models are able to perform well under these conditions. The most important difference between the models is that among the three models, only the SANTOSS model is able to perform well under rippled-bed conditions and fine sand sheet flow conditions. The two other models predict the sand transport into the wrong direction under these conditions. The three figures below illustrate the performances of the three models.
Wing Hong Wong Graduation Date: 31 May 2010 Graduation committee: University of Twente Dr.ir. J.S. Ribberink Drs. J.L.M. Schretlen Dr. K.M. Wijnberg
From left to right; the performances of the models of Nielsen, Van Rijn and the SANTOSS model. The X-axis represents the measured sand transport; the Y-axis the calculated sand transport. The solid line indicates perfect agreement; the dashed lines a factor 2 difference.
Nielsen Van Rijn SANTOSS

23
THRESHOLDS FOR FLOOD FORECASTING AND WARNING EVALUATION OF STREAMFLOW AND ENSEMBLE THRESHOLDS
The use of ensemble weather predictions in flood forecasting is an acknowledged procedure to include the uncertainty of meteorological forecasts in streamflow predictions. Flood forecasters can thus get an overview of the probability of exceeding a critical discharge, and decide on whether a flood warning should be issued or not. This offers several challenges to forecasters, among which: 1) How to define critical thresholds along all the rivers under survey? 2) How to link locally defined thresholds to simulated discharges, which result from models with specific spatial and temporal resolutions? 3) How to define the number of ensemble forecasts predicting the exceedance of thresholds necessary to launch a warning? The streamflow thresholds are evaluated for 75 catchments in France with defined operational thresholds. The emphasis lies on exceedances of this streamflow threshold -based on instantaneous observations- by daily discharges during a period of 10 years. The analysis shows that there is an optimal trade-off among hits, misses and false alarms, expressed in the Critical Success Index (CSI), when the streamflow thresholds are multiplied by an adjustment factor of 0.90. The optimal ensemble threshold is chosen to minimize the number of false alarms and misses, while optimizing the number of flood events correctly forecasted. Furthermore, in this study, an optimal ensemble threshold also considers flood preparedness: the gain in lead-time compared to a deterministic forecast. Data used to evaluate the ensemble thresholds come from a dataset of 208 catchments all over France, which covers a wide range of hydroclimatic conditions. The GRPE hydrological forecasting model, a lumped soil-moisture-accounting type rainfall-runoff model, is used. The model is driven by the 10-day ECMWF deterministic and ensemble (51 members) precipitation forecasts for a period of 18 months. he results show that there is no overall ensemble threshold for the streamflow predictions based on the ECWMF forecast which results in a higher CSI and a gain in lead-time for the exceedance of the Q99 streamflow threshold (99th percentile over the 18 month period) compared to the deterministic forecast. The optimal ensemble thresholds for the lower streamflow thresholds also result in a negative preparedness score (i.e. a loss in lead-time).The same analysis is conducted for a sub selection consisting of 29 large catchments. In this case there is an ensemble threshold for the Q99 streamflow thresholds which results in a higher CSI score and a gain in lead-time. Both scores could be maximized when a catchment specific ensemble threshold is applied.
Werner Weeink Graduation Date: 22 June 2010 Graduation committee: University of Twente Dr. M.S. Krol Dr.ir. M.J. Booij Cemagref Dr. M.H. Ramos
Number of misses (m), false alarms (f) and hits (h) as function of the number of ensemble members exceeding the Q99 threshold.

24
INFLUENCE OF SURFACE WAVES ON SAND WAVE MIGRATION AND ASYMMETRY
In shallow seas, when sand is in good supply and tidal currents are sufficiently strong, sand waves may occur. Sand waves are wavelike bed forms that have a maximum height of up to 1/3 of the water depth and they may migrate up to several tens of metres per year. The growth and migration of sand waves can have significant influences of human offshore activities: The depth available for navigation may be reduced and/or buried pipelines may be exposed, increasing their vulnerability. It is therefore important to understand the spatial and temporal behaviour of sand waves and the processes which cause sand wave changes in time. This research focussed on the influences of the height and direction of surface waves on sand wave shape characteristics and the direction and rate of sand wave migration. To do this, temporal variations in the bathymetry, as well as in current and wave data were studied and compared with the output of a 2DV, idealized sand wave model named the “Sand Wave Code”. Two case studies were performed, one discussing the area situated off the Dutch coast near IJmuiden and the second about an area near the English Channel at the Varne bank. In the Varne empirical dataset, we found that tall sand waves with narrow crests, that were formed during a two month period of relatively fair weather, were reduced in height by a metre and in transect volume by 20%, after a two month period of storms. The sediment was moved from the crests of the sand waves to the troughs. The sand waves also showed a change in the horizontal shape asymmetry. The sand waves in the IJmuiden site showed a back and forth migration in time. The Sand Wave Code was modified to be able to vary the direction of the surface waves. The simulation results show realistic sand wave migration rates and sand wave lengths and heights. The simulations also show that the sand waves reduce in height under increasing surface waves. The time scale and magnitude of these changes however, do not support the conclusion that these happened due to changes in the surface waves alone. Furthermore, the observed migration back and forth of sand waves could not be simulated by varying the direction of the surface wave. The effect of the surface wave on the simulated dynamics (migration rate and timescale of their growth) was however found to be very significant. These results may be explained by the fact that the residual current is strongly related to the direction of the surface waves. In future model modifications, it is therefore recommended to vary the magnitude and direction of the residual current (kept constant in this study) together with variation in the direction and height of surface waves.
Steven IJzer Graduation Date: 26 June 2010 Graduation committee: University of Twente (UT) Prof.dr. S.J.M.H. Hulscher Dr.ir. F.M. Sterlini UT and Deltares Dr. T.A.G.P. van Dijk

25
VALIDATION & IMPROVING SMAKHTIN EFR METHOD Global water resources assessments generally concern the social and economic demands of people. The water needs of the river ecosystem, which provides services and products for people, are often not considered in these assessments. To safeguard the river ecosystem a certain amount of water is annually required, i.e. environmental flow requirements (EFR). For use on local scale, e.g. river(sections), various EFR methods using models and expert knowledge have been developed. These methods can not be applied in global assessments. Smakhtin et al. (2004) developed a simpler EFR method that can be applied globally. The method is based on the assumption of a correlation between flow variability of a river, in this case determined by using the ratio Q90/MAR (MAR = mean annual runoff), and EFR. It consists of a low flow requirement (LFR), equal to Q90, and a high flow requirement (HFR), which volume decreases with flow stability. This study evaluates how the EFR estimations made by the Smakhtin method compare to EFR established by case studies applied on local river(sections). Ten EFR case studies were used and correlated to different flow parameter ratios describing flow variability. The results showed that the classification of flow variability is not consistent and that in general an opposite trend to Smakhtin’s method could be observed, with the case studies assigning higher volumes of water to LFR for variable flows. Based on the results a new EFR model was developed. It assigns, relative to Smakhtin’s method, higher LFR and lower HFR to variable flows; for stable flows it is the inverse. Application to major river basins showed that the main differences between the new EFR model and Smakhtin’s method are that the new model assigns lower volumes to stable flows (Q90/MAR>40%) en higher volumes to (very) variable flows (Q90/MAR<5%). For the intermediate regimes the new model gives both higher and lower estimates of EFR than Smakhtin.
New EFR model:
EFR estimations of the new EFR model on major river basins. Smakhtin, V.U., Revenga, C., & P. Doll, (2004) Taking into account environmental water requirements in global scale water resources assessments. Comprehensive Assessment Report 2 Colombo, Sri Lanka
.
Paul Zeefat Graduation Date: 6 July 2010 Graduation committee: University of Twente Prof.dr.ir. A.Y. Hoekstra Dr.ir. D.C.M. Augustijn

26
TESTING SEDIMENT TRANSPORT MODELS UNDER PARTIAL TRANSPORT CONDITIONS
River managers rely on sediment transport models, for example when predicting morphological behavior. At some places, a part of the bed sediment (the finer grain sizes) will move and part will remain immobile (coarse grain sizes) depending on the discharge. This is known as partial transport. Partial transport influences the transport rate, bed forms, bed roughness and transport composition. It is therefore interesting to know if currently available transport models can predict transport rates under these conditions accurately. The transport models of Meyer-Peter and Müller (1948), van Rijn (2007c) and Wilcock and Crowe (2003) were tested against five sets of flume experiments with partial transport conditions. The model performance was tested with different sediment distributions as input: the bulk and surface grain size distribution. Furthermore an alternative approach was tested in which only mobile fractions are used as input. Subsequently a reduction factor is applied to account for transport reduction under partial transport. Overall a fractional transport calculation performs better than a uniform calculation and the surface grain size distribution as input gives better results than the bulk grain size distribution. The transport models predict the dataset with trimodal and natural sediment accurately. However, the data sets with strong bimodal sediments cannot be predicted accurately with the original transport models. The problems with the bimodal sediment occur because of the inability of the transport models to deal with immobile grain size fractions. With an adjusted approach, using only the mobile sediment as input combined with a reduction function the bimodal sediment data sets can be predicted accurately as well.
Stephan Janssen Graduation Date: 20 August 2010 Graduation committee: University of Twente Dr.ir. J.S. Ribberink Dr.ir. P.C. Roos Dr. A.P. Tuijnder
Figure 1: Comparison of the predicted and measured transport rates with only the mobile sediment as input for the model of Meyer-Peter and Müller, showing mostly good predictions

27
WATER SYSTEM ANALYSIS SALLANDSE WETERINGEN AND CANALS OF ZWOLLE
The Sallandse Weteringen drain the catchment area of Salland, an area of approximately 50.000 ha in the west of the province of Overijssel, the Netherlands. Flowing through the canals of Zwolle, water is discharged on the Zwarte Water River and ultimately into lake IJssel. The dikes along the streams and canals are classified as secondary flood defences and must be able to hold back water levels with a return period of 200 years (frequency 1/200 years). A test conducted by the regional water board in 2008 and a model study, dating from the same year, showed that at several locations the dikes do not meet the required safety standards. Using a 1-dimensional hydraulic model (SOBEK) of the Weteringen, city canals and a part of the Zwarte Water River, characteristics of the water system and the effectiveness of different measures, aimed explicitly to reduce the design water levels, are analysed. The model results indicate that some 9.3 kilometers of dikes are not at the required height. Time series of water levels at different points along the Weteringen and canals shows that the water levels in the city of Zwolle are predominately influenced by the downstream water levels (at the mouth of the Vecht River). Water levels in Zwolle are only slightly influenced by the discharge coming from the upstream Weteringen. Further upstream of Zwolle, the influence of the downstream boundary gradually decreases while the discharge of the Weteringen becomes more dominant. This system characteristic proved to be very important in the effectiveness of possible measures. In order to comply with the safety norm it proved to be necessary to reduce the water levels at the mouth of the Vecht River with as much as 50 cm or implement a combination of upstream and downstream measures. This mainly because the water levels in Zwolle are only slightly influenced by the discharge from the Weteringen.
Gert-Ruben van Goor Graduation Date: 26 August 2010 Graduation committee: University of Twente Dr.ir. D.C.M. Augustijn Dr.ir. P.R. van Oel HydroLogic Ir. J. de Graaf
Above pictures show the threathening situation during the fall of 1998. An extreme precipitation event (approximately 1/80 – 1/100 year frequency) caused near-floodings in the city of Zwolle (left picture) and along the Weteringen (right picture).

28
PRESENTATION OF UNCERTAINTY IN MODEL OUTPUT TO DECISION MAKERS IN FLOOD MANAGEMENT A combination of an increase in extreme weather situations and restricted capacity of water systems impose higher demands on the operational water level management. Therefore, an increasing number of water boards decided to develop a decision support system (DSS), which is based on hydrologic or hydrodynamic models to predict water levels. Models contain uncertainty due to the fact that they are simplifications of reality, but the model results are often assumed to be deterministic. It is important to communicate the uncertainties that are important for decision making processes. This has lead to the objective of this research: to determine the best presentation form to communicate uncertainty in model results to decision makers in flood management. In the research, the uncertainty in model outcomes has been quantified for the January 2008 high water event in the area of water board Hunze & Aa’s. Nine presentation forms were designed, which present exactly the same information about the predicted water level and its uncertainty. During face-to-face interviews, these presentation forms were ranked by the decision makers based on their usability. Besides that the decision makers were asked to comment on each of the presentation forms. The interview results pointed out three important matters for the presentation of uncertainty in model output: 1. The peak in the water level with the uncertainty range should be visible in the presentation
form. 2. The development of the water levels in time is essential. 3. The critical values should be presented in the presentation form. This study has shown that a graphical presentation form is preferred over a presentation in words or numbers concerning these three matters. The bandwidth presentation form contains all critical information in a glance and is, therefore, ranked as the best presentation form to communicate uncertainty to decision makers. It is possible to quickly decide if it is necessary to take measures against flooding, because the maximum predicted water level in time and the critical water level are clearly visible. Adding the historical water levels of the last two days give the decision makers the opportunity to judge how much time there is to prepare and take measures.
The best presentation form to communicate uncertainty to decision makers in flood management: the bandwidth presentation with the measurement region (in grey), prediction region (in white), and the critical water level (dashed red line).
Lea Goedhart Graduation Date: 27 August 2010 Graduation committee: University of Twente Prof.dr. S.J.M.H. Hulscher Dr.ir. M.J. Booij Drs. J.J. Warmink HydroLogic Ir. A. van Loenen

29
0
5
10
15
20
25
30
35
40
45
50
Referentiesituatie 2 Brielse Meerleiding Tolhuissluisroute met peilopzetIJsselmeer
Beheerstrategie stuw Driel
Wat
erte
kort
[Mm
³]
Peilbeheer Doorspoeling Beregening
VERKENNING NAAR DE WATERAANVOERMAATREGELEN OM DE ZOETWATERVOOR-ZIENING IN MIDDEN-WEST NEDERLAND TE GARANDEREN IN DE TOEKOMST Droogte, watertekorten en de gevolgen hiervan zijn een wereldwijd probleem, zelfs het waterrijke Nederland heeft er mee te maken. Een kenmerkende regio in Nederland is Midden-West Nederland waar de combinatie watertekorten en verzilting een rol speelt. Tijdens droge periodes wordt er water bij Gouda vanuit de Hollandse IJssel in het gebied ingelaten voor de functies peilbeheer, beregening en doorspoeling. De verwachting is dat in de toekomst de Hollandse IJssel vaker zal verzilten door lagere rivierafvoeren en zeespiegelstijging als gevolg van klimaatverandering. Bij sluiting van de inlaat bij Gouda wordt gebruik gemaakt van noodaanvoerroutes. Deze zijn echter ontoereikend om het studiegebied te voorzien van voldoende water van de gewenste kwaliteit. Dit is nu al het geval zoals bleek in 2003 maar door klimaatverandering staat de zoetwatervoorziening van Midden-West Nederland verder onder druk. In de studie is onderzoek gedaan naar de haalbaarheid van maatregelen om meer water aan te voeren en zo de zoetwatervoorziening te garanderen in de toekomst. Er is gekeken naar de tijdshorizonnen 2050 en 2100. Om de toekomstige situatie te bepalen zijn er scenario’s op het gebied van klimaat en beregening ontwikkeld. Berekeningen zijn uitgevoerd met het Nationaal Hydrologisch Instrumentarium. Dit is een landsdekkend model waarin grond- en oppervlak-temodellen aan elkaar zijn gekoppeld. De berekeningen zijn uitgevoerd voor het karakteristieke droge jaar 1949. Uit de studie blijkt dat bij dat jaar 1949 de beschikbaarheid van water aan de randen van het systeem een grote rol speelt. Maatregelen kunnen genomen worden om deze beperking op te heffen, zoals het verhogen van het IJsselmeerpeil of door een ander beheer van de sluis bij Driel. Verdere maatregelen om de aanvoercapaciteit te vergroten blijken minimale verschillen in landbouwderving op te leveren. Door de grote investeringskosten, lijken deze oplossingen derhalve niet rendabel.
Watertekorten voor de referentiesituatie en verschillende oplossingsrichtingen voor het droogtejaar 1949 in 2100
Rik Bulsink Graduation Date: 9 September 2010 Graduation committee: University of Twente Prof.ir. E. van Beek Dr. M.S. Krol Deltares Ir. J. ter Maat

30
VIRTUAL WATER TRADE IN THE SADC REGION A GRID-BASED APPROACH
Nowadays rivers are given more room in order to lower the water levels in situations with high discharges. These so called floodplains are not always covered with water and thus vegetation will grow on these areas. The variety of vegetation is large and different types of vegetation occur on one floodplain. In protecting the land against a possible flood hydraulic model computations play an important role. To be able to do this in an accurate way aspects of the river have to be implemented, which also includes the vegetation on a floodplain. Due to computational limitations not all the small details can be taken into account in the model. Therefore weighting methods are used to convert multiple roughness values in one computation cell to one aggregate roughness value that has to represent the variation in roughnesses. These weighting methods however are not very accurate. Therefore in this study model calculations are carried out with the two dimensional modeling program WAQUA in order to: i) identify the important parameters that influence the aggregate roughness, ii) develop an improved method to calculate the aggregate roughness of vegetation patterns. A large set of situations are modeled which differ in pattern lay out, water depth and grid size. The results of these model runs are the average Chézy values that represent the overall flow field of the area. It turns out that with increasing water depth the average roughness decreases and that the grid size has no remarkable influence on the average roughness. The largest influence on the average roughness is induced by specific characteristics of the vegetation pattern. At the boundaries of roughness transitions flow adaptation processes occur which can be divided in two types: i) a mixing layer along the smooth-rough transitions parallel to the flow and ii) flow adaptation behind a patch due to discharge redistributions around patches perpendicular to the flow. These processes induce an additional roughness on the area. Using these two important flow processes a new prediction method is set up which is able to give accurate aggregate roughness predictions. The figure below shows the measured Chézy values obtained from the WAQUA computations and the predicted Chézy values of the old method and the new method. It can be seen that the new method gives more accurate predictions.
Comparison of the new prediction model (black points) and the now in use WA-method (grey points). The solid line indicates perfect agreement and the dotted lines the 10 percent range.
Marloes ter Haar Graduation Date: 23 September 2010 Graduation committee: University of Twente Dr.ir. J.S. Ribberink Dr. F. Huthoff
A NEW METHOD TO PREDICT THE AGGREGATE ROUGHNESS OF VEGETATION PATTERNS ON FLOODPLAINS
30
VIRTUAL WATER TRADE IN THE SADC REGION A GRID-BASED APPROACH
Nowadays rivers are given more room in order to lower the water levels in situations with high discharges. These so called floodplains are not always covered with water and thus vegetation will grow on these areas. The variety of vegetation is large and different types of vegetation occur on one floodplain. In protecting the land against a possible flood hydraulic model computations play an important role. To be able to do this in an accurate way aspects of the river have to be implemented, which also includes the vegetation on a floodplain. Due to computational limitations not all the small details can be taken into account in the model. Therefore weighting methods are used to convert multiple roughness values in one computation cell to one aggregate roughness value that has to represent the variation in roughnesses. These weighting methods however are not very accurate. Therefore in this study model calculations are carried out with the two dimensional modeling program WAQUA in order to: i) identify the important parameters that influence the aggregate roughness, ii) develop an improved method to calculate the aggregate roughness of vegetation patterns. A large set of situations are modeled which differ in pattern lay out, water depth and grid size. The results of these model runs are the average Chézy values that represent the overall flow field of the area. It turns out that with increasing water depth the average roughness decreases and that the grid size has no remarkable influence on the average roughness. The largest influence on the average roughness is induced by specific characteristics of the vegetation pattern. At the boundaries of roughness transitions flow adaptation processes occur which can be divided in two types: i) a mixing layer along the smooth-rough transitions parallel to the flow and ii) flow adaptation behind a patch due to discharge redistributions around patches perpendicular to the flow. These processes induce an additional roughness on the area. Using these two important flow processes a new prediction method is set up which is able to give accurate aggregate roughness predictions. The figure below shows the measured Chézy values obtained from the WAQUA computations and the predicted Chézy values of the old method and the new method. It can be seen that the new method gives more accurate predictions.
Comparison of the new prediction model (black points) and the now in use WA-method (grey points). The solid line indicates perfect agreement and the dotted lines the 10 percent range.
Marloes ter Haar Graduation Date: 23 September 2010 Graduation committee: University of Twente Dr.ir. J.S. Ribberink Dr. F. Huthoff
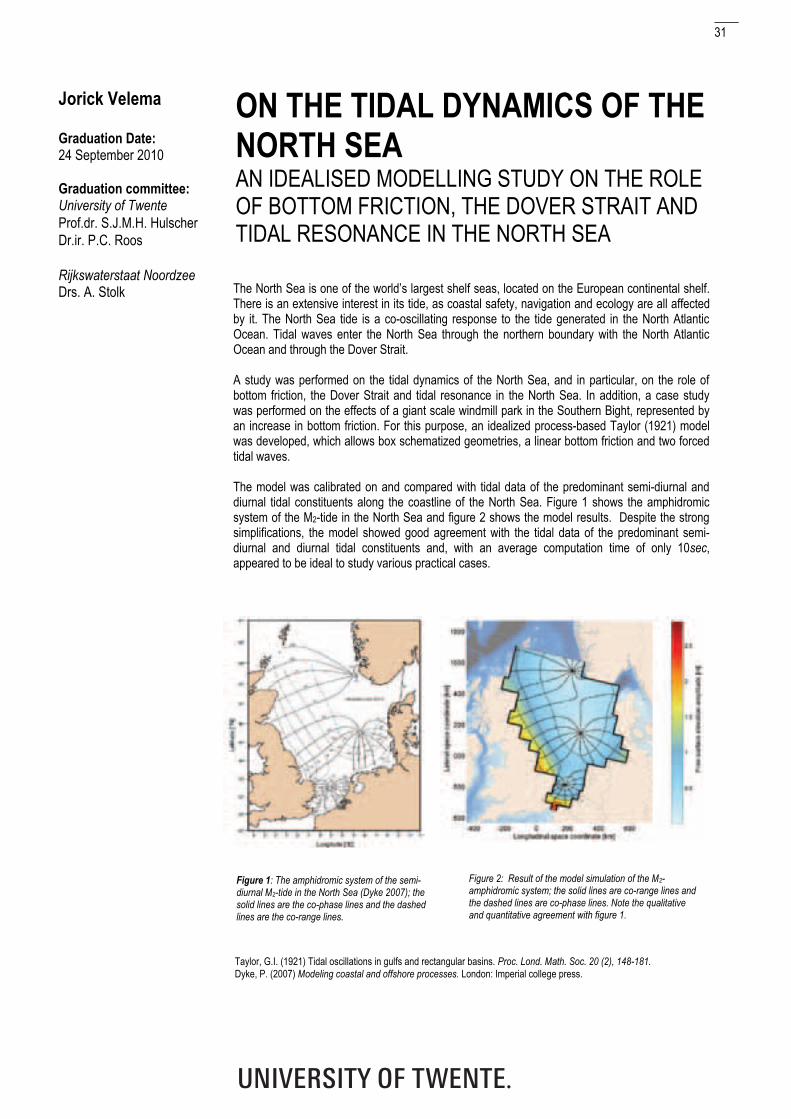
31
ON THE TIDAL DYNAMICS OF THE NORTH SEA AN IDEALISED MODELLING STUDY ON THE ROLE OF BOTTOM FRICTION, THE DOVER STRAIT AND TIDAL RESONANCE IN THE NORTH SEA
The North Sea is one of the world’s largest shelf seas, located on the European continental shelf. There is an extensive interest in its tide, as coastal safety, navigation and ecology are all affected by it. The North Sea tide is a co-oscillating response to the tide generated in the North Atlantic Ocean. Tidal waves enter the North Sea through the northern boundary with the North Atlantic Ocean and through the Dover Strait. A study was performed on the tidal dynamics of the North Sea, and in particular, on the role of bottom friction, the Dover Strait and tidal resonance in the North Sea. In addition, a case study was performed on the effects of a giant scale windmill park in the Southern Bight, represented by an increase in bottom friction. For this purpose, an idealized process-based Taylor (1921) model was developed, which allows box schematized geometries, a linear bottom friction and two forced tidal waves. The model was calibrated on and compared with tidal data of the predominant semi-diurnal and diurnal tidal constituents along the coastline of the North Sea. Figure 1 shows the amphidromic system of the M2-tide in the North Sea and figure 2 shows the model results. Despite the strong simplifications, the model showed good agreement with the tidal data of the predominant semi-diurnal and diurnal tidal constituents and, with an average computation time of only 10sec, appeared to be ideal to study various practical cases.
Jorick Velema Graduation Date: 24 September 2010 Graduation committee: University of Twente Prof.dr. S.J.M.H. Hulscher Dr.ir. P.C. Roos Rijkswaterstaat Noordzee Drs. A. Stolk
Figure 1: The amphidromic system of the semi-diurnal M2-tide in the North Sea (Dyke 2007); the solid lines are the co-phase lines and the dashed lines are the co-range lines.
Figure 2: Result of the model simulation of the M2-amphidromic system; the solid lines are co-range lines and the dashed lines are co-phase lines. Note the qualitative and quantitative agreement with figure 1.
Taylor, G.I. (1921) Tidal oscillations in gulfs and rectangular basins. Proc. Lond. Math. Soc. 20 (2), 148-181. Dyke, P. (2007) Modeling coastal and offshore processes. London: Imperial college press.

32
FLOODED WITH WATER DEFICITS OPTIMAL TIMING OF AN ENVIRONMENTAL FLOW RELEASE, USING FLOW FORECASTS IN THE OPERATIONAL MANAGEMENT OF A RESERVOIR
The environmental flow requirement (EFR) represents the flow regime required to maintain certain ecosystem conditions. However, releases for the EFR from a reservoir may cause water deficits amongst the reservoir’s functions, and therefore its implementation is not common. The moments at which the high flow peaks for the EFR can be released usually have some degree of freedom. When flow forecasts and expected water demands are available, the temporal flexibility of the EFR can be used to find the optimal moment for environmental flow release at which the deficits caused by the environmental flow release are minimal. An optimization model is developed that compares the water deficits for different moments of EFR allocation. It is applied to a case study in the Kafue River (Zambia) with the Itezhi Tezhi dam and Kafue Flats wetlands (see the figure). Aspects that influence the optimization are determined and analyzed for the case study. In this way, the effects of EFR allocation on the water deficits for the Kafue River are quantified, and insight is acquired about the effectiveness of the optimization under different conditions. For the case study it is concluded that years with reservoir inflows above the long term average, have no additional deficits if the environmental flow is released. During years with lower inflows, the optimization is able to reduce 7% of the deficits caused by the environmental flow release compared to the situation with a fixed moment of environmental flow release. Optimization is more useful if the EFR is of shorter duration with larger discharges, if the reservoir level is restored in a short time period and in years that the annual mean runoff is below long term average flow. Even without optimization, flow forecasts are useful to determine the opportunities for environmental flow released.
Jorik Chen Graduation Date: 28 October 2010 Graduation committee: University of Twente Prof.ir. E. van Beek Dr.ir. D.C.M. Augustijn Deltares Dr.ir. K.S. Meijer Dr.ir. M.G.F. Werner
The Kafue River in the Kafue Flats wetlands. Annual flooding is essential for the ecosystem, but is prevented by the upstream Itezhi Tezhi dam, out of precaution for water deficits.

33
HOW LOW SHOULD WE GO? WATER-SCARCITY PATTERNS UNDER DIFFERENT LEVELS OF DECENTRALIZATION: AN AGENT-BASED Many semi-arid areas in the world suffer from water related problems such as scarcity and unsatisfactory water allocation both between and within sectors. One of such areas is the Jaguaribe basin in the Northeast of Brazil, which is seriously affected by an extreme uncertainty in the precipitation regime and long-lasting and recurrent drought periods. Common responses to such water-related problems include the construction of infrastructure and administrative reforms. It is increasingly acknowledged that local resources in many cases should preferably be managed by a combination of local users and authorities at the supra-local (spatial) level. But, insight in how these two forces should be balanced is lacking. In order to increase insight in the potential effects of different decentralization regimes in water allocation management, three scenarios corresponding to different decentralization regimes for the Jaguaribe basin have been designed and simulated. For this purpose, a model has been created in which the processes shown in the conceptual model of the water system (Fig. 1) are integrated. Natural processes and non-irrigated demand are simulated using existing process-based models, whereas farmers and water managers are represented as agents with their mutual interactions. In addition, a sensitivity analysis is performed for the cascade scheme representing the small and medium-sized reservoirs. In general, the effects of the measures implemented under the different scenarios are very small compared to the effects of increased water consumption itself. This implies that the over-development cannot be prevented by water allocation management alone. In order to prevent the over-development, an integrated approach is required including agricultural policy measures such as increasing the value added per drop (more cash crops) and restrictions on the areas to be irrigated.
Conceptual model of the processes and interactions in water allocation
Erwin Sterrenburg Graduation Date: 4 November 2010 Graduation committee: University of Twente Dr. M.S. Krol Dr.ir. P.R. van Oel

34
SCALE DEPENDENCY OF DUNE EROSION MODELS PERFORMANCE ASSESSMENT OF THE DUROS AND XBEACH MODEL FOR VARIOUS EXPERIMENT SCALE Dune erosion models are used in the safety assessment of the coastal dunes that serve as floodprotection for the Dutch coast. Presently, the safety assessment is based on the relatively simple cross-shore dune erosion model DUROS (Van Gent et al., 2008). The empirical DUROS-model is designed for alongshore uniform coastlines. Since the DUROS-model is not qualified to assess storm impact in complex cases, a more generic model that includes the long-shore dimension can be a helpful instrument. In this study the DUROS-model is compared to the generic model XBeach (Roelvink et al., 2009). The XBeach-model contains a physical description of the most important processes that are of relevance to dune erosion in both cross-shore and long-shore direction. Since the normative storm conditions that are used in the safety assessment have never been observed, both models are based onlaboratory experiments. Since DUROS and XBeach are based on the same lab experiments but predictdifferent storm impact on real scale (XBeach estimates about 70% less dune erosion), the lab-to-prototype conversion in the two models is different (see Figure 1). The above problem led to two research questions: What causes the difference in storm impact predicted by DUROS and XBeach for reference conditions? And what consequences do these differences in storm impact have on the prediction for prototype scale? In the study the results of a series of lab experiments on various scales (M1263) and a field case were re-analysed and studied with the models. The selected lab experiments were chosen because the current DUROS-model was constructed with the results of these experiments. Both the DUROS and XBeach-model were very well capable of reproducing the large-scale experiments. However for small-scale experiments, both models showed a lack of performance: erosionvolumes were underestimated by DUROS but slightly overestimated by XBeach. Therefore, at prototype scale they were expected to resp. overestimate and underestimate dune erosion. A strong scaledependency of run-up zone characteristics was identified as one of the reasons for this. After integratinga run-up zone in DUROS, the model showed excellent performance for all lab scales (Brier SkillScore≈0.9). The revised model (DRV) predicts 60m3/m less dune erosion for the prototype reference case (230m3/m compared to 290m3/m for the current DUROS version D+). In case of XBeach, six numerical parameters were indentified that needed scale-dependent values in order to reproduce erosion processes on different scales: Three parameters concerned the dune face erosion algorithm,and three parameters concerned limiters in the sediment transport computation. The changes altogether led to a prediction improvement of XBeach from BSS≈0 to BSS≈0.5 for small-scale experiments. The erosion prediction for the prototype reference case with the revised model was increased to 150m3/m (default=80m3/m). The modifications implemented in the two models to account for scale dependent effects in the scaleddune erosion experiments, led to a decrease in the difference between the DUROS and the XBeach erosion predictions at prototype scale. The model changes in DUROS led to a reduction of the erosion amount at the prototype scale, while in case of XBeach the predicted erosion amount increased. Hence, models with more consistent performance at different scales, i.e. less scale dependency, are expected to be better able to predict dune erosion at prototype scale.
Figure 1: Storm impact on various scales: DUROS and XBeach predict similar storm impact on lab scale (gray) but deviate for prototype application (coloured)
Figure 2: Dune erosion in a large-scale experiment (Deltaflume)
Peter Brandenburg Graduation Date: 10 December 2010 Graduation committee: University of Twente Dr. ir. J.S. Ribberink Dr. K.M. Wijnberg Deltares Dr. ir. J.S.M. van Thiel de Vries
ROELVINK, D., RENIERS, A., VAN DONGEREN, A., VAN THIEL DE VRIES, J., MCCALL, R., LESCINSKI, J., (2009) MODELLING STORM IMPACTS ON BEACHES, DUNES AND BARRIER ISLANDS. COASTAL ENGINEERING 56 (2009) 1133-1152.
Van Gent, M.R.A., van Thiel de Vries, J.S.M., Coeveld, E.M., de Vroeg, J.H., van de Graaff, J., (2008) Large-scale dune erosion tests to study the influence of wave periods, Coastal Engineering (2008),
SCAL
STOR
M
LABORAT
PROTOT
D+
XB XBdefault
DRV
Roelvink, D., Reniers, A., van Dongeren, A., van Thiel de Vries, J., McCall, R., Lescinski, J., (2009) Modelling storm impacts on beaches, dunes and barrier islands. Coastal Engineering 56 (2009) 1133-1152. Van Gent, M.R.A., van Thiel de Vries, J.S.M., Coeveld, E.M., de Vroeg, J.H., van de Graaff, J., (2008) Large-scale dune erosion tests to study the influence of wave periods, Coastal Engineering (2008), doi:10.1016/j.coastaleng.2008.04.003

35
SPATIAL OPTIMISATION OF MARINE SAND EXTRACTION DEVELOPMENT OF A TOOL DETERMINING SAFETY AREAS AROUND SANDPITS IN THE NORTH SEA
The demand for sand from the North Sea used for coastal replenishment and construction sand is expected to grow. In the meantime other user functions such as wind farms, nature, cables and pipes are also expected to grow and will ask more space in the North Sea. Due to these reasons, it is expected that pressure on the North Sea will grow in the future. Therefore spatial planning in the Dutch North Sea is important. The objective of this study is to enable optimisation of the available areas for sand extraction in the Dutch North Sea, by developing a tool which determines site specific safety areas around sandpits. To find the locations where sand extraction is allowed and which locations have priority for sand extraction a second tool was also developed. This tool generates a map with those locations (figure 1) and is developed within the ArcGIS software. The generated map can be used as background in the interactive design tool to show the user where sand extraction is allowed and which locations have priority for sand extraction. In common practice and legislation a safety buffer of 500m is used around offshore platforms, wind farms, cables and pipes for sandpits with a maximal depth of 2 meters. However this is not morphologically underpinned in legislation. During this research we found that safety buffers around sandpits depend on the morphological influence around sandpits, which depends on pit size, shape, orientation (with current direction), current velocity, water depth and morphological time scale. Due to the fact that there is a large variation in current velocity and water depth in the North Sea and the fact that a sandpit can have all kind of dimensions and orientations, it could be better to determine the needed safety buffer for each sandpit individually. For this purpose an interactive design tool for sand extraction was developed. The tool is developed by using the MapTable and the Twente morphological model. A result of this tool is shown in figure 2. The conclusion of this research is that with this design tool the available area for sand extraction in the Dutch North Sea can be optimised. It determines the safety zone for each sandpit individually and site specific. In this way the necessary safety buffer can be much smaller in many cases than the currently used fixed safety buffer of 500m. The main recommendation of this research is: evaluate the advantages of a new site specific approach relative to the existing general and fixed safety buffer approach for sand extraction in current legislation. The design tool can be used for this individual site specific approach.
Quintijn van Agten Graduation Date: 10 December 2010 Graduation committee: University of Twente (UT) Prof.dr. S.J.M.H. Hulscher R.H. Buijsrogge UT and Deltares Dr. J.P.M. Mulder Witteveen + Bos and HKV Ir. S. Ouwerkerk
Figure 1: Priority zones and exclusion zones for sand extraction in the Dutch North Sea.
Figure 2: Result of the interactive design tool for sand extraction. The black line around the sandpit is the depth change contour line. The other black lines are the power cables.

36
IMPACTS OF CLIMATE CHANGE ON LOW FLOWS IN THE RHINE BASIN LOW FLOWS FOR THE RHINE BASIN
Rivers have variable discharges, where sometimes high or low flows occur. Low flows may cause damage to shipping and to water users. This research assesses the effect of climate change on low flows in the Rhine basin, using climate change scenarios and a hydrological model. The scenarios resulted from Remo Echam5, Racmo Echam5, Hirham5 Arpege and Aladin Arpege climate models simulating the A1B scenario, a greenhouse gas scenario of the IPCC. The discharge is simulated with a standalone HBV model, FEWS. Two low flows indicators have been determined for the simulated hydrographs, based on Dutch policy (LCW). One indicator reflects hindrance of navigation (the number of days with a discharge below 1000 m3/s; the other reflects underfulfillment of water demand (the annual discharge deficit). For three climate scenarios, with a runtime to 2100, Figure 1 shows that the resulting annual deficit increases dramatically between the reference period (1962-1992) and the period 2070-2100. Figure 2 shows a similar result for the annual number of days with a discharge below 1000 m3/s. For the fourth model (Aladin Arpege) simulations were available up to 2050 only, when trends are not apparent yet. For all simulations for the period 2070-2100, low flow events have turned to almost being a yearly event. The annual frequency of occurrence of a deficit varies between 80% and 87% for the three climate scenarios. The annual frequency of occurrence of a flow below 1000 m3/s varies between 80% and 96%. It can be concluded that the frequency of occurrence of low flows as well as their severity will increase in the future for 3 out of 4 scenarios that have been assessed.
Jasper Bisterbosch Graduation Date: 16 December 2010 Graduation committee: University of Twente Dr.ir. M.J. Booij M.C. Demirel MSc. Dr. M.S. Krol
Figure 1: Average annual deficit in Mm3 for the different scenarios for the different periods. Figure 2: Average annual number of days with discharge below
1000 m3/s for the different scenarios for the different periods.