Embed Size (px)
Citation preview
Mass-selection strategies for pearl millet improvement
Henry Fredrick Rattunde
An Abstract of
A Dissertation Submitted to the
Graduate Faculty in Partial Fulfillment of the
Requirements for the Degree of
DOCTOR OF PHILOSOPHY
Approved :
In Charge of Major Work
For the Major Department
For the Graduate College
Iowa State University Ames, Iowa
Mass-selection strategies for pearl millet improvement
Henry Fredrick Rattunde
Under the supervision of Kenneth J. Frey From the Department of Agronomy
Iowa State University
Mass selection is frequently used for genetically improving pearl
millet (Pennisetum slaucum R. Br.). To ascertain the ability of mass se-
lection to modify traits of agronomic importance to pearl millet, this
study determined (a) the heritability and interrelationships of those
traits and (b) the realized gains obtained from selection. SO and S 1
populations of three pearl millet composites were evaluated for an array
of agronomic and developmental traits. Parent-offspring heritability
values ranged from 0.46 to 0.64 for panicle size and seed traits, from
0.27 to 0.58 for productivity traits, and from 0.16 to 0.32 for partition-
ing traits, when averaged over three pearl millet composites. Interrela-
tionships among traits were identified by factor analyses and found to be
similar in the three composites. Unique groups of traits were associated
with biological yield, panicle size, and seed factors. Certain traits,
however, were associated with both the biological yield and the partition-
ing factors. The orientations of S plants along the biological yield, 0
panicle size, and seed parameters factors were siqnificantly related to
orientations of their S progenies along the correspondinq factors. 1
Forty-six experimental populations were created via bidirectional
selection for grain yield in three pearl millet composites. Selection
criteria used were grain yield per se and indices of yield component or
developmental traits. Upward selected populations from the EC, NELC, and
D C composites outyielded their downward selected counterparts by 635**, 2
312**, and 155* kg ha-I, respectively, when evaluated under high fertility
at the location of selection (Patancheru). Yield differences between up-
ward and downward selected populations were greatly reduced, however, when
the populations were evaluated at sites distant from Patancheru. Selec-
tion for developmental trait indices gave the greatest yield responses at
Patancheru, whereas selection for grain yield per se or yield component
traits gave the largest yield responses at locations distant from Patan-
cheru. Selection indices constructed via regression analyses or via in-
tuition were equally effective. The composites differed for symmetry of
response to selection when compared at Patancheru. Yields of upward and
downward selected EC populations differed from the unselected EC bulk by
+13% and -16%, respectively, whereas NELC populations deviated by -3%
and -13%, respectively, from the NELC bulk.
Mass-selection strategies for pearl millet improvement
by
Henry Fredrick Rattunde
A Dissertation Submitted to the
Graduate Faculty in Partial Fulfillment of the
Requirements for the Degree of
DOCTOR OF PHILOSOPHY
Department: Agronomy Major: Plant Breeding and Cytogenetics
Approved :
In Charge of Major Work
For the Major Department
For the Graduate College
Iowa State University Ames, Iowa
i i
TABLE OF CONTENTS
GENERAL INTRODUCTION
LITERATURE REVIEW
Page
1
3
SECTION I. FEASIBILITY OF MASS SELECTING FOR 19 PEARL MILLET TRAITS
ABSTRACT
INTRODUCTION
MATERIALS AND METHODS
RESULTS AND DISCUSSION
REFERENCES
SECTION 11. STRUCTURE OF VARIATION AMONG MORPHOLOGICAL AND PHYSIOLOGICAL TRAITS IN THREE PEARL MILLET COMPOSITES
ABSTRACT
INTRODUCTION
MATERIALS AND METHODS
RESULTS
DISCUSSION
SUMMARY
REFERENCES
SECTION 111. MASS SELECTION STRATEGIES FOR INCREASING 60 GRAIN YIELD OF PEARL MILLET
ABSTRACT 6 I.
INTRODUCTION 6 3
MATERIALS AND METHODS
RESULTS
DISCUSSION
REFERENCES
GENERAL CONCLUSIONS AND DISCUSSION
ADDITIONAL REFERENCES CITED
ACKNOWLEDGMENTS
APPENDIX
Page
66
76
84
8 8
GENERAL INTRODUCTION
Mass selection is an inexpensive breeding procedure for improving
crop plants, which, to be effective, requires high heritability for the
trait being selected. The immense genetic variation encompassed by pearl
millet (Pennisetum glaucum (L.) R. Br.) suggests that this crop could be
improved by mass selection (Burton and Powell, 1968), and several millet
varieties developed via this breeding procedure have been released in
India (Joshi et al., 1961; Athwal, 1962; Ahluwalia and Shankar, 1962;
Athwal and Luthra, 1964; Ahluwalia and Vittal Rao, 1964). It is not
always effective for improvinq this crop, however (Khadr and Ovinloye,
1978 1 .
To determine whether mass selection would be an appropriate breedinq
procedure for improvinq pearl millet, the followinq questions must be
addressed:
1. What traits of pearl millet are highly heritable on a sinale
plant basis?
2. Do heritability estimates for a given trait differ at the lower
arid upper tails of the phenotypic array?
3. Do relationships amonq traits exist that would cause desirable or
undesirable correlated responses?
4. What traits when selected would cause increased qrain yield?
5. Can grain yield be increased most by selection for yield per se
or via multitrait indices?
Previous studies on pearl millet have reported estimates of herita-
bility values (Pokhriyal et al., 1967; Gupta and Nanda, 1971; Sanqha and
Singh, 19731, correlations among traits (Jindla and Gill, 1984: Singh
et al., 1980), and multitrait indices that predict grain yield potential
(Shankar et al., 1963; Gupta and Athwal, 1966; Mahadevappa and Ponnaiya,
1967). These results have limited value, however, hecauge (a) most of the
studies were conducted in single environments, (b) traits of importance
to adaptation, such as biomass and growth rate, were not studied,
(c) qenetic materials were not contemporary breedinq populations, and
(d) only predicted responses for selection indices were estimated.
To provide knowledge that is currently relevant to use of mass
selection for increasing grain yield of pearl millet, I conducted research
with the following objectives:
1. To estimate heritability values and responses to divergent selec-
tion upon spaced plants for 19 pearl millet traits:
2. To describe phenotypic interrelationships amonq traits of pearl
millet when grown as spaced plants and in proqeny rows; and
3. To determine the effectiveness of mass selection for improving
grain yield of pearl millet via selection for yield per se or for
multitrait indices.
LITERATURE REVIEW
Mass Selection
Mass selection is a breeding procedure whereby single plants with
superior phenotypes are chosen to be parents of the subsequent generation.
It can be either the sole breeding procedure or it can be one component
of a progeny evaluation program (Lonnquist, 1964). Response from mass
selection depends upon the magnitude of the selection differential, the
parental controlr and the heritability of the trait under selection
(Hallauer and Miranda, 1981). Its advantages are (a) simplicity, (b) com-
pletion of one cycle per season, and (c) large effective population size
even with high selection intensity. Its disadvantages are (a) ineffec-
tiveness for traits with low inherent heritability and (b) selection
occurs in a single environment.
Mass selection has been used to modify a wide array of traits such
as oil content of seeds (Sprague et al., 1952), prolificacy (Lonnquist,
19671, ear height (Vera and Crane, 1970)r ear length (Cortez-Mendoza and
Hallauer, 1979), time of flowering (Troyer and Brown, 1976), and reduced
earworm (Heliothis zea Boddie) damage (Zuber et al., 1971) of maize (E
mays). It has been used to increase grain yield of maize and oats (Avena
sativa L.) when the selection nursery was gridded (Gardner, 1961:
Chandhanamutta and Frey, 1973). Because mass selection is practiced in a
single environment, however, the response to selection may be site-
specific (Hallauer and Sears, 1969).
Indirect selection for a primary plant trait may be more effective
than selecting for it directly if secondary traits are highly genetically
correlated with the primary trait and the secondary traits are cheaper to
measure and/or more heritable than the primary trait (Lonnquist, 1967).
For example, grian yield of oats and maize were increased via mass selec-
tion upon panicle weight and number of ears per plant, respectively
(Chandhanamutta and Frey, 1973; Torregroza and Harpstead, 1967). Selec-
tion for a primary trait per se can be considered as indirect selection
if qenotype x environment interaction between the selection and evaluation
sites causes the trait to act as two separate, but genetically correlated,
traits at the two sites (Falconer, 1952). The effectiveness of indirect
selection is determined by the heritability of the selected trait and the
magnitude of genetic correlation between the selected and primary traits
(Falconer, 1981).
In practice, mass selection generally involves simultaneous selection
for several traits (Hallauer and Miranda, 1981) via a "breeder's index"
where weights are given to traits according to intuition and experience.
Each trait in an index should be genetically corr15lated with the trait
to be improved and should be uncorrelated with other traits in the index
(Baker, 1986).
Weights for index traits can be computed via biometrical methods so
that, in theory, the correlation between the index values and genotypic
worth of the target trait is maximized (Smith, 1936; Baker, 1986). TO
compute trait weights for an "optimum index" requires the manipulation
of both genetic and phenotypic variance-covariance matrices. Optimum
indices are rarely used in routine breeding programs (Hallauer and
Miranda, 1981) because they are costly to compute and the genetic
parameters are not accurately estimated. Other indices, such as the
base index, which weights each trait according to its economic value
(Williams, 19621, or an index that uses trait heritability values as
weights, can be nearly as effective as an optimum index if selection
traits are not correlated (Suwantaradon et al., 1975; Smith et al., 1981).
Pearl Millet
Pearl millet (Pennisetum glaucum (L.) R. Br.) is a cereal grain crop
that grows as a robust annual bunchgrass. It can produce seed when grown
on soils that are too acid, dry, or infertile for sorghum (Sorghum
bicolor (L.) Moench) and maize (Burton and Powell, 1968) and, thus,
it commonly is sown in semiarid regions. Pearl millet is the predominant
crop in northwest India and the Sahel of Africa (Brunken et al., 1977;
Rachie and Majmudar, 1980; Pearson, 1985).
Pearl millet has been subjected to natural and artificial forms of
mass selection during its 4 to 5 millenia of cultivation (Brunken et al.,
1977). Selection for adaptation to moisture stress ~robably is responsi-
ble for its rapid and deep rooting capacity (Beqq, 1965; Gregory and
Squire, 1979), its efficient use of water (Kassam and Kowal, 19751, and its
ability to produce viable seed when water scarcity stops grain filling
prematurely (Fussell and Pearson, 1980). The earliest human effort to
increase grain yield of this crop may have involved mass selection for
Well-filled panicles, panicle compactness, panicle length, and high seed
weight (Krishnaswamy, 1962).
Pearl millet is an outcrossing crop with immense genetic diversity.
Its panicles vary in length from 5 to 150 cm (Burton and Powell, 1968)
and it varies considerably in tillering habit (Raymond, 1968). Many
local races of millet exist (Brunken et al., 1977; Norman et al., 1984).
Isozyme analyses have shown that early and late West African varieties
are genetically distinct even when collected from the same village
(Tostain et al., 1987). Genetic variation for grain yield of millet is
shown in crosses between adapted parents (Khadr, 1977; Sandhu et al.,
1980; Sachdeva et al., 1982) and crl~~~ses between adapted and wild, weedy,
or landrace accessions (Gupta and Sinqh, 1973; Bramel-Cox et al., 1987).
Phenotypic expression of pearl millet traits can be greatly altered
by environmental factors. For example, height of millet plants can be
reduced drastically by moisture stress (Burton and Powell, 1968) and
number of panicles per plant and tiller size are reduced by high plant
density (carberry et al., 1985). Virk et al. (1984) found that grain
- 1 yields varied from 429 to 3123 kg ha over 19 locations in India.
Further, genotype x environment interactions can contribute to pheno-
typic differences. For example, varietal rankings for days to bloom can
be inconsistent over several daylength or temperature regimes (Begg and
Burton, 1971), and genotype x location and genotype x nitroqen level
interactions have occurred for grain yield (Sachdeva et al., 1982;
Nwasike et al., 1983).
Heritability values for grain yield, yield components, and morpho-
logical traits of pearl millet may be high (Pokhriyal et al., 1967;
Gupta and Nanda, 1971: Sanqha and Singh, 1973), low (~upta and Athwal,
1966) or variable (Burton, 1951). Generally, heritability values are
high when based on data from a single environment but low when based on
data from two or more environments (Singh, 1974; Sandhu et al., 1980).
Nonadditive gene action is a significant source of genetic variation
for grain (Kapoor et al., 1982; Sachdeva et al., 1982; Tyagi et al.,
1982) and straw yields (Burton, 1959, 1968; Begg and Burton, 1971) of
pearl millet. Narrow sense heritability is smaller than broad sense
heritability for harvest index, grain-fill period, tiller number, and
leaf width (La1 and Singh, 1970; Bajaj and Phul, 19821, which suggests
that nonadditive qene action is important for these traits. In con-
trast, panicle length and diameter are determined primarily by additive
gene action (Jain et al., 1961; Gupta and Singh, 1971).
Positive correlations of pearl millet grain yield with tiller number
(Jindla and Gill, 1984; Singh et al., 19801, days to flower, threshing
percent (Nwasike et al., 1983), seed weight (Sangha and Singh, 1973),
and straw yield (Pokhriyal et al., 1967) have been reported. Pearl
millet grain yields have been predicted by using optimum indices (Shankar
et al., 1963) and indices based on multiple regression (Gupta and Athwal,
1966; Mahadevappa and Ponnaiya, 1967; Singh and Ahluwalia, 1970; Phul
et al., 1974).
Explanation of Dissertation Format
The dissertation contains three sections. Section I presents heri-
tability values and responses to simulated divergent selection for 19
traits measured on So plants and on their S1 progenies from three millet
composites. Factor analysis is used in Section I1 to describe (a) the
major phenotypic trait complexes exhibited by plants from three millet
composites when grown as spaced plants or in normal-density rows, and
(b) the heritability of those trait complexes. Section I11 reports on
empirical tests of different selection strategies for changing grain
yield of millet.
Each section was written as a complete manuscript to be submitted
for publication in a professional journal. The General Introduction and
the Literature Review precede Section I and the General Conclusions and
Discussion follow Section 111. This format is authorized on page 6 of the
1987 edition of the Graduate College Thesis Manual. References in the
Introduction, Literature Review, and General Conclusions and Discussion
are presented in Additional References Cited following the General Con-
clusions and Discussion.
SECTION I. FEASIBILITY OF MASS SELECTING FOR 19 PEARL MILLET TRAITS
ABSTRACT
Pearl millet (Pennisetum glaucum (L.) R. Br.) is a model crop for
improvement by mass selection because it is alloqamous and it encompasses
great genetic variation for a wide array of traits. To evaluate the
feasibility of mass selecting for 19 morphological and physiological
traits Of pearl millet, we determined (a) trait heritability values and
(b) the effectiveness of upward and downward selection for each trait
in each of three phenotypically distinct millet composites. Parent-
offspring heritability values qenerally were highly significant for all
traits but they varied greatly in maqnitude amonq traits. Panicle size,
seed size, and seed number traits had high heritability values, D ~ O ~ U C -
tivity traits had intermediate to low values, and dry matter partitioning
traits had low heritability values. Significant responses to both upward
and downward selection for most traits showed that pearl millet can be
improved by selectinq with either high or low intensity.
Additional index words: heritability, symmetry of response
INTRODUCTION
Mass selection is used extensively for improving pearl millet
(~ennisetum glaucum (L.) R. Br.) in India because of the immense
genetic variation for most traits exhibited by this crop (Burton and
Powell, 1968) and the low cost of this breeding method. Because mass
selection is practiced on single plants, only traits with high herita-
bility can be improved via this method. Heritabilities for several
millet traits, summarized by Burton and Powell (1968) and Rachie and
Majmudar (1980), have limited value for predicting response to single-
plant selection because (a) they were computed from replicated progenies,
(b) they were estimated from sinqle-environment experiments, and
(c) traits of importance to adaptation, such as growth rate and biomass,
have not been studied. Therefore, we conducted a study to estimate heri-
tability values for 19 traits of potential use for mass selection of pearl
millet. Further, we selected So plants ranked in the top and bottom
decile for each trait to determine whether response to selection would be
symmetrical.
MATERIALS AND METHODS
Genetic Materials
The three pearl millet (Pennnisetum glaucum (L.) R. Br.) composites,
Dwarf Composite (D2C), New Early Composite (EC), and the New Elite Com-
posite (NELC), used for this study, had broad ranges for several agronomic
traits such as height, maturity, and yield (Table 1). The EC and NELC
composites were created by recombination among 117 and 47 lines, respec-
tively, of African and Indian origin, whereas the D C composite was 2
created by crossing among 23 African lines. Following two to three gen-
erations of random mating, the D2C, EC, and NELC composites were sub-
jected to 3, 5, and 4 cycles of recurrent selection, respectively, for
improved grain yield and resistance to downy mildew (Sclerospora
qraminicola) (Singh et al., in press). The most recent cycles of selec-
tion involved S family testing for EC and NELC and half-sib family 1
testing for D C (ICRISAT, 1986). S seeds used to initiate this study 2 0
were produced by open pollination among the 50 to 60 lines selected from
the most recently completed cycle of selection for each composite.
Field Experiments
S seeds from each composite were sown in 1440 hills during the 0
1985 dry season (January-April) at the International Crops Research In-
stitute for the Semi-Arid Tropics (ICRISAT) near Hyderabad, India. Sow-
ing dates were 11 January for D C and NELC and 14 January for EC. 2 S1
seed was produced by selfing the second and third tillers of a plant,
Table 1. S population means for 19 traits in D C, EC, and two 1 samplings of NELC 2
Trait
Composites
Units D2C
EC NELC- I NELC- I I
Panicle length cm
Panicle girth cm
Panicle surface area cm 2
Leaf width cm
Seeds per panicle (x100 )
100-seed weight Cl
Compactness scale 1-9
Grain yield kg ha-'
Panicle yield kg ha-'
Growth index g/mL/day 4.98 6.80 7.02 7.42 - 1
Straw yield kc,. ha 3020 3770 4290 5130
Biomass k~ ha-l 6660 7560 8520 8310
Plant height CII 126 177 193 210
Tiller number # m-L 24.1 27.5 21.6 1e.l
Flowering date DAE 50.3 45.1 5G. 8 58.8
Harvest index % 38.0 37.1 36.6 26.7
Reproductive ratio % 55.3 50.8 50.5 38.6
Threshing percent % 68.9 72.9 72.6 69.2
Chaff yield kg ha-' 1120 1000 1115 960
and a random set of 289 S progenies from each composite was sown on 21 1
June of the 1985 wet season (June-~eptember). On the same date, 1440
S hills were sown from a second sampling of the NELC seed stock. These 0
S plants were selfed and 289 resulting S progenies were sown on 18 June 0 1
in the 1986 Wet season. The S plants and S progenies of this second 0 I
NELC sampling will be referred to as NELC-I1 whereas those of the first
sampling will be identified as NELC-I.
S seeds were sown in hills spaced 75 cm apart on ridges formed at 0
75-cm intervals. Several seeds were sown per hill, and 10 days after
emergence the seedlings were thinned to one per hill. Seedlings were
transplanted into missinq hills. S progenies from a composite were 1
evaluated in a 17 x 17 triple lattice experiment. A plot consisted of
2 rows, each 2 m long, sown on ridges 75 cm apart. Plants within rows
were thinned to a 10-cm spacing.
So and S experiments were conducted on Alfisol soils at the ICRISAT 1
0 Center, Patancheru, India, at 17 N latitude. Rainfall was 51 mm during
the 1985 dry season, 311 mm during the 1985 wet season, and 460 mm during
the 1986 wet season. Furrow irrigation was used throuqhout the dry sea-
son and twice at the end of the 1985 wet season. Average weekly maxi-
0 mum temperatures increased throughout the dry season from 29 to 40 C,
0 whereas they fluctuated between 28 to 34 C during the 1985 and 1986 wet
season. Plants were sprayed with insecticides endosulfan 35E and
carabaryl 50 WP during grain filling in the wet seasons to control leaf-
feeding insects such as Mythimna separata. Each experiment received
broadcast applications of 40 kg/ha N and 17 kg/ha P preplant and
40 kg/ha N via topdressing of urea at 15 to 22 days after seedling
emergence.
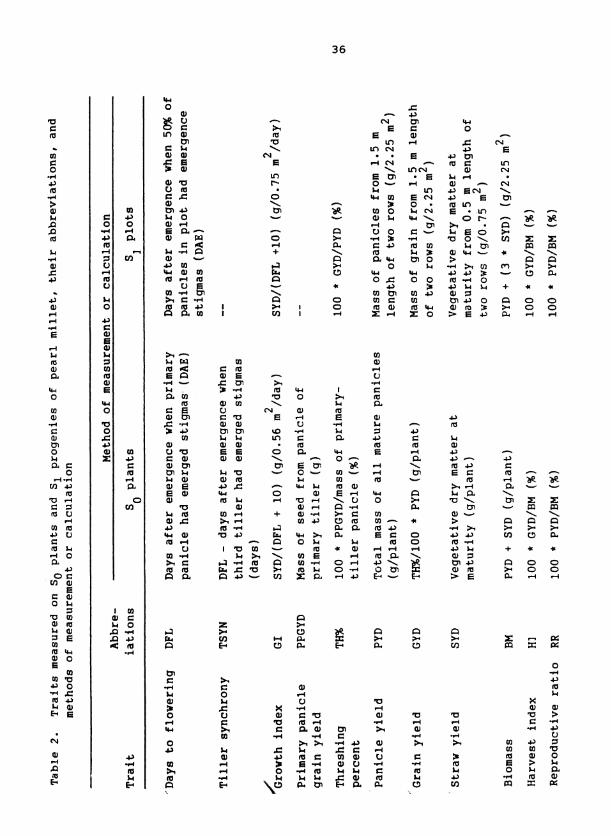
Traits
Traits measured on S plants and S progenies, their abbreviations, 0 1
and methods of measurement are presented in Table 2. All traits were
measured on all three replications of each S experiment except that 1
(a) only two replications were measured for leaf width (LFW) and plant
height (HGT) in all experiments and panicle lenqth (PLN) and qirth (PGR) in
NELC-I1 and (b) LFW was not measured in the S experiment of D C. Growth 1 2
index was calculated by using the procedure described by Bramel-Cox et al.
(1984). All traits were measured at harvest except for days to flower
(IIFL), which was recorded at flowering, and HGT, LFW, and tiller number
on S plants and HGT, LFW, PLN, PGR, and panicle compactness on S 0 1
progenies, all of which were measured two weeks before harvest. All dry
0 weights were recorded after plant materials were dried for 16 hr at 65 C,
0 except for S plant panicles, which were dried at 35 C for 24 hr.
0
Statistical Methods
Estimates of heritability and response to selection were based on S 0
plant-S proqeny pairs that had complete data for all traits in both qen- 1
erations. Numhers of pairs with complete data were 252, 254, 265, and 285
pairs in EC, D C, NELC-I, and NELC-11, respectively. The S plants of 2 0
these S -S progeny pairs included only plants that (a) produced at least 0 1
6 g of S1 seed, (b) were not transplanted, and (c) had values for threshinq
C u 0' C a, rl
- LON . E rl
Ln E N 0 bl N V, \
6 c - -4 m m bl 3 tr 0
bl lu 0 0
2 lo u m m lu Z 0
u c m 3 n \ w - cl * a c
0 0 d \ s E-
n * u
'u 3 a, 4 $.
C .rl m bl el
percent (TH%), harvest index (HI), and DFL within the acceptable ranges
for the particular composite. These ranges, established by noting the
points where distributions became discontinuous, limited TH% to between
60-85%, HI to 25-54% for NELC-I and NELC-11, 25-59% for EC, and 27-60%
for D2C: and DFL to 35-58 days for EC, 34-60 days for D2C, 38-66 days
for NELC-I, and 42-57 days for NELC-11.
S plant-S progeny heritabilities were estimated using the Standard 0 1
Unit Method outlined by Frey and Horner (1957) because scales of measure-
ment were different in S and S experiments. This method codes both S 0 1 0
and S1 measurements in standard units and, thus, results in a heritability
ceiling of 1.0. Responses to upward and downward selection were deter-
mined by first identifying So plants ranking in the upper or lower deciles
for a particular trait and, second, calculating the mean of their respec-
tive S progenies for that trait. To compare the magnitudes of response 1
obtained from upward versus downward selection, we (a) expressed the re-
sponses to selection as deviations from the mean of unselected S 1
progenies, and (b) we summed the response from upward selection with that
from downward selection for a particular trait.
RESULTS AND DISCUSSION
Heritability Values
he 19 pearl millet traits had heritability values that ranged from
16 to 64% when averaged over the three composites and two samplings of
NELC a able 3 ) . The traits could be assiqned to qroups accordinq to the
maqnitude of their heritability values.
Panicle size traits had hiqh heritability values across all three
composites and both samplinqs of NELC. Seed weiqht, seed number, and
panicle comvactness also were hiqhly heritable but tended to have
heritability Values sliqhtly lower than those of the panicle size traits.
High heritability values have been reported by other researchers for
panicle size traits (Burton, 1951; Pokhriyal et al., 1967: Sangha and
Sinqh, 1973) and for seed weiqht (Gupta and Athwal, 1966; La1 and Singh,
1970; Gupta and Nanda, 1971) of pearl millet.
Plant productivity traits had intermediate to low heritability
values across all composites. The heritability values for srain yield
(GYD), growth index (GI), straw yield (SYD), and days to flower (DFL)
were especially low in D2C. Heritability values for SYD, GI, biomass,
height, and DFT, were increased significantly when S and S populations 0 1
were tested in similar rather than contrastinq seasons. This is shown bv
comparinq NELC-I1 and NELC-I. The temperature and daylenqth differences
between the seasons when S and S evaluations occurred probably con- 0 1
trihuted to the low heritability values for DFL in NELC-I, D C, and EC. 2
These environmental factors are known to cause genotype x environment
Table 3. Standard unit heritabilities of 19 traits in D2C, EC, and two samplings of NELC, means of heritability values across com- posites, and means across related traits within composites
a Composites -
Trait group Trait EC NELC-I NELC- I I X D2C
Panicle size PLN PGR PSA LFW - X
Seed SNP characteristics SDW
CS - X
Productivity GYD PYD GI SYD BM HGT TNO DFL - X
Partitioning HI efficiency RR
TH% CF
d ~ l l coefficients are significant at the 0.01 level except as in- dicated. *Significant at the 0.05 level; ns, nonsignificant.
interactions for DFL in Pearl millet (Begg and Burton, 1971). Herita-
bility values of GYD and tiller number (TN), however, were not sig-
nificantly higher in NELC-I1 than in NELC-I. The low heritability
values for GYD may be due, in part, to the different manner in which GYD
is expressed in spaced-plant versus normal-density stands (Rattunde
et al., in press).
Dry matter partitioning traits had low heritability values in all
composites and in both samplings of NELC. One factor that may have
caused low heritability levels of these traits is that spaced-plant TH%
was computed by using grain mass from only a single panicle (Table 2).
Simulated Bidirectional Selection
S plants in the highest or lowest decile for a particular trait gen- 0
erally produced S progenies with trait values that were higher or lower, 1
respectively, than the mean of unselected S progenies (Table 4). Selec- 1
tion for both high and low panicle size and seed traits produced highly
significant differences among S progeny groups in each composite. Se- 1
lection for plant productivity traits was generally effective even though
responses of GYD, panicle yield (PYD), and GI were not always significant,
particularly in D C. The partitioning traits never showed significant re- 2
sponses to selection in D2C, whereas in EC, NELC-I, and NELC-11, signifi-
Cant responses were frequently obtained from downward selection and only
occasionally from upward selection.
The magnitude of response to upward selection equalled that to down-
ward selection for most traits (Table 5). Upward selection for parti-
Table 5 . Measures of symmetry of response to upward vs downward selec- tion, computed by summing the response to upward with that from downward selection, where all responses are deviations from the S1 population mean, for each of 19 traits in D2C, EC, and two samplings of NELC
Trait Units NELC-I
PLN
PGR
PS A
LFW
SNP
SDW
CS
GYD
PYD
GI
SYD
BM
HGT
TNO
DFL
*,**Denote differences that are significant at the 0.05 and 0.01 levels, respectively.
tioning traits generally produced smaller responses than did downward
selection but these differences were not significant. Asymmetric re-
sponses to upward and downward selection were exhibited,by some traits
but these asymmetries were inconsistent over composites and seasons of
evaluation. For example, selection was more effective for lax rather
than compact panicles and for late rather than early flowering in D C 2
and NELC-I but not in EC or NELC-11.
Implications for Mass Selection
The significant heritability values and the significant responses
of S progenies to selection upon S plants for all traits show that 1 0
(a) genetic variability for all 19 traits was present in these pearl
millet composites even after three to five cycles of recurrent selection
and (b) environmentally induced variation and errors in measurement of
S plants were not so large as to totally obscure genetic differences for 0
these traits. Single-plant selection, therefore, should be able to alter
gene frequencies for all 19 traits in the pearl millet composites. The
large heritability values for panicle and seed characteristics indicate
that selection would be more effective for these traits than it would
for plant productivity and partitioning traits.
The observation that nonadditive genetic variance is a predominant
type of genetic variation for productivity traits of millet (Burton, 1959;
Kapoor et al., 1982; Sachdeva et al., 1982) sugqests that responses to se-
lection for productivity traits would be less for recombined populations
than those exhibited by the selected S proqenies. However, since covari- 1
ance between S plants and S progenies exhibits only half of the domi- 0 1
nance variance exhibited among S plants (Hallauer and Miranda, 1981), our 0
heritability values and responses to selection probably were conservative.
Because responses to both upward and downward selection were signifi-
cant, breeders should be able to practice either mild or intense selec-
tion for most traits of pearl millet. The symmetry of responses to up-
ward and downward selection indicate (a) the absence of major genes with
allelic frequencies above or he lo^? the point of maximal additive variance
(Falconer, 1981) and (b) that environmental effects contributed propor-
tionally to both high and low trait values. Special precautions we used
to achieve uniform environmental effects on the whole population of S 0
plants were (1) overplanting and thinning to a single S plant per hill, 0
(2) transplanting seedlings to fill missing hills, and (3) using wide
spacing between S plants. 0
Differences among the three composites and two samplings of NELC for
heritability of productivity traits suggests two ways of improving effi-
ciency of selection. First, higher heritability values of EC and NELC
relative to D C may be associated with the numbers and diversity of 2
parents used to construct EC and NELC versus D C. This suggests that 2
using diverse parents to establish genetically broad-based populations
will make selection more effective. Second, the higher heritability
values exhibited by NELC-I1 as compared to NELC-I show that trait heri-
tability values can be increased by evaluating S plants in an environment 0
that closely approximates the target environment.
REFERENCES
Begg, J. E. and G. W. Burton. 1971. Comparative study of five qeno- types of pearl millet under a range of photoperiods and tempera- tures. Crop Sci. 11:803-805.
Bramel-Cox, P. J., D. J. Andrews, F. R. Bidinqer, and K. J. Frey. 1984. A rapid method of evaluating qrowth rate in pearl millet and its weedy and wild relatives. Crop Sci. 24:1187-1191.
Burton, G. W. 1951. Quantitative inheritance in pearl millet (Pennisetum glaucum). Agron. J. 43:409-417.
Burton, G. W. 1959. Breeding methods for pearl millet (Pennisetum glaucum) indicated by genetic variance component studies. Aqron. J. 51:479-481.
Burton, G. W. and J. B. Powell. 1968. Pearl millet breeding and cyto- genetics. Adv. Agron. 20:50-89.
Falconer, D. S. 1981. Introduction to quantitative genetics. Longman, New York.
Frey, K. J. and T. Horner. 1957. Heritability in standard units. Agron. 3. 49:59-62.
Gupta, V. P. and D. S. Athwal. 1966. Genetic variability, correlation, and selection indices of grain characters in pearl millet. J. Res. Punjab Aqr. Univ. 3(2):111-117.
Gupta, V. P. and G. S. Nanda. 1971. Role of grain, plant, and head char- acters in improving grain yield of pearl millet. Indian J. Genet. P1. Br. 31(1):128-131.
Hallauer, A. R. and J. B. Miranda. 1981. Quantitative genetics in maize. Iowa State Univ. Press, Ames, Iowa.
ICRISAT. 1986. ICRISAT Annual Report 1985. International Crops Research Institute for the Semi-Arid Tropics, Hyderabad, India.
Kapoor, R. L., H. P. Yadav, P. Singh, I. S. Khairwal, B. N. Dahiya. 1982. Genetics of harvest index, grain yield and biological yield of pearl millet. Indian J. Aar. Res. 52:630-633.
Lal, S. and D. Singh. 1970. Heritability, genetic advance and minimum number of genes in pearl millet. Indian J. Genet. PI. Br. 30:315- 321.
Pokhriyal, S. C . . K. S. Mangath, and L. K. Gangal. 1967. Genetic variability and correlation studies in pearl millet (Pennisetum aphoides (Burm. F.) Staph. and C. E. Hubb.). Indian J. Agr. S C ~ . 37(1):77-82.
~achie, K. E. and J. V. Majmudar. 1980. Pearl millet. The Pennsylvania State University, University Park, Pennsylvania.
Rattunde, H. F., J. R. Witcome, and K. J. Frey. Structure of variation of physiological and morphological traits in three composites of pearl millet. Euphytica (in press).
Sachdeva, A. K., F. Singh, and K. S. Dhindsa. 1982. Genetic analysis of grain yield and some quality traits in pearl millet. Z. Pflanzen. 88: 61-68.
Sangha, A. S. and B. V. Singh. 1973. Genetic variability and correla- tion studies of morphological characters in ,Pennisetum typhoides Staph. and Hubb. Madras Agr. J. 60:1258-1265.
Singh, P., K. N. Rai, J. R. Witcombe, and D. J. Andrews. Population breeding methods in pearl millet improvement. 2 Proqress in plant breeding, 11. Butterworths, London. (In press).
SECTION 11. STRUCTURE OF VARIATION AMONG MORPHOLOGICAL AND PHYSIOLOGICAL TRAITS IN THREE PEARL MILLET COMPOSITES
ABSTRACT
The plant breeder's task of improving and stabilizing many plant
traits simultaneously is complicated by interrelationships that occur
among the traits. Factor analyses were conducted on three phenotypically
diverse pearl millet (Pennisetum glaucum (L.) R. Br) composites. Approxi-
mately 1000 So spaced-plants from each composite were evaluated for 20
traits, and random samples of 289 S progenies from each composite were 1
evaluated for 18 of these traits in the subsequent season. Multitrait
factors extracted within So and S1 populations were interpreted to repre-
sent (a) biological yield, (b) panicle size, (c) dry-matter partitioning,
and (d) compensation between number and size of seeds. Associations of
certain plant traits with these factors were different in spaced-plant
than in progeny-row environments, but significant regression of S on 1
parental S factor scores showed that the observed trait complexes were 0
heritable. The implications of these results for millet breedinq are
discussed.
INTRODUCTION
Pearl millet (Pennisetum qlaucum (L.) R. Br.) consists of a large
number of genetically variable races (Brunken et al., 1977). The vari-
ability among races has been sampled by intermating lines from diverse
geographic origins to form several broad-based breeding populations
(Burton, 1959; Khadr, 1977). Success in breeding such populations is
influenced considerably by the presence of genetic associations among
traits. For instance, the array of possible recombinant types is very
limited if several traits are inherited pleiotropically (Stebbins, 1950)
Favorable genetic associations can be exploited in germplasm development
via indirect selection, whereas unfavorable associations require special
techniques to minimize undesirable correlated responses to selection.
Complexes of related traits were identified by Bramel-Cox et al.
(1987), who used principal components analysis to summarize data from
pearl millet populations derived from matings of adapted with wild,
weedy, or landrace accessions. Interrelationships among plant height,
stem diameter, leaf length, and flowering date were described by the
first principal component. This axis of variation was oriented toward
the exotic plant type at one extreme and toward the adapted type at the
other. In another multivariate study a arc ha is and Tostain, 1985),
associations among floral and seed characteristics were exhibited in
Progenies from matings between wild and cultivated pearl millet lines.
The objective of our study was to determine what relationships exist
among morphological, physiological, and yield traits in three genetically

broad-based pearl millet composites which,had undergone population
improvement. Multivariate methods were used (1) to identify major com-
plexes of related traits in each composite, (2) to determine whether
trait complexes are similar across composites and environments, and
(3) to assess whether multitrait associations are genetic in origin.
MP.TERIALS AND METHODS
Genetic Materials
The three pearl millet composites, Dwarf Composite (D2C), New Early
composite (EC), and New Elite Composite (NELC), used for this study, in-
cluded the ranges of height and maturity of cultivated pearl millet in
India (Table 1). The EC and NELC composites were created by intermating-
117 and 47 lines, respectively, of African and Indian origin, whereas the
D C composite was created by intercrossing 23 African lines. After two 2
to three generations of random mating, three to five cycles of recurrent
selection for grain yield and disease resistance were conducted in each
composite (Singh et al., in press). S seed used to initiate this study 0
was produced by open pollination among the 50 to 60 lines selected in the
most recently completed cycle of recurrent selection for each composite.
Field Experiments
S seeds of each composite were sown in 1440 hills during the 1985 0
dry season (January-April) at the International Crops Research Institute
for the Semi-Arid Tropics (ICRISAT) near Hyderabad, India. sowing dates
were 11 January for D C and NELC and 14 January for EC. S seed was 2 1
produced by selfing the second and third tillers of each plant, and an
unselected set of 289 S progenies from each composite was sown on 21 1
June in the 1985 wet season (~une-September). On the same date, a second
Sample of 1440 hills of So seeds from NELC was sown. These S plants 0
were selfed, and a random 289 of the resulting S progenies were sown on 0
Table 1. Means of eiqht traits measured on SO plants and S1 progenies from the D2C, EC, and two samplinqs of the NELC pearl millet composites; the recurrent selection cycle from which .
s plants were derived; and the numbers of entries analyzed in S and S populations 0 0 1
Seeds Growth Days Number Tillers per 100-seed index to Harvest Grain o f per panicle weight (g dar-l flower Height index plant-1
Composite Cycle entries plant (~100) (g) plt-) (DAE) (cm) ( % ) (9 )
S Populations 0
NELC- I 4 1G76 5.9 32.1 1.17 2.46 3.0 165 41.9 143
NELC- I I 4 1133 5.6 40.2 1.11 3.51 48.4 209 43.5 199
NELC-I
NELC-I I
S Populations 1
a b 289 1.8 15.8 0.71 0.37 - 50.3 126 38.0 19. lc
289 2.1 15.4 0.70 0.51 45.1 177 37.1 21 - 0
289 1.6 20.4 0.74 0.53 50.8 193 36.6 23.3
289 1.4 18.0 0.73 0.56 58.8 210 26.7 16.7
a -2 Number of panicles m divided by anticipated plant density m-2.
-1 -2 -2 b~rams day m divided by anticipated plant density m . C - 2 - 2 Grams m divided by anticipated plant density m .
18 June in the 1986 Wet season. The S plants and S progenies from the 0 1
second sampling of NELC will be labeled NELC-11, and those from the
first sampling will be labeled NELC-I.
S seeds were sown in hills spaced 75 cm apart on ridges formed at 0
75-cm intervals. Three to five seeds were sown per hill, and 10 days
after emergence, the seedlings were thinned to one per hill. Seedlings
were transplanted into missing hills. S progenies from a composite 1
were evaluated in a 17 x 17 triple lattice experiment. A plot con-
sisted of two rows each 2 m long sown on ridges spaced at 75-cm intervals.
Plants within rows were thinned to a 10-cm spacing.
S and S experiments were conducted on Alfisol soils at the ICRISAT 0 1
0 Center, Patancheru, India, at 17 N latitude. Rainfall was 51 mm during
the 1985 dry season, 311 mm during the 1985 wet season, and 460 mm during
the 1986 wet season. Furrow irrigation was used throughout the dry
season and twice at the end of the 1985 wet season. Average weekly
0 maximum temperatures increased throughout the dry season from 29 to 40 C,
whereas they fluctuated between 28 to 34'~ during the 1985 and 1986 wet
seasons. Plants were sprayed with the insecticides Endosulfan 35E and
Carbaryl 50 WP during grain filling in the wet seasons to control leaf-
feeding insects, such as Mythimna separata. Each experiment received
broadcast applications of 40 kg/ha N and 17 kg/ha P before planting and
40 kg/ha N via topdressing of urea at 15 to 22 days after seedling
emergence.
3 5
Traits
Traits measured on SO plants and S progenies, their abbreviations, 1
and methods of measurement are presented in Table 2. All traits were
measured on all three replications of each S experiment except that 1
(a) only two replications were measured for leaf width (LFW) and plant
height (HGT) in all experiments and panicle length (PLN) and panicle
girth (PGR) in NELC-I1 and (b) LFW was not measured in the D C S experi- 2 1
ment. Growth index was calculated by using the procedure presented by
Bramel-Cox et al. (1984). All traits were measured at harvest except
for date of flowering (DFL), which was recorded at flowering, and HGT, LFW,
and tiller number on S plants and HGT, LFW, PLN, PGR, and panicle com- 0
pactness on S progenies, all of which were measured 2 weeks before 1
harvest. All dry weights were recorded after plant materials were dried
0 for 16 hr at 65 C, except for SO plant panicles, which were dried at
35'~ for 24 hr.
Analysis of S populations was conducted on data from plants that 0
produced at least 6 g of S1 seed: had TH% within the ranqe of 60-85%; HI
within the ranges of 25-54% for NELC, 25-59% for EC, and 27-60% for D2C;
and DFL within the ranges of 35-58 days for EC, 34-60 for D2C, 38-66 for
NELC-I, and 42-57 for NELC-11. Data from transplants were not included
in the analyses.
u o m ' u a~ rl C O rl a u w m
LU U
m aJ * d 'u 0 aJ $ $ u 0 c
m u m 5 X Ll 0 X
"55 E g \ a m E $4 m - m In C: 0 .d - 8 - m 4 o LI
E d
m 2 a~ -I a LI u a - 0 Ll
& L U s- m u m x a N - 2.2 O m l a m 0 $ 4 aJ w e
m u - 2 2 r l* - -rl $' - > d
N In
C 0 - 4 U U 'u d aJ LU N - 0 0 , url-rl 4 0 \ w Ll U r l a 1 u C C z 44 N 0 44 N
U -4 C m a~ O - W - E U 0 \ rl+ a a d m E o g 2 LO
m u cn -4 E a u s u m -
m U E ; 1 o m a, u w 5 - aJ m f f la 5 C E 0 PI E
I m o d D a J O > aJ
c m L l m w cl E X Ll m . m Z - 4 c m *
m a J 4 0 ) a u u a w O L ~ w a b r l E 4 4 tn-4
rl U U r l
~l m a~ o \ u u c m m ~ I U E c s u L ~ E o P c d C - 4 -7 a d " g 2 g I U C m c z P E G cl
fi u w m m 4 l o r n r u a r r l w z cn - z a r a a m u a a
Statistical Analysis
Principal component analysis and factor analysis provide concise
descriptions of large covariance matrices by generating a few random ,
variables of hypothetical and unobservable nature that represent major
rnultitrait axes of variation (Karson, 1982). Principal component analy-
sis was used in the preliminary data summaries to determine the number
of variables that would describe a major portion of the variation in each
population. Subsequently, for each population, a correlation matrix of
p traits measured on SO plants or on S progenies was described by m 1
factors according to the factor analysis model:
where X is the ith trait, U is the expectation of trait X Y. is the i i i' J
jth common factor, 1 is the loading coefficient of the ith original i j
trait on the common factor Y and Z is the specific factor pertaining j ' i
to the ith trait. Trait associations were identified by noting traits
that had large loadinq coefficients for the same factor. To facilitate
biological interpretation of the factors, the axes were reoriented by
using a promax rotation, with varimax rer rotation, so that resulting
loadinq coefficients approached plus or minus 1.0 for stronqly associated
traits and 0.0 for unassociated traits. Factor scores for the jth factor
were generated for each S plant or S1 progeny of a population by a 0
linear function of all traits for that entry weighted by the loading
coefficients of the rotated jth factor. The portion of variation of
trait X explained by the m common factors is termed the final communality i
and is estimated by the squared multiple correlation of X with factor i
scores from the m factors.
The heritability and qenetic relationship between different trait
complexes were estimated by regressing rotated S1 factor scores, one
factor at a time, on scores from all of the So rotated factors. Parent-
offspring regressions were based on So plant-S progeny pairs that had 1
complete data in both generations. Numbers of pairs with complete data
were 252 , 2 5 4 , 2 6 5 , and 285 pairs in the D2C, EC, NELC-I, and NELC-I1
populations, respectively. Factor scores were based on standardized
trait values; therefore, the regression coefficients approximated
correlations.
RESULTS
Structure of Multitrait Variation
six multitrait factors were extracted from each of the four S and 1
three of the S p ~ p ~ l a t i ~ n s , and seven were identified from the NELC-I1 S 0 0
population. Within each population, factors were numbered (I, 11, etc.)
such that across p ~ p ~ l a t i ~ n s , factors with similar loading coefficient
vectors were numbered alike. Factor numbers were assigned according to
descending order of magnitude of variation accounted for; e.g., Factor I
accounted for 21 to 28% of the within-population variation after rotation,
and Factors I1 to VII accounted for progressively smaller portions of the
variances (Table 3). In total, factor analysis accounted for 82 to 88%
of the variation in each of the eight populations. Most traits had final
conununalities of 0.90 or larger in the eight populations. For DFL, TSYN,
HGT, LFW, and SDW, however, final communalities ranged from 0.48 to 0.87,
which shows that these traits exhibited independent variation that could
not be fully explained by factor analysis.
The orientation of a factor in the multidimensional space of all
morphological and physiological traits of a ~opulation is shown by the
magnitudes of the loading coefficients for the various plant traits on
that factor. Factor I from the D2C So population, for example, was
oriented toward plant mass, as indicated by the large loadings for BMI
SYD, GYD, GI, and HGT (Table 4). A factor with similar large loading
coefficients for EM, GyD, GI, SYD, and HGT was identified in each of the
ble 4. Loading coefficients ( x 100) of plant traits for Factor I or 'biological yield* axis of variation for four SO and four S1 populations of pearl millet
Population
So S1
Trait D,C EC NELC-I NELC-I1 D,C EC NELC-I NELC-I1
a EM 94 88 * 91 * 96 * 93* 93* El* 97* GYD 88* 86 85* 88* 80* 55* 3 0 66 GI 83* 78* 85* 86 * 90* 97* 93* 96 * SYD 80* 72* 79 * 84* 85* 98* 95* 98 HGT 41 * 2 8 39* 41 67* 62* 62* 52 *
CF 83* 82* 81* 73* 11 0 7 9 TNO 76 * 77 73* 53* 37 3 -10 14
TFI% - 2 -2 3 17 58* 43* 24 52* RR 2 - 4 -6 -15 -49* -76* -89* -54* HI 1 - 5 -3 - 5 0 -44* -70* -15 DFL -14 -18 -12 14 3 1 59* 49 * 42* SDW 9 5 11 26 27 4@* 42' 16
SNP PGR PLN PSA CS LFW PPGYD TSYN
Variance 4.62 4.20 4.57 4.46 4.50 5.03 4.77 4.50
a*, value qreater than the root mean square of all the values in t , hp
rotated factor pattern matrix of the respective ~opulations.
Table 6. Loading coefficients (x 100) of plant traits on Factor IIr(0r 'dry-matter partitioning1 axis of variation for four SO and four S1 populations
Population
So 1
Trait D-C EC NELC-I NELC-I1 D,C EC NELC-I NELC-I1
SYD -51* -61* -53* -50* -40* -4 2 1 -14 GI -48* -56* -47* -47* -30 - 1 24 -14 HGT -41* -52* -44* -33 0 6 7 11 DFL -14 -39* -31 -32 -47* -10 2 - 5
GYD 2 5 11 20 2 9 54* 81" 90* 72* TH% 13 22 14 2 1 39* 64* 78* 64* BM - 7 -29 -18 -13 -3 3 0 48 * 15 TNO 15 28 26 31 15 3 4 39* 9 SNP 11 5 17 13 16 29 26 44 *
SDW PGR PLN PSA C S C F LFW PPGYD TSYN
Variance 2.60 3.15 2.78 2.75 2.52 2.46 2.55 2.81
** , value greater than the root mean square of all the values in the rotated factor pattern matrix of the respective populations.
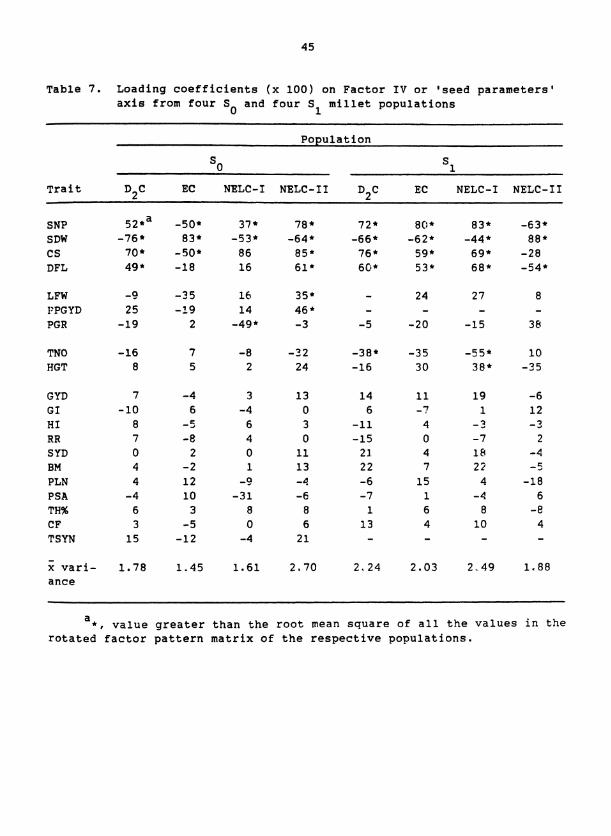
Table 7. Loading coefficients (x 100) on Factor IV or 'seed parameters' axis from four S and four S millet populations
0 1
Population
0 S1
Trait D2C
EC NELC-I NELC-I1 D2C EC NELC-I NELC-I1
SNP 52*a -50* 37 * 78 * 72* 8C:* 83* -63* SDW -76 * 83* -53* -64* -66* -62* -44* 88* CS 70* -50* 86 85* 76 * 59* 69* -28 DFL 49 * -18 16 61* 60* 5 3 * 68* -54*
LFW -0 -35 16 35* - 2 4 2 7 8 I'PGYD 25 -19 14 46 - - - - PGR -19 2 -49* -3 -5 -20 -15 38
TNO -16 7 - 8 -32 -38* -35 -5 5 10 HGT 8 5 2 2 4 -16 3 0 38* -35
GYD GI HI RR SYD BM PLN PSA TH% C F TSYN
- x vari- 1.78 1.45 1.61 2.70 2.24 2.03 2.49 1.88 ance
a*, value greater than the root mean square of all the values in the rotated factor pattern matrix of the respective populations.
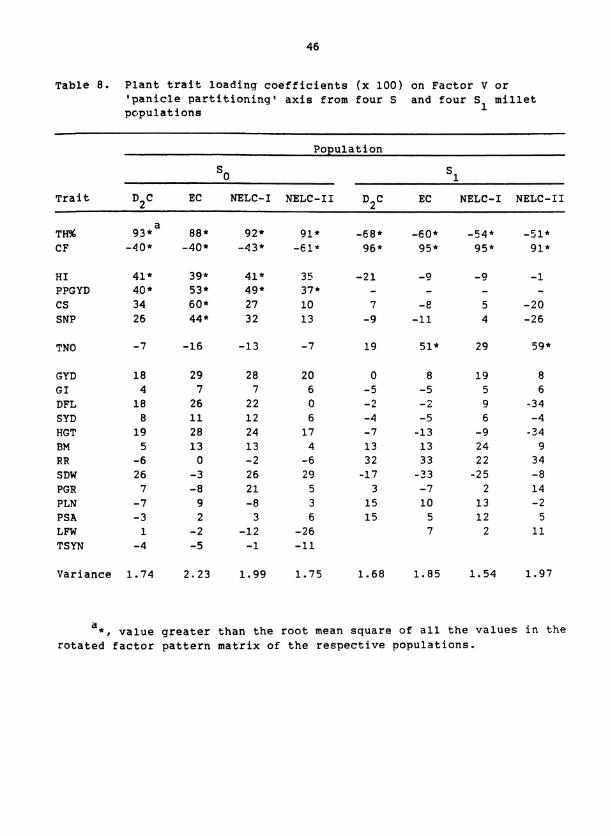
Table 8. Plant trait loading coefficients (x 100) on Factor V or 'panicle partitioning1 axis from four S and four S millet populations 1
Population
0
Trait D-C EC NELC-I NELC-I1 D-C EC NELC-I NELC-I1
HI 41* 39* 41* 3 5 -21 -0 -0 -1 PPGYD 40 * 53* 49* 37* - - - cs 34 60* 2 7 10 7 -e 5 -20 SNP 2 6 44 * 3 2 13 - 9 -11 4 -26
TNO - 7 -1 6 -13 - 7 19 51* 29 59*
GYD GI DFL SYD HGT BM RR SDW PGR PLN PSA LFW TSYN
Variance 1.74 2.23 1.99 1.75 1.68 1.85 1.54 1.97
'*, value greater than the root mean square of all the values in the rotated factor pattern matrix of the respective populations.
other seven populations as well (Table 4). This set of traits was con-
sidered to be a "core group" because their relationships with Factor I in
the eight populations transcended differences among composites and
environments. A different "core group1' of traits occurred for each of
the Factors I1 to VI (Tables 4 to 8). Each factor was interpreted as
representing a particular biological aspect of plant growth or morphology
according to the nature of the "core group1* of traits that defined the
factor's orientation. For example, Factor I was interpreted to represent
a 'biological yield' axis of variation because each "core-group" trait
described some aspect of plant mass. This axis of variation had been
identified previously via multivariate analyses of pearl millet (Bramel-
Cox et al., 1987) and dry beans (Phaeseolus vulgaris) (Denis and
Adams, 1978).
Factor I1 from four of the pearl millet populations (i.e., S of 0
D C, EC, and NELC-I and S of NELC-11) had large positive loading coeffi- 2 1
cients for PSA and the components of PSA; i.e., PLN and PGR (Table 5).
Thus, Factor I1 represented a 'panicle size' axis of variation. Each of
the other four populations had two factors that had larqe positive loading
coefficients for PSA and either PLN or PGR, so these were labeled as the
'panicle length' and 'panicle circumference' axes, respectively. That
separate factors represented panicle length and panicle circumference show
that PLN and PGR exhibited greater independence in the latter four
Populations.
RR and HI, which measure the portions of total plant mass that are
Panicle and grain mass, respectively, had large coefficients on Factor
I11 (Table 6). Factor 111, therefore, was identified as a 'dry-matter
partitioning' axis. Negative loadings for SYD, GI, and HGT in S popu- 0
lations and positive loadings for GYD in S populations support this 1
interpretation. The S population of NELC-I differed from others in 1
that the loading of GYD on Factor I11 was larger than that for HI and
the loading for RR was not significant.
SNP and SDW had large loading coefficients with opposite signs on
Factor IV (Table 7), which suggests that Factor IV represents compensa-
tion between seed number and seed size. The orientation of Factor IV
toward large SNP and small SDW or vice versa probably is a function of
whether SDW or the group of traits (SNP, CS, and DFL) had the larger
amount of variation accounted for by this factor. Our interpretation
of Factor IV supports the suggestion of Grafius and Thomas (1971) that
SNP and SDW are members of a single developmental sequence in which the
magnitude of an initial component inversely affects the size of a sub-
sequent component.
Factor V had large loadings with opposite signs for TH% and CF
a able 8). Because TH% measures that proportion of panicle mass that is
grain and CF measures chaff mass, this axis was interpreted to represent
'panicle partitioning'. SNP and SDW had small loading coefficients on
this axis, which shows that these traits, taken individually, were in-
dependent from efficiency of partitioning within the panicles. The
reversal of signs and magnitudes of loadings for TH% and CF between
So and S populations may have resulted from the different magnitudes of 1
variation for these traits that were associated with Factor I; i.e.,
CF and TH% had large loadings for Factor I in S and S populations, 0 1
respectively (Table 4 ) .
Environmental Influence on Trait Associations
When grown in field experiments, an S plant occupied seven times 0
2 more land area than did an S plant (0.56 vs 0.08 m ) , which resulted in 1
more tillers per S plant (Table 1). The large loading coefficients for 0
TNO on the 'biological yield' factors of the four S populations (Table 4) 0
reflect the importance of tillering to the mass of a spaced plant. In
the S populations, TNO had no significant loadings on 'biological 1
yield' factors, whereas positive loadings for DFL did occur. However,
loading coefficients for DFL were smaller than those for GI, which
shows that growth rate was more important than duration of growth in
determining BM of S progenies. 1
Another major difference between S spaced-plants and S progenies 0 1
involved the loading coefficients for TH% and RR on Factor I (Table 4).
Positive TH% and negative RR loadings for S1 populations show that proge-
nies with high BM had well-filled panicles but had less complete re-
mobilization of dry matter, whereas progenies with low BM effectively
translocated dry matter to the panicle but had panicles poorly filled
with grain; conditions typical of 'sink' and 'source' limitations, respec-
tively. In contrast, S populations had small loadings for both TH% and 0
RR on Factor I which shows that biomass and partitioning were independent
and suggests that spaced-plants exhibited concomitant increases of both
'source' and 'sink' parameters.
Large GYD loadings on Factor I for both spaced-plant and normal-
density row environments show that the association between GYD and BM is
environmentally stable (Table 4 ) . The association between GYD and HI,
however, was limited to the S progeny-row environment as indicated by 1
the larger positive GYD loadings on Factor I11 of S relative to S 1 0
populations (Table 6).
That greater compensation occurred between TNO and SNP for S proge- 1
nies than for S spaced plants is suggested by the loading coefficients 0
for TNO on the respective S and S 'seed parameter' factors (Table 7). 1 0
This conclusion is supported by the fact that the negative correlations
between TNO and SNP were larger for S populations (r = -0.44 to -0.61) 1
than for S populations (r = -0.21 to -0.23). 0
Genetic Determination of Trait Associations
Trait relationships identified via factor analysis within each popu-
lation were phenotypic. That these relationships had a genetic component
is shown by the significant regressions of S progeny factor scores on 1
scores for the same factor from parental S plants (diagonal of Table 9 ) . 1
Heritable variation for the 'biological yield', 'panicle sizev, and 'seed
parameter' axes was exhibited for all composites. That regressions of
S on So 'dry-matter partitioning' and 'panicle partitioning' factors 1
were significant only occasionally indicates low heritabilities or
changes in orientation for these factors across generations.
* * * * * * * * * * * * * * * m m v o m o o P F P o d t n w m ~ r l o m ON^ d o o 4 d d o 4 . . . . . . . . . . . . . . . 0 0 0 0 0 0 0 0 0 0 0 0 0 0 0 I l l I l l I l l I I
* * * * * * m m m ~ v a t - m m o o m ~ m m ~ v m m 0 0 0 0 4 0 o O O O N . . . . . . . . . . . . . . . 0 0 0 0 0 0 0 0 0 0 0 0 0 0 0 I I I I
* * * * r 4 -3- N m 0 * . * * * * * * *
* * O * * * * * * 0 * 0 0 3 T O F m U ' N N O 19 ln N O ~ N I v m p m m p c a d o . . . . . . . . . . . . . o o o r 0 0 0 0 0 0 r- 000 -3 -
rl '4 I 4
0 0 0
- u.40 u H a , O L ! 0 H U
C C C C C o w m m o m c o w 0 4 4 m c ( . - ~ q q N . . . . . . 0 0 0 0 O O C O 0
I I I
C C C C *
Table 10. Linear regression coefficients for S1 grain yield (kg ha-') upon scores for individual So rotated factors and partial regression coefficients from multiple linear regressions of S1 grain yield on scores from all So factors
Factors from So populations
I I I I1 I I v v v I Biological Panicle Dry matter Seed Panicle Tiller
Composite yield size partitioning parameters partitioning synchrony
Regression coefficients
D2C 119** 62* EC 113** 125** NELC- I 122** 77* NELC- I I 172** 98** ~ 6 * * ~
Partial regression coefficients
D2C 101** 2 1 EC 83* 47 NELC-I 121** 16 NELC- I I 133** 38 -26b
a Sign of EC Factor IV scores reversed to reflect positive SNP and negative SDW loadings.
bRegressions on NELC-I1 SO factors interpreted as 'panicle lengtht (left) and 'panicle circumference' (right).
*,**Dsnote significance at the 0.05 and 0.01 levels, respectively.
DISCUSSION
The factor analysis algorithm identified factors that were inde-
pendent from one another, except for small correlations induced by factor
rotation, in the eight pearl populations. Several siqnificant
relationships among different factors were found, however, when S 1
factor-scores were regressed on So scores for other factors (off-diagonal
regressions of Table 9). For example, the regressions of S tbiological 1
yield' factor scores on parental S 'panicle size' and 'dry matter 0
partitioning' factor scores usually were significant. Such interrelation-
ships among different factors from one generation to the next suggest the
existence of pleiotropic qenes that govern an underlying developmental
pattern that influences several characteristics.
The occurrence of genetically induced relationships among different
pearl millet traits or trait complexes would have two possible conse-
quences on the selection methodology used to improve this crop. First,
some type of restriction upon selection would be required when selection
for one trait could cause an undesirable correlated response of another
trait. For instance, the negative association between HI and BM, repre-
sented by regressions of S Factor I on S Factor I11 (Table 91, would 1 0
require that selection for increased HI be restricted so as to prevent
unacceptable decreases of BM. Second, indirect selection may be used to
exploit favorable trait associations. One such association is between
the So 'panicle partitioning' and the S 'dry matter partitioning' axes 1
(Table 9), which shows that TH%, an easily and commonly measured trait,
could be used to indirectly select for HI, a trait that is difficult
to measure.
In India, farmers generally grow pearl millet during the rainy sea-
son, whereas at the ICRISAT site, irrigation facilities permit cultiva-
tion of this crop during the dry season as well. Our results indicate
that, for certain characteristics, selection in the dry season can result
in genetic improvement for the rainy season crop despite the considerable
climatic differences between the seasons. For example, highly significant
heritabilities (i.e., parent-offspring regressions) were found for Factors
I, 11, and IV from D CI EC, and NELC-I, which had their S populations 2 0
grown in the dry season and S populations in the rainy season (diagonal 1
of Table 9). Heritabilities for Factors I to V increased, however, when
both S and S populations were tested during the rainy season, as shown 0 1
by a comparison of NELC-I and NELC-I1 regressions.
The identification of factors with similar loadings of traits for
all three pearl millet composites (Tables 4 to 8 ) could be the result of
similarity across composites of ( a ) genetically induced trait correla-
tions, (b) environmental correlations amonq traits, or (c) correlations
of measurement errors due to calculating several traits from a single
measure; e.g., BM, GI, HI, and RR all use SYD in their computations
(Table 2). To assess whether trait relationships identified via factor
analysis were due to measurement error correlations arising from the
Computational relationships among traits, we reanalyzed each population
by using only traits that were measured independently (12 in S popula- 0
tions and 10 in all S populations except D2C which had 9). 1
Three or four factors were extracted for each population by
utilizing a correlation matrix of these independently measured traits.
A factor that represented 'biological yield' was identified in each
population with large loadings for TNO, SYD, and PYD in S and GYD, 0'
SYD, HGT, and DFL in S p0p~lati0nS. A factor representing 'panicle 1
lengthi occurred in five populations, and one representing 'panicle
length and circumference' occurred in two others. Large loadings of
opposite signs occurred for SDW and CS in another factor for all S 0
and three S populations. An association between maturity and biomass 1
for spaced plants, which was indicated by large loadings for DFL, HGT,
and SYD on one factor in the EC and NELC-I S populations, was the only 0
relationship not described by the factor analyses that utilized all
traits. The similarity of factors identified from directly measured
traits and from all traits shows that the trait relationships that we
identified initially were not caused by correlations due to measurement
errors. That trait complexes were similar in all composites shows that
plant breeders could use similar selection procedures for improving
pearl millet composites of diverse phenotypes.
Factor analysis was used to identify a limited set of plant traits
for predicting yield potential of spring wheat (Triticum aestivum) geno-
types (Walton, 1972). Because our pearl millet composites were under-
going recurrent selection to increase GYD, we decided to assess the value
Of each factor as a criterion for GYD selection by regressing S1 GYD on
SO factor scores (Table 10). Most regressions, except the one involving
the 'tiller synchrony' factor, were significant, which indicates that GYD
is dependent upon several trait complexes. By selectinq S plants with 0
Factor I scores one standard deviation above the mean, we obtained
predicted S progeny yields 113 to 172 kg hav1 above the population mean. 1
The 'panicle size' and 'panicle partitioning' factors also showed con-
sistent positive relationships with GYD. S1 GYD was negatively related
to the S 'dry matter partitioning' factor in the D C and EC composites, 0 2
which shows this to be an anti-yield factor. Partial regressions of S 1
GYD on scores from all six or seven So factors suggest that selection
criteria for improving GYD would be BM, TIT%, and SDW for the EC and
D C composites and BM, TH%, and SNP for the NELC composite. 2
SUMMARY
~raits of pearl millet are related along axes of (a) biological
yield, (b) panicle size, (c) partitioning efficiency, and (d) compensa-
tion between seed number and size. Factor analysis identified similar
trait complexes in the three pearl millet composites. Traits involved in
each complex differed in the S and S generations, but these differ- 0 1
ences were due to planting design differences rather than to the effects
of inbreeding. That is, differences were those expected due to different
levels of competition among plants. Variation for the 'biological
yield1, 'panicle size*, and 'seed parameter' trait complexes was heritable
across generations even though the S and S evaluations were in differ- 0 1
ent planting patterns.
REFERENCES
rame el-Cox, P. J., D. J. Andrews, and K. J. Frey. 1987. Trait associa- tions in introgressed populations of pearl millet. Plant Breed. 98: 17-24.
rame el-Cox, P. J., D. J. Andrews, F. R. Bidinger, and K. J. Frey. 1984. A rapid method of evaluating growth rate in pearl millet and it^ weedy and wild relatives. Crop Sci. 24:1187-1191.
Brunken, J., J. M. J. De Wet, and J. R. Harlan. 1977. The morphology and domestication of pearl millet. Econ. Bot. 31:163-174.
Burton, G. W. 1959. Breeding methods for pearl millet (Pennisetum glaucum) indicated by genetic variance component studies. Agron. J. 51:479-481.
Denis, J. C. and M. W. Adams. 1978. A factor analysis of plant vari- ables related to yield in dry beans. I. Morpholgoical traits. Crop Sci. 18:74-78.
Grafius, J. E. and R. L. Thomas. 1971. The case of indirect genetic control of sequential traits and the strategy of deployment of environmental resources by the plant. Heredity 26:433-442.
Karson, M. J. 1982. Multivariate statistical methods. Iowa State University Press, Ames, Iowa.
Khadr, F. H. 1977. Recurrent selection in pearl millet (Pennisetum typhoides) in northern Nigeria. Plant Breed. 79:145-153.
Marchais, L. and S. Tostain. 1985. Genetic divergence between wild and cultivated pearl millets (Pennisetum typhoides). 11. Charac- ters of domestication. Plant Breed. 95:245-261.
Singh, P., K. N. Rai, J. R. Witcombe, and D. J. Andrews. 1988. Popula- tion breeding methods in pearl millet improvement. 2 Progress in plant breeding 11. Butterworths, London (in press).
Stebbins, G. L. 1950. Variation and evolution in plants. Columbia University Press, New York.
Walton, P. D. 1972. Factor analysis of yield in spring wheat (~riticum aestivum L.). Crop Sci. 12:731-733.
SECTION 111. MASS SELECTION STRATEGIES FOR INCREASING GRAIN YIELD OF PEARL MILLET
ABSTRACT
Pearl millet is an autogamous and genetically variable crop that
can be improved readily by mass selection for certain traits (Burton
and Powell, 1968). The feasibility of improving grain yield of pearl
millet via mass selection is questionable, however, because environmental
effects may obscure genetic differences for grain yield of single plants.
The objectives of this Study, therefore, were to determine if grain yield
of pearl millet can be increased by mass selection and, if so, whether
selection for yield per se or via indices Irould be most effective. Popu-
lations of approximately 1000 S plants from each of three pearl millet 0
composites were subjected to bidirectional selection for grain yield
per se and for values of multitrait indices. Selfed seed of selected
plants was used to create intermated populations which were evaluated
for yield at three locations in India. Significant yield responses from
selection occurred but their frequency differed greatly among the three
composites and between locations of evaluation. Yield responded to both
upward and downward selection in one composite, only to downward selection
in another, and not at all in a third. Selection with indices composed
of developmental traits produced the largest yield responses when the re-
sulting populations were evaluated at the location of selection, whereas
selection upon spaced-plant grain yield or upon yield component traits
produced several of the largest yield responses at the remote locations.
Selection indices developed by multiple regression showed no consistent
advantage over intuitive indices. By using a lower selection intensity,
mass selection was effective over a broader range of pearl millet germ-
plasm and was more compatible with breeding for broad adaptation.
Additional index words: realized gains, index selection, yield
components, developmental traits
INTRODUCTION
Pearl millet (~ennisetum glaucum (L. ) R. Br. ) is a species that
possesses immense genetic variation and thus is well suited to improvement
via mass Selection (Burton and Powell, 1968). The value of mass select-
ing for increased grain yield (GYD) in pearl millet is questionable,
however, because microenvironmental effects can confound genetic dif-
ferences for yield of sinqle plants.
For selection to be effective, the trait selected must be highly
heritable and have a StrOnq qenetic correlation with the trait to be im-
proved (Falconer, 1952). For example, selecting pearl millet spaced-
plants with greater panicle size, seed size, or GYD per se could effec-
tively increase GYD at normal-plant density if the spaced-plant traits are
highly heritable and are genetically correlated with GYD at normal density
environments.
Baker (1986) suggests that genetic improvement of a complex trait
like grain yield can be accomplished best by selecting for components of
that trait and weighting individual components differentially. According
to Grafius (1956), the components of cereal crop yield are the number of
6 ' inflorescences per unit area, number of seeds per inflorescence, and seed
weight. Selecting for yield components may not improve yield, however,
because compensation occurs among components (Hallauer and Miranda,
1981) and yield components may fail to describe the underlying yield de-
terminants operative during crop development (Apel, 1984). Takeda and
Frey (1976) proposed that grain yield be described in terms of develop-
mental traits, namely, growth rate, growth duration, and harvest index.
selection indices to be most effective should contain traits that
are genetically related to the improved plant type but are uncorrelated
with each other (Baker, 1986). The intuitive yield models of Grafius
(1956) and Takeda and Frey (1976) can serve as bases for developing selec-
tion indices since component traits in these models should be genetically
correlated with GYD. The interrelationships among traits in the yield
models of Grafius (1956) and Takeda and Frey (1976), however, could pre-
vent making optimal yield gains with selection indices based on either
of them.
Multiple regression offers an alternative method to identify traits
that best predict genetic worth of selectable genotypes for grain yield.
With this method, grain yield is regressed upon various groups of can-
didate traits and the best group is the one that gives the highest R-
square. Multiple regression analyses have been used by Gupta and
Athwal (1966), Mahadevappa and Ponnaiya (1967), Singh and Ahluwalla
(1970), and Phul et al. (1974) to determine the best sets of traits for
improving grain yield of pearl millet. These studies made use of data
from single-environment experiments and realized gains from selection were
not determined.
Our objectives were to use several alternative mass selection strate-
gies to (1) determine whether grain yield of pearl millet can be increased
via mass selection and (2) compare the relative effectiveness of selection
based upon (a) grain yield per se vs multitrait indices, (b) yield compo-
nent vs doveloomental trait indices, and (c) indices based on intuitive
vs , u ~ t i p l @ regression of yield. Further, mass selection can be
by either the best or discarding the worst plants,
,,, (3) we evaluated the magnitudes of GYD response to both upward and
downward selection for each selection criterion.
MATERIALS AND METHODS
Genetic Materials
The three pearl millet composites used in this study (New Elite
Composite (NELC), New Early Composite (EC), and Dwarf Composite (D C)) 2
represented the range of height and maturity of this crop in India
(Rattunde et al., in press). The EC and NELC composites were created
by recombination amonq 117 and 47 lines, respectively, of African and
Indian origin, whereas the D C com~osite was created by crossing among 23 2
African lines. Following two to three generations of random matinq, the
D C, EC, and NELC composite; were subjected to 3, 5, and 4 cycles of 2
recurrent selection, respectively, for improved grain yield and resis-
tance to downy mildew (Sclerospora graminicola) (Singh et al., in press).
The most recent cycles of selection involved S family testing for EC 1
and NELC and half-sib family testing for D C (ICRISAT, 1986). S seed 2 0
used to initiate this study was produced by open pollination among the
50 to 60 lines selected in the most recently completed cycle of selec-
tion for each composite.
S seed from each composite was sown in 1440 hills in the 1985 dry 0
season (January-April) at the International Crops Research Institute
for the Semi-Arid Tropics (ICRISAT) near Hyderabad, India. The second
and third tillers of each S plant were selfed and a random sample of 0
289 S progenies from each composite were sown in the 1985 wet season 1
(June to September). A second sample of 1440 NELC So spaced plants was
sown in this same season and will be referred to as NELC-11, whereas
the first sampling of NELC will be denoted as NELC-I and the S1 progenies
derived from NELC-I as NELC-S1.
S seeds were sown in hills spaced 75 cm apart on ridges formed 0
at 75-cm intervals. Several seeds were sown per hill and seedlings were
thinned to one per hill 10 days after emergence. Seedlings were trans-
planted to fill missing hills. S progenies from each composite were 1
evaluated using a 17 x 17 lattice design with three replications. s1
progenies were sown in two row plots of 2-m length on ridges 75 cm apart.
Plants were thinned to a 10-cm distance within rows.
Yield of grain (GYD), yield component traits, and developmental
traits were measured directly or calculated for each S plant (Table 1) 0
and for all three reps of each S progeny (Rattunde et al., in press). 1
Panicle compactness was quantitatively evaluated on NELC-I and NELC-I1
spaced plants by lowering a 2-kg weight of 2-cm width onto the primary
panicle midway between its tip and base, measuring the depressed panicle
thickness (DPT), and expressing DPT as a ~ercentage of the panicle
diameter.
S and S experiments were conducted on Alfisol soils at the ICRISAT 0 1
Center, Patancheru, India. Rainfall was 51 mm during the 1985 dry season
and 311 mm during the 1985 wet season. Furrow irrigation was used
throughout the dry season and twice at the end of the 1985 wet season.
0 Average weekly maximum temperatures increased from 29 to 40 C through
0 the duration of the dry season, whereas they fluctuated between 28 to 34 C
during the wet season. Each experiment received broadcast applications of
17 kg ha'' P preplant and 80 kg ha-I N in split doses with half applied
Table 1. Traits measured on pearl millet So plants, their abbreviations, units of measurement, and methods of computation for traits not measured directly
Trait Abbre- viation Calculation Units
Yield components
Tiller number Seed number per panicle Seed weight Panicle length Panicle girth Panicle surface area Threshing percent Chaff yield Panicle compactness a Depressed panicle thickness DPT as % of panicle diametera
Developmental traits
Growth index Days to flower Harvest index Flant height Straw yield Biomass Leaf width Tiller synchrony
Reproductive ratio
Yield measures
Primary panicle mass Primary panicle grain mass So-plant panicle yield So-plant grain yield
TNO SNP SDW PLN PGR PSA TH% CF CS DPT DPT%
GI DFL HI HGT SYD BM LFW TSYN
PPM PPGM PYD GYD
PLN* PGR ( PPGM/PPM) 100 PYD - GYD
PYD + SYD
DFL (tiller 1) - DFL (tiller 3 ) ( PYD/BM) 100
PYD . TH%/100
# lant-I 11 10 panicle-' g 100 seeds-' cm cm cm 2 % g plant-' 1 to 9 cm %
g plant-1 day-: days % cm g plant-' g plant-l cm days
%valuated in NELC-I and NELC-11.
before planting and half topdressed at 15 to 22 days after emergence.
Selection Indices
Selection indices based upon either yield component traits as de-
scribed by Grafius (1956) or developmental traits used by Takeda and
Frey (1976) were called Concept indices (Table 2). An index value for
a genotype was calculated by summing the individual trait values, stan-
dardized to mean zero and unity variance, weighted by their respective
heritability Values (Smith et al., 1981). Trait heritabilities wete
estimated by correlating S with S trait values within D CI EC, and 0 1 2
NELC-I (Rattunde et al., in press) and by the ratio of genetic to pheno-
typic variance components from the NELC-S1 trial. D2C, NELC-I, and
NELC-I1 index values were computed with trait values expressed as devia-
tions from the mean of 30 plants within the grid (6 rows of 5 plants
each) in which that plant was located. For ECI unadjusted S data 0
were used.
"Regression indicesu were created by regressing S progeny grain 1
yields onto groups of traits measured on their parental S plants. Three 0
regression indices were created: (1) developmental (DEV), (2) yield
component (YC), and (3) all traits (AT), by regressing S grain yields 1
upon traits assigned to the developmental-traits group, the yield-
components group or traits from both groups plus grain yield (GYD) and
primary panicle grain mass (PPGM), respectively a able 1). Because a
trait's relationship to grain yield may be nonlinear (Kempthorne and
Nordskog, 1959; Frey and Huang, 1969)r the square of each trait was
included as a Separate independent variable in the DEV and YC re-
gressions. Thus, the number of independent variables available for the
DEV and YC regressions was 18 for EC and D C, and 18 and 22, respectively, 2
in NELC-I. The AT regressions were conducted with 20 and 22 independent
variables in EC and NELC-I, respectively. All possible regressions with
one to nine independent variables were computed for each index by using
the computer "All Possible Subsets (P9R)" of BMDP (Frane, 1981). The
10 regressions equations with highest R-square values for each number
of variables (i.e., 10 one-variable, 10 two-variable, etc.) were iden-
tified. This gave a total of 90 equations for each regression index (YC,
DEV, AT) within each composite. From each set of 90 equations, one was
chosen for use as the selection index on the basis of its R-square value
(adjusted for number of independent variables) and that its variables
conformed to a reasonable representation of plant development. Index
values for the DEV, YC, or AT indices were computed for each genotype by
using the partial regression coefficients of the selected equation as
weights for the traits of the index (Table 2).
The trait values used for computing the regression equations and sub-
sequent index values were expressed either in the original units of mea-
ssrement or as deviations from 30 plant grid means, depending on which
format gave the higher R-square for the So-S1 regression a able 2). When
regressing upon deviations from grid means, the quadratic variables were
created by adding to each deviation a positive value equal to the most
negative deviation for the given trait and then squaring the resultinq
Positive values.
Selection and Intermating
Each population of 1440 So plants was reduced to approximately 1000
by discarding plants that (a) were transplanted, (b) produced less than
6 g of S seed, and ( c ) had threshing %, harvest index, or days to flower 1
outside of acceptable ranges (Rattunde et al. in press). Bidirectional
selection was practiced within each S population by choosing the top and 0
bottom 5% of plants (491 51r 54, 54 in D C, EC, NELC-I, and NELC-11, re- 2
spectively) for grain yield and for values of each selection index (Table
2). Bidirectional selection with 5% selection intensity was likewise
practiced on the NELC-S1 population.
S seed from all S plants selected for a particular criterion and 1 0
direction of selection were grown in a crossing block with each S being 1
sown in one row with 14 plants. The total number of crossing blocks for
a composite was equal to twice (high and low selection) the number of
criteria selected. Crossing blocks of selected NELC-S1 progenies were
sown with remnant S seed with approximately 28 plants representing each 1
progeny. S lines within each crossing block were intermated by pol- 1
linating all plants in a block with a bulk of pollen from all lines
within the block. A new experimental population was obtained from each
crossing block by bulking equal quantities of intermated seed from all
lines in a block.
Evaluation of Response to Selection
The intermated populations for the D C, EC, and NELC composites were 2
evaluated in separate experiments that contained 12, 16, and 25 entries,
respectively. The unselected bulk was used as one entry in NELC and as
two entries in the D2Cr and EC experiments and two adapted varieties,
WC-C75 and BJ 104, were included in the EC experiment. The D2C, EC, and
NELC experiments were conducted in 3 x 4, 4 x 4, and 5 x 5 lattice de-
signs, respectively, with four replications each. The experiment for
each composite was grown in four environments in India: at Bhavanisaqar
0 (11 N), at low fertility and at high fertility at Patancheru (17'~)~ and
at Hissar (29'~). The experiments were sown in the wet season 1986 on
29 May, 18 June, 19 June, and 8 July, respectively, in the four environ-
ments. The D C, ECr and NELC experiments were sown in the same field at 2
each environment with corresponding replicates (lst, 2nd, etc.) from each
experiment sown adjacent to each other and in random order. A plot con-
sisted of four rows each 4 m long. Distance between rows within plots
were 75 cm in all environments except Bhavanisagar where they were 50 cm
apart. Seedlings were thinned to a 10-cm spacing between plants within
the row in all environments except at Patancheru low fertility where a
20-cm spacing was used. Grain yield was measured on 3 m of each of the
four rows of a plot for the Patancheru low and high fertility environ-
ments and from the two central rows of a plot at Bhavanisagar and Hissar.
The experiments at Patancheru received 460 mm of precipitation and
no irrigation, whereas at Bhavanisagar and Hissar, the experiments were
irrigated throughout the season. The high and low fertility experiments
at Patancheru both received 17 kg ha-1 of P and they received 80 and 40
-1 kg N ha , respectively. The N was applied in split applications with
half before planting and half topdressed 18 to 25 days after sowing (DAS).
The fertilizer application at Bhavanisagar was 20 kg N, 26 kg P, and 37 kg
K ha'' before planting and topdressings of 20 kg ha-I N at 15 and 30 DAS.
Applications at Hiasar were 40 kg N and 17 kg P before planting and 20 kg
N ha-' topdressed at 20 DAS.
RESULTS
The instances when the intermated populations from upward and down-
ward mass selection were significantly different for grain yield are
summarized in Table 3. The upward mass-selected populations had signifi-
cantly higher yields than their downward selected counterparts in 17 of 80
possible composite - selection-criterion - test-environment combinations.
In three instances (i.e., DEV-Reg for EC at Bhavanisagar and DEV-Concept
for NELC-S1 at Bhavanisagar and Hissar), the population from downward
selection yielded significantly more than that from upward selection.
Response to selection was greatest at the Patancheru environments. When
averaged across criteria for mass selection, yields of upward selected
ECv NELC, and D C populations surpassed their downward selected counter- 2
parts by 635**v 312**, and 155* kg ha-I in the high fertility experiments
and by 527**, 238**, and 141x1s kg ha-I in the low fertility experiments,
respectively. At Hissar, in contrast, the yields of the upward selected
populations surpassed those of their downward selected counterparts by an
-1 average of only 134ns, 57ns, and 104ns Kg ha in ECI NELC, and D2Ct re-
spectively. Responsiveness to selection also differed greatly among com-
posites. For instance, EC, NELC, and D C had 46%, 17%, and O%, respec- 2
tively, of the comparisons between yield of upward and downward selected
populations exhibiting significant differences.
The composites, when compared at Patancheru, differed considerably
with respect to symmetry of response to upward and downward mass selection.
In EC, the responses to both directions of selection were quite
Table 3 . Instances of significant (P<0.05) grain yield differences between upward and downward selected populations from the EC, NELC, and D2C composites when tested at Bhavanisagar (BSRIr Patancheru high (PAT 1) and low fertility (PAT 2)! and Hissar (HSR)
Selectionk criterion
GYD
DEV-Concept
DEV-Reg
YC-Concept
YC-Reg
AT-Reg
BSR
Test location'
PAT 1 PAT 2
c e
a b e
a e
HSR
a~etters a, b, c, d, and e represent pairs of populations derived from NELC-I, NELC-111 NELC-S1, D2C, and EC, respectively. Positive or negative signs indicate that grain yield of the upward or downward selected populations, respectively, exceeded that of its counterpart.
b~election criteria are described in Table 2.
symmetrical, upward selection increased grain yields by 13.2% and downward
selection reduced yields by 15.8% when averaged over selection criteria
(Table 4). NELC exhibited asymmetric responses with downward selection
reducing grain yield by 14.8% and upward selection causing no yield
increase (Table 5). No trend existed for D2C able 6).
Table 4. Grain yields (kg ha-' deviations from the unselected EC bulk) of EC populations created by divergent selection upon SO plants for grain yield or multitrait indices and evaluated at four test environments
Locat ions a
Selection criterion BSR PAT 1 PAT 2 HSR
Upward selection
GYD DEV-Concept DEV-Reg YC-Concept YC-Reg AT-Reg
Downward selection
GYD DEV-Concept DEV-Reg YC-Concept YC-Reg AT-Reg
EC bulk (kg ha-l)
-selection criteria are described in Table 2.
*,**Denote significant difference from the EC bulk at the 0.05 and 0.01 levels, respectively.
-1 Table 5. � rain yields (kg ha deviations from the unselected NELC bulk) for NELC experimental populations created by divergent selec- tion upon dry season (NELC-I) or wet season (NELC-11) S spaced plants or upon S progeny means (NELC-S1) 0
1
Locat ions
Selection criterionc BSR PAT 1 PAT 2
Upward selection
GYD DEV-Concept DEV-Reg YC-Concept YC-Reg AT-Reg
Downward selection
GYD DEV-Concept DEV-Reg YC-Concept YC- Reg AT-Reg
NELC- I
NELC-I1 Upward selection
GYD ,172 129 -140 DEV-Concept ,479 -26 -351 YC-concept 151 -177 122
Downward, selection
GYD 100 -177 -335 DEV-Concept -74 -472** -529 YC-concept -124 -?84* -259
aselection criteria are described in Table 2.
BSR
*,**Denote significant deviation from the NELC bulk at the 0.05 and 0.01 levels, respectively.
Table 5. (Continued)
Locat ions
Selection criterion BSR PAT 1 PAT 2 HSR
Upxard selection
GYD DEV-Concept YC-Concept
Downward selection
GYD DEV-Concept YC-Concept
NELC bulk (kg ha-') S- (kg ha-') d
Selection Strategies
Direct selection for grain yield of spaced plants was effective in
modifying grain yield (GYD) in EC but not in NELC or D2C (Table 3 ) .
Selection for high grain yield of NELC-S1 progenies did not increase
yields but downward selection effectively reduced yields at Patancheru
(Table 5). Both upward and downward selection for GYD of EC So plants
produced yield responses that, by inspection, were more stable across
locations than were the responses obtained from any other selection
criterion (Table 4).
Multitrait indices were no more effective, on average, than select-
ing for GYD per se of S spaced plants (Table 7). There were, however, 0
significant differences of effectiveness between the several types of
Table 6. Grain yields (kg ha-I deviations from the unselected D C bulk) 2 of D2C experimental populations created by divergent selection
upon spaced-plant GYD or computed index values and evaluated at four test environments
Locations a
Selection criterion BSR PAT 1 PAT 2 HSR
Upward selection
GYD DEV-concept DEV-Reg YC-Concept YC-Reg
Downward selection
GYD DEV-Concept DEV-Reg YC-Concept YC-Reg
D2C bulk (kg ha-') S- (kg ha'l) d
-
a Selection criteria are described in Table 2,
b ~ l l deviations are nonsignificant at the 0.05 level.
indices.
Developmental-trait indices (DEv) and yield-component indices (YC)
differed in their effectiveness for sinqle-plant selection, but the dif-
ferences were specific to evaluation environment (Table 7). Selection
via DEV indices produced the greatest yield responses at Patancheru,
whereas at Bhavanisagar and Hissar, the greatest yield responses in EC
tended to be produced by the YC indices (Tables 4 and 5). However, the
Table 7. Contrasts between grain yields of experimental populations de- rived via alternative selection criteria and evaluated at four test environments
Contrast
Upward selectionU
GYD vs Index Traits (D vs YC) Methods (Con vs Reg) Traits x Methods (ConD - RegD) - (ConYC - ReqYC) AT-Reg VS (RegD and RegYC)
~ocations'
BSR PAT 1 PAT 2 HSR
Downward selection
GYD vs Index Traits (D vs YC) Methods (Con vs Reg) -e Traits x Methods (ConD - RegD) - (ConYc - RegYC) AT-Reg vs (RegD and RegYC) -e
Interaction with direction of selection
Traits x Direction -C -e C
(DH - YCH) - (DL - YCL) Methods x Direction - e (ConH - RegH) - (ConL - RegL)
a Letters a, b, c, d, and e refer to significant (Pc0.05) contrasts exhibited by NELc-I, NELC-11, NELC-S1, D2C, and EC experimental popula- tions, respectively. Negative signs denote that the initial component of the contrast yielded less than the subsequent component.
b ~ , YC, Con, Reg denote classes of selection indices based on devel- opmental traits, yield-component traits, conceptual yield-model, and regression yield-model, respectively.
C H and L denote selection for high or low index values,
respectively.
superiority of either DEV or YC indices at a particular location gen-
erally vas not expressed by both Concept and Regression indices.
The qreatest consequence of the traits chosen for selection was that
selection for high DEV index values tended to discard genotypes that con-
tributed broad adaptation, as occurred with upward selection upon the
DEV-Reg index in EC (Table 4) and the DEV-Concept index in NELC-S1
(Table 5 ) . Later maturity of.the NELC-S1 population ( 8 days later than
the NELC bulk) may have caused low yield due to end of season moisture
stress, but other factor(s) must have contributed to the low yield of
the early EC population. Downward selection for DEV index values,
however, produced either negative or nonsignificant yield responses at
all locations and, when averaged over Concept and Regression indices, did
not differ from the YC indices in effectiveness (Table 7).
Indices formed via multiple regression analyses were generally no
more effective than indices based on conceptual models of yield a able
7). Although there were siqnificant differences between the effective-
ness of Concept and Regression indices for selection in EC, these dif-
ferences were inconsistent across directions of selection and locations
of evaluation.
DISCUSSION
Mass selection Can be practiced in two ways; these beinq (1) with
high selection intensity whereby mass selection per se is used for
~o~ulation improvement and ( 2 ) with low selection,intensity whereby the
worst phenotypes are discarded before progeny tests are conducted. The
former use of mass selection was shown to be feasible since our upward
selection increased GYD of the most responsive composite by 15% and 11%
at the two Patancheru environments. Selection of phenotypically superior
S plants was generally ineffective, however, for improving GYD of other 0
composites or at sites other than that in which selection was practiced.
In contrast, identifying the phenotypically inferior plants would enable
discardinq genotypes that contribute to lower GYD in two of our three
composites. It was also shown that culling the worst phenotypes would
not reduce the populations' adaptation to sites distant from the site of
selection.
Among the mass selection strategies examined in this study, the
choice of either yield components (YC) or developmental traits (DEV) to
use as selection criteria was critical for effective selection. Our re-
sults suggest that when breeding for local adaptation, selection upon DEV
traits should be emphasized, whereas when breeding for broad adaptation,
selection for grain yield (GYD) per se or YC traits should be emphasized.
Thurling (1974) also found that DEV traits were more efficient than YC
traits for predicting seed yields of turnip rape (~rassica campestris L.
Ssp. Oleifera Metzg.) at a single location. Likewise, Byth et al. (1969)~
when using multilocational data to predict GYD of soybean genotypes
(Glycine found that more weight was given to GYD per se, whereas
when single location data were used, relatively greater weight was given
to secondary yield characteristics.
In our study, the effectiveness of selection based upon DEV or YC
traits generally differed only in degree of success at the Patancheru
sites. Also, DEV and YC indices tended to select common S plants. For 0
example, upward selection based upon the DEV- and YC-concept indices
identified 6 of 51 EC So plants and 18 of 54 NELC-I So ~lants in common.
These results sugqest that GYD may be increased by several different
approaches.
We found that selection indices constructed via multiple regression
analyses were no more effective for improving grain yield of pearl millet
than were the Concept indices. We originally hypothesized that the S -S 0 1
regression method would be better than the intuitive approach to index
construction because (1) it relies on the covariance between S -plant 0
traits and S GYD, which is basically a genetic covariance, and (2) by 1
comparing regression R-square values, it should be possible to identify
sets of traits that best predict genetic differences for yield. The
R-squares of the "bestw reqressions were low, however, usually being less
than 0.20 (Table 2). The lack of S -plant traits that have strong co- o variance with GYD of S1 progenies, therefore, seriously limited the ef-
fectiveness of the regression method of index formation. Use of quad-
ratic variables did not increase the effectiveness of the regression
indices. Therefore, single-plant selection for yield should be limited
to selection upon GYD per se or upon traits that, via biological intui-
tion, are expected to contribute to GYD.
The success of selection differed more among the pearl millet com-
posites than it did among the selection criteria. Differences of selec-
tion efficiency among composites may be due to (a) confounding effects
of environmental factors on genetic differences and/or (b) differences
of genetic variability for grain yield among the composites. The fact
that (1) selection of NELC in three different environments produced simi-
lar yield responses and (2) yield responses were larger in EC than in
NELC or D C in all four evaluation environments, suggests that confound- 2
ing effects of environmental factors were not the primary cause for dif-
ferences of selection efficiency among composites. The genetic compo-
nents of variance for grain yield were 21 + 3, 18 k 5, and 17 k 2 (Mg
ha-' x lo-*) for EC, NELC-I, and D C S populations, respectively. These 2 1
variance components were not significantly different.
The location at which the recombined populations were evaluated was
another major factor that determined the frequency of significant re-
sponses to selection. The ineffectiveness of mass selecting at one lo-
cation for increased yield at other locations is a major concern for an
international research center with a regional mandate, and increasingly,
for commercial seed firms that breed for broadly adapted varieties
(~radley et al., 1988). Lonnquist et al. (1979) designed a plan whereby
mass selection could be used to breed for broad adaptability by simul-
taneously selecting in several locations on subsamples of one seed lot,
intermating lines selected at all locations, and repeating the procedure.
Of course, where broad adaptation is important and multilocation selec-
tion is not possible, selection of single plants should be restricted
to those traits that show good correlation between the selection
environment and the target environments.
In summaryr mass selection for grain yield of pearl millet can be
effective. The choice of traits to use as selection criteria for in-
creasing GYD is critical. If selection traits are chosen incorrectly
and selection intensity is too high, yield may be decreased. If selec-
tion indices are used, they should be kept simple. Success of selection
depended more upon the pearl millet composite chosen for improvement than
upon the selection criteria employed. Research on methods of assessing
and enhancing genetic variability of millet populations, therefore,
should receive higher priority than study of alternative selection tech-
niques. That success of selection was dependent upon the location in
which resultant populations were evaluated suggests (1) the need to
identify the plant characteristics responsible for adaptation at each
location and (2) that mass selection for increased GYD should be prac-
ticed primarily for local adaptation.
REFERENCES
Ape11 P. 1984. Photosynthesis and assimilate partitioning in relation to plant breeding. p. 163-184. In P. B. Vase and S. G. Blixt (eds.) Crop breeding: A contemporary basis. A. Wheaton & Co. Ltd. , Exeter, Great Britain.
Baker, R. J. 1986. Selection indices in plant breeding. CRC Press, Inc., Boca Raton, Florida.
Bradley, J. P., K. H. Knittle, and A. F. Troyer. 1988. Statistical methods in seed corn product selection. J. Prod. Agr. 1:34-38.
Burton, Glenn W. and Jerrel B. Powell. 1968. Pearl millet breeding and cytogenetics. Adv. Agron. 20:50-89.
Byth, D. E., B. E. Caldwell, and C. R. Weber. 1969. Specific and non- specific index selection in soybeans, Glycine max L. (Merrill). Crop Sci. 9:702-705.
Falconer, D. S. 1952. The problem of environment and selection. Am. Nat. 86:293-298.
Frane, James. 1981. All possible subsets regression. p. 264-277. n W. J. Dixon (ed.) BMDP statistical software 1981. University of California Press, Berkeley, California.
Frey, K. J. and T. R. Huang. 1969. Relation of seed weight to grain yields in oats, Avena sativa L. Euphytica 18:417-424.
~rafius, J. E. 1956. Components of yield in oats: A geometrical interpretation. Agron. J. 48:419-423.
Gupta, V. P. and D. S. Athwal. 1966. Genetic variability, correlation and selection indices of grain characters in pearl millet. J. Res. Punjab Agr. Univ. 3(2):111-117.
Hallauer, A. R. and J. B. Miranda. 1981. Quantitative genetics in maize breeding. Iowa State University Press, Ames, Iowa.
ICRISAT. 1986. Annual report 1985. International Crops Research In- stitute for the Semi-Arid Tropics, Patancheru, India.
Lonnquist, J. H., W. A. Compton, J. L. Geadelmann, F. A. Loeffel, Boyd Shank, and A. F. Troyer. 1979. Convergent-divergent selection for area improvement in maize. Crop Sci. 19:602-604.
Kempthorne, 0. and A. W. Nordskog. 1959. Restricted selection indices. Biometrics 15:lO-19.
Mahadevappa, M. and B.W.X. Ponnaiya. 1967. Discriminant functions in selection of pearl millet (Pennisetum typhoides Staph. 6 Hubb.) populations for grain yield. Madras Agr. J. 54:211-222.
Phul, P. S., S. K. Gupta, and K. S. Gill. 1974. Association analysis of some morphological and physiological traits in pearl millet. Indian J. Genet. Plant Breeding 34:346-352.
Rattunde, H. F., Pheru Singh, and J. R. Witcombe. (In press). Feasi- bility of mass selecting for 19 pearl millet traits. Crop Sci.
Singh, Daljit and M. Ahluwalia. 1970. Multiple regression analysis of grain yield in pearl millet. Indian J. Genet. Plant Breeding 30: 584-589.
Singh, P., K. N. Rai, J. R. Witcombe, and D. J. Andrews. (In press). In Progress in plant breeding, 11. Butterworths, London. -
Smith, 0. S., A. R. Hallauer, and W. A. Russell. 1981. Use of index selection in recurrent selection programs in maize. Euphytica 30: 611-618.
Takeda, K. and K. J. Frey. 1976. Contributions of vegetative growth rate and harvest index to grain yield of progenies from Avena sativa x A. sterilis crosses. Crop Sci. 16:817-821. -
Thurling, N. 1974. An evaluation of index method of selection for high yield in turnip rape, Brassica campestris L. ssp. oleifera Metzg. Euphytica 23:321-331.
GENERAL CONCLUSIONS AND DISCUSSION
Results from the three sections of this dissertation have important
implications on genetic improvement of pearl millet via mass selection.
Trait heritability values reported in Section I predict the effectiveness
of mass selection for improving various traits of pearl millet. The de-
Scription of interrelationships among plant traits, presented in Section
11, shows whether selection for one trait will cause changes in other
traits of pearl millet. The ability to change yield via mass selection
for several criteria was evaluated in Section 111.
Section I concluded that mass selection can be effective for improv-
ing 19 morphological and physiological traits of pearl millet. Nearly all
heritability estimates were significantly greater than zero. The heri-
tability values indicated that responses to mass selection would be qreat-
est for panicle size and seed traits, intermediate for plant productivity
traits, and least for dry-matter partitioning traits. Mass selection
should be effective with either high or low selection intensity because
selection for either high or low values of S plant traits caused signifi- 0
cant changes of S progenies for most traits. 1
Factor analyses, presented in Section 11, showed that unique sets of
traits were related to biological yield, panicle size, seed parameters,
and panicle partitioning axes of multitrait variation. These results
indicate that changes in one axis could occur independent of changes
in the other axes. The biological yield and the dry-matter partitioning
axes, however, did share certain plant traits so altering one of these
axes likely would change the other. This interrelationship was confirmed
by the negative regressions of s biological yield on s partitioning 1 0
factor-scores. Traits associated with the biological yield axes differed
when Pearl millet was sown with wide or narrow spacing between plants.
It was concluded, however, that variation for the biological yield,
panicle size, and seed parameter axes was heritable across generations.
That mass selection can be effective in increasing grain yield (GYD)
of pearl millet was predicted by (a) the significant heritability values
for GYD (Section I) and (b) the significant regressions of S1 GYD on S 0
factor-scores (Section 11). Realized gains for GYD that can be obtained
via mass selection were determined by conducting bidirectional selection
for diverse selection criteria (Section 111). In Section 111, it was
shown that GYD of pearl millet could be modified by mass selection but
that the frequency of success differed greatly among composites and be-
tween locations of evaluation. Mass selecting for GYD per se was equally
as effective as selecting for multitrait indices, and multitrait indices
based on regression analyses were not more effective than those based on
intuition.
The plant trait(s) chosen for selection affected the response obtained
for GYD. Selection for developmental traits produced the largest GYD re-
sponses when the resulting populations were evaluated at the site of
selection. In contrast, selection upon GYD per se or upon yield component
indices gave the largest GYD responses when the populations were evaluated
at remote sites. Highly intense selection for GYD qave millet populations
with good local adaptation but inconsistent adaptation to locations
distant from where selection occurred.
The three pearl millet composites differed for magnitudes of
(a) heritability values for productivity traits and (b) responses of
GYD to selection. The low heritability value for GYD in D C and the lack 2
of GYD response to selection in this composite could be due to (a) D2C
having a narrow genetic base and/or (b) pleiotropic effects of its dwarf-
ing gene(s) on biological yield and GYD. Selection for GYD was very ef-
fective in EC and of intermediate effectiveness in NELC. That the com-
posites' differences for magnitude of GYD response to selection were con-
sistent over evaluation environments suqgests that the composites differ
in their magnitudes of genetic variability for GYD. Because GYD response
to selection differed more between composites than between techniques of
selection, a higher priority should be given to developing highly variable
base populations than to study of different criteria of selection.
GYD of pearl millet was associated with both biological yield and
partitioning efficiency but biological yield predicted GYD better than
did partitioning efficiency (Section 11). Since biological yield is a
product of growth rate and growth duration (Takeda and Frey, 19761, and
Since prolonging growth duration is generally not desirable for pearl
millet production, enhancing genetic variations for growth rate should
be a good route to increase GYD of pearl millet. Bramel-Cox et al. (1986)
have shown that a large reservoir of genes for increased qrowth rate of
pearl millet exist in primitive landraces and weedy and wild relativys
and that these genes, when introgressed into cultivated millet germplasm,
are effective.
Selection for increased GYD was most successful when experimental
populations were evaluated at the location where selection occurred. This
shows that mass selection is useful when breeding for local adaptation.
The fact that GYD responses to selection differed among locations of
evaluation suggests that contrasting plant characteristics contributed to
yield of grain at the different test sites. For example, high biological
productivity and efficient partitioning of dry matter were associated
with high GYD at Patancheru (Section 11), whereas at Rajasthan, high
tillering capacity and early seeding vigor were related to high GYD of
pearl millet (Saxena et al., 1978).
The results of this dissertation are pertinent to designing efficient
mass selection strategies for pearl millet improvement because they in-
volved (1) examination of a wide array of traits important to adaptation
of pearl millet, ( 2 ) evaluation of three phenotypically diverse pearl
millet populations of contemporary use in millet breeding, (3) determina-
tion of both predicted and realized responses to selection, and ( 4 ) evalua-
tion of genotypic performance over several locations and in both spaced-
plant and normal-density stands. Further research is needed on ( 2 ) esti-
mating trait heritability values over several locations, (b) conducting
factor analysis on matrices of genetic rather than phenotypic correlations,
(c) practicing additional cycles of selection, and (d) evaluating
responses to selection in more than one year.
ADDITIONAL REFERENCES CITED
Ahluwalia, M. and K. Shankar. 1962. For better results with Improved Ghana. Indian Farming 12:8.
Ahluwalia, M. and S. Vital Rao. 1964. Pusa Moti bajra shows better adaptability in Andhra Pradesh. Andhra Agr. J. 11:160-161.
Athwal, D. S. 1962. Bajra cultivation. Agr. Inf. Serv. Ext. Bull. 1. Ludhiana, Punjab, India.
Athwal, D. S. and R. C. Luthra. 1964. S.530 - the bristled bajra that baffles birds. Indian Farming 14:14-40.
Bajaj, R. R. and P. S. Phul. 1982. Inheritance of harvest index and span of maturity in pearl millet. Indian J. Agr. Sci. 523285-288.
Baker, R. J. 1986. Selection indices in plant breeding. CRC Press, Inc., Boca Raton, Florida.
Begg, J. E. 1965. The growth and development of a crop of bulrush millet. J. Agr. Sci. 65:341-349. \
Beggt J. E. and G. W. Burton. 1971. Comparative study of five genotypes of pearl millet under a range of photoperiods and temperatures. Crop Sci. 11:803-805.
Bramel-Cox, P. J., D. J. Andrews, and K. J. Frey. 1986. Exotic germ- plasm for improving grain yield and growth rate in pearl millet. Crop Sci. 26:687-690.
Bramel-Cox, P. J., D. J. Andrews, and K. J. Frey. 1987. Trait associa- tions in introgressed populations of pearl millet. Plant Breeding 98: 17-24.
Brunken, Jere, J.M.J. DeWet, and J. R. Harlan. 1977. The morphology and domestication of pearl millet. Economic Botany 31:163-174.
Burton, G. W. 1951. Quantitative inheritance in pearl millet (Pennisetum glaucum). Agron. J. 43:409-417.
Burton, G. W. 1959. Breeding methods for pearl millet (Pennisetum glaucum) indicated by genetic variance components studies. Agron. J. 51479-481.
Burton, G. W. 1968. Heterosis and heterozyosis in pearl millet forage production. Crop Sci. 8:229-230.
Burton, G. W. and J. B. Powell. 1968. Pearl millet breeding and cytogenetics. Adv. Agron. 20:50-89.
Carberry, P. S., L. C. Campbell, and F. R. Bidinger. 1985. Growth and development of pearl millet as affected by plant population. Field Crops Res. 11:193-205.
Chandhanamutta, P. and K. J. Frey. 1973. Indirect mass selection for grain yield in oat populations. Crop Sci. 13:470-473.
Cortez-Mendoza, H. and A. R. Hallauer. 1979. Divergent mass selection for ear length in maize. Crop Sci. 19:173-178.
Falconer, D. S. 1952. The problem of environment and selection. Am. Nat. 86:293-298.
Falconer, D. S. 1981. Introduction to quantitative genetics. Longman, New York.
Fussell, L. K. and C. J. Pearson. 1980. Effects of grain development and thermal history on grain maturation and seed vigour of Pennisetum americanum. J. Exp. Bot. 31:635-643.
Gardner, C. 0. 1961. An evaluation of effects of mass selection and seed irradiation with thermal neutrons on yield of corn. Crop Sci. 1:241-245.
Gregory, P. J. and G. R. Squire. 1979. Irrigation effects on roots and shoots of pearl millet (Pennisetum typhoides). Exp. Agr. 15:161-168.
Gupta, S. P. and T. H. Singh. 1971. Genetic analysis of grain yield and its components in pearl millet (Pennisetum typhoides (Burm. F. Stap S C. E. Hubb.). Indian J. Agr. Sci. 41:324-328.
Gupta, V. P. and D. S. Athwal. 1966. Genetic variability, correlation and selection indices of grain characters in pearl millet. J. Res. Punjab Agr. Univ. 3(2):111-117.
Guptak, V. P. and G. S. Nanda. 1971. Role of grain, plant and head char- acters in improving grain yield of pearl millet. Indian J. Genet. P1. Br. 31(1):128-131.
Gupta, V. P. and T. P. Singh. 1973. Combining ability for grain yield and its components in pearl millet. Indian J. Genet. P1. Br. 33: 183-188.
Hallauer, A. R. and J. B. Miranda. 1981. Quantitative genetics in maize breeding. Iowa State University Press, Ames, Iowa.
Hallauer, A. R. and J. H. Sears. 1969. Mass selection for yield in two varieties of maize. Crop Sci. 9:47-50.
Jain, S. K., M. Ahluwalia, K. Shankar, and A. B. Joshi. 1961. A diallel cross study of combining ability for some quantitative characters in pearl millet. I. Length and girth of spike. Indian J. Genet. PI. Br. 21:175-184.
Jindla, L. N. and Khem Singh Gill. 1984. Inter-relationship of yield and its component characters in pearl millet. Crop Improvement 11(1):43-46.
Joshi, A. B., M. Ahluwalia, and K. Shankar. 1961. 'Improved Ghana1 is a better bajra. Indian Farming 11:12.
Kapoor, R. L., H. P. Yadav, P. Singh, I. S. Chariwal, and B. N. Dahiya. 1982. Genetics of harvest index, grain yield and biological yield of pearl millet. Indian J. Agr. Sci. 52:630-633.
Kassam, A. H. and J. M. Kowal. 1975. Water use, enerqy balance and growth of Gero millet at Samaru, Northern Nigeria. Aqr. Meteor. 15:333-342.
Khadr, F. H. 1977. Recurrent selection in pearl millet Pennisetum typhoides in Northern Nigeria. 2 . Pflanzen. 79:145-153.
Khadr, F. H. and A. K. Oyinloye. 1978. Mass selection for grain yield and seed size in pearl millet, Pennisetum typhoides. Alexandria J. Agr. Res. 26:79-84.
Krishnaswamy, N. 1962. Bajra (Pennisetum typhoides S d H). Indian Council of Agr. Res., New Delhi, India.
Lal, S. and D. Singh. 1970. Heritability, genetic advance and minimum number of genes in pearl millet. Indian J. Genet. P1. Br. 30:315- 321.
Lonnquist, J. H. 1964. Modification of ear-to-row procedure for the improvement of maize populations. Crop Sci. 4:227-228.
Lonnquist, J. H. 1967. Mass selection for prolificacy in maize. Zuchter 37:185-188.
Mahadevappa, M. and B.W.X. Ponnaiya. 1967. Discriminant functions in selection of pearl millet (Pennisetum typhoides Staph. b Hubb.) populations for grain yield. Madras Agr. J. 54:211-222.
Norman, M. J.T., C. J. Pearson, and P.G.E. Searle. 1984. The ecology of tropical food crops. Cambridge University Press, Cambridge.
Nwasike, C. C., R. B. Thokare, B. A. Oyejola, and S. 0. Okiror. 1983. Genotypic and phenotypic variances and correlations in pearl millet (Pennisetum typhoides (Burm.) Staph and C. E. Hubb.). Z. Pflanzen. 90:259-264.
Pearson, C. J. 1985. Research and development for yield of pearl millet. Field Crops Res. 11:113-121.
Phul, P. S., S. K. Gupta, and K. S. Gill. 1974. Association analysis of some morphological and physiological traits in pearl millet. Indian J. Genet. PI. Br. 34:346-352.
Pokhriyal, S. C., K. S. Mangath, and L. K. Gangal. 1967. Genetic vari- ability and correlation studies in pearl millet (Pennisetum typhoides (Burm. F.) Staph and C. E. Hubb.). Indian J. Agr. Sci. 37(1):77-82.
Rachie, K. 0. and J. V. Majmudar. 1980. Pearl millet. The Pennsylvania State University, University Park, Pennsylvania.
Raymond, C. 1968. Pour une meilleure connaissance de la croissance et du developpement des mils Pennisetum. L'Agronomie Tropical 23:844- 863.
Sachdeva, A. K., F. Singh, and K. S. Dhindsa. 1982. Genetic analysis of grian yield and some quality traits in pearl millet. 2 . Pflanzen. 88 : 61-68.
Sandhu, S. S., P. S. Phul, and K. S. Gill. 1980. Analysis of genetic variability in a synthetic population of pearl millet. Crop Improve- ment 7:l-8.
Sangha, A. S. and B. V. Singh. 1973. Genetic variability and correlation studies of morphological characters in Pennisetum typhoides Staph. and Hubb. Madras Agr. J. 60:1258-1265.
Saxena, M.B.L., G. V. Shubba Rao, G. K. Gupta, and R. C. Verma. 1978. Bajra germplasm of arid areas of Rajasthan. Indian J. Genet. PI. Br. 38:390-395.
Shankar, K.1 M. Ahluwalia, and S. K. Jain. 1963. The use of selection indices in the improvement of a pearl millet population. Indian J. Genet. PI. Br. 23:30-33.
Singhr B. B. 1974. Expected and realized response to selection in bi- parental and selfed populations of pearl millet. Indian J. Genet. PI. Br. 34:405-410.
Singh, D. and M. Ahluwalia. 1970. Multiple regression analysis of grain yield in pearl millet. Indian J. Genet. PI. Br. 30:584-589.
Singh, Y. P., S. Kumar, and B.P.S. Chauhan. 1980. Path coefficient analysis of grain yield in pearl millet (Pennisetum americanum 0 Leeke). Madras Agr. J. 67(4):214-219.
Smith, H. F. 1936. A discriminant function for plant selection. Ann. Eugen. London 7:240-250.
Smith, 0. S., A. R. Hallauer, and W. A. Russell. 1981. Use of index selection in recurrent selection programs in maize. Euphytica 30: 611-618.
Sprague, G. F., P. A. Miller, and B. Brimhall. 1952. Additional studies of the relative effectiveness of two systems of selection for oil content of the corn kernel. Agron. J. 44:329-331.
Suwantaradon, K., S. A. Eberhart, J. J. Mock, J. C. Owens, and W. D. Guthrie. 1975. Index selection for several agronomic traits in the BSSS2 maize population. Crop Sci. 15:827-833.
Takeda, K. and K. J. Frey. 1976. Contributions of vegetative growth rate and harvest index to grain yield of progenies from Avena sativa x A . sterilis crosses. Crop Sci. 16:817-821.
Torregroza, M. and D. D. Harpstead. 1967. Effects of mass selection for ears per plant in maize. Agron. Abstr. 1967:20.
Tostain, S., M. F. Riandey, and L. Marchais. 1987. Enzyme diversity in pearl millet (Pennisetum glaucum. I. West Africa. Theor. ~ppl. Genet. 74:188-193.
Troyer, A. F. and W. L. Brown. 1976. Selection for early flowering in corn: Seven late synthetics. Crop Sci. 16:767-772.
Tyagi, C. S., S. Lal, and R. R. Karwasra. 1982. Genetic analysis of some quantitative characters in pearl millet. Indian J. Agr. Sci. 52:215- 219.
Vera, G. A. and P. L. Crane. 1970. Effects of selection for lower ear height in synthetic populations of maize. Crop Sci. 10:286-288.
Virk, D. S., N. B. Singh, B. Srivastava, and G. Harinarayana. 1984. Regression analysis for general adaptation in pearl millet using different environmental indices. Theor. Appl. Genet. 68:509-513.
Williams, J. S. 1962. The evaluation of a se-lection index. Bio- metrics 18:375-393.
Zuber, M. S., M. L. Fairchild, A. J. Keaster, V. L. Fergason, G. F. Krause, E. Hilderbrand, and P. J. Loesch, Jr. 1971. Evaluation of 10 generations of mass selection for corn earworm resistance. Crop Sci. 11:16-18.
like to thank Dr. John Hitcombe, my advisor in India, for
providing ideas and support that were critical to the success of this
work. I also thank Dr. Pheru Singh who, as colleague and friend, shared
his insights and enthusiasm for breeding pearl millet and generously pro-
vided land and labor for my research. My thanks also go to Dr. Fran
Bidinger for his help. The immense amount of field work could not have
been managed without my field assistant, Mr. Md. Yousuf. His hard work
and his help in supervising the large labor force were invaluable.
I acknoweldge the ICRISAT Training Program for providing the Research
Fellowship that made this research possible. I am grateful to Dr. Dallas
Oswalt, Chief Training Officer, for his interest in my research and for
his commitment to the training and research activities that are so im-
portant to agricultural development in the third world.
Dr. Kenneth J. Frey, my major professor, gave me tremendous support
'both during my time in Iowa and in his several trips to India. I greatly
appreciate his efforts and patience in helping me to develop my research
and writing skills. I also thank the members of my committee for review-
ing my research and discussing the contents of this dissertation. I
thank Dr. Paul Hinz for his help in understanding and applying multivari-
ate statistical analyses.
My thanks also go to Ina Couture for typing this dissertation in a
timely and always cheerful manner. I also thank Jean and Dean Prestemon
for opening their home to me and providing friendship and encouragement

during the last weeks of writing this dissertation.
I thank my dear friend Eva Weltzien for her wonderful companionship
and encouragement. Her optimism and dedication to improving agricultural
productivity and sustainability has nourished my hope of applying myself
in a like manner. I also give heartfelt thanks to my family for their
love and constant support over the many years of this study and to my
mother for visiting me in India and bringing me her love in person.
I want to give a big thank you to the many friends, colleagues, and
laborers not yet mentioned but whose efforts and interest were so im-
portant to this work. I will strive to pass your kindness on.
A P P E N D I X
Table Al. Abbreviations of traits presented in Appendix tables and their units of measure in SO and S1 populations
Units
So 1.
Abbre- viation Trait
4 plant-'
g plant-' -1
g plant
g plant-' daym1
Mq ha"
Mg ha-'
Mg ha-'
g m-2 day-'
BM
GYD
SYD
GI
DFL
HI
RR
TH%
HG T
LFW
TS
TNO
SNP
SDW
PS A
PLN
PGR
C S
C F
DPT
Biomass
Grain yield
Straw yield
Growth index
Days to flower
Harvest index
Reproductive ratio
Threshing percent
Plant height
Leaf width
days days
Tiller synchrony days
Tiller number
Seed number per panicle
Hcndred-seed weight
Panicle surface area
Panicle length cm
cm
1 to 9 -1
g plant
cm
Panicle girth
Panicle compactness
Depressed panicle thickness
DPT as percent of panicle diameter
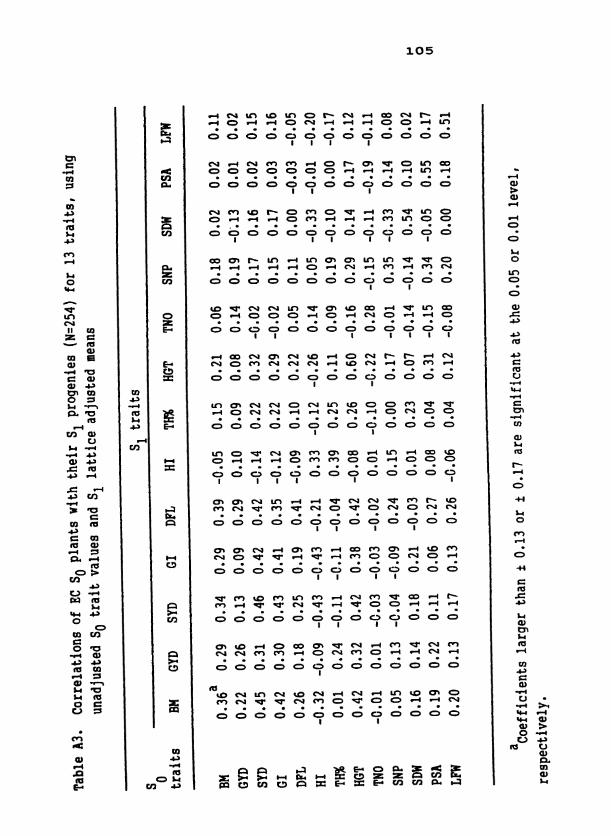
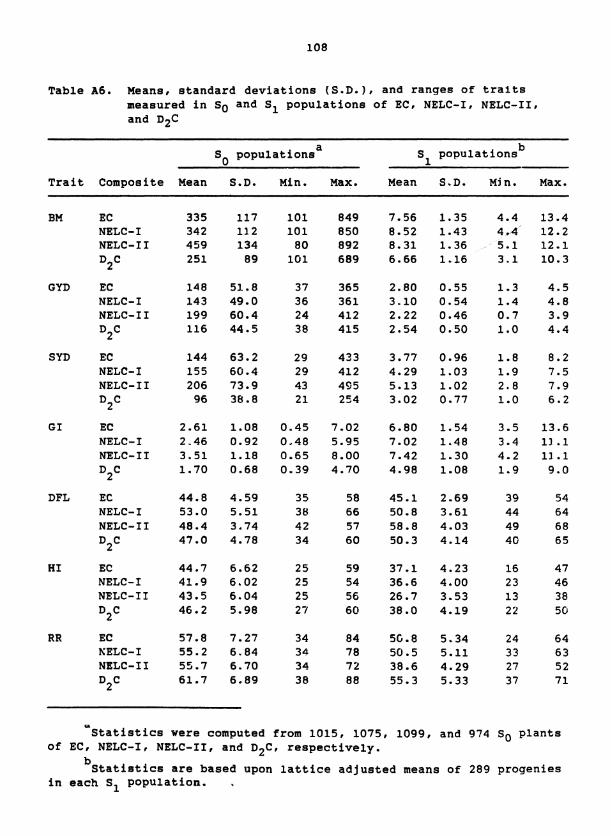
Table A 6 . Means, standard deviations (S.D.), and ranges of tralts measured in So and S1 populations of EC, NELC-I, NELC-11, and D2C
a S populations S populations
b 0 1
Trait Composite Mean S.D. Min. Max. Mean S.D. Mjn. Max.
EM EC NELC-I NELC-I1
D2C
GYD EC NELC-I NELC-I I
D2C
SYD EC NELC-I NELC- I I
D2C
GI EC NELC- I NELC- I I
D ~ C
DFL EC NELC- I NELC-I1
D2C
HI EC NELC- I NELC- I I
D2C
RR EC ITELC-I NELC-I1
D2C
u~tatistics were computed from 1015, 1075, 1099, and 974 SO Plants of EC, NELC-I, NELC-11, and D2C, respectively.
bStatistics are based upon lattice adjusted means of 289 progenies in each S1 population.
Table A6. (Continued)
So populations S1 populations
Trait Composite Mean S.D. Min. Max. Mean S.D. Min. Max.
TH%
HGT
LFW
TS
TNO
SNP
SD W
PSA
EC NELC-I NELC-I I
D2C
EC NELC- I NELC- I I
D2C
EC NELC- I NELC-I1
D2C
EC NELC-I NELC-I I
D2C
EC NELC-I NELC- I I
D2C
EC NELC-I NELC-I I
D2C
EC NELC - I NELC-I1
D2
EC NELC-I NELC-I1
D2C
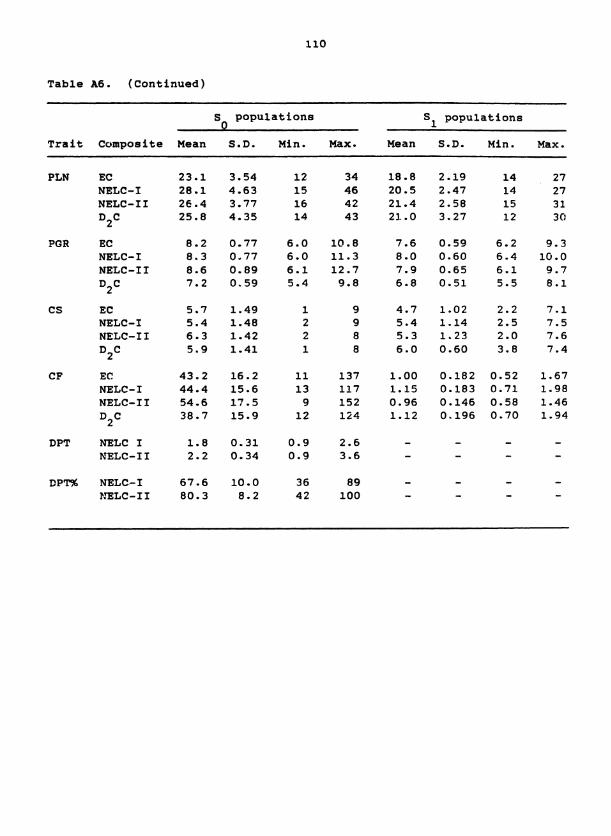
Table A 6 . (Continued)
S populations S populations 1
Trait Composite Mean S.D. Min. Max. Mean S.D. Min. Max.
PLN EC NELC-I NELC- I I
D2C
PGR EC NELC-I NELC-I1
D2C
CS EC NELC- I NELC-I I
D2C
CF EC! NELC-I NELC-I1 D C
2
DPT NELC I NELC- I I
EPT% NELC-I NELC-I1