Embed Size (px)
Citation preview
Elucidation of defence response
mechanisms in pearl millet
by
Bridget Genevieve Crampton
Submitted in partial fulfilment of the requirements for the degree
PHILOSOPHIAE DOCTOR
Department of Botany
in the Faculty of Natural and Agricultural Sciences
University of Pretoria
Pretoria
September 2006
Supervisor: Prof. D.K. Berger
©© UUnniivveerrssiittyy ooff PPrreettoorriiaa

Declaration
I, the undersigned hereby declare that the thesis submitted herewith for the
degree Philosophiae Doctor to the University of Pretoria, contains my own
independent work and hitherto has not been submitted for any degree at any
university or faculty.
BG Crampton
September 2006
Summary Thesis title: Elucidation of defence response mechanisms in pearl millet Student: Bridget Genevieve Crampton Supervisor: Professor D.K. Berger Department: Botany Degree: PhD Studies were undertaken to elucidate defence response mechanisms in pearl
millet, a non-model cereal crop. This was accomplished through the
construction and characterisation of a pearl millet defence response cDNA
library, which was subsequently utilised in large scale gene expression
studies to profile pearl millet’s response to the defence signalling compounds
nitric oxide (NO), methyl jasmonate (MeJA) and salicylic acid (SA), and to the
rust Puccinia substriata var. indica.
A pearl millet cDNA library was constructed by treating pearl millet plants with
the defence elicitors chitin and flagellin, and by wounding the plants.
Suppression subtractive hybridisation (SSH) was employed to enrich the
library for defence response transcripts. The SSH library was characterised
using a quantitative cDNA microarray-based screening method that enabled
identification of false positive transcripts and clones that represented rare or
abundant transcripts. Based on this screening method, clones were selected
for sequence analysis, which identified genes known to play important roles in
defence response.
The pearl millet SSH defence response library was arrayed onto a glass slide
and used in transcript profiling studies to examine pearl millet’s response to
the defence signalling molecules NO, MeJA and SA. Whilst only 45 cDNAs
responded significantly to NO treatment, 279 and 224 cDNAs responded to
MeJA and SA sprays, respectively. Closer examination of MeJA and SA
responsive genes revealed that many of the induced transcripts were common
to both signalling pathways, demonstrating that a substantial network of
regulatory interactions exists between the salicylate and jasmonate pathways.
Transcript profiling of a susceptible pearl millet line in response to virulent rust
infection revealed that genes common to both the jasmonate and salicylate

pathways were induced. However, pathology studies indicated that
pretreatment of pearl millet with SA conferred resistance to a virulent isolate of
rust, whereas MeJA application did not significantly reduce subsequent
infection levels. In view of these pathology results, it is probably genes that
are significantly induced in response to SA that actually confer resistance to
avirulent rust isolates.
i
TABLE OF CONTENTS ACKNOWLEDGEMENTS..................................................................................... ii PREFACE ............................................................................................................ iii ABSTRACT.......................................................................................................... iv ABBREVIATIONS................................................................................................ vi CHAPTER ONE Literature review Overview of plant defence response mechanisms...............................................1 1.1 Introduction ................................................................................................1 1.2 Pearl millet .................................................................................................2 1.3 Pearl millet diseases ..................................................................................4 1.4 Pathogen recognition by plant cells ...........................................................6 1.5 Plant defence signalling networks ...........................................................15 1.6 Biochemistry of plant defence responses................................................30 1.7 DNA microarrays: tools for studying global gene expression changes during plant defence response..................................................38 1.8 Aims of the project ...................................................................................45 1.9 Literature cited .........................................................................................47 CHAPTER TWO Construction and characterisation of a pearl millet defence response cDNA library ..................................................................................................................58 2.1 Abstract ....................................................................................................58 2.2 Introduction ..............................................................................................59 2.3 Materials and methods.............................................................................63 2.4 Results and discussion ............................................................................73 2.5 Literature cited .........................................................................................99 CHAPTER THREE Nitric oxide mediated transcriptional changes in pearl millet ...........................103 3.1 Abstract ..................................................................................................103 3.2 Introduction ............................................................................................103 3.3 Materials and methods...........................................................................106 3.4 Results and discussion ..........................................................................112 3.5 Literature cited .......................................................................................124 CHAPTER FOUR Evaluation of pearl millet defence signalling pathways involved in leaf rust (Puccinia substriata) resistance and perception........................................127 4.1 Abstract ..................................................................................................127 4.2 Introduction ............................................................................................128 4.3 Materials and methods...........................................................................129 4.4 Results and discussion ..........................................................................132 4.5 Literature cited .......................................................................................152 CHAPTER 5 CONCLUDING REMARKS AND FUTURE PROSPECTS...............................156

ii
ACKNOWLEDGEMENTS I would like to express my sincere thanks to the following people and
organisations for helping to make this thesis a reality:
My supervisor, Prof. Dave Berger, for his advice, enthusiasm and input into
my PhD, and supervision over the past five years;
Dr Fourie Joubert and Danie Theron for their willing assistance with
microarray data analyses;
Lufuno Petrus Ngomani for help with sequencing pearl millet clones and
performing subsequent GenBank homology searches;
CSIR Biosciences for affording me the time and opportunity to complete my
studies whilst in their employment, and for funding the project for four
consecutive years;
The African Centre for Gene Technologies for project financial support over a
four year period;
My fellow students from the “fruit salad” lab for helpful discussions and
technical advice;
My work colleagues at CSIR Biosciences for technical assistance and
continuous encouragement;
My parents, Gayle and Ernie Campbell, for always believing in my capabilities
and inspiring me to follow my dreams; and
My husband Michael for his love, open mindedness and emotional support
throughout the duration of my studies.
iii
PREFACE
This thesis presents a collection of studies conducted over five years that deal
with molecular based investigations into defence response mechanisms in the
non-model crop plant pearl millet. The thesis is presented as a compilation of
five chapters, with each chapter being introduced separately. All studies were
conducted independently and have been written as separate publishable
units. Thus, some repetition between parts of chapters, which contain a
progression of knowledge accumulated over a period of time, has been
unavoidable.
CHAPTER 1: Literature review – overview of plant defence response
mechanisms.
CHAPTER 2: Construction and characterisation of a pearl millet
defence response cDNA library.
CHAPTER 3: Nitric oxide mediated transcriptional changes in pearl
millet.
CHAPTER 4: Evaluation of pearl millet defence signalling pathways involved in leaf rust (Puccinia substriata) resistance and perception. CHAPTER 5: Concluding remarks and future prospects. Excerpts from Chapter 2 have appeared in the publications listed below. Berger, D. K., B. Crampton, I. Hein, and W. Vos. 2006. Screening cDNA libraries on glass slide microarrays, In: J. M. Walker (ed.), DNA Arrays. Humana Press, Totowa, New Jersey, USA.
Van den Berg, N., B. G. Crampton, I. Hein, P. R. J. Birch, and D. K. Berger. 2004. High-throughput screening of suppression subtractive hybridization cDNA libraries using DNA microarray analysis. Biotechniques 37:818-824.
Chapters 3 and 4 have been written up as publishable units and will be shortly
submitted to international peer reviewed journals for publication.
iv
ABSTRACT
Pearl millet is a staple food source for millions of African families living in
semi-arid regions of the continent. Yet, despite its importance and ability to
provide consistent yields, very little research and resources have been
directed towards understanding mechanisms governing this crop’s resilience
to biotic and abiotic stresses. The research outlined in this thesis therefore
aimed to elucidate defence response mechanisms in pearl millet, a non-model
cereal crop. This was accomplished through the construction and
characterisation of a pearl millet defence response cDNA library, which was
subsequently utilised in large scale gene expression studies to profile pearl
millet’s response to the defence signalling compounds nitric oxide (NO),
methyl jasmonate (MeJA) and salicylic acid (SA), and to the biotrophic rust
fungus Puccinia substriata var. indica.
A pearl millet cDNA library was constructed by treating pearl millet plants with
the defence elicitors chitin and flagellin, and by wounding the plants.
Suppression subtractive hybridisation (SSH) was employed to enrich the
library for defence response transcripts. In order to characterise the cDNA
libraries, a quantitative cDNA microarray-based screening method was
developed that enabled identification of false positive transcripts, as well as
clones that represented rare or abundant transcripts. Based on this screening
method, a number of clones were selected for sequence analysis, and their
identity ascertained through homology searches with previously sequenced
genes. This revealed a number of genes known to play important roles during
pathogen attack.
The pearl millet SSH defence response library, consisting of 1920 cDNAs
either up- or down regulated in defence response, was spotted onto a glass
slide microarray and used in transcript profiling studies to examine pearl
millet’s response to the defence signalling molecules NO, MeJA and SA.
Whilst only 45 cDNAs responded significantly to NO treatment, 279 and 224
cDNAs responded to MeJA and SA sprays, respectively. Closer examination
of MeJA and SA responsive genes revealed that many of the induced
v
transcripts were common to both signalling pathways, demonstrating that a
substantial network of regulatory interactions exists between the salicylate
and jasmonate pathways, which were previously believed to act in an
antagonistic manner.
Pathology studies indicated that pretreatment of pearl millet with SA conferred
resistance to a virulent isolate of P. substriata var. indica, whereas MeJA
application did not significantly reduce subsequent infection levels. Transcript
profiling of a susceptible pearl millet line in response to virulent rust infection
revealed that genes common to both the jasmonate and salicylate pathways
were induced, suggesting that the plant adopts elements from a number of
defence signalling pathways in an attempt to ward off infection by the virulent
rust fungus. However, in view of results obtained from pearl millet defence
signalling molecule pretreatments, it is probably genes that are significantly
induced in response to SA, but to a lesser extent by MeJA that actually confer
resistance to an avirulent rust isolate. Treatment of pearl millet plants with an
avirulent P. substriata strain and subsequent microarray analysis would
answer this hypothesis by revealing whether an incompatible reaction elicits
more elements of the salicylate defence response pathway.
vi
ABBREVIATIONS
AFLP amplified fragment length polymorphism
BCIP 5-bromo-4-chloro-3-indolyl-phosphate
bp base pairs
cDNA complementary DNA
DIG digoxygenin
DMSO dimethylsulphoxide
DNA deoxyribonucleic acid
dNTP deoxynucleoside triphosphate
EDTA ethylenediamine tetraacetic acid
ER expression ratio
EST expressed sequence tag
ET ethylene
h hour
HR hypersensitive response
IPTG isopropyl-β-D-thiogalactopyranoside
ITS internal transcribed spacer region
JA jasmonic acid
kb kilobase
kDa kilodalton
LB Luria Bertani
min minute
mRNA messenger ribonucleic acid
MeJA methyl jasmonate
MS Murashige and Skoog media
NBT nitroblue tetrazolium chloride
ng nanogram
NO nitric oxide
PAGE polyacrylamide gel electrophoresis
PCR polymerase chain reaction
pg picogram
pmol picomole
PR pathogenesis related
vii
qPCR quantitative PCR
RNA ribonucleic acid
RNAase ribonuclease
ROS reactive oxygen species
rpm revolutions per minute
RT reverse transcription
SA salicylic acid
SAR systemic acquired resistance
SDS sodium dodecyl sulphate
SNP sodium nitroprusside
SSC sodium chloride/sodium citrate
SSH suppression subtractive hybridisation
TAE Tris-acetate ethylenediamine tetraacetic acid
TCA Trichloroacetic acid
TE Tris ethylene diamine tetracetic acid
UV ultraviolet
μg microgram
X-gal 5-bromo-4-chloro-3-indolyl-β-D-galactoside
1
Chapter 1
Literature Review
Overview of plant defence response mechanisms
1.1 INTRODUCTION Pathogens and insect pests cause widespread losses to agriculture
throughout the world on an annual basis. In developed countries, losses are
typically around 20% of potential yield, while in developing countries losses
are normally significantly greater (Anderson et al., 2005). Plant disease
resistance is a prerequisite for the successful utilisation of crop species in
modern agriculture. One of the major challenges facing modern agriculture is
to achieve a satisfactory, but environmentally friendly control of plant
diseases. Although the extensive use of pesticides and fungicides remains
the main strategy of disease control, conventional breeding approaches have
been very successful in introducing resistance (R) genes from wild
populations into commercial crop cultivars. Although some R genes have
provided excellent disease control in large scale commercial production for
more than 15 years, this resistance is often not durable as pathogens are able
to evolve quickly and overcome it (Hammond-Kosack and Jones, 2000).
Recent advances in molecular biology have improved our understanding of
plant-pathogen interactions through the isolation of a number of R genes, and
analysis of signalling pathways leading to the hypersensitive response (HR)
and systemic acquired resistance (SAR) (Ryals et al., 1996; Dempsey et al.,
1999). This knowledge has enabled more sophisticated breeding strategies to
be employed using marker-assisted selection (Ayliffe and Lagudah, 2004).
The completion of Arabidopsis and rice genome sequences (The Arabidopsis
Genome Initiative, 2000; Yu et al., 2002; Goff et al., 2002), and the current
sequencing of crop plant genomes, together with improved knowledge of plant
defence response mechanisms through functional analyses, will pave the way
for the development of transgenic crops with increased disease resistance, or
the development of novel pesticides capable of activating plant defence
responses.
2
The presented review introduces pearl millet, an indigenous African crop, and
the diseases associated with growing this subsistence crop. In addition, an
overview of plant defence response mechanisms is presented, and wherever
possible, advances in understanding cereal specific disease resistance and
defence responses are presented. The application of DNA microarrays as a
tool to study global gene expression changes during plant defence response
is also considered. Finally, the literature review is put into context through
discussion of the aims of the project and experimental approaches adopted in
this study to elucidate defence response mechanisms in pearl millet.
1.2 PEARL MILLET Pearl millet [Pennisetum glaucum (L.) R. Br.] was domesticated from wild
grasses of the southern Sahara approximately 4000 years ago. It has since
become widely distributed across the semiarid tropics of Africa and Asia, and
is also extensively grown as a summer annual grazing crop in the southern
United States and tropical and subtropical regions of the world (Goldman et
al., 2003). In 2003 pearl millet was the world’s sixth largest cereal crop with
29 million metric tons produced on 36 million hectares of cultivated land
(http://apps.fao.org/). Approximately half of the world’s pearl millet is grown in
Africa, with the continent producing 14 million metric tons in 2003
(http://apps.fao.org/). In Southern Africa, the commercialisation of agriculture
has resulted in maize partially or completely displacing pearl millet as a
traditional food crop. In South Africa, only 12 000 tons of pearl millet was
produced in 2003, and this was mainly for subsistence purposes. Almost all
millet is produced by small scale farmers for household consumption and
localised trade.
Pearl millet is a crop of vital importance to millions of African families living in
semi-arid regions of the continent. Millet is one of the world’s most resilient
crops. In many areas where millet is the staple food, nothing else will grow.
Pearl millet is supremely adapted to heat and aridity, and production is likely
to increase as the world gets hotter and drier. Of all the major cereals, it is the
one most able to tolerate extremes of heat and drought. It yields reliably in

3
regions too hot and too dry to consistently support good yields of maize or
even sorghum. Pearl millet is easy to grow and suffers less from disease and
insect pests than sorghum, maize or other grains (National Research Council,
1996).
Pearl millet grain is nutritious, and has higher protein and energy levels than
maize or sorghum (National Research Council, 1996). Carbohydrates usually
make up about 70 percent of the dry grain, and they consist almost
exclusively of starch. The grain contains at least nine percent protein and a
good balance of amino acids. It has roughly twice the fat content (5-7%) of
most standard cereals, and is particularly high in calcium and iron. The
vitamin values of pearl millet grain are generally somewhat lower than those
of maize, although the levels of vitamin A and carotene are good, particularly
for a cereal. Importantly, it has neither the tannins nor other compounds that
reduce digestibility in sorghum. Pearl millet is a versatile foodstuff, and is
mainly used as whole seed, cracked seed, ground flour, dough, or a grain like
rice. These are made into unfermented breads (roti), fermented foods (kisra
and gallettes), thin and thick porridges (toh), steam cooked dishes (couscous),
non alcoholic beverages and traditional beers. Grain from certain cultivars is
roasted whole and consumed directly (http://africancrops.net).
In recent years, considerable advances have been made in the understanding
of the genetics of the crop. P. glaucum is diploid (2n=2x=14) with a haploid
DNA content of 2.4 pg. Detailed genetic maps of some 300 loci spread over 7
linkage groups are available (Liu et al., 1994). Despite these advances, pearl
millet is poorly supported by science and politics. Over the past two decades,
production in West Africa has only increased by 0.7 percent per year, the
lowest growth rate of any food crop in the region (National Research Council,
1996). Over the decades, more and more farmers, especially in southern
Africa, have abandoned pearl millet farming and switched to maize. This is
due to a number of reasons. First, research efforts have made maize more
productive than pearl millet; second, government incentives have given maize
an added financial advantage; and finally, easier processing has made maize
4
more convenient to use. However, with water steadily becoming a limiting
resource to numerous economies, pearl millet could become a vital resource.
1.3 PEARL MILLET DISEASES Due to the subsistence nature of farming pearl millet in developing countries,
very few statistics are available for crop losses resulting from disease.
However, pearl millet suffers less from disease and insect pests than
sorghum, maize or other grains (National Research Council, 1996), but this
could be due to the planting of landraces as opposed to hybrids in many
developing areas.
Downy mildew is the major biotic cause of yield loss in pearl millet, and is
caused by the biotrophic oomycete fungus Sclerospora graminicola (Sacc.)
Schroet. The disease is widespread in India and West Africa, but does not
occur on pearl millet in the Americas. Downy mildew is not found in South
Africa as the climate is too dry to support S. graminicola infections (de Miliano,
personal communication). The disease is economically important, since it
causes more than 60-70% loss of yield in susceptible hybrids (Singh et al.,
1990; Singh, 1995). The life cycle of S. graminicola comprises both sexual
and asexual phases. The sexual stage produces oospores that become soil-
or seedborne, thus providing the primary source of inoculum each season.
Seedlings growing in soils infested with oospores become systemically
infected and show chlorosis. Under humid conditions, systemically infected
leaves produce sporangia, and release zoospores that encyst, germinate and
invade the foliage to produce secondary infections (Jones et al., 2001).
Disease symptoms include leaf chlorosis, stunted growth with no production of
panicles, and green ear symptoms which result from transformation of floral
parts into leafy structures. Breeding for resistance to downy mildew is a high
priority for pearl millet breeders.
Smut [Moesziomyces penicillariae (Bref.) Vanky] and ergot (Claviceps sp.) are
inflorescence diseases. These fungal pathogens are widely distributed
across the pearl millet growing areas of the world; however Claviceps
fusiformis Loveless has not been reported on pearl millet in the United States
5
and strict quarantine procedures are in place to restrict its entry
(http://www.cpes.peachnet.edu). Although losses are considerably less than
downy mildew, these inflorescence diseases still result in reduced seed yield.
The introduction of hybrid and exotic breeding lines has greatly increased the
severity of these diseases in India and Africa respectively (King, 1992;
Panwar and Rathi, 1997). Field screening techniques for smut and ergot are
available and stable resistances have been identified (King, 1992; de Milliano,
1992).
The two most destructive diseases to pearl millet in the United States are rust
(caused by Puccinia substriata Ell. & Barth. var. indica Ramachar & Cumm.)
and pyricularia leaf spot [Pyricularia grisea (Cke.) Sacc] (Morgan et al., 1998).
Although rust is fairly widespread and is distributed throughout the Americas,
Asia and Africa, pyricularia leaf spot appears to be limited to India, Singapore
and the United States (http://www.cpes.peachnet.edu). General disease
resistance to both pathogens has been transferred into agronomically
acceptable forage and grain cultivars. However, the diverse nature of P.
substriata var. indica has hampered efforts to breed for stable resistance and
biomass production (Wilson and Gates, 1999). Even low levels of rust
infection result in significant losses of digestible dry matter, and as a result,
this disease has become an important limiting factor for grain and forage
production in the United States. P. substriata var. indica is a macrocyclic rust
that causes small reddish orange round uredinia to develop mainly on pearl
millet foliage. As the severity of the infection increases, leaf tissue wilts and
becomes necrotic from the leaf apex to the base. Pearl millet rust is fairly
widespread throughout growing regions of South Africa (de Miliano, personal
communication).
Bacterial and viral diseases are of minor importance to the extent that disease
causal agents are not always identified (King, 1992). Nematodes are likewise
probably widespread, but their importance in pearl millet production is virtually
unknown. A recent study indicated that pearl millet hybrids exhibited
differences in resistance to the nematode species Meloidogyne incognita
(Kofoid and White) Chitwood and Paratrichodorus minor (Colbran) Siddiqi
6
(Johnson et al., 1999). Johnson and coworkers hypothesised that the fibrous
rooting system and root branching of mature pearl millet plants probably
allows this crop to flourish under certain populations of nematodes.
1.4 PATHOGEN RECOGNITION BY PLANT CELLS Plants are sessile organisms, anchored to the ground through the root system
for acquisition of nutrients and water, and can therefore not move to escape
environmental challenges. Biotic stresses result from constant attack by
fungi, bacteria, nematodes, feeding insects and viruses. In addition to passive
protection provided by the waxy cuticle and preformed antimicrobial
compounds such as saponins (Osbourn, 1996), plants have evolved
sophisticated defence mechanisms to perceive pathogen attacks, and to
translate that perception into an adaptive response.
As a first step, plants recognise the presence of a pathogen when pathogen
derived molecules (i.e. elicitors) bind to receptors. Recognition is
accomplished by the detection of elicitors (i.e. peptide, oligosaccharide or lipid
based signalling molecules) that originate from the pathogen or cell wall
degradation products (Romeis, 2001). In gene-for-gene plant-pathogen
interactions, these race-specific elicitors are encoded by pathogen avirulence
(avr) genes and their specific recognition is conferred by corresponding plant
disease resistance (R) genes. R gene products function extracellularly or
intracellularly. Plants also possess a broader basal surveillance involving
perception systems for non-race specific microbe derived molecules termed
pathogen associated molecular patterns (PAMPs) (Gomez-Gomez, 2004). In
the case of non-race-specific elicitors, high affinity binding receptors located in
the plasma membrane are responsible for pathogen perception. Upon
pathogen recognition, signalling events become initiated that trigger early
cellular responses such as changes in ion fluxes, synthesis of reactive oxygen
species leading to the development of the hypersensitive cell death response
(HR) and changes in gene transcription. Delayed defence responses include
the production of antimicrobial compounds, cell wall fortification and the
activation of systemic acquired resistance (SAR), which reflects a long lasting
resistance that is established in non-infected areas of the plant.
7
The speed with which the plant cell can mobilise its defences often
determines whether it survives or succumbs to the attack. When the induced
responses are triggered rapidly and coordinately during a given plant-
pathogen interaction, the plant is resistant to disease. A susceptible plant
responds more slowly with an onset of defence mechanisms after infection.
Thus, the timely recognition of an invading microorganism and the rapid and
effective induction of defence responses appear to be a key difference
between resistant and susceptible plants (Hammond-Kosack and Parker,
2003).
Pathogens can be divided into two basic categories depending on the
infection strategy deployed to utilise the host plant as a substrate. Biotrophic
pathogens use living plant cells as a nutrient source, and have developed
specialised feeding structures, or haustoria (Hammond-Kosack and Jones,
2000). Biotrophs require a living host to complete their lifecycle, and therefore
aim to evade recognition by the plant. On the other hand, necrotrophic
pathogens kill the host and absorb nutrients from the dead plant tissue.
These pathogens secrete toxins or cell wall degrading enzymes to kill and
macerate plant tissue preceding recognition and the subsequent activation of
defence responses (Hammond-Kosack and Jones, 2000). Hemibiotrophic
fungi sequentially deploy a biotrophic and then a necrotrophic mode of
nutrition. The switch is usually triggered by increasing nutritional demands as
the fungal biomass increases (Hammond-Kosack and Jones, 2000).
Gene-for-gene resistance A compatible plant-pathogen interaction occurs when a virulent pathogen
penetrates a susceptible plant and causes disease. Alternatively, an
incompatible interaction takes place when an avirulent pathogen attacks a
resistant plant, which is able to rapidly activate defence responses, thus
preventing the development of disease. The gene-for-gene model for plant
disease resistance proposed that an incompatible reaction results from the
interaction of the product of a plant resistance (R) gene with the product of the
corresponding avirulence (avr) gene (Flor, 1971). Subsequent research has
8
shown that there are many exceptions to this model and that most R-Avr
protein interactions are not direct, but instead involve perception of pathogen
derived proteins within a complex (Hammond-Kosack and Parker, 2003).
R genes In the past decade, many R genes have been isolated that confer pathogen
resistance to various plant species against a wide range of pathogens. An
ever increasing number of R genes have been isolated from wheat (Triticum
aestivum), rice (Oryza sativa) and maize (Zea mays) (see Table 1.1), the
three crop species that account for over 85% of cereal production (FAO
Statistical Databases; FAOSTAT 2004). Significant advances have also been
made in understanding the molecular basis of pathogen recognition in barley
(Hordeum vulgare). These four species, however, are the only cereals from
which functional disease resistance genes have been isolated and
characterised (Ramalingam et al., 2003; Ayliffe and Lagudah, 2004).
R genes can be classified into six classes based on their predicted protein
structures (Hammond-Kosack and Jones, 2000; Hammond-Kosack and
Parker, 2003). These six classes of R genes, with examples of each, are
outlined in Table 1.1. Structures of the different R gene proteins are
illustrated in Figure 1.1.
The largest class of R genes encode proteins containing a central domain with
a nucleotide binding site (NBS), which binds either ATP or GTP (Saraste et
al., 1990), and a carboxy terminal domain consisting of a series of degenerate
leucine rich repeat residues (LRR). Amongst plant species, NBS-LRR
proteins can be further divided into two subgroups; those containing an amino
terminus with homology to the Drosophila Toll protein and mammalian
interleukin-1-receptor (TIR-NBS-LRR); and those which do not contain this
domain, but often have it substituted with a leucine zipper or coiled-coil
domain (CC-NBS-LRR). A major distinction between monocotyledonous and
dicotyledonous species is that only CC-NBS-LRR genes have been identified
in monocots, whereas both subgroups are found in dicots, with TIR-NBS-LRR
genes being the more abundant class (Dangl and Jones, 2001; Ayliffe and
9
Lagudah, 2004). The rice genome sequence has enabled scientists to
estimate the number of NBS-LRR encoding genes existing in a cereal
genome. To date about 600 NBS-LRR genes have been identified in the rice
genome (Goff et al., 2002). This compares with the 149 NBS-LRR genes
present in the Arabidopsis genome, 60% of which encode TIR-NBS-LRR
proteins, while 40% encode CC-NBS-LRR proteins (Dangl and Jones, 2001).
Several other cereal resistance genes have been identified that do not encode
NBS-LRR proteins. The rice Xa21 and Xa26 genes, which confer resistance
to the bacterial pathogen Xanthomonas oryzae, each encode a protein
comprised of an amino terminal extracellular LRR joined by a transmembrane
domain to a cytoplasmic C-terminal serine/threonine protein kinase domain
(Song et al., 1995; Sun et al., 2004).
In contrast, the non-race specific barley Rpg1 stem rust resistance gene only
encodes an intracellular protein kinase with two tandem kinase domains
(Horvath et al., 2003). Possible parallels exist between this cereal gene and
the tomato Pto gene which encodes a protein kinase that confers race specific
resistance to Pseudomonas syringe. However, to confer disease resistance,
the Pto gene product also requires the LRR containing protein Prf. It will be of
interest to determine whether the Rpg1 gene additionally requires an NBS-
LRR gene for defence gene activation.
Maize Hm1 encodes a unique R protein that confers resistance to the leaf
spot fungus Helminthosporium maydis. This nectrotrophic fungus produces a
race specific toxin, HC toxin that inhibits the activity of histone deacetylase, an
enzyme that is required for activation of plant defence responses. The maize
Hm1 resistance gene encodes a reductase enzyme that specifically detoxifies
the HC toxin (Johal and Briggs, 1992).
10
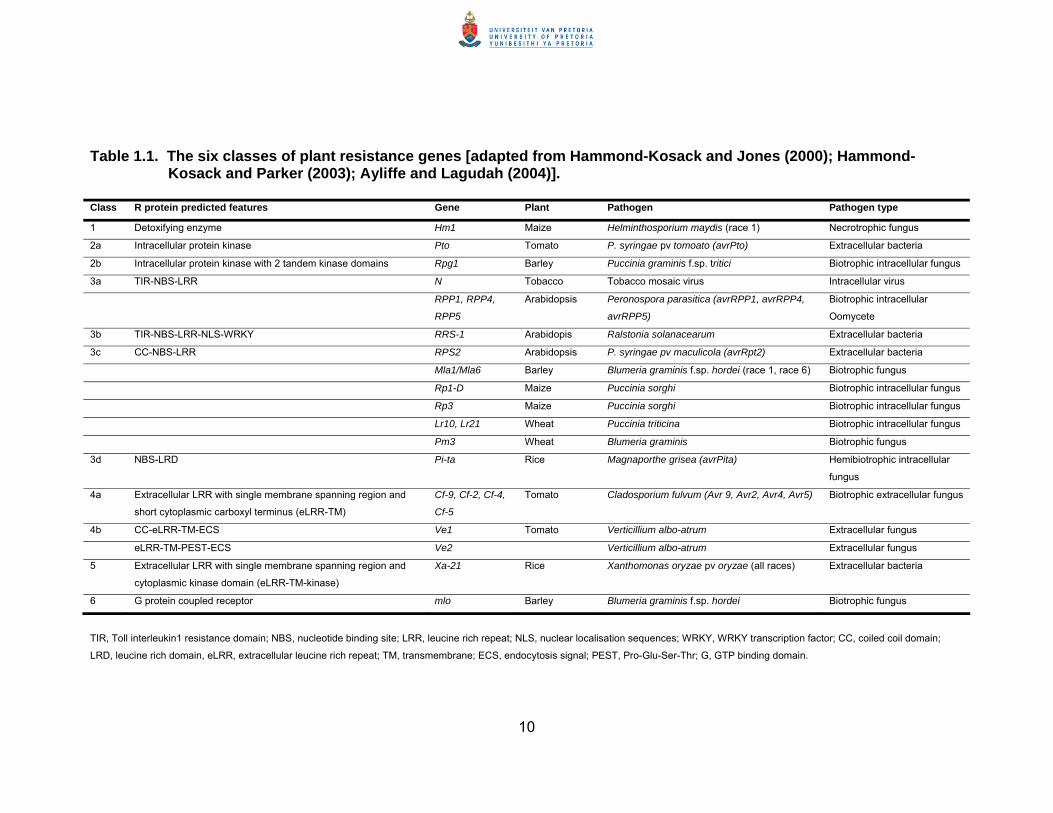
Table 1.1. The six classes of plant resistance genes [adapted from Hammond-Kosack and Jones (2000); Hammond-Kosack and Parker (2003); Ayliffe and Lagudah (2004)].
Class R protein predicted features Gene Plant Pathogen Pathogen type
1 Detoxifying enzyme Hm1 Maize Helminthosporium maydis (race 1) Necrotrophic fungus
2a Intracellular protein kinase Pto Tomato P. syringae pv tomoato (avrPto) Extracellular bacteria
2b Intracellular protein kinase with 2 tandem kinase domains Rpg1 Barley Puccinia graminis f.sp. tritici Biotrophic intracellular fungus
3a TIR-NBS-LRR N Tobacco Tobacco mosaic virus Intracellular virus
RPP1, RPP4,
RPP5
Arabidopsis Peronospora parasitica (avrRPP1, avrRPP4,
avrRPP5)
Biotrophic intracellular
Oomycete
3b TIR-NBS-LRR-NLS-WRKY RRS-1 Arabidopis Ralstonia solanacearum Extracellular bacteria
3c CC-NBS-LRR RPS2 Arabidopsis P. syringae pv maculicola (avrRpt2) Extracellular bacteria
Mla1/Mla6 Barley Blumeria graminis f.sp. hordei (race 1, race 6) Biotrophic fungus
Rp1-D Maize Puccinia sorghi Biotrophic intracellular fungus
Rp3 Maize Puccinia sorghi Biotrophic intracellular fungus
Lr10, Lr21 Wheat Puccinia triticina Biotrophic intracellular fungus
Pm3 Wheat Blumeria graminis Biotrophic fungus
3d NBS-LRD Pi-ta Rice Magnaporthe grisea (avrPita) Hemibiotrophic intracellular
fungus
4a Extracellular LRR with single membrane spanning region and
short cytoplasmic carboxyl terminus (eLRR-TM)
Cf-9, Cf-2, Cf-4,
Cf-5
Tomato Cladosporium fulvum (Avr 9, Avr2, Avr4, Avr5) Biotrophic extracellular fungus
4b CC-eLRR-TM-ECS Ve1 Tomato Verticillium albo-atrum Extracellular fungus
eLRR-TM-PEST-ECS Ve2 Verticillium albo-atrum Extracellular fungus
5 Extracellular LRR with single membrane spanning region and
cytoplasmic kinase domain (eLRR-TM-kinase)
Xa-21 Rice Xanthomonas oryzae pv oryzae (all races) Extracellular bacteria
6 G protein coupled receptor mlo Barley Blumeria graminis f.sp. hordei Biotrophic fungus
TIR, Toll interleukin1 resistance domain; NBS, nucleotide binding site; LRR, leucine rich repeat; NLS, nuclear localisation sequences; WRKY, WRKY transcription factor; CC, coiled coil domain;
LRD, leucine rich domain, eLRR, extracellular leucine rich repeat; TM, transmembrane; ECS, endocytosis signal; PEST, Pro-Glu-Ser-Thr; G, GTP binding domain.
11
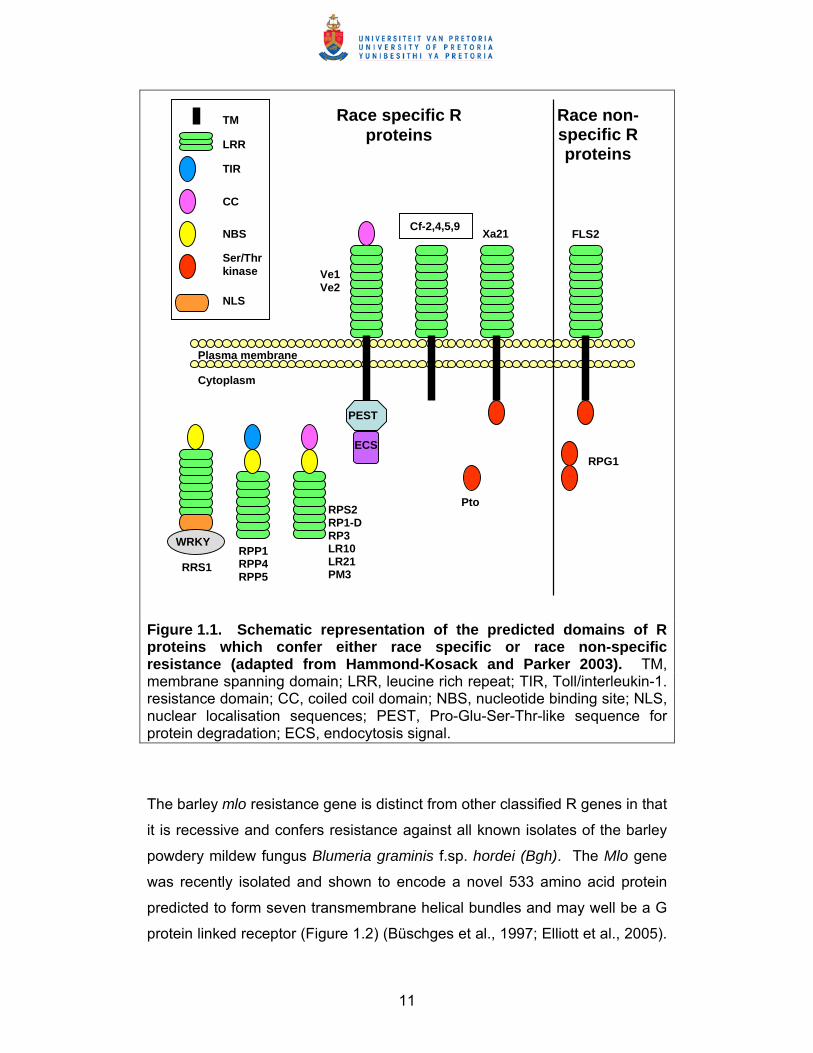
Figure 1.1. Schematic representation of the predicted domains of R proteins which confer either race specific or race non-specific resistance (adapted from Hammond-Kosack and Parker 2003). TM, membrane spanning domain; LRR, leucine rich repeat; TIR, Toll/interleukin-1. resistance domain; CC, coiled coil domain; NBS, nucleotide binding site; NLS, nuclear localisation sequences; PEST, Pro-Glu-Ser-Thr-like sequence for protein degradation; ECS, endocytosis signal.
The barley mlo resistance gene is distinct from other classified R genes in that
it is recessive and confers resistance against all known isolates of the barley
powdery mildew fungus Blumeria graminis f.sp. hordei (Bgh). The Mlo gene
was recently isolated and shown to encode a novel 533 amino acid protein
predicted to form seven transmembrane helical bundles and may well be a G
protein linked receptor (Figure 1.2) (Büschges et al., 1997; Elliott et al., 2005).
WRKY
Plasma membrane Cytoplasm
RRS1
Cf-2,4,5,9 Xa21 FLS2
RPG1
Pto
Ve1 Ve2
PEST
ECS
RPP1 RPP4 RPP5
RPS2 RP1-D RP3 LR10 LR21 PM3
TIR
CC
NBS Ser/Thr kinase NLS
LRR TM Race specific R
proteins Race non-specific R proteins
12
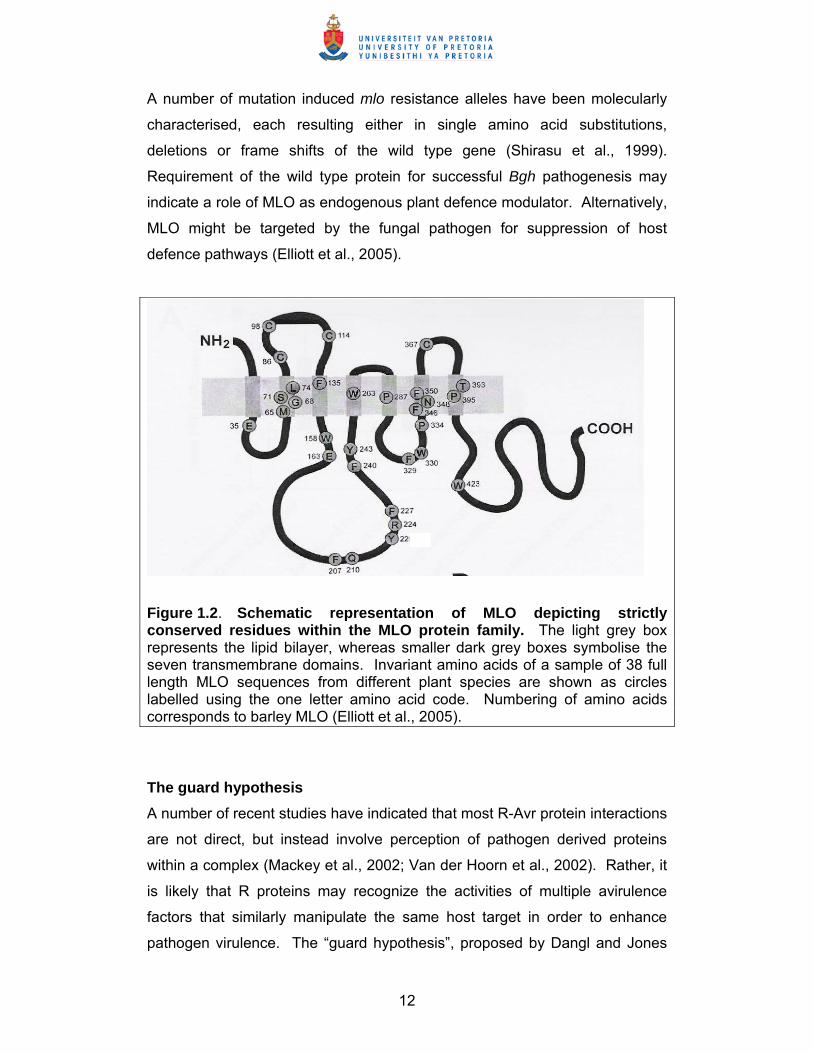
A number of mutation induced mlo resistance alleles have been molecularly
characterised, each resulting either in single amino acid substitutions,
deletions or frame shifts of the wild type gene (Shirasu et al., 1999).
Requirement of the wild type protein for successful Bgh pathogenesis may
indicate a role of MLO as endogenous plant defence modulator. Alternatively,
MLO might be targeted by the fungal pathogen for suppression of host
defence pathways (Elliott et al., 2005).
Figure 1.2. Schematic representation of MLO depicting strictly conserved residues within the MLO protein family. The light grey box represents the lipid bilayer, whereas smaller dark grey boxes symbolise the seven transmembrane domains. Invariant amino acids of a sample of 38 full length MLO sequences from different plant species are shown as circles labelled using the one letter amino acid code. Numbering of amino acids corresponds to barley MLO (Elliott et al., 2005).
The guard hypothesis A number of recent studies have indicated that most R-Avr protein interactions
are not direct, but instead involve perception of pathogen derived proteins
within a complex (Mackey et al., 2002; Van der Hoorn et al., 2002). Rather, it
is likely that R proteins may recognize the activities of multiple avirulence
factors that similarly manipulate the same host target in order to enhance
pathogen virulence. The “guard hypothesis”, proposed by Dangl and Jones
13
(2001), postulates that the corresponding R protein monitors the integrity of
that particular host target in order to detect manipulation of it by the avirulence
factors, and subsequently induce defence responses. Therefore, R proteins
might “guard” a limited set of key cellular targets of pathogen virulence
effectors. In the absence of the host R protein, the pathogen avirulence
protein could interfere with a positive plant defence regulator or promote a
plant defence suppressor. This would be crucial to successful pathogen
proliferation (Hammond-Kosack and Parker, 2003).
The guard model provides explanation for previously unexpected findings,
where specific Avr proteins associate with a seemingly inappropriate R protein
(Leister and Katagiri, 2000), that unrelated Avr proteins target the same
molecule in the plant cell (Kim et al., 2002), that R proteins can functionally
interfere with one another (Ritter and Dangl, 1996), and explains why direct
interactions between R and Avr products have been difficult to detect (Gómez-
Gómez, 2004). Direct interaction between R and Avr proteins has only been
detected during the incompatible reaction between rice and the rice blast
fungus Magnoporthe grisea. The rice Pi-ta gene encodes an NBS-LRR
protein that recognises Magnaporthe isolates in a race specific fashion. The
corresponding pathogen avirulence gene product (AVR-Pita) is predicted to
be a small, secreted metalloprotease protein. Direct physical interaction
occurs between the plant resistance protein and the pathogen avirulence
protein both in vitro and in vivo (Jia et al., 2000). It is though that the N
terminal region of Pi-ta is responsible for the interaction with AVR-Pita. In a
refinement of the guard hypothesis, it has been suggested that during a
compatible reaction this domain might interact with yet another pathogen
protein that then would preclude the interaction with the AVR-Pita leading to
pathogen virulence (Gómez-Gómez, 2004).
Given the large number of possible effectors from just a single strain of one
pathogen (Collmer et al., 2002), it is unlikely that the repertoire of R proteins in
the plant could be sufficient to mediate direct recognition of all the possible
virulence factors from a pathogen (Mackey et al., 2003). Therefore, in order
for the plant to effectively protect itself against a variety of pathogens, from
14
viruses to bacteria, from fungus to aphids, it is thought that pathogen virulence
factors only target a limited set of host proteins that are important in plant
defence responses (Gómez-Gómez, 2004).
Pathogen associated molecular patterns In addition to Avr-R gene product interactions, plants possess a broader, more
basal surveillance involving sensitive perception systems for numerous
microbe derived molecules. These molecules mediate activation of plant
defence responses in a non-cultivar specific manner, and have been
described as general elicitors (Boller, 1995). These non-specific elicitors are
constitutively present in the pathogen, and are essential for the functioning of
the microorganism. As a result, they are conserved within a class of
microbes, and have recently been termed pathogen associated molecular
patterns (PAMPs) (Gómez-Gómez, 2004).
General elicitors involved in the activation of plant defence responses have
been isolated from viruses, bacteria, fungal and oomycete pathogens. They
act as signalling molecules at low concentrations, have diverse structures and
include polygalacturonides, β-glucans, chitosan, lipids and proteins (Boller,
1995). Other examples of PAMPs include the elicitor PaNie from the
phytopathogenic oomycete Pythium aphanidermatum and other fungi (Veit et
al., 2001); the elicitor Pep-13 conserved among different oomycete
transglutaminases (Brunner et al., 2002); fungal chitin (Stacey and Shibuya,
1997; Ramonell et al., 2002); arachidonic acid, a fatty acid component of
oomycete mycelia (Geetha et al., 1996); and lipopolysaccharides that form an
integral component of the cell surface of Gram negative bacteria that invades
plants (Erbs and Newman, 2003). Two other bacterial PAMP elicitors include
bacterial cold shock protein (CSP) (Felix and Boller, 2003) and bacterial
flagellin (Felix et al., 1999). All these molecules are produced by bacteria or
fungi, but not by plant cells, and their recognition by plant receptors signals
the presence of potential phytopathogens.
Plant recognition of bacterial flagellin provides an excellent example of the
plant perception systems for PAMP molecules. Flagella are essential for
15
bacterial mobility in response to a changing environment. Flagellin represents
the building block of the flagellar filament of eubacteria, and is comprised of
conserved domains in the N and C termini of the protein, while the central
domain is hypervariable (Felix et al., 1999). Like other PAMPs, flagellae are
essential for bacterial viablility, and mutations in the flagellin protein that
compromise flagella function would have deleterious consequences for the
bacteria. Recent experiments have shown that addition of crude bacterial
extracts containing extracellular flagellin monomers caused medium
alkalinisation and ethylene production in Arabidopsis, tomato, tobacco and
rice cell cultures (Felix et al., 1999; Che et al., 2000) as well as callose
deposition and defence gene activation in Arabidopsis (Gómez-Gómez,
2004), and transcriptional reprogramming in rice (Fujiwara et al., 2004).
A breakthrough in the understanding of flagellin recognition came from the
map based cloning of Arabidopsis FLagelling Sensing (FLS2) protein (Gómez-
Gómez and Boller, 2002). FLS2 is a receptor-like kinase with structural
similarities to R proteins. It contains a predicted signal peptide, and
extracellular LRR domain, a transmembrane domain and an intracellular
serine/threonine kinase domain (Figure 1.1). The overall structure suggests a
role for FLS2 in the perception of an extracellular signal and transduction of
the signalling event through the intracellular kinase domain (Gómez-Gómez
and Boller, 2002). The search for further PAMP receptors in plants is likely to
provide good targets for engineering durable resistance control (Hammond-
Kosack and Parker, 2003).
1.5 PLANT DEFENCE SIGNALLING NETWORKS Plant-pathogen recognition causes the rapid activation of appropriate
defences. Upon elicitor binding to receptors, defence signalling pathways are
activated that eventually lead to a defence response. Intracellular signalling is
instigated when the occupied receptor directly or indirectly activates a
downstream effector enzyme to produce a specific second messenger. In its
turn, the second messenger binds to and activates, for example, a protein
kinase that is at the start of a kinase cascade. This leads to different
responses, such as transcriptional activation of defence related genes (Laxalt
16
and Munnik, 2002). Experimental evidence suggests that defence signalling
is complex and involves an interplay between protein kinases, phospholipids,
and defence signalling molecules such as nitric oxide (NO), reactive oxygen
species (ROS), salicylic acid (SA), jasmonic acid (JA) and ethylene (ET)
(McDowell and Dangl, 2000; Hammond-Kosack and Parker, 2003).
Mitogen activated protein kinases Mitogen activated protein kinase (MAPK) cascades are major components
downstream of receptors or sensors that transduce extracellular stimuli into
intracellular responses, and are found in all eukaryotes analysed to date
(Innes, 2001). The basic assembly of a MAPK cascade is a three kinase
module conserved in all eukaryotes. MAPK, the last kinase in the cascade, is
activated by a kinase relay consisting of a MAPK kinase (MAPKK or MEK),
which, in turn, is activated by a MAPKK kinase (MAPKKK or MEKK).
MAPKs are activated by a variety of stress stimuli including wounding,
temperature drought, salinity, osmolarity, UV irradiation, ozone and reactive
oxygen species. MAPKs from several plant species were also shown to be
activated during plant responses to elicitors or pathogens (Romeis, 2001;
Zhang and Klessig, 2001). A significant advance in our understanding of plant
MAPKs was recently made by Asai and coworkers (Asai et al., 2002) in which
a complete plant MAPK cascade was identified that functions downstream of
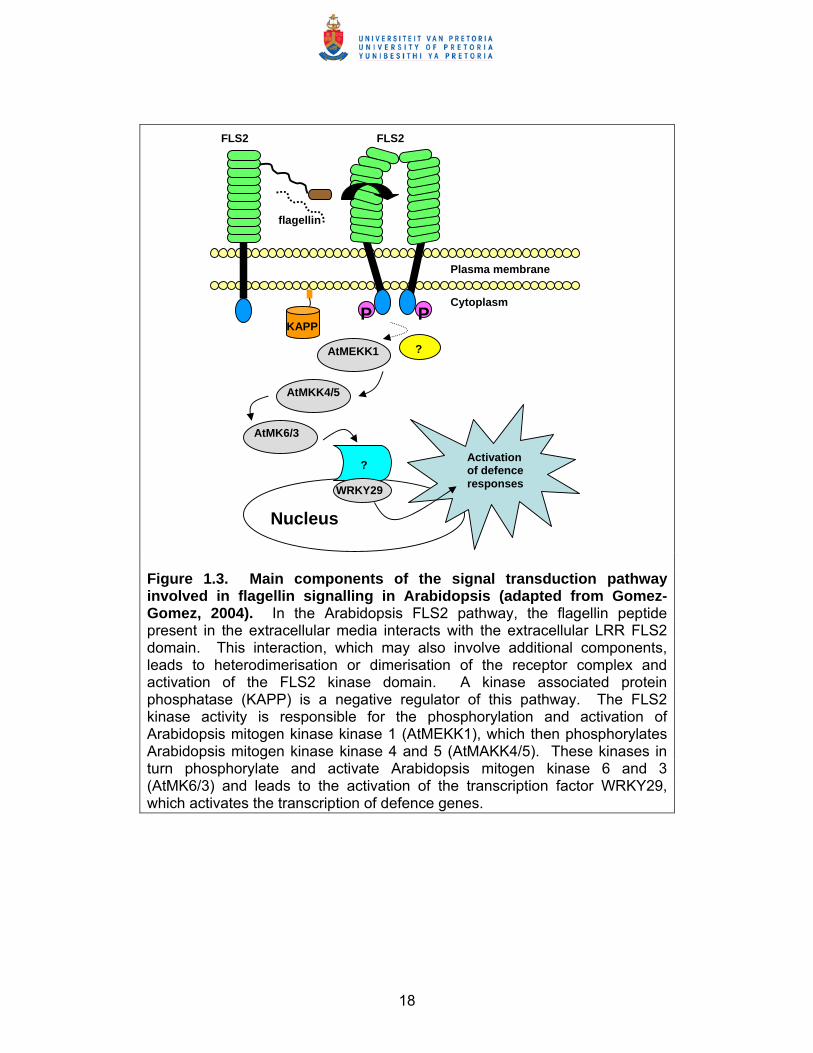
the Arabidopis flagellin receptor FLS2 (Figure 1.3). In the Arabidopsis FLS2
pathway, the flagellin peptide present in the extracellular media interacts with
the extracellular LRR FLS2 domain. This interaction leads to
heterodimerisation or dimerisation of the receptor complex and activation of
the FLS2 kinase domain. A kinase associated protein phosphatase (KAPP) is
a negative regulator in this pathway (Gómez-Gómez, 2004). The FLS2 kinase
activity is responsible for the phosphorylation and activation of the Arabidopsis
mitogen kinase kinase 1 (AtMEKK1) which then phosphorylates Arabidopsis
mitogen kinase 4 and 5 (AtMAKK4/5). These kinases in turn phosphorylate
and activate Arabidopsis mitogen kinase 6 and 3 (AtMK6/3) and lead to the
activation of the WRKY transcription factors WRKY22 and WRKY29 that
activate the transcription of defence genes. Infection of Arabidopsis plants
17
constitutively expressing components of the flagellin responsive MAPK
cascade led to enhanced resistance to the virulent pathogens Pseudomonas
syringae and Botrytis cinerea (Asai et al., 2002). These results suggest that
defence responses activated by the flagellin MAPK cascade are effective
against both fungal and bacterial pathogens, and that signalling events
initiated by diverse pathogens converge into a conserved MAPK cascade.
In tobacco, activation by fungal elicitors of AtMK3 and AtMK6 orthologues,
WIPK and SIPK respectively, is similar to activation of the flagellin MAPK
cascade in Arabidopsis (Asai et al., 2002). Furthermore, Yang and coworkers
(2001) identified a tobacco MAPKK, NtMEK2, which can activate WIPK and
SIPK. Constitutive expression of NtMEK2 in tobacco leaves lead to the
induction of hypersensitive cell death and the expression of defence genes in
the absence of pathogens. These results suggest that the MAPK cascade
containing NtMEK2, WIPK and SIPK is involved in the expression of fungal
pathogen defence responses in tobacco (Yang et al., 2001). The Arabidopsis
orthologues of NtMEK2 are MK4 and MK5, indicating the importance of the
flagellin MAPK cascade in pathogen defence, and further suggesting that
signalling events initiated by diverse pathogens converge into a conserved
MAPK cascade (Asai et al., 2002).
Recently, a number of rice MAPKs have been identified that play a role in
signalling following pathogen attack and wounding (Rakwal and Agrwal, 2003;
Agrwal et al., 2003; Kim et al., 2003). Rice MAPKs OsBWMK1, OsWJUMK1,
OsMSRMK2, OsBIMK1 and OsMSRMK3 were all shown to be upregulated by
SA, JA and ethylene (Agrwal et al., 2003). In addition, OsBIMK1 was rapidly
induced during an incompatible reaction between a blast resistant rice
genotype and Magnoporthe grisea (Song and Goodman, 2002).
18
Figure 1.3. Main components of the signal transduction pathway involved in flagellin signalling in Arabidopsis (adapted from Gomez-Gomez, 2004). In the Arabidopsis FLS2 pathway, the flagellin peptide present in the extracellular media interacts with the extracellular LRR FLS2 domain. This interaction, which may also involve additional components, leads to heterodimerisation or dimerisation of the receptor complex and activation of the FLS2 kinase domain. A kinase associated protein phosphatase (KAPP) is a negative regulator of this pathway. The FLS2 kinase activity is responsible for the phosphorylation and activation of Arabidopsis mitogen kinase kinase 1 (AtMEKK1), which then phosphorylates Arabidopsis mitogen kinase kinase 4 and 5 (AtMAKK4/5). These kinases in turn phosphorylate and activate Arabidopsis mitogen kinase 6 and 3 (AtMK6/3) and leads to the activation of the transcription factor WRKY29, which activates the transcription of defence genes.
PP
AtMEKK1
AtMKK4/5
AtMK6/3
?
?
WRKY29
Activation of defence responses
KAPP
Nucleus
Plasma membrane
Cytoplasm
FLS2 FLS2
flagellin
19
Calcium dependent protein kinases Numerous stimuli can alter the Ca2+ concentration in the cytoplasm, a factor
common to many physiological responses in plant and animal cells. In
general, in the absence of a stimulus, cytosolic Ca2+ concentration in plant
cells is maintained at a concentration of approximately 100 nM. However,
Ca2+ concentration in the cell wall and organelles is in the millimolar range
(Yang and Poovaiah, 2003). In response to a variety of stimuli, the cytosolic
Ca2+ concentration in plants is rapidly elevated via an increased Ca2+ influx,
and then quickly returns to the basal level by Ca2+ efflux – this produces a
Ca2+ spike. Specific responses to different stimuli could be achieved through
variations in the amplitude, duration, location, and frequency of these Ca2+
spikes (Ludwig et al., 2004).
Calcium binding proteins decode information contained in the temporal and
spatial patterns of these Ca2+ signals and bring about changes in metabolism
and gene expression. In addition to calmodulin, a calcium binding protein
found in all eukaryotes, plants contain a large family of calcium dependent
protein kinases (CDPKs). CDPKs, one of the largest subfamilies of plant
protein kinases, possess a characteristic structure in which an N terminal
serine/threonine protein kinase domain is fused to a carboxyl terminal
calmodulin like domain containing four EF hand calcium binding sites
(Harmon et al., 2000). A junction domain between the kinase and calmodulin
like domain functions as a pseudo substrate autoinhibitor that inhibits
phosphorylation in the absence of Ca2+ and keeps the CDPK in a state of low
activity (Harmon et al., 2000).
Elicitor induced calcium influx and protein kinase activity have been reported
in many pathosystems as one of the earliest responses required for further
downstream signalling. CDPKs are therefore ideally structured for sensing
changes in intracellular calcium concentration and translating them into kinase
activity. Treatment of tobacco with non specific elicitors and wounding caused
an accumulation of NtCDPK1 transcripts (Yoon et al., 1999). A maize CDPK
(ZmCPK10) is also transcriptionally activated in response to fungal infection
and treatment of fungal elicitors (Murillo et al., 2001). Activation of ZmCPK10
20
was accompanied by an increase in the level of maize PR proteins. One of
the best biologically characterised CDPKs is NtCDPK2 from tobacco. This
enzyme was found to be upregulated in response to treatment with the
Cladosporium fulvum Avr9 peptide in transgenic tobacco plants expressing
the Cf-9 resistance (Romeis et al., 2001). Furthermore, Romeis and
coworkers (2001) also reported that CDPK silenced Cf-9 Nicotiana
benthamiana plants showed a reduced and delayed hypersensitive response
after race specific elicitation in the Cf-9:Avr9 gene for gene interaction.
Phospholipid signalling Phospholipid derived molecules are emerging as novel secondary
messengers in plant defence signalling. A downstream product of both the
phospholipase C (PLC) and phospholipase D (PLD) pathways is phosphatidic
acid (PA). Recent research suggests that PA plays a role in defence
response signalling. Evidence for PLC involvement in plant defence response
is through the application of PLC inhibitors. These inhibitors were shown to
block a race specific defence response reaction, as well as inhibit reactive
oxygen species formation and MAPK cascade activation (Laxalt and Munnik,
2002). One of the first reports that implicated PLD in plant-pathogen
interactions described the induction of PLD gene expression in rice upon
infection by Xanthomonas oryzae (Young et al., 1996). In soybean, PA
activates a MAPK cascade via a protein kinase that has not yet been
identified, and when PA production is suppressed, wound activation of the
MAPK is also inhibited (Lee et al., 2001). Furthermore, Farmer and Choi
(Farmer and Choi, 1999) showed that a carrot CDPK was activated by PA and
Ca2+ in vitro, and further studies indicated that phosphoinositide dependent
protein kinase 1 (PDK1) specifically binds PA (Deak et al., 1999). PA
signalling is thought to be located upstream of the oxidative burst, as
treatment of tobacco cells with PA induced an oxidative burst (Laxalt and
Munnik, 2002). Future research will involve the identification of downstream
target proteins for PA, beginning with proteins that bind PA so that PA binding
domains can be characterised.
21
Reactive oxygen species and nitric oxide Reactive oxygen species (ROS) have been proposed to serve as diffusible
intercellular signals and/or second messengers for the activation of various
defence genes in animals, plants and bacteria (Mehdy et al., 1996). Upon
pathogen attack, O2- accumulates in a process known as the oxidative burst,
and is rapidly dismutated to H202 non-enzymatically, or by the action of
superoxide dismutase (Wojtaszek, 1997; Grant and Loake, 2000). Activation
of the oxidative burst in the plant is part of an integrated signal system that
involves salicylic acid and perturbations of the cytosolic Ca2+ (Alvarez et al.,
1998). Several sources are known to exist for the generation of ROS
including a plasmamembrane located NADPH oxidase, a cell wall peroxidase
and amine, diamine and polyamine oxidase type enzymes (Grant and Loake,
2000).
ROS play a role in activating a number of plant defence responses to
pathogen attack. These include induction of phytoalexin production, oxidative
cross linking of cell wall hydroxyproline rich proteins to reinforce the cell wall
against pathogen degrading enzymes, and a role in initiation of programmed
cell death leading to the formation of the hypersensitive response (Mehdy et
al., 1996; Wojtaszek, 1997). This hypersensitive cell death results in a
restricted lesion delimited from surrounding healthy tissue and is thought to
contribute to pathogen restriction. However, the oxidative burst is necessary
but not sufficient to trigger host cell death, and experimental evidence
indicates that nitric oxide (NO) cooperates with ROS in the activation of
hypersensitive cell death (Delledonne et al., 1998).
NO is a diffusible molecular messenger in animals and plants, and exerts a
number of diverse signal functions in plants. It is a free radical that can either
gain or lose an electron to energetically more favourable structures such as
the nitrosonium cation (NO+) and the nitroxyl radical (NO-). NO has recently
been identified as an essential molecule that mediates hypersensitive cell
death and defence gene activation in plants (Delledonne et al., 1998; Durner
et al., 1998; Tada et al., 2004) (Figure 1.4).
22
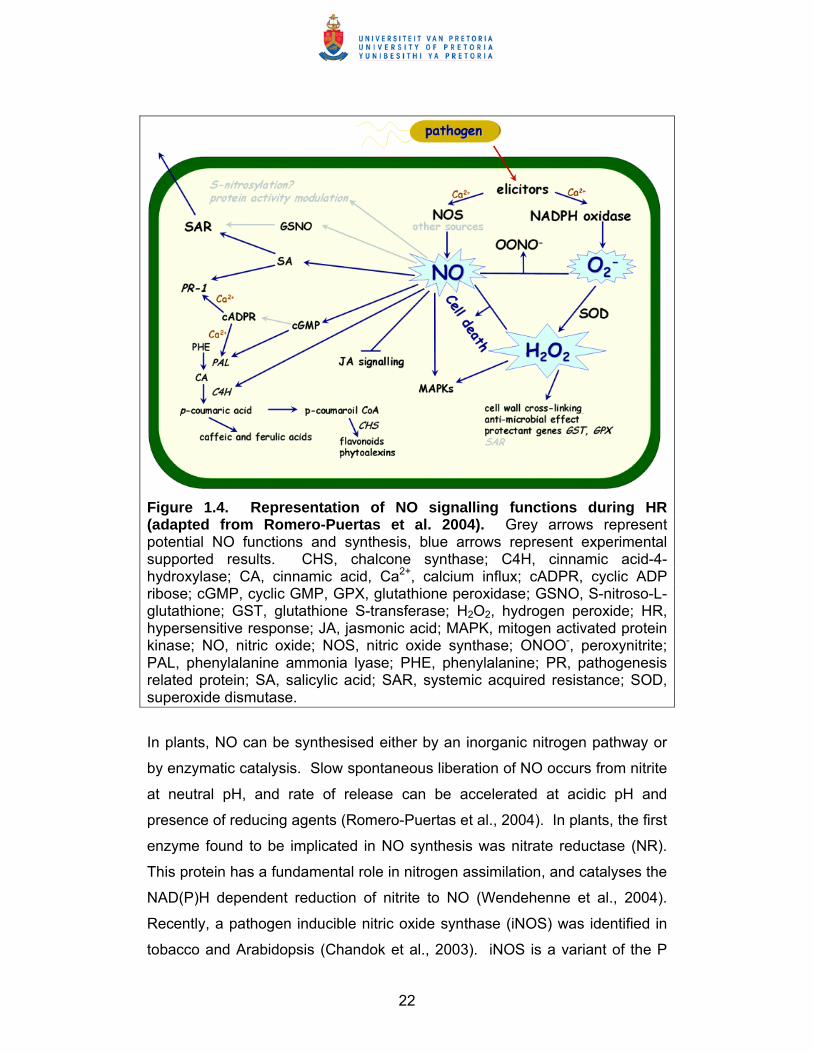
Figure 1.4. Representation of NO signalling functions during HR (adapted from Romero-Puertas et al. 2004). Grey arrows represent potential NO functions and synthesis, blue arrows represent experimental supported results. CHS, chalcone synthase; C4H, cinnamic acid-4-hydroxylase; CA, cinnamic acid, Ca2+, calcium influx; cADPR, cyclic ADP ribose; cGMP, cyclic GMP, GPX, glutathione peroxidase; GSNO, S-nitroso-L-glutathione; GST, glutathione S-transferase; H2O2, hydrogen peroxide; HR, hypersensitive response; JA, jasmonic acid; MAPK, mitogen activated protein kinase; NO, nitric oxide; NOS, nitric oxide synthase; ONOO-, peroxynitrite; PAL, phenylalanine ammonia lyase; PHE, phenylalanine; PR, pathogenesis related protein; SA, salicylic acid; SAR, systemic acquired resistance; SOD, superoxide dismutase.
In plants, NO can be synthesised either by an inorganic nitrogen pathway or
by enzymatic catalysis. Slow spontaneous liberation of NO occurs from nitrite
at neutral pH, and rate of release can be accelerated at acidic pH and
presence of reducing agents (Romero-Puertas et al., 2004). In plants, the first
enzyme found to be implicated in NO synthesis was nitrate reductase (NR).
This protein has a fundamental role in nitrogen assimilation, and catalyses the
NAD(P)H dependent reduction of nitrite to NO (Wendehenne et al., 2004).
Recently, a pathogen inducible nitric oxide synthase (iNOS) was identified in
tobacco and Arabidopsis (Chandok et al., 2003). iNOS is a variant of the P
23
protein of the glycine decarboxylase complex, displays typical NOS activity
and requires the same cofactors as its mammalian counterpart (Chandok et
al., 2003). However, with the exception of a few conserved domains, very
little homology exists between plant and mammalian NOS proteins, implying
that plant iNOS probably uses distinct chemistry to generate NO
(Wendehenne et al., 2004).
NO signalling in plants (illustrated in Figure 1.4) is exerted through the
secondary messengers cyclic GMP (cGMP), cyclic ADP-ribose (cADPR) and
Ca2+. NO binds to soluble guanylate cyclase, thereby activating the enzyme
and increasing the level of cGMP. cGMP has been shown to induce the
levels of a number of defence related proteins including pathogenesis related
1 protein (PR1), phenylalanine ammonia lyase (PAL) and cinnamate-4-
hydroxylase (C4H) as well as the level of antimicrobial flavonoids and
phytoalexins (Durner et al., 1998; Modolo et al., 2002; Polverari et al., 2003).
One mode of action of cGMP is to stimulate synthesis of cADPR, a second
messenger that stimulates Ca2+ release through intracellular Ca2+ permeable
ryanodine receptor channels (RYR). Like cGMP, cADPR application in
tobacco has also been shown to increase PAL and PR1 levels, a
phenomenon that is amplified when cGMP and cADPR were added
simultaneously (Durner et al., 1998). Thus, cGMP and cADPR appear to act
synergistically to increase defence gene expression.
In animal cells, programmed cell death (PCD) is mainly mediated by
peroxynitrite (ONOO-) that is formed from NO and superoxide (O2•-). In
contrast, evidence from soybean cells indicates that HR associated cell death
appears to be mediated by the relative levels of NO and H2O2 that is formed
by dismutation of O2•- (Delledonne et al., 2001). Consistent with this
conclusion, only the simultaneous increase of NO and H2O2 in tobacco cells
induced cell death that had typical cytological and biochemical features of
PCD (de Pinto et al., 2002). However, evidence from a study by Zhang and
coworkers (2003) suggests that NO regulates HR cell death, but NO synthesis
may not be a prerequisite for initiating the PCD signalling pathway. These
authors showed that NO production in P. syringae-inoculated Arabidopsis did
24
not precede the HR, but rather occurred concurrently with HR. Because NO
was first detected in the extracellular spaces, and then in the cytoplasm of
nearby cells that died soon afterwards, it was proposed that NO facilitates the
cell to cell spread of the HR.
Salicylic acid and systemic acquired resistance In addition to the hypersensitive response that blocks the local growth of an
infecting pathogen, a secondary defence response can be triggered that
renders uninfected parts of the plant resistant to a variety of normally virulent
pathogens (Ryals et al., 1996). This broad spectrum disease resistance is
known as systemic acquired resistance (SAR). Salicylic acid accumulates
after pathogen infection in a wide range of plants, and has been found to
accumulate in systemic tissue following pathogen infection and is closely
associated with the development of SAR (Ryals et al., 1996; Dempsey et al.,
1999). In addition, exogenous application of SA or its analogues, such as 2,6-
dichloroisonicotinic acid (INA) and benzothiadiazole (BTH) has been shown to
induce SAR (Kessmann et al., 1994; Lawton et al., 1996). Associated with the
SA accumulation and the onset of SAR is the induction of a group of
pathogenesis related (PR) genes, which encode small secreted or vacuole
targeted proteins with antimicrobial properties (Ryals et al., 1996; Dong,
2004).
SA is synthesised in plants either via the PAL pathway, or via isochorismate
synthase (ICS) (Wildermuth et al., 2001). Evidence suggests that SA
synthesised through ICS has an important role in plant defence against
pathogens, and that it is required for PR1 gene expression and SAR defence
responses. However, SA also potentiates cell death in response to particular
pathogens or fungal elicitors (Dempsey et al., 1999). As plants that are
defective in ICS gene expression still exhibit cell death when infected with
necrotising pathogens, SA that potentiates plant cell death is probably
synthesised through PAL (Wildermuth et al., 2001).
Evidence for the key role of salicylic acid in defence response came from the
analysis of transgenic plants expressing the bacterial nahG gene, which
25
encodes the enzyme salicylate hydroxylase that inactivates salicylic acid by
converting it to catechol. Transgenic NahG plants are unable to accumulate
salicylic acid, and are also incapable of developing SAR, indicating that
salicylic acid is required for the expression of SAR (Gaffney et al., 1993).
Studies on Arabidopsis mutants aimed at identifying components of the SA
dependent signalling pathway led to the isolation of the NPR1 gene which is a
key regulator in transducing the SA signal leading to PR gene expression and
SAR (Cao et al., 1998). NPR1 senses the SA signal through a change in
redox potential in the cell (Mou et al., 2003). A low redox potential leads to
the dissociation of the NPR1 oligomer in the cytoplasm through reduction of
the disulphide bonds that hold the oligomer together. The dissociated NPR1
monomer translocates into the nucleus where it activates SA inducible genes
through interaction with a subclass of the TGA transcription factors (Zhang et
al., 1999; Zhou et al., 2000; Després et al., 2003). NPR1 encodes a novel
protein with ankyrin repeats, which are necessary and sufficient for the
interaction with TGA transcription factors, although high affinity interactions
also require the N terminal one third of NPR1 (Zhang et al., 1999). Despres
and coworkers reported that TGA1 and TGA4 interact with NPR1 following SA
treatment. Both TGA1 and TGA4 have unique cysteine residues that are
oxidised in the cell’s unreduced state, forming an intramolecular disulphide
bond. However, SA induction leads to the establishment of a reduced state,
which breaks the disulphide bonds, allowing interaction between NPR1 and
TGA1 and TGA4, and subsequent PR gene expression. Besides TGAs,
WRKY transcription factors have been suggested to play an important role in
SAR related gene expression (Maleck et al., 2000; Yu et al., 2001).
Significantly, WRKY transcription factors have recently been shown to bind
the NPR1 promoter, indicating that they positively regulate NPR1 expression
during SAR (Yu et al., 2001).
Evidence that monocot and dicot plants share a conserved signal transduction
pathway controlling NPR1 mediated resistance came from a study in which
Arabidopis NPR1 was over expressed in rice plants (Chern et al., 2001).
Transgenic rice plants challenged with the rice bacterial blight pathogen,
26
Xanthomonas oryze pv. oryzae (Xoo), displayed enhanced resistance to Xoo.
Four rice bZIP proteins (rTGA2.1, rTGA2.2, rTGA2.3 and rLG2) were found to
directly interact with NPR1 (Chern et al., 2001). Chern and coworkers (Chern
et al., 2005) have recently reported the isolation of a rice NPR1 homologue
(NH1). Transgenic rice plants overexpressing NH1 acquired high levels of
resistance to Xoo, and yeast two hybrid studies indicated that NH1 interacts
with the rice transcription factor rTGA2.2.
Nitric oxide is thought to play an important role in signalling pathways leading
to SAR. NO treatment induces SA accumulation and its conjugates in
tobacco (Durner et al., 1998). Furthermore, activation of PR1 by NO is
mediated through SA, because it is blocked in transgenic NahG plants which
are unable to accumulate SA (Durner et al., 1998). Although SA is an
important molecule required for defence gene induction in uninfected distal
tissue, it is not the key signal that activates SAR (Mauch-Mani and Metraux,
1998). Durner and colleagues (1998) have proposed that nitroso glutathione
(GSNO) is a potential candidate for long distance signalling involved in SAR.
These authors showed that GSNO is a powerful inducer of plant defence
genes. GSNO has also been shown to induce systemic resistance against
TMV infection in tobacco (Song and Goodman, 2001). Furthermore,
glutathione is a major metabolite in phloem, where the SAR signal is most
probably transmitted (Romero-Puertas et al., 2004).
A recent study illustrated the importance of S-nitrosoglutathione reductase
(GSNOR) in Arabidopsis defence responses (Feechan et al., 2005). S-
nitrosylation of the antioxidant tripeptide glutathione forms GSNO, which is
thought to function as a mobile reservoir of NO bioactivity. GSNOR is able to
metabolise GSNO as well as other protein S-nitrosothiols (SNOs). Feechan
and coworkers (2005) showed that an increase in GSNOR activity led to
decreased formation of SNOs, enhancing protection against ordinarily virulent
microbial pathogens. Conversely, loss of GSNOR activity led to increased
SNO levels, and both basal and nonhost disease resistance were also
compromised (Feechan et al., 2005). Importantly, GSNOR was shown to
positively regulate the signalling network controlled by SA in Arabidopsis.
27
Jasmonic acid and ethylene NahG plants have also been valuable tools in the discovery of novel, salicylic
acid independent defence pathways that, like SAR, convey broad spectrum
systemic resistance. Several research groups demonstrated that specific
defence responses are unaffected by the absence of salicylic acid in the
NahG plants, which indicates that these defence reactions operate
independently of salicylic acid (Pieterse and Van Loon, 1999). This is
supported by the discovery that several defence responses can be activated
without an increase in the level of salicylic acid or salicylic acid marker gene
expression. In this light, the plant growth regulators jasmonic acid and
ethylene have emerged as important signalling molecules in salicylic acid
independent signalling.
Jasmonic acid (JA) is a fatty acid hormone derived from linolenic acid via the
octadecanoid pathway (Turner et al., 2002). JA and its methyl ester methyl
jasmonate (MeJA – collectively referred to as jasmonates) act as signalling
molecules in many processes in plants including pollen and seed
development, and defence against wounding, ozone, insect pests and
microbial pathogens (Kunkel and Brooks, 2002; Voelckel and Baldwin, 2004).
Evidence indicates that jasmonates and ethylene act synergistically to induce
defence responses in plants. Both are rapidly produced when the plant is
attacked by a pathogen, particularly during necrotising infections where the
rise in jasmonic acid levels even extends to systemic tissues (Penninckx et
al., 1996). Moreover, exogenous application of these signalling molecules
induces a set of defence genes that are also activated upon pathogen
infection, among which are genes encoding plant defensins or thionins which
exhibit antimicrobial activity (Terras et al., 1995; Epple et al., 1997). In
Arabidopsis NahG plants, pathogen induced systemic activation of the plant
defensin PDF1.2 is unaffected, indicating that this regulatory pathway is
salicylic acid independent. Interestingly, PDF1.2 gene expression is blocked
in the ethylene insensitive mutant ein2 and the jasmonic acid insensitive
mutant coi1 demonstrating that the signalling pathway involved in PDF1.2
28
induction requires components of the ethylene and jasmonic acid response
(Penninckx et al., 1996; Pieterse and Van Loon, 1999).
Jasmonic acid has emerged as an important signal in a plant’s wound
response against insect and herbivore feeding (Wasternack and Parthier,
1997; Leon et al., 2001). Wounding not only causes a rapid production of
jasmonic acid, but levels of ethylene increase as well. O’Donnell and
coworkers (1996) demonstrated that neither wounding, nor jasmonic acid was
able to induce the expression of the tomato pin (proteinase inhibitor) gene, a
marker of the wound response, in the presence of ethylene inhibitors.
Similarly, ethylene is unable to activate pin gene expression by itself, an
indication that ethylene must sensitize the tissue to the inducing action of
jasmonic acid (O'Donnell et al., 1996).
Although both wounding and pathogen attack involve the production of
jasmonic acid and ethylene, several lines of evidence indicate that their
respective response pathways are distinct. For example, in tobacco,
wounding and pathogen attack show differential activation of different
members of the PR gene families (Bol et al., 1996). Wounding appears to
inactivate basic PR genes, whereas pathogen attack predominantly leads to
acidic PR gene expression. A possible cause might be that upon wounding
only jasmonic acid and ethylene appear to play a role, whereas after pathogen
infection salicylic acid is produced as well. Salicylic acid and its functional
analogues inhibit jasmonic acid induced defence gene expression (Kunkel
and Brooks, 2002).
The study of Arabidopsis mutants have helped to elucidate and highlight the
complexity of jasmonate signalling during defence response. The coi1
mutation defines an Arabidopsis gene that functions in the jasmonate
signalling pathway required for pollen development and defence against
pathogens and insects. Characterisation of the COI1 gene indicated that it
encodes a protein containing leucine rich repeats and an F box motif (Xie et
al., 1998). F box proteins are known to function as receptors that selectively
recruit regulatory proteins as substrates for ubiquitination. Thus, it appears
29
that COI1 is required to degrade a repressor of the jasmonate signalling
pathway. Experiments using coimmunoprecipitation suggest that COI1 forms
part of a functional E3 type ubiquitin ligase complex, and mediates
ubiquitination of histone deacetylase, leading to the activation of the
jasmonate responsive genes (Devoto et al., 2002).
Cross talk between signalling pathways The interactions between SA and JA signalling appear to be complex, and
there are a number of examples of antagonistic action between the two
pathways. Expression of the JA/ET independent gene PDF1.2 is strongly
inhibited by SA, as demonstrated by increased PDF1.2 expression in nahG
plants following infection with Alternaria brasicola (Penninckx et al., 1996).
Furthermore, Arabidopsis mutants eds4 and pad4, which are impaired in SA
accumulation, displayed increased PDF1.2 expression after treatment with
MeJA (Gupta et al., 2000). Characterisation of the Arabidopsis JA signalling
mutant mpk4 provided genetic evidence that JA signalling negatively
regulates the expression of SA mediated defences (Petersen et al., 2000). In
addition to exhibiting impaired JA signalling, mpk4 plants constitutively
express SA mediated defences (Petersen et al., 2000).
Evidence from Arabidopis mutants seems to indicate that SA dependent
defence responses are effective against biotrophic pathogens, whereas
JA/ethylene dependent defence responses are effective against necrotrophic
pathogens (Murray et al., 2002; Kunkel and Brooks, 2002). The existence of
multiple defence mechanisms might be the evolutionary answer of the plant to
challenges from different groups of pathogens. Although the HR, which is
strongly associated with the accumulation of SA, restricts the growth of
biotrophs, it may strengthen the virulence of necrotrophic pathogens and
promote infection. This hypothesis was supported by the Arabidopsis mutant
dnd1. dnd1 fails to produce a normal HR, and was shown to suppress growth
of the necrotrophic pathogen Botrytis cinerea (Govrin and Levine, 2000). It is
therefore possible that plants have evolved a JA/ET signalling pathway in
order to combat necrotrophic pathogens. In this manner, downregulation of
30
SA dependent defence responses by JA would be a logical evolutionary
adaption.
Evidence from DNA microarray studies (reviewed in section 1.7) indicates that
positive interactions do exist between SA and JA/ET pathways. Microarray
analysis of Arabidopsis plants that had been exposed to a variety of defence
inducing treatments revealed that more than 50 defence related genes were
coinduced by SA and JA, suggesting that the two signals coordinately
regulate these genes (Schenk et al., 2000). Similarly, Salzman and
colleagues (Salzman et al., 2005) performed a microarray study in sorghum,
which showed that genes from the octadecanoic acid pathway responsible for
JA synthesis were induced by SA as well as JA, and that mutual antagonisms,
as well as synergistic effects, existed between SA and JA/ET pathways.
1.6 BIOCHEMISTRY OF PLANT DEFENCE RESPONSES
A major target of signal transduction is the cell nucleus where the terminal
signals lead to the transcriptional activation of numerous genes, and
consequently to the de novo synthesis of a variety of proteins and
antimicrobial compounds. Studies with different plant pathology systems have
revealed that the active response of plants to attempted pathogen infection is
associated with dramatic reprogramming of cellular metabolism (Rushton and
Somssich, 1998). Expression of a large array of genes whose products are
involved both in diverse primary and secondary metabolic pathways are
rapidly induced or strongly upregulated. These include genes encoding
enzymes of the shikimate and the general phenylpropanoid pathways along
with enzymes from subsequent branch pathways (Rushton and Somssich,
1998). Another group of genes, the PR genes, are closely associated with the
defence response (Van Loon and van Strien, 1999). In addition, a range of
secondary signalling molecules are generated to ensure coordination of the
defence response both temporally and spatially, resulting in rapid containment
of the pathogen.
31
Pathogenesis related proteins A major response to pathogen attack is the expression of a number of plant
genes which encode PR proteins. The PRs have typical physiochemical
properties that enable them to resist acidic pH and proteolytic cleavage and
survive the harsh environments where they occur, which include vacuoles, cell
wall or intercellular spaces. PR proteins were first discovered and classified in
tobacco, but have subsequently been found to occur in other plant species
including monocots (Stintzi et al., 1993). Currently, fourteen families of PR
proteins have been classified (Table 1.2). Within each PR family, a type
member has been defined, the nucleotide sequence of the mRNA of which
may be used in the search for homologues in the same or different plant
species (Van Loon and van Strien, 1999).
For the majority of the PR families, activities are known or can be inferred.
The PR2 family consists of endo-β-1,3-glucanases, and PR3, PR4, PR8 and
PR11 are all classified as endochitinases. A way of distinguishing these types
of chitinases is by class, based on their different specific activities on a range
of substrates, with class III (PR8) basic isoforms possessing substantial
lysozyme activity (Van Loon and van Strien, 1999). The PR5 family belongs
to the thaumatin like proteins with homology to permatins that permeabilise
fungal membranes (Vigers et al., 1991). PR6 are proteinase inhibitors
implicated in defence against insects and other herbivores, microorganisms
and nematodes. PR7 has so far been characterised only in tomato, where it
is a major PR and acts as an endoproteinase. The PR9 family of peroxidases
is likely to function in strengthening plant cell walls by catalysing lignin
deposition in reaction to microbial attack. The PR10 family is structurally
related to ribonucleases, however their capability to cleave viral mRNA
remains to be demonstrated. The PR12 defensins, PR13 type thionins and
PR14 type lipid transfer proteins all exhibit antifungal and antibacterial activity,
exerting their effect at the level of the plasma membrane of the target
microorganism (Bohlmann, 1994; Garcia-Olmedo et al., 1995; Broekaert et al.,
1997). The only PR family for which no fuction or relationship is known is the
PR1 protein family (Van Loon and van Strien, 1999).
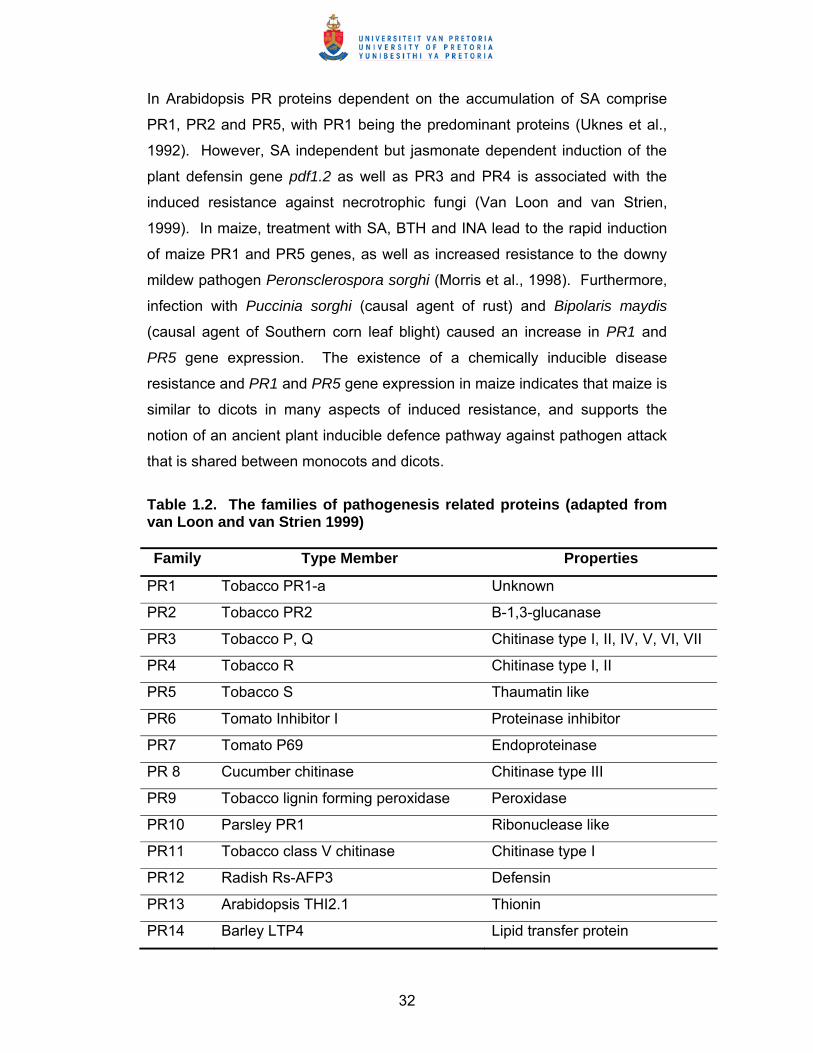
32
In Arabidopsis PR proteins dependent on the accumulation of SA comprise
PR1, PR2 and PR5, with PR1 being the predominant proteins (Uknes et al.,
1992). However, SA independent but jasmonate dependent induction of the
plant defensin gene pdf1.2 as well as PR3 and PR4 is associated with the
induced resistance against necrotrophic fungi (Van Loon and van Strien,
1999). In maize, treatment with SA, BTH and INA lead to the rapid induction
of maize PR1 and PR5 genes, as well as increased resistance to the downy
mildew pathogen Peronsclerospora sorghi (Morris et al., 1998). Furthermore,
infection with Puccinia sorghi (causal agent of rust) and Bipolaris maydis
(causal agent of Southern corn leaf blight) caused an increase in PR1 and
PR5 gene expression. The existence of a chemically inducible disease
resistance and PR1 and PR5 gene expression in maize indicates that maize is
similar to dicots in many aspects of induced resistance, and supports the
notion of an ancient plant inducible defence pathway against pathogen attack
that is shared between monocots and dicots.
Table 1.2. The families of pathogenesis related proteins (adapted from van Loon and van Strien 1999) Family Type Member Properties
PR1 Tobacco PR1-a Unknown
PR2 Tobacco PR2 Β-1,3-glucanase
PR3 Tobacco P, Q Chitinase type I, II, IV, V, VI, VII
PR4 Tobacco R Chitinase type I, II
PR5 Tobacco S Thaumatin like
PR6 Tomato Inhibitor I Proteinase inhibitor
PR7 Tomato P69 Endoproteinase
PR 8 Cucumber chitinase Chitinase type III
PR9 Tobacco lignin forming peroxidase Peroxidase
PR10 Parsley PR1 Ribonuclease like
PR11 Tobacco class V chitinase Chitinase type I
PR12 Radish Rs-AFP3 Defensin
PR13 Arabidopsis THI2.1 Thionin
PR14 Barley LTP4 Lipid transfer protein
33
Cell wall fortification Microbes must negotiate the plant cuticle and the plant cell wall to reach the
cell and cause disease. Plant cell walls are complex consisting of proteins
carbohydrates, lignin and water with encrusting molecules including cutin,
suberin and certain inorganic compounds (Shailasree et al., 2004). Exposure
to pathogens brings about further change in composition and structure.
One type of cell wall fortification that occurs rapidly in response to biotrophic
fungal invasion is the formation of papillae. These papillae, which are
primarily composed of callose (a β-1,3-glucan polymer) and lignin, are thought
to act as a physical barrier blocking fungal penetration into plant cells
(Hammond-Kosack and Jones, 2000). Callose plays a further role in plant
defence through the blockage of plasmodesmata which impedes cell to cell
movement of viruses (Beffa et al., 1996).
Extracellular basic hydroxyproline rich glycoproteins (HRGPs) contribute to
cell wall fortification in two ways. Firstly, preformed HRGPs rapidly crosslink
to the cell wall matrix by way of tyrosine through reaction with induced H2O2.
This may constitute one of the earliest defence responses accompanying the
oxidative burst (Bradley et al., 1992). Later, de novo HRGP synthesis initiates
additional lignin polymerisation to further reinforce cell walls (Hammond-
Kosack and Jones, 2000). Shailasree and colleagues (2004) demonstrated
that pearl millet cultivars rapidly accumulated HRGPs in response to infection
with S. graminicola. These authors also showed that HRGPs accumulated to
a higher level in resistant cultivars compared to susceptible ones, and
crosslinking of HRGPs to the cell wall only occurred in downy mildew resistant
pearl millet cultivars.
Plant pathogens produce a number of cutinases and cell wall hydrolysing
enzymes, such as pectinases, cellulases, xylanases and polygalacturonases
(PG), which attack the various cell wall polymers. Another class of plant
defence related extracellular proteins are polygalacturonase inhibiting proteins
(PGIPs), which have been shown to inhibit PG activity (De Lorenzo and
34
Ferrari, 2002). It has been hypothesised that PGIPs may retard PG function,
which would lead to elevated abundance of oligogalacturonides with a chain
length of >8 units. These, in turn, may trigger additional defence responses
(De Lorenzo and Ferrari, 2002). Alternatively, PGIPs may slow the rate of
hyphal extension so that other components of the defence response can be
more effectively deployed (Hammond-Kosack and Jones, 1996).
Interestingly, PGIPs possess a LRR domain similar to that predicted for
several of the cloned R gene products (Bent, 1996). Recently, Kemp and
coworkers (Kemp et al., 2003) provided the first evidence for the presence of
a PGIP in a monocotyledonous cereal. These authors isolated a PGIP from
wheat that was closely associated with the cell wall, and exhibited a highly
selective inhibitory activity against PGs from various fungi. N-terminal
sequencing of the wheat PGIP showed that the protein displayed no similarity
to any other characterised PGIP.
Lipoxygenases Lipoxygenases (LOXs) are a class of non-heme, iron containing dioxygenases
that catalyse the oxygenation of polyunsaturated fatty acids with a 1,4-cis,cis-
penatadiene structure to form conjugated diene hydroperoxide. Products of
LOX action include plant defence compounds such as jasmonates, lipid
peroxides, and antimicrobial and antifungal compounds such as leaf
aldehydes or divinyl ethers (Babitha et al., 2004). Rapid increases in LOX
enzyme activity and/or mRNA and protein levels are frequently found to be
associated with R-Avr gene mediated incompatibility (Hammond-Kosack and
Jones, 1996). Increased LOX activity may contribute to resistance in a
number of ways. For example, the primary products of LOX, the fatty acid
hydroperoxides, are very reactive and may cause oxidative damage to
membranes, leading to leakage of cellular contents, and ultimately plant cell
death (Hildebrand, 1989). Babitha and coworkers (2004) recently reported
the induction of LOX in downy mildew resistant pearl millet seedlings upon
inoculation with S. graminicola, and demonstrated that de novo synthesis of
the LOX6 isozyme was linked to resistance to downy mildew.
35
Phytoalexins Phytoalexins are low molecular mass, lipophilic compounds that accumulate
rapidly at sites of incompatible pathogen infection. Phytoalexin biosynthesis
occurs after primary metabolic precursors are diverted into secondary
metabolic pathways. For example, phenylalanine is diverted into the
synthesis of various flavonoid phytoalexins by the de novo synthesis of PAL,
an enzyme that controls a key branchpoint in the phenylpropanoid
biosynthetic pathway (Hammond-Kosack and Jones, 2000). Well
characterised phytoalexins include camalexin from wild type Arabidopsis
plants (Browne et al., 1991) and the grapevine phytoalexin resveratrol (Hain et
al., 1993). The biosynthesis of resveratol was engineered in tobacco by
constitutively expressing the terminal biosynthetic enzyme stilbene synthase
(Hain et al., 1993). Transgenic tobacco plants exhibited enhanced resistance
to the necrotrophic fungus B. cinerea. Grayer and Kokubun (Grayer and
Kokubun, 2001) showed that the rice leaf phytoalexins sakuranetin and
momilactone A were produced within three days of inoculation with the rice
blast fungus M. grisea. Further studies suggested that blast resistant cultivars
produced much higher quantities of phytoalexins than blast sensitive cultivars.
Transcription factors Transcriptional activation of genes is a vital part of the plants defence system
against pathogens. Differences in the expression patterns of pathogen
responsive genes are a result of the architecture of the promoters. Research
carried out over the past few years has been productive in identifying
promoter elements and transcription factors that bind to these elements that
are important for regulating plant responses to pathogens. Transcription
factors that play an important role in defence response belong to WRKY,
bZIP, ethylene responsive element binding proteins (EREBP), Whirly and Myb
protein families. EREBPs, WRKY and Whirly proteins appear to be unique to
plants, whereas other transcription factors such as bZIP and Myb proteins
also have counterparts in animals (Rushton and Somssich, 1998).
WRKY proteins comprise a large family of transcription factors with 74
members in Arabidopsis and more than 90 members in rice (Ülker and
36
Somssich, 2004). Common to these proteins is a DNA binding region of
approximately 60 amino acids in length (the WRKY domain) that contains the
conserved amino acid motif WRKYGQK, adjacent to a zinc finger like motif.
WRKY factors show high binding affinity to a DNA sequence designated the
W box that displays the characteristic DNA sequence (C/T)TGAC(T/C). W
box dependent binding activity requires both the invariable WRKY amino acid
signature and the cysteine and histidine residues of the WRKY domain that
tetrahedrally coordinate a zinc atom (Ülker and Somssich, 2004).
Transcriptome analyses have revealed that W boxes and related sequence
motifs are ubiquitously conserved in upstream regions of genes that are
upregulated during SAR, R gene mediated resistance or basal resistance
(Maleck et al., 2000; Ramonell et al., 2002).
Specific WRKY family members show enhanced expression and/or DNA
binding activity following induction by a range of pathogens, defence signals
and wounding (Euglem et al., 2000). Several lines of evidence also exist
which show a role for WRKY transcription factors in MAPK kinase signalling
cascades. Two Arabidopsis WRKY factors (AtWRKY22 and AtWRKY29)
have been identified as important downstream components of a MAPK
pathway that confers resistance to both bacterial and fungal pathogens (Asai
et al., 2002); see section 1.5). Similarly chitin also upregulates a group of
WRKY genes including AtWRKY22 and AtWRKY29 (Wan et al., 2004).
Furthermore, Arabidopsis WRKY70 was recently identified as a common
regulatory component of SA and JA dependent defence signalling (Li et al.,
2004). WRKY70 acts as an activator of SA signalling, but as a repressor of
the JA signalling pathway, thus mediating crosstalk between these
antagonistic pathways.
bZIPS represent a large family of transcription factors that possess a basic
region that binds DNA and a leucine zipper dimerisation motif. One class of
bZIP proteins that is linked to plant defence responses comprises the TGA
element binding factor proteins. TGA transcription factors were originally
identified by their ability to bind to the as1 like elements
(CTGACGTAAGGGATGACGCAC), a class of general stress responsive
37
elements (Rushton and Somssich, 1998). Some stress responsive genes that
contain as1 like elements and are regulated by TGA factors include PR1 and
glutathione S-transferase 6 (GST6) genes (Singh et al., 2002). A major
advance was the discovery that TGA family members bind to the NPR1 in
Arabidopsis as well as its homologue NH1 in rice (Després et al., 2003; Chern
et al., 2005). NPR1 is a key component in SA defence signalling, and
treatment of plants with SA increases the interaction between TGA proteins
and NPR1, and enhances the DNA binding activity of specific TGA proteins
(Fan and Dong, 2002).
EREBPs share a conserved 58-59 amino acid domain (the ERFdomain) that
can bind to a GCC box cis element. GCC boxes (AGCCGCC) and related
cis-elements mediate gene expression in response to various pathogens and
defence elicitors (Euglem, 2005). Further evidence for the role of EREBPs in
defence has come from yeast two hybrid experiments in which PTO kinase, a
product of the tomato Pto R gene, was shown to interact with and
phosphorylate an EREBP called PTO-INTERACTING4 (PTI4) (Zhou et al.,
1997). As a result, the DNA binding capacity of PTI4 to the GCC box is
increased. Thus, PTO appears to confer resistance to Pseudomonas
syringae strains carrying the corresponding avrPto avirulence genes by
activating a signalling pathway that leads through EREBPs to activate PR
genes containing GCC boxes.
Whirly transcription factors are single stranded DNA binding proteins that
were first identified in potato were they were found to activate or repress the
expression of the potato PR10a gene (Boyle and Brisson, 2001). These
transcription factors obtained their name from the ‘Whirly-gig’ like structures
they form through the association of four protomers in a cyclic C4 symmetry
(Desveaux et al., 2005). Studies on Arabidopsis mutants defective in Whirly
transcription factor function indicated that the Whirly transcription factor
AtWhy1 is required for SA dependent R mediated resistance, basal resistance
and SAR (Desveaux et al., 2005). In response to SA treatment, AtWhy1
tetramers bind to single stranded GTCAAAA/T containing DNA. However,
AtWhy1 SSB activity is independent of NPR1, which suggests that AtWhy1 is
38
likely to play a role in NPR1-independent salicylic signalling pathways
(Desveaux et al., 2005). Although not yet studied in a lot of detail, Whirly
family members have also been identified in the cereals wheat (2), rice (2)
and maize (2), and partial sequences have also been identified in sugar cane
(Saccharum officinarum) and rye (Secale cereale).
Certain Myb transcription factors have also been found to be upregulated
during pathogen attack and other defence related stimuli (Rushton and
Somssich, 1998; Euglem, 2005). A combined metabolomic and
transcriptomic analysis of the Arabidopsis mutant pap1-D, which
overexpresses the Myb transcription factor PAP1, indicated that genes and
subsequent metabolites involved in the phenylpropanoid and flavonoid
biosynthetic pathways were significantly upregulated (Tohge et al., 2005).
Genes and metabolites from these pathways are known to play an important
role in plant defence response (Hammond-Kosack and Jones, 2000). One
Myb binding motif (type 1, GG/TTA/TGG/TT) is generally conserved in
promoters of WRKY genes, which further supports the suggestion that Myb
factors have roles in defence regulation (Euglem, 2005).
1.7 DNA MICROARRAYS: TOOLS FOR STUDYING GLOBAL GENE EXPRESSION CHANGES DURING PLANT DEFENCE RESPONSE
The analysis of plant-pathogen interactions and defence signalling processes
in plants have traditionally been reductionist in approach, and have focussed
on only one or a few defence response genes at any one time. From such
studies, it has not been possible to assess the extent of overlap of gene
activation by different signals and pathogens during defence response. The
advent of DNA microarray technology has revolutionised the study of plant-
pathogen interactions, and can provide information on the expression patterns
of thousands of genes in parallel.
DNA microarray technology The key principle behind microarray technology is the large scale hybridisation
of fluorescently labelled nucleic acid molecules from biological samples to be
39
analysed to an array of complementary single stranded DNA sequences
immobilised on a solid surface. Two types of microarrays are commonly used
in transcriptome analysis; spotted or deposition microarrays and Affymetrix
microarrays (www.affymetrix.com). In spotted microarrays, collections of DNA
samples are deposited onto a glass slide using robotics. These microarrays
are highly flexible as they may be constructed from anonymous clones found
in genomic, subtractive, differentially displayed or normalised libraries or from
commercially synthesised long (n = 50-70) oligonucleotides (Ramonell and
Somerville, 2002). Alternatively, Affymetrix chips consist of an array of
oligonucleotides (n = 20-25) that have been synthesised in situ on a solid
substrate using photolithography. Each gene to be analysed is typically
represented by twenty specific probes on the chip. In contrast to spotted
microarrays, Affymetrix chips require prior knowledge of DNA sequence
information but permit single base change analysis. However, Affymetrix
arrays are only available commercially, and their expense often limits the
number and scale of experiments that can be performed in a typical
laboratory. An advantage of using spotted oligonucleotide and Affymetrix
microarrays over cDNA microarrays is that they offer sequence specific
detection of gene expression, which is especially important when studying the
expression of different gene family members.
In spotted microarrays, relative mRNA abundances are compared in different
samples by extraction of RNA from samples, conversion to cDNA, labelling
with different fluorescent dyes, and simultaneous hybridisation of samples to
the array. The amount of each labelled target bound to each spot on the array
is then quantified. The ratio of signal intensities between control and test
cDNA targets reflects the induced/repressed or unchanged expression of
mRNA species under study.
Described below are a number of examples of how DNA microarrays have
been employed to examine plant-pathogen interactions, the plant’s response
to mechanical wounding and insect damage, and to study coordinated
responses between different signalling pathways. The chosen examples by
no means represent all microarray defence profiling studies, but have rather
40
been chosen to illustrate studies in non model plants and cereal crops,
defence response to elicitor treatment, and detailed analysis of coordinated
defence responses.
Profiling plant-pathogen interactions A number of microarray experiments have been performed to examine the
effect of pathogens on plant gene expression. Baldwin and coworkers.
(Baldwin et al., 1999) undertook one of the first plant-pathogen interaction
studies using DNA microarray technology. These authors used an Affymetrix
chip representing 1500 maize ESTs, and observed that 117 genes were either
induced or repressed six hours after challenge with the fungal pathogen
Helminthosporium maydis. The same maize gene chip was subsequently
used to investigate the differential gene expression in the Les9 maize mutant,
which forms spontaneous lesions and exhibits an upregulation of defence
related genes and enhanced resistance to Bipolaris maydis (Nadimpalli et al.,
2000). One third of the genes on this array were defence related genes, and
nearly 70 genes showed changes in mRNA abundance of twofold or higher.
Most of these genes were involved in defence, or were unknown or not
previously implicated in plant defence. Unfortunately, neither study revealed
the identities of induced or repressed genes except for the Zm-hir3 gene
which is implicated to be involved in cell death through ion channel regulation
(Kazan et al., 2001).
Dowd and coworkers (Dowd et al., 2004) recently performed a gene
expression profiling study to examine the changes in cotton root and
hypocotyls tissues in response to infection with Fusarium oxysporum f. sp.
vasinfectum. As cotton is a non model plant system, the authors prepared
microarrays using clones from two cDNA libraries. One library was prepared
from infected tissues from several time points after infection, and a second
library was prepared from uninfected cotton tissues. Following microarray
hybridisations, differentially expressed genes were sequenced and analysed
for sequence homology to known genes. Microarray analysis of this
susceptible plant pathogen interaction revealed different gene expression
profile changes in cotton root and hypocotyls tissues. In hypocotyls tissues
41
infected with F. oxysporum f. sp. vasinfectum, increased expression of
defence related genes was observed, whereas few changes in expression
levels of defence related genes were found in infected root tissues. In
infected roots, more plant genes were repressed than induced, especially at
earlier stages of infection. Although many known cotton defence responses
were identified including induction of PR genes, gossypol biosynthesis genes,
potential new defence responses were also identified such as the biosynthesis
of lignans.
In addition to plant-pathogen gene profiling, microarray profiling has been
applied to study the effect of the addition of elicitors to plant cultures
(Ramonell et al., 2002; Akimoto-Tomiyama et al., 2003; Fujiwara et al., 2004).
Ramonell et al. (2002) characterised gene expression patterns in Arabidopsis
in response to chitin treatment using an Arabidopsis microarray consisting of
2375 EST clones representing putative defence related and regulatory genes.
These authors identified 71 genes whose expression was altered more than
three fold in response to chitin treatment. Many of these genes were reported
to be elicited by various pathogen related stimuli in other plants. Interestingly,
the chitin gene expression profile was different to those obtained previously
for SA, methyl jasmonate and ethylene treatment in Arabidopisis (Schenk et
al., 2000) suggesting that perhaps chitin acts in parallel with these defence
signalling molecules to influence the outcome of encounters between fungal
and/or insect pathogens and plants (Ramonell et al., 2002). In a similar
experiment Akimoto-Tomiyama et al. (2003) found that N-
acetylchitooligosaccharides significantly induced 166 and repressed 93 out of
8987 randomly chosen rice ESTs in suspension cultured rice cells. Of the 259
ESTs identified as responsive to N-acetylchitooctaose, 18 genes were found
to be involved in signal transduction, including 5 CDPKs.
Fujiwara et al. (2004) employed rice cDNA microarray analysis to examine
gene expression changes in suspension cultured rice cells in response to
treatment with compatible and incompatible strains of Acidovorax avenae. In
all, 131 genes were differentially expressed between compatible and
incompatible interactions. Ninety four genes were up regulated and 32 genes
42
were down regulated during incompatible interactions, whereas only 5 genes
were up regulated during compatible reactions. Among the 126 genes that
were up- or down regulated during incompatible interactions, expression of 46
genes was decreased when cultured rice cells were inoculated with a flagellin
deficient incompatible strain, indicating that approximately 37% of the 126
genes were directly controlled by flagellin perception. Interestingly, OsCDPK7
was found to play a role in flagellin perception. Akimoto-Tomiyana et al.
(2003) also demonstrated that this CDPK is also involved in N-
actelychitooctaose and jasmonic acid perception.
Profiling plant responses to insect attack Herbivorous insects, unlike most plant pathogens, are physiologically
independent of their host plant. They force their way through a plant’s outer
protective barriers with mandibles and mouthparts that cause mechanical
wounds into which herbivore specific elicitors are likely to be introduced during
the interaction. Reymond and coworkers (Reymond et al., 2000) used
Arabidpsis microarrays to analyse and compare the expression of 150
defence related genes after mechanical wounding and insect feeding by
larvae of the cabbage butterfly (Pieris rapae). The interaction between
jasmonate and wound response signal transduction pathways was also
examined in this study. Although PR proteins, genes involved in the
biosynthesis or metabolism of jasmonic acid, genes involved in the tryptophan
pathway, and genes encoding PAL and chalcone synthase showed
coordinated expression, expression profiles of genes after mechanical
wounding were more similar to those of water stress than insect feeding. This
suggested that this insect has developed feeding strategies to minimise the
activation of stress inducible defence related genes.
In a similar study, Zhu-Salzman et al. (Zhu-Salzman et al., 2004) performed
sorghum expression profiling in response to greenbug aphid (Schizaphis
graminum) infestation, as well as MeJA and SA treatments. It has been
proposed that phloem feeding insects are perceived as pathogens due to
similarities in the manner of penetration of plant tissues by fungal hyphae and
aphid stylets, and to some extent, by similar hydrolytic enzymes released
43
during fungal growth and insect feeding (Walling, 2000). In accordance with
this view, Zhu-Salzman et al. (2004) observed strong induction of SA
regulated PR genes by green bug feeding, but weak induction of wounding
and JA related genes. However, infestation tests on control and MeJA treated
plants indicated that MeJA treatment deters greenbug infestation, and
confirmed that JA regulated pathways were effective in plant defence against
greenbugs. Furthermore certain genes were activated exclusively by
greenbugs, and may represent unique signal transduction events independent
of JA and SA regulated pathways. Taken together, these results suggest that
plants co-ordinately regulate defence gene expression when attacked by
phloem feeding aphids, but also suggest that aphids are able to avoid
triggering activation of some otherwise potentially effective plant defensive
machinery, possibly through their particular mode of feeding (Zhu-Salzman et
al., 2004).
In an elegant experiment, Voelckel and Baldwin (Voelckel and Baldwin, 2004)
profiled wild tobacco’s (Nicotiana attenuata) response to attack by sap feeding
mirids (Tupiocoris notatus) and chewing hornworms (Manduca sexta).
Microarrays enriched in herbivore elicited genes (cloned by differential display
reverse transcription PCR and subtractive hybridisation) were used to
characterise single, sequential, or simultaneous attacks by these two main
predators of N. attenuata. Principle component analysis (PCA) identified
distinctly different imprints left by individual attack from the two species after
24 h, but not after 5 days. Moreover, imprints of sequential or simultaneous
attacks differed significantly from those of a single attack. On the individual
gene level this means that when a plant experiences different biological
stressors sequentially or simultaneously, a different suite of genes is induced.
Attack from both herbivores elicited a switch from growth to defence related
transcriptional processes, and herbivore specific changes occurred mainly in
primary metabolism and signalling cascades.
Analysis of coordinated defence responses In the year 2000, two milestone microarray profiling papers appeared that
represented the first large scale analyses of complex signalling pathways and
44
coordinated gene expression between signalling pathways in Arabidopsis.
Maleck et al. (2000) applied microarray technology to provide a
comprehensive description of SAR in Arabidopsis. These researchers
employed an Arabidopsis microarray to profile expression changes in 7000
genes under 14 different conditions related to SAR. About 300 genes were
identified whose expression level changed significantly in response to SAR
treatment. Many of these genes were novel, and had not previously been
shown to play a role in SAR. Clustering of differentially expressed genes, and
subsequent analysis of a gene cluster containing PR1 (a common marker of
SAR) revealed that all 26 genes in this cluster contained core binding sites for
WRKY transcription factors (W boxes) in their promoter region. This suggests
a role for PR1 WRKY transcription factors in PR1 regulation and SAR. Using
a pathology related microarray comprising 2375 elements, Schenk and
coworkers (2000) examined gene expression patterns in Arabidopsis infected
with the fungal pathogen Alternaria brassicola or treated with the defence
signalling molecules SA, MeJA or ethylene. Comparison of plants subjected
to each of the four treatments showed that 126 genes were coordinately
regulated by overlapping defence pathways. The most significant overlap was
observed in the 55 genes that were induced by both SA and MeJA treatment.
This suggests that the extent of overlap between the two pathways was much
greater than previously anticipated. In addition, 50% of the genes induced by
MeJA treatment were also induced by ethylene treatment, suggesting
coordination between these defence signalling pathways.
In a recent study, Salzman et al. (2005) undertook a similar study to Schenk
and coworkers, and examined gene expression in sorghum in response to the
defence signalling compounds SA, MeJA and the ethylene precursor
aminocyclopropane carboxylic acid (ACC). Expression profiles were
generated using a microarray containing 12982 non redundant sorghum
ESTs. Comparison of plant expression profiles in response to the three
treatments yielded similar results to Schenk et al. (2000). In total 727 genes
were co-ordinately regulated by overlapping defence pathways, with the
largest group of coregulated genes occurring between SA and MeJA.
Interestingly, synergistic as well as antagonistic effects on regulation of some
45
genes were observed between SA and JA pathways. For example, genes of
the octadecanoic acid pathway leading to JA synthesis were induced by SA
as well as by MeJA. In contrast, many of the genes induced by either MeJA
or SA were induced at lower levels when plants were treated with a
combination of MeJA+SA. This suggests that two or more independent
molecular switches control flux through the SA and JA pathways. Apparently
both pathways can be switched off (coantagonism) or on (synergism)
simultaneously (Salzman et al., 2005).
The large scale analysis of defence associated genes has accelerated our
understanding of how complex defence networks operate during plant-
pathogen interaction. As the genomes of more crop species are fully
sequenced and annotated, microarrays will be used to study signalling
networks governing plant defence in these plants. Ultimately, as our
understanding of basic processes involved in host-pathogen interactions
improves, the development of better disease protection strategies in
agriculturally important plants will follow.
1.8 AIMS OF THE PROJECT Pearl millet is the world’s sixth most important cereal crop, but very little
funding has been diverted towards pearl millet research. Of all the major
cereals, pearl millet is the most tolerant of heat and drought. Thus, as the
world becomes hotter and drier, this crop will have the power to yield reliably
in regions too arid and too hot to consistently support other grains. Despite its
thermotolerant properties, pearl millet is still affected by a number of diseases
which can result in significant yield reductions. The aim of this project was
therefore to elucidate and understand defence response mechanisms and
signalling networks in pearl millet. We hypothesised that treatment of
monocots with pathogen elicitors and defence signalling molecules would
result in differential expression of defence related genes, and chose to
evaluate this hypothesis in the non-model monocot, pearl millet. This was
accomplished through the construction of a pearl millet cDNA library enriched
for defence response genes, which was subsequently used to profile pearl
millet’s response to the defence signalling molecules NO, SA and MeJA, and
46
to infection with the compatible biotrophic rust fungus P. substriata var. indica.
Selected genes will be used in future cereal transformation projects in which
key regulators of defence signalling networks will be introduced into pearl
millet lines or other cereal crops to convey resistance to chosen pathogens.
Chapter 2 outlines the construction of a pearl millet cDNA library that was
enriched in defence response genes. This was accomplished by treating
pearl millet seedlings with the pathogen elicitors chitin and flagellin as well as
subjecting the leaves to mechanical wounding. Suppression Subtractive
Hybridisation (SSH) was performed to isolate transcripts that were either up-
or downregulated in response to treatment. A quantitative measure for
screening pearl millet SSH cDNA libraries using cDNA microarray analysis is
presented. This method was employed to identify true positive and false
positive clones from the SSH cDNA libraries. The technique also enabled
differentiation between abundantly expressed and rare transcripts following
elicitor treatment. Based on screening results, a selection of genes was
sequenced, and analysed for sequence homology to known genes.
Sequence analysis revealed similarities to many genes known to be involved
in defence response processes.
Chapter 3 examines transcriptional changes in pearl millet related to NO
action following treatment with the NO donor sodium nitroprusside (SNP).
Comparisons are made with NO mediated transcriptional changes known to
occur in Arabidopsis following SNP treatment.
In Chapter 4, a pathogen infection trial was performed to assess whether
treatment of pearl millet with the defence signalling molecules MeJA and SA
conferred resistance to the biotrophic rust pathogen P. substriata var indica.
Furthermore, a microarray profiling study is presented which outlines pearl
millet’s response to MeJA and SA treatment, as well as infection with P.
substriata var. indica. Comparisons were made between treatments to
determine whether there was any overlap between jasmonate and salicylate
pathways in pearl millet, and to assess pearl millet’s transcriptional response
to pathogen attack.
47
Finally, Chapter 5 discusses the results with reference to current ideas around
defence response and signalling networks, and the potential for its application
in the development of higher yielding cereal crops.
1.9 LITERATURE CITED
Agrwal, G. K., H. Iwahashi, and R. Rakwal. 2003. Rice MAPKs. Biochemical and Biophysical Research Communications 302:171-180.
Akimoto-Tomiyama, C., K. Sakata, J. Yazaki, K. Nakamura, F. Fujii, K. Shimbo, K. Yamamoto, T. Sasaki, N. Kishimoto, S. Kikuchi, N. Shibuya, and E. Minami. 2003. Rice gene expression in response to N-acetylchitooligosaccharide elicitor: comprehensive analysis by DNA microarray with randomly selected ESTs. Plant Molecular Biology 52:537-551.
Alvarez, M. E., R. I. Pennell, P. J. Meijer, A. Isikawa, R. A. Dixon, and C. Lamb. 1998. Reactive oxygen intermediates mediate a systemic signal network in the establishment of plant immunity. Cell 92:773-784.
Anderson, J. P., L. F. Thatcher, and K. B. Singh. 2005. Plant defence responses: conservation between models and crops. Functional Plant Biology 32:21-34.
Asai, T., G. Tenna, J. Plotnikova, M. R. Willmann, W. Chiu, L. Gómez-Gómez, T. Boller, F. M. Ausubel, and J. Sheen. 2002. MAP kinase signalling cascade in Arabidopsis innate immunity. Nature 415:977-983.
Ayliffe, M. A. and E. S. Lagudah. 2004. Molecular genetics of disease resistance in cereals. Annals of Botany 94:765-773.
Babitha, M. P., H. S. Prakash, and H. S. Shetty. 2004. Purification and properties of lipoxygenase induced in downy mildew resistant pearl millet seedlings due to infection with Sclerospora graminicola. Plant Science 166:31-39.
Baldwin, D., V. Crane, and D. Rice. 1999. A comparison of gel-based, nylon filter and microarray techniques to detect differential RNA expression in plants. Current Opinion in Plant Biology 2:96-103.
Beffa, R. S., R.-M. Hofer, M. Thomas, and F. Jr. Meins. 1996. Decreased susceptibility to viral disease of -1,3-glucanase-deficient plants generated by antisense transformation. Plant Cell 8:1001-1011.
Bent, A. F. 1996. Plant disease resistance genes: function meets structure. Plant Cell 8:1757-1771.
Bohlmann, H. 1994. The role of thionins in plant protection. Critical Reviews in Plant Sciences 13:1-16.
Bol, J. F., A. S. Buchel, M. Knoester, T. Baladin, L. C. Van Loon, and H. J. M. Linthorst. 1996. Regulation of the expression of plant defence genes. Plant Growth Regulation 18:87-91.
Boller, T. 1995. Chemoperception of microbial signals in plant cells. Annual Review of Plant Physiology and Plant Molecular Biology 46:189-214.
Boyle, B. and N. Brisson. 2001. Repression of the defense gene PR-10a by the single-stranded DNA binding protein SEBF. Plant Cell 13:2525-2537.
48
Bradley, D. J., P. Kjellblom, and C. J. Lamb. 1992. Elicitor- and wound-induced oxidative cross-linking of a proline rich plant cell protein: a novel, rapid defence response. Cell 70:21-30.
Broekaert, W. F., B. P. A. Cammue, M. F. C. De Bolle, K. Thevissen, G. W. De Samblanx, and R. W. Osborn. 1997. Antimicrobial peptides from plants. Critical Reviews in Plant Sciences 16:297-323.
Browne, L. M., K. L. Conn, W. A. Ayer, and J. P. Tewari. 1991. The camalexins: new phytoalexins produced in the leaves of Camelina sativa (cruciferae). Tetrahedron 47:3909-3914.
Brunner, F., S. Rosahl, J. Lee, J. J. Rudd, C. Geiler, S. Kauppinen, G. Rasmussen, D. Scheel, and T. Nürnberger. 2002. Pep-13, a plant defense-inducing pathogen associated pattern from Phytophthora transglutaminases. EMBO Journal 21:6681-6688.
Büschges, R., K. Hollricher, R. Panstruga, G. Simons, M. Wolter, A. Frijters, R. van Daelen, T. van der Lee, P. Diergaarde, and J. Groenedijk. 1997. The barley Mlo gene: a novel control element of plant pathogen resistance. Cell 88:695-705.
Cao, H., X. Li, and X. Dong. 1998. Generation of broad-spectrum disease resistance by overexpression of an essential regulatory gene in systemic acquired resistance. Proceedings of the National Academy of Sciences USA 95:6531-6536.
Chandok, M. R., A. J. Ytterberg, K. J. van Wijk, and D. F. Klessig. 2003. The pathogen-inducible nitric oxide synthase (iNOS) in plants is a variant of the P protein of the glycine decarboxylase complex. Cell 113:469-482.
Che, F.-S., Y. Nakajima, N. Tanaka, M. Iwano, T. Yoshida, S. Takayama, I. Kadota, and A. Isogai. 2000. Flagellin from an incompatible strain of Pseudomonas avenae induces a resistance response in cultured rice cells. The Journal of Biological Chemistry 41:32347-32356.
Chern, M., H. A. Fitzgerald, P. E. Canlas, D. A. Navarre, and P. C. Ronald. 2005. Overexpression of a rice NPR1 homolog leads to constitutive activation of defense response and hypersensitivity to light. Molecular Plant-Microbe Interactions 18:511-520.
Chern, M., H. A. Fitzgerald, R. C. Yadav, P. E. Canlas, X. Dong, and P. C. Ronald. 2001. Evidence for a disease-resistance pathway in rice similar to the NPR1-mediated signaling pathway in Arabidopsis. Plant Journal 27:101-113.
Collmer, A., M. Lindeberg, T. Petnicki-Ocwieja, D. J. Schenieder, and J. R. Alfano. 2002. Genomic mining type III secretion system effectors in Pseudomonas syringae yields new picks for all TTSS pro prospectors. Trends in Microbiology 10:462-469.
Dangl, J. L. and J. D. G. Jones. 2001. Plant pathogens and integrated defence responses to infection. Nature 411:826-833.
De Lorenzo, G. and S. Ferrari. 2002. Polygalacturonase-inhibiting proteins in defense against phytopathogenic fungi. Current Opinion in Plant Biology 5:295-299.
de Milliano, W. A. J. 1992. Pearl millet diseases in Southern Africa, In: W. A. J. de Milliano, R. A. Frederiksen, and G. D. Bengston (eds.), Sorghum and millets diseases. A second world review. ICRISAT, Andhra Pradesh.
de Pinto, M., F. Tommasi, and L. De Gara. 2002. Changes in the antioxidant systems as part of the signaling pathway responsible for the programmed cell death activated by nitric oxide and reactive oxygen species in tobacco bright-yellow 2 cells. Plant Physiology 130:698-708.
49
Deak, M., A. Casamayor, R. A. Currie, C. P. Downes, and D. R. Alessi. 1999. Characterisation of a plant 2-phosphoinositide-dependent protein kinase-1 homologue which contains a pleckstrin homology domain. FEBS letters 451:220-226.
Delledonne, M., Y. Xia, R. A. Dixon, and C. Lamb. 1998. Nitric oxide functions as a signal in plant disease resistance. Nature 394:585-588.
Delledonne, M., J. Zeier, A. Marocco, and C. Lamb. 2001. Signal interactions between nitric oxide and reactive oxygen intermediates in the plant hypersensitive disease resistance response. Proceedings of the National Academy of Sciences USA 98:13454-13459.
Dempsey, D. M. A., J. Shah, and D. F. Klessig. 1999. Salicylic acid and disease resistance in plants. Critical Reviews in Plant Science 18:547-575.
Després, C., C. Chubak, A. Rochon, R. Clark, T. Bethune, D. Desveaux, and P. R. Fobert. 2003. The Arabidopsis NPR1 disease resistance protein is a novel cofactor that confers redox regulation of DNA binding activity to the basic domain/leucine zipper transcription factor TGA1. Plant Cell2181-2191.
Desveaux, D., A. Maréchal, and N. Brisson. 2005. Whirly transcription factors: defense gene regulation and beyond. Trends in Plant Science 10:95-102.
Devoto, A., M. Nieto-Rostro, D. Xie, C. Ellis, R. Harmston, E. Patrick, J. Davis, L. Sherratt, M. Coleman, and J. G. Turner. 2002. COI1 links jasmonate signalling and fertility to the SCF ubiquitin-ligase complex in Arabidopsis. Plant Journal 32:457-466.
Dong, X. 2004. NPR1, all things considered. Current Opinion in Plant Biology 7:547-552.
Dowd, C., I. W. Wilson, and H. McFadden. 2004. Gene expression profile changes in cotton root and hypocotyl tissues in response to infection with Fusarium oxysporum f. sp. vasinfectum. Molecular Plant-Microbe Interactions 17:654-667.
Durner, J., D. Wendehenne, and D. F. Klessig. 1998. Defense gene induction in tobacco by nitric oxide, cyclic GMP, and cyclic ADP-ribose. Proceedings of the National Academy of Science USA 95:10328-10333.
Elliott, C., J. Müller, M. Miklis, R. A. Bhat, P. Schulxe-Lefert, and R. Panstruga. 2005. Conserved extracellular cystein residues and cytoplasmic loop-loop interplay are required for functionality of the heptahelical MLO protein. Biochemistry Journal 385:243-254.
Epple, P., K. Apel, and H. Bohlmann. 1997. Overexpression of an endogenous thionin enhances resistance of Arabidopsis against Fusarium oxysporum. Plant Cell 9:509-520.
Erbs, G. and M.-A. Newman. 2003. The role of lipopolyssacharides in induction of plant defense responses. Molecular Plant Pathology 4:421-425.
Euglem, T. 2005. Regulation of the Arabidopsis defense transcriptome. Trends in Plant Science.
Euglem, T., P. J. Rushton, S. Robatzek, and I. E. Somssich. 2000. The WRKY superfamily of plant transcription factors. Trends in Plant Science 5:199-206.
Fan, W. and X. Dong. 2002. In vivo interaction between NPR1 and transcription factor TGA2 leads to SA-mediated gene activation in Arabidopsis. Plant Cell 14:1377-1389.
Farmer, P. K. and J. H. Choi. 1999. Calcium and phosphlipid activation of a recombinant calcium-dependent protein kinase (DcCPK1) from carrot (Daucus carota L.). Biochimica et Biophysica Acta 1434:6-17.
50
Feechan, A., E. Kwon, B.-W. Yun, Y. Wang, J. A. Pallas, and G. J. Loake. 2005. A central role for S-nitrosothiols in plant disease resistance. Proceedings of the National Academy of Sciences USA 102:8054-8059.
Felix, G. and T. Boller. 2003. Molecular sensing of bacteria in plants. The highly conserved RNA-binding motif RNP-1 of bacterial cold shock proteins is recognized as an elicitor signal in tobacco. Journal of Biological Chemistry 278:6201-6208.
Felix, G., J. D. Duran, S. Volko, and T. Boller. 1999. Plants have a sensitive perception system for the most conserved domain of bacterial flagellin. Plant Journal 18:265-276.
Flor, H. H. 1971. Current status of the gene-for-gene concept. Annual Review of Phytopathology 9:296.
Fujiwara, S., N. Tanaka, T. Kaneda, S. Takayama, A. Isogai, and F.-S. Che. 2004. Rice cDNA microarray-based gene expression profiling of the response to flagellin perception in cultured rice cells. Molecular Plant-Microbe Interactions 17:986-998.
Gaffney, T., L. Friedrich, B. Vernooij, D. Negrotto, B. Nye, S. Uknes, E. Ward, H. Kessmann, and J. Ryals. 1993. Requirement of salicylic-acid for the induction of systemic acquired-resistance. Science 261:754-756.
Garcia-Olmedo, F., A. Molina, A. Segura, and M. Moreno. 1995. The defensive role of nonspecific lipid-transfer proteins in plants. Trends in Microbiology 3:72-74.
Geetha, S., S. A. Shetty, H. Shekar Shetty, and H. S. Prakash. 1996. Arachidonic acid-induced hypersensitive cell death as an assay of downy mildew resistance in pearl millet. Journal of Applied Biology91-96.
Goff, S. A., D. Ricke, T.-H. Lan, G. Presting, R. Wang, M. Dunn, J. Glazebrook, A. Sessions, P. Oeller, H. Varma, D. Hadley, D. Hutchison, C. Martin, F. Katagiri, B. M. Lange, T. Moughamer, Y. Xia, P. Budworth, J. Zhong, T. Miguel, U. Paszkowsi, S. Zhang, M. Colbert, W.-L. Sun, L. Chen, B. Cooper, S. Park, T. C. Wood, L. Mao, P. Quail, R. Wing, R. Dean, u, A. Zharkikh, R. Shen, S. Sahasrabudhe, A. Thomas, R. Cannings, A. Gutin, D. Pruss, J. Reid, S. Tavtigian, J. Mitchell, G. Eldredge, T. Scholl, R. M. Miller, S. Bhatnagar, N. Adey, T. Rubano, N. Tusneem, R. Robinson, J. Feldhaus, T. Macalma, A. Oliphant, and S. Briggs. 2002. A draft sequence of the rice genome (Oryza sativa L. spp. japonica). Science 296:92-100.
Goldman, J. J., W. W. Hanna, G. Fleming, and P. Ozias-Akins. 2003. Fertile transgenic pearl millet [Pennisetum glaucum (L.) R. Br.] plants recovered through microprojectile bombardment and phosphinothricin selection of apical meristem-, inflorescence-, and immature embryo-derived embryogenic tissues. Plant Cell Reports 21:999-1009.
Gómez-Gómez, L. 2004. Plant perception systems for pathogen recognition and defence. Molecular Immunology 41:1055-1062.
Gómez-Gómez, L. and T. Boller. 2002. Flagellin perception: a paradigm for innate immunity. Trends in Plant Science 7:251-256.
Govrin, E. M. and A. Levine. 2000. The hypersensistive response facilitates plant infection by the necrotrophic pathogen Botrytis cinerea. Current Biology 10:751-757.
Grant, J. J. and G. J. Loake. 2000. Role of reactive oxygen intermidiates and cognate redox signalling in disease resistance. Plant Physiology 124:21-29.
Grayer, R. J. and T. Kokubun. 2001. Plant-fungal interactions: the search for phytoalexins and other antifungal compounds from higher plants. Phytochemistry 56:253-263.
51
Gupta, V., M. G. Willits, and J. Glazebrook. 2000. Arabidopsis thaliana EDS4 contributes to salicylic acid (SA)-dependent expression of defense responses: evidence for inhibition of jasmonic acid signaling by SA. Molecular Plant-Microbe Interactions 13:503-511.
Hain, R., H. Reif, E. Drause, R. Langebarteis, H. Kindl, B. Vornam, W. Wiese, E. Schmeizer, P. H. Screier, R. H. Stocker, and K. Stenzel. 1993. Disease resistance results from foreign phytoalexin expression in a novel plant. Nature 361:153-156.
Hammond-Kosack, K. and J. D. G. Jones. 2000. Responses to plant pathogens, p. 1102-1156. In: B. Buchanan, W. Gruissem, and R. Jones (eds.), Biochemistry and Molecular Biology of Plants. American Society of Plant Physiologists.
Hammond-Kosack, K. E. and J. D. G. Jones. 1996. Resistance gene-dependent plant defense responses. Plant Cell 8:1773-1791.
Hammond-Kosack, K. E. and J. E. Parker. 2003. Deciphering plant-pathogen communication: fresh perspectives for molecular resistance breeding. Current Opinion in Biotechnology 14:177-193.
Harmon, A. C., M. Gribskov, and J. F. Harper. 2000. CDPKs - a kinase for every Ca2+ signal? Trends in Plant Science 5:154-159.
Hildebrand, D. F. 1989. Lipoxygenases. Physiologica Plantarum 76:249-253.
Horvath, H., N. Rostoks, R. Bruegemann, B. Steffenson, D. von Wettstein, and A. Kleinhofs. 2003. Genetically engineered stem rust resistance in barley using the Rpg1 gene. Proceedings of the National Academy of Sciences USA 100:364-369.
Innes, R. W. 2001. Mapping out the roles of MAP kinases in plant defense. Trends in Plant Science 6:392-394.
Jia, Y., S. A. McAdams, G. T. Bryan, H. P. Hershey, and B. Valent. 2000. Direct interaction of resistance gene and avirulence gene products confers rice blast resistance. EMBO Journal 19:4014.
Johal, G. S. and S. P. Briggs. 1992. Reductase activity encoded by the HM1 disease resistance gene in maize. Science 258:985-987.
Johnson, A. W., W. W. Hanna, and J. P. Wilson. 1999. Identification of nematode resistance in pearl millet grain hybrids. International Sorghum and Millets Newsletter 40:58-60.
Jones, E. S., W. A. Breese, and D. S. Shaw. 2001. Inoculation of pearl millet with the downy mildew pathogen, Sclerospora graminicola: chilling inoculum to delay zoospor release and avoid spray damage to zoospores. Plant Pathology 50:310-316.
Kazan, K., P. M. Schenk, I. Wilson, and J. M. Manners. 2001. DNA microarrays: new tools in the analysis of plant defence responses. Molecular Plant Pathology 2:177-185.
Kemp, G., C. W. Bergmann, R. Clay, A. J. van der Westhuizen, and Z. A. Pretorius. 2003. Isolation of a polygalacturonase-inhibiting protein (PGIP) from wheat. Molecular Plant-Microbe Interactions 16:955-961.
Kessmann, H., T. Staub, C. Hofmann, T. Maetzke, J. Herzog, E. Ward, S. Uknes, and J. Ryals. 1994. Induction of systemic acquired disease resistance in plants by chemicals. Annual Review of Phytopathology 32:439-459.
Kim, J.-A., G. K. Agrawal, R. Rakwal, K.-S. Han, K.-N. Kim, C.-H. Yun, S. Heu, S.-Y. Park, Y.-H. Lee, and N.-S. Jwa. 2003. Molecular cloning and mRNA expression analysis of a novel rice (Oryza sativa L.) MAPK kinase kinase, OsEDR1, an ortholog of Arabidopsis AtEDR1,
52
reveal its role in defense/stress signalling pathways and development. Biochemical and Biophysical Research Communications 300:868-876.
Kim, M. C., R. Panstruga, C. Elliot, J. Muller, A. Devoto, H. W. Yoon, H. C. Park, M. J. Cho, and P. Schulze-Lefert. 2002. Calmodulin interacts with MLO protein to regulate defence against mildew in barley. Nature 416:447-450.
King, S. B. 1992. World review of pearl millet diseases; knowledge and future research needs, p. 95-108. In: W. A. J. de Milliano, R. A. Frederiksen, and G. D. Bengston (eds.), Sorghum and millets diseases. A second world review. ICRISAT, Andhra Pradesh.
Kunkel, B. N. and D. M. Brooks. 2002. Cross talk between signaling pathways in pathogen defense. Current Opinion in Plant Biology 5:325-331.
Lawton, K. A., L. Friedrich, M. Hunt, K. Weymann, T. Delany, H. Kessman, T. Staub, and J. Ryals. 1996. Benzothiadiazole induces disease resistance in Arabidopsis by activation of the systemic acquired resistance signal transduction pathway. Plant Journal 10:71-82.
Laxalt, A. M. and T. Munnik. 2002. Phospholipid signalling in plant defence. Current Opinion in Plant Biology 5:1-7.
Lee, S., H. Hirt, and Y. Lee. 2001. Phosphatidic acid activates a wound activated MAPK in Glycine max. Plant Journal 26:479-486.
Leister, R. T. and F. Katagiri. 2000. A resistance gene product of the nucleotide binding site-leucine rich repeats class can form a complex with bacterial avirulence proteins in vivo. Plant Journal 22:354.
Leon, J., E. Rojo, and J. J. Sanchez-Serrano. 2001. Wound signalling in plants. Journal of Experimental Botany 52:1-9.
Li, J., G. Brader, and E. T. Palva. 2004. The WRKY70 transcription factor: a node of convergence for jasmonate-mediated and salicylate-mediated signals in plant defense. Plant Cell 16:319-331.
Liu, C. J., J. R. Witcombe, C. T. Hash, C. S. Busso, T. S. Pittaway, M. Nash, and M. D. Gale. 1994. An RFLP-based genetic map of pearl millet (Pennisetum glaucum). Theoretical and Applied Genetics 89:481-487.
Ludwig, A. A., T. Romeis, and J. D. G. Jones. 2004. CDPK-mediated signalling pathways: specificity and cross-talk. Journal of Experimental Botany 55:181-188.
Mackey, D., Y. Belkhadir, J. M. Alonso, J. R. Ecker, and J. L. Dangl. 2003. Arabidopsis RIN4 is a target of the type III virulence effector AvrRpt2 and modulates RPS2-mediated resistance. Cell 112:379-389.
Mackey, D., B. F. Holt, A. Wiig, and J. L. Dangl. 2002. RIN4 interacts with Psedomonas syringae Type III effector molecules and is required for RPM1-mediated disease resistance in Arabidopsis. Cell 108:743-754.
Maleck, K., A. Levine, T. Eulgem, A. Morgan, J. Schmid, K. A. Lawton, J. L. Dangl, and R. A. Dietrich. 2000. The transcriptome of Arabidopsis thaliana during systemic acquired resistance. Nature Genetics 26:403-410.
Mauch-Mani, B. and J. P. Metraux. 1998. Salicylic acid and systemic acquired resistance to pathogen attack. Annals of Botany 82:535-540.
McDowell, J. M. and J. L. Dangl. 2000. Signal transduction in the plant immune response. Trends in Biochemical Sciences 25:79-82.
53
Mehdy, M. C., Y. K. Sharma, K. Sathasivan, and N. W. Bays. 1996. The role of activated oxygen species in plant disease resistance. Physiologia Plantarum 98:365-374.
Modolo, L. V., F. Q. Cunha, M. R. Braga, and I. Salgado. 2002. Nitric oxide synthase-mediated phytoalexin accumulation in soybean cotyledons in response to the Diaporthe phaseolorum f. sp. meridionalis elicitor. Plant Physiology 130:1288-1297.
Morgan, R. N., J. P. Wilson, W. W. Hanna, and P. Ozias-Akins. 1998. Molecular markers for rust and pyricularia leaf spot disease resistance in pearl millet. Theoretical and Applied Genetics 96:413-420.
Morris, S. W., B. Vernooij, S. Titatarn, M. Starrett, S. Thomas, C. C. Wiltse, R. A. Frederiksen, A. Bhandhufalck, S. Hulbert, and S. Uknes. 1998. Induced resistance responses in maize. Molecular Plant Microbe Interactions 11:643-658.
Mou, Z., W. Fan, and X. Dong. 2003. Inducers of plant systemic acquired resistance regulate NPR1 function through redox changes. Cell 113:935-944.
Murillo, I., E. Jaeck, M. J. Cordero, and B. San Segundo. 2001. Transcriptional activation of a maize calcium-dependent protein kinase gene in response to fungal elicitors and infection. Plant Molecular Biology 45:145-158.
Murray, S. L., K. J. Denby, D. K. Berger, and G. J. Loake. 2002. Disease signalling in Arabidopsis: applications in the study of plant pathology in South Africa. South African Journal of Science 98:161-165.
Nadimpalli, R., N. Yalpani, G. S. Johal, and C. R. Simmons. 2000. Prohibitins, stomatins, and plant disease response genes compose a protein superfamily that controls cell proliferation, ion channel regulation and death. Journal of Biological Chemistry 275:29579-29586.
National Research Council. 1996. Lost crops of Africa. Volume 1: Grains. National Academy Press, Washington D.C.
O'Donnell, P. J., C. Calvert, R. Atzorn, C. Wasternack, H. M. O. Leyser, and D. J. Bowles. 1996. Ethylene as a signal mediating the wound response of tomato plants. Science 274:1914-1917.
Osbourn, A. E. 1996. Preformed antimicrobial compounds and plant defense against fungal attack. Plant Cell 8:1821-1831.
Panwar, M. S. and A. S. Rathi. 1997. Susceptibility of pearl millet varieties and their parents to smut. International Sorghum and Millets Newsletter 38:131-133.
Penninckx, I. A. M. A., K. Eggermont, F. R. G. Terras, B. P. H. J. Thomma, G. W. De Samblanx, A. Buchala, J.-P. Métraux, J. M. Manners, and W. F. Broekaert. 1996. Pathogen-induced systemic activation of a plant defensin gene in Arabidopsis follows a salicylic acid-independent pathway. Plant Cell 8:2309-2323.
Petersen, M., P. Brodersen, H. Naested, E. Andreasson, U. Lindhart, B. Johansen, H. B. Nielsen, M. Lacy, M. J. Austin, J. E. Parker, S. B. Sharma, D. F. Klessig, R. Nartienssen, O. Mattsson, A. B. Jensen, and J. Mundy. 2000. Arabidopsis MAP kinase 4 negatively regulates systemic acquired resistance. Cell 103:1111-1120.
Pieterse, C. M. J. and L. C. Van Loon. 1999. Salicylic acid-independent plant defence pathways. Trends in Plant Science 4:52-58.
Polverari, A., B. Molesini, M. Pezzotti, R. Buonaurio, M. Marte, and M. Delledonne. 2003. Nitric oxide-mediated transcriptional changes in Arabidopsis thaliana. Molecular Plant Microbe Interactions 16:1094-1105.
54
Rakwal, R. and G. Agrwal. 2003. Wound-signaling-coordination of the octadecanoid and MAPK pathways. Plant Physiology and Biochemistry 41:855-861.
Ramalingam, J., C. M. Vera Cruz, K. Kukrega, J. M. Chittoor, J.-L. Wu, S. W. Lee, M. Baraoidan, M. L. George, M. B. Cohen, S. H. Hulbert, J. E. Leach, and H. Leung. 2003. Candidate defense genes from rice, barley, and maize and their association with qualitative and quantitative resistance in rice. Molecular Plant-Microbe Interactions 16:14-24.
Ramonell, K. M. and S. Somerville. 2002. The genomics parade of defense responses: to infinity and beyond. Current Opinion in Plant Biology 5:1-4.
Ramonell, K. M., B. Zhang, R. M. Ewing, Y. Chen, D. Xu, G. Stacey, and S. Somerville. 2002. Microarray analysis of chitin elicitation in Arabidopsis thaliana. Molecular Plant Pathology 3:301-311.
Reymond, P., H. Weber, M. Damond, and E. E. Farmer. 2000. Differential gene expression in response to mechanical wounding and insect feeding in Arabidopsis. Plant Cell 12:707-719.
Ritter, C. and J. L. Dangl. 1996. Interference between two specific pathogen recognition events mediated by distinct plant disease resistance genes. Plant Cell 8:251-257.
Romeis, T. 2001. Protein kinases in the plant defence response. Current Opinion in Plant Biology 4:407-414.
Romeis, T., A. A. Ludwig, R. Martin, and J. D. G. Jones. 2001. Calcium-dependent protein kinases play an essential role in a plant defence response. EMBO Journal 20:5556-5567.
Romero-Puertas, M. C., M. Perazzolli, E. D. Zago, and M. Delledonne. 2004. Nitric oxide signalling functions in plant-pathogen interactions. Cellular Microbiology 6:795-803.
Rushton, P. J. and I. E. Somssich. 1998. Transcriptional control of plant genes responsive to pathogens. Current Opinion in Plant Biology 1:311-315.
Ryals, J. A., U. H. Neuenschwander, M. G. Willits, A. Molina, H. Y. Steiner, and M. D. Hunt. 1996. Systemic acquired resistance. Plant Cell 8:1809-1819.
Salzman, R. A., J. A. Brady, S. A. Finlayson, C. D. Buchanan, E. J. Summer, F. Sung, P. E. Klein, R. R. Klein, L. H. Pratt, M. Cordonnier-Pratt, and J. E. Mullet. 2005. Transcriptional profiling of sorghum induced by methyl jasmonate, salicylic acid, and aminocyclopropane carboxylic acid reveals cooperative regulation and novel gene responses. Plant Physiology 138:352-368.
Saraste, M., P. R. Sibbald, and A. Wittinghofer. 1990. The P-loop: a common motif in ATP- and GTP-binding proteins. Trends in Biochemical Sciences 15:430-434.
Schenk, P. M., K. Kazan, I. Wilson, J. P. Anderson, T. Richmond, S. C. Somerville, and J. M. Manners. 2000. Coordinated plant defense responses in Arabidopsis revealed by microarray analysis. Proceedings of the National Academy of Sciences USA 97:11655-11660.
Shailasree, S., K. Ramachandra Kini, S. Deepak, B. S. Kumudini, and H. Shekar Shetty. 2004. Accumulation of hydroxyproline-rich glycoproteins in pearl millet seedlings in response to Sclerospora graminicola infection. Plant Science 167:1227-1234.
Shirasu, K., K. Nielsen, P. Piffanelli, R. Oliver, and P. Schulze-Lefert. 1999. Cell-autonomous complementation of mlo resistance using a biolistic transient expression system. Plant Journal 17:293-299.
Singh, K. B., R. C. Foley, and L. Oñate-Sánchez. 2002. Transcription factors in plant defense and stress responses. Current Opinion in Plant Biology 5:430-436.
55
Singh, S. D. 1995. Downy mildew of pearl millet. Plant Disease 79:545-550.
Singh, S. D., S. B. King, and P. Malla Reddy. 1990. Registration of five pearl millet germplasm sources with stable resistance to downy mildew. Crop Science 30:1164-1165.
Song, F. and R. M. Goodman. 2001. Activity of nitric oxide is dependent on, but is partially required for function of, salicylic acid in the signaling pathway in tobacco systemic acquired resistance. Molecular Plant Microbe Interactions 14:1462.
Song, F. and R. M. Goodman. 2002. OsBIMK1, a rice MAP kinase gene involved in disease resistance responses. Planta 215:997-1005.
Song, W.-Y., G.-L. Wang, L.-L. Che, H.-S. Kim, L.-Y. Pi, T. Holsten, J. Gardner, B. Wang, W.-X. Zhai, L.-H. Zhu, C. Fauquet, and P. Ronald. 1995. A receptor kinase-like protein encoded by the rice disease resistance gene, Xa21. Science 270:1804-1806.
Stacey, G. and N. Shibuya. 1997. Chitin recognition in rice and legumes. Plant and Soil 194:161-169.
Stintzi, A., T. Heitz, V. Prasad, S. Wiedemann-Merdinoglu, S. Kaufmann, P. Geoffroy, M. Legrand, and B. Fritig. 1993. Plant 'pathogenesis-related' proteins and their role in defense against pathogens. Biochimie 75:687-706.
Sun, X., Y. Cao, Z. Yang, C. Xu, X. Li, S. Wang, and Q. Zhang. 2004. Xa26, a gene conferring resistance to Xanthomonas oryze pv. oryzae in rice, encodes an LRR receptor kinase-like protein. Plant Journal 37:517-527.
Tada, Y., T. Mori, T. Shinogi, N. Yao, S. Takahashi, S. Betsuyaku, M. Sakamoto, P. Park, H. Nakayashiki, Y. Tosa, and S. Mayama. 2004. Nitric oxide and reactive oxygen species do not elicit hypersensitive cell death but induce apoptosis in the adjacent cells during the defense response of oat. Molecular Plant-Microbe Interactions 17:245-253.
Terras, F. R., K. Eggermont, V. Kovaleva, N. V. Raikhel, R. W. Osborn, A. Kester, S. B. Rees, S. Torrekens, F. Van Leuven, and J. Vanderleyden. 1995. Small cysteine-rich antifungal proteins from radish: their role in host defense. Plant Cell 7:573-588.
The Arabidopsis Genome Initiative. 2000. Analysis of the genome sequence of the flowering plant Arabidopsis thaliana. Nature 408:796-815.
Tohge, T., Y. Nishiyama, M. Y. Hirai, M. Yano, J. Nakajima, M. Awazuhara, E. Inoue, H. Takahashi, D. B. Goodenowe, M. Kitayama, M. Noji, M. Yamazaki, and K. Saito. 2005. Functional genomics by integrated analysis of metabolome and transcriptome of Arabidopsis plants over-expressing an MYB transcription factor. Plant Journal 42:218-235.
Turner, J. G., C. Ellis, and A. Devoto. 2002. The jasmonate signal pathway. Plant Cell Supplement 2002:S153-S164.
Uknes, S., B. Mauch-Mani, M. Moyer, S. Potter, S. Williams, S. Dincher, D. Chandler, A. Slusarenko, E. Ward, and J. Ryals. 1992. Acquired resistance in Arabidopsis. Plant Cell 4:645-656.
Ülker, B. and I. E. Somssich. 2004. WRKY transcription factors: from DNA binding towards biological function. Current Opinion in Plant Biology 7:491-498.
Van der Hoorn, R. A. I., P. J. G. M. de Wit, and M. H. A. J. Joosten. 2002. Balancing selection favours guarding resistance proteins. Trends in Plant Science 7:71.
Van Loon, L. C. and E. A. van Strien. 1999. The families of pathogenesis-related proteins, their activities, and comparative analysis of PR-1 type proteins. Physiological and Molecular Plant Pathology 55:85-97.
56
Veit, S., J. M. Worle, T. Nurnberger, W. Koch, and H. U. Seitz. 2001. A novel protein elicitor (PaNie) from Pythium aphanidermatum induces multiple defense responses in carrot, Arabidopsis, and tobacco. Plant Physiology 127:832-841.
Vigers, A. J., W. K. Roberts, and C. P. Selitrennikof. 1991. A new family of plant antifungal proteins. Molecular Plant-Microbe Interactions 4:315-323.
Voelckel, C. and I. T. Baldwin. 2004. Herbivore-induced plant vaccination. Part II. Array-studies reveal the transience of herbivore-specific transcriptional imprints and a distinct imprint from stress combinations. Plant Journal 38:650-663.
Walling, L. L. 2000. The myriad plant responses to herbivores. Journal of Plant Growth Regulators 19:195-216.
Wan, J., S. Zhang, and G. Stacey. 2004. Activation of a mitogen-activated protein kinase pathway in Arabidopsis by chitin. Molecular Plant Pathology 5:125-135.
Wasternack, C. and B. Parthier. 1997. Jasmonate-signalled plant gene expression. Trends in Plant Science 2:302-307.
Wendehenne, D., J. Durner, and D. F. Klessig. 2004. Nitric oxide: a new player in plant signalling and defence responses. Current Opinion in Plant Biology 7:449-455.
Wildermuth, M. C., J. Dewdney, G. Wu, and F. M. Ausubel. 2001. Isochorismate synthase is required to synthesize salicylic acid for plant defence. Nature 414:562-565.
Wilson, J. P. and R. N. Gates. 1999. Disease resistance and biomass stability of forage pearl millet hybrids with partial rust resistance. Plant Disease 83:733-738.
Wojtaszek, P. 1997. Oxidative burst: an early plant response to pathogen infection. Biochemistry Journal 392:681-692.
Xie, D., B. J. Feys, S. James, M. Nieto-Rostro, and J. G. Turner. 1998. COI1: an Arabidopsis gene required for jasmonate-regulated defense and fertility. Science 280:1091-1094.
Yang, K.-Y., Y. Liu, and S. Zhang. 2001. Activation of a mitogen-activated protein kinase pathway is involved in disease resistance in tobacco. Proceedings of the National Academy of Sciences USA 98:741-746.
Yang, T. and B. W. Poovaiah. 2003. Calcium/calmodulin-mediated signal network in plants. Trends in Plant Science 8:505-512.
Yoon, G. M., H. S. Cho, H. J. Ha, J. R. Liu, and H. S. P. Lee. 1999. Characterization of NtCDPK1, a calcium-dependent protein kinase gene in Nicotiana tabacum, and the activity of its encoded protein. Plant Molecular Biology 39:991-1001.
Young, S. A., X. Wang, and J. E. Leach. 1996. Changes in the plasma membrane distribution of rice phospholipase D during resistant interactions with Xanthomonas oryzae pv. oryzae. Plant Cell 8:1079-1090.
Yu, D., C. Chen, and Z. Chen. 2001. Evidence for an important role of WRKY DNA binding proteins in the regulation of NPR1 gene expression. Plant Cell 13:1527-1539.
Yu, J., S. Hu, J. Wang, G. K. S. Wong, S. Li, B. Liu, Y. Deng, L. Dai, Y. Zhou, Z. Zhang, M. Cao, J. Liu, J. Sun, J. Tang, Y. Chen, Z. Huang, W. Lin, C. Ye, W. Tong, L. Cong, J. Geng, Y. Han, L. Li, W. Li, G. Hu, Z. Huang, W. Li, J. Li, J. Liu, L. Li, T. Li, X. Wang, H. Lu, T. Wu, M. Zhu, P. Ni, H. Han, W. Dong, X. Ren, X. Geng, P. Cui, X. Li, H. Wang, X. Xu, W. Zhai, Z. Xu, J. Zhang, S. He, J. Zhang, J. Xu, K. Zhang, X. Zheng, J. Dong, W. Zeng, L. Tao, J. Ye, J. Tan, Z. Ren, Z. Chen, J. he, D. Liu, W. Tian, C. Tian, H. Xia, Q. Bao, G. Li, H. Gao, T. Cao, J. Wang, W. Zhao, P. Li, W. Chen, X. Wang, Y. Zhang, J. Hu, J. Wang, S. Liu, J. Yang, G.
57
Zhang, Y. Xiong, Z. Li, L. Mao, C. Zhou, Z. Xhu, R. Chen, B. hao, W. Zheng, S. Chen, W. Guo, G. Li, S. Liu, M. Tao, J. Wang, L. Zhu, L. Yuan, and H. Yang. 2002. A draft sequence of the rice genome (Oryza sativa L. ssp. indica). Science 296:79-91.
Zhang, S. and D. F. Klessig. 2001. MAPK cascades in plant defense signaling. Trends in Plant Science 6:520-527.
Zhang, Y., W. Fan, M. Kinkema, X. Li, and X. Dong. 1999. Interaction of NPR1 with basic leucine zipper protein transcription factors that bind sequences required for salicylic acid induction of the PR-1 gene. Proceedings of the National Academy of Science USA 96:6523-6528.
Zhou, J., X. Tang, and G. B. Martin. 1997. The Pto kinase conferring resistance to tomato bacterial speck disease interacts with proteins that bind a cis-element of the pathogenesis-related genes. EMBO Journal 16:3207-3218.
Zhou, J.-M., Y. Trifa, H. Silva, D. Pontier, E. Lam, J. Shah, and D. F. Klessig. 2000. NPR1 differentially interacts with members of the TGA/OBF family of transcription factors that bind an element of the PR-1 gene required for induction by salicylic acid. Molecular Plant-Microbe Interactions 13:191-202.
Zhu-Salzman, K., R. A. Salzman, J.-E. Ahn, and H. Koiwa. 2004. Transcriptional regulation of sorghum defense determinants against a phloem-feeding aphid. Plant Physiology 134:420-431.
58
Chapter 2
Construction and characterisation of a pearl millet defence response cDNA library
2.1 ABSTRACT Efficient construction of cDNA libraries enriched for differentially expressed
transcripts is an important first step in many biological investigations. In order
to construct a pearl millet cDNA library enriched for defence response genes,
suppression subtractive hybridisation (SSH) was employed following
wounding and treatment of pearl millet plants with the pathogen elicitors chitin
and flagellin. A forward and reverse library was constructed to identify genes
that are up and down regulated during the defence response, respectively.
Furthermore, a quantitative procedure for screening cDNA libraries
constructed by SSH is presented. Following two colour Cy dye labelling and
hybridisation of subtracted tester with either unsubtracted driver or
unsubtracted tester cDNAs to the SSH libraries arrayed on glass slides, two
values were calculated for each clone, an enrichment ratio 1 (ER1) and an
enrichment ratio 2 (ER2). A third enrichment ratio 3 (ER3), was also
calculated following hybridisation of unsubtracted tester and unsubtracted
driver cDNAs. Graphical representation of ER1 and ER2, or ER3 plotted
against inverse ER2 enabled identification of clones that were likely to
represent up regulated transcripts. Normalisation of each clone by the SSH
process was determined from the ER2 values, thereby indicating whether
clones represented rare or abundant transcripts. Differential expression of
pearl millet clones identified by this quantitative approach was verified by
inverse Northern blots. Sequence analysis was performed on clones shown
to be up regulated during the defence response identified from plots of ER1
versus ER2, and ER3 versus inverse ER2. This pearl millet cDNA library
serves as a basis for further microarray studies to examine the effect of
defence signalling molecules and pathogen infection on pearl millet gene
expression.
59
2.2 INTRODUCTION Pearl millet [Pennisetum glaucum (L.) R. Br] is a member of the Gramineae
family that includes many major monocotyledonous agricultural crop species
such as maize, rice, wheat, sorghum, barley and oats. Many of these species
have large, complex genomes that present a substantial challenge to
molecular studies (Carson et al., 2002). Much of what is known at the genetic
level for crop plants has been obtained through genetic mapping and synteny
comparisons with species with relatively small genomes such as sorghum and
rice (Devos and Gale, 2000; Gale and Devos, 1998; Keller and Feuillet, 2000).
In recent years, completion of the rice genome sequence has added to our
knowledge of cereal genome structure and complexity (Goff et al., 2002; Yu et
al., 2002). However, information at the level of gene sequence and function is
still very limited for most non-model crop species. As a consequence,
research groups have employed Expressed Sequence Tags (ESTs) as a
method for gene discovery in crop species with complex genomes (Akimoto-
Tomiyama et al., 2003; Carson et al., 2002; Hein et al., 2004).
ESTs provide a rapid method to establish an inventory of expressed genes
through determination of single pass sequences of 200 to 900 bp from one or
both ends of randomly isolated gene transcripts that have been converted to
cDNA. The sequences are sloppy and have a relatively high error rate, but, in
most cases, they are sufficiently accurate to unambiguously identify the
corresponding gene through homology comparisons with known genes. In
addition, high throughput technology and EST sequencing projects can result
in identification of significant portions of an organism’s gene content and thus
can serve as a foundation for initiating genome sequencing projects (Alba et
al., 2004). Most importantly, thousands of sequences can be determined with
limited investment.
In order to add value to EST data, several techniques exist to isolate and
characterise cDNA fragments that are differentially expressed under specific
conditions. These include differential display reverse transcriptase PCR (DD
RT-PCR), cDNA amplified fragment length polymorphism (cDNA-AFLP), serial
analysis of gene expression (SAGE) and suppression subtractive
60
hybridisation (SSH) (Bachem et al., 1996; Diatchenko et al., 1996; Liang and
Pardee, 1992; Velculescu et al., 1995). In DD RT-PCR cDNA is synthesised
from RNA using reverse transcriptase and an oligo dT primer that anneals to
the 3’ polyA tail of mRNA. Thereafter, subsets of cDNA populations for
comparison are amplified with short, non-specific oligonucleotide primers, in
combination with oligo dT primers, and visualised on polyacrylamide gels.
Differentially expressed cDNA fragments are isolated from the gel and
sequenced. Like DD RT-PCR, cDNA-AFLP is derived from a DNA
fingerprinting method and also involves the selective PCR amplification of
subsets of cDNA populations for comparison on polyacrylamide gels.
However, cDNA-AFLP is an improvement on DD RT-PCR in that amplification
is specific, using primers with higher annealing temperatures that bind to
adaptors ligated to the ends of double stranded cDNA molecules following
restriction digestion. SAGE is an elegant technique that combines differential
display and cDNA sequencing approaches, and it has the advantage of being
quantitative. Unfortunately, SAGE is laborious and requires an extensive
foundation of sequence information. All three techniques described above are
often limited by their ability to capture low abundance transcripts (Alba et al.,
2004).
Suppression subtractive hybridisation (SSH) is a powerful technique to enrich
libraries with differentially expressed cDNAs, and can be combined with large
scale sequencing approaches (Birch and Kamoun, 2000). The SSH
technique utilises subtractive hybridisation to selectively remove cDNA from
genes that are expressed in both control and experimental samples, and a
post hybridisation PCR step to preferentially amplify cDNA unique to the
experimental sample (Figure 2.1). One of its main advantages is that it
includes a normalisation step that enables the detection of low abundance
differentially expressed transcripts such as many of those likely to be involved
in signalling and signal transduction, and might thus identify essential
regulatory components in several biological processes (Birch and Kamoun,
2000). A further advantage of SSH is that it yields cDNA fragments that can
be used directly for the construction of DNA microarrays.
61
In this study, we aimed to isolated pearl millet genes that are involved in
defence response. In order to achieve this, we treated pearl millet seedlings
with the pathogen elicitors chitin and flagellin and mechanically wounded the
leaves. Differential gene isolation was accomplished through application of
SSH to enrich cDNA libraries for genes up- or down regulated in response to
elictor treatment. The SSH procedure was chosen for several reasons: it
includes a normalisation step, it enriches for differentially expressed
transcripts, and it yields cDNA fragments that can be used directly for the
construction of DNA microarrays. The normalisation step is particularly
important because a few defence genes, such as those encoding the
pathogenesis related (PR) proteins, are abundantly induced during defence
response, potentially obscuring important defence specific transcripts
expressed at much lower levels (Mahalingam et al., 2003).
In previous studies, SSH libraries were screened to identify cloned
differentially expressed genes by colony blot hybridisation, inverse Northern
analysis or cDNA AFLP (Birch et al., 1999; Hein et al., 2004; Mahalingam et
al., 2003). However, these methods are time consuming, and do not allow the
level of enrichment of a transcript to be quantified. SSH has also been used
as a method to generate a cDNA library to use in subsequent cDNA
microarray expression profiling (Yang et al., 1999). In this study, cDNA
microarrays were used to screen PCR amplified clones from forward and
reverse subtracted SSH libraries to identify genes from pearl millet that are
up- or down regulated during defence responses, respectively. This
quantitative approach of determining the extent to which transcripts were
enriched by the SSH process allowed us to identify and exclude clones that
were not derived from differentially expressed transcripts and to determine
whether transcripts were rare or abundant. Based on cDNA microarray
analysis of forward and reverse subtracted pearl millet SSH libraries, SSH
clones were selected for sequence analysis. A number of genes exhibited
significant similarities to genes associated with plant defence and stress
responses.
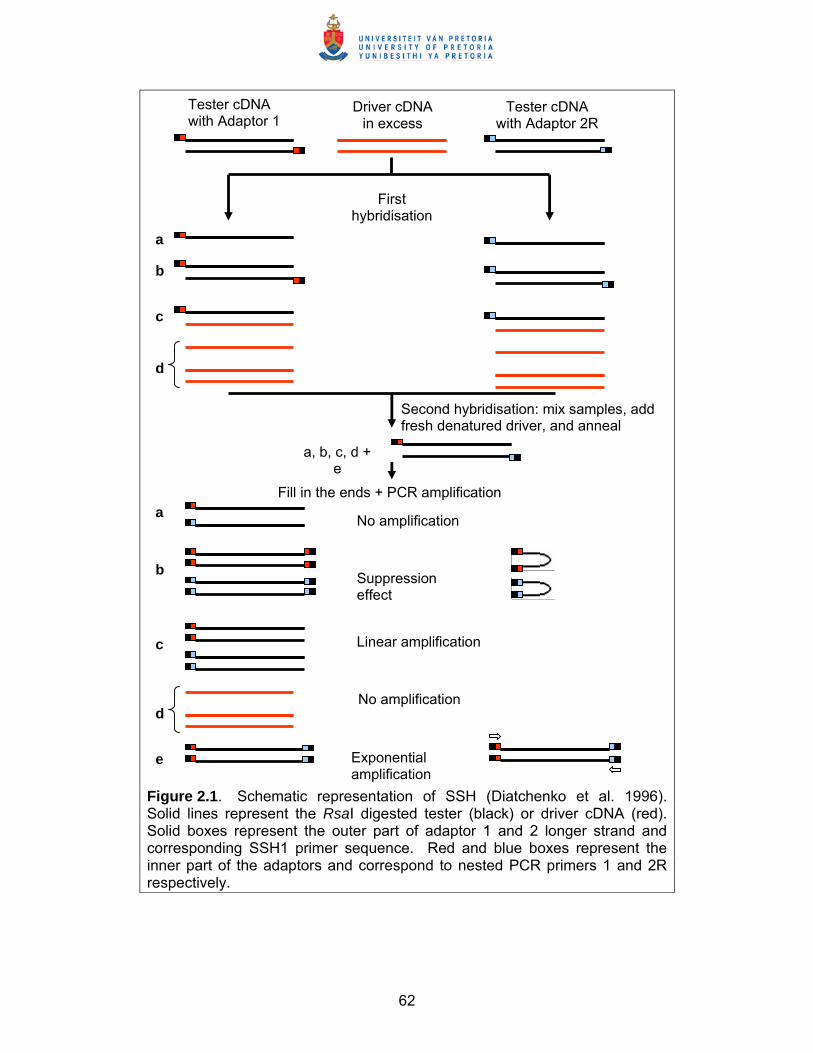
62
Figure 2.1. Schematic representation of SSH (Diatchenko et al. 1996). Solid lines represent the RsaI digested tester (black) or driver cDNA (red). Solid boxes represent the outer part of adaptor 1 and 2 longer strand and corresponding SSH1 primer sequence. Red and blue boxes represent the inner part of the adaptors and correspond to nested PCR primers 1 and 2R respectively.
a, b, c, d + e
Fill in the ends + PCR amplification
No amplification
Suppression effect
Linear amplification
No amplification
Exponential amplification
Tester cDNA with Adaptor 1
Tester cDNA with Adaptor 2R
Driver cDNA in excess
First hybridisation
a
b
c
d
a
b
c
d
e
Second hybridisation: mix samples, add fresh denatured driver, and anneal
63
2.3 MATERIALS AND METHODS Materials All reagents were purchased from Sigma (Aston Manor, South Africa) unless
otherwise stated. Sequences of adaptors and primers used in PCR, SSH and
sequencing reactions are shown in Table 2.1.
Plant material and growth Pearl millet breeding lines ICML12=P7 and 842B were obtained from
ICRISAT India and ICRISAT Zimbabwe respectively. ICML12=P7 is resistant
to downy mildew caused by the oomycetous fungus Sclerospora graminicola,
and rust (causal agent: Puccinia substriata var. indica) (Singh et al., 1990),
whereas 842B is moderately susceptible to S. graminicola infections (M.
O’Kennedy, personal communication).
Pearl millet seed was sterilised by briefly rinsing with 70% ethanol, followed by
20 min incubation in 0.7% sodium hypochlorite. Following three washes with
sterile distilled water, seeds were plated on half strength MS medium
(Murashige and Skoog, 1962), and incubated at 25ºC with a 16 hour light/8
hour dark photoperiod.
Elicitor preparation The fungal elicitor chitin was purchased from Sigma Aldrich (Sigma catalogue
number C-3641). The bacterial elicitor flagellin (Felix et al., 1999) was
prepared from Bacillus sp. alk 36 (E. Berger, personal communication).
Briefly, Luria broth pH 8.5 (Sambrook et al., 1989), was inoculated with a
colony of Bacillus sp. alk 36 and grown with shaking at 42ºC for 48 hours. An
equal volume of 0.1 N NaOH was added to the culture, which was then left at
room temperature for 30 min to strip the flagellin from the cell wall (cell bound
fraction). Samples were centrifuged at 6000 rpm for 10 min to pellet bacteria,
and the supernatant containing the flagellin was transferred to a new tube.
Alternatively, ten millilitres of bacterial culture was pelleted at 6000 rpm for 10
min, and proteins remaining in the supernatant were precipitated (extracellular
fraction). An equal volume of 10% trichloroacetic acid was added to the cell
64
bound and extracellular supernatants, which were incubated at -20ºC for one
hour to precipitate the proteins. Extracellular and cell bound proteins were
collected by centrifugation at 11 000 rpm for 20 minutes, the protein pellet was
dried in a laminar flow bench, and resuspended in a total volume of 1 ml
phosphate buffered saline (PBS) (Sambrook et al., 1989). Five micrograms of
protein was analysed on a 10% SDS polyacrylamide gel (Ausubel et al., 2005)
to assess the presence and quality of flagellin in the crude extracellular
protein extract. Proteins were detected by staining the polyacrylamide gel in
0.1% Coomassie Brilliant R, 50% methanol, 10% acetic acid.
Presence of the flagellin in the protein extract was confirmed by Western blot
analysis according to the method of (Ausubel et al., 2005). Briefly, 2.5 μg
protein was run on a 10% SDS polyacrylamide gel, and transferred to
polyvinyldifluoride (PVDF) membrane at 15V overnight in CAPS (3-
[cyclohexylamino]-1-propane-suphonic acid) buffer (10 mM CAPS 3%
methanol, pH 10.5). Following protein transfer, the membrane was incubated
in blocking solution (10 mM Tris, pH 7.5, 150 mM NaCl, 3% milk powder and
0.1% Tween 20) for 2 hours at room temperature. Rabbit antibodies raised
against the Bacillus sp. alk36 flagellin protein were diluted 1:2000 in blocking
solution and added to the membrane for 2 hour at 37ºC. The membrane was
subjected to three washes of five minutes each with washing buffer (10 mM
Tris, pH 7.5, 150 mM NaCl, and 0.1% Tween 20) to remove unbound
antibodies. Following an hour incubation at 37ºC with Anti-Rabbit IgG (whole
molecule) alkaline phosphatase conjugate (Sigma) (diluted 1:1000 in blocking
buffer), the membrane was once again subjected to three washes of five
minutes each in washing buffer. The membrane was equilibrated in detection
buffer (100 mM Tris, pH 9.5, 100 mM NaCl and 50 mM MgCl2) subsequent to
antibody detection with NBT/BCIP solution (Roche Diagnostics, Mannheim,
Germany) (200 μl in 10 ml detection buffer). The membrane was incubated in
the dark until bands appeared. The reaction was stopped by the addition of
TE, pH 8.0 (10 mM Tris, pH 8.0, 1 mM EDTA, pH 8.0).
65
Treatment of pearl millet seedlings with elicitors Leaves of ten day old ICML12=P7 and 842B pearl millet seedlings were
wounded by pricking leaves at one centimetre intervals with a sterile needle.
The abaxial surface of ICML12=P7 leaves was inoculated with a total of 100
µl of either 100 mg/ml chitin, or a crude boiled extract of flagellin. Control
842B plants were treated with sterile deionised water and not wounded. Each
elicitor and control inoculation was repeated in triplicate. Plates containing
pearl millet seedlings were sealed with Micropore™ tape (3M, Isando, South
Africa), and were incubated at 25ºC with a 16 hour light/8 hour dark
photoperiod. Necrotic lesion formation was observed under a dissecting
microscope at 24, 48 and 96 hours post inoculation.
RNA isolation Pearl millet leaves were harvested 5, 14 and 24 h post elicitor treatment (hpe),
and immediately placed in liquid nitrogen. Total RNA was prepared from ten
day old chitin or flagellin inoculated ICML12=P7 leaves, or untreated 842B
leaves using a Plant RNeasy Kit (Qiagen, Hilden, Germany) according to the
manufacturer’s instructions. RNA yield was determined by measuring
absorbency at 260 nm, and RNA integrity was determined by electrophoresing
two micrograms total RNA through a 1.2% agarose gel. Poly (A)+ RNA was
purified from total RNA using an Oligotex® mRNA Mini Kit (Qiagen).
RT-PCR amplification of the actin gene A two step reverse transcriptase PCR (RT-PCR) was performed to amplify the
actin gene from pearl millet mRNA samples. First strand cDNA synthesis
reactions were performed using a C. therm RT-PCR kit (Roche Diagnostics)
according to the manufacturer’s instructions. Each 20 μl reaction contained 1
μM actin forward primer (Table 2.1), 200 μM dNTPs, 3% (v/v) DMSO, DTT, 1
X RT buffer (Roche Diagnostics), 3 units C. therm polymerase (Roche
Diagnostics) and 50 ng mRNA. The reaction was incubated at 60ºC for 30
min, followed by 94ºC for 2 min to inactivate the reaction.
PCR amplification of the pearl millet actin gene was performed on genomic
DNA, or first strand cDNA synthesized during the RT reaction. Each twenty
66
five microlitre reaction consisted of 1 μM of each of actin forward and reverse
primers (Table 2.1), 100 μM dNTPs, 1.5 mM MgCl2, 1 X ammonium acetate
reaction buffer (Biolines, London, UK), 1 unit of Taq DNA polymerase
(Biolines BioTaq) and 5 μl RT product. Reactions were incubated at 94ºC for
two minutes to denature the DNA template, followed by 30 cycles each with a
94ºC denaturation step, a 55ºC annealing step and a 72ºC. A final elongation
cycle of 72ºC for 3 minutes was included. RT-PCR products were
electrophoresed through a 2% agarose gel to assess actin cDNA and
genomic DNA product size.
cDNA synthesis from pearl millet mRNA samples Double stranded cDNA was synthesized from 2 µg pearl millet mRNA using a
cDNA Synthesis System (Roche Diagnostics). cDNA synthesis reactions
were purified using a MinElute Reaction Cleanup Kit (Qiagen). The cDNA
preparations were resuspended in a final volume of 20 μl of nuclease free
water. Integrity of the synthesized cDNA was assessed by performing PCR
amplification of the actin gene using 1 µl of the cDNA product.
Suppression subtractive hybridisation Subtractive hybridisation was performed as described by Diatchenko et al.
(1996) using a PCR-Select cDNA Subtraction Kit (BD Biosciences Clontech,
Palo Alto, CA) with modifications. cDNA preparations from chitin treated
leaves and flagellin treated leaves isolated 5, 14 and 20 hpe were pooled in
equal proportions. For the forward subtractive cDNA library, pooled cDNA
obtained from treated ICML12=P7 leaves was used as the ‘tester’ and that
from the control 842B leaves as ‘driver’ to isolate fragments corresponding to
genes whose expression level was increased following elicitor treatment. The
reverse subtraction was performed with the control sample as tester and the
treated sample as driver to isolate fragments corresponding to genes whose
expression level decreased following elicitor treatment. Approximately 400 ng
of tester and driver cDNA were digested with RsaI in a 40 µl reaction mixture
containing 30 units of enzyme (Roche Diagnostics) for 4 hours at 37ºC. The
restricted cDNA fragments were purified using a MinElute Reaction Cleanup
Kit (Qiagen), and eluted from MinElute columns in 10 μl sterile water.
67
Digested tester cDNA (1μl) was diluted in 5 µl of water. A 2 μl aliquot of the
diluted tester cDNA was then either ligated to 2 µl of adaptor 1 (10 μM) or 2 µl
of adaptor 2R (10 µM) (Table 2.1) in separate ligation reactions in a total
volume of 10 μl at 14ºC overnight, using 2 units of T4 DNA ligase (BD
Biosciences Clontech) in the buffer supplied by the manufacturer. After
ligation, reactions were heated to 72ºC for 5 minutes to inactivate the ligase.
Thereafter, 1.5 µl driver ds cDNA, together with 1 μl hybridisation buffer (BD
Biosciences Clontech), was added to each of two tubes containing 1.5 μl of
adapter 1 and adapter 2R ligated tester cDNA (1:10 diluted) respectively. The
total reaction volume of each of the samples was 4 μl. The solution was
overlaid with mineral oil, the DNA was denatured (1.5 min, 98ºC), and then
allowed to anneal for 12 hours at 68ºC. After this first hybridisation, the two
samples were combined and a fresh portion of heat denatured driver (100 ng)
in 1 μl hybridisation buffer was added. The sample was left to hybridise for an
additional 16 hours at 68ºC. The final hybridisation reaction was diluted in
100 µl of dilution buffer (BD Biosciences Clontech), heated at 68ºC for 7 min,
and stored at -20ºC until use. The final ratio of tester to driver in both the
forward and reverse subtraction experiments was 300:1.
Six separate suppressive PCR amplification reactions were performed for the
forward and reverse subtracted cDNA samples. Primary PCR was conducted
in a 25 μl volume that contained 1 μl of subtracted cDNA, 1 µl primer SSH1
(10 uM) (Table 2.1), and 23 μl of PCR master mixture prepared using the
Advantage cDNA PCR Core Kit (BD Biosciences Clontech). PCR was
performed with the following parameters: 75ºC for 5 min; 30 cycles at (94ºC
for 30 sec, 66ºC for 30 sec, 72ºC for 90 sec); and a final extension at 72ºC for
5 min. The amplified products were diluted ten fold in sterile deionised water.
One microlitre of the product was then used as a template in secondary PCR
for 25 cycles under the same conditions, except PCR primer SSH1 was
replaced with nested PCR primers 1 and 2R (Table 2.1), and the primer
annealing temperature was 68ºC. The PCR products were analysed by 2%
agarose gel electrophoresis.
68
cDNA enriched for differentially expressed transcripts was termed subtracted
tester (ST), whereas unsubtracted tester (UT) cDNA was prepared from
treated pearl millet plants, and unsubtracted driver (UD) cDNA was prepared
from control pearl millet plants. For preparation of the reverse subtracted
cDNA library, the tester cDNA was prepared from control plants, and driver
cDNA from treated pearl millet plants.
Southern blot analysis The efficiency of the cDNA subtraction was tested by Southern hybridization
(Southern 1975). Non-radioactive DNA probes were prepared by digesting 10
μl of each of forward subtracted tester cDNA, reverse subtracted tester cDNA,
unsubtracted tester cDNA and unsubtracted driver cDNA with RsaI to remove
adapter sequences. Restriction digests were electrophoresed through a 1.5%
low melting point agarose gel, PCR products minus adaptors were excised
from the gel, and gel purified using a Qiaquick Gel Extraction Kit (Qiagen).
Products were labelled with digoxygenin (DIG)-dUTP molecules using a DIG
Random Prime Labelling Kit (Roche Diagnostics).
DNA blots were prepared by electrophoresing forward subtracted tester
cDNA, reverse subtracted tester cDNA, unsubtracted tester cDNA and
unsubtracted driver cDNA through a 2% agarose gel, followed by capillary
transfer of SSH products to a positively charged nylon membrane (Roche
Diagnostics) using 1.5 M NaCl/0.5 N NaOH as a transfer buffer. DNA was
fixed to the membrane by exposure to UV light (312 nm) for three minutes.
Nylon bound cDNA was hybridised to either 5 ng/ul DIG-labelled forward
subtracted tester cDNA, reverse subtracted tester cDNA, unsubtracted tester
cDNA or unsubtracted driver DNA. Hybridisation signals were detected using
CPD star (Roche Diagnosticss).
Cloning and analysis of the subtracted cDNA Secondary PCR products were purified using a MinElute PCR Purification Kit
(Qiagen). Subtracted cDNA fragments were ligated into pGEMT-easy using a
pGEMT-easy cloning kit (Promega, Madison, WI, USA). Recombinant
plasmids were transformed into electrocompetant Escherichia coli DH10B
69
cells (Ausubel et al., 2005). Individual colonies containing recombinant
plasmids were inoculated into 150 μl Luria broth in 96 well microtitre plates.
Cultures were grown overnight at 37ºC with gentle shaking (100 rpm), after
which 150 μl 50% glycerol was added to each of the wells. Microtitre plates
were stored at -80ºC until use.
Nucleotide sequencing of selected cDNA clones was performed by Inqaba
Biotechnological Industries (Pty) Ltd. and Scottish Crop Research Institute,
Dundee, Scotland, UK, using T7 or Sp6 primer sequences (Table 2.1). Each
sequence was edited to correct sequencing ambiguities and remove the
plasmid and SSH adaptor sequences. The edited sequences were used to
query the NCBI (National Center for Biotechnology Information, USA)
database using the BlastX, BlastN and dBEST algorithms (Altschul et al.,
1990). The cDNAs were classified according to the E-values generated in the
BLAST searches. E-values <1e-05 were deemed to indicate significant
homology, whereas cDNAs with E-values >1e-05 were deemed to have no
significant homology to any known protein and assumed to be novel (Shim et
al., 2004). Sequences were checked for stop codons to ensure that cDNA
fragments represented a portion of an open reading frame.
cDNA microarray analysis Libraries containing 960 forward subtracted and 960 reverse subtracted pearl
millet SSH clones were arrayed onto silanised microarray slides (Amersham
Biosciences, Little Chalfont, UK) using an Array Spotter Generation III
(Molecular Dynamics Inc., Sunnyvale, CA, USA). Cloned inserts were PCR
amplified using SP6 and T7 primers and visualized on a 1% agarose Electro-
FastSTRETCH gel (ABgene®, Epsom, UK). PCR products were purified
using Multiscreen® PCR Purification Plates (Millipore, Molsheim, France) and
eluted in 50 μl sterile distilled water. The probe was dried in a vacuum
centrifuge and resuspended to a final volume of 20 μl in 50% DMSO prior to
being robotically printed onto glass slides. On average, 200 pg of each pearl
millet SSH fragment was spotted on each slide. The uidA, luc and bar genes
and a fungal ITS fragment were also printed to serve as controls for global
normalisation. Following removal of adaptor sequences, 200 ng ST, UT or
70
UD cDNA probes from forward and reverse subtracted libraries were labelled
by incorporation of Cy™5 or Cy™3 dUTP (Amersham Biosciences) using
Klenow enzyme (USB, Cleveland, Ohio, USA) as previously described
(Ramonell et al., 2002). Each hybridisation was performed in duplicate with
the reverse Cy dye labelling of the probes. Reactions were spiked with Cy
labeled uidA (0.3 ng), luc (0.03 ng) and bar (3 ng) genes and a fungal ITS
fragment (3 ng). After incubation at 37ºC for 20 hours, probes were purified
using a Multiscreen® PCR Purification Plate (Millipore) and eluted in 45 μl
sterile distilled water. The probe was dried in a vacuum centrifuge and
resuspended in hybridisation buffer (Amersham Biosciences). The glass slide
was initially incubated in pretreatment solution (3.5X SSC; 0.2% SDS; 1%
bovine serum albumin) without probe at 60ºC for 20 min. The glass slide was
placed in a HybUP hybridisation chamber (NB Engineering, Pretoria, South
Africa) with the probe at 42ºC for 16 h. After hybridisation, slides were
washed for 4 min at 42ºC with 1 X SSC/0.2% SDS, 0.1 X SSC/0.2% SDS
(twice) followed by three washes in 0.1 X SSC for 1 min at room temperature.
Slides were rinsed with distilled water, dried with high pressure nitrogen, and
scanned with a Genepix™ 4000B scanner (Axon Instruments, Foster City,
CA, USA). The computer program ArrayVision™ (Molecular Dynamics Inc.)
was used to localise and integrate every spot on the array.
Enrichment ratios of ST:UD (ER1), ST:UT (ER2) and UT:UD (ER3) were
calculated for both forward and reverse subtracted pearl millet SSH libraries
from experiments performed in duplicate. For each clone, background signal
intensities were subtracted, signal intensities of duplicate spots on glass slides
were averaged, and spots with a signal/noise ratio of less than 3 were
rejected. Global normalisation of data for the Cy dye effect was performed
using a control gene set to calculate normalisation functions c and c’ for each
pair of dye swap slides (Yang et al., 2002). This was accomplished by plotting
the Cy3 versus the Cy5 value for each of the control spots and fitting a linear
regression line through the data points. The log2 value of the gradient of the
regression line was used to calculate c (or c’ in the dye swap slide). To
determine ER1, slides were hybridised with ST and UD. ER1 was calculated
using the following formula: ½[ log2 Cy3 ST/Cy5 UD – c – (log2Cy3UD/Cy5ST
71
– c’)](Yang et al., 2002). ER2 was calculated in the same way following
hybridisations with ST and UT. UT/UD values (Table 2.2) were calculated
from the ER1 and ER2 values as follows: since ER1 – ER2 ~ log2 ST/UD –
log2ST/UT = log2 UT/UD, therefore UT/UD = antilog of (ER1-ER2) in the base
2. Alternatively, a simple data analysis pipeline named SSHscreen using
“linear models for microarray data” (limma) functions in the R computing
environment was employed to calculate and plot ER1, ER2 and ER3 values
(Berger et al., 2006) (http://www.stats.ox.ac.uk/~vos/SSHscreen/). ER1, ER2
and ER3 calculations differ from the above described method in that
SSHscreen software implements both within- and between-array
normalisations. A global loess (lowess) normalisation is used to perform
within array normalization. Quantile normalisation is used to perform between
array normalisation. This ensures that the distribution of red and green
channels for each array becomes essentially the same, as well as the
distribution across arrays. Following normalisation of fluorescence values,
enrichment ratios are calculated as follows in SSHscreen: ER1 = log2
ST/UD; ER2 = log2 ST/UT; and ER3 = log2 UT/UD.
rRNA redundancy for each pearl millet libraries was determined by hybridising
glass microarray slides with pearl millet rDNA probes respectively. A clone
was considered to have hybridised to a rDNA probe if its fluorescence was
more than two standard deviations above local background fluorescence
(Leung and Cavalieri, 2003).
Inverse Northern dot blots Twenty clones which showed differential expression by microarray analysis
were selected Northern analysis. Amplified, denatured inserts of selected
clones from pearl millet SSH libraries were applied to a positively charged
Hybond nylon membrane (Amersham Biosciences) as described previously
(Hein et al., 2004). Poly (A)+ mRNA, used for pearl millet probe generation,
was isolated from 50 μg freshly prepared total RNA (tester and driver). cDNA
was labeled with DIG-dUTP using a DIG DNA Labeling and Detection Kit
(Roche Diagnostics). Hybridisations were performed as described previously
72
(Southern, 1975), using 20 ng/μl cDNA. Hybridisation signals were detected
using CDP Star (Roche Diagnostics).
ArrayVision™ (Molecular Dynamics Inc.) was used to calculate signal density,
following normalisation by comparing values of rDNA dots. Inverse Northern
expression ratios were calculated by dividing normalised density
measurements for each clone hybridised with the tester probes, with values
for the same clones hybridised with the driver probe.
Table 2.1. Sequences of adaptors and primers used in PCR, SSH and sequencing reactions (adapted from PCR Select cDNA Subtraction Kit Manual, BD Biosciences Clontech). SSH Adaptor 1: 5’CTAATACGACTCACTATAGGGCTCGAGCGGCCGCCCGGGCAGGT-3’ 3’- GGCCCGTCCA-5’ SSH Adaptor 2R 5’CTAATACGACTCACTATAGGGCAGCGTGGTCGCGGCCGAGGT-3’ 3’-GCCGGCTCCA-5’ Primer SSH1 5’CTAATACGACTCACTATAGGGC-3’ Nested PCR primer 1 5’TCGAGCGGCCGCCCGGGCAGGT-3’ Nested PCR primer 2R 5’AGCGTGGTCGCGGCCGAGGT-3’ Actin forward primer 5’ACCGAAGCCCCTCTTAACCC-3’ Actin reverse primer 5’GTATGGCTGACACCATCACC-3’ Sp6 primer 5’TATTTAGGTGACACTATAG-3’ T7 primer 5’TAATACGACTCACTATAGGG-3’
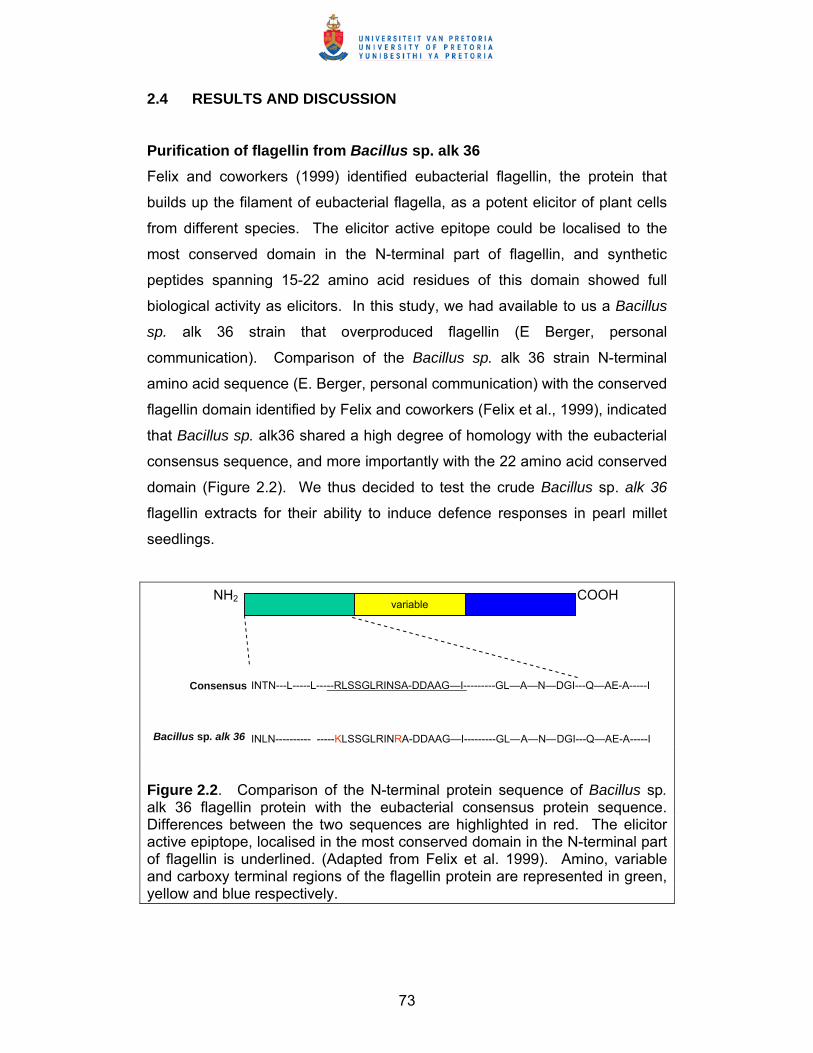
73
2.4 RESULTS AND DISCUSSION Purification of flagellin from Bacillus sp. alk 36 Felix and coworkers (1999) identified eubacterial flagellin, the protein that
builds up the filament of eubacterial flagella, as a potent elicitor of plant cells
from different species. The elicitor active epitope could be localised to the
most conserved domain in the N-terminal part of flagellin, and synthetic
peptides spanning 15-22 amino acid residues of this domain showed full
biological activity as elicitors. In this study, we had available to us a Bacillus
sp. alk 36 strain that overproduced flagellin (E Berger, personal
communication). Comparison of the Bacillus sp. alk 36 strain N-terminal
amino acid sequence (E. Berger, personal communication) with the conserved
flagellin domain identified by Felix and coworkers (Felix et al., 1999), indicated
that Bacillus sp. alk36 shared a high degree of homology with the eubacterial
consensus sequence, and more importantly with the 22 amino acid conserved
domain (Figure 2.2). We thus decided to test the crude Bacillus sp. alk 36
flagellin extracts for their ability to induce defence responses in pearl millet
seedlings.
Figure 2.2. Comparison of the N-terminal protein sequence of Bacillus sp. alk 36 flagellin protein with the eubacterial consensus protein sequence. Differences between the two sequences are highlighted in red. The elicitor active epiptope, localised in the most conserved domain in the N-terminal part of flagellin is underlined. (Adapted from Felix et al. 1999). Amino, variable and carboxy terminal regions of the flagellin protein are represented in green, yellow and blue respectively.
NH2 COOH variable
Consensus INTN---L-----L-----RLSSGLRINSA-DDAAG—I---------GL—A—N—DGI---Q—AE-A-----I
Bacillus sp. alk 36 INLN---------- -----KLSSGLRINRA-DDAAG—I---------GL—A—N—DGI---Q—AE-A-----I
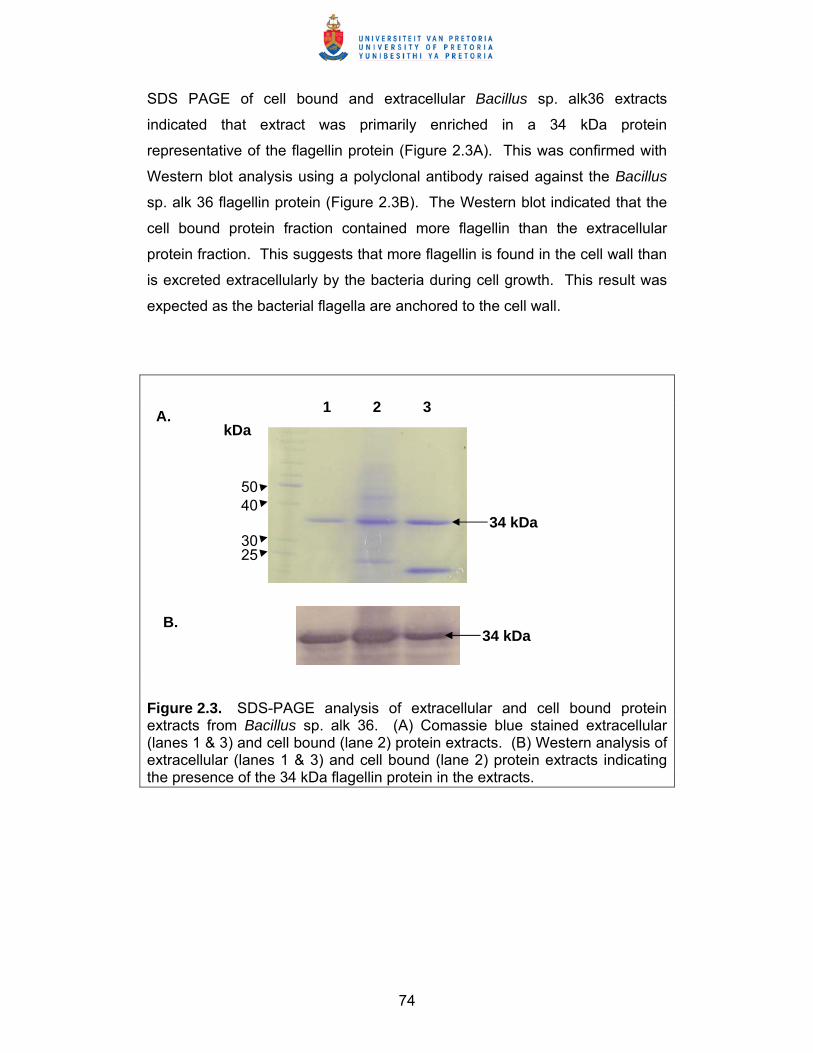
74
SDS PAGE of cell bound and extracellular Bacillus sp. alk36 extracts
indicated that extract was primarily enriched in a 34 kDa protein
representative of the flagellin protein (Figure 2.3A). This was confirmed with
Western blot analysis using a polyclonal antibody raised against the Bacillus
sp. alk 36 flagellin protein (Figure 2.3B). The Western blot indicated that the
cell bound protein fraction contained more flagellin than the extracellular
protein fraction. This suggests that more flagellin is found in the cell wall than
is excreted extracellularly by the bacteria during cell growth. This result was
expected as the bacterial flagella are anchored to the cell wall.
Figure 2.3. SDS-PAGE analysis of extracellular and cell bound protein extracts from Bacillus sp. alk 36. (A) Comassie blue stained extracellular (lanes 1 & 3) and cell bound (lane 2) protein extracts. (B) Western analysis of extracellular (lanes 1 & 3) and cell bound (lane 2) protein extracts indicating the presence of the 34 kDa flagellin protein in the extracts.
A.
B.
kDa
50 40
30 25
34 kDa
34 kDa
1 2 3
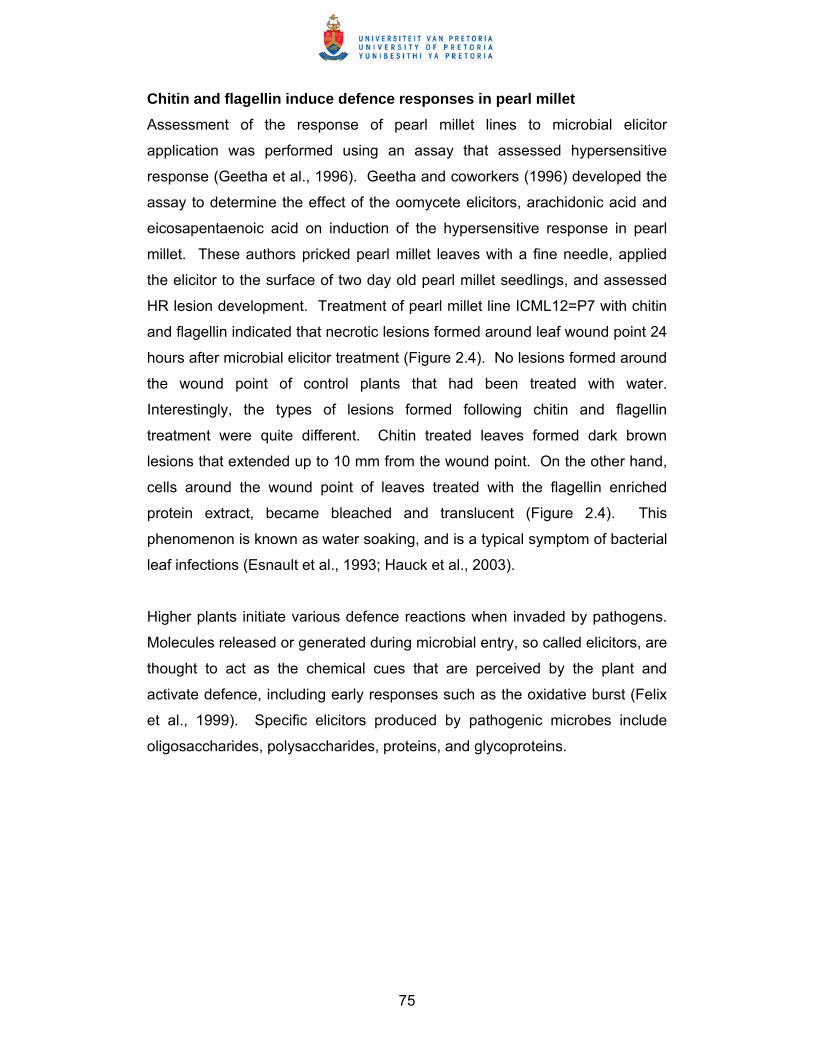
75
Chitin and flagellin induce defence responses in pearl millet Assessment of the response of pearl millet lines to microbial elicitor
application was performed using an assay that assessed hypersensitive
response (Geetha et al., 1996). Geetha and coworkers (1996) developed the
assay to determine the effect of the oomycete elicitors, arachidonic acid and
eicosapentaenoic acid on induction of the hypersensitive response in pearl
millet. These authors pricked pearl millet leaves with a fine needle, applied
the elicitor to the surface of two day old pearl millet seedlings, and assessed
HR lesion development. Treatment of pearl millet line ICML12=P7 with chitin
and flagellin indicated that necrotic lesions formed around leaf wound point 24
hours after microbial elicitor treatment (Figure 2.4). No lesions formed around
the wound point of control plants that had been treated with water.
Interestingly, the types of lesions formed following chitin and flagellin
treatment were quite different. Chitin treated leaves formed dark brown
lesions that extended up to 10 mm from the wound point. On the other hand,
cells around the wound point of leaves treated with the flagellin enriched
protein extract, became bleached and translucent (Figure 2.4). This
phenomenon is known as water soaking, and is a typical symptom of bacterial
leaf infections (Esnault et al., 1993; Hauck et al., 2003).
Higher plants initiate various defence reactions when invaded by pathogens.
Molecules released or generated during microbial entry, so called elicitors, are
thought to act as the chemical cues that are perceived by the plant and
activate defence, including early responses such as the oxidative burst (Felix
et al., 1999). Specific elicitors produced by pathogenic microbes include
oligosaccharides, polysaccharides, proteins, and glycoproteins.
76
Figure 2.4. Treatment of pearl millet leaves with elicitors. Leaves were pricked with a fine needle, and either water (A & B), chitin (C & D), or an enriched flagellin extract (E & F) was applied to the abaxial surface of the leaf. Necrotic lesions were observed under a dissecting microscope (25X magnification) 24 hours after treatment.
Chitin oligomers, which can be generated from fungal cell walls by
endochitinase, have been shown to induce defence related cellular responses
in many plants. Such responses include medium alkalinization, cytoplasmic
acidification, ion flux, membrane depolarization, protein phosphorylation and
phytoalexin production (Ramonell et al., 2002). Microarray analysis of chitin
elicitation in Arabidopsis indicated that a number of transcripts exhibited
A.
E.
C.
B.
D.
F.1 mm
1 mm 1 mm
1 mm 1 mm
1 mm
A.
E.
C.
B.
D.
F.
A.
E.
C.
B.
D.
F.1 mm1 mm
1 mm1 mm 1 mm1 mm
1 mm1 mm 1 mm1 mm
1 mm1 mm
77
altered accumulation as early as 10 minutes after seedling exposure to chitin
(Ramonell et al., 2002). Transcript levels of 61 genes were altered three fold
or more in chitin treated seedlings relative to control seedlings. Similarly,
treatment of rice suspension cultures with N-acetylchitooligosaccharides
(COS) strongly induced defence gene expression and cell death, with rapid
production of H202 preceeding cell death. COS treatment could also induce
visible cell death on rice leaves (Ning et al., 2004). Microarray analysis of
COS treated rice suspension cultures also showed that there was significant
transcriptional reprogramming in response to elicitor treatment (Akimoto-
Tomiyama et al., 2003).
Flagellin, and peptides corresponding to the most conserved domain of
eubacterial flagellin (flg15 and flg22) have been shown to act as potent
elicitors in cells of different species (Felix et al., 1999; Gómez-Gómez et al.,
1999). Flagellin and the flg22 peptide caused medium alkalinisation,
indicative of necrosis and induction of HR, in a number of dicotyledonous cell
suspension cultures, including those of tomato, potato, tobacco and
Arabidopsis. In Arabidopsis seedlings, flg22 treatment caused callose
deposition, induction of genes coding for pathogenesis related proteins, and
strong inhibition of growth (Gómez-Gómez et al., 1999). However, rice
suspension cultures did not show a detectable response to flagellin, flg22 or
flg15, although they reacted with an alkalinisation response to chitin oligomers
(Felix et al., 1999). Subsequent studies by Che and coworkers (Che et al.,
2000) demonstrated that flagellin isolated from an incompatible strain of
Acidovorax avenae induced a hypersensitive response in cultured rice cells,
but no response was observed following treatment with a compatible strain of
A. avenae. However, Pfund and coworkers (Pfund et al., 2004) showed that
flagellin from Ralstonia solanacearum cells was not the major elicitor of
defence responses in Arabidopsis. Instead, these authors concluded that the
primary eliciting activity in boiled R. solanacearum extracts applied to
Arabidopsis was attributable to one or more proteins other than flagellin.
Interestingly, the flagellin receptor FLS2 was found to be highly expressed in
the plant vasculature (Gómez-Gómez and Boller, 2002). As R. solanacearum
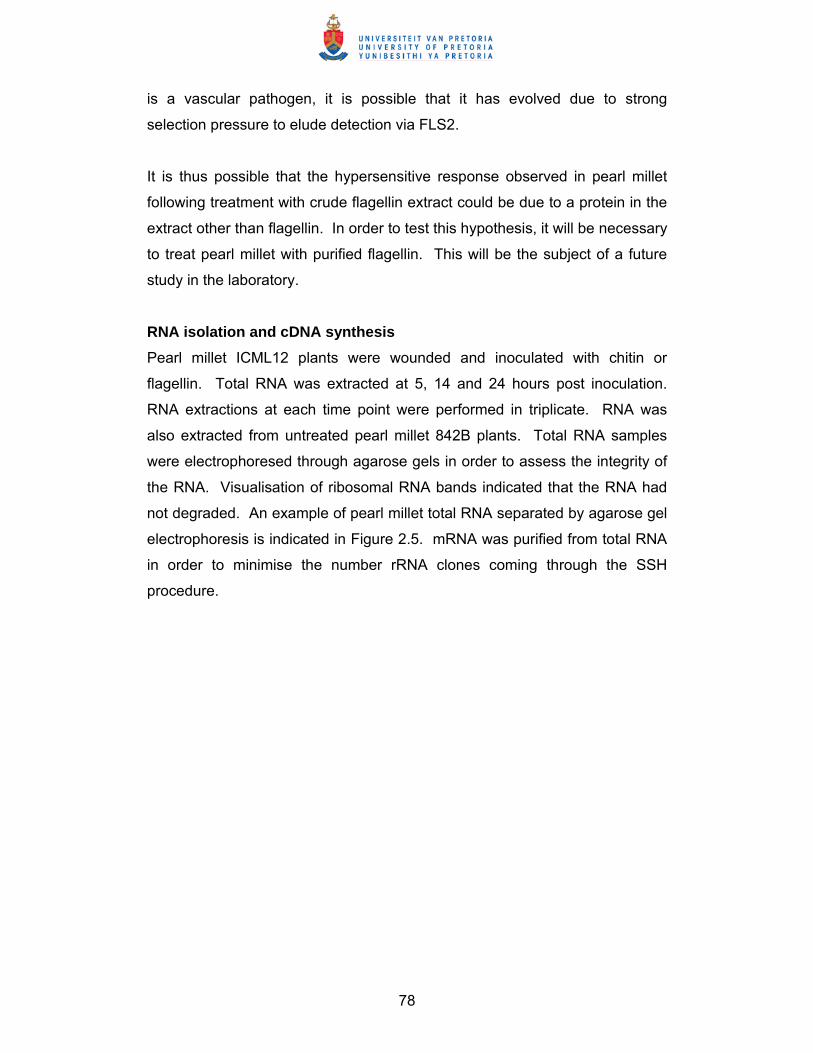
78
is a vascular pathogen, it is possible that it has evolved due to strong
selection pressure to elude detection via FLS2.
It is thus possible that the hypersensitive response observed in pearl millet
following treatment with crude flagellin extract could be due to a protein in the
extract other than flagellin. In order to test this hypothesis, it will be necessary
to treat pearl millet with purified flagellin. This will be the subject of a future
study in the laboratory.
RNA isolation and cDNA synthesis Pearl millet ICML12 plants were wounded and inoculated with chitin or
flagellin. Total RNA was extracted at 5, 14 and 24 hours post inoculation.
RNA extractions at each time point were performed in triplicate. RNA was
also extracted from untreated pearl millet 842B plants. Total RNA samples
were electrophoresed through agarose gels in order to assess the integrity of
the RNA. Visualisation of ribosomal RNA bands indicated that the RNA had
not degraded. An example of pearl millet total RNA separated by agarose gel
electrophoresis is indicated in Figure 2.5. mRNA was purified from total RNA
in order to minimise the number rRNA clones coming through the SSH
procedure.
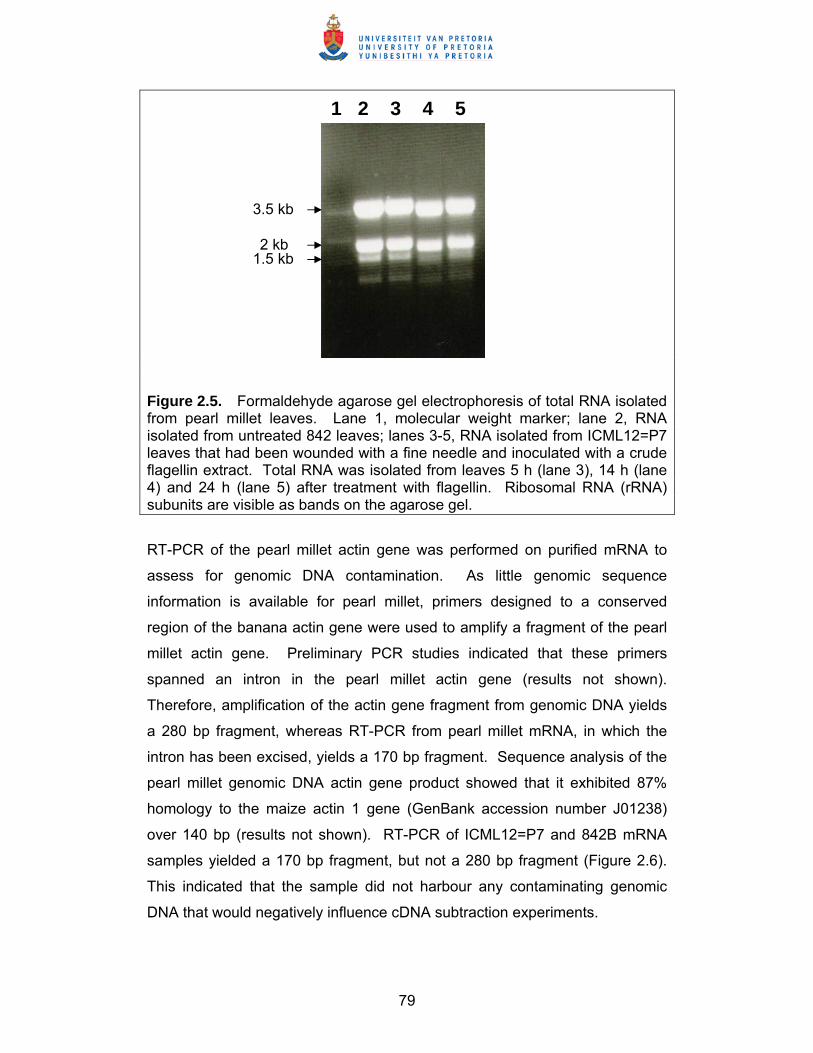
79
Figure 2.5. Formaldehyde agarose gel electrophoresis of total RNA isolated from pearl millet leaves. Lane 1, molecular weight marker; lane 2, RNA isolated from untreated 842 leaves; lanes 3-5, RNA isolated from ICML12=P7 leaves that had been wounded with a fine needle and inoculated with a crude flagellin extract. Total RNA was isolated from leaves 5 h (lane 3), 14 h (lane 4) and 24 h (lane 5) after treatment with flagellin. Ribosomal RNA (rRNA) subunits are visible as bands on the agarose gel.
RT-PCR of the pearl millet actin gene was performed on purified mRNA to
assess for genomic DNA contamination. As little genomic sequence
information is available for pearl millet, primers designed to a conserved
region of the banana actin gene were used to amplify a fragment of the pearl
millet actin gene. Preliminary PCR studies indicated that these primers
spanned an intron in the pearl millet actin gene (results not shown).
Therefore, amplification of the actin gene fragment from genomic DNA yields
a 280 bp fragment, whereas RT-PCR from pearl millet mRNA, in which the
intron has been excised, yields a 170 bp fragment. Sequence analysis of the
pearl millet genomic DNA actin gene product showed that it exhibited 87%
homology to the maize actin 1 gene (GenBank accession number J01238)
over 140 bp (results not shown). RT-PCR of ICML12=P7 and 842B mRNA
samples yielded a 170 bp fragment, but not a 280 bp fragment (Figure 2.6).
This indicated that the sample did not harbour any contaminating genomic
DNA that would negatively influence cDNA subtraction experiments.
1 2 3 4 5
3.5 kb
2 kb 1.5 kb
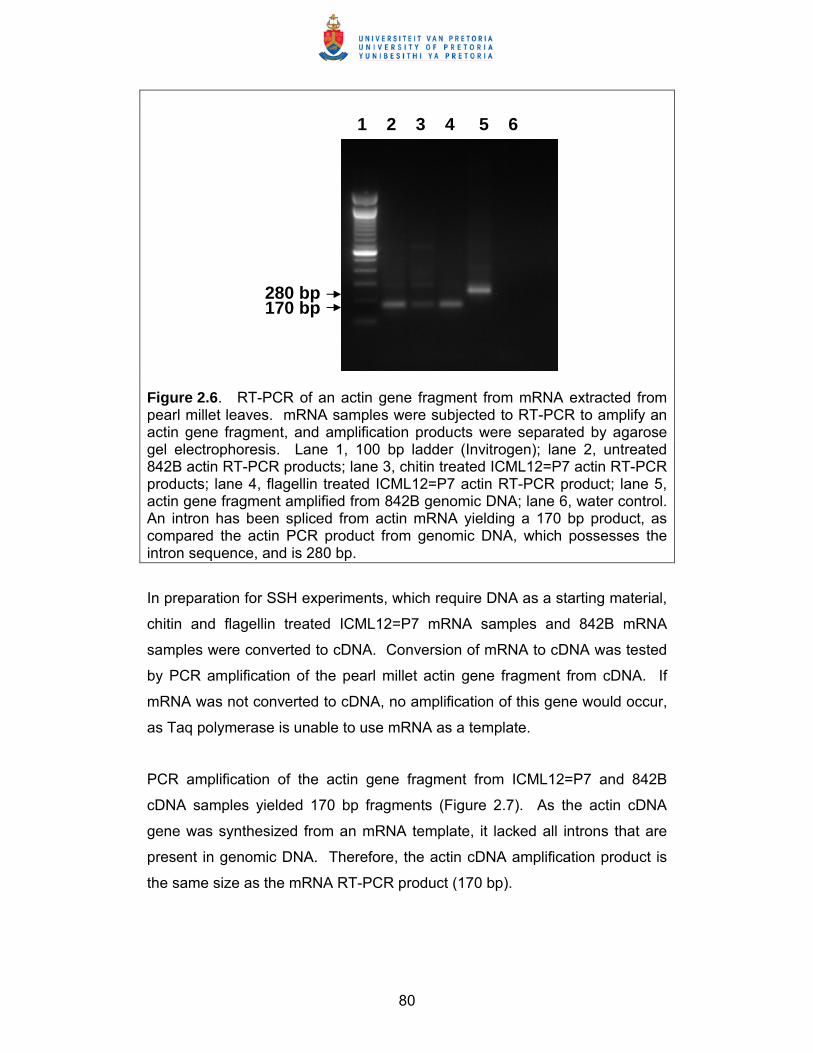
80
Figure 2.6. RT-PCR of an actin gene fragment from mRNA extracted from pearl millet leaves. mRNA samples were subjected to RT-PCR to amplify an actin gene fragment, and amplification products were separated by agarose gel electrophoresis. Lane 1, 100 bp ladder (Invitrogen); lane 2, untreated 842B actin RT-PCR products; lane 3, chitin treated ICML12=P7 actin RT-PCR products; lane 4, flagellin treated ICML12=P7 actin RT-PCR product; lane 5, actin gene fragment amplified from 842B genomic DNA; lane 6, water control. An intron has been spliced from actin mRNA yielding a 170 bp product, as compared the actin PCR product from genomic DNA, which possesses the intron sequence, and is 280 bp.
In preparation for SSH experiments, which require DNA as a starting material,
chitin and flagellin treated ICML12=P7 mRNA samples and 842B mRNA
samples were converted to cDNA. Conversion of mRNA to cDNA was tested
by PCR amplification of the pearl millet actin gene fragment from cDNA. If
mRNA was not converted to cDNA, no amplification of this gene would occur,
as Taq polymerase is unable to use mRNA as a template.
PCR amplification of the actin gene fragment from ICML12=P7 and 842B
cDNA samples yielded 170 bp fragments (Figure 2.7). As the actin cDNA
gene was synthesized from an mRNA template, it lacked all introns that are
present in genomic DNA. Therefore, the actin cDNA amplification product is
the same size as the mRNA RT-PCR product (170 bp).
1 2 3 4 5 6
280 bp 170 bp
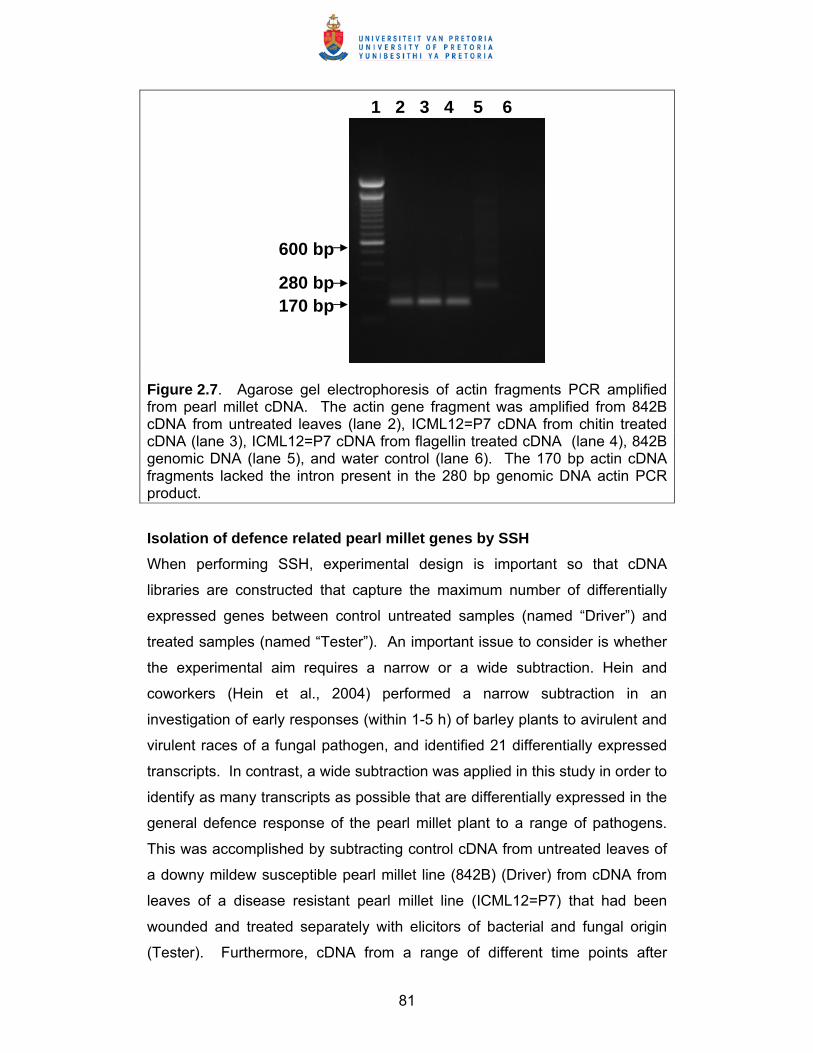
81
Figure 2.7. Agarose gel electrophoresis of actin fragments PCR amplified from pearl millet cDNA. The actin gene fragment was amplified from 842B cDNA from untreated leaves (lane 2), ICML12=P7 cDNA from chitin treated cDNA (lane 3), ICML12=P7 cDNA from flagellin treated cDNA (lane 4), 842B genomic DNA (lane 5), and water control (lane 6). The 170 bp actin cDNA fragments lacked the intron present in the 280 bp genomic DNA actin PCR product. Isolation of defence related pearl millet genes by SSH When performing SSH, experimental design is important so that cDNA
libraries are constructed that capture the maximum number of differentially
expressed genes between control untreated samples (named “Driver”) and
treated samples (named “Tester”). An important issue to consider is whether
the experimental aim requires a narrow or a wide subtraction. Hein and
coworkers (Hein et al., 2004) performed a narrow subtraction in an
investigation of early responses (within 1-5 h) of barley plants to avirulent and
virulent races of a fungal pathogen, and identified 21 differentially expressed
transcripts. In contrast, a wide subtraction was applied in this study in order to
identify as many transcripts as possible that are differentially expressed in the
general defence response of the pearl millet plant to a range of pathogens.
This was accomplished by subtracting control cDNA from untreated leaves of
a downy mildew susceptible pearl millet line (842B) (Driver) from cDNA from
leaves of a disease resistant pearl millet line (ICML12=P7) that had been
wounded and treated separately with elicitors of bacterial and fungal origin
(Tester). Furthermore, cDNA from a range of different time points after
1 2 3 4 5 6
600 bp
170 bp 280 bp
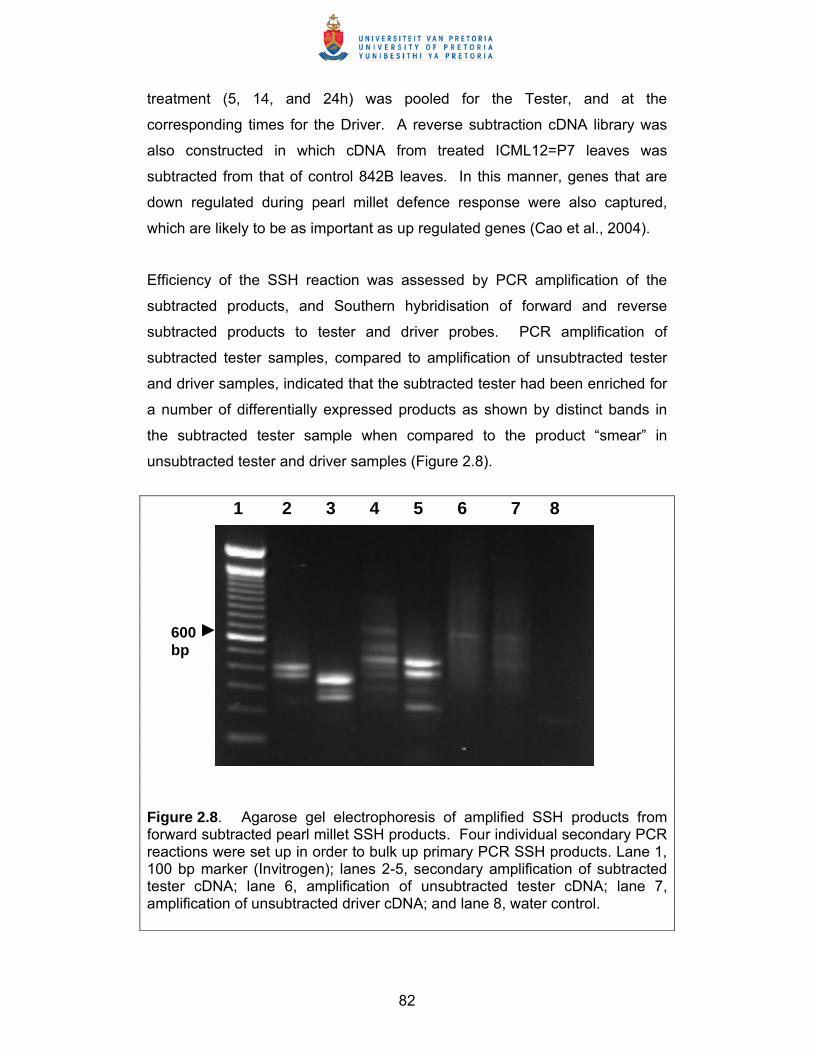
82
treatment (5, 14, and 24h) was pooled for the Tester, and at the
corresponding times for the Driver. A reverse subtraction cDNA library was
also constructed in which cDNA from treated ICML12=P7 leaves was
subtracted from that of control 842B leaves. In this manner, genes that are
down regulated during pearl millet defence response were also captured,
which are likely to be as important as up regulated genes (Cao et al., 2004).
Efficiency of the SSH reaction was assessed by PCR amplification of the
subtracted products, and Southern hybridisation of forward and reverse
subtracted products to tester and driver probes. PCR amplification of
subtracted tester samples, compared to amplification of unsubtracted tester
and driver samples, indicated that the subtracted tester had been enriched for
a number of differentially expressed products as shown by distinct bands in
the subtracted tester sample when compared to the product “smear” in
unsubtracted tester and driver samples (Figure 2.8).
Figure 2.8. Agarose gel electrophoresis of amplified SSH products from forward subtracted pearl millet SSH products. Four individual secondary PCR reactions were set up in order to bulk up primary PCR SSH products. Lane 1, 100 bp marker (Invitrogen); lanes 2-5, secondary amplification of subtracted tester cDNA; lane 6, amplification of unsubtracted tester cDNA; lane 7, amplification of unsubtracted driver cDNA; and lane 8, water control.
1 2 3 4 5 6 7 8
600 bp
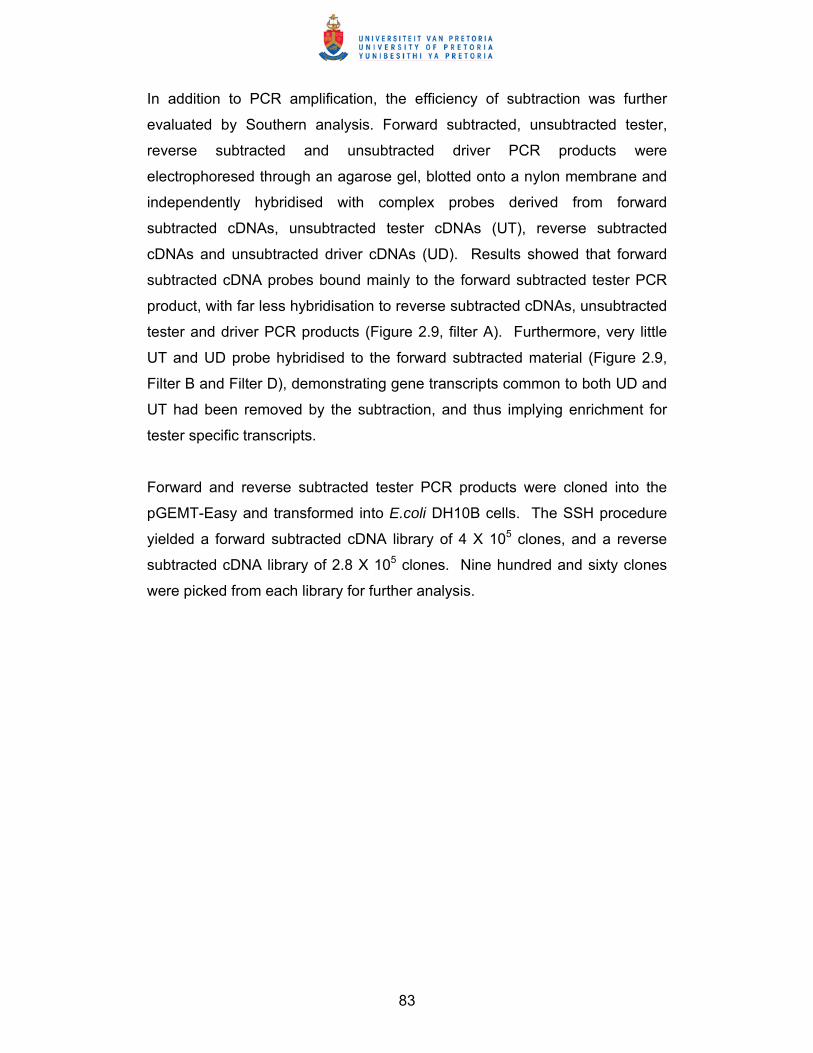
83
In addition to PCR amplification, the efficiency of subtraction was further
evaluated by Southern analysis. Forward subtracted, unsubtracted tester,
reverse subtracted and unsubtracted driver PCR products were
electrophoresed through an agarose gel, blotted onto a nylon membrane and
independently hybridised with complex probes derived from forward
subtracted cDNAs, unsubtracted tester cDNAs (UT), reverse subtracted
cDNAs and unsubtracted driver cDNAs (UD). Results showed that forward
subtracted cDNA probes bound mainly to the forward subtracted tester PCR
product, with far less hybridisation to reverse subtracted cDNAs, unsubtracted
tester and driver PCR products (Figure 2.9, filter A). Furthermore, very little
UT and UD probe hybridised to the forward subtracted material (Figure 2.9,
Filter B and Filter D), demonstrating gene transcripts common to both UD and
UT had been removed by the subtraction, and thus implying enrichment for
tester specific transcripts.
Forward and reverse subtracted tester PCR products were cloned into the
pGEMT-Easy and transformed into E.coli DH10B cells. The SSH procedure
yielded a forward subtracted cDNA library of 4 X 10⁵ clones, and a reverse
subtracted cDNA library of 2.8 X 10⁵ clones. Nine hundred and sixty clones
were picked from each library for further analysis.
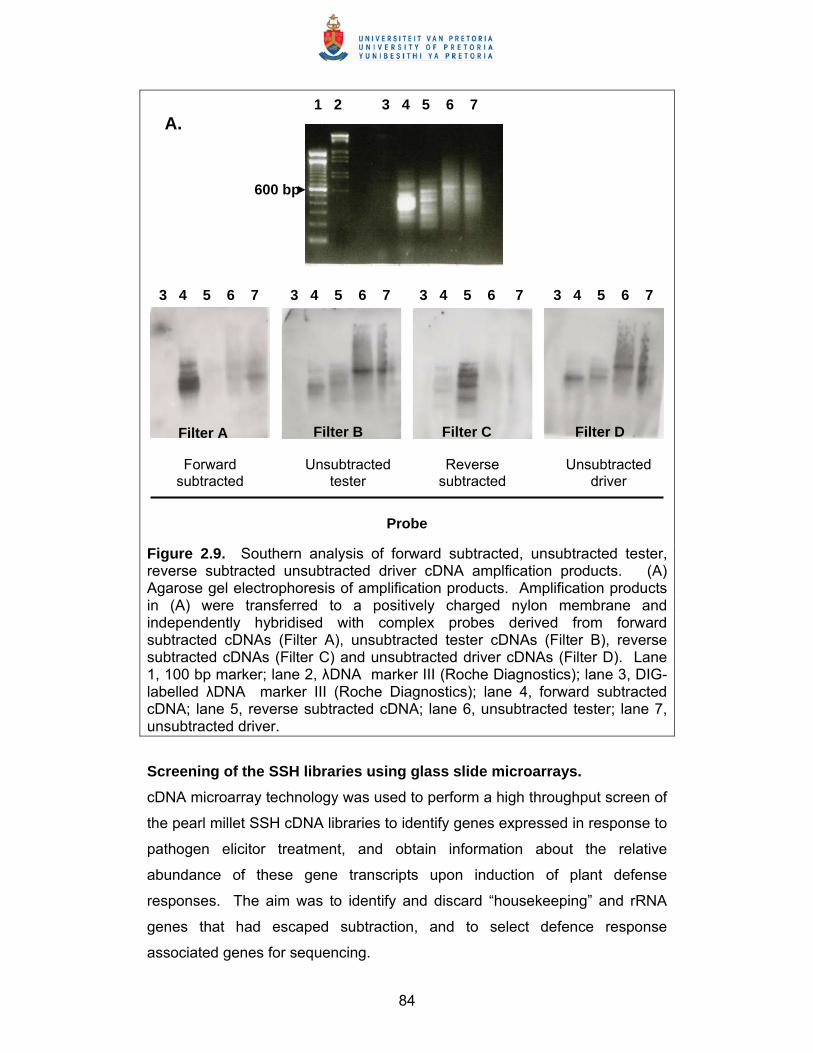
84
Figure 2.9. Southern analysis of forward subtracted, unsubtracted tester, reverse subtracted unsubtracted driver cDNA amplfication products. (A) Agarose gel electrophoresis of amplification products. Amplification products in (A) were transferred to a positively charged nylon membrane and independently hybridised with complex probes derived from forward subtracted cDNAs (Filter A), unsubtracted tester cDNAs (Filter B), reverse subtracted cDNAs (Filter C) and unsubtracted driver cDNAs (Filter D). Lane 1, 100 bp marker; lane 2, λDNA marker III (Roche Diagnostics); lane 3, DIG-labelled λDNA marker III (Roche Diagnostics); lane 4, forward subtracted cDNA; lane 5, reverse subtracted cDNA; lane 6, unsubtracted tester; lane 7, unsubtracted driver.
Screening of the SSH libraries using glass slide microarrays. cDNA microarray technology was used to perform a high throughput screen of
the pearl millet SSH cDNA libraries to identify genes expressed in response to
pathogen elicitor treatment, and obtain information about the relative
abundance of these gene transcripts upon induction of plant defense
responses. The aim was to identify and discard “housekeeping” and rRNA
genes that had escaped subtraction, and to select defence response
associated genes for sequencing.
1 2 3 4 5 6 7
600 bp
Filter A Filter B Filter C Filter D
Forward subtracted
Unsubtracted tester
Reverse subtracted
Unsubtracted driver
Probe
3 4 5 6 7 3 4 5 6 7 3 4 5 6 7 3 4 5 6 7
A.
85
The SSH libraries arrayed on the glass slides were screened with rDNA
clones from pearl millet. The rDNA probes hybridised to 5% of the forward
subtracted pearl millet clones and less than 1% of the reverse subtracted
clones (data not shown).
After hybridisation with combinations of the SSH cDNAs, enrichment ratios
were calculated for the forward subtracted library for ST:UD (ER1) and ST:UT
(ER2) (Van den Berg et al., 2004). A positive ER1 or ER2 value indicates
transcripts that have been enriched during subtraction relative to their levels in
UD or UT, respectively. Conversely, negative ER1 or ER2 values indicate
transcripts that have been reduced in abundance during SSH relative to their
levels in UD or UT, respectively, due to normalisation. Normalisation
equalises the concentration of individual transcripts, which may be present at
very different concentrations prior to normalisation (Diatchenko et al., 1996).
This has the advantage of enriching for rare transcripts in the subtracted
tester samples and reducing the levels of abundant transcripts.
Relative abundance of cDNAs in UD and UT for the forward subtracted library
was visualized by plotting ER1 versus ER2 for individual forward subtracted
pearl millet clones (Figure 2.10). The diagonal line on each graph (ER1=ER2)
in Figure 2.10 represents similar levels of enrichment / normalisation during
SSH relative to UD and UT. Clones lying on this line are derived from
transcripts of equal abundance in UD and UT. The majority of clones (77 % of
forward subtracted pearl millet SSH clones) lie above this line (ER1>ER2),
indicating a greater abundance of these transcripts in UT than in UD, and
confirming that each SSH has enriched for transcripts that are up regulated in
the tester. Clones above the diagonal line with positive ER2 values are likely
to be derived from low abundance transcripts; expression of some of these
may be difficult to detect in Northern blots and accurate comparisons of gene
expression between tester and driver may require real time RT-PCR.
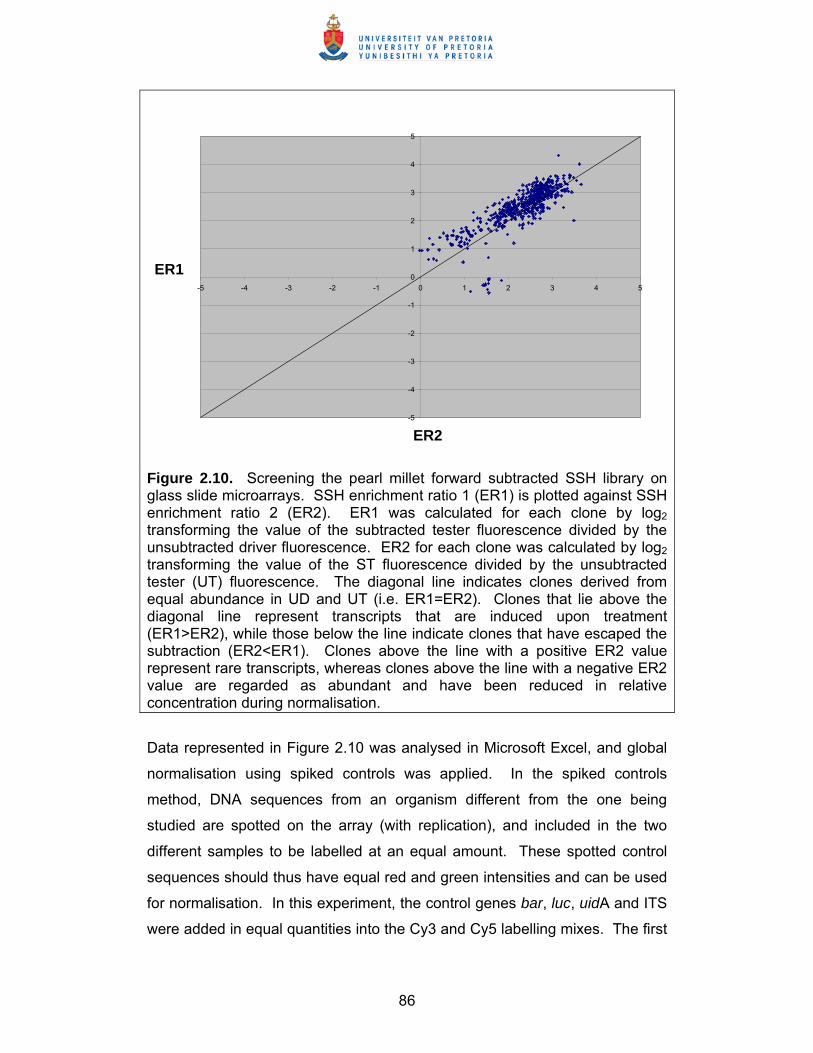
86
Figure 2.10. Screening the pearl millet forward subtracted SSH library on glass slide microarrays. SSH enrichment ratio 1 (ER1) is plotted against SSH enrichment ratio 2 (ER2). ER1 was calculated for each clone by log2 transforming the value of the subtracted tester fluorescence divided by the unsubtracted driver fluorescence. ER2 for each clone was calculated by log2 transforming the value of the ST fluorescence divided by the unsubtracted tester (UT) fluorescence. The diagonal line indicates clones derived from equal abundance in UD and UT (i.e. ER1=ER2). Clones that lie above the diagonal line represent transcripts that are induced upon treatment (ER1>ER2), while those below the line indicate clones that have escaped the subtraction (ER2<ER1). Clones above the line with a positive ER2 value represent rare transcripts, whereas clones above the line with a negative ER2 value are regarded as abundant and have been reduced in relative concentration during normalisation.
Data represented in Figure 2.10 was analysed in Microsoft Excel, and global
normalisation using spiked controls was applied. In the spiked controls
method, DNA sequences from an organism different from the one being
studied are spotted on the array (with replication), and included in the two
different samples to be labelled at an equal amount. These spotted control
sequences should thus have equal red and green intensities and can be used
for normalisation. In this experiment, the control genes bar, luc, uidA and ITS
were added in equal quantities into the Cy3 and Cy5 labelling mixes. The first
-5
-4
-3
-2
-1
0
1
2
3
4
5
-5 -4 -3 -2 -1 0 1 2 3 4 5
ER2
ER1
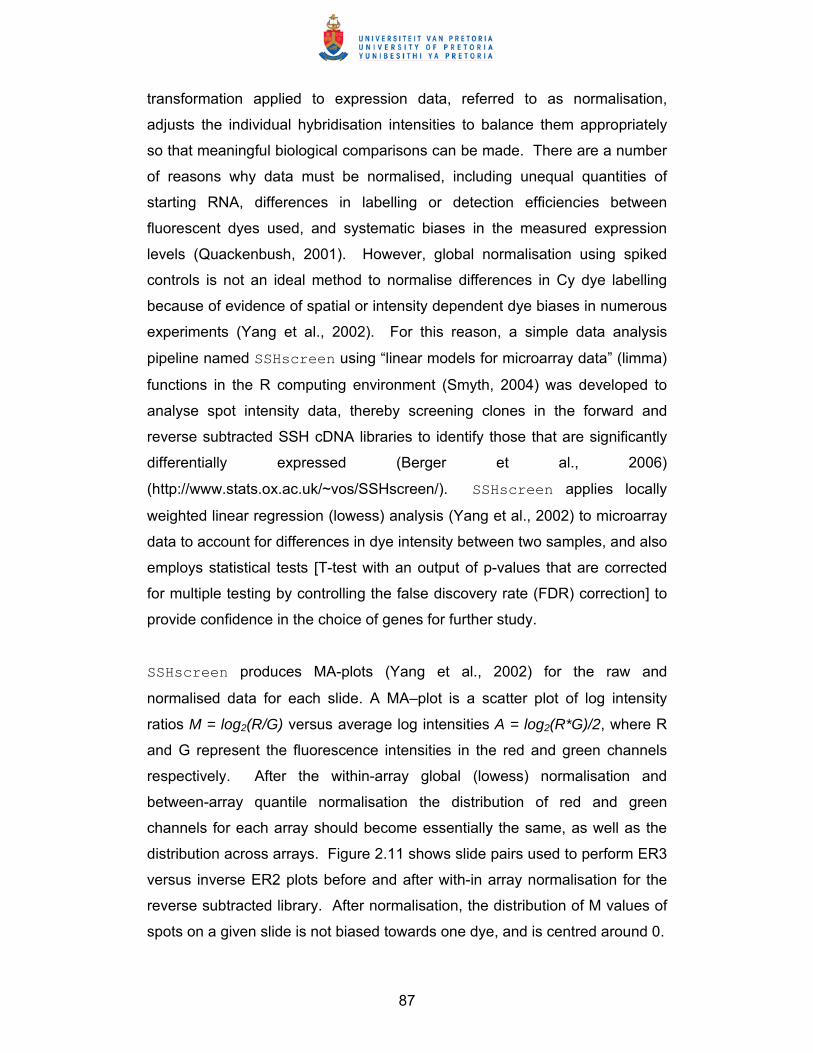
87
transformation applied to expression data, referred to as normalisation,
adjusts the individual hybridisation intensities to balance them appropriately
so that meaningful biological comparisons can be made. There are a number
of reasons why data must be normalised, including unequal quantities of
starting RNA, differences in labelling or detection efficiencies between
fluorescent dyes used, and systematic biases in the measured expression
levels (Quackenbush, 2001). However, global normalisation using spiked
controls is not an ideal method to normalise differences in Cy dye labelling
because of evidence of spatial or intensity dependent dye biases in numerous
experiments (Yang et al., 2002). For this reason, a simple data analysis
pipeline named SSHscreen using “linear models for microarray data” (limma)
functions in the R computing environment (Smyth, 2004) was developed to
analyse spot intensity data, thereby screening clones in the forward and
reverse subtracted SSH cDNA libraries to identify those that are significantly
differentially expressed (Berger et al., 2006)
(http://www.stats.ox.ac.uk/~vos/SSHscreen/). SSHscreen applies locally
weighted linear regression (lowess) analysis (Yang et al., 2002) to microarray
data to account for differences in dye intensity between two samples, and also
employs statistical tests [T-test with an output of p-values that are corrected
for multiple testing by controlling the false discovery rate (FDR) correction] to
provide confidence in the choice of genes for further study.
SSHscreen produces MA-plots (Yang et al., 2002) for the raw and
normalised data for each slide. A MA–plot is a scatter plot of log intensity
ratios M = log2(R/G) versus average log intensities A = log2(R*G)/2, where R
and G represent the fluorescence intensities in the red and green channels
respectively. After the within-array global (lowess) normalisation and
between-array quantile normalisation the distribution of red and green
channels for each array should become essentially the same, as well as the
distribution across arrays. Figure 2.11 shows slide pairs used to perform ER3
versus inverse ER2 plots before and after with-in array normalisation for the
reverse subtracted library. After normalisation, the distribution of M values of
spots on a given slide is not biased towards one dye, and is centred around 0.
88
Figure 2.11. M vs A plots for microarray slides before and after global lowess normalisation using SSHscreen. Data from slides 56 and 57 were used to calculate inverse ER2, and data from slides 58 and 114 were used to calculate ER3 for the reverse subtracted library. Slide 56 was probed with subtracted untreated sample (Cy3) and unsubtracted untreated sample (Cy5). Slide 58 was probed with unsubtracted treated sample (Cy5) and unsubtracted untreated sample (Cy 3). Slide 57 and slide 114 represent dye swap comparisons of slides 56 and 114 respectively.
89
Furthermore, comparison between normalised dye swap slide pairs shows
that MA-plot distributions are mirror images of each other, suggesting that
clones that are shown to be up- or down regulated on one slide, show similar
expression patterns on the reverse slide.
Figure 2.12 shows the plot of ER3 versus inverse ER2 for the forward
subtracted pearl millet library as analysed with SSHscreen. Data points that
are above the x-axis of the graph (ER3>0 ~ UT>UD) represent genes up
regulated by the treatment. These are the expected clones in the SSH library
that can be chosen for further study. Data points below the x-axis of the
graph (ER3<0 ~ UT<UD) represent genes that are down regulated by the
treatment, which should not be represented in the SSH library and have most
likely escaped subtraction. The x-axis of the graph (ER3=0 ~ UT=UD)
represents housekeeping genes that have similar levels in the untreated
(Driver) and treated (Tester) samples. The inverse ER2 values reflect the
level of normalisation for each gene, from which one can infer whether it is
rare or abundant in the treated sample (UT). Data points in quadrant 1 (top
left) of Figure 2.12 represent up regulated genes that are rare in the UT
sample (negative 1/ER2 and positive ER3). This information is useful since
these will have a low level of mRNA transcripts in the treated sample, which
may need a sensitive verification method such as real time RT PCR. In
contrast, data points in quadrant 2 (top right) represent up regulated genes
that are abundant in the UT sample that should require a less sensitive
verification technique such as Northern blot analysis. The clones that are
statistically significantly up- or down regulated, as determined by the linear
model, are also indicated in Figure 2.12. The advantage of the plot in Figure
2.12 over that in Figure 2.10 is that it places the data for genes with different
behaviours in each of the four quadrants which allows for easy interpretation.
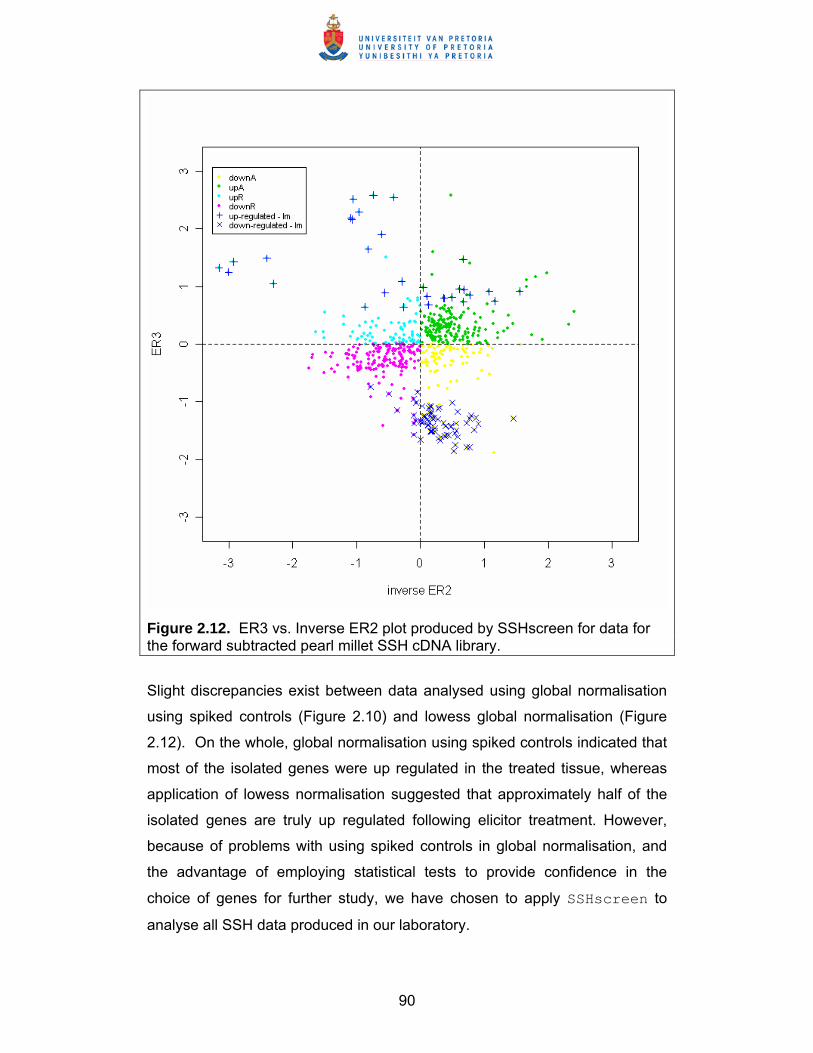
90
Figure 2.12. ER3 vs. Inverse ER2 plot produced by SSHscreen for data for the forward subtracted pearl millet SSH cDNA library.
Slight discrepancies exist between data analysed using global normalisation
using spiked controls (Figure 2.10) and lowess global normalisation (Figure
2.12). On the whole, global normalisation using spiked controls indicated that
most of the isolated genes were up regulated in the treated tissue, whereas
application of lowess normalisation suggested that approximately half of the
isolated genes are truly up regulated following elicitor treatment. However,
because of problems with using spiked controls in global normalisation, and
the advantage of employing statistical tests to provide confidence in the
choice of genes for further study, we have chosen to apply SSHscreen to
analyse all SSH data produced in our laboratory.
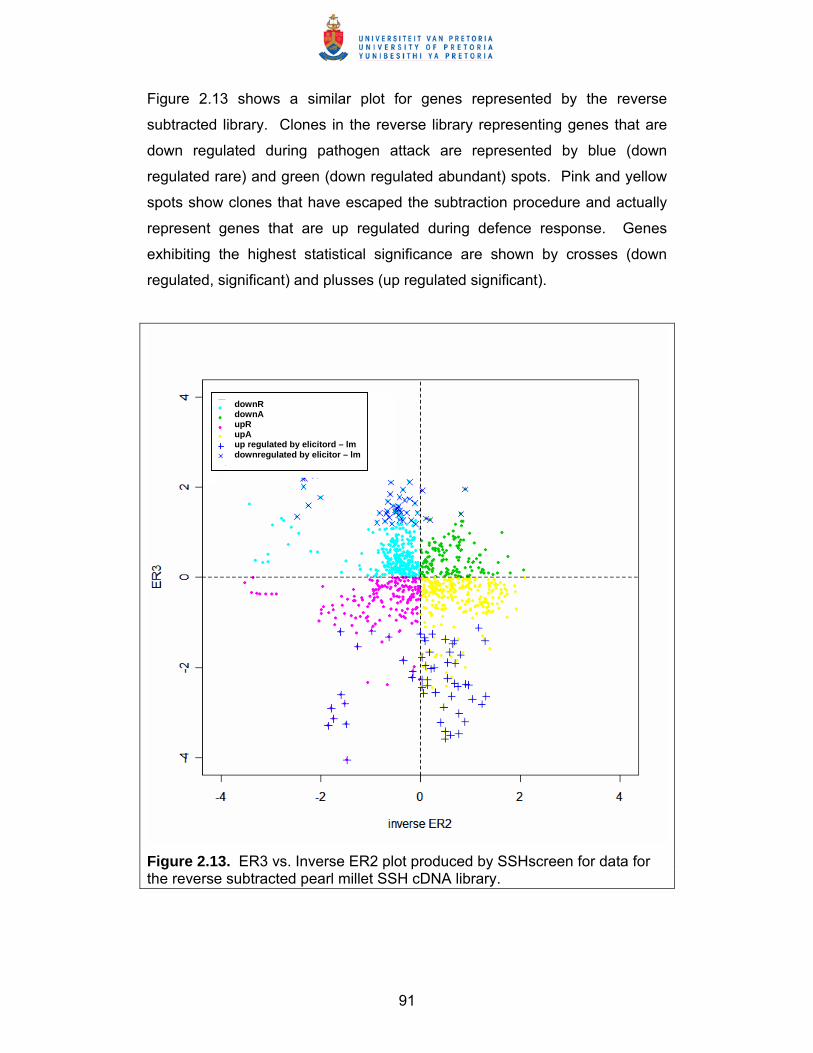
91
Figure 2.13 shows a similar plot for genes represented by the reverse
subtracted library. Clones in the reverse library representing genes that are
down regulated during pathogen attack are represented by blue (down
regulated rare) and green (down regulated abundant) spots. Pink and yellow
spots show clones that have escaped the subtraction procedure and actually
represent genes that are up regulated during defence response. Genes
exhibiting the highest statistical significance are shown by crosses (down
regulated, significant) and plusses (up regulated significant).
Figure 2.13. ER3 vs. Inverse ER2 plot produced by SSHscreen for data for the reverse subtracted pearl millet SSH cDNA library.
downR downA upR upA up regulated by elicitord – lm downregulated by elicitor – lm
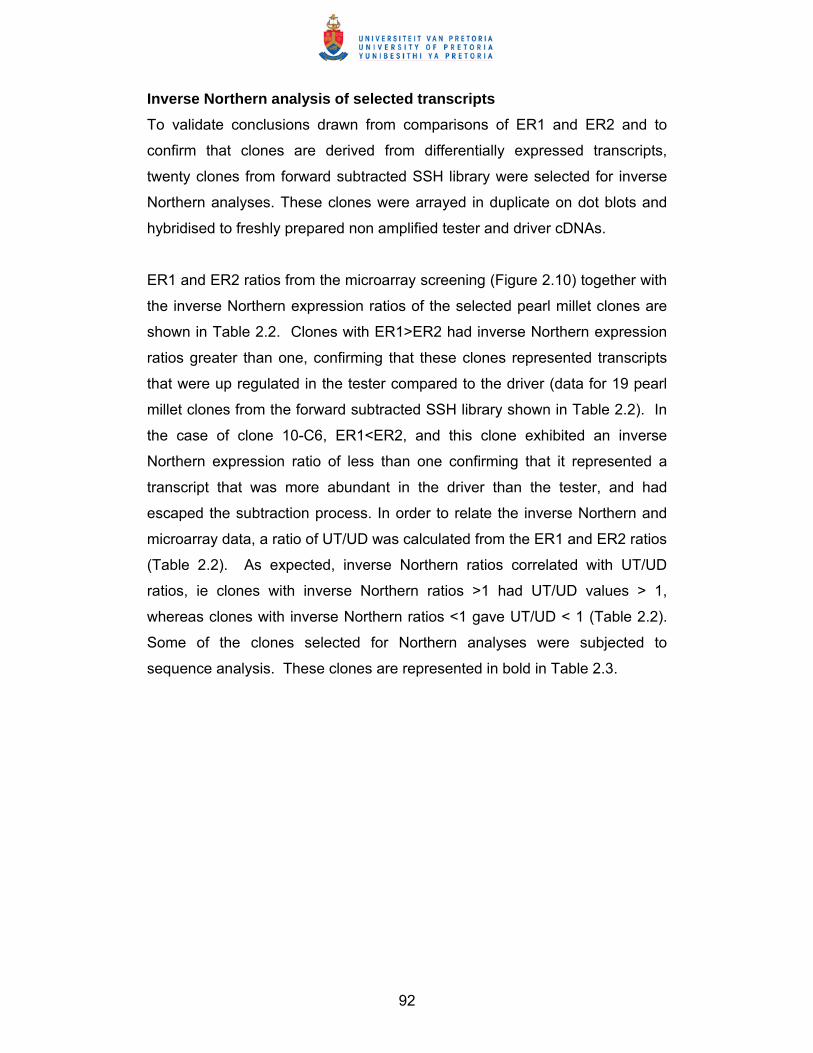
92
Inverse Northern analysis of selected transcripts To validate conclusions drawn from comparisons of ER1 and ER2 and to
confirm that clones are derived from differentially expressed transcripts,
twenty clones from forward subtracted SSH library were selected for inverse
Northern analyses. These clones were arrayed in duplicate on dot blots and
hybridised to freshly prepared non amplified tester and driver cDNAs. ER1 and ER2 ratios from the microarray screening (Figure 2.10) together with
the inverse Northern expression ratios of the selected pearl millet clones are
shown in Table 2.2. Clones with ER1>ER2 had inverse Northern expression
ratios greater than one, confirming that these clones represented transcripts
that were up regulated in the tester compared to the driver (data for 19 pearl
millet clones from the forward subtracted SSH library shown in Table 2.2). In
the case of clone 10-C6, ER1<ER2, and this clone exhibited an inverse
Northern expression ratio of less than one confirming that it represented a
transcript that was more abundant in the driver than the tester, and had
escaped the subtraction process. In order to relate the inverse Northern and
microarray data, a ratio of UT/UD was calculated from the ER1 and ER2 ratios
(Table 2.2). As expected, inverse Northern ratios correlated with UT/UD
ratios, ie clones with inverse Northern ratios >1 had UT/UD values > 1,
whereas clones with inverse Northern ratios <1 gave UT/UD < 1 (Table 2.2).
Some of the clones selected for Northern analyses were subjected to
sequence analysis. These clones are represented in bold in Table 2.3.
93
Table 2.2. Validation of microarray screening of selected pearl millet SSH clones by inverse Northern data.
Clone number
ER1 1 ER2 2 UT/UD ratio 3
Inverse Northern expression ratio 4
3-D5 4-H11 10-B7 4-H9 5-C3 1-B7 6-A2 8-D7 4-A2
4-E12 7-D7
2-A12 6-F1 2-A8 6-H1 6-C2 6-D1 3-H3 6-G2
10-C6
1.4 1.2 1.0 0.6 1.5 1.6 1.2 1.0 0.9 0.9 1.6 3.6 2.6 3.6 2.2 3.0 2.6 4.3 2.0
-0.3
0.20.30.20.30.70.50.70.4
0.03-0.02
0.83.42.03.31.92.72.53.11.71.5
2.31.91.71.21.72.11.41.51.81.91.71.11.51.21.21.21.12.31.20.3
34.3 21.1 11.1
9.3 7.9 7.2 6.3 6.2 5.8 5.4 5.3 3.6 3.3 2.6 2.5 2.3 1.5 1.3 1.1 0.9
1 and 2 ER1 and ER2 were calculated from the microarray screening as log2 (ST/UD) and log2 (ST/UT), respectively.
3 UT/UD = antilog of (ER1 – ER2) in the base 2 4 Inverse Northern expression ratio was calculated as follows: Density of
tester/Density of driver samples after normalization of the data using a rDNA clone.
The above results effectively demonstrated the use of cDNA microarrays to
screen forward and reverse subtracted pearl millet SSH libraries in a rapid,
high throughput manner. The major advantages of this screening method are
that it provides an objective and quantitative way to identify differentially
expressed genes as well as to determine the relative abundance of transcripts
in the original UT samples. Furthermore, application of SSHscreen allows
for statistical tests of microarray data to provide confidence in choice of genes
for further studies.
Previous studies have used inverse Northern blots to screen SSH libraries in
which PCR products or colonies are dotted onto nylon membranes and the
94
driver and tester cDNAs are labelled with radioactivity (Diatchenko et al.,
1996; Mahalingam et al., 2003). This method has disadvantages, namely that
comparisons are made between two separate membrane hybridisations which
introduces error and the interpretation is qualitative (Mahalingam et al., 2003)
unless a laboratory has access to a phosphorimager. In contrast to
membrane based methods, hybridisation to glass slide cDNA microarrays can
be performed with different fluorescent tags, which allows a direct comparison
of the relative abundance of transcripts in ST, UT and UD. Furthermore,
hybridisations are performed on a small surface area, which reduces the
amount of labelled probe needed. Finally, the computerised scanning of the
array provides a high throughput quantitative method to choose which genes
to sequence and study further using Northern Blot analysis, real time RT-PCR
or a custom microarray.
Sequence analysis of selected clones A random selection of clones from the forward and reverse subtracted SSH
libraries with either ER1>ER2, or positive ER3 values, were chosen for
sequence analysis (Table 2.3). In total, 120 clones were sequenced, of which
117 reactions produced results of good quality. In many cases, the same
sequences were represented by more than one clone, indicative of
enrichment in the SSH. Homology comparisons indicated that 55 of the 117
sequences represented clones with unique identity. A number of clones
showed significant similarities to genes associated with plant defence and
stress responses.
Pathogenesis related protens (PRs) (4-B7) are plant proteins induced in
response to infection by pathogens including viruses, fungi and bacteria. PR1
expression is mediated via the SA signalling pathway, and is a typical marker
protein of systemic acquired resistance.
Glutaredoxins (1-G9) are small ubiquitous proteins of the thioredoxin family,
which protect the plant from oxidative stress. These proteins catalyse dithiol-
disulphide exchange reactions or reduce protein-mixed glutathione
disulphides (Rouhier et al., 2005). Glutathione S-transferases (6-E3) are also
95
involved in protecting the plant from oxidative stress, and catalyse the
conjugation of hydrophobic, electrophilic compounds with the tripeptide
glutathione to form polar, non-toxic peptide conjugates (Wilce and Parker,
1994).
Other induced defence response genes include farnesyl pyrophosphate
synthetase (2-D2), which is involved in lesion formation in diseased leaves
(Manzano et al., 2004), UDP-glucose:salicylic acid glucosyl transferase (1-
B9), HSP70 (2-F11), ubiquitin associated protein (6-B5), alanine
aminotransferase (6-B6). HSP70 has been found to be up regulated during
the hypersensitive response (Birch et al., 1999), and recently Kanzaki and
coworkers (Kanzaki et al., 2003) showed through virus induced gene silencing
(VIGS) that HSP70 is an essential component of the plant defence signal
transduction pathway. Glucosyl transferases catalyse the transfer of glucose
residues to numerous substrates and regulate the activity of compounds that
play important roles in plant defence against pathogens, such as salicylic acid
(Chong et al., 2002). Aminotransferases have recently been shown to play a
role in “enzymatic disease resistance” to downy mildew (cased by
Pseudoperonospora cubensis) in Cucumis melo (wild melon) (Taler et al.,
2004). S-adenosylmethionine decarboxylase (6-H1) is an important enzyme in
polyamine biosynthesis, and catalyses the decarboxylation of S-adenosyl
methionine (SAM) into decarboxylated SAM which provides the aminopropyl
moiety required for spermidine and spermine biosynthesis from putresine.
Recently, a preliminary link was made between polyamines and plant defence
response where the polyamine spermine was hypothesised to act as an
inducer of PR proteins, and as a trigger for caspase-like activity and hence
HR (Walters, 2003).
Genes involved in signal transduction are represented in the pearl millet SSH
library. Receptor kinases (4-E8) are involved in perception of the pathogen
signal, and initiation of subsequent intracellular transduction to elicit plant
defence responses (Hammond-Kosack and Parker, 2003). The calcium
binding EF hand protein (5-B12) is one of four similar domains which form a
calcium dependent protein kinase (CDPK). Pathogen attack cause
96
perturbations in cellular calcium (Ca2+) levels. CDPKs decode information
contained in the temporal and spatial signals of these Ca2+ signals and bring
about changes in metabolism and gene expression (Harmon et al., 2000).
Induction of genes encoding chlorophyll A/B binding (CAB) (5-H9) proteins by
the pathogen elicitor treatment suggests the existence of crosstalk between
defence and other signalling pathways. Schenk and coworkers (Schenk et al.,
2000) obtained similar results when they treated Arabidopsis plants with SA
and observed the up regulation of cab genes. Results presented here further
support the hypothesis that defence mediated signalling pathways crosstalk
with the pathway regulated with the phytochromeA/red light, leading to
induction of cab genes. Availability of an Arabidopsis phytochrome A and B
signalling mutant (psi2) showing elevated levels of PR gene expression also
suggests that light signal transduction and pathogenesis related gene
signalling pathways are connected (Genoud et al., 1998).
SSH revealed a number of genes involved in transcription and translation that
are up regulated in response to pathogen elicitor treatment. These include
transcription factor EREBP1 (10-C3), transcription factor BTF3 (4-G8),
translation initiation factor 5A (10-A9), protein translation factor Sui1 (10-F7)
and elongation factor 1 alpha (3-C8). Of particular interest to plant defence
response interactions is transcription factor EREBP1 which is known to
mediate gene expression in response to various pathogens and defence
elicitors (Euglem, 2005).
The pearl millet SSH defence response library was found to contain a number
of unknown proteins (10-A1, 10-A3, 10-A4, 10-B7,1-C12, 1-H6, 2-C10, 2-C8,
4-A2, 5-A8, 5-B1, 6-A2, 6-B1, 6-G9, 7-A11, 7-F2, 9-D10), which potentially
code for novel, uncharacterised genes involved in plant defence response.
These genes are therefore interesting candidates for further studies involving
either RNA silencing (Vance and Vaucheret, 2001) or virus induced gene
silencing (VIGS) (Burch-Smith et al., 2004) to determine their role in plant
defence response.
97
Several research groups have employed SSH to study plant gene expression
in response to pathogen infection or insect feeding. Birch and coworkers
(Birch et al., 1999) used SSH to isolate and study potato genes that are
induced during an early stage of the hypersensitive response to Phytophthora
infestans. Mahalingam and coworkers (2003) applied SSH to identify a total
of 1058 Arabidopsis genes that are differentially expressed in response to
ozone, bacterial and oomycete pathogens and the defence signalling
molecules salicylic acid and jasmonic acid. SSH was also employed to study
gene expression changes in rice in response to treatment with the blast
fungus (Pyricularia grisea) (Xiong et al., 2001), and more recently to
characterise the early transcriptional changes involving multiple signalling
pathways in the Mla13 barley interaction with powdery mildew (Blumeria
graminis f. sp. hordei) (Hein et al., 2004). A number of studies have also
utilised SSH to create defence response cDNA libraries of non-model
organisms, and combined these experiments with cDNA microarray analyses
to examine gene expression in response to pathogen/pest treatment.
Combined SSH/microarray studies have been performed in wild rice (Oryza
minuta) to identify fungal (Magnaporthe grisea) stress induced genes and
planthopper induced genes respectively (Cho et al., 2005; Shim et al., 2004).
Zhu-Salzman and coworkers (Zhu-Salzman et al., 2004) constructed a cDNA
library by differential subtraction with cDNAs prepared from sorghum
seedlings infested by greenbug aphids and those from uninfested seedlings.
Subsequent expression profiling using DNA microarray identified transcripts
from this cDNA collection responsive to greenbug feeding, methyl jasmonate,
or salicylic acid application. The forward and reverse subtracted pearl millet
SSH cDNA libraries therefore present a resource for cDNA microarray studies
to examine gene expression changes in pearl millet in response to various
pathogen related stresses.
Next page:
Table 2.3. Selected genes from forward and reverse SSH libraries chosen for sequence analysis. Clones shown in bold represent sequences that were subjected to inverse Northern analysis (Table 2.2). Clone 10-A1 is identical to clones 3-D5, 4-H11, 5-C3. Clone 3-C8 is identical to 7-D7, and 8-F3 identical to 6-F1. Clones with “no matches” exhibit no homology to sequences in BlastX, BlastN and dBEST databases. Clones with “no identity” have homology to sequences in BlastN and dBEST databases, but the sequence is not characterised. Unknown proteins represent clones with homology to annotated but uncharacterised sequences in the BlastX database.
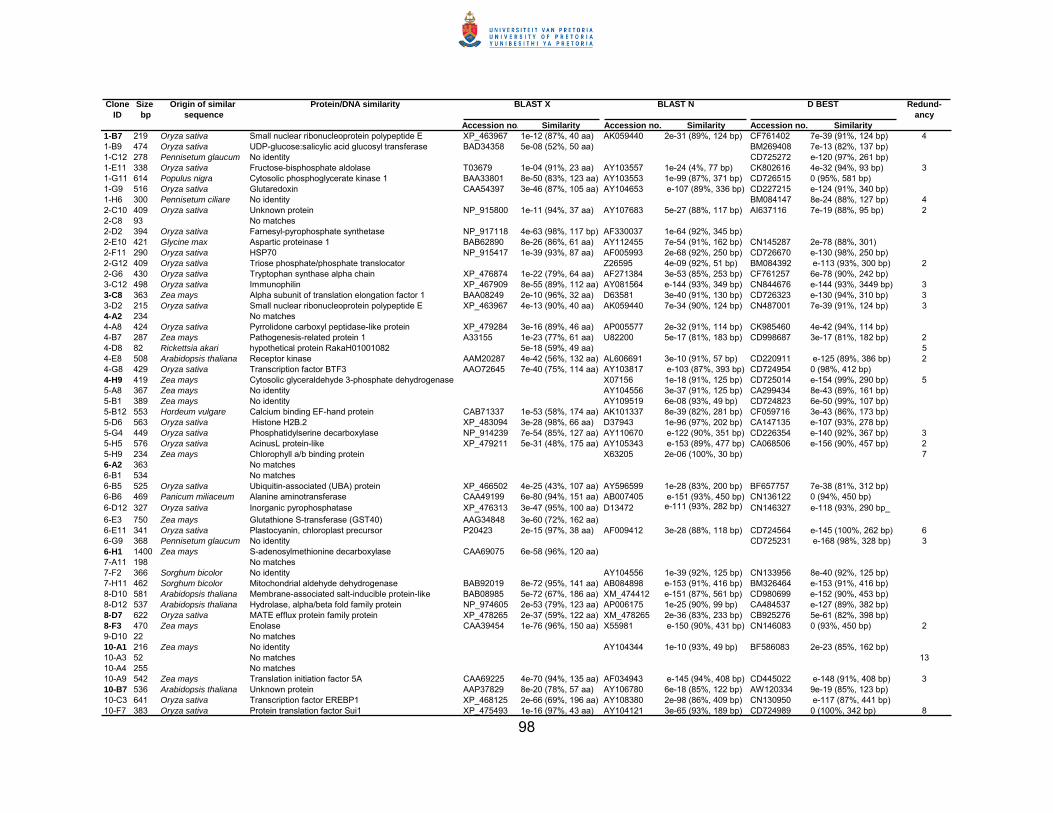
98
Clone Size Origin of similar Protein/DNA similarity Redund-ID bp sequence ancy
Accession no. Similarity Accession no. Similarity Accession no. Similarity1-B7 219 Oryza sativa Small nuclear ribonucleoprotein polypeptide E XP_463967 1e-12 (87%, 40 aa) AK059440 2e-31 (89%, 124 bp) CF761402 7e-39 (91%, 124 bp) 41-B9 474 Oryza sativa UDP-glucose:salicylic acid glucosyl transferase BAD34358 5e-08 (52%, 50 aa) BM269408 7e-13 (82%, 137 bp)1-C12 278 Pennisetum glaucum No identity CD725272 e-120 (97%, 261 bp)1-E11 338 Oryza sativa Fructose-bisphosphate aldolase T03679 1e-04 (91%, 23 aa) AY103557 1e-24 (4%, 77 bp) CK802616 4e-32 (94%, 93 bp) 31-G11 614 Populus nigra Cytosolic phosphoglycerate kinase 1 BAA33801 8e-50 (83%, 123 aa) AY103553 1e-99 (87%, 371 bp) CD726515 0 (95%, 581 bp)1-G9 516 Oryza sativa Glutaredoxin CAA54397 3e-46 (87%, 105 aa) AY104653 e-107 (89%, 336 bp) CD227215 e-124 (91%, 340 bp)1-H6 300 Pennisetum ciliare No identity BM084147 8e-24 (88%, 127 bp) 42-C10 409 Oryza sativa Unknown protein NP_915800 1e-11 (94%, 37 aa) AY107683 5e-27 (88%, 117 bp) AI637116 7e-19 (88%, 95 bp) 22-C8 93 No matches2-D2 394 Oryza sativa Farnesyl-pyrophosphate synthetase NP_917118 4e-63 (98%, 117 bp) AF330037 1e-64 (92%, 345 bp)2-E10 421 Glycine max Aspartic proteinase 1 BAB62890 8e-26 (86%, 61 aa) AY112455 7e-54 (91%, 162 bp) CN145287 2e-78 (88%, 301)2-F11 290 Oryza sativa HSP70 NP_915417 1e-39 (93%, 87 aa) AF005993 2e-68 (92%, 250 bp) CD726670 e-130 (98%, 250 bp)2-G12 409 Oryza sativa Triose phosphate/phosphate translocator Z26595 4e-09 (92%, 51 bp) BM084392 e-113 (93%, 300 bp) 22-G6 430 Oryza sativa Tryptophan synthase alpha chain XP_476874 1e-22 (79%, 64 aa) AF271384 3e-53 (85%, 253 bp) CF761257 6e-78 (90%, 242 bp)3-C12 498 Oryza sativa Immunophilin XP_467909 8e-55 (89%, 112 aa) AY081564 e-144 (93%, 349 bp) CN844676 e-144 (93%, 3449 bp) 33-C8 363 Zea mays Alpha subunit of translation elongation factor 1 BAA08249 2e-10 (96%, 32 aa) D63581 3e-40 (91%, 130 bp) CD726323 e-130 (94%, 310 bp) 33-D2 215 Oryza sativa Small nuclear ribonucleoprotein polypeptide E XP_463967 4e-13 (90%, 40 aa) AK059440 7e-34 (90%, 124 bp) CN487001 7e-39 (91%, 124 bp) 34-A2 234 No matches4-A8 424 Oryza sativa Pyrrolidone carboxyl peptidase-like protein XP_479284 3e-16 (89%, 46 aa) AP005577 2e-32 (91%, 114 bp) CK985460 4e-42 (94%, 114 bp)4-B7 287 Zea mays Pathogenesis-related protein 1 A33155 1e-23 (77%, 61 aa) U82200 5e-17 (81%, 183 bp) CD998687 3e-17 (81%, 182 bp) 24-D8 82 Rickettsia akari hypothetical protein RakaH01001082 5e-18 (59%, 49 aa) 54-E8 508 Arabidopsis thaliana Receptor kinase AAM20287 4e-42 (56%, 132 aa) AL606691 3e-10 (91%, 57 bp) CD220911 e-125 (89%, 386 bp) 24-G8 429 Oryza sativa Transcription factor BTF3 AAO72645 7e-40 (75%, 114 aa) AY103817 e-103 (87%, 393 bp) CD724954 0 (98%, 412 bp)4-H9 419 Zea mays Cytosolic glyceraldehyde 3-phosphate dehydrogenase X07156 1e-18 (91%, 125 bp) CD725014 e-154 (99%, 290 bp) 55-A8 367 Zea mays No identity AY104556 3e-37 (91%, 125 bp) CA299434 8e-43 (89%, 161 bp)5-B1 389 Zea mays No identity AY109519 6e-08 (93%, 49 bp) CD724823 6e-50 (99%, 107 bp)5-B12 553 Hordeum vulgare Calcium binding EF-hand protein CAB71337 1e-53 (58%, 174 aa) AK101337 8e-39 (82%, 281 bp) CF059716 3e-43 (86%, 173 bp)5-D6 563 Oryza sativa Histone H2B.2 XP_483094 3e-28 (98%, 66 aa) D37943 1e-96 (97%, 202 bp) CA147135 e-107 (93%, 278 bp)5-G4 449 Oryza sativa Phosphatidylserine decarboxylase NP_914239 7e-54 (85%, 127 aa) AY110670 e-122 (90%, 351 bp) CD226354 e-140 (92%, 367 bp) 35-H5 576 Oryza sativa AcinusL protein-like XP_479211 5e-31 (48%, 175 aa) AY105343 e-153 (89%, 477 bp) CA068506 e-156 (90%, 457 bp) 25-H9 234 Zea mays Chlorophyll a/b binding protein X63205 2e-06 (100%, 30 bp) 76-A2 363 No matches6-B1 534 No matches6-B5 525 Oryza sativa Ubiquitin-associated (UBA) protein XP_466502 4e-25 (43%, 107 aa) AY596599 1e-28 (83%, 200 bp) BF657757 7e-38 (81%, 312 bp)6-B6 469 Panicum miliaceum Alanine aminotransferase CAA49199 6e-80 (94%, 151 aa) AB007405 e-151 (93%, 450 bp) CN136122 0 (94%, 450 bp)6-D12 327 Oryza sativa Inorganic pyrophosphatase XP_476313 3e-47 (95%, 100 aa) D13472 e-111 (93%, 282 bp) CN146327 e-118 (93%, 290 bp_
6-E3 750 Zea mays Glutathione S-transferase (GST40) AAG34848 3e-60 (72%, 162 aa)6-E11 341 Oryza sativa Plastocyanin, chloroplast precursor P20423 2e-15 (97%, 38 aa) AF009412 3e-28 (88%, 118 bp) CD724564 e-145 (100%, 262 bp) 66-G9 368 Pennisetum glaucum No identity CD725231 e-168 (98%, 328 bp) 36-H1 1400 Zea mays S-adenosylmethionine decarboxylase CAA69075 6e-58 (96%, 120 aa)7-A11 198 No matches7-F2 366 Sorghum bicolor No identity AY104556 1e-39 (92%, 125 bp) CN133956 8e-40 (92%, 125 bp)7-H11 462 Sorghum bicolor Mitochondrial aldehyde dehydrogenase BAB92019 8e-72 (95%, 141 aa) AB084898 e-153 (91%, 416 bp) BM326464 e-153 (91%, 416 bp)8-D10 581 Arabidopsis thaliana Membrane-associated salt-inducible protein-like BAB08985 5e-72 (67%, 186 aa) XM_474412 e-151 (87%, 561 bp) CD980699 e-152 (90%, 453 bp)8-D12 537 Arabidopsis thaliana Hydrolase, alpha/beta fold family protein NP_974605 2e-53 (79%, 123 aa) AP006175 1e-25 (90%, 99 bp) CA484537 e-127 (89%, 382 bp)8-D7 622 Oryza sativa MATE efflux protein family protein XP_478265 2e-37 (59%, 122 aa) XM_478265 2e-36 (83%, 233 bp) CB925276 5e-61 (82%, 398 bp)8-F3 470 Zea mays Enolase CAA39454 1e-76 (96%, 150 aa) X55981 e-150 (90%, 431 bp) CN146083 0 (93%, 450 bp) 29-D10 22 No matches10-A1 216 Zea mays No identity AY104344 1e-10 (93%, 49 bp) BF586083 2e-23 (85%, 162 bp)10-A3 52 No matches 1310-A4 255 No matches10-A9 542 Zea mays Translation initiation factor 5A CAA69225 4e-70 (94%, 135 aa) AF034943 e-145 (94%, 408 bp) CD445022 e-148 (91%, 408 bp) 310-B7 536 Arabidopsis thaliana Unknown protein AAP37829 8e-20 (78%, 57 aa) AY106780 6e-18 (85%, 122 bp) AW120334 9e-19 (85%, 123 bp)10-C3 641 Oryza sativa Transcription factor EREBP1 XP_468125 2e-66 (69%, 196 aa) AY108380 2e-98 (86%, 409 bp) CN130950 e-117 (87%, 441 bp)10-F7 383 Oryza sativa Protein translation factor Sui1 XP_475493 1e-16 (97%, 43 aa) AY104121 3e-65 (93%, 189 bp) CD724989 0 (100%, 342 bp) 8
BLAST X BLAST N D BEST
99
2.5 LITERATURE CITED Akimoto-Tomiyama, C., K. Sakata, J. Yazaki, K. Nakamura, F. Fujii, K. Shimbo, K. Yamamoto, T. Sasaki, N. Kishimoto, S. Kikuchi, N. Shibuya, and E. Minami. 2003. Rice gene expression in response to N-acetylchitooligosaccharide elicitor: comprehensive analysis by DNA microarray with randomly selected ESTs. Plant Molecular Biology 52:537-551.
Alba, R., Z. Fei, P. Payton, Y. Liu, S. L. Moore, P. Debbie, J. Cohn, M. D'Ascenzo, J. S. Gordon, J. K. C. Rose, G. Martin, S. D. Tanksley, M. Bouzayen, M. M. Jahn, and J. Giovannoni. 2004. ESTs, cDNA microarrays, and gene expression profiling: tools for dissecting plant physiology and development. Plant Journal 39:697-714.
Altschul, S. F., W. Gish, W. Miller, E. W. Myers, and D. Lipman. 1990. Basic local alignment search tool. Journal of Molecular Biology 215:403-410.
Ausubel, F. M., R. Brent, R. E. Kingston, D. D. Moore, J. G. Seidman, J. A. Smith, and K. Struhl. 2005. Current protocols in molecular biology. Green Publishing Associates and Wiley-Interscience, New York.
Bachem, C., R. van der Hoeven, S. de Bruijn, D. Vreugdenhil, M. Zabeau, and R. Visser. 1996. Visualisation of differential gene expression using a novel method of RNA finger-printing based on AFLP: analysis of gene expression during potato tuber development. Plant Journal 9:745-753.
Berger, D. K., B. Crampton, I. Hein, and W. Vos. 2006. Screening cDNA libraries on glass slide microarrays, In: J. M. Walker (ed.), DNA Arrays. Humana Press, Totowa, New Jersey, USA.
Birch, P. R. J., A. O. Avrova, J. M. Duncan, G. D. Lyon, and R. K. Toth. 1999. Isolation of potato genes that are induced during an early stage of the hypersensitive response to Phytophthora infestans. Molecular Plant-Microbe Interactions 12:356-361.
Birch, P. R. J. and S. Kamoun. 2000. Studying interaction transcriptomes: coordinated analyses of gene expression during plant-microorganism interactions. New Technologies for life sciences: a trends guide77-82.
Burch-Smith, T. M., J. C. Anderson, G. B. Martin, and S. P. Dinesh-Kumar. 2004. Applications and advantages of virus-induced gene silencing for gene function studies in plants. Plant Journal 39:734-746.
Cao, W., C. Epstein, H. Liu, C. DeLoughery, N. Ge, J. Lin, R. Diao, H. Cao, F. Long, X. Zhang, Y. Chen, P. S. Wright, S. Busch, M. Wenck, K. Wong, A. G. Saltzman, Z. Tang, L. Liu, and A. Zilberstein. 2004. Comparing gene discovery from Affymetrix GeneChip microarrays and Clontech PCR-select cDNA subtraction: a case study. BMC Genomics 5:26.
Carson, D. L., B. I. Huckett, and F. C. Botha. 2002. Differential gene expression in sugarcane leaf and internodal tissues of varying maturity. South African Journal of Botany 68:434-442.
Che, F.-S., Y. Nakajima, N. Tanaka, M. Iwano, T. Yoshida, S. Takayama, I. Kadota, and A. Isogai. 2000. Flagellin from an incompatible strain of Pseudomonas avenae induces a resistance response in cultured rice cells. The Journal of Biological Chemistry 41:32347-32356.
Cho, S. K., K. W. Jung, J. U. Jeung, K. H. Kang, K. S. Shim, M. K. You, K. S. Yoo, S. H. Ok, and J. S. Shin. 2005. Analysis of differentially expressed transcripts from planthopper-infested wild rice (Oryza minuta). Plant Cell Reports 24:59-67.
Chong, J., R. Baltz, C. Schmitt, R. Beffa, B. Fritig, and P. Saindrenan. 2002. Downregulation of a pathogen-responsive tobacco UDP-Glc: phenylpropanoid glucosyltransferase reduces
100
scopoletin glucoside accumulation, enhances oxidative stress, and weakens virus resistance. Plant Cell 14:1093-1107.
Devos, K. M. and M. D. Gale. 2000. Genome relationships: the grass model in current research. Plant Cell 12:637-646.
Diatchenko, L., Y.-F. C. Lau, A. P. Campbell, A. Chenchik, F. Moqadam, B. Huang, S. Lukyanov, K. Lukyanov, N. Gurskaya, E. D. Sverdlov, and P. D. Siebert. 1996. Suppression subtractive hybridization: a method for generating differentially regulated or tissue-specific cDNA probes and libraries. Proceedings of the National Academy of Sciences, USA 93:6025-6030.
Esnault, R., D. Buffard, C. Breda, C. Sallaud, J. el Turk, and A. Kondorosi. 1993. Pathological and molecular characterizations of alfalfa interactions with compatible and incompatible bacteria, Xanthomonas compestris pv. alfalfae and Pseudomonas syringae pv. pisi. Molecular Plant-Microbe Interactions 6:655-664.
Euglem, T. 2005. Regulation of the Arabidopsis defense transcriptome. Trends in Plant Science.
Felix, G., J. D. Duran, S. Volko, and T. Boller. 1999. Plants have a sensitive perception system for the most conserved domain of bacterial flagellin. Plant Journal 18:265-276.
Gale, M. D. and K. M. Devos. 1998. Comparative genetics in the grasses. Proceedings of the National Academy of Sciences USA 95:1971-1974.
Geetha, S., S. A. Shetty, H. Shekar Shetty, and H. S. Prakash. 1996. Arachidonic acid-induced hypersensitive cell death as an assay of downy mildew resistance in pearl millet. Journal of Applied Biology91-96.
Genoud, T., A. J. Millar, N. Nishizawa, S. A. Kay, E. Schafer, A. Nagatani, and N. H. Chua. 1998. Plant Cell 10:889-904.
Goff, S. A., D. Ricke, T.-H. Lan, G. Presting, R. Wang, M. Dunn, J. Glazebrook, A. Sessions, P. Oeller, H. Varma, D. Hadley, D. Hutchison, C. Martin, F. Katagiri, B. M. Lange, T. Moughamer, Y. Xia, P. Budworth, J. Zhong, T. Miguel, U. Paszkowsi, S. Zhang, M. Colbert, W.-L. Sun, L. Chen, B. Cooper, S. Park, T. C. Wood, L. Mao, P. Quail, R. Wing, R. Dean, u, A. Zharkikh, R. Shen, S. Sahasrabudhe, A. Thomas, R. Cannings, A. Gutin, D. Pruss, J. Reid, S. Tavtigian, J. Mitchell, G. Eldredge, T. Scholl, R. M. Miller, S. Bhatnagar, N. Adey, T. Rubano, N. Tusneem, R. Robinson, J. Feldhaus, T. Macalma, A. Oliphant, and S. Briggs. 2002. A draft sequence of the rice genome (Oryza sativa L. spp. japonica). Science 296:92-100.
Gómez-Gómez, L. and T. Boller. 2002. Flagellin perception: a paradigm for innate immunity. Trends in Plant Science 7:251-256.
Gómez-Gómez, L., G. Felix, and T. Boller. 1999. A single locus determines sensitivity to bacterial flagellin in Arabidopisis thaliana. Plant Journal 18:277-284.
Hammond-Kosack, K. E. and J. E. Parker. 2003. Deciphering plant-pathogen communication: fresh perspectives for molecular resistance breeding. Current Opinion in Biotechnology 14:177-193.
Harmon, A. C., M. Gribskov, and J. F. Harper. 2000. CDPKs - a kinase for every Ca2+ signal? Trends in Plant Science 5:154-159.
Hauck, P., R. Thilmony, and S.-Y. He. 2003. A Pseudomonas syringae type III effector suppresses cell wall-based extracellular defense in susceptible Arabidopsis plants. Proceedings of the National Academy of Science USA 100:8577-8582.
101
Hein, I., E. I. Campbell, M. Woodhead, P. E. Hedley, V. Young, W. L. Morris, L. Ramsay, J. Stockhaus, G. D. Lyon, A. C. Newton, and P. R. Birch. 2004. Characterisation of early transcriptional changes involving multiple signalling pathways in the Mla13 barley interaction with powdery mildew ( Blumeria graminis f. sp. hordei). Planta 218:803-813.
Kanzaki, H., H. Saitoh, A. Ito, S. Fujisawa, S. Kamoun, S. Katou, H. Yoshioka, and R. Terauchi. 2003. Cytosolic HSP90 and HSP70 are essential components of INF1-mediated hypersensitive response and non-host resistance to Pseudomonas cichorii in Nicotiana benthamiana. Molecular Plant Pathology 4:383-391.
Keller, B. and C. Feuillet. 2000. Colinearity and gene density in grass genomes. Trends in Plant Science 5:246-251.
Leung, Y. F. and D. Cavalieri. 2003. Fundamentals of cDNA microarray data analysis. Trends in Genetics 19:649-659.
Liang, P. and A. B. Pardee. 1992. Differential display of eukaryotic messenger RNA by means of the polymerase chain reaction. Science 257:967-971.
Mahalingam, R., A. Gomez-Buitrago, N. Eckardt, N. Shah, A. Guevara-Garcia, P. Day, R. Raina, and N. V. Fedoroff. 2003. Characterizing the stress/defense transcriptome of Arabidopsis. Genome Biology 4:R20.1-R20.14.
Manzano, D., X. Fernandez-Busquets, H. Schaller, V. Gonzalez, A. Boronat, M. Arro, and A. Gerrer. 2004. The metabolic imbalance underlying lesion formation in Arabidopsis thaliana overexpressing farnesyl diphosphate synthase (isoform 1S) leads to oxidative stress and is triggered by the developmental decline of endogenous HMGR activity. Planta 219:982-992.
Murashige, T. and F. Skoog. 1962. A revised medium for rapid growth and bioassays with tobacco tissue cultures. Physiologia Plantarum 15:473-497.
Ning, W., F. Chen, B. Mao, Q. Li, Z. Liu, Z. Guo, and Z. He. 2004. N-acetylchitooligosaccharides elicit rice defence responses including hypersensitive response-like cell death, oxidative burst and defence gene expression. Physiological and Molecular Plant Pathology 64:263-271.
Pfund, C., J. Tans-Kersten, F. M. Dunning, J. M. Alonso, J. R. Ecker, C. Allen, and A. F. Bent. 2004. Flagellin is not a major defense elicitor in Ralstonia solanacearum cells or extracts applied to Arabidopsis thaliana. Molecular Plant-Microbe Interactions 17:696-706.
Quackenbush, J. 2001. Computational analysis of microarray data. Nature Genetics 2:418-427.
Ramonell, K. M., B. Zhang, R. M. Ewing, Y. Chen, D. Xu, G. Stacey, and S. Somerville. 2002. Microarray analysis of chitin elicitation in Arabidopsis thaliana. Molecular Plant Pathology 3:301-311.
Rouhier, N., A. Villarejo, M. Srivastava, E. Gelhaye, O. Keech, M. Droux, I. Finkemeir, G. Samuelsson, K. J. Dietz, J. P. Jacquot, and G. Wingsle. 2005. Identification of plant glutaredoxin targets. Antioxidant Redox Signalling 7:919-929.
Sambrook, J., E. F. Fritsch, and T. Maniatis. 1989. Molecular cloning. A laboratory manual. Cold Spring Harbor Laboratory Press, New York.
Schenk, P. M., K. Kazan, I. Wilson, J. P. Anderson, T. Richmond, S. C. Somerville, and J. M. Manners. 2000. Coordinated plant defense responses in Arabidopsis revealed by microarray analysis. Proceedings of the National Academy of Sciences USA 97:11655-11660.
Shim, K. S., S. K. Cho, J. U. Jeung, K. W. Jung, M. K. You, S. H. Ok, Y. S. Chung, K. H. Kang, H. G. Hwang, H. C. Choi, H. P. Moon, and J. S. Shin. 2004. Identification of fungal
102
(Magnaporthe grisea) stress-induced genes in wild rice (Oryza minuta). Plant Cell Reports 22:599-607.
Singh, S. D., S. B. King, and P. Malla Reddy. 1990. Registration of five pearl millet germplasm sources with stable resistance to downy mildew. Crop Science 30:1164-1165.
Smyth, G. K. 2004. Linear models and empirical Bayes methods for assessing differential expression in microarray experiments. Statistical Applications in Genetics and Molecular Biology 3.
Southern, E. M. 1975. Detection of specific sequences among DNA fragments separated by gel electrophoresis. Journal of Molecular Biology 98:503-517.
Taler, D., M. Galperin, I. Benjamin, Y. Cohen, and D. Kenigsbuch. 2004. Plant enzymatic resistance (eR) genes encoding for photorespiratory enzymes confer resistance against disease. Plant Cell 16:172-184.
Van den Berg, N., B. G. Crampton, I. Hein, P. R. J. Birch, and D. K. Berger. 2004. High-throughput screening of suppression subtractive hybridization cDNA libraries using DNA microarray analysis. Biotechniques 37:818-824.
Vance, V. and H. Vaucheret. 2001. RNA silencing in plants - defense and counterdefense. Science 292:2277-2280.
Velculescu, V. E., L. Zhang, B. Vogelstein, and K. W. Kinzler. 1995. Serial analysis of gene expression. Science 270:484-487.
Walters, D. 2003. Resistance to plant pathogens: possible roles for free polyamines and polyamine catabolism. New Phytologist 159:109.
Wilce, M. C. J. and M. W. Parker. 1994. Structure and function of glutathione S-transferases. Biochim.Biophys.Acta 1205:1-18.
Xiong, L., M.-W. Lee, M. Qi, and Y. Yang. 2001. Identification of defense-related rice genes by suppression subtractive hybridization and differential screening. Molecular Plant-Microbe Interactions 14:685-692.
Yang, G. P., D. T. Ross, W. W. Kuang, P. O. Brown, and R. J. Weigel. 1999. Combining SSH and cDNA microarrays for rapid identification of differentially expressed genes. Nucleic Acids Research 27:1517-1523.
Yang, Y. H., S. Dudoit, P. Luu, D. M. Lin, V. Peng, J. Ngai, and T. P. Speed. 2002. Normalization for cDNA microarray data: a robust composite method addressing single and multiple slide systematic variation. Nucleic Acids Research 30:e15.
Yu, J., S. Hu, J. Wang, G. K. S. Wong, S. Li, B. Liu, Y. Deng, L. Dai, Y. Zhou, Z. Zhang, M. Cao, J. Liu, J. Sun, J. Tang, Y. Chen, Z. Huang, W. Lin, C. Ye, W. Tong, L. Cong, J. Geng, Y. Han, L. Li, W. Li, G. Hu, Z. Huang, W. Li, J. Li, J. Liu, L. Li, T. Li, X. Wang, H. Lu, T. Wu, M. Zhu, P. Ni, H. Han, W. Dong, X. Ren, X. Geng, P. Cui, X. Li, H. Wang, X. Xu, W. Zhai, Z. Xu, J. Zhang, S. He, J. Zhang, J. Xu, K. Zhang, X. Zheng, J. Dong, W. Zeng, L. Tao, J. Ye, J. Tan, Z. Ren, Z. Chen, J. he, D. Liu, W. Tian, C. Tian, H. Xia, Q. Bao, G. Li, H. Gao, T. Cao, J. Wang, W. Zhao, P. Li, W. Chen, X. Wang, Y. Zhang, J. Hu, J. Wang, S. Liu, J. Yang, G. Zhang, Y. Xiong, Z. Li, L. Mao, C. Zhou, Z. Xhu, R. Chen, B. hao, W. Zheng, S. Chen, W. Guo, G. Li, S. Liu, M. Tao, J. Wang, L. Zhu, L. Yuan, and H. Yang. 2002. A draft sequence of the rice genome (Oryza sativa L. ssp. indica). Science 296:79-91.
Zhu-Salzman, K., R. A. Salzman, J.-E. Ahn, and H. Koiwa. 2004. Transcriptional regulation of sorghum defense determinants against a phloem-feeding aphid. Plant Physiology 134:420-431.

103
103
Chapter 3
Nitric oxide mediated transcriptional changes in pearl millet
3.1 ABSTRACT
Nitric oxide (NO) is an important signalling molecule that plays a key role in
the activation of defence response mechanisms in plants. In the current
study, we investigated the transcriptional changes in pearl millet plants over
time following application of 1 mM sodium nitroprusside (SNP), a donor of NO.
Gene expression changes were examined using a pearl millet cDNA
microarray that contained a biased representation of defence response genes.
Altered expression patterns were detected for 45 of the 1920 cDNAs
examined, of which 24 cDNAs were up regulated and 21 cDNAs were down
regulated in response to NO treatment. Comparison of pearl millet expression
profiles with those of Arabidopsis plants treated with a NO donor, suggested
that there was very little overlap in gene expression profiles. Most of the
transcripts exhibiting differential expression in pearl millet have not been
previously implicated in NO signalling in plants
3.2 INTRODUCTION
Attempted infection of plants by an avirulent pathogen elicits a number of
defence responses, many of which lead to cell death at the site of pathogen
infection. This hypersensitive cell death results in a restricted lesion delimited
from surrounding healthy tissue, and is thought to play a role in containment
of pathogen spread throughout the plant. Closely associated with the
hypersensitive response is the oxidative burst, which is characterised by the
rapid production of the reactive oxygen intermediates (ROIs) superoxide (O2-)
and hydrogen peroxide (H202). This oxidative burst drives cross linking of the
cell wall, induces several plant genes involved in cellular protection and
defence, and is necessary for the initiation of HR. However, the oxidative
burst has been shown to be necessary but not sufficient to trigger host cell
death, and experimental evidence indicates that nitric oxide (NO) cooperates
with ROIs in the activation of HR (Delledonne et al., 1998).
104
The role of NO as a biological messenger in animals has been well
documented, and has been shown to control blood pressure homeostasis,
platelet aggregation, and transmission of signals by the nervous system. NO
is also known to play a key role in the activation of macrophages and cellular
defences against microbial pathogens (Mayer and Hemmens, 1997). Recent
studies have also suggested that NO is involved in several plant functions
including stress response (Garcia-Mata and Lamattina, 2001), growth and
development (Beligni and Lamattina, 2000), senescence (Leshem and
Pinchasov, 2000) and iron homeostasis (Murgia et al., 2002). NO has also
been shown to interact with plant hormone signalling pathways such as indole
acetic acid (IAA) and abscisic acid (ABA) (Garcia-Mata and Lamattina, 2002;
Pagnussat et al., 2003). Furthermore, NO has been identified as an essential
molecule that mediates hypersensitive cell death and defence gene activation
in plants (Delledonne et al., 1998; Durner et al., 1998).
In plants, NO can by synthesised enzymatically, or by non-enzymatic
reduction of apoplastic nitrite under acidic conditions (Parani et al., 2004).
Recent evidence suggests that plants, like animals, use multiple enzymes for
the synthesis of this critical signalling molecule (Chandok et al., 2003). Nitrate
reductase is believed to be responsible for NO production in uninfected or
non-elicited plants, whereas nitric oxide synthase, a variant of the P protein of
the glycine decarboxylase complex, is induced in response to pathogen attack
(Chandok et al., 2003). NO production leads to increases in the gene
expression levels of the defence related proteins phenylalanine lyase (PAL)
and pathogenesis related protein 1 (PR1) (Durner et al., 1998), and
experimental evidence suggests that NO is required for the full function of
salicylic acid (SA) as an inducer of systemic acquired resistance (Song and
Goodman, 2001). Like mammals, NO signalling in plants has been shown to
operate through cGMP- and cADP ribose-dependent pathways (Durner et al.,
1998; Klessig et al., 2000). However, NO can also act on many other
potential cell targets, such as metal- and thiol-containing proteins and
enzymes, such as catalases and peroxidases, guanylate cyclase, receptors
and transcription factors (Polverari et al., 2003).
105
The existence of multiple mechanisms of NO action makes dissection of
specific pathways difficult. However, three recent studies have helped to
understand the role of NO in regulating gene transcription in Arabidopsis.
Huang and coworkers (Huang et al., 2002) applied DNA microarray analysis
to examine the affects of NO on transcriptional activation in Arabidopsis cell
suspension cells using microarrays containing 200 cDNAs involved in or
associated with plant defence, and 50 cDNAs associated with primary
metabolism. Parani and associates (Parani et al., 2004) improved on this
study by employing a whole genome ATH1 microarray, representing over
24000 genes, to study changes in gene expression in whole Arabidopsis
plants in response to treatment with a NO donor. Polverari and coworkers
(Polverari et al., 2003) complemented microarray studies by performing
cDNA-AFLP to examine nitric oxide mediated transcriptional changes in
Arabidopsis thaliana. Application of this technique enabled the authors to
detect gene expression patterns of approximately 2500 cDNAs. In the current
study, cDNA microarray analysis was applied to examine the effects of NO on
a non-model cereal plant, pearl millet [Pennisetum glaucum (L.) R. Br], and to
identify genes that are differentially expressed following exogenous
application of a NO donor. Furthermore, comparisons were made with reports
that analysed transcriptional changes in NO treated Arabidopsis to determine
if there were similarities in responses between this model plant and pearl
millet.
106
3.3 MATERIALS AND METHODS
NO treatment of pearl millet
Pearl millet (ICML12=P7) was sterilised by briefly rinsing with 70% ethanol,
followed by 20 min incubation in 0.7% sodium hypochlorite. Following three
washes with sterile distilled water, seeds were plated on half strength MS
medium (Murashige and Skoog, 1962), and incubated at 25ºC with a 16 hour
light/8 hour dark photoperiod. After one week (once the seeds had
germinated) seedlings were transferred to seedling trays containing sterilised
vermiculite that had been fertilised with Hoagland’s solution (Hoagland and
Arnon, 1950). Plants were grown for a further six weeks under 16 h light (140
umol/m2/s) and 8 h dark cycles at a constant temperature of 25ºC and 85%
relative humidity. For NO treatment, seven week old plants were irrigated with
1 mM sodium nitroprusside (SNP) (Sigma, Aston Manor, South Africa) in
water, and leaf tissue was harvested 0, 1, 3 and 6 hours post treatment, and
the plants were immediately frozen in liquid nitrogen for storage until RNA
purification. Plants were treated during the light period, and two replications
with 9 plants in each were included. Plants within replicates were pooled to
reduce variation prior to RNA extraction.
RNA isolation and purification
Total RNA was isolated from the frozen seedlings using Qiazol™ Lysis
Reagent (Qiagen, Hilden, Germany) according to the manufacturer’s protocol
with modifications. Briefly, one gram of plant material was placed in liquid
nitrogen and ground to a fine powder with the aid of a mortar and pestle.
Frozen samples were added to 15 ml Qiazol™ reagent (Qiagen), incubated at
60ºC for 5 minutes, and then vortexed for 15 seconds. Plant debris was
pelleted by centrifugation at 9000 rpm for 10 minutes. Three millilitres of
chloroform was added to the supernatant, the samples were vortexed
vigorously for 15 seconds, and then centrifuged at 9000 rpm for 15 minutes.
The upper aqueous phase was carefully removed and total RNA was
precipitated by the addition of a half volume of each of isopropanol and 0.8 M
sodium citrate/1.2 M NaCl solution. RNA was pelleted by centrifugation at
9000 rpm for 10 minutes, and washed with 75% ethanol. The dried RNA
107
pellets were resuspended in 200 μl nuclease free water (Ambion, Huntingdon,
Cambridgeshire, UK). Total RNA was treated with RNAse free DNAse1
(Qiagen) and further purified using an RNeasy® Minelute™ Kit (Qiagen) to
remove contaminating genomic DNA, carbohydrates and polyphenols.
RNA yield and purity was determined by measuring absorbency at 260 nm,
280 nm and 230 nm using a Nanodrop ND-1000 Spectrophotometer. RNA
integrity was assessed by electrophoresing five micrograms total RNA through
a 1.2% formaldehyde denaturing agarose gel (results not shown).
Microarray preparation
cDNA inserts from subtracted pearl millet collections (see Chapter 2 for
details) (Van den Berg et al., 2004), which are biased in representation of
defence response genes, were PCR amplified in 100 μl reactions in a 96 well
microplate format, using Sp6 (5’TATTTAGGTGACACTATAG-3’) and T7
primers (5’TAATACGACTCACTATAGGG-3’). PCR products confirmed by gel
electrophoresis were purified using Multiscreen® PCR Purification Plates
(Millipore, Molsheim, France), and resuspended in 50 µl sterile water. Purified
cDNA inserts were vacuum dried, and resuspended in a final volume of 20 μl
50% DMSO in preparation for array spotting. cDNA inserts (200 pg) were
printed in duplicate onto Corning® Gaps II (Corning, NY, USA) aminosilane
coated microscope slides using an Array Spotter Generation III (Molecular
Dynamics Inc., Sunnyvale, CA, USA) at the ACGT Microarray facility
(http://www.microarray.up.ac.za). The lucidea spiked control set (Amersham
Biosciences) was also arrayed to serve as controls for labelling and
hybridisation reactions.
Fluorescent probe preparation, hybridisation and scanning
Indirect aminoallyl labelling reactions using total RNA were performed using
slight modifications of published protocols
(http://www.tigr.org/tdb/microarray/protocols.html). Labelled cDNA from each
time point was cohybridised with that from a reference sample to profile
expression changes following exposure to SNP. RNA samples representative
of each time point were labelled with Cy3, and the reference sample was
108
labelled with Cy5 dye (Figure 3.1). A reference RNA sample was prepared by
pooling 50 μg RNA from each time point from each biological replicate. In
brief, 15 µg total RNA was reverse transcribed using SuperScript™II
(Invitrogen, Carlsbad, CA, USA) in the presence of 6 µg random hexamers
(Invitrogen), 1 ug oligo(dT)20 (Invitrogen), and 1 X aminoallyl-dNTP labelling
mix (0.5 mM dATP, 0.5 mM dCTP, 0.5 mM dGTP, 0.3 mM dTTP, 0.2 mM
aminoallyl-dUTP). Reactions were incubated at 42ºC overnight. Thereafter,
RNA was hydrolysed at 65ºC for 15 min by the addition of 0.2 N NaOH and
0.1 mM EDTA. Tris, pH7.4 (0.3 M) was added to neutralise the reaction
before cDNA was purified using a modified Qiaquick PCR Purification kit
(Qiagen) protocol. Manufacturer’s instructions were followed except that
columns were washed with phosphate wash buffer (5 mM KPO4, pH 8.5 in
80% ethanol), and cDNA was eluted in 4 mM KPO4, pH 8.5. cDNA samples
were vacuum dried and resuspended in 4.5 µl 0.1 M sodium carbonate buffer
(Na2CO3), pH 9.0, to which an equal volume of NHS-Cy dye (Amersham
BioSciences, Little Chalfont, UK) (prepared in DMSO) was added. The dye
coupling reaction was incubated for 1 h in the dark at room temperature.
Thirty five microlitres 100 mM sodium acetate, pH 5.2 was added to neutralise
the reaction, and uncoupled dye was removed by purifying the sample using a
Qiaquick PCR purification kit (Qiagen) according to the manufacturer’s
instructions. Labelling efficiency was determined by measuring absorbency
with a Nanodrop ND-1000 Spectrophotometer at 260 nm to determine cDNA
concentration, and either 550 nm or 650 nm to determine Cy3 and Cy5
concentrations, respectively. The following calculations were performed for
each sample to assess the quality of the labelled product: pmol nucleotides =
[(OD260*volume*37 ng/µl*1000 pg/ng)/324.5 pg/pmol], pmol Cy3 =
[OD550*volume)/0.15] or pmol Cy5 = [(OD650*volume)/0.25], and
nucleotides/dye ratio = [pmol DNA/pmol Cy dye]. Only cDNA samples with
dye incorporation of greater than 100 pmol and a nucleotides/dye molecule
ratio of less than 50 were considered for hybridisation reactions. Probes were
prepared by combining selected test and reference samples, which were then
dried in a vacuum desiccator, and resuspended in 45 µl hybridisation buffer
[50% formamide, 25% hybridisation buffer (Amersham Biosciences), 25%
deionised water]. Probes were denatured at 92ºC for 5 min.
109
The glass slide was initially incubated in pretreatment solution (3.5X SSC;
0.2% SDS; 1% bovine serum albumin) without probe at 60ºC for 20 min.
Thereafter, the slide was placed in a HybUP hybridisation chamber (NB
Engineering, Pretoria, South Africa) with the denatured probe solution at 42ºC
for 16 h. After hybridisation, slides were washed for 4 min at 42ºC with 1 X
SSC/0.2% SDS, 0.1 X SSC/0.2% SDS (twice) followed by three washes in 0.1
X SSC for 1 min at room temperature. Slides were rinsed with distilled water,
dried by centrifugation (2000Xg for 2 min), and scanned with a Genepix™
4000B scanner (Axon Instruments, Foster City, CA, USA). Separate images
were acquired for each fluorophore at a resolution of 10 μm per pixel.
Microarray data analysis
Scanned images (tiff images) were imported into GenePix Pro 5.0 (Axon
Instruments), and spot intensities from scanned slides were quantified. Grids
were predefined and manually adjusted to ensure optimal spot recognition,
and spots with dust or locally high background were flagged as bad. Intensity
data for individual slides were imported into limmaGUI (linear models for
microarray data Graphical User Interface) (Smyth, 2004) in the R computing
environment. Data from each microarray slide was normalised using the
global lowess algorithm. Results from biological and slide replicates within
each of the time points was collated, and linear models were computed to
contrast gene expression between time points. Expression data values for
each time point were then imported into Microsoft Excel and filtered by
expression values to eliminate genes with mean fold changes of less than
twofold up or down, and further filtered by confidence (one sample Student’s t
test P-value, using FDR multiple testing correction), to retain only genes in
which expression changes of SNP treated versus untreated control (time = 0
h) were significant at P ≤ 0.05. The resulting data were visualised and further
explored using TIGR MeV (Saeed et al., 2003). Hierachical clustering was
performed using average linkage clustering and Euclidean distance
measures. For K-means clustering, 50 iterations were performed, and the
smallest number of meaningful clusters was determined empirically viz. K-
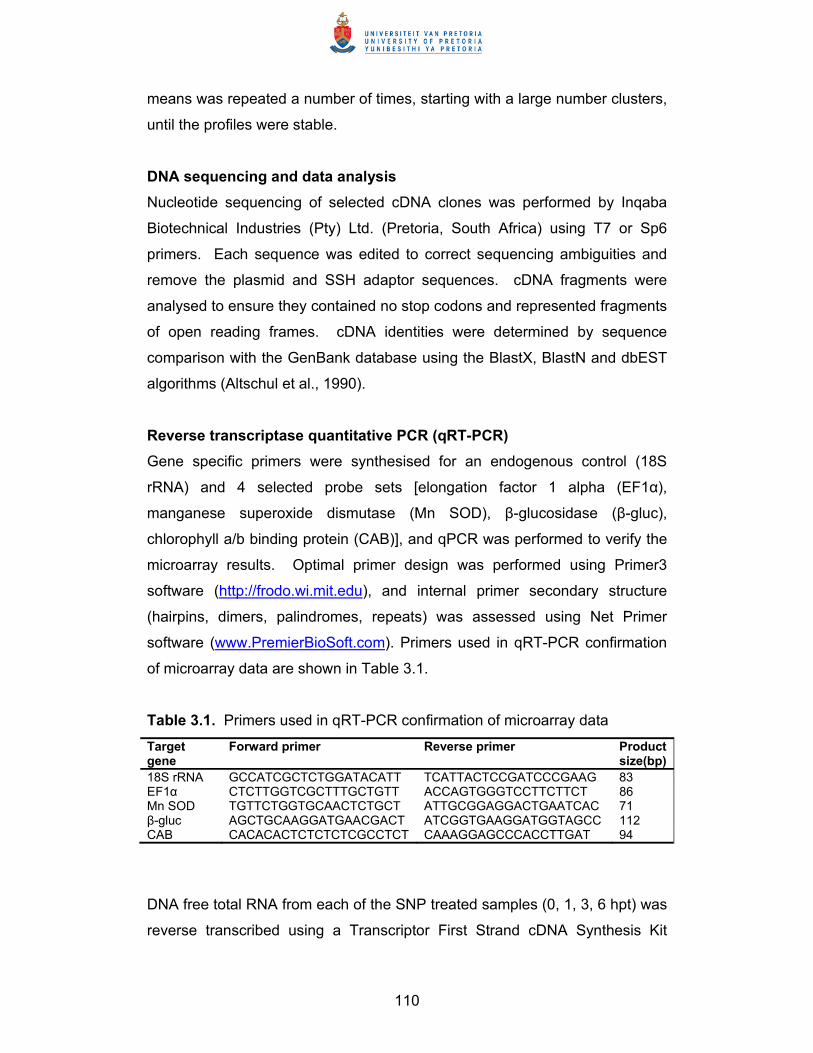
110
means was repeated a number of times, starting with a large number clusters,
until the profiles were stable.
DNA sequencing and data analysis
Nucleotide sequencing of selected cDNA clones was performed by Inqaba
Biotechnical Industries (Pty) Ltd. (Pretoria, South Africa) using T7 or Sp6
primers. Each sequence was edited to correct sequencing ambiguities and
remove the plasmid and SSH adaptor sequences. cDNA fragments were
analysed to ensure they contained no stop codons and represented fragments
of open reading frames. cDNA identities were determined by sequence
comparison with the GenBank database using the BlastX, BlastN and dbEST
algorithms (Altschul et al., 1990).
Reverse transcriptase quantitative PCR (qRT-PCR)
Gene specific primers were synthesised for an endogenous control (18S
rRNA) and 4 selected probe sets [elongation factor 1 alpha (EF1α),
manganese superoxide dismutase (Mn SOD), β-glucosidase (β-gluc),
chlorophyll a/b binding protein (CAB)], and qPCR was performed to verify the
microarray results. Optimal primer design was performed using Primer3
software (http://frodo.wi.mit.edu), and internal primer secondary structure
(hairpins, dimers, palindromes, repeats) was assessed using Net Primer
software (www.PremierBioSoft.com). Primers used in qRT-PCR confirmation
of microarray data are shown in Table 3.1.
Table 3.1. Primers used in qRT-PCR confirmation of microarray data
Target gene
Forward primer Reverse primer Product size(bp)
18S rRNA GCCATCGCTCTGGATACATT TCATTACTCCGATCCCGAAG 83 EF1α CTCTTGGTCGCTTTGCTGTT ACCAGTGGGTCCTTCTTCT 86 Mn SOD TGTTCTGGTGCAACTCTGCT ATTGCGGAGGACTGAATCAC 71 β-gluc AGCTGCAAGGATGAACGACT ATCGGTGAAGGATGGTAGCC 112 CAB CACACACTCTCTCTCGCCTCT CAAAGGAGCCCACCTTGAT 94
DNA free total RNA from each of the SNP treated samples (0, 1, 3, 6 hpt) was
reverse transcribed using a Transcriptor First Strand cDNA Synthesis Kit
111
(Roche Diagnostics). Each 20 µl reaction contained 1 µg total RNA, 60 µM
random hexamer primer, 1 X Transcriptor RT reaction buffer, 20 U Protector
RNase Inhibitor, 1 mM dNTP mix, 10 U Transcriptor reverse transcriptase.
Reactions were incubated at 55ºC for 30 min, after which the Transcriptor
reverse transcriptase was inactivated by heating to 85ºC for 5 min. Reactions
were stored at -20ºC until use in real time PCR reactions.
Conditions for all PCR reactions were optimised in a GeneAmp PCR System
2400 thermocycler (Applied Biosystems, Foster City, CA, USA) with regard to
forward and reverse primer concentrations, MgCl2 and dNTP concentration
(Roche Diagnostics), and annealing temperature. Optimised results were
applied to the LightCycler PCR protocol. Real time PCR reactions were
prepared using a LightCycler® FastStart DNA MasterPLUS SYBR Green 1 kit
(Roche Diagnostics). Each 20 μl reaction contained the following components
prepared to the indicated final concentration: 10 μl water, 2 μl forward primer
(0.5 μM), 2 µl reverse primer (0.5 μM), 4 μl 5 X LightCycler Master Mix and 2
µl cDNA (1:20 dilution). Reactions were added to glass capillaries and placed
into the LightCycler rotor (Roche Diagnostics). The following LightCycler
experimental run protocol was used: denaturation cycle (95ºC for 10 min),
amplification and quantification cycle repeated 45 times (95ºC for 10 s, 58ºC
for 10s, 72ºC for 6 s with a single fluorescence measurement), melting curve
cycle (65-95ºC with a heating rate of 0.1ºC per second and continuous
fluorescence measurement), and finally a cooling step to 40ºC. LightCycler
software 3.3 (Roche Diagnostics) was employed to calculate crossing points
(CT) for each transcript. CT is defined as the point at which the fluorescence
rises appreciably above the background fluorescence (Pfaffl, 2001).
112
3.4 RESULTS AND DISCUSSION
Experimental design
A common reference design was employed to examine changes in
transcription over time in response to treatment with a NO donor (Figure 3.1).
This design uses an aliquot of a common reference RNA, and the intensity of
hybridisation of a test RNA is compared to hybridisation of the reference RNA
at the same spot (Naidoo et al., 2005). The reference sample was prepared
by pooling equal amounts of RNA from test samples. In this manner, every
sample present in the test sample is present in the reference sample, and so
the relative amounts of each RNA species will be comparable. In order to
minimise experimental variability and ensure accurate representation of
changes in mRNA abundance, both biological and technical replicates were
employed for all time points (Figure 3.1). Two biological replicates were
collected from each of two independent SNP treatment experiments. At each
time point, nine seedlings were harvested from each biological replicate for
RNA extraction and production of cDNA, microarray probes, and quantitative
reverse transcription (RT)-PCR (qRT-PCR). Technical replication was
twofold – firstly, cDNAs were spotted in duplicate on every slide, and
secondly, RNA preparations from each of the time point comparisons were
hybridised in duplicate against the common reference control RNA sample in
at least one of the biological replicates. Test samples were labelled with Cy3
and the reference sample with Cy5 in each hybridisation reaction. Dye swap
experiments were not performed, as in a reference design, it is assumed that
any remaining dye bias not removed by normalisation affects all the arrays
similarly, and does not bias comparison between samples (Naidoo et al.,
2005). Three microarray slides were hybridised for each of the time point
comparisons following SNP treatment, and a total of 12 slides were included
in limma data analyses to identify significantly regulated genes. Data was
further filtered for significance in Microsoft Excel to retain genes passing the
twofold response cut off at P≤0.05.
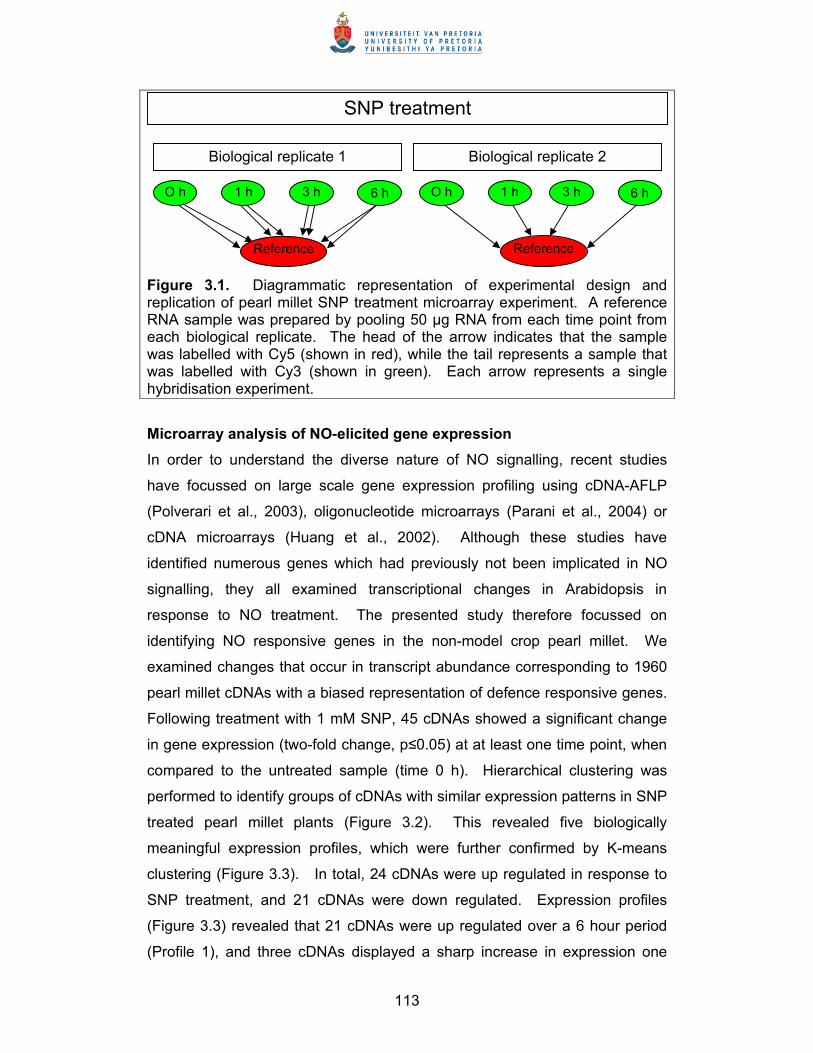
113
Figure 3.1. Diagrammatic representation of experimental design and replication of pearl millet SNP treatment microarray experiment. A reference RNA sample was prepared by pooling 50 µg RNA from each time point from each biological replicate. The head of the arrow indicates that the sample was labelled with Cy5 (shown in red), while the tail represents a sample that was labelled with Cy3 (shown in green). Each arrow represents a single hybridisation experiment.
Microarray analysis of NO-elicited gene expression
In order to understand the diverse nature of NO signalling, recent studies
have focussed on large scale gene expression profiling using cDNA-AFLP
(Polverari et al., 2003), oligonucleotide microarrays (Parani et al., 2004) or
cDNA microarrays (Huang et al., 2002). Although these studies have
identified numerous genes which had previously not been implicated in NO
signalling, they all examined transcriptional changes in Arabidopsis in
response to NO treatment. The presented study therefore focussed on
identifying NO responsive genes in the non-model crop pearl millet. We
examined changes that occur in transcript abundance corresponding to 1960
pearl millet cDNAs with a biased representation of defence responsive genes.
Following treatment with 1 mM SNP, 45 cDNAs showed a significant change
in gene expression (two-fold change, p≤0.05) at at least one time point, when
compared to the untreated sample (time 0 h). Hierarchical clustering was
performed to identify groups of cDNAs with similar expression patterns in SNP
treated pearl millet plants (Figure 3.2). This revealed five biologically
meaningful expression profiles, which were further confirmed by K-means
clustering (Figure 3.3). In total, 24 cDNAs were up regulated in response to
SNP treatment, and 21 cDNAs were down regulated. Expression profiles
(Figure 3.3) revealed that 21 cDNAs were up regulated over a 6 hour period
(Profile 1), and three cDNAs displayed a sharp increase in expression one
SNP treatment
Biological replicate 1 Biological replicate 2
O h 1 h 1 h 3 h 3 h O h 6 h 6 h
Reference Reference
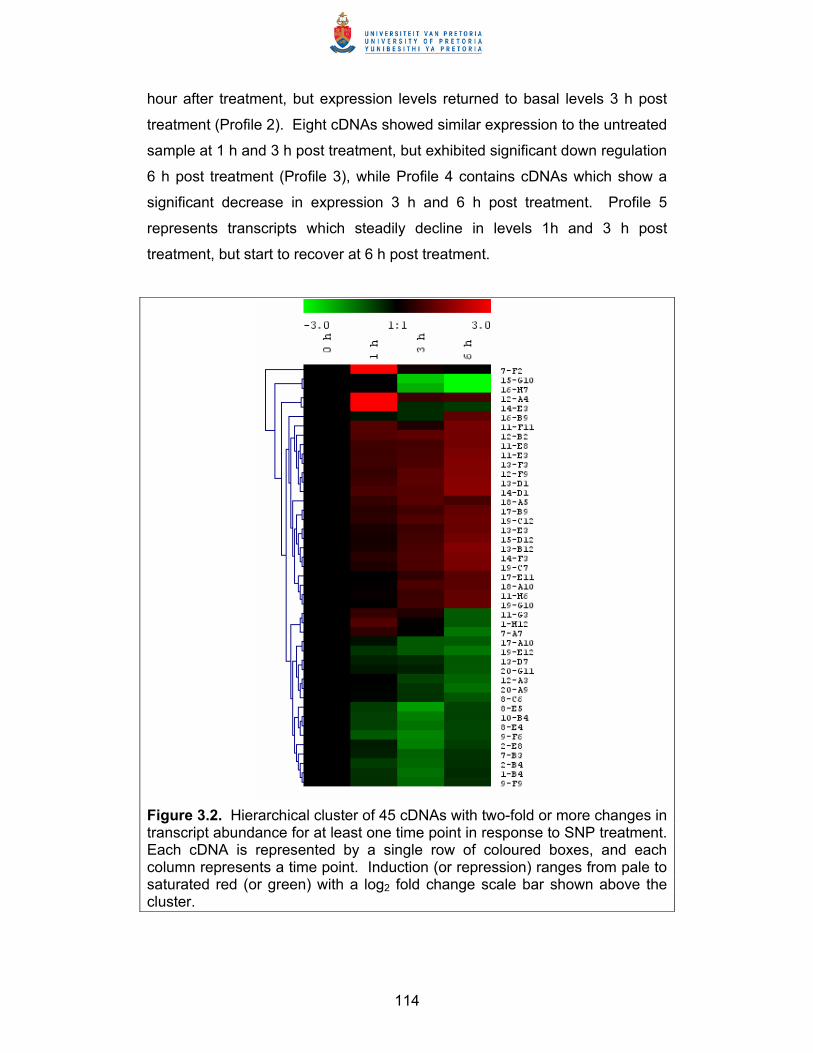
114
hour after treatment, but expression levels returned to basal levels 3 h post
treatment (Profile 2). Eight cDNAs showed similar expression to the untreated
sample at 1 h and 3 h post treatment, but exhibited significant down regulation
6 h post treatment (Profile 3), while Profile 4 contains cDNAs which show a
significant decrease in expression 3 h and 6 h post treatment. Profile 5
represents transcripts which steadily decline in levels 1h and 3 h post
treatment, but start to recover at 6 h post treatment.
Figure 3.2. Hierarchical cluster of 45 cDNAs with two-fold or more changes in transcript abundance for at least one time point in response to SNP treatment. Each cDNA is represented by a single row of coloured boxes, and each column represents a time point. Induction (or repression) ranges from pale to saturated red (or green) with a log2 fold change scale bar shown above the cluster.
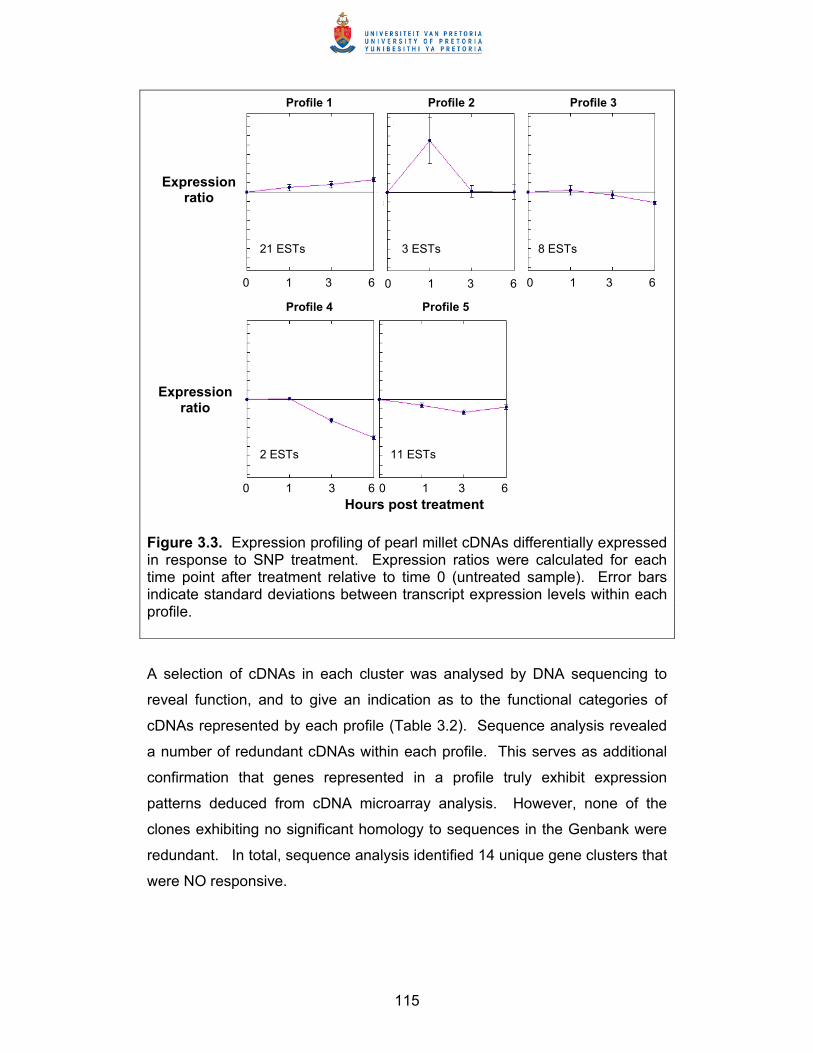
115
Figure 3.3. Expression profiling of pearl millet cDNAs differentially expressed in response to SNP treatment. Expression ratios were calculated for each time point after treatment relative to time 0 (untreated sample). Error bars indicate standard deviations between transcript expression levels within each profile.
A selection of cDNAs in each cluster was analysed by DNA sequencing to
reveal function, and to give an indication as to the functional categories of
cDNAs represented by each profile (Table 3.2). Sequence analysis revealed
a number of redundant cDNAs within each profile. This serves as additional
confirmation that genes represented in a profile truly exhibit expression
patterns deduced from cDNA microarray analysis. However, none of the
clones exhibiting no significant homology to sequences in the Genbank were
redundant. In total, sequence analysis identified 14 unique gene clusters that
were NO responsive.
Hours post treatment
Expression ratio
21 ESTs 3 ESTs 8 ESTs
0 1 3 6 0 1 3 6 0 1 3 6
2 ESTs 11 ESTs
0 1 3 6 0 1 3 6
Profile 1 Profile 2 Profile 3
Profile 4 Profile 5
Expression ratio
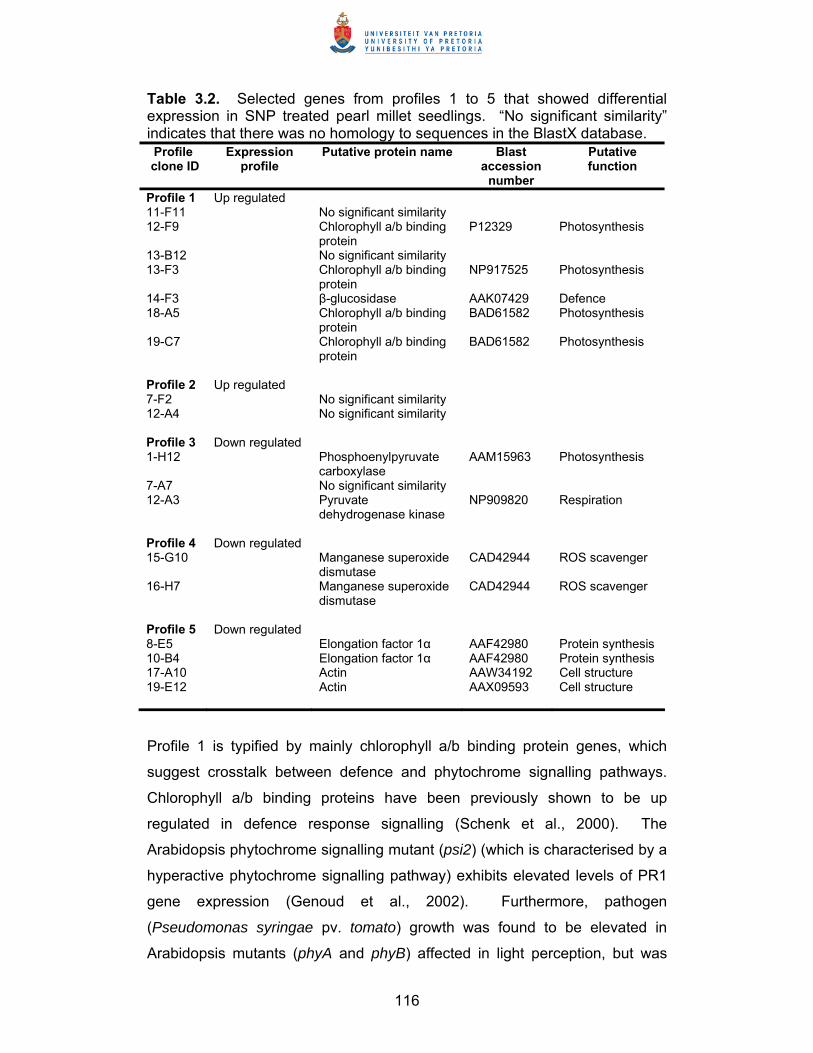
116
Table 3.2. Selected genes from profiles 1 to 5 that showed differential expression in SNP treated pearl millet seedlings. “No significant similarity” indicates that there was no homology to sequences in the BlastX database. Profile
clone ID Expression
profile Putative protein name Blast
accession number
Putative function
Profile 1 Up regulated 11-F11 No significant similarity 12-F9 Chlorophyll a/b binding
protein P12329
Photosynthesis
13-B12 No significant similarity 13-F3 Chlorophyll a/b binding
protein NP917525 Photosynthesis
14-F3 β-glucosidase AAK07429 Defence 18-A5 Chlorophyll a/b binding
protein BAD61582
Photosynthesis
19-C7 Chlorophyll a/b binding protein
BAD61582
Photosynthesis
Profile 2 Up regulated 7-F2 No significant similarity 12-A4 No significant similarity Profile 3 Down regulated 1-H12 Phosphoenylpyruvate
carboxylase AAM15963 Photosynthesis
7-A7 No significant similarity 12-A3 Pyruvate
dehydrogenase kinase NP909820
Respiration
Profile 4 Down regulated 15-G10 Manganese superoxide
dismutase CAD42944 ROS scavenger
16-H7 Manganese superoxide dismutase
CAD42944 ROS scavenger
Profile 5 Down regulated 8-E5 Elongation factor 1α AAF42980 Protein synthesis 10-B4 Elongation factor 1α AAF42980 Protein synthesis 17-A10 Actin AAW34192 Cell structure 19-E12 Actin AAX09593 Cell structure
Profile 1 is typified by mainly chlorophyll a/b binding protein genes, which
suggest crosstalk between defence and phytochrome signalling pathways.
Chlorophyll a/b binding proteins have been previously shown to be up
regulated in defence response signalling (Schenk et al., 2000). The
Arabidopsis phytochrome signalling mutant (psi2) (which is characterised by a
hyperactive phytochrome signalling pathway) exhibits elevated levels of PR1
gene expression (Genoud et al., 2002). Furthermore, pathogen
(Pseudomonas syringae pv. tomato) growth was found to be elevated in
Arabidopsis mutants (phyA and phyB) affected in light perception, but was
117
clearly reduced in the psi2 mutant hypersensitive to light (Genoud et al.,
2002). These authors also showed that the formation of HR is strongly
reduced in the absence of phytochrome signalling and is amplified in the psi2
mutant. These results clearly suggest that light signal transduction and
pathogenesis related gene signalling pathways are connected. Three
different genes coding for chlorophyll a/b binding proteins are present in this
profile (homology to BlastX accession numbers P12329, NP917525 and
BAD61582). Profile 1 also contains a β-glucosidase gene, which is up
regulated over a six hour period in response to SNP treatment. The cyclic
hydroxamic acids 2,4-dihydroxy-1,4-benzoxazin-3-one (DIBOA) and 2,4-
dihydroxy-7-methoxy-1,4-benzoxazin-3-one (DIMBOA) are secondary
metabolites that occur in high abundance as glucosides in the cereals maize,
wheat and rye. Upon pathogen attack, the hydroxamic acid glucoside is
cleaved by β-glucosidase to release a toxic aglucone that is unstable and
decomposes to the reactive benzoxaxolinones, which are toxic to invading
pathogens (Nikus et al., 2001).
Two cDNAs (7-F2 and 12-A4) were sequenced from Profile 2, both of which
were found to have no significant homology to genes in the GenBank.
However, sequence alignments indicated that the two sequences did not
display any homology, and represented two different pearl millet transcripts.
Eight cDNAs are represented by Profile 3. Sequence analysis of three cDNAs
revealed a phosphoenolpyruvate carboxylase, a pyruvate dehydrogenase
kinase, and a cDNA with no significant homology to sequences in the
GenBank. The identity of these cDNAs suggests that this profile is
representative of genes coding for enzymes involved in basic cell metabolism.
Phosphoenolpyruvate carboxylase plays an important role in photosynthesis,
and catalyses the fixation of CO2 to yield oxaloacetate. In the leaves of
Crassulacean Acid Metabolism (CAM) and C4 plants (pearl millet is a C4
plant), it catalyses the primary fixation step in atmospheric CO2 assimilation,
while in C3 leaves and non-photosynthetic tissue it replenishes TCA cycle
intermediates and allows respiration to continue (Hartwell et al., 1999). In
response to pathogen attack, as mimicked by the application of SNP in these
118
experiments, the cell obviously down regulates its basic functions such as
photosynthesis (and thus, phosphoenolpyruvate carboxylase), and puts more
energy into defence responses to fight off invading pathogens. A gene coding
for an enzyme involved in regulating respiration, pyruvate dehydrogenase
kinase (PDK), was also down regulated in response to SNP treatment. The
pyruvate dehydrogenase complex (PDC) is a multienzyme structure that
catalyses the oxidative decarboxylation of pyruvate, yielding CO2, acetyl-CoA
and NADH (Thelen et al., 2000). PDK inactivates mitochondrial PDC by
phosphorylating specific Ser residues, and is the primary regulator of flux
through the mitochondrial PDC. Down regulation of PDK by plant cells would
lead to activation of the PDC and thus an increase in respiration, which may
provide the necessary energy for activation of plant defence responses (as
elicited by SNP application) to counteract pathogen attack.
Two transcripts are representative of Profile 4, both of which display homology
to a manganese superoxide dismutase gene. During the HR, superoxide
dismutase (SOD) accelerates O2- dismutation to H2O2 to minimise the loss of
NO by reaction with O2-, and to trigger hypersensitive cell death through NO/
H2O2 cooperation (Delledonne et al., 2001). However, when the NO/O2-
balance is in favour of NO, there is no O2- left for SOD mediated dismutation
to H2O2. Thus, treatment of pearl millet plants with the NO donor, SNP,
should have yielded high levels of NO that would have reacted with O2- to
produce ONOO-, and limited SOD dismutation to H2O2. This presumably
resulted in decreased expression of SOD genes as observed in profile 4.
Similar results were obtained in oat plants, which exhibited a significant
decrease in H2O2 accumulation when treated with the NO donor S-nitroso-N-
acetylpenicillamine (SNAP). Conversely, the NO scavenger 2-(4-
carboxyphenyl)-4,4,5,5-tetramethylimidazoline-1-oxyl-3-oxide (cPTIO)
markedly enhanced H2O2 accumulation (Tada et al., 2004).
Profile 5 contains transcripts with homology to genes involved in cell
housekeeping type functions. Clones 8-E5 and 10-B4, which are redundant,
exhibit homology to elongation factor 1α. The alpha subunit of translation
elongation factor 1, EF1α, is the most abundant component in the
119
translational machinery and plays a central role in polypeptide chain
elongation in eukaryotes. It catalyses the binding reaction of aminoacyl t-
RNAs to the acceptor site (A site) on the ribosome. However, it has been
shown that EF1α is a multifunctional protein and is involved in other cellular
processes such as binding actin, acting as a microtubule severing protein,
binding calmodulin, and participating in the degradation of certain proteins via
the ubiquitin pathway (Cao et al., 1997). Many of these basic cellular
processes would be down regulated during pathogen attack, which would lead
to a decrease in EF1α gene expression. Profile 5 also contains two down
regulated cDNAs with homology to actin. These two clones are not redundant
and exhibit homology to different actin genes in the Genbank. Actin filaments
play an important role in cell elongation, and growing evidence shows that the
actin cytoskeleton is a key effector of signal transduction, which controls and
maintains the shape of plant cells, as well as playing roles in plant
morphogenesis (Vantard and Blanchoin, 2002). Studies in rat cells have
shown that disruption of the actin cytoskeleton lead to an increase in NOS
protein expression, and thus NO formation (Zeng and Morrison, 2001).
Perhaps a similar mechanism exists in plants, and increased levels of
endogenous NO would result in decreased actin synthesis, and disruption of
the actin cytoskeleton.
Verification of gene expression changes
For verification of the differential expression of genes obtained from cDNA
microarray analysis, qRT-PCR was performed for selected genes. These
included two up regulated (chlorophyll a/b binding protein and β-glucosidase)
and two down regulated (manganese superoxide dismutase and elongation
factor 1 alpha) genes, and 18S rRNA served as an endogenous control gene.
The purpose of the endogenous control gene is to normalise qRT-PCR data
for the amount of RNA added to each of the reverse transcription reactions
(Pfaffl, 2001).
Standard curves were calculated for each of the five genes subjected to qRT-
PCR (Figure 3.4). Standard curves were determined by making dilutions of
cDNA prepared from plants 3 h after SNP treatment, and subjecting these
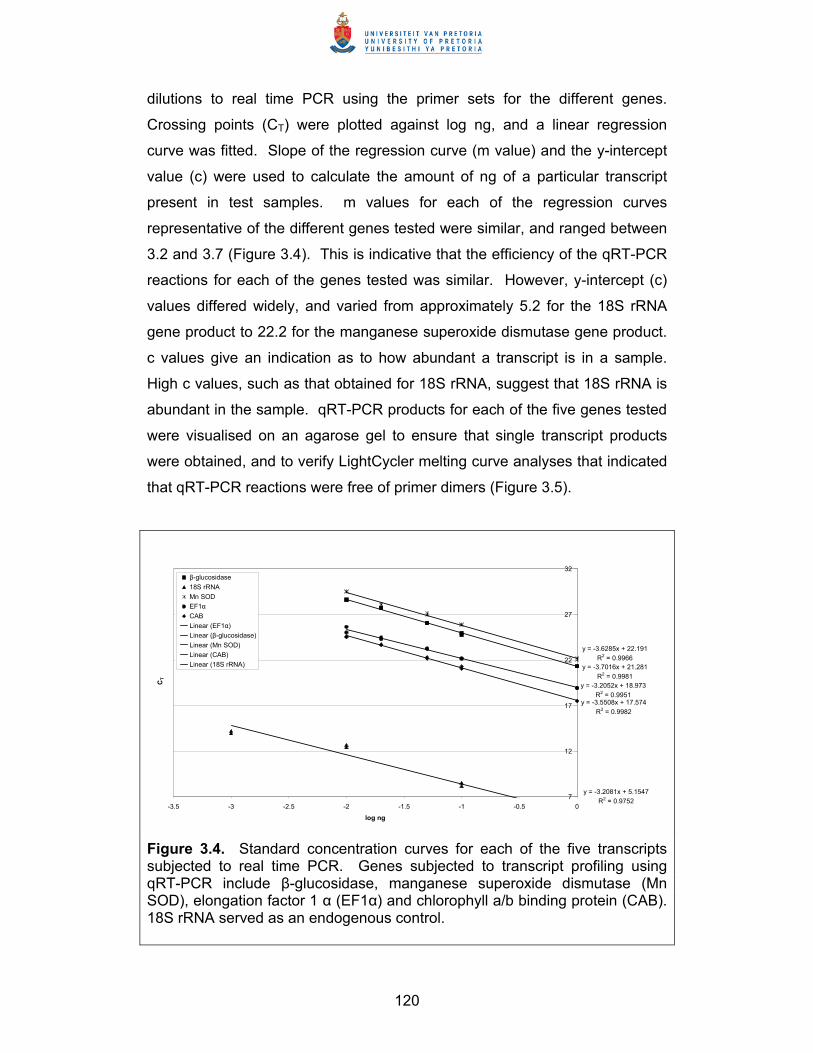
120
dilutions to real time PCR using the primer sets for the different genes.
Crossing points (CT) were plotted against log ng, and a linear regression
curve was fitted. Slope of the regression curve (m value) and the y-intercept
value (c) were used to calculate the amount of ng of a particular transcript
present in test samples. m values for each of the regression curves
representative of the different genes tested were similar, and ranged between
3.2 and 3.7 (Figure 3.4). This is indicative that the efficiency of the qRT-PCR
reactions for each of the genes tested was similar. However, y-intercept (c)
values differed widely, and varied from approximately 5.2 for the 18S rRNA
gene product to 22.2 for the manganese superoxide dismutase gene product.
c values give an indication as to how abundant a transcript is in a sample.
High c values, such as that obtained for 18S rRNA, suggest that 18S rRNA is
abundant in the sample. qRT-PCR products for each of the five genes tested
were visualised on an agarose gel to ensure that single transcript products
were obtained, and to verify LightCycler melting curve analyses that indicated
that qRT-PCR reactions were free of primer dimers (Figure 3.5).
y = -3.2052x + 18.973
R2 = 0.9951
y = -3.7016x + 21.281
R2 = 0.9981
y = -3.6285x + 22.191
R2 = 0.9966
y = -3.5508x + 17.574
R2 = 0.9982
y = -3.2081x + 5.1547R2 = 0.9752
7
12
17
22
27
32
-3.5 -3 -2.5 -2 -1.5 -1 -0.5 0
log ng
C
T
β-glucosidase
18S rRNA
Mn SOD
EF1α
CAB
Linear (EF1α)
Linear (β-glucosidase)
Linear (Mn SOD)
Linear (CAB)
Linear (18S rRNA)
Figure 3.4. Standard concentration curves for each of the five transcripts subjected to real time PCR. Genes subjected to transcript profiling using qRT-PCR include β-glucosidase, manganese superoxide dismutase (Mn SOD), elongation factor 1 α (EF1α) and chlorophyll a/b binding protein (CAB). 18S rRNA served as an endogenous control.
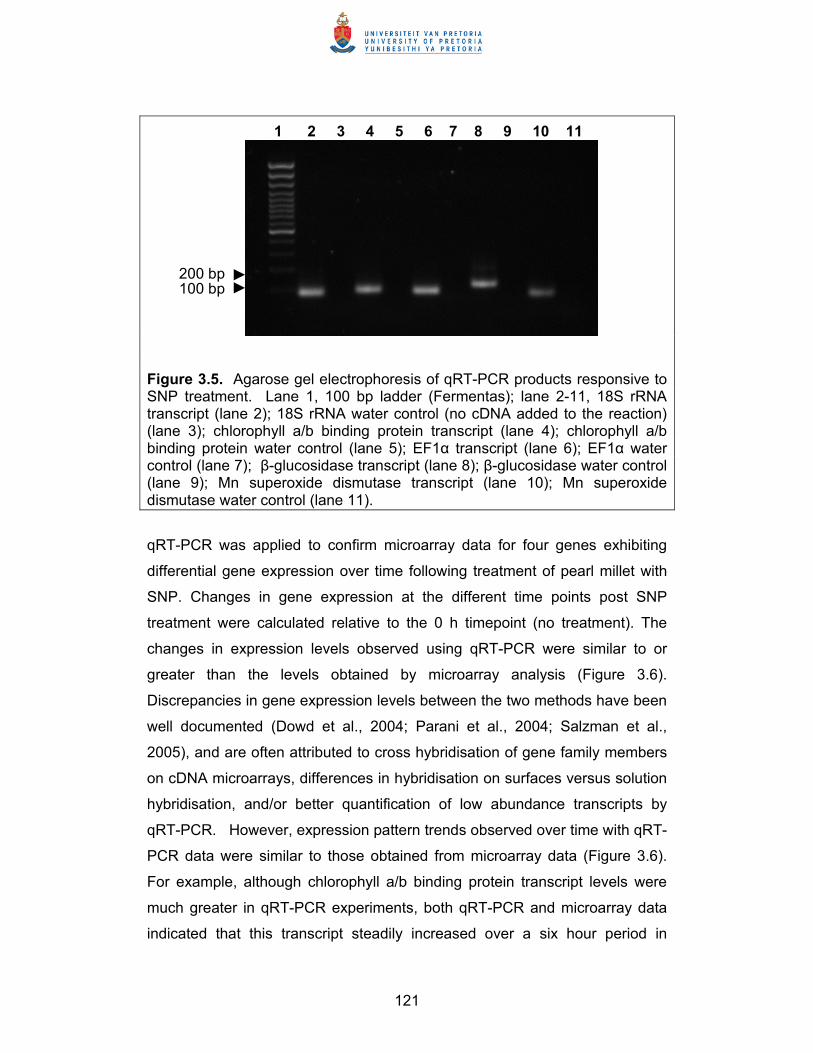
121
Figure 3.5. Agarose gel electrophoresis of qRT-PCR products responsive to SNP treatment. Lane 1, 100 bp ladder (Fermentas); lane 2-11, 18S rRNA transcript (lane 2); 18S rRNA water control (no cDNA added to the reaction) (lane 3); chlorophyll a/b binding protein transcript (lane 4); chlorophyll a/b binding protein water control (lane 5); EF1α transcript (lane 6); EF1α water control (lane 7); β-glucosidase transcript (lane 8); β-glucosidase water control (lane 9); Mn superoxide dismutase transcript (lane 10); Mn superoxide dismutase water control (lane 11).
qRT-PCR was applied to confirm microarray data for four genes exhibiting
differential gene expression over time following treatment of pearl millet with
SNP. Changes in gene expression at the different time points post SNP
treatment were calculated relative to the 0 h timepoint (no treatment). The
changes in expression levels observed using qRT-PCR were similar to or
greater than the levels obtained by microarray analysis (Figure 3.6).
Discrepancies in gene expression levels between the two methods have been
well documented (Dowd et al., 2004; Parani et al., 2004; Salzman et al.,
2005), and are often attributed to cross hybridisation of gene family members
on cDNA microarrays, differences in hybridisation on surfaces versus solution
hybridisation, and/or better quantification of low abundance transcripts by
qRT-PCR. However, expression pattern trends observed over time with qRT-
PCR data were similar to those obtained from microarray data (Figure 3.6).
For example, although chlorophyll a/b binding protein transcript levels were
much greater in qRT-PCR experiments, both qRT-PCR and microarray data
indicated that this transcript steadily increased over a six hour period in
1 2 3 4 5 6 7 8 9 10 11
200 bp 100 bp
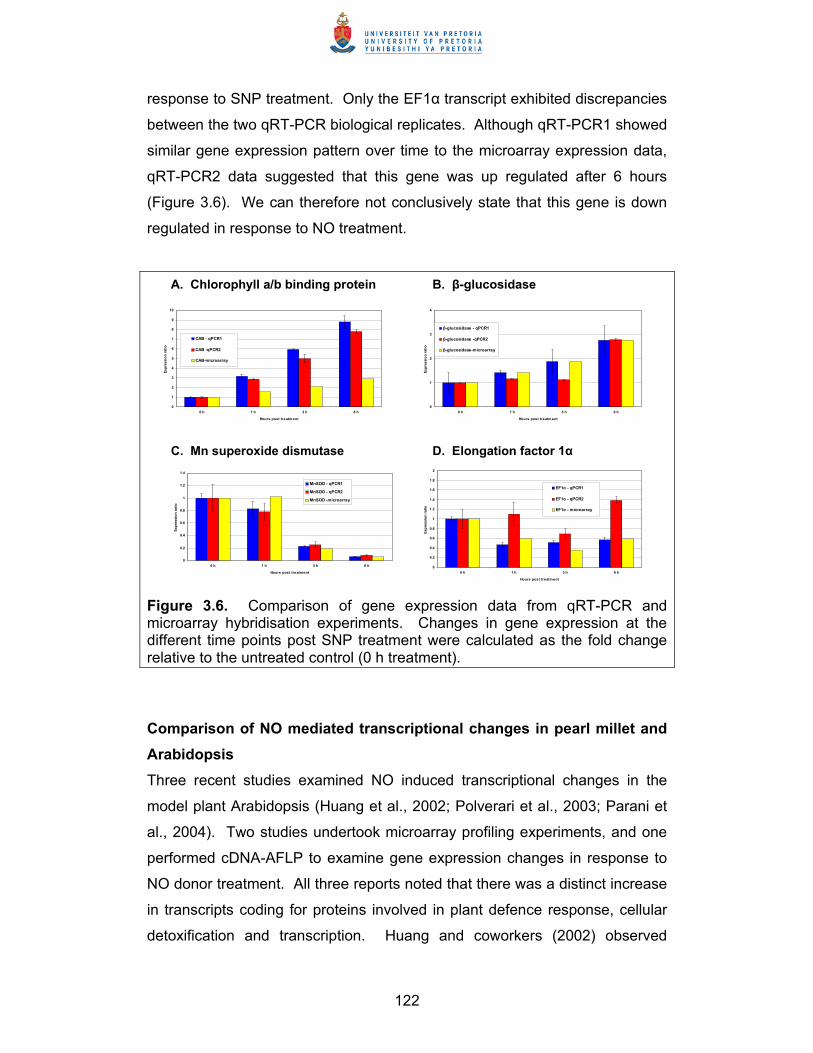
122
response to SNP treatment. Only the EF1α transcript exhibited discrepancies
between the two qRT-PCR biological replicates. Although qRT-PCR1 showed
similar gene expression pattern over time to the microarray expression data,
qRT-PCR2 data suggested that this gene was up regulated after 6 hours
(Figure 3.6). We can therefore not conclusively state that this gene is down
regulated in response to NO treatment.
Figure 3.6. Comparison of gene expression data from qRT-PCR and microarray hybridisation experiments. Changes in gene expression at the different time points post SNP treatment were calculated as the fold change relative to the untreated control (0 h treatment).
Comparison of NO mediated transcriptional changes in pearl millet and
Arabidopsis
Three recent studies examined NO induced transcriptional changes in the
model plant Arabidopsis (Huang et al., 2002; Polverari et al., 2003; Parani et
al., 2004). Two studies undertook microarray profiling experiments, and one
performed cDNA-AFLP to examine gene expression changes in response to
NO donor treatment. All three reports noted that there was a distinct increase
in transcripts coding for proteins involved in plant defence response, cellular
detoxification and transcription. Huang and coworkers (2002) observed
0
1
2
3
4
5
6
7
8
9
10
0 h 1 h 3 h 6 h
Hours post treatment
Exp
ress
ion
rat
io
CAB - qPCR1
CAB -qPCR2
CAB-microarray
0
1
2
3
4
0 h 1 h 3 h 6 h
Hours post treatment
Exp
ress
ion
rat
io
β-glucosidase - qPCR1
β-glucosidase -qPCR2
β-glucosidase-microarray
0
0.2
0.4
0.6
0.8
1
1.2
1.4
0 h 1 h 3 h 6 h
Hours post treatment
Exp
ress
ion
rat
io
MnSOD - qPCR1
MnSOD - qPCR2
MnSOD -microarray
0
0.2
0.4
0.6
0.8
1
1.2
1.4
1.6
1.8
2
0 h 1 h 3 h 6 h
Hours post treatment
Exp
ress
ion
rat
io
EF1α - qPCR1
EF1α - qPCR2
EF1α - microarray
A. Chlorophyll a/b binding protein
C. Mn superoxide dismutase
B. β-glucosidase
D. Elongation factor 1α
123
transcriptional changes in 39 genes out of a total of 250 cDNA fragments
(sequenced and non-redundant) tested, Parani et al. (2004) detected changes
in a total of 422 genes on a whole genome ATH1 microarray (24 000 genes),
and Polverari et al. (2003) noted changes in 120 out of 2500 cDNA transcripts
examined. Comparison of NO responsive genes in pearl millet and
Arabidopsis showed that there was very little overlap in gene expression
profiles. In fact, genes such as β-glucosidase, phosphoenylpyruvate
carboxylase, pyruvate dehydrogenase kinase, manganese superoxide
dismutase, elongation factor 1α and actin, identified in pearl millet as being
NO responsive, have not previously been shown to be involved in NO
signalling. In total, 45 out of 1920 pearl millet defence related transcripts
exhibited a significant change in gene expression in response to NO
treatment. Eighteen of the 45 transcripts have been sequenced, but further
sequence analysis could reveal transcripts with homology to those
represented in the Arabidopsis NO responsive transcript studies. However,
sequence analysis of pearl millet transcripts within the profiles represented in
Figure 3.3 suggests that there is a fair amount of redundancy (Table 3.2).
Alternatively, observed differences in pearl millet’s and Arabidopsis’ response
to NO could be due to the fact that the pearl millet cDNA library was
constructed from time points post elicitor treatment (5, 14, 20 h) that were
later than time points examined following SNP treatment (1, 3, 6 h post
treatment). Therefore the pearl millet cDNA library does not potentially
contain a wide array of early responsive defence transcripts. On the other
hand, pearl millet plants, and perhaps cereal plants in general, do not respond
in the same manner to NO donor treatment as Arabidopsis plants do.
In conclusion, NO plays an important role in plant defence response to
invading pathogens. The current study clearly shows that pearl millet
responds to treatment with a nitric oxide donor, and alters the expression
profiles of a number of transcripts. Comparison of pearl millet NO responsive
genes with Arabidopsis thaliana NO responsive genes revealed very little
overlap. Most of the genes exhibiting significant differential expression in
pearl millet have not been previously implicated in NO signalling in plants.
124
3.5 LITERATURE CITED
Altschul, S. F., W. Gish, W. Miller, E. W. Myers, and D. Lipman. 1990. Basic local alignment search tool. Journal of Molecular Biology 215:403-410.
Beligni, M. V. and L. Lamattina. 2000. Nitric oxide stimulates seed germination and de-etiolation, and inhibits hypocotyl elongation, three light-inducible responses in plants. Planta 210:215-221.
Cao, H., Y. Tong, and W. D. Nes. 1997. Screening corn (Zea mays) cDNA library with yeast sterol methyltrnasferase gene results in the isolation of a full length cDNA encoding elongation factor 1-alpha. Plant Physiology 113:1463.
Chandok, M. R., A. J. Ytterberg, K. J. van Wijk, and D. F. Klessig. 2003. The pathogen-inducible nitric oxide synthase (iNOS) in plants is a variant of the P protein of the glycine decarboxylase complex. Cell 113:469-482.
Delledonne, M., Y. Xia, R. A. Dixon, and C. Lamb. 1998. Nitric oxide functions as a signal in plant disease resistance. Nature 394:585-588.
Delledonne, M., J. Zeier, A. Marocco, and C. Lamb. 2001. Signal interactions between nitric oxide and reactive oxygen intermediates in the plant hypersensitive disease resistance response. Proceedings of the National Academy of Sciences USA 98:13454-13459.
Dowd, C., I. W. Wilson, and H. McFadden. 2004. Gene expression profile changes in cotton root and hypocotyl tissues in response to infection with Fusarium oxysporum f. sp. vasinfectum. Molecular Plant-Microbe Interactions 17:654-667.
Durner, J., D. Wendehenne, and D. F. Klessig. 1998. Defense gene induction in tobacco by nitric oxide, cyclic GMP, and cyclic ADP-ribose. Proceedings of the National Academy of Science USA 95:10328-10333.
Garcia-Mata, C. and L. Lamattina. 2001. Nitric oxide induces stomatal closure and enhances the adaptive plant responses against drought stress. Plant Physiology 126:1196-1204.
Garcia-Mata, C. and L. Lamattina. 2002. Nitic oxide and abscisic acid cross talk in guard cells. Plant Physiology 128:790-792.
Genoud, T., A. J. Buchala, N.-H. Chua, and J.-P. Métraux. 2002. Phytochrome signalling modulates the SA-perceptive pathway in Arabidopsis. Plant Journal 31:87-95.
Hartwell, J., A. Gill, G. A. Nimmo, M. B. Wilkins, G. I. Jenkins, and H. G. Nimmo. 1999. Phosphoenolpyruvate carboxylase kinase is a novel protein kinase regulated at the level of expression. Plant Journal 20:333-342.
Hoagland, D. R. and D. I. Arnon. 1950. The water culture method of growing plants without soil. California Agricultural Experiment Station Circular 347.
Huang, X., U. von Rad, and J. Durner. 2002. Nitric oxide induces transcriptional activation of the nitric oxide-tolerant alternative oxidase in Arabidopsis suspension cells. Planta 215:914-923.
Klessig, D. F., J. Durner, R. Noad, D. A. Navarre, D. Wendehenne, D. Kumar, J. M. Zhou, J. Shah, S. Zhang, P. Kachroo, Y. Trifa, D. Pontier, E. Lam, and H. Silva. 2000. Nitric oxide and salicylic acid signaling in plant defense. Proceedings of the National Academy of Sciences USA 97:8849-8855.
Leshem, Y. Y. and Y. Pinchasov. 2000. Non-invasive photoacoustic spectroscopic determination of relative endogenous nitric oxide and ethylene content stoichiometry during
125
the ripening of strawberries Fragaria anannasa (Duch.) and avocados Persea americana (Mill.). Journal of Experimental Botany 51:1471-1473.
Mayer, B. and B. Hemmens. 1997. Biosynthesis and action of nitric oxide in mammalian cells. Trends in Biochemical Sciences 25:79-82.
Murashige, T. and F. Skoog. 1962. A revised medium for rapid growth and bioassays with tobacco tissue cultures. Physiologia Plantarum 15:473-497.
Murgia, I., M. Delledonne, and C. Soave. 2002. Nitric oxide mediates iron-induced ferritin accumulation in Arabidopsis. Plant Journal 30:521-528.
Naidoo, S., K. J. Denby, and D. K. Berger. 2005. Microarray experiment: considerations for experimental design. South African Journal of Science In press.
Nikus, J., G. Daniel, and L. M. V. Jonsson. 2001. Subcellular localization of â-glucosidase in rye, maize and wheat seedlings. Plant Physiology 111:466-472.
Pagnussat, G. C., M. L. Lanteri, and L. Lamattina. 2003. Nitric oxide and cyclic GMP are messengers in the indole acetic acid-induced adventitious rooting process. Plant Physiology 132:1241-1248.
Parani, M., S. Rudrabhatla, R. Myers, H. Weirich, B. Smith, D. W. Leaman, and S. L. Goldman. 2004. Microarray analysis of nitric oxide responsive transcripts in Arabidopsis. Plant Biotechnology Journal 2:359-366.
Pfaffl, M. W. 2001. A new mathematical model for relative quantification in real-time RT-PCR. Nucleic Acids Research 29:2002-2007.
Polverari, A., B. Molesini, M. Pezzotti, R. Buonaurio, M. Marte, and M. Delledonne. 2003. Nitric oxide-mediated transcriptional changes in Arabidopsis thaliana. Molecular Plant Microbe Interactions 16:1094-1105.
Saeed, A. I., V. Sharov, J. White, J. Li, W. Liang, N. Bhagabati, J. Braisted, M. Klapa, T. Currier, M. Thiagarajan, A. Sturn, M. Snuffin, A. Rezantsev, D. Popov, A. Ryltsov, E. Kostukovich, I. Borisovsky, Z. Liu, A. Vinsavich, V. Trush, and J. Quackenbush. 2003. TM4: A free, open-source system for microarray data management and analysis. Biotechniques 34:374-378.
Salzman, R. A., J. A. Brady, S. A. Finlayson, C. D. Buchanan, E. J. Summer, F. Sung, P. E. Klein, R. R. Klein, L. H. Pratt, M. Cordonnier-Pratt, and J. E. Mullet. 2005. Transcriptional profiling of sorghum induced by methyl jasmonate, salicylic acid, and aminocyclopropane carboxylic acid reveals cooperative regulation and novel gene responses. Plant Physiology 138:352-368.
Schenk, P. M., K. Kazan, I. Wilson, J. P. Anderson, T. Richmond, S. C. Somerville, and J. M. Manners. 2000. Coordinated plant defense responses in Arabidopsis revealed by microarray analysis. Proceedings of the National Academy of Sciences USA 97:11655-11660.
Smyth, G. K. 2004. Linear models and empirical Bayes methods for assessing differential expression in microarray experiments. Statistical Applications in Genetics and Molecular Biology 3.
Song, F. and R. M. Goodman. 2001. Activity of nitric oxide is dependent on, but is partially required for function of, salicylic acid in the signaling pathway in tobacco systemic acquired resistance. Molecular Plant Microbe Interactions 14:1462.
Tada, Y., T. Mori, T. Shinogi, N. Yao, S. Takahashi, S. Betsuyaku, M. Sakamoto, P. Park, H. Nakayashiki, Y. Tosa, and S. Mayama. 2004. Nitric oxide and reactive oxygen species do not
126
elicit hypersensitive cell death but induce apoptosis in the adjacent cells during the defense response of oat. Molecular Plant-Microbe Interactions 17:245-253.
Thelen, J. J., J. A. Miernyk, and D. D. Randall. 2000. Pyruvate dehydrogenase kinase from Arabidopsis thaliana: a protein histidine kinase that phosphorylates serine residues. Biochemistry Journal 349:195-201.
Van den Berg, N., B. G. Crampton, I. Hein, P. R. J. Birch, and D. K. Berger. 2004. High-throughput screening of suppression subtractive hybridization cDNA libraries using DNA microarray analysis. Biotechniques 37:818-824.
Vantard, M. and L. Blanchoin. 2002. Actin polymerization processes in plant cells. Current Opinion in Plant Biology 5:502-506.
Zeng, C. and A. R. Morrison. 2001. Disruption of the actin cytoskeleton regulates cytokine-induced iNOS expression. American Journal of Physiology and Cell Physiology 281:C932-C940.
127
Chapter 4
Evaluation of pearl millet defence signalling pathways involved in leaf rust (Puccinia substriata) resistance and
perception
4.1 ABSTRACT
Studies were undertaken to assess induction of defence response pathways
in pearl millet in response to infection with the leaf rust fungus Puccinia
substriata. Pathology studies indicated that pretreatment of pearl millet with
salicylic acid (SA) conferred resistance to a virulent isolate of the rust fungus,
whereas methyl jasmonate (MeJA) did not significantly reduce infection levels.
These results imply that the salicylate defence pathway is induced in
response to an incompatible rust infection. However, large scale gene
expression profiling of pearl millet in response to treatment with MeJA, SA and
a virulent rust isolate showed that the compatible rust infection increased
transcript abundance of a number of genes that were common to jasmonate
and salicylate defence signalling, as well as transcripts that were unique to
rust infection. These results suggest that the plant adopts elements from a
number of defence signalling pathways in an attempt to ward off infection by
the compatible biotrophic rust fungus. However, in view of results obtained
from pearl millet defence chemical treatments, it is probably genes that are
significantly induced in response to SA, but to a lesser extent by MeJA that
actually confer resistance to an avirulent rust isolate. Gene expression
analysis also revealed substantial overlap in gene expression responses
between the treatments, with MeJA and SA treatments exhibiting the largest
number of coinduced transcripts (67). DNA sequence analyses of 135 cDNAs
displaying two-fold or more changes in gene expression in at least one of the
treatments yielded 66 unigenes (51% redundancy) that encoded proteins
functioning in direct defence, oxidative burst, abiotic stress, basic/secondary
metabolism, protein synthesis and cell signalling, and photosynthesis, as well
as proteins of unknown function.
128
4.2 INTRODUCTION
Plants respond to invasion by pathogens by activating a complex set of
transcriptional and biochemical changes, which induce the production of
reactive oxygen species and the development of the hypersensitive response
(HR), fortification of cell walls by the cross-linking of cell wall proteins,
biosynthesis of phytoalexins, and the accumulation of anti-microbial proteins.
The signal transduction network controlling defence activation is comprised of
several interacting pathways. Three signalling molecules, salicylic acid (SA),
jasmonic acid (JA) and ethylene (ET) are known to play key roles in various
aspects of plant defence signal transduction. These signalling molecules are
involved in what appears to be two major defence signalling pathways: a SA
dependent pathway and a SA-independent pathway that involves JA and ET
(Kunkel and Brooks, 2002).
Evidence suggests that defence signalling pathways do not function
independently, but rather influence each other through a complex network of
regulatory mechanisms (Kunkel and Brooks, 2002). However, the analysis of
signalling processes and their interactions in plants have traditionally been
reductionist in approach and have focussed on only one or a few genes at any
one time (Kunkel and Brooks, 2002). From such studies it has not been
possible to assess the extent of overlap of gene activation by different signals
and pathogens in defence response. However, a number of recent studies
have applied DNA microarray global gene expression profiling, which enables
expression analysis of thousands of genes in parallel, to improve our
understanding of the molecular basis of plant defence response mechanisms
(Schenk et al., 2000; Maleck et al., 2000; Glazebrook et al., 2003; Zhu-
Salzman et al., 2004; Salzman et al., 2005). Results from these studies
indicate the existence of a substantial network of regulatory interactions and
coordination during plant defence signalling pathways, notably between the
salicylate and jasmonate pathways that were previously thought to act in an
antagonistic fashion.
To date, most genome scale studies of gene expression in response
signalling molecules have been performed in the model plant Arabidopis
129
thaliana. Recently two studies were published on gene expression profiling in
response to defence signalling molecules in the C4 monocot sorghum
(Sorghum bicolor) (Zhu-Salzman et al., 2004; Salzman et al., 2005). In the
present study, we further improved our understanding of defence signalling
pathways in C4 monocotyledonous crop plants by examining the
transcriptional response of pearl millet [Pennisetum glaucum (L.) R. Br] at
different time points after inoculation with the compatible rust fungus Puccinia
substriata Ellis & Barth. var indica Ramachar & Cummins, and contrasting this
regulation with JA- and SA-regulated gene expression. Investigations were
made to determine whether MeJA and SA signalling is antagonistic as has
previously been reported for Arabidopsis (Kunkel and Brooks, 2002), and
whether infection with a biotrophic rust fungus elicits gene expression more
similar to the SA than JA signalling pathway.
4.3 MATERIALS AND METHODS
Treatment of pearl millet plants
Pearl millet seed (line ICML12=P7) was sterilised by briefly rinsing with 70%
ethanol, followed by 20 min incubation in 0.7% sodium hypochlorite.
Following three washes with sterile distilled water, seeds were plated on half
strength MS medium (Murashige and Skoog, 1962), and incubated at 25ºC
with a 16 hour light/8 hour dark photoperiod. After one week (once the seeds
had germinated) seedlings were transferred to seedling trays containing
sterilised vermiculite that had been fertilised with Hoagland’s solution
(Hoagland and Arnon, 1950). Plants were grown for a further six weeks under
16 h light (140 umol/m2/s) and 8 h dark cycles at a constant temperature of
25ºC and 85% relative humidity.
P. substriata var. indica cultures, isolated from infected pearl millet plants
grown in KwaZulu-Natal, South Africa, were maintained on pearl millet
ICML12=P7 plants. For inoculations, 5 mm leaf segments containing
uredospores were gently pressed onto the adaxial surface of 2 week old pearl
millet (ICML12=P7) seedlings that had been misted by spraying sterile double
130
distilled water from an “atomiser” spray bottle. Seedlings were incubated in
the dark for two days, and were thereafter maintained under 16 h light (140
umol/m2/s) and 8 h dark cycles at a constant temperature of 25ºC and 85%
relative humidity. Rust infected pearl millet leaf material was harvested 0, 20,
120 and 192 h post inoculation. For SA and methyl jasmonate (MeJA)
treatments, seven week old plants were sprayed until runoff with either 5 mM
sodium salicylate (Sigma, Aston Manor, South Africa), prepared in 0.1%
Tween20 (Sigma), or 500 μM MeJA (Sigma) in 0.1% ethanol, 0.1% Tween20,
respectively. Both SA and MeJA treated leaf tissue was harvested 0, 12, 24
and 48 hours post treatment (Schenk et al., 2000). Plants were immediately
frozen in liquid nitrogen and stored at -80ºC until RNA purification. All
treatments (rust, SA and MeJA) were applied during the light period, and two
replications with 9 plants in each were included. Plants within replicates were
pooled to reduce variation prior to RNA extraction.
Chemical induction/pathogenicity trials
For chemical induction experiments, three week old ICML12=P7 plants were
treated with either water, 5 mM sodium salicylate (Sigma) prepared in 0.1%
Tween20, or 500 μM MeJA (Sigma) in 0.1% ethanol containing 0.1%
Tween20 until run off. Plants were incubated for 24 h, after which 50 µl of
freshly collected P. substriata urediniospores were applied to the fourth leaf of
each plant. Seedlings were incubated in the dark for two days, and were
thereafter maintained under 16 h light (140 umol/m2/s) and 8 h dark cycles at
a constant temperature of 25ºC and 85% relative humidity until rust pustules
developed on the leaf surface. Each treatment consisted of two biological
replicates each containing 7 plants. Results were analysed in Microsoft Excel
using a Student’s t-test assuming unequal variances.
RNA isolation and purification, Microarray preparation, Fluorescent
probe preparation, hybridisation and scanning, Microarray data analysis,
and DNA sequencing and data analysis were performed as outlined in
Chapter 3 (Materials and methods).
131
Quantitative PCR
Gene specific primers were synthesised for an endogenous control (18S
rRNA) and five selected probe sets [ASR2, β-glucosidase (β-gluc), Ca EF
hand protein, manganese superoxide dismutase (Mn SOD) and thionin], and
used in reverse transcriptase quantitative PCR (qRT-PCR) reactions to verify
expression ratios obtained from microarray analysis. Optimal primer design
was performed using Primer3 software (http://frodo.wi.mit.edu), and internal
primer secondary structure (hairpins, dimers, palindromes, repeats) was
assessed using Net Primer software (www.PremierBioSoft.com). Primers
used in qRT-PCR confirmation of microarray data are shown in Table 4.1.
Table 4.1. Primers used in qRT-PCR confirmation of microarray data
Target gene
Forward primer Reverse primer Product size(bp)
18S rRNA GCCATCGCTCTGGATACATT TCATTACTCCGATCCCGAAG 83 ASR2 GCCACAACTGAAGAGACACC ACGCACACACAAATCGAGAG 111 β-gluc AGCTGCAAGGATGAACGACT ATCGGTGAAGGATGGTAGCC 112 Ca EF hand ATTAGTCCCCATTCCCCTTC TAACATCCGCAGAGATCGAG 94 Mn SOD TGTTCTGGTGCAACTCTGCT ATTGCGGAGGACTGAATCAC 71 thionin AGGGGTGTCAAGATCAGCAG GCAGCAACTCTTGCCTTTCT 99
DNA free total RNA from each of the four MeJA, SA and rust post treatment
timepoints was reverse transcribed using a Transcriptor First Strand cDNA
Synthesis Kit (Roche Diagnostics). qRT-PCR reactions were set up and
performed as outlined in Chapter 3 (Materials and methods).
132
4.4 RESULTS AND DISCUSSION
Experimental system: rust infection of pearl millet seedlings
In pearl millet, common rust, caused by Puccinia substriata, is a disease that
is characterised by the formation of rust pustules on leaves in productively
infected plants. As the severity of the infection increases, leaf tissue wilts and
becomes necrotic from the leaf apex to the base. Pearl millet rust is fairly
widespread throughout the growing regions of South Africa, and is a major
constraint to biomass production (de Miliano, personal communication).
A number of publications in the literature detail methods of rust infection of
plant seedlings. These include suspending urediniospores in a kerosene
solution and spraying seedlings, dewaxing leaves prior to inoculation with
uredospores (Beckett et al., 1990), mixing uredospores with talc powder and
applying to the leaf surface (Freytag and Mendgen, 1991; Larous and Losel,
1993), and particle bombardment of leaf segments with ureodiniospores (Girgi
et al., 2006). However, we sought an application method that would result in
minimal damage to the pearl leaf surface, and that would only initiate
transcriptional changes in pearl millet in response to rust treatment. For this
reason, we applied a rust infection method that was developed in kikuyu grass
(Adendorff and Rijkenberg, 2000), in which infected leaf segments containing
P. substriata urediniospores were gently pressed against the adaxial surface
of two week old pearl millet seedlings. The symptoms that are characteristic
of rust infection in the field were obtained over an 8 day period in our
experimental system (Figure 4.1). Chlorotic lesions developed on leaf
surfaces within 5 days or 120 hours postinfection (120 hpi), and fully
developed rust symptoms were visible within 8 dpi (192 hpi) (Figure 4.1).
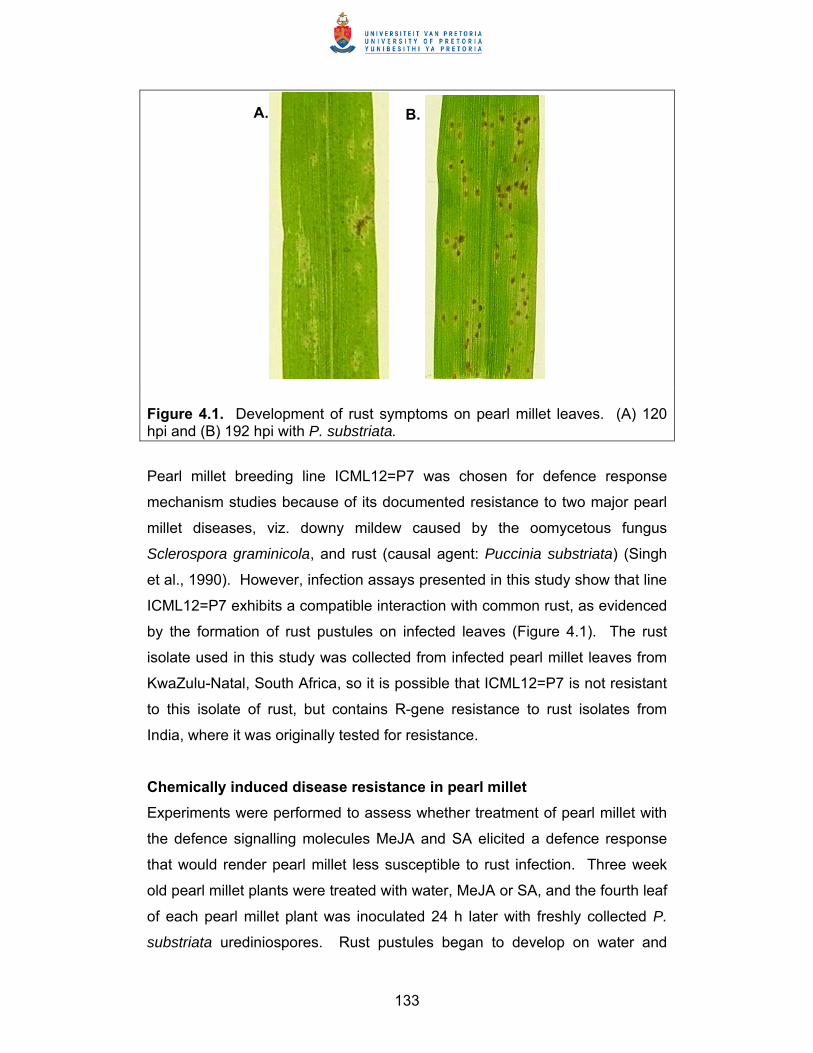
133
Figure 4.1. Development of rust symptoms on pearl millet leaves. (A) 120 hpi and (B) 192 hpi with P. substriata.
Pearl millet breeding line ICML12=P7 was chosen for defence response
mechanism studies because of its documented resistance to two major pearl
millet diseases, viz. downy mildew caused by the oomycetous fungus
Sclerospora graminicola, and rust (causal agent: Puccinia substriata) (Singh
et al., 1990). However, infection assays presented in this study show that line
ICML12=P7 exhibits a compatible interaction with common rust, as evidenced
by the formation of rust pustules on infected leaves (Figure 4.1). The rust
isolate used in this study was collected from infected pearl millet leaves from
KwaZulu-Natal, South Africa, so it is possible that ICML12=P7 is not resistant
to this isolate of rust, but contains R-gene resistance to rust isolates from
India, where it was originally tested for resistance.
Chemically induced disease resistance in pearl millet
Experiments were performed to assess whether treatment of pearl millet with
the defence signalling molecules MeJA and SA elicited a defence response
that would render pearl millet less susceptible to rust infection. Three week
old pearl millet plants were treated with water, MeJA or SA, and the fourth leaf
of each pearl millet plant was inoculated 24 h later with freshly collected P.
substriata urediniospores. Rust pustules began to develop on water and
B. A.
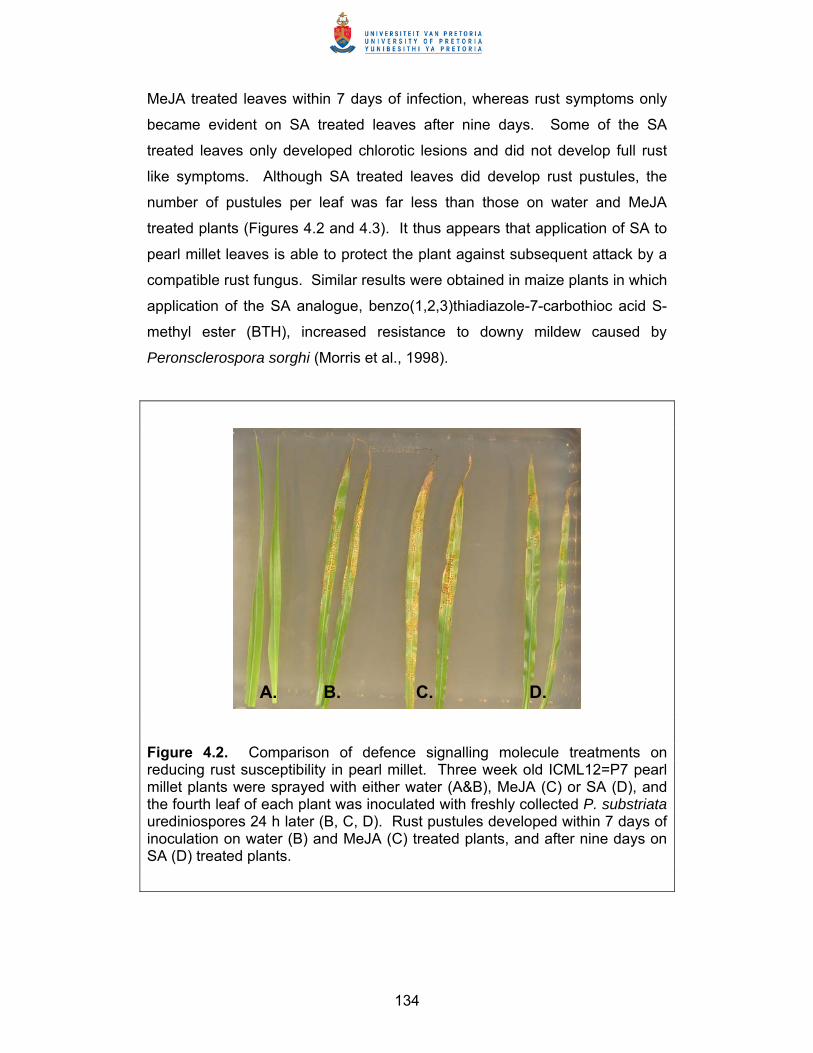
134
MeJA treated leaves within 7 days of infection, whereas rust symptoms only
became evident on SA treated leaves after nine days. Some of the SA
treated leaves only developed chlorotic lesions and did not develop full rust
like symptoms. Although SA treated leaves did develop rust pustules, the
number of pustules per leaf was far less than those on water and MeJA
treated plants (Figures 4.2 and 4.3). It thus appears that application of SA to
pearl millet leaves is able to protect the plant against subsequent attack by a
compatible rust fungus. Similar results were obtained in maize plants in which
application of the SA analogue, benzo(1,2,3)thiadiazole-7-carbothioc acid S-
methyl ester (BTH), increased resistance to downy mildew caused by
Peronsclerospora sorghi (Morris et al., 1998).
Figure 4.2. Comparison of defence signalling molecule treatments on reducing rust susceptibility in pearl millet. Three week old ICML12=P7 pearl millet plants were sprayed with either water (A&B), MeJA (C) or SA (D), and the fourth leaf of each plant was inoculated with freshly collected P. substriata urediniospores 24 h later (B, C, D). Rust pustules developed within 7 days of inoculation on water (B) and MeJA (C) treated plants, and after nine days on SA (D) treated plants.
A. B. C. D.
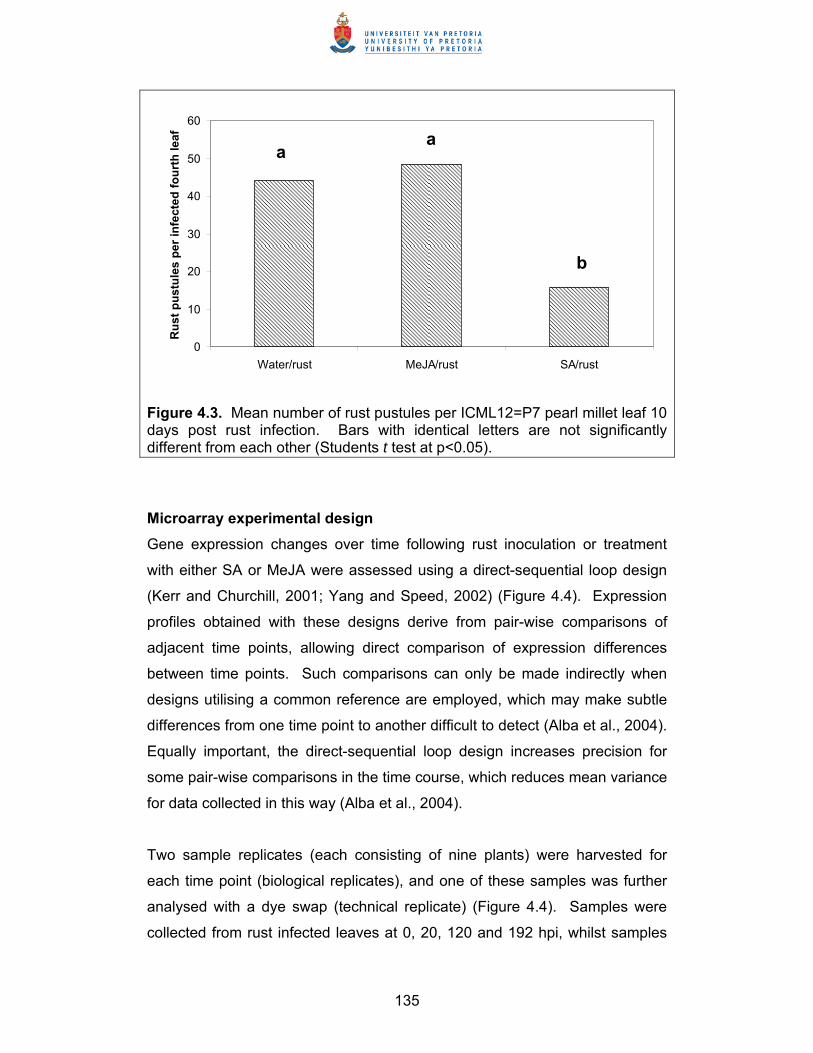
135
Figure 4.3. Mean number of rust pustules per ICML12=P7 pearl millet leaf 10 days post rust infection. Bars with identical letters are not significantly different from each other (Students t test at p<0.05).
Microarray experimental design
Gene expression changes over time following rust inoculation or treatment
with either SA or MeJA were assessed using a direct-sequential loop design
(Kerr and Churchill, 2001; Yang and Speed, 2002) (Figure 4.4). Expression
profiles obtained with these designs derive from pair-wise comparisons of
adjacent time points, allowing direct comparison of expression differences
between time points. Such comparisons can only be made indirectly when
designs utilising a common reference are employed, which may make subtle
differences from one time point to another difficult to detect (Alba et al., 2004).
Equally important, the direct-sequential loop design increases precision for
some pair-wise comparisons in the time course, which reduces mean variance
for data collected in this way (Alba et al., 2004).
Two sample replicates (each consisting of nine plants) were harvested for
each time point (biological replicates), and one of these samples was further
analysed with a dye swap (technical replicate) (Figure 4.4). Samples were
collected from rust infected leaves at 0, 20, 120 and 192 hpi, whilst samples
0
10
20
30
40
50
60
Water/rust MeJA/rust SA/rust
Ru
st p
ust
ule
s p
er in
fect
ed f
ou
rth
leaf
a a
b
a
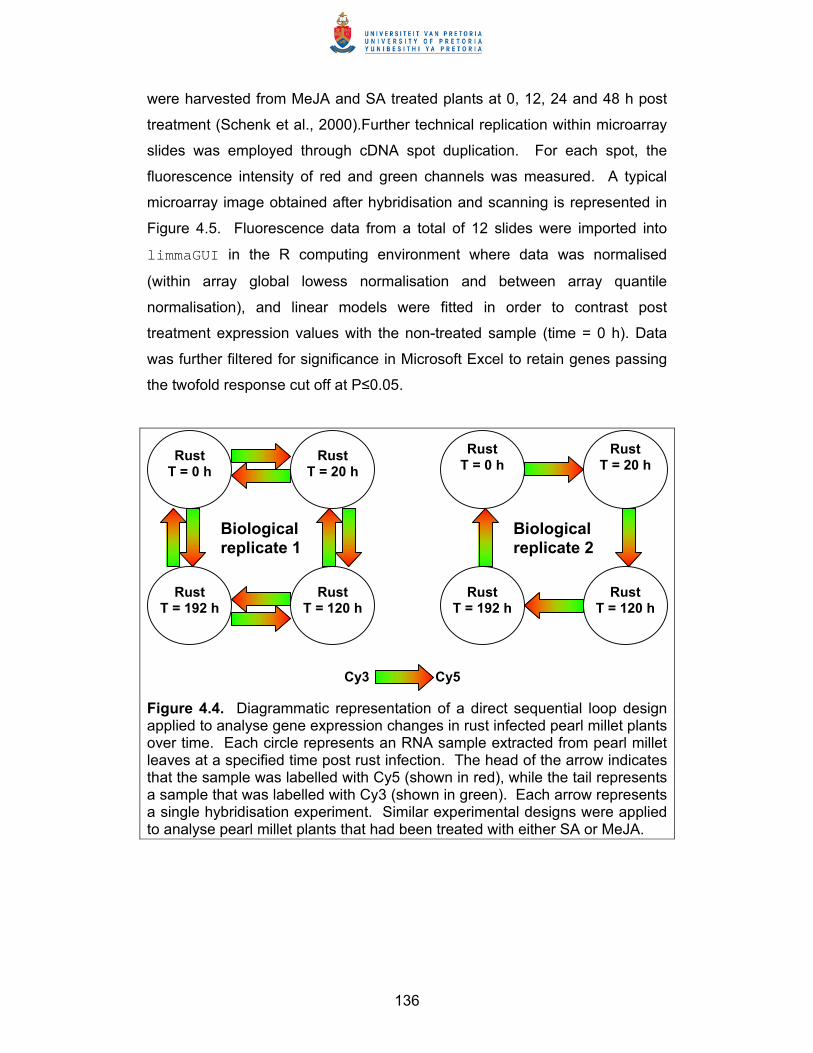
136
were harvested from MeJA and SA treated plants at 0, 12, 24 and 48 h post
treatment (Schenk et al., 2000).Further technical replication within microarray
slides was employed through cDNA spot duplication. For each spot, the
fluorescence intensity of red and green channels was measured. A typical
microarray image obtained after hybridisation and scanning is represented in
Figure 4.5. Fluorescence data from a total of 12 slides were imported into
limmaGUI in the R computing environment where data was normalised
(within array global lowess normalisation and between array quantile
normalisation), and linear models were fitted in order to contrast post
treatment expression values with the non-treated sample (time = 0 h). Data
was further filtered for significance in Microsoft Excel to retain genes passing
the twofold response cut off at P≤0.05.
Figure 4.4. Diagrammatic representation of a direct sequential loop design applied to analyse gene expression changes in rust infected pearl millet plants over time. Each circle represents an RNA sample extracted from pearl millet leaves at a specified time post rust infection. The head of the arrow indicates that the sample was labelled with Cy5 (shown in red), while the tail represents a sample that was labelled with Cy3 (shown in green). Each arrow represents a single hybridisation experiment. Similar experimental designs were applied to analyse pearl millet plants that had been treated with either SA or MeJA.
Biological replicate 1
Biological replicate 2
Rust T = 0 h
Rust T = 20 h
Rust T = 120 h
Rust T = 192 h
Rust T = 0 h
Rust T = 20 h
Rust T = 192 h
Rust T = 120 h
Cy3 Cy5
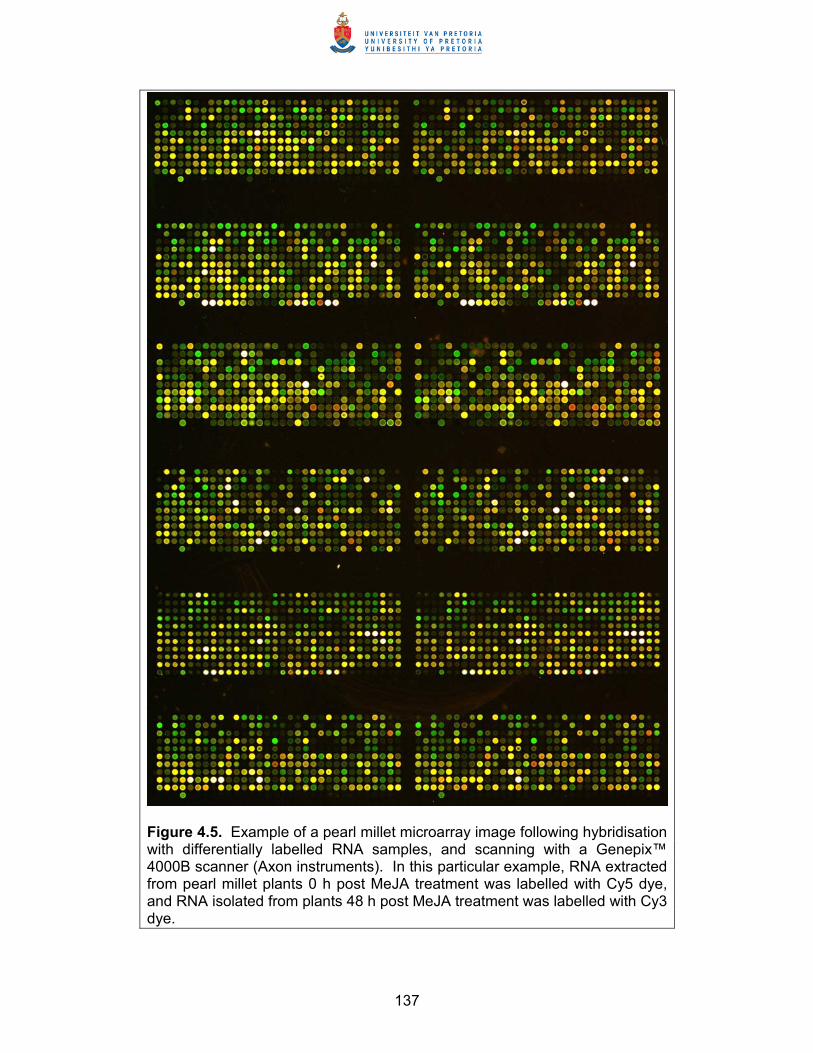
137
Figure 4.5. Example of a pearl millet microarray image following hybridisation with differentially labelled RNA samples, and scanning with a Genepix™ 4000B scanner (Axon instruments). In this particular example, RNA extracted from pearl millet plants 0 h post MeJA treatment was labelled with Cy5 dye, and RNA isolated from plants 48 h post MeJA treatment was labelled with Cy3 dye.
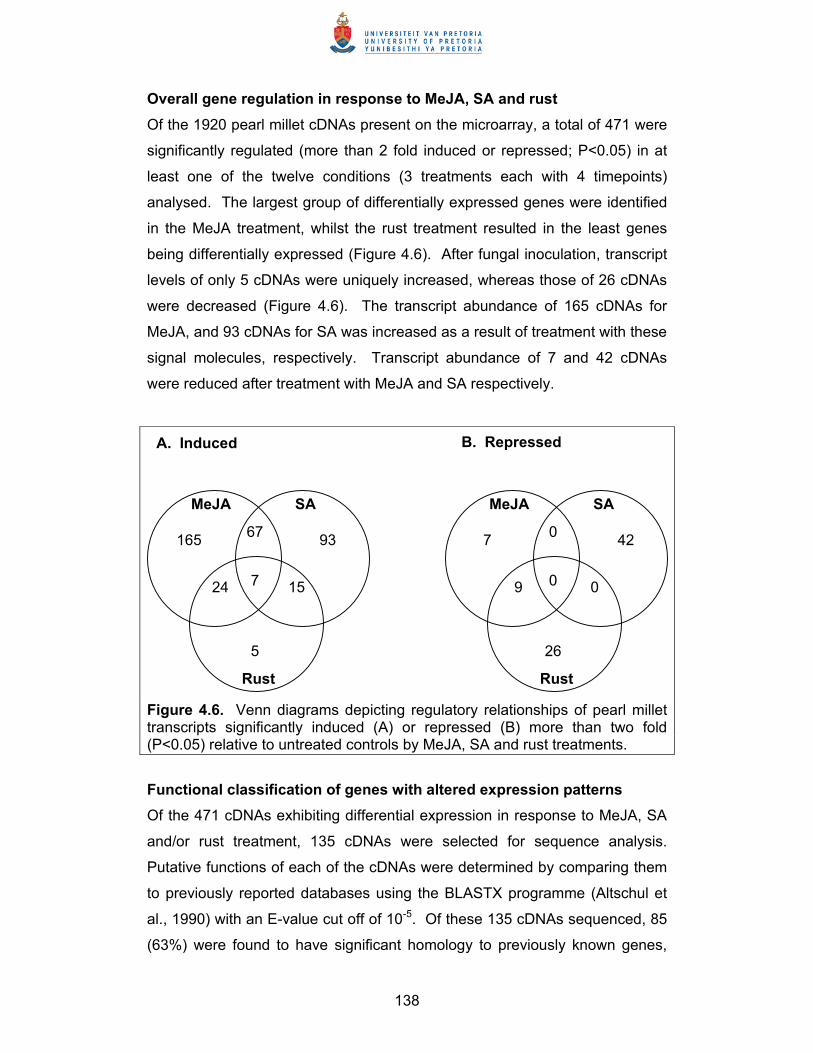
138
Overall gene regulation in response to MeJA, SA and rust
Of the 1920 pearl millet cDNAs present on the microarray, a total of 471 were
significantly regulated (more than 2 fold induced or repressed; P<0.05) in at
least one of the twelve conditions (3 treatments each with 4 timepoints)
analysed. The largest group of differentially expressed genes were identified
in the MeJA treatment, whilst the rust treatment resulted in the least genes
being differentially expressed (Figure 4.6). After fungal inoculation, transcript
levels of only 5 cDNAs were uniquely increased, whereas those of 26 cDNAs
were decreased (Figure 4.6). The transcript abundance of 165 cDNAs for
MeJA, and 93 cDNAs for SA was increased as a result of treatment with these
signal molecules, respectively. Transcript abundance of 7 and 42 cDNAs
were reduced after treatment with MeJA and SA respectively.
Figure 4.6. Venn diagrams depicting regulatory relationships of pearl millet transcripts significantly induced (A) or repressed (B) more than two fold (P<0.05) relative to untreated controls by MeJA, SA and rust treatments.
Functional classification of genes with altered expression patterns
Of the 471 cDNAs exhibiting differential expression in response to MeJA, SA
and/or rust treatment, 135 cDNAs were selected for sequence analysis.
Putative functions of each of the cDNAs were determined by comparing them
to previously reported databases using the BLASTX programme (Altschul et
al., 1990) with an E-value cut off of 10-5. Of these 135 cDNAs sequenced, 85
(63%) were found to have significant homology to previously known genes,
A. Induced B. Repressed
MeJA SA
Rust
67 165 93
7 24 15
5
MeJA SA
Rust
0 7 42
0 9 0
26
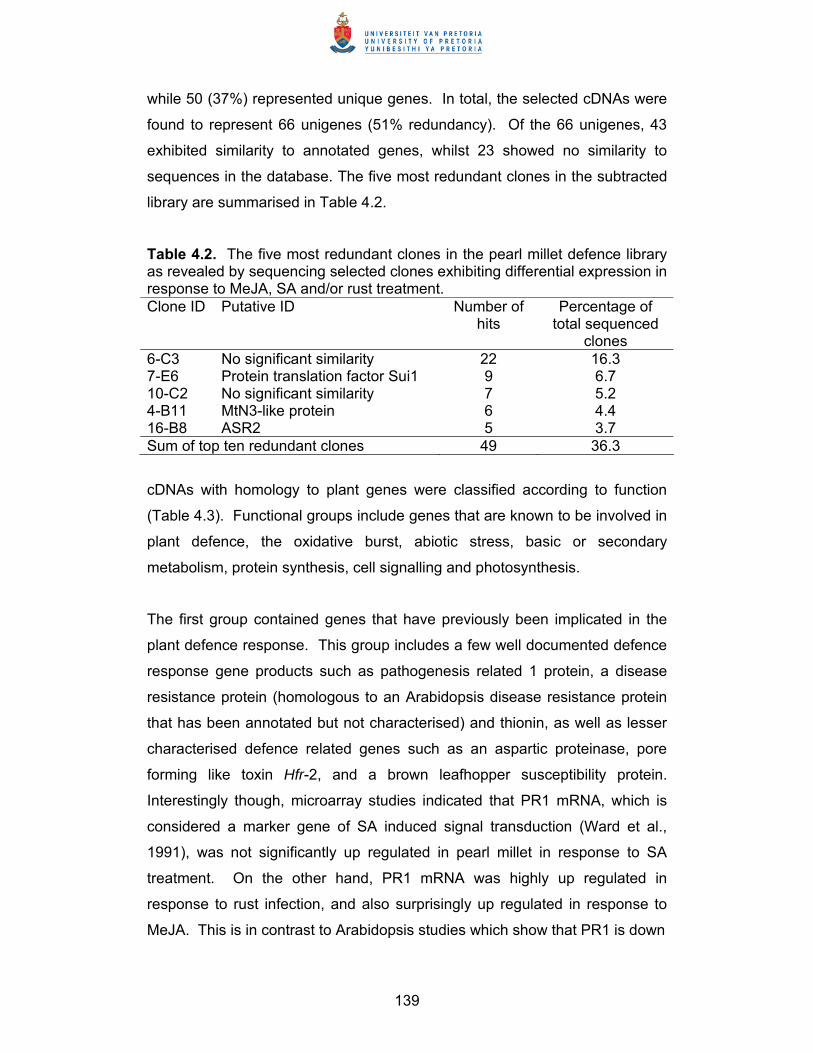
139
while 50 (37%) represented unique genes. In total, the selected cDNAs were
found to represent 66 unigenes (51% redundancy). Of the 66 unigenes, 43
exhibited similarity to annotated genes, whilst 23 showed no similarity to
sequences in the database. The five most redundant clones in the subtracted
library are summarised in Table 4.2.
Table 4.2. The five most redundant clones in the pearl millet defence library as revealed by sequencing selected clones exhibiting differential expression in response to MeJA, SA and/or rust treatment. Clone ID Putative ID Number of
hits Percentage of
total sequenced clones
6-C3 No significant similarity 22 16.3 7-E6 Protein translation factor Sui1 9 6.7 10-C2 No significant similarity 7 5.2 4-B11 MtN3-like protein 6 4.4 16-B8 ASR2 5 3.7 Sum of top ten redundant clones 49 36.3
cDNAs with homology to plant genes were classified according to function
(Table 4.3). Functional groups include genes that are known to be involved in
plant defence, the oxidative burst, abiotic stress, basic or secondary
metabolism, protein synthesis, cell signalling and photosynthesis.
The first group contained genes that have previously been implicated in the
plant defence response. This group includes a few well documented defence
response gene products such as pathogenesis related 1 protein, a disease
resistance protein (homologous to an Arabidopsis disease resistance protein
that has been annotated but not characterised) and thionin, as well as lesser
characterised defence related genes such as an aspartic proteinase, pore
forming like toxin Hfr-2, and a brown leafhopper susceptibility protein.
Interestingly though, microarray studies indicated that PR1 mRNA, which is
considered a marker gene of SA induced signal transduction (Ward et al.,
1991), was not significantly up regulated in pearl millet in response to SA
treatment. On the other hand, PR1 mRNA was highly up regulated in
response to rust infection, and also surprisingly up regulated in response to
MeJA. This is in contrast to Arabidopsis studies which show that PR1 is down
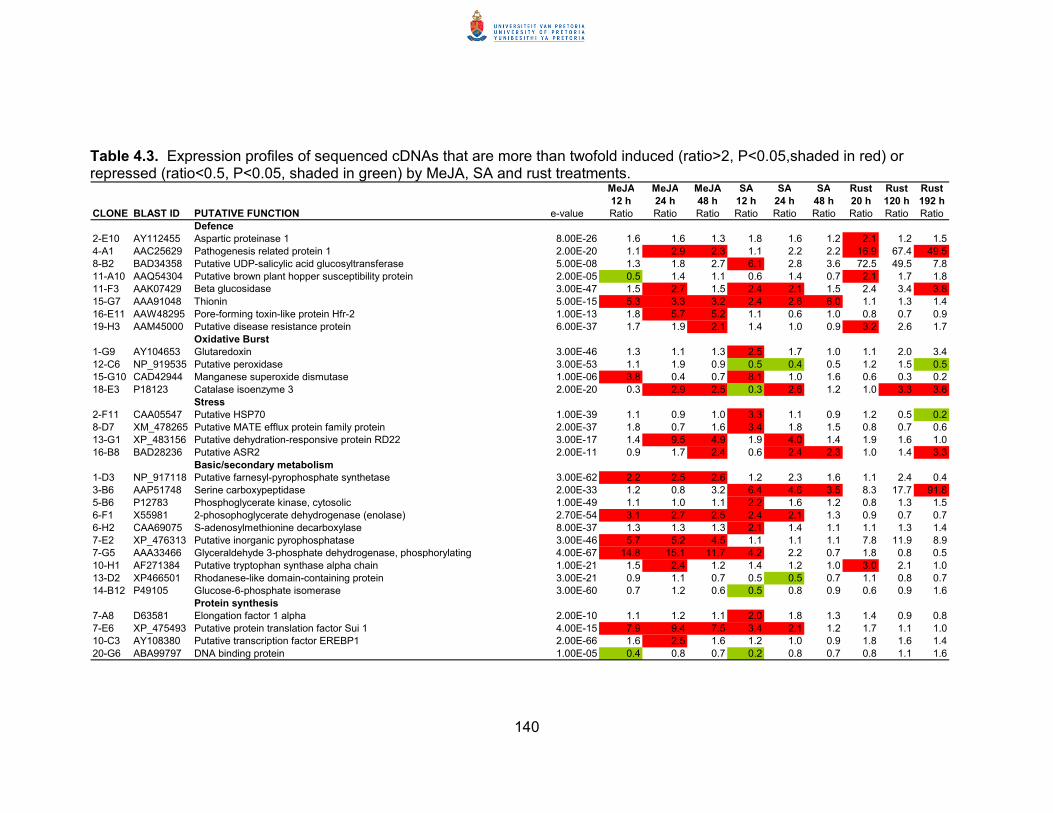
140
Table 4.3. Expression profiles of sequenced cDNAs that are more than twofold induced (ratio>2, P<0.05,shaded in red) or repressed (ratio<0.5, P<0.05, shaded in green) by MeJA, SA and rust treatments.
MeJA MeJA MeJA SA SA SA Rust Rust Rust12 h 24 h 48 h 12 h 24 h 48 h 20 h 120 h 192 h
CLONE BLAST ID PUTATIVE FUNCTION e-value Ratio Ratio Ratio Ratio Ratio Ratio Ratio Ratio RatioDefence
2-E10 AY112455 Aspartic proteinase 1 8.00E-26 1.6 1.6 1.3 1.8 1.6 1.2 2.1 1.2 1.54-A1 AAC25629 Pathogenesis related protein 1 2.00E-20 1.1 2.9 2.3 1.1 2.2 2.2 16.9 67.4 49.58-B2 BAD34358 Putative UDP-salicylic acid glucosyltransferase 5.00E-08 1.3 1.8 2.7 6.1 2.8 3.6 72.5 49.5 7.811-A10 AAQ54304 Putative brown plant hopper susceptibility protein 2.00E-05 0.5 1.4 1.1 0.6 1.4 0.7 2.1 1.7 1.811-F3 AAK07429 Beta glucosidase 3.00E-47 1.5 2.7 1.5 2.4 2.1 1.5 2.4 3.4 3.815-G7 AAA91048 Thionin 5.00E-15 5.3 3.3 3.2 2.4 2.6 6.0 1.1 1.3 1.416-E11 AAW48295 Pore-forming toxin-like protein Hfr-2 1.00E-13 1.8 5.7 5.2 1.1 0.6 1.0 0.8 0.7 0.919-H3 AAM45000 Putative disease resistance protein 6.00E-37 1.7 1.9 2.1 1.4 1.0 0.9 3.2 2.6 1.7
Oxidative Burst1-G9 AY104653 Glutaredoxin 3.00E-46 1.3 1.1 1.3 2.5 1.7 1.0 1.1 2.0 3.412-C6 NP_919535 Putative peroxidase 3.00E-53 1.1 1.9 0.9 0.5 0.4 0.5 1.2 1.5 0.515-G10 CAD42944 Manganese superoxide dismutase 1.00E-06 3.8 0.4 0.7 8.1 1.0 1.6 0.6 0.3 0.218-E3 P18123 Catalase isoenzyme 3 2.00E-20 0.3 2.9 2.5 0.3 2.6 1.2 1.0 3.3 3.6
Stress2-F11 CAA05547 Putative HSP70 1.00E-39 1.1 0.9 1.0 3.3 1.1 0.9 1.2 0.5 0.28-D7 XM_478265 Putative MATE efflux protein family protein 2.00E-37 1.8 0.7 1.6 3.4 1.8 1.5 0.8 0.7 0.613-G1 XP_483156 Putative dehydration-responsive protein RD22 3.00E-17 1.4 9.5 4.9 1.9 4.0 1.4 1.9 1.6 1.016-B8 BAD28236 Putative ASR2 2.00E-11 0.9 1.7 2.4 0.6 2.4 2.3 1.0 1.4 3.3
Basic/secondary metabolism1-D3 NP_917118 Putative farnesyl-pyrophosphate synthetase 3.00E-62 2.2 2.5 2.6 1.2 2.3 1.6 1.1 2.4 0.43-B6 AAP51748 Serine carboxypeptidase 2.00E-33 1.2 0.8 3.2 6.4 4.6 3.5 8.3 17.7 91.85-B6 P12783 Phosphoglycerate kinase, cytosolic 1.00E-49 1.1 1.0 1.1 2.2 1.6 1.2 0.8 1.3 1.56-F1 X55981 2-phosophoglycerate dehydrogenase (enolase) 2.70E-54 3.1 2.7 2.5 2.4 2.1 1.3 0.9 0.7 0.76-H2 CAA69075 S-adenosylmethionine decarboxylase 8.00E-37 1.3 1.3 1.3 2.1 1.4 1.1 1.1 1.3 1.47-E2 XP_476313 Putative inorganic pyrophosphatase 3.00E-46 5.7 5.2 4.5 1.1 1.1 1.1 7.8 11.9 8.97-G5 AAA33466 Glyceraldehyde 3-phosphate dehydrogenase, phosphorylating 4.00E-67 14.8 15.1 11.7 4.2 2.2 0.7 1.8 0.8 0.510-H1 AF271384 Putative tryptophan synthase alpha chain 1.00E-21 1.5 2.4 1.2 1.4 1.2 1.0 3.0 2.1 1.013-D2 XP466501 Rhodanese-like domain-containing protein 3.00E-21 0.9 1.1 0.7 0.5 0.5 0.7 1.1 0.8 0.714-B12 P49105 Glucose-6-phosphate isomerase 3.00E-60 0.7 1.2 0.6 0.5 0.8 0.9 0.6 0.9 1.6
Protein synthesis7-A8 D63581 Elongation factor 1 alpha 2.00E-10 1.1 1.2 1.1 2.0 1.8 1.3 1.4 0.9 0.87-E6 XP_475493 Putative protein translation factor Sui 1 4.00E-15 7.9 9.4 7.5 3.4 2.1 1.2 1.7 1.1 1.010-C3 AY108380 Putative transcription factor EREBP1 2.00E-66 1.6 2.5 1.6 1.2 1.0 0.9 1.8 1.6 1.420-G6 ABA99797 DNA binding protein 1.00E-05 0.4 0.8 0.7 0.2 0.8 0.7 0.8 1.1 1.6
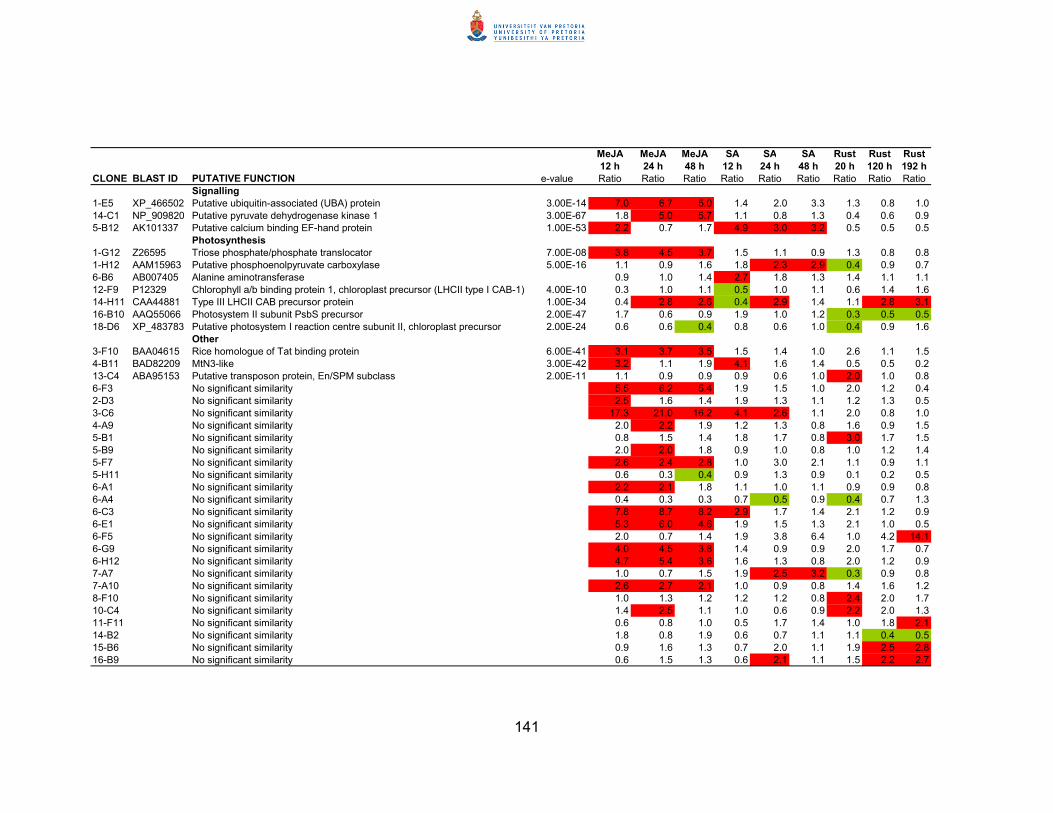
141
MeJA MeJA MeJA SA SA SA Rust Rust Rust12 h 24 h 48 h 12 h 24 h 48 h 20 h 120 h 192 h
CLONE BLAST ID PUTATIVE FUNCTION e-value Ratio Ratio Ratio Ratio Ratio Ratio Ratio Ratio RatioSignalling
1-E5 XP_466502 Putative ubiquitin-associated (UBA) protein 3.00E-14 7.0 6.7 5.0 1.4 2.0 3.3 1.3 0.8 1.014-C1 NP_909820 Putative pyruvate dehydrogenase kinase 1 3.00E-67 1.8 5.0 5.7 1.1 0.8 1.3 0.4 0.6 0.95-B12 AK101337 Putative calcium binding EF-hand protein 1.00E-53 2.2 0.7 1.7 4.9 3.0 3.2 0.5 0.5 0.5
Photosynthesis1-G12 Z26595 Triose phosphate/phosphate translocator 7.00E-08 3.8 4.5 3.7 1.5 1.1 0.9 1.3 0.8 0.81-H12 AAM15963 Putative phosphoenolpyruvate carboxylase 5.00E-16 1.1 0.9 1.6 1.8 2.3 2.9 0.4 0.9 0.76-B6 AB007405 Alanine aminotransferase 0.9 1.0 1.4 2.7 1.8 1.3 1.4 1.1 1.112-F9 P12329 Chlorophyll a/b binding protein 1, chloroplast precursor (LHCII type I CAB-1) 4.00E-10 0.3 1.0 1.1 0.5 1.0 1.1 0.6 1.4 1.614-H11 CAA44881 Type III LHCII CAB precursor protein 1.00E-34 0.4 2.8 2.6 0.4 2.9 1.4 1.1 2.8 3.116-B10 AAQ55066 Photosystem II subunit PsbS precursor 2.00E-47 1.7 0.6 0.9 1.9 1.0 1.2 0.3 0.5 0.518-D6 XP_483783 Putative photosystem I reaction centre subunit II, chloroplast precursor 2.00E-24 0.6 0.6 0.4 0.8 0.6 1.0 0.4 0.9 1.6
Other3-F10 BAA04615 Rice homologue of Tat binding protein 6.00E-41 3.1 3.7 3.5 1.5 1.4 1.0 2.6 1.1 1.54-B11 BAD82209 MtN3-like 3.00E-42 3.2 1.1 1.9 4.1 1.6 1.4 0.5 0.5 0.213-C4 ABA95153 Putative transposon protein, En/SPM subclass 2.00E-11 1.1 0.9 0.9 0.9 0.6 1.0 2.0 1.0 0.86-F3 No significant similarity 5.5 6.2 5.4 1.9 1.5 1.0 2.0 1.2 0.42-D3 No significant similarity 2.5 1.6 1.4 1.9 1.3 1.1 1.2 1.3 0.53-C6 No significant similarity 17.3 21.0 16.2 4.1 2.6 1.1 2.0 0.8 1.04-A9 No significant similarity 2.0 2.2 1.9 1.2 1.3 0.8 1.6 0.9 1.55-B1 No significant similarity 0.8 1.5 1.4 1.8 1.7 0.8 3.0 1.7 1.55-B9 No significant similarity 2.0 2.0 1.8 0.9 1.0 0.8 1.0 1.2 1.45-F7 No significant similarity 2.6 2.4 2.8 1.0 3.0 2.1 1.1 0.9 1.15-H11 No significant similarity 0.6 0.3 0.4 0.9 1.3 0.9 0.1 0.2 0.56-A1 No significant similarity 2.2 2.1 1.8 1.1 1.0 1.1 0.9 0.9 0.86-A4 No significant similarity 0.4 0.3 0.3 0.7 0.5 0.9 0.4 0.7 1.36-C3 No significant similarity 7.8 8.7 8.2 2.9 1.7 1.4 2.1 1.2 0.96-E1 No significant similarity 5.3 6.0 4.6 1.9 1.5 1.3 2.1 1.0 0.56-F5 No significant similarity 2.0 0.7 1.4 1.9 3.8 6.4 1.0 4.2 14.16-G9 No significant similarity 4.0 4.5 3.8 1.4 0.9 0.9 2.0 1.7 0.76-H12 No significant similarity 4.7 5.4 3.6 1.6 1.3 0.8 2.0 1.2 0.97-A7 No significant similarity 5.1 1.0 0.7 1.5 1.9 2.5 3.2 0.3 0.9 0.87-A10 No significant similarity 2.6 2.7 2.1 1.0 0.9 0.8 1.4 1.6 1.28-F10 No significant similarity 1.0 1.3 1.2 1.2 1.2 0.8 2.4 2.0 1.710-C4 No significant similarity 1.4 2.5 1.1 1.0 0.6 0.9 2.2 2.0 1.311-F11 No significant similarity 0.6 0.8 1.0 0.5 1.7 1.4 1.0 1.8 2.114-B2 No significant similarity 1.8 0.8 1.9 0.6 0.7 1.1 1.1 0.4 0.515-B6 No significant similarity 0.9 1.6 1.3 0.7 2.0 1.1 1.9 2.5 2.816-B9 No significant similarity 0.6 1.5 1.3 0.6 2.1 1.1 1.5 2.2 2.7
142
regulated in response to MeJA treatment (Schenk et al., 2000). A thionin
gene transcript was induced in response to MeJA and SA treatments, but not
rust infection. Thionin has been shown to be up regulated in response to
MeJA treatment in both barley (Andresen et al., 1992) and Arabidopsis
(Vignutelli et al., 1998), and was also induced in Arabidopsis in response to
the nectrotrophic fungal pathogen Fusarium oxysporum f sp. matthiolae
(Vignutelli et al., 1998). A β-glucosidase was also induced in response to all
three treatments. The cyclic hydroxamic acids 2,4-dihydroxy-1,4-benzoxazin-
3-one (DIBOA) and 2,4-dihydroxy-7-methoxy-1,4-benzoxazin-3-one
(DIMBOA) are secondary metabolites that occur in high abundance as
glucosides in the cereals maize, wheat and rye. Upon pathogen attack, the
hydroxamic acid glucoside is cleaved by β-glucosidase to release a toxic
aglucone that is unstable and decomposes to the reactive benzoxaxolinones,
which are toxic to invading pathogens (Nikus et al., 2001).
Plant aspartic proteinases exhibit antimicrobial activity (Guevara et al., 2001)
and have thus been implicated in plant defence. Recently, an aspartic
proteinase was shown to be induced in potato cultivars in response to
Phytophthora infestans infection (Guevara et al., 2005). The exact role of
aspartic proteinases in defence response is still speculative, and Rodrigo and
coworkers (Rodrigo et al., 1991) reported that the constitutive expression of
aspartic proteinases degrades PR proteins and suggest that these
proteinases might be involved in the turnover of PR proteins as well as the
pathogenesis process itself. Although a UDP-glucose:salicylic acid
glucosyltransferase was up regulated in pearl millet in response to MeJA, SA
and rust, it was only significantly induced in response to SA treatment (more
than two fold induced; P<0.05). This enzyme is capable of forming SA 2-O-β-
D-glucoside (SAG) and glucosyl salicylate (GS) following inoculation of
tobacco leaves with incompatible pathogens (Lee and Raskin, 2005). The
Hessian fly responsive-2 (Hfr-2) gene, which codes for a pore forming toxin-
like protein, was recently identified in wheat (Puthoff et al., 2005), and its
involvement in interactions with insects is supported by experiments
demonstrating its up regulation by both fall armyworm and bird cherry-oat
aphid infestations, but not virus infection. Examination of wheat defence
143
response pathways showed Hfr-2 up regulation following MeJA treatment, and
only slight up regulation in response to SA, abscisic acid and wounding
treatments (Puthoff et al., 2005). Significantly, in this pearl millet microarray
study, Hfr-2 was only induced in response to MeJA sprays, and not SA or rust
treatments. Disease resistance proteins are involved in plant pathogen
recognition and mediating race specific or non-specific race resistance
(Hammond-Kosack and Parker, 2003).
The second group of genes contains genes that are implicated in the oxidative
burst and programmed cell death (Table 4.3). Following the oxidative burst, a
number of antioxidant genes are activated in areas around the site of infection
in order to minimise damage of healthy tissue. These include peroxidases,
catalases, superoxide dismutases and thioredoxins (Table 4.3). Superoxide
dismutase catalyses the first step in the scavenging system of active oxygen
species by disproprionation of the superoxide anion radical to hydrogen
peroxide and molecular oxygen (Kaminaka et al., 1999). Catalases are
hydrogen peroxide scavengers, with peroxidases showing a higher affinity for
hydrogen peroxide (Palatnik et al., 2002). Glutaredoxins are small ubiquitous
proteins of the thioredoxin family, which protect the plant from oxidative
stress. These proteins catalyse dithiol-disulphide exchange reactions or
reduce protein-mixed glutathione disulphides (Rouhier et al., 2005).
Interestingly, some glutaredoxin targets identified include catalases, and
peroxidases, as well as alanine aminotransferase, and heat shock protein
(Rouhier et al., 2005). With the exception of the putative peroxidase, all of
these glutaredoxin targets were induced in response to SA treatment in pearl
millet (Table 4.3).
A number of abiotic stress related genes were differentially regulated in
response to MeJA, SA and/or rust treatment in pearl millet, highlighting the
similarities in response to biotic and abiotic stresses (Table 4.3). Both the
HSP70 gene and a multidrug and toxic compound extrusion (MATE) efflux
protein gene were up regulated in response to SA treatment. A recent study
that employed virus induced gene silencing of the HSP70 gene showed that
this protein is an essential component of the plant defence signal transduction
144
pathway (Kanzaki et al., 2003). Members of the MATE protein family are
putative secondary transporters, unique to plants and microbes, that remove
both toxins and secondary metabolites from the plant cell cytoplasm for
storage in the vacuole (Diener et al., 2001). A dehydration responsive protein
gene, rd22, was induced in pearl millet in response to MeJA and SA
treatment. In Arabidopsis, RD22 mRNA was induced by salt stress, water
deficit and abscisic acid treatment (Yamaguchi-Shinozaki and Shinozaki,
1993). An abscisic acid-, stress-, ripening-induced (ASR2) (Cakir et al., 2003)
protein gene was up regulated in response to all three treatments in pearl
millet.
Three genes involved in secondary metabolism were up regulated in pearl
millet in response to defence signalling molecule or fungal treatment. These
include a farnesyl-pyrophosphate synthetase gene, a serine carboxypeptidase
gene and an S-adenosylmethionine decarboxylase gene. All three of these
genes have previously been implicated to play a role in plant defence
response mechanisms. Farnesyl pyrophosphate synthetase has been shown
to be involved in lesion formation in diseased leaves (Manzano et al., 2004)
and serine carboxypeptidase is a wound inducible gene product (Moura et al.,
2000) that functions in signal transduction components via the brassionsteroid
pathway (Li et al., 2001). S-adenosylmethionine decarboxylase is an
important enzyme in polyamine biosynthesis, and catalyses the
decarboxylation of S-adenosyl methionine (SAM) into decarboxylated SAM
which provides the aminopropyl moiety required for spermidine and spermine
biosynthesis from putresine. Recently, a preliminary link was made between
polyamines and plant defence response where the polyamine spermine was
hypothesised to act as an inducer of PR proteins, and as a trigger for
caspase-like activity and hence HR (Walters, 2003).
Pearl millet defence signalling molecule inducible genes involved in protein
synthesis and signalling that have previously been shown to play roles in plant
defence responses include the transcription factor EREBP1, and a ubiquitin
associated (UBA) protein gene and a calcium EF hand protein gene.
Transcription factor EREBP1 mediates gene expression in response to
145
various pathogens and defence elicitors (Euglem, 2005). The calcium binding
EF hand protein is one of four similar monomers which form a multiprotein
complex calcium dependent protein kinase (CDPK). Pathogen attack cause
perturbations in cellular calcium (Ca2+) levels. CDPKs decode information
contained in the temporal and spatial signals of these Ca2+ signals and bring
about changes in metabolism and gene expression (Harmon et al., 2000).
Verification of gene expression changes
In order to verify differential gene expression levels of genes observed in
cDNA microarray analysis, qRT-PCR was performed for selected genes.
Genes were selected on the basis of their documented involvement in plant
defence response. In this regard, the following genes were chosen for qRT-
PCR analysis in pearl millet: the abiotic stress protein gene ASR2; the
defence related gene encoding β-glucosidase; the Ca EF hand signalling
protein gene; a manganese superoxide dismutase gene whose product is
involved in scavenging radical oxygen species; and a thionin gene, which is
well documented defence response gene. The changes in expression levels
observed using qRT-PCR were similar to or greater than levels obtained by
microarray analysis (Figure 4.7). On the whole, expression trends observed
over time for each of the treatments using microarray analysis were similar to
qRT-PCR expression trends.
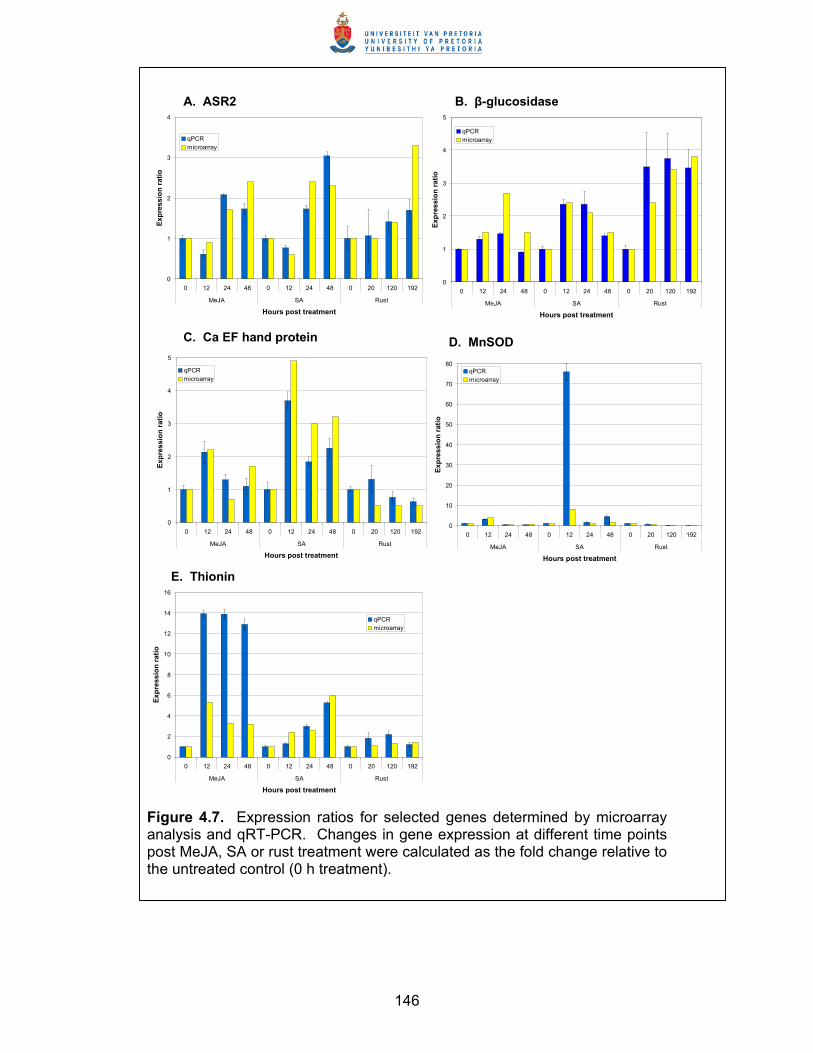
146
Figure 4.7. Expression ratios for selected genes determined by microarray analysis and qRT-PCR. Changes in gene expression at different time points post MeJA, SA or rust treatment were calculated as the fold change relative to the untreated control (0 h treatment).
0
1
2
3
4
0 12 24 48 0 12 24 48 0 20 120 192
MeJA SA Rust
Hours post treatment
Exp
ress
ion
rat
io
qPCRmicroarray
A. ASR2
0
1
2
3
4
5
0 12 24 48 0 12 24 48 0 20 120 192
MeJA SA Rust
Hours post treatment
Exp
ress
ion
rat
io
qPCRmicroarray
B. β-glucosidase
0
1
2
3
4
5
0 12 24 48 0 12 24 48 0 20 120 192
MeJA SA Rust
Hours post treatment
Exp
ress
ion
rat
io
qPCRmicroarray
C. Ca EF hand protein
0
10
20
30
40
50
60
70
80
0 12 24 48 0 12 24 48 0 20 120 192
MeJA SA Rust
Hours post treatment
Exp
ress
ion
rat
io
qPCRmicroarray
D. MnSOD
0
2
4
6
8
10
12
14
16
0 12 24 48 0 12 24 48 0 20 120 192
MeJA SA Rust
Hours post treatment
Exp
ress
ion
rat
io
qPCRmicroarray
E. Thionin
147
Characterisation of pearl millet’s response to rust infection
Evidence from Arabidopsis studies suggests that defence against biotrophic
pathogens is mounted via the SA defence signalling pathway, whereas
resistance to nectrotrophic pathogens and insect attack is elicited through the
jasmonic acid/ethylene signalling pathway (Murray et al., 2002). Infection of
pearl millet plants with a compatible biotrophic rust pathogen, P. substriata,
and subsequent microarray analysis suggested that pearl millet responds to
this biotrophic pathogen by inducing genes from both the SA and jasmonic
acid signalling pathways (Figure 4.6). In order to ascertain if pearl millet’s
response to a compatible rust infection was more similar to one of the defence
signalling pathways, cDNA expression ratios in response to MeJA, SA and
rust treatment were clustered, and a tree was built using an average-linkage
algorithm (Saeed et al., 2003). Figure 4.8 shows that over time, pearl millet
gene expression changes in response to MeJA and SA treatments are more
similar to each other, than either treatment is to gene expression changes
following the compatible rust infection. These results suggest that the plant
adopts elements from a number of defence signalling pathways in an attempt
to ward off attack by a virulent P. substriata isolate. Zhu-Salzman and
colleagues (2004) also showed that when sorghum is attacked by a phloem-
feeding greenbug aphid, the plant activates both JA and SA regulated genes,
as well as genes outside known wounding and SA signalling pathways.
These results all suggest that defence signalling in monocotyledonous plants
is complex. Whilst pathogen attack may result in the induction of a number of
defence signalling pathways, a single defence signalling pathway may be
responsible for resistance to an avirulent pathogen. It is possible that virulent
pathogens have evolved mechanisms to avoid induction of all the elements of
the signalling pathway conferring resistance (Zhu-Salzman et al., 2004).
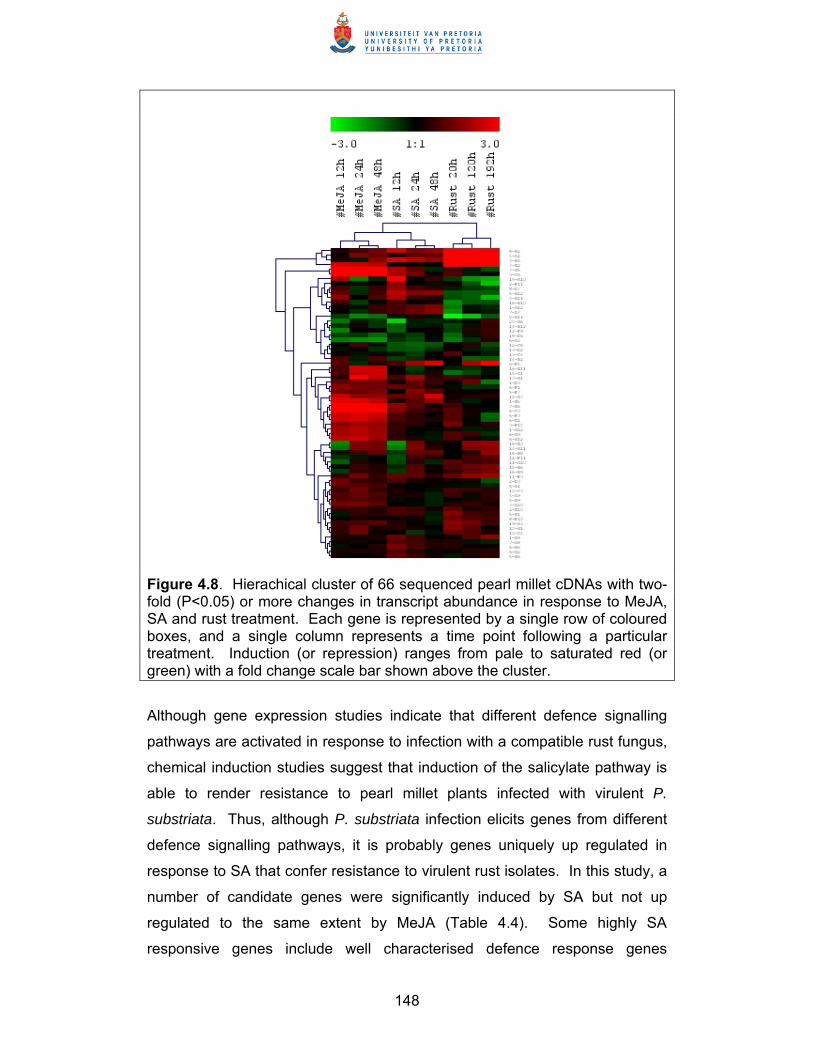
148
Figure 4.8. Hierachical cluster of 66 sequenced pearl millet cDNAs with two-fold (P<0.05) or more changes in transcript abundance in response to MeJA, SA and rust treatment. Each gene is represented by a single row of coloured boxes, and a single column represents a time point following a particular treatment. Induction (or repression) ranges from pale to saturated red (or green) with a fold change scale bar shown above the cluster.
Although gene expression studies indicate that different defence signalling
pathways are activated in response to infection with a compatible rust fungus,
chemical induction studies suggest that induction of the salicylate pathway is
able to render resistance to pearl millet plants infected with virulent P.
substriata. Thus, although P. substriata infection elicits genes from different
defence signalling pathways, it is probably genes uniquely up regulated in
response to SA that confer resistance to virulent rust isolates. In this study, a
number of candidate genes were significantly induced by SA but not up
regulated to the same extent by MeJA (Table 4.4). Some highly SA
responsive genes include well characterised defence response genes
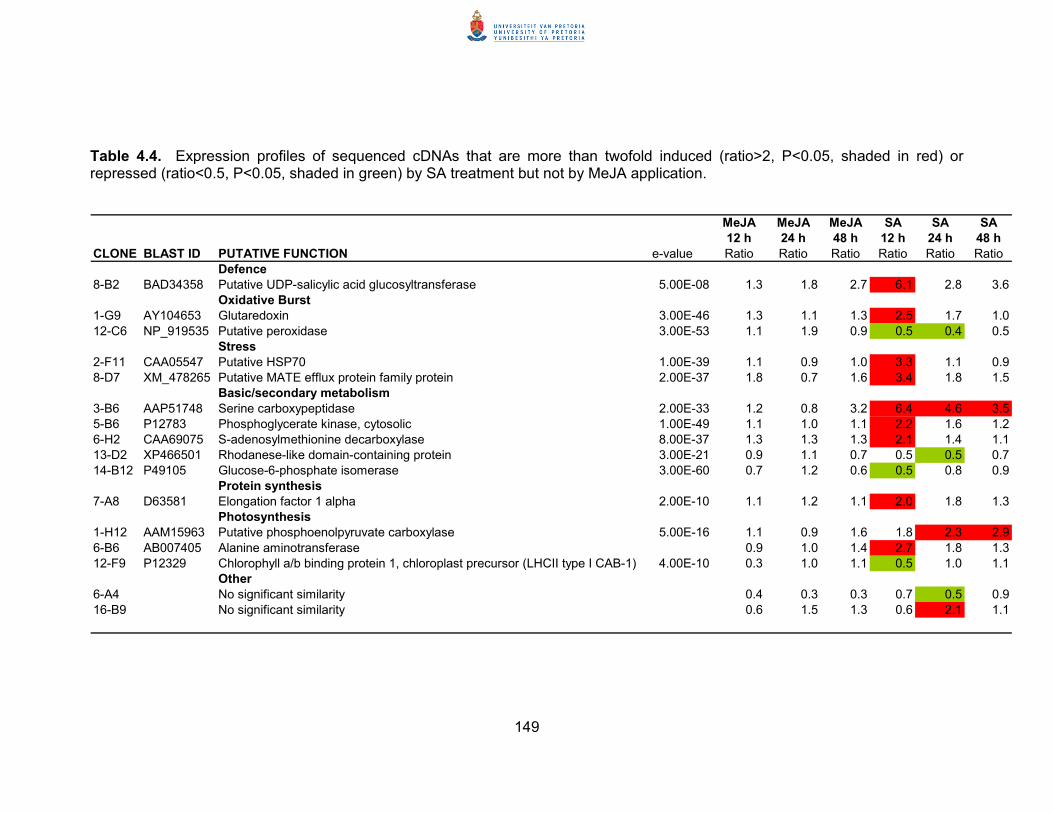
149
Table 4.4. Expression profiles of sequenced cDNAs that are more than twofold induced (ratio>2, P<0.05, shaded in red) or repressed (ratio<0.5, P<0.05, shaded in green) by SA treatment but not by MeJA application.
MeJA MeJA MeJA SA SA SA12 h 24 h 48 h 12 h 24 h 48 h
CLONE BLAST ID PUTATIVE FUNCTION e-value Ratio Ratio Ratio Ratio Ratio RatioDefence
8-B2 BAD34358 Putative UDP-salicylic acid glucosyltransferase 5.00E-08 1.3 1.8 2.7 6.1 2.8 3.6Oxidative Burst
1-G9 AY104653 Glutaredoxin 3.00E-46 1.3 1.1 1.3 2.5 1.7 1.012-C6 NP_919535 Putative peroxidase 3.00E-53 1.1 1.9 0.9 0.5 0.4 0.5
Stress2-F11 CAA05547 Putative HSP70 1.00E-39 1.1 0.9 1.0 3.3 1.1 0.98-D7 XM_478265 Putative MATE efflux protein family protein 2.00E-37 1.8 0.7 1.6 3.4 1.8 1.5
Basic/secondary metabolism3-B6 AAP51748 Serine carboxypeptidase 2.00E-33 1.2 0.8 3.2 6.4 4.6 3.55-B6 P12783 Phosphoglycerate kinase, cytosolic 1.00E-49 1.1 1.0 1.1 2.2 1.6 1.26-H2 CAA69075 S-adenosylmethionine decarboxylase 8.00E-37 1.3 1.3 1.3 2.1 1.4 1.113-D2 XP466501 Rhodanese-like domain-containing protein 3.00E-21 0.9 1.1 0.7 0.5 0.5 0.714-B12 P49105 Glucose-6-phosphate isomerase 3.00E-60 0.7 1.2 0.6 0.5 0.8 0.9
Protein synthesis7-A8 D63581 Elongation factor 1 alpha 2.00E-10 1.1 1.2 1.1 2.0 1.8 1.3
Photosynthesis1-H12 AAM15963 Putative phosphoenolpyruvate carboxylase 5.00E-16 1.1 0.9 1.6 1.8 2.3 2.96-B6 AB007405 Alanine aminotransferase 0.9 1.0 1.4 2.7 1.8 1.312-F9 P12329 Chlorophyll a/b binding protein 1, chloroplast precursor (LHCII type I CAB-1) 4.00E-10 0.3 1.0 1.1 0.5 1.0 1.1
Other6-A4 No significant similarity 0.4 0.3 0.3 0.7 0.5 0.916-B9 No significant similarity 0.6 1.5 1.3 0.6 2.1 1.1
150
encoding glutaredoxin, Mn SOD, HSP70, MATE efflux protein, Ca EF hand
protein (Table 4.3 and Table 4.4). Interestingly, application of SA or its
synthetic mimics protected barley plants systemically against Bgh infection
(Bessert et al., 2000). Chemically induced genes were found to encode a
lipoxygenase, a thionin, and acid phosphatase, a Ca EF hand protein, a
serine proteinase inhibitor, a fatty acid desaturase and several proteins of
unknown function. Except for the Ca EF hand protein and a gene of unknown
function, the genes were also induced by exogenous application of
jasmonates. However, like pearl millet, treatments that raised endogenous
jasmonastes, as well as wounding, were less effective in conferring resistance
to Bgh (Bessert et al., 2000). Treatment of pearl millet plants with an avirulent
P. substriata strain and subsequent microarray analysis would reveal whether
an incompatible reaction elicits more elements of the salicylate defence
response pathway.
Coordination between plant defence response signalling pathways
Many genes were coregulated by MeJA, SA and rust, and the largest number
of coinduced cDNAs in pearl millet were between MeJA and SA (67 cDNAs)
(Figure 4.5). Similar results were obtained in Arabidopsis (Schenk et al.,
2000) and sorghum (Salzman et al., 2005), where coregulation was observed
between MeJA, SA and ethylene signalling pathways, with the highest amount
of coregulation between jasmonate and salicylate pathways. This
contradicts data obtained from Arabidopsis mutants defective in salicylate and
jasmonate signalling pathways in which studies have indicated that the
primary mode of interaction between these signalling pathways is mutual
antagonism (Kunkel and Brooks, 2002). For example, two Arabidopsis
mutants (eds4 and pad4) with reduced levels of SA displayed increased
expression of the JA/ethylene dependent gene PDF1.2 after treatment with
MeJA (Gupta et al., 2000). Conversely, the Arabidopsis mutant mpk4, which
is defective in JA dependent PDF1.2 expression, displayed constitutive
activation of SA dependent signalling (Petersen et al., 2000). Such
antagonism has probably evolved in plants in order to conserve resources by
limiting defence responses to genes effective against biotrophs versus
nectrotrophs or insects (Kunkel and Brooks, 2002; Salzman et al., 2005).
151
However, defence signalling pathway studies in mutants tends to be
reductionist in approach with only one or a few genes examined in isolation.
The emergence of DNA microarrays have helped improve our understanding
of cross-talk between defence signalling pathways as they have created an
opportunity to study the expression of thousands of genes in parallel. Such
studies in Arabidopsis (Schenk et al., 2000), sorghum (Salzman et al., 2005)
and pearl millet suggest substantial coregulation among different plant
defence pathways. Although some antagonism exists, this appears to be
specific to particular genes. Synergism between defence pathways enables
the plant to mount a response that targets several of the pathogen’s virulence
factors or invasion strategies at once.
In conclusion, cDNA microarray analysis of pearl millet exposed to MeJA and
SA enhanced our understanding of transcriptional changes and mechanisms
of action of defence signalling pathways in a non-model cereal crop. Even
though the number of cDNAs analysed represent a subset of the entire pearl
millet defence transcriptome, the results demonstrated that a substantial
network of regulatory interactions exists between the salicylate and jasmonate
pathways, which were previously believed to act in an antagonistic manner.
Infection with the compatible biotrophic rust pathogen, P. substriata, induced
genes common to both the jasmonate and salicylate signalling pathway,
suggesting that pearl millet activates genes from a number of defence
signalling pathways in an attempt to prevent infection by the virulent
pathogen. However, treatment with SA prior to rust infection rendered the
pearl millet plants more resistant to the development of rust symptoms.
These results indicate that it is elements of the salicylate defence pathway
that actually render pearl millet resistant to rust infection.
152
4.5 LITERATURE CITED
Adendorff, R. and F. H. J. Rijkenberg. 2000. Scanning electron microscopy of direct host leaf penetration by urediospore-derived infection structures of Phakopsora apoda. Mycological Research 104:317-324.
Alba, R., Z. Fei, P. Payton, Y. Liu, S. L. Moore, P. Debbie, J. Cohn, M. D'Ascenzo, J. S. Gordon, J. K. C. Rose, G. Martin, S. D. Tanksley, M. Bouzayen, M. M. Jahn, and J. Giovannoni. 2004. ESTs, cDNA microarrays, and gene expression profiling: tools for dissecting plant physiology and development. Plant Journal 39:697-714.
Altschul, S. F., W. Gish, W. Miller, E. W. Myers, and D. Lipman. 1990. Basic local alignment search tool. Journal of Molecular Biology 215:403-410.
Andresen, I., W. Becker, K. Schlüter, J. Burges, B. Parthier, K. Apel, and Z. Adam. 1992. The identification of leaf thionin as one of the main jasmonate-induced proteins of barley (Hordeum vulgare). Plant Molecular Biology 19:193-204.
Beckett, A., J. A. Tatnell, and N. Taylor. 1990. Adhesion and pre-invasion behaviour of urediniospores of Uromyces viciae-fabae during germination on host ans synthetic surfaces. Mycological Research 94:865-875.
Bessert, K., B. Jarosch, G. Langen, and K.-H. Kogel. 2000. Expression analysis of genes induced in barley after chemical activation reveals distinct disease resistance pathways. Molecular Plant Pathology 1:277-286.
Cakir, B., A. Agasse, C. Gaillard, A. Saumonneau, S. Delrot, and R. Atanassova. 2003. A grape ASR protein involved in sugar and abscisic acid signaling. Plant Cell 15:2165-2180.
Diener, A. C., R. A. Gaxiola, and G. R. Fink. 2001. Arabidopsis ALF5, a multidrug efflux transporter gene family member, confers resistance to toxins. Plant Cell 12:1625-1638.
Euglem, T. 2005. Regulation of the Arabidopsis defense transcriptome. Trends in Plant Science.
Freytag, S. and K. Mendgen. 1991. Carbohydrates on the surface of urediniospore- and basidiospore-derived infection structures of heteroecious and autoecious rust fungi. New Phytologist 119:527-534.
Girgi, M., W. A. Breese, H. Lörz, and K. H. Oldach. Transgenic Research, in press.
Glazebrook, J., W. Chen, B. Estes, H.-S. Chang, C. Nawrath, J.-P. Métraux, T. Zhu, and F. Katagiri. 2003. Topology of the network integrating salicylate and jasmonate signal transduction derived from global expression phenotyping. Plant Journal 24:217-228.
Guevara, M. G., C. Almeida, J. R. Mendieta, C. J. Faro, P. Verissimo, E. Vieyras Pires, and G. R. Daleo. 2005. Molecular cloning of a potato leaf cDNA encoding an aspartic protease (StAsp) and its expression after P. infestans infection. Plant Physiology and Biochemistry 43:882-889.
Guevara, M. G., C. R. Oliva, M. Huarte, and G. R. Daleo. 2001. An aspartic protease with antimicrobial activity is induced after infection and wounding in intercelullar fluids of potato tubers. European Journal of Plant Pathology 108:131-137.
Gupta, V., M. G. Willits, and J. Glazebrook. 2000. Arabidopsis thaliana EDS4 contributes to salicylic acid (SA)-dependent expression of defense responses: evidence for inhibition of jasmonic acid signaling by SA. Molecular Plant-Microbe Interactions 13:503-511.
153
Hammond-Kosack, K. E. and J. E. Parker. 2003. Deciphering plant-pathogen communication: fresh perspectives for molecular resistance breeding. Current Opinion in Biotechnology 14:177-193.
Harmon, A. C., M. Gribskov, and J. F. Harper. 2000. CDPKs - a kinase for every Ca2+ signal? Trends in Plant Science 5:154-159.
Hoagland, D. R. and D. I. Arnon. 1950. The water culture method of growing plants without soil. California Agricultural Experiment Station Circular 347.
Kaminaka, H., H. Yokoi, Y. Nosaka, A. Sakamoto, S. Morita, T. Masumura, and K. Tanaka. 1999. Cloning and characterisation of manganese-superoxide dismutase gene from rice. Plant Physiology 121:1057.
Kanzaki, H., H. Saitoh, A. Ito, S. Fujisawa, S. Kamoun, S. Katou, H. Yoshioka, and R. Terauchi. 2003. Cytosolic HSP90 and HSP70 are essential components of INF1-mediated hypersensitive response and non-host resistance to Pseudomonas cichorii in Nicotiana benthamiana. Molecular Plant Pathology 4:383-391.
Kerr, M. and G. Churchill. 2001. Experimental design for gene expression microarrays. Biostatistics 2:183-201.
Kunkel, B. N. and D. M. Brooks. 2002. Cross talk between signaling pathways in pathogen defense. Current Opinion in Plant Biology 5:325-331.
Larous, L. and D. M. Losel. 1993. Vascular infection by Puccinia methae and other rust fungi. Mycological Research 97:409-414.
Lee, H. and I. Raskin. 2005. Purification, cloning and expression of a pathogen inducible UDP-glucose:salicylic acid glucosyltransferase from tobacco. Journal of Biological Chemistry 274:36637.
Li, J., K. A. Lease, F. E. Tax, and J. C. Walker. 2001. BRS1, a serine carboxypeptidase regulates BRI1 signaling in Arabidopsis thaliana. Proceedings of the National Academy of Science USA 98:5916-5921.
Maleck, K., A. Levine, T. Eulgem, A. Morgan, J. Schmid, K. A. Lawton, J. L. Dangl, and R. A. Dietrich. 2000. The transcriptome of Arabidopsis thaliana during systemic acquired resistance. Nature Genetics 26:403-410.
Manzano, D., X. Fernandez-Busquets, H. Schaller, V. Gonzalez, A. Boronat, M. Arro, and A. Gerrer. 2004. The metabolic imbalance underlying lesion formation in Arabidopsis thaliana overexpressing farnesyl diphosphate synthase (isoform 1S) leads to oxidative stress and is triggered by the developmental decline of endogenous HMGR activity. Planta 219:982-992.
Morris, S. W., B. Vernooij, S. Titatarn, M. Starrett, S. Thomas, C. C. Wiltse, R. A. Frederiksen, A. Bhandhufalck, S. Hulbert, and S. Uknes. 1998. Induced resistance responses in maize. Molecular Plant Microbe Interactions 11:643-658.
Moura, D. S., D. R. Bergey, and C. A. Ryan. 2000. Characterization and localization of a wound-inducible type I serine-carboxypeptidase from leaves of tomato plants (Lycopersicon esculentum Mill.). Planta 212:222-230.
Murashige, T. and F. Skoog. 1962. A revised medium for rapid growth and bioassays with tobacco tissue cultures. Physiologia Plantarum 15:473-497.
Murray, S. L., K. J. Denby, D. K. Berger, and G. J. Loake. 2002. Disease signalling in Arabidopsis: applications in the study of plant pathology in South Africa. South African Journal of Science 98:161-165.
154
Nikus, J., G. Daniel, and L. M. V. Jonsson. 2001. Subcellular localization of â-glucosidase in rye, maize and wheat seedlings. Plant Physiology 111:466-472.
Palatnik, J. F., E. M. Valle, M. L. Federico, L. D. Gomez, M. N. Melchiorre, A. Diaz Paleo, N. Carrillo, and A. Acevedo. 2002. Status of antioxidant metabolites and enzymes in a catalase-deficient mutant of barley (Hordeum vulgare L.). Plant Science 162:363-371.
Petersen, M., P. Brodersen, H. Naested, E. Andreasson, U. Lindhart, B. Johansen, H. B. Nielsen, M. Lacy, M. J. Austin, J. E. Parker, S. B. Sharma, D. F. Klessig, R. Nartienssen, O. Mattsson, A. B. Jensen, and J. Mundy. 2000. Arabidopsis MAP kinase 4 negatively regulates systemic acquired resistance. Cell 103:1111-1120.
Puthoff, D. P., N. Sardesai, S. Subramanyam, J. A. Nemacheck, and C. E. Williams. 2005. Hfr-2, a wheat cytolytic toxin-like gene, is upregulated by virulent Hessian fly larval feeding. Molecular Plant Pathology 6:411-423.
Rodrigo, I., P. Vera, and L. C. Van Loon. 1991. Degradation of tobacco pathogenesis related proteins. Plant Physiology 95:616-622.
Rouhier, N., A. Villarejo, M. Srivastava, E. Gelhaye, O. Keech, M. Droux, I. Finkemeir, G. Samuelsson, K. J. Dietz, J. P. Jacquot, and G. Wingsle. 2005. Identification of plant glutaredoxin targets. Antioxidant Redox Signalling 7:919-929.
Saeed, A. I., V. Sharov, J. White, J. Li, W. Liang, N. Bhagabati, J. Braisted, M. Klapa, T. Currier, M. Thiagarajan, A. Sturn, M. Snuffin, A. Rezantsev, D. Popov, A. Ryltsov, E. Kostukovich, I. Borisovsky, Z. Liu, A. Vinsavich, V. Trush, and J. Quackenbush. 2003. TM4: A free, open-source system for microarray data management and analysis. Biotechniques 34:374-378.
Salzman, R. A., J. A. Brady, S. A. Finlayson, C. D. Buchanan, E. J. Summer, F. Sung, P. E. Klein, R. R. Klein, L. H. Pratt, M. Cordonnier-Pratt, and J. E. Mullet. 2005. Transcriptional profiling of sorghum induced by methyl jasmonate, salicylic acid, and aminocyclopropane carboxylic acid reveals cooperative regulation and novel gene responses. Plant Physiology 138:352-368.
Schenk, P. M., K. Kazan, I. Wilson, J. P. Anderson, T. Richmond, S. C. Somerville, and J. M. Manners. 2000. Coordinated plant defense responses in Arabidopsis revealed by microarray analysis. Proceedings of the National Academy of Sciences USA 97:11655-11660.
Singh, S. D., S. B. King, and P. Malla Reddy. 1990. Registration of five pearl millet germplasm sources with stable resistance to downy mildew. Crop Science 30:1164-1165.
Vignutelli, A., C. Wastemack, K. Apel, and H. Bohlmann. 1998. Systemic and local induction of an Arabidopsis thionin gene by wounding and pathogens. Plant Journal 14:285-295.
Walters, D. 2003. Resistance to plant pathogens: possible roles for free polyamines and polyamine catabolism. New Phytologist 159:109.
Ward, E. R., S. J. Uknes, S. C. Williams, S. S. Dincher, D. L. Wiederhold, D. C. Alexander, P. Ahlgoy, J. P. Metraux, and J. A. Ryals. 1991. Coordinate gene activity in response to agents that induce systemic acquired-resistance. Plant Cell 3:1085-1094.
Yamaguchi-Shinozaki, K. and K. Shinozaki. 1993. The plant hormone abscisic acid mediates the drought-induced expression but not the seed-specific expression of rd22, a gene responsive to dehydration stress in Arabidopsis thaliana. Molecular and General Genetics 238:17-25.
Yang, Y. and T. Speed. 2002. Design issues for cDNA microarray experiments. Nature Review in Genetics 3:579-588.

155
Zhu-Salzman, K., R. A. Salzman, J.-E. Ahn, and H. Koiwa. 2004. Transcriptional regulation of sorghum defense determinants against a phloem-feeding aphid. Plant Physiology 134:420-431.
156
Chapter 5
Concluding remarks and future prospects
Pearl millet is the world’s sixth most important cereal crop (National Research
Council, 1996), and is a staple food source for millions of African families
living in semi-arid regions of the continent. Yet, despite its importance and
ability to yield consistently, especially in extreme heat and drought conditions,
very little research and resources have been directed towards understanding
mechanisms governing this crop’s resilience to biotic and abiotic stresses.
The research outlined in this thesis therefore aimed to elucidate defence
response mechanisms in pearl millet, and to identify broad spectrum defence
response genes that could be used in future genetic engineering experiments
to improve pearl millet and other cereal crops against pathogen attack. This
was accomplished through the construction and characterisation of a pearl
millet defence response cDNA library, which was subsequently utilised in
large scale gene expression studies to profile pearl millet’s response to the
defence signalling compounds nitric oxide, methyl jasmonate and salicylic
acid, and to the biotrophic rust fungus Puccinia substriata var. indica.
At the onset of this study, very little gene sequence information was available
for pearl millet. As a result, a pearl millet defence response cDNA library was
constructed and characterised. This was accomplished by treating pearl millet
plants with the fungal and bacterial defence elicitors chitin and flagellin,
respectively, and wounding the plants. Following RNA extraction and cDNA
synthesis, the cDNA was enriched for defence response transcripts by
employing suppression subtractive hybridisation (SSH) (Diatchenko et al.,
1996). A forward and reverse library was constructed to identify genes which
are up- or down regulated during the defence response, respectively. In an
effort to characterise the cDNA libraries, a quantitative cDNA microarray-
based screening method was developed that enabled identification of false
positive transcripts, as well as clones which represented rare or abundant
transcripts. Based on this screening method, a number of clones were
selected for sequence analysis, and their identity ascertained through
157
homology searches with previously sequenced genes. This revealed a
number of genes known to play important roles during pathogen attack.
The pearl millet defence response library, consisting of 1920 cDNAs either up-
or down regulated in defence response, was spotted onto a glass slide
microarray and used in transcript profiling studies to examine pearl millet’s
response to the defence signalling molecules NO, MeJA and SA. Whilst only
45 cDNAs responded significantly to NO treatment, 279 and 224 cDNAs
responded to MeJA and SA sprays, respectively. Table 5.1 summarises all
sequenced genes which exhibited differential expression in response to
pathogen elicitors, NO, MeJA, SA and rust infection. Closer examination of
MeJA and SA responsive genes revealed that many of the induced transcripts
were common to both signalling pathways, demonstrating that a substantial
network of regulatory interactions exists between the salicylate and jasmonate
pathways, which were previously believed to act in an antagonistic manner
(Kunkel and Brooks, 2002).
Pathology studies indicated that pretreatment of pearl millet with SA conferred
resistance to a virulent isolate of the biotrophic rust, P. substriata var. indica,
whereas MeJA did not significantly reduce infection levels. Transcript profiling
of a susceptible pearl millet cultivar in response to infection with rust revealed
that genes common to both the jasmonate and salicylate pathways were
induced, suggesting that pearl millet has evolved its defence responses by
adopting elements from both pathways in an attempt to prevent infection by
the virulent pathogen. However, as implied from chemical induction and
subsequent pathology studies, it is probably the salicylate defence signalling
pathway that confers resistance to avirulent rust isolates. Treatment of pearl
millet plants with an avirulent P. substriata strain and subsequent microarray
analysis would reveal whether an incompatible reaction elicits more elements
of the salicylate defence response pathway.
Sequence analysis of pearl millet cDNAs responsive to chitin, flagellin,
wounding, NO, MeJA, SA and rust infection revealed genes with homology to
genes coding for previously characterised defence-related proteins such as
158
aspartic proteinase, pathogenesis related protein 1, β-glucosidase, thionin, a
receptor-like kinase, a putative disease resistance protein, glutaredoxin,
peroxidase, catalase, manganese superoxide dismutase, HSP70,
transcription factor EREBP1, and a calcium binding EF hand protein (See
Table 5.1). However, a number of cDNAs exhibited no similarity to genes in
the GenBank database. These cDNAs could encode novel defence response
genes that have not been previously characterised. Studies are presently
underway to characterise the role of some of these genes in defence in pearl
millet through virus induced gene silencing (VIGS). In VIGS, viruses
engineered to carry sequences derived from plant gene transcripts activate
the host’s sequence-specific RNA degradation system. This mechanism
targets the RNAs of the viral genome for degradation, and as the virus
contains transcribed plant sequence, homologous host mRNAs are also
targeted for destruction (Scofield et al., 2005). VIGS has been successfully
applied to examine components of the defence response system in both
barley (Hein et al., 2005) and wheat (Scofield et al., 2005).
Broad spectrum disease resistance genes, exhibiting up regulation under a
number of defence conditions tested, could also be introduced into pearl millet
to convey resistance to a number of pathogens (Gurr and Rushton, 2005).
Good examples of such genes identified in this study which are up regulated
in both jasmonate and salicylate defence signalling include genes coding for
thionin, catalase, putative dehydration-responsive protein RD22, ASR2,
calcium binding EF hand protein. Receptor-like kinases, such as the
Arabidopsis FLS2, which controls perception of a portion of the highly
conserved bacterial flagellin protein, are excellent candidates for genetic
engineering resistance to a broad range of pathogens (Hammond-Kosack and
Parker, 2003). This study identified a pearl millet receptor-like kinase gene
(clone 4-E8), which was induced in response to chitin and/or flagellin. The
Arabidopsis thaliana homologue of this gene (AAM20287) has been
annotated, but not characterised. In pearl millet, this receptor-like kinase
appears to play a role in chitin or flagellin perception as it is not up regulated
under other defence inducing conditions such as NO, MeJA, SA or rust
treatment (See Table 5.1). Further characterisation of this gene through
159
studies such as VIGS might reveal a candidate gene for improved resistance
to a particular pathogen group (e.g. fungi or bacteria) in pearl millet.
Successful transformation of pearl millet has recently been achieved (Girgi et
al., 2002), providing opportunities to enhance the gene pool of this crop
regarded as an African jewel (National Research Council, 1996). However, to
minimise the cost of defence activation on plant yield a new repertoire of
pathogen promoters is required (Gurr and Rushton, 2005). Defence inducible
genes identified in this investigation will provide a novel source of material for
promoter mining studies.
The main constraint in the study was that the pearl millet SSH cDNA library
does not represent all pearl millet defence response genes. The cDNA library
contains only copies of transcripts of genes expressed in the material from
which the mRNA was extracted. Therefore, if the defence signalling
molecules NO, MeJA and SA, or the rust fungus induce or repress the
expression of genes whose expression is unaffected in the basal defence
responses against wounding or elicitor treatment, then this will not be
discovered, as these genes are not present in the SSH library and therefore
the microarray.
In conclusion, this study has yielded significant insight into defence response
mechanisms in pearl millet. At the onset of the project we hypothesised that
treatment of monocots with pathogen elicitors and defence signalling
molecules would result in differential expression of defence related genes.
Results from this study suggest that many previously characterised defence
genes are up regulated in response to elicitor treatment, defence signalling
molecules and pathogen infection. In addition, a number of genes previously
shown to be involved in the oxidative burst, stress, basic and secondary
metabolism, protein synthesis, photosynthesis and signalling exhibit
differential expression under defence inducing conditions. Furthermore, a
number of genes with no homology to sequences in the Genbank were up
regulated during defence inducing conditions
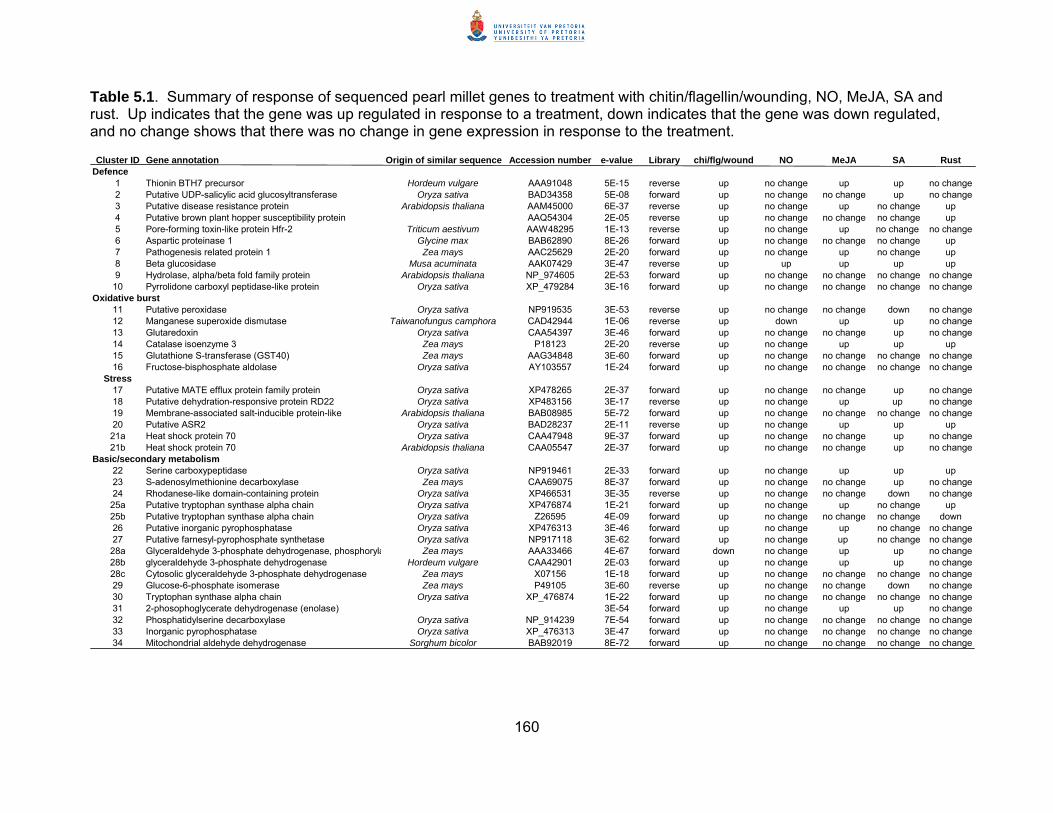
160
Table 5.1. Summary of response of sequenced pearl millet genes to treatment with chitin/flagellin/wounding, NO, MeJA, SA and rust. Up indicates that the gene was up regulated in response to a treatment, down indicates that the gene was down regulated, and no change shows that there was no change in gene expression in response to the treatment.
Cluster ID Gene annotation Origin of similar sequence Accession number e-value Library chi/flg/wound NO MeJA SA RustDefence
1 Thionin BTH7 precursor Hordeum vulgare AAA91048 5E-15 reverse up no change up up no change2 Putative UDP-salicylic acid glucosyltransferase Oryza sativa BAD34358 5E-08 forward up no change no change up no change3 Putative disease resistance protein Arabidopsis thaliana AAM45000 6E-37 reverse up no change up no change up4 Putative brown plant hopper susceptibility protein AAQ54304 2E-05 reverse up no change no change no change up5 Pore-forming toxin-like protein Hfr-2 Triticum aestivum AAW48295 1E-13 reverse up no change up no change no change6 Aspartic proteinase 1 Glycine max BAB62890 8E-26 forward up no change no change no change up7 Pathogenesis related protein 1 Zea mays AAC25629 2E-20 forward up no change up no change up8 Beta glucosidase Musa acuminata AAK07429 3E-47 reverse up up up up up9 Hydrolase, alpha/beta fold family protein Arabidopsis thaliana NP_974605 2E-53 forward up no change no change no change no change10 Pyrrolidone carboxyl peptidase-like protein Oryza sativa XP_479284 3E-16 forward up no change no change no change no change
Oxidative burst11 Putative peroxidase Oryza sativa NP919535 3E-53 reverse up no change no change down no change12 Manganese superoxide dismutase Taiwanofungus camphora CAD42944 1E-06 reverse up down up up no change13 Glutaredoxin Oryza sativa CAA54397 3E-46 forward up no change no change up no change14 Catalase isoenzyme 3 Zea mays P18123 2E-20 reverse up no change up up up15 Glutathione S-transferase (GST40) Zea mays AAG34848 3E-60 forward up no change no change no change no change16 Fructose-bisphosphate aldolase Oryza sativa AY103557 1E-24 forward up no change no change no change no change
Stress17 Putative MATE efflux protein family protein Oryza sativa XP478265 2E-37 forward up no change no change up no change18 Putative dehydration-responsive protein RD22 Oryza sativa XP483156 3E-17 reverse up no change up up no change19 Membrane-associated salt-inducible protein-like Arabidopsis thaliana BAB08985 5E-72 forward up no change no change no change no change20 Putative ASR2 Oryza sativa BAD28237 2E-11 reverse up no change up up up21a Heat shock protein 70 Oryza sativa CAA47948 9E-37 forward up no change no change up no change21b Heat shock protein 70 Arabidopsis thaliana CAA05547 2E-37 forward up no change no change up no change
Basic/secondary metabolism22 Serine carboxypeptidase Oryza sativa NP919461 2E-33 forward up no change up up up23 S-adenosylmethionine decarboxylase Zea mays CAA69075 8E-37 forward up no change no change up no change24 Rhodanese-like domain-containing protein Oryza sativa XP466531 3E-35 reverse up no change no change down no change25a Putative tryptophan synthase alpha chain Oryza sativa XP476874 1E-21 forward up no change up no change up25b Putative tryptophan synthase alpha chain Oryza sativa Z26595 4E-09 forward up no change no change no change down26 Putative inorganic pyrophosphatase Oryza sativa XP476313 3E-46 forward up no change up no change no change27 Putative farnesyl-pyrophosphate synthetase Oryza sativa NP917118 3E-62 forward up no change up no change no change28a Glyceraldehyde 3-phosphate dehydrogenase, phosphoryla Zea mays AAA33466 4E-67 forward down no change up up no change28b glyceraldehyde 3-phosphate dehydrogenase Hordeum vulgare CAA42901 2E-03 forward up no change up up no change28c Cytosolic glyceraldehyde 3-phosphate dehydrogenase Zea mays X07156 1E-18 forward up no change no change no change no change29 Glucose-6-phosphate isomerase Zea mays P49105 3E-60 reverse up no change no change down no change30 Tryptophan synthase alpha chain Oryza sativa XP_476874 1E-22 forward up no change no change no change no change31 2-phosophoglycerate dehydrogenase (enolase) 3E-54 forward up no change up up no change32 Phosphatidylserine decarboxylase Oryza sativa NP_914239 7E-54 forward up no change no change no change no change33 Inorganic pyrophosphatase Oryza sativa XP_476313 3E-47 forward up no change no change no change no change34 Mitochondrial aldehyde dehydrogenase Sorghum bicolor BAB92019 8E-72 forward up no change no change no change no change
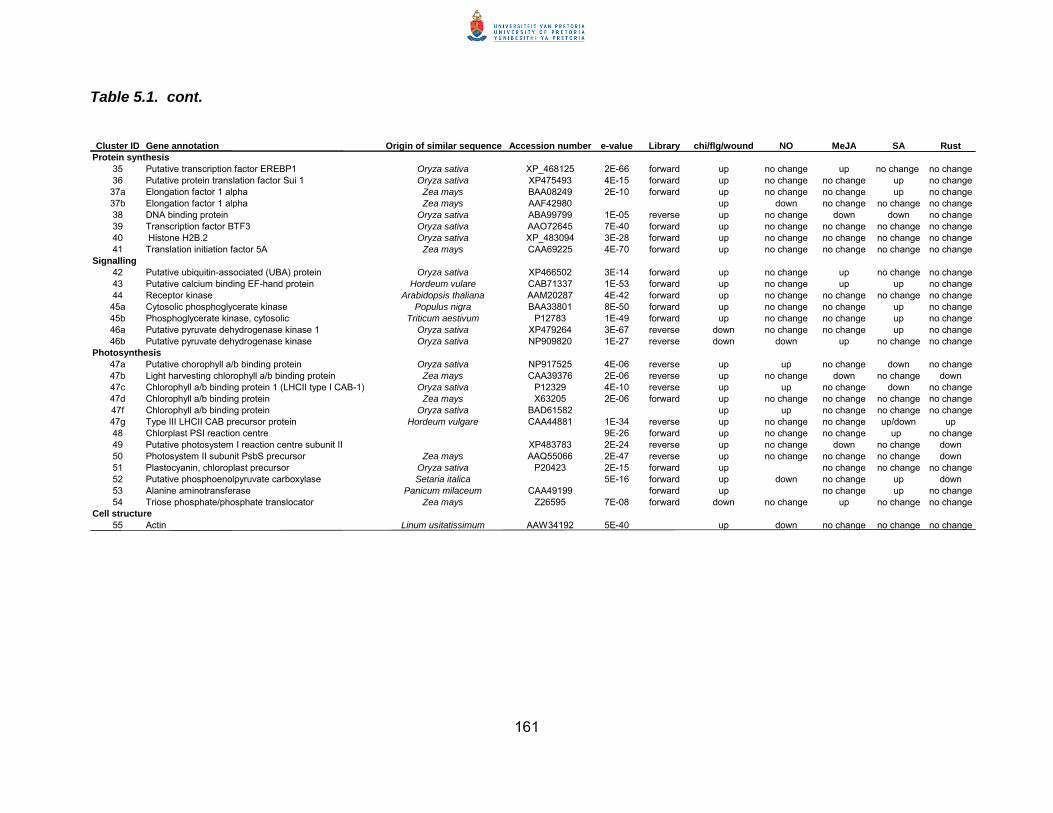
161
Table 5.1. cont.
Cluster ID Gene annotation Origin of similar sequence Accession number e-value Library chi/flg/wound NO MeJA SA RustProtein synthesis
35 Putative transcription factor EREBP1 Oryza sativa XP_468125 2E-66 forward up no change up no change no change36 Putative protein translation factor Sui 1 Oryza sativa XP475493 4E-15 forward up no change no change up no change37a Elongation factor 1 alpha Zea mays BAA08249 2E-10 forward up no change no change up no change37b Elongation factor 1 alpha Zea mays AAF42980 up down no change no change no change38 DNA binding protein Oryza sativa ABA99799 1E-05 reverse up no change down down no change39 Transcription factor BTF3 Oryza sativa AAO72645 7E-40 forward up no change no change no change no change40 Histone H2B.2 Oryza sativa XP_483094 3E-28 forward up no change no change no change no change41 Translation initiation factor 5A Zea mays CAA69225 4E-70 forward up no change no change no change no change
Signalling42 Putative ubiquitin-associated (UBA) protein Oryza sativa XP466502 3E-14 forward up no change up no change no change43 Putative calcium binding EF-hand protein Hordeum vulare CAB71337 1E-53 forward up no change up up no change44 Receptor kinase Arabidopsis thaliana AAM20287 4E-42 forward up no change no change no change no change45a Cytosolic phosphoglycerate kinase Populus nigra BAA33801 8E-50 forward up no change no change up no change45b Phosphoglycerate kinase, cytosolic Triticum aestivum P12783 1E-49 forward up no change no change up no change46a Putative pyruvate dehydrogenase kinase 1 Oryza sativa XP479264 3E-67 reverse down no change no change up no change46b Putative pyruvate dehydrogenase kinase Oryza sativa NP909820 1E-27 reverse down down up no change no change
Photosynthesis47a Putative chorophyll a/b binding protein Oryza sativa NP917525 4E-06 reverse up up no change down no change47b Light harvesting chlorophyll a/b binding protein Zea mays CAA39376 2E-06 reverse up no change down no change down47c Chlorophyll a/b binding protein 1 (LHCII type I CAB-1) Oryza sativa P12329 4E-10 reverse up up no change down no change47d Chlorophyll a/b binding protein Zea mays X63205 2E-06 forward up no change no change no change no change47f Chlorophyll a/b binding protein Oryza sativa BAD61582 up up no change no change no change47g Type III LHCII CAB precursor protein Hordeum vulgare CAA44881 1E-34 reverse up no change no change up/down up48 Chlorplast PSI reaction centre 9E-26 forward up no change no change up no change49 Putative photosystem I reaction centre subunit II XP483783 2E-24 reverse up no change down no change down50 Photosystem II subunit PsbS precursor Zea mays AAQ55066 2E-47 reverse up no change no change no change down51 Plastocyanin, chloroplast precursor Oryza sativa P20423 2E-15 forward up no change no change no change52 Putative phosphoenolpyruvate carboxylase Setaria italica 5E-16 forward up down no change up down53 Alanine aminotransferase Panicum milaceum CAA49199 forward up no change up no change54 Triose phosphate/phosphate translocator Zea mays Z26595 7E-08 forward down no change up no change no change
Cell structure55 Actin Linum usitatissimum AAW34192 5E-40 up down no change no change no change
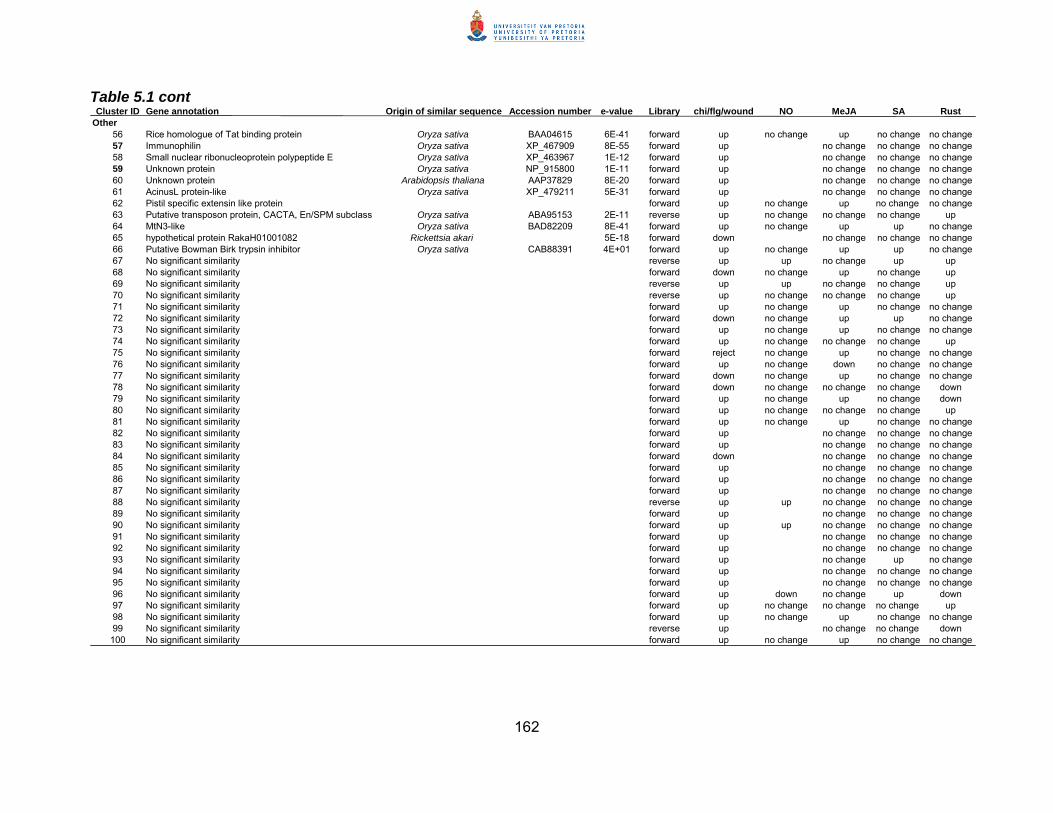
162
Table 5.1 cont Cluster ID Gene annotation Origin of similar sequence Accession number e-value Library chi/flg/wound NO MeJA SA Rust
Other56 Rice homologue of Tat binding protein Oryza sativa BAA04615 6E-41 forward up no change up no change no change57 Immunophilin Oryza sativa XP_467909 8E-55 forward up no change no change no change58 Small nuclear ribonucleoprotein polypeptide E Oryza sativa XP_463967 1E-12 forward up no change no change no change59 Unknown protein Oryza sativa NP_915800 1E-11 forward up no change no change no change60 Unknown protein Arabidopsis thaliana AAP37829 8E-20 forward up no change no change no change61 AcinusL protein-like Oryza sativa XP_479211 5E-31 forward up no change no change no change62 Pistil specific extensin like protein forward up no change up no change no change63 Putative transposon protein, CACTA, En/SPM subclass Oryza sativa ABA95153 2E-11 reverse up no change no change no change up64 MtN3-like Oryza sativa BAD82209 8E-41 forward up no change up up no change65 hypothetical protein RakaH01001082 Rickettsia akari 5E-18 forward down no change no change no change66 Putative Bowman Birk trypsin inhibitor Oryza sativa CAB88391 4E+01 forward up no change up up no change67 No significant similarity reverse up up no change up up68 No significant similarity forward down no change up no change up69 No significant similarity reverse up up no change no change up70 No significant similarity reverse up no change no change no change up71 No significant similarity forward up no change up no change no change72 No significant similarity forward down no change up up no change73 No significant similarity forward up no change up no change no change74 No significant similarity forward up no change no change no change up75 No significant similarity forward reject no change up no change no change76 No significant similarity forward up no change down no change no change77 No significant similarity forward down no change up no change no change78 No significant similarity forward down no change no change no change down79 No significant similarity forward up no change up no change down80 No significant similarity forward up no change no change no change up81 No significant similarity forward up no change up no change no change82 No significant similarity forward up no change no change no change83 No significant similarity forward up no change no change no change84 No significant similarity forward down no change no change no change85 No significant similarity forward up no change no change no change86 No significant similarity forward up no change no change no change87 No significant similarity forward up no change no change no change88 No significant similarity reverse up up no change no change no change89 No significant similarity forward up no change no change no change90 No significant similarity forward up up no change no change no change91 No significant similarity forward up no change no change no change92 No significant similarity forward up no change no change no change93 No significant similarity forward up no change up no change94 No significant similarity forward up no change no change no change95 No significant similarity forward up no change no change no change96 No significant similarity forward up down no change up down97 No significant similarity forward up no change no change no change up98 No significant similarity forward up no change up no change no change99 No significant similarity reverse up no change no change down100 No significant similarity forward up no change up no change no change
160
Literature cited
Diatchenko, L., Y.-F. C. Lau, A. P. Campbell, A. Chenchik, F. Moqadam, B. Huang, S. Lukyanov, K. Lukyanov, N. Gurskaya, E. D. Sverdlov, and P. D. Siebert. 1996. Suppression subtractive hybridization: a method for generating differentially regulated or tissue-specific cDNA probes and libraries. Proceedings of the National Academy of Sciences, USA 93:6025-6030.
Girgi, M., M. M. O'Kennedy, A. Morgenstern, G. Smith, H. Lörz, and K. H. Oldach. 2002. Transgenic and herbicide resistant pearl millet (Pennisetum glaucum L.) R.Br. via microprojectile bombardment of scutellar tissue. Molecular Breeding 10:243-252.
Gurr, S. J. and P. J. Rushton. 2005. Engineering plants with increased disease resistance: how are we going to express it? Trends in Biotechnology 23:283-290.
Hammond-Kosack, K. E. and J. E. Parker. 2003. Deciphering plant-pathogen communication: fresh perspectives for molecular resistance breeding. Current Opinion in Biotechnology 14:177-193.
Hein, I., M. Barciszewska-Pacak, K. Hrubikova, S. Williamson, M. Dinesen, I. E. Soenderby, S. Sundar, A. Jarmolowski, K. Shirasu, and C. Lacomme. 2005. Virus-induced gene silencing-based functional characterization of genes associated with powdery mildew resistance in barley. Plant Physiology 138:2155-2164.
Kunkel, B. N. and D. M. Brooks. 2002. Cross talk between signaling pathways in pathogen defense. Current Opinion in Plant Biology 5:325-331.
National Research Council. 1996. Lost crops of Africa. Volume 1: Grains. National Academy Press, Washington D.C.
Scofield, S. R., L. Huang, A. S. Brandt, and B. S. Gill. 2005. Development of a virus-induced gene-silencing system for hexaploid wheat and its use in functional analysis of the Lr21-mediated leaf rust resistance pathway. Plant Physiology 138:2165-2173.


![Sorghum & Pearl Millet in Zambia: Production Guide, [2006]](https://img.pdfslide.us/doc/110x75/6262561bbe717e2c223516cf/sorghum-amp-pearl-millet-in-zambia-production-guide-2006.jpg)