Embed Size (px)
Citation preview
CHAPTER V
MARKETING STRATEGY OF COMMERCIAL BANKS – AN APPRAISAL
CONTENTS
1. Marketing – the Concept
2. Marketing of Banking Services
3. Bank Marketing Objectives
4. Bank Marketing in India
5. Bank Marketing Strategy
6. Primary Data Analysis
a) Socio-Economic Profile of Customer
Respondents
b) Opinion of Customers on Marketing
Strategy
c) Opinion of Bank Personnel on Marketing
Strategy
References
CHAPTER V
MARKETING STRATEGY OF COMMERCIAL
BANKS – AN APPRAISAL
Marketing – the Concept
Years back, the concept of marketing centred around the selling and buying
activities and, therefore, the functional areas of marketing were totally related with
the management of sales and purchases. Today there is a sea change in this
concept of marketing and its functional areas. Now all organisations either
producing goods or generating services give significant consideration for customer
satisfaction while shaping organisational policies i.e., a basic shift from selling-
oriented to customer-oriented business. Selling focuses on the needs of the seller
while modern marketing focuses on the needs of the buyer.
Marketing management is the function of managing the marketing
activities. “Marketing management is the process of planning and executing the
conception, pricing, promotion and distribution of ideas, goods and services to
create exchanges that satisfy individual and organizational objectives”1. Basically
marketing is a business technique devised to sell products and services keeping in
mind the needs and requirements of existing and prospective customers. Thus
marketing becomes a customer satisfaction engineering in which marketer’s efforts
assign due weightage to customer satisfaction.
Marketing of Banking Services
The concept of marketing of banking services is of recent origin. It is only
during 1950s banks came to accept the marketing concept for bank services. Bank
marketing is the aggregate of functions directed at providing services to satisfy
customers’ financial needs and wants more efficiently and effectively than the
148
competitors in consonance with the organisational objectives.2 In a true sense, it is
the application of marketing techniques in the banking services. Application of
marketing techniques in banking, in simple terms, means a coordinated
organisational effort to reach the customer to fulfill his specific needs for getting
his patronage, through utilisation of people, products or services, price, promotion,
branch outlets and distribution policies for maximising customer satisfaction.3 In a
competitive situation banks sell their services through branch counters throughout
the entire country through the employees who act as salesmen recruited by the
management.
Bank Marketing Objectives
In this stage it is fruitful to have a discussion on the objectives of Bank
Marketing. The basic objectives of marketing are applicable in the case of bank
marketing also. They are:
• Maximising the profitability
• Providing high return to investors
• Development of an image and reputation and
• Developing new products to meet emerging customer requirements.
But the specific objectives of bank marketing are:
• increase in deposits
• increase in loans
• diversification of products and
• directing customers to specific products
The achievement of these objectives necessitates that the marketing
department should undertake the following functions:
1. analysis of the customer behaviour, attitudes and market segmentation.
2. market research to collect, investigate analyse and interpret customers’
attitudes and market developments to contribute to the maximum attainment
of objectives.
149
3. development of new products and/or services
4. advertising, publicity and promotion
5. pricing
6. defining strategies, administering and controlling the marketing programme
7. forecasting changing customer profiles and consequent product changes.4
Bank Marketing in India
Originally the marketing concept came into the Indian banking sector in the
form of advertising and promotion. The first major step in the direction of bank
marketing was initiated by State Bank of India in 1971. Groupwise segmentation
was introduced by SBI to assess and understand the specific needs of groups of
customers. It recognised itself on the basis of major market segments, dividing the
borrowing customers on the basis of activity and set up four major market
segments viz., commercial and institutional, small industries and business,
agriculture and personal and services banking segments. A few need based
schemes like home loan accounts, education loans, installment credit etc. were
added to the traditional services range.
The example of SBI was followed by a few other banks. Canara Bank is a
pioneer in this respect which showed how an Indian Bank could be market
innovative and could manage and respond to the changes in the banking
environment so quickly and efficiently. Foreign banks also used different
marketing techniques successfully in India in fund mobilisation and promotion of
consumer credit.
As a result of liberalisation there was an all round growth in competition in
the financial sector, especially in the banking sector. Along with the existing
Public Sector Banks and Old Private Sector Banks, some New Generation Banks
and Foreign Banks entered the scene. As the bank customers got a chance to make
choice from among different offers from different banks and other financial
agencies they became very selective and compelled bankers to project their
presence enthusiastically. This led to acute competition in the sector. Customers
150
are always selective. So the degree of success in this respect depends directly on
the degree of understanding of each group of customers. Also the mounting
intensity of competition results in quality gap5 as some competitors in the field,
especially foreign banks and new private banks, excel others in providing core and
peripheral services using advanced information technologies and develop human
resources accordingly.
Foreign Banks in India have been the pioneers in the field to apply the
quality difference in their services. Aggressive marketing and technological
advancement help them to make inroads into the bank market. Though concerted
efforts were there on the part of Indian banks, they, especially public sector banks,
were far behind in applying the marketing strategies. The technological advantages
of Foreign Banks and New Generation Banks were not available for majority of
other Indian Banks. Technological obsolescence was also a major hindrance in
this respect.
The reform process started in the beginning of 1990s led the management
and staff to the real situations. The opening of new private sector banks and
foreign banks and their application of marketing techniques made management and
staff think about marketing in their banks. They identified the need for product
laboratories for designing and developing new products. But the problem was, in
most banks, management personnel had little knowledge and experience about
marketing in a competitive environment. Their previous experience was mainly in
deposit mobilisation and in achieving deposit targets. But the situation has
changed. The emphasis has further shifted away from deposits to capturing prime
customers wanting credit facilities, raising funds from the market, offering more
and more technology oriented products and even recruiting and retaining skilled
personnel. Perhaps the most significant change is the pursuit of asset-led growth.6
The marketing of loans becomes a major occupation of management at all levels-
senior to junior. The efficiency of an officer as a banking professional is measured
in terms of his success as a loan officer. Of course, this does not mean that the need
151
for cheap funds or deposits does not exist but there is need for value addition as a
result of these efforts.7
Bank Marketing Strategy
The marketing strategy of a business consists of certain components which,
as a blend is named as marketing mix. The marketing mix of a bank is considered
as its marketing strategy as this mix or the combination of this mix varies with the
situation or environment.
The marketing mix of a bank consists of seven component sub mixes:
product, price, place, promotion, process, people and physical evidence. These are
considered as the 7 P’s or 7 elements of bank marketing strategy. In addition to
the first 4 P’s of ordinary marketing, 3 more P’s are applicable in the case of bank
marketing. These seven P’s are not much effective in isolation. An appropriate
blend of these P’s is necessary for a well orchestrated marketing strategy. Banking
professionals’ excellence in blending these sub-mixes gives the best result in the
form of satisfaction to customers and profit to the organisation.
Product – The First ‘P’
A product is anything that can be offered to a market for attention,
acquisition, use or consumption that might satisfy a want or need.8 It is a bundle of
utilities consisting of various product attributes and accompanying services. The
services are of intangible nature and banking services are of that nature. The
banking professionals are expected to develop different dimensions of products so
that the banking services are made attractive, innovative and competitive. Since
banks have customers from different walks of life, a single product specification
will not be attractive for all. Service/product of an optimal mix of core and
peripheral dimensions will raise the attraction of the product. Generally banking
products are grouped under three different heads: Core products, Formal products
and Augmented products/Peripheral services. Core products are those products in
which a banker is engaged in business. For a bank, core products are savings
152
banks, term deposits, current accounts, cash credits, overdrafts, term loans and so
on. Formal products are made up of a combination of two or more core products
and they have a strong marketing content to meet some customer needs. Unfixed
Deposit scheme 9 of Citi Bank is an example for this. The Augmented product is a
Formal product with some ancillary benefits or peripheral services attached to it.
For example in many banks when one opens a savings bank account he gets an
ATM Card or Credit Card. The different services of a bank form the product mix
of the bank. The formulation of a sound product mix is very essential to survive
and compete in the market.
Price – The Second ‘P’
Price is the interest, fees and commission charged and paid by the bank.
Price will determine the profitability of the banks. In a highly regulated market,
banks have little option in deciding the prices. In the regulated market, the RBI
prescribed deposit and lending interest rates and the Indian Banks Association took
decision regarding other charges. Naturally, Indian Banks have not felt any need
to develop their own pricing strategy. But the situation has steadily changed to
deregulated market due to liberalisation. Through RBI’s credit policy
commencements substantial deregulation has brought in, and now banks have
flexibility in their pricing policy. Thus, liberalisation has brought in almost
complete freedom to the banks to decide the price according to market situations.
Place – The Third ‘P’
This ‘P’ signifies placing or distribution of services to the ultimate
customers. The service mix of banks moves through different distribution
channels, such as, the branches, the executives and the staff. A suitable location/
point for the establishment of a bank branch is very important. It should give
conveniences and comfort to the customers. As far as possible, services should
reach the doorsteps of the customers. The behavioral profile and efficiency of the
bank personnel is also equally important. No gap in the distribution process would
153
occur that will hinder smooth flow of services since inconveniences to customers
would act as a demotivational tool that will result in deserting a bank.
Conveniences inside the premises also attract customers to the bank. It
should be neat, clean and well furnished. There are many well equipped and air-
conditioned branches for many banks. But many others lack proper space, filled
with old and worn-out furniture and look unattractive. Effective marketing requires
good appearance and comfortable surroundings.
Technology has been in extensive use to reach customers now (Refer
Ch. II). Strategic alliance with other players in the field for providing banking
services is another strategy under place mix. Through this, there is a possibility for
covering wider geographical area through other established banks, especially for
new banks with limited number of branches. Special counters for certain segments
of customers like pensioners, specialized branches for special customers like Non-
Resident Indians, exporters etc. and single window concept are now in the offing.
Mobile offices and officers which are reaching to customers are in use in many
banks.
Promotion – the Fourth ‘P’
The fourth ‘P’, promotion plays an important role in promoting banking
business. It communicates with the customers/prospective customers on almost all
the aspects of the marketing mix like advantages of different products, details of
how it is delivered, details on the interest and commission paid and charged by the
bank etc. Simultaneously, it persuades the prospective customers to bank’s
products. Thus marketing promotion has two basic objectives – first one to inform
the prospective customers and second one to persuade them. This could be in
various shapes like advertisement, personal interaction and sales campaign. Or this
could be a combination of various promotional instruments. Basically there are
four important components for promotion strategy, such as:
154
Advertising
Sales Promotion
Publicity and
Personal Selling
While formulating a promotion mix, optimal blending of all the four
elements is necessary to succeed in informing, persuading, reminding and
reinforcing customers.
Advertising
Traditional meaning of advertising is that it is a paid form of non-personal
presentation and promotion of ideas, goods and services by an identified sponsor.
It is a paid form of persuasive communication. In bank marketing it is the bank
which directly talks about itself, and pays for doing so. Here the bank tells the
prospective customer the merits of its products and how it satisfies the customer.
Earlier public sector banks were prohibited from advertising through media. But
now they have the freedom to advertise, along with private and foreign banks, their
product launch, brand building and their corporate philosophy.
Sales Promotion
Sales promotion, the next component of the promotion mix, is found
effective in motivating the customers and the employees of the bank. It comprises
of short term activities intending to boost the banking business. It helps a bank in
increasing its market share by helping to launch a new scheme/service or by
supporting an ailing or modified one. Moreover, sales promotion activities are
attention-raisers that will influence prospective customers. If advertising is aimed
to increase loyalty towards a brand, sales promotion techniques are intended to
increase the actual immediate purchase by existing or prospective buyers. The
tools of sales promotion in banks may be in the form of gifts, contests, fairs and
shows, discounts and commissions, low interest financing, entertainment and
traveling and additional allowance.
155
Personal selling
Personal selling10 is an important component of promotion mix. It is very
much instrumental in promoting banking business. It is a function of informing the
prospective customers and persuading them to purchase products through personal
communication in an exchange situation. In personal selling inter-personal or
two–way communication happens and that makes way for a feedback. Moreover,
personal selling may be interchanged with persuasion, in meaning, and persuasion
has an effective role in the banking business. Personal selling becomes very much
effective in improving the quality of banking services since the bankers have a
command on it. This art of telling-and-selling is known as personal selling in
which an individual, based on his/her expertise, attempts to transform the prospects
into customers.11 It is a form of direct selling.
Public Relations and Publicity
The next component, public relations, occupies an outstanding place in the
promotion of banking services. In banking services the development of rapport
with customers plays an incremental role in getting the business or keeping the
business. It is a two–way communication system to develop mutual understanding
between a banking organisation and its customer. It is the way to inform the public
about the organisational programmes and activities, so as to create the best public
reputation. Most probably it is in the form of a press release to newspapers and
banking magazines or financial news so as to create the interest of customers. In
banks there is a Public Relations Department and Public Relations Officers. The
other components of public relations are press bits distributed during press
conference, speeches, seminars, annual reports, charitable donations, sponsorships,
community relations and lobbying the noted personalities, VIPs etc.
Process – the Fifth ‘P’
The organisational activities or processes of a typical banking concern were
mostly designed during the traditional banking period. In the present scenario of
156
reforms basic changes in banking systems and procedures are necessary for
achieving customer satisfaction. The need of the hour is more customer-friendly
and marketing-oriented processes that will give uniqueness to the product. For this
the work-flow in a bank branch should be customer-oriented so as to give
maximum convenience to the customers. Similarly, the present reporting system
of sending too many reports/statements should be abolished to reduce the workload
of the bank staff. Some bankers have already taken this issue in their consideration
while introducing information and communication technology based systems and
procedures.
People - The Sixth ‘P’
People are an important component of bank marketing strategy as human
factor is very influential in services marketing. As the inseparability principle is
applicable in bank marketing, the services and service providers are not separable
in banks. So the quality of service provided by a bank depends on the quality of
people available to the bank. Only quality people can generate efficiency ad
improve productivity. A fair synchronisation of dedicated and committed team of
efficient professionals and new information technology could perform fantastically
to produce the best result as in some foreign banks and private banks. Human
resource development is the way for the formation of human capital. Since the
banking services are intended for customer satisfaction, it is imperative that the top
executives at the apex level should give due consideration for their human capital
and the people at the counter.
Physical Evidence –The Seventh ‘P’
Like all service products, banking products are also intangible. Making it
tangible is a major duty of the banker and for that he uses the instrument of
physical evidence in different forms in banks. Proper upkeep of branch premises
and interior decoration of branches are originally part of place strategy but which
have relevance from the standpoint of physical evidence also. Most of the banks in
157
India accepted this fact with enthusiasm and there is a new look and convenience
for many bank branches. Another area of physical evidence is the stationery items
like cheque book, pass book supplied to customers and other stationery materials
in use. These items may be redesigned to look attractive, clear and convenient to
customers. An attractively designed product brochure, a catchy brand name for a
product, timely supply of statement of account etc. will make the products tangible.
PRIMARY DATA ANALYSIS
In the background of the above said details, enquiry was made with
customers and personnel of commercial banks to know their opinion and
perception on various marketing strategies of their banks.
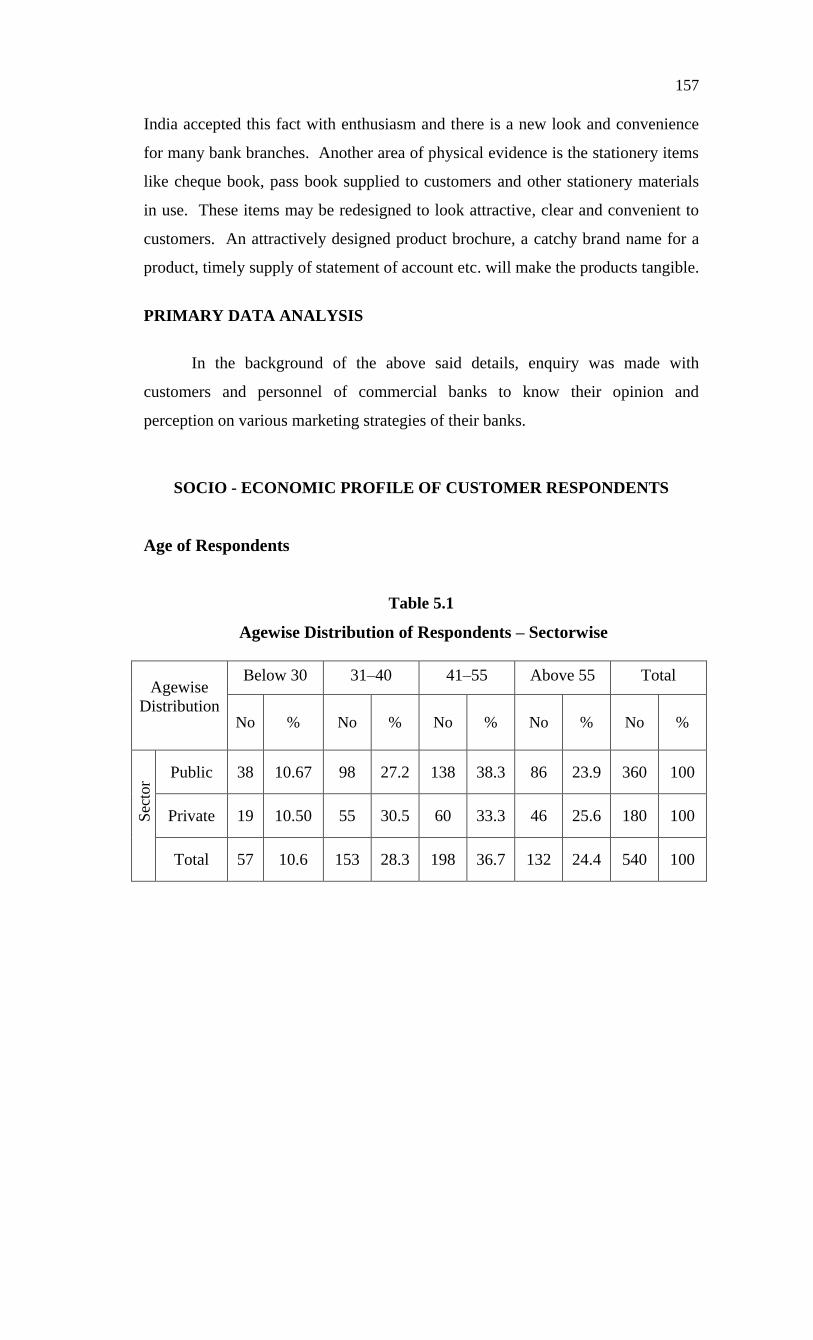
SOCIO - ECONOMIC PROFILE OF CUSTOMER RESPONDENTS
Age of Respondents
Table 5.1
Agewise Distribution of Respondents – Sectorwise
Agewise
Distribution
Below 30 31–40 41–55 Above 55 Total
No
%
No
%
No
%
No
%
No
%
Public 38 10.67 98 27.2 138 38.3 86 23.9 360 100
Private 19 10.50 55 30.5 60 33.3 46 25.6 180 100
Total 57 10.6 153 28.3 198 36.7 132 24.4 540 100
Sec
tor
158
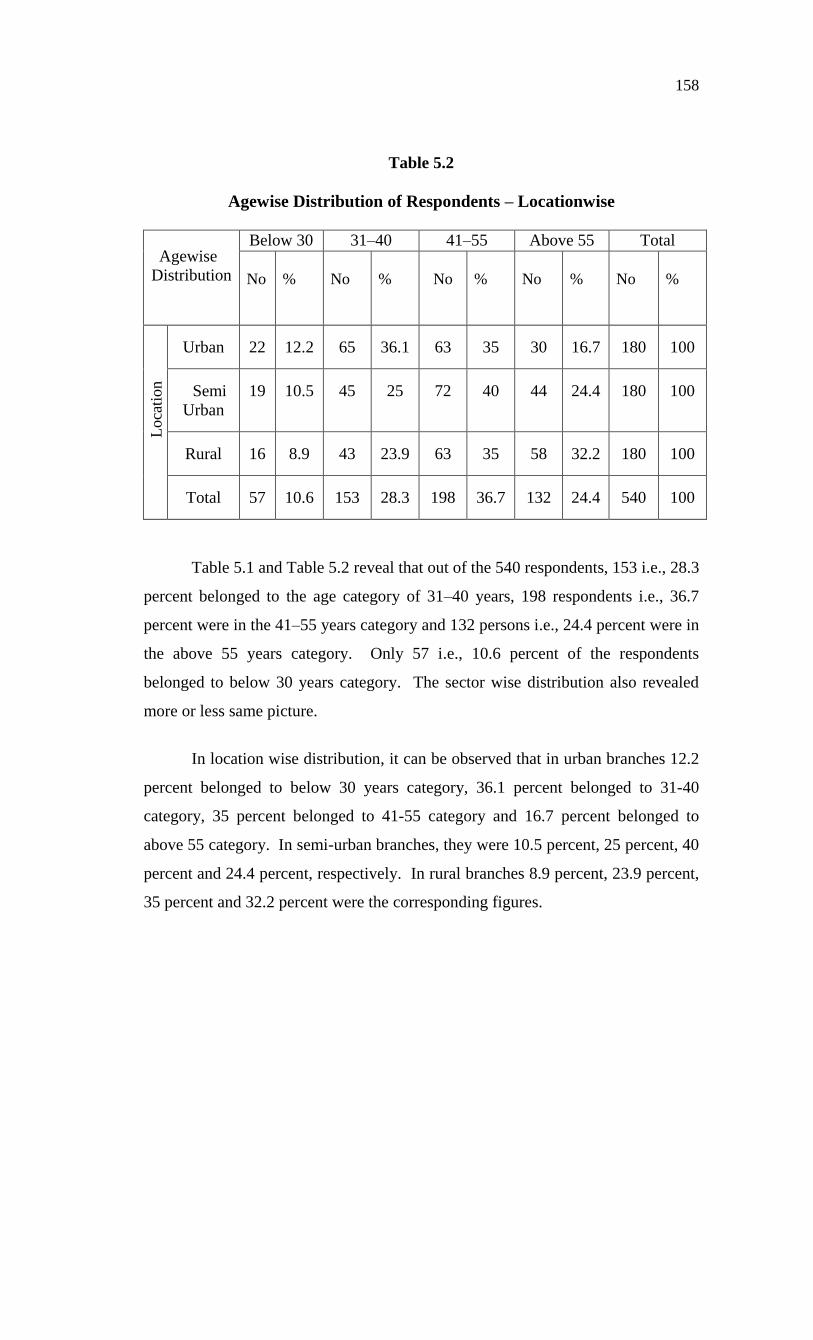
Table 5.2
Agewise Distribution of Respondents – Locationwise
Agewise
Distribution
Below 30 31–40 41–55 Above 55 Total
No
%
No
%
No
%
No
%
No
%
Urban 22 12.2 65 36.1 63 35 30 16.7 180 100
Semi
Urban
19 10.5 45 25 72 40 44 24.4 180 100
Rural 16 8.9 43 23.9 63 35 58 32.2 180 100
Total 57 10.6 153 28.3 198 36.7 132 24.4 540 100
Table 5.1 and Table 5.2 reveal that out of the 540 respondents, 153 i.e., 28.3
percent belonged to the age category of 31–40 years, 198 respondents i.e., 36.7
percent were in the 41–55 years category and 132 persons i.e., 24.4 percent were in
the above 55 years category. Only 57 i.e., 10.6 percent of the respondents
belonged to below 30 years category. The sector wise distribution also revealed
more or less same picture.
In location wise distribution, it can be observed that in urban branches 12.2
percent belonged to below 30 years category, 36.1 percent belonged to 31-40
category, 35 percent belonged to 41-55 category and 16.7 percent belonged to
above 55 category. In semi-urban branches, they were 10.5 percent, 25 percent, 40
percent and 24.4 percent, respectively. In rural branches 8.9 percent, 23.9 percent,
35 percent and 32.2 percent were the corresponding figures.
Loca
tion
159
Gender of Respondents
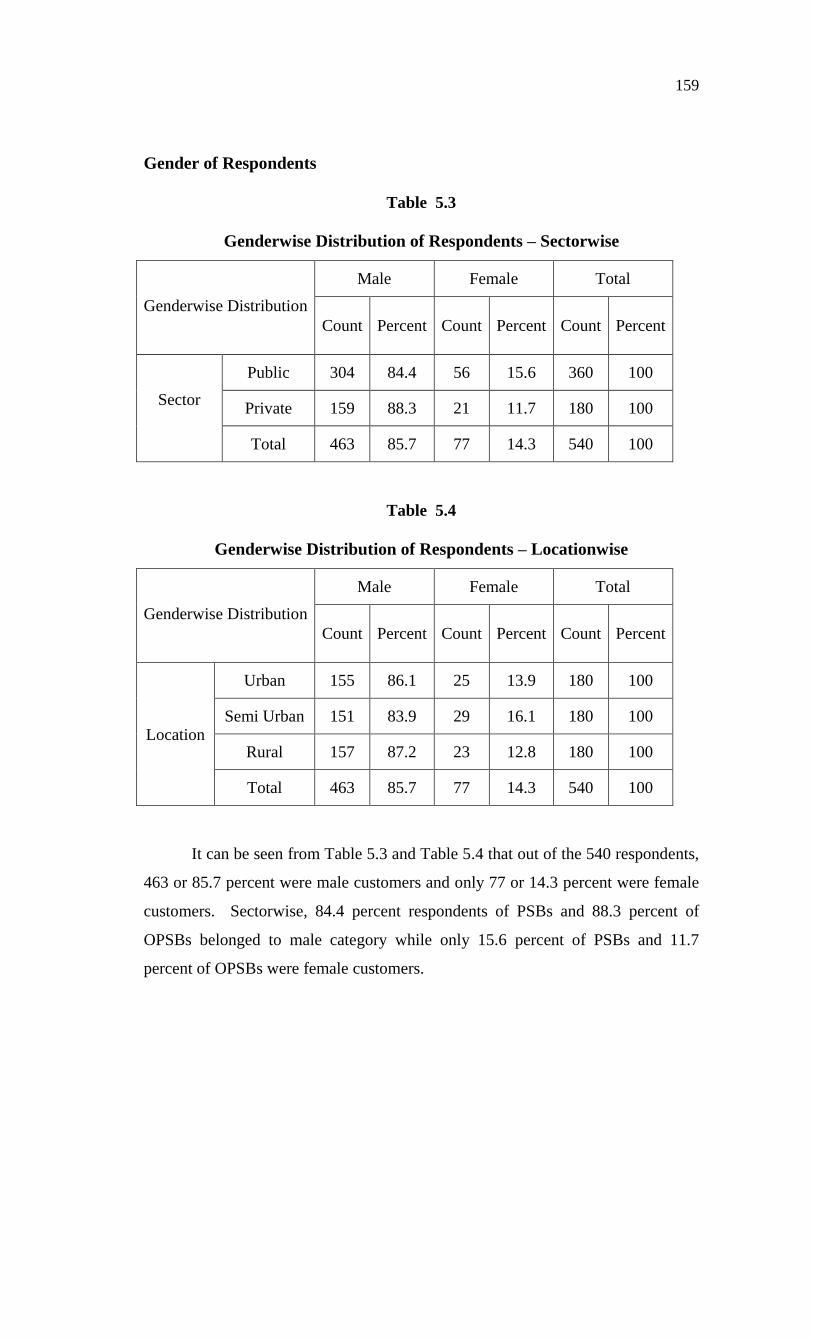
Table 5.3
Genderwise Distribution of Respondents – Sectorwise
Genderwise Distribution
Male Female Total
Count
Percent
Count
Percent
Count
Percent
Sector
Public 304 84.4 56 15.6 360 100
Private 159 88.3 21 11.7 180 100
Total 463 85.7 77 14.3 540 100
Table 5.4
Genderwise Distribution of Respondents – Locationwise
Genderwise Distribution
Male Female Total
Count
Percent
Count
Percent
Count
Percent
Location
Urban 155 86.1 25 13.9 180 100
Semi Urban 151 83.9 29 16.1 180 100
Rural 157 87.2 23 12.8 180 100
Total 463 85.7 77 14.3 540 100
It can be seen from Table 5.3 and Table 5.4 that out of the 540 respondents,
463 or 85.7 percent were male customers and only 77 or 14.3 percent were female
customers. Sectorwise, 84.4 percent respondents of PSBs and 88.3 percent of
OPSBs belonged to male category while only 15.6 percent of PSBs and 11.7
percent of OPSBs were female customers.
160
Locationwise, almost same picture was revealed. The female customers
were 13.9 percent, 16.1 percent, and 12.8 percent, respectively, in urban, semi-
urban and rural branches. This situation indicates that though women literacy and
employment rates are high in the state, female folk is reluctant to become
customers of a bank. Interaction with officials also revealed this.
Educational Qualification of Respondents
Table 5.5
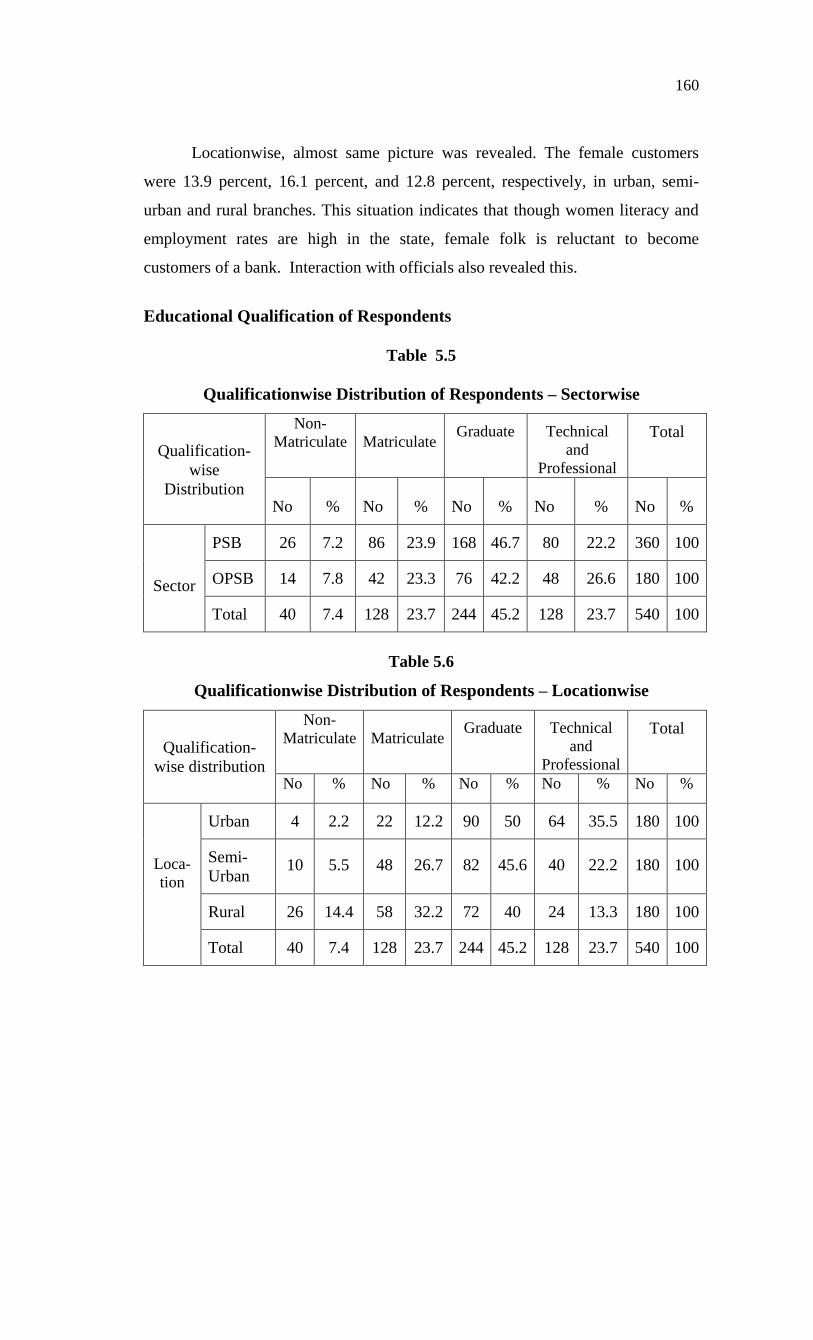
Qualificationwise Distribution of Respondents – Sectorwise
Qualification-
wise
Distribution
Non-
Matriculate
Matriculate Graduate Technical
and
Professional
Total
No
%
No
%
No
%
No
%
No
%
Sector
PSB 26 7.2 86 23.9 168 46.7 80 22.2 360 100
OPSB 14 7.8 42 23.3 76 42.2 48 26.6 180 100
Total 40 7.4 128 23.7 244 45.2 128 23.7 540 100
Table 5.6
Qualificationwise Distribution of Respondents – Locationwise
Qualification-
wise distribution
Non-
Matriculate
Matriculate Graduate Technical
and
Professional
Total
No % No % No % No % No %
Loca-
tion
Urban 4 2.2 22 12.2 90 50 64 35.5 180 100
Semi-
Urban 10 5.5 48 26.7 82 45.6 40 22.2 180 100
Rural 26 14.4 58 32.2 72 40 24 13.3 180 100
Total 40 7.4 128 23.7 244 45.2 128 23.7 540 100
161
Table 5.5 and Table 5.6 reveal that of the sample 7.4 percent respondents
were non-matriculates, 23.7 percent were matriculates, 45.2 percent were
graduates, and 23.7 percent were professionally or technically qualified.
In sectorwise analysis, the percentage of graduates of PSBs was 46.7
percent while that of OPSBs was 42.2 percent. The percentage of technically
qualified and professionally qualified persons in OPSBs was higher than in PSBs.
While considering the literacy level in Kerala, it can be assumed that participation
of non-matriculate population in commercial banking is not up to the expected
level.
In locationwise analysis, in urban branches graduates were 50 percent,
matriculates were 12.2 percent, and technically and professionally qualified were
35.5 percent of the respondents. The respective rates in semi-urban branches were
45.6 percent, 26.7 percent and 22.2 percent, and in rural branches these were 40
percent, 32.2 percent and 13.3 percent. The non-matriculates were higher (14.4
percent) in rural branches.
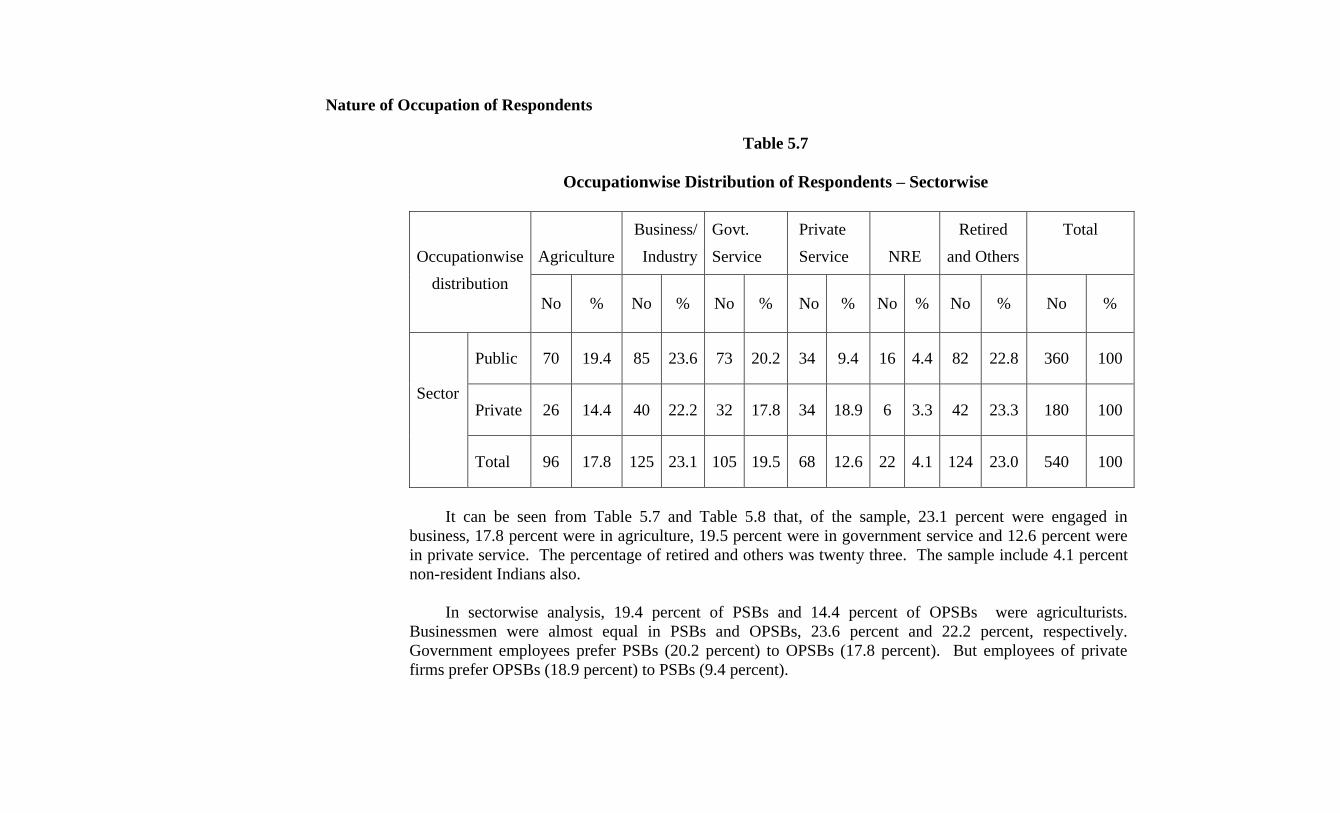
Nature of Occupation of Respondents
Table 5.7
Occupationwise Distribution of Respondents – Sectorwise
Occupationwise
distribution
Agriculture
Business/
Industry
Govt.
Service
Private
Service
NRE
Retired
and Others
Total
No
%
No
%
No
%
No
%
No
%
No
%
No
%
Sector
Public 70 19.4 85 23.6 73 20.2 34 9.4 16 4.4 82 22.8 360 100
Private 26 14.4 40 22.2 32 17.8 34 18.9 6 3.3 42 23.3 180 100
Total 96 17.8 125 23.1 105 19.5 68 12.6 22 4.1 124 23.0 540 100
It can be seen from Table 5.7 and Table 5.8 that, of the sample, 23.1 percent were engaged in
business, 17.8 percent were in agriculture, 19.5 percent were in government service and 12.6 percent were
in private service. The percentage of retired and others was twenty three. The sample include 4.1 percent
non-resident Indians also.
In sectorwise analysis, 19.4 percent of PSBs and 14.4 percent of OPSBs were agriculturists.
Businessmen were almost equal in PSBs and OPSBs, 23.6 percent and 22.2 percent, respectively.
Government employees prefer PSBs (20.2 percent) to OPSBs (17.8 percent). But employees of private
firms prefer OPSBs (18.9 percent) to PSBs (9.4 percent).
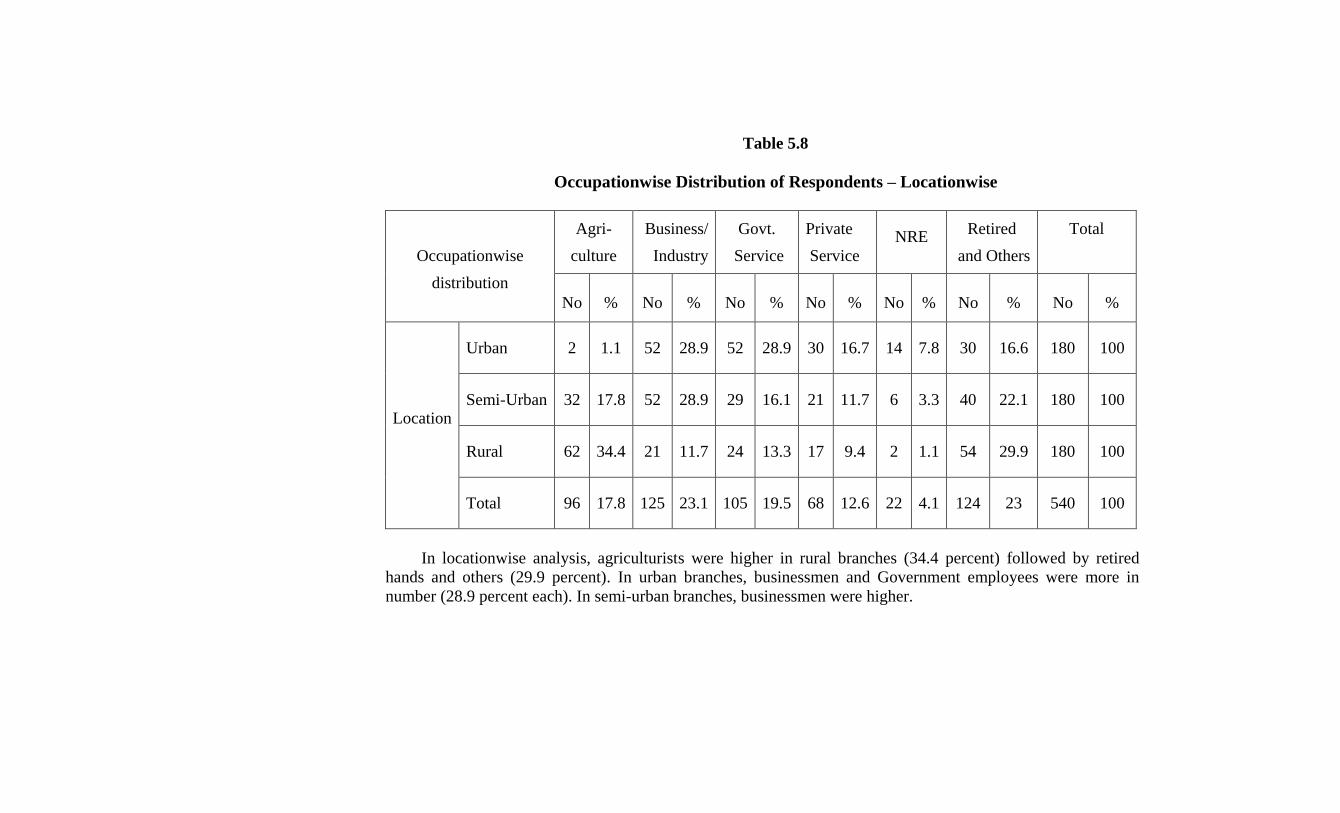
Table 5.8
Occupationwise Distribution of Respondents – Locationwise
Occupationwise
distribution
Agri-
culture
Business/
Industry
Govt.
Service
Private
Service
NRE Retired
and Others
Total
No
%
No
%
No
%
No
%
No
%
No
%
No
%
Location
Urban 2 1.1 52 28.9 52 28.9 30 16.7 14 7.8 30 16.6 180 100
Semi-Urban 32 17.8 52 28.9 29 16.1 21 11.7 6 3.3 40 22.1 180 100
Rural 62 34.4 21 11.7 24 13.3 17 9.4 2 1.1 54 29.9 180 100
Total 96 17.8 125 23.1 105 19.5 68 12.6 22 4.1 124 23 540 100
In locationwise analysis, agriculturists were higher in rural branches (34.4 percent) followed by retired
hands and others (29.9 percent). In urban branches, businessmen and Government employees were more in
number (28.9 percent each). In semi-urban branches, businessmen were higher.
164
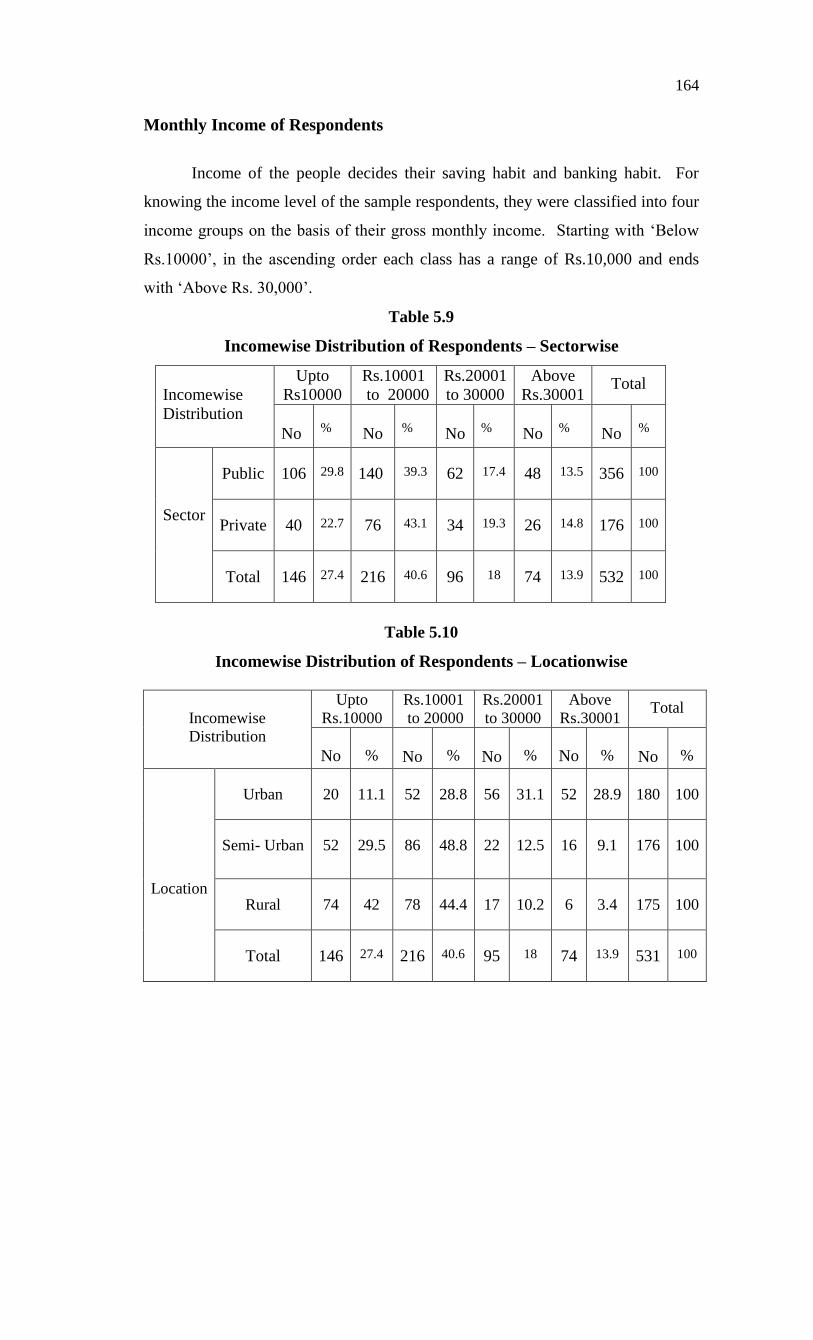
Monthly Income of Respondents
Income of the people decides their saving habit and banking habit. For
knowing the income level of the sample respondents, they were classified into four
income groups on the basis of their gross monthly income. Starting with ‘Below
Rs.10000’, in the ascending order each class has a range of Rs.10,000 and ends
with ‘Above Rs. 30,000’.
Table 5.9
Incomewise Distribution of Respondents – Sectorwise
Incomewise
Distribution
Upto
Rs10000
Rs.10001
to 20000
Rs.20001
to 30000
Above
Rs.30001 Total
No
%
No
%
No
%
No
%
No
%
Sector
Public 106 29.8 140 39.3 62 17.4 48 13.5 356 100
Private 40 22.7 76 43.1 34 19.3 26 14.8 176 100
Total 146 27.4 216 40.6 96 18 74 13.9 532 100
Table 5.10
Incomewise Distribution of Respondents – Locationwise
Incomewise
Distribution
Upto
Rs.10000
Rs.10001
to 20000
Rs.20001
to 30000
Above
Rs.30001 Total
No
%
No
%
No
%
No
%
No
%
Location
Urban 20 11.1 52 28.8 56 31.1 52 28.9 180 100
Semi- Urban 52 29.5 86 48.8 22 12.5 16 9.1 176 100
Rural 74 42 78 44.4 17 10.2 6 3.4 175 100
Total 146 27.4 216 40.6 95 18 74 13.9 531 100
165
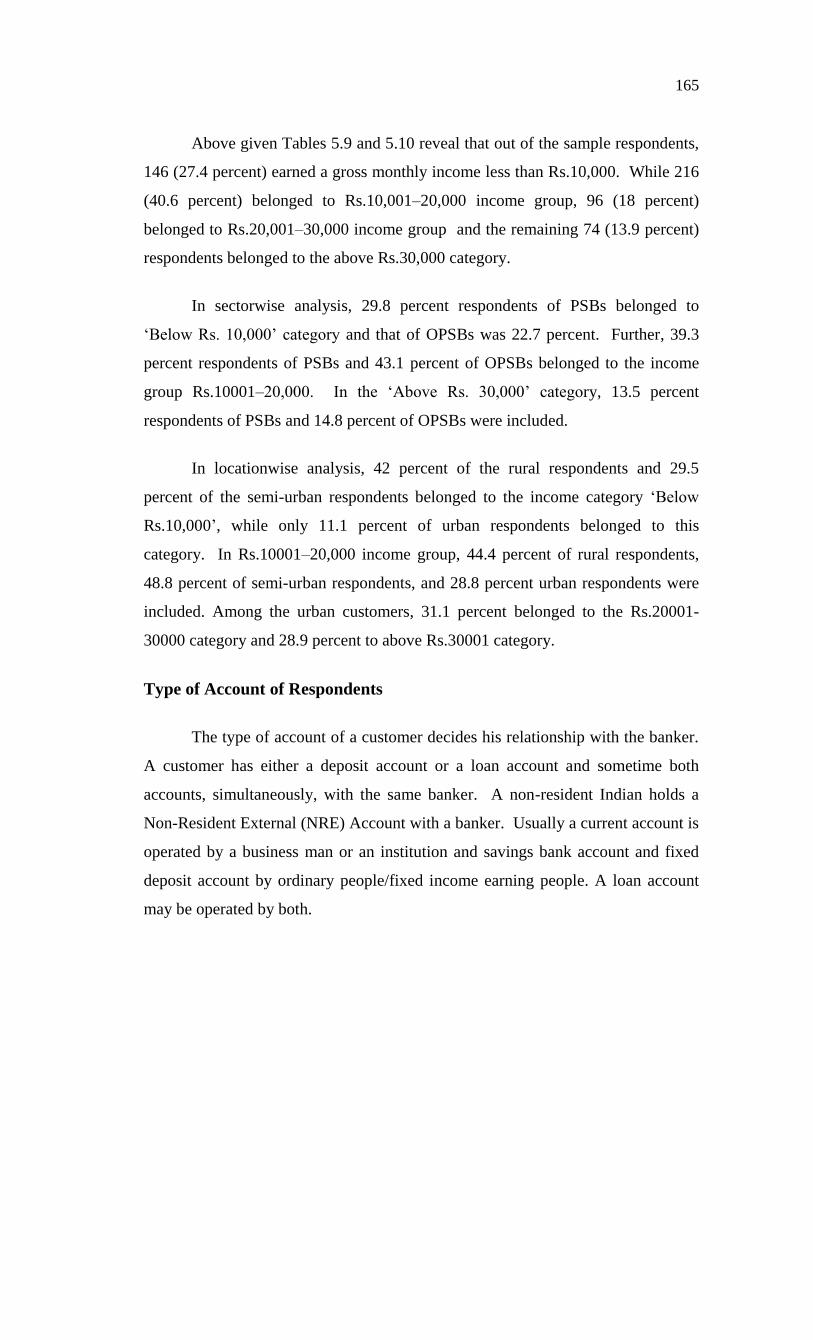
Above given Tables 5.9 and 5.10 reveal that out of the sample respondents,
146 (27.4 percent) earned a gross monthly income less than Rs.10,000. While 216
(40.6 percent) belonged to Rs.10,001–20,000 income group, 96 (18 percent)
belonged to Rs.20,001–30,000 income group and the remaining 74 (13.9 percent)
respondents belonged to the above Rs.30,000 category.
In sectorwise analysis, 29.8 percent respondents of PSBs belonged to
‘Below Rs. 10,000’ category and that of OPSBs was 22.7 percent. Further, 39.3
percent respondents of PSBs and 43.1 percent of OPSBs belonged to the income
group Rs.10001–20,000. In the ‘Above Rs. 30,000’ category, 13.5 percent
respondents of PSBs and 14.8 percent of OPSBs were included.
In locationwise analysis, 42 percent of the rural respondents and 29.5
percent of the semi-urban respondents belonged to the income category ‘Below
Rs.10,000’, while only 11.1 percent of urban respondents belonged to this
category. In Rs.10001–20,000 income group, 44.4 percent of rural respondents,
48.8 percent of semi-urban respondents, and 28.8 percent urban respondents were
included. Among the urban customers, 31.1 percent belonged to the Rs.20001-
30000 category and 28.9 percent to above Rs.30001 category.
Type of Account of Respondents
The type of account of a customer decides his relationship with the banker.
A customer has either a deposit account or a loan account and sometime both
accounts, simultaneously, with the same banker. A non-resident Indian holds a
Non-Resident External (NRE) Account with a banker. Usually a current account is
operated by a business man or an institution and savings bank account and fixed
deposit account by ordinary people/fixed income earning people. A loan account
may be operated by both.
166
Table 5.11
Current Account – Sectorwise
Current Account
No Yes Total
Count
%
Count
%
Count
%
Sector
Public 300 83.3 60 16.7 360 100
Private 153 85.0 27 15.0 180 100
Total 453 83.9 87 16.1 540 100
Table 5.12
Current Account – Locationwise
Current Account
No Yes Total
Count
%
Count
%
Count
%
Location
Urban 144 80.0 36 20 180 100
Semi
Urban 150 83.3 30 16.7 180 100
Rural 159 88.3 21 11.7 180 100
Total 453 83.9 87 16.1 540 100
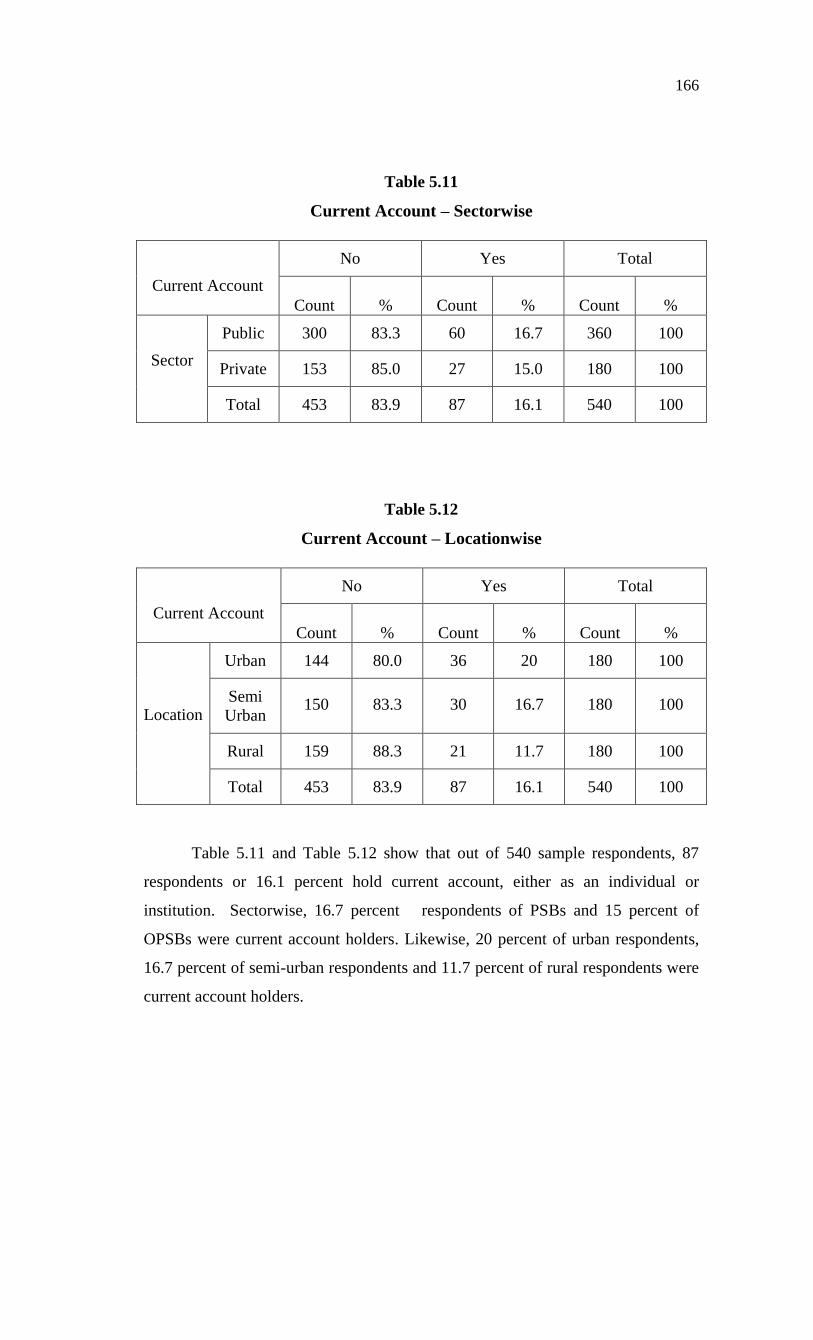
Table 5.11 and Table 5.12 show that out of 540 sample respondents, 87
respondents or 16.1 percent hold current account, either as an individual or
institution. Sectorwise, 16.7 percent respondents of PSBs and 15 percent of
OPSBs were current account holders. Likewise, 20 percent of urban respondents,
16.7 percent of semi-urban respondents and 11.7 percent of rural respondents were
current account holders.
167
Table 5.13
Savings Bank and Fixed Deposit – Sectorwise
Savings Bank and
Fixed Deposit
No Yes Total
Count % Count % Count %
Sector
Public 99 27.5 261 72.5 360 100
Private 61 33.9 119 66.1 180 100
Total 160 29.6 380 70.4 540 100
Table 5.14
Savings Bank and Fixed Deposit – Locationwise
Savings Bank and
Fixed Deposit
No Yes Total
Count % Count % Count %
Location
Urban 56 31.1 124 68.9 180 100
Semi
Urban 48 26.7 132 73.3 180 100
Rural 56 31.1 124 68.9 180 100
Total 160 29.6 380 70.4 540 100
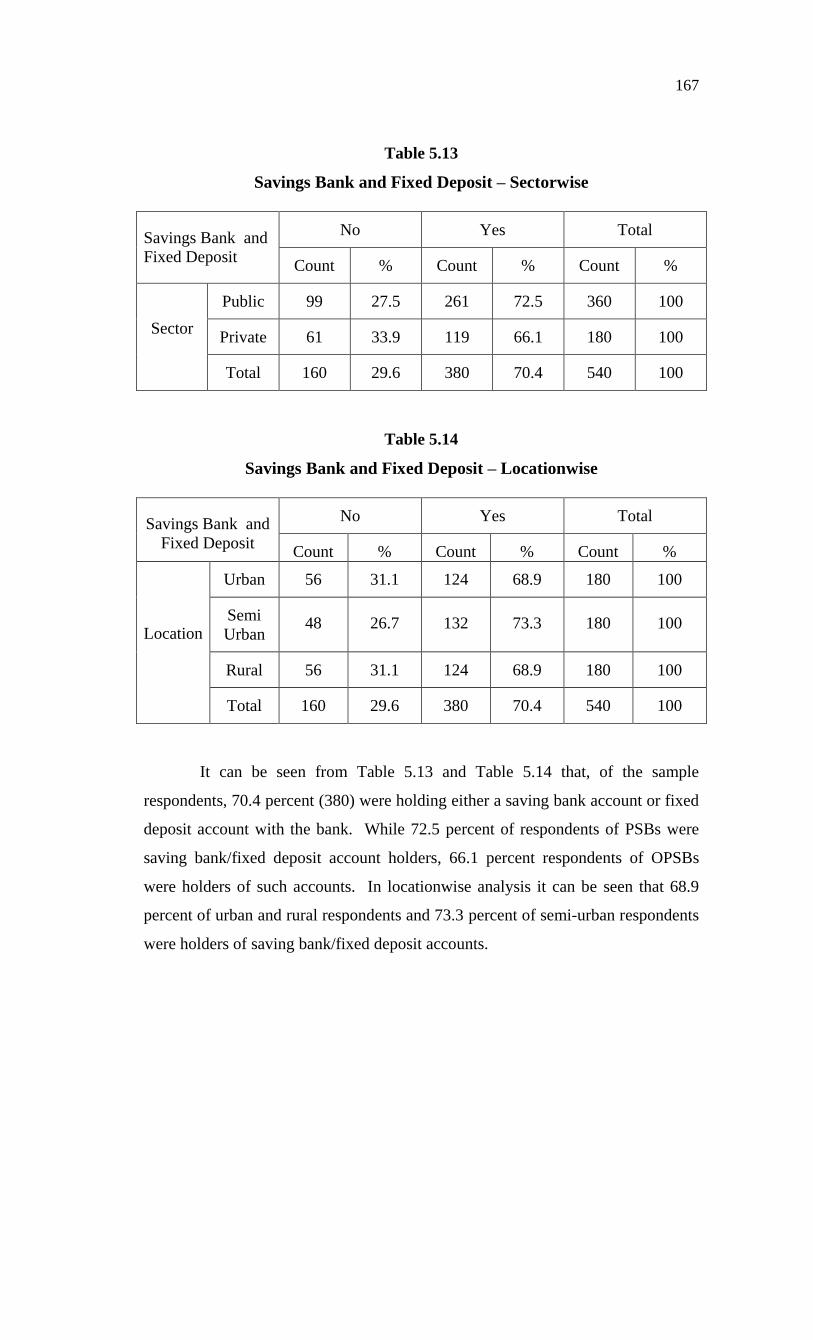
It can be seen from Table 5.13 and Table 5.14 that, of the sample
respondents, 70.4 percent (380) were holding either a saving bank account or fixed
deposit account with the bank. While 72.5 percent of respondents of PSBs were
saving bank/fixed deposit account holders, 66.1 percent respondents of OPSBs
were holders of such accounts. In locationwise analysis it can be seen that 68.9
percent of urban and rural respondents and 73.3 percent of semi-urban respondents
were holders of saving bank/fixed deposit accounts.
168
Table 5.15
Non-Resident External Account – Sectorwise
Non-Resident
External Account
No Yes Total
Count % Count % Count %
Sector
Public 344 95.6 16 4.4 360 100
Private 174 96.7 6 3.3 180 100
Total 518 95.9 22 4.1 540 100
Table 5.16
Non-Resident External Account – Locationwise
Non-Resident
External Account
No Yes Total
Count % Count % Count %
Location
Urban 168 93.3 12 6.7 180 100
Semi
Urban 176 97.8 4 2.2 180 100
Rural 174 96.7 6 3.3 180 100
Total 518 95.9 22 4.1 540 100
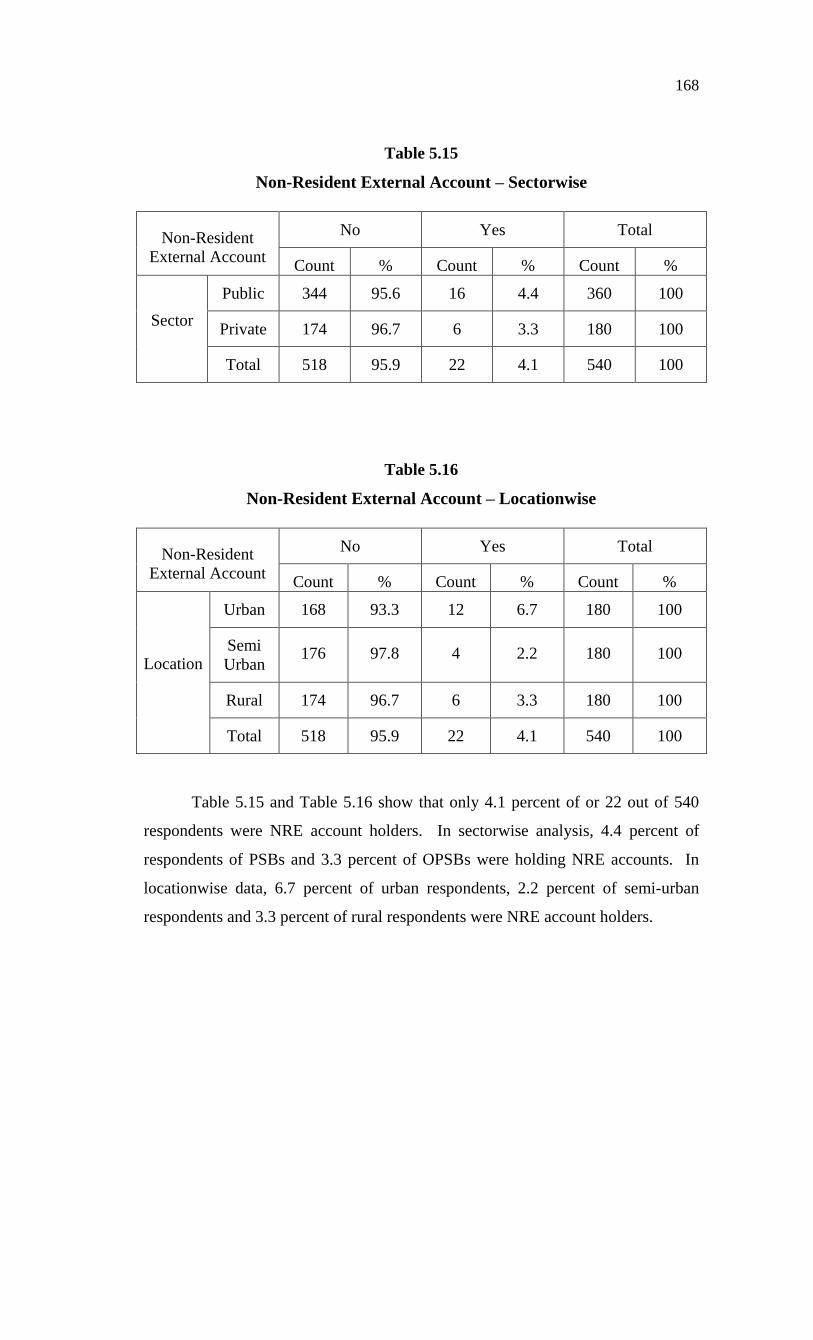
Table 5.15 and Table 5.16 show that only 4.1 percent of or 22 out of 540
respondents were NRE account holders. In sectorwise analysis, 4.4 percent of
respondents of PSBs and 3.3 percent of OPSBs were holding NRE accounts. In
locationwise data, 6.7 percent of urban respondents, 2.2 percent of semi-urban
respondents and 3.3 percent of rural respondents were NRE account holders.
169
Table 5.17
Loan Account – Sectorwise
Loan Account
No Yes Total
Count % Count % Count %
Sector
Public 198 55.0 162 45.0 360 100
Private 94 52.2 86 47.8 180 100
Total 292 54.1 248 45.9 540 100
Table 5.18
Loan Account – Locationwise
Loan Account
No Yes Total
Count % Count % Count %
Location
Urban 94 52.2 86 47.8 180 100
Semi
Urban 104 57.8 76 42.2 180 100
Rural 94 52.2 86 47.8 180 100
Total 292 54.1 248 45.9 540 100
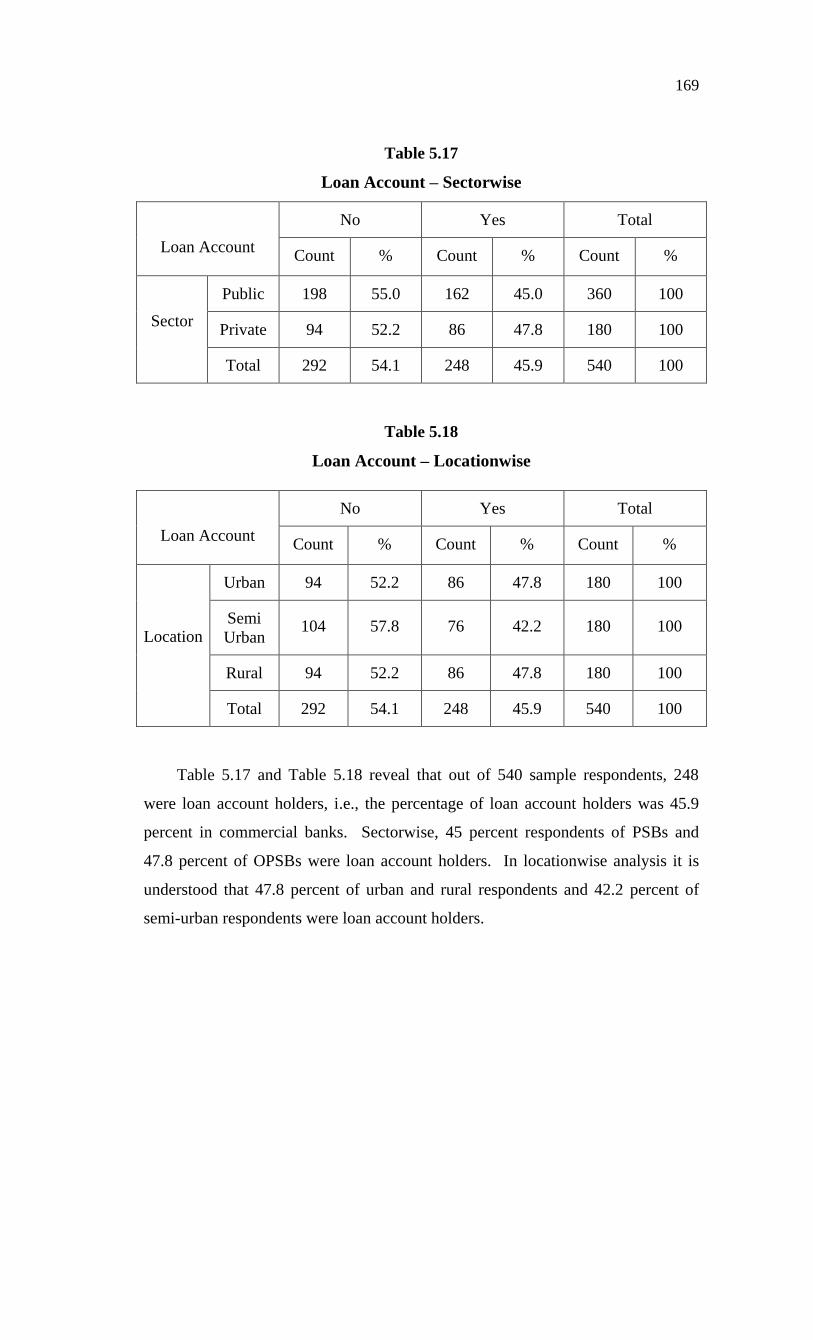
Table 5.17 and Table 5.18 reveal that out of 540 sample respondents, 248
were loan account holders, i.e., the percentage of loan account holders was 45.9
percent in commercial banks. Sectorwise, 45 percent respondents of PSBs and
47.8 percent of OPSBs were loan account holders. In locationwise analysis it is
understood that 47.8 percent of urban and rural respondents and 42.2 percent of
semi-urban respondents were loan account holders.
170
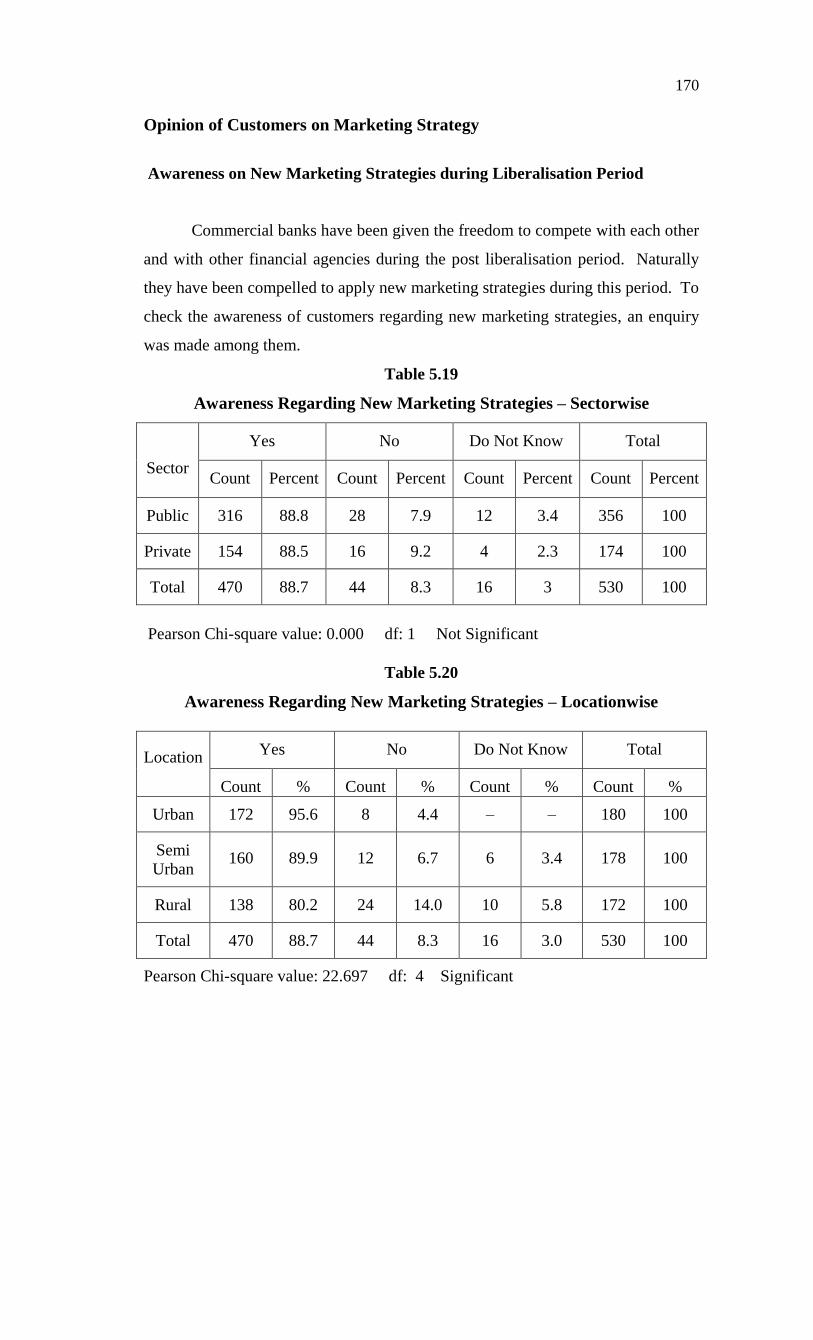
Opinion of Customers on Marketing Strategy
Awareness on New Marketing Strategies during Liberalisation Period
Commercial banks have been given the freedom to compete with each other
and with other financial agencies during the post liberalisation period. Naturally
they have been compelled to apply new marketing strategies during this period. To
check the awareness of customers regarding new marketing strategies, an enquiry
was made among them.
Table 5.19
Awareness Regarding New Marketing Strategies – Sectorwise
Sector
Yes No Do Not Know Total
Count Percent Count Percent Count Percent Count Percent
Public 316 88.8 28 7.9 12 3.4 356 100
Private 154 88.5 16 9.2 4 2.3 174 100
Total 470 88.7 44 8.3 16 3 530 100
Pearson Chi-square value: 0.000 df: 1 Not Significant
Table 5.20
Awareness Regarding New Marketing Strategies – Locationwise
Location Yes No Do Not Know Total
Count % Count % Count % Count %
Urban 172 95.6 8 4.4 – – 180 100
Semi
Urban 160 89.9 12 6.7 6 3.4 178 100
Rural 138 80.2 24 14.0 10 5.8 172 100
Total 470 88.7 44 8.3 16 3.0 530 100
Pearson Chi-square value: 22.697 df: 4 Significant
171
It can be seen from Table 5.19 and Table 5.20 that 88.7 percent of the
respondents were quite aware of banks’ new marketing strategies. Sectorwise
analysis also gave almost the same picture. In locationwise analysis also it was
seen that the awareness was high in urban branches (95.6 percent), semi-urban
branches (89.9 percent) and rural branches (80.2 percent)
Chi-square test at 5 percent level of significance in sectorwise analysis
revealed that there was no significant difference in awareness between PSB and
OPSB respondents regarding new marketing strategies followed by banks. But the
test on locations revealed that there was considerable difference among locations in
this regard.
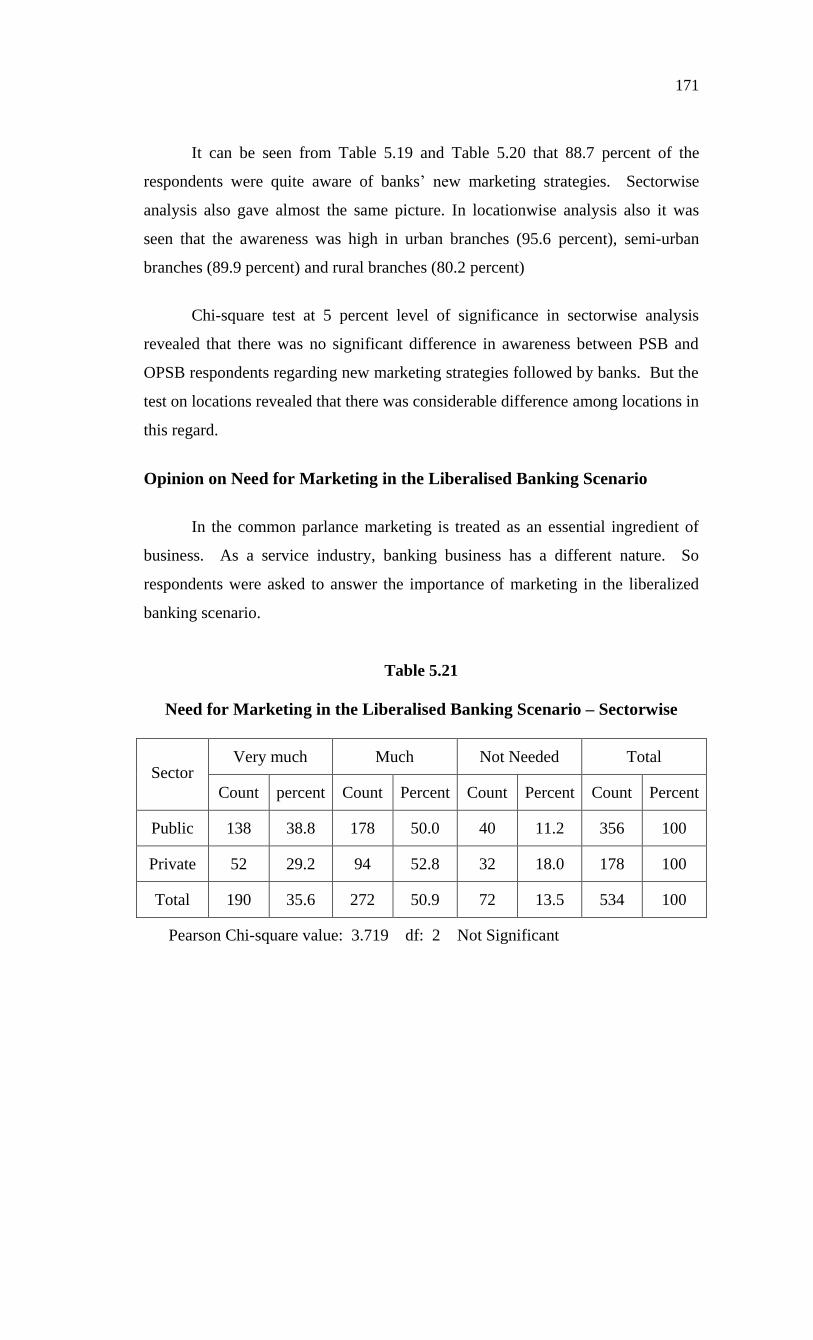
Opinion on Need for Marketing in the Liberalised Banking Scenario
In the common parlance marketing is treated as an essential ingredient of
business. As a service industry, banking business has a different nature. So
respondents were asked to answer the importance of marketing in the liberalized
banking scenario.
Table 5.21
Need for Marketing in the Liberalised Banking Scenario – Sectorwise
Sector Very much Much Not Needed Total
Count percent Count Percent Count Percent Count Percent
Public 138 38.8 178 50.0 40 11.2 356 100
Private 52 29.2 94 52.8 32 18.0 178 100
Total 190 35.6 272 50.9 72 13.5 534 100
Pearson Chi-square value: 3.719 df: 2 Not Significant
172
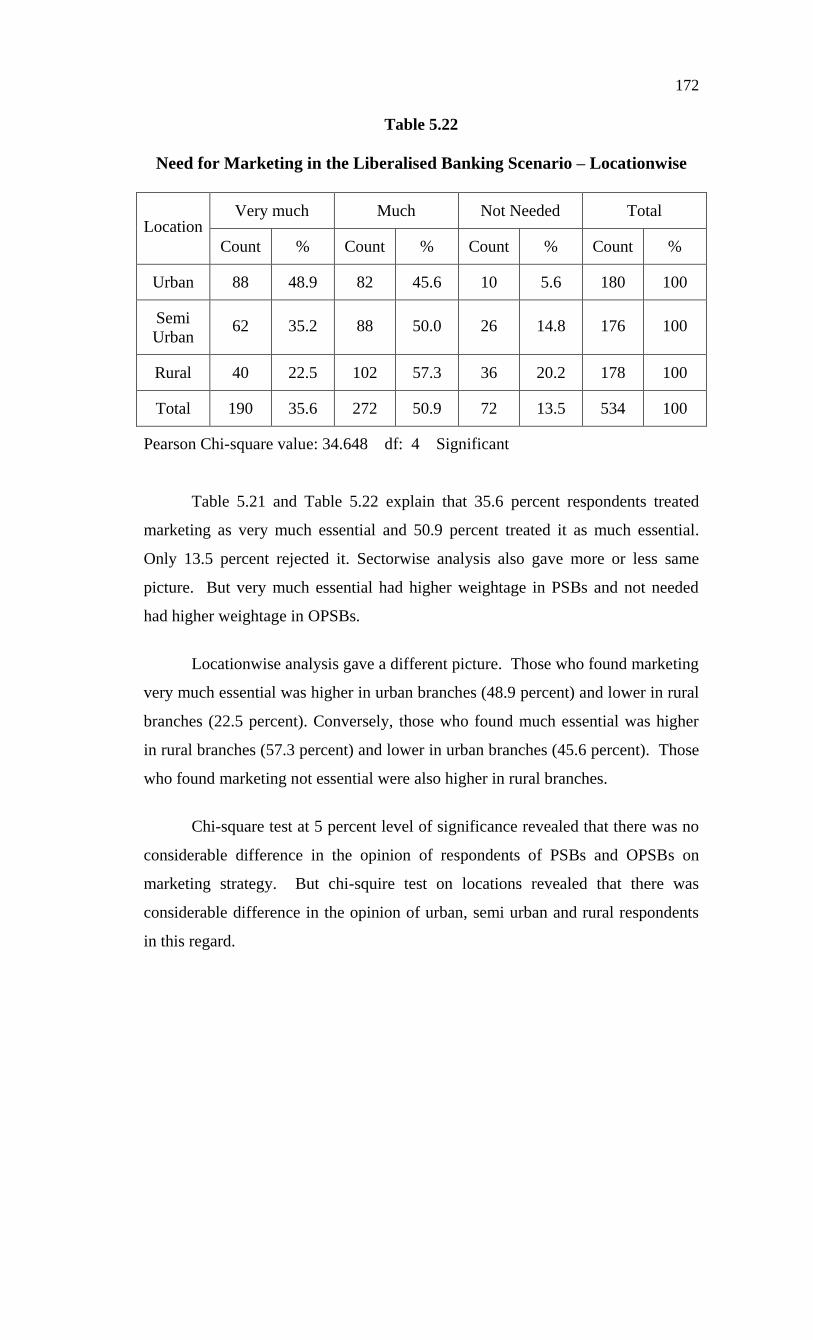
Table 5.22
Need for Marketing in the Liberalised Banking Scenario – Locationwise
Location Very much Much Not Needed Total
Count % Count % Count % Count %
Urban 88 48.9 82 45.6 10 5.6 180 100
Semi
Urban 62 35.2 88 50.0 26 14.8 176 100
Rural 40 22.5 102 57.3 36 20.2 178 100
Total 190 35.6 272 50.9 72 13.5 534 100
Pearson Chi-square value: 34.648 df: 4 Significant
Table 5.21 and Table 5.22 explain that 35.6 percent respondents treated
marketing as very much essential and 50.9 percent treated it as much essential.
Only 13.5 percent rejected it. Sectorwise analysis also gave more or less same
picture. But very much essential had higher weightage in PSBs and not needed
had higher weightage in OPSBs.
Locationwise analysis gave a different picture. Those who found marketing
very much essential was higher in urban branches (48.9 percent) and lower in rural
branches (22.5 percent). Conversely, those who found much essential was higher
in rural branches (57.3 percent) and lower in urban branches (45.6 percent). Those
who found marketing not essential were also higher in rural branches.
Chi-square test at 5 percent level of significance revealed that there was no
considerable difference in the opinion of respondents of PSBs and OPSBs on
marketing strategy. But chi-squire test on locations revealed that there was
considerable difference in the opinion of urban, semi urban and rural respondents
in this regard.
173
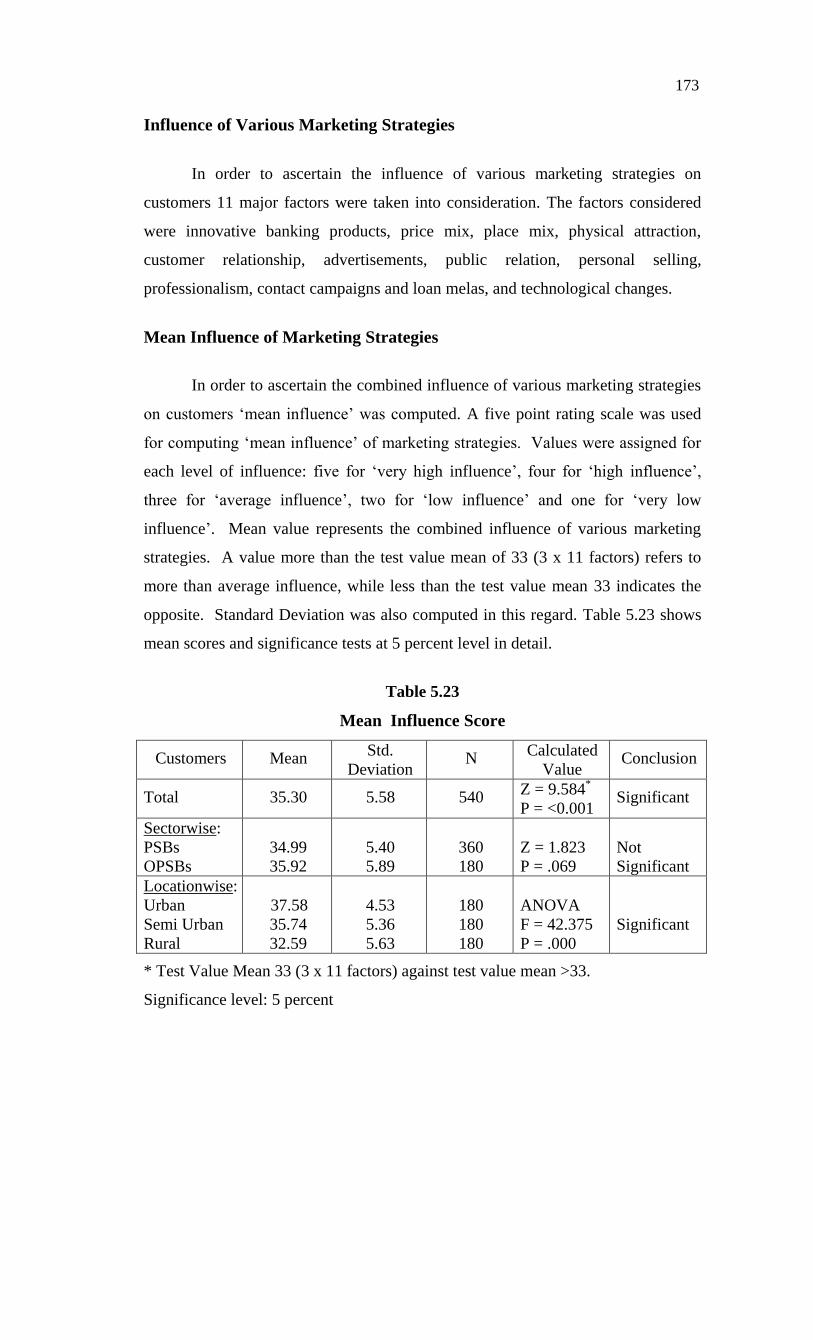
Influence of Various Marketing Strategies
In order to ascertain the influence of various marketing strategies on
customers 11 major factors were taken into consideration. The factors considered
were innovative banking products, price mix, place mix, physical attraction,
customer relationship, advertisements, public relation, personal selling,
professionalism, contact campaigns and loan melas, and technological changes.
Mean Influence of Marketing Strategies
In order to ascertain the combined influence of various marketing strategies
on customers ‘mean influence’ was computed. A five point rating scale was used
for computing ‘mean influence’ of marketing strategies. Values were assigned for
each level of influence: five for ‘very high influence’, four for ‘high influence’,
three for ‘average influence’, two for ‘low influence’ and one for ‘very low
influence’. Mean value represents the combined influence of various marketing
strategies. A value more than the test value mean of 33 (3 x 11 factors) refers to
more than average influence, while less than the test value mean 33 indicates the
opposite. Standard Deviation was also computed in this regard. Table 5.23 shows
mean scores and significance tests at 5 percent level in detail.
Table 5.23
Mean Influence Score
Customers Mean Std.
Deviation N
Calculated
Value Conclusion
Total 35.30 5.58 540 Z = 9.584*
P = <0.001 Significant
Sectorwise:
PSBs
OPSBs
34.99
35.92
5.40
5.89
360
180
Z = 1.823
P = .069
Not
Significant
Locationwise:
Urban
Semi Urban
Rural
37.58
35.74
32.59
4.53
5.36
5.63
180
180
180
ANOVA
F = 42.375
P = .000
Significant
* Test Value Mean 33 (3 x 11 factors) against test value mean >33.
Significance level: 5 percent
174
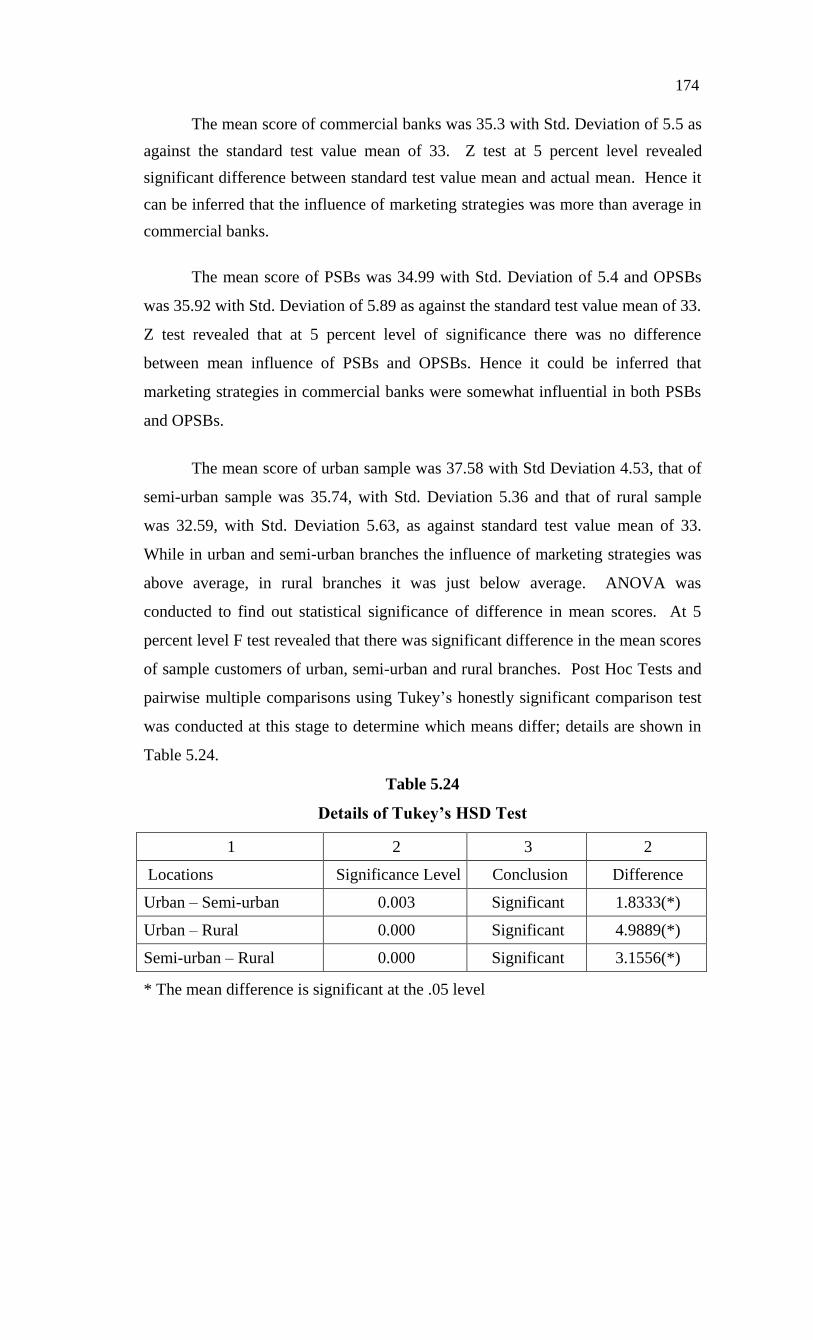
The mean score of commercial banks was 35.3 with Std. Deviation of 5.5 as
against the standard test value mean of 33. Z test at 5 percent level revealed
significant difference between standard test value mean and actual mean. Hence it
can be inferred that the influence of marketing strategies was more than average in
commercial banks.
The mean score of PSBs was 34.99 with Std. Deviation of 5.4 and OPSBs
was 35.92 with Std. Deviation of 5.89 as against the standard test value mean of 33.
Z test revealed that at 5 percent level of significance there was no difference
between mean influence of PSBs and OPSBs. Hence it could be inferred that
marketing strategies in commercial banks were somewhat influential in both PSBs
and OPSBs.
The mean score of urban sample was 37.58 with Std Deviation 4.53, that of
semi-urban sample was 35.74, with Std. Deviation 5.36 and that of rural sample
was 32.59, with Std. Deviation 5.63, as against standard test value mean of 33.
While in urban and semi-urban branches the influence of marketing strategies was
above average, in rural branches it was just below average. ANOVA was
conducted to find out statistical significance of difference in mean scores. At 5
percent level F test revealed that there was significant difference in the mean scores
of sample customers of urban, semi-urban and rural branches. Post Hoc Tests and
pairwise multiple comparisons using Tukey’s honestly significant comparison test
was conducted at this stage to determine which means differ; details are shown in
Table 5.24.
Table 5.24
Details of Tukey’s HSD Test
1 2 3 2
Locations Significance Level Conclusion Difference
Urban – Semi-urban 0.003 Significant 1.8333(*)
Urban – Rural 0.000 Significant 4.9889(*)
Semi-urban – Rural 0.000 Significant 3.1556(*)
* The mean difference is significant at the .05 level
175
Tukey test also revealed that the difference in mean between urban and
semi-urban, urban and rural and semi-urban and rural branches were statistically
significant at the .05 level. Hence it can be inferred that the influence of marketing
strategies was significantly different in different locations.
Opinion about Aggressive Bank Marketing
As a new concept aggressive marketing is in extensive use in many banks,
especially in new generation banks in the form of aggressive lending and
mobilising deposits at higher rates of interest.. Sometimes banks are over
enthusiastic in selling their products. Opinion of customers about aggressive bank
marketing is shown in Table 5.25 and Table 5.26.
Table 5.25
Opinion about Aggressive Bank Marketing – Sectorwise
Sector
Yes No Total
Count % Count % Count %
Public 164 48.0 178 52.0 342 100
Private 47 26.4 131 73.6 178 100
Total 211 40.6 309 59.4 520 100
Pearson Chi-square value: 12.572 df: 1 Significant
Table 5.26
Opinion about Aggressive Bank Marketing – Locationwise
Sector
Yes No Total
Count % Count % Count %
Urban 92 51.7 86 48.3 178 100
Semi Urban 57 32.8 117 67.2 174 100
Rural 62 36.9 106 63.1 168 100
Total 211 40.6 309 59.4 520 100
Pearson Chi-square value: 15.147 df: 2 Significant
176
Of the sample, 40.6 percent favoured aggressive bank marketing while 59.4
percent opposed it. Sectorwise analysis also showed a picture that majority were
against aggressive marketing in banking. While 52 percent in PSBs opposed it, a
higher percentage i.e., 73.6 percent, in OPSBs opposed it.
In locationwise analysis almost majority (51.7 percent) in urban branches
favoured it. But majority in semi-urban branches (67.2 percent) and rural branches
(63.1 percent) opposed it. Many of them treated aggressive bank marketing of
New Generation Banks as encroachment into their freedom. So they oppose its
application in old commercial banks. Instead of aggressive marketing customers
expect proper and timely services and relationship marketing.
Chi-square test of independence at 5 percent level of significance revealed
that there was considerable difference in opinion in between respondents of PSBs
and OPSBs with regard to aggressive bank marketing. Chi-square test on locations
also revealed that there was considerable difference among urban, semi-urban and
rural branches with regard to it.
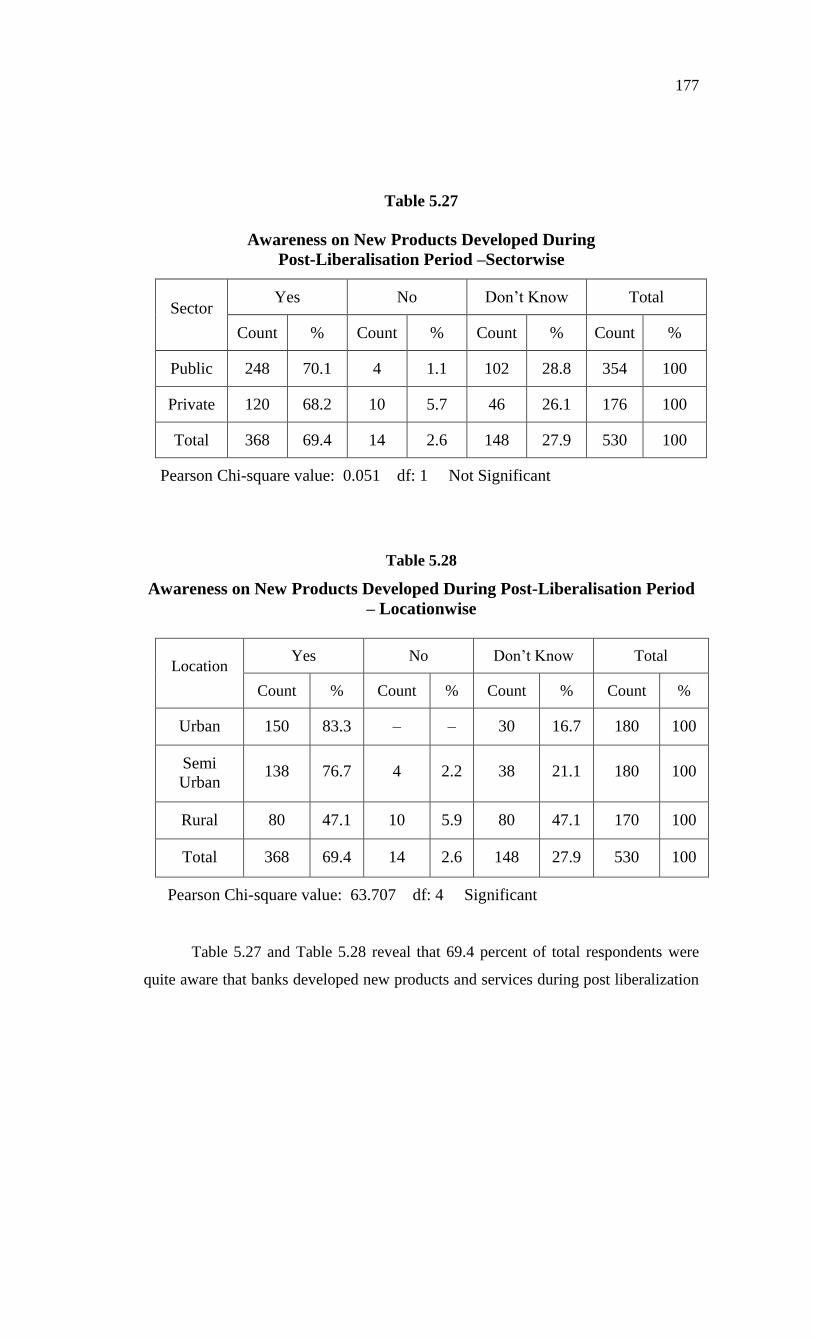
Awareness on New Products Developed During Post-Liberalisation Period
Many new products and services were developed by commercial banks for
facing competition and to attract customers during the post-liberalization period. An
enquiry was made with customers to find out their awareness level regarding new
products.
177
Table 5.27
Awareness on New Products Developed During
Post-Liberalisation Period –Sectorwise
Sector Yes No Don’t Know Total
Count % Count % Count % Count %
Public 248 70.1 4 1.1 102 28.8 354 100
Private 120 68.2 10 5.7 46 26.1 176 100
Total 368 69.4 14 2.6 148 27.9 530 100
Pearson Chi-square value: 0.051 df: 1 Not Significant
Table 5.28
Awareness on New Products Developed During Post-Liberalisation Period
– Locationwise
Location Yes No Don’t Know Total
Count % Count % Count % Count %
Urban 150 83.3 – – 30 16.7 180 100
Semi
Urban 138 76.7 4 2.2 38 21.1 180 100
Rural 80 47.1 10 5.9 80 47.1 170 100
Total 368 69.4 14 2.6 148 27.9 530 100
Pearson Chi-square value: 63.707 df: 4 Significant
Table 5.27 and Table 5.28 reveal that 69.4 percent of total respondents were
quite aware that banks developed new products and services during post liberalization
178
period. But 27.9 percent respondents were not aware about it. Sectorwise analysis
also show similar picture. In locationwise analysis it was found that the awareness of
rural respondents was quiet low (47.1 percent) and urban respondents were high (83.3
percent)
Chi-square test of independence at 5 percent level of significance revealed
that there was no considerable difference in the awareness of respondents of PSBs
and OPSBs. But chi-square test in location wise analysis revealed that the
difference was considerable among urban semi-urban, rural respondents.
Source of Knowledge about Products and Services Offered by the Bank
Banks are selling, simultaneously, their old or conventional products and
some new products. For many customers even old products are new for them.
Sometimes old products may be reshaped and presented as new products. Anyway
these are to be presented before prospective users in a convincing way. Sometimes
customers’ own initiatives pave the way for presentation of new products before
them, especially by the bank managers and other staff. To test the source of
knowledge, an enquiry was made to respondents regarding this. Many of the
respondents got knowledge from multiple sources. These responses were analysed
case by case on a multi response basis and percentages in each case reveal
proportion of respondents who got opportunity to get knowledge from different
sources.
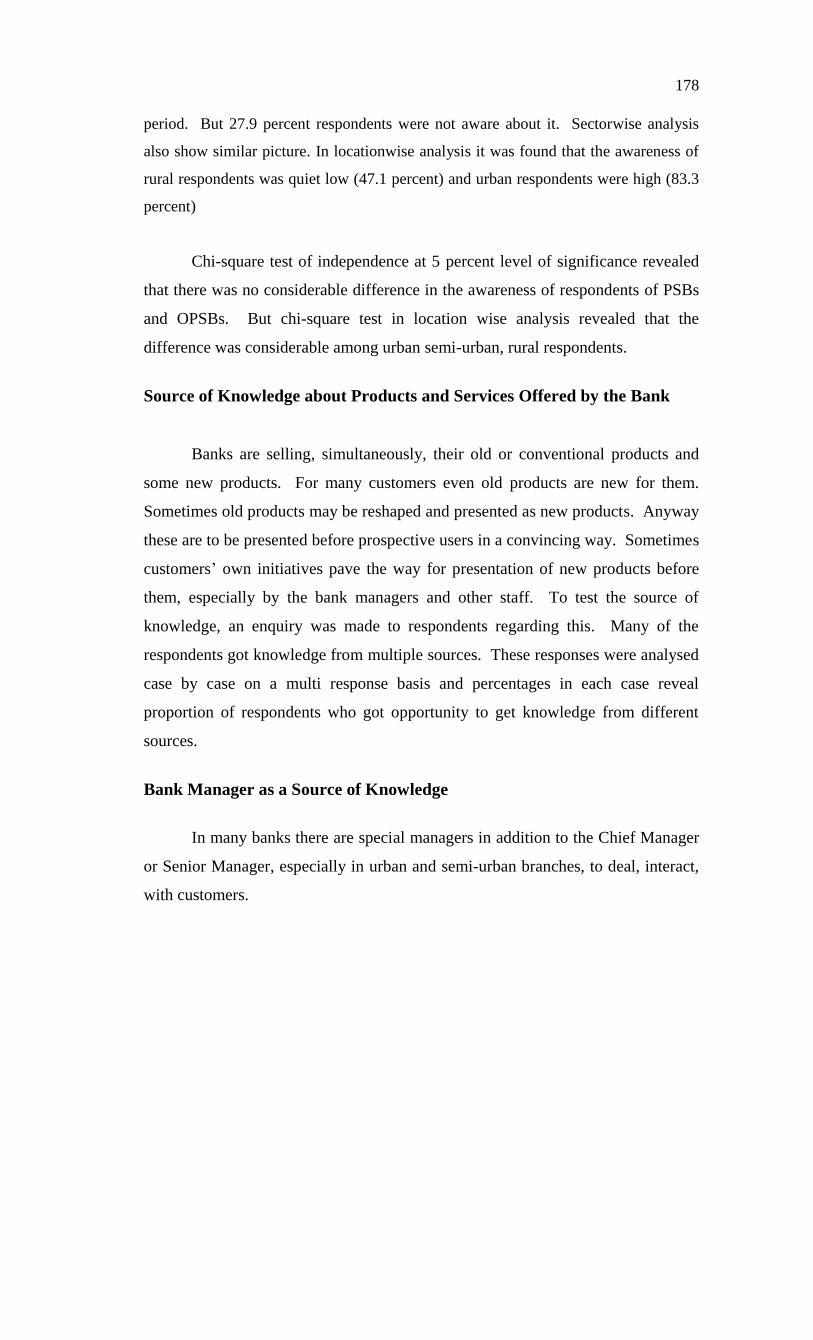
Bank Manager as a Source of Knowledge
In many banks there are special managers in addition to the Chief Manager
or Senior Manager, especially in urban and semi-urban branches, to deal, interact,
with customers.
179
Table 5.29
Bank Manager as a Source of Knowledge about
Products and Services – Sectorwise
Sector
Yes No Total
Count % Count % Count %
Public 220 63.6 126 36.4 346 100
Private 126 73.3 46 26.7 172 100
Total 346 66.8 172 33.2 518 100
Pearson Chi-square value: 2.423 df: 1 Not Significant
Table 5.30
Bank Manager as a Source of Knowledge about
Products and Services –Locationwise
Location Yes No Total
Count % Count % Count %
Urban 114 64.8 62 35.2 176 100
Semi Urban 128 74.4 44 25.6 172 100
Rural 104 61.2 66 38.8 170 100
Total 346 66.8 172 33.2 518 100
Pearson Chi-square value: 7.251 df: 2 Significant
It can be seen from Table 5.29 and 5.30 that, of the sample, 66.8 percent of
respondents got opportunity to collect information regarding bank products from
the managers. In PSBs the percentage was 63.6 percent while it was 73.3 percent
in OPSBs. In locationwise analysis, 64.8 percent in urban branches, 74.4 percent
in semi-urban branches and 61.2 percent in rural branches collected information
from managers. Managers of OPSBs and semi-urban branches are more
enthusiastic in introducing their products to customers.
180
Chi-square test of independence at 5 percent level of significance revealed
that there was no considerable difference between opinions of PSBs and OPSBs
with regard to manager as a source of knowledge about banking products. But chi-
square test on locations revealed that there was considerable difference in opinion
about managers of urban, semi-urban and rural branches with regard to this.
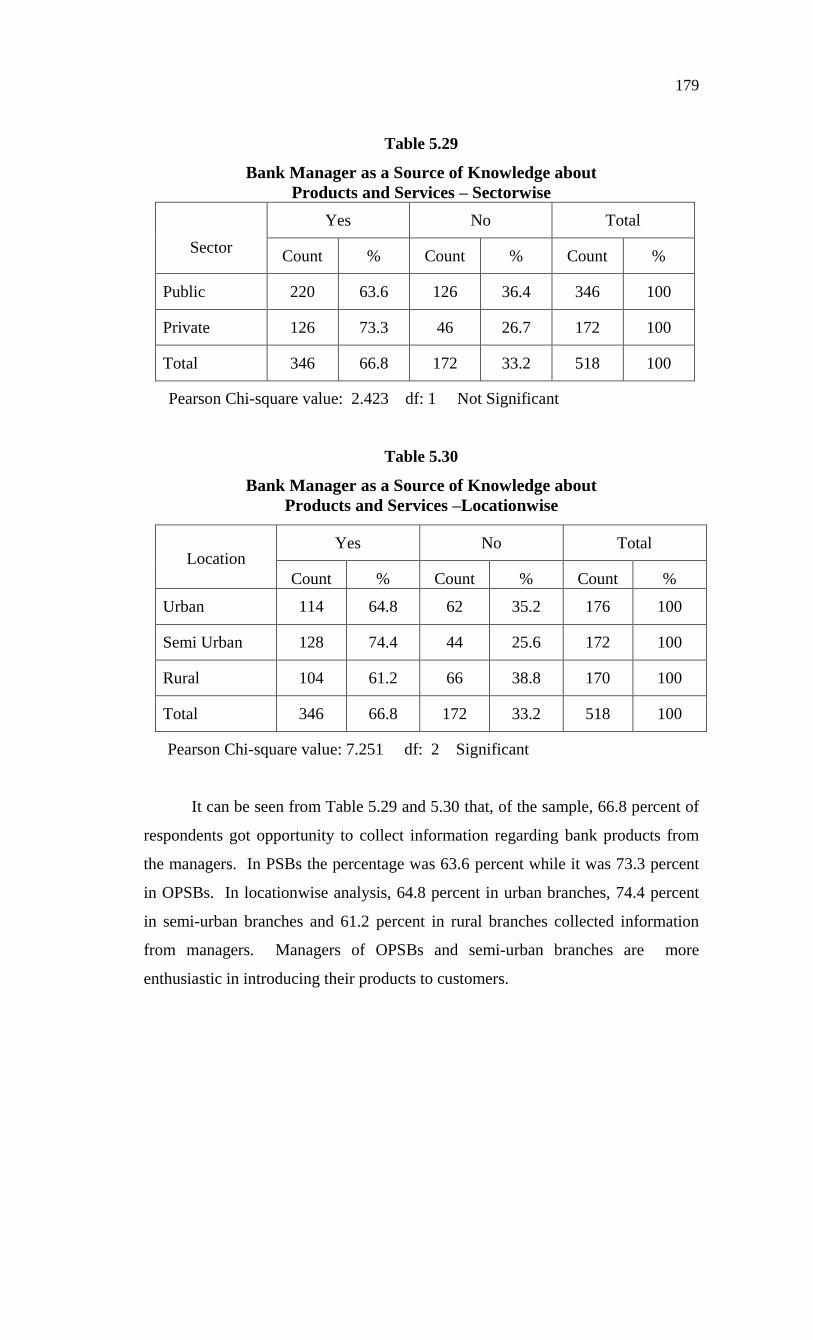
Bank Staff as a Source of Knowledge
Frontline staff, including supervisory staff, does a great job in introducing
products to prospective users.
Table 5.31
Bank Staff as Source of Knowledge about
Products and Services – Sectorwise
Sector Yes No Total
Count % Count % Count %
Public 256 73.1 94 26.9 350 100
Private 140 80.5 34 19.5 174 100
Total 396 75.6 128 24.4 524 100
Pearson Chi-square value: 1.874 df: 1 Not Significant
Table 5.32
Bank Staff as a Source of Knowledge about
Products and Services – Locationwise
Location Yes No Total
Count % Count % Count %
Urban 148 82.2 32 17.8 180 100
Semi Urban 142 81.6 32 18.4 174 100
Rural 106 62.4 64 37.6 170 100
Total 396 75.6 128 24.4 524 100
Pearson Chi-square value: 23.840 df: 2 Significant
181
Table 5.31 and 5.32 exhibit that 75.6 percent respondents got opportunity to
collect information regarding products from frontline staff, supervisory and
clerical. In PSBs 73.1 percent collected information from bank staff, while in
OPSBs 80.5 percent got this opportunity. This indicates that to some extent OPSB
staff is more active in introducing their products.
In locationwise analysis, it can be seen that 82.2 percent and 81.6 percent in
urban and semi–urban branches, respectively, got this opportunity. But only 62.4
percent in rural branches got it. The reason for this may be that sometime staff
members are not ready to explain things well to customers.
Chi-square test of independence 5 percent at level of significance revealed
that there was no considerable difference in the opinion of respondents of PSBs
and OPSBs with regard to bank staff as a source of knowledge. But in location
wise analysis, chi-square test revealed that there was significant difference among
urban, semi-urban and rural branches with regard to this.
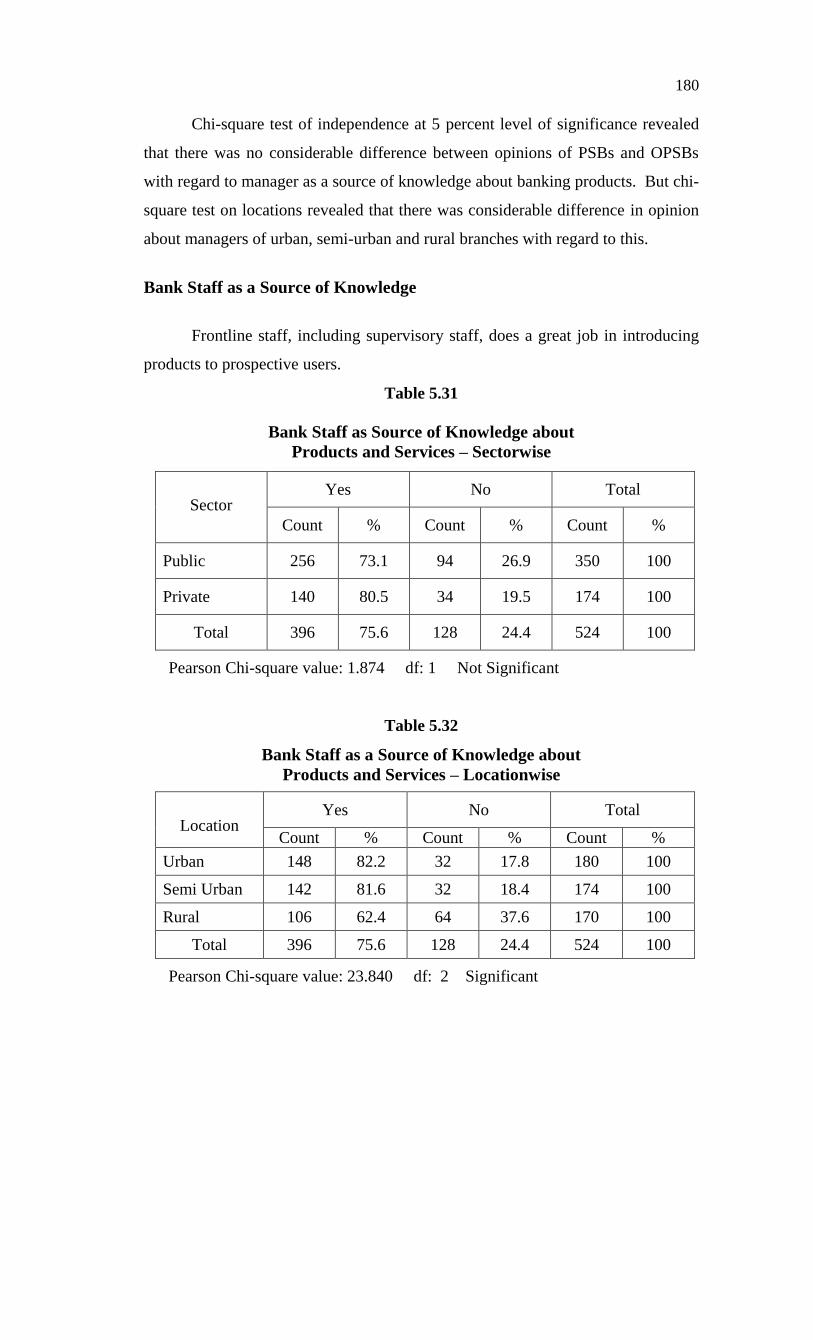
Pamphlets as a Source of Knowledge
Table 5.33
Pamphlets as a Source of Knowledge about
Products and Services – Sectorwise
Sector Yes No Total
Count % Count % Count %
Public 118 34.1 228 65.9 346 100
Private 54 31.0 120 69.0 174 100
Total 172 33.1 348 66.9 520 100
Pearson Chi-square value: 0.095 df: 1 Not Significant
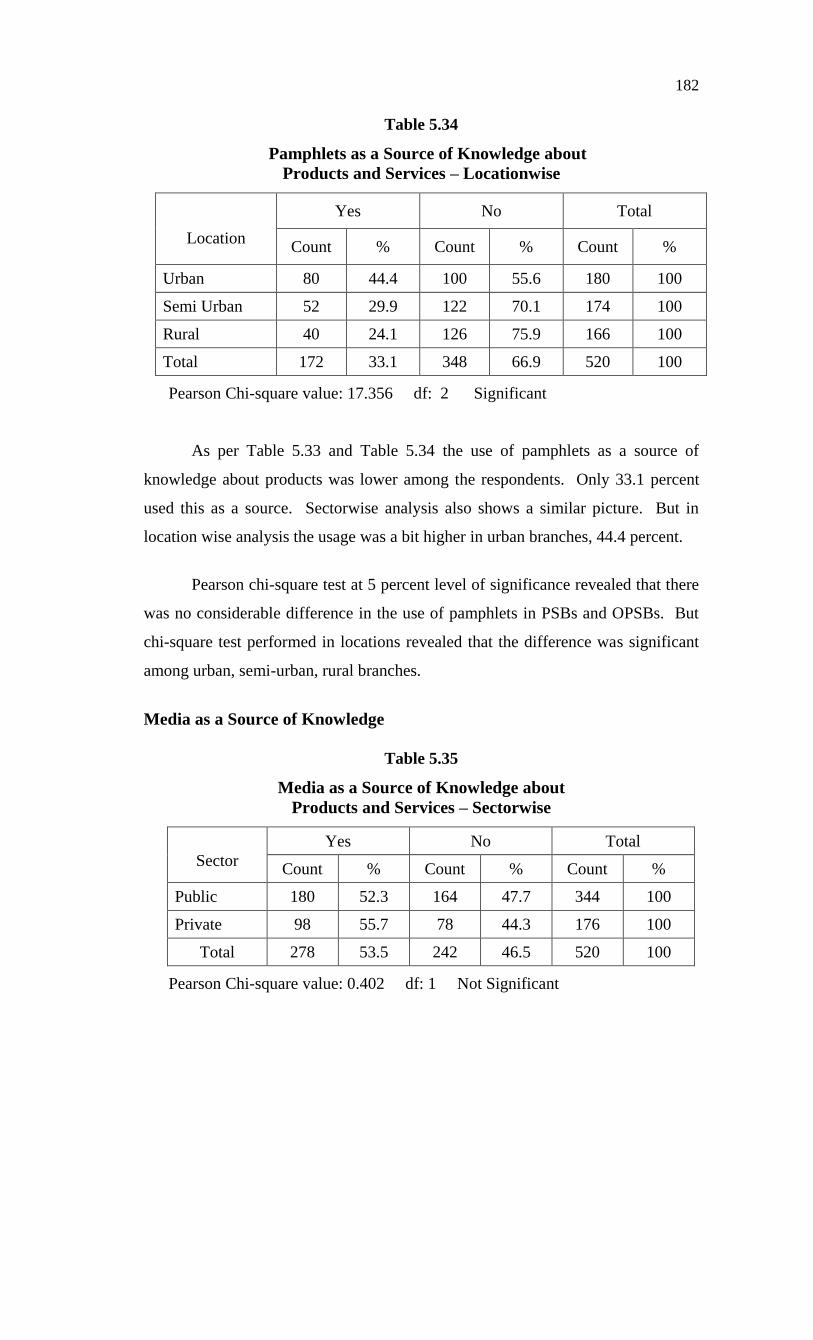
182
Table 5.34
Pamphlets as a Source of Knowledge about
Products and Services – Locationwise
Location
Yes No Total
Count % Count % Count %
Urban 80 44.4 100 55.6 180 100
Semi Urban 52 29.9 122 70.1 174 100
Rural 40 24.1 126 75.9 166 100
Total 172 33.1 348 66.9 520 100
Pearson Chi-square value: 17.356 df: 2 Significant
As per Table 5.33 and Table 5.34 the use of pamphlets as a source of
knowledge about products was lower among the respondents. Only 33.1 percent
used this as a source. Sectorwise analysis also shows a similar picture. But in
location wise analysis the usage was a bit higher in urban branches, 44.4 percent.
Pearson chi-square test at 5 percent level of significance revealed that there
was no considerable difference in the use of pamphlets in PSBs and OPSBs. But
chi-square test performed in locations revealed that the difference was significant
among urban, semi-urban, rural branches.
Media as a Source of Knowledge
Table 5.35
Media as a Source of Knowledge about
Products and Services – Sectorwise
Sector
Yes No Total
Count % Count % Count %
Public 180 52.3 164 47.7 344 100
Private 98 55.7 78 44.3 176 100
Total 278 53.5 242 46.5 520 100
Pearson Chi-square value: 0.402 df: 1 Not Significant
183
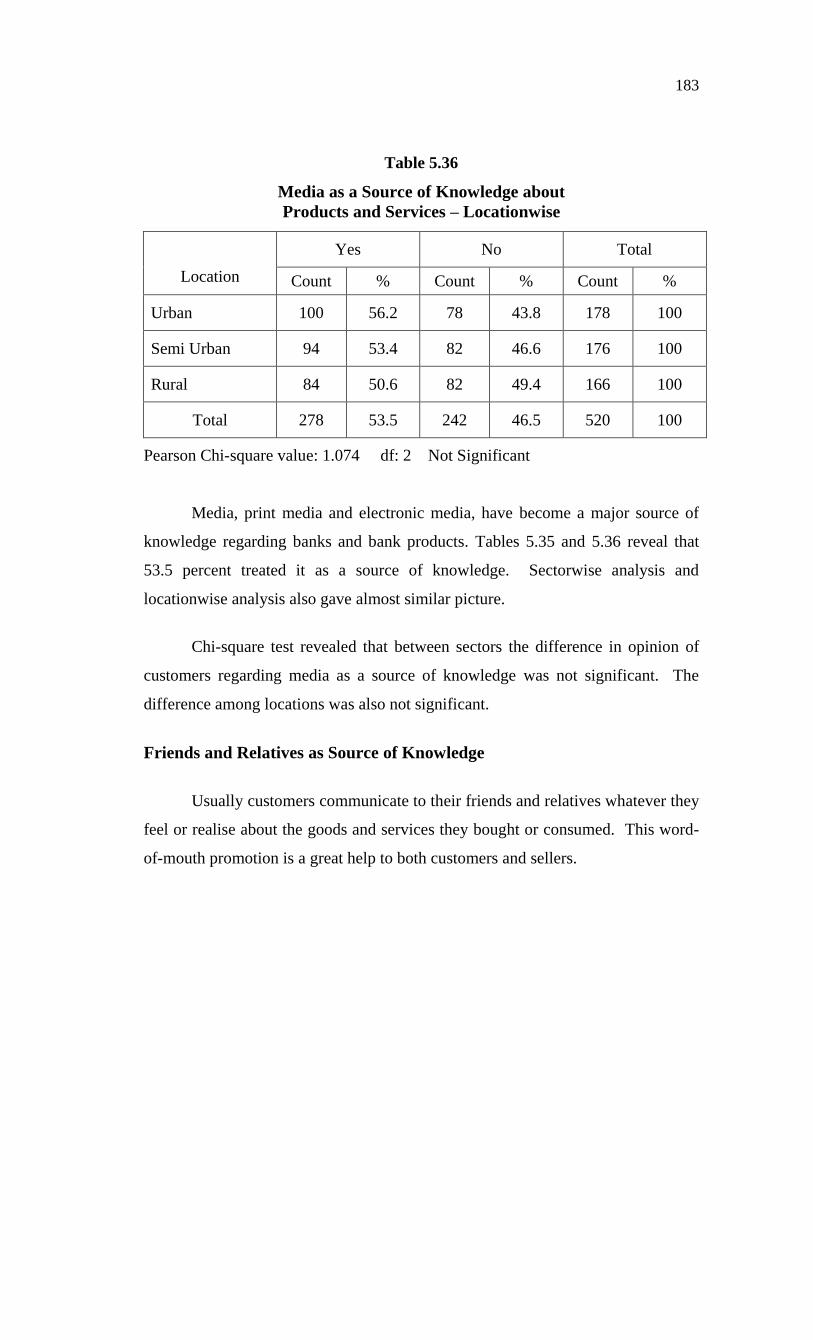
Table 5.36
Media as a Source of Knowledge about
Products and Services – Locationwise
Location
Yes No Total
Count % Count % Count %
Urban 100 56.2 78 43.8 178 100
Semi Urban 94 53.4 82 46.6 176 100
Rural 84 50.6 82 49.4 166 100
Total 278 53.5 242 46.5 520 100
Pearson Chi-square value: 1.074 df: 2 Not Significant
Media, print media and electronic media, have become a major source of
knowledge regarding banks and bank products. Tables 5.35 and 5.36 reveal that
53.5 percent treated it as a source of knowledge. Sectorwise analysis and
locationwise analysis also gave almost similar picture.
Chi-square test revealed that between sectors the difference in opinion of
customers regarding media as a source of knowledge was not significant. The
difference among locations was also not significant.
Friends and Relatives as Source of Knowledge
Usually customers communicate to their friends and relatives whatever they
feel or realise about the goods and services they bought or consumed. This word-
of-mouth promotion is a great help to both customers and sellers.
184
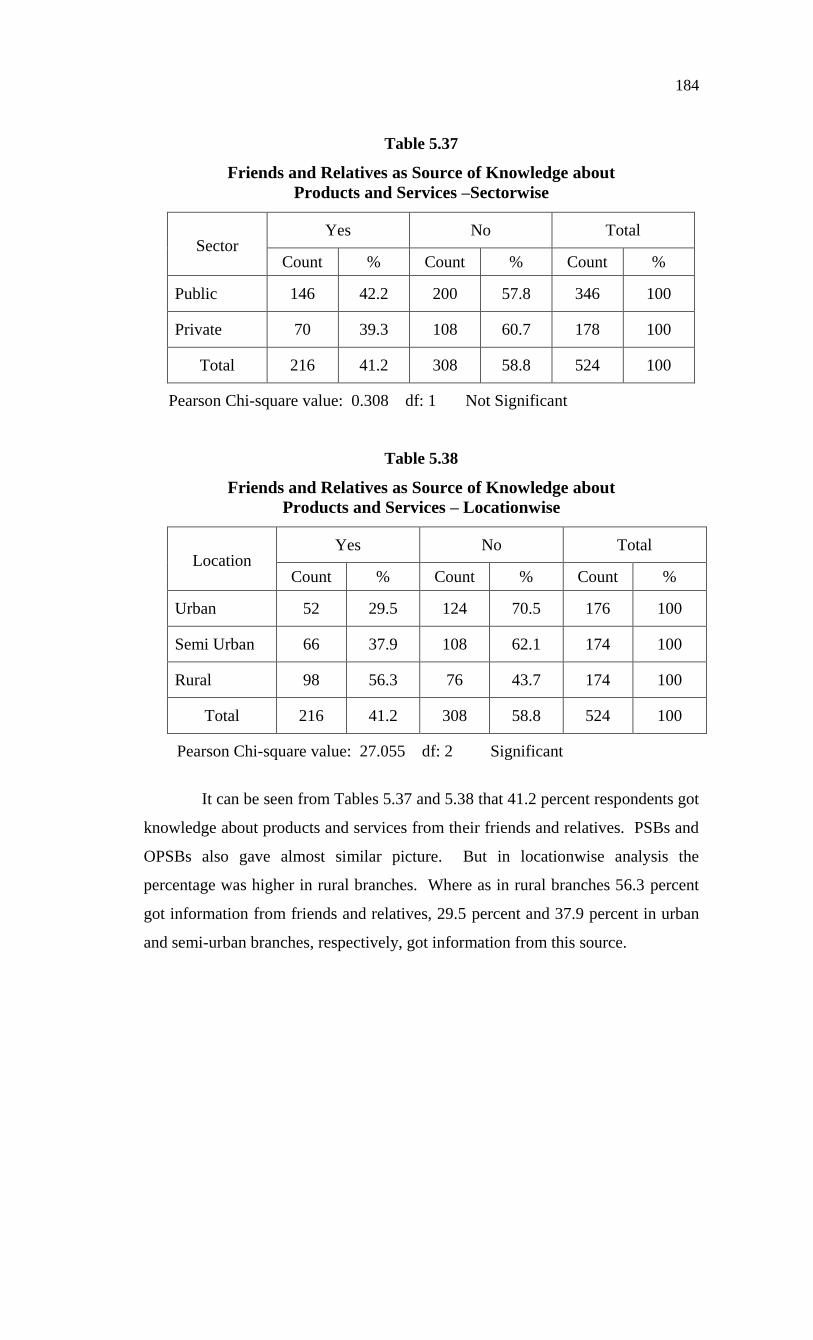
Table 5.37
Friends and Relatives as Source of Knowledge about
Products and Services –Sectorwise
Sector Yes No Total
Count % Count % Count %
Public 146 42.2 200 57.8 346 100
Private 70 39.3 108 60.7 178 100
Total 216 41.2 308 58.8 524 100
Pearson Chi-square value: 0.308 df: 1 Not Significant
Table 5.38
Friends and Relatives as Source of Knowledge about
Products and Services – Locationwise
Location Yes No Total
Count % Count % Count %
Urban 52 29.5 124 70.5 176 100
Semi Urban 66 37.9 108 62.1 174 100
Rural 98 56.3 76 43.7 174 100
Total 216 41.2 308 58.8 524 100
Pearson Chi-square value: 27.055 df: 2 Significant
It can be seen from Tables 5.37 and 5.38 that 41.2 percent respondents got
knowledge about products and services from their friends and relatives. PSBs and
OPSBs also gave almost similar picture. But in locationwise analysis the
percentage was higher in rural branches. Where as in rural branches 56.3 percent
got information from friends and relatives, 29.5 percent and 37.9 percent in urban
and semi-urban branches, respectively, got information from this source.
185
Chi-square test of independence at 5 percent level of significance revealed
that there was no difference in the opinion of PSB and OPSB personnel regarding
friends and relatives as a source of knowledge. But the chi-square test performed
on location analysis revealed that there was considerable difference among urban,
semi-urban, rural personnel with regard to friends and relatives as a source of
knowledge.
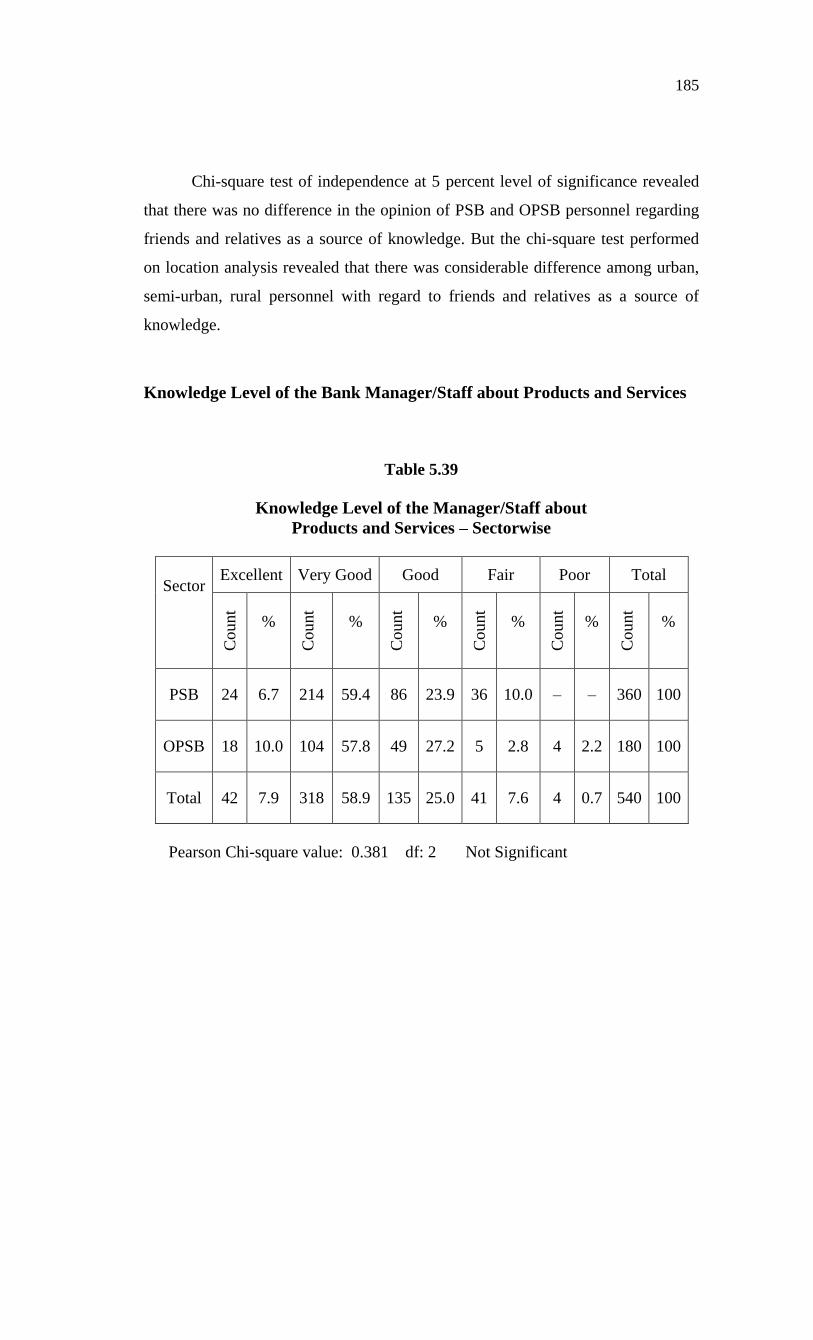
Knowledge Level of the Bank Manager/Staff about Products and Services
Table 5.39
Knowledge Level of the Manager/Staff about
Products and Services – Sectorwise
Sector Excellent Very Good Good Fair Poor Total
Count
%
Count
%
Count
%
Count
%
Count
%
Count
%
PSB 24 6.7 214 59.4 86 23.9 36 10.0 – – 360 100
OPSB 18 10.0 104 57.8 49 27.2 5 2.8 4 2.2 180 100
Total 42 7.9 318 58.9 135 25.0 41 7.6 4 0.7 540 100
Pearson Chi-square value: 0.381 df: 2 Not Significant
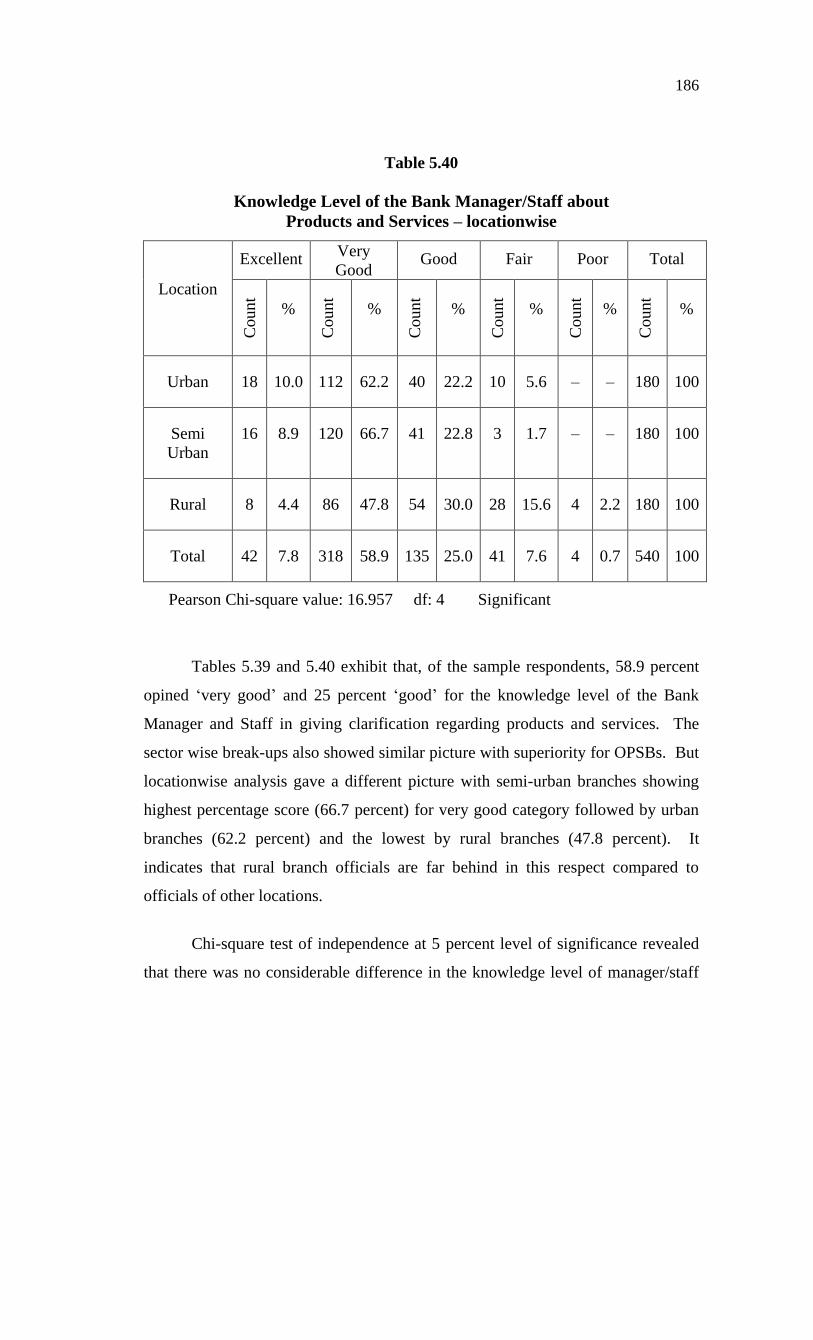
186
Table 5.40
Knowledge Level of the Bank Manager/Staff about
Products and Services – locationwise
Location
Excellent Very
Good Good Fair Poor Total
Count
%
Count
%
Count
%
Count
%
Count
%
Count
%
Urban 18 10.0 112 62.2 40 22.2 10 5.6 – – 180 100
Semi
Urban
16 8.9 120 66.7 41 22.8 3 1.7 – – 180 100
Rural 8 4.4 86 47.8 54 30.0 28 15.6 4 2.2 180 100
Total 42 7.8 318 58.9 135 25.0 41 7.6 4 0.7 540 100
Pearson Chi-square value: 16.957 df: 4 Significant
Tables 5.39 and 5.40 exhibit that, of the sample respondents, 58.9 percent
opined ‘very good’ and 25 percent ‘good’ for the knowledge level of the Bank
Manager and Staff in giving clarification regarding products and services. The
sector wise break-ups also showed similar picture with superiority for OPSBs. But
locationwise analysis gave a different picture with semi-urban branches showing
highest percentage score (66.7 percent) for very good category followed by urban
branches (62.2 percent) and the lowest by rural branches (47.8 percent). It
indicates that rural branch officials are far behind in this respect compared to
officials of other locations.
Chi-square test of independence at 5 percent level of significance revealed
that there was no considerable difference in the knowledge level of manager/staff
187
of PSBs and OPSBs. But chi-square test on locations revealed that there was
considerable difference among urban, semi-urban and rural branches in this regard.
Opinion of Bank Personnel on Marketing Strategy
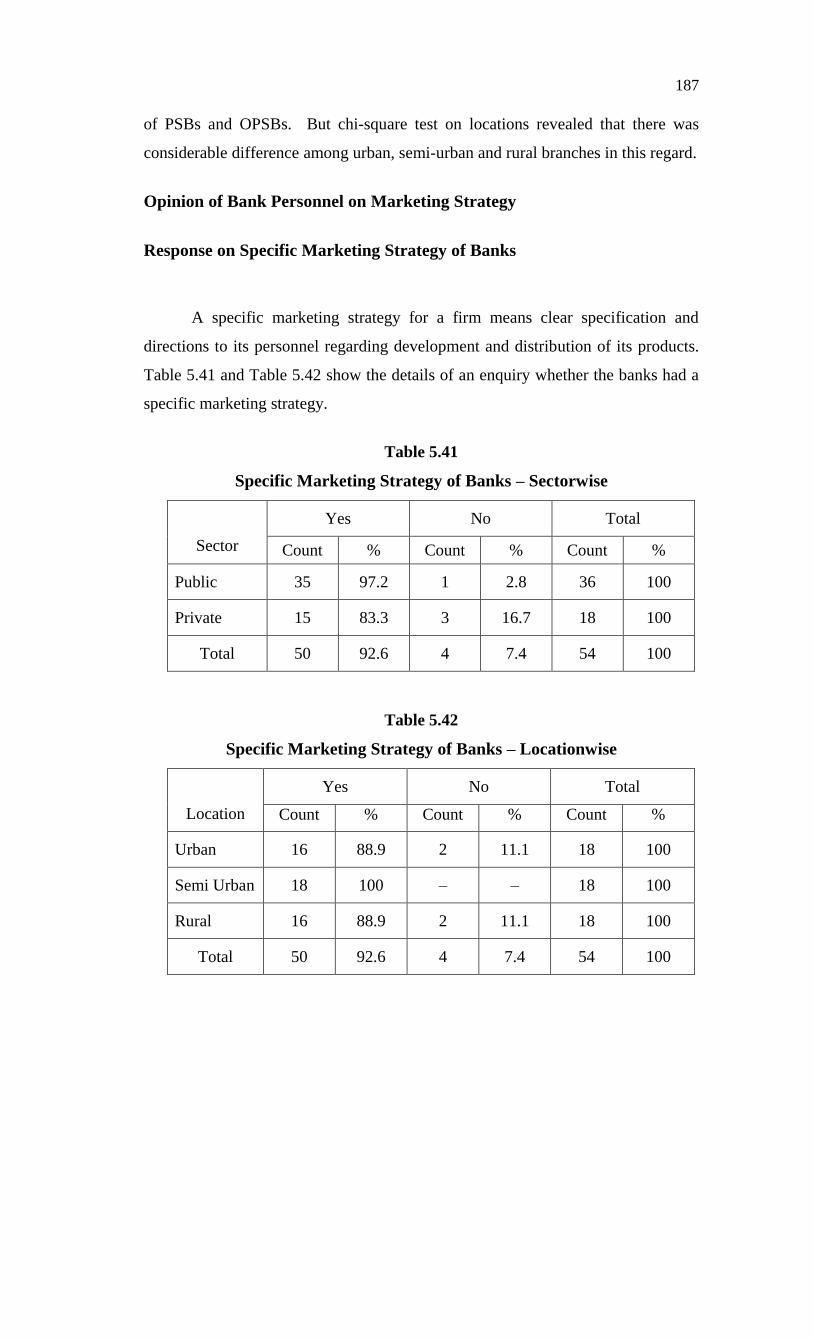
Response on Specific Marketing Strategy of Banks
A specific marketing strategy for a firm means clear specification and
directions to its personnel regarding development and distribution of its products.
Table 5.41 and Table 5.42 show the details of an enquiry whether the banks had a
specific marketing strategy.
Table 5.41
Specific Marketing Strategy of Banks – Sectorwise
Sector
Yes No Total
Count % Count % Count %
Public 35 97.2 1 2.8 36 100
Private 15 83.3 3 16.7 18 100
Total 50 92.6 4 7.4 54 100
Table 5.42
Specific Marketing Strategy of Banks – Locationwise
Location
Yes No Total
Count % Count % Count %
Urban 16 88.9 2 11.1 18 100
Semi Urban 18 100 – – 18 100
Rural 16 88.9 2 11.1 18 100
Total 50 92.6 4 7.4 54 100
188
Tables 5.41 and 5.42 show that 92.6 percent bank personnel opined that
their bank had a specific marketing strategy. In sectorwise analysis it was found
that 97.2 percent in PSBs and 83.3 percent in OPSBs knew about their banks
marketing strategy. In locationwise analysis 100 percent in semi-urban branches
and 88.9 percent in urban and rural branches knew about their banks’ specific
marketing strategy.
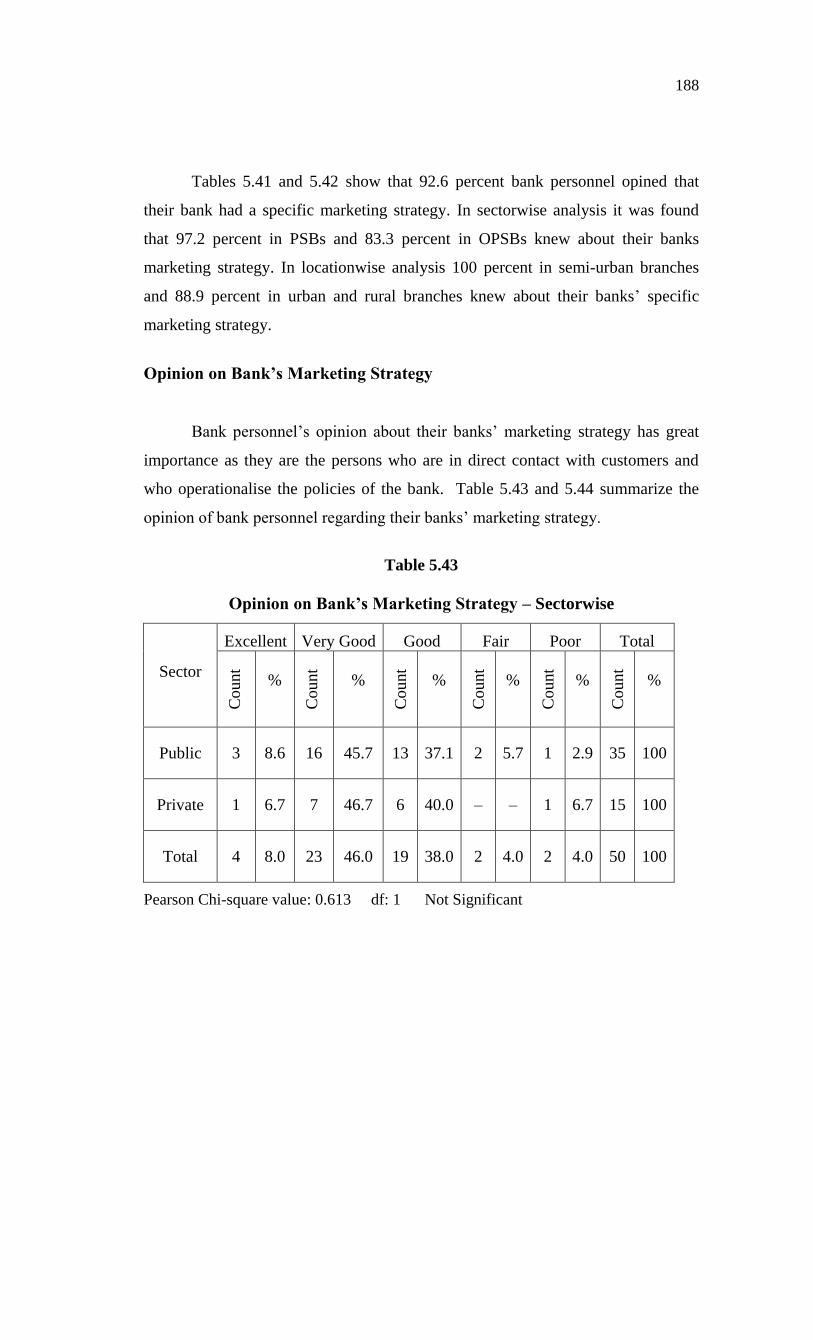
Opinion on Bank’s Marketing Strategy
Bank personnel’s opinion about their banks’ marketing strategy has great
importance as they are the persons who are in direct contact with customers and
who operationalise the policies of the bank. Table 5.43 and 5.44 summarize the
opinion of bank personnel regarding their banks’ marketing strategy.
Table 5.43
Opinion on Bank’s Marketing Strategy – Sectorwise
Sector
Excellent Very Good Good Fair Poor Total
Count
%
Count
%
Count
%
Count
%
Count
%
Count
%
Public 3 8.6 16 45.7 13 37.1 2 5.7 1 2.9 35 100
Private 1 6.7 7 46.7 6 40.0 – – 1 6.7 15 100
Total 4 8.0 23 46.0 19 38.0 2 4.0 2 4.0 50 100
Pearson Chi-square value: 0.613 df: 1 Not Significant
189
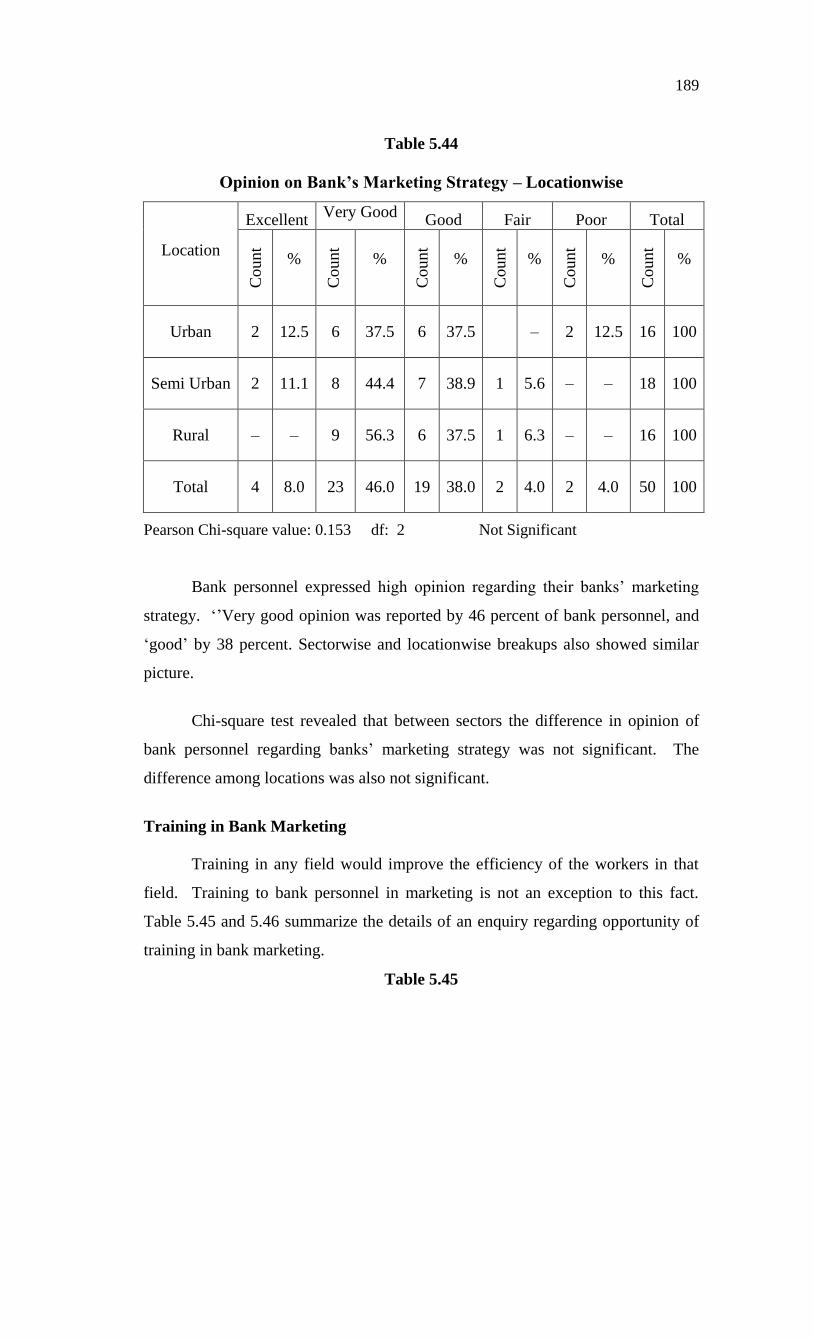
Table 5.44
Opinion on Bank’s Marketing Strategy – Locationwise
Location
Excellent Very Good
Good Fair Poor Total
Count
%
Count
%
Count
%
Count
%
Count
%
Count
%
Urban 2 12.5 6 37.5 6 37.5 – 2 12.5 16 100
Semi Urban 2 11.1 8 44.4 7 38.9 1 5.6 – – 18 100
Rural – – 9 56.3 6 37.5 1 6.3 – – 16 100
Total 4 8.0 23 46.0 19 38.0 2 4.0 2 4.0 50 100
Pearson Chi-square value: 0.153 df: 2 Not Significant
Bank personnel expressed high opinion regarding their banks’ marketing
strategy. ‘’Very good opinion was reported by 46 percent of bank personnel, and
‘good’ by 38 percent. Sectorwise and locationwise breakups also showed similar
picture.
Chi-square test revealed that between sectors the difference in opinion of
bank personnel regarding banks’ marketing strategy was not significant. The
difference among locations was also not significant.
Training in Bank Marketing
Training in any field would improve the efficiency of the workers in that
field. Training to bank personnel in marketing is not an exception to this fact.
Table 5.45 and 5.46 summarize the details of an enquiry regarding opportunity of
training in bank marketing.
Table 5.45
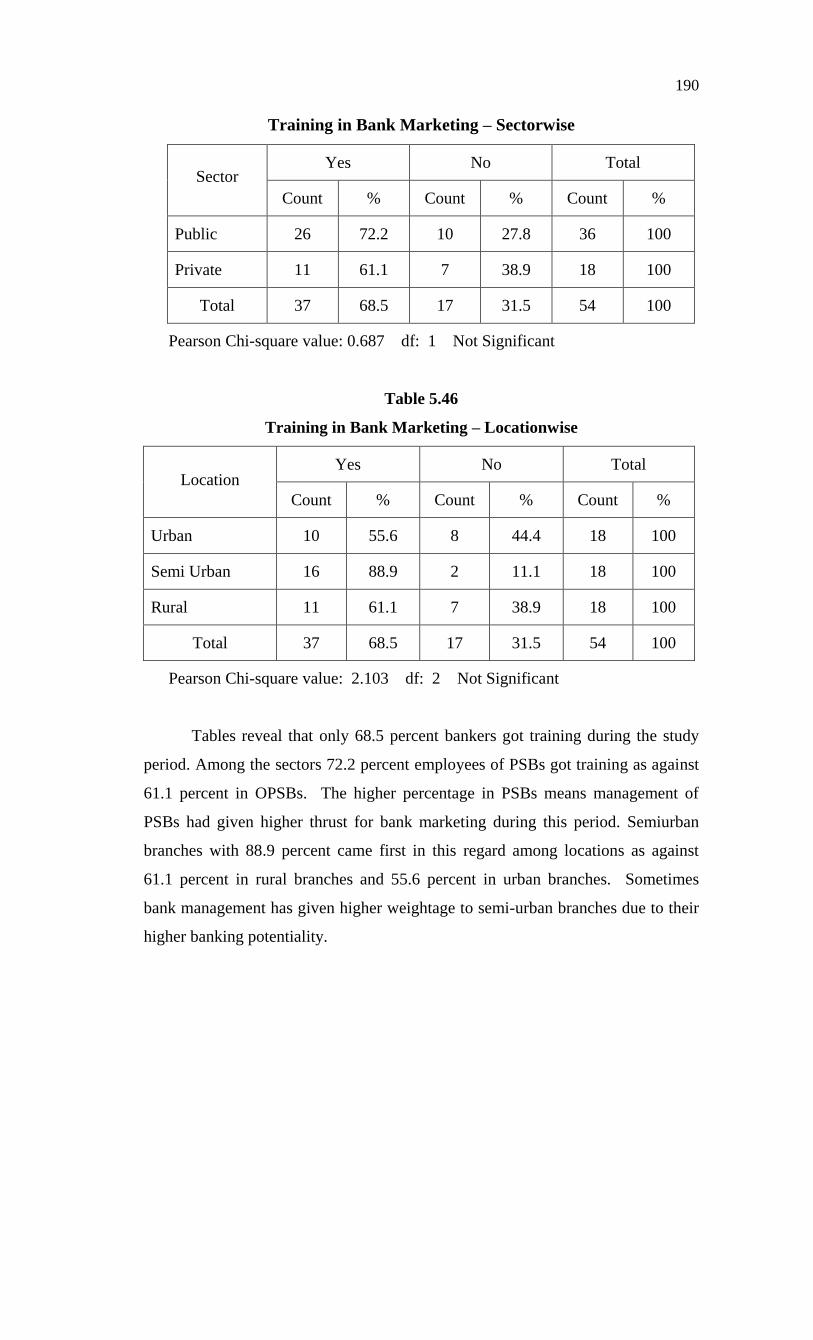
190
Training in Bank Marketing – Sectorwise
Sector Yes No Total
Count % Count % Count %
Public 26 72.2 10 27.8 36 100
Private 11 61.1 7 38.9 18 100
Total 37 68.5 17 31.5 54 100
Pearson Chi-square value: 0.687 df: 1 Not Significant
Table 5.46
Training in Bank Marketing – Locationwise
Location Yes No Total
Count % Count % Count %
Urban 10 55.6 8 44.4 18 100
Semi Urban 16 88.9 2 11.1 18 100
Rural 11 61.1 7 38.9 18 100
Total 37 68.5 17 31.5 54 100
Pearson Chi-square value: 2.103 df: 2 Not Significant
Tables reveal that only 68.5 percent bankers got training during the study
period. Among the sectors 72.2 percent employees of PSBs got training as against
61.1 percent in OPSBs. The higher percentage in PSBs means management of
PSBs had given higher thrust for bank marketing during this period. Semiurban
branches with 88.9 percent came first in this regard among locations as against
61.1 percent in rural branches and 55.6 percent in urban branches. Sometimes
bank management has given higher weightage to semi-urban branches due to their
higher banking potentiality.
191
Chi-square test on sectors revealed that there was no significant difference
between PSBs and OPSBs regarding training to bank personnel. Likewise, the
difference among locations was also not considerable.
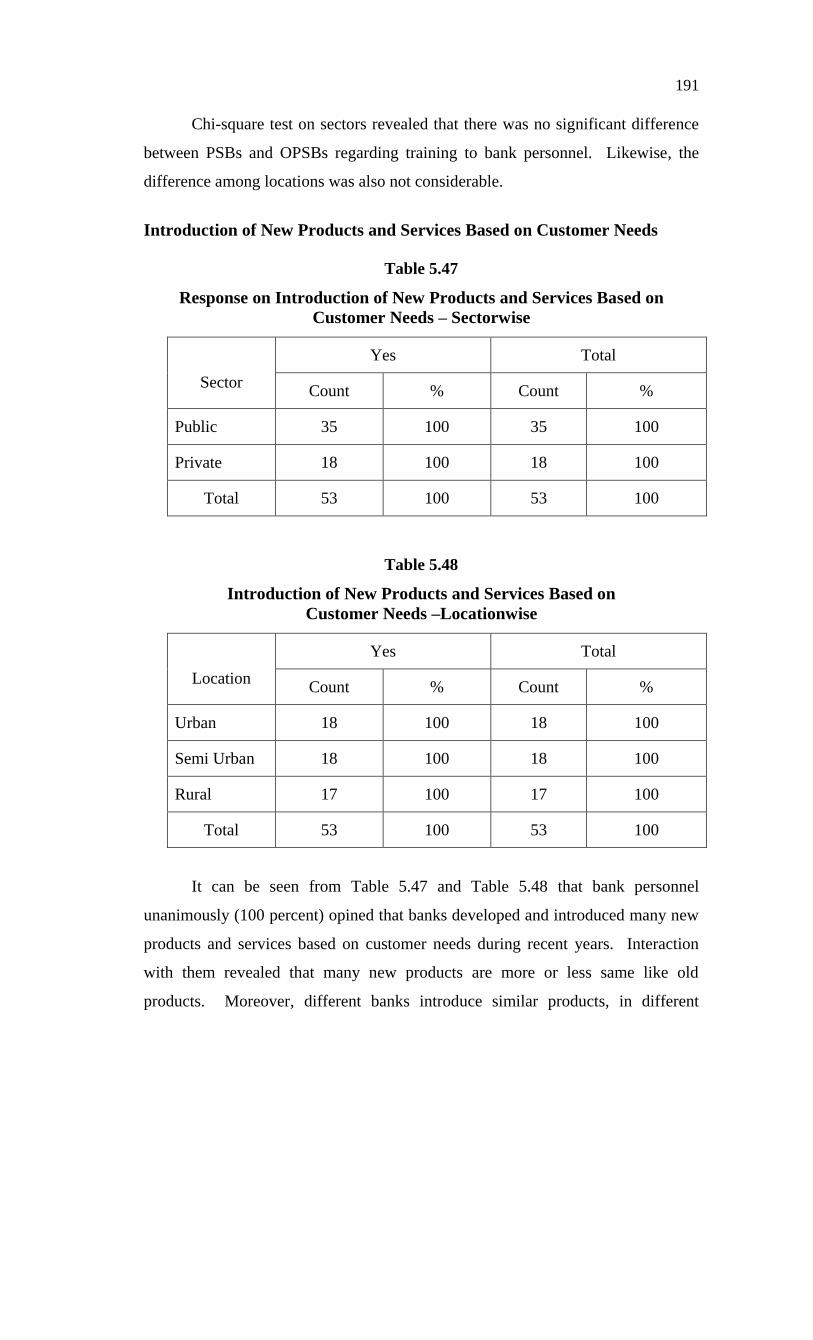
Introduction of New Products and Services Based on Customer Needs
Table 5.47
Response on Introduction of New Products and Services Based on
Customer Needs – Sectorwise
Sector
Yes Total
Count % Count %
Public 35 100 35 100
Private 18 100 18 100
Total 53 100 53 100
Table 5.48
Introduction of New Products and Services Based on
Customer Needs –Locationwise
Location
Yes Total
Count % Count %
Urban 18 100 18 100
Semi Urban 18 100 18 100
Rural 17 100 17 100
Total 53 100 53 100
It can be seen from Table 5.47 and Table 5.48 that bank personnel
unanimously (100 percent) opined that banks developed and introduced many new
products and services based on customer needs during recent years. Interaction
with them revealed that many new products are more or less same like old
products. Moreover, different banks introduce similar products, in different
192
names. Even then they have a special charm in attracting customers. However,
customization of products i.e., developing products according to an individual
customer’s needs, as in new generation banks, is not yet in practice in old
commercial banks.
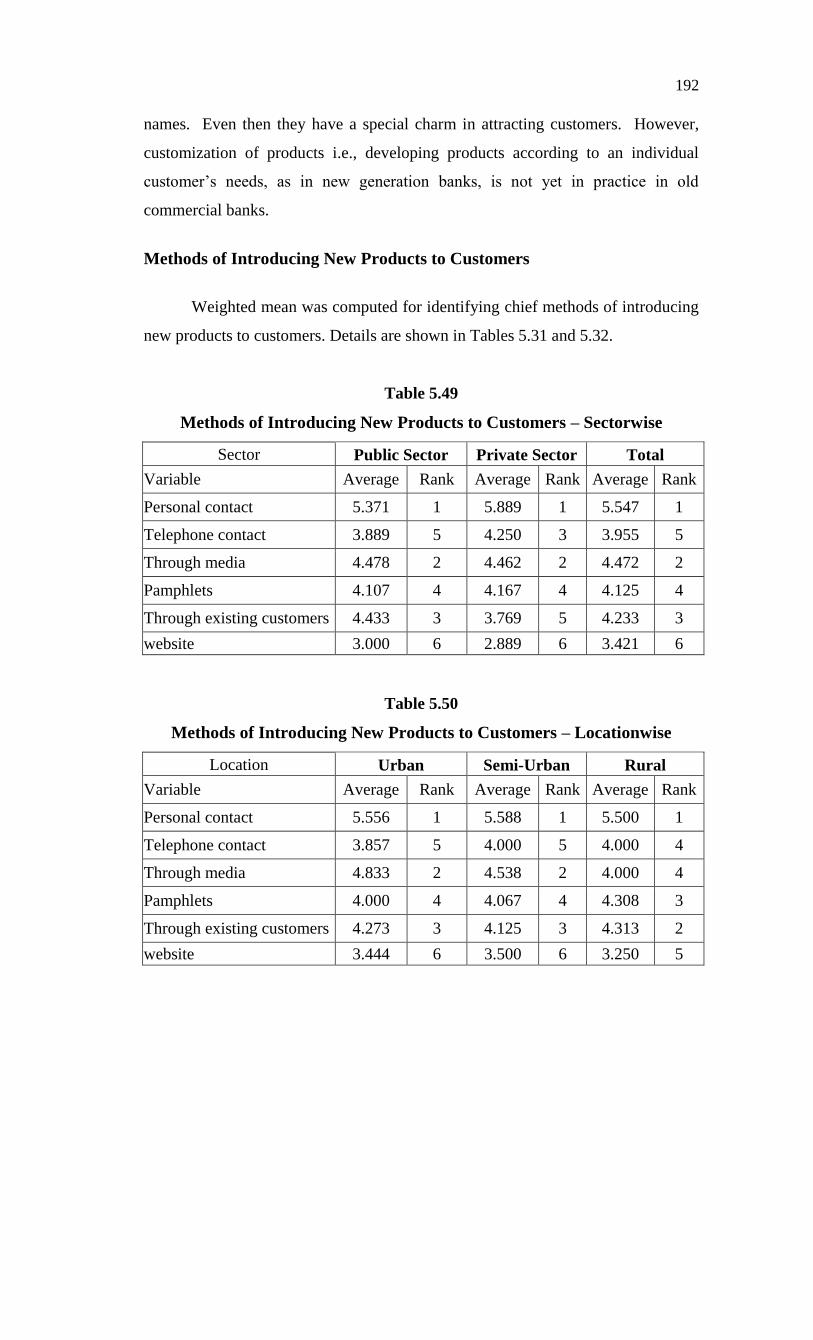
Methods of Introducing New Products to Customers
Weighted mean was computed for identifying chief methods of introducing
new products to customers. Details are shown in Tables 5.31 and 5.32.
Table 5.49
Methods of Introducing New Products to Customers – Sectorwise
Sector Public Sector Private Sector Total
Variable Average Rank Average Rank Average Rank
Personal contact 5.371 1 5.889 1 5.547 1
Telephone contact 3.889 5 4.250 3 3.955 5
Through media 4.478 2 4.462 2 4.472 2
Pamphlets 4.107 4 4.167 4 4.125 4
Through existing customers 4.433 3 3.769 5 4.233 3
website 3.000 6 2.889 6 3.421 6
Table 5.50
Methods of Introducing New Products to Customers – Locationwise
Location Urban Semi-Urban Rural
Variable Average Rank Average Rank Average Rank
Personal contact 5.556 1 5.588 1 5.500 1
Telephone contact 3.857 5 4.000 5 4.000 4
Through media 4.833 2 4.538 2 4.000 4
Pamphlets 4.000 4 4.067 4 4.308 3
Through existing customers 4.273 3 4.125 3 4.313 2
website 3.444 6 3.500 6 3.250 5
193
The first method selected was ‘Personal contact’, second ‘Media’, third
‘Existing customers’ and fourth place for ‘Pamphlets’. Even in sectorwise break
ups ‘Personal contact’ and ‘Media’ ranked first and second in both PSBs and
OPSBs. The third position was for ‘Existing customers’ in PSBs and ‘Telephone
contact’ in OPSBs. ‘Pamphlets’ ranked fourth in both sectors.
Locationwise analysis revealed that in all locations ‘personal contact’ was
the first method. With regard to second position in urban and semi-urban branches
‘Media’ was the choice as against ‘Existing customers’ in rural branches. The
third choice was ‘Existing customers’ in urban and semi-urban branches while
‘Pamphlets’ was in rural branches.
Effectiveness of Various Marketing Strategies
Bank personnel are in direct contact with customers and so they are
competent to talk about the effectiveness of various marketing strategies
efficiently. In order to measure the effectiveness of various marketing strategies
11 major factors were taken into consideration. A five point rate scale with Very
high, High, Average, Low and Very Low as points, was used to express
employees’ opinion on each strategy. The marketing strategies considered in this
regard were innovative banking products, price mix, place mix, physical attraction,
customer relationship, advertisements, public relation, personal selling,
professionalism, contact campaigns and loan melas and technological changes.
Mean Effectiveness of Marketing Strategies
In order to measure the combined effectiveness of various marketing
strategies according to bank personnel, ‘mean effectiveness’ was computed. Five
point rating scale was used for computing ‘mean effectiveness’ of marketing
strategies. Values were assigned for each level of effectiveness – five for ‘very high
effectiveness’, four for ‘high effectiveness’, three for ‘average effectiveness’, two
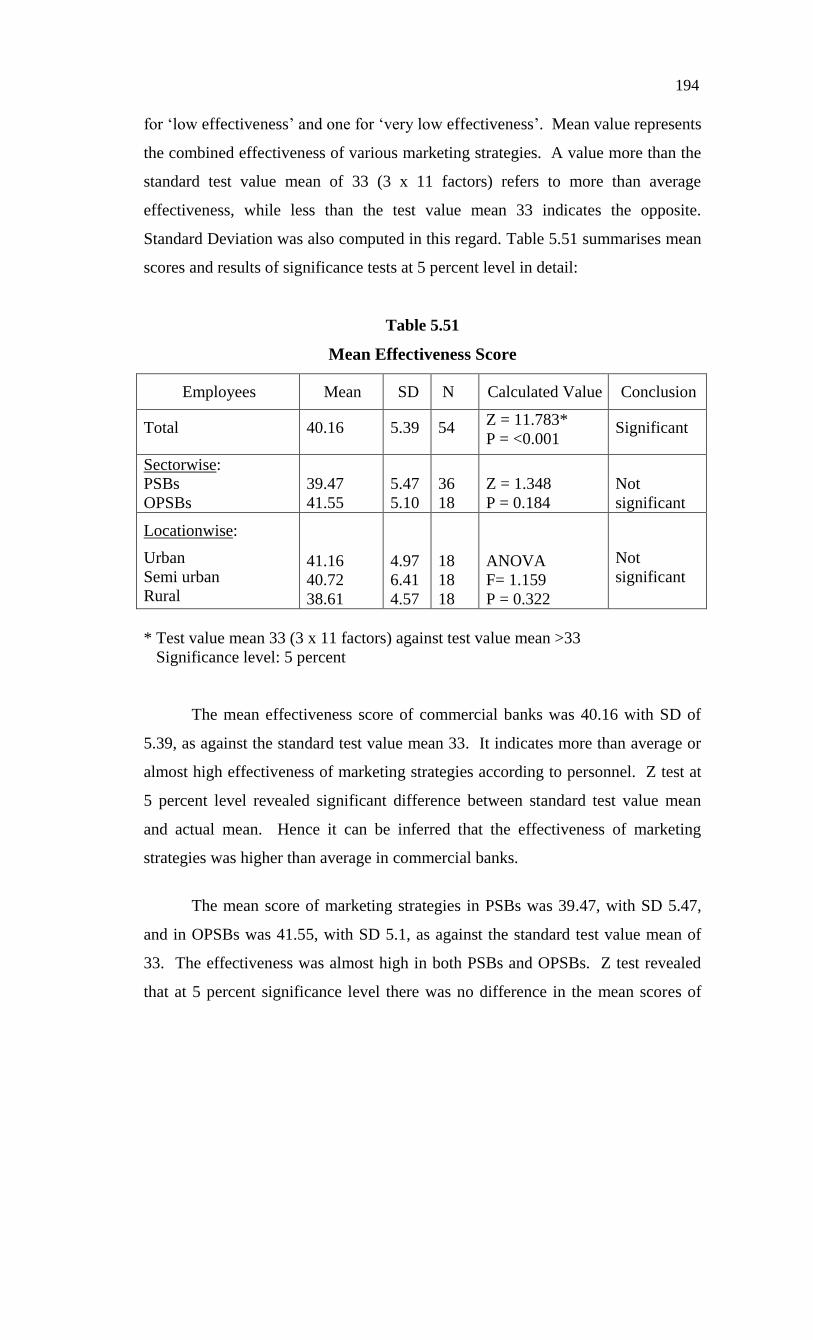
194
for ‘low effectiveness’ and one for ‘very low effectiveness’. Mean value represents
the combined effectiveness of various marketing strategies. A value more than the
standard test value mean of 33 (3 x 11 factors) refers to more than average
effectiveness, while less than the test value mean 33 indicates the opposite.
Standard Deviation was also computed in this regard. Table 5.51 summarises mean
scores and results of significance tests at 5 percent level in detail:
Table 5.51
Mean Effectiveness Score
Employees Mean SD N Calculated Value Conclusion
Total 40.16 5.39 54 Z = 11.783*
P = <0.001 Significant
Sectorwise:
PSBs
OPSBs
39.47
41.55
5.47
5.10
36
18
Z = 1.348
P = 0.184
Not
significant
Locationwise:
Urban
Semi urban
Rural
41.16
40.72
38.61
4.97
6.41
4.57
18
18
18
ANOVA
F= 1.159
P = 0.322
Not
significant
* Test value mean 33 (3 x 11 factors) against test value mean >33
Significance level: 5 percent
The mean effectiveness score of commercial banks was 40.16 with SD of
5.39, as against the standard test value mean 33. It indicates more than average or
almost high effectiveness of marketing strategies according to personnel. Z test at
5 percent level revealed significant difference between standard test value mean
and actual mean. Hence it can be inferred that the effectiveness of marketing
strategies was higher than average in commercial banks.
The mean score of marketing strategies in PSBs was 39.47, with SD 5.47,
and in OPSBs was 41.55, with SD 5.1, as against the standard test value mean of
33. The effectiveness was almost high in both PSBs and OPSBs. Z test revealed
that at 5 percent significance level there was no difference in the mean scores of
195
PSBs and OPSBs. Hence it can be inferred that marketing strategies are effective in
both PSBs and OPSBs and the effectiveness was not significantly different in
sectors.
The mean score of marketing strategies in urban branches was 41.16, with
SD 4.97, in semi-urban branches was 40.72, with SD 6.41, and in rural branches
was 38.61, with S.D. 4.57, as against the standard test value mean of 33. It
indicates that the effectiveness of marketing strategies was almost high in all
locations. ANOVA at 5 percent level revealed that there was no significant
difference in the mean scores of urban, semi-urban and rural branches with regard
to effectiveness of marketing strategies. Hence it can be inferred that marketing
strategies are effective in urban, semi-urban and rural branches and the
effectiveness was not significantly different in locations. This is quite different
from the opinion of customers.
Opinion on Need for New Bank Marketing Strategies
Customers are so demanding while dealing with banks. So, modern banks
are adapting themselves to their customers’ requirements. As part of this, banks
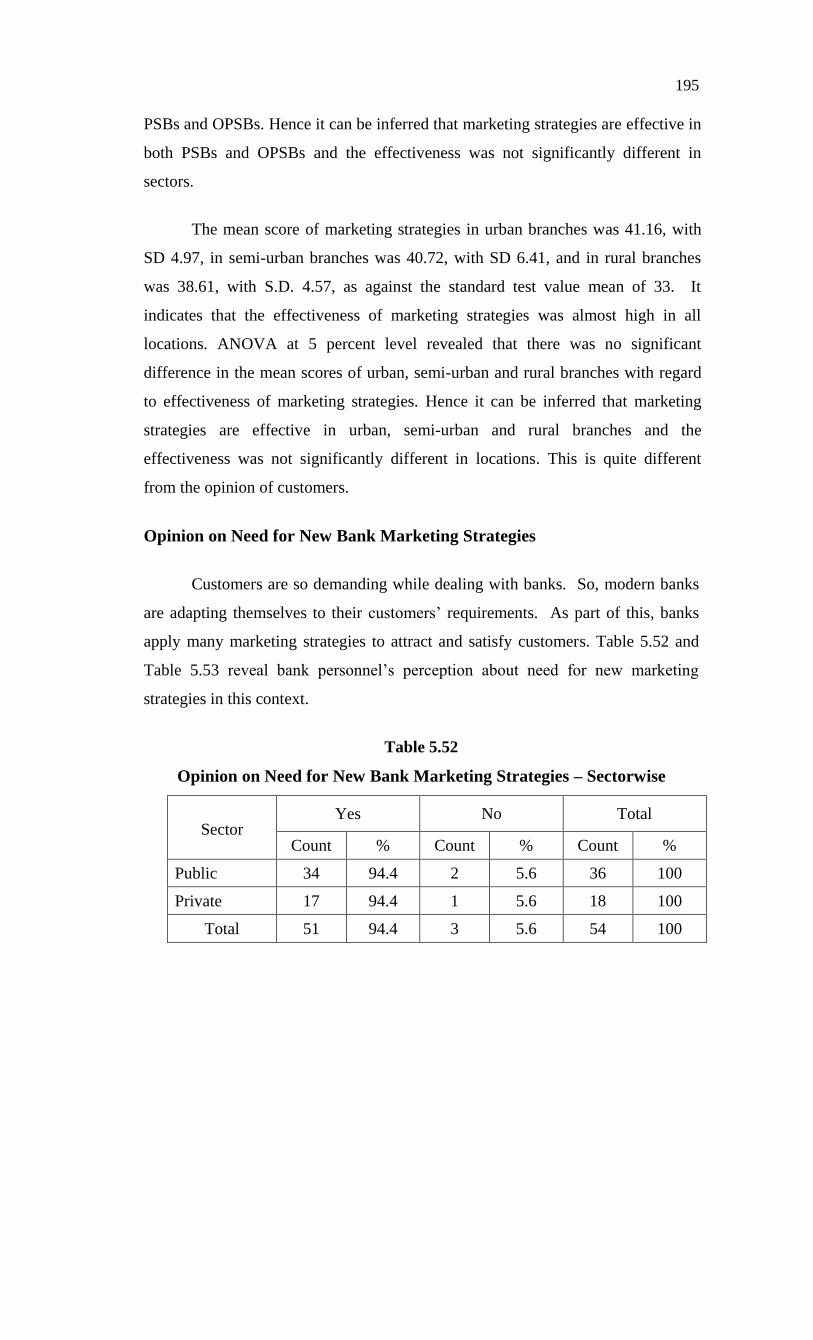
apply many marketing strategies to attract and satisfy customers. Table 5.52 and
Table 5.53 reveal bank personnel’s perception about need for new marketing
strategies in this context.
Table 5.52
Opinion on Need for New Bank Marketing Strategies – Sectorwise
Sector Yes No Total
Count % Count % Count %
Public 34 94.4 2 5.6 36 100
Private 17 94.4 1 5.6 18 100
Total 51 94.4 3 5.6 54 100
196
Table 5.53
Opinion on Need for New Bank Marketing Strategies – Locationwise
Sector
Yes No Total
Count
%
Count
%
Count
%
Urban 17 94.4 1 5.6 18 100
Semi Urban 17 94.4 1 5.6
18 100
Rural 17 94.4 1 5.6
18 100
Total 51 94.4 3 5.6
54 100
Almost unanimously (94.4 percent) bank personnel agreed with the need for
new bank marketing strategies to retain existing customers and drawing in new
customers. Interaction revealed that they are very much conscious about
competition from other financial agencies including new generation banks and
foreign banks. So to compete with others, they said, new strategies, including
effective use of customer relationship marketing, are required.
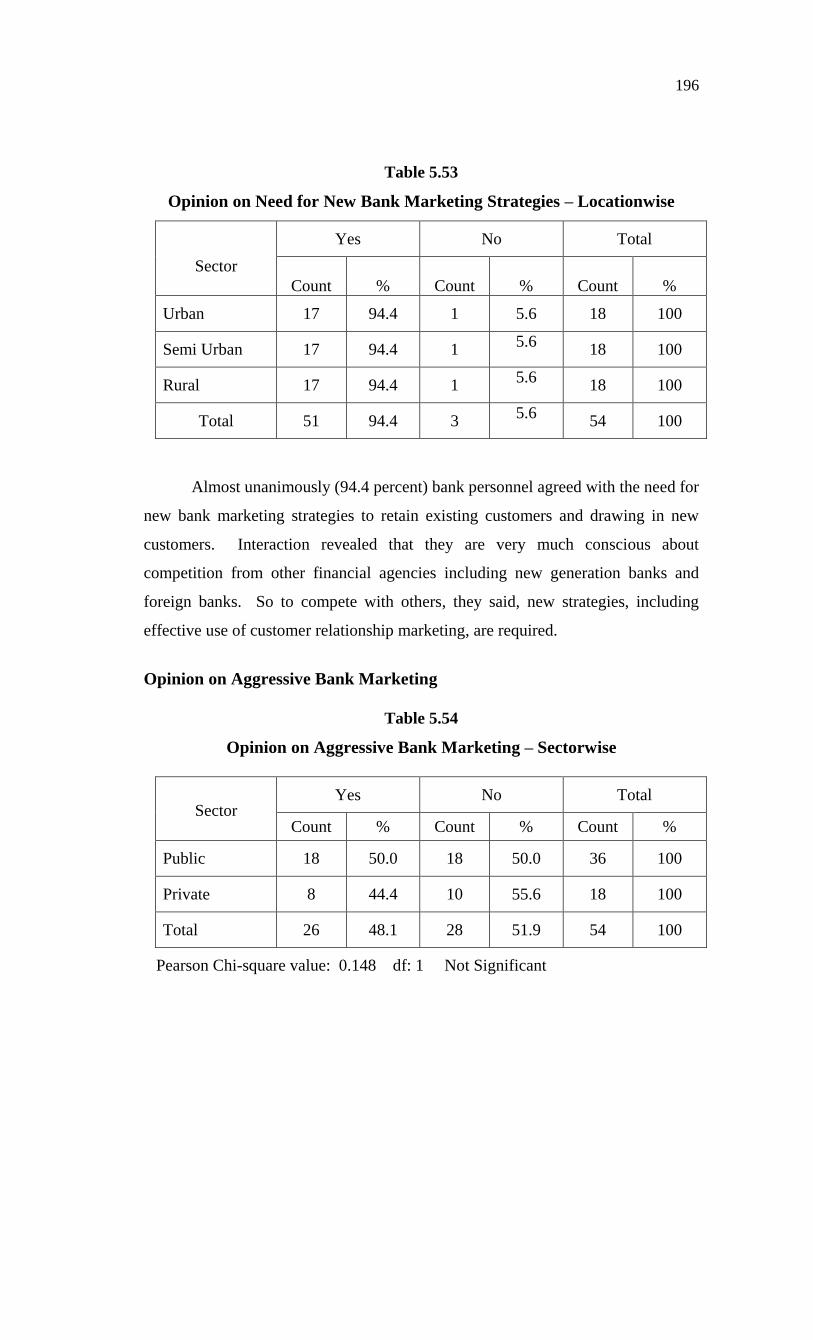
Opinion on Aggressive Bank Marketing
Table 5.54
Opinion on Aggressive Bank Marketing – Sectorwise
Sector Yes No Total
Count % Count % Count %
Public 18 50.0 18 50.0 36 100
Private 8 44.4 10 55.6 18 100
Total 26 48.1 28 51.9 54 100
Pearson Chi-square value: 0.148 df: 1 Not Significant
197
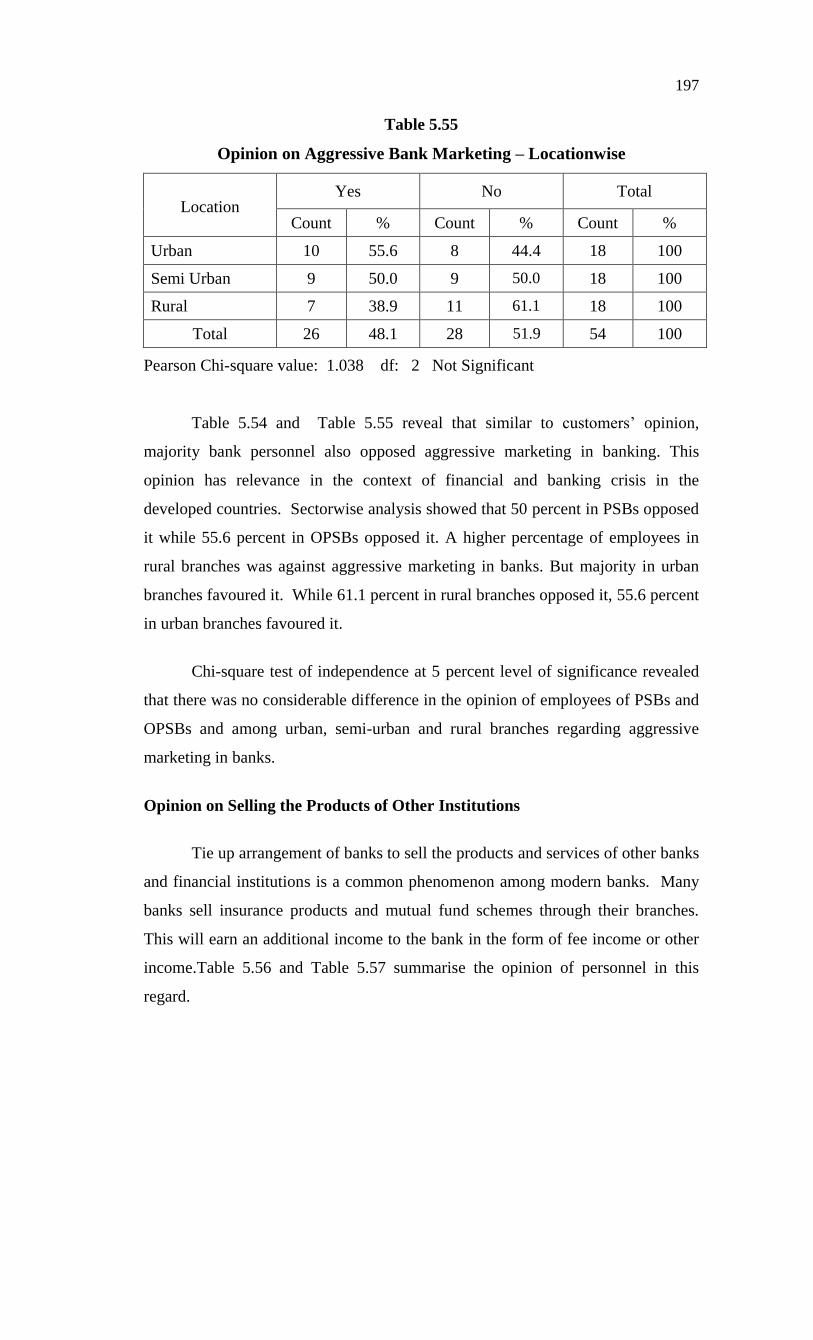
Table 5.55
Opinion on Aggressive Bank Marketing – Locationwise
Location Yes No Total
Count % Count % Count %
Urban 10 55.6 8 44.4 18 100
Semi Urban 9 50.0 9 50.0 18 100
Rural 7 38.9 11 61.1 18 100
Total 26 48.1 28 51.9 54 100
Pearson Chi-square value: 1.038 df: 2 Not Significant
Table 5.54 and Table 5.55 reveal that similar to customers’ opinion,
majority bank personnel also opposed aggressive marketing in banking. This
opinion has relevance in the context of financial and banking crisis in the
developed countries. Sectorwise analysis showed that 50 percent in PSBs opposed
it while 55.6 percent in OPSBs opposed it. A higher percentage of employees in
rural branches was against aggressive marketing in banks. But majority in urban
branches favoured it. While 61.1 percent in rural branches opposed it, 55.6 percent
in urban branches favoured it.
Chi-square test of independence at 5 percent level of significance revealed
that there was no considerable difference in the opinion of employees of PSBs and
OPSBs and among urban, semi-urban and rural branches regarding aggressive
marketing in banks.
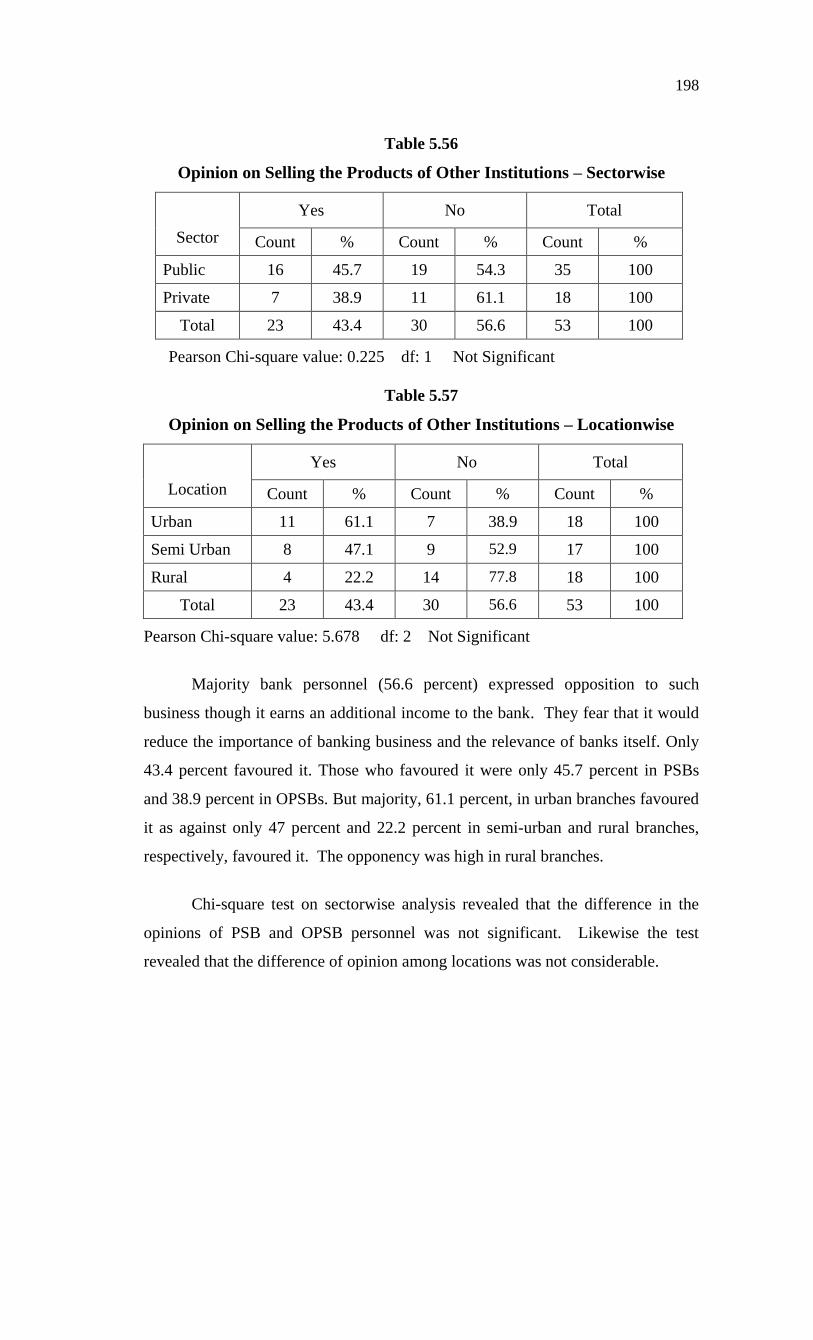
Opinion on Selling the Products of Other Institutions
Tie up arrangement of banks to sell the products and services of other banks
and financial institutions is a common phenomenon among modern banks. Many
banks sell insurance products and mutual fund schemes through their branches.
This will earn an additional income to the bank in the form of fee income or other
income.Table 5.56 and Table 5.57 summarise the opinion of personnel in this
regard.
198
Table 5.56
Opinion on Selling the Products of Other Institutions – Sectorwise
Sector
Yes No Total
Count % Count % Count %
Public 16 45.7 19 54.3 35 100
Private 7 38.9 11 61.1 18 100
Total 23 43.4 30 56.6 53 100
Pearson Chi-square value: 0.225 df: 1 Not Significant
Table 5.57
Opinion on Selling the Products of Other Institutions – Locationwise
Location
Yes No Total
Count % Count % Count %
Urban 11 61.1 7 38.9 18 100
Semi Urban 8 47.1 9 52.9 17 100
Rural 4 22.2 14 77.8 18 100
Total 23 43.4 30 56.6 53 100
Pearson Chi-square value: 5.678 df: 2 Not Significant
Majority bank personnel (56.6 percent) expressed opposition to such
business though it earns an additional income to the bank. They fear that it would
reduce the importance of banking business and the relevance of banks itself. Only
43.4 percent favoured it. Those who favoured it were only 45.7 percent in PSBs
and 38.9 percent in OPSBs. But majority, 61.1 percent, in urban branches favoured
it as against only 47 percent and 22.2 percent in semi-urban and rural branches,
respectively, favoured it. The opponency was high in rural branches.
Chi-square test on sectorwise analysis revealed that the difference in the
opinions of PSB and OPSB personnel was not significant. Likewise the test
revealed that the difference of opinion among locations was not considerable.
199
REFERENCES
1. Quoted in Jha S.M., Bank Marketing, Mumbai, Himalaya Publishing House,
2000 p.6.
2. Joshi, Vasant C., Joshi, Vinay V. Managing Indian Banks – Challenges
Ahead, New Delhi, Response Books, 2002 p.17
3. Toor, N.S., Marketing strategies in Banks in Mathur, B.L., (ed) Emerging
Perspectives of Indian Banking Vol. III, Marketing Strategy of Indian
Banking, Jaipur, Arihant Publishing House, 1995 p.18
4. Joshi, Vasant C., Joshi, Vinay V, op. cit., p. 246.
5. A gap in quality means the qualitative difference in the goods and services
provided by the competing organisations.
6. Joshi, Vasant C., Joshi, Vinay V., op. cit., p.241.
7. Ibid p.242
8. Kotler, Philip and Armstrong, Gary, Principles of Marketing, 10th edition,
New Delhi, Prentice Hall of India (P) India, 2003.
9. Unfixed Deposit of Citi Bank is a fixed deposit with the provision to
withdraw from it in parts as and when the customer wants, by drawing a
cheque. It is a formal product derived from two core products, fixed deposit
and overdraft.
10. “Personal selling is basically a method of communication. It involves
individual and social behaviour; each of the person in the face-to-face
communication – salesman and prospect – influences the other” – Cundiff,
Still and Govoni, Fundamentals of Marketing, pp. 381-382
11. Jha, S.M., Bank Marketing, Mumbai, Himalaya Publishing House, 2000, Ch.
7, Formulation of Marketing Mix for Banks, p.221.