Embed Size (px)
Citation preview
1
Are private banks more efficient than public banks?
Evidence from Russia
Alexei Karas
Ghent University
Koen Schoors
Ghent University
Laurent Weill1
University of Strasbourg
Abstract
We study whether bank ownership is related to bank efficiency in Russia. We find that
foreign banks are more efficient than domestic private banks and – surprisingly – that
domestic private banks are not more efficient than domestic public banks. These results are
not driven by the choice of the production process, the bank’s environment, the
management’s risk preferences, the bank’s activity mix, size or the econometric approach.
The evidence in fact suggests that domestic public banks are more efficient than domestic
private banks and that the efficiency gap between these two types of banks is not lower after
the introduction of deposit insurance in 2004. This may be due to increased switching costs
or to the moral hazard effects of deposit insurance. The policy conclusion is that the
efficiency of the Russian banking system may benefit more from increased levels of
competition and higher access of foreign banks than from bank privatization.
JEL classification: G21; P30; P34; P52
Keywords: Bank Efficiency; State Ownership; Foreign ownership; Russia
1 Corresponding author. E-mail: [email protected]. Address: Institut d’Etudes Politiques, 47 avenue de la Foret Noire, 67000 Strasbourg, France.
2
1. Introduction
This paper assesses the efficiency of the nascent Russian banking system. The central
question we pose is whether bank ownership has any effect on bank efficiency in Russia. We
discern foreign-owned banks (foreign banks), privately owned banks (private banks) and
state-owned banks (public banks). We find that foreign banks are more efficient than
domestic private banks and – surprisingly – that domestic private banks are not more
efficient than domestic public banks. These results are not driven by differences in activity
mix, risk preferences or bank environment and not explained by the absence of explicit
deposit insurance for domestic private banks.
Transition countries appear to be a fertile testing ground for the comparative analysis
of public and private banks’ efficiency, but first appearances can be deceiving. Indeed, this
comparative analysis failed to yield clear answers because in most countries foreign entry and
bank privatization went hand in hand. By consequence the empirical results for these
countries were largely interpreted in terms of efficiency gaps between foreign and domestic
ownership rather than between public and private ownership. In Russia however partial bank
privatization was achieved relatively quickly, while foreign bank entry remained at a relatively
low level in the first 15 years of transition2. Still, partial public ownership in various forms
remained a robust characteristic of the Russian banking sector throughout transition. The
Central Bank of Russia (CBR) has played an important role through the commercial banks
under her direct control, namely Sberbank and Vneshtorgbank. In addition, government
bodies of several levels own banks. There are examples of villages, provinces, cities, federal
bodies and state firms in this position. For October 2001 for example, we find that the 27
banks that are majority owned by state bodies (out of 1277 banks in total) control 53% of
banking assets and 39% of banking liabilities. Neglecting the CBR’s commercial banking
activities through Sberbank and Vneshtorgbank., the remaining 25 public banks hold no less
than 6% of total banking assets and 8% of total banking liabilities. The Russian banking
industry therefore presents us with the exceptional opportunity to disentangle efficiency
differences between foreign, public and private banks for a sufficiently large number of
banks. This study is therefore a complement to the literature on foreign ownership and
efficiency in emerging market economies and its conclusions contribute to our
understanding of emerging market economies’ banking sectors.
Efficiency comparisons between public and private banks are cumbersome in
emerging market economies because both types of banks are subject to different institutional
environments, for example the implicit full deposit insurance typically enjoyed by public
banks, but not by private banks. Any found differences in the cost effectiveness between
2 The Central Bank of Russia (CBR) repeatedly showed its eagerness to cap foreign entry to the banking sector. The Association of Russian Banks has consistently lobbied the government to limit foreign bank entry using the classic infant industry protection argument. Russia was ultimately forced to commit itself to a gradual opening of its financial market to foreign competition because of its desire to entry the WTO.
3
private and public banks may therefore be attributable to this difference in deposit insurance,
which may render public banks’ access to deposits less costly in terms of labor and physical
capital. In Russia too, public banks were always covered, albeit implicitly, by deposit
insurance, while household deposits held at private banks are covered by deposit insurance
only since 2004. To control for this we perform our estimations for two sub-samples, one
before (2002) and one after (2006) the introduction of deposit insurance for household
deposits at private banks. This allows us to assess whether any found difference in efficiency
may be partly attributable to differences in deposit insurance and whether the more level
playing field of generalized deposit insurance for household deposits effectively reduces the
efficiency difference.
In the following section we overview the bank efficiency literature in connection with
our study. Section 3 presents the recent history of the Russian banking sector. This is
followed by an overview of the data in section 4 and the estimation methodology in section
5. Section 6 lays out the main results. Section 7 provides further robustness checks by
repeating the analysis for a size -matched sample and employing a very different econometric
approach. We end with concluding remarks in section 8.
2. Related literature
The empirical literature on privatization in transition countries has found that the
method and timing of privatization are related to its performance effects. Frydman et al.
(1999) find that privatization has no beneficial effect on performance if firms fall under the
sway of insider owners (managers or employees), while the positive performance effect is
pronounced if the firm is privatized to outsider owners. Brown et al. (2006) document that
foreign privatization has larger productivity effects than domestic privatization in a set of
four transition countries.
There is also ample evidence for transition countries that foreign firms are more
efficient than domestic firms, be it in the banking sector or in other sectors. Foreign banks
may be more efficient than domestic ones because of their more advanced technology,
superior management practices, better access to capital or the implicit deposit insurance
through the deep pockets of the foreign mother bank.
These economy-wide results are sustained by more detailed banking sector studies that
apply stochastic frontier models. Weill (2003) shows in a study of the Czech Republic and
Poland that foreign-owned banks are indeed more efficient than domestic-owned banks and
that this is driven neither by differences in bank size nor by differences in the structure of
activities. Hasan and Marton (2003) find in a Hungarian country-study that foreign banks
were more efficient already in the period 1993-1997, early in transition. Fries and Taci
(2005) find in a study of 15 East European transition countries (including Russia) that
private banks are more cost efficient than state-owned banks. Within the class of private
4
banks, they confirm the result of Weill (2003) that privatized banks with majority foreign
ownership are the most cost efficient. These are followed by newly established private banks,
both domestic and foreign owned, and finally by privatized banks with majority domestic
ownership, though these are still more efficient than state-owned banks. Bonin et al. (2005a)
analyze the effects of ownership on bank efficiency on a set of eleven transition countries for
the period 1996-2000. They apply a stochastic frontier approach to compute bank-specific
efficiency scores and relate these to ownership in second-stage regressions. Foreign-owned
banks are again confirmed to be more cost-efficient, collect more deposits and grant more
loans than other banks. The magnitude of increased efficiency from foreign ownership is 6%
or higher. State-owned banks are not appreciably less efficient than de novo domestic private
banks, but they are less efficient than those already privatized and, which provides support
to the idea that better banks were privatized first. In a companion paper with comparable
methodology Bonin et al. (2005b) analyze whether the method and the timing of bank
privatization affect bank efficiency. They find that voucher privatization does not lead to
increased efficiency and early-privatized banks are more efficient than later-privatized banks.
Kraft, Hofler and Payne (2006) study the Croatian banking system and find that new
private and privatized banks are not more efficient than public banks and that privatization
does not immediately improve efficiency, while foreign banks are substantially more efficient
than all domestic banks.
A number of studies apply data envelopment analysis to examine bank efficiency in
Central and Eastern Europe. These include for example Grigorian and Manole (2006), who
study 17 European transition countries, Jemric and Vujcic (2002), who look at Croatia, and
Havrylchyk (2006), who studies Poland. In accordance with the findings of the stochastic
frontier literature, all studies find that foreign banks are more efficient than domestic ones.
Grigorian and Manole (2006) find in addition that privatization does not automatically lead
to higher efficiency, which is in line with Bonin et al. (2005a). This superior efficiency of
foreign banks is however not necessarily found in other emerging market economies.
Sensarma (2006) finds for India that foreign banks are less efficient than either public or
private domestic banks.
Two studies investigate bank efficiency in Russia. Fries and Taci (2005) study the cost
efficiency of banks from 15 post-communist countries including Russia between 1994 and
2001. They apply the one-stage Battese and Coelli (1995)’s stochastic frontier model and find
that foreign ownership and private ownership are both associated with greater efficiency.
Their findings, however, are based on a cross-country sample and need, therefore, not
equally hold for every country. This observation is particularly relevant for Russia given their
very limited sample of Russian banks (48 out of more than 1000 existing banks).
Styrin (2005) solves these problems by using a large dataset of Russian banks obtained
from the Central Bank of Russia for the period 1999-2002. While efficiency scores are
estimated in a first stage with the stochastic frontier approach, they are regressed on a set of
potential determinants including public ownership and foreign ownership in a second stage.
5
Public ownership is innovatively defined as the actual affiliation with the state measured by
the ratio of interest income received from the government to total interest income. This
paper concludes in favor of a better efficiency of foreign banks, whereas public ownership is
not significant to explain efficiency. The econometric two-stage approach and the exclusion
of physical capital from the list of inputs are the paper’s major limitations.
We use a similar dataset extended to 2006 and adopt the one-stage approach proposed
by Battese and Coelli (1995) to investigate the cost efficiency of Russian banks. Next to
solving the limitations of previous studies we contribute to the literature by studying whether
the introduction of generalized deposit insurance had any effects on banks’ comparative
efficiency.
3. History and problems of the Russian banking sector
The privatization of Russia’s former ‘spetsbanki’3 was a relatively uncontrolled process
that started before 1990 -the official start of bank privatization process- and was largely
accomplished by the end of 1991, when the Soviet system collapsed. This secessionist
privatization yielded a few large successors (Sberbank, Vneshtorgbank, Mosbiznesbank,
Promstroibank and SBS–Agro) and more than 600 relatively small successors. Most of these
were reluctant to restructure, as mirrored in higher costs, higher loan rates, poorer loan
quality and smaller capital buffers (see Schoors, 2003). Not surprisingly most of the smaller
successors faltered in the period 1995-1998. In the aftermath of the August 1998 crisis the
larger successors were also swept away, with the notorious exceptions of Sberbank and
Vneshtorgbank which survived as daughters of the CBR and now control a considerable part
of the Russian banking market4. At present, the vast majority of Russian banks are
unburdened by lingering Soviet deficiencies: most private banks are de novo banks -the
privatized ‘spetsbanki’ faltered in the period 1992-1999-, while most public banks have been
created after the collapse of the Soviet Union by government bodies like state enterprises,
cities and federal, regional or local governments (see Tompson, 2004 and Vernikov, 2007).
In our sample we count 25 of the latter category. Still, the banking sector has been faced
with a number of serious problems throughout its history.
3 In 1987 the Soviet Union turned its monobank system into a kind of two tier banking system with a embryonal central bank (Gosbank) and specialized ‘commercial banks’. These were Sberbank (the savings bank), Promstroibank (industry and construction), Zhilsotsbank (housing and communal financing), Agroprombank (Agriculture) and Vneshtorgbank.(foreign trade). These specialized banks are commonly referred to as ‘spetsbanki’. 4 In its 2005 Annual Report, Sberbank claims it holds 54.2% of total retail deposits, 44.1% of consumer loans, 32.2% of corporate loans, 16.6% of government securities and 26.5% of total Russian banking assets. The share in ruble-denominate retail deposits is even higher with more than 70%.
6
Early in transition, banks clearly preferred speculation to lending (Schoors, 2001).
Bank lending to the non-financial sector shrank year after year as a share of total banking
assets until 1999. In 2003, bank loans to the non- financial sector only amounted to just
17.0% of GDP and financed as little as 4.8% of fixed investment.5 Since then the situation
has improved. This reluctance to lend seems rational with hindsight. The presence of soft
legal constraints (Perotti, 2002) rendered the enforcement of overdue claims difficult to
impossible. Bank lending was further depressed by huge information asymmetries between
banks and their prospective customers, and by the lack of screening and monitoring skills in
the banks themselves and the economy at large. Banks were therefore unable to identify
good potential borrowers (Brana, Maurel and Sgard, 1999), and often preferred not to lend
at all. Moreover, the vast amount of tiny banks and the lack of a transparent information
system about credit histories may have contributed to depressing lending (Pyle, 2002).
The largest part of the lending went to connected agents, regardless of the viability of
the lending project, and with only very weak monitoring incentives (Laeven, 2001). Many of
the newly founded private banks were captured by their owners. Such “pocket banks”
operated as treasuries for a firm or a group of firms rather than independent banks. Note
that the government, too, is to some extent a connected party, because several banks are
captured by local, regional, or national governments. At the start of 2003, federal or regional
authorities held majority stakes in 23 banks, the regional authorities held minority stakes in
several more banks and a large number of state enterprises were part-owners of banks
(Tompson, 2004).
The average loan quality was negatively affected by the combined problems of
connected lending, soft legal constraints, information asymmetries and the lack of screening
and monitoring skills. A leaked analysis of Russian banks after the crisis of August 1998
shows that the major cost for banks was not the devaluation loss or the government default
on treasury bills, but bad loans hidden and accumulated during the preceding period.6
Schoors and Sonin (2005) explain how the Russian banking system was stuck in a passivity
trap, where it is rational for each individual bank to hide bad loans rather than collecting
them. Economic growth after 2000 allowed Russian banks to ‘grow’ out of bad loans, but
the problem of loan quality is still a latent threat to the Russian banking system.
The Russian banking sector has in the past suffered from poor capitalization,
especially considering the poor quality of assets and the large exposure to exchange rate risk.
This overexposure was revealed when the devaluation in August 1998 sent capital of many
Russian banks from positive to negative overnight (Perotti, 2002). The CBR has steadily
tightened capital standards since 1999 and Claeys and Schoors (2007) show that these
standards are indeed enforced. As a result capital levels have reached more acceptable levels.
Still our data reveal that the average capitalization of the Russian banks is substantially higher
5 Data from the CBR Bulletin of Bank Statistics. 6 See ’The newly-wed and the nearly dead’, Euromoney, June 1999.
7
than the weighted average capitalization, implying that the capital buffer is lower in the
banks that are most important for systemic stability.
The institutional stability of Russian banks has proven weak with systemic problems in
1994, 1995, 1998 and 2004. Since 1992, more than 2000 Russian banks were liquidated or
vanished. Sometimes this was due to a combination of the above-mentioned factors (poor
capitalization, excessive speculative risk, endemic bad loans, connected lending, etc.), but
there were also several cases of Ponzi schemes where crooks cheated depositors and fled
with their money. In the aftermath of the August 1998 crisis it became apparent that the soft
legal constraints faced by banks encouraged asset stripping and left creditors to bear the
brunt of the cost of failure (Perotti, 2002). Claeys and Schoors (2007) give an overview of
the CBR’s relatively weak prudential supervision and control during the first decade and
show that a policy rule-based enforcement of bank standards is difficult for the CBR because
of conflicts with systemic stability concerns. Depositors reacted to this widespread
institutional instability by either disciplining their banks in a sophisticated way7 (Karas, Pyle
and Schoors, 2006) or fleeing to the safe heavens of Sberbank and Vneshtorgbank that –like
all public banks- were covered by an implicit state guarantee8 (see OECD, 2004). Figure 1
shows how Sberbank’s share of private deposits9 reached a peak of close to 80% in 1998.
The government wanted to restore some competition in the deposit market and
reacted by providing a form of partial deposit insurance. The federal law on deposit
insurance was introduced in 2003, but the system became only operational in September
200410. Sberbank was initially exempted and kept its full state guarantee until the 1st of
January 2007, when it finally became subject to the new deposit insurance scheme. Other
regulatory advantages of Sberbank (for example lower required reserves on ruble deposits)
were also abolished. This gradually more level playing field ensured that Sberbank’s share of
private deposits gradually fell during the last five years to a still very high level of about 50%
in 2006 (see figure 1).
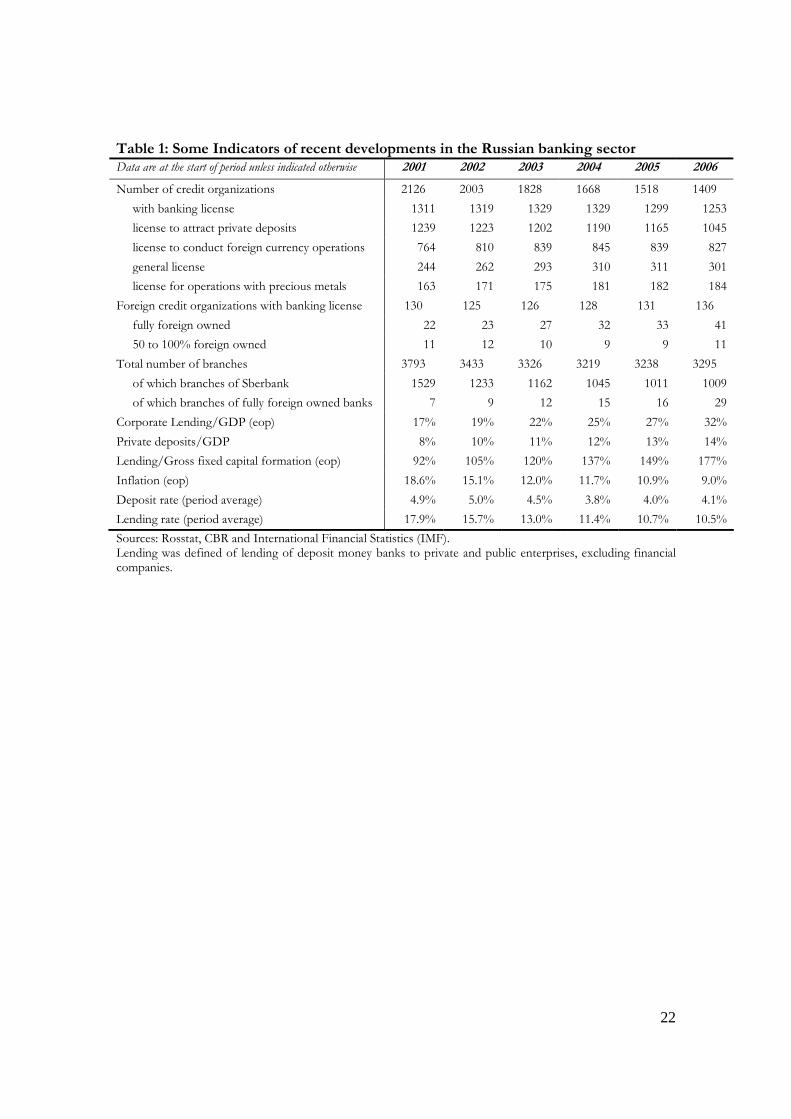
In table 1 we summarize some of the crucial indicators of the recent developments of
the Russian banking system. By early 2006 there were 1253 banks, among which only 1045
money deposit banks (covered by the deposit insurance scheme) with 3295 bank branches.
More than 30% of these bank branches were however still operated by Sberbank, such that
the average bank had about two branches. Clearly the average Russian bank is tiny when
compared to European or world standards. By 2006 the Russian market counted 62 majority
7 By interpreting very high promised deposit rates as a proxy of institutional instability. 8 Sberbank has a huge branch network and carries a government guarantee. The government lent credibility to this guarantee by supporting Sberbank when needed and using it as a device to absorb deposits from large defunct deposit banks in the aftermath of the 1998 crisis. The same holds for Vneshtorgbank as demonstrated in the mini-crisis in May–July 2004, when Vneshtorgbank acquired Gutabank, one of the larger deposit banks under attack. As a result, Sberbank and Vneshtorgbank continue to dominate a highly concentrated deposit market. 9 Both ruble- and foreign currency-denominated private deposits. 10 Although an unrelated and opaque form of state guarantee was already granted to all banks in July 2004 to stop the evolving banking panic.
8
foreign-owned banks, but their branch network was still relatively underdeveloped. On the
other hand banking has clearly revived during the last five years, with bank lending rising
from 17% of GDP in 2001 to 32% of GDP in 2006 and private deposits rising from 8% of
GDP to 14% of GDP over the same period. Average interest rates seem still high in nominal
terms but are low once inflation is taken into account. Clearly Russian banks are increasingly
playing their role as effective intermediaries between savings and investments, but the
banking system still suffers from the predominance of tiny banks with underdeveloped
branch network, excessive concentration and lack of foreign competition. Although private
deposit collection is growing it remains far behind corporate lending.
4. Data and variables
The quarterly bank balances and profit and loss accounts were made available to the
authors by the financial information agency Interfax11. The chosen sample periods (2002 and
2006) are convenient to properly detect longitudinal effects of private ownership. Brown et
al (2006) find that positive effects of domestic privatization appear immediately in Hungary,
Romania, and Ukraine, but emerge only five years after privatization in Russia. In our study
almost all remaining banks are de novo banks and the few remaining privatized banks are
considered 10 years or more after privatization, so any positive efficiency effects are
expected to have appeared by then.
The panel is unbalanced because some banks fail, some merge, and some are founded
during the sample period. If a bank merged or was acquired we treat the resulting larger bank
as “new”. To identify foreign banks, we use the quarterly lists of 100% foreign-owned banks
provided by the CBR since 1999. The lists of banks with the state as a majority owner are
available at two points in time, February 1, 2002 (Matovnikov, 2002) and July 1, 2005
(Mamontov, 2005). These lists reveal that the state ownership category remains stable over
our sample period.
We perform estimations before (2002) and after (2006) the introduction of deposit
insurance in 2004. For each sub-period, we use a balanced panel which is more convenient
for the application of the Battese and Coelli (1995)’s model. As efficiency scores are relative
measures of performance, we need to have comparable banks in terms of practiced activities.
We therefore only keep banks with both shares of deposits and loans in total assets greater
than 10%. Our final sample consists of 747 banks (including 19 public banks and 26 foreign
banks) for 2002 and 471 banks (including 15 public banks and 20 foreign banks) for 2006.
The literature disagrees on the role of deposits in the production process of banks. The
classical production approach treats deposits and loans as outputs and labor and physical
11 Karas and Schoors (2005) provide a detailed description of the dataset and confirm its consistency with other data sources.
9
capital as inputs. The intermediation approach first used by Sealey and Lindley (1977) views
banks as intermediaries between savings and investments in the economy and treats earning
assets as outputs and deposits as inputs.
The weak development of financial markets makes a clear focus on the lending and
deposit activities of banks relevant for Russia. Therefore we tend to prefer the production
approach in this paper. The intermediation approach has the disadvantage that deposits are
neglected as an important output. There exists also an argument in favor of the
intermediation approach though. Public and foreign banks might have access to cheaper
funding if depositors believe those banks to possess additional protection compared to
private domestic banks. Public banks have enjoyed the explicit state guarantee backing their
retail deposits, which was scrapped only at the end of 2003. In addition their cost of funds is
reduced by the perception that the state will stand behind them (Tompson, 2004). Foreign
banks’ deposits may also enjoy an implicit (by the mother bank) or an explicit deposit
guarantee (in some countries clients of foreign branches of domestic banks are covered
under the national deposit insurance scheme). Such guarantees, be they perceived or real,
could affect input prices for deposits, but this is not considered in the production approach,
because the deposit cost is not included in the measure of total costs. This gives a rationale
for the use of the intermediation approach, that considers deposits as an input rather than an
output and that includes the cost of deposits in the measure of total costs. In robustness
checks, we will substitute the intermediation for the production approach. Our results are
however robust to the choice of the production process. This is not unexpected given the
finding of Wheelock and Wilson (1995) and Berger et al. (1997), that the choice of the
approach may have a considerable impact on the level of the efficiency scores but not on
their rankings.
For the production approach, the output variables are total deposits and total loans.
The input prices are the price of physical capital, measured by the ratio of other operating
expenses to fixed assets, and the price of labor, measured by the ratio of personnel expenses
to total assets12 as data on the number of employees is not available (Altunbas et al. 2000,
Weill, 2003). As observed by Maudos et al. (2002), the latter ratio can be interpreted as labor
cost per worker (personnel expenses to number of employees) adjusted for differences in
labor productivity (number of employees to total assets), since it is the product of these
ratios. Total costs are the sum of personnel expenses and other operating expenses. Controls
for environment, risk preferences and activities mix include seven geographical district
dummies, the log of total assets, the log of equity, the share of bad loans in total loans, and
the percentage breakdown of banks’ total deposits and loans by counterpart (households,
firms, government, banks).
12 We use the Tukey box-plot to detect outliers: for each input price we drop observations lying out of the range defined by the first and third quartile minus/plus two times the interquartile range.
10
For the intermediation approach, the output variables are total loans and total
securities, while the input prices are the deposit rate (measured as the ratio of interest paid
on deposits to interest bearing deposits), the price of physical capital (as defined before), and
the price of labor (as defined before). Total costs are the sum of interest paid on deposits,
personnel expenses and other operating expenses.
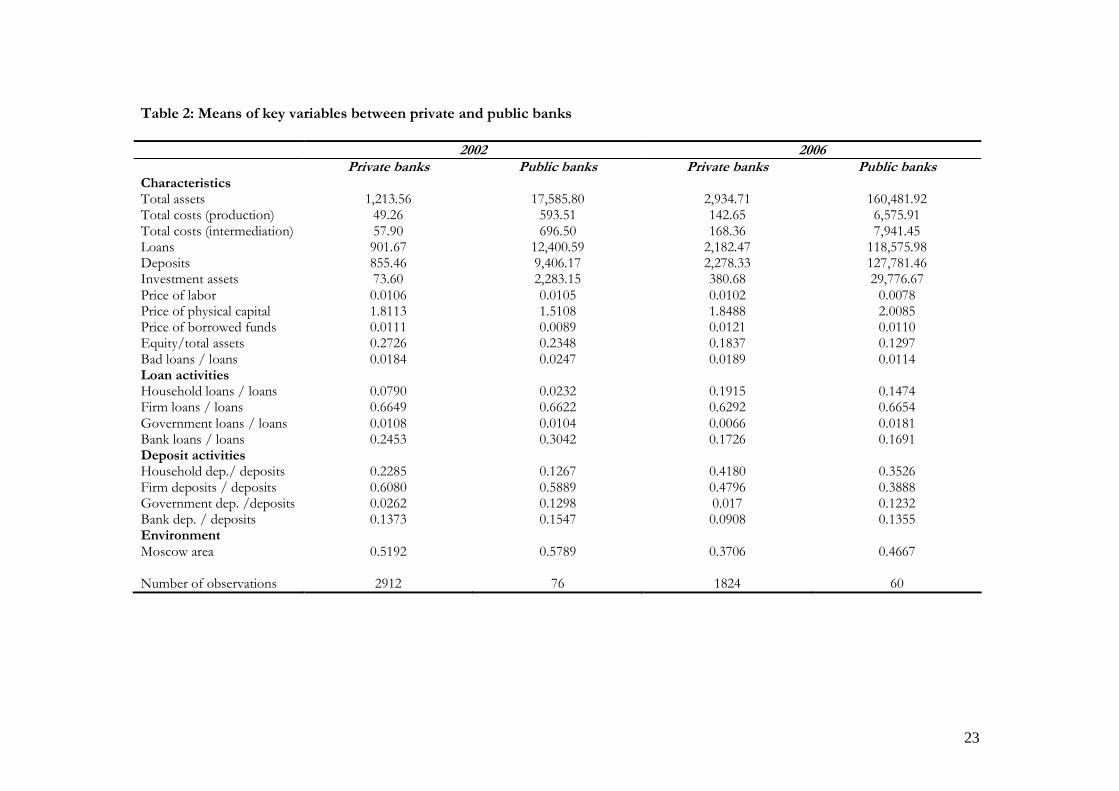
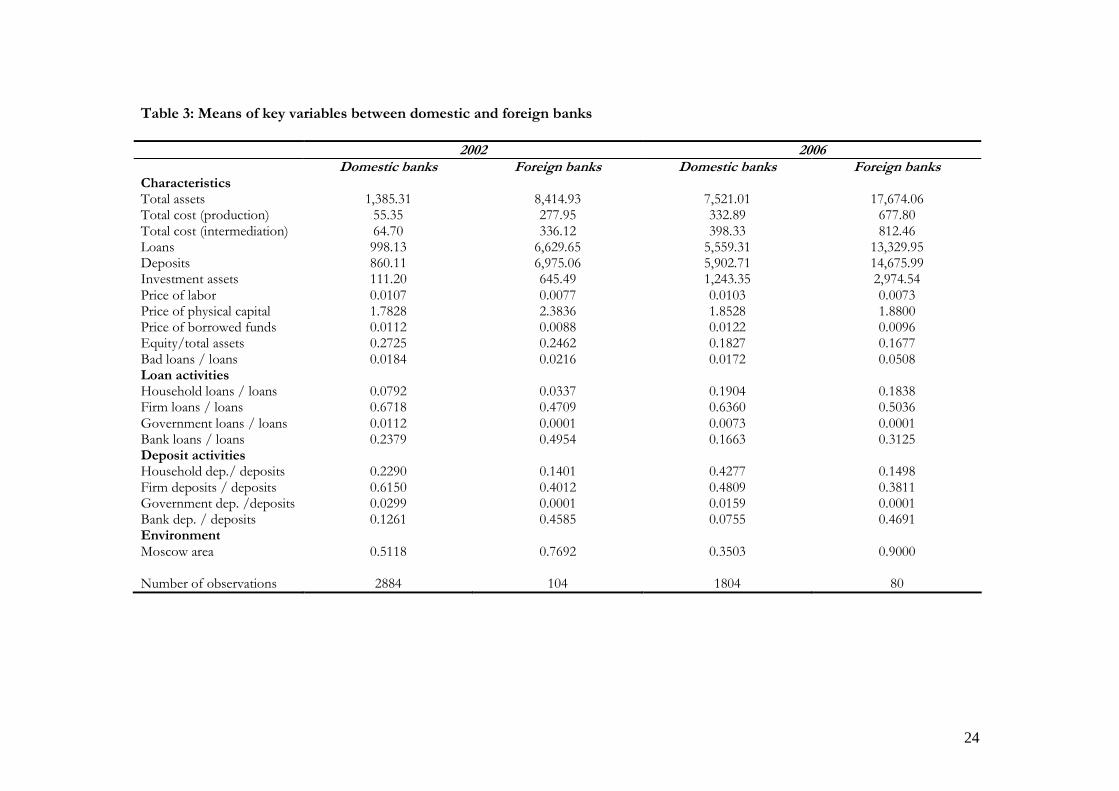
Table 2 compares the means of key variables of private and public banks. Table 3 does
the same for domestic and foreign banks. Both public and foreign banks are much bigger,
slightly less capitalized and more frequently located in the Moscow area relative to their
counterparts, respectively, private and domestic banks. These patterns are more pronounced
in the second sub-period. Compared to private banks, public banks grant relatively more
loans to companies and banks and relatively less loans to households. Not surprisingly,
public banks rely relatively more on the government as a source of funding. Foreign banks
are extremely active on the interbank market, both in terms of borrowing and lending, while
domestic banks are predominantly occupied with core activities: granting loans to companies
and individuals and collecting core deposits. For all bank categories household deposits have
become a much more important source of funding over time.
5. Methodology
This section develops the methodology adopted to estimate cost efficiency of Russian
banks. Cost efficiency measures how close a bank cost is to what a bank optimal cost would
be for producing the same bundle of outputs. It then provides information on wastes in the
production process and on the optimality of the chosen mix of inputs.
Several techniques have been proposed in the literature to measure efficiency with
frontier approaches. While nonparametric approaches, e.g. DEA, use linear programming
techniques, parametric approaches, such as stochastic frontier approach or distribution-free
approach, apply econometric tools to estimate the efficiency frontier. We adopt stochastic
frontier approach in our study, following many studies on banking efficiency in transition
countries (Weill, 2003; Bonin et al., 2005a; Fries and Taci, 2005). In comparison to DEA,
this approach presents the advantage to disentangle inefficiency from a statistical noise
taking exogenous events into account in the residual (the distance from the efficiency
frontier). In section 7 we also present DEA estimates as additional robustness checks.
The stochastic frontier approach assumes that total cost deviates from the optimal cost
by a random disturbance, v, and an inefficiency term, u. Thus the cost function is TC = f(Y,
P) + ε where TC represents total cost, Y is the vector of outputs, P the vector of input
prices and ε the error term which is the sum of u and v. u is a one-sided component
representing cost inefficiencies, meaning the degree of weakness of managerial performance.
v is a two-sided component representing random disturbances, reflecting luck or
11
measurement errors. u and v are independently distributed. u is assumed to have a truncated
normal distribution, while v is assumed to have a normal distribution. σv² and σu² are the
respective variances of u and v. According to Jondrow et al. (1982), firm-specific estimates of
inefficiency terms can be calculated by using the distribution of the inefficiency term
conditional on the estimate of the composite error term.
The more straightforward procedure is the so-called “two-stage procedure”: the
stochastic frontier model is estimated in the first stage, while the obtained efficiency scores
are regressed on a set of explanatory variables including ownership variables in the second
stage. Although often applied in the literature, this two-stage procedure presents two
important econometric problems, as observed by Kumbhakar and Lovell (2000). First, it
assumes that the efficiency terms are identically distributed in the estimation of the
stochastic frontier model of the first stage, while in the second stage this assumption is
contradicted by the fact that the regression of the efficiency terms on the explanatory
variables suggests that the efficiency terms are not identically distributed. Second, the
explanatory variables must be assumed as uncorrelated with the variables of the cost frontier
function, or else the maximum likelihood estimates of the parameters of the cost frontier
function would be biased because of the omission of the explanatory variables in the first
stage. But then, the estimated efficiency terms that are explained in the second stage are
biased estimates, as they are estimated relative to a biased representation of the cost frontier.
Therefore, we choose to use the “one-stage procedure” proposed by Battese and Coelli
(1995), which solves these econometric problems. They propose a procedure for panel data,
in which the non-negative inefficiency term is assumed to have a truncated distribution with
different means for each firm. As a result, the distributions of the inefficiency terms are not
the same, but are expressed as functions of explanatory variables. The inefficiency terms are
then independently but not identically distributed. They are obtained by truncation at zero of
the N(µit , σu²) distribution: µit = zit δ, where zit is a vector of explanatory variables, and δ is
a vector of parameters to be estimated.
The estimated model consists of the cost frontier function and an equation explaining
inefficiency. As is common in the literature on bank efficiency in transition countries (Weill,
2003, Bonin et al., 2005a, Fries and Taci, 2005) we use a standard translog specification of
the cost frontier:
i,t i,t0 m m,i,t mj,i,t m,i,t j,i,t 1
m m ji,t i,t
2
i,t i,t2 m m,i,t i,t
mi,t i,t
TC pl1ln ln y ln y ln y ln
pk 2 pk
pl pl ln ln ln y
pk pk
= β + α + α + β
+ β + γ + ε
∑ ∑∑
∑
(1)
12
where TC total cost, ym mth bank output (m=1,2), pl price of labor, pk price of physical
capital, ε the composite error term. Inefficiency is a function of bank-specific variables:
uit =δ zit + Wit (2)
where uit is the inefficiency, zit is a p*1 vector of explanatory variables, δ is a 1*p vector
of parameters to be estimated, Wit is a random variable defined by the truncation of the
normal distribution with mean zero and variance σ² (σ² = σu² + σv²). We use the software
program Frontier 4.1 to perform the maximum likelihood estimation of the cost frontier.
6. Results
We estimate the efficiency model for the period before generalized deposit insurance
(2002) and after generalized deposit insurance (2006) to check whether the implementation
of the deposit insurance has modified the differences in efficiency between banks with
different types of ownership. In all estimations, we include bank ownership variables in the
equation explaining inefficiency. Two alternative definitions of public ownership are
employed. On the one hand, we include a dummy variable taking the value of one whether
the bank is publicly-owned. On the other hand, following Styrin (2005), we measure public
ownership by the ratio of interest income received from the government to total interest
income. Foreign ownership is taken into account through a dummy variable equal to one
whether the bank is foreign-owned.
Insert table 4 around here
Table 4 describes the main results. While Panel A presents the results when public
banks are defined according to the ownership, panel B presents those when public banks are
defined according to their activities. In the interpretation, one has to keep in mind that the
econometric model identifies inefficiency. Therefore a minus sign indicates that an increase
in the explanatory variable implies lower inefficiency, i.e. higher efficiency.
The baseline specification (a) of panel A shows that foreign banks are more efficient
than domestic private banks and public banks, and that public banks are more efficient than
domestic private banks after the introduction of deposit insurance. Indeed, while the
estimates for public ownership are negative and insignificant in specification (a), specification
(d) indicates that the efficiency gap between public banks and domestic private banks
becomes significant after the introduction of generalized deposit insurance. In an economic
sense, the found efficiency differences are considerable. This is also true in panel B where
public banks are identified according to their activities rather than their ownership.
13
In the baseline specifications (a) and (d), we implicitly assume that bank’s environment
(determined by its location) and risk preferences are management choices. One could
however argue that environment is exogenous to management decisions. Consequently, the
influence of environment should be disentangled to have a satisfactory measure of bank
efficiency. In this strand of literature, Dietsch and Lozano-Vivas (2000) have notably shown
that environment may explain the cross-country differences in bank efficiency. Furthermore,
Hugues and Mester (1993) and Mester (1996) have shown that efficiency differences may
also come from differences in managers’ risk preferences. Indeed the degree of risk aversion
has an impact on cost efficiency. Risk-loving managers may keep the capital down to its cost-
minimizing level (the regulatory threshold), while risk-averse managers may prefer to hold
higher levels of capital. Consequently, by omitting the level of equity in the cost frontier, we
may consider a bank as inefficient while it behaves optimally given the risk preferences of its
managers. Berger and Mester (1997) provide an additional reason to include the level of
equity into the estimation of the cost efficiency model, based on the fact that the insolvency
risk of the bank depends on the equity available to absorb losses. This insolvency risk may
lead to higher bank costs13. This issue has a particular importance in transition economies
like Russia where the insolvency risk of banks is not negligible.
In specifications (b) before generalized deposit insurance and (e) after generalized
deposit insurance, we therefore include some environmental variables in the cost frontier.
We use information on the district of the bank, taking into consideration the geographical
breakdown of Russia in 7 districts. We therefore include 6 dummy variables, which are equal
to one whether the bank is located in the concerned district, in the cost frontier. In
specifications (c) and (f), we include the logarithm of equity in the estimation of the cost
frontier to control for risk preferences in addition to environmental variables, following
notably Mester (1996), Altunbas et al. (2000) and Weill (2003). All these specifications show
that the baseline results are very robust. Foreign banks remain consistently the most efficient
ones and public banks remain consistently more efficient than domestic private ones.
This first set of results suggests that in Russia public banks are more rather than less
efficient than domestic private banks. This is in accordance with Styrin (2005) but differs
from Fries and Taci (2005). Note however that the latter study obtained results on a cross-
country sample from 15 transition countries including only a very limited sample of Russian
banks. In addition, our results surprisingly suggest this efficiency advantage was enhanced
rather than reduced by the implementation of the deposit insurance scheme.
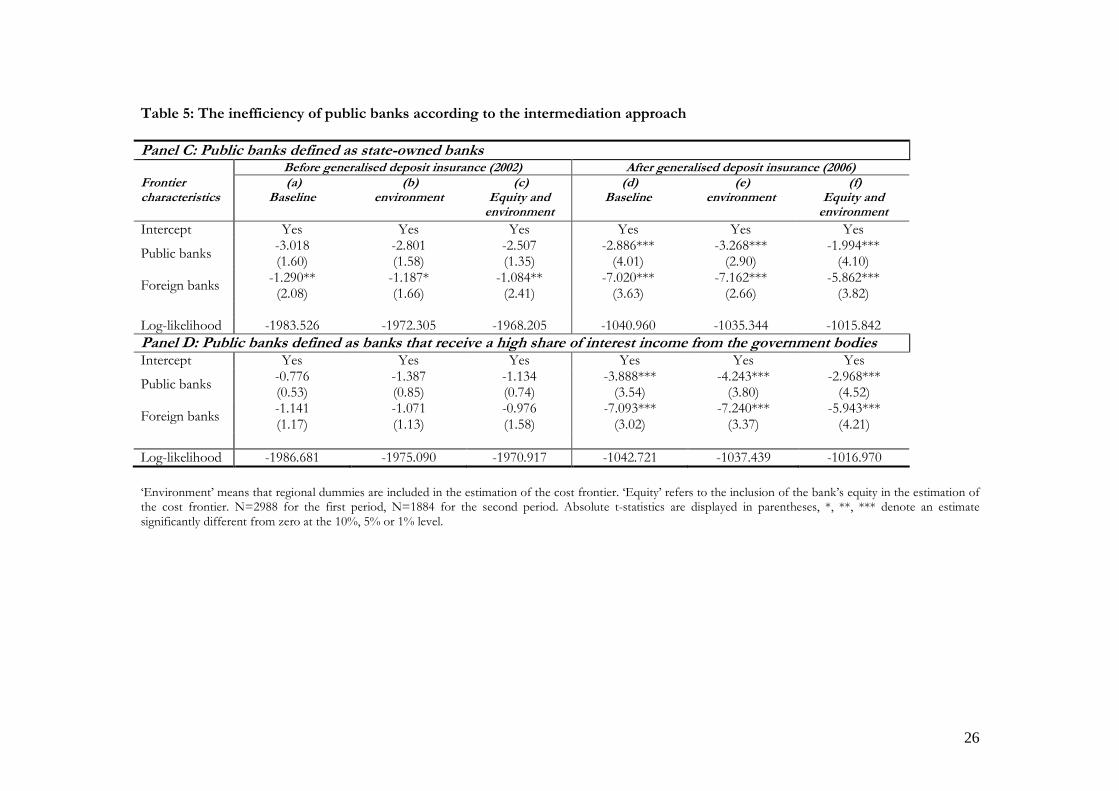
Since the results in table 4 do not take into account the possible effect of systematic
differences in the deposit rate14, table 5 repeats the regressions of table 4, applying the
intermediation approach instead of the production approach. In the intermediation approach
13 In our framework, higher solvency risk could affect the costs of the considered cost function through higher labor costs and higher costs of physical capital (to convince depositors to lay out their deposits, banks with lower capital need to invest more in their branch network). 14 Public banks could have systematically lower deposit rates than private banks.
14
the deposit rate is an input cost in the cost function and the total deposit cost is included of
the measure of total cost.
Insert table 5 around here
The estimates in table 5 indicate that our unexpected results are very robust to the
choice of a production process. Applying the intermediation approach, we again find that
foreign banks exhibit superior efficiency, that public banks tend to be more efficient than
domestic private banks and that the latter efficiency gap becomes statistically significant after
the introduction of deposit insurance. It is suggested therefore that the superior efficiency of
public over private banks is not an inheritance of some communist past, but a fact of
contemporaneous Russian banking markets.
One explanation for this puzzle could be that public and private banks have different
sets of activities and that the typical activity mix of public banks involves fewer costs than
the one typically exerted by private banks. In table 6, we test this idea by including measures
of the activity mix in the equation explaining inefficiency.
Include table 6 around here
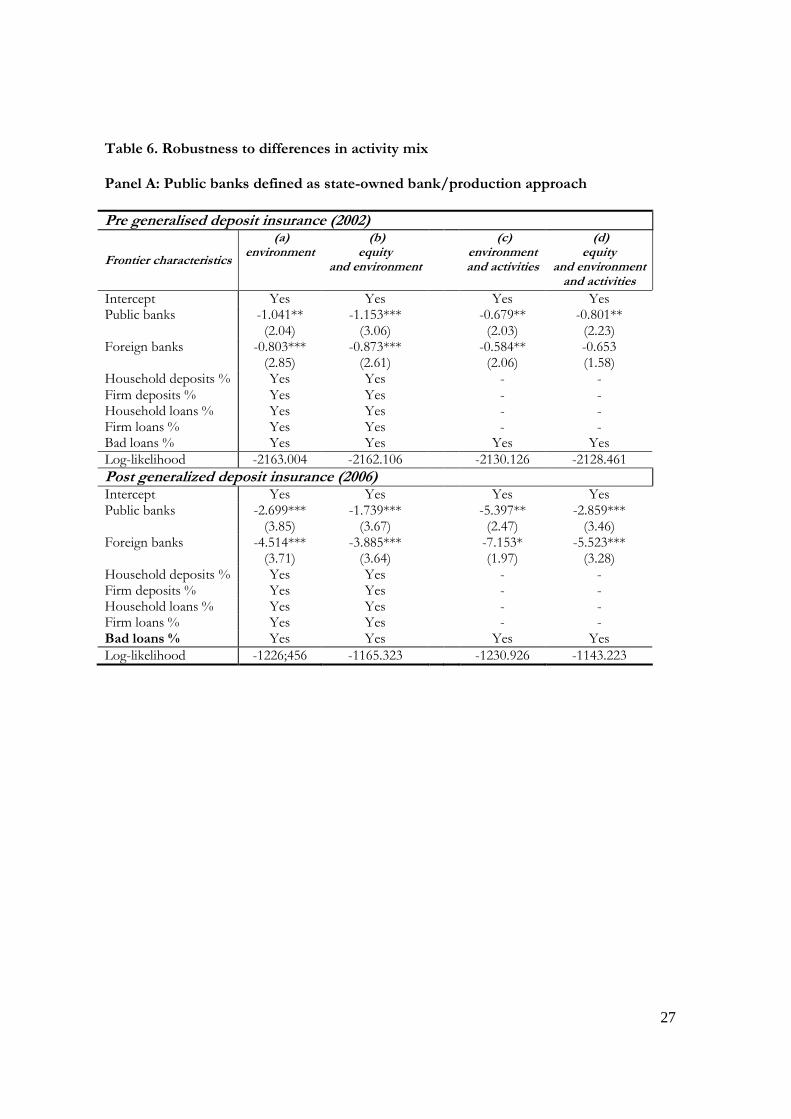
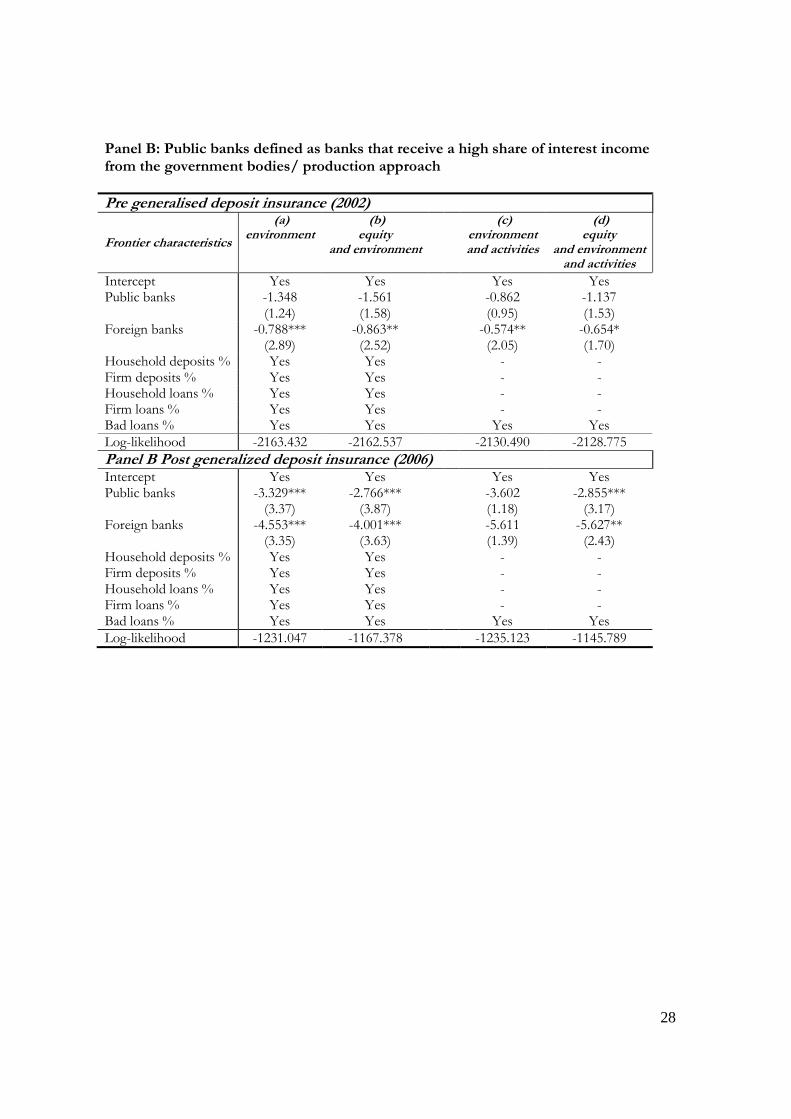
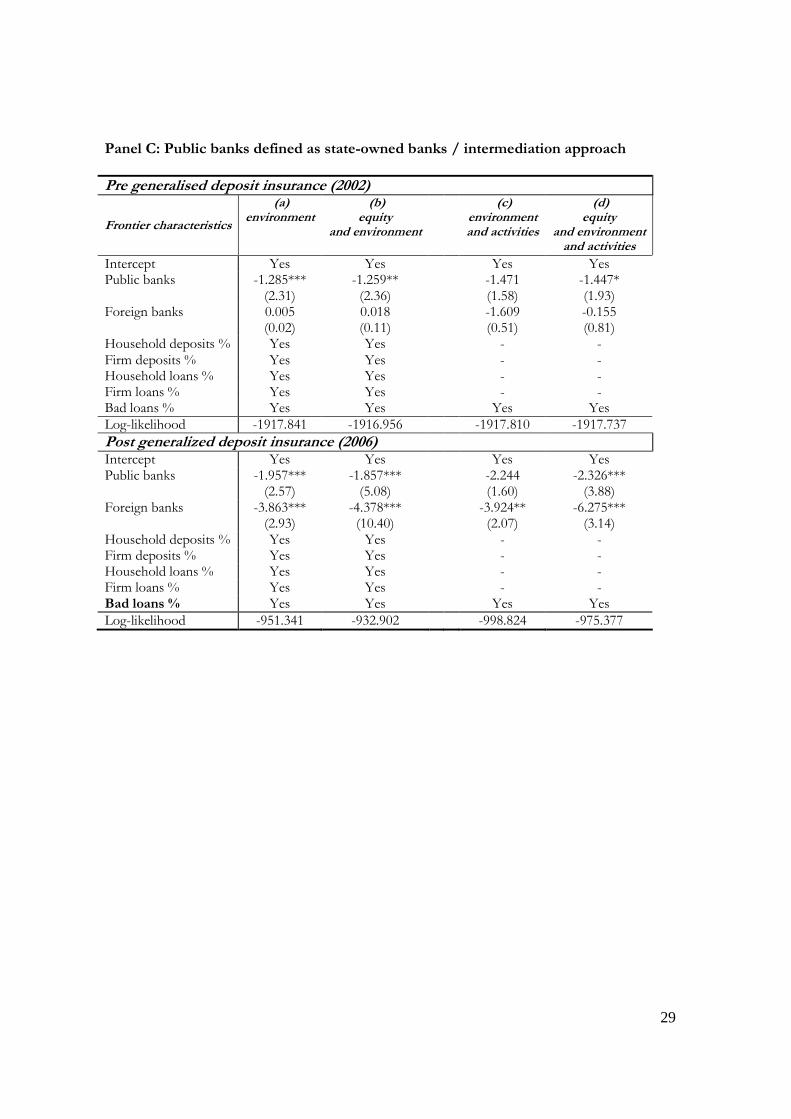
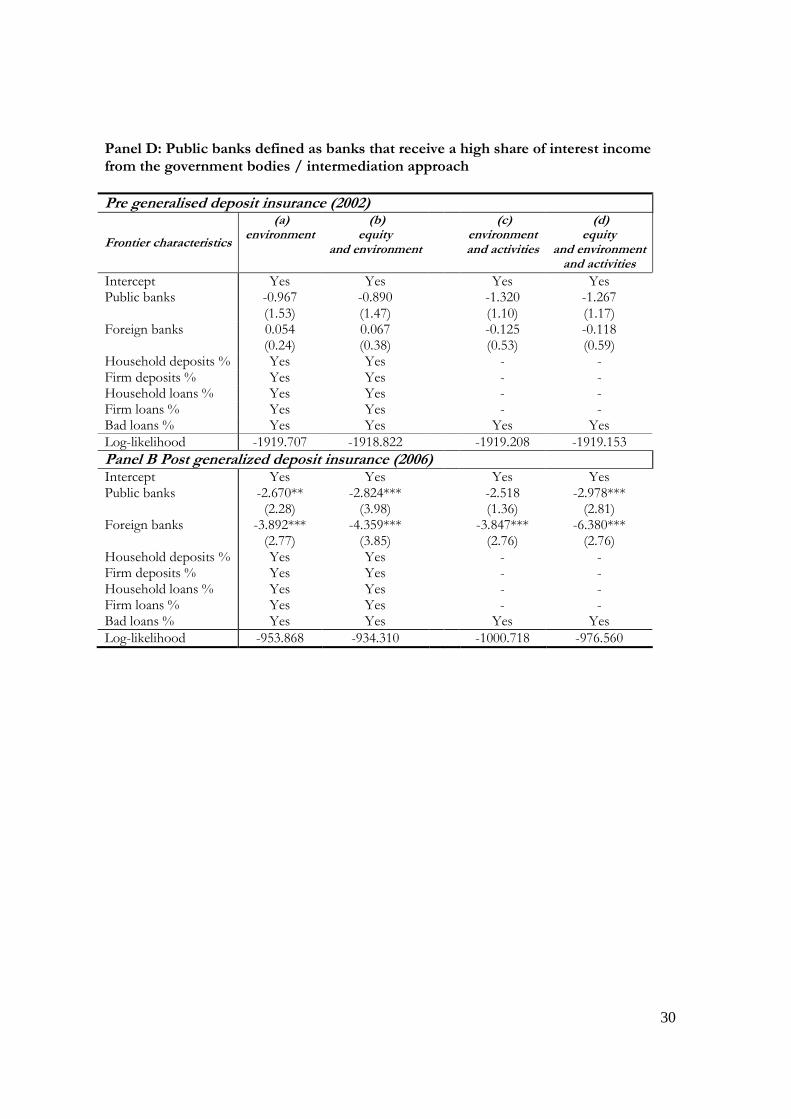
In each panel of table 6, we consider the activity mix in the form of lending and
deposit shares by type of customer (households, firms, government, bank) and the average
loan quality (measured as the ratio of classified loans to total loans).15 In panels A and B we
apply the production approach, in panels C and D the intermediation approach. Panels A
and C identify public banks through ownership, while panels B and D identify public banks
through revealed activities with the government. In each panel we have 4 specifications. In
specification (a) we include the regional dummies in the estimation of the efficient frontier
and all the activity mix variables in the equation explaining inefficiency. In specification (b)
we additionally include equity in the estimation of the efficient frontier. In specification (c)
we include the regional dummies and the activity mix variables in the estimation of the
efficient frontier, leaving only the loan quality as explanatory variable for the residual
inefficiency. In specification (d) we include the regional dummies, equity and the set of
activity mix variables in the estimation of the frontier, again leaving only loan quality as
explanatory variable for the residual inefficiency. Our three main results are very robust to all
these exercises. Foreign banks are again more efficient than domestic private banks. Public
banks tend to be more efficient than domestic private ones. This effect seems to be stronger
after than before the introduction of deposit insurance. Moreover some results become
stronger rather than weaker in some cases. In panel A for example (production approach,
15 Since the bank share and the government share are zero for many banks, their sum is the omitted variable for both lending and deposits. The results do not change if households or firms are the excluded category instead.
15
public ownership), the public banks superior efficiency now becomes statistically evident
even in pre deposit insurance period. In panel C (intermediation approach, public
ownership) the public banks become less inefficient than even the foreign banks in the pre-
deposit insurance period.
7. Further robustness checks
The summary statistics in table 2 indicate that public banks are on average very large
compared to domestic private banks. If scale economies are present in the Russian banking
sector, these considerable size differences may explain our results. Note however that there
are also arguments to hypothesize large Russian private banks may be less efficient than their
smaller competitors. Claeys and Schoors (2007) find that large Russian banks enjoy
regulatory forbearance from the part of the Central bank of Russia. This form of soft legal
constraints implies that managers of larger banks are subject to less regulatory pressure. This
gives the managers concerned more degrees of freedom to maximize their private benefits of
control, which may come at the cost of lower efficiency. To control the effect of size we
repeat our estimations for a size matched sample. The matching procedure for the two sub-
periods runs as follows:
1. We exclude the largest public banks, Sberbank, Vneshtorgbank and Gazprombank from
the two samples. They dominate the market and their special status (see above) may
drive the results.
2. For each of the remaining public banks, we identify in each time period 20 size-matched
(size in terms of total assets) private domestic banks. Specifically, we draw the closest 10
larger and the closest 10 smaller private domestic banks that have not been drawn yet in
the specific period. This yields two lists of matching banks, one for the sample before
deposit insurance and one for the sample after deposit insurance.
3. Finally we make the sample balanced, by dropping all banks that fail to show up in all 4
quarters of the sub-period.
This procedure yields ultimately 123 matching private domestic banks before deposit
insurance (or 492 bank observations) and 141 matching private domestic banks after deposit
insurance (or 564 bank observations). All foreign banks are retained in the sample. In annex
A.1 we present the summary statistics of this matched sample. One observes that the size
differences are now substantially smaller than in the full sample of table 2.
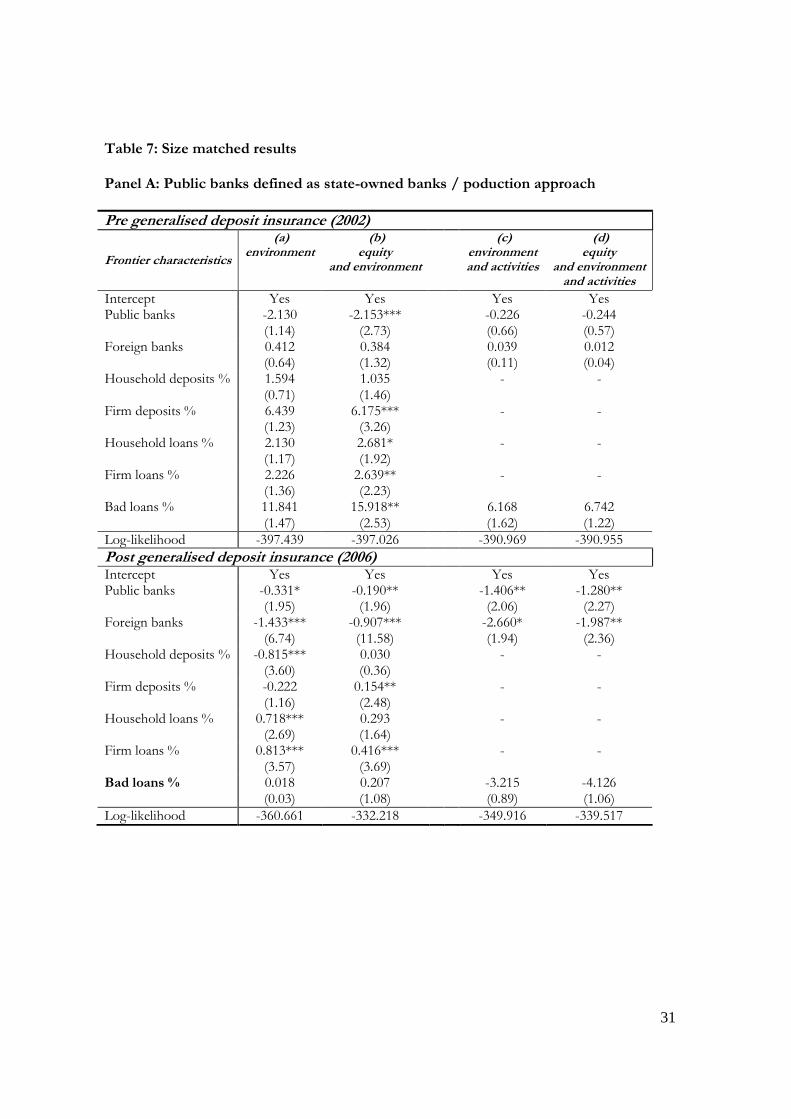
Insert table 7 around here
In table 7, we repeat the estimations with all possible controls of panel A in table 6. In
annex A.2 we show the reproduced estimations with the size-matched datasets from the
16
remaining panels of table 6. Our three main findings are robust but the estimated efficiency
gap becomes smaller in most specifications. The public bank variable remains consistently
negative in all specifications of all panels although its significance falters in some
specifications of the intermediation approach (see Annex A.2). Apparently the observed
efficiency gap between public and private banks is not only driven by size differences or by
the special position enjoyed by the CBR-owned large public banks, but also by some genuine
efficiency differences.
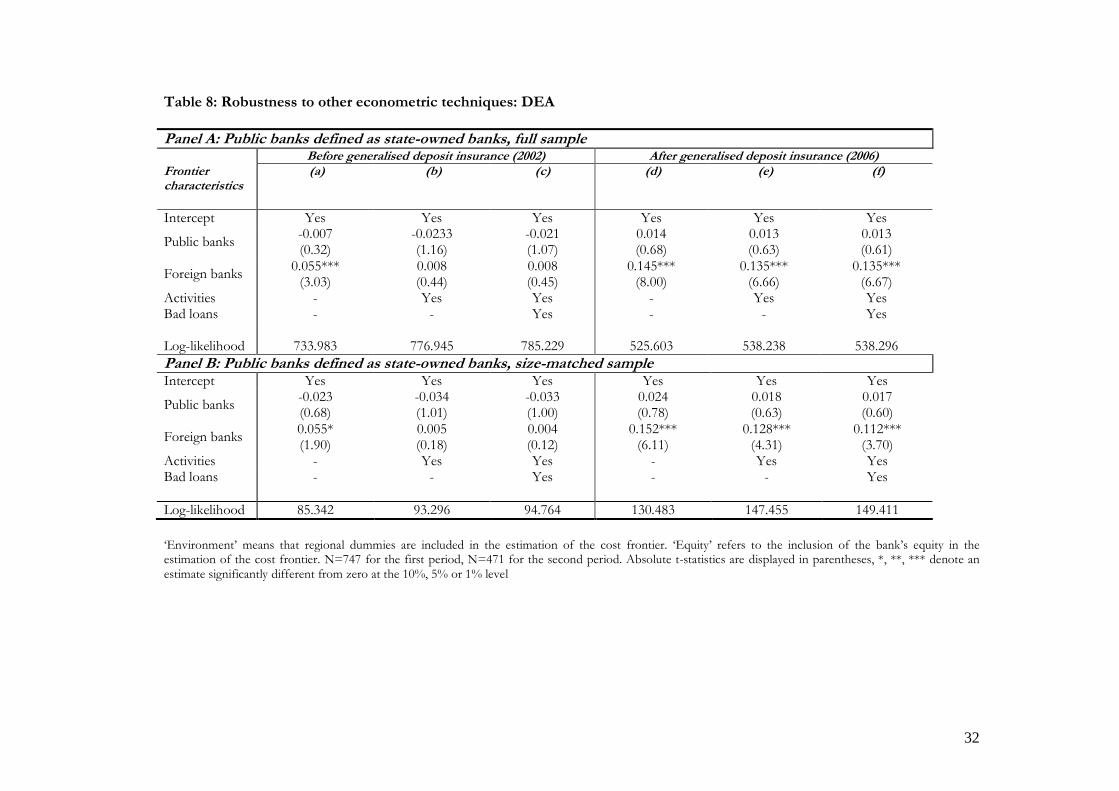
As a further robustness check we employed a two-stage DEA procedure. In the first
stage we estimate time specific bank efficiency scores for each quarter. We use the quarterly
efficiency scores for each bank to compute each bank’s mean efficiency scores for each year
(2002 before the reform, 2006 after the reform). In a second stage, we regress these mean
efficiency scores on a set of determinants (public ownership, foreign ownership, activity)
using a Tobit estimator. .This exercise was performed both on the full and the size-matched
sample. Results of the second stage Tobit regressions are presented in table 8. Note that
DEA is a totally different estimation strategy, often leading to quite different results. The
interpretation of the signs is now different, since DEA measures efficiency rather than
inefficiency and since the estimates are time-specific rather than panel estimates.
Insert table 8 around here.
In table 8 we observe that foreign banks are again found to be more efficient than
domestic banks. The efficiency of publicly owned banks is never significantly different from
that of private banks. The introduction of deposit insurance seems again to be affecting
efficiency differences in favor of the foreign banks and the public banks. In the case of
publicly owned banks, the signs of the estimates change from insignificantly negative in 2002
to insignificantly positive in 2006.
8. Concluding remarks
In the Russian banking market we document three very robust results with respect to
bank efficiency. Foreign banks are more efficient than domestic private banks (no surprise),
domestic private banks are not more efficient than public banks (surprise) and the
introduction of deposit insurance increased any existing efficiency gap between public and
private banks (big surprise). These results are not driven by the choice of the production
process, environment, risk preferences, activity mix, size or econometric approach.
This result of foreign banks’ superior efficiency is in accordance with most literature
on this topic in transition countries. Namely, Weill (2003), Fries and Taci (2005) and Bonin
et al. (2005a) conclude similarly on samples of banks from various transition countries. This
17
finding is also very robust to the specifications taking environment, equity, size and structure
of activities into account. It may find its origin in both reasons proposed by Weill (2003). On
the one hand, most shareholders of foreign banks are themselves banks. Consequently these
shareholders can provide their know-how in organization and risk analysis to their
subsidiaries. On the other hand, foreign banks would benefit from better corporate
governance as shareholders originating from Western economies would be more used to
monitoring bank managers.
But why are private banks not more efficient than public banks in Russia? This
unexpected finding is neither in accordance with the general prior that public ownership is
less efficient than private ownership, nor with the findings of Bonin et al. (2005a) and Fries
and Taci (2005) on cross-country samples of banks from Central and Eastern European
countries. Implicit state guarantees may have rendered Russia’s public banks’ access to
deposits less costly in terms of labor and physical capital resulting in higher efficiency. A
greater depositor base may in turn lead to a greater pool of loan applicants. Therefore, public
banks may also benefit from granting a higher amount of loans than private banks for the
same level of costs, because they have to provide fewer efforts to find lenders. But if this
explanation is true, the creation of a more level playing field by the introduction of a
generalized deposit insurance scheme, no matter how incomplete, should have mitigated the
efficiency difference, while we found that the opposite is true. So this explanation must be
abandoned. Still deposit insurance may have played a role through moral hazard. There is
strong evidence that Russian private domestic banks were subject to strong and sophisticated
market discipline before the introduction of deposit insurance (see Karas, Schoors and Pyle,
2006). This forced them in the direction of more efficiency. The introduction of deposit
insurance may however have reduced the pressure coming from market discipline, without
replacing it with sufficiently strong regulatory pressure. In short, the introduction of deposit
insurance may have introduced moral hazard, leading to more rather than less inefficient
management practices of private banks.
Alternatively, the observed increase in the efficiency gap between public and private
banks may be due to the existence of increased switching costs (see Kim et al., 2003). These
switching costs notably derive from costs linked to the time and effort to close an account
and open it elsewhere, to become comfortable with unfamiliar procedures and new bank
employees, and from costs related to the loss of capitalized value of established relationships.
Switching costs may also endogenously result from the fact that banks benefit from better
information on their clients than competitors (Sharpe, 1990; Rajan, 1992). The widespread
trust in public banks accumulated through their long dominance of the Russian retail
markets and the renewed distrust in private banks after the ‘mini-crisis’ of May-July 2004 (see
above) may have increased switching costs from public to private banks. Stronger even, the
several weeks of turbulence on the Russian inter-bank market triggered by the CBR’s
intervention in the case of a bank accused of money-laundering, hampered depositor trust in

18
the banking system and led to the "flight to quality" - the shift of deposits from private to
public banks.
Given the fact that Russian public banks are not more inefficient than private ones, the
large state presence in the Russian banking sector is not necessarily the cause of its relative
inefficiency with the well-known corollaries of lower credit levels and higher financial
instability. The implication is that bank privatization will not necessarily improve the
efficiency of the Russian banking system. Since the main inefficiency seems to reside with
domestic private banks, the system’s efficiency may benefit more from increased
competition than privatization. This can be achieved by creating a more level and more
stable regulatory playing field for all banks, an objective the CBR is making progress with,
and by opening the market to foreign competition. In this light, the CBR’s relentless efforts16
of the last years (2006-2007) to get rid of inefficient and fraudulent banks regardless of their
size and the increasing access of foreign banks to the Russian banking sector may be more
instrumental in boosting the sector’s efficiency than yet another round of chaotic
privatization.
16 These efforts are deeply resented by some of the banks concerned that fear to loose their license and culminated in the brutal murder of the Mr. Kozlov, vice president of the CBR in charge of bank licensing policy in October 2006. The CBR reacted by reinforcing its effort to sweep though the banking licenses.
19
Reference list
Altunbas, Y., Evans, L., Molyneux P., Seth, R. (2000). ‘Efficiency and Risk in Japanese
Banking’, Journal of Banking and Finance, 24, pp. 1605-1628.
Battese, G. E. Coelli, T J. (1995). ‘A Model for Technical Inefficiency Effects in Stochastic
Frontier Production Function for Panel Data’, Empirical Economics, 20, pp. 325- 332.
Berger, A., Leusner, J., Mingo, J. (1997). ‘The Efficiency of Bank Branches’, Journal of
Monetary Economics, 40, 1, pp. 141-162.
Berger, A., Mester, L. (1997). ‘Inside the Black Box: What Explains Differences in the
Efficiencies of Financial Institutions?’, Journal of Banking and Finance, 21, pp. 895-947.
Bonin, J. P., Hasan, I., Wachtel, P. (2005a). ‘Bank Performance, Efficiency and Ownership in
Transition Countries’, Journal of Banking and Finance, 29, pp. 31–53.
Bonin, J. P., Hasan, I., Wachtel, P. (2005b). ‘Privatization matters: Bank Efficiency in
Transition Countries’, Journal of Banking and Finance, 29, pp. 2155–2178.
Brana, S., Maurel, M., Sgard, J. (1999). ‘Enterprise Adjustment and the Role of Bank Credit
in Russia: Evidence from a 420 Firm’s Qualitative Survey’, Comparative Economic
Studies, 41, 4, pp. 47-69.
Brown, J. D., Earle, J.S., Telegdy, I. (2006). ‘The Productivity Effects of Privatization:
Longitudinal Estimates from Hungary, Romania, Russia and Ukraine’, Journal of
Political Economy, 114, 1, pp. 61-99.
Claeys, S., Schoors, K. (2007). ‘Bank Supervision Russian Style: Evidence of Conflicts
between Micro- and Macro-Prudential Concerns’, Journal of Comparative Economics,
35, 3, pp. 630-657.
Dietsch, M., Lozano-Vivas, A. (2000). ‘How the Environment Determines the Efficiency of
Banks, A Comparison between French and Spanish Banking Industry’, Journal of
Banking and Finance, 24, 6, pp. 985-1004.
Fries, S., Taci, A. (2005). ‘Cost Efficiency of Banks in Transition: Evidence from 289 Banks
in 15 Post-Communist Countries’, Journal of Banking and Finance, 29, pp. 55–81.
Frydman, R., Gray, C., Hessel, M., Rapaczynski, A. (1999). ‘When Does Privatization Work?
The Impact of Private Ownership on Corporate Performance in the Transition
Economies’, Quarterly Journal of Economics, 114, 4, pp. 1153-91.
Grigorian D.A., Manole, V. (2006). ‘Determinants of Commercial Bank Performance in
Transition: An Application of Data Envelopment Analysis’, Comparative Economic
Studies 48, 3, pp. 497-522.
Hasan, I., Marton K. (2003). ‘Development and Efficiency of the Banking Sector in a
Transitional Economy: Hungarian Experience’, Journal of Banking and Finance, 27, pp.
2249-2271.
Havrylchyk, O. (2006). ‘Efficiency of the Polish banking industry: Foreign versus Domestic
Banks’, Journal of Banking and Finance, 30, pp. 1975-1996.
20
Hughes, D.P., Mester L.J. (1993). ‘A Quality and Risk-Adjusted Cost Function for Banks:
Evidence on the ‘Too-Big-Too-Fail Doctrine’’, Journal of Productivity Analysis, 4, pp.
196-315.
Jemric, I., Vujcic, B. (2002). ‘Efficiency of Banks in Croatia, A DEA approach’, Comparative
Economic Studies, 44, pp. 69-193.
Jondrow, J., Lovell, C.A.K., Materov, I., Schmidt, P. (1982). ‘On the Estimation of Technical
Inefficiency in the Stochastic Frontier Production Function Model’, Journal of
Econometrics, 19, pp. 233-238.
Karas, A., Pyle, W., Schoors, K. (2006). ‘Sophisticated discipline in a nascent deposit market:
Evidence from post-communist Russia’, BOFIT Discussion Paper 13, Bank of Finland,
Helsinki.
Karas, A., Schoors, K. (2005). ‘Heracles or Sisyphus? Finding, Cleaning and Reconstructing a
Database of Russian Banks’, Ghent University Working Paper 05/327.
Kim, M., Kliger, D., Vale, B. (2003). ‘Estimating Switching Costs: The Case of Banking’,
Journal of Financial Intermediation, 12, 1, pp. 25-56.
Kraft, E., Hofler, R., Payne, J. (2006). ‘Privatization, Foreign Bank Entry and Bank
Efficiency in Croatia: a Fourier-Flexible Function Stochastic Cost Frontier Analysis’,
Applied Economics, 38, pp. 2075-2088.
Kumbhakar, S., Lovell, C.A.K. (2000). Stochastic Frontier Analysis, Cambridge University
Press.
Laeven, L. (2001). ‘Insider lending and bank ownership: The case of Russia’, Journal of
Comparative Economics, 29, pp. 207-229.
Mamontov, A. (2005). ‘Gosudarstvo v Bankakh: Zlo ili Blago?’, Natsional’nyi Bankovskii
Zhurnal 12, 24.
Matovnikov, Mikhail (2002). ‘Nadezhnost’ Banka Tesno Svyazana so Strukturoi ego
Aktsionernogo Kapitala.’, Tsentr Ekonomicheskogo Analiza-Interfax, Moscow.
Maudos, J., Pastor, J.M., Perez, F., Quesada, J. (2002). ‘Cost and Profit Efficiency in
European Banks’, Journal of International Financial Markets, Institutions and Money,
12, 1, pp. 33--58.
Mester, L. (1996). ‘A Study of Bank Efficiency Taking into Account Risk-Preferences’,
Journal of Banking and Finance, 20, pp. 1025-1045.
Perotti, E. (2002). ‘Lessons from the Russian meltdown: The economics of soft legal
constraints’, International Finance, 5, pp. 359-399.
Pyle, W. (2002). ‘Overbanked and Credit-Starved: A Paradox of the Transition.’ Journal of
Comparative Economics, 30, pp. 25-50.
Rajan, R. (1992). ‘Insiders and Outsiders: The Choice Between Informed and Arm’s Length
Debt’, Journal of Finance, 47, pp. 1367-1400.
Schoors, K. (2001). ‘The Credit Squeeze during Russia's Early Transition: A Bank-Based
View’, Economics of Transition, 9, pp. 205-228.
21
Schoors, K. (2003). ‘The fate of Russia's former state banks: Chronicle of a restructuring
postponed and a crisis foretold’, Europe-Asia Studies 55, pp. 75-100.
Schoors, K., Sonin, K. (2005). ‘Passive creditors’, International Finance 8, pp. 57-86.
Sealey, C.W., Lindley, J.T. (1977). ‘Inputs, Outputs and a Theory of Production and Cost at
Depository Financial Institutions’, Journal of Finance, 32, 4, pp. 1251-1266.
Sensarma, R. (2006). ‘Are Foreign Banks Always the Best? Comparison of State-Owned,
Private and Foreign banks in India’, Economic Modelling 23, pp. 717-735.
Sharpe, S. (1990). ‘Asymmetric Information, Bank Lending and Implicit Contracts: A
Stylized Model of Customer Relationships’, Journal of Finance 45, pp. 1069-1087.
Styrin, K. (2005). ‘What Explains Differences in Efficiency Across Russian Banks?’,
Economics Education and Research Consortium, Russia and CIS, Final report, Moscow.
Tompson, W. (2004). ‘Banking reform in Russia: problems and prospects’, OECD
economics department working papers No. 410, Paris
Vernikov, A. (2007). ‘Russia's banking sector transition: Where to?’, BOFIT Discussion
Papers 5, Bank of Finland, Helsinki.
Weill, L. (2003). ‘Banking Efficiency in Transition Economies: The Role of Foreign
Ownership’, Economics of Transition 11, 3, pp. 569-592.
Wheelock, D., Wilson, P. (1995), ‘Evaluating the Efficiency of Commercial Banks: Does Our
View of What Banks Do Matter ?’, Review of Federal Reserve Bank of Saint-Louis, 77, 4,
pp. 39-52.
22
Table 1: Some Indicators of recent developments in the Russian banking sector Data are at the start of period unless indicated otherwise 2001 2002 2003 2004 2005 2006
Number of credit organizations 2126 2003 1828 1668 1518 1409
with banking license 1311 1319 1329 1329 1299 1253
license to attract private deposits 1239 1223 1202 1190 1165 1045
license to conduct foreign currency operations 764 810 839 845 839 827
general license 244 262 293 310 311 301
license for operations with precious metals 163 171 175 181 182 184
Foreign credit organizations with banking license 130 125 126 128 131 136
fully foreign owned 22 23 27 32 33 41
50 to 100% foreign owned 11 12 10 9 9 11
Total number of branches 3793 3433 3326 3219 3238 3295
of which branches of Sberbank 1529 1233 1162 1045 1011 1009
of which branches of fully foreign owned banks 7 9 12 15 16 29
Corporate Lending/GDP (eop) 17% 19% 22% 25% 27% 32%
Private deposits/GDP 8% 10% 11% 12% 13% 14%
Lending/Gross fixed capital formation (eop) 92% 105% 120% 137% 149% 177%
Inflation (eop) 18.6% 15.1% 12.0% 11.7% 10.9% 9.0%
Deposit rate (period average) 4.9% 5.0% 4.5% 3.8% 4.0% 4.1%
Lending rate (period average) 17.9% 15.7% 13.0% 11.4% 10.7% 10.5%
Sources: Rosstat, CBR and International Financial Statistics (IMF). Lending was defined of lending of deposit money banks to private and public enterprises, excluding financial companies.
23
Table 2: Means of key variables between private and public banks 2002 2006 Private banks Public banks Private banks Public banks Characteristics Total assets 1,213.56 17,585.80 2,934.71 160,481.92 Total costs (production) 49.26 593.51 142.65 6,575.91 Total costs (intermediation) 57.90 696.50 168.36 7,941.45 Loans 901.67 12,400.59 2,182.47 118,575.98 Deposits 855.46 9,406.17 2,278.33 127,781.46 Investment assets 73.60 2,283.15 380.68 29,776.67 Price of labor 0.0106 0.0105 0.0102 0.0078 Price of physical capital 1.8113 1.5108 1.8488 2.0085 Price of borrowed funds 0.0111 0.0089 0.0121 0.0110 Equity/total assets 0.2726 0.2348 0.1837 0.1297 Bad loans / loans 0.0184 0.0247 0.0189 0.0114 Loan activities Household loans / loans 0.0790 0.0232 0.1915 0.1474 Firm loans / loans 0.6649 0.6622 0.6292 0.6654 Government loans / loans 0.0108 0.0104 0.0066 0.0181 Bank loans / loans 0.2453 0.3042 0.1726 0.1691 Deposit activities Household dep./ deposits 0.2285 0.1267 0.4180 0.3526 Firm deposits / deposits 0.6080 0.5889 0.4796 0.3888 Government dep. /deposits 0.0262 0.1298 0.017 0.1232 Bank dep. / deposits 0.1373 0.1547 0.0908 0.1355 Environment Moscow area 0.5192 0.5789 0.3706 0.4667 Number of observations 2912 76 1824 60
24
Table 3: Means of key variables between domestic and foreign banks
2002 2006 Domestic banks Foreign banks Domestic banks Foreign banks Characteristics Total assets 1,385.31 8,414.93 7,521.01 17,674.06 Total cost (production) 55.35 277.95 332.89 677.80 Total cost (intermediation) 64.70 336.12 398.33 812.46 Loans 998.13 6,629.65 5,559.31 13,329.95 Deposits 860.11 6,975.06 5,902.71 14,675.99 Investment assets 111.20 645.49 1,243.35 2,974.54 Price of labor 0.0107 0.0077 0.0103 0.0073 Price of physical capital 1.7828 2.3836 1.8528 1.8800 Price of borrowed funds 0.0112 0.0088 0.0122 0.0096 Equity/total assets 0.2725 0.2462 0.1827 0.1677 Bad loans / loans 0.0184 0.0216 0.0172 0.0508 Loan activities Household loans / loans 0.0792 0.0337 0.1904 0.1838 Firm loans / loans 0.6718 0.4709 0.6360 0.5036 Government loans / loans 0.0112 0.0001 0.0073 0.0001 Bank loans / loans 0.2379 0.4954 0.1663 0.3125 Deposit activities Household dep./ deposits 0.2290 0.1401 0.4277 0.1498 Firm deposits / deposits 0.6150 0.4012 0.4809 0.3811 Government dep. /deposits 0.0299 0.0001 0.0159 0.0001 Bank dep. / deposits 0.1261 0.4585 0.0755 0.4691 Environment Moscow area 0.5118 0.7692 0.3503 0.9000 Number of observations 2884 104 1804 80

25
Table 4: The inefficiency of public banks according to the production approach
Panel A: Public banks defined as state-owned banks Before generalised deposit insurance (2002) After generalised deposit insurance (2006)
Frontier characteristics
(a) Baseline
(b) environment
(c) Equity and environment
(d) Baseline
(e) environment
(f) Equity and environment
Intercept Yes Yes Yes Yes Yes Yes
Public banks -2.321 (1.37)
-2.346 (1.38)
-2.226 (1.24)
-2.915*** (4.19)
-3.527*** (4.34)
-1.924*** (4.04)
Foreign banks -2.393* (1.95)
-2.544*** (2.67)
-2.560 (1.34)
-6.325*** (3.88)
-6.594*** (4.00)
-4.788*** (3.35)
Log-likelihood -2203.909 -2192.782 -2189.672 -1278.612 -1270.417 -1200.630
Panel B: Public banks defined as banks that receive a high share of interest income from the government bodies Intercept Yes Yes Yes Yes Yes Yes
Public banks -2.125 (0.88)
-2.357 (1.01)
-2.172 (0.84)
-3.398*** (4.35)
-3.633*** (3.70)
-2.903*** (4.66)
Foreign banks -2.370**
(1.97) -2.535***
(2.80) -2.550 (1.54)
-6.519*** (3.31)
-6.739*** (3.30)
-4.965*** (2.95)
Log-likelihood -2205.207 -2194.002 -2190.745 -1282.249 -1274.881 -1202.208
‘Environment’ means that regional dummies are included in the estimation of the cost frontier. ‘Equity’ refers to the inclusion of the bank’s equity in the estimation of the cost frontier. N=2988 for the first period, N=1884 for the second period. Absolute t-statistics are displayed in parentheses, *, **, *** denote an estimate significantly different from zero at the 10%, 5% or 1% level.
26
Table 5: The inefficiency of public banks according to the intermediation approach
Panel C: Public banks defined as state-owned banks Before generalised deposit insurance (2002) After generalised deposit insurance (2006)
Frontier characteristics
(a) Baseline
(b) environment
(c) Equity and environment
(d) Baseline
(e) environment
(f) Equity and environment
Intercept Yes Yes Yes Yes Yes Yes
Public banks -3.018 (1.60)
-2.801 (1.58)
-2.507 (1.35)
-2.886*** (4.01)
-3.268*** (2.90)
-1.994*** (4.10)
Foreign banks -1.290**
(2.08) -1.187* (1.66)
-1.084** (2.41)
-7.020*** (3.63)
-7.162*** (2.66)
-5.862*** (3.82)
Log-likelihood -1983.526 -1972.305 -1968.205 -1040.960 -1035.344 -1015.842
Panel D: Public banks defined as banks that receive a high share of interest income from the government bodies Intercept Yes Yes Yes Yes Yes Yes
Public banks -0.776 (0.53)
-1.387 (0.85)
-1.134 (0.74)
-3.888*** (3.54)
-4.243*** (3.80)
-2.968*** (4.52)
Foreign banks -1.141 (1.17)
-1.071 (1.13)
-0.976 (1.58)
-7.093*** (3.02)
-7.240*** (3.37)
-5.943*** (4.21)
Log-likelihood -1986.681 -1975.090 -1970.917 -1042.721 -1037.439 -1016.970
‘Environment’ means that regional dummies are included in the estimation of the cost frontier. ‘Equity’ refers to the inclusion of the bank’s equity in the estimation of the cost frontier. N=2988 for the first period, N=1884 for the second period. Absolute t-statistics are displayed in parentheses, *, **, *** denote an estimate significantly different from zero at the 10%, 5% or 1% level.
27
Table 6. Robustness to differences in activity mix Panel A: Public banks defined as state-owned bank/production approach
Pre generalised deposit insurance (2002)
Frontier characteristics
(a) environment
(b) equity
and environment
(c) environment and activities
(d) equity
and environment and activities
Intercept Yes Yes Yes Yes Public banks -1.041**
(2.04) -1.153***
(3.06) -0.679**
(2.03) -0.801**
(2.23) Foreign banks -0.803***
(2.85) -0.873***
(2.61) -0.584**
(2.06) -0.653 (1.58)
Household deposits % Yes Yes - - Firm deposits % Yes Yes - - Household loans % Yes Yes - - Firm loans % Yes Yes - - Bad loans % Yes Yes Yes Yes Log-likelihood -2163.004 -2162.106 -2130.126 -2128.461
Post generalized deposit insurance (2006) Intercept Yes Yes Yes Yes Public banks -2.699***
(3.85) -1.739***
(3.67) -5.397**
(2.47) -2.859***
(3.46) Foreign banks -4.514***
(3.71) -3.885***
(3.64) -7.153*
(1.97) -5.523***
(3.28) Household deposits % Yes Yes - - Firm deposits % Yes Yes - - Household loans % Yes Yes - - Firm loans % Yes Yes - - Bad loans % Yes Yes Yes Yes Log-likelihood -1226;456 -1165.323 -1230.926 -1143.223
28
Panel B: Public banks defined as banks that receive a high share of interest income from the government bodies/ production approach
Pre generalised deposit insurance (2002)
Frontier characteristics
(a) environment
(b) equity
and environment
(c) environment and activities
(d) equity
and environment and activities
Intercept Yes Yes Yes Yes Public banks -1.348
(1.24) -1.561 (1.58)
-0.862 (0.95)
-1.137 (1.53)
Foreign banks -0.788*** (2.89)
-0.863** (2.52)
-0.574** (2.05)
-0.654* (1.70)
Household deposits % Yes Yes - - Firm deposits % Yes Yes - - Household loans % Yes Yes - - Firm loans % Yes Yes - - Bad loans % Yes Yes Yes Yes Log-likelihood -2163.432 -2162.537 -2130.490 -2128.775
Panel B Post generalized deposit insurance (2006) Intercept Yes Yes Yes Yes Public banks -3.329***
(3.37) -2.766***
(3.87) -3.602
(1.18) -2.855***
(3.17) Foreign banks -4.553***
(3.35) -4.001***
(3.63) -5.611
(1.39) -5.627**
(2.43) Household deposits % Yes Yes - - Firm deposits % Yes Yes - - Household loans % Yes Yes - - Firm loans % Yes Yes - - Bad loans % Yes Yes Yes Yes Log-likelihood -1231.047 -1167.378 -1235.123 -1145.789
29
Panel C: Public banks defined as state-owned banks / intermediation approach
Pre generalised deposit insurance (2002)
Frontier characteristics
(a) environment
(b) equity
and environment
(c) environment and activities
(d) equity
and environment and activities
Intercept Yes Yes Yes Yes Public banks -1.285***
(2.31) -1.259**
(2.36) -1.471
(1.58) -1.447* (1.93)
Foreign banks 0.005 (0.02)
0.018 (0.11)
-1.609 (0.51)
-0.155 (0.81)
Household deposits % Yes Yes - - Firm deposits % Yes Yes - - Household loans % Yes Yes - - Firm loans % Yes Yes - - Bad loans % Yes Yes Yes Yes Log-likelihood -1917.841 -1916.956 -1917.810 -1917.737
Post generalized deposit insurance (2006) Intercept Yes Yes Yes Yes Public banks -1.957***
(2.57) -1.857***
(5.08) -2.244
(1.60) -2.326***
(3.88) Foreign banks -3.863***
(2.93) -4.378***
(10.40) -3.924**
(2.07) -6.275***
(3.14) Household deposits % Yes Yes - - Firm deposits % Yes Yes - - Household loans % Yes Yes - - Firm loans % Yes Yes - - Bad loans % Yes Yes Yes Yes Log-likelihood -951.341 -932.902 -998.824 -975.377
30
Panel D: Public banks defined as banks that receive a high share of interest income from the government bodies / intermediation approach
Pre generalised deposit insurance (2002)
Frontier characteristics
(a) environment
(b) equity
and environment
(c) environment and activities
(d) equity
and environment and activities
Intercept Yes Yes Yes Yes Public banks -0.967
(1.53) -0.890 (1.47)
-1.320 (1.10)
-1.267 (1.17)
Foreign banks 0.054 (0.24)
0.067 (0.38)
-0.125 (0.53)
-0.118 (0.59)
Household deposits % Yes Yes - - Firm deposits % Yes Yes - - Household loans % Yes Yes - - Firm loans % Yes Yes - - Bad loans % Yes Yes Yes Yes Log-likelihood -1919.707 -1918.822 -1919.208 -1919.153
Panel B Post generalized deposit insurance (2006) Intercept Yes Yes Yes Yes Public banks -2.670**
(2.28) -2.824***
(3.98) -2.518
(1.36) -2.978***
(2.81) Foreign banks -3.892***
(2.77) -4.359***
(3.85) -3.847***
(2.76) -6.380***
(2.76) Household deposits % Yes Yes - - Firm deposits % Yes Yes - - Household loans % Yes Yes - - Firm loans % Yes Yes - - Bad loans % Yes Yes Yes Yes Log-likelihood -953.868 -934.310 -1000.718 -976.560
31
Table 7: Size matched results Panel A: Public banks defined as state-owned banks / poduction approach
Pre generalised deposit insurance (2002)
Frontier characteristics
(a) environment
(b) equity
and environment
(c) environment and activities
(d) equity
and environment and activities
Intercept Yes Yes Yes Yes Public banks -2.130
(1.14) -2.153***
(2.73) -0.226
(0.66) -0.244 (0.57)
Foreign banks 0.412 (0.64)
0.384 (1.32)
0.039 (0.11)
0.012 (0.04)
Household deposits % 1.594 (0.71)
1.035 (1.46)
- -
Firm deposits % 6.439 (1.23)
6.175*** (3.26)
- -
Household loans % 2.130 (1.17)
2.681* (1.92)
- -
Firm loans % 2.226 (1.36)
2.639** (2.23)
- -
Bad loans % 11.841 (1.47)
15.918** (2.53)
6.168 (1.62)
6.742 (1.22)
Log-likelihood -397.439 -397.026 -390.969 -390.955
Post generalised deposit insurance (2006) Intercept Yes Yes Yes Yes Public banks -0.331*
(1.95) -0.190**
(1.96) -1.406**
(2.06) -1.280**
(2.27) Foreign banks -1.433***
(6.74) -0.907***
(11.58) -2.660*
(1.94) -1.987**
(2.36) Household deposits % -0.815***
(3.60) 0.030 (0.36)
- -
Firm deposits % -0.222 (1.16)
0.154** (2.48)
- -
Household loans % 0.718*** (2.69)
0.293 (1.64)
- -
Firm loans % 0.813*** (3.57)
0.416*** (3.69)
- -
Bad loans % 0.018 (0.03)
0.207 (1.08)
-3.215 (0.89)
-4.126 (1.06)
Log-likelihood -360.661 -332.218 -349.916 -339.517
32
Table 8: Robustness to other econometric techniques: DEA
Panel A: Public banks defined as state-owned banks, full sample Before generalised deposit insurance (2002) After generalised deposit insurance (2006)
Frontier characteristics
(a) (b) (c) (d) (e) (f)
Intercept Yes Yes Yes Yes Yes Yes
Public banks -0.007 (0.32)
-0.0233 (1.16)
-0.021 (1.07)
0.014 (0.68)
0.013 (0.63)
0.013 (0.61)
Foreign banks 0.055***
(3.03) 0.008 (0.44)
0.008 (0.45)
0.145*** (8.00)
0.135*** (6.66)
0.135*** (6.67)
Activities - Yes Yes - Yes Yes Bad loans - - Yes - - Yes Log-likelihood 733.983 776.945 785.229 525.603 538.238 538.296
Panel B: Public banks defined as state-owned banks, size-matched sample Intercept Yes Yes Yes Yes Yes Yes
Public banks -0.023 (0.68)
-0.034 (1.01)
-0.033 (1.00)
0.024 (0.78)
0.018 (0.63)
0.017 (0.60)
Foreign banks 0.055* (1.90)
0.005 (0.18)
0.004 (0.12)
0.152*** (6.11)
0.128*** (4.31)
0.112*** (3.70)
Activities - Yes Yes - Yes Yes Bad loans - - Yes - - Yes Log-likelihood 85.342 93.296 94.764 130.483 147.455 149.411
‘Environment’ means that regional dummies are included in the estimation of the cost frontier. ‘Equity’ refers to the inclusion of the bank’s equity in the estimation of the cost frontier. N=747 for the first period, N=471 for the second period. Absolute t-statistics are displayed in parentheses, *, **, *** denote an estimate significantly different from zero at the 10%, 5% or 1% level
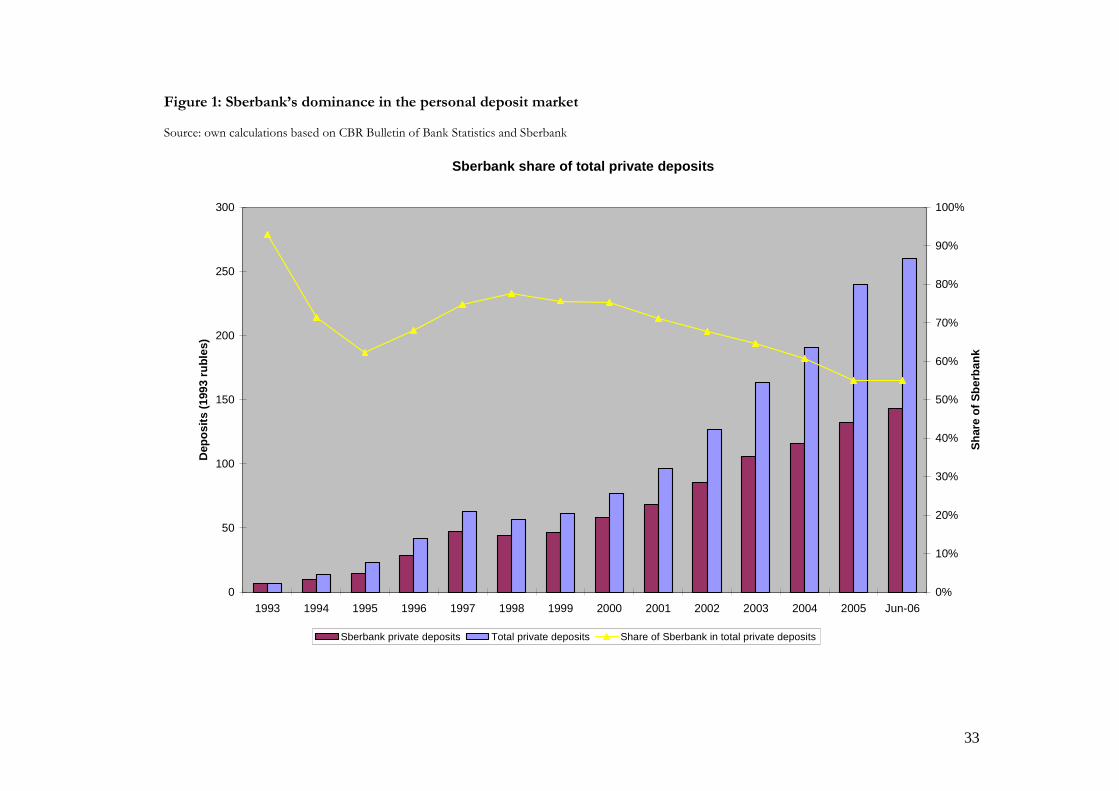
33
Figure 1: Sberbank’s dominance in the personal deposit market Source: own calculations based on CBR Bulletin of Bank Statistics and Sberbank
Sberbank share of total private deposits
0
50
100
150
200
250
300
1993 1994 1995 1996 1997 1998 1999 2000 2001 2002 2003 2004 2005 Jun-06
Dep
osi
ts (
1993
ru
ble
s)
0%
10%
20%
30%
40%
50%
60%
70%
80%
90%
100%
Sh
are
of
Sb
erb
ank
Sberbank private deposits Total private deposits Share of Sberbank in total private deposits
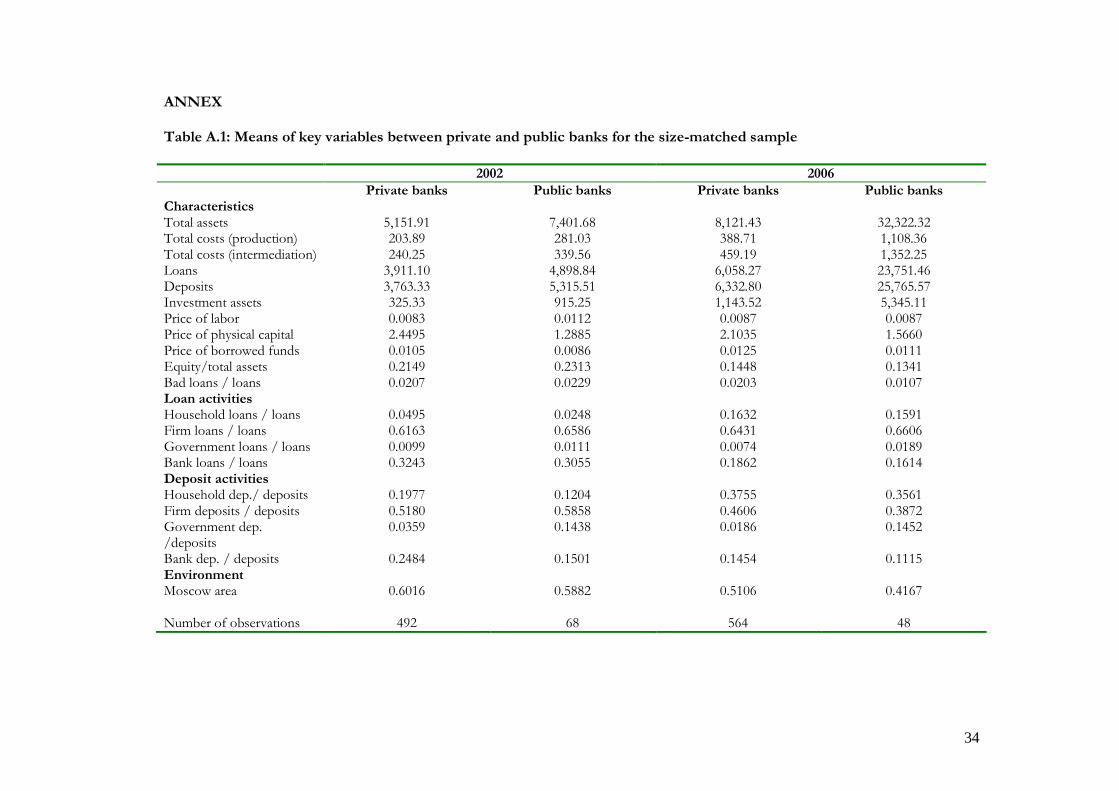
34
ANNEX Table A.1: Means of key variables between private and public banks for the size-matched sample 2002 2006
Private banks Public banks Private banks Public banks Characteristics Total assets 5,151.91 7,401.68 8,121.43 32,322.32 Total costs (production) 203.89 281.03 388.71 1,108.36 Total costs (intermediation) 240.25 339.56 459.19 1,352.25 Loans 3,911.10 4,898.84 6,058.27 23,751.46 Deposits 3,763.33 5,315.51 6,332.80 25,765.57 Investment assets 325.33 915.25 1,143.52 5,345.11 Price of labor 0.0083 0.0112 0.0087 0.0087 Price of physical capital 2.4495 1.2885 2.1035 1.5660 Price of borrowed funds 0.0105 0.0086 0.0125 0.0111 Equity/total assets 0.2149 0.2313 0.1448 0.1341 Bad loans / loans 0.0207 0.0229 0.0203 0.0107 Loan activities Household loans / loans 0.0495 0.0248 0.1632 0.1591 Firm loans / loans 0.6163 0.6586 0.6431 0.6606 Government loans / loans 0.0099 0.0111 0.0074 0.0189 Bank loans / loans 0.3243 0.3055 0.1862 0.1614 Deposit activities Household dep./ deposits 0.1977 0.1204 0.3755 0.3561 Firm deposits / deposits 0.5180 0.5858 0.4606 0.3872 Government dep. /deposits
0.0359 0.1438 0.0186 0.1452
Bank dep. / deposits 0.2484 0.1501 0.1454 0.1115 Environment Moscow area 0.6016 0.5882 0.5106 0.4167 Number of observations 492 68 564 48
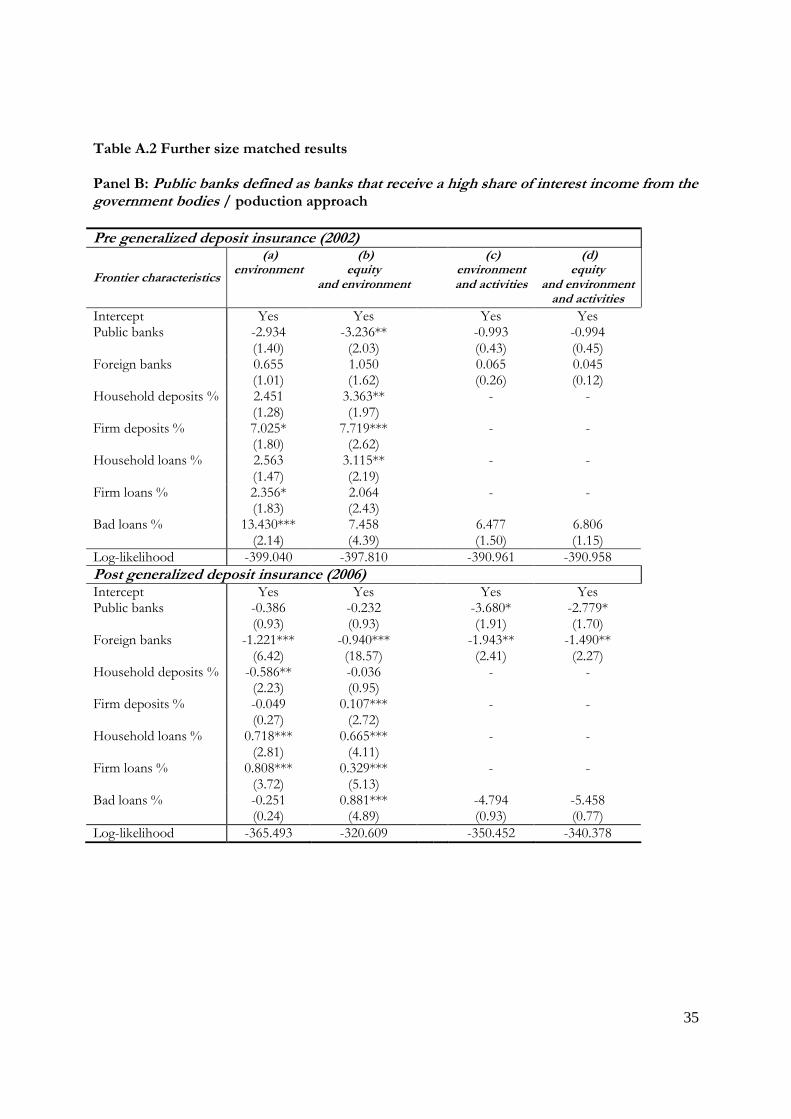
35
Table A.2 Further size matched results Panel B: Public banks defined as banks that receive a high share of interest income from the government bodies / poduction approach
Pre generalized deposit insurance (2002)
Frontier characteristics
(a) environment
(b) equity
and environment
(c) environment and activities
(d) equity
and environment and activities
Intercept Yes Yes Yes Yes Public banks -2.934
(1.40) -3.236**
(2.03) -0.993
(0.43) -0.994 (0.45)
Foreign banks 0.655 (1.01)
1.050 (1.62)
0.065 (0.26)
0.045 (0.12)
Household deposits % 2.451 (1.28)
3.363** (1.97)
- -
Firm deposits % 7.025* (1.80)
7.719*** (2.62)
- -
Household loans % 2.563 (1.47)
3.115** (2.19)
- -
Firm loans % 2.356* (1.83)
2.064 (2.43)
- -
Bad loans % 13.430*** (2.14)
7.458 (4.39)
6.477 (1.50)
6.806 (1.15)
Log-likelihood -399.040 -397.810 -390.961 -390.958
Post generalized deposit insurance (2006) Intercept Yes Yes Yes Yes Public banks -0.386
(0.93) -0.232 (0.93)
-3.680* (1.91)
-2.779* (1.70)
Foreign banks -1.221*** (6.42)
-0.940*** (18.57)
-1.943** (2.41)
-1.490** (2.27)
Household deposits % -0.586** (2.23)
-0.036 (0.95)
- -
Firm deposits % -0.049 (0.27)
0.107*** (2.72)
- -
Household loans % 0.718*** (2.81)
0.665*** (4.11)
- -
Firm loans % 0.808*** (3.72)
0.329*** (5.13)
- -
Bad loans % -0.251 (0.24)
0.881*** (4.89)
-4.794 (0.93)
-5.458 (0.77)
Log-likelihood -365.493 -320.609 -350.452 -340.378
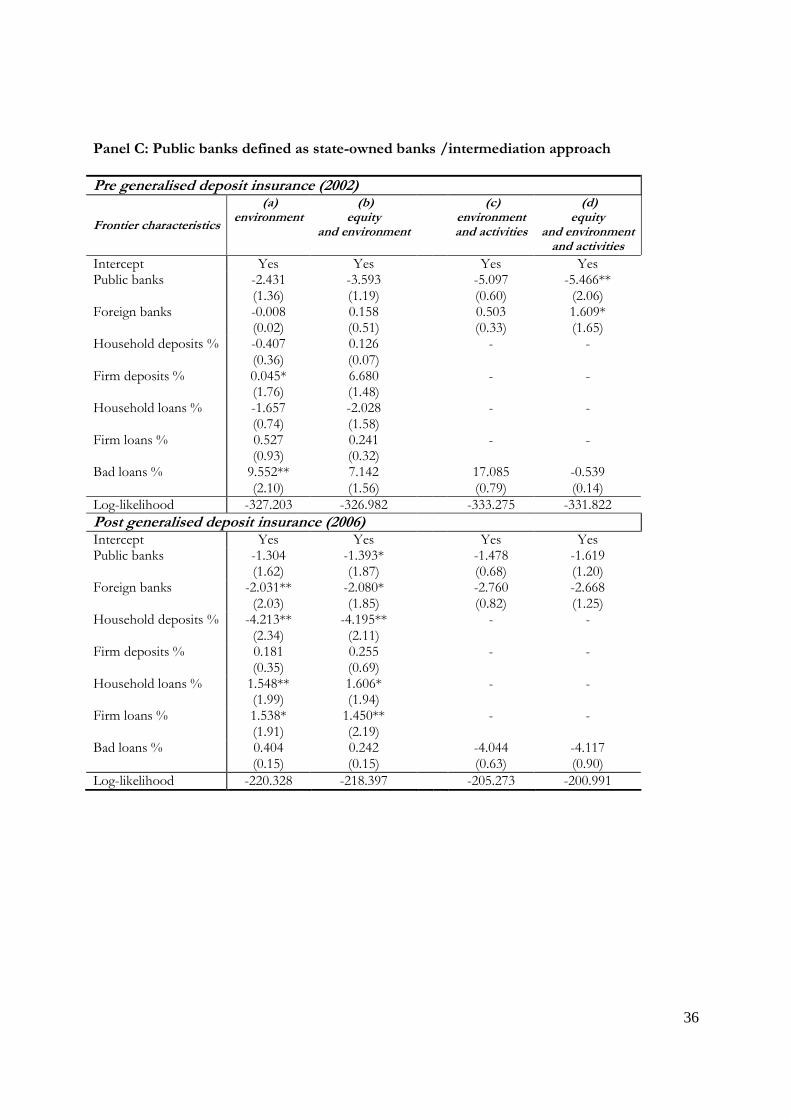
36
Panel C: Public banks defined as state-owned banks /intermediation approach
Pre generalised deposit insurance (2002)
Frontier characteristics
(a) environment
(b) equity
and environment
(c) environment and activities
(d) equity
and environment and activities
Intercept Yes Yes Yes Yes Public banks -2.431
(1.36) -3.593 (1.19)
-5.097 (0.60)
-5.466** (2.06)
Foreign banks -0.008 (0.02)
0.158 (0.51)
0.503 (0.33)
1.609* (1.65)
Household deposits % -0.407 (0.36)
0.126 (0.07)
- -
Firm deposits % 0.045* (1.76)
6.680 (1.48)
- -
Household loans % -1.657 (0.74)
-2.028 (1.58)
- -
Firm loans % 0.527 (0.93)
0.241 (0.32)
- -
Bad loans % 9.552** (2.10)
7.142 (1.56)
17.085 (0.79)
-0.539 (0.14)
Log-likelihood -327.203 -326.982 -333.275 -331.822
Post generalised deposit insurance (2006) Intercept Yes Yes Yes Yes Public banks -1.304
(1.62) -1.393* (1.87)
-1.478 (0.68)
-1.619 (1.20)
Foreign banks -2.031** (2.03)
-2.080* (1.85)
-2.760 (0.82)
-2.668 (1.25)
Household deposits % -4.213** (2.34)
-4.195** (2.11)
- -
Firm deposits % 0.181 (0.35)
0.255 (0.69)
- -
Household loans % 1.548** (1.99)
1.606* (1.94)
- -
Firm loans % 1.538* (1.91)
1.450** (2.19)
- -
Bad loans % 0.404 (0.15)
0.242 (0.15)
-4.044 (0.63)
-4.117 (0.90)
Log-likelihood -220.328 -218.397 -205.273 -200.991
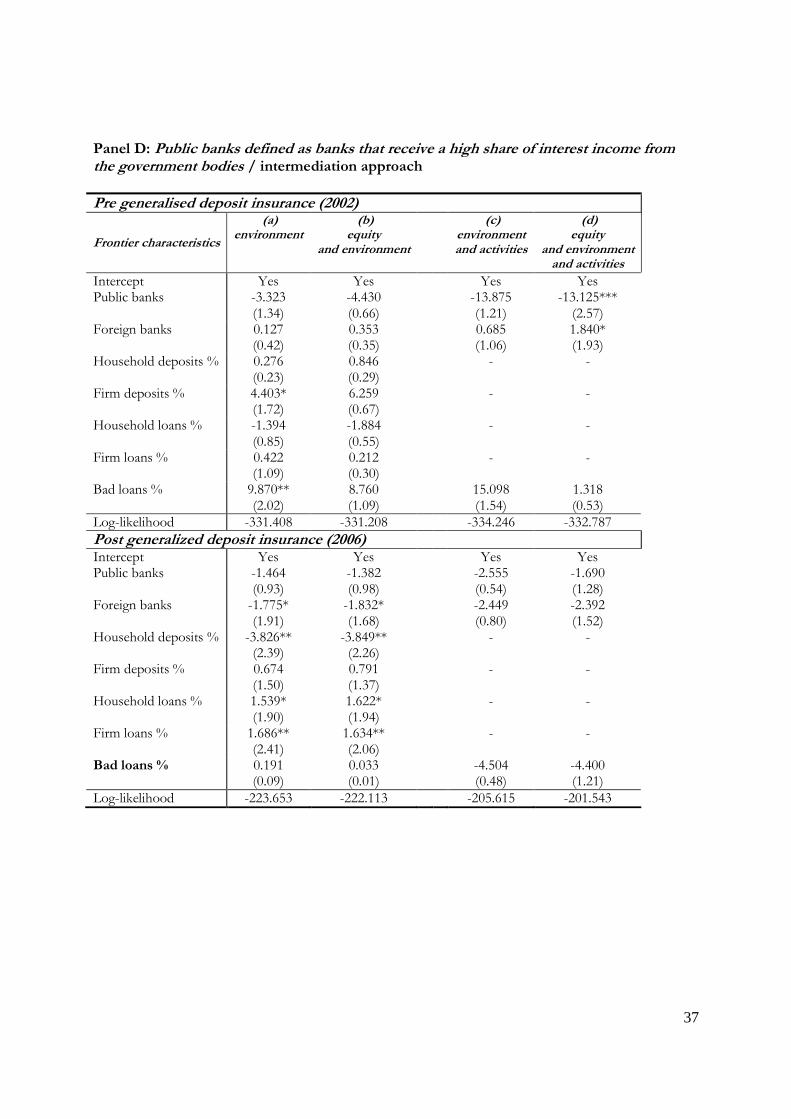
37
Panel D: Public banks defined as banks that receive a high share of interest income from the government bodies / intermediation approach
Pre generalised deposit insurance (2002)
Frontier characteristics
(a) environment
(b) equity
and environment
(c) environment and activities
(d) equity
and environment and activities
Intercept Yes Yes Yes Yes Public banks -3.323
(1.34) -4.430 (0.66)
-13.875 (1.21)
-13.125*** (2.57)
Foreign banks 0.127 (0.42)
0.353 (0.35)
0.685 (1.06)
1.840* (1.93)
Household deposits % 0.276 (0.23)
0.846 (0.29)
- -
Firm deposits % 4.403* (1.72)
6.259 (0.67)
- -
Household loans % -1.394 (0.85)
-1.884 (0.55)
- -
Firm loans % 0.422 (1.09)
0.212 (0.30)
- -
Bad loans % 9.870** (2.02)
8.760 (1.09)
15.098 (1.54)
1.318 (0.53)
Log-likelihood -331.408 -331.208 -334.246 -332.787
Post generalized deposit insurance (2006) Intercept Yes Yes Yes Yes Public banks -1.464
(0.93) -1.382 (0.98)
-2.555 (0.54)
-1.690 (1.28)
Foreign banks -1.775* (1.91)
-1.832* (1.68)
-2.449 (0.80)
-2.392 (1.52)
Household deposits % -3.826** (2.39)
-3.849** (2.26)
- -
Firm deposits % 0.674 (1.50)
0.791 (1.37)
- -
Household loans % 1.539* (1.90)
1.622* (1.94)
- -
Firm loans % 1.686** (2.41)
1.634** (2.06)
- -
Bad loans % 0.191 (0.09)
0.033 (0.01)
-4.504 (0.48)
-4.400 (1.21)
Log-likelihood -223.653 -222.113 -205.615 -201.543