Embed Size (px)
Citation preview

MARKET REPORT 2013
2
CONTENTS
ENERGY MARKET COMPANY Letter from the Chairman 1
MARKET OVERVIEW Market History 3
Industry Structure 4
Market Features 6
MARKET GOVERNANCE Overview 8
Letter from the Chair, Rules Change Panel 9
Market Evolution 10
Letter from the Dispute Resolution Counsellor 12
MARKET PERFORMANCE Overview of the Year 15
Energy Demand 19
Energy Supply 20
Energy Prices 23
Ancillary Markets 28
Competition in the Generation and Retail Markets 35
Settlement and Prudential Management 37
Contracted Ancillary Services 38
Market Fees 39
ADDITIONAL INFORMATION Glossary 41
Market Entities’ Contact Details 43
1
ENERGY MARKET COMPANY: Letter from the Chairman
We will continue to work with all stakeholders to evolve the market. I am confident that Singapore’s electricity market will continue to serve as a role model for others who are embarking on the path of market liberalisation.
Wong Meng Meng Chairman Energy Market Company
In many aspects, 2013 was a significant year for the electricity industry in Singapore. Overall, the National Electricity Market of Singapore (NEMS) performed within the expectations of an effective competitive market and demonstrated the real benefits that liberalised electricity markets can offer.
Singapore’s first Liquefied Natural Gas (LNG) terminal commenced operations in May. This milestone development provides greater opportunities for Singapore to diversify its gas sources and enhance energy security.
The NEMS started its second decade of trading in an environment of surplus generation supply. Total registered capacity increased 14.9 percent from the previous year to reach an all-time high of 12,422 megawatts (MW) in 2013. This resulted from the registration of new combined-cycle gas turbine (CCGT) units by both existing and new market participants.
For the first time since the market started, total generation supply – the amount of electricity that is actually offered in the NEMS – crossed the 7,000MW mark. Electricity consumption, on the other hand, increased by only 2.4 percent compared to 2012, to 45.2 terawatt hours.
Arising largely from the increase in supply, the Uniform Singapore Energy Price (USEP) retreated after three straight years of increase to end at $173 per megawatt hour. This is a 22.1 percent drop from 2012’s level and the biggest year-on-year drop in the history of the NEMS. The annual value of products traded also declined by a record 20.1 percent to $8.7 billion.
I am happy to note that wholesale electricity prices have generally responded efficiently to changes in the underlying drivers of demand and supply.
I am also pleased to observe considerable movement in the market share of market participants and generation technologies as this demonstrates healthy competition in the NEMS.
The combined market share of the top three generation companies dropped to 69.7 percent in 2013. This is the first time since the start of the market that their combined market share has fallen below 75 percent.
The retail market also saw an interesting development. Apart from SP Services, which provides market support services to contestable consumers and is the supplier for all non-contestable consumers, three retailers had consistently held the top three positions since 2004. In 2013, however, Keppel Electric successfully displaced one of them and made it to the list of top three.
Finally, the continuous move towards more efficient generation was most pronounced in 2013. The market share of CCGT generation units, currently the most efficient in the market, reached a new high of 94.3 percent.
The NEMS’ stable and efficient operations can be attributed to the concerted effort of our regulator, governance panels, market participants as well as other stakeholders. I would like to thank everyone – especially the members of our Rules Change Panel, Market Surveillance and Compliance Panel and Dispute Resolution and Compensation Panel – for their commitment and dedication to the NEMS.
Dear Industry Members
CONTENTS

2
MARKET OVERVIEW

3
Corporatisation 1995 Electricity functions of the Public Utilities Board corporatised Singapore Power formed as a holding company
1996 Singapore Electricity Pool (SEP) design process began
Singapore Electricity Pool (SEP) 1998 SEP commencedPowerGrid is SEP Administrator and Power System Operator (PSO)
1999 Review of electricity industry
National Electricity Market of Singapore (NEMS)
2000 Decision for further reform to obtain full benefits of competition New market design process began
2001 Electricity industry legislation enactedEnergy Market Authority (EMA) established as industry regulator and PSOEnergy Market Company (EMC) established as the NEMS wholesale market operatorFirst phase of retail contestability
2002 Testing and trialling of wholesale market system began
2003 NEMS wholesale market trading began
2004 Vesting contract regime introducedInterruptible loads (IL) began to participate in the reserves market
2006 First wholesale market trader joined the market and commenced trading as IL providerFirst commercial generator since 2003 joined the market and started trading Retail contestability expanded to 75 percent of total electricity demand
2007 Removal of the Market Registration Application Fee
2008 Sale of Tuas Power to China Huaneng Group in March, Senoko Power to Lion Consortium in September, and PowerSeraya to YTL Power in December
Embedded generators (EG) joined the market
2009 Revised regulation price cap of $300/MWh was implementedNew EGs, small generators and incineration plants joined and started trading
2010 Vesting tender was introduced to tender out a percentage of non-contestable electricity demand to generation companies for bidding
2012 NEMS completed ten successful years of trading
2013 Singapore’s Liquefied Natural Gas (LNG) terminal started commercial operationsLNG vesting contract introduced
Market Reform Milestones
MARKET OVERVIEW: Market History
The opening of the National Electricity Market of Singapore (NEMS) in January 2003 was the culmination of a number of structural reforms to Singapore’s electricity industry.
Singapore’s journey to liberalisation started in October 1995, when industry assets were corporatised and put on a commercial footing. In 1998, the Singapore Electricity Pool, a day-ahead market, began operations. On 1 April 2001, a new legal and regulatory framework was introduced that formed the basis for a new electricity market.
The NEMS is an integral part of Singapore’s overall energy policy framework which seeks to maintain a balance of the three policy objectives of economic competitiveness, energy security and environmental sustainability. The NEMS places Singapore alongside an international movement to introduce market mechanisms into the electricity industry as a way to:• increase economic efficiency through
competition;• attract private investment;• send accurate price signals to guide
production and consumption decisions;• encourage innovation; and• provide consumer choice.
CONTENTS
4
Singapore’s electricity industry is structured to facilitate competitive wholesale and retail markets. Competitiveness is achieved by separating the ownership of the contestable parts of the industry from those with natural monopoly characteristics.
Five New Market Participants Joined the Market
The NEMS welcomed five new market participants (MPs) in 2013. Three of the new MPs are wholesale market traders while two are retailers.
Singapore LNG Corporation, which operates Singapore’s first liquefied natural gas terminal, joined the NEMS as a wholesale market trader in March. This was followed by GlaxoSmithKline Biologicals in May, and ECO Special Waste Management in November.
On the retail side, PacificLight Energy and Hyflux Energy joined the NEMS in February and June respectively. This brings the total number of retailers in the NEMS to eight.
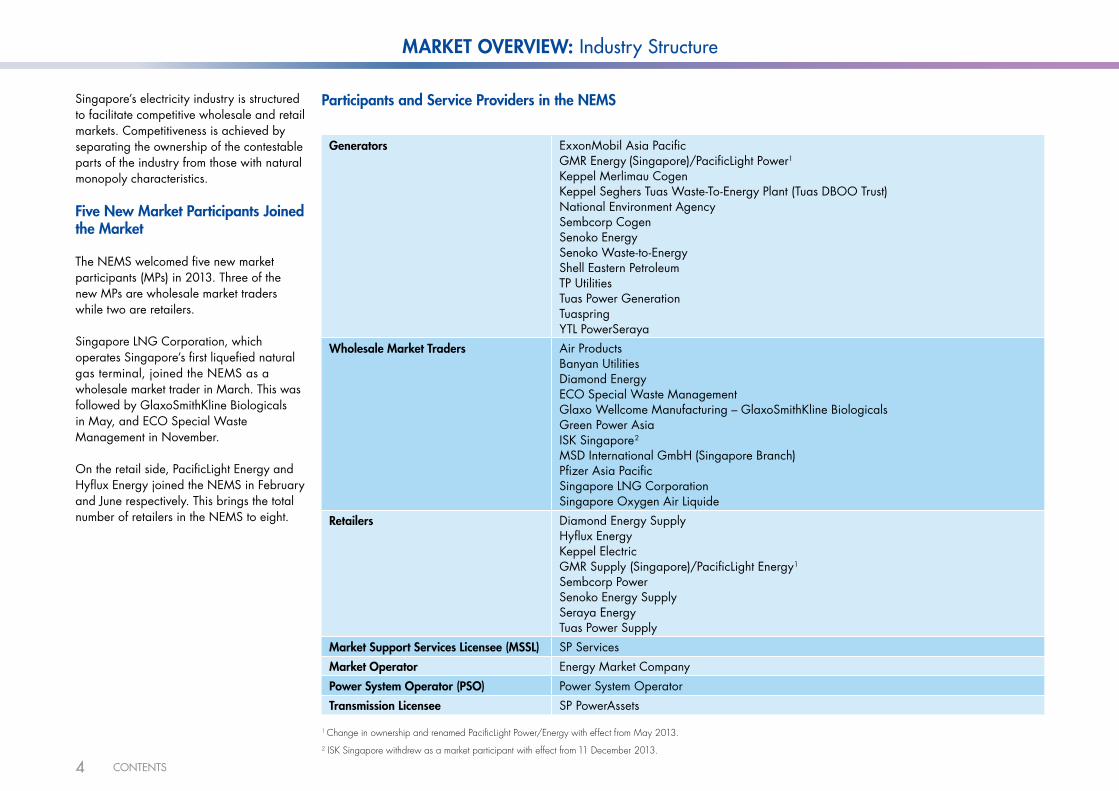
Participants and Service Providers in the NEMS
Generators ExxonMobil Asia PacificGMR Energy (Singapore)/PacificLight Power1
Keppel Merlimau CogenKeppel Seghers Tuas Waste-To-Energy Plant (Tuas DBOO Trust)National Environment AgencySembcorp CogenSenoko Energy Senoko Waste-to-EnergyShell Eastern PetroleumTP UtilitiesTuas Power GenerationTuaspringYTL PowerSeraya
Wholesale Market Traders Air ProductsBanyan UtilitiesDiamond EnergyECO Special Waste ManagementGlaxo Wellcome Manufacturing – GlaxoSmithKline BiologicalsGreen Power AsiaISK Singapore2 MSD International GmbH (Singapore Branch)Pfizer Asia PacificSingapore LNG Corporation Singapore Oxygen Air Liquide
Retailers Diamond Energy SupplyHyflux EnergyKeppel ElectricGMR Supply (Singapore)/PacificLight Energy1
Sembcorp PowerSenoko Energy SupplySeraya EnergyTuas Power Supply
Market Support Services Licensee (MSSL) SP ServicesMarket Operator Energy Market CompanyPower System Operator (PSO) Power System Operator Transmission Licensee SP PowerAssets
1 Change in ownership and renamed PacificLight Power/Energy with effect from May 2013.2 ISK Singapore withdrew as a market participant with effect from 11 December 2013.
MARKET OVERVIEW: Industry Structure
CONTENTS

5
Generation Licensees All generators that are connected to the transmission system are licensed by the EMA unless their facilities are less than 10MW. All generators with facilities of 1MW or more that are connected to the transmission system must participate in the NEMS and be registered with EMC. Wholesale Market TradersWholesale market traders are companies, other than generators or retailers, that are licensed by the EMA to trade in the wholesale electricity markets. Retail Electricity LicenseesRetailers that sell electricity to contestable consumers are licensed by the EMA. Retailers that are registered as market participants purchase electricity directly from the wholesale market.
Market Support Services Licensee – SP Services A Market Support Services Licensee (MSSL) is authorised to provide market support services. Such services include consumer registration and transfer, meter reading and meter data management, retail settlements and billing for contestable consumers. SP Services is the only MSSL. Market Operator – EMC EMC operates and administers the wholesale market. This role includes calculating prices, scheduling generation, clearing and settling market transactions and procuring ancillary services. EMC also administers the rule change process and provides resources that support market surveillance and the compliance and dispute resolution processes.
Transmission License – SP PowerAssets SP PowerAssets owns and is responsible for maintaining the transmission system. Power System Operator The Power System Operator (PSO), a division of the EMA, is responsible for ensuring the security of supply of electricity to consumers. The PSO controls the dispatch of generation facilities, co-ordinates scheduled outages and power system emergency planning and directs the operation of the high-voltage transmission system. Regulator – EMA The EMA is the regulator of the electricity industry and has the ultimate responsibility for the market framework and for ensuring that the interests of consumers are protected.
ConsumersConsumers are classified as being either contestable or non-contestable, depending on their level of electricity usage. Contestable consumers may choose to purchase electricity from a retailer, directly from the wholesale market or indirectly from the wholesale market through the MSSL, SP Services. Non-contestable consumers are supplied by SP Services.
MARKET OVERVIEW: Industry Structure
CONTENTS
6
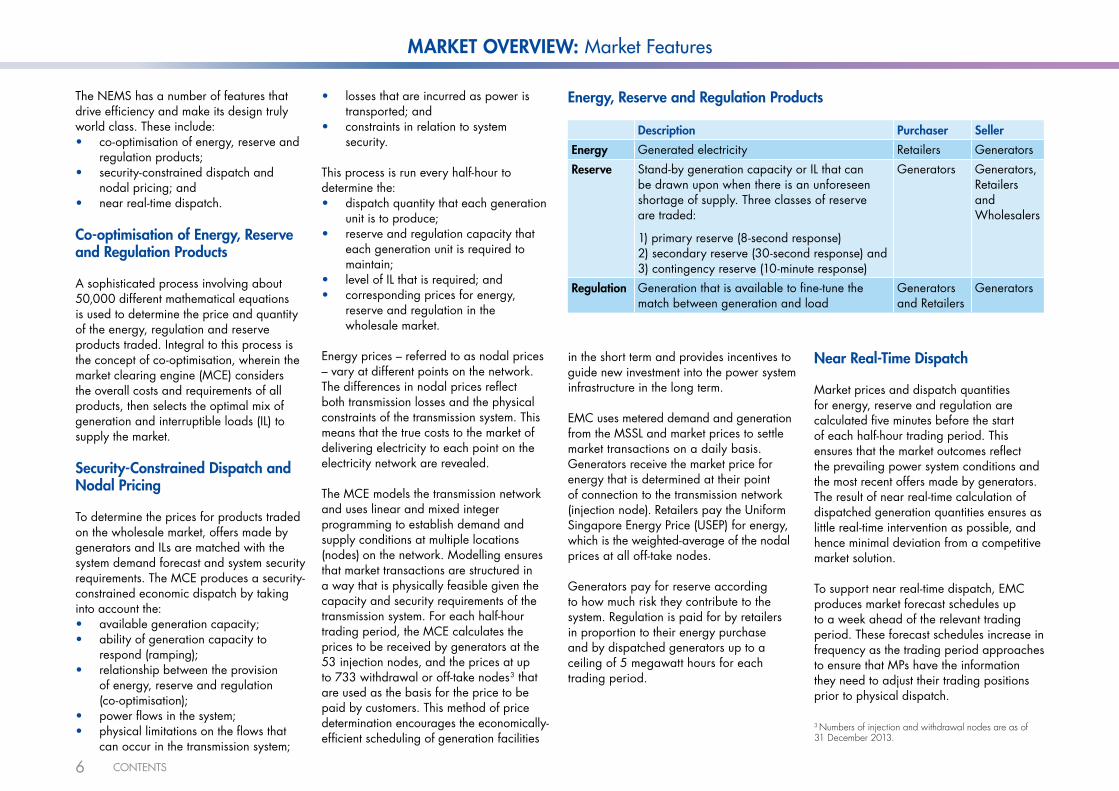
Energy, Reserve and Regulation ProductsThe NEMS has a number of features that drive efficiency and make its design truly world class. These include:• co-optimisation of energy, reserve and
regulation products;• security-constrained dispatch and
nodal pricing; and• near real-time dispatch.
Co-optimisation of Energy, Reserve and Regulation Products
A sophisticated process involving about 50,000 different mathematical equations is used to determine the price and quantity of the energy, regulation and reserve products traded. Integral to this process is the concept of co-optimisation, wherein the market clearing engine (MCE) considers the overall costs and requirements of all products, then selects the optimal mix of generation and interruptible loads (IL) to supply the market.
Security-Constrained Dispatch and Nodal Pricing
To determine the prices for products traded on the wholesale market, offers made by generators and ILs are matched with the system demand forecast and system security requirements. The MCE produces a security-constrained economic dispatch by taking into account the:• available generation capacity;• ability of generation capacity to
respond (ramping);• relationship between the provision
of energy, reserve and regulation (co-optimisation);
• power flows in the system;• physical limitations on the flows that
can occur in the transmission system;
Description Purchaser Seller
Energy Generated electricity Retailers GeneratorsReserve Stand-by generation capacity or IL that can
be drawn upon when there is an unforeseen shortage of supply. Three classes of reserve are traded:
1) primary reserve (8-second response) 2) secondary reserve (30-second response) and 3) contingency reserve (10-minute response)
Generators Generators, Retailers and Wholesalers
Regulation Generation that is available to fine-tune the match between generation and load
Generators and Retailers
Generators
• losses that are incurred as power is transported; and
• constraints in relation to system security.
This process is run every half-hour to determine the:• dispatch quantity that each generation
unit is to produce;• reserve and regulation capacity that
each generation unit is required to maintain;
• level of IL that is required; and • corresponding prices for energy,
reserve and regulation in the wholesale market.
Energy prices – referred to as nodal prices – vary at different points on the network. The differences in nodal prices reflect both transmission losses and the physical constraints of the transmission system. This means that the true costs to the market of delivering electricity to each point on the electricity network are revealed.
The MCE models the transmission network and uses linear and mixed integer programming to establish demand and supply conditions at multiple locations (nodes) on the network. Modelling ensures that market transactions are structured in a way that is physically feasible given the capacity and security requirements of the transmission system. For each half-hour trading period, the MCE calculates the prices to be received by generators at the 53 injection nodes, and the prices at up to 733 withdrawal or off-take nodes3 that are used as the basis for the price to be paid by customers. This method of price determination encourages the economically-efficient scheduling of generation facilities
in the short term and provides incentives to guide new investment into the power system infrastructure in the long term.
EMC uses metered demand and generation from the MSSL and market prices to settle market transactions on a daily basis. Generators receive the market price for energy that is determined at their point of connection to the transmission network (injection node). Retailers pay the Uniform Singapore Energy Price (USEP) for energy, which is the weighted-average of the nodal prices at all off-take nodes.
Generators pay for reserve according to how much risk they contribute to the system. Regulation is paid for by retailers in proportion to their energy purchase and by dispatched generators up to a ceiling of 5 megawatt hours for each trading period.
Near Real-Time Dispatch
Market prices and dispatch quantities for energy, reserve and regulation are calculated five minutes before the start of each half-hour trading period. This ensures that the market outcomes reflect the prevailing power system conditions and the most recent offers made by generators. The result of near real-time calculation of dispatched generation quantities ensures as little real-time intervention as possible, and hence minimal deviation from a competitive market solution.
To support near real-time dispatch, EMC produces market forecast schedules up to a week ahead of the relevant trading period. These forecast schedules increase in frequency as the trading period approaches to ensure that MPs have the information they need to adjust their trading positions prior to physical dispatch.
3 Numbers of injection and withdrawal nodes are as of 31 December 2013.
MARKET OVERVIEW: Market Features
CONTENTS

MARKET GOVERNANCE

8
Governing Documents and Institutions
The Energy Market Authority (EMA) was established under the Energy Market Authority of Singapore Act 2001. The EMA is the electricity market regulator under the Electricity Act 2001 and is responsible for, among other mandates:• creating the market framework for electricity and gas supply;• promoting development of the electricity and gas industries;• protecting the interests of consumers and the public;• issuing licences; and• advising the Government on energy policies.
Rule Change Process
The day-to-day functioning of the National Electricity Market of Singapore (NEMS) wholesale market is governed by the Singapore Electricity Market Rules.
The rule change process is the responsibility of the Rules Change Panel (RCP). Appointed by the Energy Market Company (EMC) Board, RCP members represent generators, retailers, wholesale market traders, the financial community, the Power System Operator (PSO), the Market Support Services Licensee (MSSL), the transmission licensee, electricity consumers and EMC, ensuring representation by all the key sectors of the industry.
The rule change process is designed to maximise transparency and opportunities for public involvement. Rule modifications recommended by the RCP require the support of the EMC Board and the EMA. When approving changes to the Market Rules, the EMA is required to consider whether the proposed rule modifications (i) unjustly discriminate in favour of or against a market participant (MP) or a class of MPs; or (ii) are consistent with the functions and duties of the EMA under subsection 3(3) of the Electricity Act. Each year, the RCP establishes and publishes its work plan to ensure that stakeholders remain informed about the likely evolution of the market. The work plan can be found at www.emcsg.com.
Market Surveillance and Compliance
The Market Surveillance and Compliance Panel (MSCP), comprising professionals independent of the market, is responsible for monitoring, investigating and reporting the behaviour of MPs and the structural efficiency of the market. The panel identifies market rule breaches and assesses market operations for efficiency and fairness. In circumstances in which the MSCP determines that an MP is not compliant with the Market Rules, it may take enforcement action, which may include levying a penalty. The MSCP also recommends remedial actions to mitigate any rule breaches or inefficiencies identified. The panel produces the MSCP Annual Report, which has been published together with the NEMS Market Report since 2007.
Dispute Resolution
The Market Rules contain a process that facilitates the resolution of disputes between MPs and service providers. The dispute resolution process is designed to be a cost-effective way of resolving disputes and preserving market relationships by avoiding court proceedings. This process is managed by the Dispute Resolution Counsellor (DRC).
MARKET GOVERNANCE: Overview
CONTENTS

9
like to express my appreciation to Mr Low for his contributions in the past one and a half years.
The success of the rules change process would not have been attainable without the following people: our EMA regulators and the EMC Board for their collaborative efforts in assessing the rule changes; market participants for providing their comments and suggestions; and EMC’s Market Administration Team for their assiduous efforts and analytical support on rule change proposals. I thank them for their commitment and for making 2013 another successful year.
Dave CarlsonChairRules Change Panel
The wholesale market operations of the NEMS are governed by the Singapore Electricity Market Rules. The Market Rules constantly evolve to ensure that they stay relevant amidst policy and market changes in the electricity landscape.
Championing the evolution of the Market Rules is the Rules Change Panel’s (RCP) mandate. The RCP re-prioritises its work plan annually to ensure that the most important and urgent issues are tackled first. To further enhance the relevance of the work plan, starting from 2014, industry members will be allowed to submit urgent issues that they wish to incorporate into the work plan midway through the financial year.
This year, a major theme among issues on the RCP’s agenda involved refinements to the market clearing engine (MCE). The MCE is central to the workings of the NEMS, balancing economic efficiency with
system security considerations. Given its significant role in determining schedules and prices, the RCP paid exceptional care in examining every proposed refinement to the MCE’s formulation. In the process of tackling these issues, I believe all Panel members have benefitted from a greater understanding and appreciation of the complex formulation underpinning the market.
Beyond establishing potential benefits from the proposed enhancements, robust cost-benefit analyses often feature prominently in the Panel’s decision-making process. For example, one enhancement sought to introduce a new algorithm to reduce non-physical losses, which occur when energy prices are negative. While the Panel recognised that the proposed methodology was an improvement, it decided to hold off any changes given the low frequency of negative energy prices in the market.
Many of the issues tackled required a balance of somewhat divergent views and objectives. A case in point was the proposal to revise prices when generators failed to revise their offers following forced outages. Such failures to revise offers have serious commercial and system security implications. Although the revision of prices during such cases would reinstate the right price signals, they could be unfair to consumers whose consumption decisions have already been made.
I am proud to partake in the constructive debates when evaluating rule changes, and grateful to my fellow Panel members for their diligence, dedication and professionalism.
On the membership front, we welcomed Frances Chang this year as she replaced Low Cheong Kee to represent electricity consumers. On behalf of the Panel, I would
Dear Industry Members
MARKET GOVERNANCE: Letter from the Chair, Rules Change Panel
CONTENTS
10
Rule Changes Supported by the RCP
The following rule changes were discussed and approved, as part of the RCP’s continual efforts to guide the evolution of the wholesale electricity market.
Review of Constraint Violation Penalties
The market clearing engine (MCE) seeks to achieve the most economical scheduling outcome while simultaneously satisfying many constraints. Where the MCE is unable to meet all of these constraints, some violations are allowed to ensure that a feasible scheduling outcome is still possible. However, such violations impose an associated cost to the overall net benefit, known as the constraint violation penalty (CVP).
The CVP structure was reviewed following an observation during a contingency event when the MCE channelled available generation resources to supply reserve rather than energy, even in an energy deficit situation.
After examining the level of energy deficits incurred and the proportion of reserve requirement met under various solutions, a rule change was implemented to introduce stepwise CVP for reserve and regulation deficits, with increasing severity of violation incurring a higher CVP per unit of violation. This will divert resources to address energy needs and reduce energy deficits, while ensuring that a core amount of each ancillary service is procured to maintain system security.
Remodelling of Mixed Integer Program -Based Regulation Constraints
The energy output of a generator must be within its operational regulation range in order to provide regulation. However, using linear programming-based constraints to model a generator’s regulation range can prevent it from being scheduled for energy beyond its regulation range, even if it is not scheduled to provide regulation.
To resolve this, Mixed Integer Program (MIP)-based regulation constraints were introduced in 2007. As there were initial concerns about the time needed for the MCE to find a solution, these MIP-based regulation constraints were used only when deemed necessary, i.e., only when a generator was “trapped” at the boundaries of its regulation range during a normal linear programming run. However, it was observed that if MIP-based regulation constraints were only applied for “trapped” cases, the MCE might produce sub-optimal schedules under certain circumstances.
A rule change was thus made to apply MIP-based regulation constraints at all times, regardless of whether any regulation provider was “trapped”, and to reformulate the existing MIP-based regulation constraints by using fewer variables and constraints to define the same solution space.
Publication of Total Available Offer Capacity
EMC releases the total available energy offer capacity data for a given real-time dispatch run to MPs. A proposal sought to publish the same aggregated data for each product (energy, regulation and three classes of reserve) across both real-time and forecast schedules.
While publishing the data could bring benefits like greater transparency and credibility, it could also adversely impact the market by facilitating the potential exercise of market power. To determine the potential for capacity withholding, the pivotal supplier test, which is commonly used in other jurisdictions, was conducted on energy and regulation data in the Singapore Wholesale Electricity Market (SWEM). EMC concluded that pivotal suppliers do exist in selected periods, and the publication of total available offer capacity for energy and regulation may facilitate capacity withholding.
Nevertheless, the RCP supported the proposal to publish the total available offer capacity for all products across all schedules given that:• market power risk is likely to reduce with new capacity entering the market in 2013; and • publication of data will enhance efficiencies in the upcoming electricity futures market and demand response initiatives spearheaded by the EMA.
A final decision on this rule change proposal is expected in 2014.
Rule Changes Not Supported by the RCP
The RCP also discussed the following proposals but decided not to support them, either because the current arrangement was deemed to be more appropriate, the timing was not right for implementation, or the potential benefits did not justify the costs.
Adjustment of Recovery and Refund of Payments for Partial Provision of Ancillary Services
Previously, a rule change was implemented to ensure that non-providers of ancillary services that were identified before the preliminary settlement statement was posted would not be paid.
Given the PSO’s review of reserve provider groups and changes to the reserve effectiveness factor, a proposal suggested that non-payment of reserve should only apply when no reserve was provided at all (i.e., full failure), while payment for the provision of partial reserve should remain. According to the proposal, this would avert the issue of a “double” penalty, and ensure that reserve provision would be paid based on what was actually provided.
However, as partial provision cases pose system security risks, it was assessed and concluded that such cases should not be paid at all. Therefore the RCP decided not to support the proposal.
Market Governance: Market Evolution
CONTENTS
11
Proposed Provision for Price Revision when Generating Units Fail to Revise their Offers in Good Faith
Generators are obligated to revise their offers during forced outages, so that the offers considered by the MCE are the best reflection of their revised physical capabilities. However, during an episode on 13 December 2011, energy offers were not revised following a sequence of forced outages, and it resulted in the MCE scheduling generators that were physically unable to generate4. This not only compromised system security but also artificially suppressed the prices for energy, reserve and regulation, thereby failing to accurately reflect the physical scarcity faced by the market.
It was proposed that prices be revised in such cases, as such a move:• preserved the price signal integrity for long-term decision making;• was more financially equitable to the producers by ensuring that they received settlement payments equivalent to what they should have received in the first place; and• removed the financial incentive for MPs to keep prices suppressed if they were exposed to spot prices.
The main argument against price revision, however, was that it was unfair to charge consumers a higher ex-post price for quantities consumed based on ex-ante prices, as they would not have had a chance to respond during the affected period(s) by reducing their consumption. After much debate and deliberation, the price revision proposal was not supported, but the RCP requested that the frequency of occurrence of any future similar incidents be monitored.
Proposed Rejection of Offers with Zero Ramp Rates
As part of their energy offer submission, generation registered facilities (GRFs) can specify ramp-up and ramp-down rates that are lower than those in their standing capability data. This accords MPs the flexibility to de-rate their generators to better reflect their GRFs’ physical capabilities. However, when zero ramp-up/down rates are offered, either of the following two scenarios would result:• the GRF in question will be scheduled at its start generation level regardless of its actual energy offer price, and will not take part in the price discovery process, or • ramp rate violation will be incurred.
Given the undesirable market outcomes of erroneously submitted zero ramp rates, an offer validation rule was proposed to be introduced to prevent zero ramp rates from being offered, unless the maximum energy ramp-up and ramp-down rates in the standing data are both zero.
Nevertheless, some MPs have indicated that they preferred the flexibility of using zero ramp rates in their offers. The proposed offer validation rule of disallowing zero ramp rates is also inconsistent with the market design principle of self-commitment, whereby MPs are responsible for their own offers. As such, the proposal to disallow zero ramp rates in the energy offers was not supported.
Proposed New Constraint for Handling Non-Physical Losses
To serve a given level of forecast demand, the MCE will schedule generation such that the overall production cost is minimised, thus maximising the net benefit (which is the benefit of serving the forecast demand less the production cost).
To minimise production cost, generation output and transmission losses have to be correspondingly minimised. This is true when energy prices are positive. However, when energy prices are negative, the MCE increases the modelled losses as higher losses increase the amount of generation required, leading to a lower production cost and higher net benefit. To do so, the MCE uses linear segments that are poor approximations of actual losses. The differential between the good and poor approximations is termed Non Physical Losses (NPL), which is essentially a modelling error that compromises accuracy in transmission modelling and energy dispatch. Currently, the MCE adopts an iterative process to reduce the NPL to below an acceptable threshold prior to publishing the dispatch schedules.
It was proposed that an enhancement, the “loss ceiling method”, be implemented to accelerate the convergence of the iterative procedure by capping the total loss (physical loss and NPL) to an estimated value. Although it was found that a modification of the original proposal would achieve better performance and optimality, the proposal was not supported due to the low frequency of negative prices – and thus the actual number of real-time dispatch periods – that will be affected by NPL.
Market Governance: Market Evolution
4 This specific case was referred to the MSCP for investigation at that time and enforcement action was taken. Refer to the MSCP Annual Report 2012 for details.
CONTENTS

12
Dear Industry Members
Dispute Resolution and Compensation Panel
The Dispute Resolution and Compensation Panel (DRCP) was established under the Market Rules to provide dedicated dispute resolution services to the NEMS when required.
DMS Contacts
Pursuant to the Market Rules, each market entity has nominated at least one Dispute Management System (DMS) contact to be the first point of engagement in the event of a dispute.
The current DMS contacts are:
1. Air Products - Tang Siew Wai
2. Diamond Energy - Muhammed Iqbal
3. Energy Market Company - Abdul Aziz Yatim
4. ExxonMobil - Elaine Lee
5. ExxonMobil - Teddy Yong
6. GlaxoSmithKline - Chew Siou Ping
7. GlaxoSmithKline - Wong Joon Jee
8. Green Power Asia - Daniel Ma
9. Keppel Electric - Janice Bong
10. Keppel Electric - Joelyn Wong
11. Keppel Merlimau Cogen - Sean Chan
12. Keppel Merlimau Cogen - Tini Mulyawati
13. National Environment Agency - Siew Weng Soon
14. National Environment Agency - Teresa Tan
15. PacificLight Power - Calvin Tan
16. PacificLight Power - Linda Wen
17. Pfizer - Lee Chin Hoo
18. Pfizer - Tan Meng Tong
19. Power System Operator - Agnes Tan
20. Power System Operator - Yong Thi Yen
21. Sembcorp Cogen - Ramesh Tiwari
22. Sembcorp Power - H C Chew
23. Senoko Energy - Eu Pui Sun
24. Senoko Energy - Eveline How
25. Senoko Energy - Ho Poey Ee
26. Senoko Energy - Michelle Lim
27. Seraya Energy - Daniel Lee
28. Seraya Energy - Elaine Syn
29. Singapore Oxygen Air Liquide - Lim Yong Yi
30. SP Power Assets - Chan Hung Kwan
31. SP Power Assets - Ong Sheau Chin
32. SP Services - Budiman Roesli
33. SP Services - Lawrence Lee
34. Tuas Power Generation - Philip Tan
35. Tuas Power Generation - Priscilla Chua
36. Tuas Power Supply - Jazz Feng
37. Tuas Power Supply - Zhang Ai Jia
38. YTL PowerSeraya - Jonathan Chew
39. YTL PowerSeraya - Mark New
As part of my responsibilities, I help to provide training in dispute resolution and the Market Rules for the DMS contacts.
On 1 November 2013, I conducted a workshop for the newly-appointed DMS contacts to give them a better understanding of the market’s dispute resolution process. At this workshop, they also met with the other DMS contacts.
MARKET GOVERNANCE: Letter from the Dispute Resolution Counsellor
CONTENTS
13
Conclusion
I thank the DRCP members and DMS contacts for their contributions, and look forward to continuing to support the dispute resolution needs of all NEMS market entities in the coming year.
George LimSenior CounselDispute Resolution Counsellor
DRCP Members
The DRCP members are:
Mediation Panel
1. Chandra Mohan
2. Daniel John
3. Danny McFadden
4. Geoff Sharp
5. Associate Professor Joel Lee
6. Associate Professor Lim Lei Theng
7. Dr Peter Adler
8. Robert Yu
9. Shirli Kirschner
MARKET GOVERNANCE: Letter from the Dispute Resolution Counsellor
Arbitration Panel
1. Ang Cheng Hock, Senior Counsel
2. Chelva Rajah, Senior Counsel
3. Giam Chin Toon, Senior Counsel
4. Gregory Thorpe
5. Harry Elias, Senior Counsel
6. Kenneth Tan, Senior Counsel
7. Professor Lawrence Boo
8. N Sreenivasan, Senior Counsel
9. Naresh Mahtani
10. Philip Jeyaretnam, Senior Counsel
11. Phillip Harris
12. Raymond Chan
13. Dr Robert Gaitskell, Queen’s Counsel
14. Tan Chee Meng, Senior Counsel
15. Professor Tan Cheng Han, Senior Counsel
CONTENTS

14
MARKET PERFORMANCE

15
Annual Electricity Consumption 2009 – 2013
Electricity consumption increases across all quarters compared to 2012
Electricity purchased by market participants (MPs) is settled using electricity consumption data provided by the Market Support Services Licensee (MSSL).
Electricity consumption increased by 2.4 percent from 2012, climbing to 45.2 terawatt hours (TWh) in 2013. The strength of electricity consumption was observed throughout the year as there was positive year-on-year (YOY) growth in all four quarters. The largest YOY change was in the third quarter, when electricity consumption was 5.0 percent higher than it was in the third quarter of 2012.
Q1 Q2 Q3 Q4 YOY Growth
MARKET PERFORMANCE: Overview of the Year
50
40
30
20
10
0
TWh
2009 2010 2011 2012 2013
Q4
Q1
Q2
Q3
39.0
42.443.0
44.2 45.2
10
8
6
4
2
0
YOY Growth (%)
CONTENTS
16
MARKET PERFORMANCE: Overview of the Year
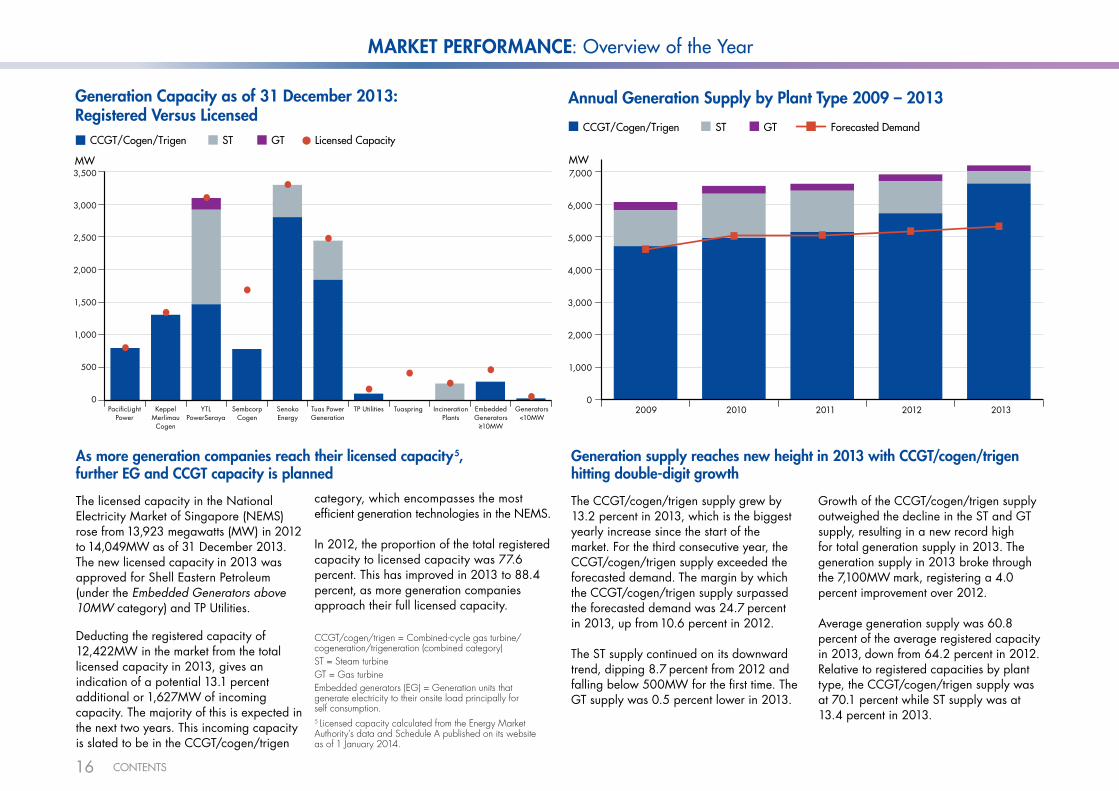
Generation Capacity as of 31 December 2013: Registered Versus Licensed
As more generation companies reach their licensed capacity5, further EG and CCGT capacity is planned
The licensed capacity in the National Electricity Market of Singapore (NEMS) rose from 13,923 megawatts (MW) in 2012 to 14,049MW as of 31 December 2013. The new licensed capacity in 2013 was approved for Shell Eastern Petroleum (under the Embedded Generators above 10MW category) and TP Utilities.
Deducting the registered capacity of 12,422MW in the market from the total licensed capacity in 2013, gives an indication of a potential 13.1 percent additional or 1,627MW of incoming capacity. The majority of this is expected in the next two years. This incoming capacity is slated to be in the CCGT/cogen/trigen
category, which encompasses the most efficient generation technologies in the NEMS.
In 2012, the proportion of the total registered capacity to licensed capacity was 77.6 percent. This has improved in 2013 to 88.4 percent, as more generation companies approach their full licensed capacity.
5 Licensed capacity calculated from the Energy Market Authority’s data and Schedule A published on its website as of 1 January 2014.
CCGT/cogen/trigen = Combined-cycle gas turbine/cogeneration/trigeneration (combined category)ST = Steam turbineGT = Gas turbineEmbedded generators (EG) = Generation units that generate electricity to their onsite load principally for self consumption.
CCGT/Cogen/Trigen ST GT Licensed Capacity
Annual Generation Supply by Plant Type 2009 – 2013
Generation supply reaches new height in 2013 with CCGT/cogen/trigen hitting double-digit growth
The CCGT/cogen/trigen supply grew by 13.2 percent in 2013, which is the biggest yearly increase since the start of the market. For the third consecutive year, the CCGT/cogen/trigen supply exceeded the forecasted demand. The margin by which the CCGT/cogen/trigen supply surpassed the forecasted demand was 24.7 percent in 2013, up from 10.6 percent in 2012.
The ST supply continued on its downward trend, dipping 8.7 percent from 2012 and falling below 500MW for the first time. The GT supply was 0.5 percent lower in 2013.
Growth of the CCGT/cogen/trigen supply outweighed the decline in the ST and GT supply, resulting in a new record high for total generation supply in 2013. The generation supply in 2013 broke through the 7,100MW mark, registering a 4.0 percent improvement over 2012.
Average generation supply was 60.8 percent of the average registered capacity in 2013, down from 64.2 percent in 2012. Relative to registered capacities by plant type, the CCGT/cogen/trigen supply was at 70.1 percent while ST supply was at 13.4 percent in 2013.
MW3,500
3,000
2,500
2,000
1,500
1,000
500
0PacificLight
PowerKeppel
Merlimau Cogen
YTL PowerSeraya
Sembcorp Cogen
Senoko Energy
Tuas Power Generation
TP Utilities Tuaspring Incineration Plants
Embedded Generators ≥10MW
Generators <10MW
MW7,000
6,000
5,000
4,000
3,000
2,000
1,000
02009 2010 2011 2012 2013
Forecasted DemandST GTCCGT/Cogen/Trigen
CONTENTS

17
MARKET PERFORMANCE: Overview of the Year
Annual USEP and Ancillary Prices 2009 – 2013
In 2013, the annual average Uniform Singapore Energy Price (USEP) was $173.24 per megawatt hour (MWh). This was a 22.1 percent decrease from 2012. The drop was driven by record high generation supply and was in line with lower high sulfur fuel oil (HSFO6) prices. This was the first year since 2009 that recorded a decline in the USEP from the preceding year, and the fall is the largest year-on-year (YOY) percentage drop since the market started. Nevertheless, the USEP was the third highest since 2003.
The USEP settled below the vesting contract prices7 throughout most of the year. The monthly USEP did, however, surpass the vesting contract prices in June and August due to dips in the generation supply.
The primary and secondary reserve prices increased from $0.46/MWh and $1.91/MWh in 2012, to $1.50/MWh and $3.10/MWh respectively in 2013. This was largely due to a shifting of reserve offers into higher price tranches. Recovering from a year in which tight supply conditions
triggered seven periods of contingency reserve shortfall, the contingency reserve market eased significantly in 2013. Aided by a boost in the contingency reserve supply, the contingency reserve price fell from $15.89/MWh in 2012 to an average of $9.12/MWh in 2013. This is the first time that the average annual contingency reserve price has dipped below $10/MWh since 2008.
The regulation price also eased from 2012, down 13.1 percent to $79.52/MWh.
This was attributed to an increase in the regulation supply and the higher proportion of cheaper offers8 in 2013, which overcame a 31.4 percent rise in the regulation requirement volume.
Greater supply lowers energy, contingency reserve and regulation prices
6 Based on HSFO 180 CST price which is used as a proxy for fuel price.7 Vesting contract prices refer to the Vesting Contract Hedge Price (VCHP) from 1 January to 30 June 2013, and the Balance Vesting Price (BVP) and LNG Vesting Price (LVP) from 1 July to 31 December 2013.8 Higher proportion of offers in the offer tranche below $30/MWh.
$/MWh
2009 2010 2011 2012 2013
MARKET PERFORMANCE: Overview of the Year
250
200
150
100
50
0USEP Primary Reserve Secondary Reserve Contingency Reserve Regulation
CONTENTS
18
Annual Value of Products Traded 2009 – 2013
MARKET PERFORMANCE: Overview of the Year
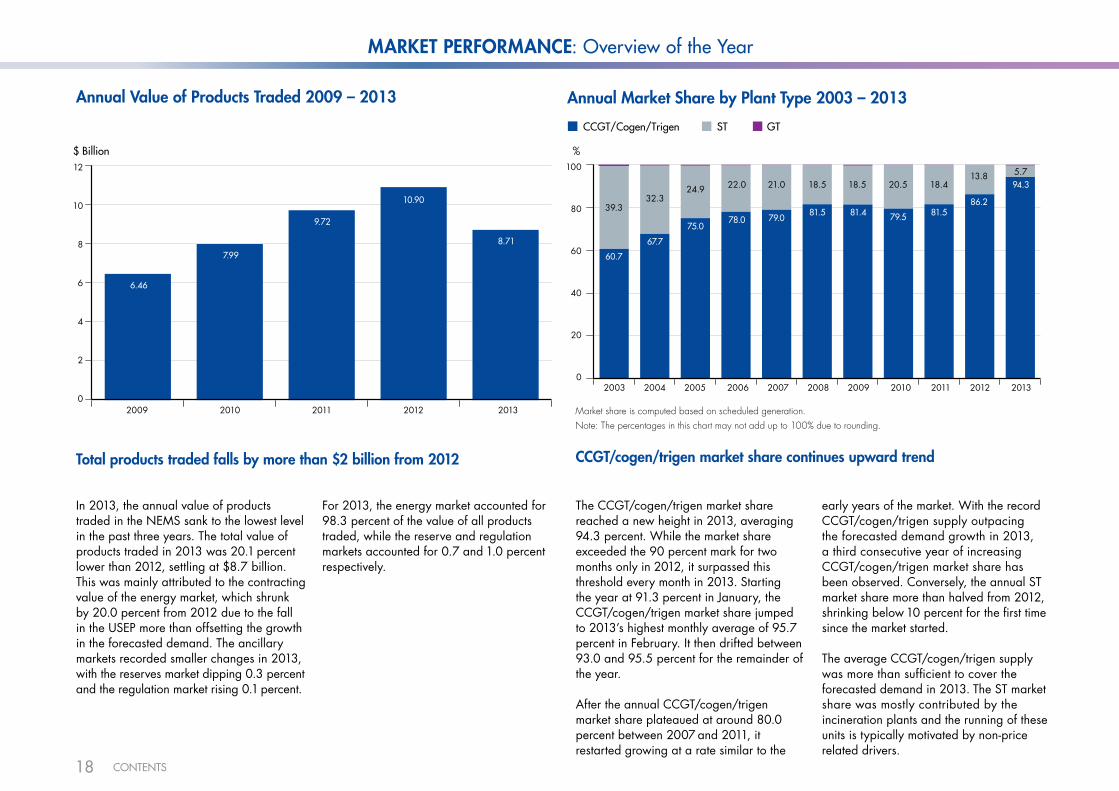
Total products traded falls by more than $2 billion from 2012
In 2013, the annual value of products traded in the NEMS sank to the lowest level in the past three years. The total value of products traded in 2013 was 20.1 percent lower than 2012, settling at $8.7 billion. This was mainly attributed to the contracting value of the energy market, which shrunk by 20.0 percent from 2012 due to the fall in the USEP more than offsetting the growth in the forecasted demand. The ancillary markets recorded smaller changes in 2013, with the reserves market dipping 0.3 percent and the regulation market rising 0.1 percent.
For 2013, the energy market accounted for 98.3 percent of the value of all products traded, while the reserve and regulation markets accounted for 0.7 and 1.0 percent respectively.
CCGT/cogen/trigen market share continues upward trend
The CCGT/cogen/trigen market share reached a new height in 2013, averaging 94.3 percent. While the market share exceeded the 90 percent mark for two months only in 2012, it surpassed this threshold every month in 2013. Starting the year at 91.3 percent in January, the CCGT/cogen/trigen market share jumped to 2013’s highest monthly average of 95.7 percent in February. It then drifted between 93.0 and 95.5 percent for the remainder of the year.
After the annual CCGT/cogen/trigen market share plateaued at around 80.0 percent between 2007 and 2011, it restarted growing at a rate similar to the
early years of the market. With the record CCGT/cogen/trigen supply outpacing the forecasted demand growth in 2013, a third consecutive year of increasing CCGT/cogen/trigen market share has been observed. Conversely, the annual ST market share more than halved from 2012, shrinking below 10 percent for the first time since the market started.
The average CCGT/cogen/trigen supply was more than sufficient to cover the forecasted demand in 2013. The ST market share was mostly contributed by the incineration plants and the running of these units is typically motivated by non-price related drivers.
Annual Market Share by Plant Type 2003 – 2013
ST GTCCGT/Cogen/Trigen
Market share is computed based on scheduled generation.Note: The percentages in this chart may not add up to 100% due to rounding.
$ Billion12
10
8
6
4
2
02009 2010 2011 2012 2013
6.46
8.71
10.90
9.72
7.99
100
80
60
40
20
02003 2004 2005 2006 2007 2008 2009 2010 2011 2012 2013
60.7
39.3
94.35.7
86.2
13.8
81.5
18.4
79.5
20.5
81.4
18.5
81.5
18.5
79.0
21.0
78.0
22.0
75.0
24.9
67.7
32.3
%
CONTENTS
19
MARKET PERFORMANCE: Overview of the Year MARKET PERFORMANCE: Energy Demand
Monthly Forecasted Demand 2009 – 2013
Forecasted demand registers positive YOY growth for most months
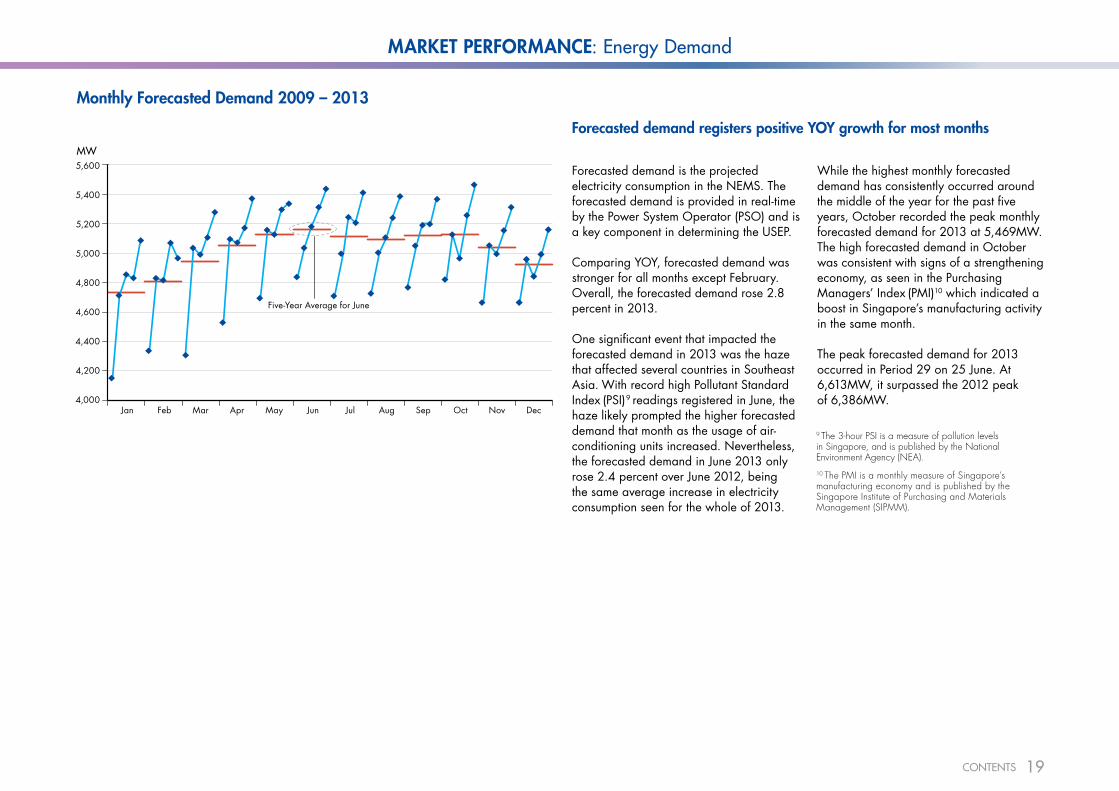
Forecasted demand is the projected electricity consumption in the NEMS. The forecasted demand is provided in real-time by the Power System Operator (PSO) and is a key component in determining the USEP.
Comparing YOY, forecasted demand was stronger for all months except February. Overall, the forecasted demand rose 2.8 percent in 2013.
One significant event that impacted the forecasted demand in 2013 was the haze that affected several countries in Southeast Asia. With record high Pollutant Standard Index (PSI)9 readings registered in June, the haze likely prompted the higher forecasted demand that month as the usage of air-conditioning units increased. Nevertheless, the forecasted demand in June 2013 only rose 2.4 percent over June 2012, being the same average increase in electricity consumption seen for the whole of 2013.
While the highest monthly forecasted demand has consistently occurred around the middle of the year for the past five years, October recorded the peak monthly forecasted demand for 2013 at 5,469MW. The high forecasted demand in October was consistent with signs of a strengthening economy, as seen in the Purchasing Managers’ Index (PMI)10 which indicated a boost in Singapore’s manufacturing activity in the same month.
The peak forecasted demand for 2013 occurred in Period 29 on 25 June. At 6,613MW, it surpassed the 2012 peak of 6,386MW.
9 The 3-hour PSI is a measure of pollution levels in Singapore, and is published by the National Environment Agency (NEA).10 The PMI is a monthly measure of Singapore’s manufacturing economy and is published by the Singapore Institute of Purchasing and Materials Management (SIPMM).
Five-Year Average for June
MW
Jan Feb Mar Apr May Jun Jul Aug Sep Oct Nov Dec
5,600
5,400
5,200
5,000
4,800
4,600
4,400
4,200
4,000
CONTENTS
20
MARKET PERFORMANCE: Energy Supply
Generation Facilities Registered and De-registered in 2013
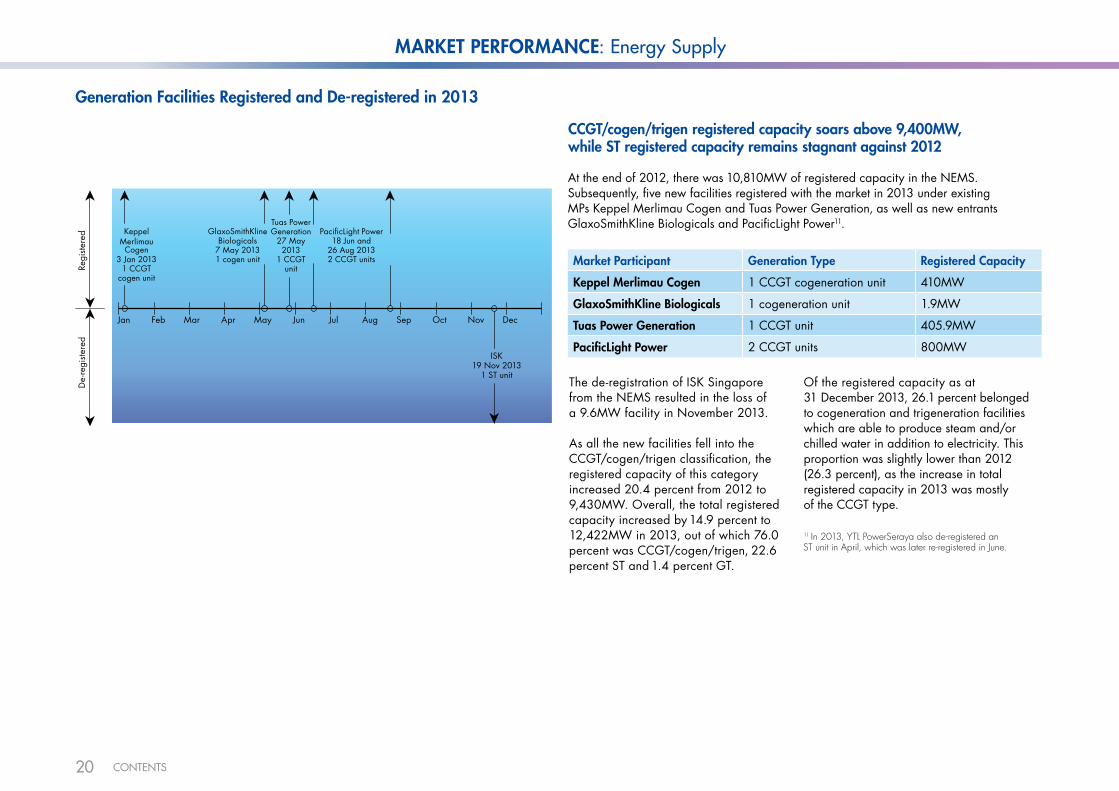
At the end of 2012, there was 10,810MW of registered capacity in the NEMS. Subsequently, five new facilities registered with the market in 2013 under existing MPs Keppel Merlimau Cogen and Tuas Power Generation, as well as new entrants GlaxoSmithKline Biologicals and PacificLight Power11.
CCGT/cogen/trigen registered capacity soars above 9,400MW, while ST registered capacity remains stagnant against 2012
Market Participant Generation Type Registered Capacity
Keppel Merlimau Cogen 1 CCGT cogeneration unit 410MW
GlaxoSmithKline Biologicals 1 cogeneration unit 1.9MW
Tuas Power Generation 1 CCGT unit 405.9MW
PacificLight Power 2 CCGT units 800MW
ISK19 Nov 2013
1 ST unit
Jan Feb Mar Apr May Jun Jul Aug Sep Oct Nov Dec
De-
regi
stere
d
Re
giste
red Keppel
Merlimau Cogen
3 Jan 20131 CCGT
cogen unit
GlaxoSmithKline Biologicals
7 May 20131 cogen unit
Tuas PowerGeneration
27 May 2013
1 CCGT unit
PacificLight Power 18 Jun and
26 Aug 20132 CCGT units
The de-registration of ISK Singapore from the NEMS resulted in the loss of a 9.6MW facility in November 2013.
As all the new facilities fell into the CCGT/cogen/trigen classification, the registered capacity of this category increased 20.4 percent from 2012 to 9,430MW. Overall, the total registered capacity increased by 14.9 percent to 12,422MW in 2013, out of which 76.0 percent was CCGT/cogen/trigen, 22.6 percent ST and 1.4 percent GT.
Of the registered capacity as at 31 December 2013, 26.1 percent belonged to cogeneration and trigeneration facilities which are able to produce steam and/or chilled water in addition to electricity. This proportion was slightly lower than 2012 (26.3 percent), as the increase in total registered capacity in 2013 was mostly of the CCGT type.
11 In 2013, YTL PowerSeraya also de-registered an ST unit in April, which was later re-registered in June.
CONTENTS

21
MARKET PERFORMANCE: Energy Supply MARKET PERFORMANCE: Energy Supply
Monthly Energy Offer Price Proportion and HSFO Price 2013
More energy offers priced below $200/MWh as fuel price12 eases
In 2013, the monthly percentage of energy offers priced below $200/MWh ranged from a low of 77.6 percent in April and May, to a high of 82.6 percent in November. For the year, this percentage increased from 74.1 percent in 2012 to 79.1 percent in 2013. This was due to a shifting of energy offers away from the higher-priced tranches, particularly the $200/MWh to $400/MWh tranche.
Higher fuel prices tend to depress cheaper energy supply (the proportion of offers below $200/MWh). The growth in the cheaper energy offers in 2013 is in line with the average HSFO price falling 7.2 percent from 2012. The average HSFO price was US$671.48 per metric tonne (MT) in 2012, and settled at US$623.46/MT in 2013.12 Based on HSFO 180 CST price which is used as a proxy for fuel price.
HSFO
<$100/MWh ≥$100/MWh and <$150/MWh ≥$150/MWh and <$200/MWh
≥$400/MWh≥$200/MWh and <$400/MWh
Monthly Generation Maintenance 2012 Versus 2013
Generation maintenance higher at the start and end of the year
Generation maintenance levels13 decreased 14.9 percent in 2013 to an average of 877MW. Compared to 2012, generation maintenance was lower in 2013 for all months between February and October, and in December.
The scheduling of more generation maintenance in the months of January, November and December seems to be consistent with the notion of planning maintenance when forecasted demand is projected to be lower.
The average ratio of generation maintenance to registered capacity dipped to 7.5 percent in 2013 from 9.6 percent in 2012. This was due to the fall in annual generation maintenance combined with the increase in registered capacity in 2013.
13 Generation maintenance levels are calculated based on the annual generation overhaul program (AGOP) provided by the PSO.
2012 2013 Average for 2012 Average for 2013
1,500
1,200
900
600
300
0Jan Feb Mar Apr May Jun Jul Aug Sep Oct Nov Dec
MWOffer price proportion (%) HSFO (US$/MT)
Jan Feb Mar Apr May Jun Jul Aug Sep Oct Nov Dec
100
80
60
40
20
0
750
700
650
600
550
CONTENTS
22
MARKET PERFORMANCE: Energy Supply
Monthly Utilisation Rate by Plant Type 2013
Utilisation rates for CCGT/cogen/trigen and ST plant types down for second consecutive year
Monthly ST Utilisation Rate 2013
Monthly CCGT/Cogen/Trigen Utilisation Rate 2013
Utilisation Rate (%)80
70
60
50
40
30
20
10
0Jan Feb Mar Apr May Jun Jul Aug Sep Oct Nov Dec
Average Annual ST Utilisation Rate 2013
Average Annual ST Utilisation Rate 2012Average Annual CCGT/Cogen/Trigen Utilisation Rate 2012
Average Annual CCGT/Cogen/Trigen Utilisation Rate 2013
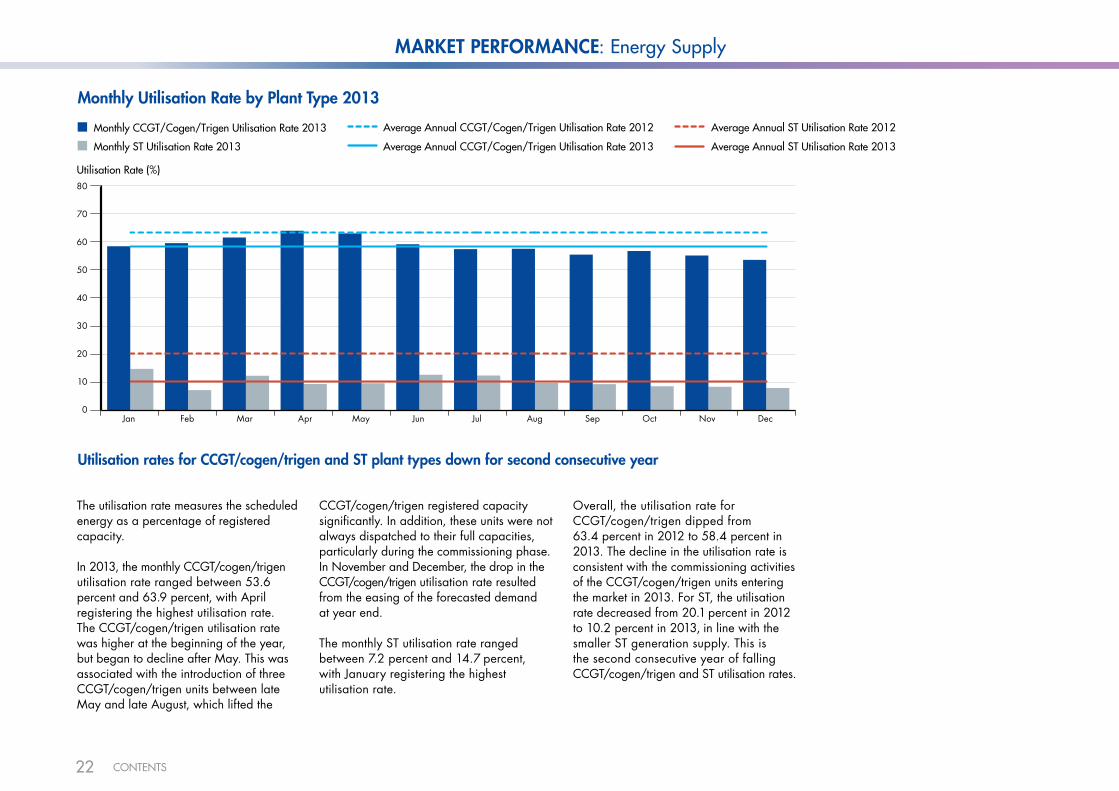
The utilisation rate measures the scheduled energy as a percentage of registered capacity.
In 2013, the monthly CCGT/cogen/trigen utilisation rate ranged between 53.6 percent and 63.9 percent, with April registering the highest utilisation rate. The CCGT/cogen/trigen utilisation rate was higher at the beginning of the year, but began to decline after May. This was associated with the introduction of three CCGT/cogen/trigen units between late May and late August, which lifted the
CCGT/cogen/trigen registered capacity significantly. In addition, these units were not always dispatched to their full capacities, particularly during the commissioning phase. In November and December, the drop in the CCGT/cogen/trigen utilisation rate resulted from the easing of the forecasted demand at year end.
The monthly ST utilisation rate ranged between 7.2 percent and 14.7 percent, with January registering the highest utilisation rate.
Overall, the utilisation rate for CCGT/cogen/trigen dipped from 63.4 percent in 2012 to 58.4 percent in 2013. The decline in the utilisation rate is consistent with the commissioning activities of the CCGT/cogen/trigen units entering the market in 2013. For ST, the utilisation rate decreased from 20.1 percent in 2012 to 10.2 percent in 2013, in line with the smaller ST generation supply. This is the second consecutive year of falling CCGT/cogen/trigen and ST utilisation rates.
CONTENTS

23
MARKET PERFORMANCE: Energy Supply
Monthly USEP, VCHP, BVP, LVP and Supply Cushion 2013
USEP mostly below $180/MWh due to stronger supply cushion14VCHP USEPSupply Cushion BVP LVP
MARKET PERFORMANCE: Energy Prices
$/MWh Supply Cushion (%)
Jan Feb Mar Apr May Jun Jul Aug Sep Oct Nov Dec
220
200
180
160
140
120
100
32
30
28
26
24
22
20
With the start of the Liquefied Natural Gas (LNG) Vesting Scheme in the third quarter of 2013, a certain percentage of the total allocated vesting quantity is pegged to LNG, i.e., Total Allocated Vesting Quantity = LNG Vesting Quantity (pegged to LNG) + Balance Vesting Quantity (pegged to piped natural gas). Correspondingly, the LNG Vesting Price (LVP) is the price for the LNG Vesting Quantity allocated, while the Balance Vesting Price (BVP) is the price for the Balance Vesting Quantity allocated.
In 2013, the monthly average USEP fluctuated between $147/MWh and $201/MWh. The difference of $54/MWh is the narrowest in the past six years, reflecting decreased volatility in the energy price compared to preceding years. In comparison, the average VCHP in the first two quarters of 2013 was $196.59/MWh, and the average BVP for the last two quarters of 2013 was $193.13/MWh.
Continuing the trend from the latter half of 2012, the monthly USEP mostly settled below the VCHP and BVP in 2013, except for June and August. The largest differences occurred in the fourth quarter, when the USEP dropped to the lowest levels for the year.
The supply cushion in 2013 started off strongly, reaching 27.5 percent in February. This was due to the forecasted demand being pulled down by the Chinese New Year holidays coupled with an increase in the generation supply. When the supply cushion dipped below 25 percent in June and August mostly due to lesser supply, the average monthly USEP rose to around $200/MWh.
In November, the supply cushion dropped to 2013’s lowest level of 24.3 percent due to the fall in generation supply exceeding the drop in forecasted demand. Despite the diminished supply cushion, the USEP also eased slightly to $158/MWh. This was because generation supply became relatively cheaper, with the percentage of energy offers priced below $200/MWh rising to the highest monthly level in 2013. The supply cushion then jumped to the highest level for the year in December at 29.0 percent, as a result of lower forecasted demand in conjunction with a 3.5 percent growth in total generation supply. With the expansion of the supply cushion, the December USEP further declined to the lowest monthly level for 2013, settling at $147/MWh. This is also the lowest that the monthly USEP has reached since August 2010.
14 Supply cushion measures the percentage of total generation supply that is available after matching off forecasted demand.
CONTENTS

24
Daily USEP, Forecasted Demand and Generation Supply 2013
$/MWh MW500
400
300
200
100Jan Feb Mar Apr May Jun Jul Aug Sep Oct Nov Dec
8,000
7,000
6,000
5,000
4,000
Forecasted DemandGeneration Supply USEP
MARKET PERFORMANCE: Energy Prices
AE
F
D
G
C
B
CONTENTS
25
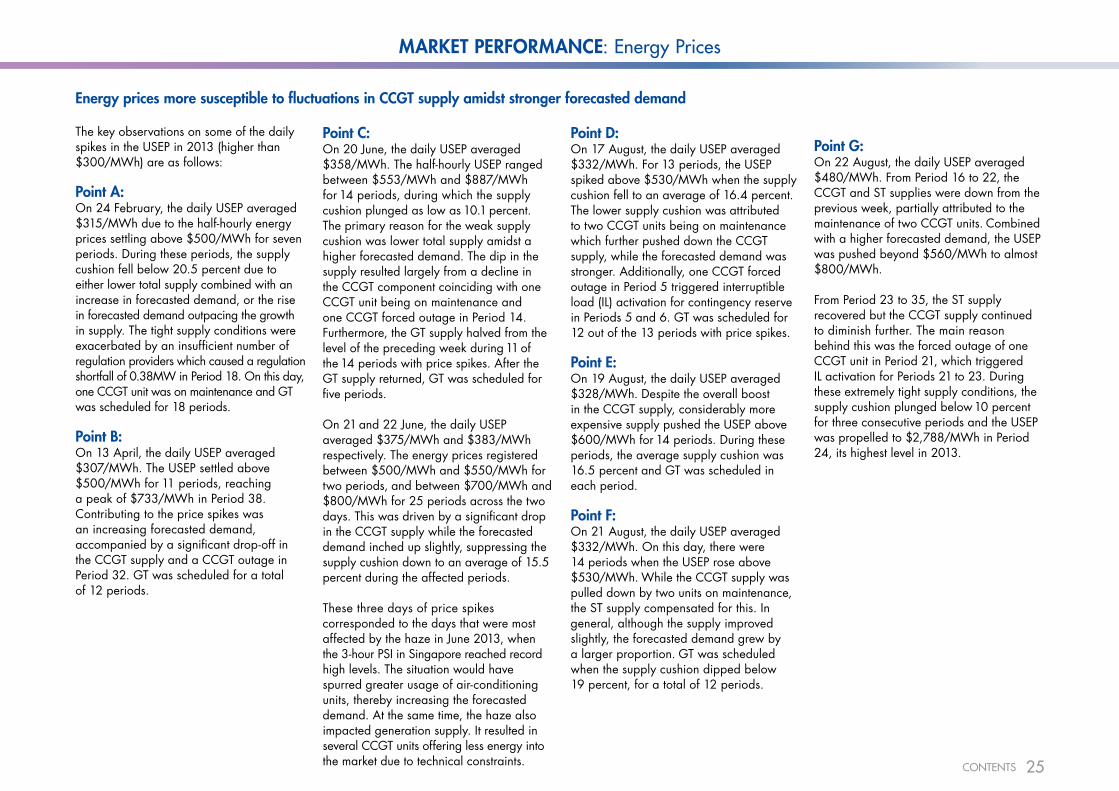
Energy prices more susceptible to fluctuations in CCGT supply amidst stronger forecasted demand
MARKET PERFORMANCE: Energy Prices
Point G:On 22 August, the daily USEP averaged $480/MWh. From Period 16 to 22, the CCGT and ST supplies were down from the previous week, partially attributed to the maintenance of two CCGT units. Combined with a higher forecasted demand, the USEP was pushed beyond $560/MWh to almost $800/MWh.
From Period 23 to 35, the ST supply recovered but the CCGT supply continued to diminish further. The main reason behind this was the forced outage of one CCGT unit in Period 21, which triggered IL activation for Periods 21 to 23. During these extremely tight supply conditions, the supply cushion plunged below 10 percent for three consecutive periods and the USEP was propelled to $2,788/MWh in Period 24, its highest level in 2013.
The key observations on some of the daily spikes in the USEP in 2013 (higher than $300/MWh) are as follows:
Point A: On 24 February, the daily USEP averaged $315/MWh due to the half-hourly energy prices settling above $500/MWh for seven periods. During these periods, the supply cushion fell below 20.5 percent due to either lower total supply combined with an increase in forecasted demand, or the rise in forecasted demand outpacing the growth in supply. The tight supply conditions were exacerbated by an insufficient number of regulation providers which caused a regulation shortfall of 0.38MW in Period 18. On this day, one CCGT unit was on maintenance and GT was scheduled for 18 periods.
Point B:On 13 April, the daily USEP averaged $307/MWh. The USEP settled above $500/MWh for 11 periods, reaching a peak of $733/MWh in Period 38. Contributing to the price spikes was an increasing forecasted demand, accompanied by a significant drop-off in the CCGT supply and a CCGT outage in Period 32. GT was scheduled for a total of 12 periods.
Point C:On 20 June, the daily USEP averaged $358/MWh. The half-hourly USEP ranged between $553/MWh and $887/MWh for 14 periods, during which the supply cushion plunged as low as 10.1 percent. The primary reason for the weak supply cushion was lower total supply amidst a higher forecasted demand. The dip in the supply resulted largely from a decline in the CCGT component coinciding with one CCGT unit being on maintenance and one CCGT forced outage in Period 14. Furthermore, the GT supply halved from the level of the preceding week during 11 of the 14 periods with price spikes. After the GT supply returned, GT was scheduled for five periods.
On 21 and 22 June, the daily USEP averaged $375/MWh and $383/MWh respectively. The energy prices registered between $500/MWh and $550/MWh for two periods, and between $700/MWh and $800/MWh for 25 periods across the two days. This was driven by a significant drop in the CCGT supply while the forecasted demand inched up slightly, suppressing the supply cushion down to an average of 15.5 percent during the affected periods.
These three days of price spikes corresponded to the days that were most affected by the haze in June 2013, when the 3-hour PSI in Singapore reached record high levels. The situation would have spurred greater usage of air-conditioning units, thereby increasing the forecasted demand. At the same time, the haze also impacted generation supply. It resulted in several CCGT units offering less energy into the market due to technical constraints.
Point D:On 17 August, the daily USEP averaged $332/MWh. For 13 periods, the USEP spiked above $530/MWh when the supply cushion fell to an average of 16.4 percent. The lower supply cushion was attributed to two CCGT units being on maintenance which further pushed down the CCGT supply, while the forecasted demand was stronger. Additionally, one CCGT forced outage in Period 5 triggered interruptible load (IL) activation for contingency reserve in Periods 5 and 6. GT was scheduled for 12 out of the 13 periods with price spikes.
Point E:On 19 August, the daily USEP averaged $328/MWh. Despite the overall boost in the CCGT supply, considerably more expensive supply pushed the USEP above $600/MWh for 14 periods. During these periods, the average supply cushion was 16.5 percent and GT was scheduled in each period.
Point F:On 21 August, the daily USEP averaged $332/MWh. On this day, there were 14 periods when the USEP rose above $530/MWh. While the CCGT supply was pulled down by two units on maintenance, the ST supply compensated for this. In general, although the supply improved slightly, the forecasted demand grew by a larger proportion. GT was scheduled when the supply cushion dipped below 19 percent, for a total of 12 periods.
CONTENTS
26
MARKET PERFORMANCE: Energy Prices
Application of Security Constraints in 2013
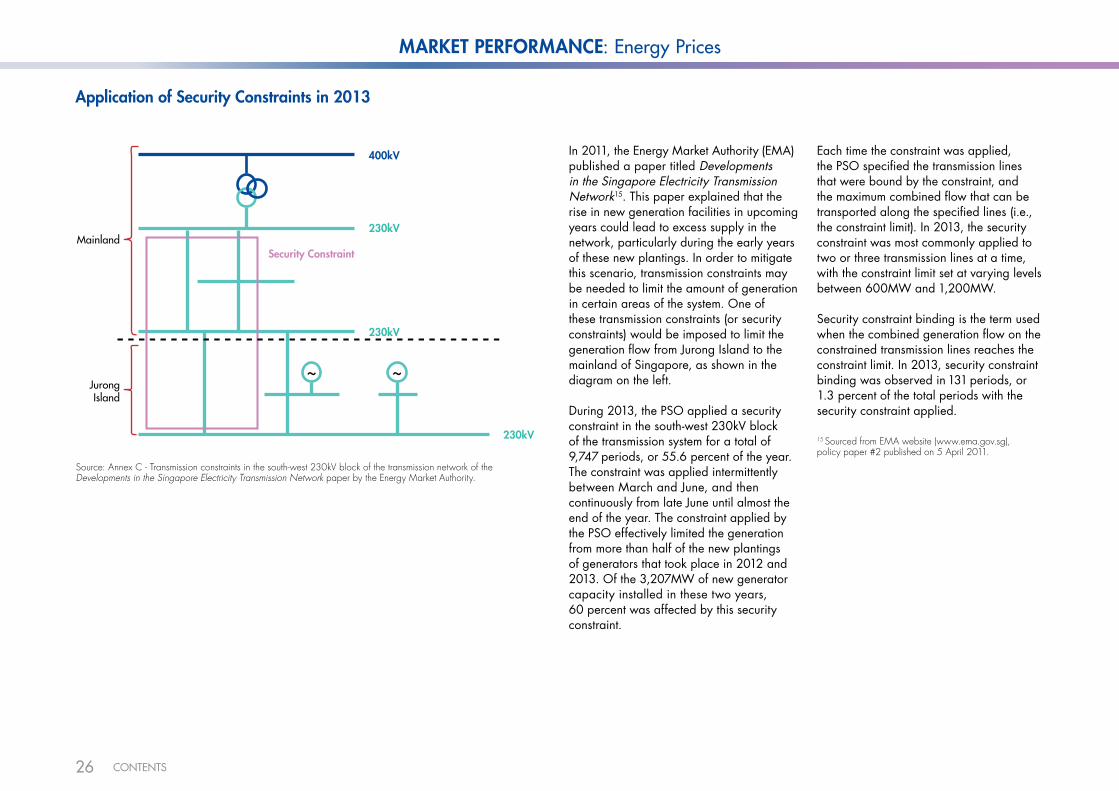
In 2011, the Energy Market Authority (EMA) published a paper titled Developments in the Singapore Electricity Transmission Network15. This paper explained that the rise in new generation facilities in upcoming years could lead to excess supply in the network, particularly during the early years of these new plantings. In order to mitigate this scenario, transmission constraints may be needed to limit the amount of generation in certain areas of the system. One of these transmission constraints (or security constraints) would be imposed to limit the generation flow from Jurong Island to the mainland of Singapore, as shown in the diagram on the left.
During 2013, the PSO applied a security constraint in the south-west 230kV block of the transmission system for a total of 9,747 periods, or 55.6 percent of the year. The constraint was applied intermittently between March and June, and then continuously from late June until almost the end of the year. The constraint applied by the PSO effectively limited the generation from more than half of the new plantings of generators that took place in 2012 and 2013. Of the 3,207MW of new generator capacity installed in these two years, 60 percent was affected by this security constraint.
230kV
400kV
230kV
230kV
Security ConstraintMainland
Jurong Island
Each time the constraint was applied, the PSO specified the transmission lines that were bound by the constraint, and the maximum combined flow that can be transported along the specified lines (i.e., the constraint limit). In 2013, the security constraint was most commonly applied to two or three transmission lines at a time, with the constraint limit set at varying levels between 600MW and 1,200MW.
Security constraint binding is the term used when the combined generation flow on the constrained transmission lines reaches the constraint limit. In 2013, security constraint binding was observed in 131 periods, or 1.3 percent of the total periods with the security constraint applied.
Source: Annex C - Transmission constraints in the south-west 230kV block of the transmission network of the Developments in the Singapore Electricity Transmission Network paper by the Energy Market Authority.
15 Sourced from EMA website (www.ema.gov.sg), policy paper #2 published on 5 April 2011.
CONTENTS
27
MARKET PERFORMANCE: Energy Prices
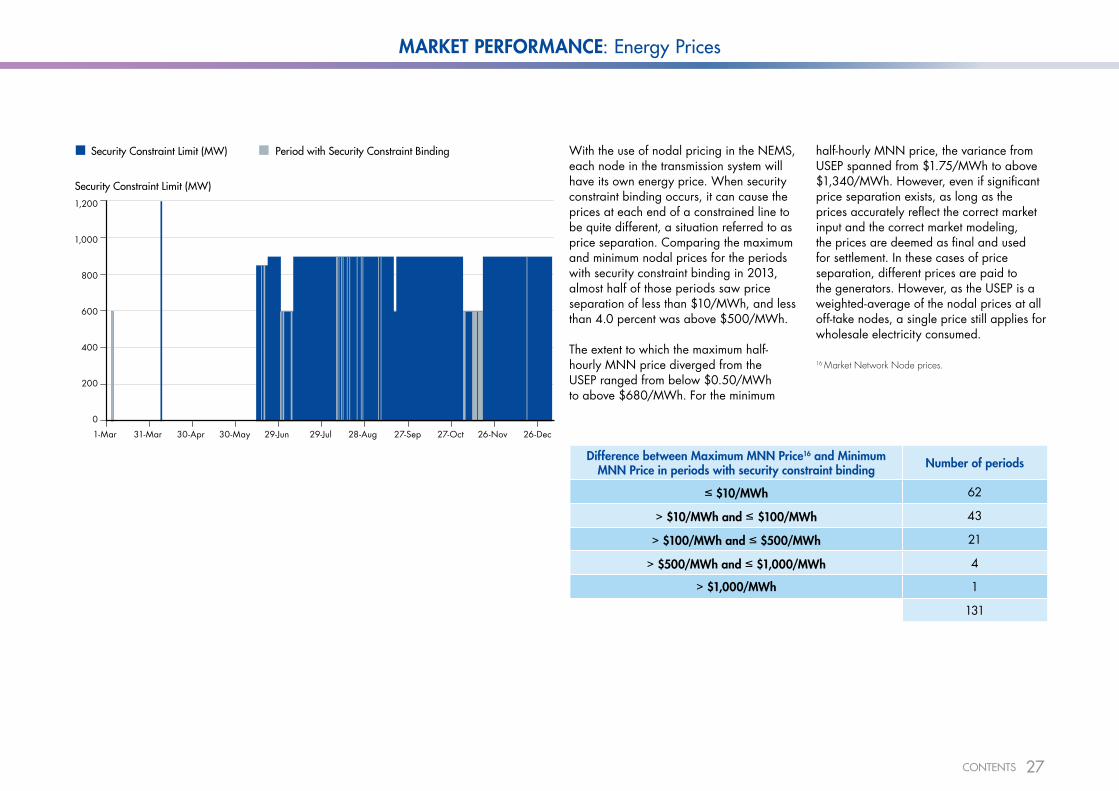
With the use of nodal pricing in the NEMS, each node in the transmission system will have its own energy price. When security constraint binding occurs, it can cause the prices at each end of a constrained line to be quite different, a situation referred to as price separation. Comparing the maximum and minimum nodal prices for the periods with security constraint binding in 2013, almost half of those periods saw price separation of less than $10/MWh, and less than 4.0 percent was above $500/MWh.
The extent to which the maximum half-hourly MNN price diverged from the USEP ranged from below $0.50/MWh to above $680/MWh. For the minimum
Period with Security Constraint BindingSecurity Constraint Limit (MW)
Difference between Maximum MNN Price16 and Minimum MNN Price in periods with security constraint binding Number of periods
≤ $10/MWh 62
> $10/MWh and ≤ $100/MWh 43
> $100/MWh and ≤ $500/MWh 21
> $500/MWh and ≤ $1,000/MWh 4
> $1,000/MWh 1
131
half-hourly MNN price, the variance from USEP spanned from $1.75/MWh to above $1,340/MWh. However, even if significant price separation exists, as long as the prices accurately reflect the correct market input and the correct market modeling, the prices are deemed as final and used for settlement. In these cases of price separation, different prices are paid to the generators. However, as the USEP is a weighted-average of the nodal prices at all off-take nodes, a single price still applies for wholesale electricity consumed.
Security Constraint Limit (MW)1,200
1,000
800
600
400
200
0
1-Mar 31-Mar 30-Apr 30-May 29-Jun 29-Jul 28-Aug 27-Sep 27-Oct 26-Nov 26-Dec
16 Market Network Node prices.
CONTENTS
28
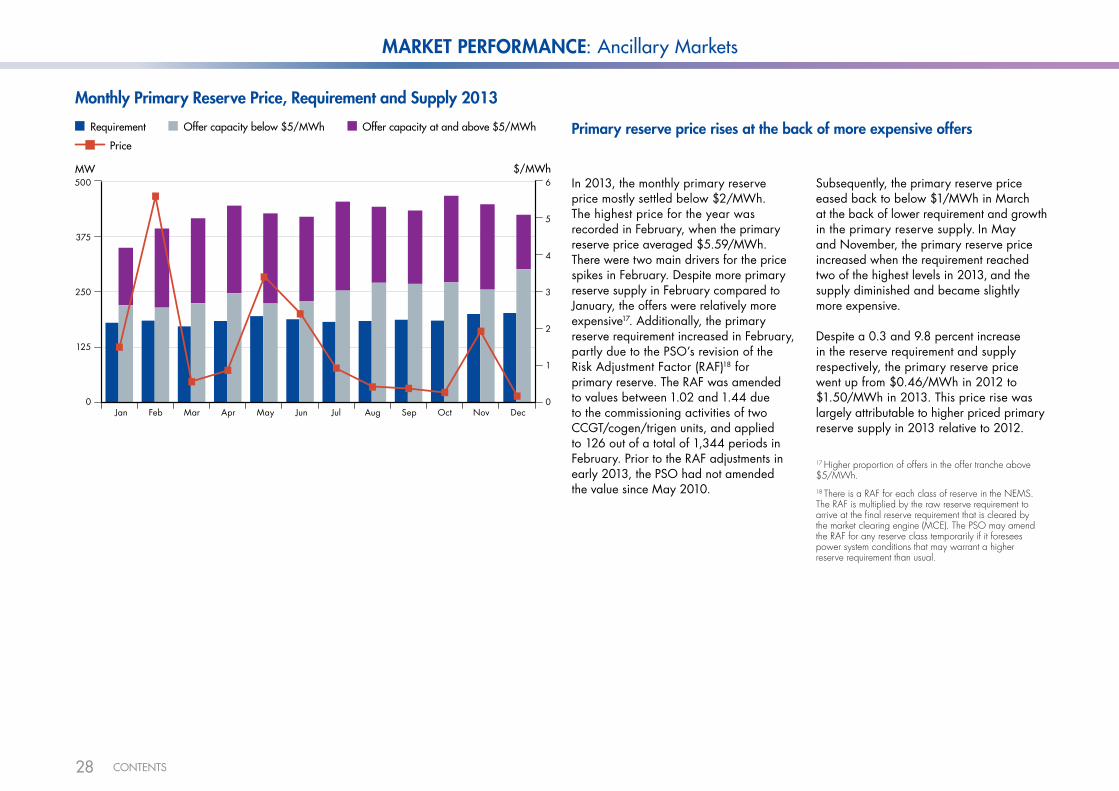
Monthly Primary Reserve Price, Requirement and Supply 2013
Primary reserve price rises at the back of more expensive offersOffer capacity at and above $5/MWhOffer capacity below $5/MWhRequirement
Price
MARKET PERFORMANCE: Ancillary Markets
MW $/MWh
Jan Feb Mar Apr May Jun Jul Aug Sep Oct Nov Dec
500
375
250
125
0
6
5
4
3
2
1
0
In 2013, the monthly primary reserve price mostly settled below $2/MWh. The highest price for the year was recorded in February, when the primary reserve price averaged $5.59/MWh. There were two main drivers for the price spikes in February. Despite more primary reserve supply in February compared to January, the offers were relatively more expensive17. Additionally, the primary reserve requirement increased in February, partly due to the PSO’s revision of the Risk Adjustment Factor (RAF)18 for primary reserve. The RAF was amended to values between 1.02 and 1.44 due to the commissioning activities of two CCGT/cogen/trigen units, and applied to 126 out of a total of 1,344 periods in February. Prior to the RAF adjustments in early 2013, the PSO had not amended the value since May 2010.
Subsequently, the primary reserve price eased back to below $1/MWh in March at the back of lower requirement and growth in the primary reserve supply. In May and November, the primary reserve price increased when the requirement reached two of the highest levels in 2013, and the supply diminished and became slightly more expensive.
Despite a 0.3 and 9.8 percent increase in the reserve requirement and supply respectively, the primary reserve price went up from $0.46/MWh in 2012 to $1.50/MWh in 2013. This price rise was largely attributable to higher priced primary reserve supply in 2013 relative to 2012.
17 Higher proportion of offers in the offer tranche above $5/MWh.18 There is a RAF for each class of reserve in the NEMS. The RAF is multiplied by the raw reserve requirement to arrive at the final reserve requirement that is cleared by the market clearing engine (MCE). The PSO may amend the RAF for any reserve class temporarily if it foresees power system conditions that may warrant a higher reserve requirement than usual.
CONTENTS

29
Monthly Secondary Reserve Price, Requirement and Supply 2013
Higher prices in first half of the year push secondary reserve price to $3.10/MWh
The monthly secondary reserve price generally followed a downward trend during 2013. The price settled below $3/MWh for most months throughout the year, although there were several months in the first half of the year which registered higher prices.
Although the secondary reserve requirement declined in January, the reserve supply retracted by a greater magnitude. This, together with a shifting of the reserve offers into higher priced tranches, drove the secondary reserve price to its peak monthly level in 2013. The prices from February to April eased as the secondary reserve supply grew stronger with each subsequent month. When this trend reversed in May and June, the prices rose to $5.83/MWh and $4.86/MWh respectively. In November, the secondary reserve price moved up due to the increased requirement amidst a lower, more expensive reserve supply19.
19 Higher proportion of offers in the offer tranche above $5/MWh.
Overall, the growth of the secondary reserve supply outpaced the increase in the requirement for 2013, as the supply and requirement grew 13.9 percent and 2.6 percent respectively compared to 2012. Regardless, the secondary reserve price for 2013 increased 62.0 percent from 2012, to an average of $3.10/MWh. Akin to the primary reserve market, the rise in the annual reserve price was driven mainly by the higher pricing of the secondary reserve offers in 2013.
Offer capacity at and above $5/MWhOffer capacity below $5/MWhRequirement
Price
MARKET PERFORMANCE: Ancillary Markets
MW $/MWh625
500
375
250
125
0
11
10
9
8
7
6
5
4
3
2
1
0Jan Feb Mar Apr May Jun Jul Aug Sep Oct Nov Dec
CONTENTS
30
Monthly Contingency Reserve Price, Requirement and Supply 2013
Offer capacity at and above $5/MWhOffer capacity below $5/MWhRequirement
Price
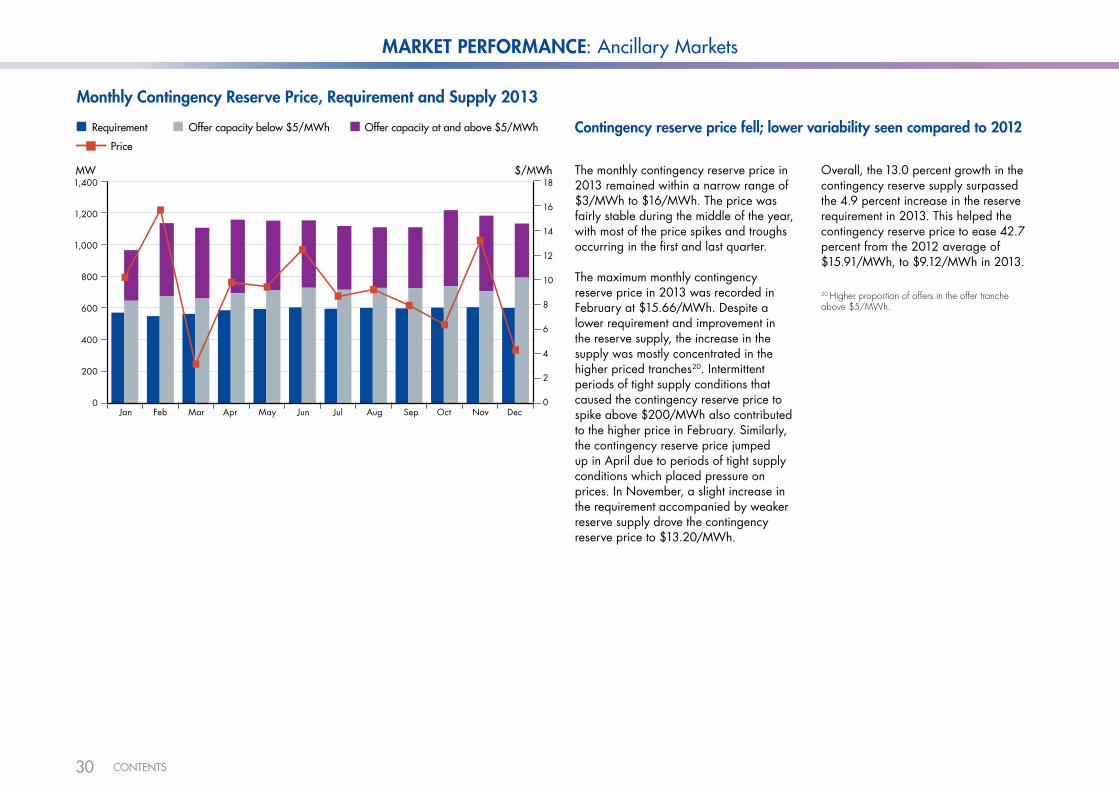
Contingency reserve price fell; lower variability seen compared to 2012
The monthly contingency reserve price in 2013 remained within a narrow range of $3/MWh to $16/MWh. The price was fairly stable during the middle of the year, with most of the price spikes and troughs occurring in the first and last quarter.
The maximum monthly contingency reserve price in 2013 was recorded in February at $15.66/MWh. Despite a lower requirement and improvement in the reserve supply, the increase in the supply was mostly concentrated in the higher priced tranches20. Intermittent periods of tight supply conditions that caused the contingency reserve price to spike above $200/MWh also contributed to the higher price in February. Similarly, the contingency reserve price jumped up in April due to periods of tight supply conditions which placed pressure on prices. In November, a slight increase in the requirement accompanied by weaker reserve supply drove the contingency reserve price to $13.20/MWh.
Overall, the 13.0 percent growth in the contingency reserve supply surpassed the 4.9 percent increase in the reserve requirement in 2013. This helped the contingency reserve price to ease 42.7 percent from the 2012 average of $15.91/MWh, to $9.12/MWh in 2013.
20 Higher proportion of offers in the offer tranche above $5/MWh.
MARKET PERFORMANCE: Ancillary Markets
MW $/MWh
Jan Feb Mar Apr May Jun Jul Aug Sep Oct Nov Dec
1,400
1,200
1,000
800
600
400
200
0
18
16
14
12
10
8
6
4
2
0
CONTENTS

31
MARKET PERFORMANCE: Ancillary Markets
Annual Interruptible Load (IL) Activations for Contingency Reserve Market 2003 – 2013
Total number of periods of IL activation triples from 2012
As of 31 December 2013, the total registered capacity for IL remained the same as 2012 at 21MW for each class of reserve.
Continuing the downward trend seen in 2012, the percentage of registered capacity of IL against the total fell for all three classes of reserves. The percentage of registered capacity by IL for reserves in 2012 was 2.3 percent for primary reserve, 1.9 percent for secondary reserve, and 0.7 percent for contingency reserve. By end of 2013, this had dipped to 2.1 percent for primary reserve, 1.7 percent for secondary reserve and 0.6 percent for contingency reserve.
The number of IL activations for contingency reserve rose to 20 in 2013, from 11 in 2012. However, the total number of periods when IL was activated for contingency reserve almost tripled from the preceding year to 41 in 2013. This is the largest number in a year since the market started, and represents 33.3 percent of all occurrences of IL activation for contingency reserve. Typically, each activation lasted two or three periods. There was no IL activation for primary and secondary reserves in 2013.
Overall, payment to IL totalled $0.41 million in 2013. This was a 49.3 percent drop from the $0.80 million payment in 2012, attributed mainly to the lower contingency reserve price in 2013.
Instances of IL activation No. of periods of IL activation
Reserve Provider Group Effectiveness for Primary and Secondary Reserve Classes (Aggregate) 2009 – 2013
Statistics exclude IL providers.
Reserve effectiveness falls in 2013
Reserve providers in the NEMS are classified into five groups, with Group A reflecting reserve providers with the highest level of responsiveness and Group E reflecting those with the lowest level of responsiveness. A higher level of responsiveness attracts a higher proportion of reserve price.
The percentage of reserve providers in Group A reached a record high in 2012 at 60.1 percent, but dropped to 54.2 percent in 2013. Reflecting the overall poorer performance of the reserve providers relative to 2012, the reserve providers from Group A shifted mostly to Groups B and C, pushing the percentage of reserve providers in Group B to one of the highest levels since the market started. No reserve providers were categorised in Group E during 2013.
Note: The percentages in this chart may not add up to 100% due to rounding.
A B C D E
Count
2003 2004 2005 2006 2007 2008 2009 2010 2011 2012 2013
45
40
35
30
25
20
15
10
5
0
100
80
60
40
20
02009 2010 2011 2012 2013
6.00.91.8
5.6
13.8
6.76.37.311.2
22.4
12.49.111.9
19.4
46.654.2
60.1
51.547.3
23.627.5 26.6
16.611.2
%
CONTENTS
32
Annual Reserve Payment 2009 – 2013
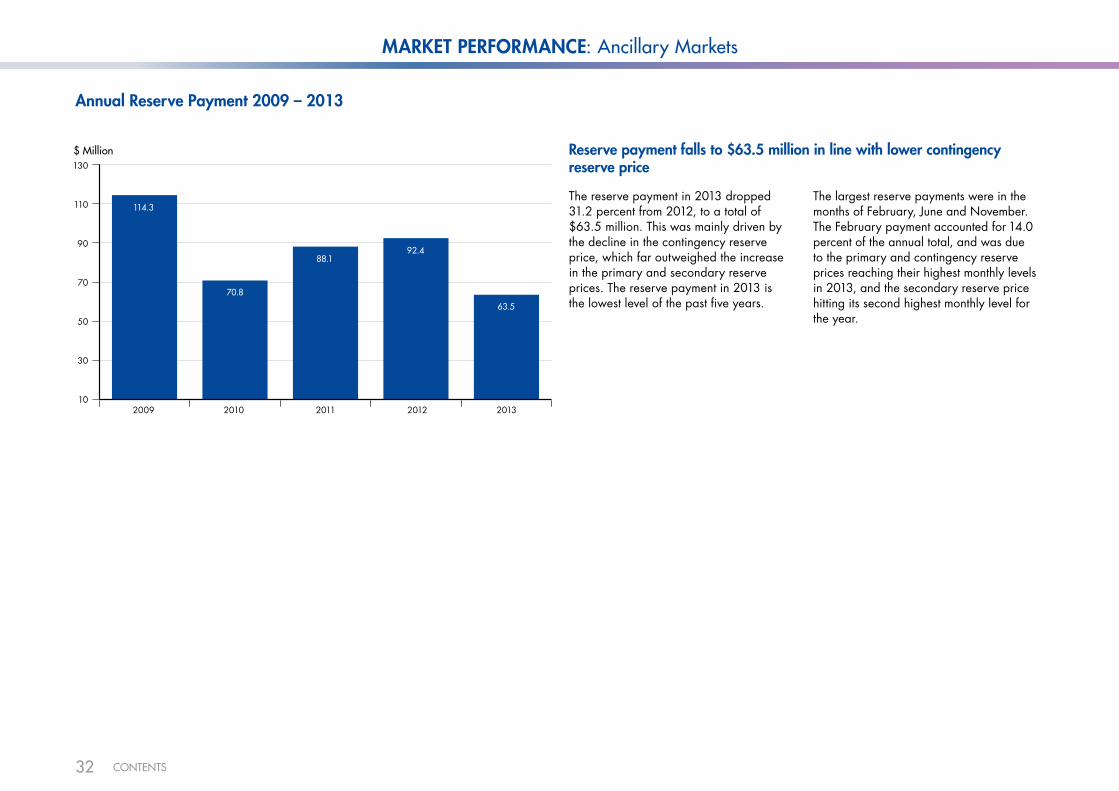
Reserve payment falls to $63.5 million in line with lower contingency reserve price
The reserve payment in 2013 dropped 31.2 percent from 2012, to a total of $63.5 million. This was mainly driven by the decline in the contingency reserve price, which far outweighed the increase in the primary and secondary reserve prices. The reserve payment in 2013 is the lowest level of the past five years.
The largest reserve payments were in the months of February, June and November. The February payment accounted for 14.0 percent of the annual total, and was due to the primary and contingency reserve prices reaching their highest monthly levels in 2013, and the secondary reserve price hitting its second highest monthly level for the year.
MARKET PERFORMANCE: Ancillary Markets
$ Million130
110
90
70
50
30
102009 2010 2011 2012 2013
114.3
63.5
92.488.1
70.8
CONTENTS
33
Annual Forced Outages by Generation Companies 2003 – 2013
MARKET PERFORMANCE: Ancillary Markets
Average Failure Probability by Year 2009 – 2013
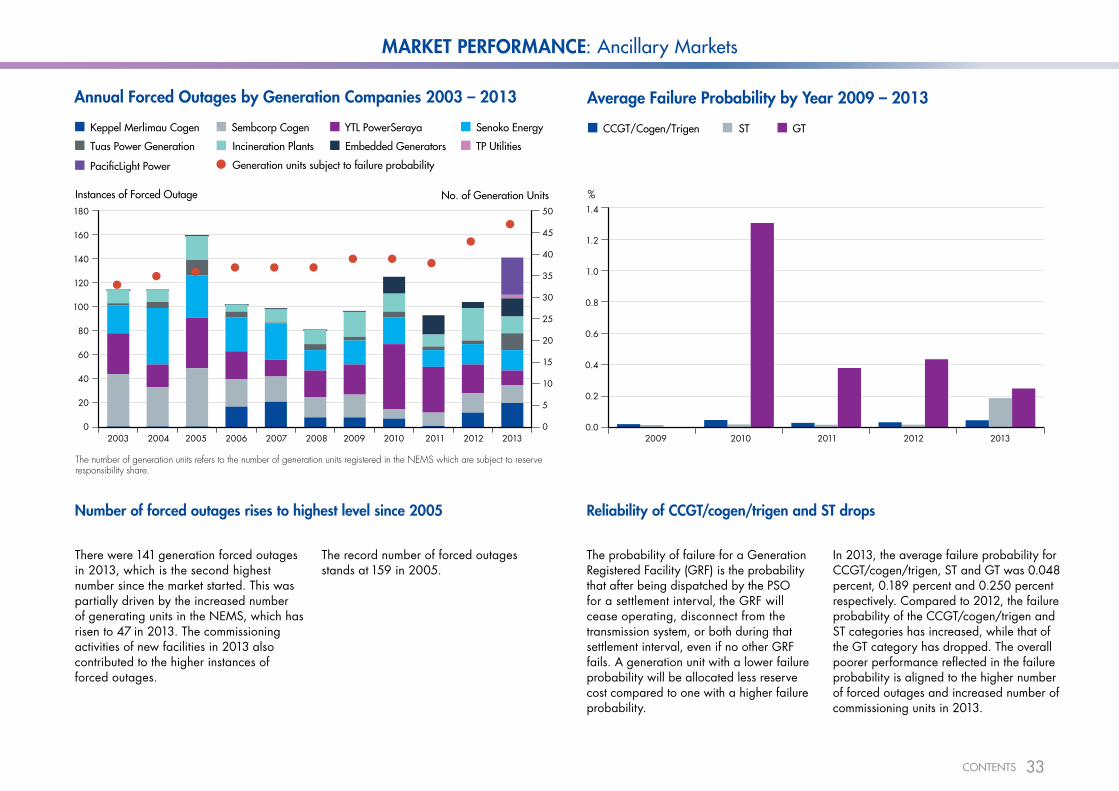
Reliability of CCGT/cogen/trigen and ST drops
The probability of failure for a Generation Registered Facility (GRF) is the probability that after being dispatched by the PSO for a settlement interval, the GRF will cease operating, disconnect from the transmission system, or both during that settlement interval, even if no other GRF fails. A generation unit with a lower failure probability will be allocated less reserve cost compared to one with a higher failure probability.
In 2013, the average failure probability for CCGT/cogen/trigen, ST and GT was 0.048 percent, 0.189 percent and 0.250 percent respectively. Compared to 2012, the failure probability of the CCGT/cogen/trigen and ST categories has increased, while that of the GT category has dropped. The overall poorer performance reflected in the failure probability is aligned to the higher number of forced outages and increased number of commissioning units in 2013.
Number of forced outages rises to highest level since 2005
There were 141 generation forced outages in 2013, which is the second highest number since the market started. This was partially driven by the increased number of generating units in the NEMS, which has risen to 47 in 2013. The commissioning activities of new facilities in 2013 also contributed to the higher instances of forced outages.
The number of generation units refers to the number of generation units registered in the NEMS which are subject to reserve responsibility share.
Generation units subject to failure probability
Keppel Merlimau Cogen
Tuas Power Generation
Sembcorp Cogen
Incineration Plants
YTL PowerSeraya
Embedded Generators
Senoko Energy
TP Utilities
PacificLight Power
%
2009 2010 2011 2012 2013
1.4
1.2
1.0
0.8
0.6
0.4
0.2
0.0
ST GTCCGT/Cogen/Trigen
Instances of Forced Outage No. of Generation Units180
160
140
120
100
80
60
40
20
02003 2004 2005 2006 2007 2008 2009 2010 2011 2012 2013
50
45
40
35
30
25
20
15
10
5
0
The record number of forced outages stands at 159 in 2005.
CONTENTS
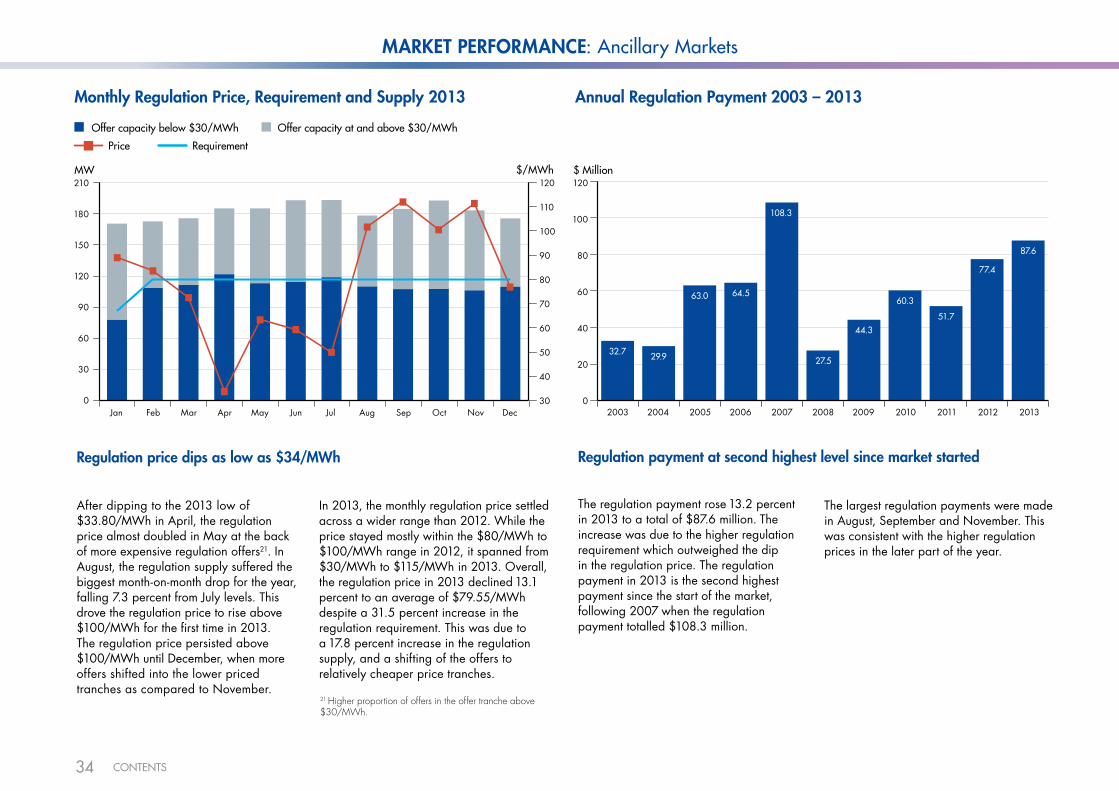
34
Monthly Regulation Price, Requirement and Supply 2013
Regulation price dips as low as $34/MWh
Offer capacity at and above $30/MWhOffer capacity below $30/MWh
Price Requirement
MARKET PERFORMANCE: Ancillary Markets
Annual Regulation Payment 2003 – 2013
Regulation payment at second highest level since market started
The regulation payment rose 13.2 percent in 2013 to a total of $87.6 million. The increase was due to the higher regulation requirement which outweighed the dip in the regulation price. The regulation payment in 2013 is the second highest payment since the start of the market, following 2007 when the regulation payment totalled $108.3 million.
The largest regulation payments were made in August, September and November. This was consistent with the higher regulation prices in the later part of the year.
$ Million120
100
80
60
40
20
02003 2004 2005 2006 2007 2008 2009 2010 2011 2012 2013
32.7 29.9
63.0 64.5
108.3
27.5
44.3
60.3
51.7
77.4
87.6
MW $/MWh210
180
150
120
90
60
30
0Jan Feb Mar Apr May Jun Jul Aug Sep Oct Nov Dec
120
110
100
90
80
70
60
50
40
30
After dipping to the 2013 low of $33.80/MWh in April, the regulation price almost doubled in May at the back of more expensive regulation offers21. In August, the regulation supply suffered the biggest month-on-month drop for the year, falling 7.3 percent from July levels. This drove the regulation price to rise above $100/MWh for the first time in 2013. The regulation price persisted above $100/MWh until December, when more offers shifted into the lower priced tranches as compared to November.
In 2013, the monthly regulation price settled across a wider range than 2012. While the price stayed mostly within the $80/MWh to $100/MWh range in 2012, it spanned from $30/MWh to $115/MWh in 2013. Overall, the regulation price in 2013 declined 13.1 percent to an average of $79.55/MWh despite a 31.5 percent increase in the regulation requirement. This was due to a 17.8 percent increase in the regulation supply, and a shifting of the offers to relatively cheaper price tranches.
21 Higher proportion of offers in the offer tranche above $30/MWh.
CONTENTS

35
MARKET PERFORMANCE: Competition in the Generation and Retail Markets
Annual Market Share by Generation Company 2009 – 2013 (Based on Scheduled Generation)
Increasing competition from smaller players puts pressure on the market share of larger generation companies
Two of the three leading generation companies had significant reductions in their market share in 2013.
Tuas Power Generation’s market share fell by the largest extent, dropping from 25.2 percent in 2012 to 19.5 percent in 2013.
The market share of YTL PowerSeraya also fell. This is the fourth consecutive year of declining market share for the generation company, whose share dropped to 23.2 percent in 2013.
Note: The percentages in this chart may not add up to 100% due to rounding.
Senoko Energy’s market share was unchanged from 2012, and it continues to hold the largest market share at 27.0 percent.
With a net fall amongst the three largest generation companies, the market share was picked up mainly by the embedded generators (EGs) and Keppel Merlimau Cogen. Most significantly, the market share of the EGs tripled from 1.2 percent in 2012 to 3.9 percent in 2013. Keppel Merlimau
2009 2010 2011 2012 2013
Cogen’s market share rose to its highest level since the company joined the market in 2006, jumping from 8.8 percent in 2012 to 13.3 percent in 2013. The boost in the market share of EGs and Keppel Merlimau Cogen is in line with the registration of new facilities since late 2012.
%
Embedded Generators
Incineration Plants Keppel Merlimau Cogen
YTL PowerSeraya Sembcorp Cogen Senoko Energy TP Utilities Tuas Power Generation
PacificLight Power
30
25
20
15
10
5
0
3.92.5
13.3
27.0
1.1
19.5
23.2
8.5
1.1
CONTENTS
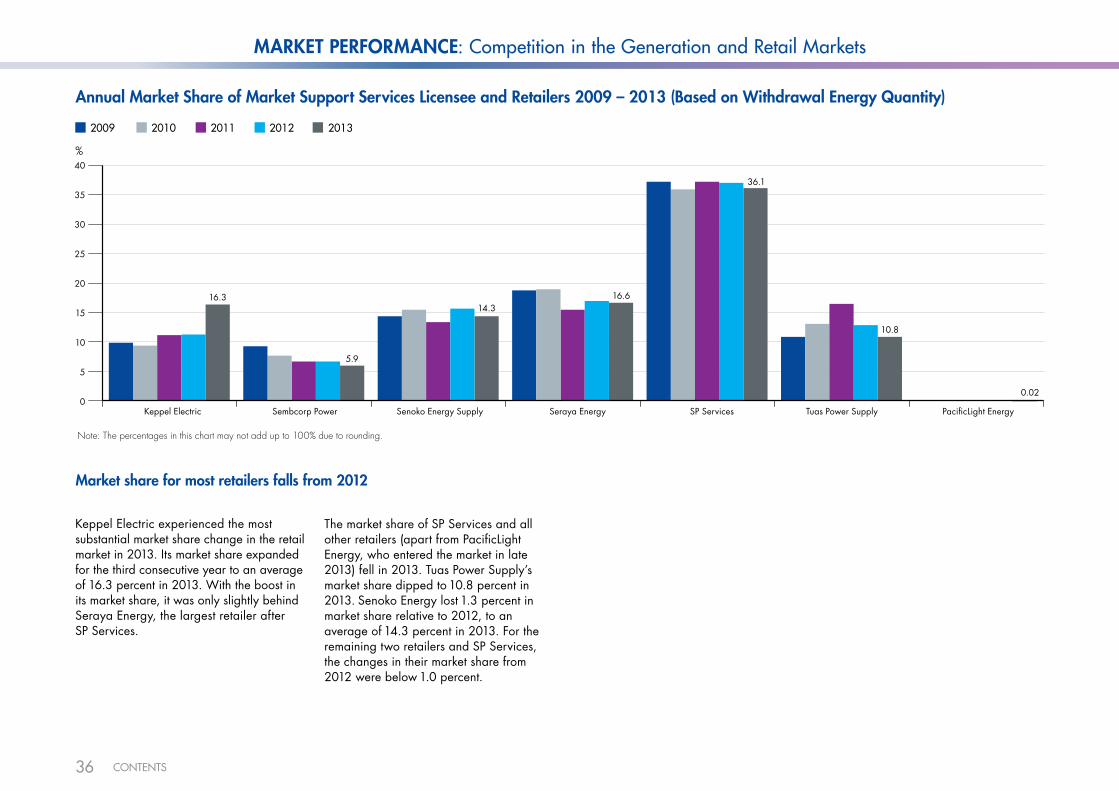
36
Annual Market Share of Market Support Services Licensee and Retailers 2009 – 2013 (Based on Withdrawal Energy Quantity)
Market share for most retailers falls from 2012
2009 2010 2011 2012 2013
Note: The percentages in this chart may not add up to 100% due to rounding.
MARKET PERFORMANCE: Competition in the Generation and Retail Markets
%40
35
30
25
20
15
10
5
0Keppel Electric Sembcorp Power Senoko Energy Supply Seraya Energy SP Services Tuas Power Supply PacificLight Energy
16.3
5.9
14.316.6
36.1
10.8
0.02
Keppel Electric experienced the most substantial market share change in the retail market in 2013. Its market share expanded for the third consecutive year to an average of 16.3 percent in 2013. With the boost in its market share, it was only slightly behind Seraya Energy, the largest retailer after SP Services.
The market share of SP Services and all other retailers (apart from PacificLight Energy, who entered the market in late 2013) fell in 2013. Tuas Power Supply’s market share dipped to 10.8 percent in 2013. Senoko Energy lost 1.3 percent in market share relative to 2012, to an average of 14.3 percent in 2013. For the remaining two retailers and SP Services, the changes in their market share from 2012 were below 1.0 percent.
CONTENTS
37
MARKET PERFORMANCE: Settlement and Prudential Management
Energy Market Company (EMC) is the financial clearing house for the wholesale market and settles the following transactions:• energy;• ancillary market products - three classes of reserve (primary, secondary and contingency) and regulation;• bilateral and vesting contracts;• uplift charges;• financial adjustments;• fee recovery of EMC and the PSO administration costs; and• contracted ancillary services not provided through the ancillary market (black-start services). The market is well-secured. To cover the exposure of a debtor and the time required to manage a default, all retailers must provide on-going collateral to EMC. This credit support protects EMC and other MPs from payment defaults. EMC reviews the risk exposure of MPs on a daily basis.
A margin call is issued when a retailer’s estimated exposure reaches a value equal to or greater than 70 percent of the level of its credit support. In 2013, EMC issued 47 margin calls, and all were met within the required time frame of two business days.
In 2013, the value of total retail settlement payments (net of bilateral offsets) was $3.88 billion and the value of credit support on 31 December 2013 was $447.97 million.
CONTENTS
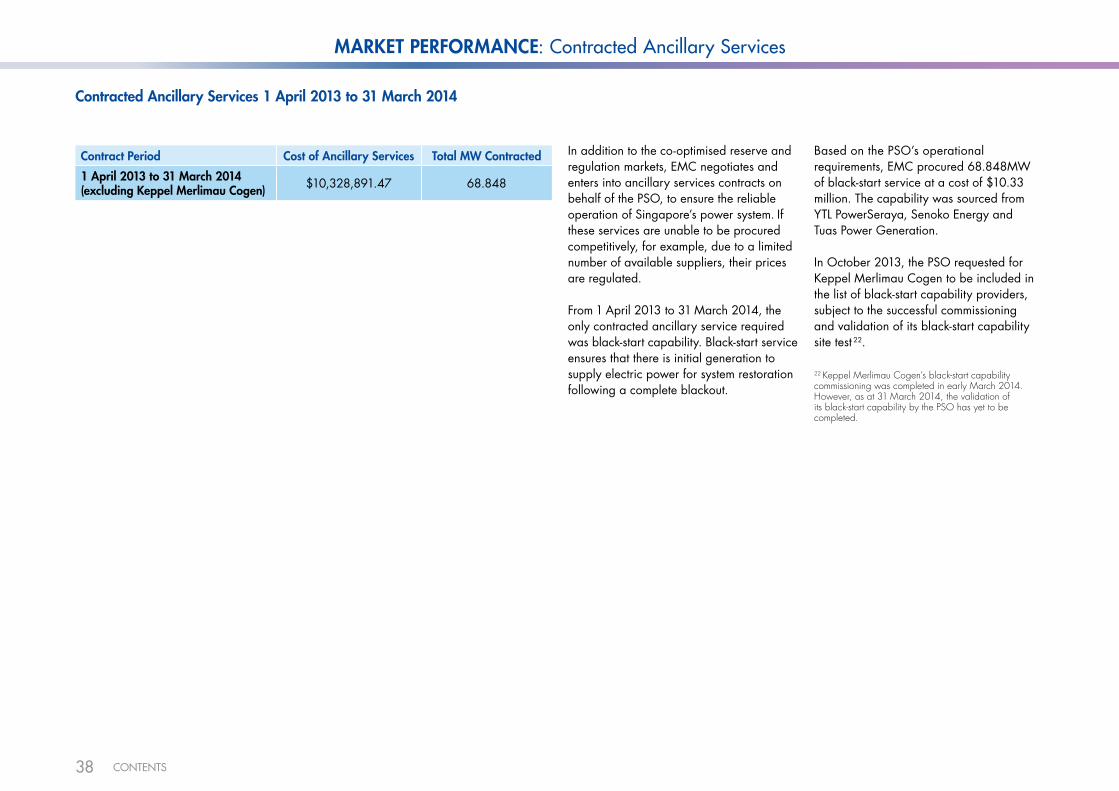
38
Contracted Ancillary Services 1 April 2013 to 31 March 2014
Contract Period Cost of Ancillary Services Total MW Contracted
1 April 2013 to 31 March 2014 (excluding Keppel Merlimau Cogen) $10,328,891.47 68.848
In addition to the co-optimised reserve and regulation markets, EMC negotiates and enters into ancillary services contracts on behalf of the PSO, to ensure the reliable operation of Singapore’s power system. If these services are unable to be procured competitively, for example, due to a limited number of available suppliers, their prices are regulated.
From 1 April 2013 to 31 March 2014, the only contracted ancillary service required was black-start capability. Black-start service ensures that there is initial generation to supply electric power for system restoration following a complete blackout.
Based on the PSO’s operational requirements, EMC procured 68.848MW of black-start service at a cost of $10.33 million. The capability was sourced from YTL PowerSeraya, Senoko Energy and Tuas Power Generation.
In October 2013, the PSO requested for Keppel Merlimau Cogen to be included in the list of black-start capability providers, subject to the successful commissioning and validation of its black-start capability site test 22.
22 Keppel Merlimau Cogen’s black-start capability commissioning was completed in early March 2014. However, as at 31 March 2014, the validation of its black-start capability by the PSO has yet to be completed.
MARKET PERFORMANCE: Contracted Ancillary Services
CONTENTS

39
The costs associated with the wholesale functions of the NEMS are recovered directly from the wholesale market or from MPs and consumers.
EMC and PSO fees are recovered from both generator and retailer class MPs in proportion to the quantity of energy that they trade.
EMC Net Fees and PSO Fees Recovered Directly from the NEMS – 1 April 2013 to 31 March 2014
Total Fees $’000
Fees/MWh* $
EMC Net Fees 25,066 0.2848
PSO Net Fees 18,948 0.2153
Total Fees 44,014 0.5001
*The volume is estimated at 44,003MWh based on actual volumes up to September 2013 being annualised.
Fees Recovered Directly from MPs and Consumers
Supplier Service Method of Assessment
SP Power Assets Transmission charges Levied based on actual usage
SP Services (MSSL) Meter reading and data management
Levied on a per meter basis
MARKET PERFORMANCE: Market Fees
CONTENTS

40
ADDITIONAL INFORMATION
41
ancillary servicesThe additional services necessary to ensure the security and reliability of the power system. The ancillary services traded competitively on the wholesale market are regulation and the three classes of reserve. The black-start ancillary service is contracted by Energy Market Company (EMC) on behalf of the Power System Operator (PSO) on an annual basis.
balance vesting priceThis refers to the price for the balance vesting quantity allocated.
balance vesting quantityWith the start of the Liquefied Natural Gas (LNG) Vesting Scheme in the third quarter of 2013, a certain percentage of the total allocated vesting quantity is pegged to LNG. The remaining percentage pegged to piped natural gas is known as balance vesting quantity.
black-start ancillary serviceA service to ensure that there is initial generation for system restoration following a complete blackout.
contestable consumersConsumers that have the right to choose to purchase electricity from a retail supplier, directly from the wholesale market, or
indirectly from the wholesale market through the Market Support Services Licensee (MSSL), SP Services. Consumers qualify to be contestable based on their level of electricity consumption.
co-optimisationThe process used by the market clearing engine (MCE) to ensure that the most inexpensive mix of energy, reserve and regulation is purchased from the market to meet electricity demand in each dispatch period.
dispatch scheduleA schedule produced by the MCE every half-hour that is the basis for the supply of energy, reserve and regulation in the market.
embedded generators (EG)Generation units that generate electricity to their onsite load principally for self consumption.
energyThe flow of electricity.
gigawatt (GW)A measure of electrical power equivalent to one thousand megawatts. Gigawatt hour (GWh) represents the number of gigawatts produced or consumed in an hour.
interruptible load (IL)A contestable consumer of electricity that participates in the wholesale market and allows its supply of electricity to be interrupted in the event of a system disturbance in exchange for reserve payment.
lng vesting priceThis refers to the price for the LNG vesting quantity allocated.
lng vesting quantityWith the start of the LNG Vesting Scheme in the third quarter of 2013, a certain percentage of the total allocated vesting quantity is pegged to LNG. This is known as the LNG vesting quantity.
loadThe consumption of electricity.
market clearing engine (MCE)The linear programme computer application used to calculate the spot market quantities and prices.
market participant (MP)A person who has an electricity licence issued by the Energy Market Authority (EMA) and has been registered with EMC as a market participant.
megawatt (MW)A measure of electrical power equivalent to one million watts. Megawatt hour (MWh) represents the number of megawatts produced or consumed in an hour.
metered demand Metered demand is the electricity consumption which is proxied by the withdrawal energy quantity (WEQ).
nodal pricingA market structure in which prices are calculated at specific locations, or nodes, in the power system to reflect the demand and supply characteristics of each location. Nodal pricing is also commonly referred to as locational marginal pricing.
non-contestable consumersConsumers that are supplied by the MSSL, SP Services, at a regulated tariff. These consumers have not been given the right to choose to purchase electricity from either a retail supplier, directly from the wholesale market or indirectly from the wholesale market through the MSSL, SP Services.
regulationGeneration that is on standby to fine-tune the match between generation and load.
ADDITIONAL INFORMATION: Glossary
CONTENTS
42
reserveStand-by generation capacity or interruptible load that can be drawn upon when there is an unforeseen disruption of supply.
retail marketThe transactions made between retail companies and end consumers.
supply cushionThe supply cushion measures the percentage of total supply available after matching off demand.
terawatt (TW)A measure of electrical power equivalent to one million megawatts. Terawatt hour (TWh) represents the number of terawatts produced or consumed in an hour.
Uniform Singapore Energy Price (USEP)The USEP is the weighted-average of the nodal prices at all off-take nodes.
vesting contractA vesting contract is a regulatory instrument imposed on some generators by the EMA, with the objective of mitigating the potential exercise of market power when the supply side of the industry is concentrated among a small number of generators. A vesting contract requires these generators to produce a specified quantity of electricity (vesting contract level) at a specified price (vesting contract hedge price).
vesting contract hedge price (VCHP)The VCHP is calculated by the MSSL every three months. It is determined using the long-run marginal cost (LRMC) of the most efficient generation technology in the Singapore power system, i.e., the combined-cycle gas turbine (CCGT). EMC’s settlement system uses the VCHP to settle the vesting quantity between the MSSL and the generation companies. With the introduction of LNG into the generation mix, the VCHP has been replaced by ‘lng vesting price’ and ‘balance vesting price’ from July 2013.
withdrawal energy quantity (WEQ)Withdrawal energy quantity (in MWh) refers to the amount of electricity withdrawn by load facilities. It is provided by the MSSL.
wholesale marketThe transactions made between generation companies and retail companies.
ADDITIONAL INFORMATION: Glossary
CONTENTS

43
Generator Licensees ExxonMobil Asia PacificKeppel Merlimau CogenKeppel Seghers Tuas Waste-To-Energy Plant (in its capacity as Trustee of Tuas DBOO Trust)National Environment Agency PacificLight PowerSembcorp CogenSenoko EnergySenoko Waste-To-Energy (in its capacity as Trustee of Senoko Trust)Shell Eastern PetroleumTP UtilitiesTuas Power GenerationTuaspringYTL PowerSeraya
www.exxonmobil.com.sgwww.kepinfra.comwww.keppelseghers.com
www.nea.gov.sgwww.pacificlight.com.sgwww.sembcorp.comwww.senokoenergy.com.sgwww.kepinfra.com www.shell.com.sg www.tuaspower.com.sgwww.tuaspower.com.sgwww.hyflux.comwww.ytlpowerseraya.com
Retailer Licensees Diamond Energy Supply Hyflux EnergyKeppel ElectricPacificLight EnergySembcorp PowerSenoko Energy SupplySeraya EnergyTuas Power Supply
www.diamond-energy.com.sgwww.hyflux.comwww.keppelelectric.comwww.pacificlight.com.sgwww.sembcorp.comwww.senokoenergy.com.sgwww.serayaenergy.com.sgwww.tpsupply.com.sg
Wholesale Market Traders Air Products SingaporeBanyan UtilitiesDiamond EnergyECO Special Waste ManagementGlaxo Wellcome Manufacturing – GlaxoSmithKline BiologicalsGreen Power AsiaISK Singapore23
MSD International GmbH (Singapore Branch)Pfizer Asia PacificSingapore LNG CorporationSingapore Oxygen Air Liquide
www.airproducts.com.sg
www.diamond-energy.com.sgwww.eco.com.sgwww.gsk.comwww.greenpowerasia.comwww.isktuas.com www.msd-singapore.comwww.pfizer.com.sgwww.slng.com.sgwww.soxal.com
Market Operator Energy Market Company www.emcsg.com
Market Support Services Licensee SP Services www.spservices.com.sg
Power System Operator Power System Operator www.ema.gov.sg
Transmission Licensee SP PowerAssets www.sppowerassets.com.sg
ADDITIONAL INFORMATION: Market Entities’ Contact Details
23 ISK Singapore withdrew as a market participant with effect from 11 December 2013.
CONTENTS

44

45
Disclaimer
While Energy Market Company Pte Ltd (“EMC”) has made reasonable efforts to ensure that the information contained in this report is accurate, it is provided for general information purposes only and EMC does not represent and makes no warranty whatsoever that the information provided is current, accurate, complete, fit, suitable or valid for any purpose or use whatsoever and EMC shall not be liable for any direct and/or indirect loss or damage of any kind whatsoever suffered due to any omission, error, inaccuracy, incompleteness, or otherwise, and/or any reliance on such information. You should always consult a suitably qualified professional and independently assess the information provided in this report. If you have any specific queries about this report or its contents, contact us at [email protected].
Copyright Notice
© Energy Market Company Pte Ltd 2014. All Rights Reserved.
Reproduction, transmission and distribution of this report for reference purposes only is authorised provided that such reproduction, transmission and distribution is in respect of the whole and complete report. This report shall not be reproduced, transmitted or distributed in parts. Full acknowledgement of Energy Market Company Pte Ltd as the source of this report must be given at all times.

Printed on recycled paper
Energy Market Company Pte Ltd238A Thomson Road#11-01 Novena Square Tower ASingapore 307684T: +65 6779 3000F: +65 6779 3030www.emcsg.com


![[2013] Ofcom - The Communications Market Report 2013](https://img.pdfslide.us/doc/110x75/5568613bd8b42a203d8b49c7/2013-ofcom-the-communications-market-report-2013.jpg)