Embed Size (px)
Citation preview
1 1
www.angelbroking.com
Market Outlook
March 2, 2016
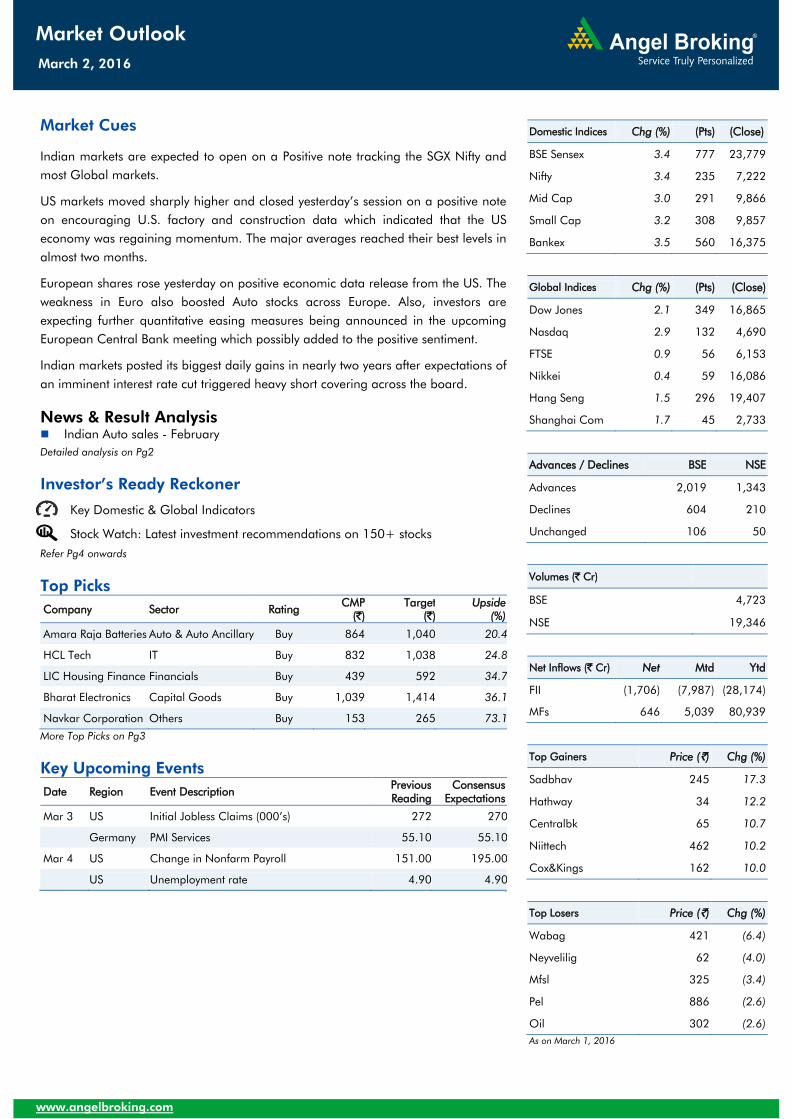
Market Cues
Indian markets are expected to open on a Positive note tracking the SGX Nifty and
most Global markets.
US markets moved sharply higher and closed yesterday’s session on a positive note
on encouraging U.S. factory and construction data which indicated that the US
economy was regaining momentum. The major averages reached their best levels in
almost two months.
European shares rose yesterday on positive economic data release from the US. The
weakness in Euro also boosted Auto stocks across Europe. Also, investors are
expecting further quantitative easing measures being announced in the upcoming
European Central Bank meeting which possibly added to the positive sentiment.
Indian markets posted its biggest daily gains in nearly two years after expectations of
an imminent interest rate cut triggered heavy short covering across the board.
News & Result Analysis
Indian Auto sales - February
Detailed analysis on Pg2
Investor’s Ready Reckoner
Key Domestic & Global Indicators
Stock Watch: Latest investment recommendations on 150+ stocks
Refer Pg4 onwards
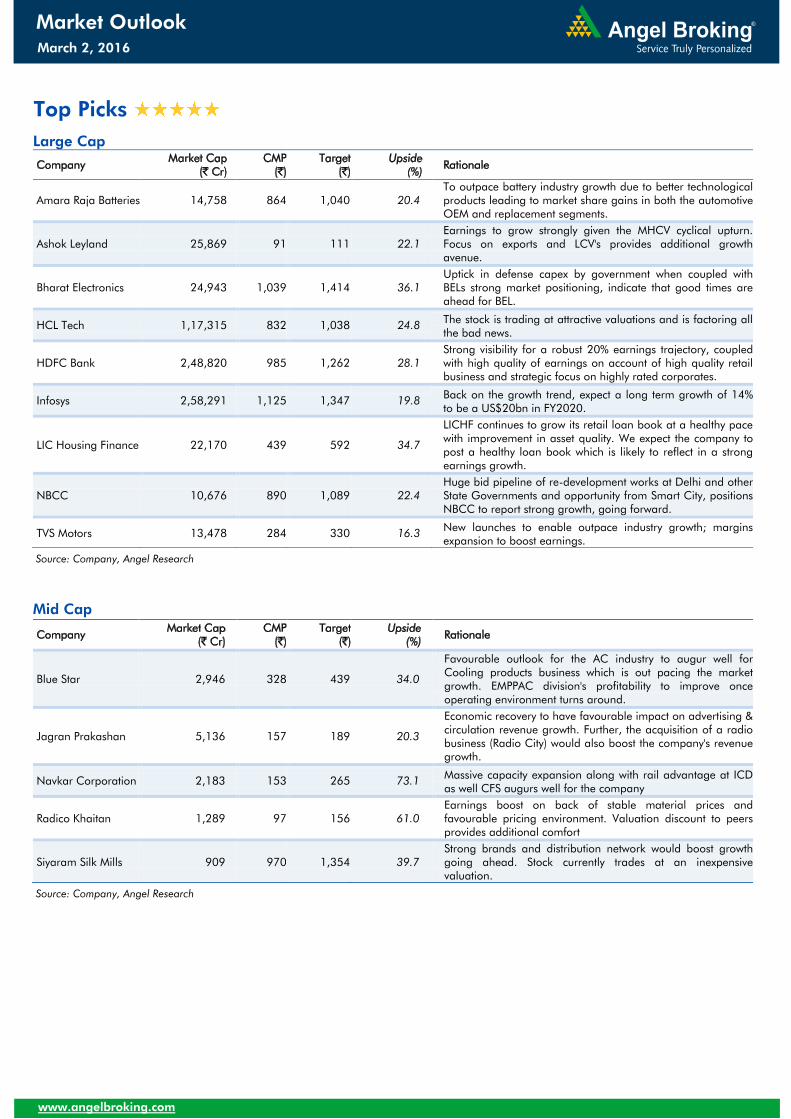
Top Picks
Company Sector Rating CMP
(`) Target
(`) Upside
(%)
Amara Raja Batteries Auto & Auto Ancillary Buy 864 1,040 20.4
HCL Tech IT Buy 832 1,038 24.8
LIC Housing Finance Financials Buy 439 592 34.7
Bharat Electronics Capital Goods Buy 1,039 1,414 36.1
Navkar Corporation Others Buy 153 265 73.1
More Top Picks on Pg3
Key Upcoming Events
Date Region Event Description
Previous
Reading
Consensus
Expectations
Mar 3 US Initial Jobless Claims (000’s) 272 270
Germany
PMI Services 55.10 55.10
Mar 4 US Change in Nonfarm Payroll 151.00 195.00
US
Unemployment rate 4.90 4.90
6.(
Domestic Indices Chg (%) (Pts) (Close)
BSE Sensex 3.4 777 23,779
Nifty 3.4 235 7,222
Mid Cap 3.0 291 9,866
Small Cap 3.2 308 9,857
Bankex 3.5 560 16,375
Global Indices Chg (%) (Pts) (Close)
Dow Jones 2.1 349 16,865
Nasdaq 2.9 132 4,690
FTSE 0.9 56 6,153
Nikkei 0.4 59 16,086
Hang Seng 1.5 296 19,407
Shanghai Com 1.7 45 2,733
Advances / Declines BSE NSE
Advances 2,019 1,343
Declines 604 210
Unchanged 106 50
Volumes (` Cr)
BSE 4,723
NSE 19,346
Net Inflows (` Cr) Net Mtd Ytd
FII (1,706) (7,987) (28,174)
MFs 646 5,039 80,939
Top Gainers Price (`) Chg (%)
Sadbhav 245 17.3
Hathway 34 12.2
Centralbk 65 10.7
Niittech 462 10.2
Cox&Kings 162 10.0
Top Losers Price (`) Chg (%)
Wabag 421 (6.4)
Neyvelilig 62 (4.0)
Mfsl 325 (3.4)
Pel 886 (2.6)
Oil 302 (2.6)
As on March 1, 2016
2
www.angelbroking.com
Market Outlook
March 2, 2016
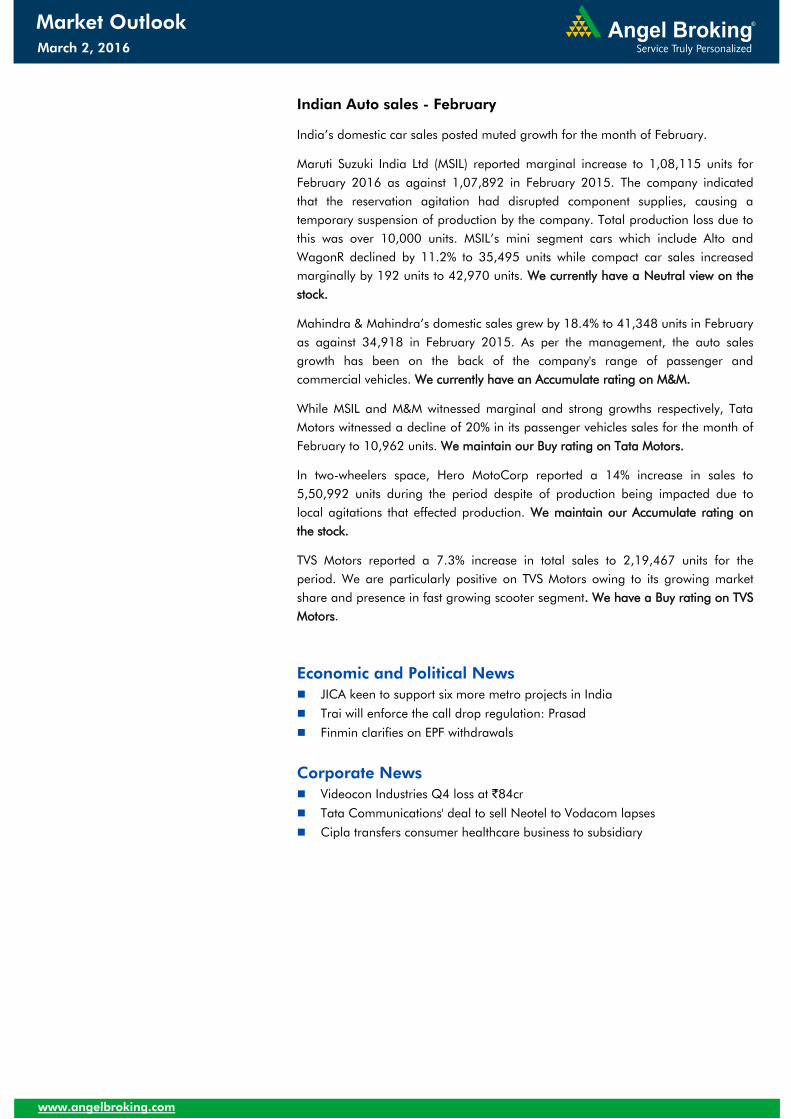
Indian Auto sales - February
India’s domestic car sales posted muted growth for the month of February.
Maruti Suzuki India Ltd (MSIL) reported marginal increase to 1,08,115 units for
February 2016 as against 1,07,892 in February 2015. The company indicated
that the reservation agitation had disrupted component supplies, causing a
temporary suspension of production by the company. Total production loss due to
this was over 10,000 units. MSIL’s mini segment cars which include Alto and
WagonR declined by 11.2% to 35,495 units while compact car sales increased
marginally by 192 units to 42,970 units. We currently have a Neutral view on the
stock.
Mahindra & Mahindra’s domestic sales grew by 18.4% to 41,348 units in February
as against 34,918 in February 2015. As per the management, the auto sales
growth has been on the back of the company's range of passenger and
commercial vehicles. We currently have an Accumulate rating on M&M.
While MSIL and M&M witnessed marginal and strong growths respectively, Tata
Motors witnessed a decline of 20% in its passenger vehicles sales for the month of
February to 10,962 units. We maintain our Buy rating on Tata Motors.
In two-wheelers space, Hero MotoCorp reported a 14% increase in sales to
5,50,992 units during the period despite of production being impacted due to
local agitations that effected production. We maintain our Accumulate rating on
the stock.
TVS Motors reported a 7.3% increase in total sales to 2,19,467 units for the
period. We are particularly positive on TVS Motors owing to its growing market
share and presence in fast growing scooter segment. We have a Buy rating on TVS
Motors.
Economic and Political News
JICA keen to support six more metro projects in India
Trai will enforce the call drop regulation: Prasad
Finmin clarifies on EPF withdrawals
Corporate News
Videocon Industries Q4 loss at `84cr
Tata Communications' deal to sell Neotel to Vodacom lapses
Cipla transfers consumer healthcare business to subsidiary
3
www.angelbroking.com
Market Outlook
March 2, 2016
Top Picks
Large Cap
Company Market Cap
(` Cr)
CMP
(`) Target
(`) Upside
(%) Rationale
Amara Raja Batteries 14,758 864 1,040 20.4
To outpace battery industry growth due to better technological
products leading to market share gains in both the automotive
OEM and replacement segments.
Ashok Leyland 25,869 91 111 22.1
Earnings to grow strongly given the MHCV cyclical upturn.
Focus on exports and LCV's provides additional growth
avenue.
Bharat Electronics 24,943 1,039 1,414 36.1
Uptick in defense capex by government when coupled with
BELs strong market positioning, indicate that good times are
ahead for BEL.
HCL Tech 1,17,315 832 1,038 24.8 The stock is trading at attractive valuations and is factoring all
the bad news.
HDFC Bank 2,48,820 985 1,262 28.1
Strong visibility for a robust 20% earnings trajectory, coupled
with high quality of earnings on account of high quality retail
business and strategic focus on highly rated corporates.
Infosys 2,58,291 1,125 1,347 19.8 Back on the growth trend, expect a long term growth of 14%
to be a US$20bn in FY2020.
LIC Housing Finance 22,170 439 592 34.7
LICHF continues to grow its retail loan book at a healthy pace
with improvement in asset quality. We expect the company to
post a healthy loan book which is likely to reflect in a strong
earnings growth.
NBCC 10,676 890 1,089 22.4
Huge bid pipeline of re-development works at Delhi and other
State Governments and opportunity from Smart City, positions
NBCC to report strong growth, going forward.
TVS Motors 13,478 284 330 16.3 New launches to enable outpace industry growth; margins
expansion to boost earnings.
Source: Company, Angel Research
Mid Cap
Company Market Cap
(` Cr)
CMP
(`) Target
(`) Upside
(%) Rationale
Blue Star 2,946 328 439 34.0
Favourable outlook for the AC industry to augur well for
Cooling products business which is out pacing the market
growth. EMPPAC division's profitability to improve once
operating environment turns around.
Jagran Prakashan 5,136 157 189 20.3
Economic recovery to have favourable impact on advertising &
circulation revenue growth. Further, the acquisition of a radio
business (Radio City) would also boost the company's revenue
growth.
Navkar Corporation 2,183 153 265 73.1 Massive capacity expansion along with rail advantage at ICD
as well CFS augurs well for the company
Radico Khaitan 1,289 97 156 61.0
Earnings boost on back of stable material prices and
favourable pricing environment. Valuation discount to peers
provides additional comfort
Siyaram Silk Mills 909 970 1,354 39.7
Strong brands and distribution network would boost growth
going ahead. Stock currently trades at an inexpensive
valuation.
Source: Company, Angel Research
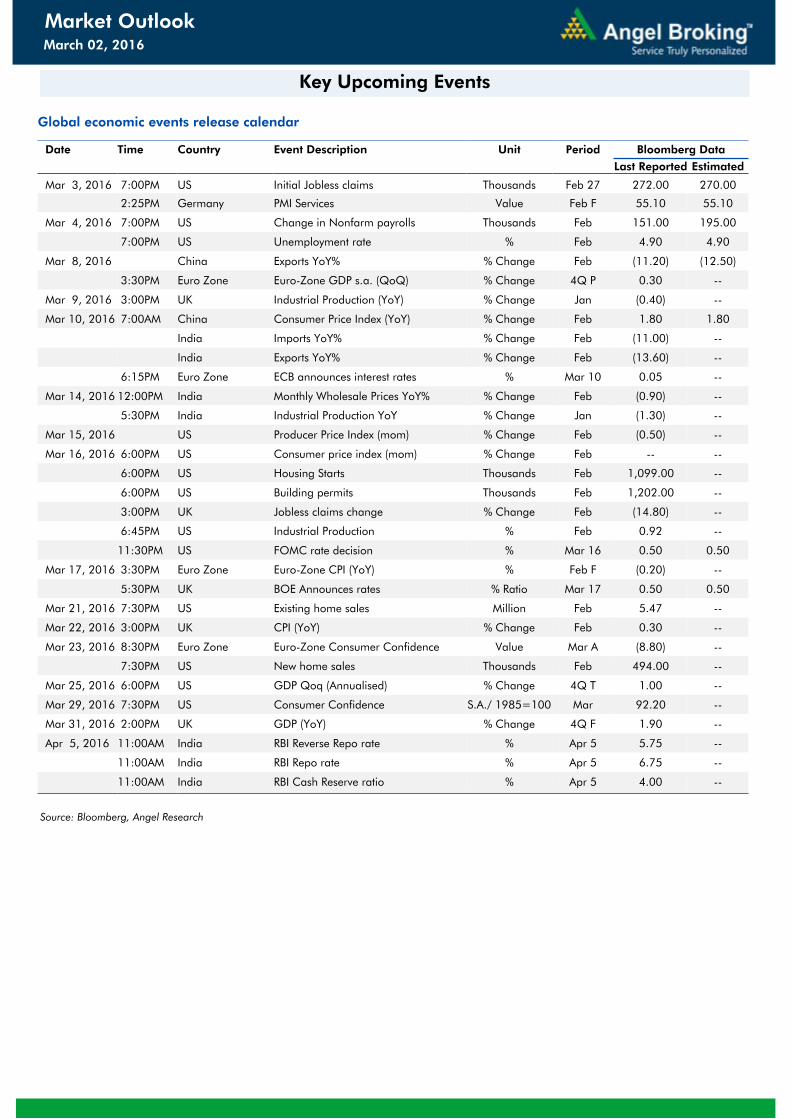
Global economic events release calendar
Date Time Country Event Description Unit Period Bloomberg Data
Last Reported Estimated
Mar 3, 2016 7:00PM US Initial Jobless claims Thousands Feb 27 272.00 270.00
2:25PM Germany PMI Services Value Feb F 55.10 55.10
Mar 4, 2016 7:00PM US Change in Nonfarm payrolls Thousands Feb 151.00 195.00
7:00PM US Unemployment rate % Feb 4.90 4.90
Mar 8, 2016 China Exports YoY% % Change Feb (11.20) (12.50)
3:30PM Euro Zone Euro-Zone GDP s.a. (QoQ) % Change 4Q P 0.30 --
Mar 9, 2016 3:00PM UK Industrial Production (YoY) % Change Jan (0.40) --
Mar 10, 2016 7:00AM China Consumer Price Index (YoY) % Change Feb 1.80 1.80
India Imports YoY% % Change Feb (11.00) --
India Exports YoY% % Change Feb (13.60) --
6:15PM Euro Zone ECB announces interest rates % Mar 10 0.05 --
Mar 14, 2016 12:00PM India Monthly Wholesale Prices YoY% % Change Feb (0.90) --
5:30PM India Industrial Production YoY % Change Jan (1.30) --
Mar 15, 2016 US Producer Price Index (mom) % Change Feb (0.50) --
Mar 16, 2016 6:00PM US Consumer price index (mom) % Change Feb -- --
6:00PM US Housing Starts Thousands Feb 1,099.00 --
6:00PM US Building permits Thousands Feb 1,202.00 --
3:00PM UK Jobless claims change % Change Feb (14.80) --
6:45PM US Industrial Production % Feb 0.92 --
11:30PM US FOMC rate decision % Mar 16 0.50 0.50
Mar 17, 2016 3:30PM Euro Zone Euro-Zone CPI (YoY) % Feb F (0.20) --
5:30PM UK BOE Announces rates % Ratio Mar 17 0.50 0.50
Mar 21, 2016 7:30PM US Existing home sales Million Feb 5.47 --
Mar 22, 2016 3:00PM UK CPI (YoY) % Change Feb 0.30 --
Mar 23, 2016 8:30PM Euro Zone Euro-Zone Consumer Confidence Value Mar A (8.80) --
7:30PM US New home sales Thousands Feb 494.00 --
Mar 25, 2016 6:00PM US GDP Qoq (Annualised) % Change 4Q T 1.00 --
Mar 29, 2016 7:30PM US Consumer Confidence S.A./ 1985=100 Mar 92.20 --
Mar 31, 2016 2:00PM UK GDP (YoY) % Change 4Q F 1.90 --
Apr 5, 2016 11:00AM India RBI Reverse Repo rate % Apr 5 5.75 --
11:00AM India RBI Repo rate % Apr 5 6.75 --
11:00AM India RBI Cash Reserve ratio % Apr 5 4.00 --
Source: Bloomberg, Angel Research
March 02, 2016
Market Outlook
Key Upcoming Events
h
2
Market Outlook
March 2, 2016
www.angelbroking.com www.angelbroking.com
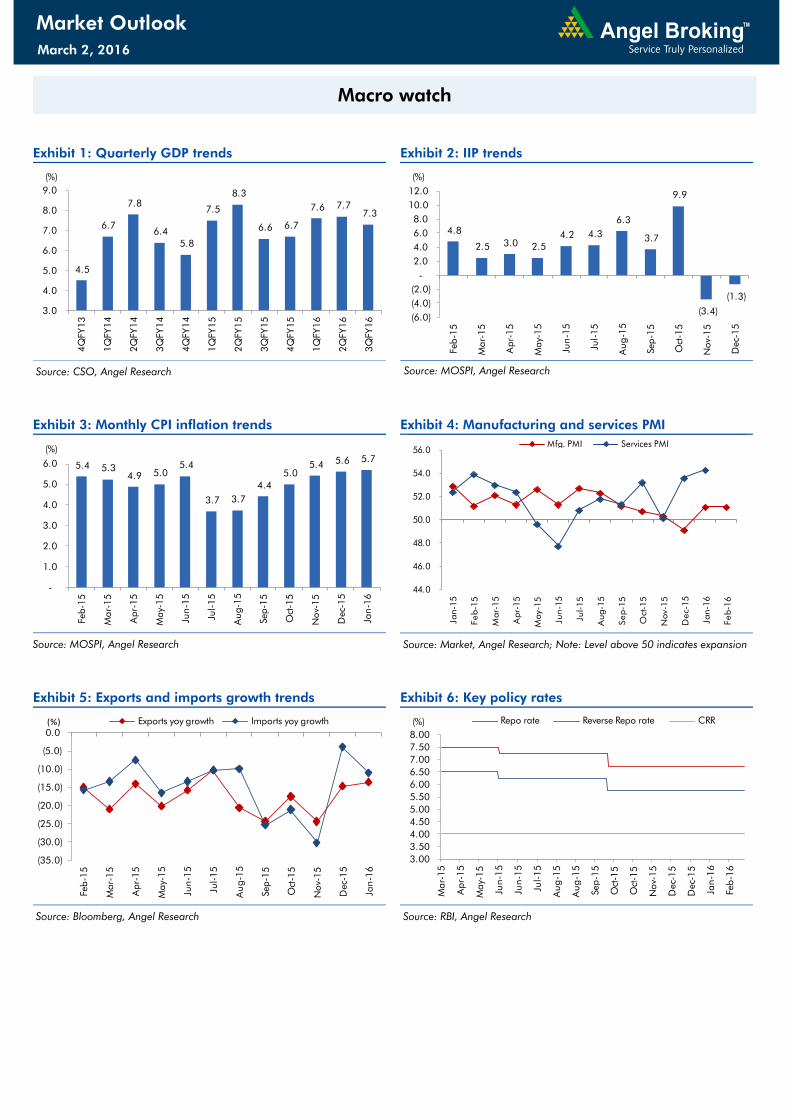
Macro watch
Exhibit 1: Quarterly GDP trends
Source: CSO, Angel Research
Exhibit 2: IIP trends
Source: MOSPI, Angel Research
Exhibit 3: Monthly CPI inflation trends
Source: MOSPI, Angel Research
Exhibit 4: Manufacturing and services PMI
Source: Market, Angel Research; Note: Level above 50 indicates expansion
Exhibit 5: Exports and imports growth trends
Source: Bloomberg, Angel Research
Exhibit 6: Key policy rates
Source: RBI, Angel Research
4.5
6.7
7.8
6.4
5.8
7.5
8.3
6.6 6.7
7.6 7.7
7.3
3.0
4.0
5.0
6.0
7.0
8.0
9.0
4Q
FY13
1Q
FY14
2Q
FY14
3Q
FY14
4Q
FY14
1Q
FY15
2Q
FY15
3Q
FY15
4Q
FY15
1Q
FY16
2Q
FY16
3Q
FY16
(%)
4.8
2.5 3.0
2.5
4.2 4.3
6.3
3.7
9.9
(3.4)
(1.3)
(6.0)
(4.0)
(2.0)
-
2.0
4.0
6.0
8.0
10.0
12.0
Feb-15
Mar-15
Apr-15
May-15
Jun-15
Jul-15
Aug
-15
Sep
-15
Oct-15
Nov-15
Dec-15
(%)
5.4 5.3
4.9 5.0
5.4
3.7 3.7
4.4
5.0
5.4 5.6 5.7
-
1.0
2.0
3.0
4.0
5.0
6.0
Feb-15
Mar-15
Apr-15
May-15
Jun
-15
Jul-15
Aug-15
Sep-15
Oct-15
Nov-15
Dec-15
Jan
-16
(%)
44.0
46.0
48.0
50.0
52.0
54.0
56.0 Jan-15
Feb-15
Mar-15
Apr-15
May-15
Jun-15
Jul-15
Aug-15
Sep-15
Oct-15
Nov-15
Dec-15
Jan-16
Feb-16
Mfg. PMI Services PMI
(35.0)
(30.0)
(25.0)
(20.0)
(15.0)
(10.0)
(5.0)
0.0
Feb
-15
Mar-15
Apr-15
May-15
Jun-15
Jul-15
Aug
-15
Sep-15
Oct-15
Nov-15
Dec-15
Jan-16
Exports yoy growth Imports yoy growth(%)
3.00
3.50
4.00
4.50
5.00
5.50
6.00
6.50
7.00
7.50
8.00
Mar-15
Apr-15
May-15
Jun-15
Jun-15
Jul-15
Aug
-15
Aug
-15
Sep-15
Oct-15
Oct-15
Nov-15
Dec-15
Dec-15
Jan-16
Feb-16
Repo rate Reverse Repo rate CRR (%)
h
3
Market Outlook
March 2, 2016
www.angelbroking.com www.angelbroking.com
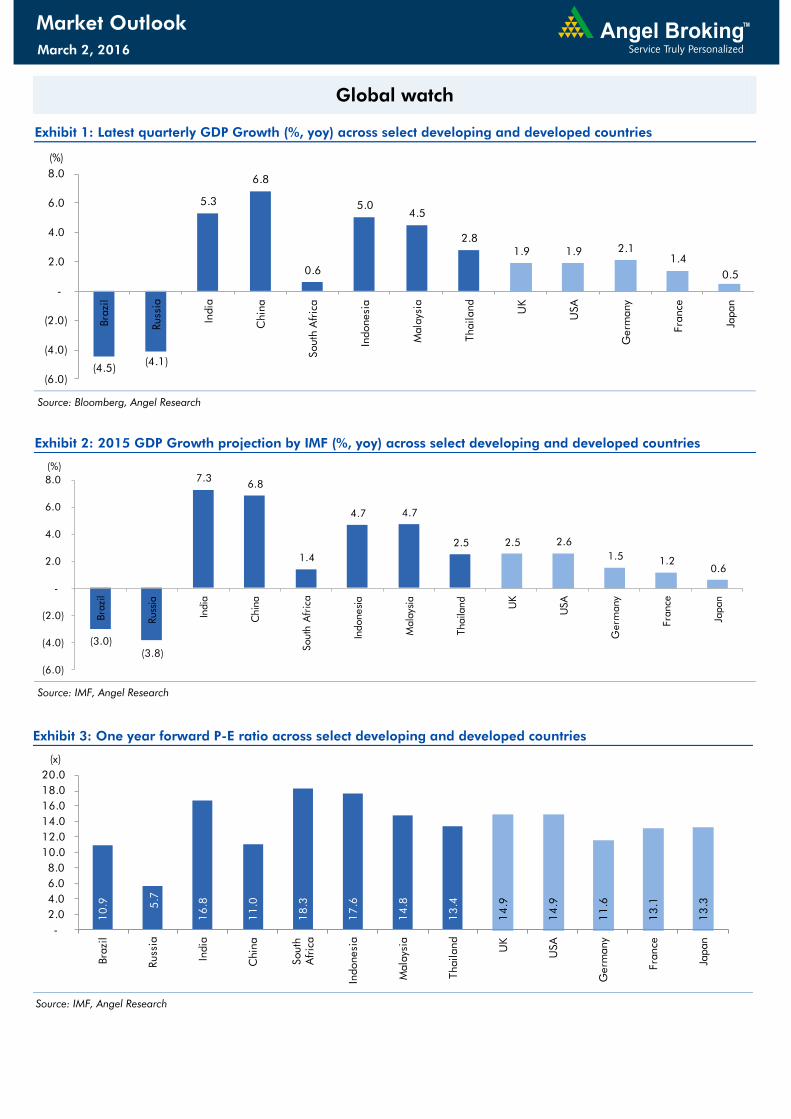
Global watch
Exhibit 1: Latest quarterly GDP Growth (%, yoy) across select developing and developed countries
Source: Bloomberg, Angel Research
Exhibit 2: 2015 GDP Growth projection by IMF (%, yoy) across select developing and developed countries
Source: IMF, Angel Research
Exhibit 3: One year forward P-E ratio across select developing and developed countries
Source: IMF, Angel Research
(4.5)(4.1)
5.3
6.8
0.6
5.0
4.5
2.8
1.9 1.9 2.1
1.4
0.5
(6.0)
(4.0)
(2.0)
-
2.0
4.0
6.0
8.0
Brazil
Russia
India
China
South A
frica
Indonesia
Malaysia
Thailand
UK
USA
Germ
any
France
Japan
(%)
(3.0)
(3.8)
7.3 6.8
1.4
4.7 4.7
2.5 2.5 2.6
1.5 1.2
0.6
(6.0)
(4.0)
(2.0)
-
2.0
4.0
6.0
8.0
Brazil
Russia
India
Chin
a
South
A
fric
a
Indonesia
Mala
ysia
Thailand
UK
USA
Germ
any
France
Japan
(%)
10
.9
5.7
16
.8
11
.0
18
.3
17
.6
14
.8
13
.4
14
.9
14
.9
11
.6
13
.1
13
.3
-
2.0
4.0
6.0
8.0
10.0
12.0
14.0
16.0
18.0
20.0
Brazil
Russia
India
China
South
Africa
Indonesia
Malaysia
Thailand
UK
USA
Germ
any
France
Japan
(x)
h
4
Market Outlook
March 2, 2016
www.angelbroking.com www.angelbroking.com
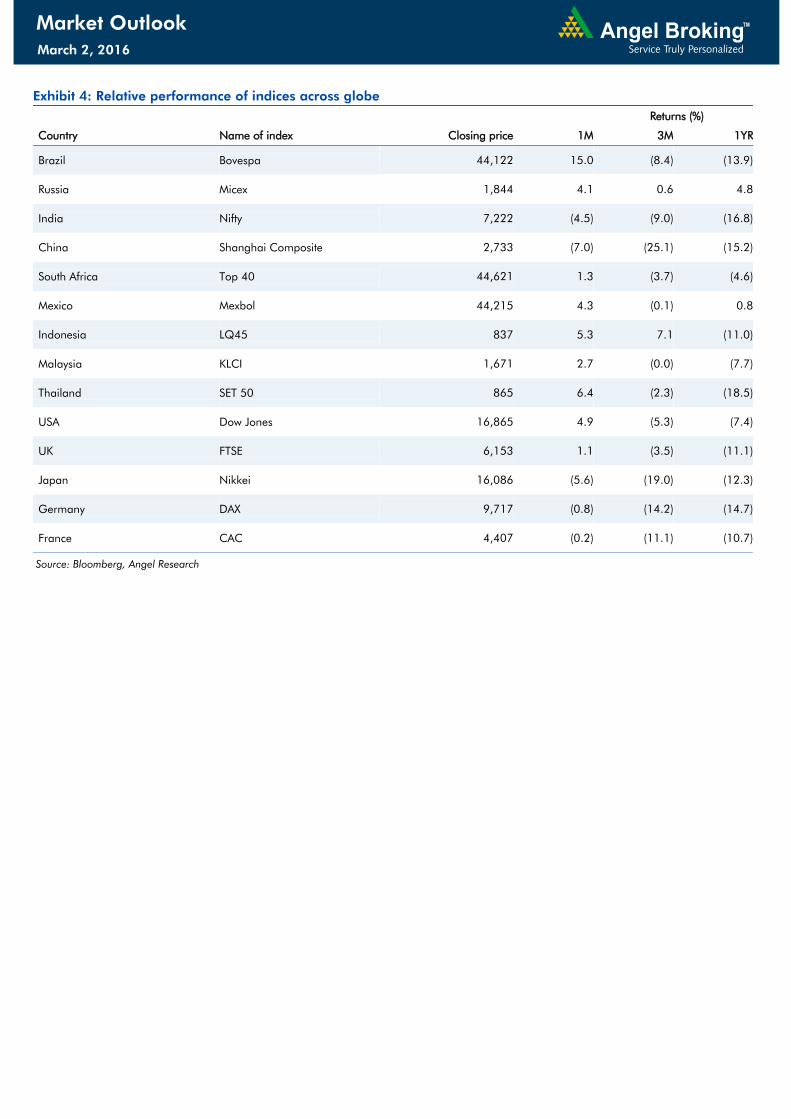
Exhibit 4: Relative performance of indices across globe
Returns (%)
Country Name of index Closing price 1M 3M 1YR
Brazil Bovespa 44,122 15.0 (8.4) (13.9)
Russia Micex 1,844 4.1 0.6 4.8
India Nifty 7,222 (4.5) (9.0) (16.8)
China Shanghai Composite 2,733 (7.0) (25.1) (15.2)
South Africa Top 40 44,621 1.3 (3.7) (4.6)
Mexico Mexbol 44,215 4.3 (0.1) 0.8
Indonesia LQ45 837 5.3 7.1 (11.0)
Malaysia KLCI 1,671 2.7 (0.0) (7.7)
Thailand SET 50 865 6.4 (2.3) (18.5)
USA Dow Jones 16,865 4.9 (5.3) (7.4)
UK FTSE 6,153 1.1 (3.5) (11.1)
Japan Nikkei 16,086 (5.6) (19.0) (12.3)
Germany DAX 9,717 (0.8) (14.2) (14.7)
France CAC 4,407 (0.2) (11.1) (10.7)
Source: Bloomberg, Angel Research
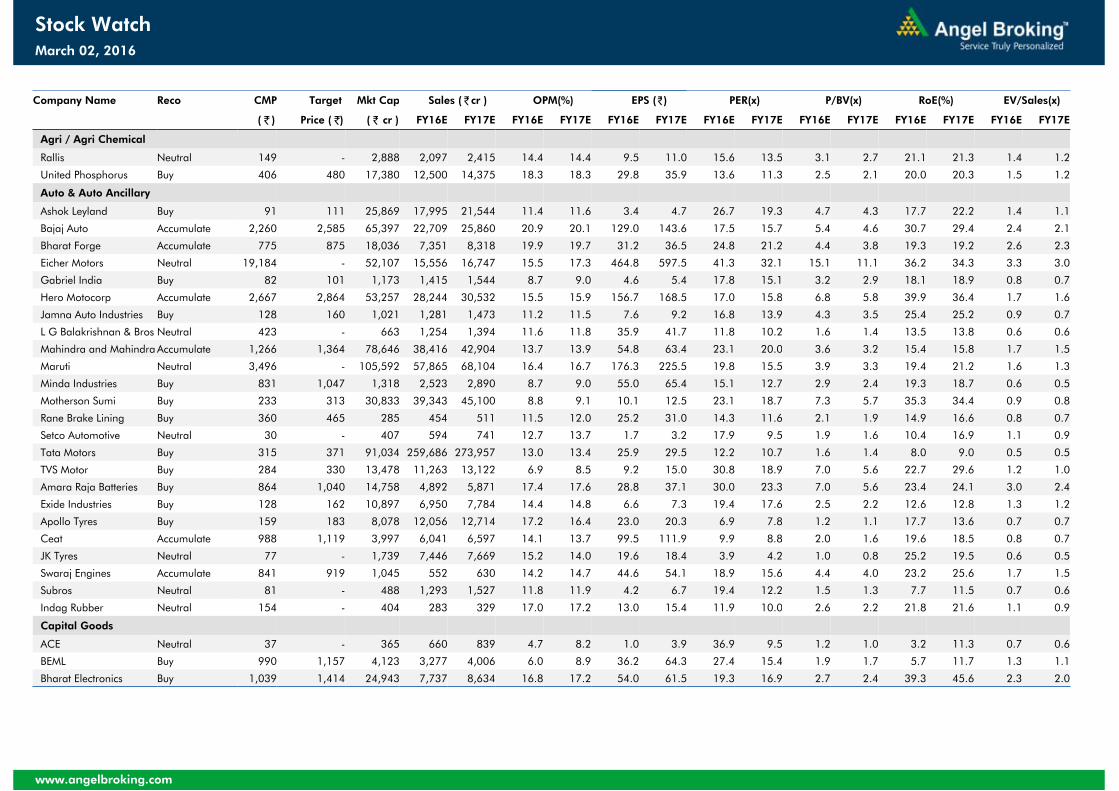
Company Name Reco CMP Target Mkt Cap Sales ( ₹cr ) OPM(%) EPS (₹) PER(x) P/BV(x) RoE(%) EV/Sales(x)
( ₹ ) Price ( ₹) ( ₹ cr ) FY16E FY17E FY16E FY17E FY16E FY17E FY16E FY17E FY16E FY17E FY16E FY17E FY16E FY17E
Agri / Agri Chemical
Rallis Neutral 149 - 2,888 2,097 2,415 14.4 14.4 9.5 11.0 15.6 13.5 3.1 2.7 21.1 21.3 1.4 1.2
United Phosphorus Buy 406 480 17,380 12,500 14,375 18.3 18.3 29.8 35.9 13.6 11.3 2.5 2.1 20.0 20.3 1.5 1.2
Auto & Auto Ancillary
Ashok Leyland Buy 91 111 25,869 17,995 21,544 11.4 11.6 3.4 4.7 26.7 19.3 4.7 4.3 17.7 22.2 1.4 1.1
Bajaj Auto Accumulate 2,260 2,585 65,397 22,709 25,860 20.9 20.1 129.0 143.6 17.5 15.7 5.4 4.6 30.7 29.4 2.4 2.1
Bharat Forge Accumulate 775 875 18,036 7,351 8,318 19.9 19.7 31.2 36.5 24.8 21.2 4.4 3.8 19.3 19.2 2.6 2.3
Eicher Motors Neutral 19,184 - 52,107 15,556 16,747 15.5 17.3 464.8 597.5 41.3 32.1 15.1 11.1 36.2 34.3 3.3 3.0
Gabriel India Buy 82 101 1,173 1,415 1,544 8.7 9.0 4.6 5.4 17.8 15.1 3.2 2.9 18.1 18.9 0.8 0.7
Hero Motocorp Accumulate 2,667 2,864 53,257 28,244 30,532 15.5 15.9 156.7 168.5 17.0 15.8 6.8 5.8 39.9 36.4 1.7 1.6
Jamna Auto Industries Buy 128 160 1,021 1,281 1,473 11.2 11.5 7.6 9.2 16.8 13.9 4.3 3.5 25.4 25.2 0.9 0.7
L G Balakrishnan & Bros Neutral 423 - 663 1,254 1,394 11.6 11.8 35.9 41.7 11.8 10.2 1.6 1.4 13.5 13.8 0.6 0.6
Mahindra and Mahindra Accumulate 1,266 1,364 78,646 38,416 42,904 13.7 13.9 54.8 63.4 23.1 20.0 3.6 3.2 15.4 15.8 1.7 1.5
Maruti Neutral 3,496 - 105,592 57,865 68,104 16.4 16.7 176.3 225.5 19.8 15.5 3.9 3.3 19.4 21.2 1.6 1.3
Minda Industries Buy 831 1,047 1,318 2,523 2,890 8.7 9.0 55.0 65.4 15.1 12.7 2.9 2.4 19.3 18.7 0.6 0.5
Motherson Sumi Buy 233 313 30,833 39,343 45,100 8.8 9.1 10.1 12.5 23.1 18.7 7.3 5.7 35.3 34.4 0.9 0.8
Rane Brake Lining Buy 360 465 285 454 511 11.5 12.0 25.2 31.0 14.3 11.6 2.1 1.9 14.9 16.6 0.8 0.7
Setco Automotive Neutral 30 - 407 594 741 12.7 13.7 1.7 3.2 17.9 9.5 1.9 1.6 10.4 16.9 1.1 0.9
Tata Motors Buy 315 371 91,034 259,686 273,957 13.0 13.4 25.9 29.5 12.2 10.7 1.6 1.4 8.0 9.0 0.5 0.5
TVS Motor Buy 284 330 13,478 11,263 13,122 6.9 8.5 9.2 15.0 30.8 18.9 7.0 5.6 22.7 29.6 1.2 1.0
Amara Raja Batteries Buy 864 1,040 14,758 4,892 5,871 17.4 17.6 28.8 37.1 30.0 23.3 7.0 5.6 23.4 24.1 3.0 2.4
Exide Industries Buy 128 162 10,897 6,950 7,784 14.4 14.8 6.6 7.3 19.4 17.6 2.5 2.2 12.6 12.8 1.3 1.2
Apollo Tyres Buy 159 183 8,078 12,056 12,714 17.2 16.4 23.0 20.3 6.9 7.8 1.2 1.1 17.7 13.6 0.7 0.7
Ceat Accumulate 988 1,119 3,997 6,041 6,597 14.1 13.7 99.5 111.9 9.9 8.8 2.0 1.6 19.6 18.5 0.8 0.7
JK Tyres Neutral 77 - 1,739 7,446 7,669 15.2 14.0 19.6 18.4 3.9 4.2 1.0 0.8 25.2 19.5 0.6 0.5
Swaraj Engines Accumulate 841 919 1,045 552 630 14.2 14.7 44.6 54.1 18.9 15.6 4.4 4.0 23.2 25.6 1.7 1.5
Subros Neutral 81 - 488 1,293 1,527 11.8 11.9 4.2 6.7 19.4 12.2 1.5 1.3 7.7 11.5 0.7 0.6
Indag Rubber Neutral 154 - 404 283 329 17.0 17.2 13.0 15.4 11.9 10.0 2.6 2.2 21.8 21.6 1.1 0.9
Capital Goods
ACE Neutral 37 - 365 660 839 4.7 8.2 1.0 3.9 36.9 9.5 1.2 1.0 3.2 11.3 0.7 0.6
BEML Buy 990 1,157 4,123 3,277 4,006 6.0 8.9 36.2 64.3 27.4 15.4 1.9 1.7 5.7 11.7 1.3 1.1
Bharat Electronics Buy 1,039 1,414 24,943 7,737 8,634 16.8 17.2 54.0 61.5 19.3 16.9 2.7 2.4 39.3 45.6 2.3 2.0
www.angelbroking.com
March 02, 2016
Stock Watch

Company Name Reco CMP Target Mkt Cap Sales ( ₹cr ) OPM(%) EPS (₹) PER(x) P/BV(x) RoE(%) EV/Sales(x)
( ₹ ) Price ( ₹) ( ₹ cr ) FY16E FY17E FY16E FY17E FY16E FY17E FY16E FY17E FY16E FY17E FY16E FY17E FY16E FY17E
Capital Goods
Voltas Buy 231 353 7,653 5,363 5,963 8.0 9.1 11.0 13.8 21.0 16.8 3.2 2.8 16.2 17.9 1.4 1.2
BGR Energy Neutral 95 - 687 3,615 3,181 9.5 9.4 16.7 12.4 5.7 7.7 0.5 0.5 10.0 7.0 0.6 0.8
BHEL Neutral 93 - 22,689 33,722 35,272 10.8 11.7 10.5 14.2 8.8 6.5 0.7 0.6 7.0 9.0 0.8 0.7
Blue Star Buy 328 439 2,946 3,548 3,977 6.3 6.9 13.7 17.2 23.9 19.1 6.0 3.9 26.1 25.4 0.9 0.8
Crompton Greaves Neutral 134 - 8,417 13,484 14,687 4.9 6.2 4.5 7.1 29.8 18.9 2.1 2.0 7.2 10.8 0.8 0.7
Greaves Cotton Neutral 125 - 3,050 1,655 1,755 16.6 16.8 7.4 7.8 16.9 16.0 3.4 3.2 21.1 20.6 1.8 1.7
Inox Wind Buy 232 458 5,143 4,980 5,943 17.0 17.5 26.6 31.6 8.7 7.3 2.6 1.9 35.0 30.0 1.2 0.9
KEC International Neutral 108 - 2,787 8,791 9,716 6.1 6.8 5.4 8.2 20.1 13.2 2.0 1.8 10.0 14.0 0.5 0.5
Thermax Neutral 763 - 9,092 6,413 7,525 7.4 8.5 30.5 39.3 25.0 19.4 3.9 3.4 15.0 17.0 1.4 1.1
Cement
ACC Neutral 1,231 - 23,107 13,151 14,757 16.4 18.3 63.9 83.4 19.3 14.8 2.5 2.3 13.3 16.1 1.6 1.3
Ambuja Cements Neutral 191 - 29,564 11,564 12,556 19.4 20.7 8.9 10.1 21.4 18.9 2.7 2.5 12.8 13.8 2.2 2.0
HeidelbergCement Neutral 65 - 1,465 1,772 1,926 13.3 15.4 1.0 3.0 64.7 21.6 1.6 1.5 2.6 7.9 1.4 1.2
India Cements Neutral 70 - 2,143 4,216 4,840 18.0 19.5 4.0 9.9 17.4 7.1 0.7 0.6 4.0 9.5 0.8 0.7
JK Cement Buy 494 605 3,451 3,661 4,742 10.1 15.8 7.5 28.5 65.8 17.3 2.0 1.8 7.5 22.9 1.4 1.1
J K Lakshmi Cement Neutral 287 - 3,371 2,947 3,616 16.7 19.9 11.5 27.2 24.9 10.5 2.4 2.0 9.8 20.8 1.6 1.2
Mangalam Cements Neutral 170 - 454 1,053 1,347 10.5 13.3 8.4 26.0 20.2 6.5 0.9 0.8 4.3 12.5 0.8 0.6
Orient Cement Neutral 138 - 2,821 1,854 2,524 21.2 22.2 7.7 11.1 17.9 12.4 2.6 2.2 13.3 15.7 2.3 1.6
Ramco Cements Neutral 365 - 8,687 4,036 4,545 20.8 21.3 15.1 18.8 24.2 19.4 3.0 2.6 12.9 14.3 2.7 2.3
Shree Cement^ Neutral 10,368 - 36,119 7,150 8,742 26.7 28.6 228.0 345.5 45.5 30.0 6.7 5.6 15.7 20.3 4.8 3.9
UltraTech Cement Accumulate 2,888 3,107 79,240 24,669 29,265 18.2 20.6 82.0 120.0 35.2 24.1 3.8 3.3 11.3 14.7 3.3 2.8
Construction
ITNL Neutral 68 - 2,234 7,360 8,825 34.0 35.9 7.0 9.0 9.7 7.5 0.3 0.3 3.2 3.7 3.7 3.6
KNR Constructions Buy 497 603 1,399 937 1,470 14.3 14.0 44.2 38.6 11.3 12.9 2.3 1.9 15.4 15.4 1.6 1.0
Larsen & Toubro Buy 1,124 1,310 104,675 58,870 65,708 8.3 10.3 42.0 53.0 26.8 21.2 1.9 1.7 8.8 11.2 2.0 1.8
Gujarat Pipavav Port Neutral 154 - 7,435 629 684 51.0 52.2 6.4 5.9 24.0 26.1 3.2 2.9 15.9 12.7 11.5 10.4
MBL Infrastructures Buy 128 285 529 2,313 2,797 12.2 14.6 19.0 20.0 6.7 6.4 0.7 0.6 11.3 10.6 0.9 0.8
Nagarjuna Const. Neutral 63 - 3,500 7,892 8,842 8.8 9.1 3.0 5.3 21.0 11.9 1.1 1.0 5.0 8.5 0.7 0.6
PNC Infratech Buy 477 558 2,449 1,873 2,288 13.2 13.5 24.0 32.0 19.9 14.9 1.9 1.7 12.1 12.3 1.4 1.2
Simplex Infra Neutral 211 - 1,042 5,955 6,829 10.3 10.5 16.0 31.0 13.2 6.8 0.7 0.6 5.3 9.9 0.7 0.6
Power Mech Projects Neutral 570 - 839 1,539 1,801 12.8 12.7 59.0 72.1 9.7 7.9 1.5 1.2 18.6 16.8 0.6 0.5
www.angelbroking.com
March 02, 2016
Stock Watch
Company Name Reco CMP Target Mkt Cap Sales ( ₹cr ) OPM(%) EPS (₹) PER(x) P/BV(x) RoE(%) EV/Sales(x)
( ₹ ) Price ( ₹) ( ₹ cr ) FY16E FY17E FY16E FY17E FY16E FY17E FY16E FY17E FY16E FY17E FY16E FY17E FY16E FY17E
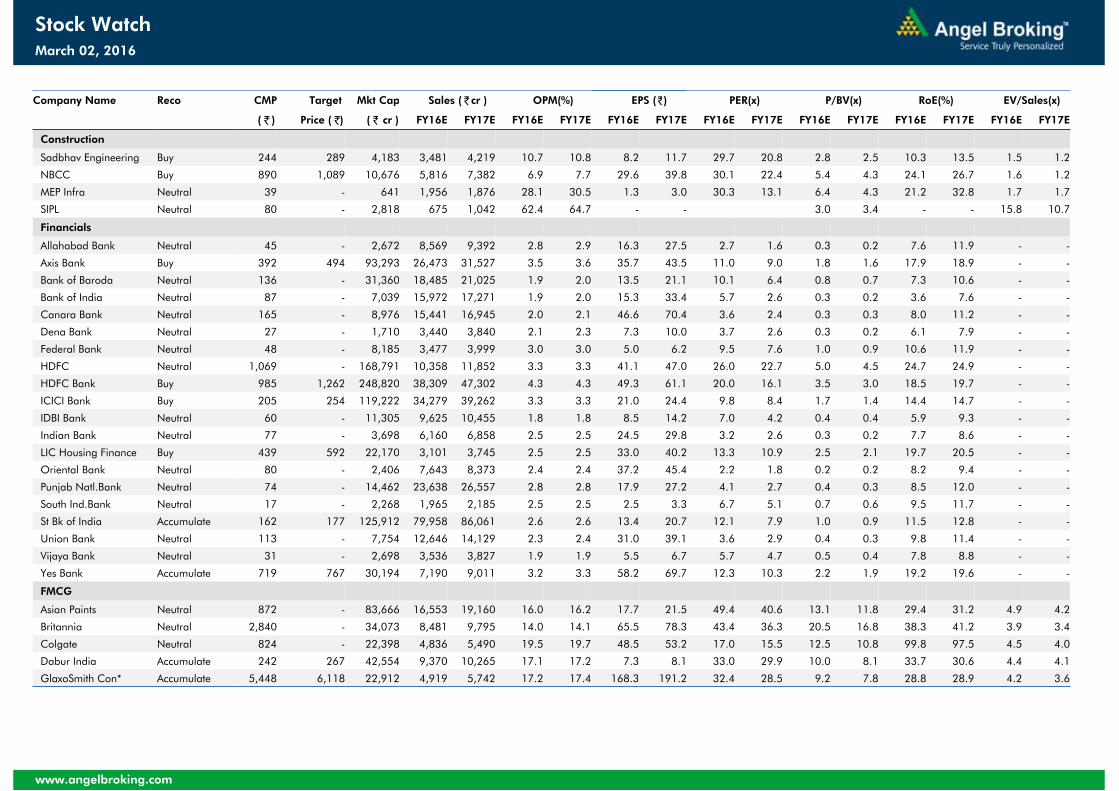
Construction
Sadbhav Engineering Buy 244 289 4,183 3,481 4,219 10.7 10.8 8.2 11.7 29.7 20.8 2.8 2.5 10.3 13.5 1.5 1.2
NBCC Buy 890 1,089 10,676 5,816 7,382 6.9 7.7 29.6 39.8 30.1 22.4 5.4 4.3 24.1 26.7 1.6 1.2
MEP Infra Neutral 39 - 641 1,956 1,876 28.1 30.5 1.3 3.0 30.3 13.1 6.4 4.3 21.2 32.8 1.7 1.7
SIPL Neutral 80 - 2,818 675 1,042 62.4 64.7 - - 3.0 3.4 - - 15.8 10.7
Financials
Allahabad Bank Neutral 45 - 2,672 8,569 9,392 2.8 2.9 16.3 27.5 2.7 1.6 0.3 0.2 7.6 11.9 - -
Axis Bank Buy 392 494 93,293 26,473 31,527 3.5 3.6 35.7 43.5 11.0 9.0 1.8 1.6 17.9 18.9 - -
Bank of Baroda Neutral 136 - 31,360 18,485 21,025 1.9 2.0 13.5 21.1 10.1 6.4 0.8 0.7 7.3 10.6 - -
Bank of India Neutral 87 - 7,039 15,972 17,271 1.9 2.0 15.3 33.4 5.7 2.6 0.3 0.2 3.6 7.6 - -
Canara Bank Neutral 165 - 8,976 15,441 16,945 2.0 2.1 46.6 70.4 3.6 2.4 0.3 0.3 8.0 11.2 - -
Dena Bank Neutral 27 - 1,710 3,440 3,840 2.1 2.3 7.3 10.0 3.7 2.6 0.3 0.2 6.1 7.9 - -
Federal Bank Neutral 48 - 8,185 3,477 3,999 3.0 3.0 5.0 6.2 9.5 7.6 1.0 0.9 10.6 11.9 - -
HDFC Neutral 1,069 - 168,791 10,358 11,852 3.3 3.3 41.1 47.0 26.0 22.7 5.0 4.5 24.7 24.9 - -
HDFC Bank Buy 985 1,262 248,820 38,309 47,302 4.3 4.3 49.3 61.1 20.0 16.1 3.5 3.0 18.5 19.7 - -
ICICI Bank Buy 205 254 119,222 34,279 39,262 3.3 3.3 21.0 24.4 9.8 8.4 1.7 1.4 14.4 14.7 - -
IDBI Bank Neutral 60 - 11,305 9,625 10,455 1.8 1.8 8.5 14.2 7.0 4.2 0.4 0.4 5.9 9.3 - -
Indian Bank Neutral 77 - 3,698 6,160 6,858 2.5 2.5 24.5 29.8 3.2 2.6 0.3 0.2 7.7 8.6 - -
LIC Housing Finance Buy 439 592 22,170 3,101 3,745 2.5 2.5 33.0 40.2 13.3 10.9 2.5 2.1 19.7 20.5 - -
Oriental Bank Neutral 80 - 2,406 7,643 8,373 2.4 2.4 37.2 45.4 2.2 1.8 0.2 0.2 8.2 9.4 - -
Punjab Natl.Bank Neutral 74 - 14,462 23,638 26,557 2.8 2.8 17.9 27.2 4.1 2.7 0.4 0.3 8.5 12.0 - -
South Ind.Bank Neutral 17 - 2,268 1,965 2,185 2.5 2.5 2.5 3.3 6.7 5.1 0.7 0.6 9.5 11.7 - -
St Bk of India Accumulate 162 177 125,912 79,958 86,061 2.6 2.6 13.4 20.7 12.1 7.9 1.0 0.9 11.5 12.8 - -
Union Bank Neutral 113 - 7,754 12,646 14,129 2.3 2.4 31.0 39.1 3.6 2.9 0.4 0.3 9.8 11.4 - -
Vijaya Bank Neutral 31 - 2,698 3,536 3,827 1.9 1.9 5.5 6.7 5.7 4.7 0.5 0.4 7.8 8.8 - -
Yes Bank Accumulate 719 767 30,194 7,190 9,011 3.2 3.3 58.2 69.7 12.3 10.3 2.2 1.9 19.2 19.6 - -
FMCG
Asian Paints Neutral 872 - 83,666 16,553 19,160 16.0 16.2 17.7 21.5 49.4 40.6 13.1 11.8 29.4 31.2 4.9 4.2
Britannia Neutral 2,840 - 34,073 8,481 9,795 14.0 14.1 65.5 78.3 43.4 36.3 20.5 16.8 38.3 41.2 3.9 3.4
Colgate Neutral 824 - 22,398 4,836 5,490 19.5 19.7 48.5 53.2 17.0 15.5 12.5 10.8 99.8 97.5 4.5 4.0
Dabur India Accumulate 242 267 42,554 9,370 10,265 17.1 17.2 7.3 8.1 33.0 29.9 10.0 8.1 33.7 30.6 4.4 4.1
GlaxoSmith Con* Accumulate 5,448 6,118 22,912 4,919 5,742 17.2 17.4 168.3 191.2 32.4 28.5 9.2 7.8 28.8 28.9 4.2 3.6
www.angelbroking.com
March 02, 2016
Stock Watch

Company Name Reco CMP Target Mkt Cap Sales ( ₹cr ) OPM(%) EPS (₹) PER(x) P/BV(x) RoE(%) EV/Sales(x)
( ₹ ) Price ( ₹) ( ₹ cr ) FY16E FY17E FY16E FY17E FY16E FY17E FY16E FY17E FY16E FY17E FY16E FY17E FY16E FY17E
FMCG
Godrej Consumer Neutral 1,247 - 42,448 10,168 12,886 16.1 16.1 32.1 38.4 38.8 32.5 7.9 7.3 19.7 21.0 4.3 3.4
HUL Neutral 825 - 178,519 34,940 38,957 17.5 17.7 20.8 24.7 39.7 33.4 44.1 35.3 110.5 114.2 4.9 4.4
ITC Accumulate 325 359 261,324 36,804 38,776 37.9 37.9 12.2 12.9 26.7 25.2 7.4 6.5 27.7 25.8 6.7 6.3
Marico Neutral 236 - 30,396 6,551 7,766 15.7 16.0 10.4 12.5 22.7 18.9 6.6 5.5 33.2 32.4 4.6 3.9
Nestle* Buy 5,049 6,646 48,680 11,291 12,847 22.2 22.3 158.9 184.6 31.8 27.4 16.6 14.9 55.0 57.3 4.2 3.6
Tata Global Buy 109 144 6,873 8,635 9,072 9.8 9.9 6.5 7.6 16.8 14.3 1.7 1.6 6.8 7.4 0.7 0.7
IT
HCL Tech^ Buy 832 1,038 117,315 42,038 47,503 21.2 21.5 51.5 57.7 16.2 14.4 3.5 2.7 21.5 18.8 2.4 1.9
Infosys Buy 1,125 1,347 258,291 61,850 69,981 27.5 27.5 59.4 65.7 18.9 17.1 4.0 3.4 21.2 20.1 3.5 2.9
TCS Buy 2,275 2,854 448,272 108,487 122,590 28.3 28.5 122.8 138.4 18.5 16.4 7.0 6.4 38.0 38.9 3.7 3.2
Tech Mahindra Buy 432 530 41,769 26,524 29,177 16.2 17.0 28.8 33.6 15.0 12.9 2.9 2.5 19.3 19.1 1.3 1.2
Wipro Buy 535 680 132,177 50,808 56,189 23.7 23.8 37.3 40.7 14.3 13.1 2.7 2.5 19.2 17.7 2.1 1.7
Media
D B Corp Accumulate 313 356 5,745 2,241 2,495 27.8 27.9 21.8 25.6 14.4 12.2 3.8 3.3 26.7 28.5 2.5 2.2
HT Media Neutral 80 - 1,854 2,495 2,603 11.2 11.2 7.3 8.6 10.9 9.3 0.9 0.8 7.4 8.1 0.2 0.2
Jagran Prakashan Buy 157 189 5,136 2,170 2,355 27.2 26.2 8.9 9.9 17.7 15.9 3.7 3.2 20.9 20.5 2.3 2.1
Sun TV Network Neutral 339 - 13,356 2,779 3,196 70.2 70.5 22.8 27.3 14.9 12.4 3.7 3.3 26.7 28.3 4.6 3.9Hindustan Media Ventures Neutral 260 - 1,908 920 1,031 20.0 20.0 19.2 20.9 13.5 12.5 2.2 1.9 16.4 15.3 1.6 1.4
Metals & Mining
Coal India Buy 318 380 200,671 76,167 84,130 19.9 22.3 22.4 25.8 14.2 12.3 5.1 5.0 35.5 41.0 2.0 1.8
Hind. Zinc Accumulate 163 175 68,873 14,641 14,026 50.4 50.4 17.7 16.0 9.2 10.2 1.4 1.3 16.2 13.2 2.3 2.2
Hindalco Neutral 70 - 14,496 104,356 111,186 8.7 9.5 6.7 11.1 10.5 6.4 0.4 0.4 3.5 5.9 0.7 0.6
JSW Steel Neutral 1,144 - 27,647 42,308 45,147 16.4 20.7 (10.3) 49.5 23.1 1.3 1.2 (1.0) 5.6 1.7 1.6
NMDC Neutral 82 - 32,669 8,237 10,893 46.6 44.5 10.0 11.7 8.3 7.1 0.9 0.8 12.5 13.0 3.8 2.9
SAIL Neutral 36 - 14,868 45,915 53,954 7.2 10.5 1.5 4.4 23.9 8.2 0.4 0.3 2.3 4.1 1.0 0.9
Vedanta Neutral 75 - 22,220 71,445 81,910 26.2 26.3 12.9 19.2 5.8 3.9 0.4 0.4 7.2 8.9 0.8 0.6
Tata Steel Neutral 257 - 24,951 126,760 137,307 8.9 11.3 6.4 23.1 40.4 11.1 0.8 0.8 2.0 7.1 0.8 0.7
Oil & Gas
Cairn India Neutral 123 - 23,023 11,323 12,490 49.4 51.0 20.7 20.7 5.9 6.0 0.4 0.4 6.4 6.1 1.1 0.5
GAIL Neutral 320 - 40,579 64,856 70,933 9.1 9.6 24.0 28.9 13.4 11.1 1.1 1.1 8.8 9.6 0.8 0.7
ONGC Neutral 192 - 163,838 154,564 167,321 36.8 37.4 28.6 32.5 6.7 5.9 0.9 0.8 12.7 13.5 1.3 1.2
Petronet LNG Neutral 247 - 18,510 29,691 31,188 5.8 6.2 12.8 13.4 19.3 18.4 2.9 2.6 15.8 14.8 0.7 0.7
Indian Oil Corp Buy 386 455 93,719 359,607 402,760 5.9 6.1 42.5 48.7 9.1 7.9 1.2 1.1 14.1 14.4 0.4 0.3
www.angelbroking.com
March 02, 2016
Stock Watch
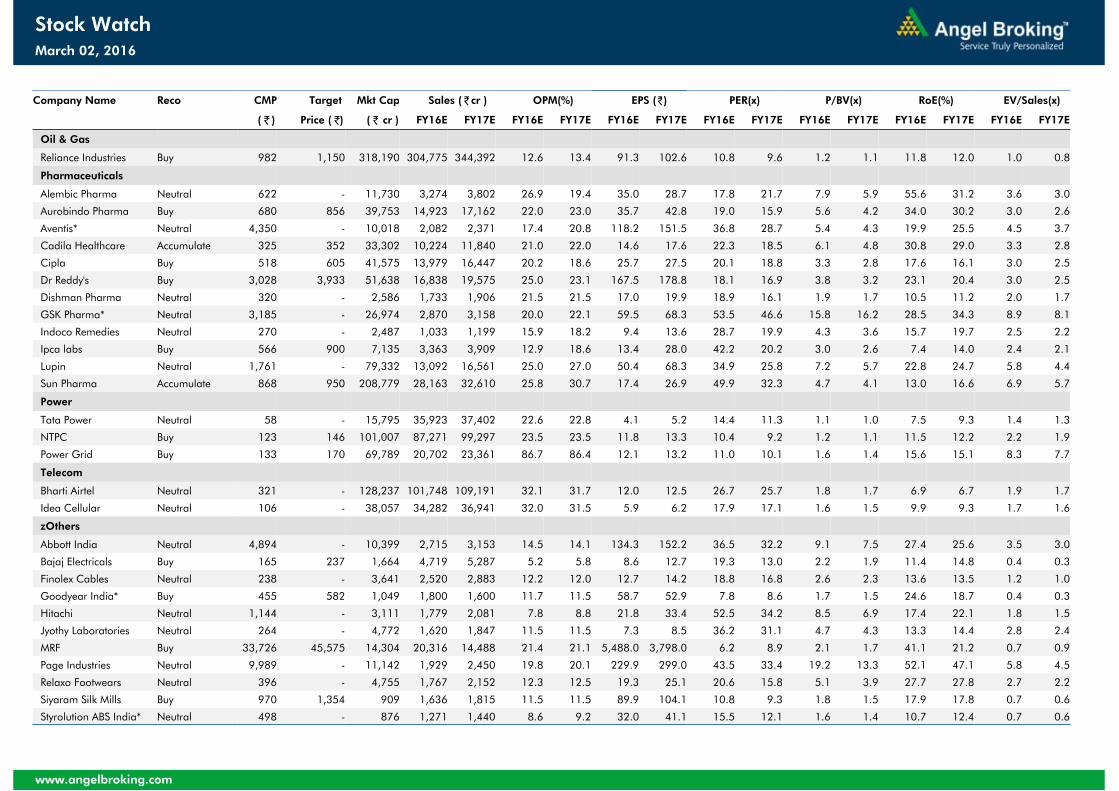
Company Name Reco CMP Target Mkt Cap Sales ( ₹cr ) OPM(%) EPS (₹) PER(x) P/BV(x) RoE(%) EV/Sales(x)
( ₹ ) Price ( ₹) ( ₹ cr ) FY16E FY17E FY16E FY17E FY16E FY17E FY16E FY17E FY16E FY17E FY16E FY17E FY16E FY17E
Oil & Gas
Reliance Industries Buy 982 1,150 318,190 304,775 344,392 12.6 13.4 91.3 102.6 10.8 9.6 1.2 1.1 11.8 12.0 1.0 0.8
Pharmaceuticals
Alembic Pharma Neutral 622 - 11,730 3,274 3,802 26.9 19.4 35.0 28.7 17.8 21.7 7.9 5.9 55.6 31.2 3.6 3.0
Aurobindo Pharma Buy 680 856 39,753 14,923 17,162 22.0 23.0 35.7 42.8 19.0 15.9 5.6 4.2 34.0 30.2 3.0 2.6
Aventis* Neutral 4,350 - 10,018 2,082 2,371 17.4 20.8 118.2 151.5 36.8 28.7 5.4 4.3 19.9 25.5 4.5 3.7
Cadila Healthcare Accumulate 325 352 33,302 10,224 11,840 21.0 22.0 14.6 17.6 22.3 18.5 6.1 4.8 30.8 29.0 3.3 2.8
Cipla Buy 518 605 41,575 13,979 16,447 20.2 18.6 25.7 27.5 20.1 18.8 3.3 2.8 17.6 16.1 3.0 2.5
Dr Reddy's Buy 3,028 3,933 51,638 16,838 19,575 25.0 23.1 167.5 178.8 18.1 16.9 3.8 3.2 23.1 20.4 3.0 2.5
Dishman Pharma Neutral 320 - 2,586 1,733 1,906 21.5 21.5 17.0 19.9 18.9 16.1 1.9 1.7 10.5 11.2 2.0 1.7
GSK Pharma* Neutral 3,185 - 26,974 2,870 3,158 20.0 22.1 59.5 68.3 53.5 46.6 15.8 16.2 28.5 34.3 8.9 8.1
Indoco Remedies Neutral 270 - 2,487 1,033 1,199 15.9 18.2 9.4 13.6 28.7 19.9 4.3 3.6 15.7 19.7 2.5 2.2
Ipca labs Buy 566 900 7,135 3,363 3,909 12.9 18.6 13.4 28.0 42.2 20.2 3.0 2.6 7.4 14.0 2.4 2.1
Lupin Neutral 1,761 - 79,332 13,092 16,561 25.0 27.0 50.4 68.3 34.9 25.8 7.2 5.7 22.8 24.7 5.8 4.4
Sun Pharma Accumulate 868 950 208,779 28,163 32,610 25.8 30.7 17.4 26.9 49.9 32.3 4.7 4.1 13.0 16.6 6.9 5.7
Power
Tata Power Neutral 58 - 15,795 35,923 37,402 22.6 22.8 4.1 5.2 14.4 11.3 1.1 1.0 7.5 9.3 1.4 1.3
NTPC Buy 123 146 101,007 87,271 99,297 23.5 23.5 11.8 13.3 10.4 9.2 1.2 1.1 11.5 12.2 2.2 1.9
Power Grid Buy 133 170 69,789 20,702 23,361 86.7 86.4 12.1 13.2 11.0 10.1 1.6 1.4 15.6 15.1 8.3 7.7
Telecom
Bharti Airtel Neutral 321 - 128,237 101,748 109,191 32.1 31.7 12.0 12.5 26.7 25.7 1.8 1.7 6.9 6.7 1.9 1.7
Idea Cellular Neutral 106 - 38,057 34,282 36,941 32.0 31.5 5.9 6.2 17.9 17.1 1.6 1.5 9.9 9.3 1.7 1.6
zOthers
Abbott India Neutral 4,894 - 10,399 2,715 3,153 14.5 14.1 134.3 152.2 36.5 32.2 9.1 7.5 27.4 25.6 3.5 3.0
Bajaj Electricals Buy 165 237 1,664 4,719 5,287 5.2 5.8 8.6 12.7 19.3 13.0 2.2 1.9 11.4 14.8 0.4 0.3
Finolex Cables Neutral 238 - 3,641 2,520 2,883 12.2 12.0 12.7 14.2 18.8 16.8 2.6 2.3 13.6 13.5 1.2 1.0
Goodyear India* Buy 455 582 1,049 1,800 1,600 11.7 11.5 58.7 52.9 7.8 8.6 1.7 1.5 24.6 18.7 0.4 0.3
Hitachi Neutral 1,144 - 3,111 1,779 2,081 7.8 8.8 21.8 33.4 52.5 34.2 8.5 6.9 17.4 22.1 1.8 1.5
Jyothy Laboratories Neutral 264 - 4,772 1,620 1,847 11.5 11.5 7.3 8.5 36.2 31.1 4.7 4.3 13.3 14.4 2.8 2.4
MRF Buy 33,726 45,575 14,304 20,316 14,488 21.4 21.1 5,488.0 3,798.0 6.2 8.9 2.1 1.7 41.1 21.2 0.7 0.9
Page Industries Neutral 9,989 - 11,142 1,929 2,450 19.8 20.1 229.9 299.0 43.5 33.4 19.2 13.3 52.1 47.1 5.8 4.5
Relaxo Footwears Neutral 396 - 4,755 1,767 2,152 12.3 12.5 19.3 25.1 20.6 15.8 5.1 3.9 27.7 27.8 2.7 2.2
Siyaram Silk Mills Buy 970 1,354 909 1,636 1,815 11.5 11.5 89.9 104.1 10.8 9.3 1.8 1.5 17.9 17.8 0.7 0.6
Styrolution ABS India* Neutral 498 - 876 1,271 1,440 8.6 9.2 32.0 41.1 15.5 12.1 1.6 1.4 10.7 12.4 0.7 0.6
www.angelbroking.com
March 02, 2016
Stock Watch

Company Name Reco CMP Target Mkt Cap Sales ( ₹cr ) OPM(%) EPS (₹) PER(x) P/BV(x) RoE(%) EV/Sales(x)
( ₹ ) Price ( ₹) ( ₹ cr ) FY16E FY17E FY16E FY17E FY16E FY17E FY16E FY17E FY16E FY17E FY16E FY17E FY16E FY17E
zOthers
TVS Srichakra Buy 2,049 3,217 1,569 2,035 2,252 15.9 15.3 248.6 268.1 8.2 7.6 3.6 2.6 43.6 33.9 0.8 0.7
HSIL Buy 254 302 1,835 2,123 2,384 16.1 16.5 15.0 18.9 16.9 13.5 1.3 1.2 8.0 9.4 1.2 1.1Kirloskar Engines India Ltd Neutral 210 - 3,036 2,403 2,554 8.6 9.9 9.2 10.5 22.9 20.0 2.2 2.1 9.7 10.7 0.9 0.8
M M Forgings Buy 396 614 478 511 615 21.7 21.6 43.1 55.8 9.2 7.1 1.7 1.4 19.9 21.2 1.1 0.9
Banco Products (India) Neutral 98 - 701 1,208 1,353 11.0 12.3 10.8 14.5 9.1 6.8 1.0 0.9 11.9 14.5 0.5 0.5
Competent Automobiles Neutral 135 - 83 1,040 1,137 3.2 3.1 25.7 28.0 5.2 4.8 0.8 0.7 15.0 14.3 0.1 0.1
Nilkamal Neutral 1,015 - 1,514 1,871 2,031 10.7 10.5 63.2 69.8 16.1 14.6 2.6 2.2 17.6 16.6 0.9 0.8
Visaka Industries Buy 98 144 156 1,086 1,197 9.9 10.3 21.5 28.8 4.6 3.4 0.4 0.4 9.6 11.6 0.4 0.3Transport Corporation of India Neutral 242 - 1,844 2,830 3,350 8.8 9.0 14.4 18.3 16.9 13.3 2.6 2.3 15.4 17.1 0.8 0.7
Elecon Engineering Neutral 49 - 531 1,359 1,482 10.3 13.7 0.8 3.9 60.7 12.5 1.0 1.0 1.6 7.8 0.7 0.7
Surya Roshni Buy 128 201 559 2,992 3,223 8.1 8.4 14.7 18.3 8.7 7.0 0.8 0.7 9.7 11.0 0.5 0.4
MT Educare Neutral 149 - 595 286 366 18.3 17.7 7.7 9.4 19.3 16.0 4.1 3.6 20.2 21.1 2.0 1.5
Radico Khaitan Buy 97 156 1,289 1,517 1,635 12.7 13.4 5.8 7.1 16.6 13.6 1.4 1.3 8.6 9.6 1.3 1.2
Garware Wall Ropes Buy 290 473 634 862 974 11.2 11.2 24.9 29.6 11.7 9.8 1.8 1.5 15.1 15.4 0.7 0.6
Wonderla Holidays Neutral 362 - 2,043 206 308 44.0 43.6 9.0 12.9 40.2 28.0 5.5 5.0 13.7 17.8 9.8 6.5
Linc Pen & Plastics Neutral 179 - 265 340 371 8.3 8.9 10.8 13.2 16.6 13.6 2.7 2.3 16.0 17.1 0.8 0.7
The Byke Hospitality Neutral 154 - 616 222 287 20.5 20.5 5.6 7.6 27.2 20.3 5.1 4.2 18.9 20.8 2.8 2.2
Interglobe Aviation Neutral 826 - 29,755 17,022 21,122 20.7 14.5 63.9 53.7 12.9 15.4 19.4 15.9 149.9 103.2 1.8 1.4Coffee Day Enterprises Ltd Neutral 225 - 4,636 2,692 2,964 17.0 18.6 - 4.7 - 47.5 2.8 2.6 0.2 5.5 2.1 2.0
Navneet Education Neutral 84 - 1,997 998 1,062 24.1 24.0 5.8 6.1 14.6 13.8 3.2 2.8 22.0 20.6 2.1 2.0
Navkar Corporation Buy 153 265 2,183 365 436 38.3 37.5 5.6 5.9 27.2 26.1 1.7 1.6 6.3 6.1 6.8 5.9
Source: Company, Angel Research; Note: *December year end; #September year end; &October year end; Price as on March 01, 2016
www.angelbroking.com
March 02, 2016
Stock Watch
Research Team Tel: 022 - 39357800 E-mail: [email protected] Website: www.angelbroking.com
DISCLAIMER
Angel Broking Private Limited (hereinafter referred to as “Angel”) is a registered Member of National Stock Exchange of India Limited, Bombay Stock Exchange Limited and Metropolitian Stock Exchange of India Limited. It is also registered as a Depository Participant with CDSL and Portfolio Manager with SEBI. It also has registration with AMFI as a Mutual Fund Distributor. Angel Broking Private Limited is a registered entity with SEBI for Research Analyst in terms of SEBI (Research Analyst) Regulations, 2014 vide registration number INH000000164. Angel or its associates has not been debarred/ suspended by SEBI or any other regulatory authority for accessing /dealing in securities Market. Angel or its associates including its relatives/analyst do not hold any financial interest/beneficial ownership of more than 1% in the company covered by Analyst. Angel or its associates/analyst has not received any compensation / managed or co-managed public offering of securities of the company covered by Analyst during the past twelve months. Angel/analyst has not served as an officer, director or employee of company covered by Analyst and has not been engaged in market making activity of the company covered by Analyst.
This document is solely for the personal information of the recipient, and must not be singularly used as the basis of any investment decision. Nothing in this document should be construed as investment or financial advice. Each recipient of this document should make such investigations as they deem necessary to arrive at an independent evaluation of an investment in the securities of the companies referred to in this document (including the merits and risks involved), and should consult their own advisors to determine the merits and risks of such an investment.
Reports based on technical and derivative analysis center on studying charts of a stock's price movement, outstanding positions and trading volume, as opposed to focusing on a company's fundamentals and, as such, may not match with a report on a company's fundamentals.
The information in this document has been printed on the basis of publicly available information, internal data and other reliable sources believed to be true, but we do not represent that it is accurate or complete and it should not be relied on as such, as this document is for general guidance only. Angel Broking Pvt. Limited or any of its affiliates/ group companies shall not be in any way responsible for any loss or damage that may arise to any person from any inadvertent error in the information contained in this report. Angel Broking Pvt. Limited has not independently verified all the information contained within this document. Accordingly, we cannot testify, nor make any representation or warranty, express or implied, to the accuracy, contents or data contained within this document. While Angel Broking Pvt. Limited endeavors to update on a reasonable basis the information discussed in this material, there may be regulatory, compliance, or other reasons that prevent us from doing so.
This document is being supplied to you solely for your information, and its contents, information or data may not be reproduced, redistributed or passed on, directly or indirectly.
Neither Angel Broking Pvt. Limited, nor its directors, employees or affiliates shall be liable for any loss or damage that may arise from or in connection with the use of this information.
Note: Please refer to the important ‘Stock Holding Disclosure' report on the Angel website (Research Section). Also, please refer to the latest update on respective stocks for the disclosure status in respect of those stocks. Angel Broking Pvt. Limited and its affiliates may have investment positions in the stocks recommended in this report.
www.angelbroking.com
Market OutlookMarch 02, 2016