Embed Size (px)
Citation preview


Maria Eduarda da Rocha Pereira Dias Moita
Effects of Echium plantagineum L. bee pollen on macrophages and basophils:
metabolic profile vs inflammatory mediators, degranulation and oxidative stress
Thesis for Doctor Degree in Pharmaceutical Sciences
Phytochemistry and Pharmacognosy Speciality
Work performed under the supervision of
Professor Doctor Paula Cristina Branquinho de Andrade
And co-supervision of
Professor Doctor Patrícia Carla Ribeiro Valentão
Doctor Luís Manuel Lopes Rodrigues da Silva
Porto 2015

To Miguel, Daniel and Tiago
Knowledge comes, but wisdom lingers
A. Tennyson

v
This work received financial support from the European Union (FEDER funds through
COMPETE) and National Funds (FCT, Fundação para a Ciência e Tecnologia) through
project Pest-C/EQB/LA0006/2013 and from the European Union (FEDER funds) under the
framework of QREN through Project NORTE-07-0124-FEDER-000069.
THE REPRODUCTION OF THIS THESIS, IN WHOLE, IS AUTHORIZED ONLY FOR
RESEARCH PURPOSES, UPON WRITTEN DECLARATION FROM THE INTERESTED
PART, WHICH COMPROMISES ITSELF TO DO SO


Publications
VII
PUBLICATIONS
The data contained in the following works make part of this dissertation:
Publications in international peer-reviewed journals indexed at Journal Citation Reports
from ISI Web of Knowledge:
1. Moita E, Gil-Izquierdo A, Sousa C, Ferreres F, Silva LR, Valentão P, Domínguez-
Perles R, Baenas N, Andrade PB. Integrated analysis of COX-2 and iNOS derived
inflammatory mediators in LPS-stimulated RAW macrophages pre-exposed to
Echium plantagineum L. bee pollen extract. Plos One 2013; 8(3): e59131.
2. Moita E, Sousa C, Andrade PB, Fernandes F, Pinho BR, Silva LR, Valentão P.
Effects of Echium plantagineum bee pollen on basophil degranulation: relationship
with metabolic profile. Molecules 2014; 19: 10635-49.
3. Sousa C, Moita E, Valentão P, Fernandes F, Monteiro P, Andrade PB.
Effects of colored and non-colored phenolics of Echium plantagineum L.
bee pollen in Caco-2 cells under oxidative stress induced by tert-butyl
hydroperoxide. J. Agric. Food Chem. 2015; 63: 2083-91
Publications
VIII
Communications at conferences or workshops, which were subjected to review by their
Scientific Committees and were included in the respective books of abstracts:
Poster communications
1. Moita E, Sousa C, Monteiro P, Valentão P, Andrade PB. Compostos fenólicos
e ação antioxidante de pólen de abelha de Echium plantagineum L.. XX
Encontro Luso-Galego de Química, 26-28 November 2014, Porto (Portugal).
2. Monteiro P, Moita E, Sousa C, Valentão P, Andrade PB. Effects of coloured
and non-coloured phenolics of Echium plantagineum L. bee pollen in Caco-2
cells. IJUP’14 – 7th Meeting of Young Researchers of U.Porto, 12-13
February 2014, Porto (Portugal).
3. Moita E, Silva LR, Valentão P, Sousa C, Andrade PB. Biological activities of
Echium plantagienum L. pollen hydro-alcoholic extract. IJUP’12 – 5th Meeting
of Young Researchers of U.Porto, 22-24 February 2012, Porto (Portugal).

IX
AUTHOR’S DECLARATION
The author states to have afforded a major contribution to the conceptual design,
technical execution of the work, interpretation of the results and manuscript preparation of
the published work included in this dissertation.

XI
ACKNOWLEDGMENTS
This PhD thesis results from the important contribution of several people and
institutions, being not possible otherwise. Therefore, I deeply express my gratitude to:
Prof. Doctor Paula Cristina Branquinho de Andrade, who gave me the great opportunity
and privilege to work in her lab, providing all the conditions necessary to achieve this
purpose. From the first moment I was welcomed and I appreciated all the orientation and
teaching in a field new to me. Her expertise, enthusiasm and permanent commitment
gave me confidence and motivation to learn and grow in the scientific field.
Prof. Andrade’s exceptional scientific supervision, great experience and tireless
encouragement enriched in an invaluable way this work. I also thank her constant
availability.
Prof. Doctor Patrícia Carla Ribeiro Valentão, who through positive criticism and
scientific guidance helped me to accomplish interesting results in the research now
present in this thesis. I thank her the permanent availability to questioning, correcting and
perfecting this work. I express my admiration for Prof. Valentão’s full dedication and
prompt cooperation in every moment.
Doctor Luís Silva, for his contribution to the lab work. His valuable help was important
for the development of this work and I also thank him for his availability to help.
Prof. Doctor Federico Ferreres from Consejo Superior de Investigaciones Cientificas
(CSIC), for his availability and essential contribution in the UPLC-QqQ-MS/MS analyses of
eicosanoids.
Doctor Carla Sousa, for her availability, help and scientific knowledge, important in the
development and successful achievement of the final results.
The remaining staff of the Laboratory of Pharmacognosy from the Faculty of Pharmacy of
Porto University, for all the support and availability.
XII
Doctor Marcos Taveira, who from the beginning gave me a helping hand and with
flawless patience heard and answered my doubts about practical matters. I thank him for
his friendship throughout these years.
My lab colleagues, Doctor Brígida Pinho, Doctor Fátima Fernandes, Doctor Andreia
Oliveira, Doctor Graciliana Lopes, and Doctor Clara Grosso, who amongst their busy
working hours found time to help, give important advice and answer my doubts. I also
thank them the good and pleasant ambience in the lab.
My friends, who encouraged me in accomplishing this project.
My family, for their support and encouragement. I particularly thank my husband for his
love, patience and also encouragement. I deeply thank my sons, Daniel and Tiago, for
their love and understanding for all the time I was absent, believing I was doing something
very important. To you I dedicate this thesis.
The European Union (FEDER funds through COMPETE) and National Funds (FCT,
Fundação para a Ciência e Tecnologia) through project Pest-C/EQB/LA0006/2013 and
from the European Union (FEDER funds) under the framework of QREN through Project
NORTE-07-0124-FEDER-000069.

ABSTRACT

Abstract
XV
ABSTRACT
Bee-collected pollen has been used as a folk medicine and foodstuff for human
consumption for centuries. Even today it is very sought after for its therapeutic and
nutritional properties.
On the other hand, several classes of bee pollen components have been used to
establish quality parameters of pollen, to characterize it in terms of botanical origin, to
recognize taxonomic markers and to evaluate their nutritional and biological properties.
Oxidative stress and inflammation play important roles in disease development. This
dissertation intended to evaluate the anti-inflammatory and anti-allergic potential of
Echium plantagineum L. bee pollen to support its claimed health beneficial effects.
The hydromethanol extract efficiently scavenged nitric oxide radical (NO), although
against superoxide anion (O2-) it behaved as antioxidant at lower concentrations and as
pro-oxidant at higher concentrations. The anti-inflammatory potential was evaluated in
LPS-stimulated macrophages. The levels of NO and L-citrulline decreased for all extract
concentrations tested, while the levels of prostaglandins, their metabolites and
isoprostanes, evaluated by UPLC-MS, decreased with low extract concentrations. So, E.
plantagineum bee pollen can exert anti-inflammatory activity by reducing NO and
prostaglandins.
The anti-allergic potential of the hydromethanol extract obtained from E. plantagineum
bee pollen was also evaluated, by assessing β-hexosaminidase release in rat basophilic
leukemic cells (RBL-2H3). Two different stimuli were used: calcium ionophore A23187
and IgE/antigen complex. Lipoxygenase inhibitory activity was evaluated in a cell-free
system.
In RBL-2H3 cells stimulated with calcium ionophore or IgE/antigen, the hydromethanol
extract significantly decreased β-hexosaminidase release until the concentration of 2.08
mg mL-1, without compromising cellular viability. No effect was found on lipoxygenase.
Overall, this study showed promising results, substantiating for the first time the utility of
the intake of E. plantagineum bee pollen to prevent allergy and ameliorate allergy
symptoms, although a potentiation of an allergic response can occur, depending on the
dose used.
The hydromethanol extract was analysed for its phenolic content, as it is known that
these are important bioactive compounds. The chromatogram obtained by HPLC-DAD
showed kaempferol-3-O-neohesperidoside as a major peak, followed by its acylated
derivative, kaempferol-3-O-(3’/4’-acetyl)-neohesperidoside, and eight minor peaks
Abstract
XVI
corresponding to quercetin and kaempferol derivatives. In addition, HPLC-UV and GC-
IT/MS methods were used to determine organic acids and fatty acids, respectively. Eight
organic acids and five fatty acids were determined for the first time, malonic acid and α-
linolenic acid being the main compounds from each class. This extract revealed to be
devoid of alkaloids.
To widen the knowledge in E. plantagineum bee pollen, two fractions of pollen’s
acidified methanol extract, enriched either in flavonols or anthocyanins, were
characterized by HPLC-DAD and their antioxidant properties were evaluated in Caco-2
cells subjected to oxidative stress induced by tert-butyl hydroperoxide (t-BHP). For
comparison purposes the whole extract was also studied.
Seven flavonols and five anthocyanins were detected in both whole extract and fraction
II, while fraction I contained six flavonols (in higher amounts than in fraction II) and small
amounts of petunidin-3-O-rutinoside. The pre-exposition to fraction I imparted a tendency
to protect cells, while fraction II and the whole extract aggravated the toxicity of t-BHP at
some of the tested concentrations.
The protective effects appeared to be correlated with the levels of total glutathione,
while there was no observable correlation between cellular viability and reactive species.
No significant effect on antioxidant enzymes activity was noticed. Overall, anthocyanins
seemed to abrogate the antioxidant potential of flavonoid-rich E. plantagineum bee pollen
extract.
E. plantagineum bee pollen proved to be nutritionally and pharmacologically
interesting, due to its chemical composition and to the biological activity of its constituents,
namely phenolic compounds. This study contributes to increase the possibility of
commercialization of this natural product in the granular form or as an extract.
Keywords: Echium plantagineum L. bee pollen; metabolic profile; inflammation; allergy;
oxidative stress.

RESUMO

Resumo
XIX
RESUMO
O pólen de abelha tem sido usado há séculos como remédio tradicional e alimento
para consumo humano. Ainda hoje é muito procurado pelas suas propriedades nutritivas
e terapêuticas.
Por outro lado, várias classes de compostos do pólen de abelha têm sido utilizadas
para se estabelecer os seus parâmetros de qualidade, para a sua caracterização em
termos de origem botânica, reconhecimento de marcadores taxonómicos e avaliar as
suas propriedades biológicas e nutricionais.
A inflamação e o stress oxidativo desempenham um papel importante no
desenvolvimento de várias doenças. Nesta dissertação pretendeu-se avaliar o potencial
anti-inflamatório e antialérgico do pólen de abelha de Echium plantagineum L., para
suporte científico dos seus aclamados efeitos benéficos para a saúde.
O extrato hidrometanólico demonstrou capacidade para sequestrar o óxido nítrico
(•NO); no entanto, relativamente ao radical anião superóxido (O2•-) comporta-se como
antioxidante em baixas concentrações e como pró-oxidante em concentrações mais altas.
O potencial anti-inflamatório foi avaliado em macrófagos estimulados com LPS. Os níveis
de •NO e de L-citrulina diminuíram com todas as concentrações de extrato testadas,
enquanto os níveis de prostaglandinas, os seus metabolitos e isoprostanos, analisados
por UPLC-MS, diminuíram com baixas concentrações de extrato. Assim, o extrato de
pólen de abelha de E. plantagineum exerce atividade anti-inflamatória reduzindo os níveis
de •NO e de prostaglandinas.
O potencial anti-alérgico do extrato hidrometanólico de pólen de abelha de E.
plantagineum foi, também testado relativamente ao seu efeito sobre a libertação de β-
hexosaminidase, em basófilos leucémicos de ratinho (RBL-2H3). Foram usados dois
estímulos diferentes: o ionóforo de cálcio A23187 e o complexo IgE/antigénio. A atividade
inibitória da lipoxigenase foi analisada em sistema não celular.
O extrato hidrometanólico diminuiu significativamente a libertação de β-
hexosaminidase das células RBL-2H3 estimuladas com ionóforo de cálcio ou
IgE/antigénio até à concentração de 2,08 mg mL-1, sem comprometer a viabilidade
celular. Não foi observado qualquer efeito na lipoxigenase. Globalmente, foram obtidos
resultados promissores que substanciam, pela primeira vez, a utilidade do consumo de
pólen de abelha de E. plantagineum para prevenir a alergia e melhorar sintomas de
alergia, apesar de poder ocorrer uma potenciação da resposta alérgica, dependendo da
dose usada.

Resumo
XX
O extrato hidrometanólico foi analisado relativamente à sua composição fenólica. O
cromatograma obtido por HPLC-DAD mostrou o canferol-3-O-neoesperidósido como
composto principal, seguido de um seu derivado acilado, canferol-3-O-(3’/4’-acetil)-neo-
hesperidósido, além de oito compostos em menor quantidade, correspondentes a
derivados de quercetina e de canferol. Adicionalmente, o extrato foi analisado por HPLC-
UV e por GC-IT/MS para pesquisa de ácidos orgânicos e de ácidos gordos,
respetivamente. Oito ácidos orgânicos e cinco ácidos gordos foram determinados pela
primeira vez, sendo o ácido malónico e o ácido α-linolénico os compostos principais de
cada classe. Este extrato não apresentou alcaloides na sua composição.
Para alargar o conhecimento do pólen de abelha de E. plantagineum foram
caracterizadas por HPLC-DAD duas frações do extrato metanólico adicificado, ricas em
flavonóis ou em antocianinas, cuja capacidade antioxidante foi avaliada em células Caco-
2 sob stress oxidativo induzido pelo terc-butil-hidroperóxido (t-BHP). O extrato inteiro foi
usado para comparação.
Na fração II e no extrato total foram identificados sete flavonóis e cinco antocianinas,
enquanto a fração I continha seis flavonóis (em concentração superior à da fração II) e
pequenas quantidades de petunidina-3-O-rutinósido. Da pré-exposição à fração I foi
possível observar uma tendência para proteger as células, enquanto a fração II e o
extrato total agravaram a toxicidade do t-BHP em algumas das concentrações testadas.
Os efeitos protetores pareceram estar correlacionados com os níveis de glutationa
total, não se tendo observado qualquer correlação entre a viabilidade celular e as
espécies reativas. Os extratos não demonstraram ter efeito significativo na atividade das
enzimas antioxidantes. Em geral, as antocianinas pareceram anular o potencial
antioxidante do extrato metanólico acidificado do E. plantagineum rico em flavonóis.
O pólen de abelha do E. plantagineum revelou ser interessante sob o ponto de vista
nutricional e farmacológico, devido à sua composição química e à atividade biológica dos
seus constituintes, principalmente dos seus compostos fenólicos. Este estudo contribui
para aumentar a possibilidade de comercialização deste produto natural, na forma de
granulado ou como um extrato.
Palavras–chave: Pólen de abelha de Echium plantagienum L; perfil metabólico;
inflamação; alergia; stress oxidativo.
GENERAL INDEX

General Index
XXIII
GENERAL INDEX
PUBLICATIONS VII
ACKNOWLEDGMENTS XI
ABSTRACT XV
RESUMO XIX
GENERAL INDEX XXIII
INDEX OF FIGURES XXXI
INDEX OF TABLES XXXV
ABBREVIATIONS AND SYMBOLS XXXIX
DISSERTATION OUTLINE 1
Chapter I – Introduction 3
1. Echium plantagineum Linnaeus 5
1.1. General considerations 5
1.2. Characteristics 5
1.2.1. Habitat 5
1.2.2. Stems and leaves 5
1.2.3. Flowers and fruit 6
1.3. Distribution of E. plantagineum in Portugal 8
2. Secondary metabolism 9
2.1. Alkaloids 9
2.1.1. Pyrrolizidine alkaloids 10
2.1.1.1. Biosynthetic pathway 11
2.1.1.1.1. Biosynthesis of necines 11
2.1.1.1.2. Biosynthesis of necic acids 12
2.1.1.2. Biological activities 12
2.1.1.3. Pyrrolizidine alkaloids in E. plantagineum 12
General Index
XXIV
2.2. Phenolic compounds 13
2.2.1. Flavonoids 15
2.2.2. Biosynthetic pathway 15
2.2.3. Extraction, separation and identification 19
2.2.4. Biological activities 21
2.2.5. Phenolic compounds in E. plantagineum 23
3. Primary metabolism 24
3.1. Organic acids 24
3.1.1. Bioynthetic pathway 25
3.1.2. Extraction, separation and identification 26
3.1.3. Biological activities 26
3.2. Fatty acids 27
3.2.1. Biosynthetic pathway 27
3.2.2. Extraction, separation and identification 28
3.2.3. Biological activities 29
3.2.4. Fatty acids in E. plantagineum 29
4. Inflammation 30
4.1. In vitro models 33
5. Allergy 34
5.1. In vitro models 38
6. Objectives 39
Chapter II – Experimental section 41
1. Standards and reagents 43
2. Plant material 44
3. Hydromethanol extract 44
3.1. Preparation 44
3.2. Alkaloid precipitation tests for alkaloid detection 45
3.3. HPLC-DAD analysis of phenolic compounds 45
3.4. HPLC-UV analysis of organic acids 45
General Index
XXV
3.5. GC-IT/MS analysis of fatty acids 46
3.5.1. Extract purification and derivatization 46
3.5.2. GC-IT/MS conditions 46
3.6. Reactive species scavenging assays in cell-free systems 47
3.6.1. Superoxide anion (O2-) 47
3.6.2. Nitric oxide (NO) 47
3.7. Antibacterial capacity 48
3.7.1. Microorganisms 48
3.7.2. Assay 49
3.8. Effect on inflammation 49
3.8.1. Cell culture conditions and treatments 49
3.8.2. MTT reduction assay 50
3.8.3. Lactate dehydrogenase (LDH) leakage 50
3.8.4. NO in RAW 264.7 cells culture medium 51
3.8.5. Determination of L-citrulline 51
3.8.6. Extraction of eicosanoids from macrophages and culture
medium 51
3.8.7. UPLC-QqQ-MS/MS analysis of eicosanoids 52
3.9. Effect on degranulation 52
3.9.1. Cell culture conditions and treatments 52
3.9.2. MTT reduction assay 53
3.9.3. Quantification of released β-hexosaminidase 53
3.9.4. β-Hexosaminidase inhibitory activity 54
3.9.5. Lipoxygenase inhibition assay 54
3.10. Statistical analysis 54
4. Acidified methanol extract and fractions 55
4.1. Preparation 55
4.2. Acid hydrolysis 55
4.3.HPLC-DAD analysis 56
4.3.1. Flavonoids 56

General Index
XXVI
4.3.2. Anthocyanins 56
4.4. Effect on cell oxidative stress 57
4.4.1. Cell culture conditions and treatments 57
4.4.2. MTT reduction assay 57
4.4.3. LDH leakage 57
4.4.4. Reactive species 58
4.4.5. Total glutathione 58
4.4.6. Antioxidant enzymes 58
4.4.6.1. Glutathione-S- transferase 59
4.4.6.2. Glutathione reductase 59
4.4.6.3. Glutathione peroxidase 59
4.4.6.4. Catalase 59
4.4.6.5. Superoxide dismutase 59
4.4.7. Protein quantification 60
4.5. Statistical analysis 60
Chapter III – Results and discussion 61
1. Hydromethanol extract 63
1.1. Chemical composition 63
1.1.1. Phenolic profile 63
1.1.2. Organic acids profile 64
1.1.3. Fatty acids profile 66
1.2. Biological effects 67
1.2.1. Reactive species scavenging in cell-free systems 67
1.2.2. Effect on inflammation 68
1.2.2.1. Effect on cell viability 69
1.2.2.2.NO and L-citrulline in culture medium 70
1.2.2.3. Effect on eicosanoids 71
1.2.3. Effect on degranulation 78
1.2.3.1. Effect on cell viability 79
General Index
XXVII
1.2.3.2. Effect on β-hexosaminidase release 80
1.2.3.3. Effect on soybean lipoxygenase activity 82
1.2.4. Antibacterial activity 82
2. Acidified methanol extract 84
2.1. Phenolic composition 84
2.1.1. Non-coloured phenolic profile 84
2.1.1.1. Qualitative analysis 84
2.1.1.2. Quantitative analysis 85
2.1. 2. Anthocyanins profile 86
2.1.2.1. Qualitative analysis 86
2.1.2.2. Quantitative analysis 87
2.2. Biological effects 87
2.2.1. Cell viability 88
2.2.2. Reactive species 90
2.2.3. Glutathione homeostasis 94
2.2.4. Antioxidant enzymes 95
Chapter IV – Conclusions 99
Chapter V – References 103


INDEX OF FIGURES

Index of Figures
XXXI
INDEX OF FIGURES
Figure 1. Several aspects of Echium plantagineum plant 7
Figure 2. Geographical distribution of E. plantagineum in Portugal 8
Figure 3. Major structural types of naturally occurring plant PAS 11
Figure 4. General structure of flavonoids 15
Figure 5. Shikimic acid pathway 17
Figure 6. Simplified synthesis of flavonoids tannins 18
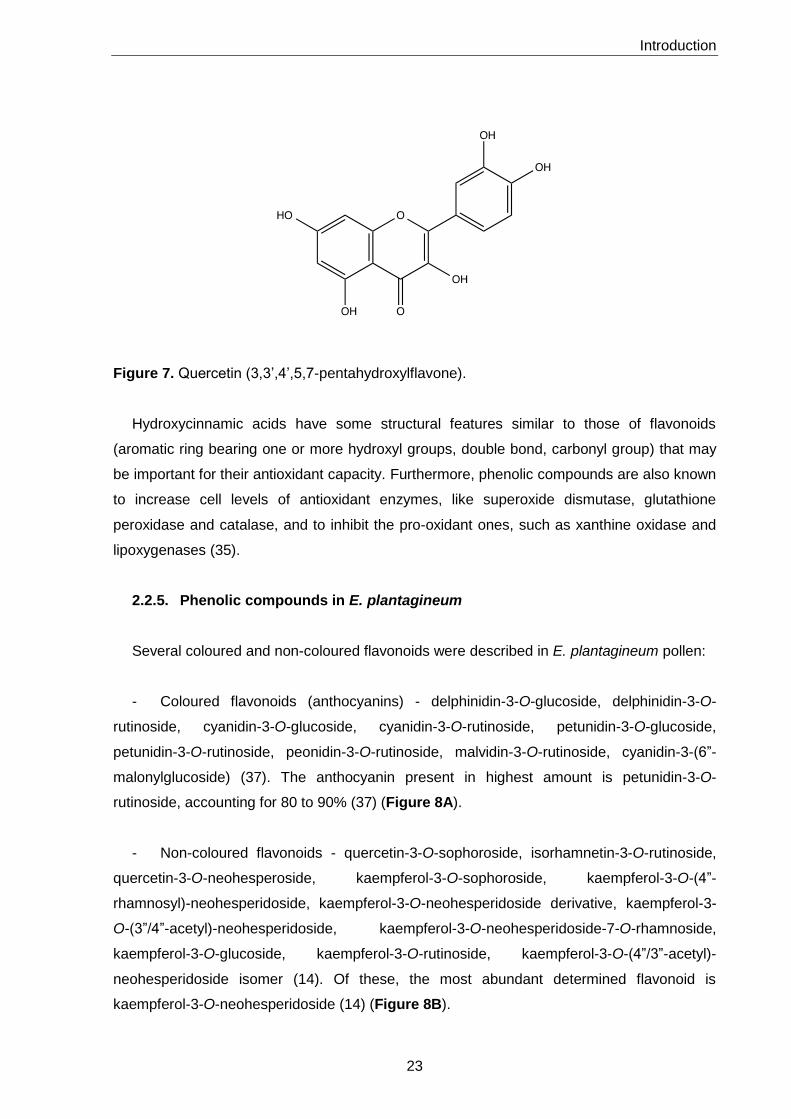
Figure 7. Quercetin (3,3’,4’,5,7-pentahydroxylflavone) 23
Figure 8. Chemical structures of petunidin-3-O-rutinoside and kaempferol-3-O-
neohesperidoside 24
Figure 9. Krebs cycle 25
Figure 10. Chemical structure of (A) linoleic acid and (B) α-linolenic acid 27
Figure 11. Metabolic pathway of ω-3 and ω-6 polyunsaturated fatty acids and
derived eicosanoids 28
Figure 12. Synthesis of eicosanoids through an oxidative pathway from arachidonic
acid 32
Figure 13. Type I allergic disease mechanism 35
Figure 14. Interplay between the allergen source, environmental cofactors, and cells
of the allergic immune response during exposure to pollen grains 37
Figure 15. HPLC-DAD chromatogram (350 nm) of phenolic compounds in
E. plantagineum bee pollen hydromethanolic extract and chemical structure of the
main compound, kaempferol-3-O-neohesperidoside 63
Figure 16. HPLC-UV organic acids profile of E. plantagineum hydromethanol extract 65
Figure 17. GC-IT/MS fatty acids profile of E.plantagineum pollen hydromethanol
extract 66
Figure 18. Effect of E. plantagineum pollen hydromethanol extract against
•NO and O2•- 68
Figure 19. Effect of E. plantagineum bee pollen extract in cell viability 69

Index of Figures
XXXII
Figure 20. Effect of E. plantagineum bee pollen extract pre-exposure in NO and L-
citrulline production by LPS-stimulated macrophages 70
Figure 21. Effect of E. plantagineum bee pollen extract pre-exposure in intracellular
eicosanoids levels of LPS-stimulated macrophages 72
Figure 22. Metabolic pathways of eicosanoids in LPS-stimulated macrophages pre-
exposed to E. plantagineum bee pollen extract 73
Figure 23. Effect of E. plantagineum bee pollen extract pre-exposure in eicosanoids
release of LPS-stimulated macrophages 75
Figure 24. Effect of E. plantagineum bee pollen extract in RBL-2H3 basophils viability
assessed by MTT reduction assay 79
Figure 25. Effect of E. plantagineum bee pollen extract in β-hexosaminidase release 80
Figure 26. HPLC-DAD chromatogram of E. plantagineum bee pollen 85
Figure 27. Viability of Caco-2 cells evaluated by LDH and MTT assays 88
Figure 28. Reactive species in Caco-2 exposed to 150 μM t-BHT after pre-treatment
with E. plantagineum bee pollen acidified methanol extract and fractions for 24h 93
Figure 29. Glutathione levels in Caco-2 cells treated with E.plantagineum bee pollen
acidified methanol extract and fractions for 24h 94
Figure 30. Effect of E. plantagineum bee pollen acidified methanol extract and
fractions in superoxide levels 97
INDEX OF TABLES


Index of Tables
XXXV
INDEX OF TABLES
Table 1. Precursor amino acids and origin of the main alkaloid heterocycles 10
Table 2. Classification of phenolics according to their chemical structures 14
Table 3. Phenolic compounds content in E. plantagineum bee pollen hydromethanol
extract 64
Table 4. Organic acids content of E. plantagineum bee pollen hydromethanol extract 65
Table 5. Fatty acid content of E. plantagineum bee hydromethanol pollen 67
Table 6. MIC and MLC values (mg mL-1 pollen) obtained with E. plantagineum bee
pollen hydromethanol extract against selected bacteria 83
Table 7. Non-coloured phenolic compounds in E. plantagineum bee pollen acidified
methanol extract and fractions (mg Kg -1 pollen) 86
Table 8. Coloured phenolic compounds from E. plantagineum bee pollen acidified
methanol extract and its fractions (mg Kg-1 pollen) 87


ABBREVIATIONS AND SYMBOLS


Abbreviations and Symbols
XXXIX
AA Arachidonic acid
ALA α-Linolenic acid
BSA Albumin from bovine serum
CoA Coenzyme A
COX Cyclooxygenase
CE Capillary electrophoresis
DAD Diode array
DCFH-DA 2′,7′-Dichlorofluorescein diacetate
dehydroPA 1,2-Dehydropyrrolizidine ester alkaloid
DGLA Dihomo-γ-linolenic acid
DMEM Dulbecco’s Modified Eagle Medium
DMSO Dimethyl sulfoxide
DPA Docosapentaenoic acid
DPBS Dulbecco’s Phosphate Buffered Saline
DTNB 5,5'-Dithiobis(2-nitrobenzoic acid)
DTT DL-Dithiothreitol
EO Echium oil
EBSS Earle’s Balanced Salt Solution
EPA Eicosapentaenoic acid
ESI Electrospray ionisation
FAME Fatty acid methyl esters
FBS Foetal bovine serum
FGT Flavonoid 3-O-glucosyltransferase
FLS Flavonol synthase
GC Gas chromatography
GC-MS Gas chromatography coupled with mass spectrometry
GLA γ-Linolenic acid
Abbreviations and Symbols
XL
HBS Hepes Buffered Saline
HETE Hydroxyeicosatetraenoic acid
HPETE Hydroperoxyeicosatetraenoic acid
HPLC High-performance liquid chromatography
HPLC-DAD-ESI/MSn High-performance liquid chromatography-diode array detection-electrospray ionisation/ multi-stage mass spectrometry
HS Homospermidine synthetase
IgE Immunoglobulin E
iNOS Inducible nitric oxide synthase
IPNI The International Plant Names Index
LOD Limit of detection
LOQ Limit of quantification
LOX Lipoxygenase
LPS Lipopolysaccharide
LT Leukotriene
LX Lipoxin
MHA Mueller Hinton agar
MHB Mueller Hinton broth
MIC Minimum inhibitory concentration
MLC Minimum lethal concentration
MS Mass spectrometry
MSTFA N-methyl-N-(trimethylsilyl)trifluoroacetamide
MTT (4,5-Dimethylthiazol-2-yl)-2,5-diphenyl tetrazolium bromide
NADH Nicotinamide adenine dinucleotide reduced form
NBT Nitroblue tetrazolium
•NO Nitric oxide radical
OA Oleic acid
O2- Superoxide anion radical
Abbreviations and Symbols
XLI
PA Pyrrolizidine alkaloid
PAL Phenylalanine ammonia-lyase
PALMs Pollen-associated lipid mediators
PANO Pyrrolizidine N-oxides
PBS Phosphate buffer saline
PG Prostaglandin
PLA2 Phospholipase A2
PMS Phenazine methosulfate
PUFA Polyunsaturated fatty acid
RP-C18 Reversed-phase C18 column
RP-HPLC Reversed-phase high-performance liquid chromatography
Rt Retention time
SDA Stearidonic acid
SNP Sodium nitroprusside
SPE Solid-phase extraction
tert-BHP tert-Butylhydroperoxide
THF Tetra-hydrofuran
TNB 5-thio-2-nitrobenzoic acid
TX Thromboxane
UPLC Ultra performance liquid chromatography
UPLC-QqQ-MS/MS Ultra performance liquid chromatography coupled with mass spectrometry
UV Ultraviolet

DISSERTATION OUTLINE

Dissertation Outline
1
DISSERTATION OUTLINE
The present dissertation is divided into five main sections:
Chapter I – Introduction
In chapter I a general overview on the thesis subject and objectives is included. A
review on the existing literature about the different topics approached in this dissertation is
provided. It affords a basis to understand the objectives and the obtained results.
Chapter II – Experimental section
This section provides detailed information about all the methods and techniques used
for the realization of all the works presented in this dissertation.
Chapter III – Results and discussion
This section is divided in two main parts. The first part is related with the studies
conducted with Echium plantagineum L. bee pollen hydromethanolic extract, namely the
evaluation of its anti-inflammatory and anti-allergic potentials. The second one concerns
to the study of the acidified methanol extract of the same matrix, relating its composition
and the protective effect against oxidative stress. All of the results are integrated and
discussed concerning their relevance, linking them to the existing scientific reports.
Chapter IV – Conclusions and perspectives
The main conclusions that can be taken from the developed work are summarized in
this section. In addition, some future perspectives are approached.
Chapter V – References
In this last section are listed all the bibliographic references used in this dissertation.


Chapter I
Introduction

Introduction
5
1. Echium plantagineum Linnaeus
1.1. General considerations
According to the “Taxonomic Nomenclature Checker Germplasm Resources
Information Network” (TNC-GRIN), the Echium genus comprises twenty-four species.
Other taxonomic databases, namely from the “International Association for Plant
Taxonomy” (IAPT), the “International Plant Names Index” (IPNI) and the “International
Global Plant Checklist” (IOPI) describe a long list of Echium species.
The Echium genus (Boraginaceae) contains two distinctive nodes: the predominantly
woody species of the macaronesian archipelago, and the herbaceous species that are
chiefly distributed in Europe and North Africa (1). Within the latter group, the main centres
of species diversity are the Iberian Peninsula, with about sixteen species, and North-West
Africa (particularly Morocco) presenting about twenty species (1).
In this dissertation Echium plantagineum L. was considered, which characteristics are
provided below.
1.2. Characteristics
1.2.1. Habitat
E. plantagineum is a widespread weed in warm-temperate regions. It is found mostly in
areas dominated by winter rainfalls and can flourish in a wide range of soils (2). Native
from western Mediterranean Basin, it extends into central Europe and locally naturalized
in northern Europe (1).
Since its introduction in Australia, E. plantagineum has spread to infest vast areas of
predominantly agricultural land in south-east and south-west Australia, where it can be the
dominant pasture species (3).
1.2.2. Stems and leaves
E. plantagineum is an annual herb, occasionally biennial, that grows to 1.5 m high, but
commonly 30 to 60 cm. It is an erect softly hairy species, with several flowering stems,
that reproduces by seed (1, 3). Young plants form rosettes with basal leaves that can be
up to 25 cm long, broadly ovate, petiolate, with prominent lateral veins. As it grows, it
produces several stems starting at the base of the plant, although it can occasionally be
Introduction
6
found to be single stemmed. The stems have stout white hairs. The stem leaves are
narrower and smaller, sessile and cordate at the base (2, 4).
1.2.3. Flowers and fruit
The inflorescence (Figure 1) is usually branched. The calyx is 7-10 mm at anthesis, up
to 15 mm in the fruit. The corolla is 18-30 mm, trumpet shaped, curled and purple, and
unrolls as the flowers open; it is hairy only on the veins and margins, usually with two or
less exserted stamens (2, 4). The flowers are sessile, each one consisting of five petals
that are 2-3 cm long and five stamens, two being longer than the others and projecting
significantly from the corolla. Its filaments are rather sparsely hairy and the pollen is bluish
(2). The fruit consists of four nutlets 2.5 x 2 mm, tuberculate, pale brownish-grey,
surrounded by persistent stiffly bristled calyx (2, 4).

Introduction
7
Figure 1. Several aspects of Echium plantagineum plant: A – Corolla with five stamens and one stigma, five petals; B – Stem with stout white hairs; C – Purple colour of the corolla, two stamens protruding, hence the common name “Purple Viper’s Bugloss”; D – Alternate flowers; E – Hairy leaf without petiole; F – Flowers in three stages of development; G – Pollen with the characteristic blue colour; H – Pollen´s microscopic analysis. (Photographs by Eduarda Moita, António Moita and Sérgio Moreira, Paredes de Coura, June 2011 and July 2014; different magnifications).
A B
C
D
A B
C D
E F
G H
Introduction
8
1.3. Distribution of E. plantagineum in Portugal
E. plantagineum has a general distribution in the country, except in Alentejo coast
(Serra do Cercal) and in Serra Algarvia (Serra de Monchique and Serra Espinhaço de
Cão). It concentrates mainly in Alto Alentejo (Évora region) (Figure 2). In Portugal it is
known as “Chupa-mel”, “Língua-de-vaca”, “Soagem” or “Soagem viperina”.
Figure 2. Geographical distribution of E. plantagineum in Portugal [data from (5)].
Introduction
9
The habitat includes cultivated and ruderal areas, the budding season occurring in
March-June. It is a therophyte and hemicryptophyte plant (4).
2. Secondary metabolism
Plants have the ability to synthesize an enormous variety of secondary metabolites,
since they need to respond to a continuously changing and often hostile environment, in
order to survive and reproduce (6).
Environmental factors, such as nutrient supply, temperature, light conditions or
atmospheric CO2 concentrations, can influence the levels of carbon-based secondary
metabolites in plant tissues and plant partitioning of carbohydrates and energy. As it is
generally known that secondary metabolism is linked to primary metabolism by the rates
at which the substrates are diverted from primary pathways and funnelled into secondary
biosynthetic routes, several environmental factors affecting growth, photosynthesis and
other parts of primary metabolism will also affect secondary metabolism (7).
2.1. Alkaloids
Alkaloids are one of the most diverse classes of secondary metabolites found in living
organisms, including a wide range of structures resulting from several biosynthetic
pathways and with an array of pharmacological activities. Evidence suggests that they
may serve specific biological functions. In some plants, the concentration of alkaloids
increases just prior to seed formation and then drops off when the seed is ripe, suggesting
that alkaloids may play a role in this process. Alkaloids may also protect some plants from
destruction by certain insect species (8).
Alkaloids are found in nature in the form of salts (citrates and malates), or combined
with tannins (8). In plants they are part of the cell wall (8). They are basic, nitrogenated
compounds, with nitrogen atom as part of a heterocyclic system, biosynthesis starting in
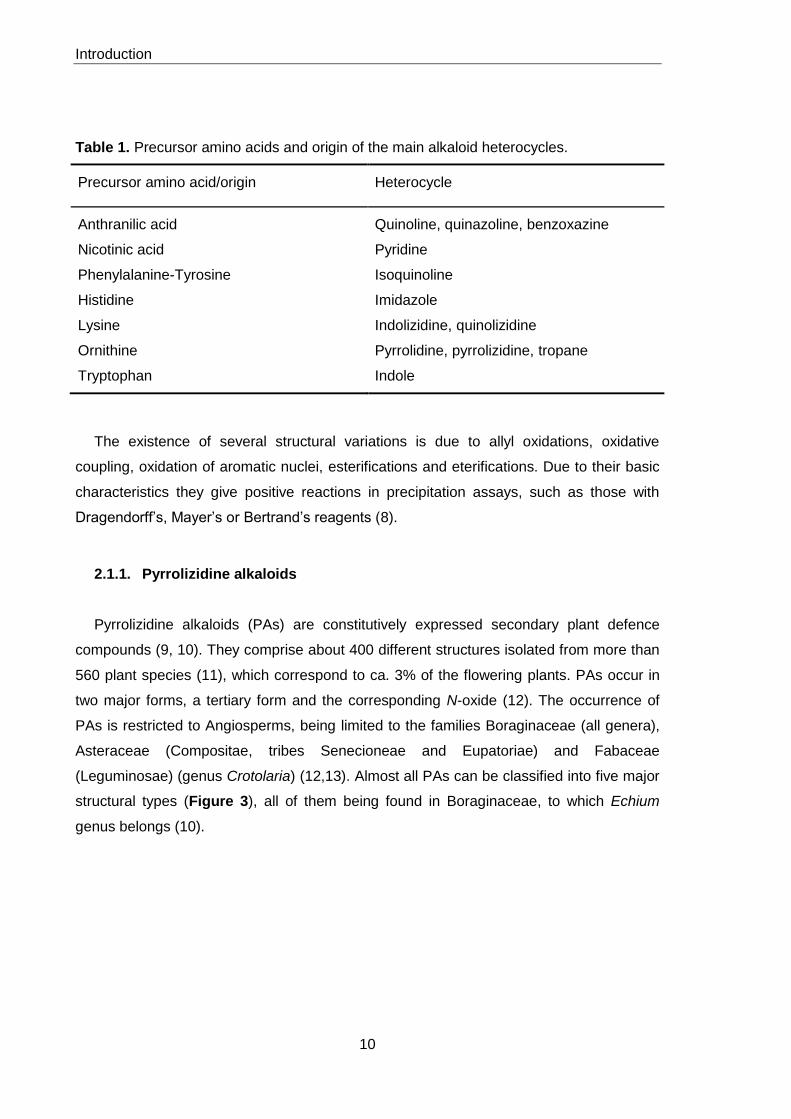
an amino acid. In Table 1 are indicated the amino acids that are precursors of alkaloids
and the characteristic nuclei they originate (8).
Introduction
10
Table 1. Precursor amino acids and origin of the main alkaloid heterocycles.
Precursor amino acid/origin Heterocycle
Anthranilic acid Quinoline, quinazoline, benzoxazine
Nicotinic acid Pyridine
Phenylalanine-Tyrosine Isoquinoline
Histidine Imidazole
Lysine Indolizidine, quinolizidine
Ornithine Pyrrolidine, pyrrolizidine, tropane
Tryptophan Indole
The existence of several structural variations is due to allyl oxidations, oxidative
coupling, oxidation of aromatic nuclei, esterifications and eterifications. Due to their basic
characteristics they give positive reactions in precipitation assays, such as those with
Dragendorff’s, Mayer’s or Bertrand’s reagents (8).
2.1.1. Pyrrolizidine alkaloids
Pyrrolizidine alkaloids (PAs) are constitutively expressed secondary plant defence
compounds (9, 10). They comprise about 400 different structures isolated from more than
560 plant species (11), which correspond to ca. 3% of the flowering plants. PAs occur in
two major forms, a tertiary form and the corresponding N-oxide (12). The occurrence of
PAs is restricted to Angiosperms, being limited to the families Boraginaceae (all genera),
Asteraceae (Compositae, tribes Senecioneae and Eupatoriae) and Fabaceae
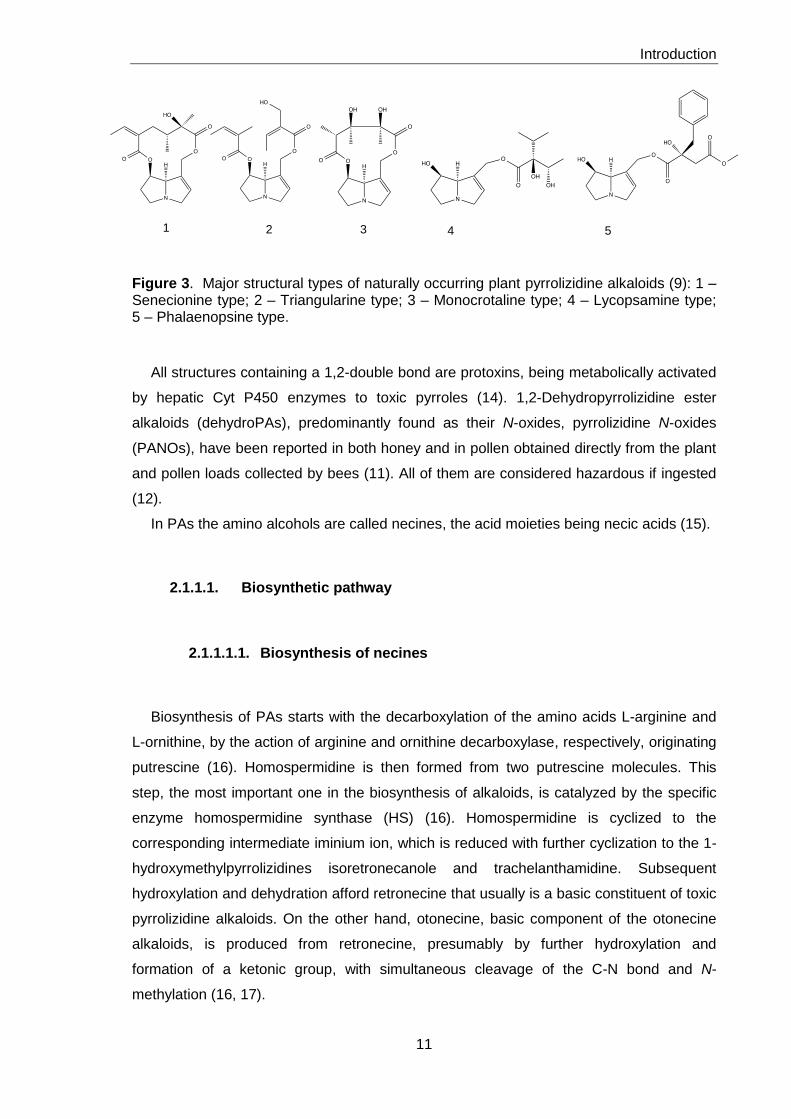
(Leguminosae) (genus Crotolaria) (12,13). Almost all PAs can be classified into five major
structural types (Figure 3), all of them being found in Boraginaceae, to which Echium
genus belongs (10).
Introduction
11
Figure 3. Major structural types of naturally occurring plant pyrrolizidine alkaloids (9): 1 – Senecionine type; 2 – Triangularine type; 3 – Monocrotaline type; 4 – Lycopsamine type; 5 – Phalaenopsine type.
All structures containing a 1,2-double bond are protoxins, being metabolically activated
by hepatic Cyt P450 enzymes to toxic pyrroles (14). 1,2-Dehydropyrrolizidine ester
alkaloids (dehydroPAs), predominantly found as their N-oxides, pyrrolizidine N-oxides
(PANOs), have been reported in both honey and in pollen obtained directly from the plant
and pollen loads collected by bees (11). All of them are considered hazardous if ingested
(12).
In PAs the amino alcohols are called necines, the acid moieties being necic acids (15).
2.1.1.1. Biosynthetic pathway
2.1.1.1.1. Biosynthesis of necines
Biosynthesis of PAs starts with the decarboxylation of the amino acids L-arginine and
L-ornithine, by the action of arginine and ornithine decarboxylase, respectively, originating
putrescine (16). Homospermidine is then formed from two putrescine molecules. This
step, the most important one in the biosynthesis of alkaloids, is catalyzed by the specific
enzyme homospermidine synthase (HS) (16). Homospermidine is cyclized to the
corresponding intermediate iminium ion, which is reduced with further cyclization to the 1-
hydroxymethylpyrrolizidines isoretronecanole and trachelanthamidine. Subsequent
hydroxylation and dehydration afford retronecine that usually is a basic constituent of toxic
pyrrolizidine alkaloids. On the other hand, otonecine, basic component of the otonecine
alkaloids, is produced from retronecine, presumably by further hydroxylation and
formation of a ketonic group, with simultaneous cleavage of the C-N bond and N-
methylation (16, 17).
1 5 4 3 2
Introduction
12
2.1.1.1.2. Biosynthesis of necic acids
Necic acids are mainly composed by L-valine, L-leucine, L-isoleucine and the
secondary product of the latter, L-threonine. In contrast with the necine biosynthesis, the
synthesis of necic acids follows different routes. Monocarboxylic acids with five carbon
atoms, such as angelic, tiglic and sarracinic acid, are generated in the threonine
metabolism. Threonine can interact with pyruvate to yield isoleucine, which may be
involved in the formation of necic acids. Isoleucine can be degraded to propionyl-Co A
and acetyl-Co A via tiglyl-CoA (16).
Valine is converted into senecioic, viridifloric and trachelanthic acid by reaction with
activated acetaldehyde. The formation of the ten-carbon atoms-containing dicarboxylic
acids is only effected by subsequent cyclization of the open-chain necine monocarboxylic
acid diesters. Thus, senecionine is produced from diangeloylretronecine, in a reaction
similar to the Michael’s addition proceeding via cationic intermediates (16, 17).
The different metabolic pathways enable a great variability of necic acids. Biosynthesis
of dicarboxylic acids takes place in the roots where the alkaloids occur as N-oxides. Being
available in easily water-soluble form, they are transported to the aerial parts of the plant
and stored in vacuoles (18, 19).
2.1.1.2. Biological activities
Pyrrolizidine alkaloids have various interesting biological actions, like antimicrobial
activity. Pharmacological and biological effects, e.g., spasmolytic, anti-histaminic, anti-HIV
and glucosidase inhibition, have been attributed to some saturated PAs (17). Alkaloid
producing species are highly protected from herbivores. They have been referred to as
defence agents against both vertebrate and invertebrate predators, as they are reported
to be distasteful to them (17).
2.1.1.3. Pyrrolizidine alkaloids in E. plantagineum
Several pyrrolizidine alkaloids N-oxides have been described in E. plantagineum:
lepanthine, echimiplatine, 7-O-acetyllycopsamine, 7-O-acetylintermedine, echimidine, 3’-
O-acetylechimidine, echiumine and 3’-O-acetylechiumine (20).
Introduction
13
2.2. Phenolic compounds
Phenolics represent the most abundant and widely spread class of plant secondary
metabolites, comprising a large range of structures (from simple phenolic acids to
polymeric molecules with high molecular mass, like condensed or hydrolizable tannins)
and functions. They can be classified into water-soluble compounds (phenolic acids,
flavonoids and quinones) and water-insoluble compounds (condensed tannins, lignans
and cell-wall bound hydroxycinnamic acids) (21, 22). These compounds are synthesized
during normal development of the plant and play important functions, including support of
the plant body, protection against biotic and abiotic stresses, herbivore deterrence and
signalling in plant-plant and plant microbe interactions (21, 22).
Phenolic compounds are thought to be the active ingredients in many dietary plants
and traditional medicines used for the treatment of disorders related to oxidative stress
and inflammation (22). There is increasing evidence that phenolic compounds present in
natural foods may reduce the risk of chronic diseases, such as cancer, inflammation,
cardiovascular and neurodegenerative disorders (22). Therefore, there is a growing
interest in phenolic compounds of fruits and vegetables, which may promote human
health or lower the risk of disease (23).
Phenolic compounds can be classified into distinct families according to their basic
molecular structure. Particular emphasis is given here to flavonoids, as the phenolic
compounds previously found in E. plantagineum belong to this class (Table 2) (14, 22).
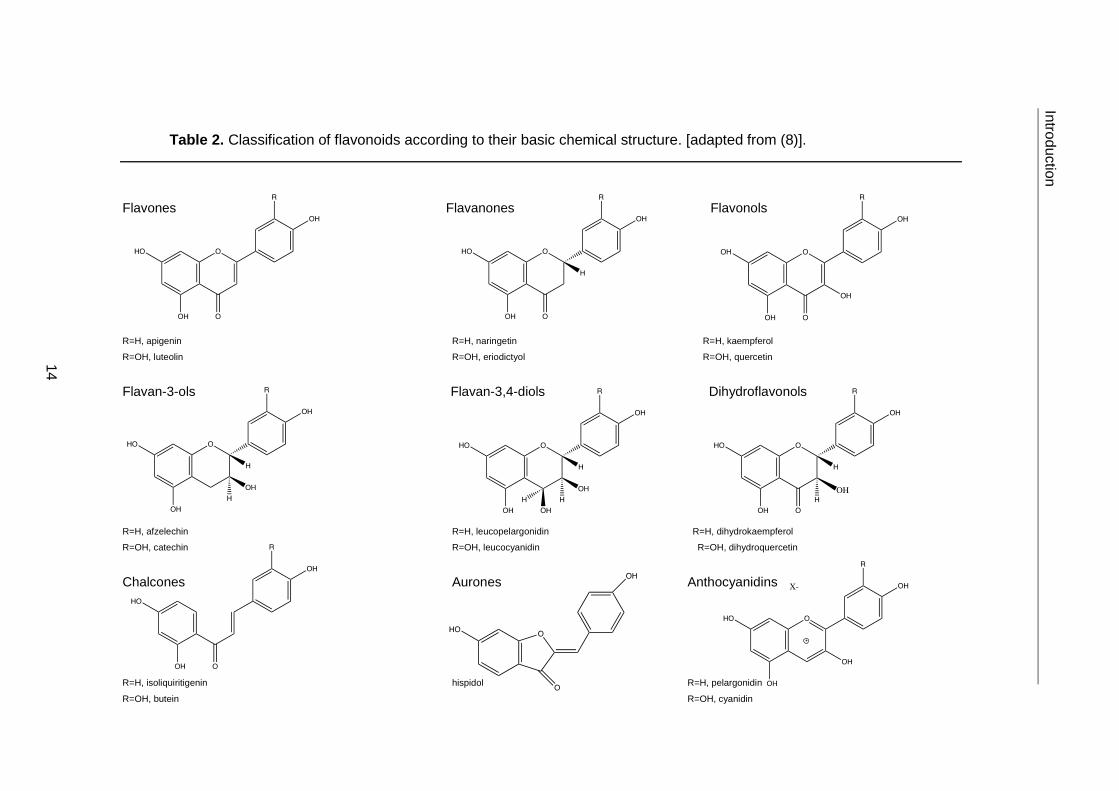
Table 2. Classification of flavonoids according to their basic chemical structure. [adapted from (8)].
Flavones Flavanones Flavonols
R=H, apigenin R=H, naringetin R=H, kaempferol
R=OH, luteolin R=OH, eriodictyol R=OH, quercetin
Flavan-3-ols Flavan-3,4-diols Dihydroflavonols
R=H, afzelechin R=H, leucopelargonidin R=H, dihydrokaempferol
R=OH, catechin R=OH, leucocyanidin R=OH, dihydroquercetin
Chalcones Aurones Anthocyanidins
R=H, isoliquiritigenin hispidol R=H, pelargonidin
R=OH, butein R=OH, cyanidin
14
Intro
du
ctio
n
Introduction
15
A
B
C
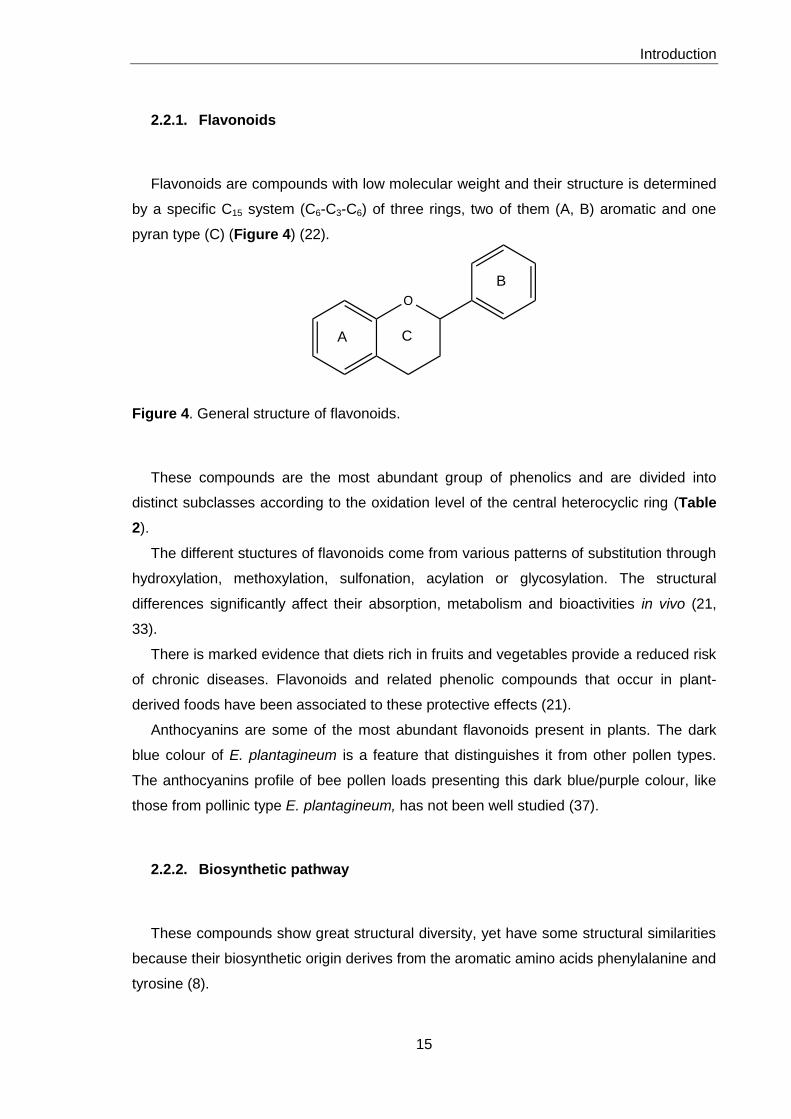
2.2.1. Flavonoids
Flavonoids are compounds with low molecular weight and their structure is determined
by a specific C15 system (C6-C3-C6) of three rings, two of them (A, B) aromatic and one
pyran type (C) (Figure 4) (22).
Figure 4. General structure of flavonoids.
These compounds are the most abundant group of phenolics and are divided into
distinct subclasses according to the oxidation level of the central heterocyclic ring (Table
2).
The different stuctures of flavonoids come from various patterns of substitution through
hydroxylation, methoxylation, sulfonation, acylation or glycosylation. The structural
differences significantly affect their absorption, metabolism and bioactivities in vivo (21,
33).
There is marked evidence that diets rich in fruits and vegetables provide a reduced risk
of chronic diseases. Flavonoids and related phenolic compounds that occur in plant-
derived foods have been associated to these protective effects (21).
Anthocyanins are some of the most abundant flavonoids present in plants. The dark
blue colour of E. plantagineum is a feature that distinguishes it from other pollen types.
The anthocyanins profile of bee pollen loads presenting this dark blue/purple colour, like
those from pollinic type E. plantagineum, has not been well studied (37).
2.2.2. Biosynthetic pathway
These compounds show great structural diversity, yet have some structural similarities
because their biosynthetic origin derives from the aromatic amino acids phenylalanine and
tyrosine (8).
Introduction
16
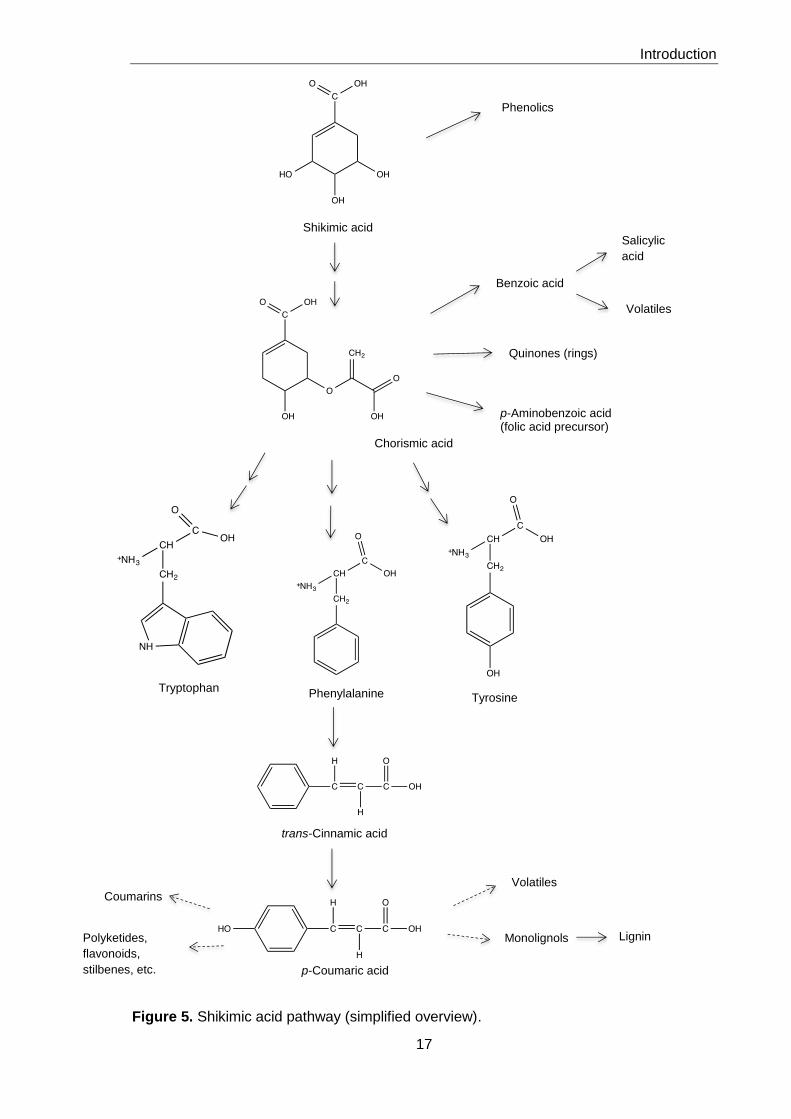
The synthesis of aromatic compounds starts in plastids with the shikimic acid pathway
and results in the production of three aromatic amino acids, tyrosine, phenylalanine and
tryptophan (Figures 5 and 6). L-Phenylalanine occupies a key position as the precursor of
the phenylpropanoid pathway. The cytoplasmic enzyme phenylalanine ammonia-lyase
(PAL) removes the amino group from phenylalanine and yields trans-cinnamic acid, which
is a substrate for a Cyt P450 monoxygenase. The product is p-coumaric acid, which can
be further modified, usually by esterification with coenzyme A. The resulting pool of
coumaroyl-CoA in the cytoplasm is the source of the synthesis of primary products,
monolignols and lignin, and of a large number of natural products, the vital flavonoids and
their derivatives and defensive compounds, such as coumarins (8).
Introduction
17
Figure 5. Shikimic acid pathway (simplified overview).
Shikimic acid
Tryptophan Phenylalanine Tyrosine
trans-Cinnamic acid
p-Coumaric acid
Phenolics
Benzoic acid
Quinones (rings)
p-Aminobenzoic acid (folic acid precursor)
Salicylic
acid
Volatiles
Coumarins
Volatiles
Polyketides,
flavonoids,
stilbenes, etc.
Monolignols Lignin
Chorismic acid

Figure 6. Simplified synthesis of flavonoids and tannins.
Flavones
Chalcones
Flavanones
Dihydroflavonols
Isoflavones
Flavonols
Anthocyanins
s
Tannins
18
Intro
du
ctio
n
Introduction
19
2.2.3. Extraction, separation and identification
The most important steps for the analysis of phenolic compounds are sample preparation
and extraction, followed by identification and quantification using spectrophotometry, gas
chromatography (GC), high performance liquid chromatography (HPLC) or capillary
electrophoresis (CE) methods (25).
The most common techniques to extract phenolic compounds employ solvents, either
organic or inorganic. There are several parameters that may influence the yield of phenolics,
including extraction time, temperature, solvent-to-sample ratio, the number of repeated
extractions of the sample, as well as the solvent type. Besides, the optimum recovery of
phenolics is different from one sample to another and relies on the type of plant and its active
compounds. The choice of the extraction solvent, such as water, acetone, ethyl acetate,
alcohols (methanol, ethanol and propanol), as well as of its mixtures, will influence the yield
of phenolics extracted (25).
The association with ultrasounds enhances the process, with consequent reduction of the
extraction time. Ultrasounds cause disruption of cell walls, reduction of particle size and
enhancement of the mass transfer of cell contents to the solvent, by the collapse of the
bubbles produced by cavitation, which leads to membrane’s destruction (26, 27).
One of the disadvantages of solvent extraction is the co-extraction of other compounds,
such as chlorophylls, peptides, proteins, sugars and organic acids, among others. To bias
these interferences, different techniques can be performed, the use of C18 Sep-Pak
cartridges being the most common (28).
Increasing time and temperature promote analyte solubility; however, plant phenolics are
generally degraded or undergo undesirable reactions, like enzymatic oxidation by extended
extraction times and high temperatures (25).
The increase of solvent-to-sample ratio enhances phenolic extraction from plant samples,
but determining the optimum ratio is advisable, so that the solvent input and saturation
effects of solvent by phenolics are minimized (25).
Sample matrix and particle size also strongly influence phenolics extraction from plant
materials. Phenolic compounds may bind to other sample elements, such as carbohydrates
Introduction
20
and proteins. These linkages can be hydrolysed by addition of enzymes, thereby promoting
the release of bounded phenolics. Acidic and alkaline hydrolysis is also used in the isolation
of phenolics from plants and plant products and is important for the stability of these
compounds in the extract (25).
The purification stage includes removing interfering compounds from the crude extract,
with partionable solvents and using open column chromatography or an adsorption-
desorption process. Sephadex LH-20, polyamide, Amberlite, solid phase extraction (SPE)
cartridges and styrene-divinylbenzene (XAD 4, XAD16, EXA-90, EXA 118, SP70), acrylic
resins (XAD-7, EXA-31) are examples of regularly applied materials to purify phenolics from
crude sample extracts. However, in most studies, SPE is used for purification and partial
concentration prior to separation using HPLC (25).
Several techniques are used for the analysis of phenolics, namely thin-layer
chromatography, gas chromatography, capillary electrophoresis, high-speed counter current
chromatography, supercritical fluid chromatography, among others, reversed-phase HPLC
being the preferred one for separation and quantification of phenolic compounds from plant-
food material (25).
Various factors affect HPLC analysis of phenolics: sample purification, mobile phase,
column type and detector (24). As referred below, HPLC equipment, provided with a
reversed-phase C18 (RP-C18) column and diode array detector (DAD), and polar acidified
organic solvents are most used to analyse purified phenolics. Usually, HPLC sensitivity and
detection is based on purification of phenolic compounds and pre-concentration from
complex matrices of crude plant extracts. The retention time of phenolic compounds is higher
for substances that are less polar (flavonoids), while polar molecules (phenolic acids) are
eluted more easily. However, if the compound contains apolar substituents, such as
methoxyl groups, retention time increases; if it includes sugars or quinic acid residues it
tends to elute before the corresponding free compound. So, retention time can be used as an
indicator of polarity, allowing predicting the class of metabolite according to the
chromatographic behavior (25).
The main eluents used in the HPLC analysis of phenolics are acetonitrile and methanol, or
their aqueous mixtures. In some cases, ethanol, tetrahydrofuran (THF) and 2-propanol have
been used. To avoid the ionization of phenolic and carboxylic groups during identification, it
is necessary to maintain the pH of the mobile phase between 2 and 4, which will improve

Introduction
21
both retention time and resolution. Therefore, aqueous acidified mobile phases
predominantly contain acetic acid, but formic and phosphoric acids or phosphate, citrate and
ammonium acetate buffers at low pH have also been used (25).
A gradient elution system is more commonly applied than an isocratic one (28), due to the
chemical complexity and similarity of phenolic compounds.
The selection of the appropriate column is another critical factor in identifying phenolics.
Based on the polarity, different classes of phenolics can be detected using silica-bonded C18
or RP-C18 column, 10-30 cm in length, 3.9-4.6 mm internal diameter and 3-10 μm particle
size. Most HPLC analyses of phenolic compounds are carried out at room temperature.
HPLC running time is the other factor that influences the detection of phenolics and can
range from 10 to 150 minutes (25).
Phenolic compounds are frequently detected using UV-Vis and DAD detectors, at
wavelengths ranging from 190 to 600 nm. DAD has the great advantage of supplying a wide
range of information from a single run, as each class has a characteristic UV-Vis spectrum
(27). Moreover, it gives the possibility to determine the correct wavelength to quantify the
compounds and evaluate peak purity (30). Other methods also used are fluorimetric,
colorimetric arrays, DAD coupled with fluorescence and chemical reaction-detection
techniques (25).
HPLC coupled with mass spectrometry (MS) detector is highly sensitive and is able to
achieve high specificity due to the mass selectivity of detection. Although UV-Vis information
is a very important analytical tool, it may not be sufficient for the complete characterization of
a complex mixture (25). Electrospray ionisation (ESI) is the method better suited to couple
HPLC with MS (31) when the purpose is to analyse thermally unstable compounds with
higher molecular weights and polarity. As this technique has a good sensitivity for flavonoids
glycosides present in plant extracts, it is one of the most widely used (28).
2.2.4. Biological activities
The growing interest in phenolic compounds, especially flavonoids, is mainly due to their
antioxidant potential and the association between their consumption in fruits and vegetables
and the prevention of some diseases, mainly those associated to oxidative stress, like
degenerative ones (cancer, multiple sclerosis, autoimmune, Alzheimer’s and Parkinson’s
diseases) (30, 36). Active oxygen free radicals are involved in oxidative stress, being
Introduction
22
implicated as causative agents in the conditions metioned above (36). These species can be
produced both by normal metabolism and by external influences, like UV light and
carcinogens. When produced in quantities that overload the body’s natural antioxidant and
repair defence system, they can bring about breakdown of vital components, such as
coenzymes, neurotransmitters and macromolecules (e.g., nucleic acids, proteins, lipids and
carbohydrates) (36). Living cells have a limited capacity to nullify the activity of these
oxidative free radicals. The regular intake of phenolic compounds can improve the protection
of vital cellular components and, thus, their physiological function, bringing health benefits to
the individual (36).
The antioxidant properties of phenolic compounds depend on the chemical structure,
nucleus rearrangement and the presence of functional groups (32, 33). Phenolic compounds
have an aromatic ring bearing one or more hydroxyl groups and their structure may vary from
that of a simple phenoIic molecule to that of a complex high molecular mass polymer. In the
presence of free radicals phenolics have the capacity to stabilize the unpaired electron, by
donating a hydrogen atom of their hydroxyl groups, and stabilize the phenoxyl radical so
formed, converting it into an innocuous molecule (30, 32).
Quercetin (3,3’,4’,5,7-pentahydroxylflavone) is a flavonol-type flavonoid ubiquitously
present in vegetables (Figure 7). This compound has high antioxidant capacity, directly
scavenging reactive oxygen species (ROS) or effectively inhibiting ROS-generating enzymes
(e.g. xanthine oxidase, lipoxygenase) (34). This is mainly due to the presence of the two
hydroxyl groups in ring B. In addition, the presence of a 3-OH group increases the
antioxidant activity, since it turns planar the conformation of ring B, allowing conjugation to
occur and an electronic stability displacement reaction (32). Also, the double bond between
C2 and C3 influences electronic displacements and maintains the planar conformation. This
explains why flavonols and flavan-3-ols are generally the classes of flavonoids with stronger
antioxidant activity (32).
Introduction
23
Figure 7. Quercetin (3,3’,4’,5,7-pentahydroxylflavone).
Hydroxycinnamic acids have some structural features similar to those of flavonoids
(aromatic ring bearing one or more hydroxyl groups, double bond, carbonyl group) that may
be important for their antioxidant capacity. Furthermore, phenolic compounds are also known
to increase cell levels of antioxidant enzymes, like superoxide dismutase, glutathione
peroxidase and catalase, and to inhibit the pro-oxidant ones, such as xanthine oxidase and
lipoxygenases (35).
2.2.5. Phenolic compounds in E. plantagineum
Several coloured and non-coloured flavonoids were described in E. plantagineum pollen:
- Coloured flavonoids (anthocyanins) - delphinidin-3-O-glucoside, delphinidin-3-O-
rutinoside, cyanidin-3-O-glucoside, cyanidin-3-O-rutinoside, petunidin-3-O-glucoside,
petunidin-3-O-rutinoside, peonidin-3-O-rutinoside, malvidin-3-O-rutinoside, cyanidin-3-(6”-
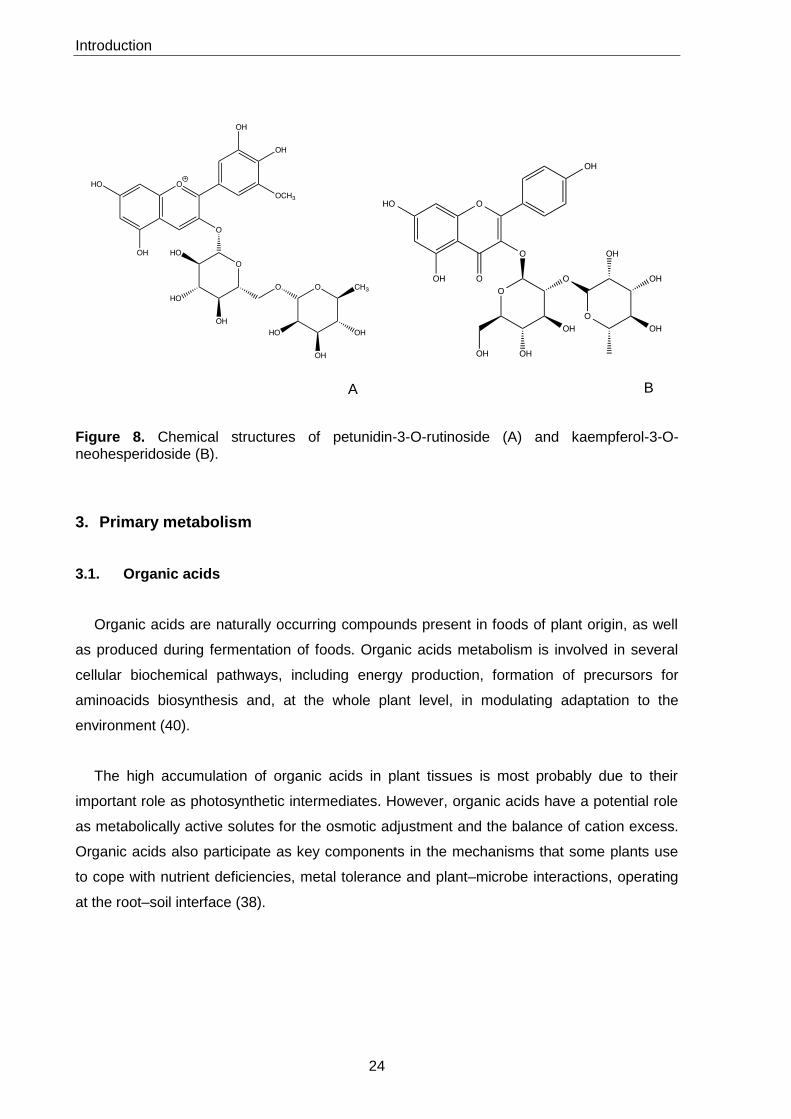
malonylglucoside) (37). The anthocyanin present in highest amount is petunidin-3-O-
rutinoside, accounting for 80 to 90% (37) (Figure 8A).
- Non-coloured flavonoids - quercetin-3-O-sophoroside, isorhamnetin-3-O-rutinoside,
quercetin-3-O-neohesperoside, kaempferol-3-O-sophoroside, kaempferol-3-O-(4”-
rhamnosyl)-neohesperidoside, kaempferol-3-O-neohesperidoside derivative, kaempferol-3-
O-(3”/4”-acetyl)-neohesperidoside, kaempferol-3-O-neohesperidoside-7-O-rhamnoside,
kaempferol-3-O-glucoside, kaempferol-3-O-rutinoside, kaempferol-3-O-(4”/3”-acetyl)-
neohesperidoside isomer (14). Of these, the most abundant determined flavonoid is
kaempferol-3-O-neohesperidoside (14) (Figure 8B).
Introduction
24
B A
Figure 8. Chemical structures of petunidin-3-O-rutinoside (A) and kaempferol-3-O- neohesperidoside (B).
3. Primary metabolism
3.1. Organic acids
Organic acids are naturally occurring compounds present in foods of plant origin, as well
as produced during fermentation of foods. Organic acids metabolism is involved in several
cellular biochemical pathways, including energy production, formation of precursors for
aminoacids biosynthesis and, at the whole plant level, in modulating adaptation to the
environment (40).
The high accumulation of organic acids in plant tissues is most probably due to their
important role as photosynthetic intermediates. However, organic acids have a potential role
as metabolically active solutes for the osmotic adjustment and the balance of cation excess.
Organic acids also participate as key components in the mechanisms that some plants use
to cope with nutrient deficiencies, metal tolerance and plant–microbe interactions, operating
at the root–soil interface (38).
Introduction
25
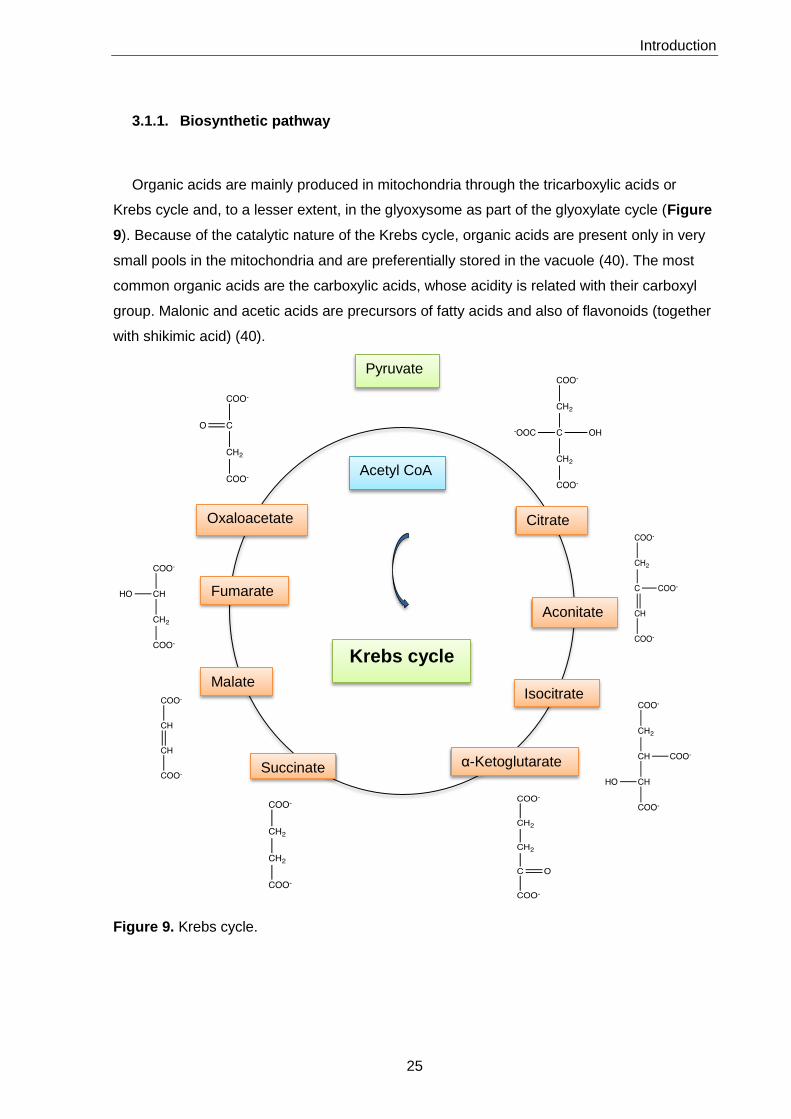
3.1.1. Biosynthetic pathway
Organic acids are mainly produced in mitochondria through the tricarboxylic acids or
Krebs cycle and, to a lesser extent, in the glyoxysome as part of the glyoxylate cycle (Figure
9). Because of the catalytic nature of the Krebs cycle, organic acids are present only in very
small pools in the mitochondria and are preferentially stored in the vacuole (40). The most
common organic acids are the carboxylic acids, whose acidity is related with their carboxyl
group. Malonic and acetic acids are precursors of fatty acids and also of flavonoids (together
with shikimic acid) (40).
Figure 9. Krebs cycle.
Citrate
Aconitate
Isocitrate
α-Ketoglutarate Succinate
Fumarate
Malate
Oxaloacetate
Acetyl CoA
Pyruvate
Krebs cycle
Introduction
26
3.1.2. Extraction, separation and identification
Organic acids are soluble in water and hydroalcoholic solvent mixtures. The extraction of
organic acids is increased when the solvent is acidified and further purification of the extracts
is achieved using SPE (41, 42).
HPLC is a particularly useful method to separate polar or moderately polar compounds,
such as organic acids (43). An ion exclusion column, consisting on an ion-exchange resin,
splits ionised and neutral species. While ionised compounds are rejected by the resin and
eluted through the column, the neutral and slightly ionised ones are retained. This allows
proper separation of acid molecules from highly ionised compounds (44). Elution can be
isocratic or in gradient mode, the first being more used for the determination of organic
compounds (45, 46).
The detection of organic acids can be achieved by several techniques, such as UV, MS
and fluorescence (43). The most commonly used is UV, in which case external standards for
compounds’ identification and quantification are necessary (41).
3.1.3. Biological activities
Organic acids have long been utilized as food additives and preservatives for preventing
food deterioration and extending the shelf-life of perishable food ingredients (38). Although
the mechanisms of organic acids antibacterial effect are not fully understood, they are
capable of exhibiting bacteriostatic and bactericidal properties, depending on the
physiological status of the organism and the physiochemical characteristics of the external
environment. Given the weak acid nature of most of these compounds, pH is considered a
primary determinant of effectiveness, because it affects the concentration of undissociated
acid form. It has been traditionally assumed that undissociated forms of organic acids can
easily penetrate the lipid membrane of the bacterial cell and once internalized into the neutral
pH of the cell cytoplasm dissociate into anions and protons (38, 39). The generation of these
species potentially presents problems for bacteria that must maintain a neutral cytoplasm to
sustain macromolecules. The exportation of excess of protons requires consumption of
cellular adenosine triphosphate (ATP) and may result in depletion of cellular energy (38, 39).
Other toxicity mechanisms have been proposed for organic acids, like membrane disruption,
inhibition of essential metabolic reactions, stress on intracellular pH homeostasis and the
accumulation of toxic anions (39, 47, 48).
Introduction
27
A B
They can be interesting to prevent several diseases like cancer and atherosclerosis (47).
At industrial level they can be used as flavourings, preservatives and antioxidants. The
utilization of organic acids is expected to increase because of the increasing demand for
organic foods (48).
3.2. Fatty acids
Fatty acids can be represented by the general formula RCOOH, in which R corresponds
to an alkyl chain. Long-chain fatty acids with an even number of carbon atoms are important
for human nutrition and metabolism (12 to 26). These metabolites can be classified
according to the degree of saturation. Saturated fatty acids contain a flexible alkyl chain,
without any double bond between carbon atoms; the monounsaturated have a double bond
and the polyunsaturated have at least two of those bindings. There are cis or trans isomers
(48).
As the fatty acid carboxylic group has a pKa near 4.8, these molecules are found in body
fluids in the ionized form. Humans are able to synthesize the majority of the fatty acids,
including saturated, monounsaturated and some polyunsaturated ones. However, linoleic
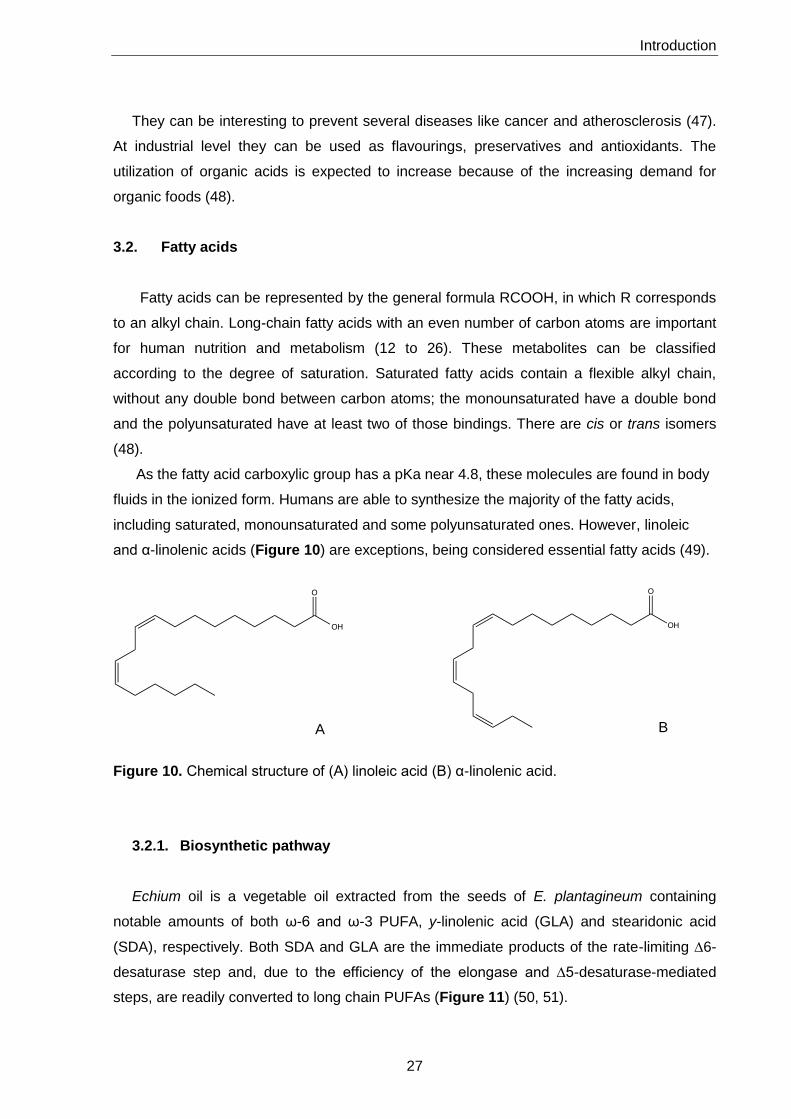
and α-linolenic acids (Figure 10) are exceptions, being considered essential fatty acids (49).
Figure 10. Chemical structure of (A) linoleic acid (B) α-linolenic acid.
3.2.1. Biosynthetic pathway
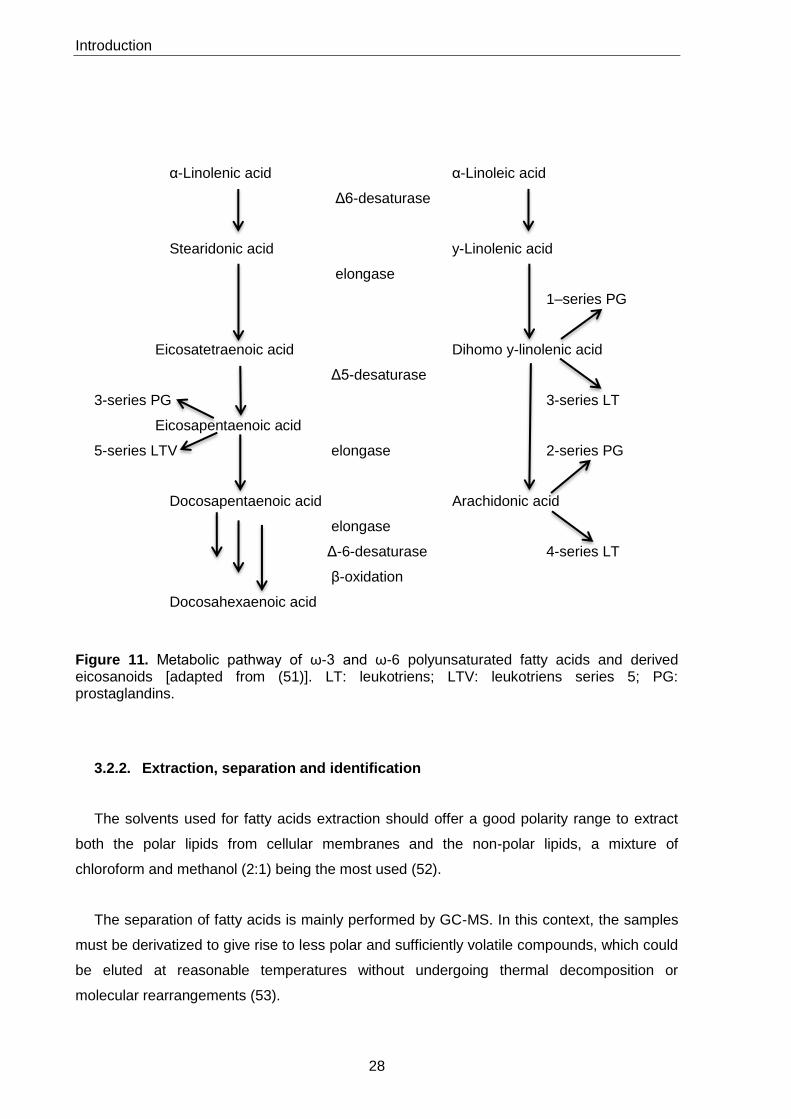
Echium oil is a vegetable oil extracted from the seeds of E. plantagineum containing
notable amounts of both ω-6 and ω-3 PUFA, y-linolenic acid (GLA) and stearidonic acid
(SDA), respectively. Both SDA and GLA are the immediate products of the rate-limiting ∆6-
desaturase step and, due to the efficiency of the elongase and ∆5-desaturase-mediated
steps, are readily converted to long chain PUFAs (Figure 11) (50, 51).
Introduction
28
α-Linolenic acid α-Linoleic acid
Δ6-desaturase
Stearidonic acid y-Linolenic acid
elongase
1–series PG
Eicosatetraenoic acid Dihomo y-linolenic acid
Δ5-desaturase
3-series PG 3-series LT
Eicosapentaenoic acid
5-series LTV elongase 2-series PG
Docosapentaenoic acid Arachidonic acid
elongase
Δ-6-desaturase 4-series LT
β-oxidation
Docosahexaenoic acid
Figure 11. Metabolic pathway of ω-3 and ω-6 polyunsaturated fatty acids and derived eicosanoids [adapted from (51)]. LT: leukotriens; LTV: leukotriens series 5; PG: prostaglandins.
3.2.2. Extraction, separation and identification
The solvents used for fatty acids extraction should offer a good polarity range to extract
both the polar lipids from cellular membranes and the non-polar lipids, a mixture of
chloroform and methanol (2:1) being the most used (52).
The separation of fatty acids is mainly performed by GC-MS. In this context, the samples
must be derivatized to give rise to less polar and sufficiently volatile compounds, which could
be eluted at reasonable temperatures without undergoing thermal decomposition or
molecular rearrangements (53).

Introduction
29
Different methods, like esterification, silylation and acetylation, can be used for
derivatization. Esterification is the most commonly used and can be done with an appropriate
alcohol, such as methanol, and an inorganic acid to catalyse the reaction. Boron trifluoride or
boron trichloride are very useful for forming ester derivatives, the reactions catalysed by the
first being faster (53).
3.2.3. Biological activities
Lipids are an important component of the diet. There is a growing awareness that diet in
general, and lipids in particular, are important in the maintenance of good health and in the
development and treatment of some diseases. Fatty acids and their triacylglycerols represent
a wide range of structures, and it is the total amount of these and the balance between the
various types that it is significant (54).
The effects of fatty acids are complex and greatly vary according to the dose and the
nature of the molecule. The knowledge on the beneficial effect of ω-3 long-chain PUFAs on
inflammatory and autoimmune diseases, like atherosclerosis, cancer, rheumatoid arthritis,
asthma, Alzheimer’s disease and others, has dramatically increased during recent years
(55). The literature also refers the fatty acids importance in the bone matrix, since they
interfere with signalling pathways of osteoclasts and osteoblasts, favouring bone growth (56).
Among PUFAs, the ones belonging to ω-3 and ω-6 families are highlighted. The human
organism is not able to synthesize them due to the absence of specific enzymes. So, it is
necessary to obtain them from the diet (57, 58). These fatty acids are recognized by their
ability to lower serum cholesterol levels, leading to the reduction of blood pressure, thus
decreasing the risk of cardiovascular disease (59).
3.2.4. Fatty acids in E. plantagineum
It is known that pollen contains all nutrients, including lipids, which are necessary for plant
growth and development. As far as we know, fatty acid content of E. plantagineum bee
pollen has not determined. Nevertheless, the fatty acid composition of other tissues is well
studied.
Echium plantagineum seed contains a highly polyunsaturated oil: 16% oleic acid (OA,
18:1 n-9), 19% linoleic acid (LA, 18:2 n-6), 10% γ-linolenic acid (GLA, 18:3 n-6), 30% α-
linolenic acid (ALA, 18:3 n-3) and 13% stearidonic acid (SDA, 18:4 n-3). By their metabolism,
this natural ratio of fatty acids delivers enhanced plasma concentrations of eicosapentaenoic
Introduction
30
(EPA, 20:5 n-3), docosapentaenoic (DPA, 22:5 n-3) and dihomo-γ-linolenic (DGLA, 20:3 n-6)
acids, without increasing the concentrations of arachidonic acid (AA, 20:4 n-6) (51). Almost
all of the fatty acids belong to ω-3 family (60).
The main fatty acid in E. plantagineum leaf is ALA (61). Macaronesian E. plantagineum
leaves have a high content of the following saponifiable lipids: 16:0 (20.26%) and 18:3 n-3
(29.43%) (61).
4. Inflammation
Inflammation is a physiological response induced by microbial infection or damage to
living tissues. A major trigger of inflammation is the recognition of microbes by specific
receptors of the innate immune system, which play a crucial role in the induction of early
signals initiating and establishing the inflammatory setting (62). It is a defence mechanism
that evolved in higher organisms to protect them from infection and injury. A main function of
inflammation is to resolve infection and to repair damage in order to achieve homeostasis
equilibrium (62). Thus, the ideal inflammatory response is rapid and destructive, yet specific
and self-limiting. This is a process involved in the so-called acute inflammation because it
lasts only a few days, allowing the aggressive agent to be localized and eliminated and the
organism to heal. A response of longer duration is referred to as chronic inflammation, when
chronic infectious or inflammatory disorders cause more damage to the host than the
microbe (62).
Inflammation and the immune system are intimately related. So, an over activation of
innate immune response can cause chronic infection or chronic inflammation, and hence
disease, due to an inefficient regulation or resolution of the inflammatory response 62
Oxidative stress is implicated in the inflammatory processes at the molecular level.
Oxidative stress is a status characterized by the production of high amount of oxidants or low
level of antioxidants, which results in an imbalance between oxidant and antioxidant systems
causing damage. Oxidative stress can be extrinsically induced by environmental factors and
intrinsically by endogenous factors, such as the electron transport chain in mitochondria,
some enzyme activities (NADH oxidase and nitric oxide synthase) and respiratory burst from
inflammatory cells (63).
Introduction
31
Inflammation induces reactive oxygen species and reactive nitrogen species production
via respiratory bursts and inflammatory cytokines, which can activate many oxidant
generating enzymes, such as inducible nitric oxide synthase (iNOS), cyclooxygenase 2
(COX2), myeloperoxidase (MPO) and eosinophil peroxidase (EPO) (63).
Eicosanoids, including prostaglandins (PGs), leukotrienes (LTs) and lipoxins (LXs), are
signalling molecules that are generated primarily through an oxidative pathway from AA
(Figure 12). They are also generated from pathways originating from EPA and DGLA (64).
AA-derived eicosanoids exert complex control over a wide range of physiological processes.
Eicosanoids production is considerably increased during inflammation and their biosynthetic
pathways are of particular clinical relevance because their products are involved in the
pathogenesis of various pathologies related to immune functions (64).
Introduction
32
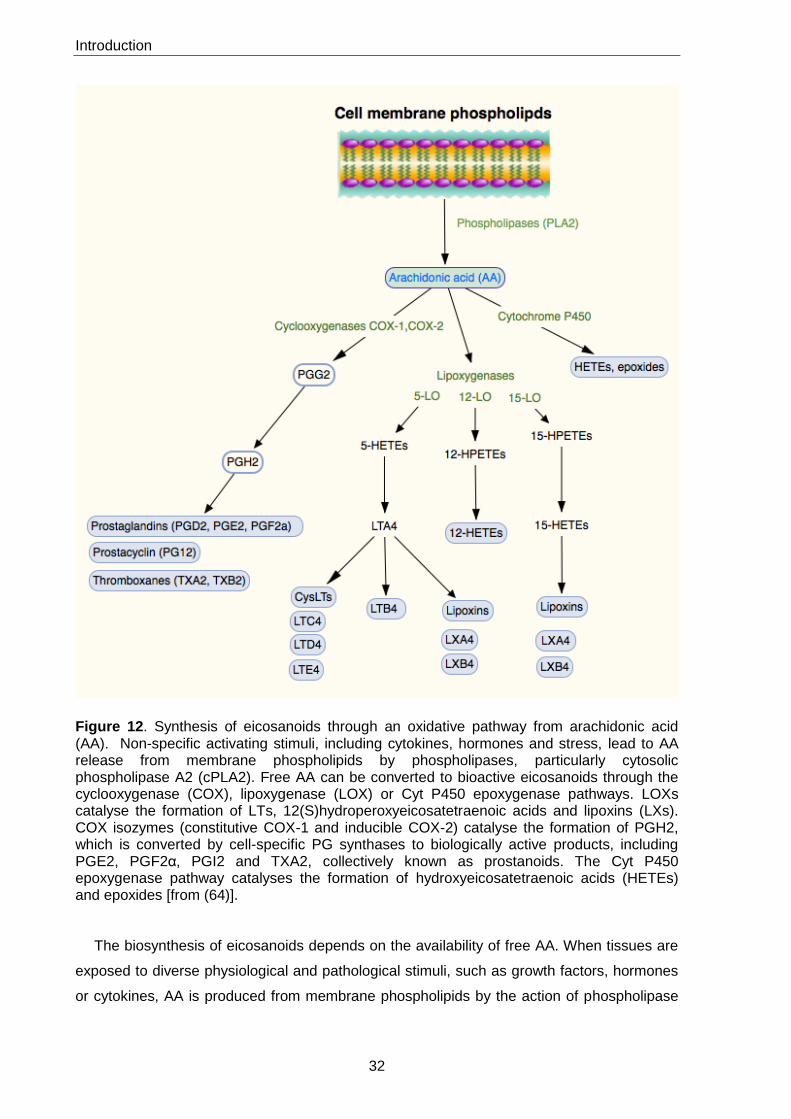
Figure 12. Synthesis of eicosanoids through an oxidative pathway from arachidonic acid (AA). Non-specific activating stimuli, including cytokines, hormones and stress, lead to AA release from membrane phospholipids by phospholipases, particularly cytosolic phospholipase A2 (cPLA2). Free AA can be converted to bioactive eicosanoids through the cyclooxygenase (COX), lipoxygenase (LOX) or Cyt P450 epoxygenase pathways. LOXs catalyse the formation of LTs, 12(S)hydroperoxyeicosatetraenoic acids and lipoxins (LXs). COX isozymes (constitutive COX-1 and inducible COX-2) catalyse the formation of PGH2, which is converted by cell-specific PG synthases to biologically active products, including PGE2, PGF2α, PGI2 and TXA2, collectively known as prostanoids. The Cyt P450 epoxygenase pathway catalyses the formation of hydroxyeicosatetraenoic acids (HETEs) and epoxides [from (64)].
The biosynthesis of eicosanoids depends on the availability of free AA. When tissues are
exposed to diverse physiological and pathological stimuli, such as growth factors, hormones
or cytokines, AA is produced from membrane phospholipids by the action of phospholipase
Introduction
33
A2 (PLA2) enzymes and can then be converted into different eicosanoids. AA can be
enzymatically metabolized by three main pathways: Cyt P450 epoxygenase,
cyclooxygenases (COXs) and lipoxygenases (LOXs) (Figure 12). The Cyt P450
epoxygenase pathway produces hydroxyeicosatetraenoic acids (HETEs) and epoxides. The
COX pathway produces PGG2 and PGH2, which are subsequently converted into PGs and
thromboxanes (TXs).
There are two COX isoforms, commonly referred to as COX-1 and COX-2 (65). It is the
enzyme that catalyses the rate-limiting step in prostaglandin synthesis, converting AA into
prostaglandin H2α, which is then further metabolized to prostaglandin E2 (PGE2), PGF2α,
PGD2 and other eicosanoids.
COX-1 is constitutively expressed in many tissues (encoded by a constitutively expressed
gene) and plays an important role in tissue homeostasis. COX-2, which can be expressed in
a variety of cells and tissues, is an inducible isoform (encoded by an immediate early
response gene) and growth factors, cytokines and tumour promoters stimulate its expression
(66). Despite the structural similarity between the two isoforms, COX-1 and COX-2 differ
substantially in the regulation of their expression and their roles in tissue biology and
disease.
LOXs are more numerous and convert AA into diverse hydroperoxyeicosatetraenoic
acids (HPETEs) and HETEs. 5-HETE is converted into the leukotriene LTA4, which is the
precursor of LTB4, cysteinyl-LTs (CysLTs) (including LTC4, LTD4 and LTE4) and LXs.
Synthesis of LXs is dependent on the activity of the requisite interacting LOXs and the
proximity of cells that are necessary for the metabolism of AA to the LX end-products. In
some instances, the metabolite is transferred to another cell that, in turn, converts it into
another compound. For example, PGI2 and LXA4 can be produced during cell–cell
interactions, utilizing enzymes in adjacent cells. PGI2 is produced from PGH2 (of platelet
origin) by the vascular epithelium or lymphocytes. Similarly, LTA4 produced by neutrophils
can be converted into LTC4 by vascular epithelium or platelets, or into LTB4 by erythrocytes.
Thus, biosynthesis of different eicosanoids is dependent on local production and distribution
of specific precursors and enzymes in specific cells (64).
4.1. In vitro models
Macrophages are a major component of the mononuclear phagocyte system that consists
Introduction
34
of closely related cells of bone marrow origin, including blood monocytes, and tissue
macrophages. They play a critical role in the initiation, maintenance, and resolution of
inflammation, being activated and deactivated in the inflammatory process. Activation signals
include cytokines (interferon gamma, granulocyte-monocyte colony stimulating factor, and
tumor necrosis factor alpha (TNF-α)), bacterial lipopolysaccharide (LPS), extracellular matrix
proteins, and other chemical mediators. Inhibition of inflammation by removal or deactivation
of mediators and inflammatory effector cells permits the host to repair damaged tissues. Anti-
inflammatory cytokines (interleukin 10 and transforming growth factor beta) and cytokine
antagonists that are mainly produced by macrophages deactivate activated macrophages.
Macrophages participate in the auto-regulatory loop in the inflammatory process. Because
macrophages produce a wide range of biologically active molecules participating in both
beneficial and detrimental outcomes in inflammation, therapeutic interventions targeting
macrophages and their products may open new avenues for controlling inflammatory
diseases (67).
The cellular model of LPS-stimulated macrophages is widely used to assess anti-
inflammatory activity (68, 69, 70). It is well known that infection of cells by microorganisms
activates the inflammatory response due to the recognition by macrophages receptors of
LPS present in microorganisms’ cell wall: the initial sensing of infection is mediated by innate
pattern recognition receptors that are expressed by macrophages dendritic cells and various
nonprofessional immune cells. Although inflammation is a protective response of the body to
ensure removal of detrimental stimuli, as well as a healing process for repairing damaged
tissue, the stimulation of macrophages, initiated by microorganisms (or other agent) can
result in the overproduction of inflammatory mediators like PGE2 and PGI2, which enhance
edema formation and leukocyte infiltration by promoting blood flow in the inflamed region (71,
72).
5. Allergy
Bee pollen has been used as a “perfect health food” for many centuries and its benefits
have been widely lauded. Modern research has also shown that bee pollen mainly
possesses the therapeutic effects of improving the cardiovascular system, enhancing body
immunity, delaying aging, maintaining the digestive system and preventing prostate
degeneration (73). Nevertheless, in sensitized individuals it can cause allergic reactions.
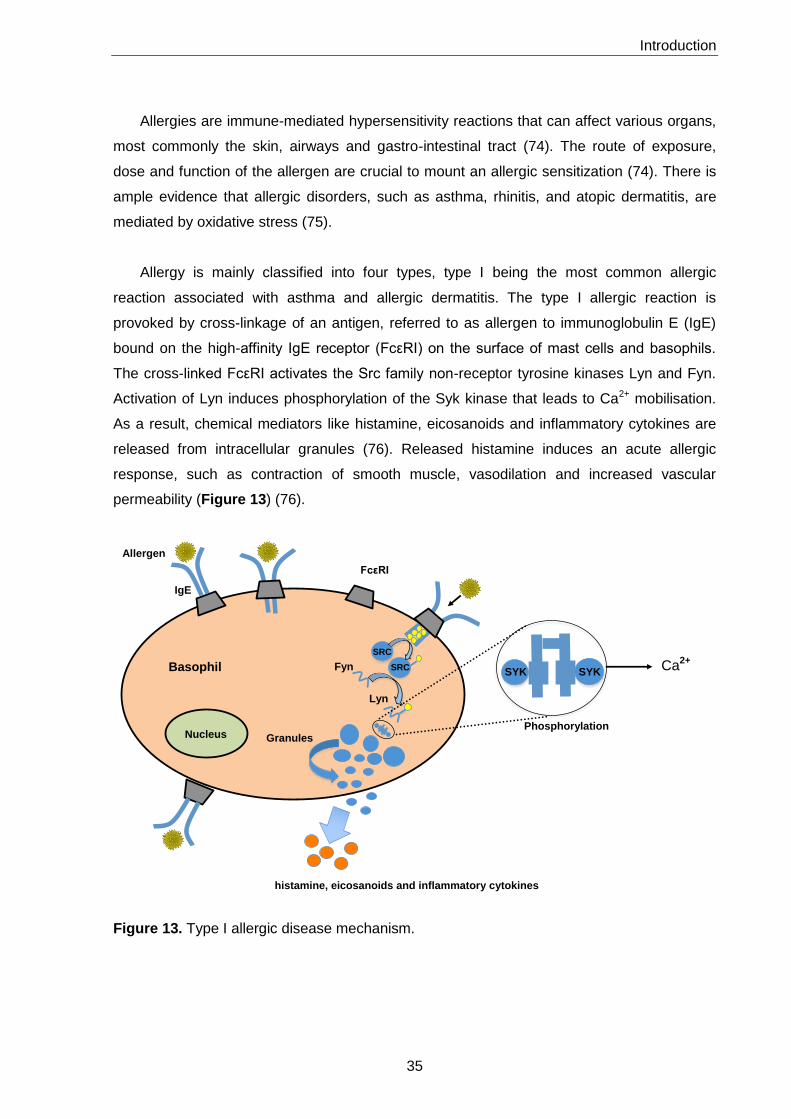
Introduction
35
FcεRI
Basophil
Allergen
IgE
SRC
SRC Fyn SYK SYK
Phosphorylation
Ca2+
Lyn
Granules
histamine, eicosanoids and inflammatory cytokines
Nucleus
Allergies are immune-mediated hypersensitivity reactions that can affect various organs,
most commonly the skin, airways and gastro-intestinal tract (74). The route of exposure,
dose and function of the allergen are crucial to mount an allergic sensitization (74). There is
ample evidence that allergic disorders, such as asthma, rhinitis, and atopic dermatitis, are
mediated by oxidative stress (75).
Allergy is mainly classified into four types, type I being the most common allergic
reaction associated with asthma and allergic dermatitis. The type I allergic reaction is
provoked by cross-linkage of an antigen, referred to as allergen to immunoglobulin E (IgE)
bound on the high-affinity IgE receptor (FcεRI) on the surface of mast cells and basophils.
The cross-linked FcεRI activates the Src family non-receptor tyrosine kinases Lyn and Fyn.
Activation of Lyn induces phosphorylation of the Syk kinase that leads to Ca2+ mobilisation.
As a result, chemical mediators like histamine, eicosanoids and inflammatory cytokines are
released from intracellular granules (76). Released histamine induces an acute allergic
response, such as contraction of smooth muscle, vasodilation and increased vascular
permeability (Figure 13) (76).
Figure 13. Type I allergic disease mechanism.

Introduction
36
The most important sources of allergens are wind-dispersed pollen grains from trees,
grasses and weeds, followed by excretions of house dust mites and cockroaches, fungal
spores, animal dander and insect venoms (74).
Notwithstanding the genetic predisposition, there are several factors that contribute to
the appearance of allergic disease, which can be classified as adjuvant and causal factors.
As adjuvant factors that cause allergic sensitisation, we can mention biogenic and
antropogenic factors; irritants, environmental tobacco smoke, infections and exercise cause
skin and/or airway hyper-reactivity (74). As causal factors, allergens are the main ones
promoting allergic sensitisation; oligomerisation and surface motifs are responsible for skin
and/or airway hyperreactivity (74).
Atopic diseases are characterized by predominance of T helper cell type 2 (Th2)-biased
immune responses to environmental allergens (77, 78). It is well established that allergen
specific Th2 cells are the key orchestrators of allergic reactions, initiating and propagating
inflammation through the release of a number of Th2 cytokines (78). Th2 responses
constitute a prerequisite for the development of type I hypersensitivity reactions, which lead
to IgE production and arming of mast cells and basophils with specific IgE. Subsequent
allergen encounter leads to IgE-mediated mast cell/basophil degranulation and release of
pro-inflammatory mediators, cytokines, and chemokines that ultimately are responsible for
the inflammatory response seen in type I hypersensitivity (75) (Figure 14).
In the context of type I allergy, airborne pollen grains have generally been regarded as
allergen carriers. Aside from allergens, pollens release many other substances with pro-
inflammatory and immune-modulatory effects on cells of the allergic immune response. In
addition, pollens can carry biogenic and anthropogenic factors that influence allergen
release, generate novel allergenic epitopes, and modulate the epithelial microenvironment of
an allergen encounter (74).
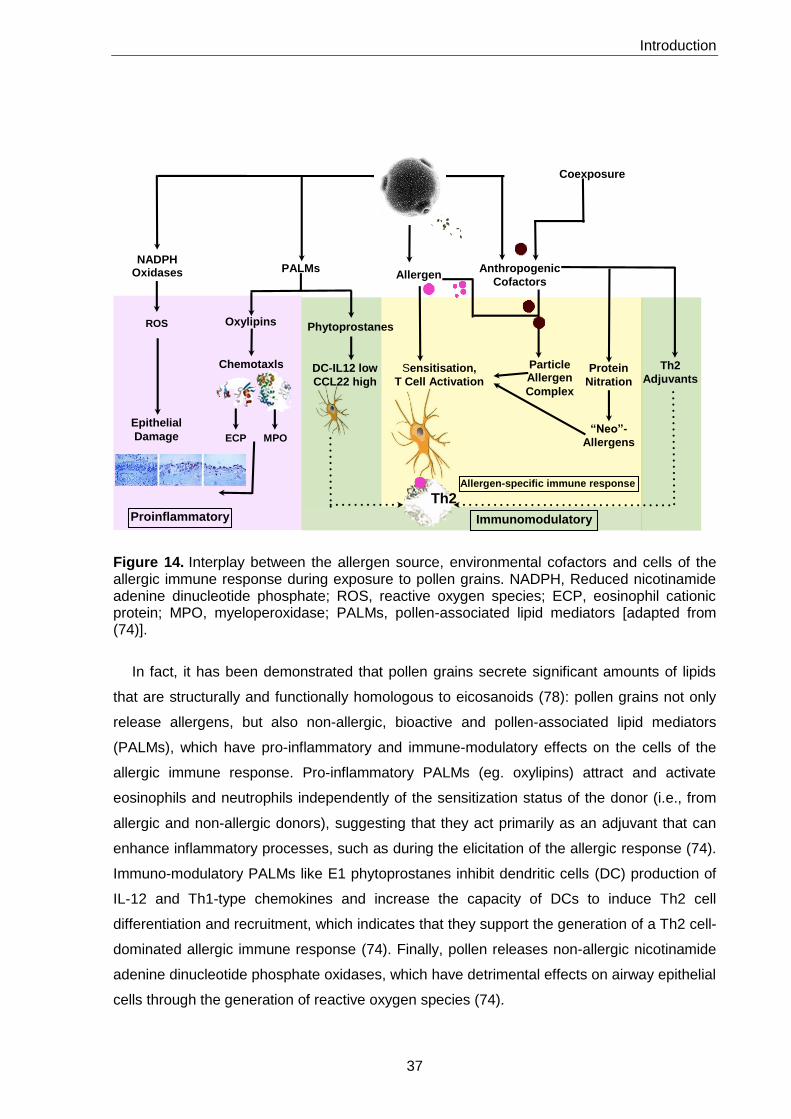
Introduction
37
Figure 14. Interplay between the allergen source, environmental cofactors and cells of the allergic immune response during exposure to pollen grains. NADPH, Reduced nicotinamide adenine dinucleotide phosphate; ROS, reactive oxygen species; ECP, eosinophil cationic protein; MPO, myeloperoxidase; PALMs, pollen-associated lipid mediators [adapted from (74)].
In fact, it has been demonstrated that pollen grains secrete significant amounts of lipids
that are structurally and functionally homologous to eicosanoids (78): pollen grains not only
release allergens, but also non-allergic, bioactive and pollen-associated lipid mediators
(PALMs), which have pro-inflammatory and immune-modulatory effects on the cells of the
allergic immune response. Pro-inflammatory PALMs (eg. oxylipins) attract and activate
eosinophils and neutrophils independently of the sensitization status of the donor (i.e., from
allergic and non-allergic donors), suggesting that they act primarily as an adjuvant that can
enhance inflammatory processes, such as during the elicitation of the allergic response (74).
Immuno-modulatory PALMs like E1 phytoprostanes inhibit dendritic cells (DC) production of
IL-12 and Th1-type chemokines and increase the capacity of DCs to induce Th2 cell
differentiation and recruitment, which indicates that they support the generation of a Th2 cell-
dominated allergic immune response (74). Finally, pollen releases non-allergic nicotinamide
adenine dinucleotide phosphate oxidases, which have detrimental effects on airway epithelial
cells through the generation of reactive oxygen species (74).
AllergenAnthropogenic
Cofactors
Coexposure
NADPH Oxidases PALMs
ROS
Epithelial
Damage
PhytoprostanesOxylipins
Chemotaxls
MPOECP
Allergen-specific immune response
Sensitisation,
T Cell Activation
DC-IL12 low
CCL22 high
Th2
Particle Allergen
Complex
Protein
Nitration
“Neo”-
Allergens
Proinflammatory
Th2
Adjuvants
Immunomodulatory
Introduction
38
5.1. In vitro models
During immediate-type allergy (type I hypersensitivity), histamine is released from
activated mast cells via a degranulation process by IgE-allergenic stimulation. Along with
histamine release β-hexosaminidase is simultaneously degranulated from the same activated
cells (79). Thus, β-hexosaminidase activity can be used as a biomarker of allergic response
of the mast cells. As indicated above, 5-lipoxygenase (5-LOX) is an enzyme that produces
LTs from AA. Because LTs are mediators of some allergic reactions, such as bronchial
asthma (80), 5-LOX is regarded as an enzyme that induces allergic response. Accordingly,
inhibition of the release of β-hexosaminidase and 5-LOX is well correlated with anti-allergic
action. On the other hand, the recruited monocytes and lymphocytes and their secreted
cytokines like IL-1β play an important role in delayed-type allergic response (type IV
hypersensitivity) (81).
The rat basophilic leukemic (RBL-2H3) cell line has been widely used for allergy and
immunological research (82, 83, 84). The release of β-hexosaminidase enzyme, a marker of
degranulation in mast cells and basophils, allows estimating the anti-allergic potential of new
drugs in vitro (85).

Objectives
39
6. Objectives
The main objectives of this dissertation were:
1. To improve the knowledge on the chemical composition of E. plantagineum bee
pollen;
2. To evaluate the potential of E. plantagineum bee pollen on inflammation and to
elucidate the mechanisms underlying the anti-inflammatory effect;
3. To evaluate the activity of E. plantagineum bee pollen on allergy and to assess the
mechanisms behind its effect;
4. To evaluate the protective effect of E. plantagineum bee pollen against oxidative
stress;
5. To establish possible relationships between the chemical composition and the
biological activity of E. plantagineum bee pollen.

Chapter II
Experimental Section

Experimental Section
43
1. Standards and reagents
LPS from Salmonella enterica, quercetin-3-O-rutinoside, lipoxygenase from Glycine max
(L.) Merr. (type V-S; EC 1.13.11.12), methyl linolelaidate, N-methyl-N-
(trimethylsilyl)trifluoroacetamide (MSTFA), capric, lauric, palmitic, linolenic, stearic, oxalic,
aconitic, citric, pyruvic, malonic, shikimic and fumaric acids, 3-(4,5-dimethylthiazol-2-yl)-2,5-
diphenyltetrazolium bromide (MTT), methanol, Triton X-100, Tris-HCl, dimethyl sulfoxide
(DMSO), DL-dithiothreitol (DTT), phenylmethanesulfonyl fluoride (PMSF), calcium ionophore
A23187, mouse anti-2,4-dinitrophenylated IgE (anti-DNP IgE), albumin from bovine serum
(BSA), 2,4-dinitrophenylated BSA (DNP-BSA), 4-nitrophenyl N-acetyl-β-D-glucosaminide,
sodium pyruvate, β-nicotinamide adenine dinucleotide reduced form (NADH), 2’,7’-
dichlorofluorescein diacetate (DCFA-DA), 5,5’-dithiobis(2-nitrobenzoic acid) (DTNB), tert-
butyl hydroperoxide (t-BHP), antipyrene E, phenazine methosulfate (PMS), nitroblue
tetrazolium chloride (NBT), perchloric acid, glutathione reduced form (GSH), oxidized
glutathione (GSSG), reduced nicotinamide adenine dinucleotide phosphate (β-NADPH), 2-
vinylpyridine, glutathione reductase (GR, EC 1.6.4.2), 2,4-dinitrophenylhydrazine, 1-chloro-
2,4-dinitrobenzene (CDNB), brilliant blue G, diacetylmonoxime (79 mM in 83 mM acetic
acid), β-glucuronidase, type H2 from Helix pomatia, sodium linoleate (2 mM in ethanol),
potassium hydrogen carbonate, hydrogen peroxide, superoxide dismutase (SOD) bovine (EC
1.15.1.1) were purchased from Sigma-Aldrich (St. Louis, MO, USA).
Kaempferol-3-O-rutinoside, kaempferol-3-O-glucoside, delphinidin-3-O-glucoside and
malvidin-3-O-glucoside were obtained from Extrasynthese (Genay, France).
ortho-Phosphoric acid 85% was obtained from Panreac (Barcelona, Spain).
The n-alkane series (C8–C40) was from Supelco (Bellefonte, PA, USA). N-(1-Naphthyl)-
ethylene-diamine dihydrochloride, sodium nitroprusside (SNP) dehydrate, sodium chloride,
methanol, trichloroacetic acid and acetonitrile were obtained from Merck (Darmstadt,
Germany) and acetic and sulfuric acids were from Fisher Scientific (Loughborough, UK).
Ethyl acetate, hydrochloric and formic acids were from BDH Prolabo (Dublin, Ireland).
Dulbecco’s Phosphate Buffered Saline (DPBS), Dulbecco’s Modified Eagle Medium
(DMEM), DMEM+GlutaMAX™1, Earle’s Balanced Salt Solution (EBSS), heat inactivated
foetal bovine serum (FBS), heat inactivated foetal calf serum (FCS) and Pen Strep solution
(Penicillin 5000 units mL-1 and Streptomycin 5000 mg mL-1) were obtained from Gibco,
InvitrogenTM (Grand Island, NY, USA).
Experimental Section
44
Non-essential aminoacids (NEAA), fungizone (250 μg mL-1 amphotericin B), human
transferrin (4 mg mL-1) and trypsin-EDTA were purchased from Gibco, InvitrogenTM (Paisley,
UK).
Mueller Hinton Broth (MHB) and Mueller Hinton Agar (MHA) media were purchased from
Liofilchem (Teramo, Italy).
PGE1, PGE2, tetranor-PGEM, tetranor-PGAM, 20-hydroxy-PGE2, 6-keto-PGF1α, 2,3-
dinor-6-keto-PGF1α, 11b-PGF2α, 2,3-dinor-6-keto-PGF1α, 11b-PGF2α, 2,3-dinor-11b-
PGF2α, tetranor-PGFM, 9,11-dideoxy-9α,11a-epoxymethano-PGF2α (U-44069), 9,11-
dideoxy-9α, 11a-methanoepoxy-PGF2α (U-46619), 11-dehydrothromboxane B2, 8-iso-
PGF2α, 2,3-dinor-8-iso-PGF2α, 8-iso-15(R)-PGF2α, 8-iso-15-keto-PGF2α, 8-
isoprostaglandin F2α-d4 and 11-dehydro-thromboxane B2-d4 were from Cayman Chemicals
(Ann Arbor, Michigan, USA).
Water was treated in a Milli-Q (Miilipore, Bedford, MA, USA) water purification system.
2. Plant material
E. plantagineum bee pollen sample was provided by bee-keepers in the Spanish
Extremadura region. The botanical origin was ascertained by Professor Paula B. Andrade
(Laboratório de Farmacognosia, Faculdade de Farmácia, Universidade do Porto). Pollen was
stored protected from light, under desiccating conditions to prevent alteration. When needed,
samples were ground into a fine powder and kept in a desiccator in the dark until analysis.
3. Hydromethanol extract
3.1. Preparation
Bee pollen (0.2 g) was thoroughly mixed with 1 mL methanol-water (7:3), ultrasonicated
for 1 h and centrifuged at 2,900 × g during 10 min. The supernatant was evaporated under
reduced pressure at 40 ºC and the dry residue was stored at −20 ºC, protected from light,
until use.
Experimental Section
45
3.2. Alkaloid precipitation tests for alkaloid detection
The presence of alkaloids was discarded by the general alkaloids precipitation tests,
adding Dragendorff’s (solution of potassium bismuth iodide), Mayer’s (potassium mercuric
iodide solution) and Bertrand’s (silicotungstic acid solution) reagents to the extract.
3.3. HPLC-DAD analysis of phenolic compounds
The extract was analysed in an analytical HPLC unit (Gilson, Villiers-le-bel, France) as
before (14), using a LiChroCART column (250 4mm, RP-18, 5 m particle size,
LiChrospher100 stationary phase; Merck, Darmstadt, Germany). The mobile phase
consisted of two solvents: water-formic acid (1%) (A) and methanol (B). Elution started with
30% B and a gradient was used to obtain 40% at 20 min, 50% at 25 min, 60% at 30 min and
80% at 32 min. The flow rate was 1 mL min-1 and the injection volume 20 μL. Spectral data
from all peaks were accumulated in the range 240-600 nm and chromatograms were
recorded at 350 nm. The data were processed on a Unipoint Software system (Gilson
Medical Electronics, Villiers-le-Bel, France). Peak purity was checked by the software
contrast facilities.
Phenolic compounds quantification was achieved by the absorbance recorded at 350 nm
relative to external standards. Because standards of all identified flavonoid derivatives were
not commercially available, quercetin-3-O-neohesperidoside was quantified as quercetin-3-
O-rutinoside and kaempferol derivatives as kaempferol-3-O-rutinoside, except kaempferol-3-
O-glucoside, which was quantified as itself. Analyses were performed in triplicate.
3.4. HPLC-UV analysis of organic acids
The dry residue of the hydromethanolic extract was dissolved in sulphuric acid 0.01 N.
The HPLC-UV analysis was carried out as previously reported (85), in a system consisting of
an analytical HPLC unit (Gilson, Villiers-le-bel, France), with an ion exclusion column
(Nucleogel Ion 300 OA) in conjunction with a column heating device set at 30 ºC. Elution was
carried out isocratically at a solvent flow rate of 0.2 mL min-1, with sulphuric acid 0.01 N. The
injection volume was 20 μL. Detection was performed with an UV-Vis detector set at 214 nm.
Organic acids quantification was achieved by the absorbance recorded in the
chromatograms relative to external standards. The data were processed on a Clarity
Experimental Section
46
Software system (Data Apex, Prague, Czech Republic). Analyses were performed in
triplicate.
3.5. GC-IT/MS analysis of fatty acids
3.5.1. Extract purification and derivatization
The extract was purified before fatty acids derivatization. The dry residue of the
hydromethanolic extract was thoroughly mixed with acidic water (pH 2 with HCl) and applied
to an Amberlite XAD-2 (Fluka Chemicals, Steinheim, Germany: pore size 9 nm, particle size
0.3-1.2 mm) column. Sugars and other polar compounds were eluted with the aqueous
solvent. The retained compounds were eluted with ethanol and the internal standard (IS)
methyl linolelaidate (100.00 μg mL-1 final concentration) was added. The volume was
completed to 2.00 mL with ethanol. Fatty acids derivatization was carried out as previously
described (86). Briefly, an aliquot of 50 μL of purified extract solution was transferred to a
glass vial, the solvent was evaporated under nitrogen stream and 50 μL of derivatization
reagent (MSTFA) were added to the dried residue. The vial was capped, vortexed and
heated for 20 min in a dry block heater maintained at 60 ºC.
3.5.2. GC-IT/MS conditions
Samples were analysed using a Varian CP-3800 gas chromatographer coupled to a
Varian Saturn 4000 mass selective ion trap detector (Palo Alto, CA, USA) and a Saturn GC-
MS workstation software (version 6.8). A VF-5 ms (30 m x 0.25 mm x 0.25 μm) column
(Varian) and a CombiPAL automatic auto sampler (Varian) were used. The injector port was
heated to 250 ºC. Injections were performed in split mode, with a ratio of 1/40. The carrier
gas was helium C-60 (Gasin, Leça da Palmeira, Portugal), at a constant flow of 1 mL min-1.
The ion trap detector was set as follows: transfer line, manifold and trap temperatures were
280, 50 and 180 ºC, respectively. The mass ranged from 50 to 600 m/z, with a scan rate of 6
scan s-1. The emission current was 50 μA and the electron multiplier was set in relative mode
to auto tune procedure. The maximum ionization time was 25.000 μs, with an ionization
storage level of 35 m/z. The injection volume was 2 μL and the analysis was performed in
Full Scan mode. The oven temperature was set at 100 ºC for 1 min, then increasing 20 ºC
min-1 to 250 ºC and held for 2 min, 10 ºC min-1 to 300 ºC and held for 10 min. All mass
spectra were acquired in electron impact (EI) mode. Ionization was maintained off during the
first 4 min to avoid solvent overloading. Compounds were identified by comparison of
Experimental Section
47
retention times and MS fragmentation pattern with those of standards analysed under the
same conditions and a mass spectra database search was performed using the National
Institute of Standards and Technology (NIST) MS 05 spectral database. In addition, retention
index (RI) was experimentally calculated and the values were compared with those reported
in the literature for GC columns with 5%-phenyl-95%-dimethylpolysiloxane (87, 88). For the
RI determination, an n-alkanes series (C8-C40) was used. Analyses were performed in
triplicate.
3.6. Reactive species scavenging assays in cell-free systems
3.6.1. Superoxide anion (O2-)
The radical was generated by the PMS/NADH system and monitored by the reduction of
NBT to formazan (89). The reaction mixtures consisted of NADH (166 μM), PMS (2.7 μM),
NBT (43 μM) and extract (five different concentrations). All components were dissolved in
phosphate buffer (19 mM, pH 7.4).
The reaction was conducted at room temperature for 2 min and initiated with the addition
of PMS. The absorbance variation was measured spectrophotometrically at 562 nm, in a
Multiskan Ascent plate reader (Thermo, Electron Cosporation). Three experiments were
performed, in which each concentration was tested in triplicate.
3.6.2. Nitric oxide (NO)
Nitric oxide was generated from SNP and measured by the Griess reagent as before (62).
SNP (6 mg mL-1) in phosphate buffer was mixed with different concentrations of bee pollen
extract dissolved in the same solvent and incubated at room temperature for 1 h, under light.
The nitrite accumulated in the reaction medium was then measured. Equal volumes of
reaction medium and Griess reagent (1:1 mixture (v/v) of 1% sulphanilamide and 0.1% N-(1-
naphthyl) ethylenediamine in 2% H3PO4) were mixed and incubated for 10 min in the dark, at
room temperature.
The cromophore was determined in a Multiskan Ascent plate reader (Thermo, Electron
Cosporation) at 562 nm. Five different extract concentrations were tested. Three experiments
were performed, in which each concentration was tested in triplicate.
Experimental Section
48
3.7. Antibacterial capacity
3.7.1. Microorganisms
Nine bacterial species from the American Type Culture Collection (ATCC) were used for
the experiments: Staphylococcus aureus (ATCC 20231), Staphylococcus epidermidis (ATCC
20044), Salmonella typhimurium (ATCC 43971), Proteus mirabilis (ATCC 4479), Escherichia
coli (ATCC 30083), Pseudomonas aeruginosa (ATCC 50071), Bacillus cereus (ATCC
31000), Enterococcus faecalis (ATCC 20477) and Micrococcus luteus (ATCC 20030).
Cultures were obtained from the Laboratory of Microbiology, Faculty of Pharmacy, Porto
University. Stock cultures were maintained on MHA at 4 ºC.
Experimental Section
49
3.7.2. Assay
Bacterial inocula were prepared by growing cells in MHB for 24 h, at 37 ºC. Cell
suspensions were diluted in sterile MHB to provide final cell counts of 1.56 106 colony-
forming units per mL (CFU mL-1).
Minimum inhibitory concentration (MIC) was determined by employing broth microdilution
methods based on the Clinical and Laboratory Standards Institute (CLSI) guidelines,
reference documents M07-A8 and M100-S19, with minor modifications (24). Briefly, the
suspensions of bacteria cultures were prepared in ampoules containing 2 mL of NaCl 0.85%
suspension medium (api®, Biomérieux, Marcy l’Étoile, France). After adjusting the turbidity to
0.5 McFarland, suspensions were diluted in MHB till the final bacterial density of 1.56 106
CFU mL-1. The MIC of the extract was determined by two-fold serial dilution method, in 96-
well plates: 50 μL of the bacterial suspension was added in each well, which contained 50 μL
of the extract dilutions in MHB medium.
The maximum DMSO concentration did not exceed 2.5% (v/v). The plates were incubated
at 37 ºC in a humidified atmosphere containing 5% CO2, without agitation for 18-24 h for both
Gram positive and Gram negative bacteria. The MIC was determind as the lowest
concentration of the extract inhibiting visual growth of the tested culture on the microplate.
Gentamicin MIC for S. aureus (ATCC 25923) was determined as quality control. Sterility and
positive controls in MHB medium alone and with 2.5% of DMSO (v/v) were included. Positive
control wells contained microorganisms without antibiotics. The experiments were performed
in duplicate and repeated independently three times, yielding essentially the same results.
3.8. Effect on inflammation
3.8.1. Cell culture conditions and treatments
Macrophage RAW 264.7 cells were from ATCC and were kindly provided by Prof. Maria
S. J. Nascimento (Laboratory of Microbiology, Faculty of Pharmacy, Porto University). They
were cultured at 37 ºC in DMEM supplemented with 10% FBS and 2% Pen Strep solution in
a humidified atmosphere of 5% CO2, as previously reported (49). Cells were seeded in 48-
well plates (150 000 cells/ well) and cultured until 80-90% confluence.
Two groups of RAW 264.7 cells were considered: control group (C group) and LPS-
treated group (T group). Both C and T groups were cultured in cell media containing growing
Experimental Section
50
doses of bee pollen extract (C0 and T0: 0; C1 and T1: 0.5; C2 and T2: 1.0; C3 and T3: 2.1;
C4 and T4: 4.2; C5 and T5: 8.3 mg mL-1; for viability assays concentrations of 16.7 and 33.3
mg mL-1 were also tested) dissolved in medium containing 0.5% DMSO. Exposure periods
were 19 h for viability (MTT and LDH assays), NO and L-citrulline assays and 9 h for
eicosanoids determination. One mg mL-1 of LPS was added to the culture media of T group
cells after the first hour of extract exposure and this inflammatory stimulus was maintained
during the following 8 or 18 h.
3.8.2. MTT reduction assay
This assay evaluates cells’ mitochondrial activity, thus allowing determining the number of
viable cells. The reaction consists on the reduction of MTT to formazan by mitochondrial
dehydrogenase succinate, this enzyme being active only in cells with intact metabolism and
respiratory chain (90).
After the incubation period, RAW 264.7 cells were washed with DPBS and then
incubated for 30 min with MTT (0.5 mg mL-1 in DMEM). The extent of the reduction to
formazan within the cells was quantified at 510 nm (69). Results were expressed as
percentage of the respective control (with or without LPS). Five independent assays were
performed in triplicate.
3.8.3. Lactate dehydrogenase (LDH) leakage
LDH is rapidly released from damaged cells. The consumption of NADH is kinetically
measured in the supernatant and is correlated with the amount of extracellular LDH. Thus,
cell viability is inversely proportional to the amount of released LDH (91).
Under the assay conditions LDH catalyses the conversion of pyruvate to lactate as NADH
is oxidized to NAD+. The catalytic activity is determined from the rate of disappearance of
NADH at 340 nm during 4 min (background correction at 620 nm). Thus, the decrease in
absorbance is proportional to LDH activity in the sample (92).
After the treatment period (18 h after LPS addition), an aliquot of the culture medium was
taken to determine the activity of LDH leaked through cell membranes, according to a
described procedure (69). The cell monolayer was lysed in the remaining medium with lysis
buffer (1% triton-X 100 in PBS) to determine total LDH activity. Results are expressed as
Experimental Section
51
LDH activity in media relative to total activity (medium plus cell lysate). Five independent
assays were performed in duplicate.
3.8.4. NO in RAW 264.7 cells culture medium
Nitrite accumulated in the culture medium of C and T-group LPS-stimulated cells was
measured after 18 h incubation with LPS. This determination was based on the Griess
reaction (69, 93). Equal volumes of culture supernatant and Griess reagent were mixed and
incubated for 10 min in the dark, at room temperature. The absorbance was read at 562 nm.
Five independent assays were performed in duplicate.
3.8.5. Determination of L-citrulline
L-citrulline was quantified using the method of Senshu and collaborators (94), with the
modifications of Marzinzig and colleagues (95). Briefly, after 18 h incubation with LPS, 100
μL of culture medium of RAW 264.7 cells of C and T-groups were deproteinized with 200 μL
of trichloroacetic acid (2.45 M). After centrifugation (10 min; 2,900 x g), 250 μL supernatant
were mixed with 100 μL of reaction mixture containing 40% (v/v) diacetylmonoxime (79 mM
in 83 mM acetic acid), 18% (v/v) antipyrine E (47.8 mM in H2O) and 42% (v/v) H2SO4 7.5 M,
and incubated at 96 ºC for 25 min. The solution was then cooled down to room temperature
and the absorption was read at 405 nm. Five independent assays were performed in
duplicate.
3.8.6. Extraction of eicosanoids from macrophages and culture medium
Eicosanoids were determined in the whole cell extracts and in the culture media of RAW
264.7 cells. The culture medium was collected after 9 h exposure to the extract, 0.005% BHT
(final concentration) was added and the medium was kept at −80 ºC until eicosanoids
extraction. To precipitate the serum proteins present in the culture media, 3 mL of
methanol/HCl 200 mM were added to 2 mL medium and centrifuged at 10,000 x g for 5 min.
After removing the culture medium, cells were lysed by incubation with lysis buffer (50 mM
Tris-HCl pH 8.0, 150 mM NaCl, 1% Triton X-100, containing 0.005% BHT) for 1 h at 0 ºC.
Lysates were centrifuged at 8,000 x g for 5 min. The resulting supernatants were kept at −80
ºC until eicosanoids extraction.
Experimental Section
52
Before eicosanoids extraction, one replicate of each culture condition was hydrolysed
using 5000 UE mL-1 of β-glucuronidase (96).
After hydrolysis, both hydrolysed and non-hydrolysed supernatants were subjected to
SPE using Strata X-AW cartridge (100 mg 3mL-1), following the procedure of Medina et al
(96). Target compounds were eluted with methanol and dried using a SpeedVac
concentrator.
3.8.7. UPLC-QqQ-MS/MS analysis of eicosanoids
The separation of eicosanoids in the cell lysates and culture medium was performed by
UPLC coupled to 6460 QqQ-MS/MS (Agilent Technologies, Waldbronn, Germany), using the
set up of Medina and collaborators (96, 97).
The quantification of the separate eicosanoids detected was performed using the standard
compounds PGE1, PGE2, tetranor-PGEM, tetranor-PGAM, 20-hydroxy-PGE2, 6-keto-
PGF1α, 2,3-dinor-6-keto-PGF1α, 11b-PGF2α, 2,3-dinor-11β-PGF2α, tetranor-PGFM, 9,11-
dideoxy-9α,11α-epoxymethano-PGF2α (U-44069), 9,11-dideoxy-9α,11a-methanoepoxy-
PGF2α (U-46619), 11-dehydrothromboxane B2, 8-iso-PGF2α, 2,3-dinor-8-iso-PGF2α, 8-iso-
15(R)-PGF2α, 8-iso-15-keto-PGF2α. The isoprostaglandin F2α-d4 (containing 4 deuterium
atoms at positions 3, 39,4 and 49) and 11-dehydrothromboxane B2-d4 (containing 4
deuterium atoms at positions 3, 39, 4 and 49) were used as internal standards (96, 97).
3.9. Effect on degranulation
3.9.1. Cell culture conditions and treatments
The rat basophil cell line RBL-2H3 (from ATCC) was grown in DMEM+GlutaMAX™-I
supplemented with 10% FBS, 100 U mL-1 penicillin and 100 μg mL-1 streptomycin, under 5%
CO2 at 37 ºC, in humidified air. For the anti-allergic assays cells were planted at 3 x 10⁵ cells
mL-1 in 24-wells plates (1 mL/well) and treated after reaching confluence.
In the assay using calcium ionophore as stimulus, cells were pre-treated with the extract
(dissolved in culture medium) 15 min prior to the addition of the ionophore (1 μM in EBSS +
0.1% BSA) and maintained in culture for another 30 min. Then the supernatant was collected
and used for the determination of β-hexosaminidase release, whereas the MTT cell viability
Experimental Section
53
assay was performed in adherent cells. Three independent assays were performed in
duplicate.
In another experiment cells were sensitized with anti-DNP IgE (100 ng mL-1) for 16 h, then
stimulated for 1 h with DNP-BSA (100 ng mL-1 in EBSS + 0.1% BSA). Cells were co-
incubated with the extract throughout the assay. β-Hexosaminidase release and MTT assays
were performed as in the assay with calcium ionophore.
The effect of the extract on β-hexosaminidase release in the absence of stimuli (calcium
ionophore or IgE/antigen) was simultaneously checked in every assay performed with an
allergic stimulus.
3.9.2. MTT reduction assay
Cellular viability was assessed by the reduction of MTT to formazan, according to a
previously described method (98), with some modifications. After cell treatment, culture
medium removal and cells washing with DPBS, cells in 24-well plates were incubated with 1
mL/well of MTT (0.5 mg mL-1), for 30 min at 37 ºC. Supernatant was then discarded,
formazan was solubilized in DMSO (1 mL) and quantified by measurement of optical density
at 550 nm, using a microplate reader. Results are expressed as percentage of control
(without allergic stimulus). Three independent assays were performed in duplicate with
calcium ionophore (or extract only) and six independent assays were performed in duplicate
with IgE-DNP – DNP-BSA (or extract only).
3.9.3. Quantification of released β-hexosaminidase
To assess the effect of the extract in RBL-2H3 cells degranulation, β-hexosaminidase was
quantified according to a previously published method (99), with some modifications. Briefly,
30 μL of supernatant was incubated with 50 μL of 1.3 mg mL-1 4-nitrophenyl N-acetyl-β-D-
glucosaminide (in 0.2 M citric acid, pH 4.5), for 1 h at 37 ºC. β-Hexosaminidase reaction was
stopped by the addition of 80 μL of NaOH 0.5 M and absorbance was measured at 405 nm
using a microplate reader. Three independent assays were performed in duplicate in the
assay with calcium ionophore (or extract only) and six independent assays were performed
in duplicate in the assay with IgE-DNP – DNP-BSA (or extract only).
Experimental Section
54
3.9.4. β-Hexosaminidase inhibitory activity
Besides avoiding β-hexosaminidase release, the extract may directly inhibit β-
hexosaminidase enzymatic activity. The inhibition of β-hexosaminidase activity was checked
by the following assay (99): after culture, cells were lysed by incubation with lysis buffer (50
mM Tris-HCl pH 8.0, 150 mM NaCl, 1% Triton X-100) for 1 h, at 0 ºC. Lysates were
centrifuged at 8,000 x g for 5 min. The resulting supernatants were used to determine β-
hexosaminidase activity in the presence and in the absence of the extract, as described in
the previous section. Three independent assays were performed in duplicate.
3.9.5. Lipoxygenase inhibition assay
The oxidation of linoleic acid, by lipoxygenase, to the conjugated diene 13-hydroperoxy
linoleic acid was followed by measuring the absorbance at 234 nm on an UV/vis
spectrophotometer (Helios Alpha, Cambridge, UK). The assay was performed by adding 20
μL of extract dissolved in phosphate buffer (pH 9.0), 1 mL of phosphate buffer and 20 μL of a
soybean lipoxygenase solution (500 U). After 5 min incubation, at room temperature, the
reaction was started by the addition of 50 μL sodium linoleate (2 mM in ethanol). The
reaction time was 3 min and the inhibition of the enzyme activity was calculated by
comparing the reaction rate with the control (without extract) (99).
3.10. Statistical analysis
All statistical calculations were made using GraphPad Prism 5 Software (San Diego
California, USA). For all cell-system assays, determination of the statistical significance in
comparison to control was performed using the parametric method of one-way ANOVA on
ranks, followed by Bonferroni’s post-hoc test in RAW 264.7 macrophages. Two-way ANOVA
and Sidak’s multiple comparisons test were used to determine the interaction between
extract and LPS in cell viability and differences in citrulline and NO release by LPS-
stimulated macrophages.
Two-way ANOVA and Bonferroni’s test, as post-hoc test, were used to determine the
interaction of the stimulus and the extract in MTT reduction assay in RBL-2H3 cells. Two-
tailed t paired test was used to determine the statistical significance in comparison to control
in β-hexosaminidase release assay.
Experimental Section
55
In all cases, p values lower than 0.05 were considered statistically significant.
4. Acidified methanol extract and fractions
4.1. Preparation
Aliquots of 1 g of E. plantagineum bee pollen were accurately weighed, thoroughly mixed
with 10 mL of methanol containing 0.5% HCl (v/v), ultra-sonicated for 1 h and centrifuged at
4000 rpm during 10 min. The supernatant was decanted and the residue was re-extracted by
vortexing for 2 min with 10 mL of methanol containing 0.5% HCl (v/v) and centrifuged at 4000
rpm for 10 min. The supernatants were pooled together and the solvent was evaporated
under reduced pressure at 30 ºC. In order to obtain extracts enriched in phenolic
compounds, a SPE procedure was performed using Chromabond C18 non-end-capped
(NEC) columns (45 µm particle size, 60 Å pore size; 10 g sorbent mass, 70 mLreservoir
volume) from Macherey-Nagel (Düren, Germany). The residue was dissolved in 10 mL of
water and applied to the SPE cartridge preconditioned with 20 mL of ethyl acetate, 20 mL of
methanol and 20 mL of water. The loaded cartridge was washed with 10 mL of water. A
fraction containing non-coloured phenolics was eluted with 100 mL of ethyl acetate (fraction
I). A second fraction with anthocyanins (fraction II) was eluted with 40 mL of methanol. A
combined extract was obtained by mixing ethyl acetate and methanol eluates (whole extract).
The eluates were concentrated under reduced pressure, and the residues obtained were
dissolved in 5 mL of methanol (final concentration of 200 mg mL-1).
4.2. Acid hydrolysis
One mL of HCl 2 M was added to 2 ml of fraction II. The acidic solution was heated at 100
ºC for 30 min, under reflux. The obtained anthocyanins were recovered by SPE using
Chromabond C18 NEC columns (45 µm particle size, 60 Å pore size; 1 g sorbent mass, 6 mL
reservoir volume) from Macherey-Nagel (Düren, Germany), previously conditioned with
methanol and HCl 2M. Compounds were eluted with 20 mL of methanol. The solvent was
evaporated under reduced pressure at 30 ºC, the residue was dissolved in 2 mL of methanol,
filtered through a 0.45 µm pore size filter and injected for anthocyanins identification.

Experimental Section
56
4.3. HPLC-DAD analysis
The extracts were analysed on an analytical HPLC unit (Gilson) equipped with a
Spherisorb ODS2 column (25.0 0.46 cm, 5 µm, particle diameter). The data were
processed on a Unipoint Software system (Gilson Medical Electronics, Villiers le Bel,
France). Peak purity was checked by the software contrast facilities.
4.3.1. Flavonols
The extracts were analysed according to the method used for the analysis of the
hydromethanol extract described in section 3.3. Spectral data from all peaks were
accumulated in the range 200–600 nm, and chromatograms were recorded at 350 nm.
Phenolic compounds quantification was achieved by the absorbance recorded at 350 nm
relative to external standards. Because standards of all identified flavonoid derivatives were
not commercially available, kaempferol derivatives were quantified as kaempferol-3-O-
rutinoside, except kaempferol-3-O-glucoside, which was quantified as itself.
4.3.2. Anthocyanins
Coloured phenolics were analysed following a previously described method (100). The
mobile phase consisted of water/formic acid/acetonitrile (87:10:3, v/v/v; eluent A) and
water/formic acid/acetonitrile (40:10:50, v/v/v; eluent B), using a gradient program as follows:
from 10 to 25% B (10 min), from 25 to 31% B (5 min), from 31 to 40% B (5 min), from 40 to
50% B (10 min), from 50 to 100% B (10 min) and from 100 to 10% B (5 min). The flow rate
was 0.8 mL min-1 and the injection volume was 20 µL. Chromatograms were recorded at 500
nm. Phenolic compounds in the extracts and in the hydrolysed extracts were identified by
comparing their retention times and UV-Vis spectra with those of standards when
commercially available and by comparison with literature (37). Quantification was performed
at 500 nm. Delphinidin heterosides were quantified as delphinidin-3-O-glucoside, petunidin
heterosides and malvidin-3-O-glucoside were quantified as malvidin-3-O-glucoside.

Experimental Section
57
4.4. Effect on cell oxidative stress
4.4.1. Cell culture conditions and treatments
Human colorectal adenocarcinoma cell line (Caco-2) from the American Type Culture
Collection (LGC Standards S.L.U., Spain) was grown in DMEM+GlutaMAXTM-I supplemented
with 10% foetal bovine serum (FBS) heat-inactivated, 1% non-essential aminoacids, 1%
fungizone and 6 µg mL-1 transferrin, 1% penicillin and 1% streptomycin, at 37 ºC in 5% CO2,
until they reach 90% confluence. For cells treatment the culture medium was prepared
without FCS. Cells were plated at 1.5×10⁵ cells mL-1 using 200 µL/well of cell suspension in
96-well plates (viability assays), 1200 µL/well in 24-well plates (GSH, DCFA-DA) and 2.5
mL/well in 12-well plates (enzymes) and then incubated until they reached confluence.
Just before the assays, an aliquot of the extracts was evaporated under a nitrogen
stream, the residue was dissolved in the same volume of culture medium without FCS and
sterilized by filtration through a 0.22 μm size pore membrane. A series of five dilutions was
prepared and cells were exposed for 24 h to the different concentrations of the extracts. In
order to evaluate the antioxidant potential, cells were pre-exposed for 24 h to the extracts,
then the extracts were removed and cells were exposed to 150 µM of t-BHP for 4 (DCFA-DA
assay) or 6 h (other assays).
4.4.2. MTT reduction assay
After cells treatment and removal of the culture medium, adherent cells were treated for
30 min with 0.5 mg mL-1 of MTT. The formazan crystals were then dissolved with DMSO and
quantified by measuring the absorbance at 560 nm in a microplate reader (98). Results are
expressed as percentage of control. Five independent experiments were performed in
triplicate.
4.4.3. LDH leakage
LDH was determined by adding pyruvate (124 µM) and NADH (154 µM) to the culture
medium of treated cells and following the rate of oxidation of NADH at 340 nm during the
conversion of pyruvate to lactate (98, 101). Results are expressed as percentage of control.
Five independent experiments were performed in triplicate.
Experimental Section
58
4.4.4. Reactive species
The measurement of intracellular reactive species with DCFA-DA was performed using a
previously described method with modifications (102). Cells were exposed to the extracts for
24 h and the culture medium was removed. DCFA-DA (10 µM, dissolved in culture medium
(DMEM) without phenol red) was added and the cells were incubated with the probe for 30
min at 37 ºC. The probe was removed and t-BHP dissolved in culture medium without phenol
red was added. Fluorescence (485 nm excitation, 528 nm emission) was read immediately
and every 30 min during 4 h, in a microplate spectrofluorimeter (Synergy HT, Bio-Tek
Instruments Winooski, USA, operated by KC4 software). The plate was maintained at 37 ºC
between readings. Results are expressed as % of control (without t-BHP) and were
normalized with the result at 0 time. Five independent assays were performed.
4.4.5. Total glutathione
Total glutathione (GSHt) was measured by DTNB-glutathione reductase recycling assay,
according to a previously described method (103, 104). In brief, after cells treatment, the
culture medium was removed and 250 µL of perchloric acid 5% were added to each well.
Incubation was maintained during 10 min on ice in order to extract GSHt, then the solution
was collected and kept at −20 ºC until analysis. 250 µL of NaOH 0.3 M were added to the
cells in each well to solubilize proteins for protein quantification.
GSH was measured by following the increase of 5-thio-2-nitrobenzoic acid (TNB) at 405
nm, resulting from the oxidation of GSH by DTNB (1.28 mM). The assay was performed after
neutralizing perchloric acid with KHCO3 0.76 M, in the presence of GR (2.0 U mL-1) and
NADPH (0.21 mM), to recycle GSSG, increasing the detection limit. Five independent assays
were performed.
4.4.6. Antioxidant enzymes
For the measurement of enzymes activity, after exposure to the extracts the culture
medium was collected for extracellular SOD analysis and the cells were lysed on ice for 30
min with 1% Triton X-100 in Tris 50 mM pH=8.0, containing 150 mM NaCl, 0.5 mM PMSF
and 1 mM DTT (for GPx analysis 0.5 mM of DTT was used). The lysates were centrifuged at
10,000 rpm for 10 min at 4 ºC and the supernatants were collected for enzymatic and protein
assays. Five independent assays were performed.
Experimental Section
59
4.4.6.1. Glutathione-S- transferase
Glutathione-S-transferase (GST) activity was assayed according to a previously described
method (105). GSH (1 mM) was incubated at room temperature with CDNB (1.5 mM) and the
formation of the conjugate was monitored at 340 nm. GST activity was calculated by using
an extinction coefficient of 9.6 mM-1 cm-1.
4.4.6.2. Glutathione reductase
Glutathione reductase (GR) activity was determined at room temperature, following the
decrease of NADPH (0.5 mM) at 340 nm, during the reduction of GSSG (1.2 mM) to GSH
(106). GR activity was calculated by using an extinction coefficient of 6.22 mM-1 cm-1.
4.4.6.3. Glutathione peroxidase
Glutathione peroxidase (GPx) activity was determined following a previously described
method (107). The activity was indirectly measured by a coupled assay of GSSG reduction,
under conditions in which GPx activity is rate limiting. The assay was performed at room
temperature using t-BHP (0.15 mM) as substrate, GSH (1 mM) plus NADPH (0.15 mM) and
GR (0.03 U mL -1) to recycle the formed GSSG. The decrease of NADPH was measured at
340 nm. The enzyme activity was calculated by using an extinction coefficient of 6.22 mM-1
cm-1 and expressed as mmol of NADPH oxidized/min/mg of protein.
4.4.6.4. Catalase
Catalase activity was measured at room temperature by monitoring the decomposition of
H2O2 (10 mM) at 240 nm (107). The enzyme activity was calculated by using an extinction
coefficient of 39.4 M-1 cm-1.
4.4.6.5. Superoxide dismutase
Extracellular SOD was assayed using a previously described method (107) with
modifications. A PMS (0.003 mM) / NADH (0.07mM) system was used to generate O2•- and
subsequent reduction of NBT (0.03 mM) by O2•- was monitored at 560 nm. SOD activity was

Experimental Section
60
determined by interpolation in a calibration curve, built under the same conditions with bovine
SOD in the concentration range of 0.025- 0.25 U mL-1.
In order to screen for O2•- scavenging activity, an assay was performed by incubating
culture medium without cells, and measuring NBT reduction in the previously described
conditions. Four independent assays were performed. The results are expressed as % of
control and compared with the ones obtained in the assay performed with cells.
4.4.7. Protein quantification
Protein quantification was performed according to the Bradford method (108). Proteins
were measured by addition of 200 mL of Bradford dye reagent (brilliant blue G, 0.1 mg mL-1;
ethanol, 5% (v/v); phosphoric acid, 10 % (v/v); water) to 40 mL of the acidified extract or
fractions I and II, pre-diluted 100 times. The photometrical measure was performed at 595
nm. Bovine serum albumin was used to generate a standard curve (34).
4.5. Statistical analysis
All statistical calculations were made using Graphpad Prism 6 Software (San Diego, CA,
USA). For all cell systems assays, the statistical significance in comparison to control was
estimated using the parametric method of two-way ANOVA, followed by Dunnets's test (LDH,
MTT, DCFA-DA and antioxidant enzymes) or Sidak’s (GSHt, superoxide), as post-hoc test.
Two-way ANOVA and Sidak’s multiple comparisons test were used to compare between
groups.
In all cases, p values lower than 0.05 were considered statistically significant.

Chapter III
Results and Discussion

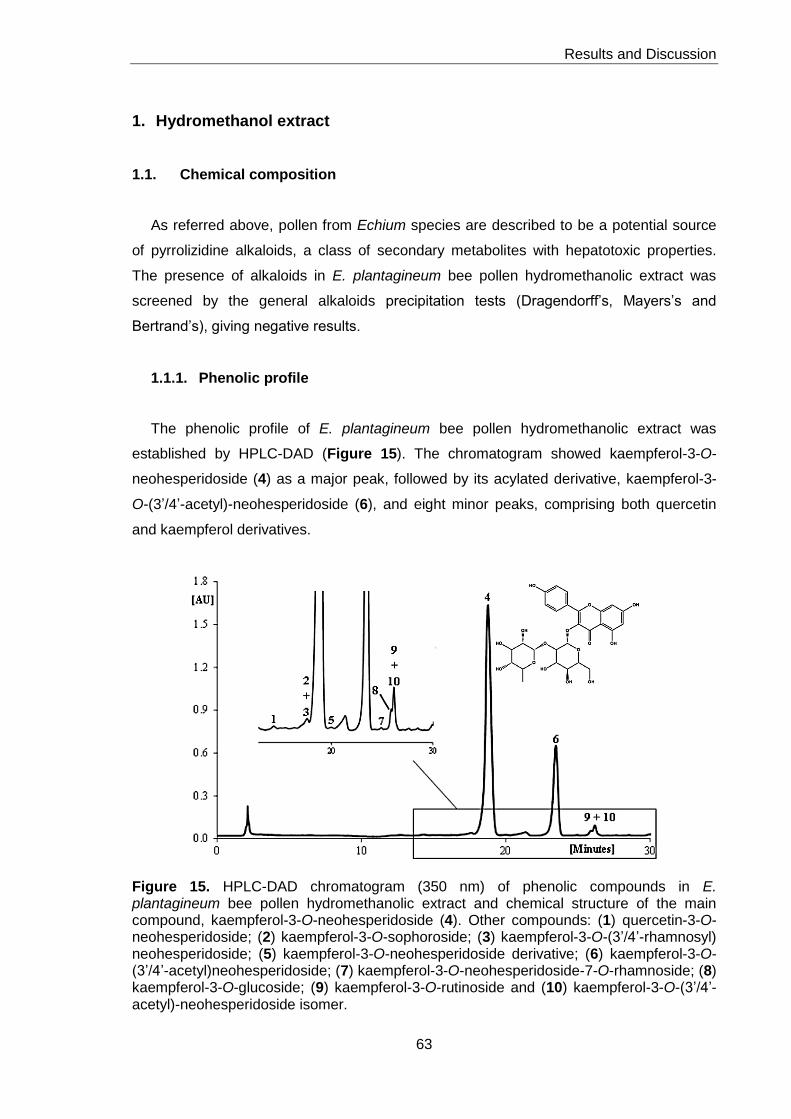
Results and Discussion
63
1. Hydromethanol extract
1.1. Chemical composition
As referred above, pollen from Echium species are described to be a potential source
of pyrrolizidine alkaloids, a class of secondary metabolites with hepatotoxic properties.
The presence of alkaloids in E. plantagineum bee pollen hydromethanolic extract was
screened by the general alkaloids precipitation tests (Dragendorff’s, Mayers’s and
Bertrand’s), giving negative results.
1.1.1. Phenolic profile
The phenolic profile of E. plantagineum bee pollen hydromethanolic extract was
established by HPLC-DAD (Figure 15). The chromatogram showed kaempferol-3-O-
neohesperidoside (4) as a major peak, followed by its acylated derivative, kaempferol-3-
O-(3’/4’-acetyl)-neohesperidoside (6), and eight minor peaks, comprising both quercetin
and kaempferol derivatives.
Figure 15. HPLC-DAD chromatogram (350 nm) of phenolic compounds in E. plantagineum bee pollen hydromethanolic extract and chemical structure of the main compound, kaempferol-3-O-neohesperidoside (4). Other compounds: (1) quercetin-3-O-neohesperidoside; (2) kaempferol-3-O-sophoroside; (3) kaempferol-3-O-(3’/4’-rhamnosyl) neohesperidoside; (5) kaempferol-3-O-neohesperidoside derivative; (6) kaempferol-3-O-(3’/4’-acetyl)neohesperidoside; (7) kaempferol-3-O-neohesperidoside-7-O-rhamnoside; (8) kaempferol-3-O-glucoside; (9) kaempferol-3-O-rutinoside and (10) kaempferol-3-O-(3’/4’-acetyl)-neohesperidoside isomer.
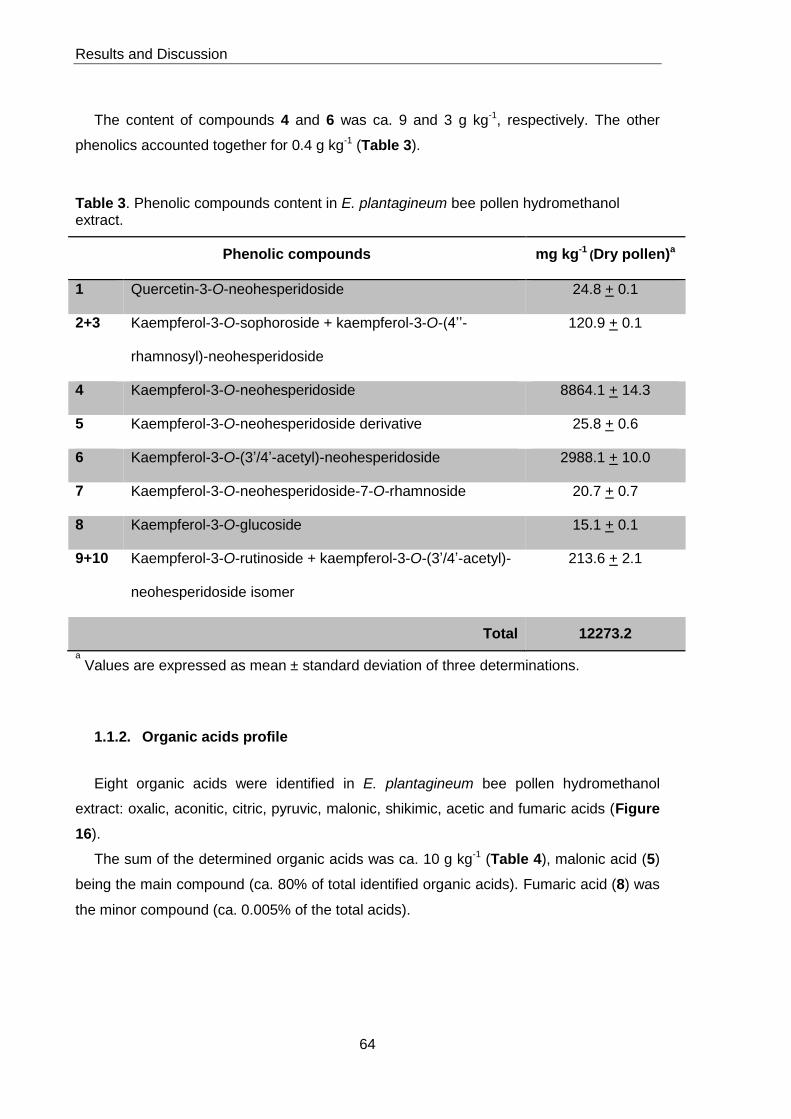
Results and Discussion
64
The content of compounds 4 and 6 was ca. 9 and 3 g kg-1, respectively. The other
phenolics accounted together for 0.4 g kg-1 (Table 3).
Table 3. Phenolic compounds content in E. plantagineum bee pollen hydromethanol extract.
Phenolic compounds mg kg-1 (Dry pollen)a
1 Quercetin-3-O-neohesperidoside 24.8 + 0.1
2+3 Kaempferol-3-O-sophoroside + kaempferol-3-O-(4’’-
rhamnosyl)-neohesperidoside
120.9 + 0.1
4 Kaempferol-3-O-neohesperidoside 8864.1 + 14.3
5 Kaempferol-3-O-neohesperidoside derivative 25.8 + 0.6
6 Kaempferol-3-O-(3’/4’-acetyl)-neohesperidoside 2988.1 + 10.0
7 Kaempferol-3-O-neohesperidoside-7-O-rhamnoside 20.7 + 0.7
8 Kaempferol-3-O-glucoside 15.1 + 0.1
9+10 Kaempferol-3-O-rutinoside + kaempferol-3-O-(3’/4’-acetyl)-
neohesperidoside isomer
213.6 + 2.1
Total 12273.2
a Values are expressed as mean ± standard deviation of three determinations.
1.1.2. Organic acids profile
Eight organic acids were identified in E. plantagineum bee pollen hydromethanol
extract: oxalic, aconitic, citric, pyruvic, malonic, shikimic, acetic and fumaric acids (Figure
16).
The sum of the determined organic acids was ca. 10 g kg-1 (Table 4), malonic acid (5)
being the main compound (ca. 80% of total identified organic acids). Fumaric acid (8) was
the minor compound (ca. 0.005% of the total acids).
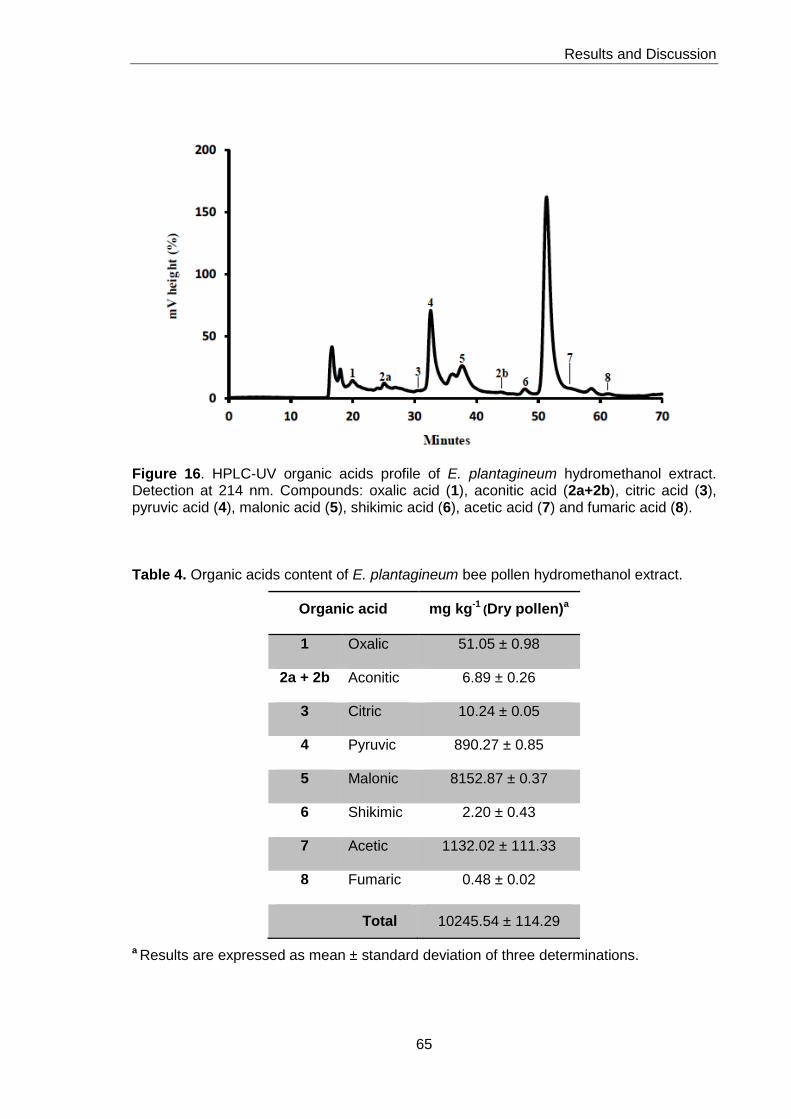
Results and Discussion
65
Figure 16. HPLC-UV organic acids profile of E. plantagineum hydromethanol extract. Detection at 214 nm. Compounds: oxalic acid (1), aconitic acid (2a+2b), citric acid (3), pyruvic acid (4), malonic acid (5), shikimic acid (6), acetic acid (7) and fumaric acid (8).
Table 4. Organic acids content of E. plantagineum bee pollen hydromethanol extract.
Organic acid mg kg-1 (Dry pollen)a
1 Oxalic 51.05 ± 0.98
2a + 2b Aconitic 6.89 ± 0.26
3 Citric 10.24 ± 0.05
4 Pyruvic 890.27 ± 0.85
5 Malonic 8152.87 ± 0.37
6 Shikimic 2.20 ± 0.43
7 Acetic 1132.02 ± 111.33
8 Fumaric 0.48 ± 0.02
Total 10245.54 ± 114.29
a Results are expressed as mean ± standard deviation of three determinations.
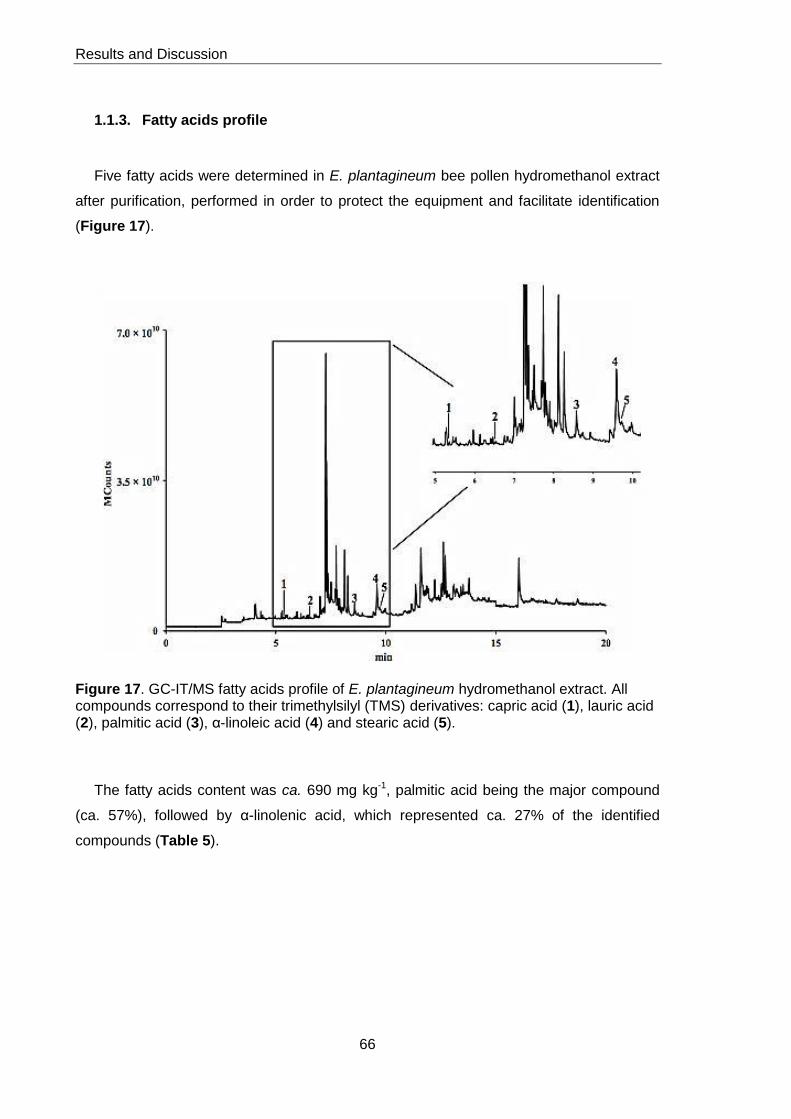
Results and Discussion
66
1.1.3. Fatty acids profile
Five fatty acids were determined in E. plantagineum bee pollen hydromethanol extract
after purification, performed in order to protect the equipment and facilitate identification
(Figure 17).
Figure 17. GC-IT/MS fatty acids profile of E. plantagineum hydromethanol extract. All compounds correspond to their trimethylsilyl (TMS) derivatives: capric acid (1), lauric acid (2), palmitic acid (3), α-linoleic acid (4) and stearic acid (5).
The fatty acids content was ca. 690 mg kg-1, palmitic acid being the major compound
(ca. 57%), followed by α-linolenic acid, which represented ca. 27% of the identified
compounds (Table 5).
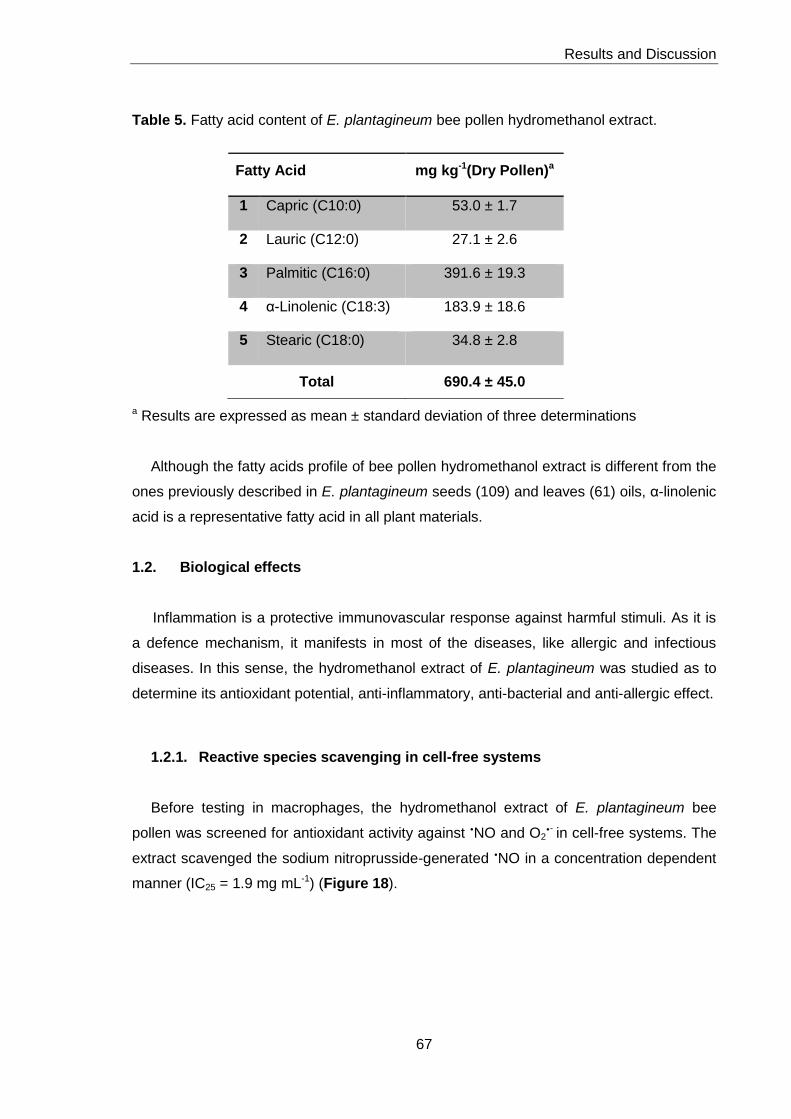
Results and Discussion
67
Table 5. Fatty acid content of E. plantagineum bee pollen hydromethanol extract.
a Results are expressed as mean ± standard deviation of three determinations
Although the fatty acids profile of bee pollen hydromethanol extract is different from the
ones previously described in E. plantagineum seeds (109) and leaves (61) oils, α-linolenic
acid is a representative fatty acid in all plant materials.
1.2. Biological effects
Inflammation is a protective immunovascular response against harmful stimuli. As it is
a defence mechanism, it manifests in most of the diseases, like allergic and infectious
diseases. In this sense, the hydromethanol extract of E. plantagineum was studied as to
determine its antioxidant potential, anti-inflammatory, anti-bacterial and anti-allergic effect.
1.2.1. Reactive species scavenging in cell-free systems
Before testing in macrophages, the hydromethanol extract of E. plantagineum bee
pollen was screened for antioxidant activity against NO and O2- in cell-free systems. The
extract scavenged the sodium nitroprusside-generated NO in a concentration dependent
manner (IC25 = 1.9 mg mL-1) (Figure 18).
Fatty Acid mg kg-1(Dry Pollen)a
1 Capric (C10:0) 53.0 ± 1.7
2 Lauric (C12:0) 27.1 ± 2.6
3 Palmitic (C16:0) 391.6 ± 19.3
4 α-Linolenic (C18:3) 183.9 ± 18.6
5 Stearic (C18:0) 34.8 ± 2.8
Total 690.4 ± 45.0
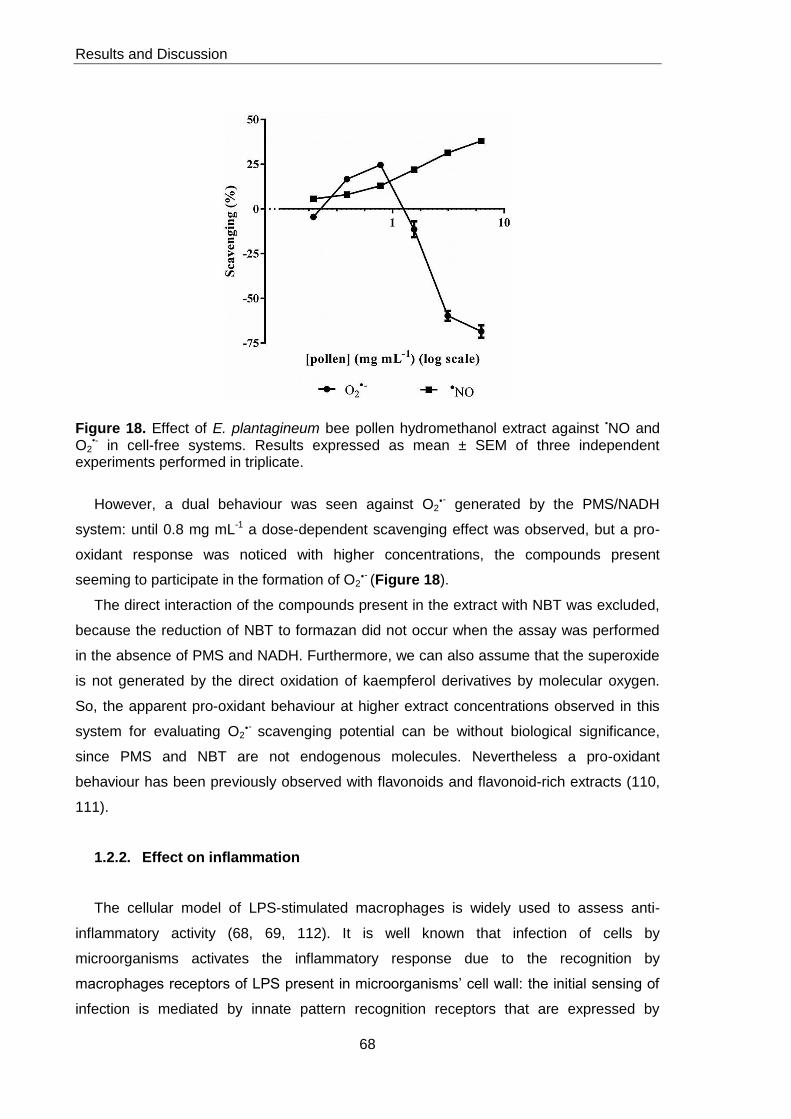
Results and Discussion
68
Figure 18. Effect of E. plantagineum bee pollen hydromethanol extract against •NO and O2
•- in cell-free systems. Results expressed as mean ± SEM of three independent experiments performed in triplicate.
However, a dual behaviour was seen against O2- generated by the PMS/NADH
system: until 0.8 mg mL-1 a dose-dependent scavenging effect was observed, but a pro-
oxidant response was noticed with higher concentrations, the compounds present
seeming to participate in the formation of O2- (Figure 18).
The direct interaction of the compounds present in the extract with NBT was excluded,
because the reduction of NBT to formazan did not occur when the assay was performed
in the absence of PMS and NADH. Furthermore, we can also assume that the superoxide
is not generated by the direct oxidation of kaempferol derivatives by molecular oxygen.
So, the apparent pro-oxidant behaviour at higher extract concentrations observed in this
system for evaluating O2- scavenging potential can be without biological significance,
since PMS and NBT are not endogenous molecules. Nevertheless a pro-oxidant
behaviour has been previously observed with flavonoids and flavonoid-rich extracts (110,
111).
1.2.2. Effect on inflammation
The cellular model of LPS-stimulated macrophages is widely used to assess anti-
inflammatory activity (68, 69, 112). It is well known that infection of cells by
microorganisms activates the inflammatory response due to the recognition by
macrophages receptors of LPS present in microorganisms’ cell wall: the initial sensing of
infection is mediated by innate pattern recognition receptors that are expressed by
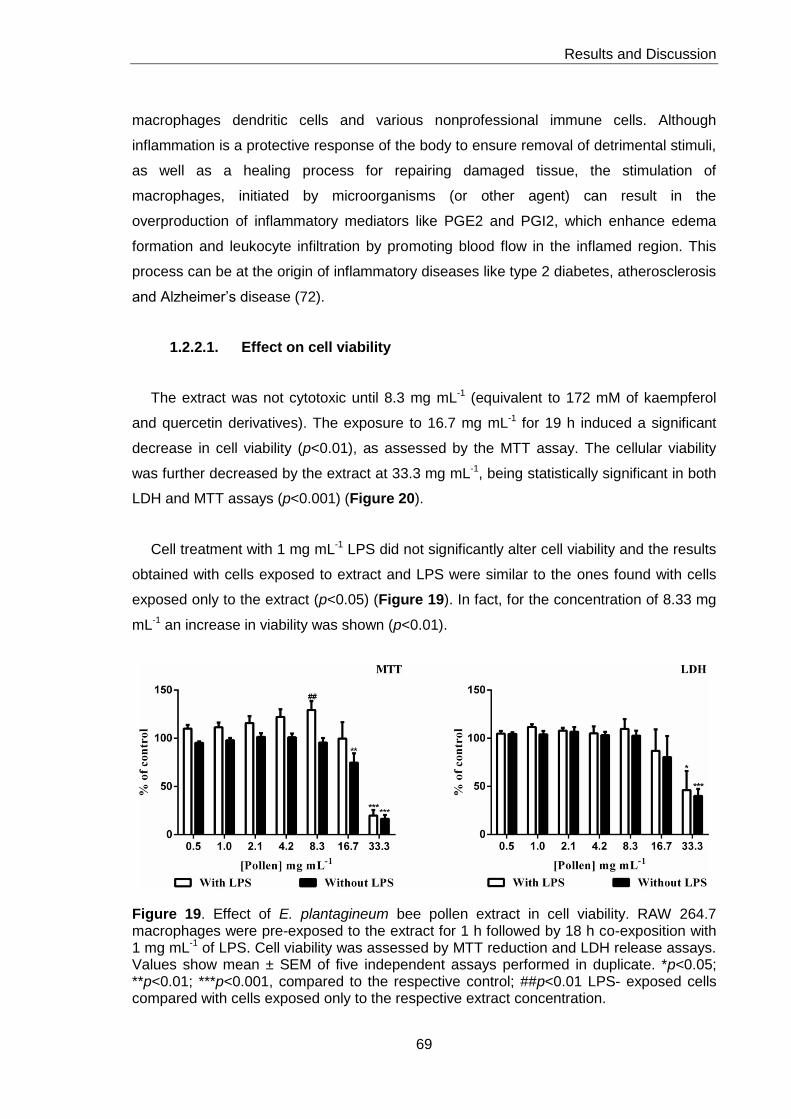
Results and Discussion
69
macrophages dendritic cells and various nonprofessional immune cells. Although
inflammation is a protective response of the body to ensure removal of detrimental stimuli,
as well as a healing process for repairing damaged tissue, the stimulation of
macrophages, initiated by microorganisms (or other agent) can result in the
overproduction of inflammatory mediators like PGE2 and PGI2, which enhance edema
formation and leukocyte infiltration by promoting blood flow in the inflamed region. This
process can be at the origin of inflammatory diseases like type 2 diabetes, atherosclerosis
and Alzheimer’s disease (72).
1.2.2.1. Effect on cell viability
The extract was not cytotoxic until 8.3 mg mL-1 (equivalent to 172 mM of kaempferol
and quercetin derivatives). The exposure to 16.7 mg mL-1 for 19 h induced a significant
decrease in cell viability (p<0.01), as assessed by the MTT assay. The cellular viability
was further decreased by the extract at 33.3 mg mL-1, being statistically significant in both
LDH and MTT assays (p<0.001) (Figure 20).
Cell treatment with 1 mg mL-1 LPS did not significantly alter cell viability and the results
obtained with cells exposed to extract and LPS were similar to the ones found with cells
exposed only to the extract (p<0.05) (Figure 19). In fact, for the concentration of 8.33 mg
mL-1 an increase in viability was shown (p<0.01).
Figure 19. Effect of E. plantagineum bee pollen extract in cell viability. RAW 264.7 macrophages were pre-exposed to the extract for 1 h followed by 18 h co-exposition with 1 mg mL-1 of LPS. Cell viability was assessed by MTT reduction and LDH release assays. Values show mean ± SEM of five independent assays performed in duplicate. *p<0.05; **p<0.01; ***p<0.001, compared to the respective control; ##p<0.01 LPS- exposed cells compared with cells exposed only to the respective extract concentration.
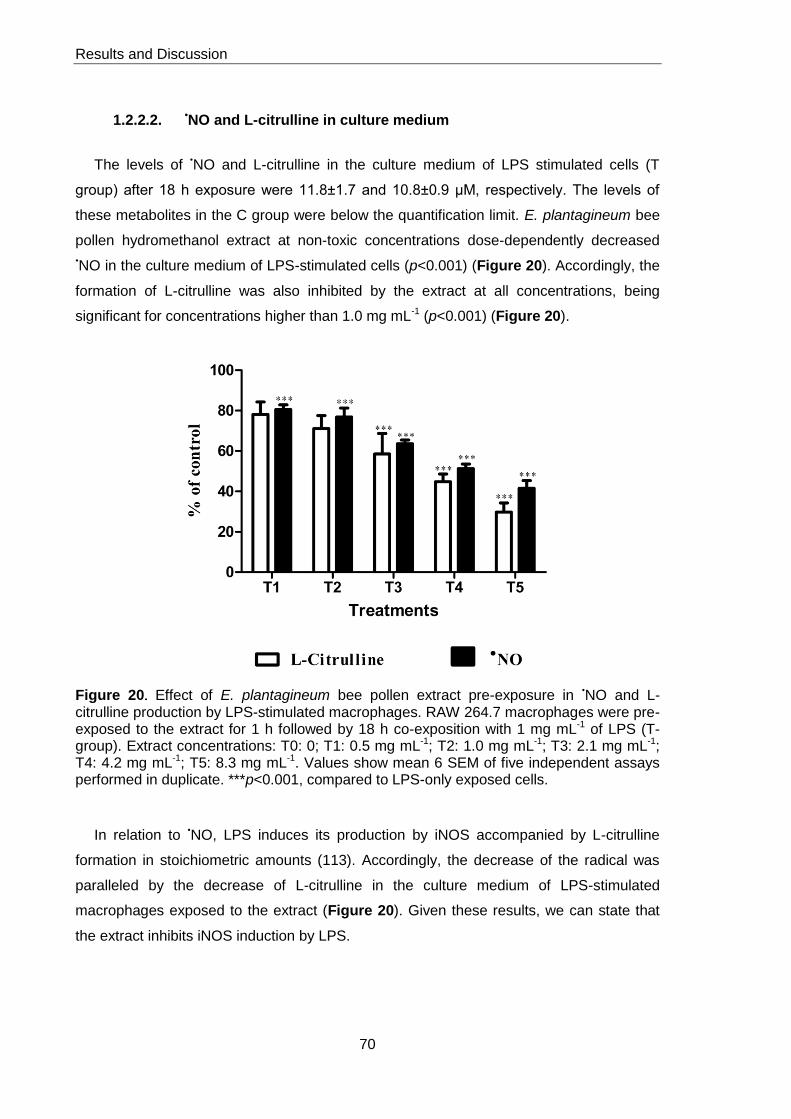
Results and Discussion
70
1.2.2.2. •NO and L-citrulline in culture medium
The levels of •NO and L-citrulline in the culture medium of LPS stimulated cells (T
group) after 18 h exposure were 11.8±1.7 and 10.8±0.9 μM, respectively. The levels of
these metabolites in the C group were below the quantification limit. E. plantagineum bee
pollen hydromethanol extract at non-toxic concentrations dose-dependently decreased
•NO in the culture medium of LPS-stimulated cells (p<0.001) (Figure 20). Accordingly, the
formation of L-citrulline was also inhibited by the extract at all concentrations, being
significant for concentrations higher than 1.0 mg mL-1 (p<0.001) (Figure 20).
Figure 20 Effect of E. plantagineum bee pollen extract pre-exposure in •NO and L-citrulline production by LPS-stimulated macrophages. RAW 264.7 macrophages were pre-exposed to the extract for 1 h followed by 18 h co-exposition with 1 mg mL-1 of LPS (T-group). Extract concentrations: T0: 0; T1: 0.5 mg mL-1; T2: 1.0 mg mL-1; T3: 2.1 mg mL-1; T4: 4.2 mg mL-1; T5: 8.3 mg mL-1. Values show mean 6 SEM of five independent assays performed in duplicate. ***p<0.001, compared to LPS-only exposed cells.
In relation to •NO, LPS induces its production by iNOS accompanied by L-citrulline
formation in stoichiometric amounts (113). Accordingly, the decrease of the radical was
paralleled by the decrease of L-citrulline in the culture medium of LPS-stimulated
macrophages exposed to the extract (Figure 20). Given these results, we can state that
the extract inhibits iNOS induction by LPS.
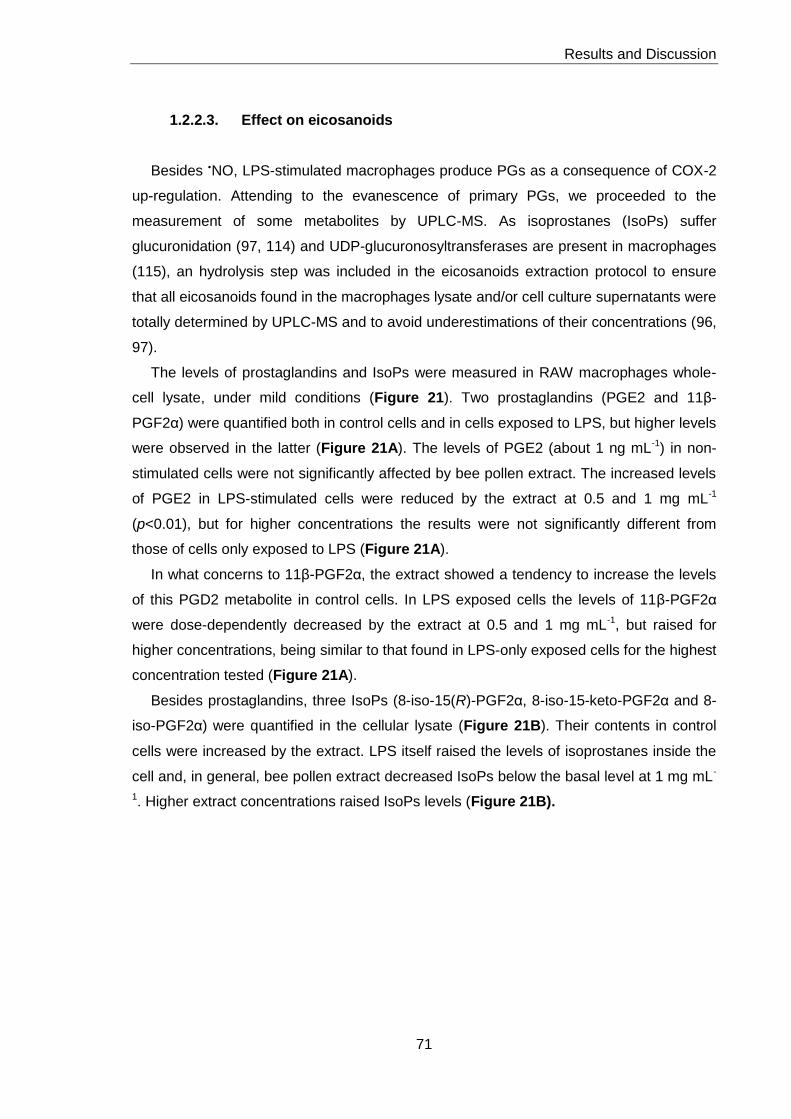
Results and Discussion
71
1.2.2.3. Effect on eicosanoids
Besides NO, LPS-stimulated macrophages produce PGs as a consequence of COX-2
up-regulation. Attending to the evanescence of primary PGs, we proceeded to the
measurement of some metabolites by UPLC-MS. As isoprostanes (IsoPs) suffer
glucuronidation (97, 114) and UDP-glucuronosyltransferases are present in macrophages
(115), an hydrolysis step was included in the eicosanoids extraction protocol to ensure
that all eicosanoids found in the macrophages lysate and/or cell culture supernatants were
totally determined by UPLC-MS and to avoid underestimations of their concentrations (96,
97).
The levels of prostaglandins and IsoPs were measured in RAW macrophages whole-
cell lysate, under mild conditions (Figure 21). Two prostaglandins (PGE2 and 11β-
PGF2α) were quantified both in control cells and in cells exposed to LPS, but higher levels
were observed in the latter (Figure 21A). The levels of PGE2 (about 1 ng mL-1) in non-
stimulated cells were not significantly affected by bee pollen extract. The increased levels
of PGE2 in LPS-stimulated cells were reduced by the extract at 0.5 and 1 mg mL-1
(p<0.01), but for higher concentrations the results were not significantly different from
those of cells only exposed to LPS (Figure 21A).
In what concerns to 11β-PGF2α, the extract showed a tendency to increase the levels
of this PGD2 metabolite in control cells. In LPS exposed cells the levels of 11β-PGF2α
were dose-dependently decreased by the extract at 0.5 and 1 mg mL-1, but raised for
higher concentrations, being similar to that found in LPS-only exposed cells for the highest
concentration tested (Figure 21A).
Besides prostaglandins, three IsoPs (8-iso-15(R)-PGF2α, 8-iso-15-keto-PGF2α and 8-
iso-PGF2α) were quantified in the cellular lysate (Figure 21B). Their contents in control
cells were increased by the extract. LPS itself raised the levels of isoprostanes inside the
cell and, in general, bee pollen extract decreased IsoPs below the basal level at 1 mg mL-
1. Higher extract concentrations raised IsoPs levels (Figure 21B).
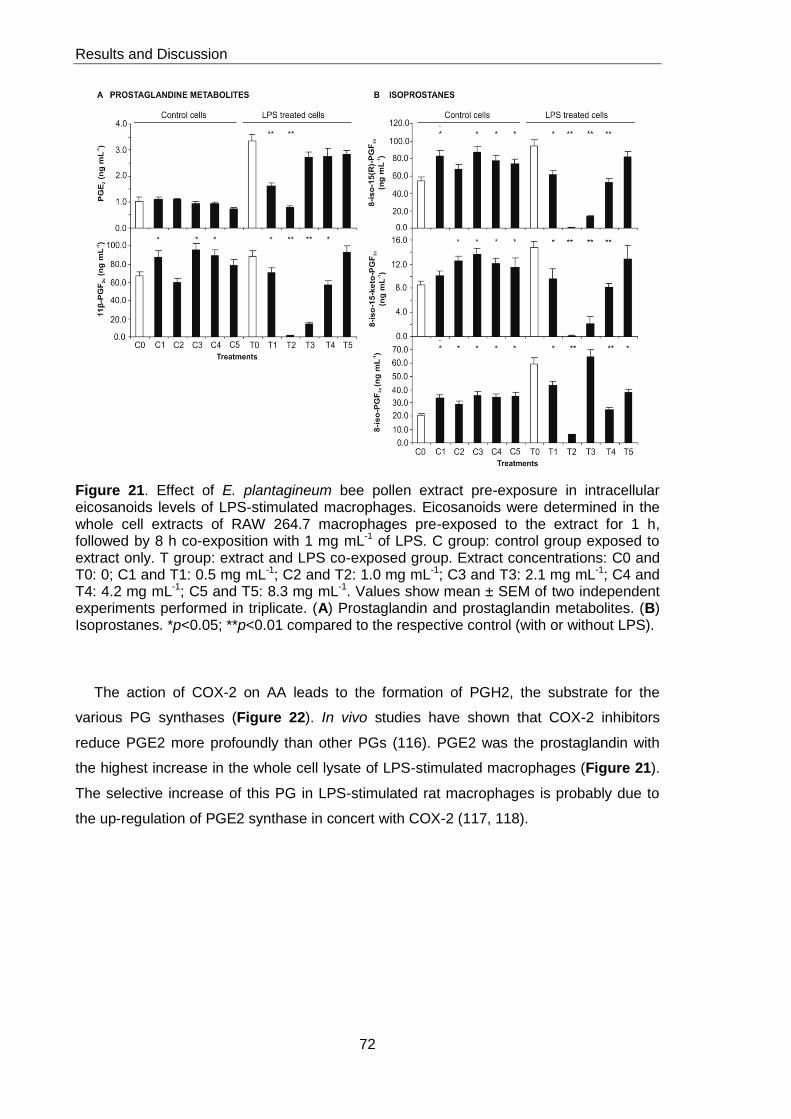
Results and Discussion
72
Figure 21. Effect of E. plantagineum bee pollen extract pre-exposure in intracellular eicosanoids levels of LPS-stimulated macrophages. Eicosanoids were determined in the whole cell extracts of RAW 264.7 macrophages pre-exposed to the extract for 1 h, followed by 8 h co-exposition with 1 mg mL-1 of LPS. C group: control group exposed to extract only. T group: extract and LPS co-exposed group. Extract concentrations: C0 and T0: 0; C1 and T1: 0.5 mg mL-1; C2 and T2: 1.0 mg mL-1; C3 and T3: 2.1 mg mL-1; C4 and T4: 4.2 mg mL-1; C5 and T5: 8.3 mg mL-1. Values show mean ± SEM of two independent experiments performed in triplicate. (A) Prostaglandin and prostaglandin metabolites. (B) Isoprostanes. *p<0.05; **p<0.01 compared to the respective control (with or without LPS).
The action of COX-2 on AA leads to the formation of PGH2, the substrate for the
various PG synthases (Figure 22). In vivo studies have shown that COX-2 inhibitors
reduce PGE2 more profoundly than other PGs (116). PGE2 was the prostaglandin with
the highest increase in the whole cell lysate of LPS-stimulated macrophages (Figure 21).
The selective increase of this PG in LPS-stimulated rat macrophages is probably due to
the up-regulation of PGE2 synthase in concert with COX-2 (117, 118).
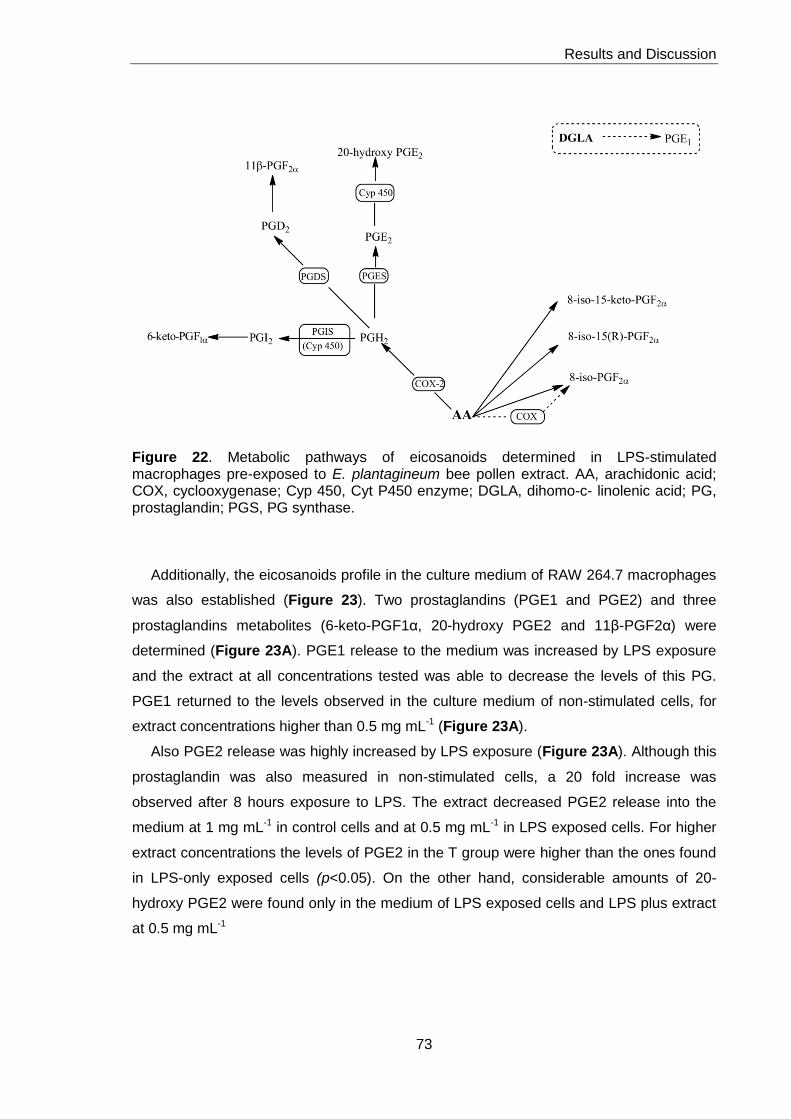
Results and Discussion
73
Figure 22. Metabolic pathways of eicosanoids determined in LPS-stimulated macrophages pre-exposed to E. plantagineum bee pollen extract. AA, arachidonic acid; COX, cyclooxygenase; Cyp 450, Cyt P450 enzyme; DGLA, dihomo-c- linolenic acid; PG, prostaglandin; PGS, PG synthase.
Additionally, the eicosanoids profile in the culture medium of RAW 264.7 macrophages
was also established (Figure 23). Two prostaglandins (PGE1 and PGE2) and three
prostaglandins metabolites (6-keto-PGF1α, 20-hydroxy PGE2 and 11β-PGF2α) were
determined (Figure 23A). PGE1 release to the medium was increased by LPS exposure
and the extract at all concentrations tested was able to decrease the levels of this PG.
PGE1 returned to the levels observed in the culture medium of non-stimulated cells, for
extract concentrations higher than 0.5 mg mL-1 (Figure 23A).
Also PGE2 release was highly increased by LPS exposure (Figure 23A). Although this
prostaglandin was also measured in non-stimulated cells, a 20 fold increase was
observed after 8 hours exposure to LPS. The extract decreased PGE2 release into the
medium at 1 mg mL-1 in control cells and at 0.5 mg mL-1 in LPS exposed cells. For higher
extract concentrations the levels of PGE2 in the T group were higher than the ones found
in LPS-only exposed cells (p<0.05). On the other hand, considerable amounts of 20-
hydroxy PGE2 were found only in the medium of LPS exposed cells and LPS plus extract
at 0.5 mg mL-1
Results and Discussion
74
and 1 mg mL-1. A similar behaviour was observed for 6-keto-PGF1α, a PGI2 metabolite
that was only quantified in the medium of LPS exposed cells and LPS plus extract at 0.5
mg mL-1.
Considering 11β-PGF2α, the amount of this PG metabolite was higher in the culture
medium of non-stimulated cells, compared to LPS-stimulated cells. Particularly in LPS-
stimulated RAW macrophages, the extract did not have a significant effect on the release
of 11β-PGF2α, except when at 2.1 mg mL-1.
In what concerns to IsoPs, it was observed that both 8-iso-15(R)-PGF2α and 8-iso-15-
keto-PGF2α increased with LPS exposure, while the levels of 8-iso-PGF2α decreased
(Figure 23B). The effect in the former IsoPs was significantly reduced by the extract only
at the lowest concentration tested (p<0.05). However, in control cells, the extract at 0.5
mg mL-1 significantly increased the levels of 8-iso-15(R)-PGF2α, 8-iso-15-keto-PGF2α, as
well as that of the prostaglandin metabolite 11β-PGF2α.
Regarding 8-iso-PGF2α, the extract at 1 mg mL-1 further decreased its level in LPS-
exposed cells.
Although PGF2α has been implicated in acute inflammation, in this model of
inflammation, tetranor-PGFM, which is PGF2α main metabolite, was not detected, neither
in whole cell extract nor in the culture medium.
U-44069, an analogue of PGH2, thromboxane A2 (as its stable analogue U-46619) and
11-dehydrothromboxane B2 were not encountered in whole cell lysates or culture medium
of macrophages.
The search for 2,3-dinor-6-keto-PGF1α (a PGI2 metabolite) and the IsoP 2,3-dinor-8-
iso-PGF2α in the cell lysate and culture medium gave negative results.
Comparing the levels of eicosanoids in the culture medium and inside the cell (Figures
21 and 23A and 23B) it can be observed that eicosanoids are mainly secreted into the
medium, with the exception of 11β-PGF2α and 8-iso-PGF2α that are present at similar
levels inside and outside the cell.
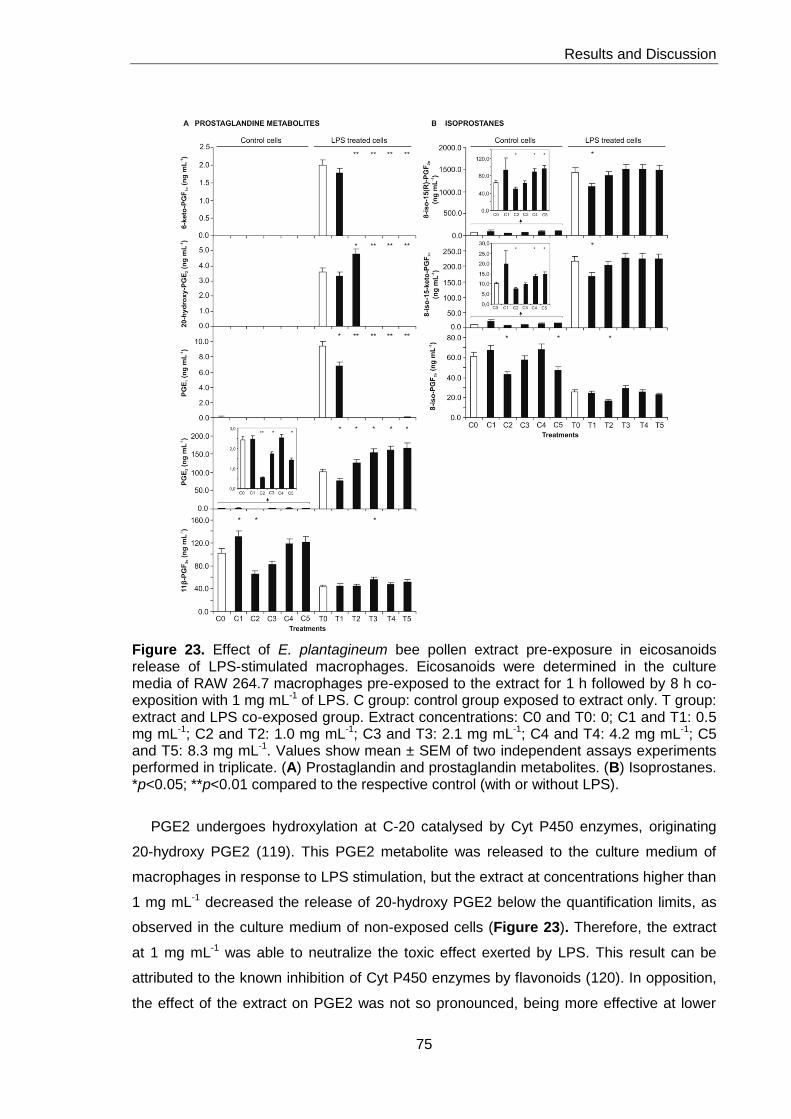
Results and Discussion
75
Figure 23. Effect of E. plantagineum bee pollen extract pre-exposure in eicosanoids release of LPS-stimulated macrophages. Eicosanoids were determined in the culture media of RAW 264.7 macrophages pre-exposed to the extract for 1 h followed by 8 h co-exposition with 1 mg mL-1 of LPS. C group: control group exposed to extract only. T group: extract and LPS co-exposed group. Extract concentrations: C0 and T0: 0; C1 and T1: 0.5 mg mL-1; C2 and T2: 1.0 mg mL-1; C3 and T3: 2.1 mg mL-1; C4 and T4: 4.2 mg mL-1; C5 and T5: 8.3 mg mL-1. Values show mean ± SEM of two independent assays experiments performed in triplicate. (A) Prostaglandin and prostaglandin metabolites. (B) Isoprostanes. *p<0.05; **p<0.01 compared to the respective control (with or without LPS).
PGE2 undergoes hydroxylation at C-20 catalysed by Cyt P450 enzymes, originating
20-hydroxy PGE2 (119). This PGE2 metabolite was released to the culture medium of
macrophages in response to LPS stimulation, but the extract at concentrations higher than
1 mg mL-1 decreased the release of 20-hydroxy PGE2 below the quantification limits, as
observed in the culture medium of non-exposed cells (Figure 23). Therefore, the extract
at 1 mg mL-1 was able to neutralize the toxic effect exerted by LPS. This result can be
attributed to the known inhibition of Cyt P450 enzymes by flavonoids (120). In opposition,
the effect of the extract on PGE2 was not so pronounced, being more effective at lower

Results and Discussion
76
concentrations (Figures 21 and 23). Tetranor-PGEM and tetranor-PGAM, PGE2
metabolites (121), were not detected.
PGE1, a PG derived from dihomo-c-linolenic acid (Figure 22), was found in the culture
medium of LPS stimulated macrophages. The extract was more effective in decreasing
the release of PGE1 than of PGE2 (Figure 23).
As said above, another prostanoid found in the culture medium of cells exposed to LPS
was 6-keto PGF1α, a PGI2 metabolite (Figure 23). PGI2 formation is mediated by
prostacyclin synthase, a member of the Cyt P450 monooxygenase family. PGI2 is readily
hydrolysed to form the stable 6-keto PGF1α (121). Interestingly, cells treated with the
lowest extract concentration did not significantly alter the concentration of this metabolite,
although for all the other extract concentrations 6-keto PGF1α levels were below
quantification limits. So, it is possible that the phenolic compounds present in the extract
exert an inhibitory effect on prostacyclin synthase, under inflammatory conditions, as seen
for the inducible form of NOS.
Thromboxane A2 biosynthesis is also catalysed by a member of the Cyt P450 enzymes
and it counteracts PGI2 action (121). The absence of thromboxane A2 and its metabolite
could be expected, since thromboxane A2 formation is mediated by COX- 1, although in
LPS-stimulated cells COX-2 can also be involved (117).
PGD2 has important roles in the mediation and resolution of inflammation. This PG is
converted to several metabolites, including 11β-PGF2α, which maintains the biological
activity of PGE2 (122). 11β-PGF2α was quantified in the cellular lysate and culture
medium of control and LPS-exposed cells (Figures 21 and 23). The increase of PGE2 in
the culture medium of LPS-stimulated macrophages compared to control group was
accompanied by a decrease of 11β-PGF2α (Figure 23). PGD2 is a structural isomer of
PGE2, and this can explain the opposite tendency observed for this prostanoid. In
unstimulated macrophages PGD2 generation is coupled to the constitutive COX-1 (117).
So, the decrease of 11β-PGF2α in the culture medium of LPS-stimulated cells when
compared to control cells can be justified by the preferred production of PGE2, which is in
agreement with bibliography (117). This fact can also explain why the extract had no
effect in the release of 11β-PGF2α into the medium, since phenolic compounds mainly
affect COX-2 (123). However, the intracellular level of 11β- PGF2α was increased by LPS
and a decrease of this metabolite was observed when cells were also exposed to the
extract (except for the highest concentration) in comparison with cells exposed only to
LPS (Figure 21).
Results and Discussion
77
As previously said, the bee pollen extract used in this work was characterized by the
presence of kaempferol and quercetin derivatives. It is well known that kaempferol inhibits
iNOS, COX-2 expression and PGE2 formation in LPS-activated RAW macrophages (124).
Also quercetin was found to decrease PGE2 in the culture medium of LPS-stimulated
RAW macrophages (125), the reduction being much stronger in J774A.1 macrophages
(126).
The iNOS inhibitory activity of flavonoids is attributed to the inhibition of NF-kB
induction (124). The more active flavonoids possess a double bond between C-2 and C-3
and a 5,7-dihydroxyl group. The hydroxyl group at C-3 decreases the inhibitory potency
(93). On the other hand, COX-2 inhibition by flavonoids is less studied, but is also partly
attributed to NF-kB inhibition. NFkB is involved in COX-2 protein expression in LPS-
stimulated J774.1 macrophages and the exposition of these cells to NF-kB inhibitors
before LPS challenge abrogates the generation PGE2 and 6-keto PGF1α (125). In fact, 6-
keto PGF1α release was inhibited by the extract, except for the lowest concentration
tested, while a decrease of PGE2 release was only observed for this concentration
(Figure 23).
It can be expected polyphenol aglycones to be more potent than their heterosides. For
instance, Kim and collaborators showed that isoliquiritigenin was significantly more active
than its 4-O-glucoside (isoliquiritin) in reducing NO and PGE2 production, as well as
protein and mRNA expression of iNOS and COX-2 (126). This result was explained by the
different lipophilicity, which affects the cellular uptake and compatibility with cellular
membranes (126). Also the inhibition of iNOS and COX-2 expression by quercetin was
higher than the one of its 3-O-rutinoside, rutin (125). Nevertheless, the decrease of PG
observed when cells were exposed to the extract at 0.5 or 0.1 mg mL-1 is probably due to
the inhibitory action of the flavonol heterosides that characterize the bee pollen extract.
It has been suggested a cross-talk between NOS and COX enzymes (127). NO may
act through generation of peroxynitrite as the endogenous oxidant needed to create the
tyrosyl radical required for catalytic activity of COX enzymes. NO exerts divergent effects
on constitutive and inducible COX isoforms, activating COX-1, but inactivating COX-2
(127). This may explain why extract concentrations that reduce NO to lower levels failed
to reduce the levels of PGE2, the major PG released by LPS stimulated macrophages
(Figures 21 and 23).
Conversely, PGE2 demonstrated to modulate NO pathway in LPS-stimulated
Results and Discussion
78
macrophages (128). These results were not confirmed by Swierkosz and collaborators,
who found that the formation of COX metabolites had no effect on NOS activity, whereas
NO inhibits both COX-2 activity and induction (129).
IsoPs are derived from the free radical-catalysed peroxidation of AA in a COX
independent mechanism (Figure 22). Due to the lack of enzymatic control, a series of
stereoisomers can be formed (122). IsoPs are reliable markers of lipid peroxidation in vivo
and potentially mediate some of the adverse effects of oxidant injury (130). In this study
three IsoPs of the 8-series (containing the nonprostane hydroxyl group at C-8) were
encountered, both in the cell lysate and in the culture medium (Figures 21 and 23). In
general, LPS treatment leads to an increase of IsoPS, which can be a consequence of the
increase of NO in LPS-exposed macrophages. The excess of NO production can lead to
peroxynitrite formation, which is associated with increased IsoP generation in vitro and in
vivo (131, 132).
8-iso-PGF2α showed a different behaviour, since the release of this IsoP into the
culture medium after 8 h exposition to LPS decreased when compared with control cells
(Figure 23). 8-iso-PGF2α can be formed via COX-2 in monocytes and, as so, it was
expected to increase under a pro-inflammatory stimulus (133). Nevertheless, at this time
the level of 8-iso-PGF2α in cell lysate of LPS stimulated cells was higher than in control
cells (Figure 21).
IsoPs levels showed a tendency to be increased by extract concentrations above 1 mg
mL-1, despite the decrease of NO contents (Figures 20, 21 and 23). This can be
attributed to a pro-oxidant behaviour of phenolic compounds when present at high
concentrations (observed in the O2- cell-free assay), despite the ability of these
compounds to inhibit iNOS induction in macrophages under an inflammatory stimulus
(125, 126).
1.2.3. Effect on degranulation
In this study we used a crude extract to evaluate the anti-allergic potential of E.
plantagineum bee pollen since bee pollen is consumed in folk and complementary
medicines as a whole (134). So the extraction method used allowed the recovery of a
wide variety of compounds, in order to guarantee that the compounds that have an activity
in vivo were not lost during the extraction process.
The extract revealed to be composed by several organic and fatty acids, as shown in
tables 4 and 5, respectively. These compounds could affect the results of degranulation
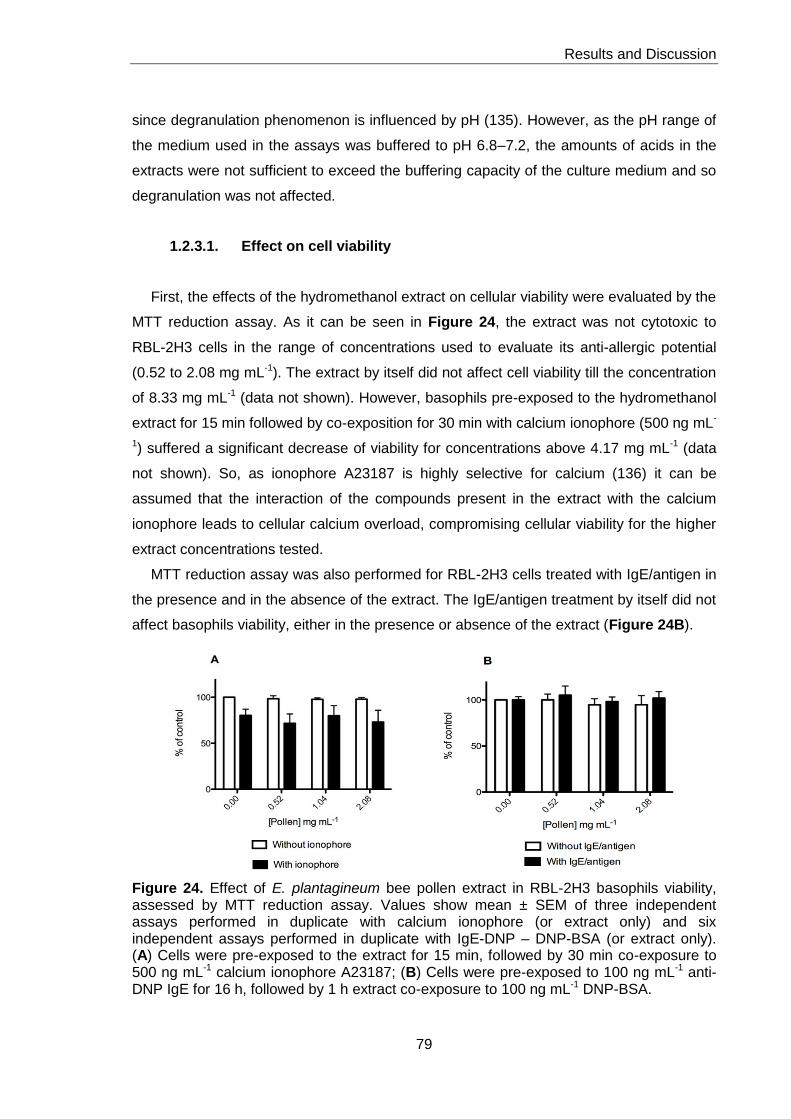
Results and Discussion
79
since degranulation phenomenon is influenced by pH (135). However, as the pH range of
the medium used in the assays was buffered to pH 6.8–7.2, the amounts of acids in the
extracts were not sufficient to exceed the buffering capacity of the culture medium and so
degranulation was not affected.
1.2.3.1. Effect on cell viability
First, the effects of the hydromethanol extract on cellular viability were evaluated by the
MTT reduction assay. As it can be seen in Figure 24, the extract was not cytotoxic to
RBL-2H3 cells in the range of concentrations used to evaluate its anti-allergic potential
(0.52 to 2.08 mg mL-1). The extract by itself did not affect cell viability till the concentration
of 8.33 mg mL-1 (data not shown). However, basophils pre-exposed to the hydromethanol
extract for 15 min followed by co-exposition for 30 min with calcium ionophore (500 ng mL-
1) suffered a significant decrease of viability for concentrations above 4.17 mg mL-1 (data
not shown). So, as ionophore A23187 is highly selective for calcium (136) it can be
assumed that the interaction of the compounds present in the extract with the calcium
ionophore leads to cellular calcium overload, compromising cellular viability for the higher
extract concentrations tested.
MTT reduction assay was also performed for RBL-2H3 cells treated with IgE/antigen in
the presence and in the absence of the extract. The IgE/antigen treatment by itself did not
affect basophils viability, either in the presence or absence of the extract (Figure 24B).
Figure 24. Effect of E. plantagineum bee pollen extract in RBL-2H3 basophils viability, assessed by MTT reduction assay. Values show mean ± SEM of three independent assays performed in duplicate with calcium ionophore (or extract only) and six independent assays performed in duplicate with IgE-DNP – DNP-BSA (or extract only). (A) Cells were pre-exposed to the extract for 15 min, followed by 30 min co-exposure to 500 ng mL-1 calcium ionophore A23187; (B) Cells were pre-exposed to 100 ng mL-1 anti-DNP IgE for 16 h, followed by 1 h extract co-exposure to 100 ng mL-1 DNP-BSA.
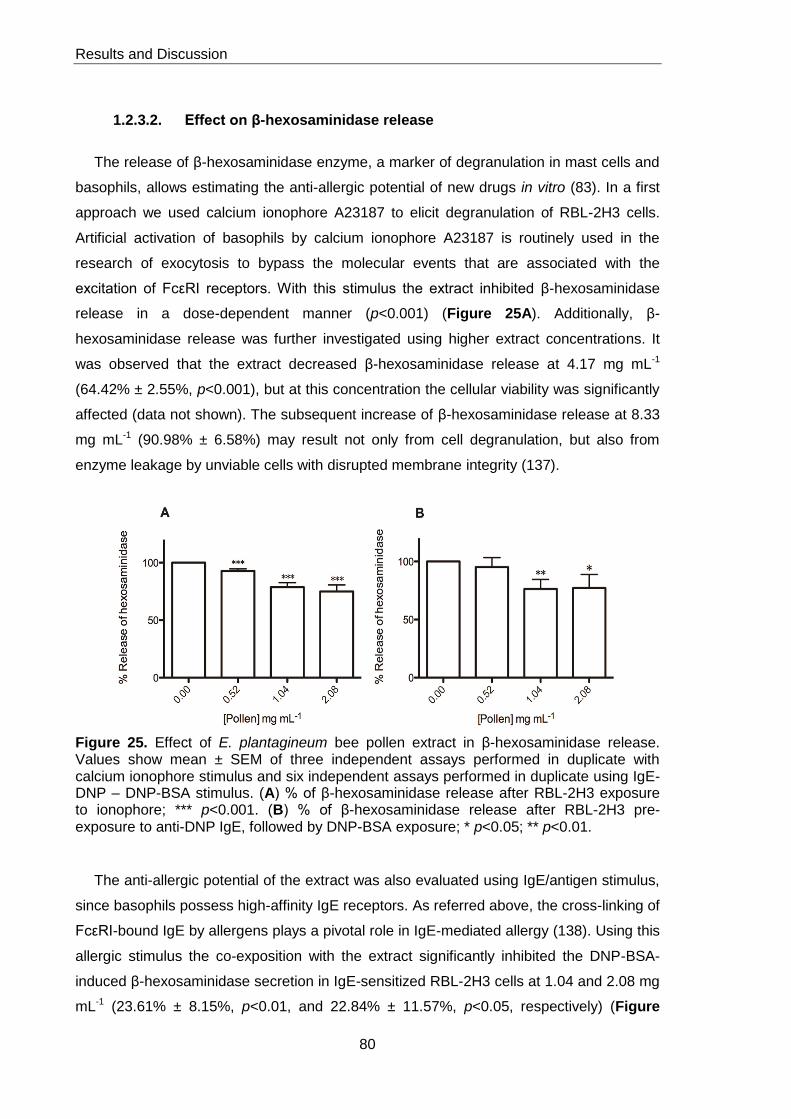
Results and Discussion
80
1.2.3.2. Effect on β-hexosaminidase release
The release of β-hexosaminidase enzyme, a marker of degranulation in mast cells and
basophils, allows estimating the anti-allergic potential of new drugs in vitro (83). In a first
approach we used calcium ionophore A23187 to elicit degranulation of RBL-2H3 cells.
Artificial activation of basophils by calcium ionophore A23187 is routinely used in the
research of exocytosis to bypass the molecular events that are associated with the
excitation of FcεRI receptors. With this stimulus the extract inhibited β-hexosaminidase
release in a dose-dependent manner (p<0.001) (Figure 25A). Additionally, β-
hexosaminidase release was further investigated using higher extract concentrations. It
was observed that the extract decreased β-hexosaminidase release at 4.17 mg mL-1
(64.42% ± 2.55%, p<0.001), but at this concentration the cellular viability was significantly
affected (data not shown). The subsequent increase of β-hexosaminidase release at 8.33
mg mL-1 (90.98% ± 6.58%) may result not only from cell degranulation, but also from
enzyme leakage by unviable cells with disrupted membrane integrity (137).
Figure 25. Effect of E. plantagineum bee pollen extract in β-hexosaminidase release. Values show mean ± SEM of three independent assays performed in duplicate with calcium ionophore stimulus and six independent assays performed in duplicate using IgE-DNP – DNP-BSA stimulus. (A) % of β-hexosaminidase release after RBL-2H3 exposure to ionophore; *** p<0.001. (B) % of β-hexosaminidase release after RBL-2H3 pre-exposure to anti-DNP IgE, followed by DNP-BSA exposure; * p<0.05; ** p<0.01.
The anti-allergic potential of the extract was also evaluated using IgE/antigen stimulus,
since basophils possess high-affinity IgE receptors. As referred above, the cross-linking of
FcεRI-bound IgE by allergens plays a pivotal role in IgE-mediated allergy (138). Using this
allergic stimulus the co-exposition with the extract significantly inhibited the DNP-BSA-
induced β-hexosaminidase secretion in IgE-sensitized RBL-2H3 cells at 1.04 and 2.08 mg
mL-1 (23.61% ± 8.15%, p<0.01, and 22.84% ± 11.57%, p<0.05, respectively) (Figure
Results and Discussion
81
25B). As observed with the calcium ionophore, when higher concentrations of the extract
were assayed, an increase in β-hexosaminidase release was observed (data not shown).
However, with this stimulus there was no observable decrease of cell viability. So, we can
argue that at higher concentrations the extract demonstrated a potential allergic effect in
IgE sensitized basophils. In fact, the hydromethanol extract has demonstrated a pro-
oxidant potential at these same concentrations, as mentioned in section 1.2.1. .Thus, it
may be speculated that the generation of reactive oxygen species influenced the signaling
pathways evoked by the IgE/antigen stimulus, leading to enhanced degranulation. This
behaviour has already been observed for compounds with pro-oxidant activity (139).
The anti-allergic potential demonstrated by the extract can be attributed to several
compounds, namely to the polyphenols shown in table 3 and to the fatty acids displayed
in table 5. Palmitic and α-linolenic acids, the two major fatty acids identified in the extract,
have known anti-allergic effects. In fact, among the fatty acids found in the extract, α-
linolenic acid has been demonstrated to reduce the release of inflammatory mediators,
including histamine and prostaglandin E2 (140). Moreover, epidemiological studies show
that high intake of α-linolenic and palmitic acids during pregnancy may decrease the risk
of asthma of the offspring (141). So, the anti-degranulation effects observed in the model
used in the present study can result partially from the presence of fatty acids in the
extract.
Concerning to polyphenols, these compounds are well known for their anti-allergic
potential (141). In fact, the tested extract contains derivatives of quercetin and kaempferol
(Table 3), which have inhibitory effect on degranulation of mast cells and basophils (142).
This effect is thought to result from two mechanisms: one by which polyphenols impact
allergen-IgE complex formation, and another through which they impact on the binding of
this complex to their basophil FcεRI (142). This can be explained by the formation of
insoluble complexes between the polyphenols and potential allergenic proteins, rendering
them to be hypoallergenic (142). Nevertheless, the extract was more effective in inhibiting
degranulation when the calcium ionophore was used: the effective concentrations ranged
between 0.52 mg mL-1 and 2.08 mg mL-1, while in the assay with IgE/antigen the effective
concentrations varied between 1.04 mg mL-1 and 2.08 mg mL-1, suggesting that the
compounds present in the extract also affected the increase of cytoplasmic calcium, an
event that immediately precedes degranulation.
A direct effect of organic acids in degranulation could not be established. However, as
malonic and acetic acids are precursors of fatty acids and also of flavonoids (together with
shikimic acid), the determination of organic acids was considered important for the
Results and Discussion
82
characterization of the metabolic profile of this matrix.
In order to clarify whether the effects of the extract were due to the inhibition of
hexosaminidase release, and not a false positive resulting from the inhibition of β-
hexosaminidase activity, we tested the effect of the extract on β-hexosaminidase activity
using a basophil cell lysate as source of β-hexosaminidase. As the extract did not inhibit
β-hexosaminidase enzymatic activity (data not shown), the β-hexosaminidase results
observed in basophils insulted with an allergic stimulus are due to the extract effects on
degranulation.
Considering the results obtained with the extract, although the percentage of inhibition
of degranulation was not very high, it was significantly different from the control, justifying
the traditional use of bee pollen in allergic diseases.
1.2.3.3. Effect on soybean lipoxygenase activity
Lipoxygenases are enzymes involved in the AA pathway, which catalyze the
peroxidation of polyunsaturated fatty acids in a selective way. 5-Lipoxygenase
metabolizes free AA to 5-hydroperoxy-eicosatetraenoic acid (5-HPETE), which is further
metabolized to leukotrienes. These compounds are pivotal lipid mediators in allergy and
inflammation (143). Because of structural and functional similarities with mammalian
enzymes, lipoxygenase obtained from soybean is widely accepted as a model for
lipoxygenase inhibition studies (144). In this assay, E. plantagineum bee pollen
hydromethanolic extract was not able to inhibit the activity of this enzyme. As shown in
section 1.2.2.3., the extract decreased the levels of AA metabolites derived from COX-2 in
LPS-stimulated macrophages, demonstrating that it has anti-inflammatory activity. As
during an allergic reaction an inflammatory activity is involved, the extract can contribute
to ameliorate the symptoms of allergy, through a mechanism not involving the inhibition of
lipoxygenase.
1.2.4. Antibacterial capacity
In order to evaluate the antimicrobial potential of E. plantagineum bee pollen, the
hydro- methanol extract was screened against Gram-positive and Gram-negative bacteria.
Concerning to the effect against Gram-positive bacteria, S. aureus was the only one for
which it was possible to determine the MIC value (Table 6). The extract also showed

Results and Discussion
83
some effect against other two Gram-positive bacteria, S. epidermidis and M. luteus, with
MLC values of 100 and 200 mg mL-1, respectively (Table 6).
Table 6. MIC and MLC values (mg mL-1 pollen) obtained with E. plantagineum bee pollen
hydromethanol extract against selected bacteria.
Microorganism MIC MLC
Gram-positive
S. aureus
200 100
S. epidermidis
- 100
M. luteus
- 200
E. faecalis
- -
B. cereus
- -
Gram-negative
P. mirabillis
- -
E. coli
- -
P. aeruginosa
- -
S. typhimurium
- -
Under the tested concentrations, all Gram-negative bacteria were found to be resistant
to the extract. Previous studies indicated that Gram-negative bacteria appear to be less
sensitive to the action of several natural extracts (114), which agrees with the results
above presented. The reason for this may be related with the physical differences
between the cell walls of Gram-positive and Gram-negative bacteria. The external
membrane with high content of lipopolysaccharide that surrounds the cell wall in the latter
is considered to be the major factor contributing to its resistance to chemical stress (115,
116).
From the obtained data it can be stated that E. plantagineum bee pollen has low anti-
bacterial activity and only in very high concentrations. As the bee pollen contains organic
acids, the activity observed might be attributed to these compounds, as they have been
reported to exhibit general antimicrobial activities and are commonly used as food
preservatives. Also, it is known that plants synthesize phenolic compounds in response to
Results and Discussion
84
microbial infection (117) and have shown antimicrobial activity in vitro against a wide
range of microorganisms. Phenolic activity is concentration-dependent and possibly its
concentration in the extract was not sufficiently high as to cause a marked bacterial
inhibition.
2. Acidified methanol extract
2.1. Phenolic composition
In order to study the protective effect of E. plantagineum bee pollen on cells of the
digestive tract, an acidified methanol extract was prepared. The purpose was to assess
the effect of each of the two classes of phenolic compounds present in the extract, non-
coloured flavonoids and anthocyanins, and also of the extract as a whole. As
anthocyanins are positively charged at acidic pH and several authors reported that
acidified methanol preserves the extracted anthocyanin in their original form, better than in
a non-acidified solvent system (145), the methanol extract was acidified. The crude
extract was fractioned by SPE using ethyl acetate and methanol as eluents. Two fractions
were separated, one enriched in non-coloured flavonoids (fraction I) and the other
enriched in anthocyanins (fraction II). Twelve phenolic compounds were identified,
belonging to flavonols (7 compounds) and anthocyanins (5 compounds), as described
below.
2.1.1. Non-coloured phenolic profile
2.1.1.1. Qualitative analysis
The determined non-coloured phenolic compounds were all derivatives of kaempferol
(Table 7, Figure 26). Fraction I (eluted with ethyl acetate) contained six compounds, while
fraction II (collected with methanol, after ethyl acetate elution) and the whole extract
contained all the identified compounds. In all of the cases the major compound found was
kaempferol-3-O-neohesperidoside, representing between 73.2% (fraction I) and 75.2%
(whole extract) of the identified compounds.
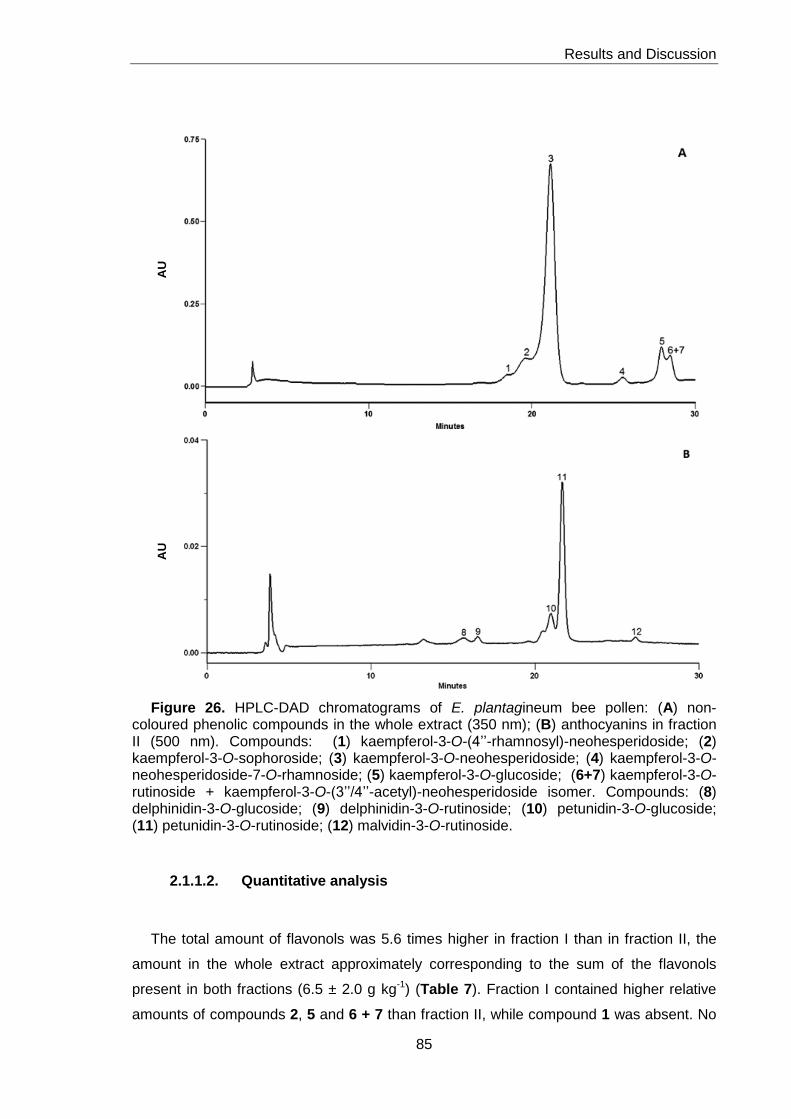
Results and Discussion
85
Figure 26. HPLC-DAD chromatograms of E. plantagineum bee pollen: (A) non-coloured phenolic compounds in the whole extract (350 nm); (B) anthocyanins in fraction II (500 nm). Compounds: (1) kaempferol-3-O-(4’’-rhamnosyl)-neohesperidoside; (2) kaempferol-3-O-sophoroside; (3) kaempferol-3-O-neohesperidoside; (4) kaempferol-3-O-neohesperidoside-7-O-rhamnoside; (5) kaempferol-3-O-glucoside; (6+7) kaempferol-3-O-rutinoside + kaempferol-3-O-(3’’/4’’-acetyl)-neohesperidoside isomer. Compounds: (8) delphinidin-3-O-glucoside; (9) delphinidin-3-O-rutinoside; (10) petunidin-3-O-glucoside; (11) petunidin-3-O-rutinoside; (12) malvidin-3-O-rutinoside.
2.1.1.2. Quantitative analysis
The total amount of flavonols was 5.6 times higher in fraction I than in fraction II, the
amount in the whole extract approximately corresponding to the sum of the flavonols
present in both fractions (6.5 ± 2.0 g kg-1) (Table 7). Fraction I contained higher relative
amounts of compounds 2, 5 and 6 + 7 than fraction II, while compound 1 was absent. No
AU
A
U
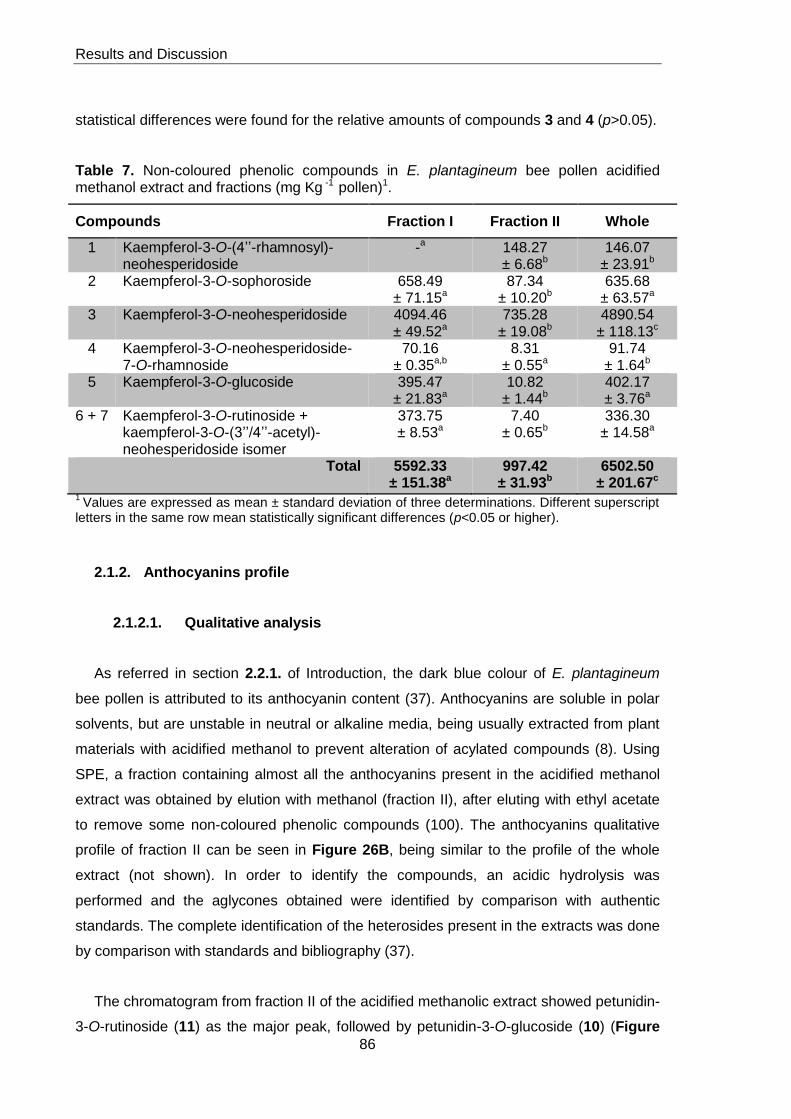
Results and Discussion
86
statistical differences were found for the relative amounts of compounds 3 and 4 (p>0.05).
Table 7. Non-coloured phenolic compounds in E. plantagineum bee pollen acidified methanol extract and fractions (mg Kg -1 pollen)1.
Compounds Fraction I Fraction II Whole
1 Kaempferol-3-O-(4’’-rhamnosyl)-neohesperidoside
-a 148.27 ± 6.68b
146.07 ± 23.91b
2 Kaempferol-3-O-sophoroside 658.49 ± 71.15a
87.34 ± 10.20b
635.68 ± 63.57a
3 Kaempferol-3-O-neohesperidoside 4094.46 ± 49.52a
735.28 ± 19.08b
4890.54 ± 118.13c
4 Kaempferol-3-O-neohesperidoside-7-O-rhamnoside
70.16 ± 0.35a,b
8.31 ± 0.55a
91.74 ± 1.64b
5 Kaempferol-3-O-glucoside 395.47 ± 21.83a
10.82 ± 1.44b
402.17 ± 3.76a
6 + 7 Kaempferol-3-O-rutinoside + kaempferol-3-O-(3’’/4’’-acetyl)-neohesperidoside isomer
373.75 ± 8.53a
7.40 ± 0.65b
336.30 ± 14.58a
Total 5592.33 ± 151.38a
997.42 ± 31.93b
6502.50 ± 201.67c
1 Values are expressed as mean ± standard deviation of three determinations. Different superscript
letters in the same row mean statistically significant differences (p<0.05 or higher).
2.1.2. Anthocyanins profile
2.1.2.1. Qualitative analysis
As referred in section 2.2.1. of Introduction, the dark blue colour of E. plantagineum
bee pollen is attributed to its anthocyanin content (37). Anthocyanins are soluble in polar
solvents, but are unstable in neutral or alkaline media, being usually extracted from plant
materials with acidified methanol to prevent alteration of acylated compounds (8). Using
SPE, a fraction containing almost all the anthocyanins present in the acidified methanol
extract was obtained by elution with methanol (fraction II), after eluting with ethyl acetate
to remove some non-coloured phenolic compounds (100). The anthocyanins qualitative
profile of fraction II can be seen in Figure 26B, being similar to the profile of the whole
extract (not shown). In order to identify the compounds, an acidic hydrolysis was
performed and the aglycones obtained were identified by comparison with authentic
standards. The complete identification of the heterosides present in the extracts was done
by comparison with standards and bibliography (37).
The chromatogram from fraction II of the acidified methanolic extract showed petunidin-
3-O-rutinoside (11) as the major peak, followed by petunidin-3-O-glucoside (10) (Figure

Results and Discussion
87
26B).
2.1.2.2. Quantitative analysis
The total amount of anthocyanins was higher in the whole extract than in fraction II.
Petunidin-3-O-rutinoside (compound 11) was the major compound in both, being the only
anthocyanin present in fraction I. This compound was found in the whole extract at higher
quantity than its sum in fractions I and II. Delphinidin-3-O-glucoside and delphinidin-3-O-
rutinoside were present in higher concentration in fraction II than in the whole extract
(Table 8). Because compound 11 co-eluted with compound 3, the latter being more
concentrated than the former in the whole extract, the quantification of compound 11 was
less accurate in the whole extract (though the compounds absorb at different
wavelengths). The total amount of identified anthocyanins corresponded to 0.313 mg kg-1
in fraction I, 32.6 mg kg-1 in fraction II and 38.3 mg kg-1 in the whole extract, compound 11
accounting for 100.0, 74.7 and 77.3% of the total identified anthocyanins, respectively.
Table 8. Coloured phenolic compounds from E. plantagineum bee pollen acidified methanol extract and its fractions (mg Kg-1 pollen)1.
Compounds Fraction I Fraction II Whole
8 Delphinidin-3-O-glucoside -a
1.21 ± 0.05b
1.03 ± 0.03b
9 Delphinidin-3-O-rutinoside -a
0.95 ± 0.06b
0.88 ± 0.10b
10 Petunidin-3-O-glucoside -a
5.41 ± 0.30b
5.88 ± 0.48b
11 Petunidin-3-O-rutinoside 0.31 ± 0.003a
24.30 ± 0.17b
29.56 ± 0.58c
12
Malvidin-3-O-rutinoside -a
0.68 ± 0.02a,b
0.92 ± 0.06b
Total 0.31 ± 0.003a
32.56 ± 0.60b
38.26 ± 1.26c
1Values are expressed as mean ± standard deviation of three determinations. Different superscript
letters in the same row mean statistically significant differences (p<0.05 or higher).
2.2. Biological effects
Protective effects were assessed in Caco-2 cells that mimic the enterocytes of small
intestine.
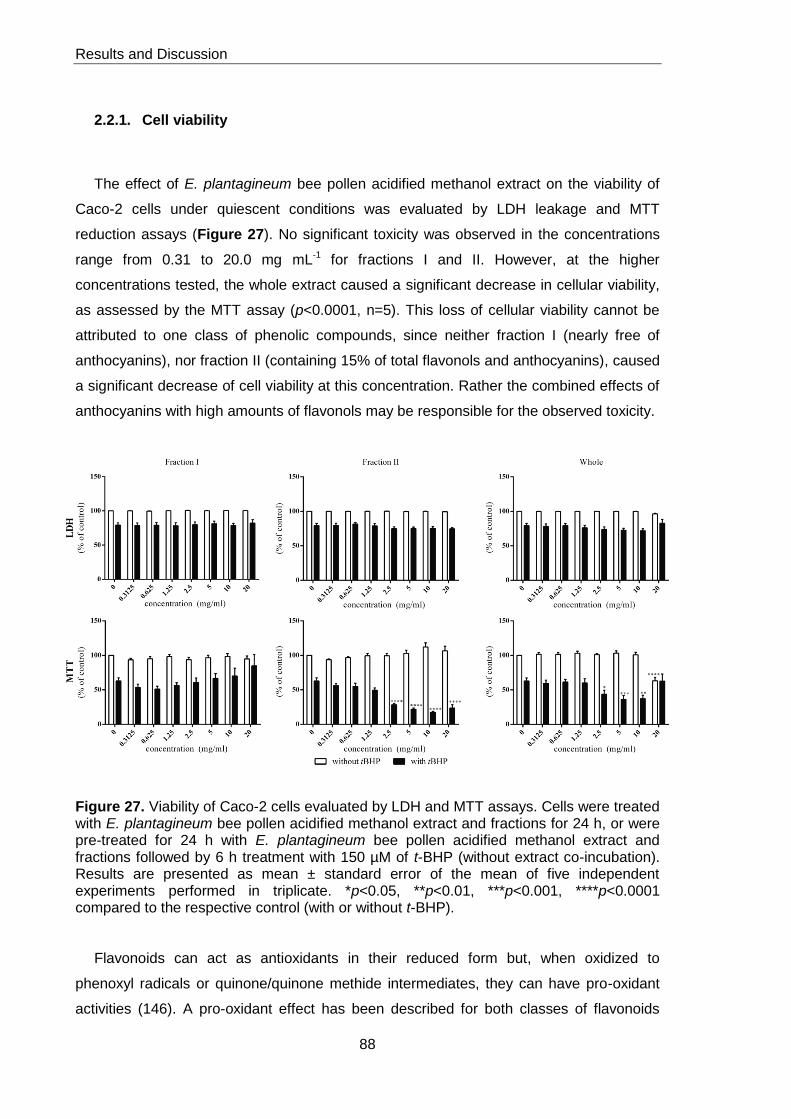
Results and Discussion
88
2.2.1. Cell viability
The effect of E. plantagineum bee pollen acidified methanol extract on the viability of
Caco-2 cells under quiescent conditions was evaluated by LDH leakage and MTT
reduction assays (Figure 27). No significant toxicity was observed in the concentrations
range from 0.31 to 20.0 mg mL-1 for fractions I and II. However, at the higher
concentrations tested, the whole extract caused a significant decrease in cellular viability,
as assessed by the MTT assay (p<0.0001, n=5). This loss of cellular viability cannot be
attributed to one class of phenolic compounds, since neither fraction I (nearly free of
anthocyanins), nor fraction II (containing 15% of total flavonols and anthocyanins), caused
a significant decrease of cell viability at this concentration. Rather the combined effects of
anthocyanins with high amounts of flavonols may be responsible for the observed toxicity.
Figure 27. Viability of Caco-2 cells evaluated by LDH and MTT assays. Cells were treated with E. plantagineum bee pollen acidified methanol extract and fractions for 24 h, or were pre-treated for 24 h with E. plantagineum bee pollen acidified methanol extract and fractions followed by 6 h treatment with 150 µM of t-BHP (without extract co-incubation). Results are presented as mean ± standard error of the mean of five independent experiments performed in triplicate. *p<0.05, **p<0.01, ***p<0.001, ****p<0.0001 compared to the respective control (with or without t-BHP).
Flavonoids can act as antioxidants in their reduced form but, when oxidized to
phenoxyl radicals or quinone/quinone methide intermediates, they can have pro-oxidant
activities (146). A pro-oxidant effect has been described for both classes of flavonoids
Results and Discussion
89
present in E. plantagineum bee pollen. Flavonol compounds with a phenolic B ring like the
kaempferol derivatives found in the extracts may act as pro-oxidants after oxidation by
peroxidases/H2O2 to phenoxyl radicals, accompanied by GSH co-oxidation and oxygen
activation, resulting in superoxide radical and H2O2 formation (147). Also, a pro-oxidant
effect of anthocyanidins in HL-60 cells was attributed to intracellular hydrogen peroxide
production, triggering an apoptotic death program through oxidative stress (148). This
may explain why only in the MTT assay a significant loss of viability was observed.
Oxidative stress can be induced in cells by t-BHP, which is metabolized by Cyt P450,
leading to the formation of toxic peroxyl and alkoxyl radicals that initiate lipid peroxidation,
affect cell integrity and form covalent bonds with cellular molecules, resulting in cell death
(149, 150). The exposition of Caco-2 cells to 150 µM t-BHP for 6 h lead to a reduction of
viability to 79.3 ± 3.2 % of control in LDH leakage assay (p<0.0001, n = 5) and 63.0 ± 0.3
% in the MTT assay (p<0.001; n = 5). The higher sensitivity of MTT assay in detecting t-
BHP toxicity can be explained by the fact that its biotransformation by Cyt P450 and GPx
occurs mainly in the mitochondria (149, 151, 152). The pre-treatment of Caco-2 cells with
the extracts did not prevented, nor aggravated, the toxicity of t-BHP, as measured by the
LDH leakage assay (Figure 27). However, the extracts containing anthocyanins (fraction
II and the whole extract) significantly aggravated t-BHP toxicity, as measured by the MTT
assay, fraction II being more deleterious (Figure 27). When the cells were pre-treated with
this fraction, a significant increase of cell death (compared to the control with t-BHP) was
observed for extract concentrations higher than 1.25 mg mL-1 (p<0.0001, n=5), while with
the whole extract the differences in cellular viability were only seen between 2.5 and 10
mg mL-1 (p<0.001 or higher, n=5). The additional cellular death, observed only in the MTT
assay, may be a consequence of the depletion of cellular defences of cells pre-exposed to
anthocyanins, due to their ability to induce the production of reactive species (148).
On the other hand, fraction I showed a tendency to protect Caco-2 cells from t-BHP-
induced toxicity, directly dependent on its concentration, although the differences of
cellular viability were not statistically significant (Figure 27). The viability of cells pre-
treated with faction I at the concentration of 20 mg mL-1 was increased to 84.7 ± 16.3% of
control, as measured by the MTT assay. Also, the pre-exposition to the whole extract at
20.0 mg mL-1 did not increased cellular death assessed by the MTT assay (p>0.05, n=5),
which was nearly the same has in the cells exposed to t-BHP only, although at this
concentration the whole extract induced cellular death by itself (Figure 27). It can be
assumed that, in insulted cells, the pre-exposition to flavonols may stimulate antioxidant
defences, which help fighting the subsequent oxidative stress induced by t-BHP.
Probably, the pro-oxidant effects of anthocyanins do not prepare the cells for a
Results and Discussion
90
subsequent insult, resulting in increased toxicity. As observed in the assay with the whole
extract at 20 mg mL-1, this toxicity can be counteracted by the defences induced by
flavonols, although they contribute to the overall oxidative stress observed in cells
exposed to the extract.
The effects of E. plantagineum bee pollen in cellular viability greatly depend upon the
cell line. In fact, as shown above, the hydromethanol extract of this material caused loss
of macrophages viability at concentrations higher than 30 mg mL-1 (Figure 19), but
basophils revealed decreased viability at 8 mg mL-1 (section 1.2.3.1.). Since macrophages
are known to produce reactive species (153) and the gastrointestinal tract is constantly
exposed to reactive oxygen, chlorine, and nitrogen species (154), the sensitivity of the
different cells lines can be explained by the oxidative stress induced by extract
compounds and cellular ability to oppose to it.
2.2.2. Reactive species
The levels of reactive species were measured by the DCFA-DA assay. The exposure
of Caco-2 cells to 150 µM t-BHP lead to a significant increase of reactive species to 126.5
± 1.4% of control after 30 min (p<0.0001, n = 5), reaching a maximum of 133.7 ± 1.8%
after 150 min, and decreasing to 130.1 ± 2.9% after 240 min. Fraction I significantly
decreased the levels of reactive species in a concentration and time dependent manner,
this ability being reduced over time (Figure 28). The lower concentrations of fraction I and
of the other extracts were more effective in reducing reactive species (Figure 28). For
instance, pre-exposure to 1.25 mg mL-1 of fraction I reduced the level of reactive species
induced by t-BHP to 111.6 ± 3.6% after 30 min (p<0.01), but after 240 min the level of
reactive species achieved was 116.6 ± 4.2% (p<0.05). On the other hand, the levels of
reactive species were 122.4 ± 2.0% (p>0.05) after 30 min and 137.7 ± 5.4% (p>0-1.05)
after 240 min, when the cells were pre-exposed to the extract at 20 mg mL-1.
In cells pre-exposed to fraction II a more pronounced effect on the levels of reactive
species induced by t-BHP was observed (Figure 28). Excepting 20 mg mL-1, all
concentrations lead to a significant decrease in the levels of reactive species during the
240 min evaluation period (p<0.01 or higher). It should be noted that the levels of reactive
species were reduced to the levels attained in cells not exposed to t-BHP when the cells
were pre-exposed to 1.25 mg mL-1 of fraction II (100.6 ± 4.5% after 30 min and 99.1 ±
3.8% after 240 min exposition to t-BHP). Although no statistical difference was seen for
the concentration of 20 mg mL-1, the levels of reactive species were lower than in cells not
Results and Discussion
91
pre-treated with extract (116.9 ± 3.5 mg mL-1 after 30 min and 129.0 ± 3.7 mg mL-1 after
240 min).
Surprisingly, the whole extract, containing the compounds of both fractions, not only
was unable to reduce the levels of reactive species induced by t-BHP, but further
aggravated the oxidative stress after 180 min in cells pre-exposed to 20 mg mL-1 of the
extract (Figure 28). At this concentration, the levels of reactive species reached 152.4 ±
5.9% after 240 min exposition to t-BHP (p<0.0001). However, at the beginning of the
measurements they were of 115.2 ± 3.6% (p>0.05), and for lower concentrations no
statistical differences were seen (116.8 ± 1.5% after 30 min and 126.7 ± 1.7% after 240
min in cells pre-exposed to 1.25 mg mL-1 of whole extract). The whole extract was the one
with higher variations in the levels of reactive species measured over time, being this
effect detected earlier with higher concentrations. It showed a tendency to increase the
levels of reactive species over time, with statistical differences being noticed, from the
concentration of 2.5 mg mL-1, while with the other extracts a significant increase was only
seen at 20 mg mL-1 for fraction II and 10 mg mL-1 for fraction I.
Although the levels of reactive species were measured without taking into account the
viability of cells, a significant decrease in this parameter measured by the MTT assay was
seen after 6 h exposure to t-BHP in cells pre-exposed to concentrations from 2.5 mg mL-1
of fraction II and from 2.5 to 10 mg mL-1 of the whole extract (Figure 28). So, the results
may reflect the levels of reactive species in viable and unviable cells.
Fraction II, which showed the higher ability to aggravate the toxicity induced by t-BHP,
was the one that reduced the levels of reactive species more pronouncedly (Figure 28). It
is possible that reactive species produced during the pre-exposition to anthocyanins and
other compounds present in fraction II have inactivated Cyt P450, diminishing in this way
the biotransformation of t-BHP and, consequently, the levels of reactive species. The
inhibition of the activity of several Cyt P450 isoforms by anthocyanins has already been
described (155, 156). For instance, petunidin inhibited Cyt P450 3A4 activity with an IC50
of 23 µM (155). Flavonols (present in both fractions, as well as in the whole extract) may
also contribute to the inhibitory activity of these enzymes (157). The viability of cells pre-
exposed to higher concentrations of fraction II was adversely affected, as seen by the
MTT assay (Figure 27), and the levels of reactive species induced by t-BHP were higher
than in cells exposed to lower extract concentrations (Figure 28). It is possible that when
cells with lower Cyt P450 activity were exposed to t-BHP, new radical species were
generated by non-enzymatic reaction of t-BHP with iron, as demonstrated by Castilho and
collaborators in an experiment using the iron chelator o-phenantroline with diminished
toxicity of t-BHP (158). This fact may also explain the increased toxicity observed with the

Results and Discussion
92
whole extract, which can be due to the combined effects of anthocyanins and high
amounts of flavonols in Cyt P450 inhibition.
In addition to Cyt P450 inhibition, the antioxidant ability of fractions I and II seen in this
assay can be attributed to direct scavenging effect or metal chelating properties of the
flavonoids absorbed by the cells previously to t-BHP exposure (159, 160).
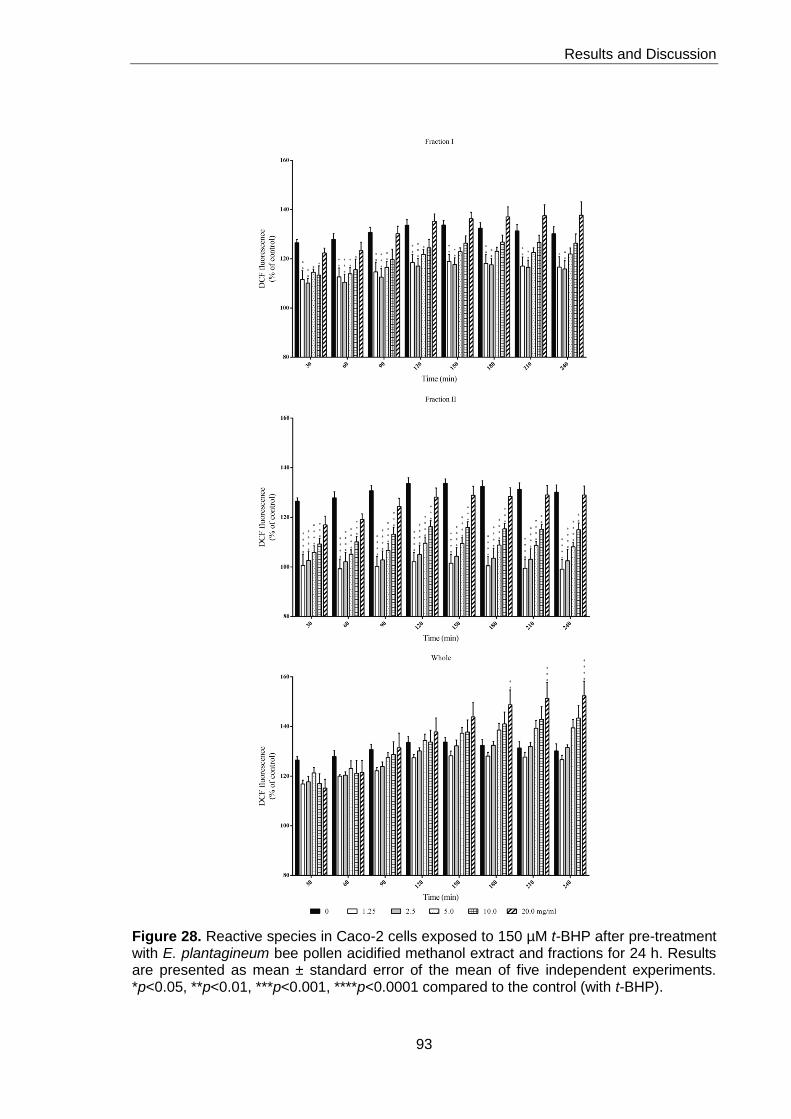
Results and Discussion
93
Figure 28. Reactive species in Caco-2 cells exposed to 150 µM t-BHP after pre-treatment with E. plantagineum bee pollen acidified methanol extract and fractions for 24 h. Results are presented as mean ± standard error of the mean of five independent experiments. *p<0.05, **p<0.01, ***p<0.001, ****p<0.0001 compared to the control (with t-BHP).
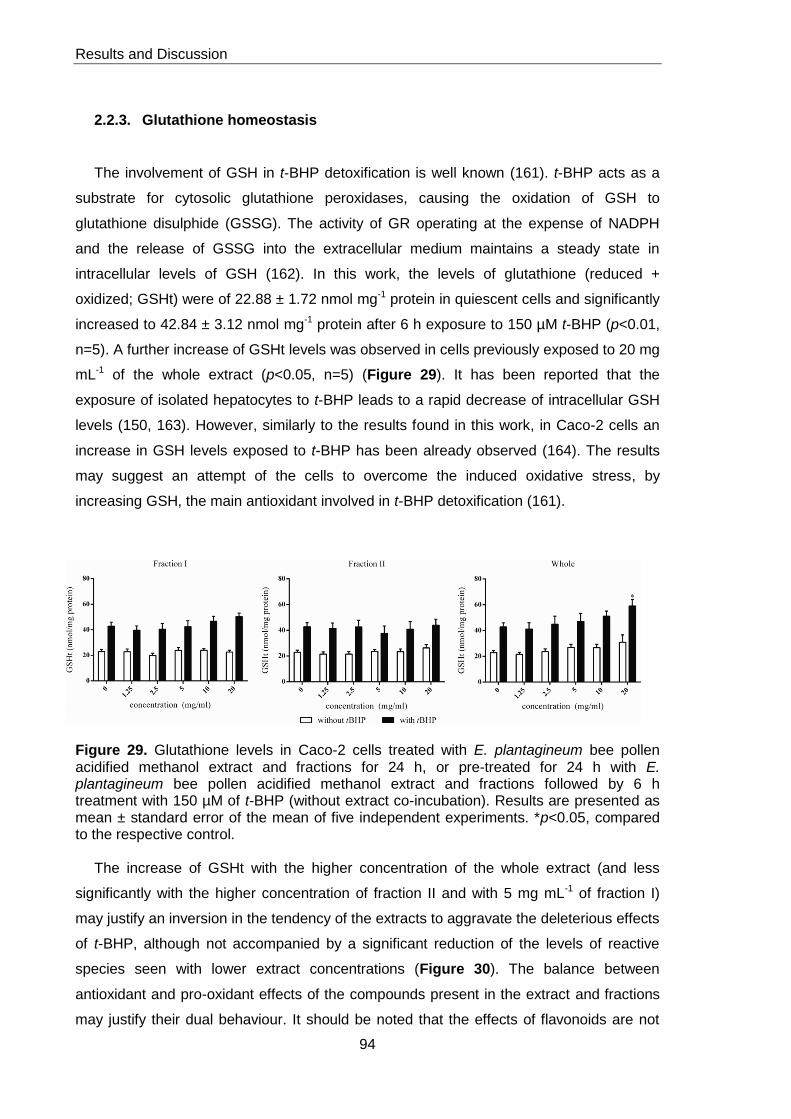
Results and Discussion
94
2.2.3. Glutathione homeostasis
The involvement of GSH in t-BHP detoxification is well known (161). t-BHP acts as a
substrate for cytosolic glutathione peroxidases, causing the oxidation of GSH to
glutathione disulphide (GSSG). The activity of GR operating at the expense of NADPH
and the release of GSSG into the extracellular medium maintains a steady state in
intracellular levels of GSH (162). In this work, the levels of glutathione (reduced +
oxidized; GSHt) were of 22.88 ± 1.72 nmol mg-1 protein in quiescent cells and significantly
increased to 42.84 ± 3.12 nmol mg-1 protein after 6 h exposure to 150 µM t-BHP (p<0.01,
n=5). A further increase of GSHt levels was observed in cells previously exposed to 20 mg
mL-1 of the whole extract (p<0.05, n=5) (Figure 29). It has been reported that the
exposure of isolated hepatocytes to t-BHP leads to a rapid decrease of intracellular GSH
levels (150, 163). However, similarly to the results found in this work, in Caco-2 cells an
increase in GSH levels exposed to t-BHP has been already observed (164). The results
may suggest an attempt of the cells to overcome the induced oxidative stress, by
increasing GSH, the main antioxidant involved in t-BHP detoxification (161).
Figure 29. Glutathione levels in Caco-2 cells treated with E. plantagineum bee pollen acidified methanol extract and fractions for 24 h, or pre-treated for 24 h with E. plantagineum bee pollen acidified methanol extract and fractions followed by 6 h treatment with 150 µM of t-BHP (without extract co-incubation). Results are presented as mean ± standard error of the mean of five independent experiments. *p<0.05, compared to the respective control.
The increase of GSHt with the higher concentration of the whole extract (and less
significantly with the higher concentration of fraction II and with 5 mg mL-1 of fraction I)
may justify an inversion in the tendency of the extracts to aggravate the deleterious effects
of t-BHP, although not accompanied by a significant reduction of the levels of reactive
species seen with lower extract concentrations (Figure 30). The balance between
antioxidant and pro-oxidant effects of the compounds present in the extract and fractions
may justify their dual behaviour. It should be noted that the effects of flavonoids are not
Results and Discussion
95
limited to antioxidant or pro-oxidant mechanisms, since these compounds can interfere
with many cellular molecules and processes (8, 146).
Under the assay conditions it was not possible to determine the intracellular levels of
GSSG (below 0.38 nmol mg-1 protein). The low levels of GSSG (less than 1% of GSHt)
can be explained by both its reduction to GSH by GR and its efflux from the cell (162).
2.2.4. Antioxidant enzymes
Since t-BHP detoxification involves its reduction by glutathione peroxidase (GPx) with
concomitant oxidation of GSH to GSSG (162), an attempt was made to quantify GPx and
GR, the later implicated in the recycling of GSSG back to GSH. Under the assay
conditions, the activity of GPx was below the detection limit of the method (p<0.02 U mg-1
protein). GR activity in cells exposed to the extract or fractions for 24 h was not
statistically different from control (0.027 ± 0.001 U mg-1 protein) at the concentrations
tested (p>0.05; n=5).
Mitochondrial GSH transferases (GST) may prevent lipid peroxidation in mitochondria
by a non-selenium glutathione-dependent peroxidase activity. Because t-BHP is a known
substrate for GST, the activity of this enzyme was determined, being of 0.101 ± 0.006 U
mg-1 protein in control cells. GST activity in cells exposed to the extracts was not
statistically different from the control (p>0.05; n=5). However, the non-coloured phenolic
fraction showed a tendency to decrease GST activity, reaching 0.089 ± 0.006 U mg-1
protein at the concentration of 20 mg mL-1.
Although t-BHP does not react with catalase (165), the activity of this enzyme and of
SOD was evaluated, due to their importance in the detoxification of H2O2 and superoxide
that can be produced by a pro-oxidant effect of flavonoids, including flavonols and
anthocyanins (147, 148), and in the maintenance of the redox cellular status, in general.
Catalase activity in control was 7.444 ± 1.012 U mg-1 protein. When the cells were
exposed to E. plantagineum bee pollen extract or fractions the enzyme activity varied
between 5.998 ± 0.647 and 6.839 ± 0.829 U mg-1 protein. No statistical differences were
seen for catalase activity (p>0.05; n = 5).
The extracellular SOD is a copper-zinc isoform of SOD that contains a signal peptide
that directs this isoform exclusively to extracellular spaces (166). The activity of this
enzyme in control was 0.100 ± 0.009 U mg-1 protein. Because the extracts exert a direct
activity on superoxide, it was not possible to distinguish between the effects on SOD
Results and Discussion
96
activity and the superoxide scavenging activity of the extracts. For this reason an assay
was performed using the extract and fractions incubated in culture medium, under the
same conditions used to evaluate SOD activity, but without cells.
The results obtained for the variation of superoxide with or without the cells are
presented in Figure 30. Fraction I was able to decrease superoxide levels, but this ability
was higher in the cell-free assay, indicating a scavenging activity rather than induction of
extracellular SOD. Significant differences from the control were observed from 2.5 mg mL-
1 (p<0.01; n=4) in the cell-free assay, and from 10 mg mL-1 (p<0.05, n=5) in the assay with
cells. Comparing the two assays (with and without cells), they were significantly different
from 5.0 mg mL-1 (p<0.0001). This result can be explained by the inhibition of extracellular
SOD, but, it is possible that some compounds were absorbed or modified by the cells, and
were not available for superoxide scavenging. Considering fraction II and the whole
extract, they exerted a slight scavenging activity (not statistically significant) for
concentrations up to 5 mg mL-1 in the cell-free assay. This tendency was not observed in
the assay with cells. At the concentration of 20 mg mL-1 a pro-oxidant effect was observed
in both assays, although it was statistically significant only with fraction II in the assay with
cells (p<0.001).
The ability of fraction I to scavenge superoxide radicals may contribute to the tendency
of this extract to protect Caco-2 cells from t-BHP induced toxicity (Figures 28 and 30).
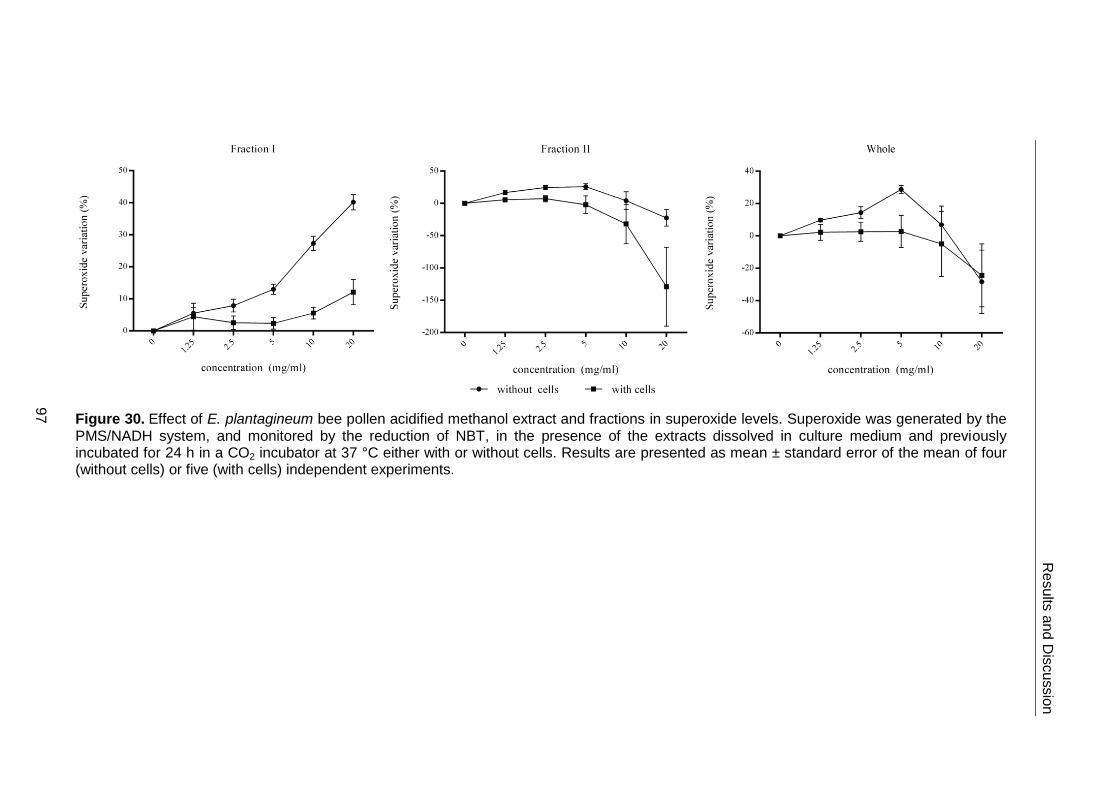
Figure 30. Effect of E. plantagineum bee pollen acidified methanol extract and fractions in superoxide levels. Superoxide was generated by the PMS/NADH system, and monitored by the reduction of NBT, in the presence of the extracts dissolved in culture medium and previously incubated for 24 h in a CO2 incubator at 37 °C either with or without cells. Results are presented as mean ± standard error of the mean of four (without cells) or five (with cells) independent experiments.
97
Re
sults
and
Dis
cu
ssio
n


Chapter IV
Conclusions

Conclusions
101
Conclusions
The work presented in this dissertation provides an increased knowledge of the chemical
profile and the biological potential of E. plantagineum bee pollen.
The main conclusions are listed below.
Hydromethanol extract:
Significant amounts of phenolic compounds were found.
Eight organic acids and five fatty acids were determined for the first time.
In vitro assays revealed the ability to scavenge NO and O2-, although for the latter a
pro-oxidant behaviour was observed for the higher concentrations tested.
The extract reduces NO and prostaglandins release in LPS-stimulated macrophages,
but, in what concerns to prostaglandins, this is true only if the extract concentrations are
maintained below certain levels.
The levels of prostaglandins metabolites derived from Cyt P450 enzymes, like 20-
hydroxy-PGE2 and 6-keto-PGF1α, are reduced by high extract concentrations. However,
under those conditions several isoprostanes are increased.
The extract is effective in inhibiting basophils degranulation under an allergic
stimulus, as ascertained by the levels of β-hexosaminidase released. Nevertheless, some
deleterious effects on insulted cells were noticed at the highest tested concentrations.
Reduced antibacterial capacity was observed and just against S. aureus, S.
epidermidis and M. luteus.
Acidified methanol extract and fractions:
Seven flavonols and five anthocyanins were determined.
The phenolic extracts were not efficient at protecting Caco-2 cells from the oxidative
stress induced by t-BHP, although the removal of anthocyanins ceased the pro-oxidant
effects and imparted a small protection.
Conclusions
102
The antioxidant potential of the compounds may be abrogated by the fact that in the
presence of iron t-BHP generates reactive species, which can be more deleterious than the
ones generated by its biotransformation.
The pro-oxidant effects seen with the extracts containing anthocyanins may also be
ascribed to their ease in being themselves converted into radical species.
The protective effects seem to be related with the levels of total glutathione.
Overall, the results obtained demonstrate that E. plantagineum bee pollen bioactive
compounds can impart beneficial health effects, by reducing the levels of oxidative stress
and inflammatory mediators involved in the genesis of many diseases, and also by
preventing allergy and ameliorating allergy symptoms.

Chapter V
References


References
105
1. Gibbs PE. Taxonomic studies of the genus Echium. I. An outline revision of the
Spanish species. Lagascalia 1971; 1: 27-81.
2. International Environmental Weed Foundation. Available from: www.iewf.org
[accessed 29/06/2014].
3. Grigulis K, Sheppard AW, Ash JE, Groves RH. The comparative demography of the
pasture weed Echium plantagineum between its native and invaded ranges. J Appli
Ecol 2001 Apr; 38 (2): 281-290.
4. Kroyer G and Hegedus N. Evaluation of bioactive properties of pollen extracts as
functional dietary food supplement. Innov Food Sci Emerg Technol 2001 Sep; 2 (3):
171-174.
5. Jardim Botânico da UTAD. Available from: http://jb.utad.pt/ [accessed 29/06/2014].
6. Hall RD. Plant metabolomics: from holistic hope, to hype, to hot topic. New Phyt
2006 Jan; 169 (3): 453-468.
7. Ibrahim MH, Jaafar HZE. Involvement of carbohydrate, protein and phenylanine
ammonia lyase in up-regulation of secondary metabolites in Labisia pumila under
various CO2 and N2 levels. Molecules 2011 May; 16 (5): 4172-90.
8. Bruneton J. Pharmacognosie, phytochimie, plants médicinales. 3th ed. Paris:
Editions Tec & Doc; 1999.
9. Roberts MF and M Wink (eds.): Alkaloids: Biochemistry, ecology and medicinal
applications; Plenum Press, New York and London; 1998.
10. Kempf M, Reinhard A, Beuerle T. Pyrrolizidine alkaloids (PAs) in honey and pollen-
legal regulation of PA levels in food and animal feed required. Mol Nutr Food Res
2010 Jan; 54 (1): 158-168.
11. Kempf M, Heil S, Hasslauer I, Schmidt L, von der Ohe K, Theuring C, et al.
Pyrrolizidine alkaloids in pollen and pollen products. Mol Nutr Food Res 2010 Nov ;
54 (2): 292-00.
12. Edgar JA, Colegate SM, Boppré M, Molyneaux RJ. Pyrrolizidine alkaloids in food: a
spectrum of potential health consequences. Food Addit Contam 2011 Mar; 28 (3):
308-24.
13. Hartmann T, Witte L. Pyrrolizidine alkaloids: chemical, biological and
chemoecological aspects. In SW Pelletier, ed, Alkaloids: Chemical and Biological
Perspectives, Vol 9. Pergamon Press, Oxford; 1995
14. Ferreres F, Pereira MD, Valentão P, Andrade PB. First report of non-coloured
flavonoids in Echium plantagineum bee pollen: differentiation of isomers by liquid
chromatography/ion trap mass spectrometry. Rapid Commun Mass Spectrom 2010
Jan; 24 (6): 801-6.
References
106
15. Mattocks AR. Chemistry and toxicology of pyrrolizidine alkaloids. London: Academic
Press; 1986.
16. Matsuda H, Ishikado A, Nishida N, Ninomiya K, Fujiwara H, Kobayashi Y,
Yoshikawa M. Hepatoproctetive, superoxide scavenging and antioxidative activities
of aromatic constituents from the bark of Betula platyphylla var. japonica. Bioorg
Med Chem Lett 1998 Nov; 8 (21): 2939-44.
17. El-Shazly A, Wink M. Diversity of pyrrolizidine alkaloids in the Boraginaceae:
Structures, distribution, and biological properties. Diversity 2014 Apr; 6 (2): 188-82.
18. Toppel G, Witte L, Riebschl B, Borstel K v, Hartmann T. Alkaloid patterns and
biosynthetic capacity of root cultures from some pyrrolizidine alkaloid producing
Senecio species. Plant Cell Rep 1987 Dec; 6 (6): 466-69.
19. Borstel K v, Witte L, Hartmann T. Pyrrolizidine alkaloid patterns in populations of
Senecio vulgaris, Senecio vernalis and their hybrids. Phytochemistry 1989 Dec; 28
(6): 1635-38.
20. Betteridge K, Cao Y, Colegate SM. Improved method for extraction and LC-MS
analysis of pyrrolizidine alkaloids and their N-oxides in honey: application to Echium
vulgare honeys. J Agric Food Chem 2005 Mar; 53 (6): 1894-2.
21. Slimestad R, Verheul M. Review of flavonoids and other phenolics from fruits of
different tomato (Lycopersicon esculentum Mill.) cultivars. J Sci Food Agric 2009
May; 89 (8): 1255-70.
22. Gambao MPT. Compuestos fitoquímicos de mieles como marcadores florales:
capacidad antimicrobiana y anti-quorum sensing (thesis). Murcia: University of
Murcia; 2010.
23. Conforti F, Sosa S, Marrelli M, Menichini F, Statti GA, Uzunov D, et al. The
protective ability of Mediterranean dietary plants against the oxidative damage: The
role of radical oxygen species in inflammation and the polyphenol, flavonoid and
sterol contents. Food Chem 2009 Feb; 112 (3): 587-594.
24. Andrade P. Tipificação de méis de Erica sp. da região da Serra da Lousã [thesis].
Coimbra: Faculdade de Farmácia da Universidade de Coimbra; 1996.
25. Khodami A, Wilkes MA, Roberts TH. Techniques for analysis of plant phenolic
compounds. Molecules 2013 Feb; 18 (2): 2328-75.
26. Casazza AA, Aliakbarian B, Mantegna S, Cravotto G, Perego P. Extraction of
phenolics from Vitis vinifera wastes using non-conventional techniques. J Food Eng
2010 Sep; 100 (1): 50-5.
References
107
27. Prasad KN, Yang B, Zhao M, Sun J, Wei X, Jiang Y. Effects of high pressure or
ultrasonic treatment on extraction yield and antioxidant activity of pericarp tissues of
longan fruit. J Food Biochem 2010 Apr; 34 (4): 838-55.
28. Ignat I, Volf I, Popa VI. A critical review of methods for characterisation of
polyphenolic compounds in fruits and vegetables. Food Chem 2011 Jun; 126 (4):
1821-35.
29. Kim DO, Lee CY. Extraction and isolation of polyphenolics. In: Hoboken N, editor.
Current protocols in food analytical chemistry. New York: John Wiley & Sons, Inc.;
2001.
30. Haminiuk CWI, Maciel GM, Plata-Oviedo MSV, Peralta RM. Phenolic compounds in
fruits - an overview. Int J Food Sci Tech 2012 Jan; 47 (10): 2023-44.
31. Fulcrand H, Mané C, Preys S, Mazerolles G, Bouchut C, Mazauric J-P, et al. Direct
mass spectrometry approaches to characterize polyphenol composition of complex
samples. Phytochemistry 2008 Dec; 69 (18): 3131-8.
32. Soobrattee MA, Neergheen VS, Luximon-Ramma A, Aruoma OI, Bahorun T.
Phenolics as potential antioxidant therapeutic agents: mechanism and actions.
Mutat Res-Fund Mol M 2005 Nov; 579 (1-2): 200-13.
33. Yang F, Zhao Y, Kai G, Xiao J. Interaction of dietary flavonoids with gamma-
globulin: molecular property-binding affinity relationship aspect. Food Funct 2011
Feb; 2 (2): 137-41.
34. Terao J, Murota K, Kawai Y. Conjugated quercetin glucuronides as bioactive
metabolites and precursors of aglycone in vivo. Food Funct 2011 Jan; 2 (1):11-17.
35. Amic D, Davidovic-Amic D, Beslo D, Rastija V, Lucic B, Trinajstic N. SAR and QSAR
of the antioxidant activity of flavonoids. Curr Med Chem 2007 Dec; 14 (7): 827-45.
36. Campos MG, Webby RF, Markham KR, Mitchell KA, P. da Cunha A. Age-induced
diminution of free radical scavenging capacity in bee pollens and the contribution of
constituent flavonoids. J Agric Food Chem 2003 Jan; 51 (3): 742-45.
37. Di Paola-Naranjo RD, Sánchez-Sánchez J, González-Paramás AM, Rivas-Gonzalo
JC. Liquid chromatographic-mass spectrometric analysis of anthocyanin
composition of dark blue bee pollen from Echium plantagineum. J Chromatog A
2004 Oct; 1054 (1-2): 205-10.
38. Ricke SC. Perspectives on the use of organic acids and short chain fatty acids as
antimicrobials. Poultry Sci 2003 Jan; 82 (4): 632-39.
39. Davidson, PM. Chemical preservatives and natural antimicrobial compounds. In:
Doyle MP, Reuchat LR, Montville TJ editors. Food Microbiology – Fundamentals

References
108
and Frontiers. 2nd edition Washington: American Society for Microbiology; 2001, p.
593-27.
40. López-Bucio J, Nieto-Jacobo MF, Ramírez-Rodríguez V, Herrera-Estrella L. Organic
acid metabolism in plants: from adaptive physiology transgenic varieties for
cultivation in extreme soils. Plant Sci 2000 Dec; 160 (1):1-13.
41. Ribeiro B, Rangel J, Valentão P, Andrade PB, Pereira JA, Bölke H, et al. Organic
acids in two Portuguese chestnut (Castanea sativa Miller) varieties. Food Chem
2007 Jan; 100 (2): 504-8.
42. Simpson NJK. Solid-phase extraction: principles, techniques, and applications. 1st
ed. New York: Marcel Dekker; 2000.
43. Theron MM, Lues JF. Organic acids and food preservation. 1st ed. New York: Taylor
& Francis; 2009.
44. Papadoyannis IN, Samanidou VF. Sample preparation for HPLC. Encyclopedia of
Chromatography. 3rd ed. Thessaloniki: Taylor & Francis; 2009.
45. Andrade PB, Pereira DM, Valentão P. Phenolic compounds: analysis by HPLC. In:
Cazes J, editor. Encyclopedia of Chromatography. 3rd ed. New York: Taylor &
Francis LLC; 2010. p. 1768-76.
46. Silva BM, Andrade PB, Mendes GC, Seabra RM, Ferreira MA. Study of the organic
acids composition of quince (Cydonia oblonga Miller) fruit and jam. J Agric Food
Chem 2002 Apr; 50 (8): 2313-7.
47. Seabra RM, Andrade PB, Valentão P, Fernandes E, Carvalho F, Lurdes Bastos M.
Antioxidant compounds extracted from several plant materials. In: Fingerman M,
Nagabhushanam R, editors. Biomaterials from aquatic and terrestrial organisms.
Enfield: Science; 2006. p. 115-74.
48. Brul S, Coote P. Preservative agents in foods mode of action and microbial
resistance mechanisms. Int J Food Microbiol 1999 Sep; 50 (1-2): 1-17.
49. Burtis CA and Ashwood ER. Fundamentals of Clinical Chemistry. 4th edition. 1996.
50. Mir M. Echium oil: a valuable source of n-3 and n-6 fatty acids. OCL 2008 Jul-Aug;
15 (4): 252-56.
51. Czaplicki S, Zadernowski R, Ogrodowska. Triacylglycerols from viper bugloss
(Echium vulgare L.) seed bio-oil. Eur J Lipid Sci Technol 2009 Dec; 111 (12): 1266-
69.
52. Somashekar D, Venkateshwaran G, Srividya C, Krishnanand K, Sambaiah K,
Lokesh BR. Efficacy of extraction methods for lipid and fatty acid composition from
fungal cultures. World J Microbiol Biotechnol 2001 Apr; 17 (3): 317-20.
References
109
53. Moldoveanu S, David V. Sample preparation in chromatography. 1st ed. Amsterdam:
Elsevier; 2002.
54. Gunstone FD. Why are structured lipids and new lipid sources required? In
Gunstone FD editor. Structured and modified lipids. New York: Marcel Dekker, Inc;
2001. p. 1-9.
55. Simopoulos AP. Omega-3 fatty acids in inflammation and autoimmune diseases. J
Am Coll Nutr 2002 Dec; 21(6): 495-05.
56. Kruger MC, Coetzee M, Haag M, Weiler H. Long-chain polyunsaturated fatty acids:
selected mechanisms of action on bone. Prog Lipid Res 2010 Oct; 49 (4): 438-49.
57. Berg JM, Tymoczko JL, Stryer L. Biochemistry. In: Berg JM, Tymoczko JL, Stryer L,
editors. Fatty acids are synthesized and degraded by different pathways. 5th ed.
New York: W H Freeman; 2002.
58. Venegas-Calerón M, Sayanova O, Napier JA. An alternative to fish oils: metabolic
engineering of oil-seed crops to produce omega-3 long chain polyunsaturated fatty
acids. Prog Lipid Res 2010 Apr; 49 (2): 108-19.
59. Kris-Etherton PM, Harris WS, Appel LJ, Committee ftN. Fish consumption, fish oil,
omega-3 fatty acids and cardiovascular disease. Circulation 2002 Nov; 106 (21):
2747-57.
60. Gray DA, Payne G, McClements DJ, Decker EA, Lad M. Oxidative stability of
Echium plantagineum seed oil bodies. Eur J Lipid Sci Technol 2010 Jul; 112 (7):
741-49.
61. Guil-Guerrero JL, García-Maroto F, Campra-Madrid P, Gómez-Mercado F.
Occurrence and characterization of oils rich in y-linolenic acid Part II: fatty acids and
squalene from Macaronesian Echium leaves. Phytochemistry 2000 Jun; 54 (5): 525-
29.
62. García-Lafuente A, Guillamón E, Villares A, Rostagno MA, Martínez JA. Flavonoids
as anti-inflammatory agents: implications in cancer and cardiovascular disease.
Inflamm Res 2009 Apr; 58 (9):537-52.
63. Thanan R, Oikawa S, Hiraku Y, Ohnishi S, Ma N, Pinlaor S, et al. Oxidative stress
and its significant roles in neurodegenerative diseases and cancer. Int J Mol 2014
Dec; 16 (1); 193-17.
64. Harizi H, Corcuff J-B, Gualde N. Arachidonic-acid-derived eicosanoids: roles in
biology and immunopathology. Trends Mol Med 2008 Oct; 14 (10): 461-69.
65. Chang YW, Putzer K, Ren L, Kaboord B, Chance TW, Qoronfleh MW, et al. .
Differential regulation of cyclooxygenase 2 expression by small GTPases Ras,
Rac1, and RhoaA. J Cell Biochem 2005 Oct; 96 (2): 314-29.
References
110
66. Ding XZ, Hennig R, Adrian TE. Lipoxygenase and cyclooxygenase metabolism:
new insights in treatment and chemoprevention of pancreatic cancer. Mol Cancer
2003 Jan; 2:10.
67. Fujiwara N, Kobayashi K. Macrophages in inflammation. Curr Drug Targets Inflamm
Allergy 2005 Jun; 4(3): 281-86.
68. Wadsworth TL, Koop DR. Effects of wine polyphenolics quercetin and resveratrol on
pro-inflammatory cytokine expression in RAW 264.7 macrophages. Biochem
Pharmacol 1999 Apr; 57 (8): 941–49.
69. Lopes G, Sousa C, Silva LR, Pinto E, Paula BA, et al. Can phlorotannins purified
extracts constitute a novel pharmacological alternative for microbial infections with
associated inflammatory conditions? Plos One 2012 Feb; 7 (2): e31145.
70. Pinho BR, Sousa C, Valentão P, Andrade PB. Is nitric oxide decrease observed with
naphtoquinones in LPS stimulated RAW 264.7 macrophages a beneficial property?
Plos One 2011 Aug; 6 (8): e24098.
71. Takeuchi O, Akira S. Pattern recognition receptors and inflammation. Cell 2010 Mar;
140 (6): 805-20.
72. Andreasen AS, Krabbe KS, Krogh-Madsen R, Taudorf S. Pedersen BK, Møller K.
Human endotoxemia as a model of systemic inflammation. Curr Med Chem 2008
May; 15 (17): 1697-05.
73. Chu Q, Tian X, Jiang L, Ye Jiannong. Application of capillary electrophoresis to
study phenolic profiles of honeybee-collected pollen. J Agric Food Chem 2007 Sep;
55 (22): 8864-69.
74. Traidl-Hoffmann C, Jakob T, Behrendt H. Determinants of allergenicity. J Allergy
Clin Immunol 2009 Mar; 123 (3): 558-66.
75. Bowler RP, Crapo JD. Oxidative stress in allergic respiratory diseases. J Allergy Clin
Immunol 2002 Sep; 110 (3): 349-56.
76. Ishida M, Nishi K, Watanabe H, Sugahara T. Inhibitory effect of aqueous spinach
extract on degranulation of RBL-2H3 cells. Food Chem 2013 Jan; 136 (2): 322-27.
77. Traidl-Hoffmann C, Mariani V, Thiel M, Gilles S, Müller MJ, Ring J, et al. Pollen pave
their way. Th2 micromilieu generated by pollen-associated lipid mediators (PALMs).
Allergy Clin Immunol Int: J World Allergy Org 2007; Supplement 2.
78. Gilles S, Mariani V, Bryce M, Müller MJ, Ring J, Behrendt H, et al. Pollen allergens
do not come alone: pollen-associated lipid mediators shift human immune systems
toward a T helper 2-dominated response. Allergy Asthma Clin Immunol 2009 Oct;
5:(3) e 102310.
References
111
79. Marquardt DL, Wasserman SI. Modulation of rat serosal mast cell biochemistry by in
vivo dexamethasone administration. J Immunol 1983 Aug; 131 (2): 934-39.
80. Rubin P, Mollison KW. Pharmacotherapy of diseases mediated by 5-lipoxygenase
pathway eicosanoids. Prostag Oth Lipid M 2007 May; 83 (3): 188-97.
81. Jim JH, Lee DU, YS, Kim HP. Anti-allergic activity of sesquiterpenes from the
rhizomes of Cyperus rotundus. Arch Pharm Res 2011 Nov; 34 (2): 223-28.
82. Chan TK, Ng DSW, Cheng C, Guan SP, Koh HM, Wong WSF. Anti-allergic actions
of rottlerin from Mallotus philippinensis in experimental mast cell-mediated
anaphylatic models. Phytomedicine 2013 Jul; 20 (10): 853-60.
83. Grundemann C, Papagiannopoulos M, Lamy E, Mersch-Sundermann V, Huber R.
Immunomodulatory properties of a lemon-quince preparation (Gencydo®) as an
indicator of anti-allergic potency. Phytomedicine 2011 Jun; 18 (8-9): 760-68.
84. Yodsaoue O, Cheeprache S, Karla C, Ponglimanont C, Tewtrakul S. Anti-allergic
activity of principles from the roots and heartwood of Caesalpinia sappan on antigen
induced β-hexosaminidase release. Phytother Res 2009 Jul; 23 (7): 1028–31.
85. Pereira DM, Faria J, Gaspar L, Valentão P, Andrade PB. Boerhaavia diffusa:
Metabolite profiling of a medicinal plant from Nyctaginaceae. Food Chem Toxicol
2009 Aug; 47 (8): 2142-49.
86. Pereira DM, Vinholes J, Guedes de Pinho P, Valentão P, Mouga T, Teixeira N, et al.
A gas chromatography-mass spectrometry multi-target method for the simultaneous
analysis of three classes of metabolites in marine organisms. Talanta 2012 Oct;
100: 391–00.
87. NIST Chemistry WebBook. Available from: http://webbook.nist.gov/chemistry/name-
ser.html [accessed 06/01/2014]
88. Sheperd T, Dobson G, Verrall SR, Conner S, Griffiths DW, McNicol JW, et al. Potato
metabolomics by GC-MS: What are the limiting factors? Metabolomics 2007 Dec; 3
(4): 475-88.
89. Oliveira AP, Valentão P, Pereira JA, Silva BM, Tavares F, Andrade PB. Ficus carica
L.: metabolic and biological screening. Food Chem Toxicol 2009 Nov. 47 (11):
2841–46.
90. Twentyman PR, Luscombe M. A study of some variables in a tetrazolium dye (MTT)
based assay for cell growth and chemosensitivity. Br J Cancer 1987 Sep; 56 (3):
279-85.
91. Lobner D. Comparison of the LDH and MTT assays for quantifying cell death:
validity for neuronal apoptosis? J Neurosci Methods 2000 Mar; 96 (2): 147-52.
References
112
92. Del Barrio L, Martin-de-Saavedra MD, Romero A, Parada E, Egea J, Avila J, et al.
Neurotoxicity induced by okadaic acid in the human neuroblastoma SH-SY5Y line
can be differentially prevented by alpha7 and beta2 nicotinic stimulation. Toxicol Sci
2011 Sep; 123 (1): 193-5.
93. Kim HK, Cheon BS, Kim YH, Kim SY, Kim HP. Effects of naturally occurring
flavonoids on nitric oxide production in the macrophage cell line RAW 264.7 and
their structure-activity relationships. Biochem Pharmacol 1999 Sep; 58 (5): 759-65.
94. Senshu T, Sato T, Inoue T, Aliyama K, Asaga H. Detection of citrulline residues in
deiminated proteins on polyvinylidene difluoride membrane. Anal Biochem 1992
May; 203 (1): 94-100.
95. Marzinzig M, Nussler AK, Stadler J, Marzinzig E, Barthlen W, Nussler NC, et al.
Improved methods to measure end products of nitric oxide in biological fluids: nitrite,
nitrate, and S-nitrosothiols. Nitric Oxide-Biol Chem 1997 Apr; 1 (2): 177-89.
96. Medina S, Domínguez-Perles P, Gil IJ, Ferreres F, García-Viguera, Martínez-Sanz
JM, et al. A ultra-pressure liquid chromatography/triple quadropole tandem mass
spectrometry method for the analysis of 13 eicosanoids in human urine and
quantitative 24 h values in healthy volunteers in a controlled constant diet. Rapid
Commun Mass Spectrom 2012 May; 26 (10): 1249-57.
97. Medina S, Domínguez-Perles R, Cejuela-Anta R, Villaño D, Martínez-Sans JM, Gil
P, et al. Assessment of oxidative stress markers and prostaglandins after chronic
training of triathletes. Prostag Oth Lipid M 2012 Dec; 99 (3-4): 79-86.
98. Moita E, Gil-Izquierdo A, Sousa C, Ferreres F, Silva LR, Valentão P, et al.
Integrated analysis of COX-2 and iNOS derived inflammatory mediators in LPS-
stimulated RAW macrophages pre-exposed to Echium plantagineum L. bee pollen
extract. Plos One 2013 Mar; 8 (3): e59131.
99. Pinho BR, Sousa C, Valentão P, Oliveira JMA, Andrade PB. Modulation of
basophils’ degranulation and allergy-related enzymes by monomeric and dimeric
naphthoquinones. PLoS One 2014 Feb; 9: e90122.
100. Dopico-García MS, Fique A, Guerra L, Afonso JM, Pereira O, Valentão P, et al.
Principal components of phenolics to characterize red Vinho Verde grapes:
Anthocyanins or non-coloured compounds? Talanta 2008 Jun; 75 (5): 1190–2.
101. Bergermeyer HU, Bernt E, 1974. UV-assay for lactate dehydrogenase with pyruvate
and NADH. In: Bergermeyer, H.U. (Ed.), Methods of Enzymatic Analysis. Verlag
Chemie GmbH, Weinheim.
102. Taveira M, Sousa C, Valentão P, Ferreres F, Teixeira JP, Andrade PB.
Neuroprotective effect of steroidal alkaloids on glutamate-induced toxicity by

References
113
preserving mitochondrial membrane potential and reducing oxidative stress. J
Steroid Biochem 2014 Mar; 140: 106-15.
103. Vandeputte C, Guizon I, Genestie-Denis I, Vannier B, Lorenzon G. A microtiter plate
assay for total glutathione and glutathione disulfide contents in cultured/isolated
cells: performance study of a new miniaturized protocol. Cell Biol Toxicol 1994 Dec;
10 (5): 415-21.
104. Habig WH, Pabst MJ, Jakoby WB. Glutathione S-transferases. The first enzymatic
step in mercapturic acid formation. J Biol Chem 1974 Nov; 249 (22): 7130–39.
105. Remião F, Carmo H, Carvalho FD, Bastos ML. Inhibition of glutathione reductase by
isoproterenol oxidation products. J Enzym Inhib 1999 Feb; 15 (1): 47-61.
106. Flohé L, Otting F. Superoxide dismutase assays. Method Enzym 1984; 105: 93-04.
107. Aebi H. Catalase in vitro. Method Enzym 1984 Feb; 105: 121-26.
108. Bradford MM. A rapid and sensitive method for the quantification of microgram
quantities of protein utilizing the principle of protein-dye binding. Anal Biochem 1976
May; 72 (1-2): 248-54.
109. Almeida-Muradian LB, Pamplona LC, Coimbra S, Barth OM. Chemical composition
and botanical evaluation of dried bee pollen pellets. J Food Compos Anal 2005 Feb;
18: (1) 105-11.
110. Galati G, Sabzevari O, Wilson JX, and O’Brien PJ. Prooxidant activity and cellular
effects of the phenoxyl radicals of dietary flavonoids and other polyphenolics.
Toxicology 2002 Aug; 177 (1): 91-4.
111. Fernandes F, Sousa C, Ferreres F, Valentão P, Remião F, Pereira JA, et al. Kale
extract increases glutathione levels in V79 cells but does not protect them against
acute toxicity induced by hydrogen peroxide. Molecules 2012 May; 17 (5): 5269–88.
112. Pinho Br, Sousa C, Valentão P, Andrade PB. Is nitric oxide decrease observed with
naphtoquinones in LPS stimulated RAW 264.7 macrophages a beneficial property?
Plos One 2011 Aug; 6 (8): e24098.
113. Tayed MA, Marletta MA. Macrophage oxidation of L-arginine to nitric oxide, nitrite,
and nitrate. J Biol Chem 1989 Nov; 264 (33): 19654-58.
114. Yan Z, Mas E, Mori TA, Croft KD, Barden AE. A significant proportion of F2-
isoprostanes in human urine are excreted as glucuronide conjugates. Anal Biochem
2010 Aug; 403 (1-2): 126–28.
115. Trottein F, Schaffer L, Ivanov S, Paget C, Vendeville C, Groux-Degroote S, et al.
Glycosyltransferase and sulfotransferase gene expression profiles in human
monocytes, dendritic cells and macrophages. Glycoconj J 2009 Dec; 26 (9): 1259-
74.
References
114
116. Harada Y, Hatanaka K, Kawamura M, Saito M, Ogino M, Majima M, et al. Role of
prostaglandin H synthase-2 in prostaglandin E2 formation in rat carragenin-induced
pleurisy. Prostaglandins 1996 Jan; 51 (1): 19-33.
117. Matsumoto H, Naraba H, Murakami M, Kudo I, Yamaka K, Ueno A, et al.
Concordant induction of prostaglandin E2 syntgase with cyclooxygenase-2 leads to
preferred production of prostaglandin E2 over thromboxane and prostaglandins D2
in lipopolysaccharide-stimulated rat peritoneal macrophages. Biochem Biophys Res
Commun 1997 Jan; 230 (1): 110-14.
118. Murakami M, Naraba H, Tanioka T, Semmyo N, Nakatani Y, Kojima F. Regulation of
prostaglandin E2 biosynthesis by inducible membrane-associated prostaglandin E2
synthase that acts in concert with cyclooxigenase-2. J Biol Chem 2000 Oct; 275
(42): 32783-92.
119. Vatsis KP, Theoharides AD, Kupfer D, Coon MJ. Hydroxylation of prostaglandins by
inducible isozymes of rabbit liver microsomal Cyt P450. Participation of Cyt b5. J
Biol Chem 1982 Oct; 257: 11221-29.
120. Hodek P, Trefil P, Stiborová M. Flavonoids potent and versatile biologically active
compounds interacting with Cyt P450. Chem Biol Interact 2002 Jan; 139 (1): 1-21.
121. Buczynski MW, Dumlao DS, Dennis EA. An integrated omics analysis of eicosanoid
biology. J Lipid Res 2009 Jun; 50 (6): 1015-38.
122. Song WL, Wang M, Riociotti E, Fries S, Yu Y, Grosser T. Tetranor PGDM, an
abundant urinary metabolite reflects biosynthesis of prostaglandin D2 in mice and
humans. J Biol Chem 2008 Jan; 283 (2): 1179-88.
123. Kim JY, Park SJ, Yun KJ, Cho YW, Park HJ, Lee KT. Isoliquiritigenin isolated from
the roots of Glycyrrhiza uralensis inhibits LPS-induced iNOS and COX-2 expression
via the attenuation of NF-kB in RAW 264.7 macrophages. Eur J Pharmacol 2008
Apr; 584 (1): 175-84.
124. Escudero O, Silva LR, Valentão P, Seijo MC, Andrade PB. Assessing Rubus honey
value: Pollen and phenolic compounds content and antibacterial capacity. Food
Chem 2012 Feb; 130 (3): 671-78.
125. Chen YC, Shen SC, Lee WR, Hou WC, Yang LL, Lee TJ. Inhibition of nitric oxide
synthase inhibitors and lipopolysaccharide inducible NOS and cyclooxygenase-2
gene expressions by rutin, quercetin, and quercetin pentaacetate in RAW 264.7
macrophages. J Cell Biochem 2001 Sep; 82 (4): 537-48.
126. Raso GM, Meli R, Di Carlo G, Pacilio M, Di Carlo R. Inhibition of inducible nitric
oxide synthase and cyclooxygenase-2 expression by flavonoids in macrophage
J774A.1. Life Sci 2001 Jan; 68 (8): 921-31.
References
115
127. Clancy R, Varenika B, Huang W, Ballou L, Attur M, Amin AR. Nitric oxide
synthase/COX cross-talk: Nitric oxide activates COX-1 but inhibits COX-2-derived
prostaglandin production. J Immunol 2000 Aug; 165 (3): 1582-87.
128. Marotta P, Sautebin L, Di Rosa M. Modulation of the induction of nitric oxide
synthase by eicosanoids in the murine macrophage cell line J774. Br J Pharmacol
1992 Nov; 107 (3): 640-41.
129. Swierkosz TA, Mitchell JA, Warner TD, Botting RM, Vane JR. Coinduction of nitric
oxide synthase and cyclo-oxygenase: interaction between nitric oxide and
prostanoids. Br J Pharmacol 1995 Apr; 114: 1335-42.
130. Roberts LJ II, Morrow JD. Products of the isoprostane pathway: Unique bioactive
compounds and markers of lipid peroxidation. Cell Mol Life Sci 2002 May; 59 (5):
808-20.
131. Moore KP, Darley-Usmar V, Morrow J, Roberts LJ II. Formation of F2-isoprostanes
during oxidation of human low-density lipoprotein and plasma by peroxynitrite. Circ
Res 1995 Aug; 77 (2): 335-41.
132. Marnett LJ, Wright TL, Crews BC, Tannenbaum SR, Morrow JD. Regulation of
prostaglandin biosynthesis by nitric oxide is revealed by targeted deletion of
inducible nitric-oxide synthase. J Biol Chem 2000 May; 275 (18): 13427-30.
133. Ozdŏl NÇ, Melli M. Formation of 8-isoprostaglandin F2α and prostaglandin E2 in
carrageenan-induced air pouch model in rats. Eur J Pharmacol 2004 Dec; 506 (2):
189-97.
134. Medeiros KCP, Figueiredo CAV, Figueiredo TB, Freire KRL, Santos FAR, Alcantara-
Neves NM, et al. Anti-allergic effect of bee pollen phenolic extract and myricetin in
ovalbumin-sensitized mice. J Ethopharmacol 2008 Sep; 119 (1): 41-46.
135. Tang JM, Liu J, Wu W. Studies on the degranulation of RBL-2H3 cells induced by
traditional Chinese medicine injections. Chin Med 2012 Dec; 3 (4): 200-8.
136. Luckasen R, Whiteand JG, Hersey JH. Mitogenic properties of a calcium ionophore
A23187. Proc Natl Acad Sci USA 1974 Dec; 71 (12): 5088-90.
137. Cheung KL, Chen H, Chen Q, Wang J, Ho HP, Wong CK, et al. CTAB-coated gold
nanorods elicit allergic response through degranulation and cell death in human
basophils. Nanoscale 2012 Aug; 4: 4447-4449.
138. Broide DH. Molecular and cellular mechanisms of allergic disease. J Allergy Clin
Immunol 2001 Aug; 108 (2): 565-71.
139. Kepley CL, Lauer FT, Oliver JM, Burchiel SW. Environmental polycyclic aromatic
hydrocarbons, benzo(a)pyrene (BaP) and BaP-quinones, enhance IgE-mediated
References
116
histamine release and IL-4 production in human basophils. Clin Immunol 2003 Apr;
107 (1): 10-19.
140. Lumia M, Luukkainen P, Tapanaimen H, Kaila M, Erkkola M, Uusitalo L, et al.
Dietary fatty acid composition during pregnancy and the risk of asthma in the
offspring. Pediatr Allergy Immunol 2011 Dec; 22 (8): 827-35.
141. Kawai M, Hirano T, Higa S, Arimitsu J, Maruta M, Kuwahara Y, et al. Flavonoids and
related compounds as anti-allergic substances. Allergol Int 2007 Jun; 56 (2): 113-23.
142. Singh A, Holvoet S, Mercenier A. Dietary polyphenols in the prevention and
treatment of allergic diseases. Clin Exp Allergy 2011 Oct; 41 (10): 1346-59.
143. Pergola C, Werz O. 5-Lipoxygenase inhibitors: A review of recent development and
patents. Expert Opin Ther Patents 2010 Mar; 20 (3): 355-75.
144. Prigge ST, Boyington JC, Gaffney BJ, Amzel LM. Structure conservation in
lipoyigenases: structural analysis of soybean lipoxygenase-1 and modeling human
lipoxygenase. Protein Struct Funct Genet 1996 Mar; 24: 275-91.
145. Ponmozhi P, Geetha M, Kumar MS, and Devi PS. Extraction of anthocyanin and
analysing its antioxidant properties from Pithecellobium dulce fruit pericarp. Asian J
Clin Pharm Res 2011; 4 (1): 41-45.
146. Galati G, O’Brien PJ. Potential toxicity of flavonoids and other dietary phenolics:
Significance for their chemoprotective and anticancer properties. Free Rdical Bio
Med 2004 Aug; 37 (1): 287-3.
147. Galati G, Sabzevari O, Wilson JX, O’Brien PJ. Prooxidant activity and cellular effects
of the phenoxyl radicals of dietary flavonoids and other polyphenolics. Toxicology
2002 Aug; 177 (1): 91-04.
148. Hou DX, Ose T, Lin S, Harazoro K, Imamura I, Kubo M, et al. Anthocyanidins
induce apoptosis in human promyelocytic leukemia cells: Stucture-activity
relationship and mechanisms involved. Int J Oncol 2003 Sep; 23: 705-12.
149. Myers CR. Subcellular sites of xenobiotic-induced free radical generation. In KB
Wallace (Eds.), Free radical toxicology, 30-31. Washington: Taylor & Francis 1997.
150. Valentão P, Carvalho M, Fernandes E, Carvalho F, Andrade PB, Seabra RM, et al.
Protective activity of Hypericum androsaemum infusion against tert-butyl
hydroperoxide-induced oxidative damage in isolated rat hepatocytes. J
Ethnopharmacol 2004 May; 92 (1): 79-84.
151. Kennedy CH, Church DF, Winston GW, Pryor WA. tert-Butyl hydroperoxide-induced
radical production in rat liver mitochondria. Free Radic Biol Med 1992; 12 (5): 381-
87.
References
117
152. Lötscher HR, Winterhalter KH, Carafoli E, Richter C. Hydroperoxides can modulate
the redox state of pyridine nucleotides and the calcium balance in rat liver
mitochondria. P Natl Acad Sci USA 1979 Sep; 76 (9): 4340-44.
153. Marletta MA, Yoon PS, Iyengar R, Leaf CD, Wishnok JS. Macrophage oxidation of
L-arginine to nitrite and nitrate: nitric oxide is an intermediate. Biochemistry 1988
Nov; 27 (24): 8706-11.
154. Haliwell B, Rafter J, Jenner A. Health promotion by flavonoids, tocopherols,
tocotrienols and other phenols: direct or indirect effects? Antioxidant or not? Am J
Clin Nutr 2005 Jan; 81 (1): 268S-76S.
155. Dreiseitel A, Schreier P, Oehme A, Locher S, Hajak G, Sand PG. Anthocyanins and
their metabolites are weak inhibitors of Cyt p450 3A4. Mol Nutr Food Res 2008 Dec;
52 (12): 1428-33.
156. Dreiseitel A, Schreier P, Oehme A, Locher S, Rogle G, Piberger H, et al.
Anthocyanins and anthocyanidins are poor inhibitors of CYP2D6. Method Find Exp
Clin 2009 Jan-Feb; 31 (1): 3-9.
157. Ubeda A, Esteve ML, Alcaraz MJ, Cheeseman KH, Slater TF. Effects of flavonoids
on Cyt P450 from rat liver microsomes inhibition of enzyme activities and protection
against peroxidative damage. Phytother Res 1995 Sep; 9: 416-20.
158. Castilho RF, Kowaltowski AJ, Meinicke AR., Bechara EJH, Vercesi AE.
Permeabilization of the inner mitochondrial membrane by Ca2+ ions is stimulated by
t-butyl hydroperoxide and mediated by reactive oxygen species generated by
mitochondria. Free Radical Bio Med 1995 Mar; 18 (3): 479-86.
159. Sawa T, Nakao M, Akaike T, Ono K, Maeda H. Alkylperoxyl radical-scavenging
activity of various flavonoids and other phenolic compounds: Implications for the
anti-tumor-promoter effect of vegetables. J Agr Food Chem 1999 Feb; 47 (2): 397-2.
160. Sestili P, Guidarelli A, Dacha M, Cantoni O. Quercetin prevents DNA single strand
breakage and cytotoxicity caused by tert-butylhydroperoxide: Free radical
scavenging versus iron chelating mechanism. Free Radical Biol Med 1998 Jul; 25
(2): 196-00.
161. Jewell SA, Di Monte D, Richelmi P, Bellomo G, Orrenius S. tert-Butyl hydroperoxide-
induced toxicity in isolated hepatocytes: contribution of thiol oxidation and lipid
peroxidation. J Biochem Toxicol 1986 Sep; 1 (3): 13-22.
162. Sies H, Wahlländer A, Waydhas C, Soboll S, Häberle D. Functions of intracellular
glutathione in hepatic hydroperoxide and drug metabolism and the role of
extracellular glutathione. Adv Enzyme Reg 1980; 18: 303-20.
References
118
163. Jewell SA, Bellomo G, Thor H, Orrenius S, Smith MT. Bleb formation in hepatocytes
during drug metabolism is caused by disturbances in thiol and calcium ion
homeostasis. Science 1982 Sep; 217 (4566): 1257-59.
164. O’Sullivan AM, O’Callaghan YC, O’Grady MN, Oueguineur B, Hannify D, Troy DJ, et
al. Assessment of the ability of seaweed extracts to protect against hydrogen
peroxide and tert-butyl hydroperoxide induced cellular damage in Caco-2 cells. Food
Chem 2012 Sep; 134 (2): 1137-40.
165. Sies H, Gerstenecker C. Oxidation in the NADP system and release of GSSG from
hemoglobin-free perfused rat liver during peroxidatic oxidation of glutathione by
hydroperoxides. FEBS Letters 1972 Oct; 27 (1): 171-75.
166. Zelko I, Mariani TJ, Folz RJ. Superoxide multigene family: a comparison of the
CuZn-SOD (SOD I), Mn-SOD (SOD 2) and EC-SOD (SOD 3) gene structures,
evolution and expression. Free Radical Bio Med 2002 Aug; 33 (3): 337-49.