Embed Size (px)
Citation preview
Quaderni di Dipartimento
The Determinants of Structural Inertia: Technological and Organizational Factors
Massimo Colombo
(Università di Pavia)
Marco Delmastro (Università di Pavia)
# 3 (02-01)
Dipartimento di economia politica e metodi quantitativi
Università degli studi di Pavia Via San Felice, 5
I-27100 Pavia
Febbraio 2001
THE DETERMINANTS OF STRUCTURAL INERTIA:
TECHNOLOGICAL AND ORGANIZATIONAL FACTORS
Massimo G. Colombo, Università di Pavia and CIRET-Politecnico di Milano
Marco Delmastro, Università di Pavia and CIRET-Politecnico di Milano
Abstract
There are a growing body of theoretical work, wide anecdotal evidence and a few large-scale empirical studies
supporting the view that business firms quite rarely change their organizational structure, a phenomenon usually
referred to in the literature as “structural inertia”. The present paper aims to analyze empirically the determinants
of structural inertia. As far as we know, this work constitutes the first attempt to directly address such issue
through econometric estimates based on a large, longitudinal data set at plant level. For this purpose, we consider
changes of the organizational structure within a sample composed of 438 Italian manufacturing plants that are
observed from 1975 up to 1996. More precisely, we specify and test a duration model of the likelihood of an
individual plant changing the number of hierarchical tiers after a spell τ , provided that no change has occurred
up to τ. We consider a set of plant- and industry-specific explanatory variables which are expected to induce oroppose organizational change. The findings show that the adoption of advanced manufacturing technologies and
new human resources management practices favors organizational change. On the contrary, the presence of sunk
costs and the extent of influence activities figure prominently in explaining structural inertia of business
organizations.
Key words: inertia, influence activity, technology adoptions, organization, hierarchy
JEL classification: L2
__________________________
(*) We wish to thank Keith Cowling, Clelia Di Seri, Dennis Leech, Colin Mayer, Rocco Mosconi, Fabio Sartori
and Michael Waterson for useful comments and suggestions. The usual disclaimer applies. Financial support
from University of Pavia 1997 FAR funds is gratefully acknowledged. The authors are jointly responsible for the
work. However, sections 1, 2, 3 and 8 have been written by Massimo G. Colombo, and sections 4, 5, 6 and 7 by
Marco Delmastro.
Corresponding author:
Marco Delmastro,
Dipartimento di Economia e Produzione
Politecnico di Milano
P.za Leonardo da Vinci, 32
20133 Milan, ITALY

2
1. Introduction
There are wide anecdotal evidence and a few large-scale empirical studies supporting the
view that business firms quite rarely change their organizational structure, a phenomenon
usually referred to in the literature as “structural inertia”.
Both the economic press and studies in business history suggest that powerful conservative
forces are at work preventing firms from implementing organizational changes, even if such
changes would overtly improve performances. There are well known examples of companies
in which internal reorganization lasted for many years, being obstructed by high corporate
officers; in the end a drastic change of the top management was needed for the restructuring
to take place (see for instance the cases of Du Pont in Chandler et al. 1996, of General Motors
in Chandler 1962, of Mitsubishi in Moriwaka 1970, and of Siemens in Kocha 1971). In other
instances, organizational changes were only implemented when a crisis threatened the very
survival of the firm (see for instance Baker and Wruck 1989 and Wruck 1994, mentioned in
Schaefer 1998). In addition, econometric works on the adoption of the M-form by large
enterprises highlight that the diffusion of such organizational innovation has been extremely
slow when compared to the diffusion of technological innovations, thus suggesting the
existence of structural inertia (Teece 1980). More recently, a longitudinal study of the
organization of Italian metalworking plants (Colombo and Delmastro 1999) show that more
than 60% of the sampled plants did not change the number of hierarchical tiers in the 20 year
period under examination.
Why are firms so reticent to modify their organizational structure? In other words, what
are the determinants of structural inertia? Various explanations have been offered by the
economic literature.
Behavioralist theorists of organizations (see March and Simon 1958, Cyert and March
1963) point to the bounded rationality of economic agents and the costs involved by decision-
3
making activity under uncertainty to have access, store, process, and transmit information. As
there is no guarantee that a decision to modify the organization be optimal, firms prefer to
stay with their structure unless abnormally poor performances trigger change.
The literature on population ecology contends that structural inertia is the outcome of an
ecological-evolutionary process: selection tends to favor stable organizations, that is
organizations whose structure is difficult to change (Hannan and Freeman 1984). In
comparison with other institutions, business firms enjoy the advantage of a high level of
reliability and accountability (i.e. the capacity to collectively produce a product of given
quality repeatedly and to document the sequence of decisions and related outcome, see
Hannan and Freeman 1984, p. 153). But in order to assure reliability and accountability, a
firm’s organizational structure needs to be reproducible over time. This is obtained by
processes of institutionalization and by the creation of standardized routines, two factors
which make firms highly resistant to change.
Evolutionary theories of economic change (see Nelson and Winter 1982) help understand
why organizational routines are a source of structural inertia. According to such stream of
literature, routines are the repertoire of a firm’s idiosyncratic collective actions; they are built
through a cumulative process based on past experience of problem solving activity and
involve automatic coordinated responses to specific signals from the environment.i So, due
their very nature, they can only be modified incrementally and at considerable costs, with this
leading to lock-in effects which extend to firm’s entire organization.
Two further bodies of theoretical literature are key for understanding the sources of
structural inertia. The literature concerned with the investment behavior of firms under
uncertainty in the framework of real option theory (Dixit and Pindyck 1994) has argued that
when an investment decision entails sunk costs and future market conditions are uncertain,
there is an additional opportunity cost of implementing the decision which stems from the lost
4
option value of delaying it until new information is available. Any change of a firm’s
organization implies sunk costs, and its returns are uncertain by nature. So, it might be
optimal for a firm to postpone it until new information is collected.
Lastly, there are political forces within organizations that hinder organizational change (see
Milgrom 1988, Milgrom and Roberts 1990b). The reason is that adoption by a firm of a
particular organizational design leads to a particular distribution of quasi-rents among firms’
employees. Therefore, if a firm is going to change its organizational structure, a change which
is likely to have considerable distributional implications, individual employees will try to
influence the nature of the change so as to protect or augment their own quasi-rents. As such
influence activities absorb employees’ time and attention, which otherwise could be used in
directly productive activities, they engender substantial costs. In order to avoid them, a firm
may refrain from implementing organizational changes that would improve productive
efficiency, unless failure to do so threatens survival (Schaefer 1998).
The present paper aims to analyze empirically the determinants of structural inertia. As far
as we know, this work constitutes the first attempt to directly address such issue through
econometric estimates based on a large, longitudinal data set at plant level. For this purpose,
we consider changes of the organizational structure within a sample composed of 438 Italian
manufacturing plants that are observed from 1975 up to 1996. More precisely, we specify and
test a duration model of the likelihood of an individual plant changing the number of
hierarchical tiers after a spell τ, provided that no change has occurred up to τ. We consider a
set of plant- and industry-specific explanatory variables which are expected to stimulate or
oppose organizational change. We are especially interested in three aspects. First, we analyze
the impact of adoption of process innovations and new management practices in accordance
with the view that technological and managerial innovations are the main driver of
organizational change. Second, we consider the role of sunk costs associated with the
5
organization of plants’ production processes in favoring organizational inertia. Lastly, we
focus on variables which are likely to mirror the extent of influence activities by plants’
employees.
The paper is structured as follows. In Section 2, we analyze in greater detail the
determinants of organizational change and the sources of structural inertia. In section 3 we
describe the data set. Section 4 is devoted to the specification of the empirical model. In
Section 5 the explanatory variables are introduced. In Section 6 we present the estimates of
the econometric model, while Section 7 is devoted to the results of a simulation study. Some
summarizing remarks, in Section 8, concludes the paper.
2. The determinants of structural inertia of the managerial hierarchy
The theoretical literature on organizational design analyzes the characteristics of optimal
hierarchies, including the number of tiers (see Radner 1992). It is argued that the optimal
number of managerial levels is the result of the trade-off between loss of control and reduced
effectiveness of monitoring (Williamson 1967). On the one hand, the proliferation of
hierarchical layers leads to organizational failures due to information transmission leaks
between the top and the bottom of the organization. In a hierarchy decisions taken by top
managers must be implemented by workers at the bottom of the pyramid. Since agents are
organized serially within the organization, the efficiency of the implemented plan depends on
how effective is transmission of information from each superior to her direct subordinates.
The larger the distance between the top manager and productive workers, the more likely that
actions collectively undertaken by the latter will deviate from the ones decided by the former,
thus reducing managerial effectiveness (Beckmann 1977). On the other hand, with the number
of employees being held constant, a reduction of the number of tiers results in an increase of
the span of control, that is of the number of subordinates under each superior. As any superior
only has a limited amount of time available to check the efforts made by her immediate
6
subordinates, the probability of an individual employee being checked, and thus the
effectiveness of monitoring, decrease with the span of control (Calvo and Wellisz 1978).
Consequently, if the subordinates’ objectives diverge from those of the superior, a smaller
number of tiers results in greater shirking. Alternatively, higher efficiency wages must be
paid to firm’s employees so as to restore incentives to work.
In spite of the interest of such line of reasoning, the above arguments do not lead to
directly testable implications as to the determinants of organizational inertia. Namely, the
optimal number of tiers is contingent on exogenous conditions such as the difficulty of
transmitting instructions to and monitoring the efforts of subordinates; changes in the value of
such parameters will induce changes in the optimal number of tiers, with everything else
being equal. Unfortunately, in most instances variations over time of the value of such
parameters are unobservable. So, we can only assume that they are influenced by plant-, firm-
and industry-specific variables (e.g. R&D intensity, growth rate and concentration of
industries, size and age of organizations), which in turn are likely to influence the likelihood
of organizational change. What the above mentioned studies do suggest is that there is a
linkage between changes of a plant’s size and changes of the size of the managerial pyramid.
In fact, the optimal number of tiers is shown to increase with plant size.ii On the one hand,
when the organization expands with a fixed number of tiers, the span of control increases. In
order to restore proper incentives in the workforce, the number of hierarchical tiers must be
augmented, even though this results in increased loss of control (Qian 1994). On the other
hand, larger organizations need to process a larger amount of information than their smaller
counterparts. In order to avoid information overload and minimize information processing
time, firms resort to increasingly complex managerial hierarchies (Keren and Lehvari 1979
and 1983, Radner 1993, Bolton and Dewatripont 1994). It follows that changes of plant size
should be associated with changes of the number of hierarchical tiers.iii
7
The number of hierarchical tiers of a plant will also be influenced by the adoption of
technological innovations and new management practices. Generally speaking, use of both
advanced equipment and innovative techniques for managing human resources increase the
productivity of workers.iv
If the span of control at the bottom of the hierarchy is larger than
the one at the top, a condition which is usually met by real world business organizations, Qian
(1994) shows that higher productivity results in an increase of the optimal number of tiers.
Nonetheless, we believe that there is more than that as regards the relation between
innovation and organizational change. In a seminal paper, Milgrom and Roberts (1990a)
contend that adoption of advanced technologies, use of new human resource management
practices and organizational change are characterized by strong complementarities and non-
convexities. In the course of the 1980s and 1990s the appearance of several production
technologies associated with the “flexible firm” paradigm, such as FMSs and FMCs (flexible
manufacturing systems and cells), machining centers, programmable robots, CAD, CAM and
CAD-CAM equipment, substantially reduced the cost of designing and manufacturing an
increased variety of product versions and of introducing new products over time. Such
technologies exhibit strong complementarities: the marginal return to adoption of any of them
increases with adoption of the others (and with the extent of their use).v What is more
interesting for the purpose of the present study is that the above mentioned complementarities
extend to product/market strategies, management practices and the characteristics of the
organizational structure. Use of flexible technologies makes it easier for firms to implement a
market strategy based on a broad product line, short product life cycles and quick response to
environmental changes. In order to shorten decision time and assure greater responsiveness,
firms (and plants) have to reduce the delays caused by the communication of information up
and down the managerial hierarchy. This in turn requires delegation of decision authority
downwards the organizational pyramid, assignment of greater responsibility to productive
8
employees, increased reliance on a multi-skilled workforce so as to assure greater flexibility,
and recourse to suitable incentive-based payment schemes. As a consequence, intermediate
managerial positions and staff functions are eliminated, with this leading to a “leaner”
organization, that is one with a smaller number of tiers.
In accordance with the above arguments, we expect the adoption of advanced production
technologies and new human resource management practices to be a major factor for the
removal of inertial forces in organizations. We also expect the likelihood of organizational
change to positively covariate with the extent of use of advanced production technologies.vi
It is important to recognize that there are powerful forces within plants that oppose change
of the organizational structure It seems to us that two of deserve special attention.
First of all, structural inertia may be the (efficient) outcome of a firm’s attempt to avoid
sunk costs. Any change of a plant’s organization involves unrecoverable investments due to
the need to reallocate decision authority within the plant (and across different units that
belong to the same firm), reassign tasks to plant employees, redefine communication flows,
and modify administrative procedures. As the business environment is uncertain by definition,
such investments may engender substantial sunk costs should future conditions differ from
those expected at the time when the decision to change the organization was made. Under
such circumstances, real option theory (Dixit and Pyndick 1994) claims that there is an
additional opportunity cost in changing the organization due to the lost option value of
waiting for new information. So, it may be optimal for a plant to stay with the current
organizational structure even though it does not suit present business conditions. The larger
the sunk costs involved by organizational change, the larger the incentive to postpone it, that
is the larger structural inertia. We contend that the amount of sunk costs entailed by a change
of the number of managerial layers of a plant depends on plant’s specific organizational
pattern. More specifically, in plants that adhere to a Tayloristic organization of production,

9
there is a rigid division of labor among workers, tasks are specialized, organizational
procedures are standardized and codified in a formal way, and authority relations and
communication flows tend to be defined once for all at the upstart of production. It follows
that subsequent modifications of the organization are likely to involve substantial costs; so we
expect inertial forces to be quite strong in such plants.
Furthermore, the literature on influence activities (Milgrom 1988, Milgrom and Roberts
1990b. See also Schaefer 1998) claims that structural inertia may be due to the willingness of
firms’ (and plants’) management to limit the costs associated with such activities. A change of
of the number of tiers of a plant is likely to modify the distribution of quasi-rents among
plant’s employees. As a consequence, if employees anticipate that such a change will occur,
they will devote time and resources to trying to turn it to their own advantage, an activity
which obviously is detrimental to the organization. The incentives to indulge in such activity,
and thus the associated loss for the firm in terms of reduction of the productive effort of
employees, depend on the marginal benefits and costs to individual employees (Perri 1994).
These in turn are contingent on a number of factors. First, the expected benefits arising from
influence activities depend on the nature of decision-making within the organization: the more
discretionary decision-making power, the higher influence costs, with everything else being
held constant. Actually, if there is no room for influencing decisions because the decision-
maker has no discretionary power, the benefits of influence activities will entirely vanish.
Second, closeness to the agent entitled with decision-making power determines the personal
costs incurred by individual employees in trying to affect the outcome of her decisions. In
accordance with such argument, how responsibility for decisions relating to a plant’s
organizational chart is allocated within firms should figure prominently in explaining
structural inertia.
10
3. The data set
The data on plant organization used in this paper are provided by a survey of Italian
metalworking plants carried out in June 1997. The metalworking sector includes seven two-
digit NACE-CLIO industries: fabricated metals (31), non-electrical machinery (32),
computers and office equipment (33), electrical machinery and electronics (34), automotive
and other transportation equipment (35-36), and scientific, precision, medical and optical
instruments (37). In 1996 such industries accounted for 47% and 40% of total employees and
number of firms in the Italian manufacturing sector, respectively (see Istat 1999).
The data concern a sample composed of 438 plants. The sample was drawn in 1989 and
was initially composed of 810 plants that were in operation in 1986. It was stratified for plant
size, industry and geographical location so as to fully represent the 1986 universe of all Italian
metalworking plants with more than 10 employees. A questionnaire concerning the
organization of plants and the changes occurred during the 1975-’96 period was mailed to the
plant managers of the 708 plants of the initial sample that were still in operation in 1997
(actually 102 plants turned out to have been closed during the 1989-‘97 period). The response
rate was 62%. For each plant of the final sample, the plant manager was directly contacted by
phone in order to check the accurateness of answers (and to complete the questionnaire if
needed).
For each plant we know the date of the last two organizational changes that entailed a
change of the number of tiers and occurred in the 1975-‘96 period. We also know the number
of managerial levels of the plant at the end of 1996 and before the last organizational change.
Additional data on sample plants provided by the survey and relevant to the purpose of the
present paper include:
• a detailed description of plants’ decision-making structure. More precisely, for a series of
strategic decisionsvii
we know who is responsible and how the decision is made;
11
• the year of adoption by each plant of advanced manufacturing technologies such as
flexible manufacturing systems, machining centers, NC and CNC machinery, and
programmable robots, and of innovative management techniques such as rotation of
productive workers, use of quality circles and of payment systems based on measures of
individual performance;
• plants’ size (i.e. number of employees in 1996 and 1989), sector of operation and
ownership status.
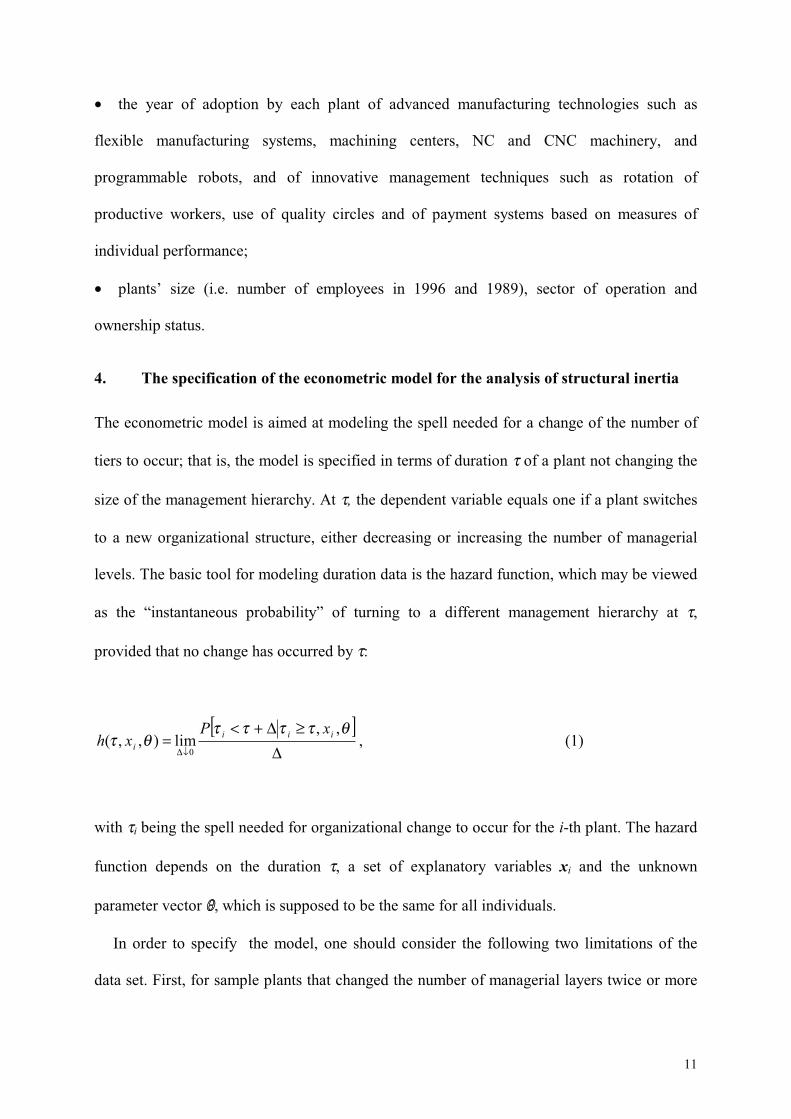
4. The specification of the econometric model for the analysis of structural inertia
The econometric model is aimed at modeling the spell needed for a change of the number of
tiers to occur; that is, the model is specified in terms of duration τ of a plant not changing the
size of the management hierarchy. At τ, the dependent variable equals one if a plant switches
to a new organizational structure, either decreasing or increasing the number of managerial
levels. The basic tool for modeling duration data is the hazard function, which may be viewed
as the “instantaneous probability” of turning to a different management hierarchy at τ,
provided that no change has occurred by τ:
[ ]∆
≥∆+<=
↓∆
θττττθτ
,,lim),,(
0
iii
i
xPxh , (1)
with τi being the spell needed for organizational change to occur for the i-th plant. The hazard
function depends on the duration τ, a set of explanatory variables xi and the unknown
parameter vector θ, which is supposed to be the same for all individuals.
In order to specify the model, one should consider the following two limitations of the
data set. First, for sample plants that changed the number of managerial layers twice or more
12
times between 1975 and 1996 the available data relate to the period that starts in the year
following the organizational change before the last one and ends in 1996. Second, as to the
remaining plants, we do not have any information prior to 1975. Therefore, the observation of
such plants is left-censored.
The usual way of dealing with left-censoring problems (see Andersen et al. 1992) would
be to estimate the unobserved date of the last organizational change that occurred before the
observation period.viii
However, this was not possible as we had no information on sample
plants before 1975 and the hazard rate was unlikely to be constant over time, due to both the
presence of time-dependent covariates and possible duration dependence (see Section 5).
What we did know is that such date is comprised between E
it , plant’s i year of foundation,
and 1975. In addition, should a plant not have changed the number of tiers from the year of
establishment up to 1975, it would be natural to compute the time spell from E
it .
Relying on such considerations, we proceeded in the following manner to determine the
duration origin. For plants that did not change the number of managerial layers during the
entire observation period the origin was initially assumed to coincide with the maximum (say
t0) between the plant’s year of foundation E
it and 1975. Observations of plants that changed
organizational structure only once were divided into two intervals: the first period of
observation goes from t0 to the date of the first organizational change (t1), while the time span
of the second interval is delimited by t1 and 1996. Lastly, observations of plants that changed
twice or more times, and thus are left-uncensored, were divided into two intervals: the first
period starts with the year that follows the organizational change before the last one and ends
with the date of the last change (t2); the time spell of the second interval is delimited by t2 and
1996. The three cases are illustrated in greater detail in the Appendix. Then, we recalculated
the time spell after replacing t0 with E
it and repeated the estimates.ix
This means that in this
latter case, plants that were in operation before 1975 were assumed to have maintained the

13
number of tiers constant from the date of establishment up to 1975. The results of the two sets
of estimates are remarkably similar; for sake of synthesis, in Section 6 we will only present
the estimates of the former model. What is important to emphasize here is that the
econometric results proved to be robust with respect to the choice of the (unobserved)
duration origins.
Under the above assumptions, the likelihood function can be written in terms of the hazard
rate, as follows (Cox and Oakes 1984):
∏∏ ∫∈
−=Ui
ii
i
i xhduxuhLi
),,(),,(exp)(0
θτθθτ
. (2)
U is the set of all right-uncensored individuals; it includes plants that changed organizational
structure between 1975 and 1996, when they are observed in the first interval out of the two in
which the observation period has been divided. The set of right-censored individuals
comprises: a) plants that stayed with the same organizational structure in the whole period of
scrutiny; b) plants that changed organizational structure, when they are observed in the second
interval of observation, that is after the year in which the last organizational change occurred.
(See again the Appendix). In order to estimate equation (2) a functional form allowing for
duration dependence must be chosen for the hazard function. Following recent work on
technology adoption (see Karshenas and Stoneman 1993, Colombo and Mosconi 1995) , we
assumed h() to be Weibull:
xp
iiiehhhppxh
βττβθτ ==≡ − ,)()],(,,[ 1
(3)

14
where p is the parameter that rules duration dependence. When p equals one, there is no
duration dependence; when it is greater than one there is positive duration dependence, while
a negative duration dependence arises when p is smaller than unity. The effects of the
covariates included in vector x are accounted for by the parameter vector β.
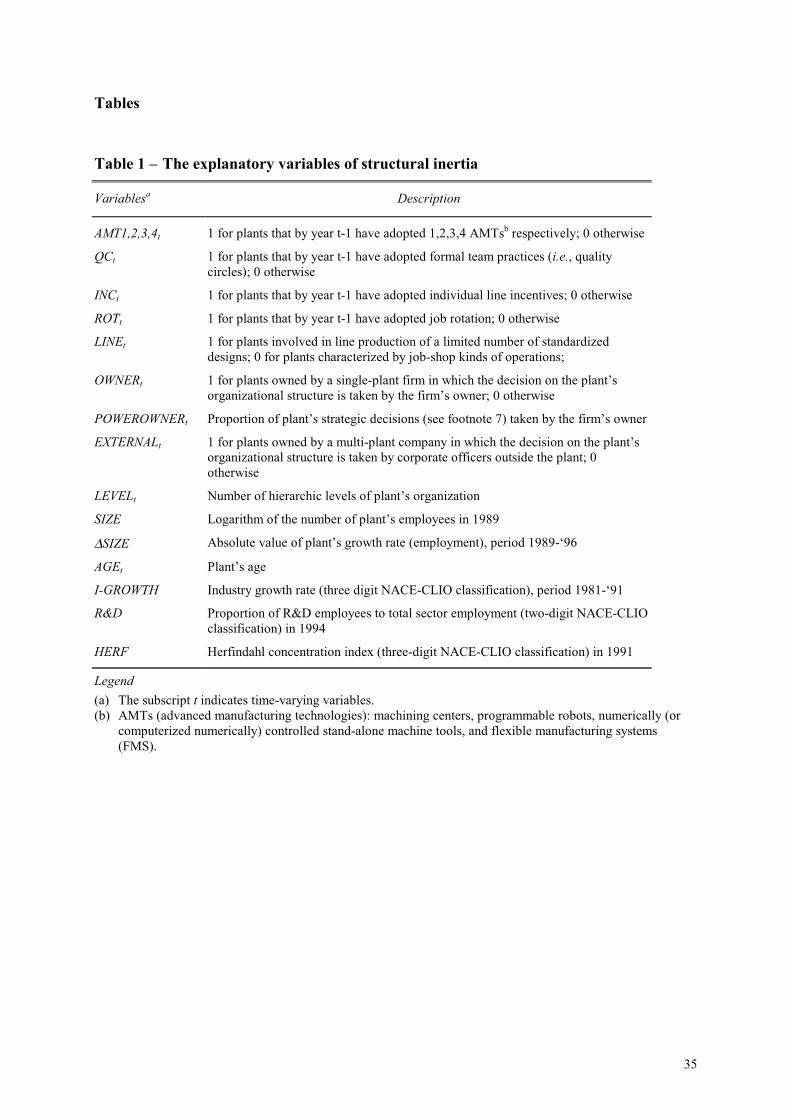
5. The explanatory variables of structural inertia
In this paragraph we concentrate on the explanatory variables of the likelihood of a plant
changing the number of tiers of the management hierarchy. They are presented in Table 1
where time varying variables are denoted by subscript t. They are divided into three sets.
The first set includes variables that capture adoption by sample plants of process
innovations and new human resource management techniques, having an expected positive
impact on organizational change.
As to technological innovations, we consider advanced manufacturing technologies
(AMTs) to which the recent empirical literature on technological change has devoted
considerable attention (see for instance Dunne 1994). In particular we focus on the following
AMTs: flexible manufacturing systems and cells (FMS), machining centers, NC and CNC
stand-alone machine tools, and programmable robots. As all such technologies pertain to the
production sphere, they directly affect production processes and consequently the
organization of plants. Generally speaking, both theoretical (Milgrom and Roberts 1990a) and
empirical (Bresnahan et al. 1999) studies suggest that the introduction of such advanced
technologies is positively related to organizational change. We also want to test the existence
of a “cluster effect”: AMTs may affect the organization of a plant especially when they are
introduced together rather than in isolation. For this purpose, we have defined four time-
varying dummy variables: AMT1, AMT2, AMT3 and AMT4 equal 1 for plants which by year t-
1 had adopted 1,2,3 and 4 AMTs, respectively. Doms et al. (1997), using a similar technology
count for US manufacturing plants, find that the intensity of use of AMTs (that is, the level of
15
intra-firm diffusion) is positively associated with the use of multiple technologies. So, we
expect plants that have adopted a greater number of AMTs to be more inclined towards
organizational change.
In addition, we consider time dependent dummy variables regarding the introduction of
new human resource management practices (HRMPs). QC, INC and ROT equal 0 for plants
that by year t have not adopted quality circles, individual incentive schemes and job rotation
practices, respectively. In the year following adoption they are switched to 1. These work
policies are at the core of recent empirical (Ichniowski et al. 1997) and theoretical research on
the organization of firms (Holmström and Milgrom 1994, Kandel and Lazear 1992). This
body of literature argues that the introduction of managerial innovations is part of a new
organizational paradigm characterized by greater decentralization of decision-making
activities, multitasking (rather than specialization of tasks), and reduced bureaucratization. As
Lindbeck and Snower (1996) point out “the organizational structure of firms is becoming
flatter: the new structure is built around teams that report to the central management, with few
if any intermediaries”. Hence, we predict a positive impact of QC, INC, and ROT on change
of plants’ organizational structure.
The second group encompasses explanatory variables aimed at reflecting forces that
oppose organizational change, namely the presence of sunk costs and the extent of influence
activities within plants.
The characteristics of plants’ production processes considerably affect the amount of sunk
costs entailed by changing the organization, and thus the likelihood of change. The impact of
sunk costs is examined through the time-varying dummy variable denoted LINE. LINE
indicates that at time t plants are involved in line production, whilst equals 0 for plants
characterized by job-shop kinds of operations. Line production is associated with
specialization of blue collars in specific tasks, codification of organizational procedures, and

16
rigid definition of communication flows and authority relations. On the contrary, job shop
operations are linked to a less formalized, more flexible multitask organization. Thus, plants
involved in line production should be less likely to change the organization of the
management hierarchy, due to the higher sunk costs associated with such a change.
Turning attention to influence activities, we expect their extent within a plant to be closely
linked with the characteristics of decision-making activities. Accordingly, we consider a
number of variables that control for the allocation of decision-making power within the firm
to which a given plant belongs. PM SUP is a time-varying dummy variable that equals 1 if at
time t the plant manager’s corporate superior has responsibility for decisions concerning the
plant’s organization. More specifically, PM SUP is set to 1 when authority over at least one of
the decisions regarding plant’s workforce (i.e. hiring and dismissal, definition of individual
and collective incentive schemes, and decisions on the career paths of plant’s employees) is
assigned to a plant manager’s superior. Given that we do not have specific information as to
the corporate level that takes the decision of changing the number of tiers, we assume that the
likelihood of such decision being taken by a superior of the plant manager is greater if she is
in charge of (some of the) decisions concerning the plant’s personnel.
Further, we distinguish between single-plant and multi-plant firms. In the Italian economy
the vast majority of firms is family-owned. This especially applies to single-plant (usually
smaller) organizations. Therefore, in these latter firms the corporate superior of the plant
manager generally is the owner. On the contrary, within a (usually larger) multi-plant
corporation she likely is a middle manager. In single-plant family-owned firms the owner
operates both inside and outside the plant and generally possesses discretionary power. Thus,
in this case influence activities are likely to be very high, due to both the proximity between
plant’s agents and the owner and the discretionary nature of decision-making. Conversely, in
large multi-plant corporations where decision-making on plant’s organization is assigned to a
17
salaried executive who works outside the production unit, influence activities are limited by
both the distance between the decision-maker and the agents who are affected by her
decisions and the existence of formal procedures that limit discretion.
In order to take into account these situations, we have defined three time-varying dummy
variables: OWNER, PM, and EXTERNAL.x
OWNER equals one if at time t decisions on
plant’s organization are assigned to the plant manager’s corporate superior (i.e. PM SUP =1)
and the plant is owned by a single-plant firm. In this case it is very likely that there are no
intermediate levels between the plant manager and the owner. Thus, OWNER captures
situations where the firm’s owner detains decision-making power on plant’s organization, and
is set to zero otherwise. PM equals one if at time t the plant manager is assigned responsibility
for the decision of changing the plant’s management hierarchy independently of the single or
multi-plant ownership status (PM SUP =0). EXTERNAL equals one when PM SUP is one (i.e.
authority is centralized at the plant manager’s corporate superior level) and the plant is owned
by a multi-plant corporation. In this latter case the plant manager’s corporate superior
probably is a high corporate officer who works outside the plant. On the basis of the
theoretical considerations on influence activities illustrated in Section 2, we expect the
following order as to the impact of the allocation of decision-making power upon the
likelihood of structural inertia: OWNER>PM>EXTERNAL.
Actually, case studies reveal that the owner of a family business is often unwilling to
change the organization. In (small) single-plant firms changing the organizational structure
means both introducing new corporate levels and delegating power downwards the
management hierarchy (see Colombo and Delmastro 1999). Due to moral hazard problems
and psychological motivations (i.e. the aversion towards loosing direct control of operations)
owners are usually reluctant to implement such change. It follows that the negative impact of
OWNER on the likelihood of changing the number of tiers might reflect factors that are not
18
connected with influence costs. In order to control for such effect, we have defined an
additional explanatory variable denoted POWEROWNER. Such variable aims to capture the
propensity of owners of family-owned single-plant firms towards centralization of decision-
making. It equals 0 when OWNER is 0. When OWNER equals 1, it is given by the number of
decisions out of the 6 considered here (see footnote 7) which are taken at the level of the plant
manager’s superior (that is, by the owner). So POWEROWNER is a proxy of the preference of
owners for autocratic decision-making. Should the negative influence of OWNER on the
likelihood of organizational change be due to psychological reasons, POWEROWNER would
be positively associated with structural inertia. Namely, if the owner detains authority over all
strategic decisions, organizational change will almost inevitably lead to some delegation of
power, a move that is likely to be opposed by an autocratic owner. On the contrary, evidence
that POWEROWNER is negatively related to structural inertia would be consistent with
explanations that emphasize the role of influence costs. In a family-owned firm in which the
owner is directly responsible for decisions related to the organizational chart, the incentives
for employees to engage in activities aimed at influencing the outcome of the owner’s
decisions would be higher if she delegates some other strategic decisions downwards the
organizational pyramid, as influence activities are more likely to be successful. In other
words, partial delegation signals the possibility to influence the owner. Instead, if she keeps
all decisions at the top, influence activities will be relatively discouraged.
The third category includes plant-, firm- and industry-specific control variables.
LEVEL is the number of a plant’s corporate levels at time t. It provides information on the
complexity of the structure of agents’ relations within the plant. On the one hand, the
managerial literature suggests that during the 1980s and 1990s plants characterized by very
bureaucratic structures have changed their organizations turning to “leaner” forms (Baharami
1992, Drucker 1988, Krafcik 1988). On the other, organizational ecology theory (Hannan and

19
Freeman 1984) predicts just an opposite relation: complexity of organizations causes
structural inertia. As a consequence, the likelihood of inertia may increase or decrease with
LEVEL, depending on which effect prevails.
SIZE is the logarithm of the number of plant’s employees at June 1989. We do not have
any priors as to the effect of such variable based on theoretical considerations. However,
previous empirical work on organizational change has devoted considerable attention to firm
size. On the one hand, Thompson (1983) shows that organizational change (i.e. the passage
from a functional form to an M-form in large multi-plant companies) is positively related to
firm size. On the other hand, more recent studies (see for instance Palmer et al. 1993) find
that once we control for (product and geographic) diversification the effect of size vanishes.
∆SIZE is the absolute value of a plant’s growth rate (in terms of employment) between 1989
and 1996.xi
In accordance with the theoretical literature mentioned in Section 2, we expect a
change in the number of employees to strongly affect the likelihood of changing the
organizational structure. In fact, since the number of tiers of a plant is a positive function of
the number of employees, a change in the latter should end up in a change in the former. AGE
conveys information on plant’s age at time t. Young plants have less consolidated hierarchic
structures in terms of procedural routines and authority relations than older ones. This should
render it easier changing the organization. In addition, in the early years after establishment it
is often necessary to adjust a plant’s organization as environmental conditions may differ
from those that were expected at the time when plant’s organizational chart was initially
designed. Therefore, we expect AGE to negatively affect organizational change.
As to industry-specific characteristics, we consider the following variables. I-GROWTH is
the value of industry growth rate (three-digit NACE-CLIO classification) in the period 1981-
‘91. To examine the impact of industry concentration on the likelihood of changing a plant’s
organization, we calculate the Herfindahl index at the three digit NACE-CLIO classification

20
in 1991 (HERF). Finally, we include the variable R&D, which is the ratio of R&D expenses
to industry turnover (two-digit NACE-CLIO classification) in 1994. Overall, we would expect
plants in high-tech, fast-growing and more competitive (i.e. less concentrated) industries to
change more frequently their organizations, due to the need to quickly adapt the production
structure to an unstable and competitive environment.
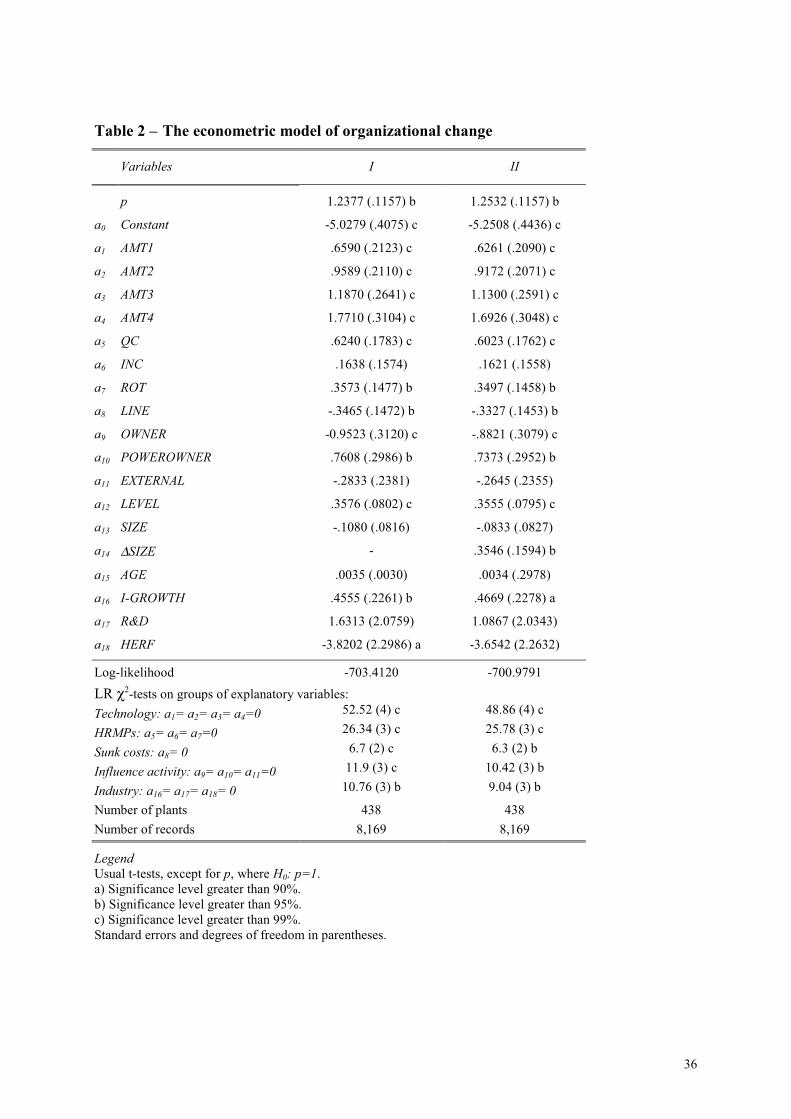
6. Empirical results
Table 2 presents the results of two Weibull duration models. In Model I we omit the variable
relating to plant’s growth rate, due to the problems in the definition of this measure (see
footnote 11). Results of other variables do not change from one model to the others. So,
thereafter we concentrate on Model II.
Before addressing the core issues which this paper is concerned with, i.e. the impact of
organizational variables and technology adoptions on structural inertia, let us consider the role
of “more classical” firm and industry-specific explanatory variables.
First, SIZE fails to register any additional significant impact upon the likelihood of a plant
changing the organizational structure once we consider the characteristics of plant’s
organization (notably, the number of levels of the management hierarchy). In contrast,
variations of the number of employees over time, captured by ∆SIZE (be they positive or
negative) turn out to have a positive impact. In a related paper Delmastro (2000) shows that
organizational depth is positively related to plant size; therefore the negative impact of ∆SIZE
on inertia would seem to mimic the static link: plants that are growing introduce new
corporate layers, whereas those that are downsizing decrease the depth of the management
hierarchy.
Contrary to expectations, AGE displays a negative effect on structural inertia, even if it
fails to register any significant explanatory power. As all sampled plants are at least three
years old, such result suggests that should young organizations suffer from organizational
21
instability, such effect would rapidly vanish over time. Turning to industry-specific variables,
they overall display a significant impact on structural inertia, with the coefficient of I-
GROWTH, R&D and HERF being jointly significant at conventional levels (see the LR tests
at the bottom of Table 2). In particular, in industries that are expanding, changes of a plant’s
organization are more likely than in declining industries, with the coefficient of I-GROWTH
being positive and significant. In addition, the negative (weakly significant) sign of HERF
highlights that industry concentration favors structural inertia. On the contrary, the estimates
fail to support the view that a higher scientific base induces more change, as the coefficient of
R&D though positive is insignificant.
As to the complexity of a plant’s organization, this turns out to be positively related to
organizational change, with the coefficient of LEVEL being positive and significant at the
99% level. This result contrasts with predictions of organizational ecology theory, confirming
instead case studies evidence provided by the managerial literature.
Next, let us focus attention on adoption of AMTs and HRMPs. Technology variables
overall display a great explanatory power, with the LR test of joint significance showing the
key role played by adoption of process innovations on organizational change. The coefficients
of the dummy variables AMT1, AMT2, AMT3 and AMT4 are all positive and statistically
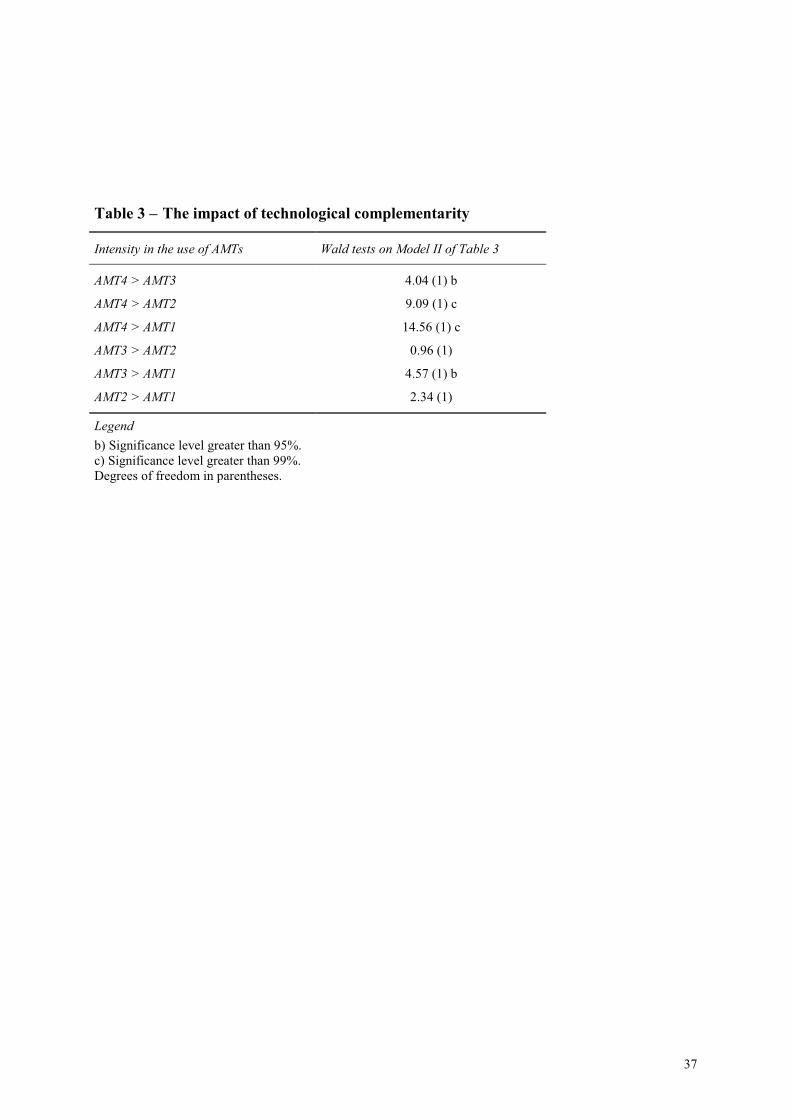
significant at 99%. Even more interestingly, these results show that the higher the intensity of
use of AMTs, the larger the impact on organizational change. This evidence is further
confirmed by the Wald tests of Table 3, which demonstrate that the increasing magnitude of
the effect of multiple technology adoptions on organizational change is statistically significant
in almost all cases: the larger the number of technologies in use, the higher the probability of
changing the management hierarchy. Such result points to the complementarity between the
adoption of technologies related to the Flexible Automation paradigm and consequent
changes in organization. In this sense, they are consistent with both theory (Milgrom and

22
Roberts 1990a) and previous empirical evidence (Colombo and Mosconi 1995). Lastly, the
results on HRMPs confirm the predictions of theoretical work: the management hierarchy
often changes with the introduction of managerial innovations. The coefficients of INC, QC
and ROT are positive, with the last two being significant at conventional levels.xii
The result of the variable LINE, which has a negative and significant (at 95%) coefficient,
shows that sunk costs are key in explaining structural inertia. Given that a) plants whose
layout of production is in line incur in high sunk costs when changing their organizational
structure and b) the decision on organizational change implies uncertain returns, then in
accordance with real option theory (Dixit and Pyndick 1994) for a plant’s management may
be rational to postpone any change until new information is collected. This in turn leads to the
detected inertial process.
Let us now turn to variables reflecting the allocation of decision-making. They overall
display a significant impact on the likelihood of changing the organizational chart (see again
the LR tests at the bottom of Table 2). Contrary to expectations, the variable EXTERNAL has
a negative, statistically insignificant coefficient in the estimates; this possibly suggest that
with all else being equal, proximity of a plant’s employees to the decision-maker does not
influence organizational change when the decision-maker is a salaried manager. Instead, the
variables OWNER and POWEROWNER are significant at conventional levels. As was
expected, plants owned by a single-plant firm where the owner is in charge of decisions
relating to plant’s organizational chart are most likely to be characterized by structural inertia:
the coefficient of OWNER is negative and significant at the 99% level. In addition, the
negative effect of OWNER on the likelihood of change decreases with the extent to which
authority over strategic decisions is centralized in the owner’s hands, as is apparent from the
positive, statistical significant (at 95%) coefficient of POWEROWNER. In other words, the
more centralized is decision-making in owner-managed plants, the more likely is
23
organizational change. Such evidence clearly provides support to the role played by influence
activities in inhibiting organizational change. Agents are very likely to try to influence the
decisions of the principal so as to defend their personal quasi-rents, especially when a) the
principal is entitled with discretionary decision power, a condition which distinguishes
situations where the owner-manager is in charge of decisions relating to a plant’s managerial
hierarchy from those where responsibility for such decisions is delegated to a salaried
manager and b) influence activities are likely to be successful; this in turn is signaled by the
fact that the owner partially allocates strategic decision-making power to lower levels, even
though she does keep authority over decisions as to the size of the managerial pyramid. If the
negative coefficient of OWNER were to be explained by psychological motivations connected
with the aversion of owner-managers towards organizational changes which often imply a
delegation of decision-making authority to salaried managers, then POWEROWNER should
display a negative coefficient, as very autocratic owners would likely be most resistant to
organizational change. Such argument is not supported by our findings.
7. Simulations
The coefficients of the econometric models presented in Table 2 are not derivatives in the
estimations, thus assessing the magnitude of the impact of the different explanatory variables
is difficult. For this purpose, we have proceeded to simulate the model. The basic idea is to
use the estimated parameters for calculating the distribution function F(τ,x,θ). For any plant,
F gives the probability of having changed the organization by τ years from the last
organizational change. As a benchmark, we have firstly calculated the value of F when the
explanatory variables in the vector x take on values that describe the “representative plant”.
The probability of the representative plant is then compared to those calculated for different
values of x, in order to analyze the estimated effects of the variable(s) which have been
modified.
24
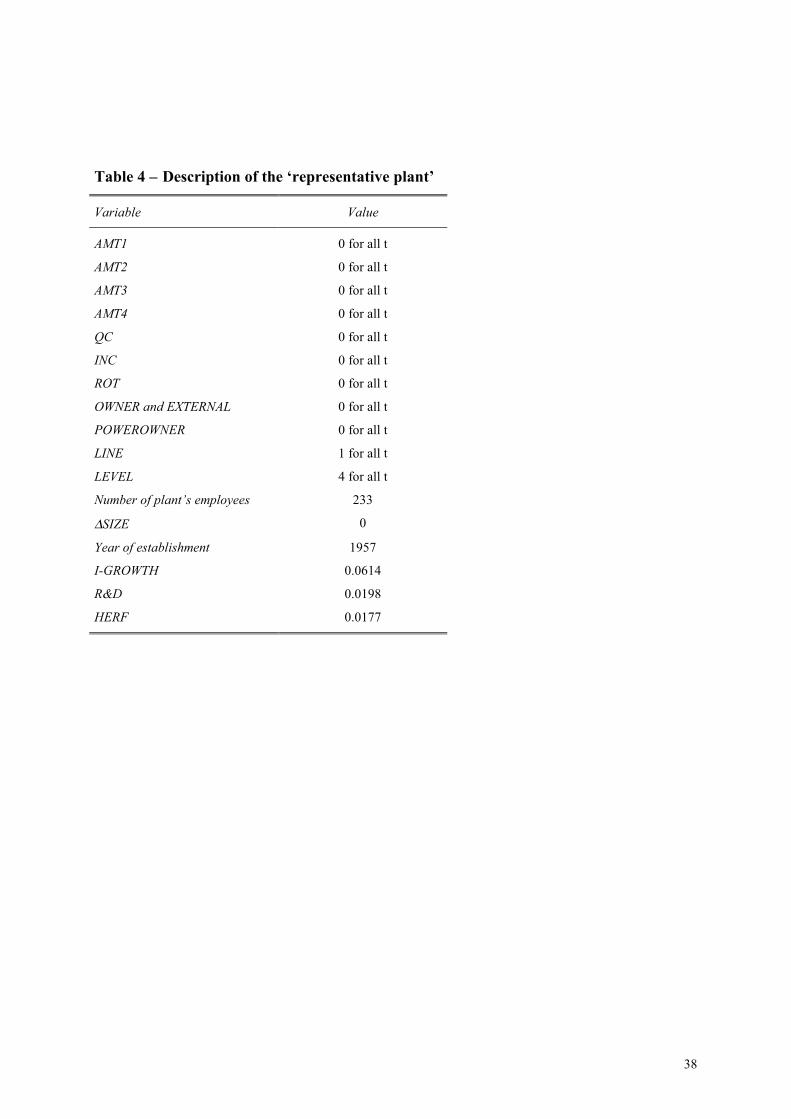
The characteristics of the representative plant are described in Table 4. All non-dummy
variables have been set at (or around) the mean, while dummies have been set to zero for the
whole period with the exception of LINE, which equals 1. So, the benchmark case is
represented by a plant founded in 1957, with a constant number of employees equal to 233,
and characterized by a four-level hierarchy in which decisions on plant’s organizational
structure are assigned to the plant manager (i.e. OWNER and EXTERNAL =0).
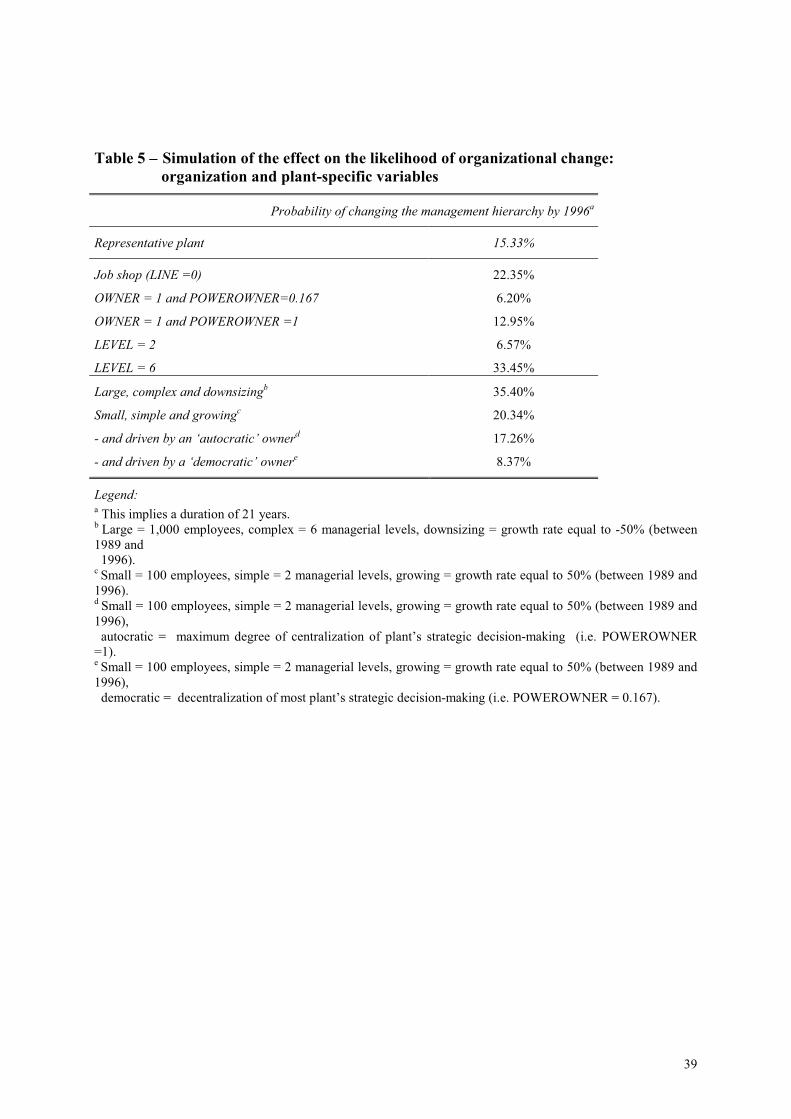
Tables 5 and 6 illustrate the predicted probability of changing the organization by 1996
(i.e. in a period of 21 years) when the significant explanatory variables are changed one at a
time, to give an idea of the impact of each variable on structural inertia. Whenever a variable
is changed, it is set either to a value representative of the lowest values observed in our
sample, or to a value representative of the highest ones. This with the exceptions of SIZE and
∆SIZE, for which intermediate (more interesting) values have been chosen. As for the time
varying dummies that capture characteristics of the organization, technology adoptions and
HRMPs, when they are changed they are set to 1 from the beginning of the period considered
(i.e. from 1975).
Table 5 presents simulations of the effects on structural inertia of change in organization
and other plant-specific variables with respect to the representative plant. The sunk costs
explanation of structural inertia is supported by the effect of the type of production
operations: plants that are involved in line production operations are far less likely to change
their structure than plants characterized by job shop kinds of operations, the probability of
changing the organizational chart by 1996 being 22.3% for job shop production units and
15.3% for line production units. Influence activities also strongly inhibit the stimulus towards
change. In particular, structural inertia is more marked in single-plants where the owner keeps
authority over the organizational change. But this is not the result of an autocratic attitude of
the owner. Indeed, when the owner delegates some power downward the organizational
25
pyramid, influence activities are stronger due to a reputation effect: firm’s agents are more
likely to incur in influence activities because there is more room to affect owner’s behavior.
Indeed, the likelihood of changing the organization decreases from 13%, when plant’s
decision-making is totally centralized at the owner’s level, to 6.6%, in the case of a
‘democratic” owner prone to delegation.
As to organizational complexity, the probability of changing the organization of plants
considerably increases with the size of the management hierarchy from 6.6% in a 2-layered
organization up to 33.4% with 6 managerial layers.
At the bottom of Table 5, we present results for two important categories of plants: large
(number of employees=1,000), complex (number of levels=6) and declining (growth rate =
-50%) units and small (100), simple (2) and growing (+50%) plants. The former tend to
change their organization quite often (35.4% versus 15.3% of the benchmark case), whilst the
latter follow a more inertial process (20.3%), particularly pronounced in plants where the
owner is in charge of the decision on organizational change but delegates other decision-
making activities (8.4%).
Lastly, Table 6 shows the results of the simulated effects on structural inertia of technology
adoptions and use of HRMPs. First, the impact of adoption of AMTs on organizational
change seems to be greater than that of HRMPs: a plant that by 1975 had adopted one AMT
has a probability of changing its structure by 1996 equal to 30.6%, a value greater than the
one associated with the most influent category of HRMPs (Quality Circles with 29.9%).
Second, the effect of technological complementarity is now more manifest. The higher the
number of flexible technologies adopted, the larger the impact on organizational change, with
a plant that by 1975 had adopted four AMTs being almost sure to change its management
hierarchy by 1996 (75.4% versus 15.3% of the “no adoption” case).
26
8. Concluding remarks
This paper was aimed at analyzing empirically the determinants of structural inertia, that is
the tendency of business organizations to maintain constant the size of the managerial
hierarchy (i.e. the number of hierarchical levels). We were especially interested in the role of
technological factors and organizational variables in favoring or inhibiting organizational
change. For this purpose, we considered the evolution of the organizational chart of 438
Italian manufacturing plants over the 1975-’96 period. We estimated a duration model of the
likelihood of a plant changing organizational structure after a spell τ, given no change up to τ.
As far as we know, this work constitutes the first attempt to provide large-scale quantitative
evidence based on econometric estimates on such phenomenon, while our knowledge of it so
far relied almost exclusively on anecdotal evidence.
The main results of the study can be synthesized as follows.
First, adoption of advanced manufacturing technologies associated with the flexible
automation paradigm and new human resources management practices such as job rotation,
quality circles and incentive-based payment schemes, figure prominently in explaining the
likelihood of organizational change, with the impact of the former variables being larger than
that of the latter. In addition, there seem to be cumulative effects: structural inertia rapidly
decreases with the extent of use of advanced manufacturing technologies. Altogether, such
results are consistent with the view that use of flexible technologies, recourse to innovative
management techniques, and change of a plant’s organizational structure are characterized by
strong complementarities: they are highly profitable only if they are all carried out together.
Second, when we turn attention to organizational variables, the results of the estimates lend
support to the view that the existence of sunk costs and the extent of influence activities
within a plant are important determinants of structural inertia.
27
On the one hand, plants that adhere to a Tayloristic organization of production turn out to
change the number of managerial levels more rarely than those characterized by job-shop
operations; the reason may be that in the former plants such changes involve substantially
greater sunk costs, due to the rigid specialization of the tasks performed by workers, the
formal codification of procedures, and the rigid definition of authority relations and
communication flows. Of course, there may be other sources of sunk costs in organizations,
associated for instance with the specificity of physical assets or the unrecoverable nature of
investments in human capital. The findings of the present work suggest that it may be
worthwhile investigating their effects on the persistence of the structure of business
organizations.
On the other hand, our findings show that the allocation of decision authority has a
considerable impact on the likelihood of organizational change. Independent family-owned
plants where it is up to the owner to modify plant’s organizational chart are more resistant to
change than the remaining plants, that is both independent plants where such responsibility is
allocated to the plant manager and plants that belong to multi-plant firms. Namely, in the
former plants the owner generally is quite close to plant’s employees, differently from the
middle-manager of a multi-plant organization who works outside the production unit under
consideration; in addition, the owner has a rather discretionary decision power in the sense
that her decisions are not limited by the existence of formal procedures, a situation which
instead is typical of a salaried manager. Among independent plants where the owner is
directly in charge of modifying the number of managerial levels, the most resilient ones turn
out to be those where strategic decisions relating to other aspects such as the introduction of
new technologies or the purchase of new capital equipment are delegated by the owner
downwards the management hierarchy. In plants with a very autocratic owner who centralizes
decision-making in her own hands, modifications of the organizational chart are relatively
28
more frequent. Such results are easily interpreted in the light of the theoretical contributions
on influence costs. Namely, following Schaefer (1998), in owner-managed plants the
centralization of decision-making may be interpreted as signaling the difficulty for plant’s
employees to affect the outcome of the decisions of the owner. Under such circumstances
incentives for them to indulge in influence activities will be weak. On the contrary, incentives
will be stronger if the owner has a reputation of taking into account the opinion of others, a
situation which is more likely if decision authority is assigned at least partially to
subordinates. It is worth emphasizing that such results cannot simply be explained by
psychological motivations which trace back structural inertia to the aversion of the owner of a
family business to delegate power to subordinates.
Lastly, in contrast to the predictions of ecological organization theory, the econometric
estimates confirm the anecdotal evidence provided by the managerial literature that in the
1980s and 1990s, bureaucratic organizations characterized by a large number of managerial
levels have been more prone to organizational change, generally implying a reduction of the
size of the hierarchical pyramid with the adoption of a leaner organization, than plants having
a simpler managerial hierarchy. Such effect is on top of the positive effect on the likelihood of
change determined by corporate downsizing;xiii
nor it can be explained by industry-specific
effects connected with the restructuring of mature, capital intensive and highly concentrated
industries, dominated by bureaucratic organizations. As to industry-specific effects, growth
and competition seem to stimulate organizational change, as firms struggle to adapt to
changing business conditions.
We think that the present paper offers an important contribution to shed light into the
determinants of firms’ organization and its evolution over time. Nonetheless, we are aware
that much remains to be done in this field.
29
In particular, there are two directions for future research that seem especially promising.
First, notwithstanding the wide set of determinants considered in this paper, there may of
course be other factors that have some bearing on structural inertia and were not taken into
account due to lack of data. In particular, at plant level, it would be interesting to consider
explanatory variables that reflect the skills of the workforce. Plants with operators with higher
skills incur into lower costs of re-organizing the production process (see Bresnahan et al.
1999); so they should be more inclined to organizational change. In addition, there is a
linkage between the organization of a plant and that of its parent firm. Therefore, radical
changes in the latter, due for instance to change of ownership or to managerial turnover,
should likely result in a change of the former.
Second, in spite of the fact that the number of hierarchical layers is a key ingredient of
business organizations, inertia may concern other important aspects of a plant’s organization.
One such dimension is resilience of authority relations. In another paper (Colombo and
Delmastro 2000) we analyze the determinants of the allocation of decision-making power. It
would be interesting to investigate what factors influence change of such allocation and
whether they differ according to the nature of the decision (e.g. strategic versus operating
decisions, decisions concerning the labor force versus those concerning capital): such issue is
high in our research agenda.

30
Appendix
We have classified plants depending on the evolution of their organizational structure. In
particular there are three possible cases, which are graphically presented in what follows: a)
plants that have not changed their organization over the observation period (i.e. from 1975 to
1996), b) plants that have changed once, and c) plants that have changed twice or more times.
a) No organizational change:
In this case the starting date of the observation period (t0) is the maximum between 1975 (the
first year of observation of the empirical survey) and the date of plant’s foundation ( E
it ).
Observations are both left- and right-censored, since we do not know the exact date of the last
organizational change and we impose a closing date given by 1996.
b) one organizational change
In this case we divide the period under observation into two intervals. The first starts from t0
and ends at the date of the organizational change (t1); observations are left-censored. The
second is delimited by t1 and 1996; observations are right-censored.
t0 =max(1975, E
it ) 1996 time
τ=1996-t00 duration
duration
time1996 t0=max(1975, E
it ) t1= date of the org. change
τ2=1996-t1τ1=t1-t00

31
c) two or more organizational changes
The period under observation is divided into two intervals. The first starts from the date of the
organizational change before the last one (t1) and ends at the date of the last change (t2). The
second interval is delimited by t2 and 1996; in this latter case observations are right-censored.
durationτ2=1996-t2τ1=t2-t1 0
time1996t1 = date of the org.
change before the last one
t2 = date of the last org. change

32
References
Andersen, P., Borgan, O., Gill, R.D., Keiding, N., 1993. Statistical models Based on Counting
Processes, (Springer-Verlag, London).
Baharami, H, 1992, “The emerging flexible company,” California Management Review, 34,
pp.33-52.
Beckmann, M.J., 1977, “Management production functions and the theory of the firm,”
Journal of Economic Theory, 14, pp.1-18.
Bolton, P. and Dewatripont, M., 1994, “The firm as a communication network,” Quarterly
Journal of Economics, 109, pp.809-39.
Bresnahan, T., Brynjolfsson, E. and Hitt, L., 1999, “Information technology, workplace
organization and the demand for skilled labor: firm-level evidence,” NBER Working
Paper, 7136.
Calvo, G., and Wellisz, S., 1978, “Supervision, loss of control, and the optimal size of the
firm,” Journal of Political Economy, 86, pp.943-952.
Cappelli, P., Neumark, D., 1999, “Do ‘high performance’ work practices improve
establishment-level outcomes?,” NBER Working Paper, 7374.
Chandler, A.D., 1962. Strategy and Structure, (The MIT Press, Cambridge MA).
Chandler, A.D., McCrow, T.K. and Tedlow, R.S., 1996. Management Past and Present,
(South-Western College Publishing, Cincinnati).
Cohen, N.D., Burkhart, R., Dosi, G., Egidi, M., Marengo, L., Warglien, M., and Winter, S.,
1996, “Routines and other recurring action patterns of organizations: Contemporary
research issues,” Industrial and Corporate Change, 5, pp. 653-699.
Colombo, M., and Delmastro, M., 1999, “Some stylized facts on organization and its
evolution,” Journal of Economic Behavior and Organization, 40, pp.255-274.
Colombo, M., and Delmastro, M., 2000, “Formal and real authority in organizations: testing
the determinants of the allocation of decision-making,” mimeo, Politecnico di Milano.
Colombo, M. and Mosconi, R., 1995, “Complementarity and cumulative learning effects in
the early diffusion of multiple technologies,” Journal of Industrial Economics, XLIII,
pp.13-48.
Cox, D.R. and Oakes, D., 1984. Analysis of Survival Data, (Chapman and Hall, London).
Cyert, R. and March J., 1963. A Behavioral Theory of the Firm, (Prentice-Hall, Englewood
Cliff, N.J.).
Delmastro, M., 2000, “The determinants of the management hierarchy: evidence from Italian
plants,” International Journal of Industrial Organization, forthcoming.
Di Nardo, J. and Pischke, J.S., 1997, “The returns to computers use revisited: have pencils
changed the wage structure too?,” Quarterly Journal of Economics, 112, pp.291-311.
Dixit, A. and Pindyck, R., 1994. Investment under Uncertainty, (Princeton University Press,
Princeton).
Doms, M., Dunne, T. and Troske, K., 1997, “Workers, wages and technology,” Quarterly
Journal of Economics, 112, pp.253-290.
33
Drucker, P.F., 1988, “The coming of the new organization,” Harvard Business Review, 66,
pp. 45-55.
Dunne, T., 1994, “Plant age and technology use in U.S. manufacturing industries,” RAND
Journal of Economic, 25, pp.488-499.
Hannan, M.T. and Freeman, J., 1984, “Structural inertia and organizational change,”
American Sociological Review, 49, pp.149-164.
Holmstrom B., and Milgrom, P., 1994, “The firm as an incentive system,” American
Economic Review, 84, pp.972-991.
Ichniowski, C., Shaw, K. and Prennushi, G., 1997, “The effects of human resource
management practices on productivity: a study of steel finishing lines,” American
Economic Review, 87, pp.291-313.
Istat, 1999, Censimento Intermedio dell’Industria e dei Servizi.
Kandel, E. and Lazear, E., 1992, “Peer pressure and partnership,” Journal of Political
Economy, 100, pp.801-817.
Karshenas, M. and Stoneman P., 1993, “Rank, stock, order, and epidemic effects in the
diffusion of new process technologies: an empirical model,” RAND Journal of Economics,
pp.503-528.
Keren, M. and Levhari, D., 1979, “The optimum span of control in a pure hierarchy,”
Management Science, 25, pp.1162-1172.
Keren, M. and Levhari, D., 1983, “The internal organization of the firm and the shape of
average costs,” Bell Journal of Economics, 41, pp.474-486.
Kocha, J., 1971, “Family and bureaucracy in German industrial management 1850-1914,”
Business History Review, 45, pp.133-156.
Krafcik, J.F., 1988, “Triumph of the lean production system,” Sloan Management Review,
fall, pp.41-51.
Lindbeck, A. and Snower, D.J., 1996, “Reorganization of firms and labor-market inequality,”
American Economic Review Paper and Proceedings, 86, pp.315-321.
March, J.G. and Simon, H., 1958. Organizations, (Wiley & Sons, New York).
Milgrom, P., 1988, “Employment contracts, influence activities and efficient organization
design,” Journal of Political Economy, 96, pp.46-60.
Milgrom, P. and Roberts, J., 1990a, “The economics of modern manufacturing: technology,
strategy, and organization,” American Economic Review, 80, pp.511-528.
Milgrom, P. and Roberts, J., 1990b, “Bargaining costs, influence costs, and the organization
of economic activity,” in Alt, J. and Shepsle, K. Perspectives on Positive PoliticalEconomy, (Cambridge University Press, Cambridge).
Moriwaka, H., 1970, “The organizational structure of the Mitsubishi and Mitsui zaibatsu,”
Business History Review, 44, pp.62-83.
Nelson, R. and Winter, S., 1982. An Evolutionary Theory of Economic Change, (Harvard
University Press, Cambridge MA).
Palmer, D., Devereaux Jennings, P. and Zhou, X., 1993, “Late adoption of the multidivisional
form by large U.S. corporations,” Administrative Science Quarterly, 38, pp.100-131.
34
Perri, T.J., 1994, “Influence activity and executive compensation”, Journal of Economic
Behavior and Organization, 24, pp.169-181.
Qian, Y., 1994, “Incentives and loss of control in an optimal hierarchy,” Review of Economic
Studies, 61, pp.527-544.
Radner, R., 1992, “Hierarchy: the economics of managing,” Journal of Economic Literature,
30, pp.1382-1415.
Radner, R., 1993, “The organization in decentralized information processing,” Econometrica,
61, pp.1109-1146.
Schaefer, S., 1998, “Influence costs, structural inertia, and organizational change,” Journal of
Economics and Management Strategy, 7, pp.237-263.
Stoneman, P. and Kwon, M.J., 1996, “Technology adoption and firm profitability,” Economic
Journal, 106, pp.952-962.
Teece, D.J., 1980, “The diffusion of administrative innovation,” Management Science, 26,
pp.464-470.
Thompson, R., 1983, “Diffusion of the M-form structure in the UK,” International Journal of
Industrial Organization, 1, pp.297-315.
Williamson, O.E., 1967, “Hierarchical control and optimum firm size,” Journal of Political
Economy, 75, pp.123-138.
Winter, S.G., 1988, “On Coase, competence, and the corporation,” Journal of Law,
Economics, and Organization, 4, pp.163-80.
Womack, J., Jones, D.T. and Ross, D., 1990. The Machine that Changed the World,
(Macmillan, New York).
van Zandt, T., 1999, “Real-time decentralized information processing as a model of
organizations with boundedly rational agents,” Review of Economic Studies, 66, pp.633-
658.
35
Tables
Table 1 – The explanatory variables of structural inertia
Variablesa Description
AMT1,2,3,4t 1 for plants that by year t-1 have adopted 1,2,3,4 AMTsb respectively; 0 otherwise
QCt 1 for plants that by year t-1 have adopted formal team practices (i.e., quality
circles); 0 otherwise
INCt 1 for plants that by year t-1 have adopted individual line incentives; 0 otherwise
ROTt 1 for plants that by year t-1 have adopted job rotation; 0 otherwise
LINEt 1 for plants involved in line production of a limited number of standardized
designs; 0 for plants characterized by job-shop kinds of operations;
OWNERt 1 for plants owned by a single-plant firm in which the decision on the plant’s
organizational structure is taken by the firm’s owner; 0 otherwise
POWEROWNERt Proportion of plant’s strategic decisions (see footnote 7) taken by the firm’s owner
EXTERNALt 1 for plants owned by a multi-plant company in which the decision on the plant’s
organizational structure is taken by corporate officers outside the plant; 0
otherwise
LEVELt Number of hierarchic levels of plant’s organization
SIZE Logarithm of the number of plant’s employees in 1989
∆SIZE Absolute value of plant’s growth rate (employment), period 1989-‘96
AGEt Plant’s age
I-GROWTH Industry growth rate (three digit NACE-CLIO classification), period 1981-‘91
R&D Proportion of R&D employees to total sector employment (two-digit NACE-CLIO
classification) in 1994
HERF Herfindahl concentration index (three-digit NACE-CLIO classification) in 1991
Legend
(a) The subscript t indicates time-varying variables.
(b) AMTs (advanced manufacturing technologies): machining centers, programmable robots, numerically (or
computerized numerically) controlled stand-alone machine tools, and flexible manufacturing systems
(FMS).
36
Table 2 – The econometric model of organizational change
Variables I II
p 1.2377 (.1157) b 1.2532 (.1157) b
a0 Constant -5.0279 (.4075) c -5.2508 (.4436) c
a1 AMT1 .6590 (.2123) c .6261 (.2090) c
a2 AMT2 .9589 (.2110) c .9172 (.2071) c
a3 AMT3 1.1870 (.2641) c 1.1300 (.2591) c
a4 AMT4 1.7710 (.3104) c 1.6926 (.3048) c
a5 QC .6240 (.1783) c .6023 (.1762) c
a6 INC .1638 (.1574) .1621 (.1558)
a7 ROT .3573 (.1477) b .3497 (.1458) b
a8 LINE -.3465 (.1472) b -.3327 (.1453) b
a9 OWNER -0.9523 (.3120) c -.8821 (.3079) c
a10 POWEROWNER .7608 (.2986) b .7373 (.2952) b
a11 EXTERNAL -.2833 (.2381) -.2645 (.2355)
a12 LEVEL .3576 (.0802) c .3555 (.0795) c
a13 SIZE -.1080 (.0816) -.0833 (.0827)
a14 ∆SIZE - .3546 (.1594) b
a15 AGE .0035 (.0030) .0034 (.2978)
a16 I-GROWTH .4555 (.2261) b .4669 (.2278) a
a17 R&D 1.6313 (2.0759) 1.0867 (2.0343)
a18 HERF -3.8202 (2.2986) a -3.6542 (2.2632)
Log-likelihood -703.4120 -700.9791
LR χ2-tests on groups of explanatory variables:
Technology: a1= a2= a3= a4=0 52.52 (4) c 48.86 (4) c
HRMPs: a5= a6= a7=0 26.34 (3) c 25.78 (3) c
Sunk costs: a8= 0 6.7 (2) c 6.3 (2) b
Influence activity: a9= a10= a11=0 11.9 (3) c 10.42 (3) b
Industry: a16= a17= a18= 0 10.76 (3) b 9.04 (3) b
Number of plants 438 438
Number of records 8,169 8,169
LegendUsual t-tests, except for p, where H0: p=1.
a) Significance level greater than 90%.
b) Significance level greater than 95%.
c) Significance level greater than 99%.
Standard errors and degrees of freedom in parentheses.
37
Table 3 – The impact of technological complementarity
Intensity in the use of AMTs Wald tests on Model II of Table 3
AMT4 > AMT3 4.04 (1) b
AMT4 > AMT2 9.09 (1) c
AMT4 > AMT1 14.56 (1) c
AMT3 > AMT2 0.96 (1)
AMT3 > AMT1 4.57 (1) b
AMT2 > AMT1 2.34 (1)
Legend
b) Significance level greater than 95%.
c) Significance level greater than 99%.
Degrees of freedom in parentheses.
38
Table 4 – Description of the ‘representative plant’
Variable Value
AMT1 0 for all t
AMT2 0 for all t
AMT3 0 for all t
AMT4 0 for all t
QC 0 for all t
INC 0 for all t
ROT 0 for all t
OWNER and EXTERNAL 0 for all t
POWEROWNER 0 for all t
LINE 1 for all t
LEVEL 4 for all t
Number of plant’s employees 233
∆SIZE 0
Year of establishment 1957
I-GROWTH 0.0614
R&D 0.0198
HERF 0.0177
39
Table 5 – Simulation of the effect on the likelihood of organizational change:
organization and plant-specific variables
Probability of changing the management hierarchy by 1996a
Representative plant 15.33%
Job shop (LINE =0) 22.35%
OWNER = 1 and POWEROWNER=0.167 6.20%
OWNER = 1 and POWEROWNER =1 12.95%
LEVEL = 2 6.57%
LEVEL = 6 33.45%
Large, complex and downsizingb35.40%
Small, simple and growingc20.34%
- and driven by an ‘autocratic’ ownerd17.26%
- and driven by a ‘democratic’ ownere8.37%
Legend:a This implies a duration of 21 years.
bLarge = 1,000 employees, complex = 6 managerial levels, downsizing = growth rate equal to -50% (between
1989 and
1996).cSmall = 100 employees, simple = 2 managerial levels, growing = growth rate equal to 50% (between 1989 and
1996).d
Small = 100 employees, simple = 2 managerial levels, growing = growth rate equal to 50% (between 1989 and
1996),
autocratic = maximum degree of centralization of plant’s strategic decision-making (i.e. POWEROWNER
=1).eSmall = 100 employees, simple = 2 managerial levels, growing = growth rate equal to 50% (between 1989 and
1996),
democratic = decentralization of most plant’s strategic decision-making (i.e. POWEROWNER = 0.167).
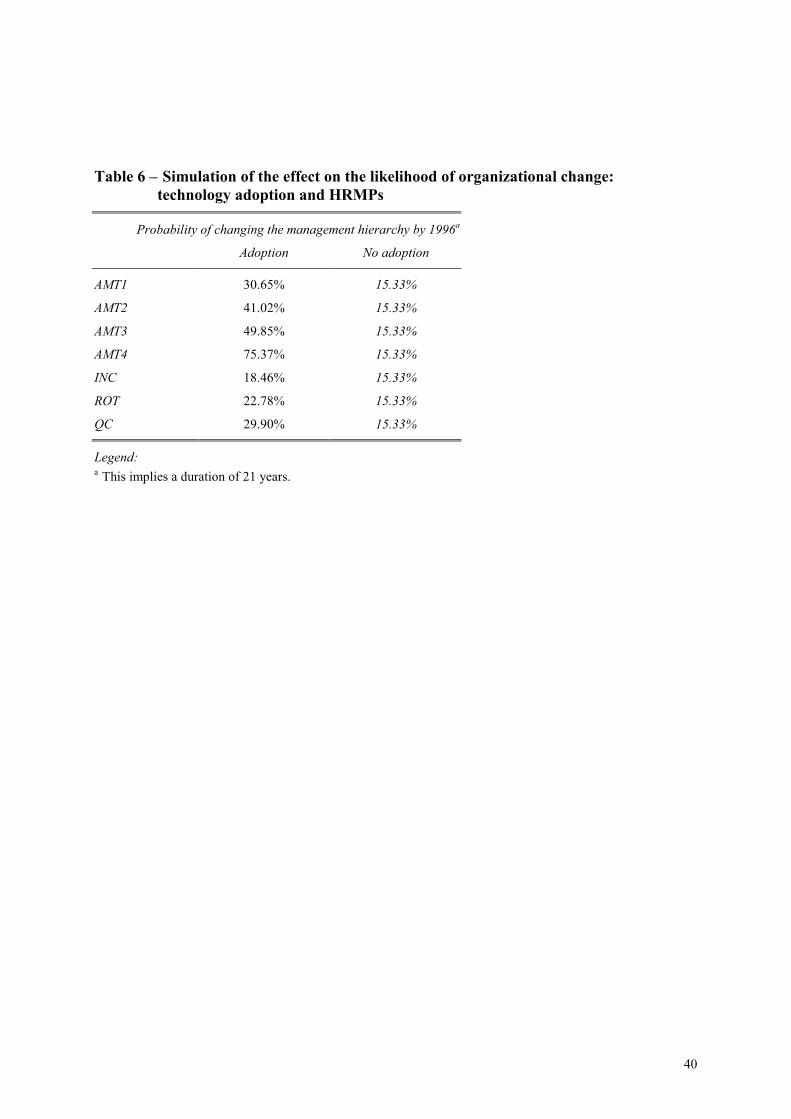
40
Table 6 – Simulation of the effect on the likelihood of organizational change:
technology adoption and HRMPs
Probability of changing the management hierarchy by 1996a
Adoption No adoption
AMT1 30.65% 15.33%
AMT2 41.02% 15.33%
AMT3 49.85% 15.33%
AMT4 75.37% 15.33%
INC 18.46% 15.33%
ROT 22.78% 15.33%
QC 29.90% 15.33%
Legend:a
This implies a duration of 21 years.

41
Endnotes
i Routines are the memory of the organization, being responsible for the preservation of
distinctive capabilities in spite of the fact that individual employees come and go (Winter
1988). See also the analysis by Nelson and Winter (1982). For a critical review of the concept
of routines and its relation to firms’ distinctive capabilities, see Cohen et al. (1996).
iiEmpirical evidence consistent with such view is provided by Colombo and Delmastro
(1999) and Delmastro (2000).
iii Note that the literature on organizational ecology claims that large, very complex
organizations are subject to structural inertia to a larger extent than their smaller counterparts
(Hannah and Freeman 1984). There are reasons to believe that the opposite may be true, at
least in the 1980s and 1990s. Actually, in such period increasing emphasis has been placed by
firms on “time to market” and “quick response” so as to cope with the increasing uncertainty
and turbulence of the business environment. In accordance with the lean production paradigm
(see for instance Womack et al. 1990), firms (and plants) with a large number of managerial
layers have reorganized operations eliminating middle management positions so as to assure
faster decision-making. For a theoretical model of real-time decentralized information
processing which shows how the need to base decisions on timely information leads to
increasing reliance on small managerial teams, see van Zandt (1999).
ivThere exists robust empirical evidence that demonstrates that adoption of new technologies
has a positive impact upon firm’s productivity (see Stoneman and Kwon 1996). Conversely,
as to human resources management practices, evidence is rather weak. Indeed, whilst
Ichniowski et al. (1997) find a positive relation, Cappelli and Neumark (1999) cast some
doubt on such relation.
v Colombo and Mosconi (1995) analyze the diffusion of advanced manufacturing and design
technologies among Italian metalworking plants. They provide evidence that consistently with
the above argument, the adoption of anyone of the two technologies positively influences
subsequent adoption of the other; in addition, adoption of both technologies is positively
associated with use of innovative management techniques such as just-in-time and total
quality management.
viWhile arguments inspired by both Milgrom and Roberts (1990a) and Qian (1994) suggest
that organizational change is stimulated by adoption of advanced production technologies and
new management practices, they differ as to the direction of the expected change. Namely,
Milgrom and Roberts (1990a) predicts a decrease of the number of tiers of the managerial
42
hierarchy; on the contrary, according to Qian (1994) one would expect an increase. The
analysis of the direction of organizational change goes beyond the scope of the present paper.
Nonetheless, the evidence provided elsewhere by the authors (see Colombo and Delmastro
1999) suggests that the former effect prevails among large, complex plants which in the ‘80s
and ‘90s have been downscaling the size of the managerial hierarchy, while adopting a leaner
pattern of organization (see footnote 3). On the contrary, the latter argument is more pertinent
for small, inherently flexible plants which in the same period have been experiencing an
opposite phenomenon.
viiThe strategic decisions considered in the survey are: (i) purchases of stand-alone
machinery, (ii) purchases of large-scale capital equipment, (iii) introduction of new
technologies, (iv) hiring and dismissals, (v) individual and collective incentives, and (vi)
career paths.
viiiAnother solution to left-censoring problems is to base the estimates only on uncensored
observations and disregard the information provided by censored ones; in other words, data
can be handled as if they were left-truncated. Nonetheless, this way of analyzing the data is
not efficient (see again Andersen et al. 1992). In addition, in our sample left-censored
observations largely outnumber left-uncensored ones.
ix Actually, for plants that were established before World War II, E
it was conventionally
assumed to equal 1946.
x Note that these variables are mutually exclusive and exhaustive, thus one has to be chosen as
the baseline of the estimates. In particular, we chose PM, which thus does not appear in the
estimates of the econometric model.
xi Note that while the dependent variable, i.e. organizational change, is observed over the
period 1975-’96 (except for plants that changed the number of tiers twice or more times) the
variable ∆SIZE measures a plant’s growth rate between 1989 and 1996. Unfortunately, we do
not have information as to the number of plant’s employees before 1989. So this variable is a
very rough proxy of plant’s growth rate for the overall period under observation.
xiiNonetheless, it is fair to recognize that the above results may also reflect unobserved
heterogeneity of plants: plants that adopt multiple technologies may be more likely to change
the organization due to differences in plants’ employees skills (see Di Nardo and Pischke
1997 for a similar issue but in another empirical context) or to an attitude more prone to both
technological and organizational innovation.
43
xiiiNote that between 1989 and 1996 the average plant’s size declined from 233 employees to
195, a decrease which is almost entirely due to the downsizing of larger plants.
Dipartimento di economia politica e metodi quantitativi
Università degli studi di Pavia
Elenco degli ultimi Quaderni di dipartimento pubblicati
(disponibili sul sito internet: "http://3weco.unipv.it/Web/dipeco/index.htm").
List of the lately published Technical Reports
(available at the web site: "http://3weco.unipv.it/Web/dipeco/index.htm").
Per ricevere uno o più quaderni, si indirizzi la richiesta a:
Requests for Technical Reports should be addressed to:
Eduardo Rossi
Dipartimento di economia politica e metodi quantitativi
Via San Felice, 5
I-27100 Pavia
Italy
e-mail: [email protected]
Quaderni di Dipartimento # Date Author(s) Title
114 06-00 C.Castagnetti Managing the risk side of a medium size
portfolio showing GARCH effects
115 06-00 C.Tarantola Spanning trees and indefiability of a single-
P.Vicard factor model
116 07-00 P.Giudici P.Green Efficient Model Determination for discrete
C.Tarantola graphical models
117 09-00 P.Giudici R.Castelo Improving Markov Chain Monte Carlo for
data mining
118 09-00 E.M. Fronk P.Giudici Markov Chain Monte Carlo Model Selection
for DAG Models
119 09-00 A.Sembenelli D.Vannoni Choosing among alternative market
structures: the role of demand
and supply product links
120 11-00 P.Giudici G.Schoier Convergence diagnostics for the Bayesian
E.Chieffo analysis of the GARCH models
121 11-00 E. Rossi Lectures notes on GARCH Models
122 12-00 G.Consonni P.Veronese Order-invariant Group Reference Priors for
E.Gutierrez-Pena Natural Exponential Families Having a
Simple Quadratic Variance Function
123 12-00 G.Consonni P.Veronese Enriched Conjugate and Reference Priors for
the Wishart Family on Symmetric Cones
124 01-01 P.Bertoletti Why regulate prices? Some notes on the
price cap methods
125 02-01 C.Castagnetti Estimating the risk premium fo swap spreads
Two econometric GARCH-based techniques


![Deep Learning and TensorFlow - Pavia€¦ · Deep Learning and TensorFlow–Episode 1 [1] ... Artificial Neural Networks Università degli Studi di Pavia. Deep Learning and TensorFlow–Episode](https://img.pdfslide.us/doc/110x75/5ec46f4ac208227a5a11a202/deep-learning-and-tensorflow-pavia-deep-learning-and-tensorflowaepisode-1-1.jpg)