Embed Size (px)
Citation preview
SUBREGIONAL MOBILITY MATRIX NORTH COUNTY
Project No. PS-4010-3041-F-01-TO2
Final Report
Prepared for:
Prepared by:
Cambridge Systematics, Inc. 445 S. Figueroa Street, Suite 3100
Los Angeles, CA 90071
February 2015
Final Report
North County
S U B R E G I O N A L M O B I L I T Y M A T R I X – N O R T H C O U N T Y February 2015 Page i
Final Report
Subregional Mobility Matrix North County
PS-4010-3041-F-01-TO2
Prepared for:
Los Angeles County
Metropolitan Transportation Authority
Prepared by: Cambridge Systematics, Inc.
In Association With:
Point C, LLC Arellano Associates AVS Consulting, Inc.
WKE, Inc.
Quality Review Tracking
Version # Date Reviewer Signature Description/Comments
Draft Final Report 2/11/2015 Jon Overman, Michael Snavely
Final Report 2/19/2015 Jon Overman, Michael Snavely
Final Report
North County
S U B R E G I O N A L M O B I L I T Y M A T R I X – N O R T H C O U N T Y February 2015 Page ii
Table of Contents
EXECUTIVE SUMMARY ......................................................................................................................................................................................... 1 Mobility Matrix Overview ................................................................................................................................................................................ 1 Project Purpose ................................................................................................................................................................................................ 1 Process ………………………………………………………………………………………………………………………………………………………………………………………3 Subregional Overview ..................................................................................................................................................................................... 3 Goals and Objectives ....................................................................................................................................................................................... 4 Subregional Projects and Programs ............................................................................................................................................................... 5 Evaluation ......................................................................................................................................................................................................... 6 Findings ........................................................................................................................................................................................................... 9 Implementation Timeframes and Cost Estimates ........................................................................................................................................ 9 What’s Next .................................................................................................................................................................................................... 10
1.0 INTRODUCTION ..................................................................................................................................................................................... 1-1 1.1 Mobility Matrix Overview ................................................................................................................................................................ 1-1 1.2 Project Purpose ................................................................................................................................................................................ 1-1 1.3 Developed by Subregional Jurisdictions and Stakeholders .......................................................................................................... 1-4 1.4 What’s in it for the Subregion? ...................................................................................................................................................... 1-4 1.5 Policy Context .................................................................................................................................................................................. 1-5 1.6 Document Overview ........................................................................................................................................................................ 1-6
2.0 SUBREGIONAL OVERVIEW ................................................................................................................................................................... 2-1 2.1 Land Use and Demographics.......................................................................................................................................................... 2-2 2.2 Travel Patterns ................................................................................................................................................................................. 2-3 2.3 Vehicle Travel .................................................................................................................................................................................. 2-6 2.4 Active Transportation ...................................................................................................................................................................... 2-8 2.5 Transit .............................................................................................................................................................................................. 2-9
3.0 GOALS AND OBJECTIVES ...................................................................................................................................................................... 3-1 3.1 Mobility Matrix Themes .................................................................................................................................................................. 3-1 3.2 Subregional Priorities ...................................................................................................................................................................... 3-3
4.0 SUBREGIONAL MOBILITY MATRIX .................................................................................................................................................... 4-1 4.1 Project List ....................................................................................................................................................................................... 4-1 4.2 Evaluation ......................................................................................................................................................................................... 4-4
Final Report
North County
S U B R E G I O N A L M O B I L I T Y M A T R I X – N O R T H C O U N T Y February 2015 Page iii
4.3 Findings ........................................................................................................................................................................................... 4-7
5.0 IMPLEMENTATION TIMEFRAMES ...................................................................................................................................................... 5-1 5.1 Cost Estimates ................................................................................................................................................................................. 5-4 5.2 Financing the Transportation System ............................................................................................................................................ 5-8 5.3 What’s Next? .................................................................................................................................................................................... 5-8
6.0 APPENDICES ........................................................................................................................................................................................... 6-1
Final Report
North County
S U B R E G I O N A L M O B I L I T Y M A T R I X – N O R T H C O U N T Y February 2015 Page iv
List of Tables Table ES-1. North County Transportation Programs ................................................................................................................................................ 5 Table ES-2. Evaluation Methodology .......................................................................................................................................................................... 6 Table ES-3. Performance Evaluation – Summary by Subprogram ........................................................................................................................... 7 Table ES-4. North County Mobility Matrix Summary of Rough Order of Magnitude Cost Estimates and Categorizations .............................. 11 Table 2-1. Summary of Ethnic and Economic Characteristics............................................................................................................................... 2-2 Table 2-2. 2012 Commute Travel Mode Share ........................................................................................................................................................ 2-3 Table 2-3. Vehicle Travel Volumes to/from North Count Mobility Matrix Subregion, 2014 to 2024 ................................................................. 2-6 Table 2-4. Peak-Period Vehicle Hours of Travel and Average Trip Time, 2014 .................................................................................................. 2-8 Table 3-1. Subregional Transportation Issues Identified by the North County PDT ........................................................................................... 3-2 Table 3-2. Goals and Performance Measures for the North County Mobility Matrix Subregion ........................................................................ 3-4 Table 4-1. Evaluation Methodology .......................................................................................................................................................................... 4-4 Table 4-2. Performance Evaluation – Summary by Subprogram .......................................................................................................................... 4-5 Table 5-1. North County Subregional Mobility Matrix Projects and Programs Categorization Summary ......................................................... 5-2 Table 5-2. North County Mobility Matrix Program Cost Estimate Ranges and Categorizations ........................................................................ 5-5 Table 5-3. North County Mobility Matrix Summary of Rough Order of Magnitude Cost Estimates and Categorizations ............................... 5-7 Table A-1. North County Mobility Matrix PDT Meetings and Approvals ............................................................................................................. A-1 Table B-1. Evaluation Methodology ......................................................................................................................................................................... B-3 Table C-1. North County Mobility Matrix – Preliminary Project List .................................................................................................................... C-1
Final Report
North County
S U B R E G I O N A L M O B I L I T Y M A T R I X – N O R T H C O U N T Y February 2015 Page v
List of Figures Figure ES-1. Los Angeles County Mobility Matrix Subregions ................................................................................................................................ 2 Figure ES-2. Common Countywide Themes for All Mobility Matrices ................................................................................................................... 4 Figure 1-1. Los Angeles County Mobility Matrix Subregions ................................................................................................................................ 1-2 Figure 1-2. North County Mobility Matrix Study Area ........................................................................................................................................... 1-3 Figure 2-1. Projected Changes in Employment and Residents, 2014 to 2024 ...................................................................................................... 2-4 Figure 2-2. 2014 Average Daily Trips to/From North County Mobility Matrix Subregion .................................................................................. 2-5 Figure 2-3. CSAN/CMP Network of Regionally Significant Arterials in Study Area ........................................................................................... 2-7 Figure 2-4. Bicycle and Pedestrian Collisions in Study Area, 2007 to 2011 .......................................................................................................... 2-9 Figure 2-5. Bicycle and Pedestrian Collision Density in Study Area, 2009 to 2011 ............................................................................................ 2-10 Figure 2-6. Transit Service in Study Area ............................................................................................................................................................. 2-11 Figure 3-1. Common Countywide Themes for All Mobility Matrices ................................................................................................................... 3-1 Figure 4-1. North County Mobility Matrix Projects and Programs ....................................................................................................................... 4-3 Figure B-1. Categorization Time Frames ................................................................................................................................................................ C-3
Final Report
North County
S U B R E G I O N A L M O B I L I T Y M A T R I X – N O R T H C O U N T Y February 2015 Page vi
List of Terms and Acronyms
Acronyms Definitions
AB Assembly Bill
ADT Average Daily Traffic
BRT Bus Rapid Transit
CalEnviroScreen California Environmental Health Hazard Screening Tool
Caltrans California Department of Transportation
CEQA California Environmental Quality Act
COG Council of Governments
CSTAN Los Angeles Countywide Strategic Truck Arterial Network
ITS Intelligent Transportation Systems
LOS Level-of-Service
LRT Light Rail Transit
LRTP Long Range Transportation Plan
LVMCOG Las Virgenes/Malibu Council of Governments
MAP-21 Moving Ahead for Progress in the 21st Century Act
Metro Los Angeles County Metropolitan Transportation Authority
MPO Metropolitan Planning Organization
Acronyms Definitions
OPR Governor’s Office of Planning and Research
NCTC North County Transportation Coalition
PCH Pacific Coast Highway
PDT Project Development Team
PeMS Caltrans Freeway Performance Monitoring System
SB Senate Bill
SBCCOG South Bay Cities Council of Governments
SCS Sustainability Communities Strategy
SFV San Fernando Valley
SFVCOG San Fernando Valley Council of Governments
SGVCOG San Gabriel Valley Council of Governments
SRTP Short Range Transportation Plan
STAA Surface Transportation Assistance Act
TDM Transportation Demand Management
TSM Transportation Systems Management
VMT Vehicle miles traveled
WCCOG Westside Cities Council of Governments
Final Report
Executive Summary
S U B R E G I O N A L M O B I L I T Y M A T R I X – N O R T H C O U N T Y February 2015 Page ES-1
EXECUTIVE SUMMARY
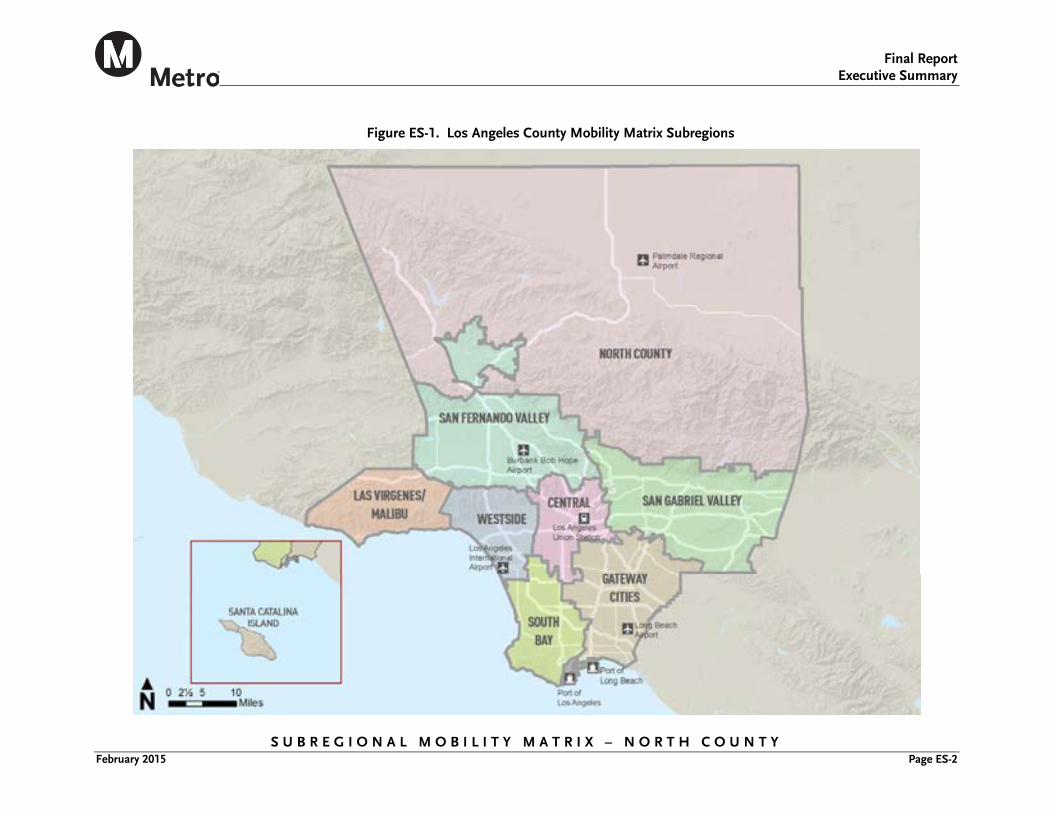
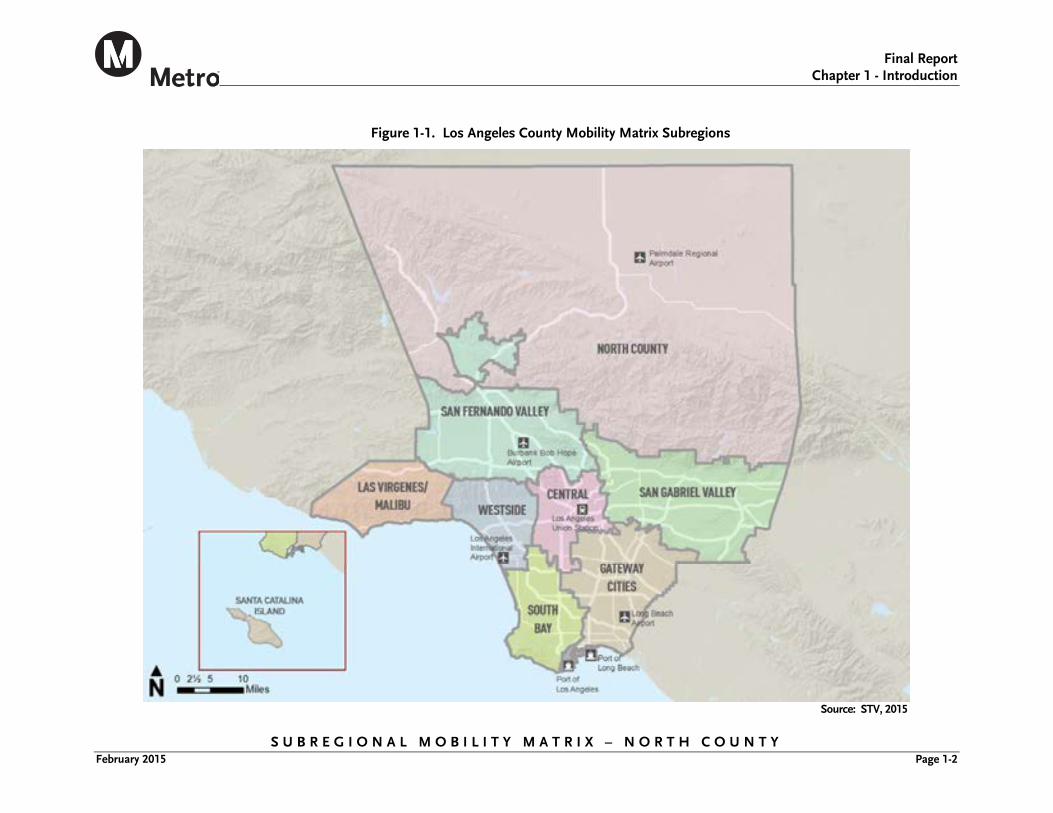
Mobility Matrix Overview In February 2014, the Los Angeles County Metropolitan Transportation Authority (Metro) Board approved the holistic, countywide approach for preparing Mobility Matrices for Central Los Angeles, the Las Virgenes/Malibu Council of Governments (LVMCOG), North County Transportation Coalition (NCTC), San Fernando Valley Council of Governments (SFVCOG), San Gabriel Valley Council of Governments (SGVCOG), South Bay Cities Council of Governments (SBCCOG) and Westside Cities Council of Governments (WCCOG) (see Figure ES-1). The Gateway Cities COG is developing its own Strategic Transportation Plan which will serve as its Mobility Matrix.
For the purposes of the Mobility Matrix, cities with membership in two subregions selected one subregion in which to participate. The Arroyo Verdugo subregion decided to include the cities of La Cañada Flintridge, Pasadena, and South Pasadena in the SGVCOG, and Burbank and Glendale in the SFVCOG. The City of Santa Clarita opted to be included in the SFVCOG instead of the NCTC. Boundaries between the WCCOG and Central Los Angeles, and the WCCOG and SBCCOG, were modified based on Metro Board direction in January 2015.
In January 2015, the Metro Board created the Regional Facilities category. Regional Facilities include projects
and programs related to Los Angeles County’s four commercial airports (Los Angeles International Airport, Burbank Bob Hope Airport, Long Beach Airport, and Palmdale Regional Airport), the two seaports (Port of Los Angeles and Port of Long Beach), and Union Station. The projects/programs related to Regional Facilities have been removed from the subregional Mobility Matrices.
Project Purpose The Mobility Matrix will serve as a starting point for the update of the Metro Long-Range Transportation Plan (LRTP) currently scheduled for adoption in 2017. This North County Mobility Matrix, along with concurrent efforts in other Metro subregions, includes the development of subregional goals and objectives to guide future transportation investments, an assessment of baseline transportation system conditions to identify critical needs and deficiencies, and an initial screening of projects and programs based on their potential to address subregional objectives and countywide performance themes.
The Mobility Matrix includes a preliminary assessment of anticipated investment needs and project and program implementation over the short-term (2015-2024), mid-term (2025-2034) and long-term (2035-2045) timeframes. The Mobility Matrix does not prioritize projects, but rather serves as a basis for further quantitative analysis to be performed during the Metro LRTP update, expected in 2017.
Final Report
Executive Summary
S U B R E G I O N A L M O B I L I T Y M A T R I X – N O R T H C O U N T Y February 2015 Page ES-2
Figure ES-1. Los Angeles County Mobility Matrix Subregions
Final Report
Executive Summary
S U B R E G I O N A L M O B I L I T Y M A T R I X – N O R T H C O U N T Y February 2015 Page ES-3
Process To ensure proposed projects and programs reflect the needs and interests of the subregion, the Mobility Matrices followed a “bottoms-up” approach guided by a Project Development Team (PDT) selected by the subregion, consisting of city, stakeholder, and subregional representatives. The North County PDT consisted of representatives from the following jurisdictions and stakeholder agencies: City of Lancaster, City of Palmdale, Los Angeles County Department of Public Works. Antelope Valley Transit Authority (AVTA), California Department of Transportation (Caltrans), Metrolink, Safe Routes to School National Partnership, and Southern California Association of Governments (SCAG). The PDT met five times over the eight-month study period to guide the creation of strategic goals and objectives, determine a subregional priority package of projects and programs, oversee the project and program evaluation process, and review and approve all work products associated with the Subregional Mobility Matrix.
Subregional Overview The NCTC was formed in 1995 and consists of membership from the Cities of Lancaster, Palmdale, Santa Clarita and the County of Los Angeles. Its purpose is to improve the movement of people and goods in the North Los Angeles County subregion. Its duties include the development of policies and strategies that directly lead to the implementation of projects and programs that address critical North County transportation issues, promote economic development, and maximize transportation funding opportunities for member jurisdictions. The City of Santa Clarita has elected to participate in the SFVCOG Mobility Matrix.
The Baseline Conditions Report, included as Appendix D, identified several key findings regarding the transportation system for the North County Mobility Matrix Subregion, including but not limited to:
Very high rates of growth are expected in North County, which will place greater burdens on its multimodal system in the years to come. North County believes actual growth in population and employment may outpace SCAG projections.
The study area features a larger population of at-risk residents, but better air quality than the County average.
Residents face long commute travel times with few alternatives to driving other than infrequent Metrolink trains and commuter express buses operated by AVTA.
While overall vehicle collisions have steadily decreased over the last several years, collisions involving pedestrians and bicyclists are gradually rising.
Final Report
Executive Summary
S U B R E G I O N A L M O B I L I T Y M A T R I X – N O R T H C O U N T Y February 2015 Page ES-4
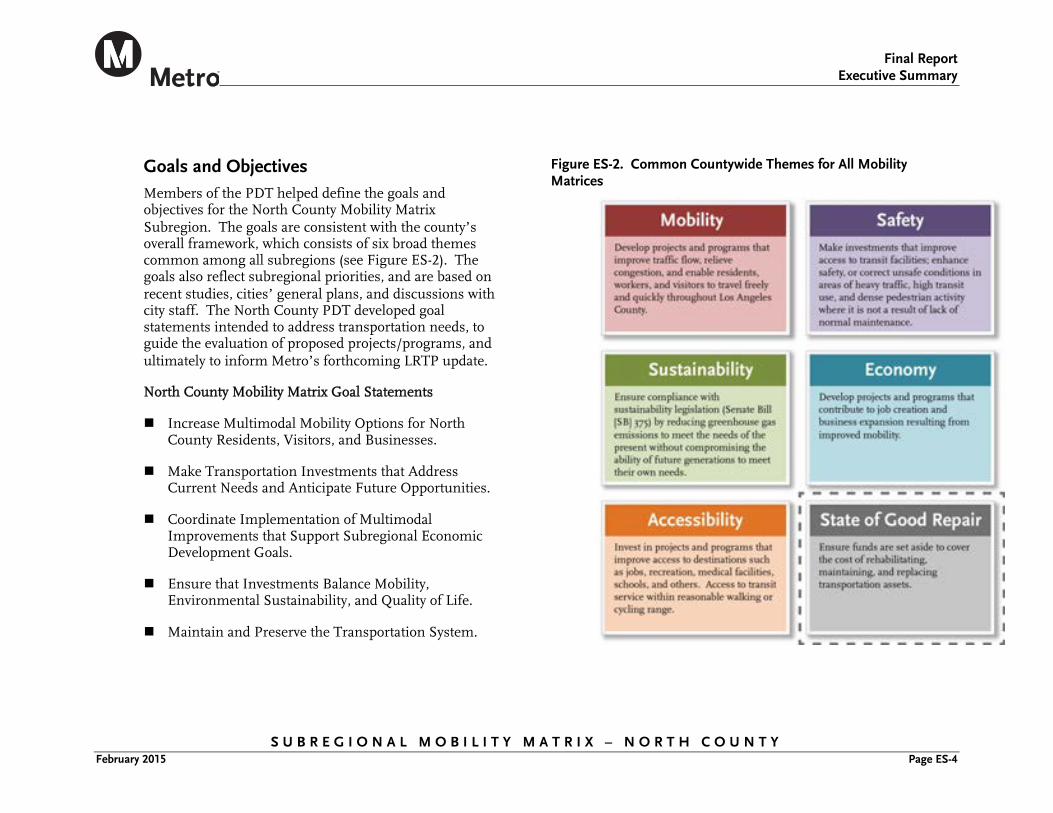
Goals and Objectives Members of the PDT helped define the goals and objectives for the North County Mobility Matrix Subregion. The goals are consistent with the county’s overall framework, which consists of six broad themes common among all subregions (see Figure ES-2). The goals also reflect subregional priorities, and are based on recent studies, cities’ general plans, and discussions with city staff. The North County PDT developed goal statements intended to address transportation needs, to guide the evaluation of proposed projects/programs, and ultimately to inform Metro’s forthcoming LRTP update.
North County Mobility Matrix Goal Statements
Increase Multimodal Mobility Options for North County Residents, Visitors, and Businesses.
Make Transportation Investments that Address Current Needs and Anticipate Future Opportunities.
Coordinate Implementation of Multimodal Improvements that Support Subregional Economic Development Goals.
Ensure that Investments Balance Mobility, Environmental Sustainability, and Quality of Life.
Maintain and Preserve the Transportation System.
Figure ES-2. Common Countywide Themes for All Mobility Matrices
Final Report
Executive Summary
S U B R E G I O N A L M O B I L I T Y M A T R I X – N O R T H C O U N T Y February 2015 Page ES-5
Subregional Projects and ProgramsAn initial North County Mobility Matrix Subregion project and program list was compiled from Metro’s December 2013 subregional project lists, which included unfunded LRTP projects; unfunded Measure R scope elements; and subregional needs submitted in response to requests by Directors Antonovich and Dubois. The project and program list was updated through the outreach process to incorporate input from the PDT members and other subregion stakeholders.
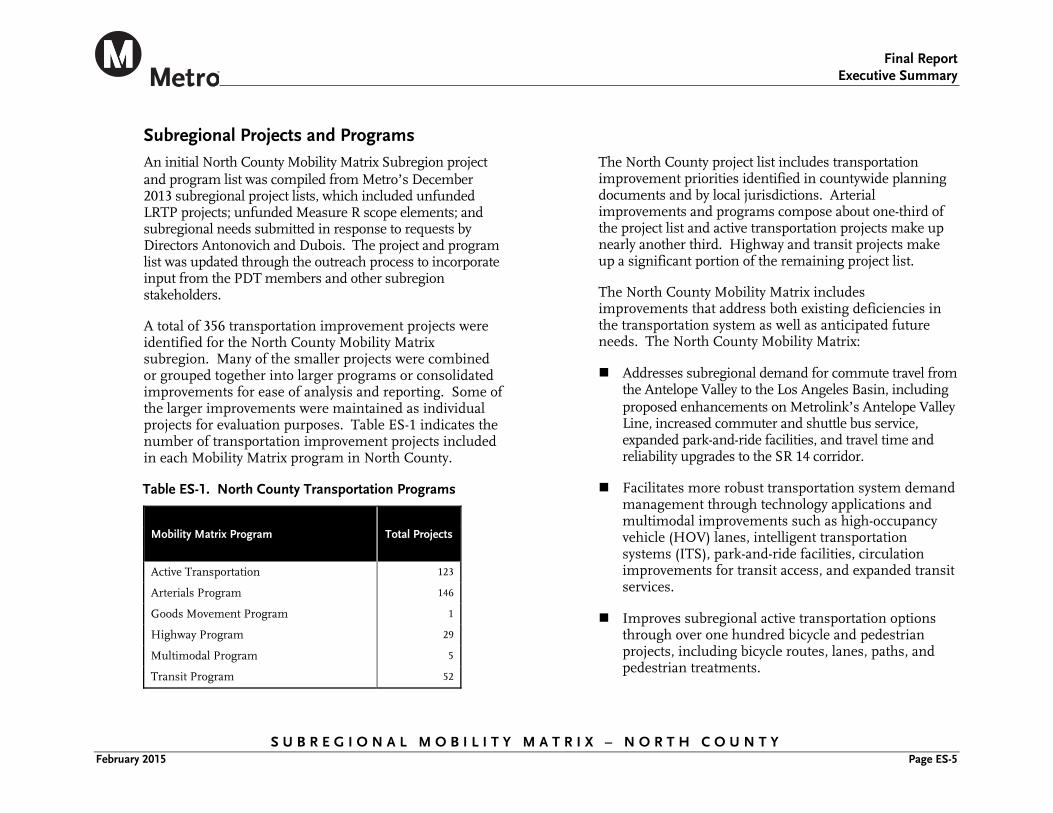
A total of 356 transportation improvement projects were identified for the North County Mobility Matrix subregion. Many of the smaller projects were combined or grouped together into larger programs or consolidated improvements for ease of analysis and reporting. Some of the larger improvements were maintained as individual projects for evaluation purposes. Table ES-1 indicates the number of transportation improvement projects included in each Mobility Matrix program in North County.
Table ES-1. North County Transportation Programs
Mobility Matrix Program Total Projects
Active Transportation 123
Arterials Program 146
Goods Movement Program 1
Highway Program 29
Multimodal Program 5
Transit Program 52
The North County project list includes transportation improvement priorities identified in countywide planning documents and by local jurisdictions. Arterial improvements and programs compose about one-third of the project list and active transportation projects make up nearly another third. Highway and transit projects make up a significant portion of the remaining project list.
The North County Mobility Matrix includes improvements that address both existing deficiencies in the transportation system as well as anticipated future needs. The North County Mobility Matrix:
Addresses subregional demand for commute travel from the Antelope Valley to the Los Angeles Basin, including proposed enhancements on Metrolink’s Antelope Valley Line, increased commuter and shuttle bus service, expanded park-and-ride facilities, and travel time and reliability upgrades to the SR 14 corridor.
Facilitates more robust transportation system demand management through technology applications and multimodal improvements such as high-occupancy vehicle (HOV) lanes, intelligent transportation systems (ITS), park-and-ride facilities, circulation improvements for transit access, and expanded transit services.
Improves subregional active transportation options through over one hundred bicycle and pedestrian projects, including bicycle routes, lanes, paths, and pedestrian treatments.
Final Report
Executive Summary
S U B R E G I O N A L M O B I L I T Y M A T R I X – N O R T H C O U N T Y February 2015 Page ES-6
Supports the subregional and countywide priority of maintaining a state of good repair on the transportation system.
These improvements are intended to keep the multimodal transportation system functioning smoothly in the future in order to retain and attract business and development in the subregion.
Evaluation Each project or program was evaluated in an initial, high-level screening based on its potential to contribute to subregional goals and objectives under each of the six countywide Mobility Matrix themes identified in Figure ES-2. Due to a limited timeframe for project completion and incomplete or inconsistent project/program details and data, this evaluation was qualitative in nature. The evaluation serves not as a prioritization, but as a preliminary screening process to identify projects and programs with the potential to address subregional and countywide transportation goals. This merely serves as a starting point for more rigorous quantitative analysis during the Metro LRTP update process.
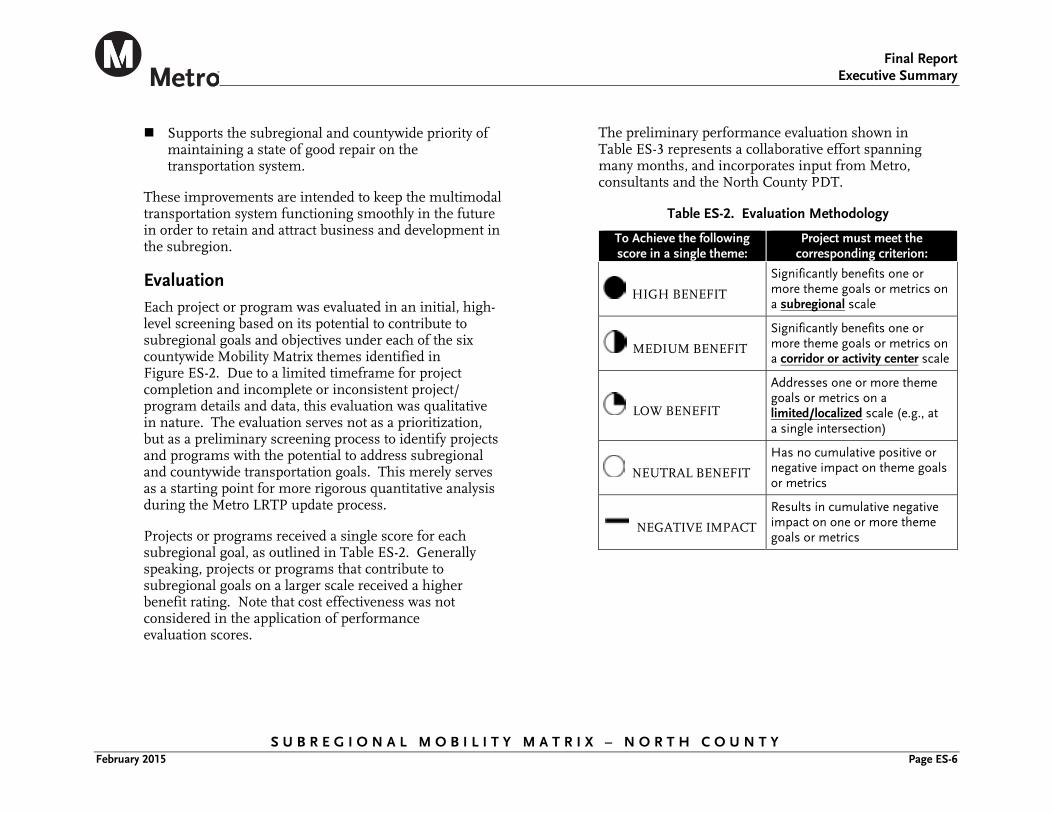
Projects or programs received a single score for each subregional goal, as outlined in Table ES-2. Generally speaking, projects or programs that contribute to subregional goals on a larger scale received a higher benefit rating. Note that cost effectiveness was not considered in the application of performance evaluation scores.
The preliminary performance evaluation shown in Table ES-3 represents a collaborative effort spanning many months, and incorporates input from Metro, consultants and the North County PDT.
Table ES-2. Evaluation Methodology
To Achieve the following score in a single theme:
Project must meet the corresponding criterion:
HIGH BENEFIT
Significantly benefits one or more theme goals or metrics on a subregional scale
MEDIUM BENEFIT
Significantly benefits one or more theme goals or metrics on a corridor or activity center scale
LOW BENEFIT
Addresses one or more theme goals or metrics on a limited/localized scale (e.g., at a single intersection)
NEUTRAL BENEFIT
Has no cumulative positive or negative impact on theme goals or metrics
NEGATIVE IMPACT
Results in cumulative negative impact on one or more theme goals or metrics
Final Report
Executive Summary
S U B R E G I O N A L M O B I L I T Y M A T R I X – N O R T H C O U N T Y February 2015 Page ES-7
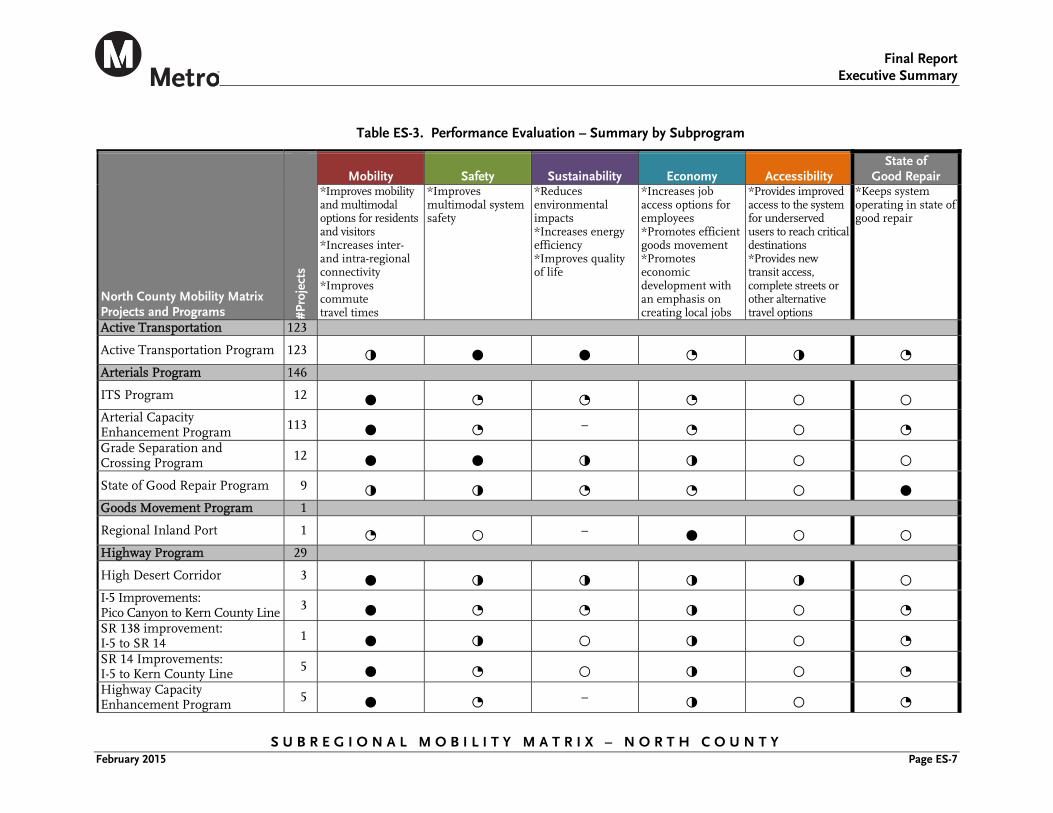
Table ES-3. Performance Evaluation – Summary by Subprogram
North County Mobility Matrix Projects and Programs #P
roje
cts
Mobility Safety Sustainability Economy Accessibility State of
Good Repair *Improves mobility and multimodal options for residents and visitors *Increases inter- and intra-regional connectivity *Improves commute travel times
*Improves multimodal system safety
*Reduces environmental impacts *Increases energy efficiency *Improves quality of life
*Increases job access options for employees *Promotes efficient goods movement *Promotes economic development with an emphasis on creating local jobs
*Provides improved access to the system for underserved users to reach critical destinations *Provides new transit access, complete streets or other alternative travel options
*Keeps system operating in state of good repair
Active Transportation 123
Active Transportation Program 123 ◑ ● ● ◔ ◑ ◔ Arterials Program 146
ITS Program 12 ● ◔ ◔ ◔ ○ ○ Arterial Capacity Enhancement Program 113 ● ◔ – ◔ ○ ◔ Grade Separation and Crossing Program 12 ● ● ◑ ◑ ○ ○
State of Good Repair Program 9 ◑ ◑ ◔ ◔ ○ ● Goods Movement Program 1
Regional Inland Port 1 ◔ ○ – ● ○ ○ Highway Program 29
High Desert Corridor 3 ● ◑ ◑ ◑ ◑ ○ I-5 Improvements: Pico Canyon to Kern County Line 3 ● ◔ ◔ ◑ ○ ◔ SR 138 improvement: I-5 to SR 14 1 ● ◑ ○ ◑ ○ ◔ SR 14 Improvements: I-5 to Kern County Line 5 ● ◔ ○ ◑ ○ ◔ Highway Capacity Enhancement Program 5 ● ◔ – ◑ ○ ◔
Final Report
Executive Summary
S U B R E G I O N A L M O B I L I T Y M A T R I X – N O R T H C O U N T Y February 2015 Page ES-8
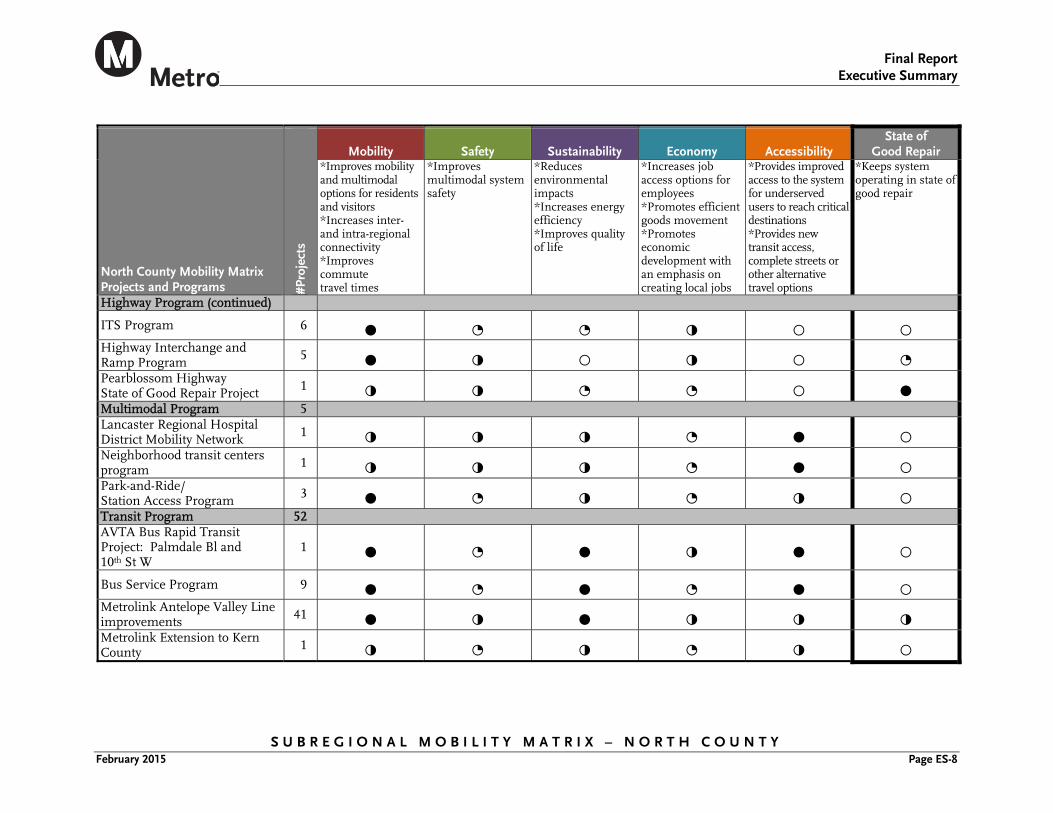
North County Mobility Matrix Projects and Programs #P
roje
cts
Mobility Safety Sustainability Economy Accessibility State of
Good Repair *Improves mobility and multimodal options for residents and visitors *Increases inter- and intra-regional connectivity *Improves commute travel times
*Improves multimodal system safety
*Reduces environmental impacts *Increases energy efficiency *Improves quality of life
*Increases job access options for employees *Promotes efficient goods movement *Promotes economic development with an emphasis on creating local jobs
*Provides improved access to the system for underserved users to reach critical destinations *Provides new transit access, complete streets or other alternative travel options
*Keeps system operating in state of good repair
Highway Program (continued)
ITS Program 6 ● ◔ ◔ ◑ ○ ○ Highway Interchange and Ramp Program 5 ● ◑ ○ ◑ ○ ◔ Pearblossom Highway State of Good Repair Project 1 ◑ ◑ ◔ ◔ ○ ● Multimodal Program 5 Lancaster Regional Hospital District Mobility Network 1 ◑ ◑ ◑ ◔ ● ○ Neighborhood transit centers program 1 ◑ ◑ ◑ ◔ ● ○ Park-and-Ride/ Station Access Program 3 ● ◔ ◑ ◔ ◑ ○ Transit Program 52 AVTA Bus Rapid Transit Project: Palmdale Bl and 10th St W
1 ● ◔ ● ◑ ● ○
Bus Service Program 9 ● ◔ ● ◔ ● ○ Metrolink Antelope Valley Line improvements 41 ● ◑ ● ◑ ◑ ◑ Metrolink Extension to Kern County 1 ◑ ◔ ◑ ◔ ◑ ○
Final Report
Executive Summary
S U B R E G I O N A L M O B I L I T Y M A T R I X – N O R T H C O U N T Y February 2015 Page ES-9
Findings The North County Mobility Matrix addresses each of the six countywide themes:
Mobility. Highway and arterial capacity enhancement, transportation system management, and managed-lane programs help to relieve congestion or create redundancy for primary subregional roadways. Transit expansion programs provide improvements to travel times and system reliability. Active transportation and locally oriented improvements provide moderate benefit to subregional mobility, while individual multimodal projects close identified gaps in modal connectivity.
Safety. Grade separation and active transportation score highly under the safety theme by separating user groups and eliminating conflict potential. Many proposed bicycle facilities, including those in the Safe Routes to School program, address areas with high incidents of collisions involving bicyclists and pedestrians. State of good repair projects, transit and roadway improvement projects enhance vehicular safety and improve reliability by eliminating dangerous or unpredictable road surfaces.
Sustainability. The Mobility Matrix contributes to reduced greenhouse gas emissions, improved air quality, and greater quality of life in the study area. Active transportation and transit programs exhibit the greatest benefits by facilitating travel by modes other than single occupant vehicle and improving public health and quality of life. Other improvements such as the ITS program and specific bottleneck
mitigations contribute to reduced delay and associated emissions at specific intersections.
Economy. The proposed Regional Inland Port provides the greatest potential to create lasting direct and indirect employment and development in the study area. Grade separations and new highway capacity benefits subregional goods movement and job access
Accessibility. Increased transit and commuter rail improvements and new multimodal access programs identified through the Mobility Matrix effort offer improved access to transportation for North County’s large underserved population.
State of Good Repair. The North County Mobility Matrix includes pavement, bridge, and sidewalk preservation programs that address subregional state of good repair. Other projects included repaving, transit asset management, or other elements that contribute to longer life of transportation assets.
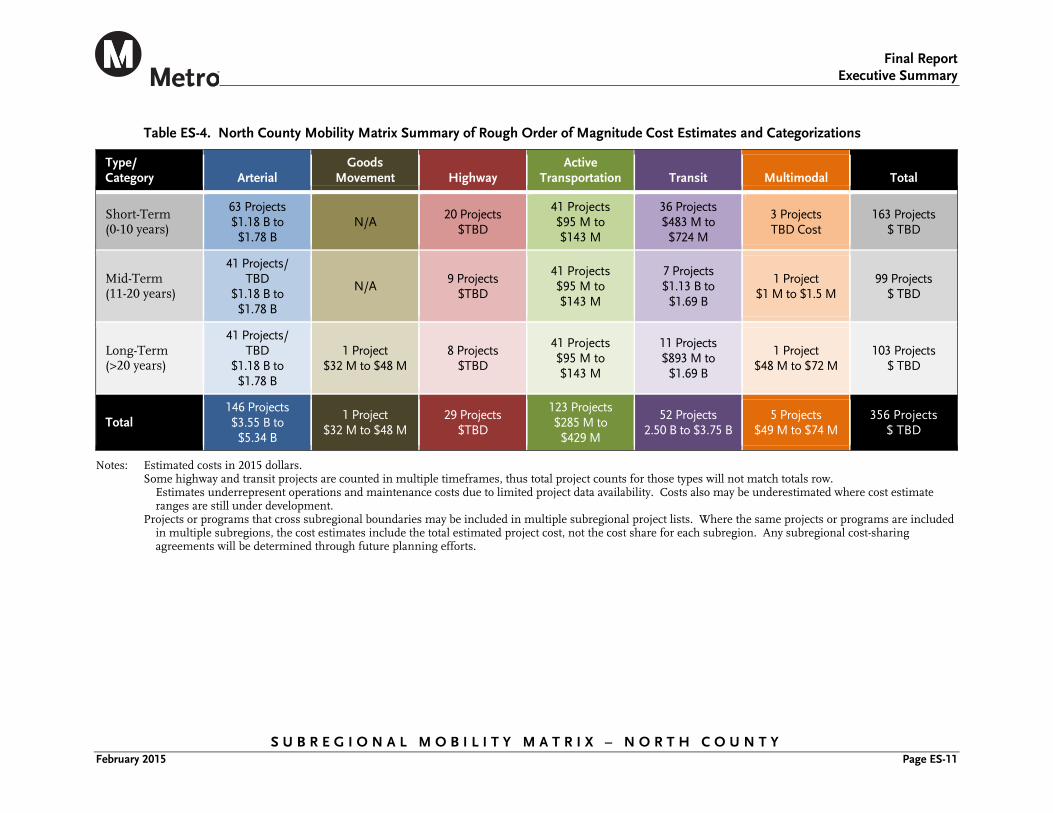
Implementation Timeframes and Cost Estimates The Mobility Matrix included the development of high-level, rough order-of-magnitude planning-cost ranges for short-, mid-, and long-term subregional funding needs. Table ES-4 indicates anticipated Mobility Matrix cost estimate ranges by project type and implementation timeframe.
Due to variations in project scope and available cost data, costs estimated for use in the Mobility Matrix are not intended to be used for future project-level planning.
Final Report
Executive Summary
S U B R E G I O N A L M O B I L I T Y M A T R I X – N O R T H C O U N T Y February 2015 Page ES-10
Rather, the cost ranges developed via this process constitute a high-level, rough order-of-magnitude planning estimate range for short-, mid-, and long-term subregional funding needs for the Mobility Matrix effort only. For the most part, these estimates do not include vehicles, operating, maintenance and financing costs. More detailed analysis will be conducted in the Metro LRTP update process, which may necessitate refinement of project/program details and associated cost estimates. A full description of the cost estimation methodology can be found in Appendix B.
Since the list was compiled from various sources, some of the projects in the list overlap in scope or purpose, leading to duplicative costs in the cost matrix. Projects or programs that cross subregional boundaries may be included in multiple subregional project lists. Where the same projects or programs are included in multiple subregions, the cost estimates include the total estimated project cost, not the cost share for each subregion. The cost sharing will be determined as part of future efforts.
Finally, due to lack of available data and the short timeframe of the Mobility Matrix effort, some of the projects and programs have missing cost estimates or do not include operations and maintenance (O&M) costs. Where O&M costs were available, they were included for the applicable timeframes. O&M costs will be revisited as part of the Metro LRTP update.
What’s Next The Mobility Matrix is the first step in identifying North County transportation projects and programs that require funding. This important work effort serves as a “bottoms-
up” approach towards updating Metro’s LRTP in the future.
Three major next steps should arise out of the Mobility Matrix process:
North County Prioritization of Projects. This Mobility Matrix study does not prioritize projects. Instead, it provides some of the information needed for decision makers to prioritize projects/programs in the next phase of work, and an unconstrained list of all potential transportation projects/programs in the region. In preparation for a potential ballot measure and LRTP update (as described further below), the NCTC should decide how it wants to prioritize these projects/programs assuming a constrained funding scenario.
Metro Ballot Measure Preparations. Metro will continue working with the PDTs of all the Subregions, as it starts developing a potential ballot measure. Part of the ballot measure work would involve geographic equity determination, as well as determining the amount of funding available for each category of projects/programs and subregion of the County.
Metro LRTP Update. The potential ballot measure would then feed into a future Metro LRTP update and be integrated into the LRTP Finance Plan. If additional funding becomes available through a ballot measure or other new funding sources or initiatives, the list of projects developed through the Mobility Matrix and any subsequent list developed by the subregion could be used to update the constrained project list for the LRTP moving forward.
Final Report
Executive Summary
S U B R E G I O N A L M O B I L I T Y M A T R I X – N O R T H C O U N T Y February 2015 Page ES-11
Table ES-4. North County Mobility Matrix Summary of Rough Order of Magnitude Cost Estimates and Categorizations
Type/ Category Arterial
Goods Movement Highway
Active Transportation Transit Multimodal Total
Short-Term (0-10 years)
63 Projects $1.18 B to
$1.78 B N/A
20 Projects $TBD
41 Projects $95 M to $143 M
36 Projects $483 M to
$724 M
3 Projects TBD Cost
163 Projects $ TBD
Mid-Term (11-20 years)
41 Projects/ TBD
$1.18 B to $1.78 B
N/A 9 Projects
$TBD
41 Projects $95 M to $143 M
7 Projects $1.13 B to
$1.69 B
1 Project $1 M to $1.5 M
99 Projects $ TBD
Long-Term (>20 years)
41 Projects/ TBD
$1.18 B to $1.78 B
1 Project $32 M to $48 M
8 Projects $TBD
41 Projects $95 M to $143 M
11 Projects $893 M to
$1.69 B
1 Project $48 M to $72 M
103 Projects $ TBD
Total 146 Projects $3.55 B to
$5.34 B
1 Project $32 M to $48 M
29 Projects $TBD
123 Projects $285 M to
$429 M
52 Projects 2.50 B to $3.75 B
5 Projects $49 M to $74 M
356 Projects $ TBD
Notes: Estimated costs in 2015 dollars. Some highway and transit projects are counted in multiple timeframes, thus total project counts for those types will not match totals row.
Estimates underrepresent operations and maintenance costs due to limited project data availability. Costs also may be underestimated where cost estimate ranges are still under development.
Projects or programs that cross subregional boundaries may be included in multiple subregional project lists. Where the same projects or programs are included in multiple subregions, the cost estimates include the total estimated project cost, not the cost share for each subregion. Any subregional cost-sharing agreements will be determined through future planning efforts.
Final Report
Chapter 1 - Introduction
S U B R E G I O N A L M O B I L I T Y M A T R I X – N O R T H C O U N T Y February 2015 Page 1-1
1.0 INTRODUCTION
1.1 Mobility Matrix Overview In February 2014, the Los Angeles County Metropolitan Transportation Authority (Metro) Board approved the holistic, countywide approach for preparing Mobility Matrices for Central Los Angeles, the Las Virgenes/Malibu Council of Governments (LVMCOG), North County Transportation Coalition (NCTC), San Fernando Valley Council of Governments (SFVCOG), San Gabriel Valley Council of Governments (SGVCOG), South Bay Cities Council of Governments (SBCCOG) and Westside Cities Council of Governments (WCCOG) (see Figure ES-1). The Gateway Cities COG is developing its own Strategic Transportation Plan which will serve as its Mobility Matrix.
For the purposes of the Mobility Matrix, cities with membership in two subregions selected one subregion in which to participate. The Arroyo Verdugo subregion decided to include the Cities of La Cañada Flintridge, Pasadena, and South Pasadena in the SGVCOG; and Burbank and Glendale in the SFVCOG. The City of Santa Clarita opted to be included in the SFVCOG instead of the NCTC. Additionally, in response to Metro Board’s direction in January 2015, the boundary between the WCCOG and the Central Los Angeles subregion was revised to roughly follow La Brea Avenue from north to south. The border between the WCCOG and the SBCCOG was revised to transfer a small portion of the City of Inglewood from the WCCOG subregion to the
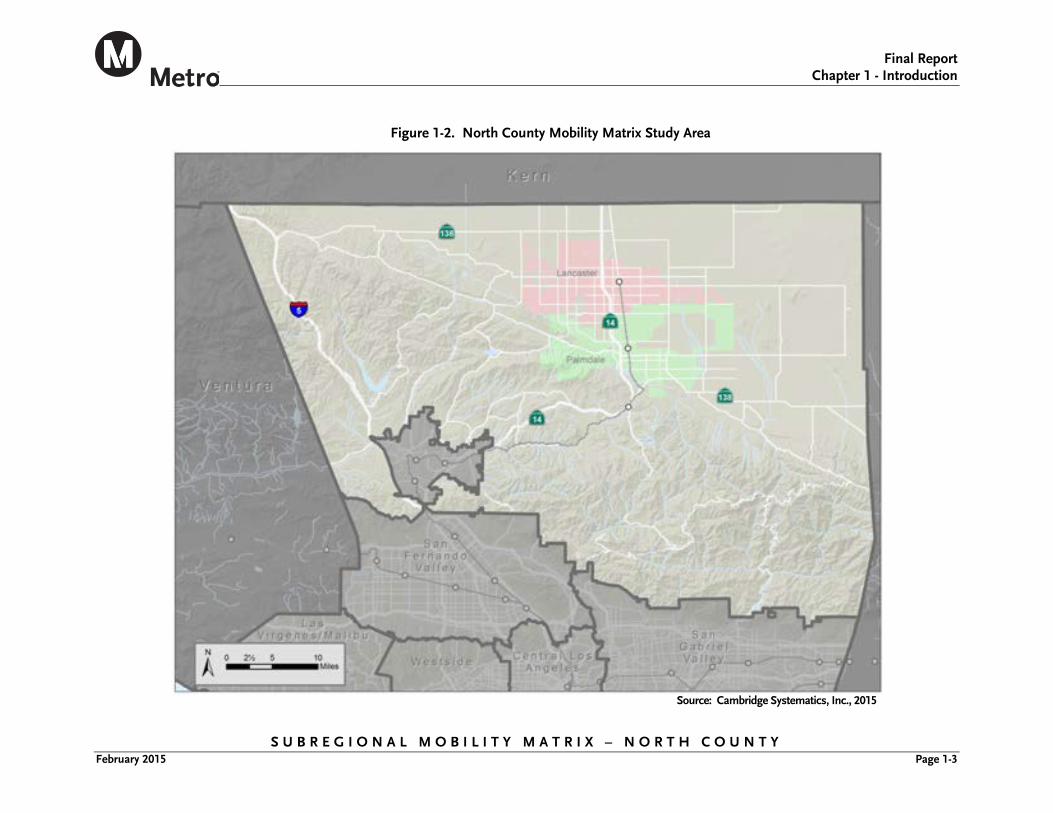
SBCCOG. The border between the Central Los Angeles subregion and the SBCCOG was revised to transfer an area of South Los Angeles from the SBCCOG to the Central Los Angeles subregion. The North County Mobility Matrix Subregion, also referred to as the study area in this document, is presented in Figure 1-2.
In January 2015, the Metro Board also created the Regional Facilities category. Regional Facilities include projects and programs related to Los Angeles County’s four commercial airports (Los Angeles International Airport, Burbank Bob Hope Airport, Long Beach Airport, and Palmdale Regional Airport), the two seaports (Port of Los Angeles and Port of Long Beach), and Union Station. The projects/programs related to Regional Facilities have been removed from the subregional Mobility Matrices and will be included in a separate report.
1.2 Project Purpose The Mobility Matrix will serve as a starting point for the update of the Metro Long Range Transportation Plan (LRTP) currently scheduled for adoption in 2017. This North County Mobility Matrix, along with concurrent efforts in other Metro subregions, includes the development of subregional goals and objectives to guide future transportation investments, an assessment of baseline transportation system conditions to identify critical needs and deficiencies, and an initial screening of projects and programs based on their potential to address subregional objectives and countywide performance themes. The Mobility Matrix includes a preliminary
Final Report
Chapter 1 - Introduction
S U B R E G I O N A L M O B I L I T Y M A T R I X – N O R T H C O U N T Y February 2015 Page 1-2
Figure 1-1. Los Angeles County Mobility Matrix Subregions
Source: STV, 2015
Final Report
Chapter 1 - Introduction
S U B R E G I O N A L M O B I L I T Y M A T R I X – N O R T H C O U N T Y February 2015 Page 1-3
Figure 1-2. North County Mobility Matrix Study Area
Source: Cambridge Systematics, Inc., 2015
Final Report
Chapter 1 - Introduction
S U B R E G I O N A L M O B I L I T Y M A T R I X – N O R T H C O U N T Y February 2015 Page 1-4
assessment of anticipated investment needs and project and program implementation over the short-term (2015-2024), mid-term (2025-2034), and long-term (2035-2045) timeframes. The Mobility Matrix does not prioritize projects, but rather serves as a strategic transportation plan for future transportation investments over the next 20 plus years..
1.3 Developed by Subregional Jurisdictions and Stakeholders To ensure proposed projects and programs reflect the needs and interests of the subregion, the Mobility Matrices followed a “bottoms-up” approach guided by a Project Development Team (PDT) selected by the subregion, consisting of city, stakeholder, and subregional representatives. The North County PDT consisted of representatives from the following jurisdictions and stakeholder agencies:
City of Lancaster
City of Palmdale
Los Angeles County Department of Public Works
Antelope Valley Transit Authority (AVTA)
California Department of Transportation (Caltrans)
Metrolink
Safe Routes to School National Partnership
Southern California Association of Governments (SCAG)
The PDT met five times over the eight-month study period to guide the creation of strategic goals and
objectives, identify a subregional package of projects and programs, oversee the project and program evaluation process, and review and approve all work products associated with the Subregional Mobility Matrix. In addition, targeted outreach was conducted with city staff and other stakeholders on an as-needed basis to confirm project and program details. Several meetings with adjacent Mobility Matrix subregions were held in late 2014 to ensure coordination on projects and programs that crossed or approached subregional boundaries. All coordination activities for this project are summarized in Appendix A.
1.4 What’s in it for the Subregion? The Mobility Matrix serves as a vehicle for communicating subregional needs into Metro’s LRTP update process, providing:
A process for developing consensus. Through the PDT and targeted outreach, the Mobility Matrix stakeholders built consensus around goals and objectives for improving mobility within the subregion, in order to more consistently address their transportation issues and proposed improvements in the next LRTP and beyond.
An initial framework for LRTP performance analysis. The consensus-building process included articulating a set of subregional goals and objectives; a high-level analysis of potential projects and programs to address those goals and objectives; and development of a set of proposed performance measures.
An approved list of project and programs. The Mobility Matrix provides a list of projects and
Final Report
Chapter 1 - Introduction
S U B R E G I O N A L M O B I L I T Y M A T R I X – N O R T H C O U N T Y February 2015 Page 1-5
programs approved by the subregion intended to address transportation system deficiencies and needs.
Draft cost ranges and implementation timeframes. Based on project/program readiness and high-level, rough order-of-magnitude planning estimate project cost ranges, the Mobility Matrix presents the subregional draft investment needs to be considered in the LRTP update over its 30-year time horizon.
1.5 Policy Context The Subregional Mobility Matrix process was undertaken in the context of Federal, state, and local policies and is intended to complement local and regional planning efforts. A sampling of relevant policies considered during the development of subregional objectives and project and program evaluation includes:
1.5.1 Federal
MAP-21 (2012), the Federal Transportation Authorization Bill, places a greater emphasis on performance-based planning for metropolitan planning organizations (MPO), LRTPs, and the Transportation Improvement Program(TIP).
1.5.2 State
Assembly Bill (AB) 32, the Global Warming Solutions Act of 2006, set greenhouse gas (GHG) mitigation targets for California with a goal of reducing GHG emissions to 1990 levels by the year 2020 across all sectors.
Senate Bill (SB) 375, the Sustainable Communities and Climate Protection Act of 2006, authorized the Air Resources Board (ARB) to set regional targets for
GHG emissions reductions from passenger vehicles, and directed California MPOs to prepare a Sustainable Communities Strategy (SCS), incorporating land use, housing, and transportation strategies intended to help regions meet GHG emissions reduction targets.
SB 743 (2013), the Jobs and Economic Improvement Through Environmental Leadership Act, directed the Governor’s Office of Planning and Research (OPR) to develop a new approach for analyzing transportation impacts under the California Environmental Quality Act (CEQA). The law provides exemptions to CEQA requirements for certain types of development located in transit-priority areas that are consistent with adopted SCS or alternative planning strategies. An outcome of this Bill is the use of vehicle miles traveled (VMT) rather than level-of-service (LOS) metrics in CEQA transportation analysis. Whereas LOS evaluation prioritizes capacity expansion projects that reduce delay or congestion, VMT reduction can be attributed to projects that encourage ridesharing, transit use, transit-oriented development, and active transportation projects that contribute to the reduction of vehicle travel. In short, SB 743 allows for the use of VMT, rather than delay or congestion, to prioritize transportation investments. OPR has yet to establish comprehensive guidelines for the implementation of SB 743.
1.5.3 Local
Metro’s LRTP, a 30-year transportation planning document required for obtaining Federal funding, was last updated in 2009. The Mobility Matrix will serve as an initial step in the LRTP update, slated for completion in 2017.
Final Report
Chapter 1 - Introduction
S U B R E G I O N A L M O B I L I T Y M A T R I X – N O R T H C O U N T Y February 2015 Page 1-6
Local Option Sales Tax Measures. Los Angeles County voters have approved three one-half-cent sales tax ballot measures over the past three decades: Proposition A, Proposition C, and Measure R. Unlike the first two tax measures, which do not expire and did not designate funding for specific projects, Measure R expires in 30 years and contains a specific expenditure plan. Metro is considering placing a new sales tax on the 2016 Ballot. Through the Mobility Matrix process, subregional stakeholders began the project/program vetting process by identifying goals and priorities specific to their subregion. These goals and unmet needs will help focus potential additional funding on key subregional projects and programs.
1.6 Document Overview The Subregional Mobility Matrix contains the following chapters:
Chapter 2.0 – Subregional Overview. An overview of the North County Mobility Matrix Subregion, including key trends and issues impacting the subregional transportation system and highlighting critical needs.
Chapter 3.0 – Subregional Goals and Objectives. A summary of goals and objectives to guide subregional transportation investments in North County.
Chapter 4.0 – Subregional Mobility Matrix. An initial screening of subregional priority projects and programs for consideration in the LRTP.
Chapter 5.0 – Implementation Timeline and Cost Estimation. An initial categorization of project and program implementation into short-, mid- and long-
term investment needs, and a summary of next steps for the Mobility Matrix.
Appendices. Includes a log of the PDT and outreach process, methodology memorandums, a full project list, and the full Baseline Conditions Report.
Final Report
Chapter 2 – Subregional Overview
S U B R E G I O N A L M O B I L I T Y M A T R I X – N O R T H C O U N T Y February 2015 Page 2-1
2.0 SUBREGIONAL OVERVIEW
The North County Transportation Coalition (NCTC) was formed in 1995 and consists of membership from the Cities of Lancaster, Palmdale, and Santa Clarita, and the County of Los Angeles. Its purpose is to improve the movement of people and goods in the North Los Angeles County region. Its duties include the development of policies and strategies that directly lead to the implementation of projects and programs that address critical North County transportation issues, promote economic development, and maximize transportation funding opportunities for member jurisdictions. For the purposes of the Metro Mobility Matrix, the City of Santa Clarita elected to conduct this study with the San Fernando Valley Council of Governments, and is not included as part of the North County study area.
This chapter presents an overview of 2014 baseline transportation conditions within the North County Mobility Matrix subregion, and forecasted conditions for year 2024. It provides an understanding of the major transportation conditions and issues in the subregion, and provides an overview of subregional needs. This chapter summarizes results of the subregional Baseline Conditions Report, an interim work product which assessed the following:
Existing projects and studies;
Demographics. Land uses, population and employment change projected from 2014 to 2024, and environmental justice measures (transit-dependent communities and disadvantaged/at-risk communities, such as pollution burden, poverty, asthma, education rates, etc.);
Travel patterns. An assessment of trip origins and destinations to, from, and within the subregion, as well as subregional commute travel mode choice;
Vehicle travel. Countywide Strategic Arterials Network (CSAN) facilities within the area, vehicle hours traveled and average trip times, designated truck routes per the Draft Countywide Strategic Truck Arterial Network (CSTAN), and motor vehicle and truck collisions;
Transit. Transit mode share, Metrolink service including weekday boardings, and bus routes; and
Active transportation. Active transportation mode share, existing bikeways, and bicycle/pedestrian-involved collisions.
The Baseline Conditions Report identified several key findings regarding the transportation system for the North County Mobility Matrix Subregion, including, but not limited to, the following:
Very high rates of expected growth are expected in North County, which will place greater burdens on multimodal system in the years to come. North County believes actual growth in population and employment may outpace SCAG projections.
The region features a larger population of at-risk residents but better air quality than the county average.
Residents face long commute travel times with few alternatives to driving other than infrequent Metrolink trains and commuter express shuttles operated by AVTA.
Final Report
Chapter 2 – Subregional Overview
S U B R E G I O N A L M O B I L I T Y M A T R I X – N O R T H C O U N T Y February 2015 Page 2-2
While overall vehicle collisions have steadily decreased over the last several years, collisions involving pedestrians and bicyclists are gradually rising.
2.1 Land Use and Demographics The North County Mobility Matrix subregion has demographic and land use characteristics that are unique in Los Angeles County.
2.1.1 Land Use
The North County study area features the largest concentration of rural and undeveloped land in Los Angeles County. The majority of the region is zoned residential, while the SR 14 corridor through the Cities of Lancaster and Palmdale features pockets of commercial and industrial activity.
2.1.2 Population and Employment
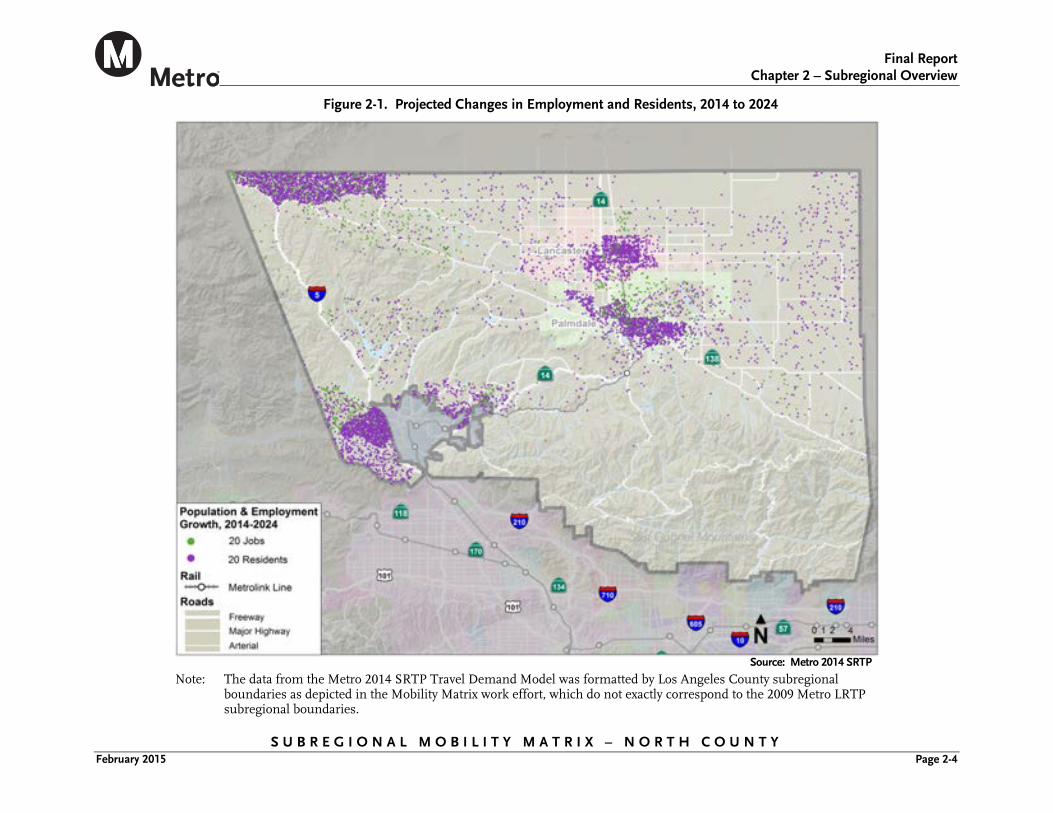
North Los Angeles County is one of the few areas in the County that feature large swaths of undeveloped land and the potential for significant growth. Compared to the rest of the County, the average population density is low, but according to SCAG population and employment estimates and forecasts used in the 2014 Metro SRTP, the study area is expected to grow from about 470,700 residents in 2014 to more than 600,000 by 2024, an increase of 28 percent. Employment in the region is expected to grow by 24 percent over the same period. This represents the largest forecasted growth rate of any region in the County, far above the forecasted countywide average growth forecasts of 8 percent (residents) and 5 percent (jobs). The majority of the growth is concentrated in and around the Cities of Lancaster and Palmdale and the unincorporated areas in the Santa Clarita Valley and the
Quail Lake region near the SR 138/I-5 Interchange (see Figure 2-1).
2.1.3 Environmental Justice
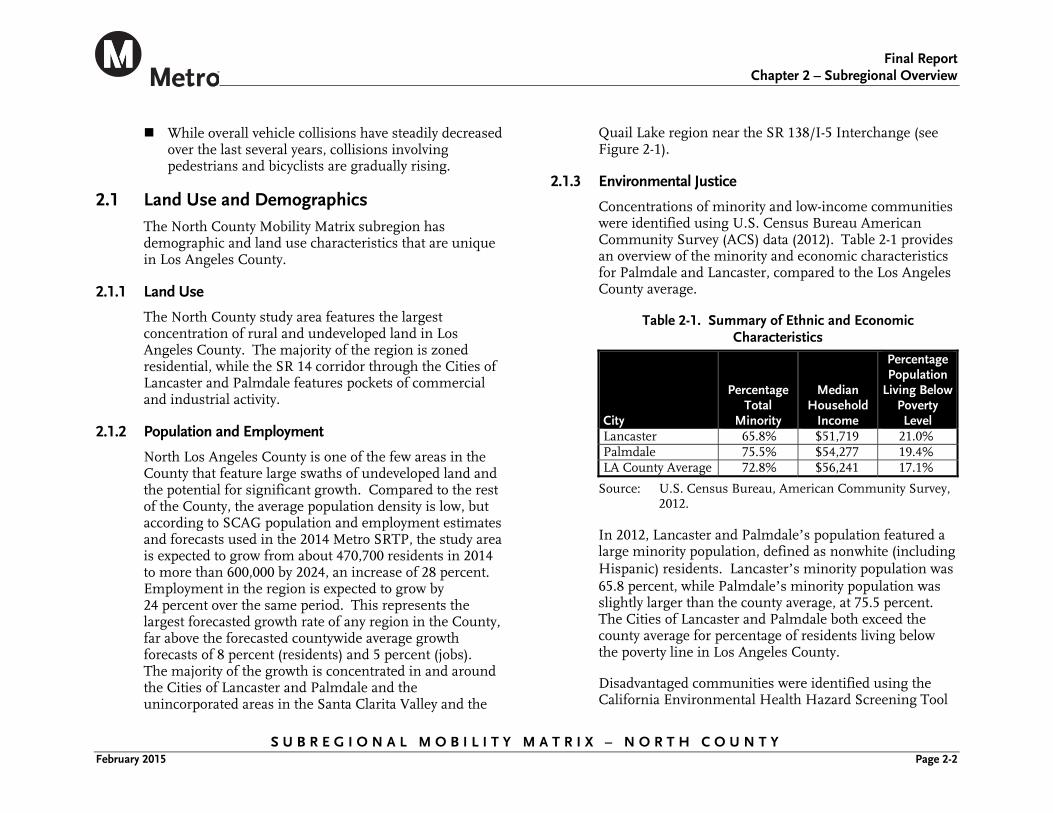
Concentrations of minority and low-income communities were identified using U.S. Census Bureau American Community Survey (ACS) data (2012). Table 2-1 provides an overview of the minority and economic characteristics for Palmdale and Lancaster, compared to the Los Angeles County average.
Table 2-1. Summary of Ethnic and Economic Characteristics
City
Percentage Total
Minority
Median Household
Income
Percentage Population
Living Below Poverty Level
Lancaster 65.8% $51,719 21.0% Palmdale 75.5% $54,277 19.4% LA County Average 72.8% $56,241 17.1%
Source: U.S. Census Bureau, American Community Survey, 2012.
In 2012, Lancaster and Palmdale’s population featured a large minority population, defined as nonwhite (including Hispanic) residents. Lancaster’s minority population was 65.8 percent, while Palmdale’s minority population was slightly larger than the county average, at 75.5 percent. The Cities of Lancaster and Palmdale both exceed the county average for percentage of residents living below the poverty line in Los Angeles County.
Disadvantaged communities were identified using the California Environmental Health Hazard Screening Tool
Final Report
Chapter 2 – Subregional Overview
S U B R E G I O N A L M O B I L I T Y M A T R I X – N O R T H C O U N T Y February 2015 Page 2-3
(CalEnviroScreen). This tool aggregates variables that indicate certain types of socioeconomic vulnerability or physical exposure, such as low income, low education attainment, linguistic isolation, pollution exposure, hazardous waste exposure, or traffic exposure. The resulting indexed score shows the communities most disproportionately burdened by multiple types of exposure and risk, with a high score indicating higher levels of exposure and risk. In North County, higher risk areas are located around Palmdale and Lancaster. The study area is home to many at-risk population factors, but the CalEnviroScores are offset by comparably low levels of pollution compared to the rest of the County.
2.2 Travel Patterns
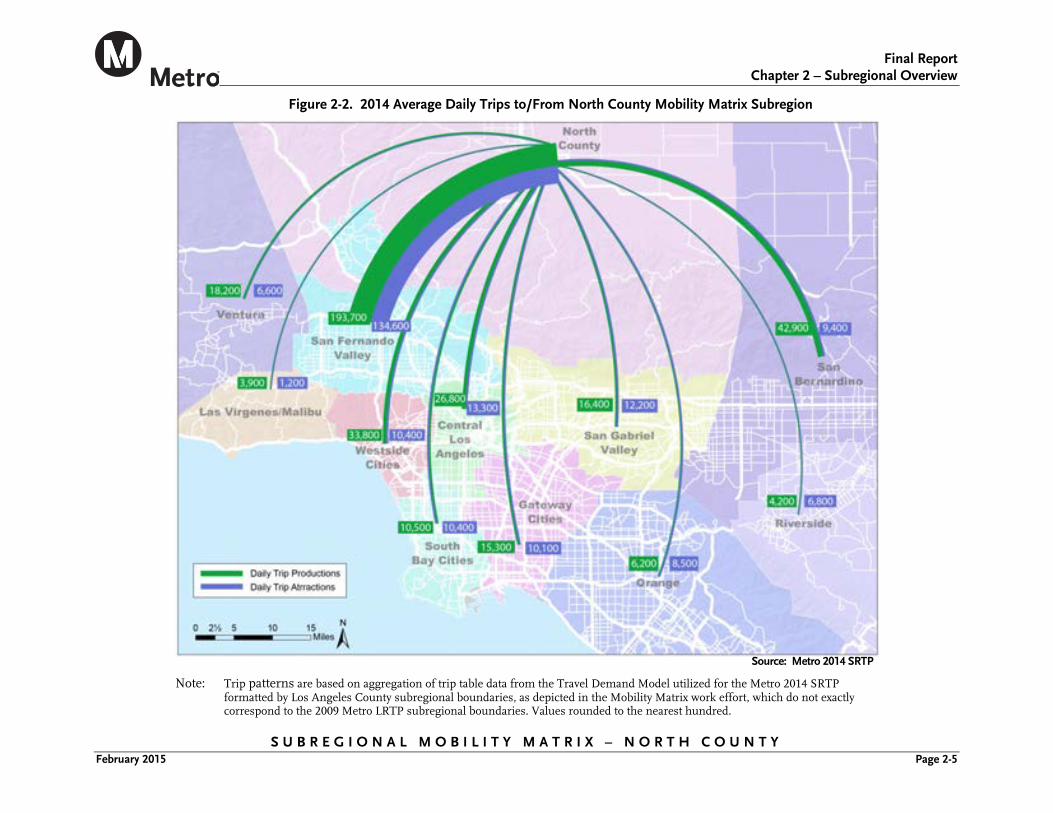
2.2.1 Interregional Travel Patterns Figure 2-2 illustrates the 2014 average weekday trips produced and attracted (all modes) between the study area and neighboring subregions based on the Metro 2014 Short-Range Transportation Plan (SRTP) Travel Demand Model, including trips both to and from the study area. Trip productions are defined as the home end (origin or destination) of a home-based trip, or origin of a non-home based trip. Trip attractions are defined as the nonhome end (origin or destination) of a home-based trip, or destination of a nonhome-based trip. North County’s largest subregional travel market is the San Fernando Valley (including Santa Clarita), featuring 328,300 two-
way person-trips on an average weekday, followed by San Bernardino County (52,300 trips); Westside (44,200); and Central Los Angeles (40,100).
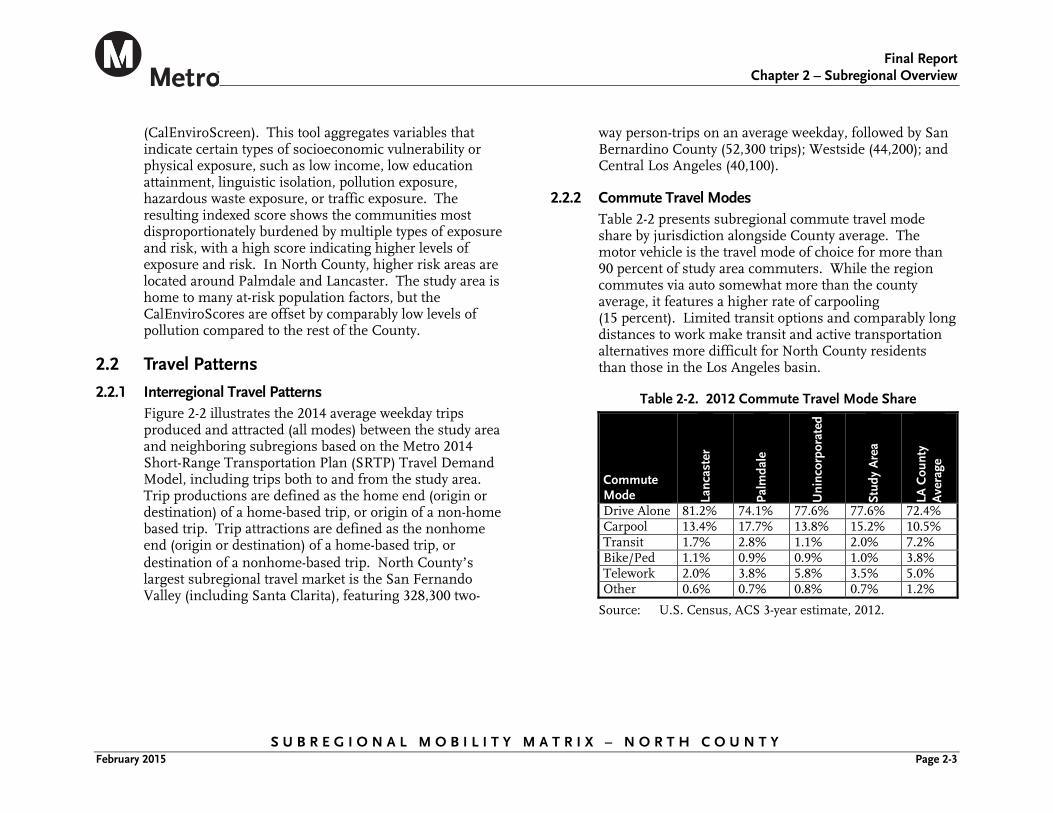
2.2.2 Commute Travel Modes Table 2-2 presents subregional commute travel mode share by jurisdiction alongside County average. The motor vehicle is the travel mode of choice for more than 90 percent of study area commuters. While the region commutes via auto somewhat more than the county average, it features a higher rate of carpooling (15 percent). Limited transit options and comparably long distances to work make transit and active transportation alternatives more difficult for North County residents than those in the Los Angeles basin.
Table 2-2. 2012 Commute Travel Mode Share
Commute Mode La
ncas
ter
Palm
dale
Uni
ncor
pora
ted
Stud
y A
rea
LA C
ount
y A
vera
ge
Drive Alone 81.2% 74.1% 77.6% 77.6% 72.4% Carpool 13.4% 17.7% 13.8% 15.2% 10.5% Transit 1.7% 2.8% 1.1% 2.0% 7.2% Bike/Ped 1.1% 0.9% 0.9% 1.0% 3.8% Telework 2.0% 3.8% 5.8% 3.5% 5.0% Other 0.6% 0.7% 0.8% 0.7% 1.2%
Source: U.S. Census, ACS 3-year estimate, 2012.
Final Report
Chapter 2 – Subregional Overview
S U B R E G I O N A L M O B I L I T Y M A T R I X – N O R T H C O U N T Y February 2015 Page 2-4
Figure 2-1. Projected Changes in Employment and Residents, 2014 to 2024
Note: The data from the Metro 2014 SRTP Travel Demand Model was formatted by Los Angeles County subregional
boundaries as depicted in the Mobility Matrix work effort, which do not exactly correspond to the 2009 Metro LRTP subregional boundaries.
Source: Metro 2014 SRTP
Final Report
Chapter 2 – Subregional Overview
S U B R E G I O N A L M O B I L I T Y M A T R I X – N O R T H C O U N T Y February 2015 Page 2-5
Figure 2-2. 2014 Average Daily Trips to/From North County Mobility Matrix Subregion
Note: Trip patterns are based on aggregation of trip table data from the Travel Demand Model utilized for the Metro 2014 SRTP
formatted by Los Angeles County subregional boundaries, as depicted in the Mobility Matrix work effort, which do not exactly correspond to the 2009 Metro LRTP subregional boundaries. Values rounded to the nearest hundred.
Source: Metro 2014 SRTP
Final Report
Chapter 2 – Subregional Overview
S U B R E G I O N A L M O B I L I T Y M A T R I X – N O R T H C O U N T Y February 2015 Page 2-6
2.3 Vehicle Travel The North County Mobility Matrix subregion contains three primary highways:
1. SR 14. The primary artery for vehicle travel from the Antelope Valley toward the Los Angeles Basin, which meets I-5 in the Santa Clarita valley;
2. I-5. Critical interregional route passing through the western edge of the study area, which connects Southern California and the Central Valley and points north; and
3. SR 138. Primary east-west travel corridor providing access from I-5 in the west to I-15 in San Bernardino County.
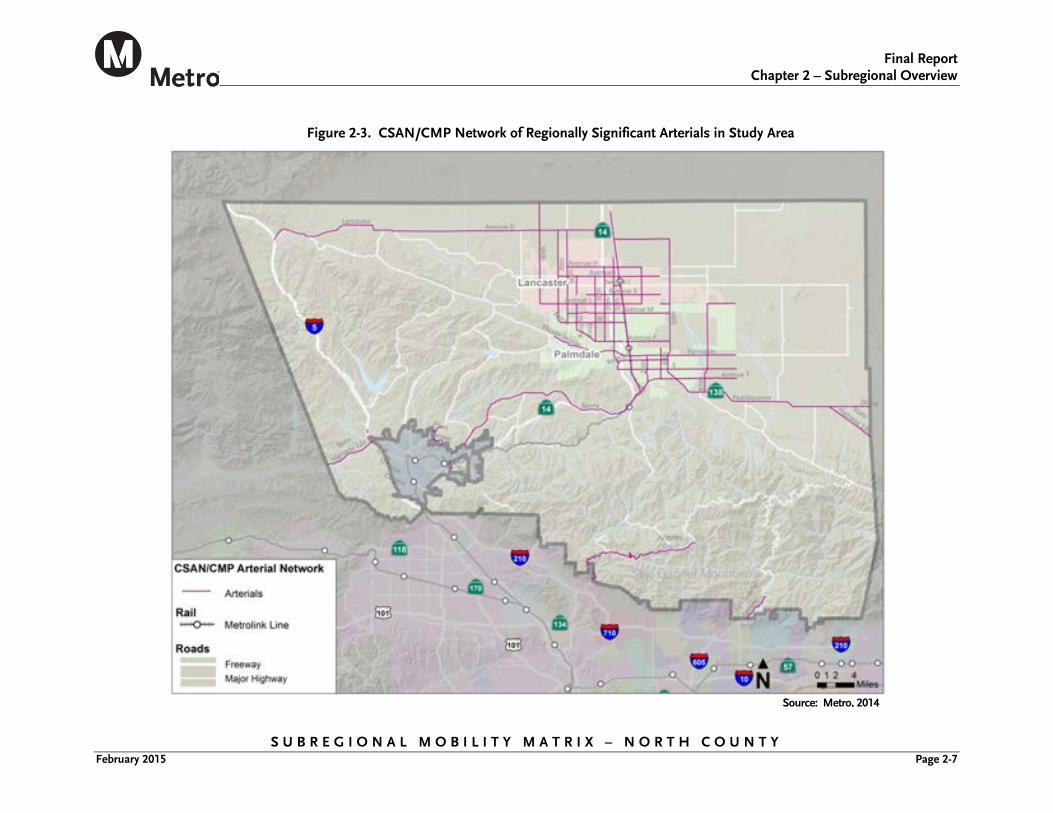
Figure 2-3 shows primary arterials in the region as captured in the CSAN, as amended by subregional stakeholders through the Metro Congestion Management Program (CMP).
According to data from the Statewide Integrated Traffic Record System (SWITRS), total vehicle collisions fell by 27 percent between 2007 and 2011, from 2,692 to 1,968 collisions. Additionally, fatal crashes fell 16 percent, from 62 in 2007 to 52 in 2011 and severe injury crashes fell 23 percent, from 961 in 2007 to 630 in 2011.
2.3.1 Passenger Vehicle Travel Demands
Due largely to significant regional population growth over the coming 10 years, vehicle trips originating
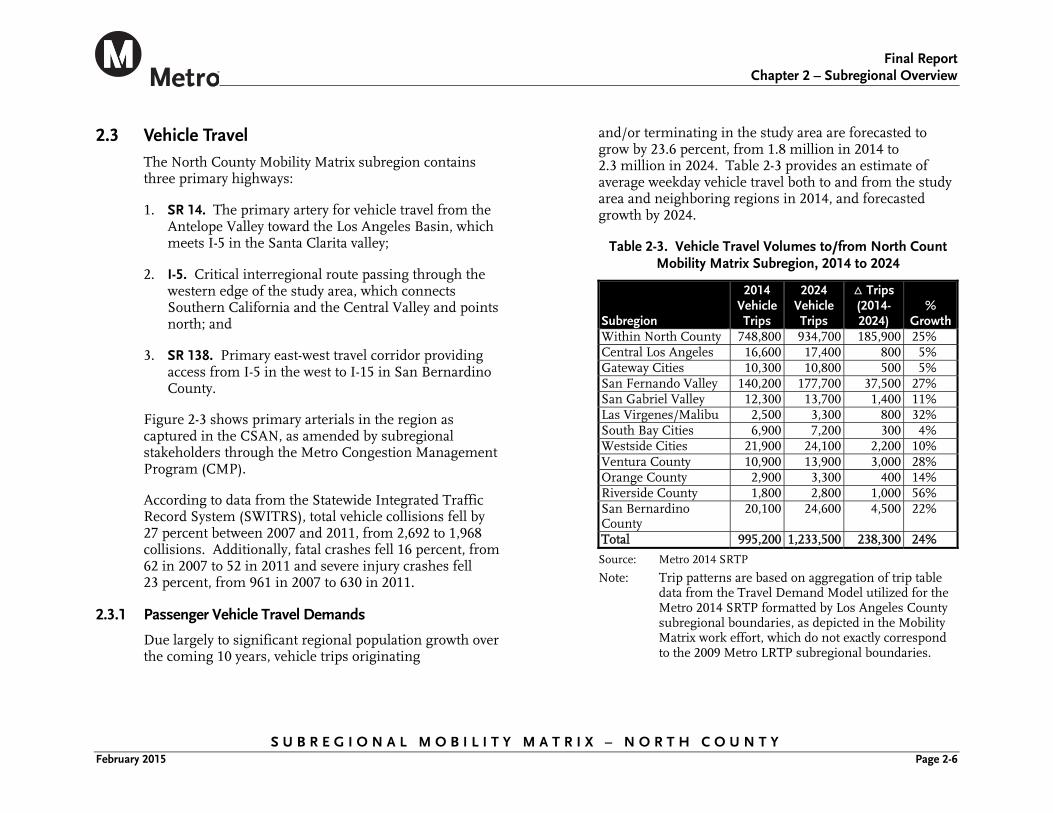
and/or terminating in the study area are forecasted to grow by 23.6 percent, from 1.8 million in 2014 to 2.3 million in 2024. Table 2-3 provides an estimate of average weekday vehicle travel both to and from the study area and neighboring regions in 2014, and forecasted growth by 2024.
Table 2-3. Vehicle Travel Volumes to/from North Count Mobility Matrix Subregion, 2014 to 2024
Subregion
2014 Vehicle Trips
2024 Vehicle Trips
Trips (2014-2024)
% Growth
Within North County 748,800 934,700 185,900 25% Central Los Angeles 16,600 17,400 800 5% Gateway Cities 10,300 10,800 500 5% San Fernando Valley 140,200 177,700 37,500 27% San Gabriel Valley 12,300 13,700 1,400 11% Las Virgenes/Malibu 2,500 3,300 800 32% South Bay Cities 6,900 7,200 300 4% Westside Cities 21,900 24,100 2,200 10% Ventura County 10,900 13,900 3,000 28% Orange County 2,900 3,300 400 14% Riverside County 1,800 2,800 1,000 56% San Bernardino County
20,100 24,600 4,500 22%
Total 995,200 1,233,500 238,300 24%
Source: Metro 2014 SRTP
Note: Trip patterns are based on aggregation of trip table data from the Travel Demand Model utilized for the Metro 2014 SRTP formatted by Los Angeles County subregional boundaries, as depicted in the Mobility Matrix work effort, which do not exactly correspond to the 2009 Metro LRTP subregional boundaries.
Final Report
Chapter 2 – Subregional Overview
S U B R E G I O N A L M O B I L I T Y M A T R I X – N O R T H C O U N T Y February 2015 Page 2-7
Figure 2-3. CSAN/CMP Network of Regionally Significant Arterials in Study Area
Source: Metro, 2014
Final Report
Chapter 2 – Subregional Overview
S U B R E G I O N A L M O B I L I T Y M A T R I X – N O R T H C O U N T Y February 2015 Page 2-8
2.3.2 Driving Times
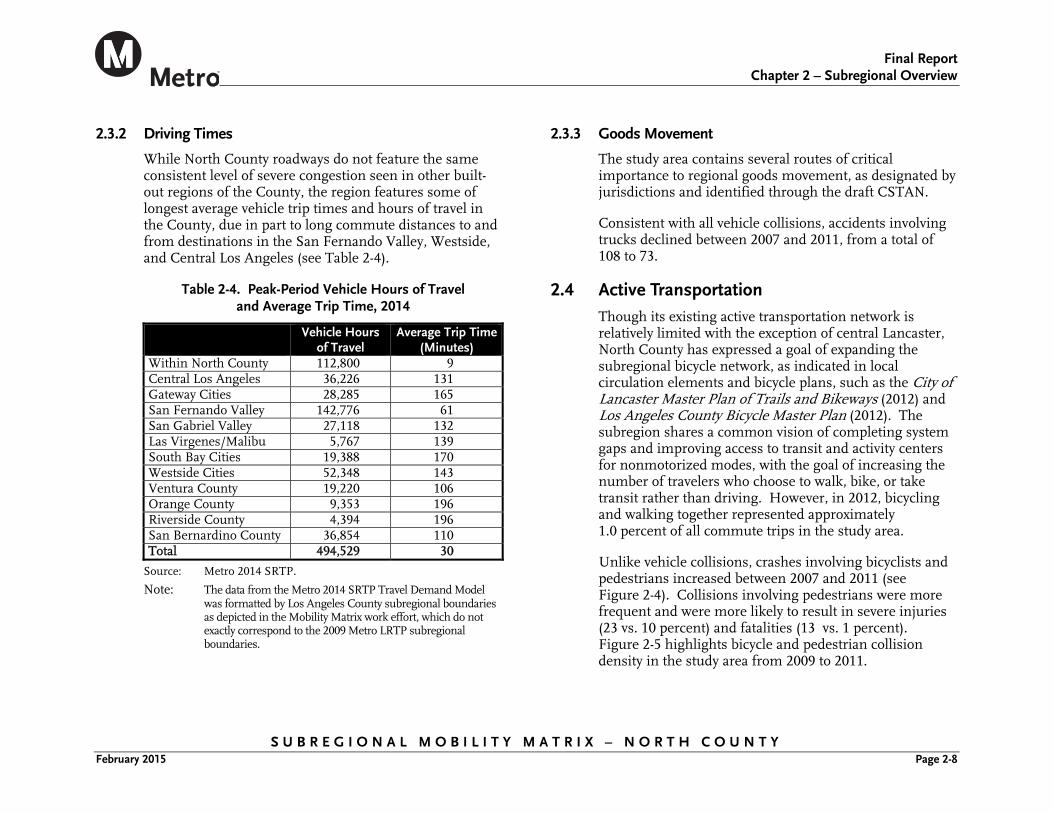
While North County roadways do not feature the same consistent level of severe congestion seen in other built-out regions of the County, the region features some of longest average vehicle trip times and hours of travel in the County, due in part to long commute distances to and from destinations in the San Fernando Valley, Westside, and Central Los Angeles (see Table 2-4).
Table 2-4. Peak-Period Vehicle Hours of Travel and Average Trip Time, 2014
Vehicle Hours
of Travel Average Trip Time
(Minutes) Within North County 112,800 9 Central Los Angeles 36,226 131 Gateway Cities 28,285 165 San Fernando Valley 142,776 61 San Gabriel Valley 27,118 132 Las Virgenes/Malibu 5,767 139 South Bay Cities 19,388 170 Westside Cities 52,348 143 Ventura County 19,220 106 Orange County 9,353 196 Riverside County 4,394 196 San Bernardino County 36,854 110 Total 494,529 30
Source: Metro 2014 SRTP.
Note: The data from the Metro 2014 SRTP Travel Demand Model was formatted by Los Angeles County subregional boundaries as depicted in the Mobility Matrix work effort, which do not exactly correspond to the 2009 Metro LRTP subregional boundaries.
2.3.3 Goods Movement
The study area contains several routes of critical importance to regional goods movement, as designated by jurisdictions and identified through the draft CSTAN.
Consistent with all vehicle collisions, accidents involving trucks declined between 2007 and 2011, from a total of 108 to 73.
2.4 Active Transportation Though its existing active transportation network is relatively limited with the exception of central Lancaster, North County has expressed a goal of expanding the subregional bicycle network, as indicated in local circulation elements and bicycle plans, such as the City of Lancaster Master Plan of Trails and Bikeways (2012) and Los Angeles County Bicycle Master Plan (2012). The subregion shares a common vision of completing system gaps and improving access to transit and activity centers for nonmotorized modes, with the goal of increasing the number of travelers who choose to walk, bike, or take transit rather than driving. However, in 2012, bicycling and walking together represented approximately 1.0 percent of all commute trips in the study area.
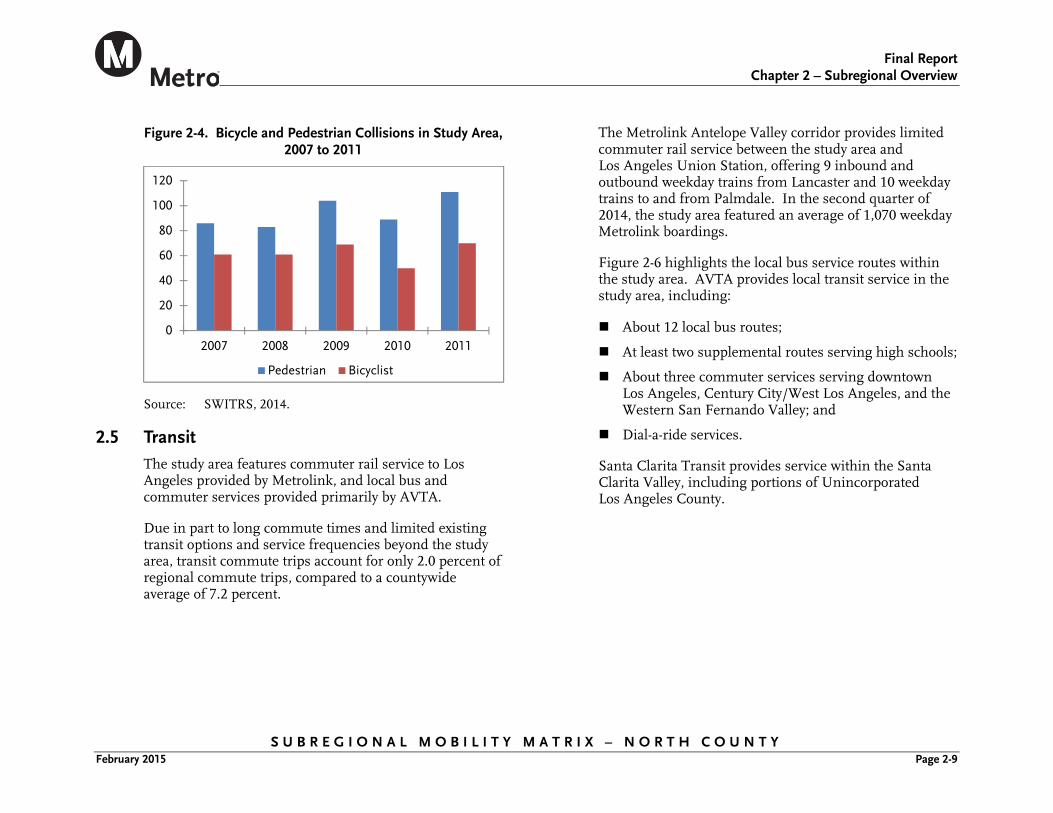
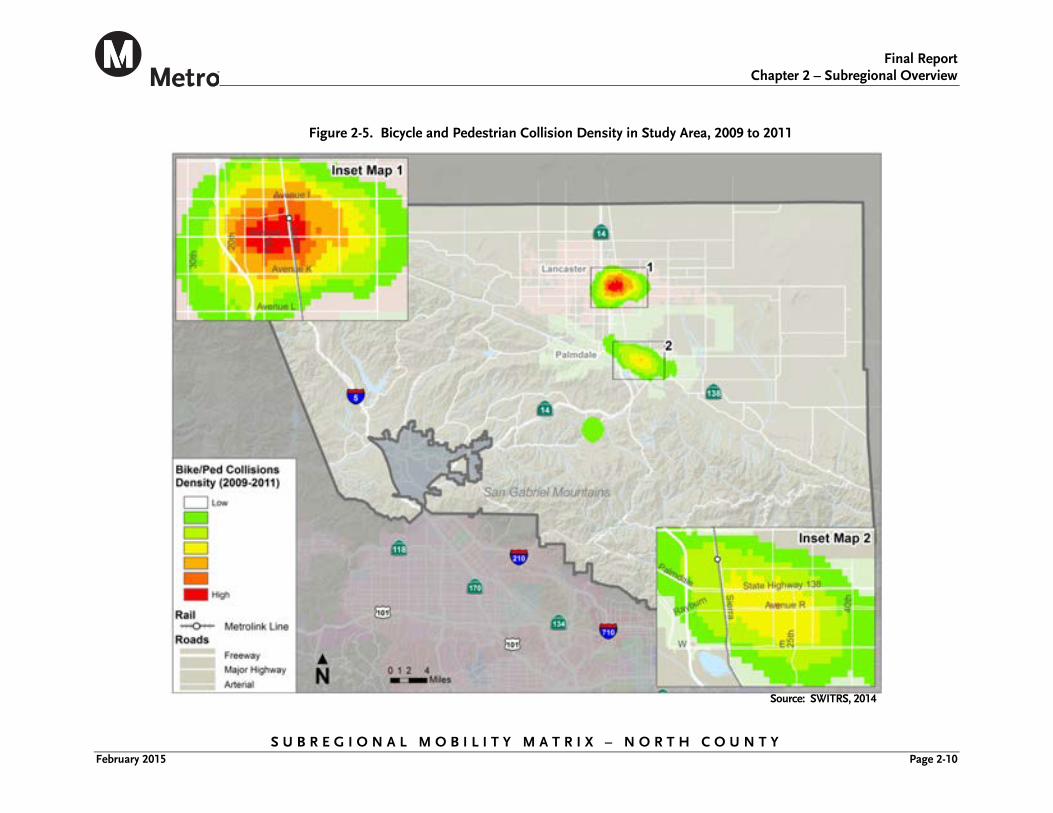
Unlike vehicle collisions, crashes involving bicyclists and pedestrians increased between 2007 and 2011 (see Figure 2-4). Collisions involving pedestrians were more frequent and were more likely to result in severe injuries (23 vs. 10 percent) and fatalities (13 vs. 1 percent). Figure 2-5 highlights bicycle and pedestrian collision density in the study area from 2009 to 2011.
Final Report
Chapter 2 – Subregional Overview
S U B R E G I O N A L M O B I L I T Y M A T R I X – N O R T H C O U N T Y February 2015 Page 2-9
Figure 2-4. Bicycle and Pedestrian Collisions in Study Area, 2007 to 2011
Source: SWITRS, 2014.
2.5 Transit The study area features commuter rail service to Los Angeles provided by Metrolink, and local bus and commuter services provided primarily by AVTA.
Due in part to long commute times and limited existing transit options and service frequencies beyond the study area, transit commute trips account for only 2.0 percent of regional commute trips, compared to a countywide average of 7.2 percent.
The Metrolink Antelope Valley corridor provides limited commuter rail service between the study area and Los Angeles Union Station, offering 9 inbound and outbound weekday trains from Lancaster and 10 weekday trains to and from Palmdale. In the second quarter of 2014, the study area featured an average of 1,070 weekday Metrolink boardings.
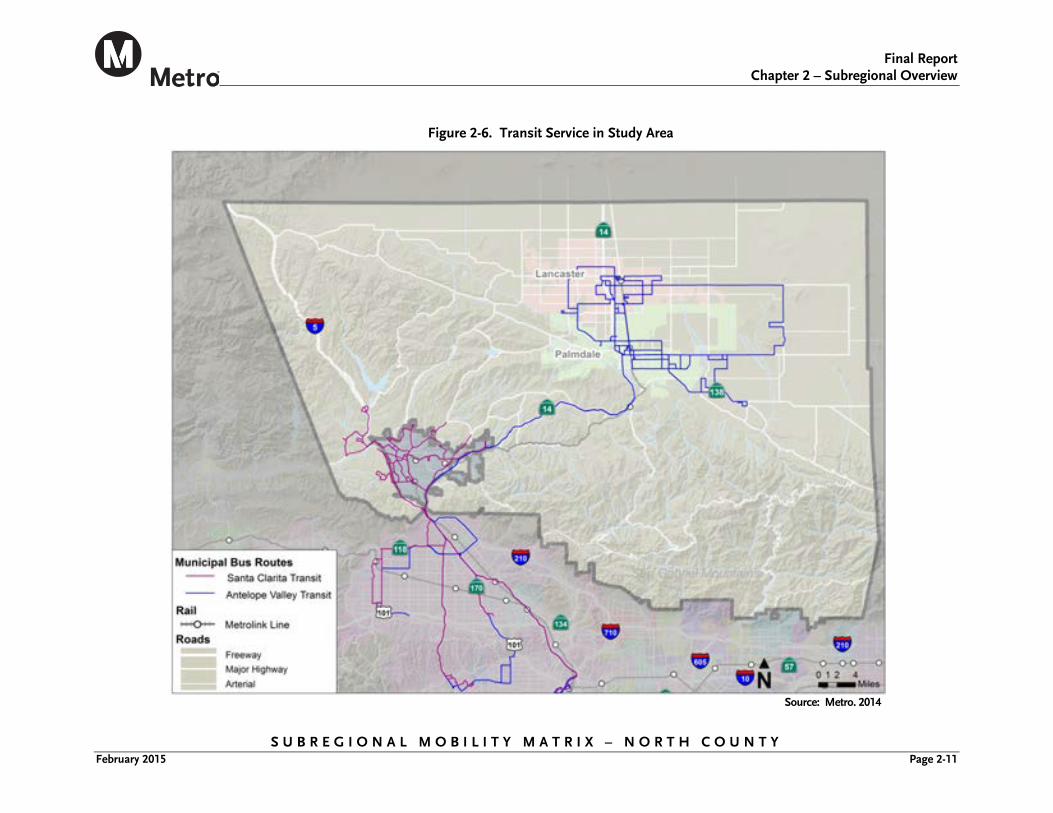
Figure 2-6 highlights the local bus service routes within the study area. AVTA provides local transit service in the study area, including:
About 12 local bus routes;
At least two supplemental routes serving high schools;
About three commuter services serving downtown Los Angeles, Century City/West Los Angeles, and the Western San Fernando Valley; and
Dial-a-ride services.
Santa Clarita Transit provides service within the Santa Clarita Valley, including portions of Unincorporated Los Angeles County.
0
20
40
60
80
100
120
2007 2008 2009 2010 2011
Pedestrian Bicyclist
Final Report
Chapter 2 – Subregional Overview
S U B R E G I O N A L M O B I L I T Y M A T R I X – N O R T H C O U N T Y February 2015 Page 2-10
Figure 2-5. Bicycle and Pedestrian Collision Density in Study Area, 2009 to 2011
Source: SWITRS, 2014
Final Report
Chapter 2 – Subregional Overview
S U B R E G I O N A L M O B I L I T Y M A T R I X – N O R T H C O U N T Y February 2015 Page 2-11
Figure 2-6. Transit Service in Study Area
Source: Metro, 2014
Final Report
Chapter 3 – Goals and Objectives
S U B R E G I O N A L M O B I L I T Y M A T R I X – N O R T H C O U N T Y February 2015 Page 3-1
3.0 GOALS AND OBJECTIVES
This chapter describes the goals and objectives for the North County Mobility Matrix Subregion. The goals are consistent with the County’s overall goals framework, which consists of six broad themes common among all the subregions. The goals also reflect subregional priorities and are based on recent studies, local jurisdictions’ general plans, and discussions with city and stakeholder staff.
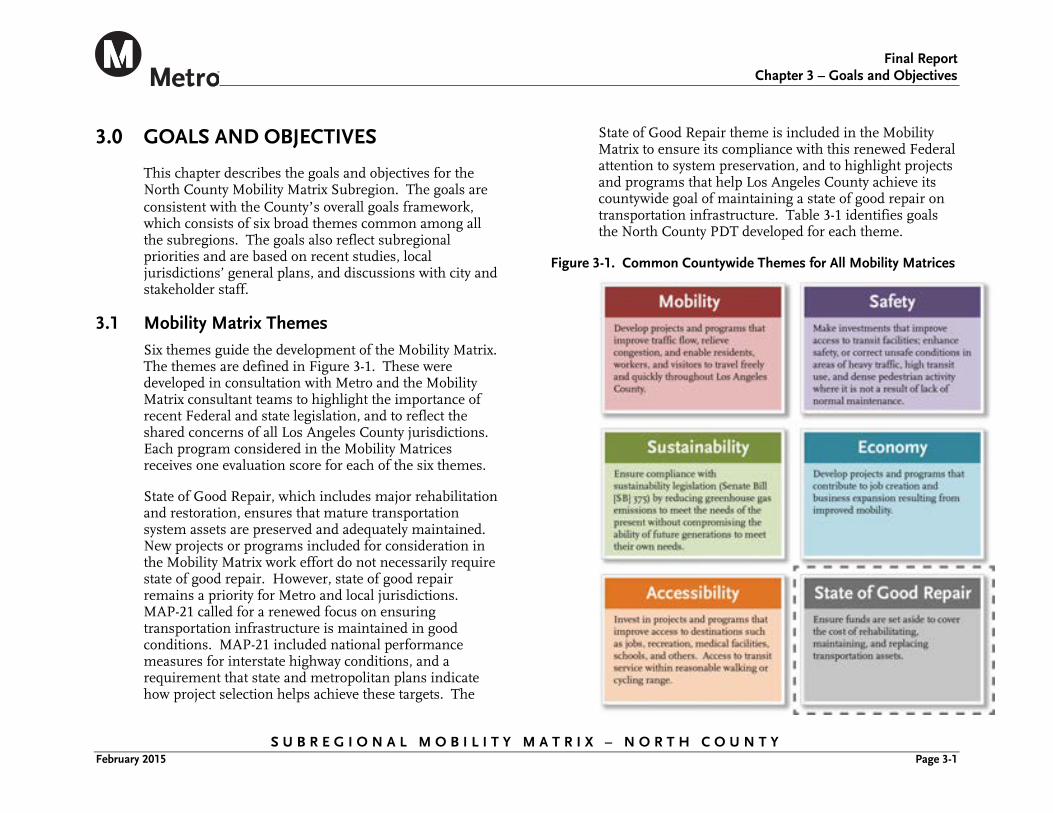
3.1 Mobility Matrix Themes Six themes guide the development of the Mobility Matrix. The themes are defined in Figure 3-1. These were developed in consultation with Metro and the Mobility Matrix consultant teams to highlight the importance of recent Federal and state legislation, and to reflect the shared concerns of all Los Angeles County jurisdictions. Each program considered in the Mobility Matrices receives one evaluation score for each of the six themes.
State of Good Repair, which includes major rehabilitation and restoration, ensures that mature transportation system assets are preserved and adequately maintained. New projects or programs included for consideration in the Mobility Matrix work effort do not necessarily require state of good repair. However, state of good repair remains a priority for Metro and local jurisdictions. MAP-21 called for a renewed focus on ensuring transportation infrastructure is maintained in good conditions. MAP-21 included national performance measures for interstate highway conditions, and a requirement that state and metropolitan plans indicate how project selection helps achieve these targets. The
State of Good Repair theme is included in the Mobility Matrix to ensure its compliance with this renewed Federal attention to system preservation, and to highlight projects and programs that help Los Angeles County achieve its countywide goal of maintaining a state of good repair on transportation infrastructure. Table 3-1 identifies goals the North County PDT developed for each theme.
Figure 3-1. Common Countywide Themes for All Mobility Matrices
Final Report
Chapter 3 – Goals and Objectives
S U B R E G I O N A L M O B I L I T Y M A T R I X – N O R T H C O U N T Y February 2015 Page 3-2
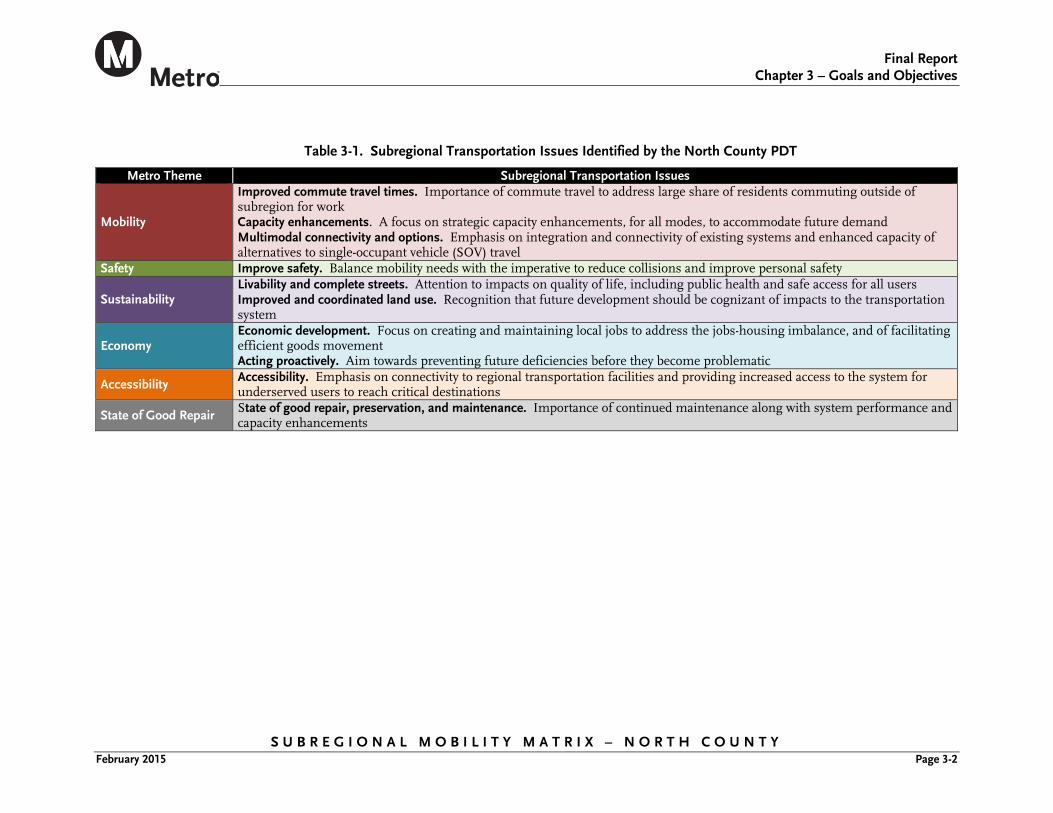
Table 3-1. Subregional Transportation Issues Identified by the North County PDT
Metro Theme Subregional Transportation Issues
Mobility
Improved commute travel times. Importance of commute travel to address large share of residents commuting outside of subregion for work Capacity enhancements. A focus on strategic capacity enhancements, for all modes, to accommodate future demand Multimodal connectivity and options. Emphasis on integration and connectivity of existing systems and enhanced capacity of alternatives to single-occupant vehicle (SOV) travel
Safety Improve safety. Balance mobility needs with the imperative to reduce collisions and improve personal safety
Sustainability Livability and complete streets. Attention to impacts on quality of life, including public health and safe access for all users Improved and coordinated land use. Recognition that future development should be cognizant of impacts to the transportation system
Economy Economic development. Focus on creating and maintaining local jobs to address the jobs-housing imbalance, and of facilitating efficient goods movement Acting proactively. Aim towards preventing future deficiencies before they become problematic
Accessibility Accessibility. Emphasis on connectivity to regional transportation facilities and providing increased access to the system for underserved users to reach critical destinations
State of Good Repair State of good repair, preservation, and maintenance. Importance of continued maintenance along with system performance and capacity enhancements
Final Report
Chapter 3 – Goals and Objectives
S U B R E G I O N A L M O B I L I T Y M A T R I X – N O R T H C O U N T Y February 2015 Page 3-3
3.2 Subregional Priorities The PDT was asked to consider the six Mobility Matrix themes and develop goals and objectives for each theme that reflected subregional priorities.
In response to the above transportation issues and needs, stakeholders from the subregion developed a series of goal statements to help guide local and subregional transportation planning efforts.
North County’s subregional goal statements will help guide how proposed transportation projects are assessed in the Mobility Matrix evaluation process and inform subregional needs in Metro’s forthcoming LRTP update.
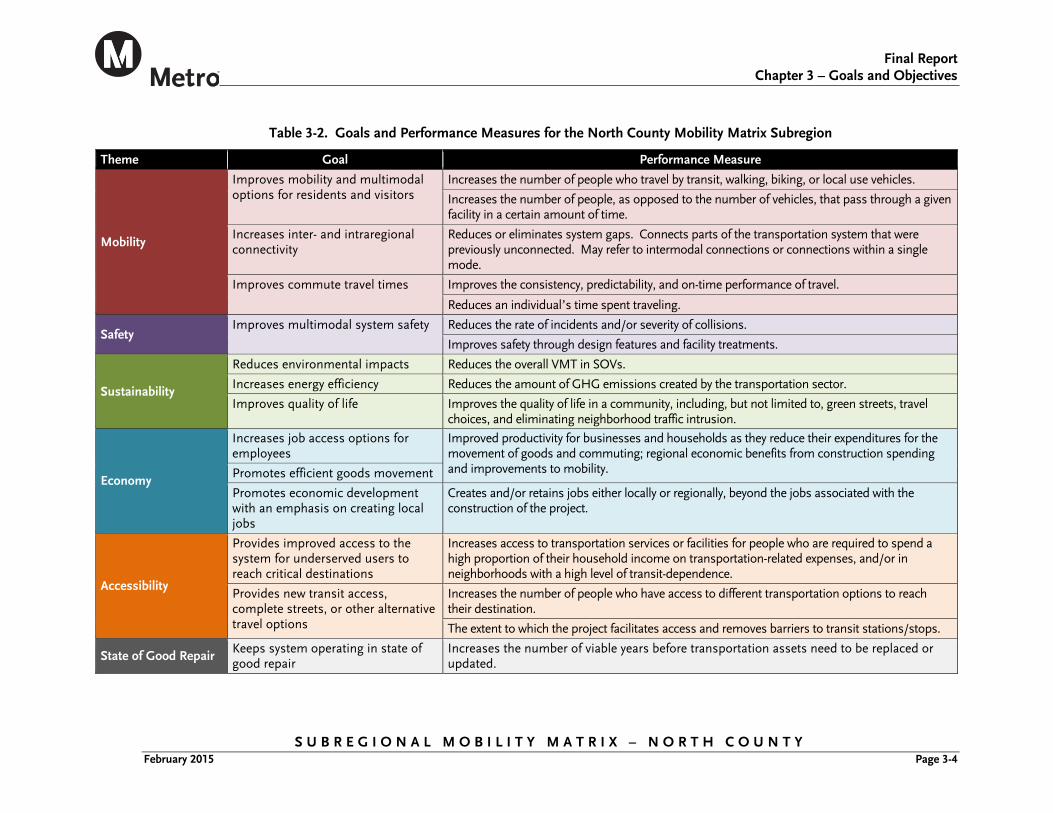
Table 3-2 lists the goals and performance measure for each goal.
3.2.1 North County Goal Statements
Goal #1. Increase Multimodal Mobility Options for North County Residents, Visitors, and Businesses
North County’s transportation investments and policies should focus on maximizing mobility options to improve both inter- and intraregional connectivity.
Goal #2. Make Transportation Investments that Address Current Needs and Anticipate Future Opportunities
North County should take advantage of its unique geographic location, population and development characteristics, and industry clusters to address existing needs and position the region for future opportunities.
Goal #3. Coordinate Implementation of Multimodal Improvements that Support Subregional Economic Development Goals
North County should encourage coordination, communication, and collaboration among subregional stakeholders to ensure that investment decisions are coordinated and reflect subregional transportation, land use, and economic development goals.
Goal #4. Ensure that Investments Balance Mobility, Environmental Sustainability, and Quality of Life
North County should implement fiscally responsible transportation improvements that improve safety, capacity, energy efficiency, and connectivity, while minimizing impacts to the natural environment and overall quality of life.
Goal #5. Maintain and Preserve the Transportation System
North County should continue to develop and implement projects and programs that protect its existing investments and allow the transportation system to operate in a state of good repair.
Final Report
Chapter 3 – Goals and Objectives
S U B R E G I O N A L M O B I L I T Y M A T R I X – N O R T H C O U N T Y February 2015 Page 3-4
Table 3-2. Goals and Performance Measures for the North County Mobility Matrix Subregion
Theme Goal Performance Measure
Mobility
Improves mobility and multimodal options for residents and visitors
Increases the number of people who travel by transit, walking, biking, or local use vehicles.
Increases the number of people, as opposed to the number of vehicles, that pass through a given facility in a certain amount of time.
Increases inter- and intraregional connectivity
Reduces or eliminates system gaps. Connects parts of the transportation system that were previously unconnected. May refer to intermodal connections or connections within a single mode.
Improves commute travel times Improves the consistency, predictability, and on-time performance of travel.
Reduces an individual’s time spent traveling.
Safety Improves multimodal system safety Reduces the rate of incidents and/or severity of collisions.
Improves safety through design features and facility treatments.
Sustainability
Reduces environmental impacts Reduces the overall VMT in SOVs.
Increases energy efficiency Reduces the amount of GHG emissions created by the transportation sector.
Improves quality of life Improves the quality of life in a community, including, but not limited to, green streets, travel choices, and eliminating neighborhood traffic intrusion.
Economy
Increases job access options for employees
Improved productivity for businesses and households as they reduce their expenditures for the movement of goods and commuting; regional economic benefits from construction spending and improvements to mobility. Promotes efficient goods movement
Promotes economic development with an emphasis on creating local jobs
Creates and/or retains jobs either locally or regionally, beyond the jobs associated with the construction of the project.
Accessibility
Provides improved access to the system for underserved users to reach critical destinations
Increases access to transportation services or facilities for people who are required to spend a high proportion of their household income on transportation-related expenses, and/or in neighborhoods with a high level of transit-dependence.
Provides new transit access, complete streets, or other alternative travel options
Increases the number of people who have access to different transportation options to reach their destination.
The extent to which the project facilitates access and removes barriers to transit stations/stops.
State of Good Repair Keeps system operating in state of good repair
Increases the number of viable years before transportation assets need to be replaced or updated.
Final Report
Chapter 4 – Subregional Mobility Matrix
S U B R E G I O N A L M O B I L I T Y M A T R I X – N O R T H C O U N T Y February 2015 Page 4-1
4.0 SUBREGIONAL MOBILITY MATRIX
An initial North County Mobility Matrix project and program list was compiled from Metro’s December 2013 subregional project lists, which included unfunded LRTP projects, unfunded Measure R scope elements, and subregional needs submitted in response to requests by Directors Antonovich and Dubois. The project and program list was updated through the outreach process to incorporate input from the PDT members and other subregion stakeholders. The list reflects not only the transportation needs within the jurisdictions, but also includes many projects with wider subregional and regional impacts.
This chapter summarizes the transportation needs of the North County Mobility Matrix Subregion, as demonstrated by the project and program list, and describes the high-level evaluation of project and program performance.
4.1 Project List A total of 356 projects and programs were identified for the North County Mobility Matrix subregion, including projects with detailed descriptions and defined geographic boundaries and broad categorical programs or ongoing transportation investments. Due to the subregional scale of the study, many of the smaller projects were combined or grouped together into larger programs or consolidated improvements for ease of analysis, while some of the larger improvements were maintained as individual projects. The 356 projects and programs are divided into six program types and further grouped into 21 subprograms for the purposes of the project evaluation
described later in this section. The six program types include:
Active Transportation Program
Arterial Program
Goods Movement Program
Highway Program
Multimodal Program
Transit Program
The North County Mobility Matrix project list includes a wide variety of transportation improvements that are consistent with the priorities identified in Chapter 3.0.
The project list includes projects from countywide planning documents and from local jurisdictions, including the Cities of Lancaster and Palmdale, the Los Angeles County Department of Public Works, AVTA, Caltrans, and Metrolink. Arterial improvements and programs compose about one-third of the project list and active transportation projects make up nearly another third. Highway and transit projects make up a significant portion of the remaining project/program list.
The project/program list includes improvements that address both existing deficiencies in the system, as well as future transportation needs. For instance, it includes improvements to Pearblossom Highway, an important east-west freight corridor that is in need of rehabilitation and enhancement. Additionally, the list contains many improvements that seek to mitigate future bottlenecks before they become problematic, such as new arterials and road widening projects. North County’s population growth rate is higher than any other subregion in the
Final Report
Chapter 4 – Subregional Mobility Matrix
S U B R E G I O N A L M O B I L I T Y M A T R I X – N O R T H C O U N T Y February 2015 Page 4-2
County, and stakeholders in the subregion are committed to proactively ensuring the transportation system can support the expected growth.
The North County Mobility Matrix project/program list addresses the subregional demand for commute travel from the Antelope Valley to the Santa Clarita Valley and the Los Angeles Basin. This includes 41 proposed enhancements on the Metrolink Antelope Valley Line, increased commuter and shuttle bus service, expanded park-and-ride facilities, and upgrades to the SR 14 corridor for improved vehicular travel times and reliability. The upgrades are intended to keep the transportation system functioning smoothly in the future so that the subregion can retain and attract business and development.
The North County Mobility Matrix list seeks to increase sustainability and improve the quality of life through the expansion of the multimodal transportation network. North County’s project/program list places an emphasis on increasing facilities for bicycle and pedestrian travel, collectively referred to as Active Transportation. The subregion benefits from more available land than other parts of the County. Local jurisdictions submitted many proposed bicycle routes, lanes, and paths; and expressed a desire to build out a comprehensive bicycle network before road widths and land uses become limiting. Increasing pedestrian accessibility and safety is a priority of the subregion. The list contains specific pedestrian treatments and ongoing programs to improve walkability within the subregion.
Also included are projects and programs that manage system demand through technology applications and multimodal improvements. These include high-
occupancy vehicle (HOV) lanes, intelligent transportation systems (ITS), park-and-ride facilities, circulation improvements for transit access, and expanded transit services.
The list includes state of good repair projects and programs that address the subregional, and countywide, priority to preserve the existing transportation system and infrastructure and to extend the life of existing and future transportation assets.
A prior iteration of the list contained one project, the People Mover to the Palmdale Regional Airport, which has been removed from the North County Mobility Matrix list and added to the Regional Facilities report.
A full list of the projects and programs can be found in Appendix C. Figure 4-1 presents a map of the North County Mobility Matrix projects and programs, where sufficient information was available to map. The numbers on the map correspond to the Project ID in Appendix C.
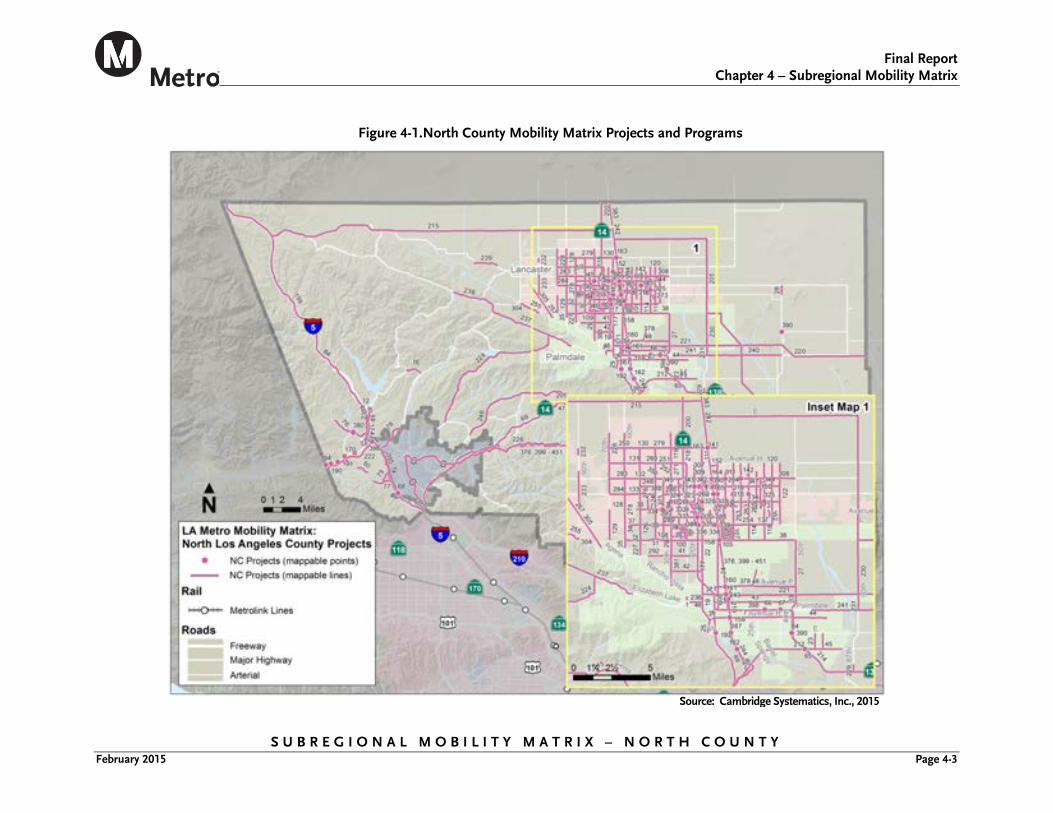
Final Report
Chapter 4 – Subregional Mobility Matrix
S U B R E G I O N A L M O B I L I T Y M A T R I X – N O R T H C O U N T Y February 2015 Page 4-3
Figure 4-1.North County Mobility Matrix Projects and Programs
Source: Cambridge Systematics, Inc., 2015
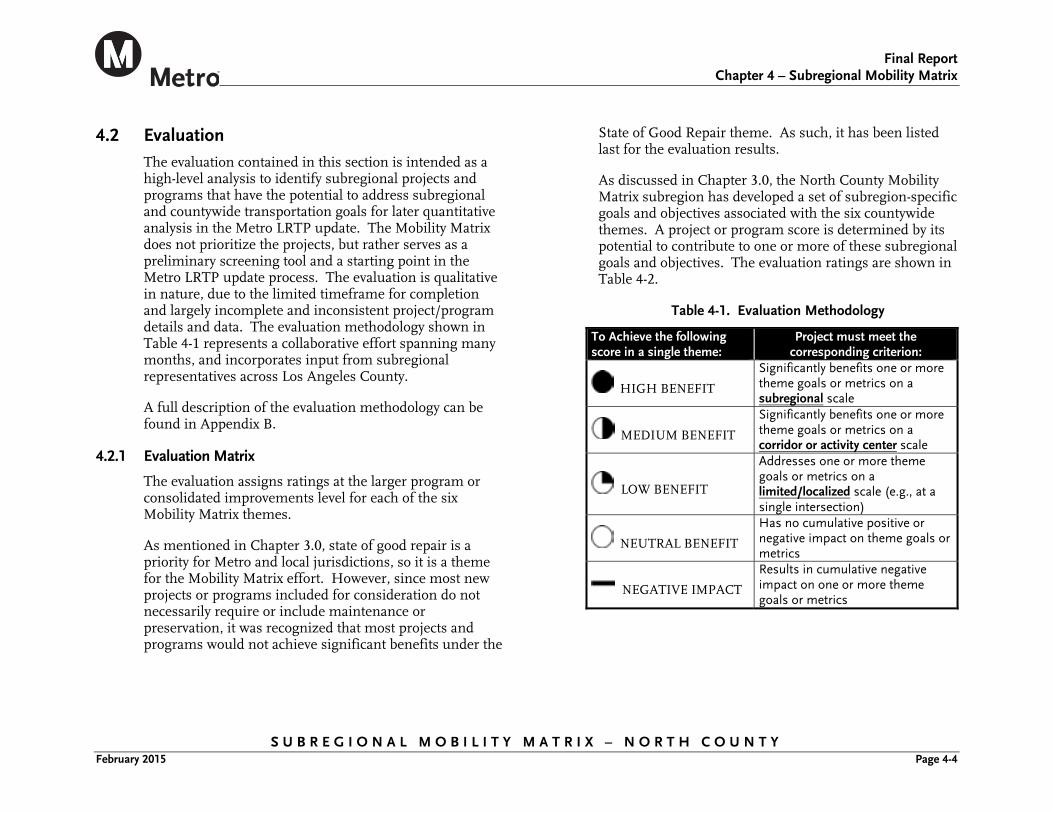
Final Report
Chapter 4 – Subregional Mobility Matrix
S U B R E G I O N A L M O B I L I T Y M A T R I X – N O R T H C O U N T Y February 2015 Page 4-4
4.2 Evaluation The evaluation contained in this section is intended as a high-level analysis to identify subregional projects and programs that have the potential to address subregional and countywide transportation goals for later quantitative analysis in the Metro LRTP update. The Mobility Matrix does not prioritize the projects, but rather serves as a preliminary screening tool and a starting point in the Metro LRTP update process. The evaluation is qualitative in nature, due to the limited timeframe for completion and largely incomplete and inconsistent project/program details and data. The evaluation methodology shown in Table 4-1 represents a collaborative effort spanning many months, and incorporates input from subregional representatives across Los Angeles County.
A full description of the evaluation methodology can be found in Appendix B.
4.2.1 Evaluation Matrix
The evaluation assigns ratings at the larger program or consolidated improvements level for each of the six Mobility Matrix themes.
As mentioned in Chapter 3.0, state of good repair is a priority for Metro and local jurisdictions, so it is a theme for the Mobility Matrix effort. However, since most new projects or programs included for consideration do not necessarily require or include maintenance or preservation, it was recognized that most projects and programs would not achieve significant benefits under the
State of Good Repair theme. As such, it has been listed last for the evaluation results.
As discussed in Chapter 3.0, the North County Mobility Matrix subregion has developed a set of subregion-specific goals and objectives associated with the six countywide themes. A project or program score is determined by its potential to contribute to one or more of these subregional goals and objectives. The evaluation ratings are shown in Table 4-2.
Table 4-1. Evaluation Methodology
To Achieve the following score in a single theme:
Project must meet the corresponding criterion:
HIGH BENEFIT
Significantly benefits one or more theme goals or metrics on a subregional scale
MEDIUM BENEFIT
Significantly benefits one or more theme goals or metrics on a corridor or activity center scale
LOW BENEFIT
Addresses one or more theme goals or metrics on a limited/localized scale (e.g., at a single intersection)
NEUTRAL BENEFIT
Has no cumulative positive or negative impact on theme goals or metrics
NEGATIVE IMPACT
Results in cumulative negative impact on one or more theme goals or metrics
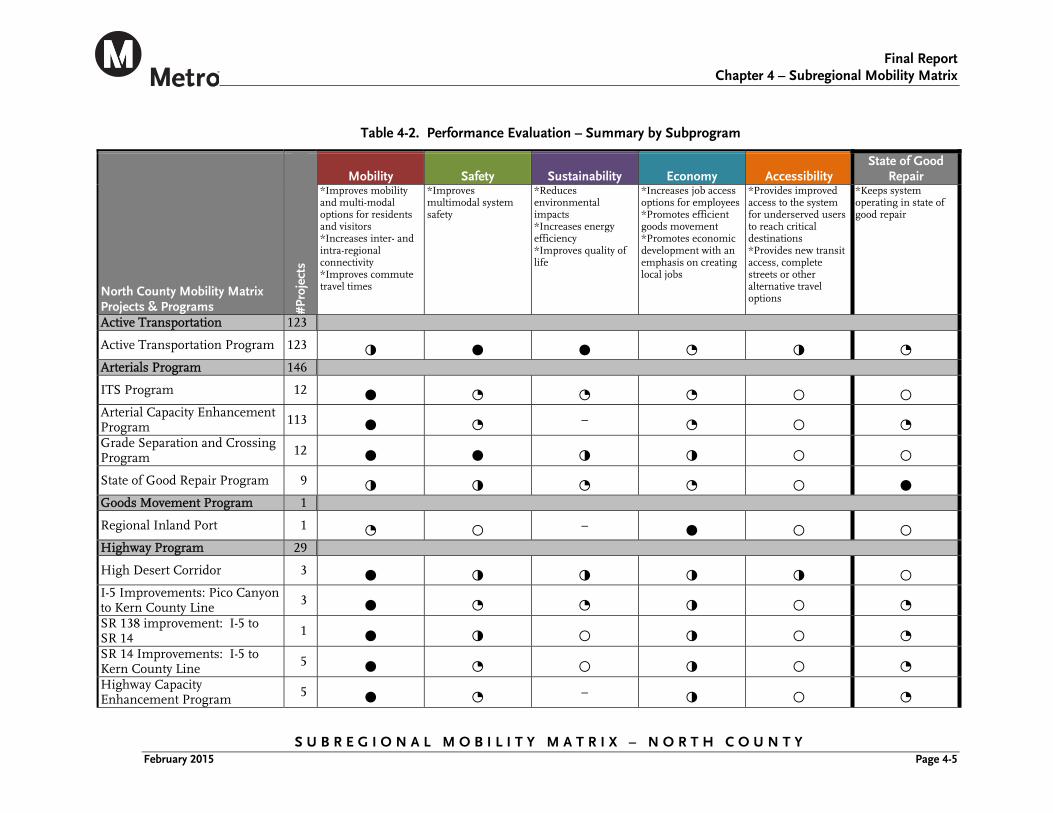
Final Report
Chapter 4 – Subregional Mobility Matrix
S U B R E G I O N A L M O B I L I T Y M A T R I X – N O R T H C O U N T Y February 2015 Page 4-5
Table 4-2. Performance Evaluation – Summary by Subprogram
North County Mobility Matrix Projects & Programs #P
roje
cts
Mobility Safety Sustainability Economy Accessibility State of Good
Repair *Improves mobility and multi-modal options for residents and visitors *Increases inter- and intra-regional connectivity *Improves commute travel times
*Improves multimodal system safety
*Reduces environmental impacts *Increases energy efficiency *Improves quality of life
*Increases job access options for employees *Promotes efficient goods movement *Promotes economic development with an emphasis on creating local jobs
*Provides improved access to the system for underserved users to reach critical destinations *Provides new transit access, complete streets or other alternative travel options
*Keeps system operating in state of good repair
Active Transportation 123
Active Transportation Program 123 ◑ ● ● ◔ ◑ ◔ Arterials Program 146
ITS Program 12 ● ◔ ◔ ◔ ○ ○ Arterial Capacity Enhancement Program 113 ● ◔ – ◔ ○ ◔ Grade Separation and Crossing Program 12 ● ● ◑ ◑ ○ ○
State of Good Repair Program 9 ◑ ◑ ◔ ◔ ○ ● Goods Movement Program 1
Regional Inland Port 1 ◔ ○ – ● ○ ○ Highway Program 29
High Desert Corridor 3 ● ◑ ◑ ◑ ◑ ○ I-5 Improvements: Pico Canyon to Kern County Line 3 ● ◔ ◔ ◑ ○ ◔ SR 138 improvement: I-5 to SR 14 1 ● ◑ ○ ◑ ○ ◔ SR 14 Improvements: I-5 to Kern County Line 5 ● ◔ ○ ◑ ○ ◔ Highway Capacity Enhancement Program 5 ● ◔ – ◑ ○ ◔
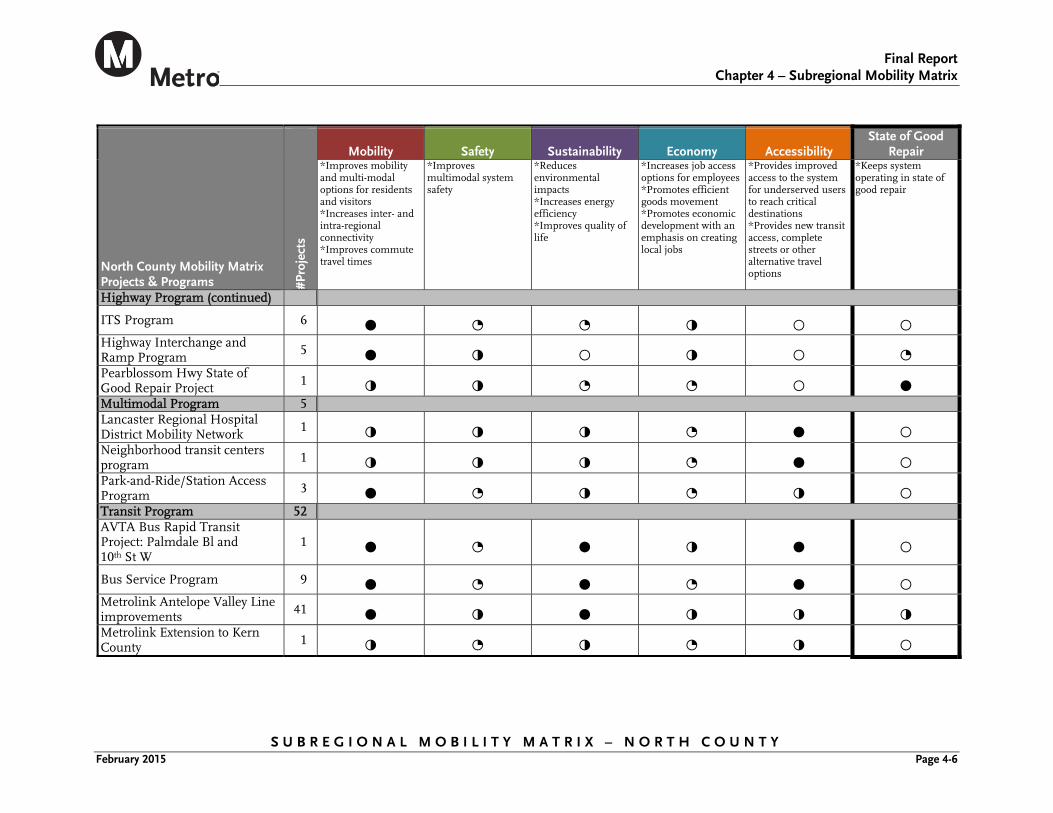
Final Report
Chapter 4 – Subregional Mobility Matrix
S U B R E G I O N A L M O B I L I T Y M A T R I X – N O R T H C O U N T Y February 2015 Page 4-6
North County Mobility Matrix Projects & Programs #P
roje
cts
Mobility Safety Sustainability Economy Accessibility State of Good
Repair *Improves mobility and multi-modal options for residents and visitors *Increases inter- and intra-regional connectivity *Improves commute travel times
*Improves multimodal system safety
*Reduces environmental impacts *Increases energy efficiency *Improves quality of life
*Increases job access options for employees *Promotes efficient goods movement *Promotes economic development with an emphasis on creating local jobs
*Provides improved access to the system for underserved users to reach critical destinations *Provides new transit access, complete streets or other alternative travel options
*Keeps system operating in state of good repair
Highway Program (continued)
ITS Program 6 ● ◔ ◔ ◑ ○ ○ Highway Interchange and Ramp Program 5 ● ◑ ○ ◑ ○ ◔ Pearblossom Hwy State of Good Repair Project 1 ◑ ◑ ◔ ◔ ○ ● Multimodal Program 5 Lancaster Regional Hospital District Mobility Network 1 ◑ ◑ ◑ ◔ ● ○ Neighborhood transit centers program 1 ◑ ◑ ◑ ◔ ● ○ Park-and-Ride/Station Access Program 3 ● ◔ ◑ ◔ ◑ ○ Transit Program 52 AVTA Bus Rapid Transit Project: Palmdale Bl and 10th St W
1 ● ◔ ● ◑ ● ○
Bus Service Program 9 ● ◔ ● ◔ ● ○ Metrolink Antelope Valley Line improvements 41 ● ◑ ● ◑ ◑ ◑ Metrolink Extension to Kern County 1 ◑ ◔ ◑ ◔ ◑ ○
Final Report
Chapter 5 – Implementation Timeframes and Cost Estimation
S U B R E G I O N A L M O B I L I T Y M A T R I X – N O R T H C O U N T Y February 2015 Page 4-7
4.3 Findings Overall, most projects and programs perform well under one or two Mobility Matrix themes, while also providing some secondary benefits in other themes. Some projects and programs have multiple neutral/no benefit scores, but that does not mean they do not provide benefits; rather, those projects or programs tend to be tightly focused on one theme. The Mobility Matrix evaluation does not involve any prioritization, but is intended as a preliminary screening tool only, for use as a starting point in the Metro LRTP update process. The intent of this evaluation is to simply identify subregional projects and programs with the potential to address subregional and countywide transportation goals for later quantitative analysis.
4.3.1 Mobility
Most of the North County transportation improvement programs subprogram score well under the Mobility theme. The primary purpose of many transportation projects is to relieve congestion or provide alternative travel options to improve travel times or system reliability. The highway and arterial capacity enhancement, transportation system management (TSM), and managed lane programs help to relieve congestion or create redundancy for the primary subregional roadways. The transit expansion programs provide improvements to travel times and system reliability. Active transportation and locally oriented improvements provide moderate benefit to subregional mobility. Individual projects may close gaps in modal connectivity, and taken as a whole, these improvements will provide important mobility benefits to a diverse group of users in North County.
4.3.2 Safety
Improved safety is often a byproduct of projects and programs with mobility goals. Grade separation and active transportation score high benefits under the safety theme by separating user groups and removing the potential for conflicts. Many of the proposed bicycle facilities are in areas with high incidents of collisions involving bicyclists and pedestrians. Additionally, the active transportation program includes the Safe Routes to School Programs, the only safety-specific projects on the project list. State of good repair projects and roadway improvement projects enhance vehicular safety by eliminating dangerous or unpredictable road surfaces.
4.3.3 Sustainability
Projects that reduce GHG emissions or improve air quality score positively under the Sustainability theme. Active transportation and transit programs receive high scores in Sustainability because they facilitate travel by modes other than SOV. Similarly, programs receiving a moderate benefit score offer alternatives to SOV travel, but do not offer the breadth of impact of the transit and active transportation programs. Other projects received low benefit scores owing to decreased emissions from reduced vehicle idling.
4.3.4 Economy
Increased economic development and fiscal sustainability are high priorities for the North County Mobility Matrix subregion. Transportation investments can increase economic activity by connecting people to jobs or by improving the flow of goods or services. The only project to score a high benefit under the Economy theme is the Regional Inland Port, which, if deemed economically
Final Report
Chapter 5 – Implementation Timeframes and Cost Estimation
S U B R E G I O N A L M O B I L I T Y M A T R I X – N O R T H C O U N T Y February 2015 Page 4-8
viable, has the potential to create many long-term direct and indirect jobs. Other projects and programs received moderate benefits scores in Economy by increasing job access and improving travel times for commuters and goods.
4.3.5 Accessibility
Projects that allow underserved users to access critical destinations scored well under the Accessibility theme. Increasing transit services by expanding the transit network or reducing transit headways provide a high
benefit to subregional accessibility goals. Projects and programs that facilitate more safe and convenient access to transit on an area or corridor level received moderate benefit scores (e.g. station access programs).
4.3.6 State of Good Repair
The projects and programs specifically intended for maintaining existing assets are the only two programs that scored a high benefit for the State of Good Repair theme. Within the State of Good Repair subprogram, there are pavement, bridge, and sidewalk preservation programs. Projects that added new capacity without rehabilitation of existing assets received neutral scores.
Final Report
Chapter 5 – Implementation Timeframes and Cost Estimation
S U B R E G I O N A L M O B I L I T Y M A T R I X – N O R T H C O U N T Y February 2015 Page 5-1
5.0 IMPLEMENTATION TIMEFRAMES
The projects and programs described in Chapter 4.0 were categorized into the three different timeframes based on a number of factors, including project readiness, need, funding availability or potential, and phasing. A 20-plus year timeframe was used as the basis for categorizing projects, with breakpoints at the 10- and 20-year timeframes. The timeframes correspond to when the projects are anticipated to be completed and in operation. Some projects/programs span multiple timeframes, particularly those involving ongoing operations or maintenance.
Metro, Mobility Matrix consultants, PDT members, local jurisdictions, and other stakeholders worked collaboratively to determine project implementation timeframes. Table 5-1 presents the categorization for the North County project/program categories. A full description of the categorization methodology can be found in Appendix B.
The larger, stand-alone projects have been categorized into the likely timeframe of completion, or phased across multiple timeframes. Most of the subprograms in the North County are categorized for short-, mid-, and long-term implementation timeframes. Most of the projects identified within those subprograms are short-term improvements intended to address existing deficiencies. For Arterials Capacity Enhancement, Grade Separations, and Active Transportation, the number of projects and costs were spread across all three time periods. For other subprograms, it was assumed that there would be additional mid- and long-term projects identified in future years. The emphasis on the shorter term is partially a
result of the bottoms-up approach; whereby local jurisdictions submitted projects/programs intended to address their immediate needs.
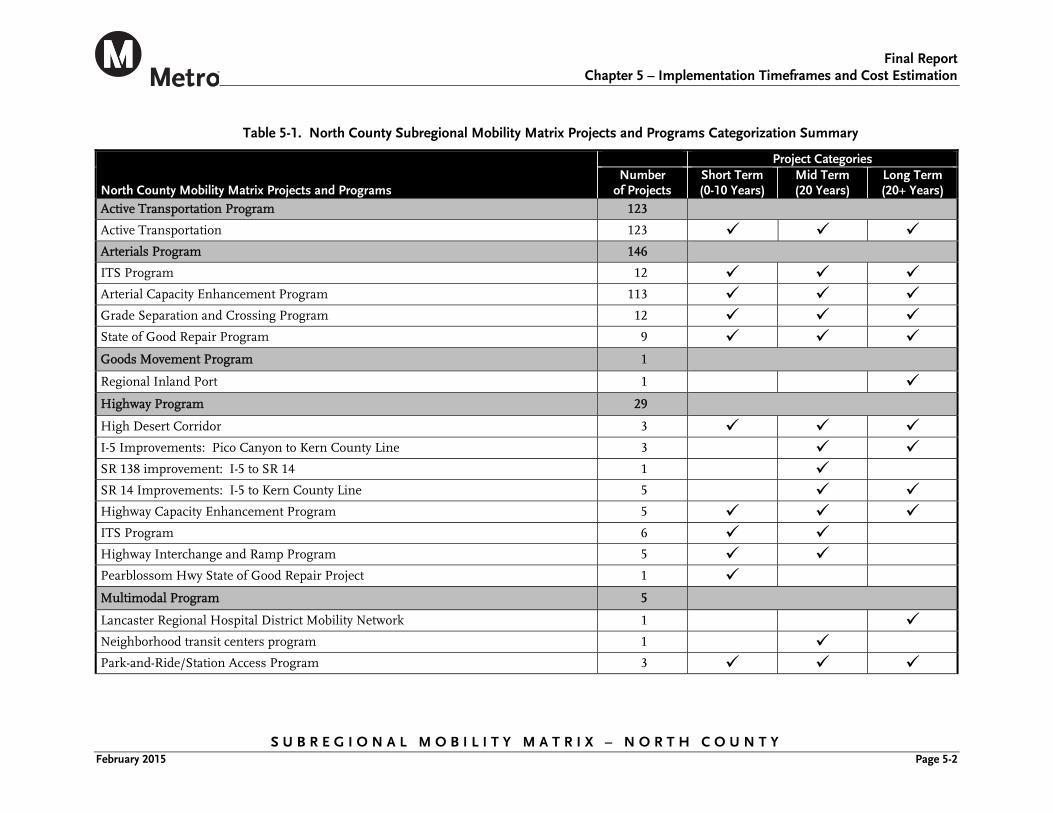
Final Report
Chapter 5 – Implementation Timeframes and Cost Estimation
S U B R E G I O N A L M O B I L I T Y M A T R I X – N O R T H C O U N T Y February 2015 Page 5-2
Table 5-1. North County Subregional Mobility Matrix Projects and Programs Categorization Summary
North County Mobility Matrix Projects and Programs
Project Categories Number
of Projects Short Term (0-10 Years)
Mid Term (20 Years)
Long Term (20+ Years)
Active Transportation Program 123 Active Transportation 123 Arterials Program 146 ITS Program 12 Arterial Capacity Enhancement Program 113 Grade Separation and Crossing Program 12 State of Good Repair Program 9 Goods Movement Program 1
Regional Inland Port 1 Highway Program 29
High Desert Corridor 3 I-5 Improvements: Pico Canyon to Kern County Line 3 SR 138 improvement: I-5 to SR 14 1 SR 14 Improvements: I-5 to Kern County Line 5 Highway Capacity Enhancement Program 5 ITS Program 6 Highway Interchange and Ramp Program 5 Pearblossom Hwy State of Good Repair Project 1 Multimodal Program 5
Lancaster Regional Hospital District Mobility Network 1 Neighborhood transit centers program 1 Park-and-Ride/Station Access Program 3
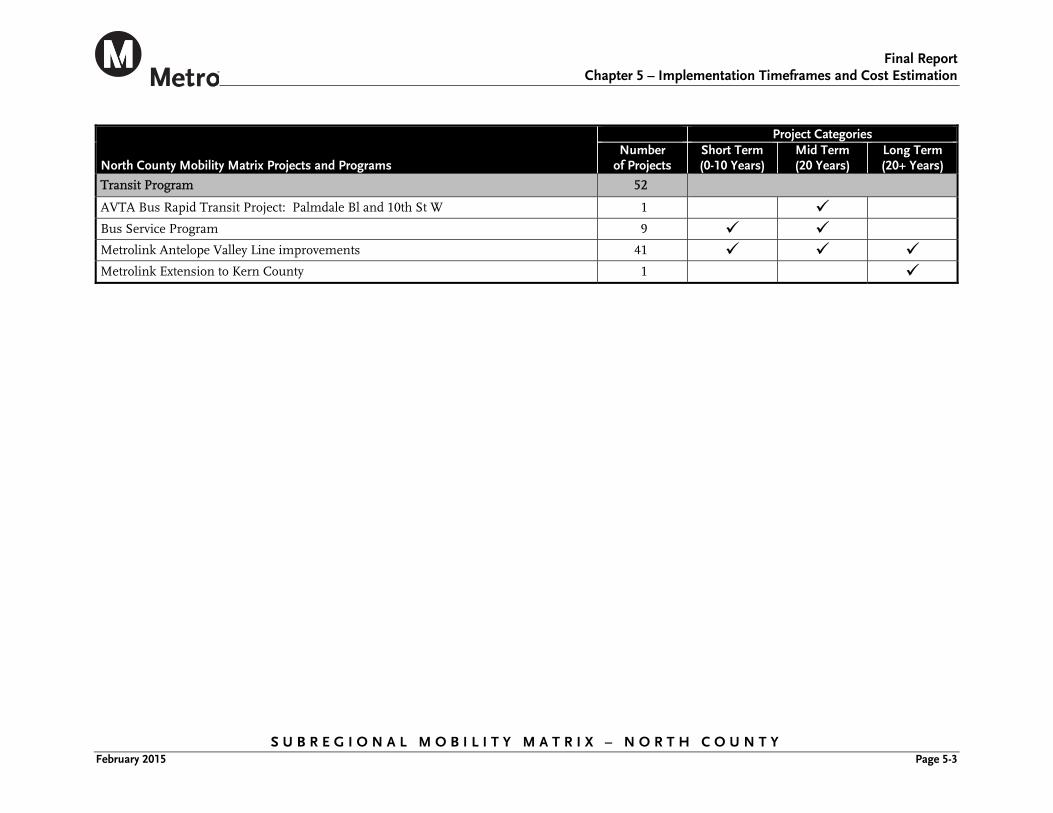
Final Report
Chapter 5 – Implementation Timeframes and Cost Estimation
S U B R E G I O N A L M O B I L I T Y M A T R I X – N O R T H C O U N T Y February 2015 Page 5-3
North County Mobility Matrix Projects and Programs
Project Categories Number
of Projects Short Term (0-10 Years)
Mid Term (20 Years)
Long Term (20+ Years)
Transit Program 52
AVTA Bus Rapid Transit Project: Palmdale Bl and 10th St W 1 Bus Service Program 9 Metrolink Antelope Valley Line improvements 41 Metrolink Extension to Kern County 1
Final Report
Chapter 5 – Implementation Timeframes and Cost Estimation
S U B R E G I O N A L M O B I L I T Y M A T R I X – N O R T H C O U N T Y February 2015 Page 5-4
5.1 Cost Estimates This chapter contains the North County Mobility Matrix cost range estimates at the summary program level. Due to variations in project scope and available cost data, costs estimated for use in the Mobility Matrix are not intended to be used for future project-level planning. Rather, the cost ranges developed via this process constitute a high-level, rough order-of-magnitude planning estimate range for short-, mid-, and long-term subregional funding needs for the Mobility Matrix effort only. For the most part, these estimates do not include vehicles, operating, maintenance and financing costs. More detailed analysis will be conducted in the Metro LRTP update process, which may necessitate refinement of project/program details and associated cost estimates.
For consistency, all estimated project and program costs were reported in year 2015 dollars, as this is the base year of the 2014 Metro SRTP. Estimates from prior years were escalated to year 2015 dollars at a three-percent annual rate. A full description of the cost estimation methodology can be found in Appendix B.
Since the list was compiled from various sources, some of the projects in the list overlap in their scope or purpose, leading to some duplicative costs in the cost matrix. Projects or programs that cross subregional boundaries may be included in multiple subregional project lists. Where the same projects or programs are included in multiple subregions, the cost estimates include the total estimated project cost, not the cost share for each subregion. The cost sharing will be determined as part of future efforts.
Finally, due to lack of available data and the short timeframe of the Mobility Matrix effort, some of the projects and programs have missing cost estimates or do not include operations and maintenance (O&M) costs. Where O&M costs were available, they were included for the applicable timeframes. O&M costs will be revisited as part of the Metro LRTP update.
Table 5-2 shows the estimated cost ranges for each North County subprogram, divided into the three time periods. For subprograms with many projects on the project list, such as Arterials Capacity Enhancement and Active Transportation, the project costs on the list were spread across all three time periods. For other subprograms with needs anticipated in future timeframes, such as Arterial ITS and State of Good Repair, the short-term project costs have also been applied to future years.
The table also contains columns showing the total number of projects within the program, as well as the number of projects with available cost estimates. This indicates which programs have low cost estimate range values due to unavailable cost data. Project costs were provided or estimated for all subprograms except for SR 14 Improvements: I-5 to Kern County Line, Pearblossom Highway State of Good Repair Project, and the Park-and-Ride/Station Access Program. Table 5-3 summarizes the range of cost estimates, by time period and project type.
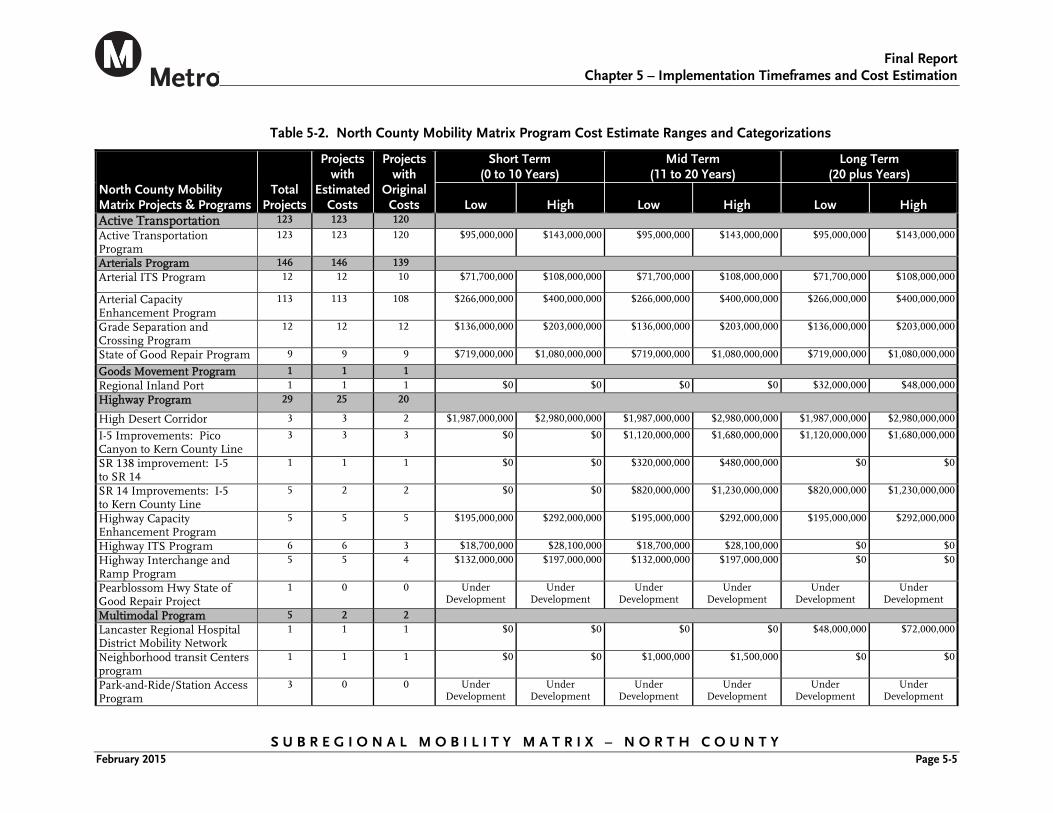
Final Report
Chapter 5 – Implementation Timeframes and Cost Estimation
S U B R E G I O N A L M O B I L I T Y M A T R I X – N O R T H C O U N T Y February 2015 Page 5-5
Table 5-2. North County Mobility Matrix Program Cost Estimate Ranges and Categorizations
North County Mobility Matrix Projects & Programs
Total Projects
Projects with
Estimated Costs
Projects with
Original Costs
Short Term (0 to 10 Years)
Mid Term (11 to 20 Years)
Long Term (20 plus Years)
Low High Low High Low High Active Transportation 123 123 120 Active Transportation Program
123 123 120 $95,000,000 $143,000,000 $95,000,000 $143,000,000 $95,000,000 $143,000,000
Arterials Program 146 146 139 Arterial ITS Program 12 12 10 $71,700,000 $108,000,000 $71,700,000 $108,000,000 $71,700,000 $108,000,000
Arterial Capacity Enhancement Program
113 113 108 $266,000,000 $400,000,000 $266,000,000 $400,000,000 $266,000,000 $400,000,000
Grade Separation and Crossing Program
12 12 12 $136,000,000 $203,000,000 $136,000,000 $203,000,000 $136,000,000 $203,000,000
State of Good Repair Program 9 9 9 $719,000,000 $1,080,000,000 $719,000,000 $1,080,000,000 $719,000,000 $1,080,000,000
Goods Movement Program 1 1 1 Regional Inland Port 1 1 1 $0 $0 $0 $0 $32,000,000 $48,000,000 Highway Program 29 25 20
High Desert Corridor 3 3 2 $1,987,000,000 $2,980,000,000 $1,987,000,000 $2,980,000,000 $1,987,000,000 $2,980,000,000
I-5 Improvements: Pico Canyon to Kern County Line
3 3 3 $0 $0 $1,120,000,000 $1,680,000,000 $1,120,000,000 $1,680,000,000
SR 138 improvement: I-5 to SR 14
1 1 1 $0 $0 $320,000,000 $480,000,000 $0 $0
SR 14 Improvements: I-5 to Kern County Line
5 2 2 $0 $0 $820,000,000 $1,230,000,000 $820,000,000 $1,230,000,000
Highway Capacity Enhancement Program
5 5 5 $195,000,000 $292,000,000 $195,000,000 $292,000,000 $195,000,000 $292,000,000
Highway ITS Program 6 6 3 $18,700,000 $28,100,000 $18,700,000 $28,100,000 $0 $0 Highway Interchange and Ramp Program
5 5 4 $132,000,000 $197,000,000 $132,000,000 $197,000,000 $0 $0
Pearblossom Hwy State of Good Repair Project
1 0 0 Under Development
Under Development
Under Development
Under Development
Under Development
Under Development
Multimodal Program 5 2 2 Lancaster Regional Hospital District Mobility Network
1 1 1 $0 $0 $0 $0 $48,000,000 $72,000,000
Neighborhood transit Centers program
1 1 1 $0 $0 $1,000,000 $1,500,000 $0 $0
Park-and-Ride/Station Access Program
3 0 0 Under Development
Under Development
Under Development
Under Development
Under Development
Under Development
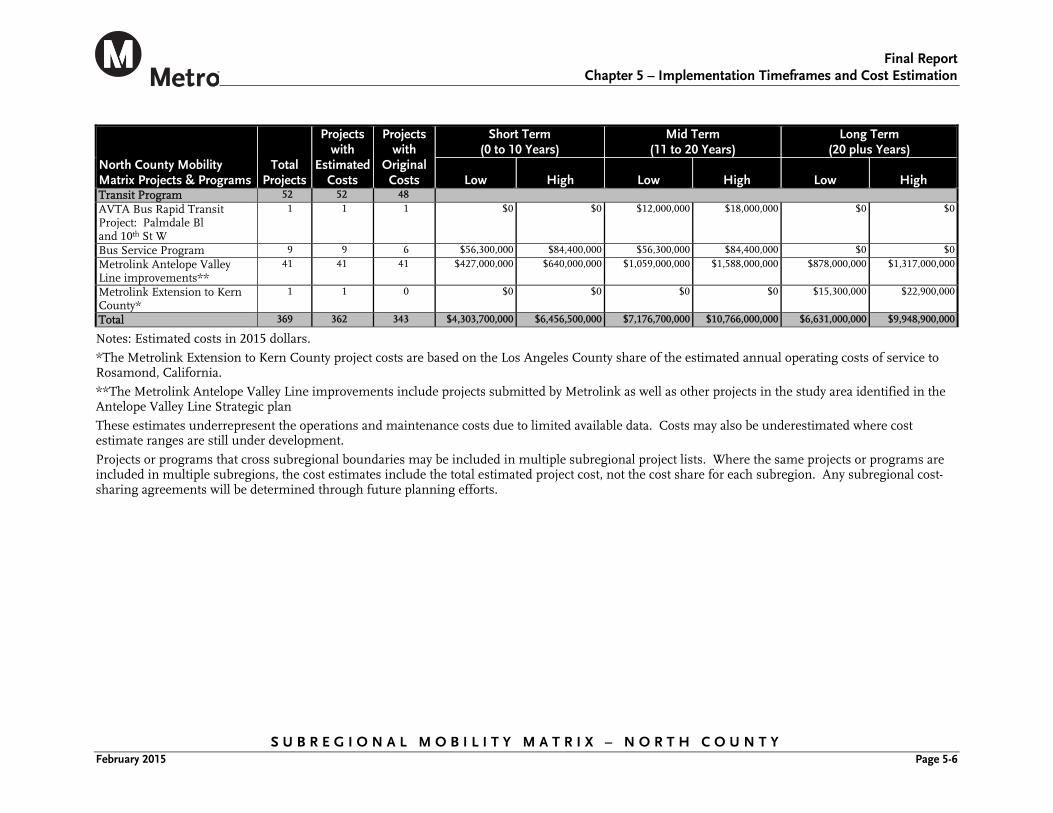
Final Report
Chapter 5 – Implementation Timeframes and Cost Estimation
S U B R E G I O N A L M O B I L I T Y M A T R I X – N O R T H C O U N T Y February 2015 Page 5-6
North County Mobility Matrix Projects & Programs
Total Projects
Projects with
Estimated Costs
Projects with
Original Costs
Short Term (0 to 10 Years)
Mid Term (11 to 20 Years)
Long Term (20 plus Years)
Low High Low High Low High Transit Program 52 52 48 AVTA Bus Rapid Transit Project: Palmdale Bl and 10th St W
1 1 1 $0 $0 $12,000,000 $18,000,000 $0 $0
Bus Service Program 9 9 6 $56,300,000 $84,400,000 $56,300,000 $84,400,000 $0 $0 Metrolink Antelope Valley Line improvements**
41 41 41 $427,000,000 $640,000,000 $1,059,000,000 $1,588,000,000 $878,000,000 $1,317,000,000
Metrolink Extension to Kern County*
1 1 0 $0 $0 $0 $0 $15,300,000 $22,900,000
Total 369 362 343 $4,303,700,000 $6,456,500,000 $7,176,700,000 $10,766,000,000 $6,631,000,000 $9,948,900,000
Notes: Estimated costs in 2015 dollars. *The Metrolink Extension to Kern County project costs are based on the Los Angeles County share of the estimated annual operating costs of service to Rosamond, California. **The Metrolink Antelope Valley Line improvements include projects submitted by Metrolink as well as other projects in the study area identified in the Antelope Valley Line Strategic plan These estimates underrepresent the operations and maintenance costs due to limited available data. Costs may also be underestimated where cost estimate ranges are still under development. Projects or programs that cross subregional boundaries may be included in multiple subregional project lists. Where the same projects or programs are included in multiple subregions, the cost estimates include the total estimated project cost, not the cost share for each subregion. Any subregional cost-sharing agreements will be determined through future planning efforts.
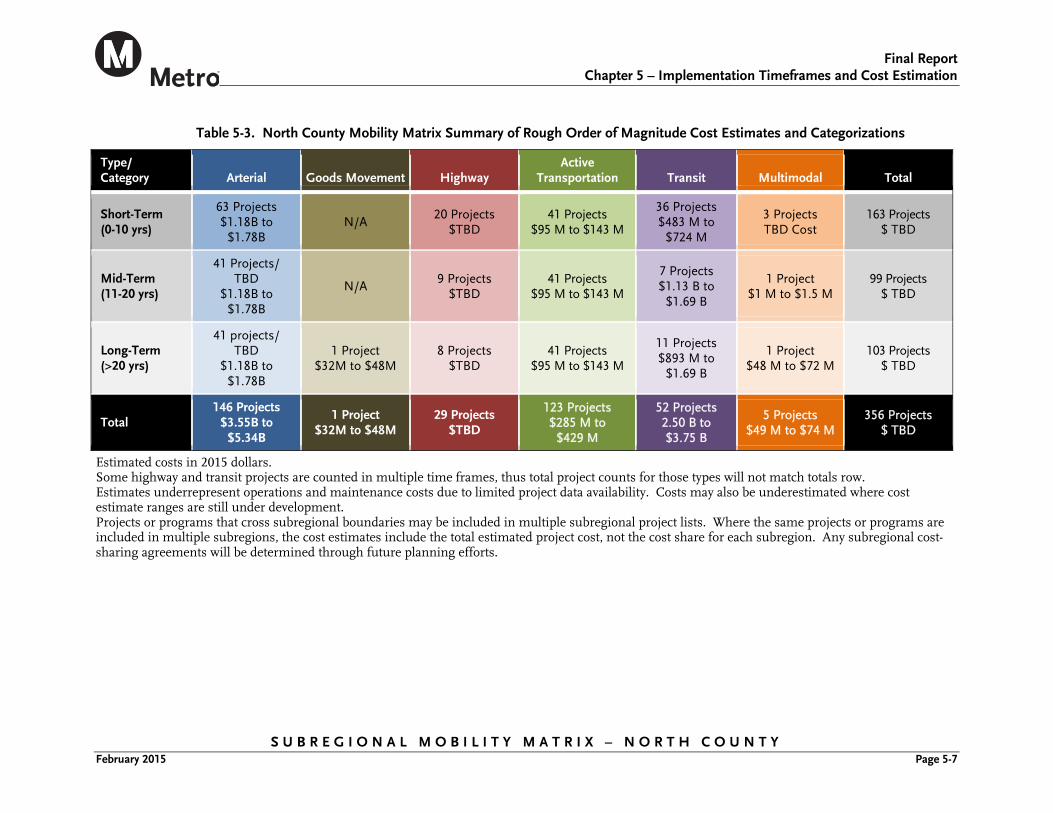
Final Report
Chapter 5 – Implementation Timeframes and Cost Estimation
S U B R E G I O N A L M O B I L I T Y M A T R I X – N O R T H C O U N T Y February 2015 Page 5-7
Table 5-3. North County Mobility Matrix Summary of Rough Order of Magnitude Cost Estimates and Categorizations
Type/ Category Arterial Goods Movement Highway
Active Transportation Transit Multimodal Total
Short-Term (0-10 yrs)
63 Projects $1.18B to
$1.78B N/A
20 Projects $TBD
41 Projects $95 M to $143 M
36 Projects $483 M to
$724 M
3 Projects TBD Cost
163 Projects $ TBD
Mid-Term (11-20 yrs)
41 Projects/ TBD
$1.18B to $1.78B
N/A 9 Projects
$TBD 41 Projects
$95 M to $143 M
7 Projects $1.13 B to
$1.69 B
1 Project $1 M to $1.5 M
99 Projects $ TBD
Long-Term (>20 yrs)
41 projects/ TBD
$1.18B to $1.78B
1 Project $32M to $48M
8 Projects $TBD
41 Projects $95 M to $143 M
11 Projects $893 M to
$1.69 B
1 Project $48 M to $72 M
103 Projects $ TBD
Total 146 Projects
$3.55B to $5.34B
1 Project $32M to $48M
29 Projects $TBD
123 Projects $285 M to
$429 M
52 Projects 2.50 B to $3.75 B
5 Projects $49 M to $74 M
356 Projects $ TBD
Estimated costs in 2015 dollars. Some highway and transit projects are counted in multiple time frames, thus total project counts for those types will not match totals row. Estimates underrepresent operations and maintenance costs due to limited project data availability. Costs may also be underestimated where cost estimate ranges are still under development. Projects or programs that cross subregional boundaries may be included in multiple subregional project lists. Where the same projects or programs are included in multiple subregions, the cost estimates include the total estimated project cost, not the cost share for each subregion. Any subregional cost-sharing agreements will be determined through future planning efforts.
Final Report
Chapter 5 – Implementation Timeframes and Cost Estimation
S U B R E G I O N A L M O B I L I T Y M A T R I X – N O R T H C O U N T Y February 2015 Page 5-8
5.2 Financing the Transportation System 2009 Long Range Transportation Plan and Identified Additional Needs
The 2009 Long Range Transportation Plan (LRTP) lays out a 30-year strategy for keeping Los Angeles County moving and is based on a financial forecast of continued economic growth and moderate inflation. The 2009 LRTP identifies a $297.6 billion investment in Los Angeles County’s transportation system through 2040 and is funded with more than 45 sources of federal, state and local revenue. A majority of funding is locally generated through three half-cent voter initiatives, Propositions A and C and Measure R. These local initiatives, other local sources of revenue such as passenger fares, advertising, real estate rentals, bonding, and competitive grants account for 75 percent of Metro’s 30-year financial forecast. Many more projects and programs are needed in Los Angeles County than the transportation funding is available. These additional needs constitute the Strategic Unfunded Plan. However, both the funded 2009 Plan and the Strategic Unfunded Plan will require new funding in order to add projects and services and/or accelerate projects identified for funding. Metro’s commitment to maintain and improve Los Angeles County’s transportation system will depend on funding availability and strategies for obtaining new or increased funding.
2017 Long Range Transportation Plan Update and Exploration of New Funding Options
The 2017 LRTP will incorporate significant changes that have occurred since the 2009 LRTP was adopted, including changes in economic conditions, growth patterns, and the transportation costs and funding forecast. It is anticipated that this Plan would incorporate
existing 2009 LRTP projects as well as new project initiatives such as those that may be identified by the sub regions through the Mobility Matrices process. As with past LRTPs, this update will include recommendations for constrained (funded) projects as well as strategic (unfunded) projects that could be built if additional funding becomes available, consistent with adopted Metro Board priorities and actions. The LRTP update will revise funding recommendations for various major transportation programs, including funds available to the Call for Projects by funding category, Regional Rail/Metrolink, Access Services and other programs. The Plan will also address state of good repair needs, new requirements for sustainability, and other initiatives and policies not anticipated in the 2009 LRTP.
The 2017 LRTP update includes the exploration of several new funding sources beyond those identified in the 2009 LRTP. Most notable is the exploration of a new transportation sales tax measure that could be considered by Los Angeles County voters as soon as November 2016. Approval of a 2016 transportation sales tax measure could significantly augment the availability of new funding included in the LRTP update and increase the size of the constrained plan. In addition to a new transportation sales tax measure, Metro is continuing the exploration of Public-Private Partnerships and congestion pricing for applicable highway and transit projects. Other new funding sources under consideration include, but are not limited to, land value capture around transit stations and California State Cap & Trade funds.
5.3 What’s Next? The Mobility Matrix is the first step in identifying North County transportation projects and programs that require
Final Report
Chapter 5 – Implementation Timeframes and Cost Estimation
S U B R E G I O N A L M O B I L I T Y M A T R I X – N O R T H C O U N T Y February 2015 Page 5-9
funding. The Mobility Matrix also identifies the subregion’s goals and objectives for their unique needs and geographic considerations. The Mobility Matrix work effort resulted in a subregional, project/program list, as well as estimating those projects and program costs. This important work effort serves as a “bottoms-up” approach towards updating Metro’s LRTP in the future.
Three major next steps should arise out of the Mobility Matrix process:
North County Prioritization of Projects. This Mobility Matrix study does not prioritize projects. Instead, it provides some of the information needed for decision makers to prioritize projects/programs in the next phase of work, and an unconstrained list of all potential transportation projects/programs in the region. In preparation for a potential ballot measure and LRTP update (as described further below), the NCTC should decide how it wants to prioritize these projects/programs assuming a constrained funding scenario.
Metro Ballot Measure Preparations. Metro will continue working with the PDTs of all the Subregions, as it starts developing a potential ballot measure. Part of the ballot measure work would involve geographic equity determination, as well as determining the amount of funding available for each category of projects/programs and subregion of the County.
Metro LRTP Update. The potential ballot measure would then feed into a future Metro LRTP update and be integrated into the LRTP Finance Plan. If additional funding becomes available through a ballot measure or other new funding sources or initiatives,
the list of projects developed through the Mobility Matrix and any subsequent list developed by the subregion could be used to update the constrained project list for the LRTP moving forward.
Final Report
Chapter 6 - Appendices
S U B R E G I O N A L M O B I L I T Y M A T R I X – N O R T H C O U N T Y February 2015 Page 6-1
6.0 APPENDICES
The following appendices provide further information on issues discussed in this document.
Appendix A: Meeting Matrix
Appendix B: Methodology Memorandums
Appendix C: Project Detail Matrix
Appendix D: Baseline Conditions Report
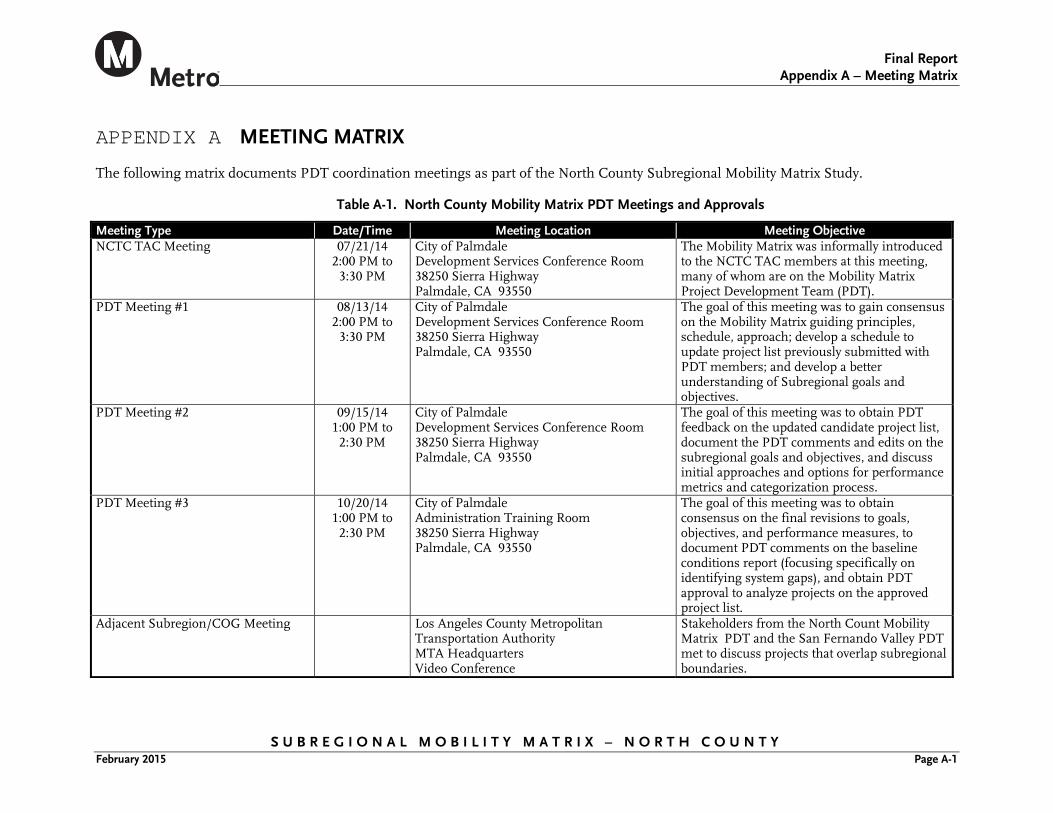
Final Report
Appendix A – Meeting Matrix
S U B R E G I O N A L M O B I L I T Y M A T R I X – N O R T H C O U N T Y February 2015 Page A-1
APPENDIX A MEETING MATRIX
The following matrix documents PDT coordination meetings as part of the North County Subregional Mobility Matrix Study.
Table A-1. North County Mobility Matrix PDT Meetings and Approvals
Meeting Type Date/Time Meeting Location Meeting Objective NCTC TAC Meeting 07/21/14
2:00 PM to 3:30 PM
City of Palmdale Development Services Conference Room 38250 Sierra Highway Palmdale, CA 93550
The Mobility Matrix was informally introduced to the NCTC TAC members at this meeting, many of whom are on the Mobility Matrix Project Development Team (PDT).
PDT Meeting #1 08/13/14 2:00 PM to
3:30 PM
City of Palmdale Development Services Conference Room 38250 Sierra Highway Palmdale, CA 93550
The goal of this meeting was to gain consensus on the Mobility Matrix guiding principles, schedule, approach; develop a schedule to update project list previously submitted with PDT members; and develop a better understanding of Subregional goals and objectives.
PDT Meeting #2 09/15/14 1:00 PM to
2:30 PM
City of Palmdale Development Services Conference Room 38250 Sierra Highway Palmdale, CA 93550
The goal of this meeting was to obtain PDT feedback on the updated candidate project list, document the PDT comments and edits on the subregional goals and objectives, and discuss initial approaches and options for performance metrics and categorization process.
PDT Meeting #3 10/20/14 1:00 PM to
2:30 PM
City of Palmdale Administration Training Room 38250 Sierra Highway Palmdale, CA 93550
The goal of this meeting was to obtain consensus on the final revisions to goals, objectives, and performance measures, to document PDT comments on the baseline conditions report (focusing specifically on identifying system gaps), and obtain PDT approval to analyze projects on the approved project list.
Adjacent Subregion/COG Meeting Los Angeles County Metropolitan Transportation Authority MTA Headquarters Video Conference
Stakeholders from the North Count Mobility Matrix PDT and the San Fernando Valley PDT met to discuss projects that overlap subregional boundaries.
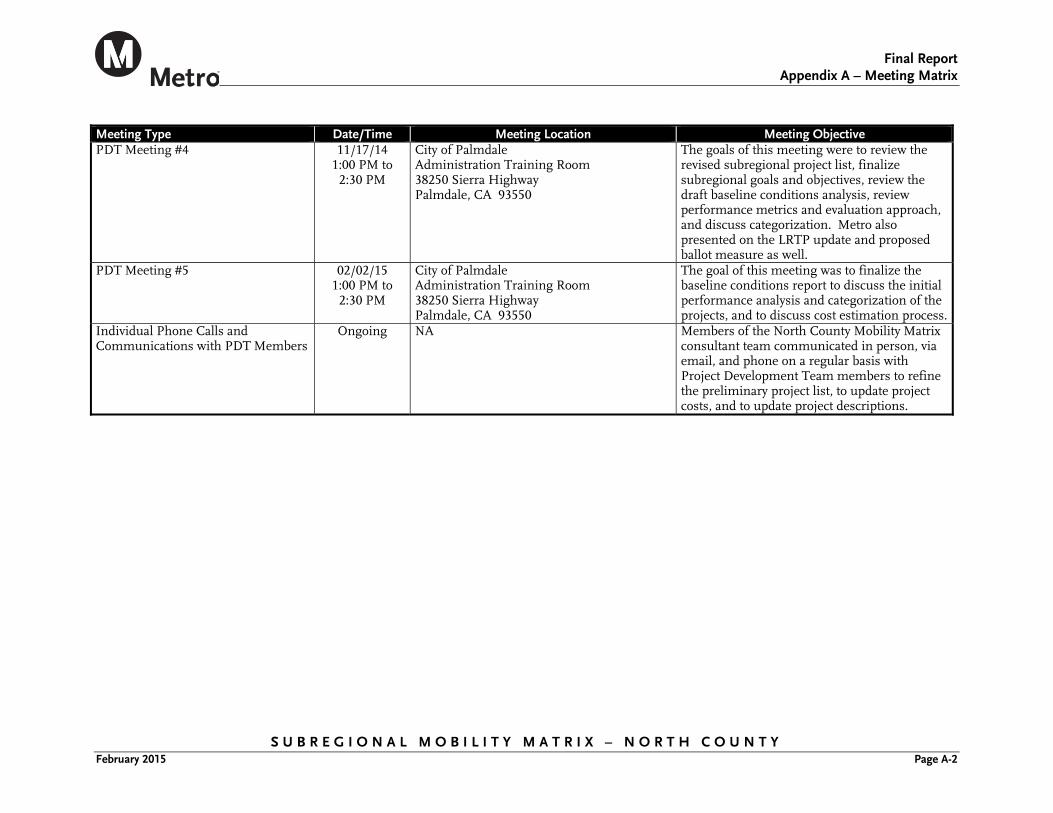
Final Report
Appendix A – Meeting Matrix
S U B R E G I O N A L M O B I L I T Y M A T R I X – N O R T H C O U N T Y February 2015 Page A-2
Meeting Type Date/Time Meeting Location Meeting Objective PDT Meeting #4 11/17/14
1:00 PM to 2:30 PM
City of Palmdale Administration Training Room 38250 Sierra Highway Palmdale, CA 93550
The goals of this meeting were to review the revised subregional project list, finalize subregional goals and objectives, review the draft baseline conditions analysis, review performance metrics and evaluation approach, and discuss categorization. Metro also presented on the LRTP update and proposed ballot measure as well.
PDT Meeting #5 02/02/15 1:00 PM to
2:30 PM
City of Palmdale Administration Training Room 38250 Sierra Highway Palmdale, CA 93550
The goal of this meeting was to finalize the baseline conditions report to discuss the initial performance analysis and categorization of the projects, and to discuss cost estimation process.
Individual Phone Calls and Communications with PDT Members
Ongoing NA Members of the North County Mobility Matrix consultant team communicated in person, via email, and phone on a regular basis with Project Development Team members to refine the preliminary project list, to update project costs, and to update project descriptions.
Final Report
Appendix B – Methodology Memorandums
S U B R E G I O N A L M O B I L I T Y M A T R I X – N O R T H C O U N T Y February 2015 Page B-1
APPENDIX B METHODOLOGY MEMORANDUMS
Introduction The following document describes the methodologies used for the performance evaluation, project categorization, and cost estimating exercises under Metro’s Subregional Mobility Matrix studies.
Program Evaluation Methodology Overview This section outlines the context and approach for evaluating programs submitted for consideration in the subregional Mobility Matrices.
Background and Context
The Mobility Matrices are intended as a preliminary input into Metro’s forthcoming Long Range Transportation Plan (LRTP) update process. The Mobility Matrix effort has involved collecting improvement projects and defining subregional improvement programs, defining subregional goals and objectives, analysis of baseline conditions, and a high-level evaluation of programs submitted for consideration. This document outlines the approach for evaluation of subregional projects and programs.
The Mobility Matrix process does not involve any prioritization. Rather, the Mobility Matrix is intended as a screening tool and a starting point in the Metro 2017 LRTP update process. It is also a tool to assist subregions in reaching consensus on goals and objectives and unmet transportation needs.
The intent of the Mobility Matrix process is to identify subregional projects and programs with the potential to address subregional and countywide transportation needs and goals for later quantitative analysis.
Metro and the Mobility Matrix consultant teams investigated the potential for a quantitative screening evaluation process, but this proved infeasible for the following reasons:
Inconsistent project details. Most cities in Los Angeles County did not have the resources or staff available to provide detailed data on their project concepts within the Mobility Matrix development timeframe. Performing quantitative analysis on inconsistent project lists would result in skewed evaluations.
Insufficient time and scope to fill in all data gaps. The condensed time frame and limited scope of Mobility Matrix process was deemed insufficient to warrant a detailed outreach to all 89 jurisdictions to collect all the data and project details necessary for a rigorous quantitative evaluation.
Due to the limited time frame for completion and largely incomplete and inconsistent project/program details and data, the Mobility Matrix evaluation is qualitative in nature, focusing on each program’s potential to address countywide and subregional goals and objectives. This was done to ensure a consistent, holistic county-wide approach.
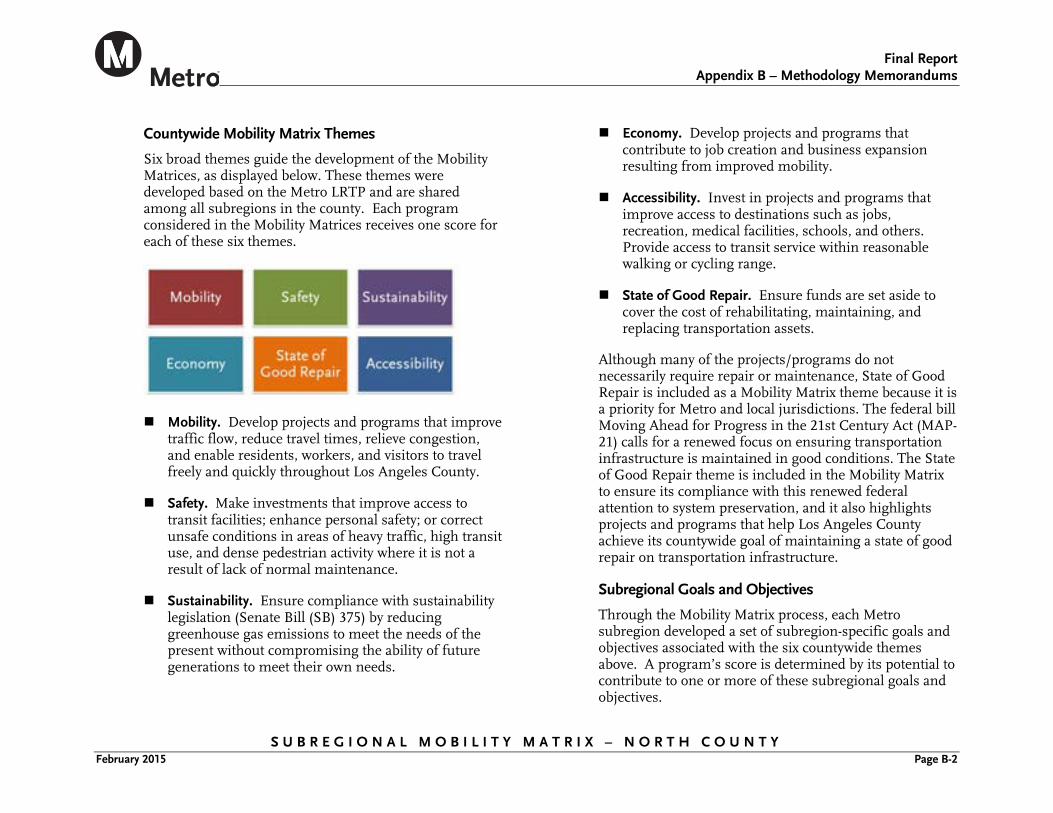
Final Report
Appendix B – Methodology Memorandums
S U B R E G I O N A L M O B I L I T Y M A T R I X – N O R T H C O U N T Y February 2015 Page B-2
Countywide Mobility Matrix Themes
Six broad themes guide the development of the Mobility Matrices, as displayed below. These themes were developed based on the Metro LRTP and are shared among all subregions in the county. Each program considered in the Mobility Matrices receives one score for each of these six themes.
Mobility. Develop projects and programs that improve traffic flow, reduce travel times, relieve congestion, and enable residents, workers, and visitors to travel freely and quickly throughout Los Angeles County.
Safety. Make investments that improve access to transit facilities; enhance personal safety; or correct unsafe conditions in areas of heavy traffic, high transit use, and dense pedestrian activity where it is not a result of lack of normal maintenance.
Sustainability. Ensure compliance with sustainability legislation (Senate Bill (SB) 375) by reducing greenhouse gas emissions to meet the needs of the present without compromising the ability of future generations to meet their own needs.
Economy. Develop projects and programs that contribute to job creation and business expansion resulting from improved mobility.
Accessibility. Invest in projects and programs that improve access to destinations such as jobs, recreation, medical facilities, schools, and others. Provide access to transit service within reasonable walking or cycling range.
State of Good Repair. Ensure funds are set aside to cover the cost of rehabilitating, maintaining, and replacing transportation assets.
Although many of the projects/programs do not necessarily require repair or maintenance, State of Good Repair is included as a Mobility Matrix theme because it is a priority for Metro and local jurisdictions. The federal bill Moving Ahead for Progress in the 21st Century Act (MAP-21) calls for a renewed focus on ensuring transportation infrastructure is maintained in good conditions. The State of Good Repair theme is included in the Mobility Matrix to ensure its compliance with this renewed federal attention to system preservation, and it also highlights projects and programs that help Los Angeles County achieve its countywide goal of maintaining a state of good repair on transportation infrastructure.
Subregional Goals and Objectives
Through the Mobility Matrix process, each Metro subregion developed a set of subregion-specific goals and objectives associated with the six countywide themes above. A program’s score is determined by its potential to contribute to one or more of these subregional goals and objectives.
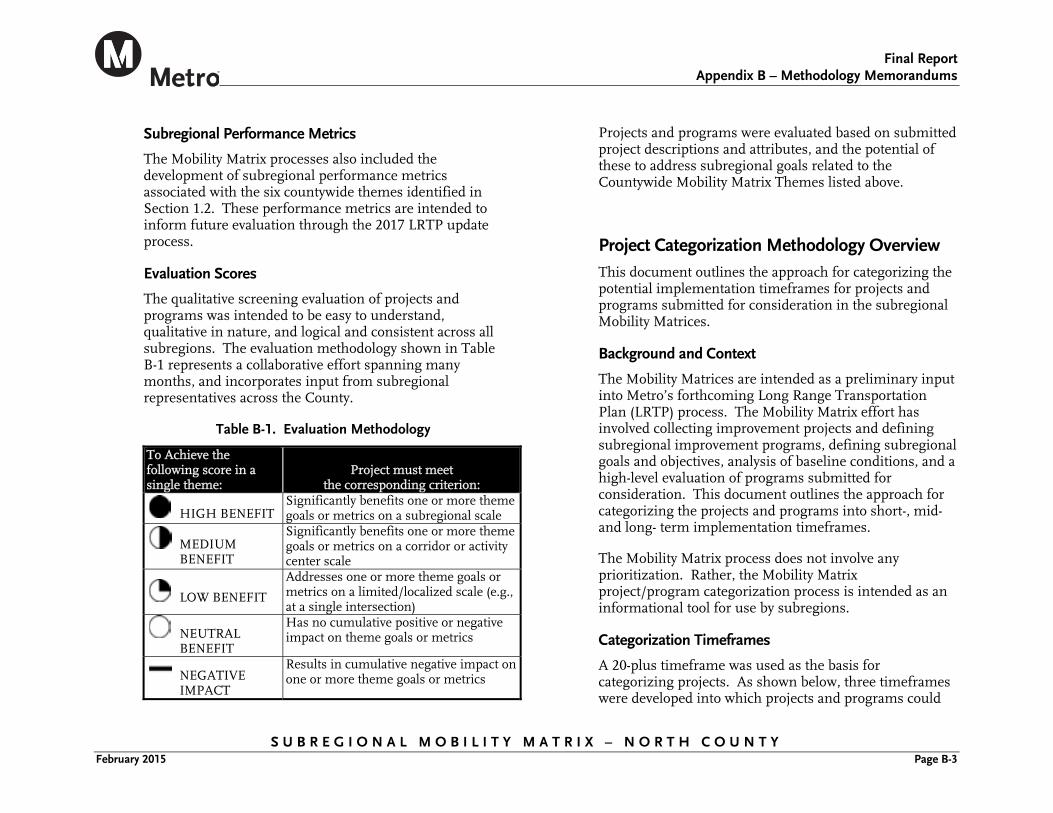
Final Report
Appendix B – Methodology Memorandums
S U B R E G I O N A L M O B I L I T Y M A T R I X – N O R T H C O U N T Y February 2015 Page B-3
Subregional Performance Metrics
The Mobility Matrix processes also included the development of subregional performance metrics associated with the six countywide themes identified in Section 1.2. These performance metrics are intended to inform future evaluation through the 2017 LRTP update process.
Evaluation Scores
The qualitative screening evaluation of projects and programs was intended to be easy to understand, qualitative in nature, and logical and consistent across all subregions. The evaluation methodology shown in Table B-1 represents a collaborative effort spanning many months, and incorporates input from subregional representatives across the County.
Table B-1. Evaluation Methodology
To Achieve the following score in a single theme:
Project must meet the corresponding criterion:
HIGH BENEFIT Significantly benefits one or more theme goals or metrics on a subregional scale
MEDIUM BENEFIT
Significantly benefits one or more theme goals or metrics on a corridor or activity center scale
LOW BENEFIT
Addresses one or more theme goals or metrics on a limited/localized scale (e.g., at a single intersection)
NEUTRAL BENEFIT
Has no cumulative positive or negative impact on theme goals or metrics
NEGATIVE IMPACT
Results in cumulative negative impact on one or more theme goals or metrics
Projects and programs were evaluated based on submitted project descriptions and attributes, and the potential of these to address subregional goals related to the Countywide Mobility Matrix Themes listed above.
Project Categorization Methodology Overview This document outlines the approach for categorizing the potential implementation timeframes for projects and programs submitted for consideration in the subregional Mobility Matrices.
Background and Context
The Mobility Matrices are intended as a preliminary input into Metro’s forthcoming Long Range Transportation Plan (LRTP) process. The Mobility Matrix effort has involved collecting improvement projects and defining subregional improvement programs, defining subregional goals and objectives, analysis of baseline conditions, and a high-level evaluation of programs submitted for consideration. This document outlines the approach for categorizing the projects and programs into short-, mid- and long- term implementation timeframes.
The Mobility Matrix process does not involve any prioritization. Rather, the Mobility Matrix project/program categorization process is intended as an informational tool for use by subregions.
Categorization Timeframes
A 20-plus timeframe was used as the basis for categorizing projects. As shown below, three timeframes were developed into which projects and programs could
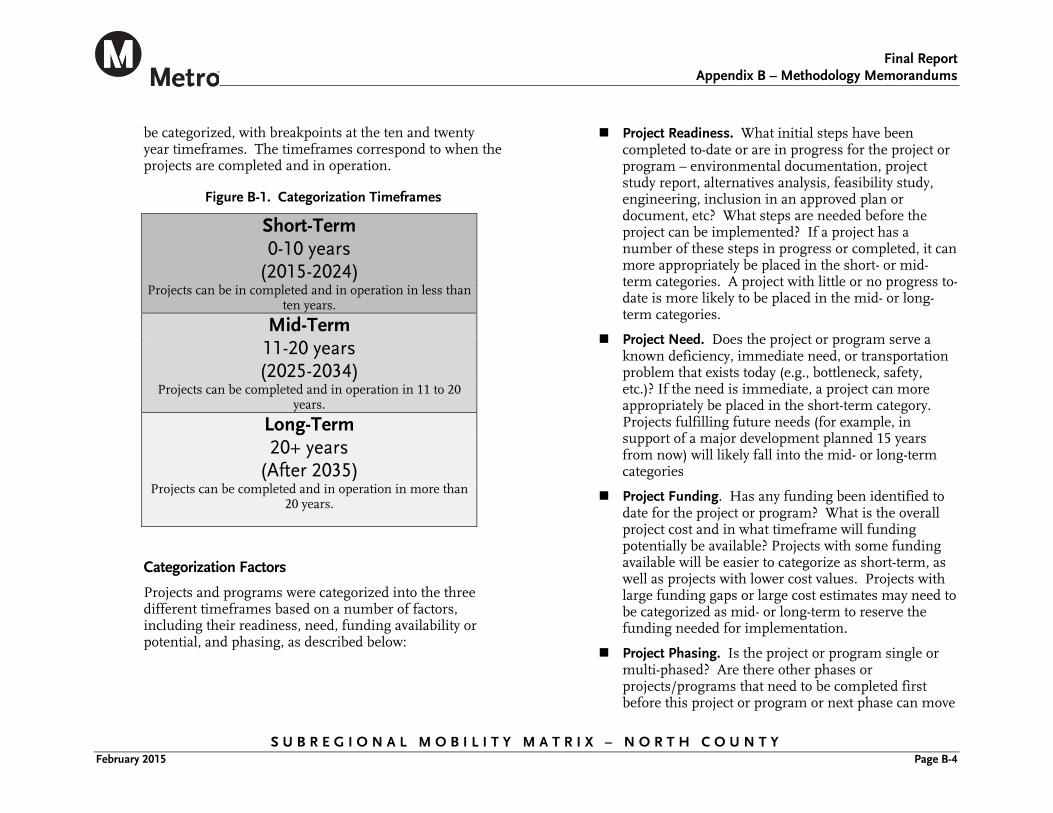
Final Report
Appendix B – Methodology Memorandums
S U B R E G I O N A L M O B I L I T Y M A T R I X – N O R T H C O U N T Y February 2015 Page B-4
be categorized, with breakpoints at the ten and twenty year timeframes. The timeframes correspond to when the projects are completed and in operation.
Figure B-1. Categorization Timeframes
Short-Term 0-10 years
(2015-2024) Projects can be in completed and in operation in less than
ten years.
Mid-Term 11-20 years (2025-2034)
Projects can be completed and in operation in 11 to 20 years.
Long-Term 20+ years
(After 2035) Projects can be completed and in operation in more than
20 years.
Categorization Factors
Projects and programs were categorized into the three different timeframes based on a number of factors, including their readiness, need, funding availability or potential, and phasing, as described below:
Project Readiness. What initial steps have been completed to-date or are in progress for the project or program – environmental documentation, project study report, alternatives analysis, feasibility study, engineering, inclusion in an approved plan or document, etc? What steps are needed before the project can be implemented? If a project has a number of these steps in progress or completed, it can more appropriately be placed in the short- or mid-term categories. A project with little or no progress to-date is more likely to be placed in the mid- or long-term categories.
Project Need. Does the project or program serve a known deficiency, immediate need, or transportation problem that exists today (e.g., bottleneck, safety, etc.)? If the need is immediate, a project can more appropriately be placed in the short-term category. Projects fulfilling future needs (for example, in support of a major development planned 15 years from now) will likely fall into the mid- or long-term categories
Project Funding. Has any funding been identified to date for the project or program? What is the overall project cost and in what timeframe will funding potentially be available? Projects with some funding available will be easier to categorize as short-term, as well as projects with lower cost values. Projects with large funding gaps or large cost estimates may need to be categorized as mid- or long-term to reserve the funding needed for implementation.
Project Phasing. Is the project or program single or multi-phased? Are there other phases or projects/programs that need to be completed first before this project or program or next phase can move
Final Report
Appendix B – Methodology Memorandums
S U B R E G I O N A L M O B I L I T Y M A T R I X – N O R T H C O U N T Y February 2015 Page B-5
forward? Many programs or large projects will likely cover more than one timeframe.
Categorization Process
Metro, Mobility Matrix consultants, PDT members, cities and other stakeholders worked collaboratively to determine project implementation timeframes. For projects or programs located in only one jurisdiction, that jurisdiction was given the first opportunity to define a feasible timeframe for its projects and programs. Subregional projects were categorized in conjunction with affected jurisdictions, and any conflicts between category suggestions by the affected jurisdictions were discussed and determined as a group. Project categorizations will be approved as part of the Final Subregional Mobility Matrix Report.
Cost Estimation Methodology Overview This document outlines the context and approach for estimating rough order-of-magnitude capital cost estimate ranges for transportation projects and programs included in the subregional Mobility Matrices.
Purpose
The Mobility Matrices are intended as preliminary input into Metro’s forthcoming Long Range Transportation Plan (LRTP) update process. The Mobility Matrix effort has involved collecting transportation improvement projects and defining subregional improvement programs, defining subregional goals and objectives, analysis of baseline conditions, and a high-level screening evaluation of transportation programs submitted for
consideration. The purpose of this document is to outline the approach for preparing rough order-of-magnitude capital cost estimates, not including vehicles, operating, maintenance and financing cost, for the unfunded transportation projects and programs in each subregion.
Some projects and programs on the Mobility Matrix lists contained capital cost estimates, while others did not. Furthermore, some projects submitted by stakeholder jurisdictions had defined scope and limits, while other projects were less defined or programmatic in nature.
Due to variations in project scope and available cost data, costs estimated for use in the Mobility Matrix are not intended to be used for future project-level planning. Rather, the cost ranges developed via this process constitute a high-level, rough order-of-magnitude planning range for short-, mid-, and long-term subregional funding needs for the Mobility Matrix effort only. More detailed analysis will be conducted in the LRTP process, which may necessitate refinement of project/program and associated cost estimates.
Cost Estimation Methodology
This section explains the process by which consistent transportation improvement project cost minimum/maximum range estimates were developed at the program level.
Major Transit Project Cost Estimates Developed by Metro
Metro’s Cost Estimating Department provided parametric unit cost estimates for major transit projects such as bus rapid transit, light rail transit, heavy rail transit, and
Final Report
Appendix B – Methodology Memorandums
S U B R E G I O N A L M O B I L I T Y M A T R I X – N O R T H C O U N T Y February 2015 Page B-6
maintenance and operations facilities, based on Metro historical project costs.
Major Freeway Project Cost Estimates Developed by Caltrans
The California Department of Transportation (Caltrans) provided unit cost estimates for major freeway and highway projects. If Caltrans did not provide highway/freeway project cost estimates, they were left blank for the purposes of the Mobility Matrix.
Projects with Cost Estimates Provided by Jurisdictions
If available, jurisdictions submitted cost estimates for their transportation improvement projects and programs. For some, jurisdictions submitted specific cost estimates, while for others, jurisdictions submitted minimum and maximum cost estimate ranges. Given the high-level planning nature of the Mobility Matrix process, and in the interest of subregional consistency, a minimum/maximum cost range was developed for each project or program:
Capital projects submitted with minimum/maximum cost ranges were left unchanged. Projects submitted with specific cost estimates were expanded to a minimum (20 percent below specific estimate) and maximum (20 percent above specific estimate) cost range.
Program ongoing costs were assumed to continue throughout the Mobility Matrix categorization periods, or throughout the short, medium and long term period, if duration was unknown. Again, cost estimates were adjusted to include a minimum range
(20 percent below) and maximum range (20 percent above) around each annual cost estimate.
Projects or Programs Without Cost Estimates
Projects or programs submitted without costs were assigned cost estimates based on per-unit or per-mile industry standard factors by project or program type, or on the average per-unit or per-mile costs of comparable projects/programs with cost information submitted for consideration in the Mobility Matrix. The following methods were used to develop these placeholder cost estimates:
Using Comparable Mobility Matrix Project Costs. First, Mobility Matrix projects or programs with similar characteristics were sorted by type, and average costs were calculated based on per mile or per unit costs. For any projects or programs with similar characteristics, these average per mile and per unit costs were applied. This estimate was expanded to a minimum (20 percent below) and maximum (20 percent above) cost range.
Using Research Literature. In some cases, industry standard cost estimates were available in research literature on a per-mile or per-unit basis. If no comparable costs were submitted through the Mobility Matrix project or program lists, these studies were utilized to develop cost estimates. Specific cost estimates were expanded to a minimum (20 percent below) and maximum (20 percent above) cost range.
Estimating Remaining Project Costs by Project Type. For remaining projects, the average total cost of other projects
Final Report
Appendix B – Methodology Memorandums
S U B R E G I O N A L M O B I L I T Y M A T R I X – N O R T H C O U N T Y February 2015 Page B-7
in the same program was used to approximate project cost.
For example, if 15 out of 20 pedestrian program projects have cost estimates that total $15 million, the remaining five pedestrian improvement projects were assumed to have similar average costs ($1 million per project). In this example, if the original value of the 15 known projects was $15 million, the assumed cost of the full program of 20 projects would be $20 million
Program-Level Estimates
Cost ranges developed through this process are for high-level planning purposes only, and should not be used in project-specific planning. In the interest of consistency, project-level cost estimates were rolled-up to the program level and not reported at the project-specific level.
All Project Costs Reported in Year 2015 Dollars
For consistency, all estimated project and program costs are in year 2015 dollars, as this is the base year of the 2009 Long Range Transportation Plan update process. Project cost estimates from prior years were escalated to year 2015 dollars at a three-percent annual rate.
Metro Cost Estimating Department Reviewed Major Cost Estimates
As a final step to ensure consistency with Metro’s cost estimating processes, the Metro Cost Estimating Department provided a high-level review of transit cost estimates to ensure consultant estimates were consistent with Metro practices.
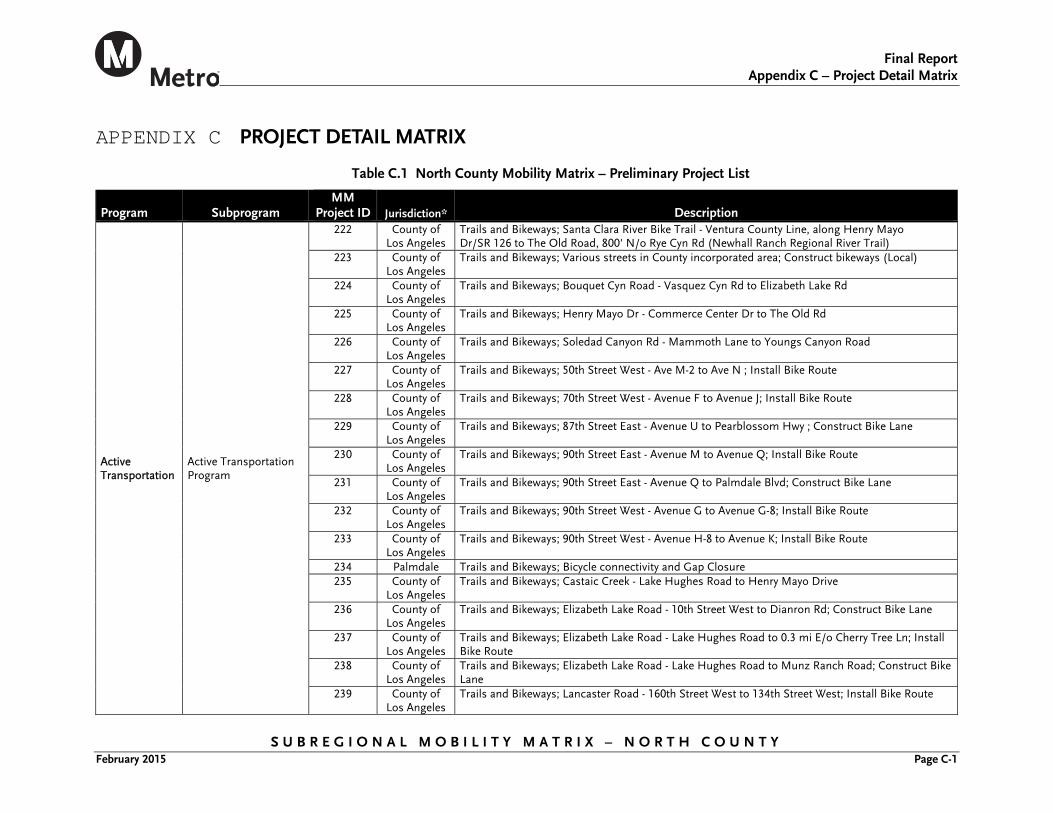
Final Report
Appendix C – Project Detail Matrix
S U B R E G I O N A L M O B I L I T Y M A T R I X – N O R T H C O U N T Y February 2015 Page C-1
APPENDIX C PROJECT DETAIL MATRIX
Table C.1 North County Mobility Matrix – Preliminary Project List
Program Subprogram MM
Project ID Jurisdiction* Description
Active Transportation
Active Transportation Program
222 County of Los Angeles
Trails and Bikeways; Santa Clara River Bike Trail - Ventura County Line, along Henry Mayo Dr/SR 126 to The Old Road, 800' N/o Rye Cyn Rd (Newhall Ranch Regional River Trail)
223 County of Los Angeles
Trails and Bikeways; Various streets in County incorporated area; Construct bikeways (Local)
224 County of Los Angeles
Trails and Bikeways; Bouquet Cyn Road - Vasquez Cyn Rd to Elizabeth Lake Rd
225 County of Los Angeles
Trails and Bikeways; Henry Mayo Dr - Commerce Center Dr to The Old Rd
226 County of Los Angeles
Trails and Bikeways; Soledad Canyon Rd - Mammoth Lane to Youngs Canyon Road
227 County of Los Angeles
Trails and Bikeways; 50th Street West - Ave M-2 to Ave N ; Install Bike Route
228 County of Los Angeles
Trails and Bikeways; 70th Street West - Avenue F to Avenue J; Install Bike Route
229 County of Los Angeles
Trails and Bikeways; 87th Street East - Avenue U to Pearblossom Hwy ; Construct Bike Lane
230 County of Los Angeles
Trails and Bikeways; 90th Street East - Avenue M to Avenue Q; Install Bike Route
231 County of Los Angeles
Trails and Bikeways; 90th Street East - Avenue Q to Palmdale Blvd; Construct Bike Lane
232 County of Los Angeles
Trails and Bikeways; 90th Street West - Avenue G to Avenue G-8; Install Bike Route
233 County of Los Angeles
Trails and Bikeways; 90th Street West - Avenue H-8 to Avenue K; Install Bike Route
234 Palmdale Trails and Bikeways; Bicycle connectivity and Gap Closure 235 County of
Los Angeles Trails and Bikeways; Castaic Creek - Lake Hughes Road to Henry Mayo Drive
236 County of Los Angeles
Trails and Bikeways; Elizabeth Lake Road - 10th Street West to Dianron Rd; Construct Bike Lane
237 County of Los Angeles
Trails and Bikeways; Elizabeth Lake Road - Lake Hughes Road to 0.3 mi E/o Cherry Tree Ln; Install Bike Route
238 County of Los Angeles
Trails and Bikeways; Elizabeth Lake Road - Lake Hughes Road to Munz Ranch Road; Construct Bike Lane
239 County of Los Angeles
Trails and Bikeways; Lancaster Road - 160th Street West to 134th Street West; Install Bike Route
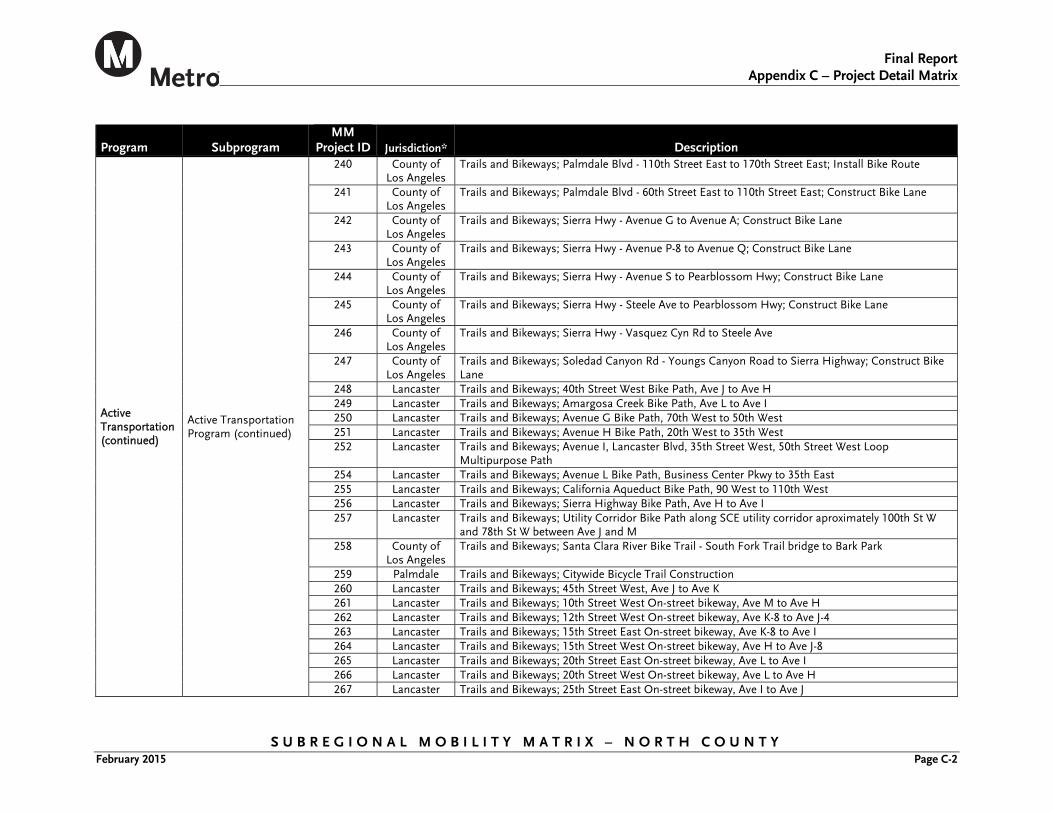
Final Report
Appendix C – Project Detail Matrix
S U B R E G I O N A L M O B I L I T Y M A T R I X – N O R T H C O U N T Y February 2015 Page C-2
Program Subprogram MM
Project ID Jurisdiction* Description
Active Transportation (continued)
Active Transportation Program (continued)
240 County of Los Angeles
Trails and Bikeways; Palmdale Blvd - 110th Street East to 170th Street East; Install Bike Route
241 County of Los Angeles
Trails and Bikeways; Palmdale Blvd - 60th Street East to 110th Street East; Construct Bike Lane
242 County of Los Angeles
Trails and Bikeways; Sierra Hwy - Avenue G to Avenue A; Construct Bike Lane
243 County of Los Angeles
Trails and Bikeways; Sierra Hwy - Avenue P-8 to Avenue Q; Construct Bike Lane
244 County of Los Angeles
Trails and Bikeways; Sierra Hwy - Avenue S to Pearblossom Hwy; Construct Bike Lane
245 County of Los Angeles
Trails and Bikeways; Sierra Hwy - Steele Ave to Pearblossom Hwy; Construct Bike Lane
246 County of Los Angeles
Trails and Bikeways; Sierra Hwy - Vasquez Cyn Rd to Steele Ave
247 County of Los Angeles
Trails and Bikeways; Soledad Canyon Rd - Youngs Canyon Road to Sierra Highway; Construct Bike Lane
248 Lancaster Trails and Bikeways; 40th Street West Bike Path, Ave J to Ave H 249 Lancaster Trails and Bikeways; Amargosa Creek Bike Path, Ave L to Ave I 250 Lancaster Trails and Bikeways; Avenue G Bike Path, 70th West to 50th West 251 Lancaster Trails and Bikeways; Avenue H Bike Path, 20th West to 35th West 252 Lancaster Trails and Bikeways; Avenue I, Lancaster Blvd, 35th Street West, 50th Street West Loop
Multipurpose Path 254 Lancaster Trails and Bikeways; Avenue L Bike Path, Business Center Pkwy to 35th East 255 Lancaster Trails and Bikeways; California Aqueduct Bike Path, 90 West to 110th West 256 Lancaster Trails and Bikeways; Sierra Highway Bike Path, Ave H to Ave I 257 Lancaster Trails and Bikeways; Utility Corridor Bike Path along SCE utility corridor aproximately 100th St W
and 78th St W between Ave J and M 258 County of
Los Angeles Trails and Bikeways; Santa Clara River Bike Trail - South Fork Trail bridge to Bark Park
259 Palmdale Trails and Bikeways; Citywide Bicycle Trail Construction 260 Lancaster Trails and Bikeways; 45th Street West, Ave J to Ave K 261 Lancaster Trails and Bikeways; 10th Street West On-street bikeway, Ave M to Ave H 262 Lancaster Trails and Bikeways; 12th Street West On-street bikeway, Ave K-8 to Ave J-4 263 Lancaster Trails and Bikeways; 15th Street East On-street bikeway, Ave K-8 to Ave I 264 Lancaster Trails and Bikeways; 15th Street West On-street bikeway, Ave H to Ave J-8 265 Lancaster Trails and Bikeways; 20th Street East On-street bikeway, Ave L to Ave I 266 Lancaster Trails and Bikeways; 20th Street West On-street bikeway, Ave L to Ave H 267 Lancaster Trails and Bikeways; 25th Street East On-street bikeway, Ave I to Ave J
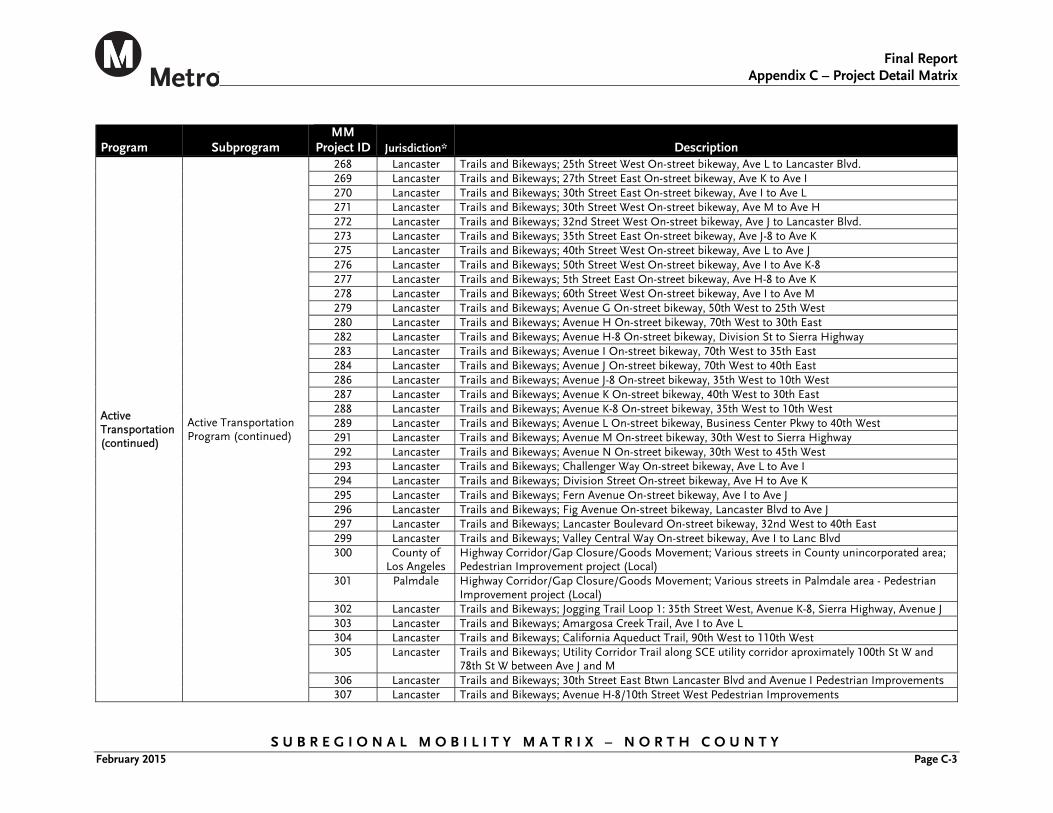
Final Report
Appendix C – Project Detail Matrix
S U B R E G I O N A L M O B I L I T Y M A T R I X – N O R T H C O U N T Y February 2015 Page C-3
Program Subprogram MM
Project ID Jurisdiction* Description
Active Transportation (continued)
Active Transportation Program (continued)
268 Lancaster Trails and Bikeways; 25th Street West On-street bikeway, Ave L to Lancaster Blvd. 269 Lancaster Trails and Bikeways; 27th Street East On-street bikeway, Ave K to Ave I 270 Lancaster Trails and Bikeways; 30th Street East On-street bikeway, Ave I to Ave L 271 Lancaster Trails and Bikeways; 30th Street West On-street bikeway, Ave M to Ave H 272 Lancaster Trails and Bikeways; 32nd Street West On-street bikeway, Ave J to Lancaster Blvd. 273 Lancaster Trails and Bikeways; 35th Street East On-street bikeway, Ave J-8 to Ave K 275 Lancaster Trails and Bikeways; 40th Street West On-street bikeway, Ave L to Ave J 276 Lancaster Trails and Bikeways; 50th Street West On-street bikeway, Ave I to Ave K-8 277 Lancaster Trails and Bikeways; 5th Street East On-street bikeway, Ave H-8 to Ave K 278 Lancaster Trails and Bikeways; 60th Street West On-street bikeway, Ave I to Ave M 279 Lancaster Trails and Bikeways; Avenue G On-street bikeway, 50th West to 25th West 280 Lancaster Trails and Bikeways; Avenue H On-street bikeway, 70th West to 30th East 282 Lancaster Trails and Bikeways; Avenue H-8 On-street bikeway, Division St to Sierra Highway 283 Lancaster Trails and Bikeways; Avenue I On-street bikeway, 70th West to 35th East 284 Lancaster Trails and Bikeways; Avenue J On-street bikeway, 70th West to 40th East 286 Lancaster Trails and Bikeways; Avenue J-8 On-street bikeway, 35th West to 10th West 287 Lancaster Trails and Bikeways; Avenue K On-street bikeway, 40th West to 30th East 288 Lancaster Trails and Bikeways; Avenue K-8 On-street bikeway, 35th West to 10th West 289 Lancaster Trails and Bikeways; Avenue L On-street bikeway, Business Center Pkwy to 40th West 291 Lancaster Trails and Bikeways; Avenue M On-street bikeway, 30th West to Sierra Highway 292 Lancaster Trails and Bikeways; Avenue N On-street bikeway, 30th West to 45th West 293 Lancaster Trails and Bikeways; Challenger Way On-street bikeway, Ave L to Ave I 294 Lancaster Trails and Bikeways; Division Street On-street bikeway, Ave H to Ave K 295 Lancaster Trails and Bikeways; Fern Avenue On-street bikeway, Ave I to Ave J 296 Lancaster Trails and Bikeways; Fig Avenue On-street bikeway, Lancaster Blvd to Ave J 297 Lancaster Trails and Bikeways; Lancaster Boulevard On-street bikeway, 32nd West to 40th East 299 Lancaster Trails and Bikeways; Valley Central Way On-street bikeway, Ave I to Lanc Blvd 300 County of
Los Angeles Highway Corridor/Gap Closure/Goods Movement; Various streets in County unincorporated area; Pedestrian Improvement project (Local)
301 Palmdale Highway Corridor/Gap Closure/Goods Movement; Various streets in Palmdale area - Pedestrian Improvement project (Local)
302 Lancaster Trails and Bikeways; Jogging Trail Loop 1: 35th Street West, Avenue K-8, Sierra Highway, Avenue J 303 Lancaster Trails and Bikeways; Amargosa Creek Trail, Ave I to Ave L 304 Lancaster Trails and Bikeways; California Aqueduct Trail, 90th West to 110th West 305 Lancaster Trails and Bikeways; Utility Corridor Trail along SCE utility corridor aproximately 100th St W and
78th St W between Ave J and M 306 Lancaster Trails and Bikeways; 30th Street East Btwn Lancaster Blvd and Avenue I Pedestrian Improvements 307 Lancaster Trails and Bikeways; Avenue H-8/10th Street West Pedestrian Improvements
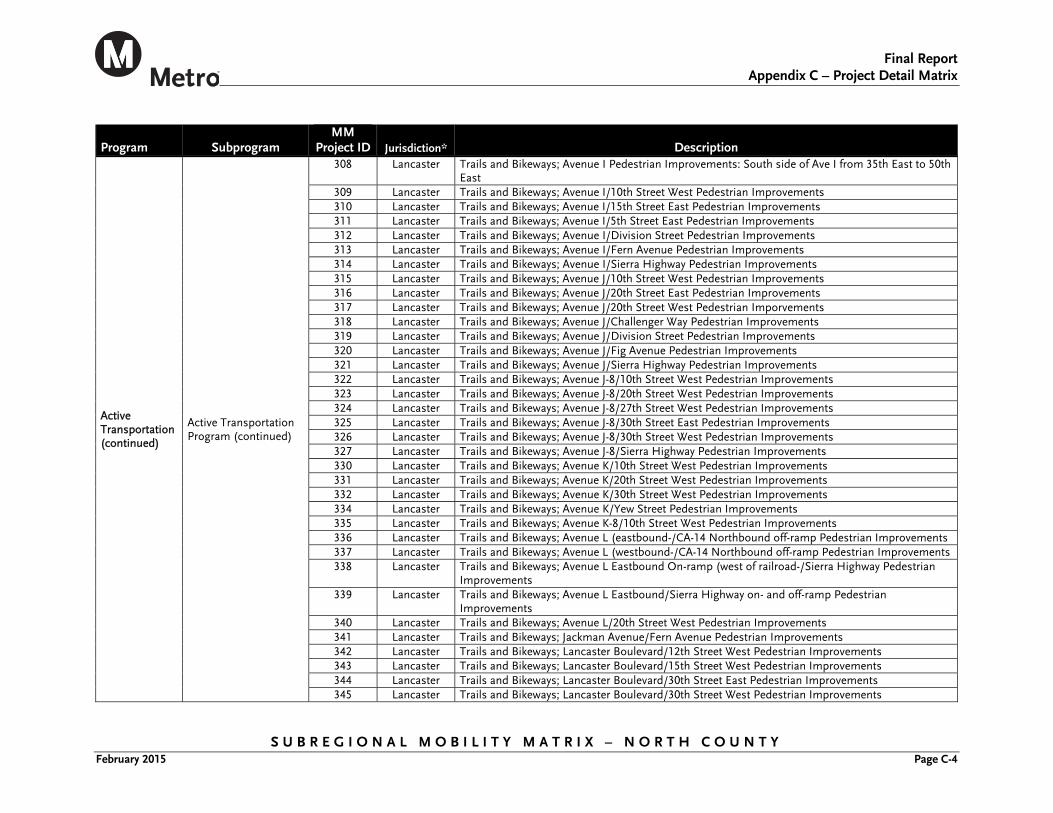
Final Report
Appendix C – Project Detail Matrix
S U B R E G I O N A L M O B I L I T Y M A T R I X – N O R T H C O U N T Y February 2015 Page C-4
Program Subprogram MM
Project ID Jurisdiction* Description
Active Transportation (continued)
Active Transportation Program (continued)
308 Lancaster Trails and Bikeways; Avenue I Pedestrian Improvements: South side of Ave I from 35th East to 50th East
309 Lancaster Trails and Bikeways; Avenue I/10th Street West Pedestrian Improvements 310 Lancaster Trails and Bikeways; Avenue I/15th Street East Pedestrian Improvements 311 Lancaster Trails and Bikeways; Avenue I/5th Street East Pedestrian Improvements 312 Lancaster Trails and Bikeways; Avenue I/Division Street Pedestrian Improvements 313 Lancaster Trails and Bikeways; Avenue I/Fern Avenue Pedestrian Improvements 314 Lancaster Trails and Bikeways; Avenue I/Sierra Highway Pedestrian Improvements 315 Lancaster Trails and Bikeways; Avenue J/10th Street West Pedestrian Improvements 316 Lancaster Trails and Bikeways; Avenue J/20th Street East Pedestrian Improvements 317 Lancaster Trails and Bikeways; Avenue J/20th Street West Pedestrian Imporvements 318 Lancaster Trails and Bikeways; Avenue J/Challenger Way Pedestrian Improvements 319 Lancaster Trails and Bikeways; Avenue J/Division Street Pedestrian Improvements 320 Lancaster Trails and Bikeways; Avenue J/Fig Avenue Pedestrian Improvements 321 Lancaster Trails and Bikeways; Avenue J/Sierra Highway Pedestrian Improvements 322 Lancaster Trails and Bikeways; Avenue J-8/10th Street West Pedestrian Improvements 323 Lancaster Trails and Bikeways; Avenue J-8/20th Street West Pedestrian Improvements 324 Lancaster Trails and Bikeways; Avenue J-8/27th Street West Pedestrian Improvements 325 Lancaster Trails and Bikeways; Avenue J-8/30th Street East Pedestrian Improvements 326 Lancaster Trails and Bikeways; Avenue J-8/30th Street West Pedestrian Improvements 327 Lancaster Trails and Bikeways; Avenue J-8/Sierra Highway Pedestrian Improvements 330 Lancaster Trails and Bikeways; Avenue K/10th Street West Pedestrian Improvements 331 Lancaster Trails and Bikeways; Avenue K/20th Street West Pedestrian Improvements 332 Lancaster Trails and Bikeways; Avenue K/30th Street West Pedestrian Improvements 334 Lancaster Trails and Bikeways; Avenue K/Yew Street Pedestrian Improvements 335 Lancaster Trails and Bikeways; Avenue K-8/10th Street West Pedestrian Improvements 336 Lancaster Trails and Bikeways; Avenue L (eastbound-/CA-14 Northbound off-ramp Pedestrian Improvements 337 Lancaster Trails and Bikeways; Avenue L (westbound-/CA-14 Northbound off-ramp Pedestrian Improvements 338 Lancaster Trails and Bikeways; Avenue L Eastbound On-ramp (west of railroad-/Sierra Highway Pedestrian
Improvements 339 Lancaster Trails and Bikeways; Avenue L Eastbound/Sierra Highway on- and off-ramp Pedestrian
Improvements 340 Lancaster Trails and Bikeways; Avenue L/20th Street West Pedestrian Improvements 341 Lancaster Trails and Bikeways; Jackman Avenue/Fern Avenue Pedestrian Improvements 342 Lancaster Trails and Bikeways; Lancaster Boulevard/12th Street West Pedestrian Improvements 343 Lancaster Trails and Bikeways; Lancaster Boulevard/15th Street West Pedestrian Improvements 344 Lancaster Trails and Bikeways; Lancaster Boulevard/30th Street East Pedestrian Improvements 345 Lancaster Trails and Bikeways; Lancaster Boulevard/30th Street West Pedestrian Improvements
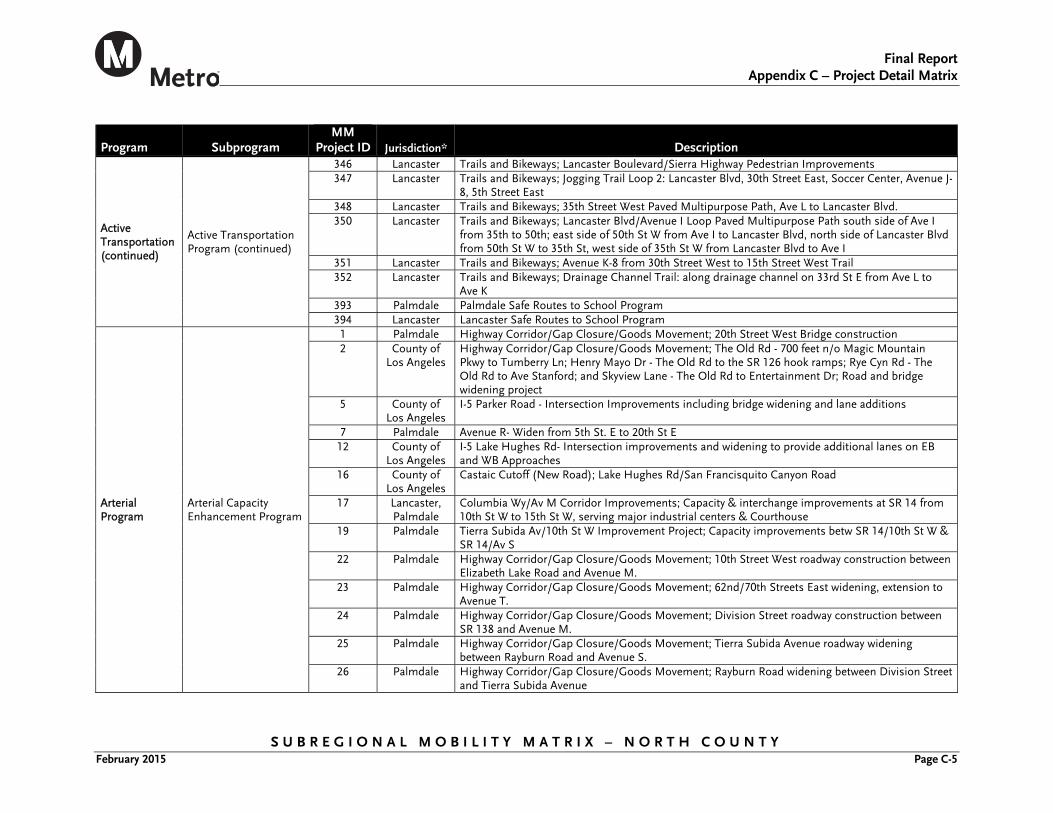
Final Report
Appendix C – Project Detail Matrix
S U B R E G I O N A L M O B I L I T Y M A T R I X – N O R T H C O U N T Y February 2015 Page C-5
Program Subprogram MM
Project ID Jurisdiction* Description
Active Transportation (continued)
Active Transportation Program (continued)
346 Lancaster Trails and Bikeways; Lancaster Boulevard/Sierra Highway Pedestrian Improvements 347 Lancaster Trails and Bikeways; Jogging Trail Loop 2: Lancaster Blvd, 30th Street East, Soccer Center, Avenue J-
8, 5th Street East 348 Lancaster Trails and Bikeways; 35th Street West Paved Multipurpose Path, Ave L to Lancaster Blvd. 350 Lancaster Trails and Bikeways; Lancaster Blvd/Avenue I Loop Paved Multipurpose Path south side of Ave I
from 35th to 50th; east side of 50th St W from Ave I to Lancaster Blvd, north side of Lancaster Blvd from 50th St W to 35th St, west side of 35th St W from Lancaster Blvd to Ave I
351 Lancaster Trails and Bikeways; Avenue K-8 from 30th Street West to 15th Street West Trail 352 Lancaster Trails and Bikeways; Drainage Channel Trail: along drainage channel on 33rd St E from Ave L to
Ave K 393 Palmdale Palmdale Safe Routes to School Program 394 Lancaster Lancaster Safe Routes to School Program
Arterial Program
Arterial Capacity Enhancement Program
1 Palmdale Highway Corridor/Gap Closure/Goods Movement; 20th Street West Bridge construction 2 County of
Los Angeles Highway Corridor/Gap Closure/Goods Movement; The Old Rd - 700 feet n/o Magic Mountain Pkwy to Tumberry Ln; Henry Mayo Dr - The Old Rd to the SR 126 hook ramps; Rye Cyn Rd - The Old Rd to Ave Stanford; and Skyview Lane - The Old Rd to Entertainment Dr; Road and bridge widening project
5 County of Los Angeles
I-5 Parker Road - Intersection Improvements including bridge widening and lane additions
7 Palmdale Avenue R- Widen from 5th St. E to 20th St E 12 County of
Los Angeles I-5 Lake Hughes Rd- Intersection improvements and widening to provide additional lanes on EB and WB Approaches
16 County of Los Angeles
Castaic Cutoff (New Road); Lake Hughes Rd/San Francisquito Canyon Road
17 Lancaster, Palmdale
Columbia Wy/Av M Corridor Improvements; Capacity & interchange improvements at SR 14 from 10th St W to 15th St W, serving major industrial centers & Courthouse
19 Palmdale Tierra Subida Av/10th St W Improvement Project; Capacity improvements betw SR 14/10th St W & SR 14/Av S
22 Palmdale Highway Corridor/Gap Closure/Goods Movement; 10th Street West roadway construction between Elizabeth Lake Road and Avenue M.
23 Palmdale Highway Corridor/Gap Closure/Goods Movement; 62nd/70th Streets East widening, extension to Avenue T.
24 Palmdale Highway Corridor/Gap Closure/Goods Movement; Division Street roadway construction between SR 138 and Avenue M.
25 Palmdale Highway Corridor/Gap Closure/Goods Movement; Tierra Subida Avenue roadway widening between Rayburn Road and Avenue S.
26 Palmdale Highway Corridor/Gap Closure/Goods Movement; Rayburn Road widening between Division Street and Tierra Subida Avenue
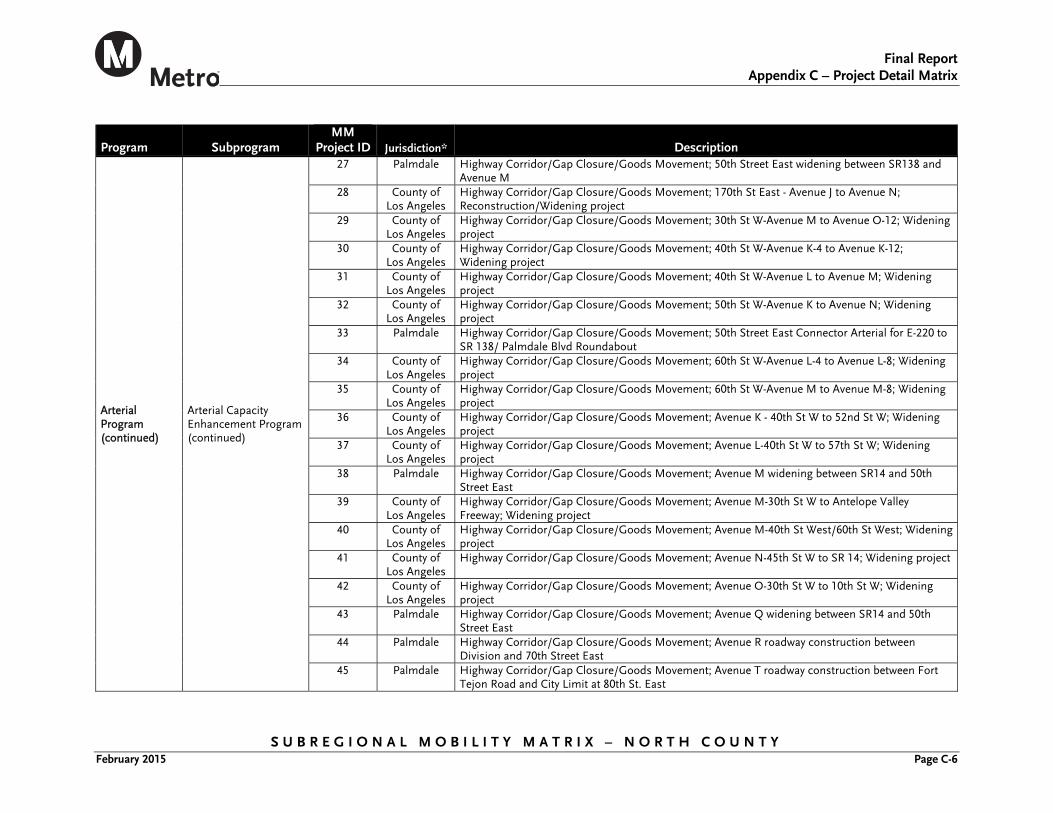
Final Report
Appendix C – Project Detail Matrix
S U B R E G I O N A L M O B I L I T Y M A T R I X – N O R T H C O U N T Y February 2015 Page C-6
Program Subprogram MM
Project ID Jurisdiction* Description
Arterial Program (continued)
Arterial Capacity Enhancement Program (continued)
27 Palmdale Highway Corridor/Gap Closure/Goods Movement; 50th Street East widening between SR138 and Avenue M
28 County of Los Angeles
Highway Corridor/Gap Closure/Goods Movement; 170th St East - Avenue J to Avenue N; Reconstruction/Widening project
29 County of Los Angeles
Highway Corridor/Gap Closure/Goods Movement; 30th St W-Avenue M to Avenue O-12; Widening project
30 County of Los Angeles
Highway Corridor/Gap Closure/Goods Movement; 40th St W-Avenue K-4 to Avenue K-12; Widening project
31 County of Los Angeles
Highway Corridor/Gap Closure/Goods Movement; 40th St W-Avenue L to Avenue M; Widening project
32 County of Los Angeles
Highway Corridor/Gap Closure/Goods Movement; 50th St W-Avenue K to Avenue N; Widening project
33 Palmdale Highway Corridor/Gap Closure/Goods Movement; 50th Street East Connector Arterial for E-220 to SR 138/ Palmdale Blvd Roundabout
34 County of Los Angeles
Highway Corridor/Gap Closure/Goods Movement; 60th St W-Avenue L-4 to Avenue L-8; Widening project
35 County of Los Angeles
Highway Corridor/Gap Closure/Goods Movement; 60th St W-Avenue M to Avenue M-8; Widening project
36 County of Los Angeles
Highway Corridor/Gap Closure/Goods Movement; Avenue K - 40th St W to 52nd St W; Widening project
37 County of Los Angeles
Highway Corridor/Gap Closure/Goods Movement; Avenue L-40th St W to 57th St W; Widening project
38 Palmdale Highway Corridor/Gap Closure/Goods Movement; Avenue M widening between SR14 and 50th Street East
39 County of Los Angeles
Highway Corridor/Gap Closure/Goods Movement; Avenue M-30th St W to Antelope Valley Freeway; Widening project
40 County of Los Angeles
Highway Corridor/Gap Closure/Goods Movement; Avenue M-40th St West/60th St West; Widening project
41 County of Los Angeles
Highway Corridor/Gap Closure/Goods Movement; Avenue N-45th St W to SR 14; Widening project
42 County of Los Angeles
Highway Corridor/Gap Closure/Goods Movement; Avenue O-30th St W to 10th St W; Widening project
43 Palmdale Highway Corridor/Gap Closure/Goods Movement; Avenue Q widening between SR14 and 50th Street East
44 Palmdale Highway Corridor/Gap Closure/Goods Movement; Avenue R roadway construction between Division and 70th Street East
45 Palmdale Highway Corridor/Gap Closure/Goods Movement; Avenue T roadway construction between Fort Tejon Road and City Limit at 80th St. East
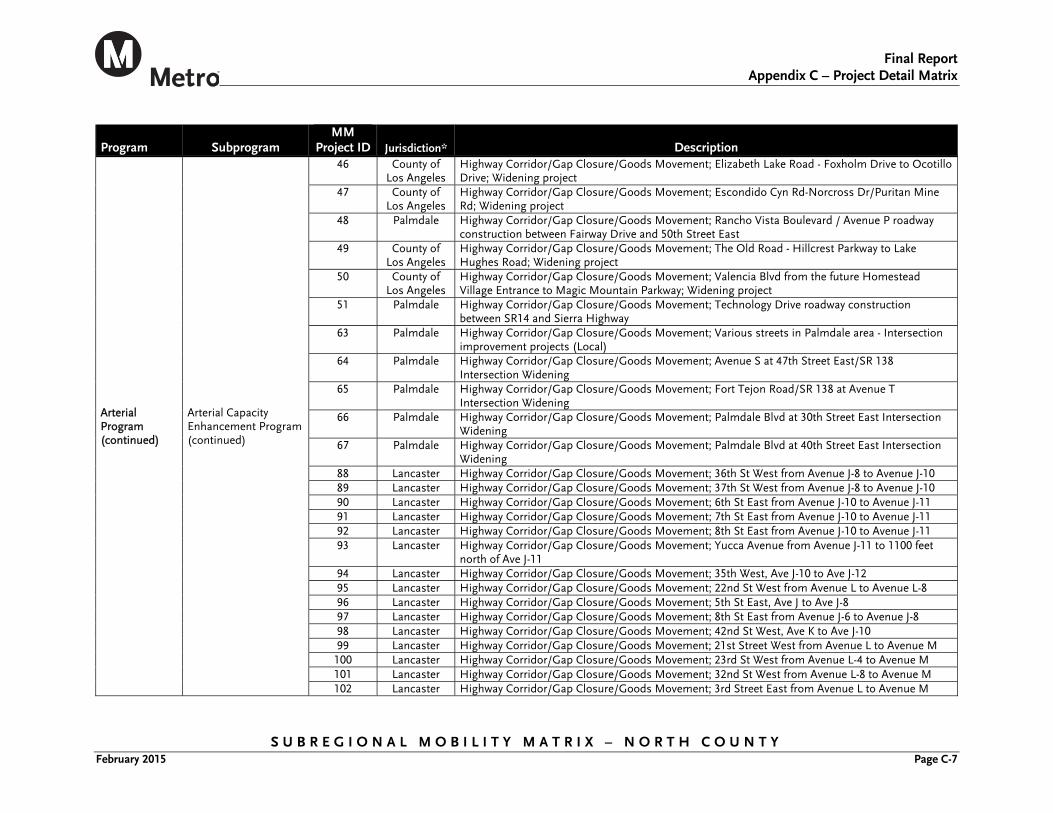
Final Report
Appendix C – Project Detail Matrix
S U B R E G I O N A L M O B I L I T Y M A T R I X – N O R T H C O U N T Y February 2015 Page C-7
Program Subprogram MM
Project ID Jurisdiction* Description
Arterial Program (continued)
Arterial Capacity Enhancement Program (continued)
46 County of Los Angeles
Highway Corridor/Gap Closure/Goods Movement; Elizabeth Lake Road - Foxholm Drive to Ocotillo Drive; Widening project
47 County of Los Angeles
Highway Corridor/Gap Closure/Goods Movement; Escondido Cyn Rd-Norcross Dr/Puritan Mine Rd; Widening project
48 Palmdale Highway Corridor/Gap Closure/Goods Movement; Rancho Vista Boulevard / Avenue P roadway construction between Fairway Drive and 50th Street East
49 County of Los Angeles
Highway Corridor/Gap Closure/Goods Movement; The Old Road - Hillcrest Parkway to Lake Hughes Road; Widening project
50 County of Los Angeles
Highway Corridor/Gap Closure/Goods Movement; Valencia Blvd from the future Homestead Village Entrance to Magic Mountain Parkway; Widening project
51 Palmdale Highway Corridor/Gap Closure/Goods Movement; Technology Drive roadway construction between SR14 and Sierra Highway
63 Palmdale Highway Corridor/Gap Closure/Goods Movement; Various streets in Palmdale area - Intersection improvement projects (Local)
64 Palmdale Highway Corridor/Gap Closure/Goods Movement; Avenue S at 47th Street East/SR 138 Intersection Widening
65 Palmdale Highway Corridor/Gap Closure/Goods Movement; Fort Tejon Road/SR 138 at Avenue T Intersection Widening
66 Palmdale Highway Corridor/Gap Closure/Goods Movement; Palmdale Blvd at 30th Street East Intersection Widening
67 Palmdale Highway Corridor/Gap Closure/Goods Movement; Palmdale Blvd at 40th Street East Intersection Widening
88 Lancaster Highway Corridor/Gap Closure/Goods Movement; 36th St West from Avenue J-8 to Avenue J-10 89 Lancaster Highway Corridor/Gap Closure/Goods Movement; 37th St West from Avenue J-8 to Avenue J-10 90 Lancaster Highway Corridor/Gap Closure/Goods Movement; 6th St East from Avenue J-10 to Avenue J-11 91 Lancaster Highway Corridor/Gap Closure/Goods Movement; 7th St East from Avenue J-10 to Avenue J-11 92 Lancaster Highway Corridor/Gap Closure/Goods Movement; 8th St East from Avenue J-10 to Avenue J-11 93 Lancaster Highway Corridor/Gap Closure/Goods Movement; Yucca Avenue from Avenue J-11 to 1100 feet
north of Ave J-11 94 Lancaster Highway Corridor/Gap Closure/Goods Movement; 35th West, Ave J-10 to Ave J-12 95 Lancaster Highway Corridor/Gap Closure/Goods Movement; 22nd St West from Avenue L to Avenue L-8 96 Lancaster Highway Corridor/Gap Closure/Goods Movement; 5th St East, Ave J to Ave J-8 97 Lancaster Highway Corridor/Gap Closure/Goods Movement; 8th St East from Avenue J-6 to Avenue J-8 98 Lancaster Highway Corridor/Gap Closure/Goods Movement; 42nd St West, Ave K to Ave J-10 99 Lancaster Highway Corridor/Gap Closure/Goods Movement; 21st Street West from Avenue L to Avenue M 100 Lancaster Highway Corridor/Gap Closure/Goods Movement; 23rd St West from Avenue L-4 to Avenue M 101 Lancaster Highway Corridor/Gap Closure/Goods Movement; 32nd St West from Avenue L-8 to Avenue M 102 Lancaster Highway Corridor/Gap Closure/Goods Movement; 3rd Street East from Avenue L to Avenue M
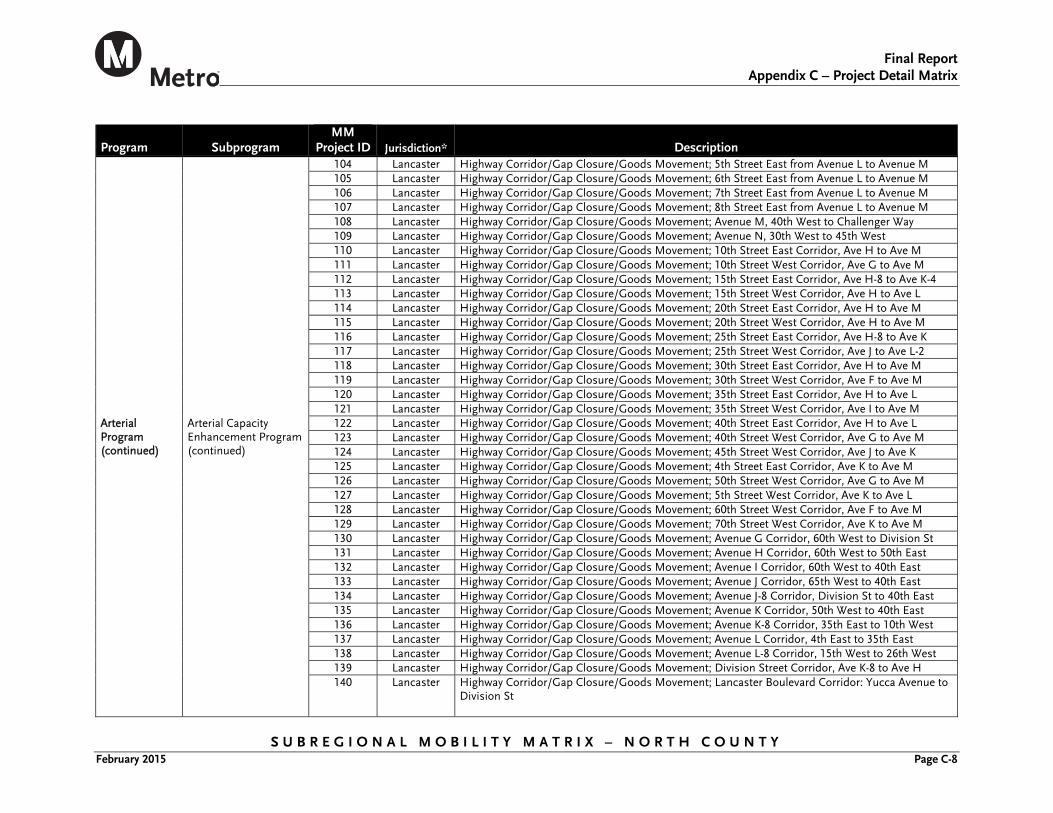
Final Report
Appendix C – Project Detail Matrix
S U B R E G I O N A L M O B I L I T Y M A T R I X – N O R T H C O U N T Y February 2015 Page C-8
Program Subprogram MM
Project ID Jurisdiction* Description
Arterial Program (continued)
Arterial Capacity Enhancement Program (continued)
104 Lancaster Highway Corridor/Gap Closure/Goods Movement; 5th Street East from Avenue L to Avenue M 105 Lancaster Highway Corridor/Gap Closure/Goods Movement; 6th Street East from Avenue L to Avenue M 106 Lancaster Highway Corridor/Gap Closure/Goods Movement; 7th Street East from Avenue L to Avenue M 107 Lancaster Highway Corridor/Gap Closure/Goods Movement; 8th Street East from Avenue L to Avenue M 108 Lancaster Highway Corridor/Gap Closure/Goods Movement; Avenue M, 40th West to Challenger Way 109 Lancaster Highway Corridor/Gap Closure/Goods Movement; Avenue N, 30th West to 45th West 110 Lancaster Highway Corridor/Gap Closure/Goods Movement; 10th Street East Corridor, Ave H to Ave M 111 Lancaster Highway Corridor/Gap Closure/Goods Movement; 10th Street West Corridor, Ave G to Ave M 112 Lancaster Highway Corridor/Gap Closure/Goods Movement; 15th Street East Corridor, Ave H-8 to Ave K-4 113 Lancaster Highway Corridor/Gap Closure/Goods Movement; 15th Street West Corridor, Ave H to Ave L 114 Lancaster Highway Corridor/Gap Closure/Goods Movement; 20th Street East Corridor, Ave H to Ave M 115 Lancaster Highway Corridor/Gap Closure/Goods Movement; 20th Street West Corridor, Ave H to Ave M 116 Lancaster Highway Corridor/Gap Closure/Goods Movement; 25th Street East Corridor, Ave H-8 to Ave K 117 Lancaster Highway Corridor/Gap Closure/Goods Movement; 25th Street West Corridor, Ave J to Ave L-2 118 Lancaster Highway Corridor/Gap Closure/Goods Movement; 30th Street East Corridor, Ave H to Ave M 119 Lancaster Highway Corridor/Gap Closure/Goods Movement; 30th Street West Corridor, Ave F to Ave M 120 Lancaster Highway Corridor/Gap Closure/Goods Movement; 35th Street East Corridor, Ave H to Ave L 121 Lancaster Highway Corridor/Gap Closure/Goods Movement; 35th Street West Corridor, Ave I to Ave M 122 Lancaster Highway Corridor/Gap Closure/Goods Movement; 40th Street East Corridor, Ave H to Ave L 123 Lancaster Highway Corridor/Gap Closure/Goods Movement; 40th Street West Corridor, Ave G to Ave M 124 Lancaster Highway Corridor/Gap Closure/Goods Movement; 45th Street West Corridor, Ave J to Ave K 125 Lancaster Highway Corridor/Gap Closure/Goods Movement; 4th Street East Corridor, Ave K to Ave M 126 Lancaster Highway Corridor/Gap Closure/Goods Movement; 50th Street West Corridor, Ave G to Ave M 127 Lancaster Highway Corridor/Gap Closure/Goods Movement; 5th Street West Corridor, Ave K to Ave L 128 Lancaster Highway Corridor/Gap Closure/Goods Movement; 60th Street West Corridor, Ave F to Ave M 129 Lancaster Highway Corridor/Gap Closure/Goods Movement; 70th Street West Corridor, Ave K to Ave M 130 Lancaster Highway Corridor/Gap Closure/Goods Movement; Avenue G Corridor, 60th West to Division St 131 Lancaster Highway Corridor/Gap Closure/Goods Movement; Avenue H Corridor, 60th West to 50th East 132 Lancaster Highway Corridor/Gap Closure/Goods Movement; Avenue I Corridor, 60th West to 40th East 133 Lancaster Highway Corridor/Gap Closure/Goods Movement; Avenue J Corridor, 65th West to 40th East 134 Lancaster Highway Corridor/Gap Closure/Goods Movement; Avenue J-8 Corridor, Division St to 40th East 135 Lancaster Highway Corridor/Gap Closure/Goods Movement; Avenue K Corridor, 50th West to 40th East 136 Lancaster Highway Corridor/Gap Closure/Goods Movement; Avenue K-8 Corridor, 35th East to 10th West 137 Lancaster Highway Corridor/Gap Closure/Goods Movement; Avenue L Corridor, 4th East to 35th East 138 Lancaster Highway Corridor/Gap Closure/Goods Movement; Avenue L-8 Corridor, 15th West to 26th West 139 Lancaster Highway Corridor/Gap Closure/Goods Movement; Division Street Corridor, Ave K-8 to Ave H 140 Lancaster Highway Corridor/Gap Closure/Goods Movement; Lancaster Boulevard Corridor: Yucca Avenue to
Division St
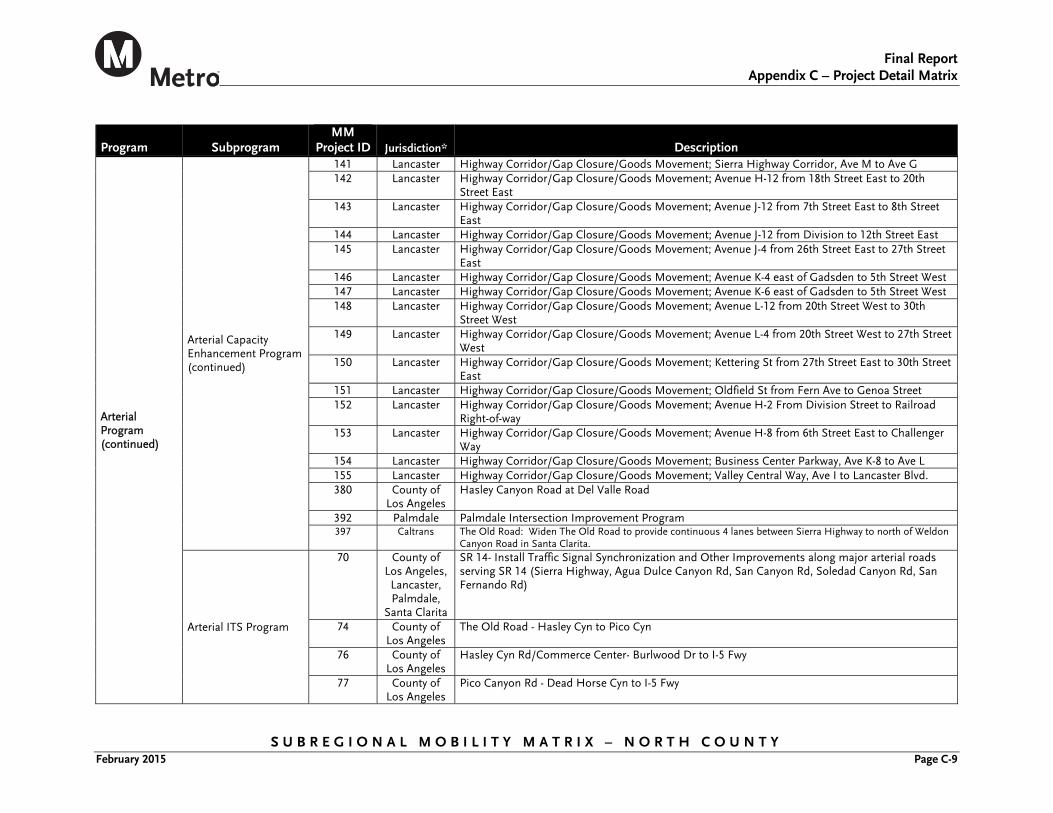
Final Report
Appendix C – Project Detail Matrix
S U B R E G I O N A L M O B I L I T Y M A T R I X – N O R T H C O U N T Y February 2015 Page C-9
Program Subprogram MM
Project ID Jurisdiction* Description
Arterial Program (continued)
Arterial Capacity Enhancement Program (continued)
141 Lancaster Highway Corridor/Gap Closure/Goods Movement; Sierra Highway Corridor, Ave M to Ave G 142 Lancaster Highway Corridor/Gap Closure/Goods Movement; Avenue H-12 from 18th Street East to 20th
Street East 143 Lancaster Highway Corridor/Gap Closure/Goods Movement; Avenue J-12 from 7th Street East to 8th Street
East 144 Lancaster Highway Corridor/Gap Closure/Goods Movement; Avenue J-12 from Division to 12th Street East 145 Lancaster Highway Corridor/Gap Closure/Goods Movement; Avenue J-4 from 26th Street East to 27th Street
East 146 Lancaster Highway Corridor/Gap Closure/Goods Movement; Avenue K-4 east of Gadsden to 5th Street West 147 Lancaster Highway Corridor/Gap Closure/Goods Movement; Avenue K-6 east of Gadsden to 5th Street West 148 Lancaster Highway Corridor/Gap Closure/Goods Movement; Avenue L-12 from 20th Street West to 30th
Street West 149 Lancaster Highway Corridor/Gap Closure/Goods Movement; Avenue L-4 from 20th Street West to 27th Street
West 150 Lancaster Highway Corridor/Gap Closure/Goods Movement; Kettering St from 27th Street East to 30th Street
East 151 Lancaster Highway Corridor/Gap Closure/Goods Movement; Oldfield St from Fern Ave to Genoa Street 152 Lancaster Highway Corridor/Gap Closure/Goods Movement; Avenue H-2 From Division Street to Railroad
Right-of-way 153 Lancaster Highway Corridor/Gap Closure/Goods Movement; Avenue H-8 from 6th Street East to Challenger
Way 154 Lancaster Highway Corridor/Gap Closure/Goods Movement; Business Center Parkway, Ave K-8 to Ave L 155 Lancaster Highway Corridor/Gap Closure/Goods Movement; Valley Central Way, Ave I to Lancaster Blvd. 380 County of
Los Angeles Hasley Canyon Road at Del Valle Road
392 Palmdale Palmdale Intersection Improvement Program 397 Caltrans The Old Road: Widen The Old Road to provide continuous 4 lanes between Sierra Highway to north of Weldon
Canyon Road in Santa Clarita.
Arterial ITS Program
70 County of Los Angeles, Lancaster, Palmdale,
Santa Clarita
SR 14- Install Traffic Signal Synchronization and Other Improvements along major arterial roads serving SR 14 (Sierra Highway, Agua Dulce Canyon Rd, San Canyon Rd, Soledad Canyon Rd, San Fernando Rd)
74 County of Los Angeles
The Old Road - Hasley Cyn to Pico Cyn
76 County of Los Angeles
Hasley Cyn Rd/Commerce Center- Burlwood Dr to I-5 Fwy
77 County of Los Angeles
Pico Canyon Rd - Dead Horse Cyn to I-5 Fwy
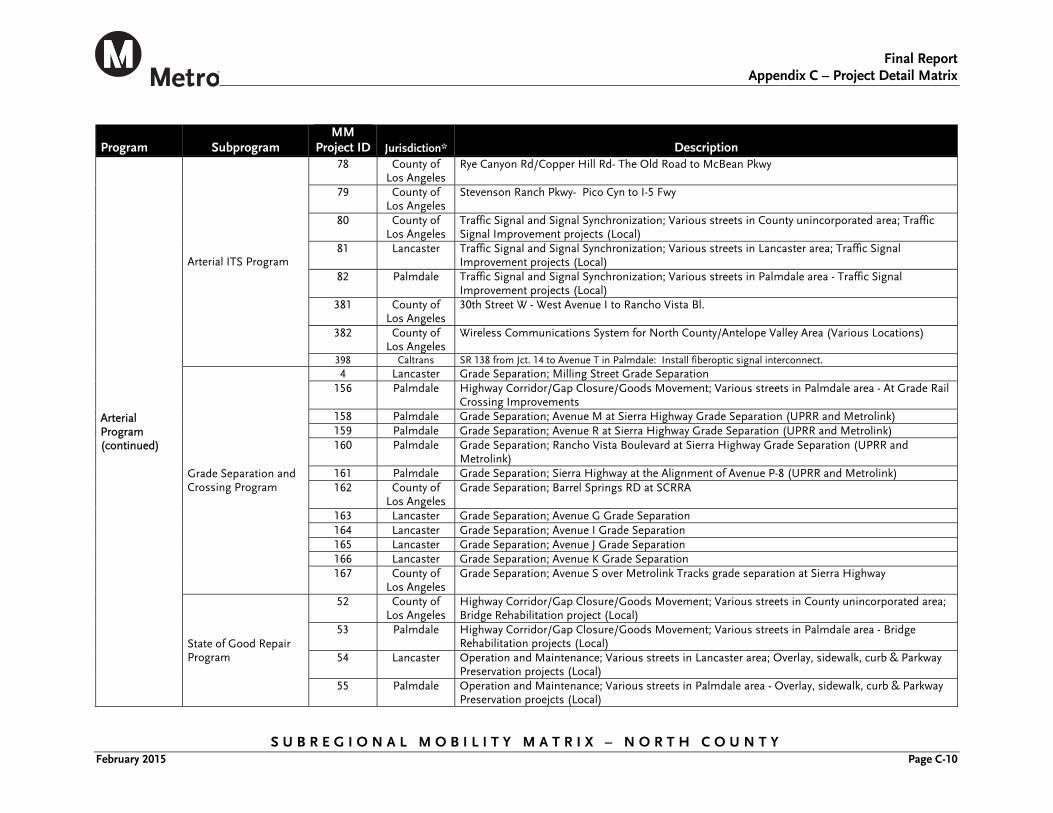
Final Report
Appendix C – Project Detail Matrix
S U B R E G I O N A L M O B I L I T Y M A T R I X – N O R T H C O U N T Y February 2015 Page C-10
Program Subprogram MM
Project ID Jurisdiction* Description
Arterial Program (continued)
Arterial ITS Program
78 County of Los Angeles
Rye Canyon Rd/Copper Hill Rd- The Old Road to McBean Pkwy
79 County of Los Angeles
Stevenson Ranch Pkwy- Pico Cyn to I-5 Fwy
80 County of Los Angeles
Traffic Signal and Signal Synchronization; Various streets in County unincorporated area; Traffic Signal Improvement projects (Local)
81 Lancaster Traffic Signal and Signal Synchronization; Various streets in Lancaster area; Traffic Signal Improvement projects (Local)
82 Palmdale Traffic Signal and Signal Synchronization; Various streets in Palmdale area - Traffic Signal Improvement projects (Local)
381 County of Los Angeles
30th Street W - West Avenue I to Rancho Vista Bl.
382 County of Los Angeles
Wireless Communications System for North County/Antelope Valley Area (Various Locations)
398 Caltrans SR 138 from Jct. 14 to Avenue T in Palmdale: Install fiberoptic signal interconnect.
Grade Separation and Crossing Program
4 Lancaster Grade Separation; Milling Street Grade Separation 156 Palmdale Highway Corridor/Gap Closure/Goods Movement; Various streets in Palmdale area - At Grade Rail
Crossing Improvements 158 Palmdale Grade Separation; Avenue M at Sierra Highway Grade Separation (UPRR and Metrolink) 159 Palmdale Grade Separation; Avenue R at Sierra Highway Grade Separation (UPRR and Metrolink) 160 Palmdale Grade Separation; Rancho Vista Boulevard at Sierra Highway Grade Separation (UPRR and
Metrolink) 161 Palmdale Grade Separation; Sierra Highway at the Alignment of Avenue P-8 (UPRR and Metrolink) 162 County of
Los Angeles Grade Separation; Barrel Springs RD at SCRRA
163 Lancaster Grade Separation; Avenue G Grade Separation 164 Lancaster Grade Separation; Avenue I Grade Separation 165 Lancaster Grade Separation; Avenue J Grade Separation 166 Lancaster Grade Separation; Avenue K Grade Separation 167 County of
Los Angeles Grade Separation; Avenue S over Metrolink Tracks grade separation at Sierra Highway
State of Good Repair Program
52 County of Los Angeles
Highway Corridor/Gap Closure/Goods Movement; Various streets in County unincorporated area; Bridge Rehabilitation project (Local)
53 Palmdale Highway Corridor/Gap Closure/Goods Movement; Various streets in Palmdale area - Bridge Rehabilitation projects (Local)
54 Lancaster Operation and Maintenance; Various streets in Lancaster area; Overlay, sidewalk, curb & Parkway Preservation projects (Local)
55 Palmdale Operation and Maintenance; Various streets in Palmdale area - Overlay, sidewalk, curb & Parkway Preservation proejcts (Local)
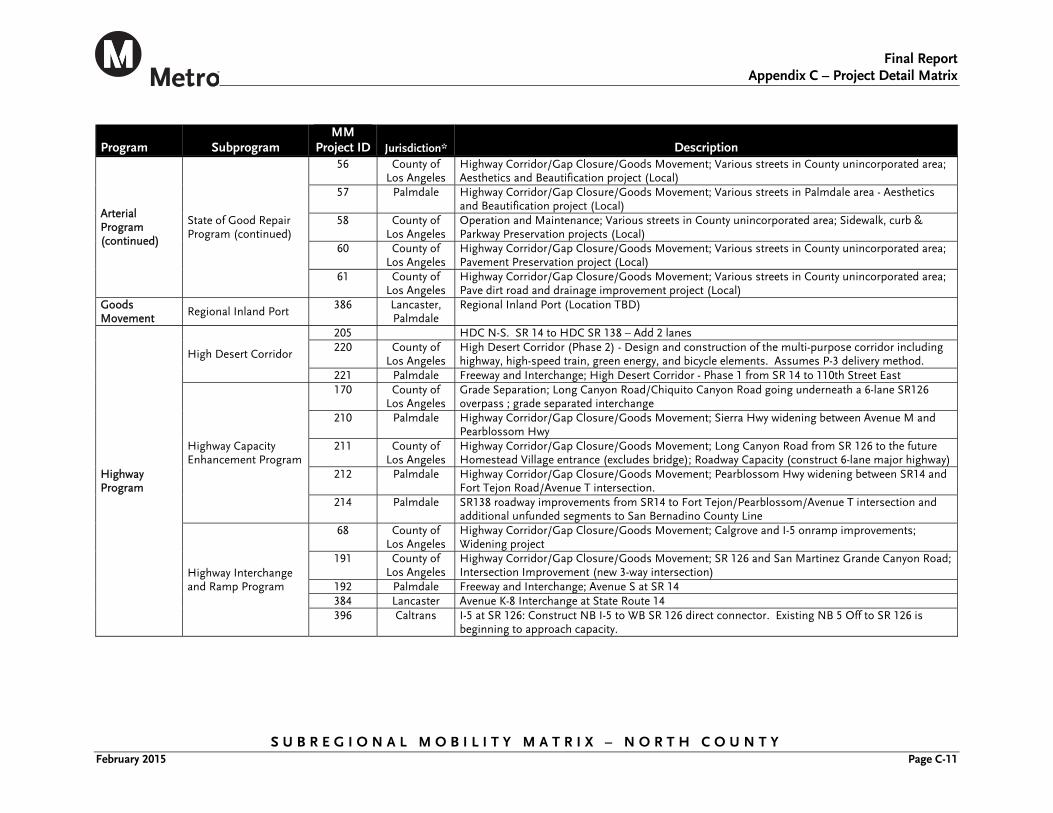
Final Report
Appendix C – Project Detail Matrix
S U B R E G I O N A L M O B I L I T Y M A T R I X – N O R T H C O U N T Y February 2015 Page C-11
Program Subprogram MM
Project ID Jurisdiction* Description
Arterial Program (continued)
State of Good Repair Program (continued)
56 County of Los Angeles
Highway Corridor/Gap Closure/Goods Movement; Various streets in County unincorporated area; Aesthetics and Beautification project (Local)
57 Palmdale Highway Corridor/Gap Closure/Goods Movement; Various streets in Palmdale area - Aesthetics and Beautification project (Local)
58 County of Los Angeles
Operation and Maintenance; Various streets in County unincorporated area; Sidewalk, curb & Parkway Preservation projects (Local)
60 County of Los Angeles
Highway Corridor/Gap Closure/Goods Movement; Various streets in County unincorporated area; Pavement Preservation project (Local)
61 County of Los Angeles
Highway Corridor/Gap Closure/Goods Movement; Various streets in County unincorporated area; Pave dirt road and drainage improvement project (Local)
Goods Movement
Regional Inland Port 386 Lancaster,
Palmdale Regional Inland Port (Location TBD)
Highway Program
High Desert Corridor
205 HDC N-S. SR 14 to HDC SR 138 – Add 2 lanes 220 County of
Los Angeles High Desert Corridor (Phase 2) - Design and construction of the multi-purpose corridor including highway, high-speed train, green energy, and bicycle elements. Assumes P-3 delivery method.
221 Palmdale Freeway and Interchange; High Desert Corridor - Phase 1 from SR 14 to 110th Street East
Highway Capacity Enhancement Program
170 County of Los Angeles
Grade Separation; Long Canyon Road/Chiquito Canyon Road going underneath a 6-lane SR126 overpass ; grade separated interchange
210 Palmdale Highway Corridor/Gap Closure/Goods Movement; Sierra Hwy widening between Avenue M and Pearblossom Hwy
211 County of Los Angeles
Highway Corridor/Gap Closure/Goods Movement; Long Canyon Road from SR 126 to the future Homestead Village entrance (excludes bridge); Roadway Capacity (construct 6-lane major highway)
212 Palmdale Highway Corridor/Gap Closure/Goods Movement; Pearblossom Hwy widening between SR14 and Fort Tejon Road/Avenue T intersection.
214 Palmdale SR138 roadway improvements from SR14 to Fort Tejon/Pearblossom/Avenue T intersection and additional unfunded segments to San Bernadino County Line
Highway Interchange and Ramp Program
68 County of Los Angeles
Highway Corridor/Gap Closure/Goods Movement; Calgrove and I-5 onramp improvements; Widening project
191 County of Los Angeles
Highway Corridor/Gap Closure/Goods Movement; SR 126 and San Martinez Grande Canyon Road; Intersection Improvement (new 3-way intersection)
192 Palmdale Freeway and Interchange; Avenue S at SR 14 384 Lancaster Avenue K-8 Interchange at State Route 14 396 Caltrans I-5 at SR 126: Construct NB I-5 to WB SR 126 direct connector. Existing NB 5 Off to SR 126 is
beginning to approach capacity.
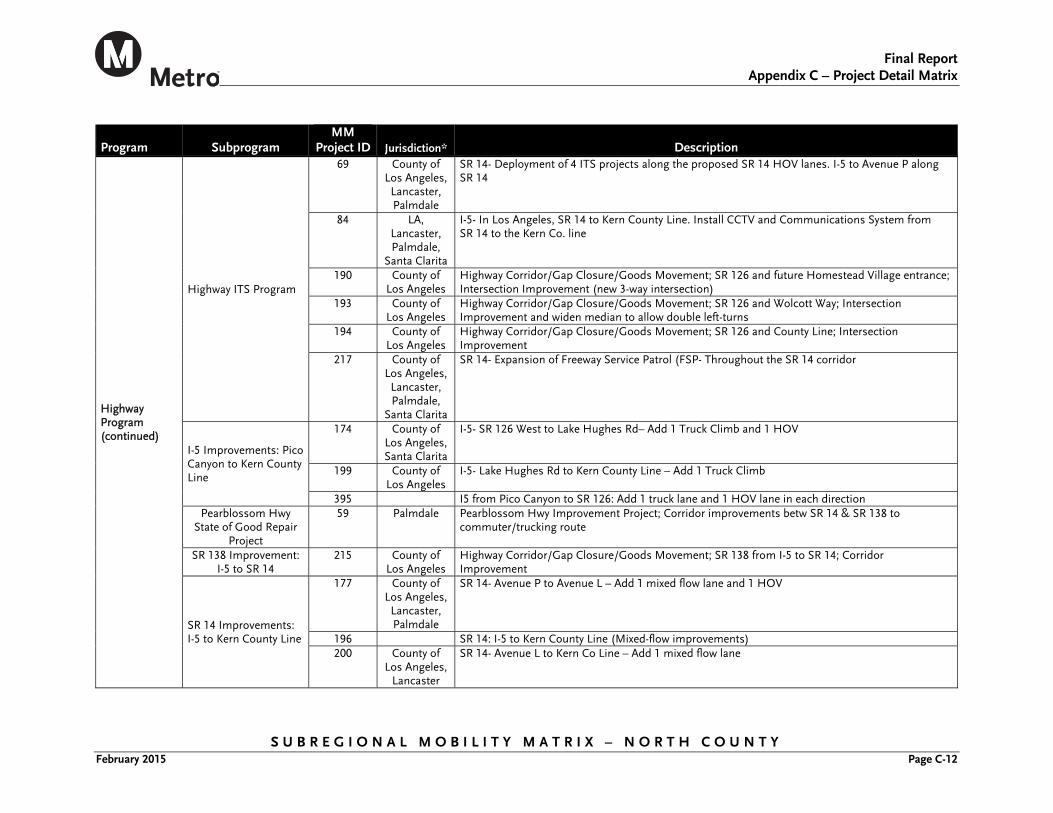
Final Report
Appendix C – Project Detail Matrix
S U B R E G I O N A L M O B I L I T Y M A T R I X – N O R T H C O U N T Y February 2015 Page C-12
Program Subprogram MM
Project ID Jurisdiction* Description
Highway Program (continued)
Highway ITS Program
69 County of Los Angeles, Lancaster, Palmdale
SR 14- Deployment of 4 ITS projects along the proposed SR 14 HOV lanes. I-5 to Avenue P along SR 14
84 LA, Lancaster, Palmdale,
Santa Clarita
I-5- In Los Angeles, SR 14 to Kern County Line. Install CCTV and Communications System from SR 14 to the Kern Co. line
190 County of Los Angeles
Highway Corridor/Gap Closure/Goods Movement; SR 126 and future Homestead Village entrance; Intersection Improvement (new 3-way intersection)
193 County of Los Angeles
Highway Corridor/Gap Closure/Goods Movement; SR 126 and Wolcott Way; Intersection Improvement and widen median to allow double left-turns
194 County of Los Angeles
Highway Corridor/Gap Closure/Goods Movement; SR 126 and County Line; Intersection Improvement
217 County of Los Angeles, Lancaster, Palmdale,
Santa Clarita
SR 14- Expansion of Freeway Service Patrol (FSP- Throughout the SR 14 corridor
I-5 Improvements: Pico Canyon to Kern County Line
174 County of Los Angeles, Santa Clarita
I-5- SR 126 West to Lake Hughes Rd– Add 1 Truck Climb and 1 HOV
199 County of Los Angeles
I-5- Lake Hughes Rd to Kern County Line – Add 1 Truck Climb
395 I5 from Pico Canyon to SR 126: Add 1 truck lane and 1 HOV lane in each direction Pearblossom Hwy
State of Good Repair Project
59 Palmdale Pearblossom Hwy Improvement Project; Corridor improvements betw SR 14 & SR 138 to commuter/trucking route
SR 138 Improvement: I-5 to SR 14
215 County of Los Angeles
Highway Corridor/Gap Closure/Goods Movement; SR 138 from I-5 to SR 14; Corridor Improvement
SR 14 Improvements: I-5 to Kern County Line
177 County of Los Angeles, Lancaster, Palmdale
SR 14- Avenue P to Avenue L – Add 1 mixed flow lane and 1 HOV
196 SR 14: I-5 to Kern County Line (Mixed-flow improvements) 200 County of
Los Angeles, Lancaster
SR 14- Avenue L to Kern Co Line – Add 1 mixed flow lane
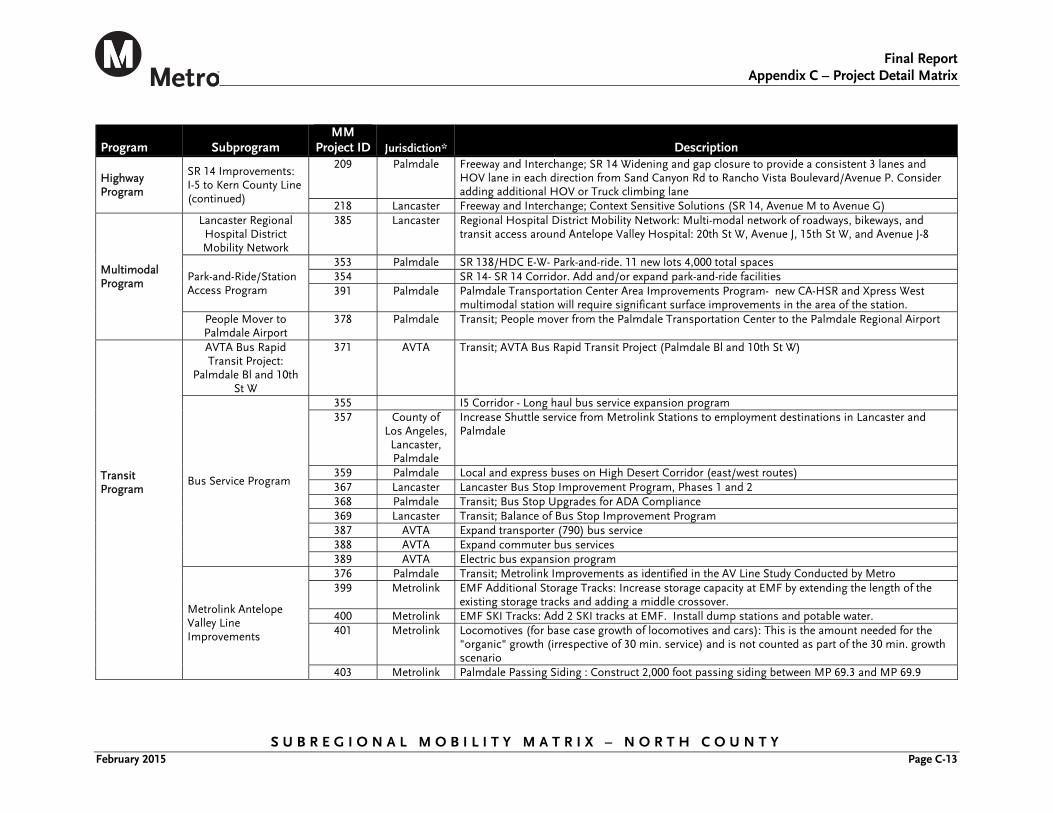
Final Report
Appendix C – Project Detail Matrix
S U B R E G I O N A L M O B I L I T Y M A T R I X – N O R T H C O U N T Y February 2015 Page C-13
Program Subprogram MM
Project ID Jurisdiction* Description
Highway Program
SR 14 Improvements: I-5 to Kern County Line (continued)
209 Palmdale Freeway and Interchange; SR 14 Widening and gap closure to provide a consistent 3 lanes and HOV lane in each direction from Sand Canyon Rd to Rancho Vista Boulevard/Avenue P. Consider adding additional HOV or Truck climbing lane
218 Lancaster Freeway and Interchange; Context Sensitive Solutions (SR 14, Avenue M to Avenue G)
Multimodal Program
Lancaster Regional Hospital District Mobility Network
385 Lancaster Regional Hospital District Mobility Network: Multi-modal network of roadways, bikeways, and transit access around Antelope Valley Hospital: 20th St W, Avenue J, 15th St W, and Avenue J-8
Park-and-Ride/Station Access Program
353 Palmdale SR 138/HDC E-W- Park-and-ride. 11 new lots 4,000 total spaces 354 SR 14- SR 14 Corridor. Add and/or expand park-and-ride facilities 391 Palmdale Palmdale Transportation Center Area Improvements Program- new CA-HSR and Xpress West
multimodal station will require significant surface improvements in the area of the station. People Mover to Palmdale Airport
378 Palmdale Transit; People mover from the Palmdale Transportation Center to the Palmdale Regional Airport
Transit Program
AVTA Bus Rapid Transit Project:
Palmdale Bl and 10th St W
371 AVTA Transit; AVTA Bus Rapid Transit Project (Palmdale Bl and 10th St W)
Bus Service Program
355 I5 Corridor - Long haul bus service expansion program 357 County of
Los Angeles, Lancaster, Palmdale
Increase Shuttle service from Metrolink Stations to employment destinations in Lancaster and Palmdale
359 Palmdale Local and express buses on High Desert Corridor (east/west routes) 367 Lancaster Lancaster Bus Stop Improvement Program, Phases 1 and 2 368 Palmdale Transit; Bus Stop Upgrades for ADA Compliance 369 Lancaster Transit; Balance of Bus Stop Improvement Program 387 AVTA Expand transporter (790) bus service 388 AVTA Expand commuter bus services 389 AVTA Electric bus expansion program
Metrolink Antelope Valley Line Improvements
376 Palmdale Transit; Metrolink Improvements as identified in the AV Line Study Conducted by Metro 399 Metrolink EMF Additional Storage Tracks: Increase storage capacity at EMF by extending the length of the
existing storage tracks and adding a middle crossover. 400 Metrolink EMF SKI Tracks: Add 2 SKI tracks at EMF. Install dump stations and potable water. 401 Metrolink Locomotives (for base case growth of locomotives and cars): This is the amount needed for the
"organic" growth (irrespective of 30 min. service) and is not counted as part of the 30 min. growth scenario
403 Metrolink Palmdale Passing Siding : Construct 2,000 foot passing siding between MP 69.3 and MP 69.9
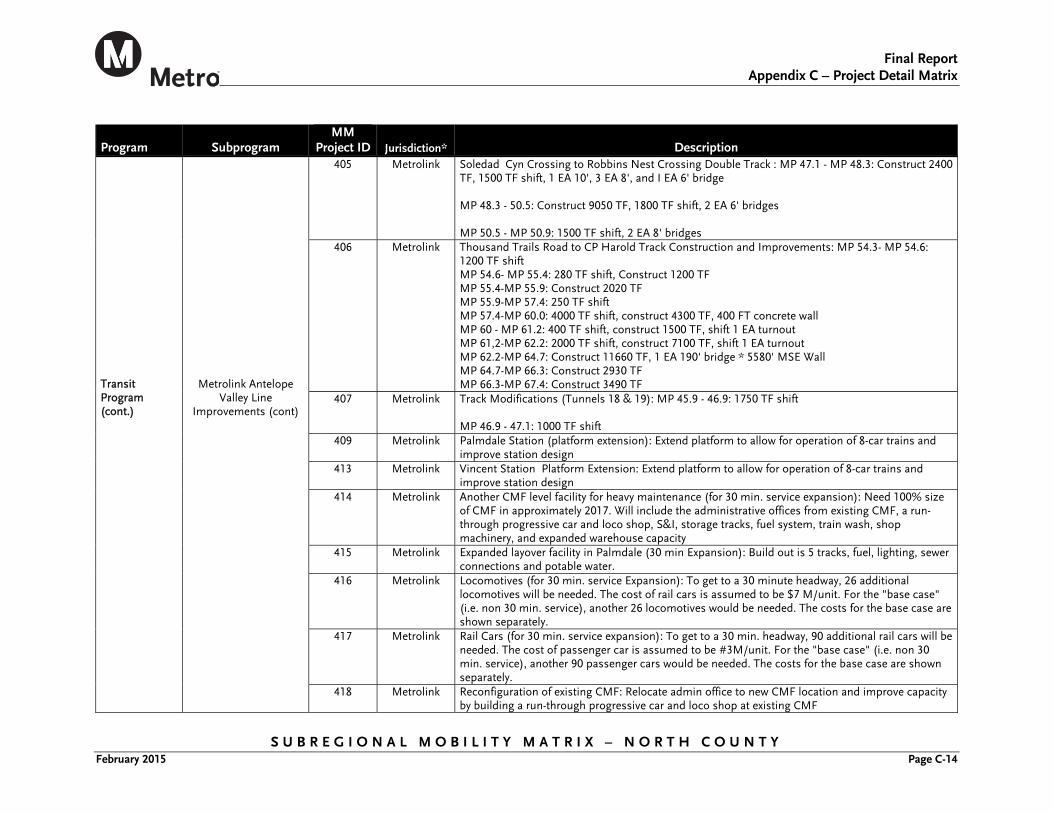
Final Report
Appendix C – Project Detail Matrix
S U B R E G I O N A L M O B I L I T Y M A T R I X – N O R T H C O U N T Y February 2015 Page C-14
Program Subprogram MM
Project ID Jurisdiction* Description Transit Program (cont.)
Metrolink Antelope Valley Line
Improvements (cont)
405 Metrolink Soledad Cyn Crossing to Robbins Nest Crossing Double Track : MP 47.1 - MP 48.3: Construct 2400 TF, 1500 TF shift, 1 EA 10', 3 EA 8', and I EA 6' bridge MP 48.3 - 50.5: Construct 9050 TF, 1800 TF shift, 2 EA 6' bridges MP 50.5 - MP 50.9: 1500 TF shift, 2 EA 8' bridges
406 Metrolink Thousand Trails Road to CP Harold Track Construction and Improvements: MP 54.3- MP 54.6: 1200 TF shift MP 54.6- MP 55.4: 280 TF shift, Construct 1200 TF MP 55.4-MP 55.9: Construct 2020 TF MP 55.9-MP 57.4: 250 TF shift MP 57.4-MP 60.0: 4000 TF shift, construct 4300 TF, 400 FT concrete wall MP 60 - MP 61.2: 400 TF shift, construct 1500 TF, shift 1 EA turnout MP 61,2-MP 62.2: 2000 TF shift, construct 7100 TF, shift 1 EA turnout MP 62.2-MP 64.7: Construct 11660 TF, 1 EA 190' bridge * 5580' MSE Wall MP 64.7-MP 66.3: Construct 2930 TF MP 66.3-MP 67.4: Construct 3490 TF
407 Metrolink Track Modifications (Tunnels 18 & 19): MP 45.9 - 46.9: 1750 TF shift MP 46.9 - 47.1: 1000 TF shift
409 Metrolink Palmdale Station (platform extension): Extend platform to allow for operation of 8-car trains and improve station design
413 Metrolink Vincent Station Platform Extension: Extend platform to allow for operation of 8-car trains and improve station design
414 Metrolink Another CMF level facility for heavy maintenance (for 30 min. service expansion): Need 100% size of CMF in approximately 2017. Will include the administrative offices from existing CMF, a run-through progressive car and loco shop, S&I, storage tracks, fuel system, train wash, shop machinery, and expanded warehouse capacity
415 Metrolink Expanded layover facility in Palmdale (30 min Expansion): Build out is 5 tracks, fuel, lighting, sewer connections and potable water.
416 Metrolink Locomotives (for 30 min. service Expansion): To get to a 30 minute headway, 26 additional locomotives will be needed. The cost of rail cars is assumed to be $7 M/unit. For the "base case" (i.e. non 30 min. service), another 26 locomotives would be needed. The costs for the base case are shown separately.
417 Metrolink Rail Cars (for 30 min. service expansion): To get to a 30 min. headway, 90 additional rail cars will be needed. The cost of passenger car is assumed to be #3M/unit. For the "base case" (i.e. non 30 min. service), another 90 passenger cars would be needed. The costs for the base case are shown separately.
418 Metrolink Reconfiguration of existing CMF: Relocate admin office to new CMF location and improve capacity by building a run-through progressive car and loco shop at existing CMF
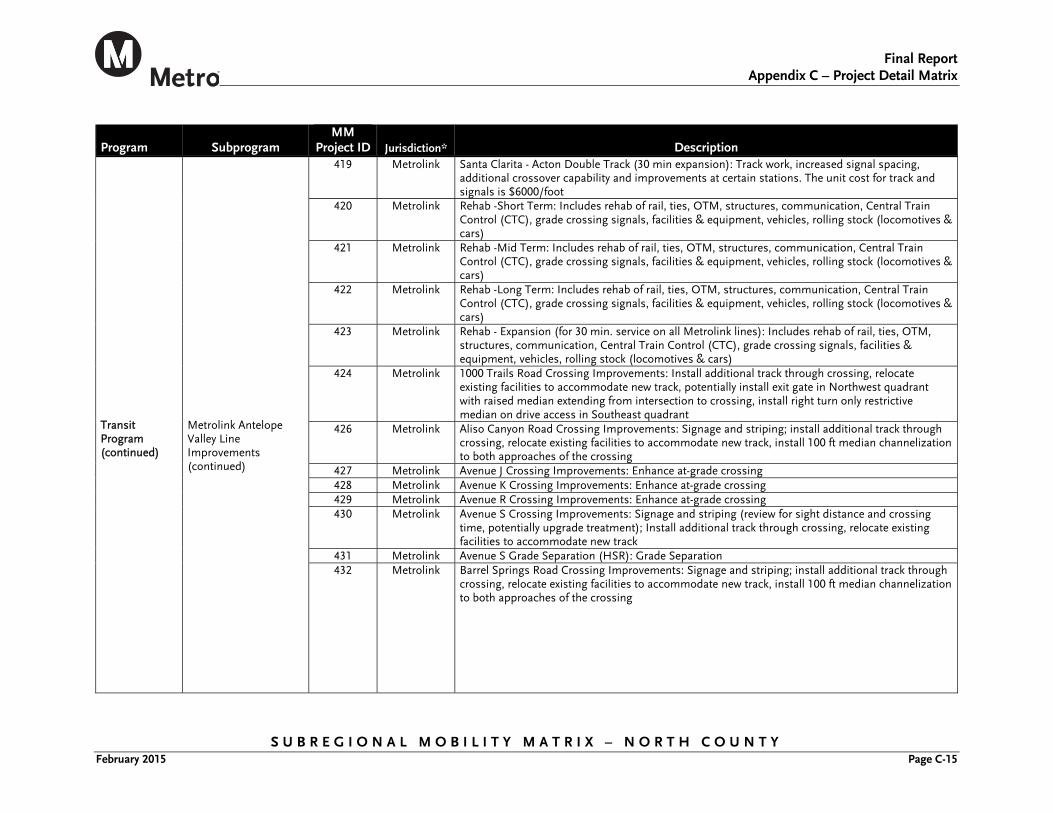
Final Report
Appendix C – Project Detail Matrix
S U B R E G I O N A L M O B I L I T Y M A T R I X – N O R T H C O U N T Y February 2015 Page C-15
Program Subprogram MM
Project ID Jurisdiction* Description Transit Program (continued)
Metrolink Antelope Valley Line Improvements (continued)
419 Metrolink Santa Clarita - Acton Double Track (30 min expansion): Track work, increased signal spacing, additional crossover capability and improvements at certain stations. The unit cost for track and signals is $6000/foot
420 Metrolink Rehab -Short Term: Includes rehab of rail, ties, OTM, structures, communication, Central Train Control (CTC), grade crossing signals, facilities & equipment, vehicles, rolling stock (locomotives & cars)
421 Metrolink Rehab -Mid Term: Includes rehab of rail, ties, OTM, structures, communication, Central Train Control (CTC), grade crossing signals, facilities & equipment, vehicles, rolling stock (locomotives & cars)
422 Metrolink Rehab -Long Term: Includes rehab of rail, ties, OTM, structures, communication, Central Train Control (CTC), grade crossing signals, facilities & equipment, vehicles, rolling stock (locomotives & cars)
423 Metrolink Rehab - Expansion (for 30 min. service on all Metrolink lines): Includes rehab of rail, ties, OTM, structures, communication, Central Train Control (CTC), grade crossing signals, facilities & equipment, vehicles, rolling stock (locomotives & cars)
424 Metrolink 1000 Trails Road Crossing Improvements: Install additional track through crossing, relocate existing facilities to accommodate new track, potentially install exit gate in Northwest quadrant with raised median extending from intersection to crossing, install right turn only restrictive median on drive access in Southeast quadrant
426 Metrolink Aliso Canyon Road Crossing Improvements: Signage and striping; install additional track through crossing, relocate existing facilities to accommodate new track, install 100 ft median channelization to both approaches of the crossing
427 Metrolink Avenue J Crossing Improvements: Enhance at-grade crossing 428 Metrolink Avenue K Crossing Improvements: Enhance at-grade crossing 429 Metrolink Avenue R Crossing Improvements: Enhance at-grade crossing 430 Metrolink Avenue S Crossing Improvements: Signage and striping (review for sight distance and crossing
time, potentially upgrade treatment); Install additional track through crossing, relocate existing facilities to accommodate new track
431 Metrolink Avenue S Grade Separation (HSR): Grade Separation 432 Metrolink Barrel Springs Road Crossing Improvements: Signage and striping; install additional track through
crossing, relocate existing facilities to accommodate new track, install 100 ft median channelization to both approaches of the crossing
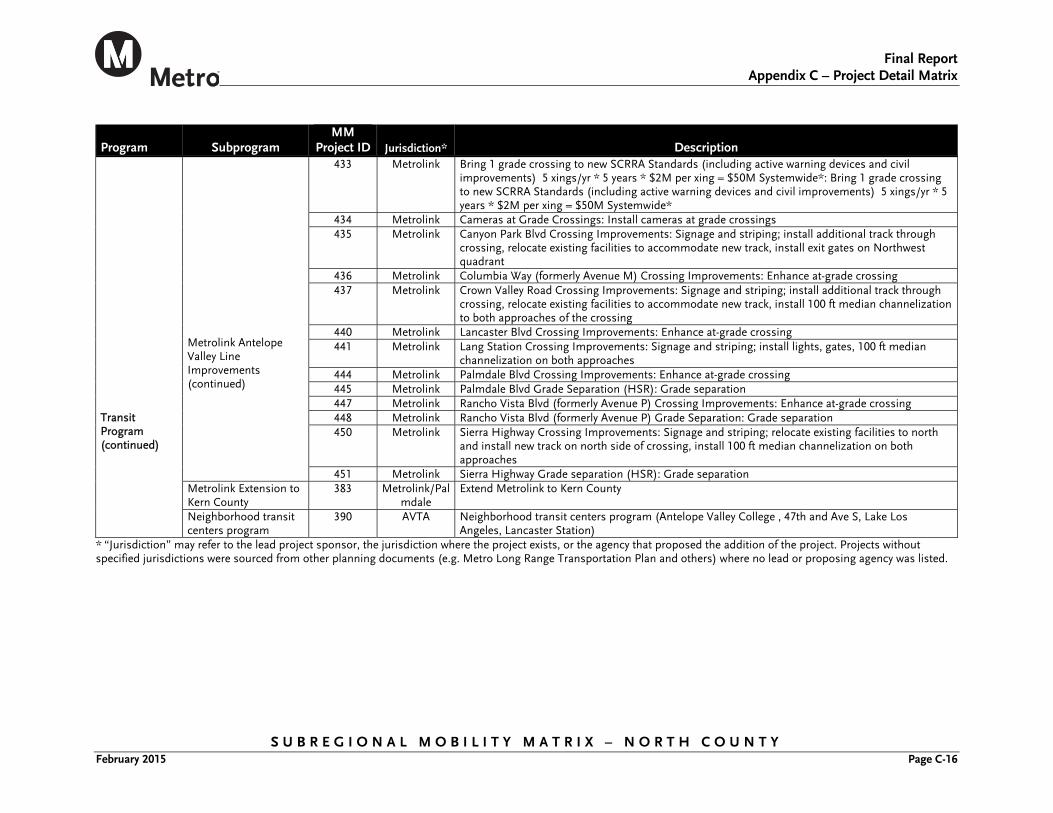
Final Report
Appendix C – Project Detail Matrix
S U B R E G I O N A L M O B I L I T Y M A T R I X – N O R T H C O U N T Y February 2015 Page C-16
Program Subprogram MM
Project ID Jurisdiction* Description Metrolink Antelope Valley Line Improvements (continued)
433 Metrolink Bring 1 grade crossing to new SCRRA Standards (including active warning devices and civil improvements) 5 xings/yr * 5 years * $2M per xing = $50M Systemwide*: Bring 1 grade crossing to new SCRRA Standards (including active warning devices and civil improvements) 5 xings/yr * 5 years * $2M per xing = $50M Systemwide*
434 Metrolink Cameras at Grade Crossings: Install cameras at grade crossings 435 Metrolink Canyon Park Blvd Crossing Improvements: Signage and striping; install additional track through
crossing, relocate existing facilities to accommodate new track, install exit gates on Northwest quadrant
436 Metrolink Columbia Way (formerly Avenue M) Crossing Improvements: Enhance at-grade crossing 437 Metrolink Crown Valley Road Crossing Improvements: Signage and striping; install additional track through
crossing, relocate existing facilities to accommodate new track, install 100 ft median channelization to both approaches of the crossing
Transit Program (continued)
440 Metrolink Lancaster Blvd Crossing Improvements: Enhance at-grade crossing 441 Metrolink Lang Station Crossing Improvements: Signage and striping; install lights, gates, 100 ft median
channelization on both approaches 444 Metrolink Palmdale Blvd Crossing Improvements: Enhance at-grade crossing 445 Metrolink Palmdale Blvd Grade Separation (HSR): Grade separation 447 Metrolink Rancho Vista Blvd (formerly Avenue P) Crossing Improvements: Enhance at-grade crossing 448 Metrolink Rancho Vista Blvd (formerly Avenue P) Grade Separation: Grade separation 450 Metrolink Sierra Highway Crossing Improvements: Signage and striping; relocate existing facilities to north
and install new track on north side of crossing, install 100 ft median channelization on both approaches
451 Metrolink Sierra Highway Grade separation (HSR): Grade separation Metrolink Extension to Kern County
383 Metrolink/Palmdale
Extend Metrolink to Kern County
Neighborhood transit centers program
390 AVTA Neighborhood transit centers program (Antelope Valley College , 47th and Ave S, Lake Los Angeles, Lancaster Station)
* “Jurisdiction” may refer to the lead project sponsor, the jurisdiction where the project exists, or the agency that proposed the addition of the project. Projects without specified jurisdictions were sourced from other planning documents (e.g. Metro Long Range Transportation Plan and others) where no lead or proposing agency was listed.
Final Report
Appendix D – Baseline Conditions Report
S U B R E G I O N A L M O B I L I T Y M A T R I X – N O R T H C O U N T Y February 2015 Page D-1
APPENDIX D BASELINE CONDITIONS REPORT
The North County Baseline Conditions Report is attached as Appendix D.
SUBREGIONAL MOBILITY MATRIX
North Los Angeles County Project No. PS-4010-3041-F-01-TO2
Baseline Conditions – Final Report
Prepared for:
Prepared by: Cambridge Systematics, Inc. 445 S. Figueroa Street, Suite 3100
Los Angeles, CA 90071
January 2015
S U B R E G I O N A L M O B I L I T Y M A T R I X – N O R T H C O U N T Y
Baseline Conditions – Final Report
Subregional Mobility Matrix North Los Angeles County
PS-4010-3041-F-01-TO2
Prepared for:
Los Angeles County
Metropolitan Transportation Authority
Prepared by: Cambridge Systematics, Inc.
Quality Review Tracking
Version # Date Reviewer Signature Description/Comments
Internal Review Draft 11/12/2014 Michael Snavely
Revised Draft 12/15/2014 Jon Overman
Final Draft 1/21/2015 Jon Overman, Michael Snavely
Baseline Conditions
North County
S U B R E G I O N A L M O B I L I T Y M A T R I X – N O R T H C O U N T Y January 2015 Page i
Table of Contents
1.0 INTRODUCTION AND SUMMARY ....................................................................................................................................................... 1-1 1.1 Study Background ........................................................................................................................................................................... 1-1 1.2 Report Purpose and Structure ........................................................................................................................................................ 1-2 1.3 Land Use and Demographics.......................................................................................................................................................... 1-2 1.4 Multimodal Transportation System ............................................................................................................................................... 1-2
2.0 EXISTING PROJECTS AND STUDIES ................................................................................................................................................... 2-1
3.0 STUDY AREA DEMOGRAPHICS ........................................................................................................................................................... 3-3 3.1 Land Use .......................................................................................................................................................................................... 3-3 3.2 Population and Employment .......................................................................................................................................................... 3-3 3.3 Environmental Justice Communities ............................................................................................................................................. 3-6
4.0 TRAVEL PATTERNS AND PREFERENCES............................................................................................................................................ 4-1 4.1 Interregional Travel Patterns .......................................................................................................................................................... 4-1 4.2 Commute Travel Modes .................................................................................................................................................................. 4-2 4.3 Passenger Vehicle Travel Demands ............................................................................................................................................... 4-2 4.4 Passenger Vehicle Through Trips .................................................................................................................................................. 4-4 4.5 System Safety ................................................................................................................................................................................... 4-4
5.0 VEHICLE TRAVEL ................................................................................................................................................................................... 5-1 5.1 Vehicle Travel Facilities ................................................................................................................................................................... 5-1 5.2 Driving Conditions .......................................................................................................................................................................... 5-1 5.3 Goods Movement Vehicle Travel .................................................................................................................................................... 5-3 5.4 Vehicle Safety ................................................................................................................................................................................... 5-3
6.0 TRANSIT ................................................................................................................................................................................................... 6-1 6.1 Passenger Rail Service ..................................................................................................................................................................... 6-1 6.2 Bus Service ....................................................................................................................................................................................... 6-1
7.0 ACTIVE TRANSPORTATION ................................................................................................................................................................. 7-1 7.1 Commute Mode Share .................................................................................................................................................................... 7-1 7.2 Bicycle Facilities ............................................................................................................................................................................... 7-1 7.3 Safety ................................................................................................................................................................................................ 7-3
8.0 CONCLUSIONS AND NEXT STEPS ....................................................................................................................................................... 8-1
Baseline Conditions
North County
S U B R E G I O N A L M O B I L I T Y M A T R I X – N O R T H C O U N T Y January 2015 Page ii
List of Tables Table 2-1. Funded, In Construction, and Completed Projects in North County .................................................................................................. 2-2 Table 3-1. Forecasted Population and Employment Growth by Jurisdiction (2014 to 2024) ............................................................................... 3-3 Table 3-2. Summary of Ethnic and Economic Characteristics............................................................................................................................... 3-6 Table 4-1. Daily Person Trips To/From North County .......................................................................................................................................... 4-1 Table 4-2. 2012 Commute Travel Mode Share ........................................................................................................................................................ 4-2 Table 4-3. Vehicle Travel Volumes to/from North Count Mobility Matrix Subregion, 2014 to 2024 ................................................................. 4-2 Table 5-1. Peak-Period Vehicle Hours of Travel and Average Trip Time, 2014 ................................................................................................... 5-1 Table 6-1. Transit Commute Mode Share, 2012 ..................................................................................................................................................... 6-1 Table 6-2. Metrolink Train Service By Station ........................................................................................................................................................ 6-1 Table 7-1. Commute Mode Share in Study Area .................................................................................................................................................... 7-1
List of Figures Figure 1-1. Los Angeles County Mobility Matrix Subregions ................................................................................................................................ 1-4 Figure 1-2. North Los Angeles County Mobility Matrix Study Area ...................................................................................................................... 1-5 Figure 3-1. Land Uses in Study Area ....................................................................................................................................................................... 3-2 Figure 3-2. 2014 Population and Employment in Study Area ............................................................................................................................... 3-4 Figure 3-3. Population and Employment Change in Study Area, 2014 to 2024 ................................................................................................... 3-5 Figure 3-4. Transit-Dependent Communities in Study Area ................................................................................................................................. 3-7 Figure 3-5. CalEnviroScreen Environmental Justice Scores .................................................................................................................................. 3-8 Figure 4-1. 2014 Average Weekday Person Trips to/from North County (All Modes) ........................................................................................ 4-3 Figure 4-2. North County Vehicle Collisions, 2007 to 2011 ................................................................................................................................... 4-4 Figure 5-1. CSAN/CMP Network of Regionally Significant Arterials ................................................................................................................... 5-2 Figure 5-2. Draft Countywide Strategic Truck Arterial Network ........................................................................................................................... 5-4 Figure 5-3. Motor Vehicle Collisions, 2009 to 2011 ................................................................................................................................................ 5-5 Figure 5-4. Trends in Collisions Involving Trucks, 2007 to 2011 .......................................................................................................................... 5-6 Figure 5-5. Truck Collisions, 2009 to 2011 .............................................................................................................................................................. 5-7 Figure 6-1. Metrolink Average Weekday Boardings (Second Quarter, 2014) ....................................................................................................... 6-2 Figure 6-2. North County Bus Service ..................................................................................................................................................................... 6-3
Baseline Conditions
North County
S U B R E G I O N A L M O B I L I T Y M A T R I X – N O R T H C O U N T Y January 2015 Page iii
Figure 7-1. Existing Bikeways in Study Area, 2014 ................................................................................................................................................ 7-2 Figure 7-2. Bicycle and Pedestrian Collisions, 2007 to 2011 .................................................................................................................................. 7-3 Figure 7-3. Pedestrian Collisions by Severity, 2007 to 2011 ................................................................................................................................... 7-3 Figure 7-4. Bicyclist Collisions by Severity, 2007 to 2011 ...................................................................................................................................... 7-3 Figure 7-5. Bicycle and Pedestrian Collisions in Study Area, 2009 to 2011 .......................................................................................................... 7-4
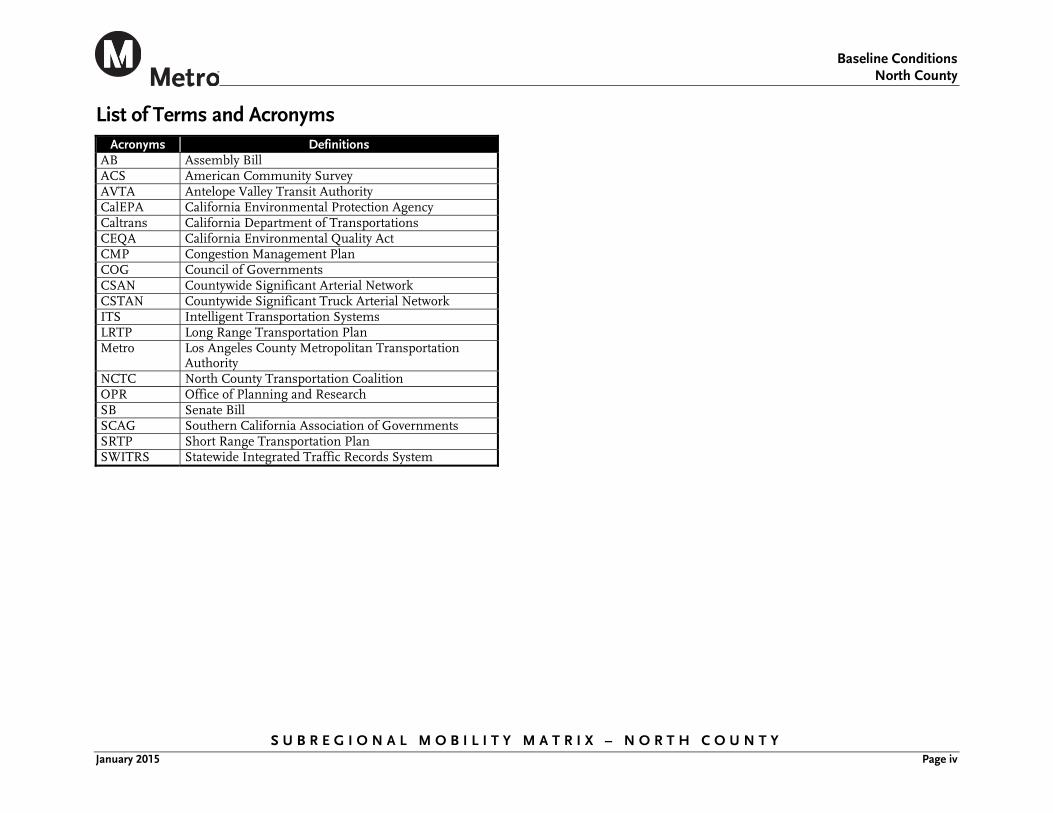
Baseline Conditions
North County
S U B R E G I O N A L M O B I L I T Y M A T R I X – N O R T H C O U N T Y January 2015 Page iv
List of Terms and Acronyms Acronyms Definitions
AB Assembly Bill ACS American Community Survey AVTA Antelope Valley Transit Authority CalEPA California Environmental Protection Agency Caltrans California Department of Transportations CEQA California Environmental Quality Act CMP Congestion Management Plan COG Council of Governments CSAN Countywide Significant Arterial Network CSTAN Countywide Significant Truck Arterial Network ITS Intelligent Transportation Systems LRTP Long Range Transportation Plan Metro Los Angeles County Metropolitan Transportation
Authority NCTC North County Transportation Coalition OPR Office of Planning and Research SB Senate Bill SCAG Southern California Association of Governments SRTP Short Range Transportation Plan SWITRS Statewide Integrated Traffic Records System
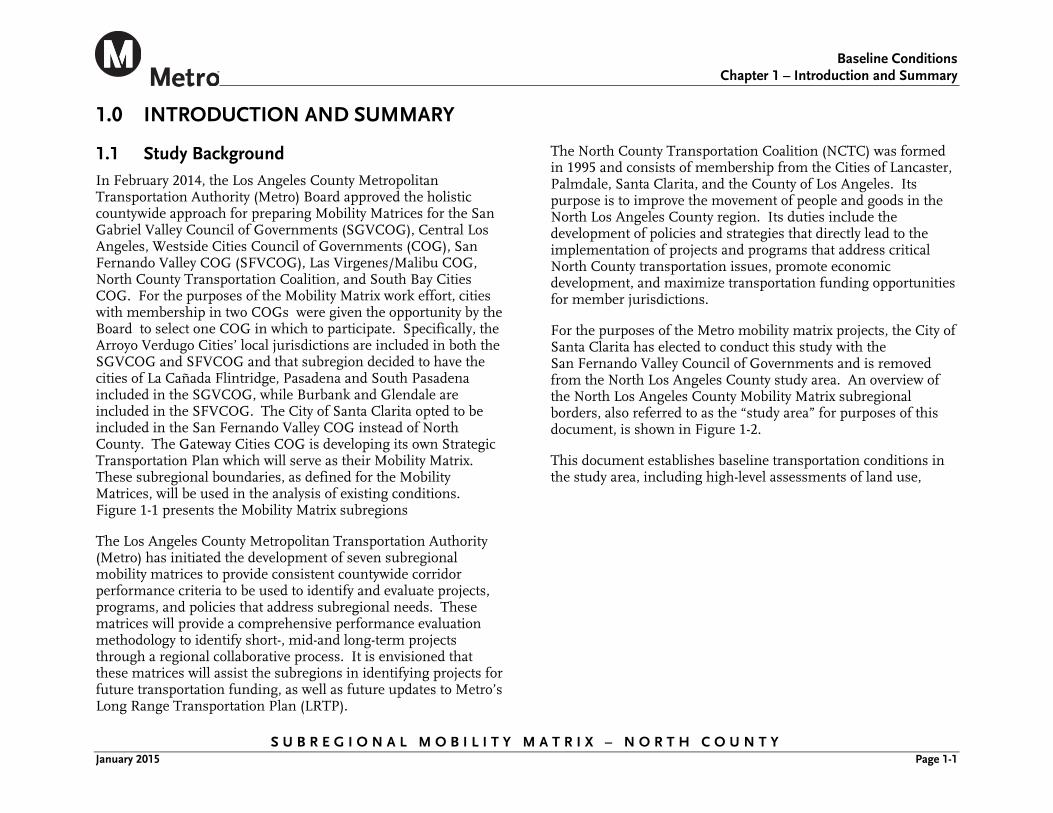
Baseline Conditions
Chapter 1 – Introduction and Summary
S U B R E G I O N A L M O B I L I T Y M A T R I X – N O R T H C O U N T Y January 2015 Page 1-1
1.0 INTRODUCTION AND SUMMARY
1.1 Study Background In February 2014, the Los Angeles County Metropolitan Transportation Authority (Metro) Board approved the holistic countywide approach for preparing Mobility Matrices for the San Gabriel Valley Council of Governments (SGVCOG), Central Los Angeles, Westside Cities Council of Governments (COG), San Fernando Valley COG (SFVCOG), Las Virgenes/Malibu COG, North County Transportation Coalition, and South Bay Cities COG. For the purposes of the Mobility Matrix work effort, cities with membership in two COGs were given the opportunity by the Board to select one COG in which to participate. Specifically, the Arroyo Verdugo Cities’ local jurisdictions are included in both the SGVCOG and SFVCOG and that subregion decided to have the cities of La Cañada Flintridge, Pasadena and South Pasadena included in the SGVCOG, while Burbank and Glendale are included in the SFVCOG. The City of Santa Clarita opted to be included in the San Fernando Valley COG instead of North County. The Gateway Cities COG is developing its own Strategic Transportation Plan which will serve as their Mobility Matrix. These subregional boundaries, as defined for the Mobility Matrices, will be used in the analysis of existing conditions. Figure 1-1 presents the Mobility Matrix subregions
The Los Angeles County Metropolitan Transportation Authority (Metro) has initiated the development of seven subregional mobility matrices to provide consistent countywide corridor performance criteria to be used to identify and evaluate projects, programs, and policies that address subregional needs. These matrices will provide a comprehensive performance evaluation methodology to identify short-, mid-and long-term projects through a regional collaborative process. It is envisioned that these matrices will assist the subregions in identifying projects for future transportation funding, as well as future updates to Metro’s Long Range Transportation Plan (LRTP).
The North County Transportation Coalition (NCTC) was formed in 1995 and consists of membership from the Cities of Lancaster, Palmdale, Santa Clarita, and the County of Los Angeles. Its purpose is to improve the movement of people and goods in the North Los Angeles County region. Its duties include the development of policies and strategies that directly lead to the implementation of projects and programs that address critical North County transportation issues, promote economic development, and maximize transportation funding opportunities for member jurisdictions.
For the purposes of the Metro mobility matrix projects, the City of Santa Clarita has elected to conduct this study with the San Fernando Valley Council of Governments and is removed from the North Los Angeles County study area. An overview of the North Los Angeles County Mobility Matrix subregional borders, also referred to as the “study area” for purposes of this document, is shown in Figure 1-2.
This document establishes baseline transportation conditions in the study area, including high-level assessments of land use,
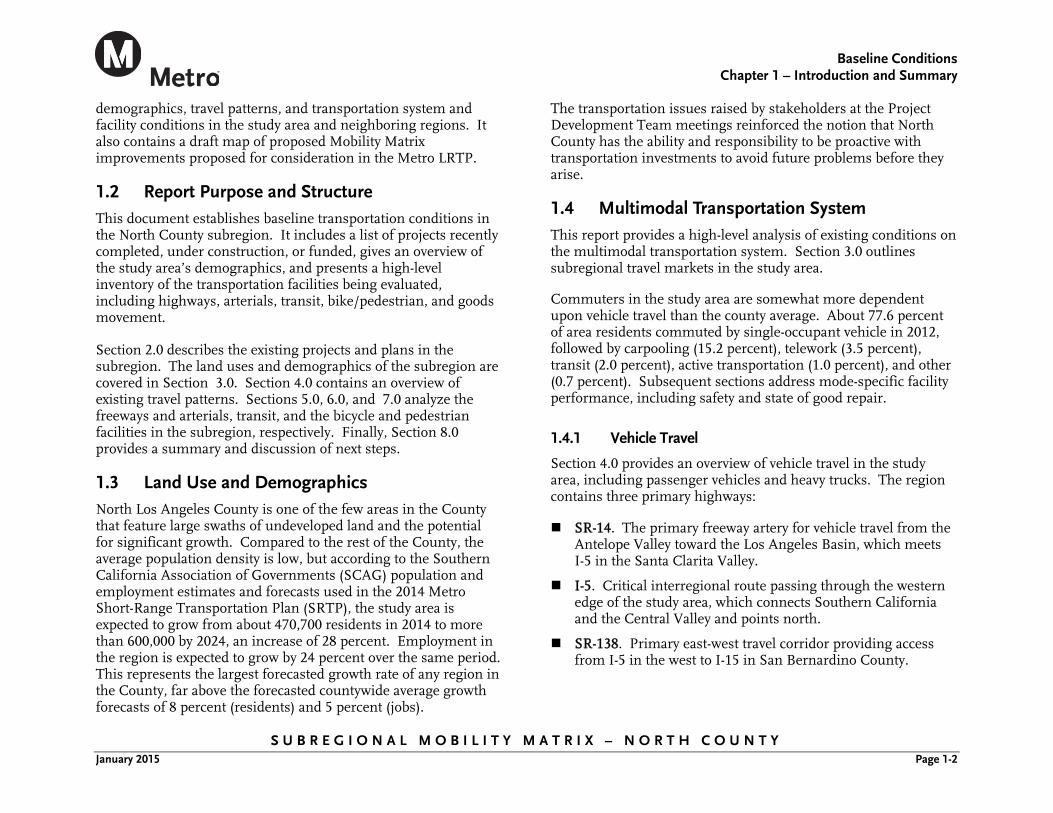
Baseline Conditions
Chapter 1 – Introduction and Summary
S U B R E G I O N A L M O B I L I T Y M A T R I X – N O R T H C O U N T Y January 2015 Page 1-2
demographics, travel patterns, and transportation system and facility conditions in the study area and neighboring regions. It also contains a draft map of proposed Mobility Matrix improvements proposed for consideration in the Metro LRTP.
1.2 Report Purpose and Structure This document establishes baseline transportation conditions in the North County subregion. It includes a list of projects recently completed, under construction, or funded, gives an overview of the study area’s demographics, and presents a high-level inventory of the transportation facilities being evaluated, including highways, arterials, transit, bike/pedestrian, and goods movement.
Section 2.0 describes the existing projects and plans in the subregion. The land uses and demographics of the subregion are covered in Section 3.0. Section 4.0 contains an overview of existing travel patterns. Sections 5.0, 6.0, and 7.0 analyze the freeways and arterials, transit, and the bicycle and pedestrian facilities in the subregion, respectively. Finally, Section 8.0 provides a summary and discussion of next steps.
1.3 Land Use and Demographics North Los Angeles County is one of the few areas in the County that feature large swaths of undeveloped land and the potential for significant growth. Compared to the rest of the County, the average population density is low, but according to the Southern California Association of Governments (SCAG) population and employment estimates and forecasts used in the 2014 Metro Short-Range Transportation Plan (SRTP), the study area is expected to grow from about 470,700 residents in 2014 to more than 600,000 by 2024, an increase of 28 percent. Employment in the region is expected to grow by 24 percent over the same period. This represents the largest forecasted growth rate of any region in the County, far above the forecasted countywide average growth forecasts of 8 percent (residents) and 5 percent (jobs).
The transportation issues raised by stakeholders at the Project Development Team meetings reinforced the notion that North County has the ability and responsibility to be proactive with transportation investments to avoid future problems before they arise.
1.4 Multimodal Transportation System This report provides a high-level analysis of existing conditions on the multimodal transportation system. Section 3.0 outlines subregional travel markets in the study area.
Commuters in the study area are somewhat more dependent upon vehicle travel than the county average. About 77.6 percent of area residents commuted by single-occupant vehicle in 2012, followed by carpooling (15.2 percent), telework (3.5 percent), transit (2.0 percent), active transportation (1.0 percent), and other (0.7 percent). Subsequent sections address mode-specific facility performance, including safety and state of good repair.
1.4.1 Vehicle Travel
Section 4.0 provides an overview of vehicle travel in the study area, including passenger vehicles and heavy trucks. The region contains three primary highways:
SR-14. The primary freeway artery for vehicle travel from the Antelope Valley toward the Los Angeles Basin, which meets I-5 in the Santa Clarita Valley.
I-5. Critical interregional route passing through the western edge of the study area, which connects Southern California and the Central Valley and points north.
SR-138. Primary east-west travel corridor providing access from I-5 in the west to I-15 in San Bernardino County.
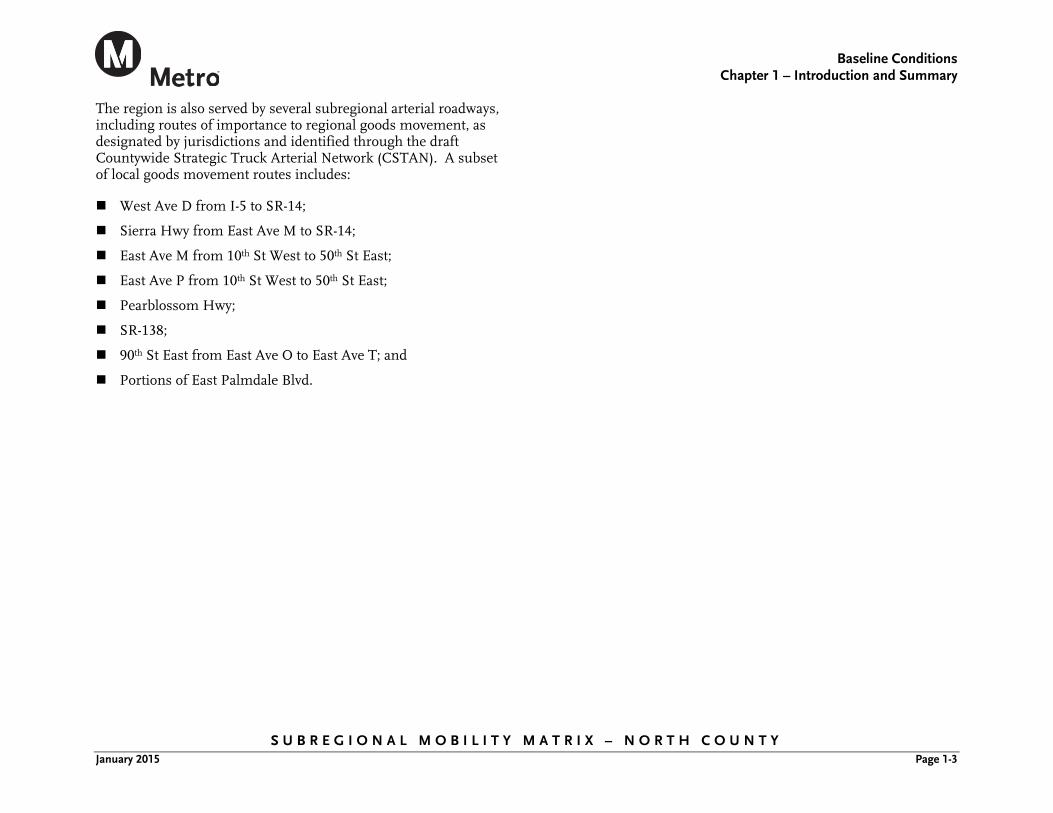
Baseline Conditions
Chapter 1 – Introduction and Summary
S U B R E G I O N A L M O B I L I T Y M A T R I X – N O R T H C O U N T Y January 2015 Page 1-3
The region is also served by several subregional arterial roadways, including routes of importance to regional goods movement, as designated by jurisdictions and identified through the draft Countywide Strategic Truck Arterial Network (CSTAN). A subset of local goods movement routes includes:
West Ave D from I-5 to SR-14;
Sierra Hwy from East Ave M to SR-14;
East Ave M from 10th St West to 50th St East;
East Ave P from 10th St West to 50th St East;
Pearblossom Hwy;
SR-138;
90th St East from East Ave O to East Ave T; and
Portions of East Palmdale Blvd.
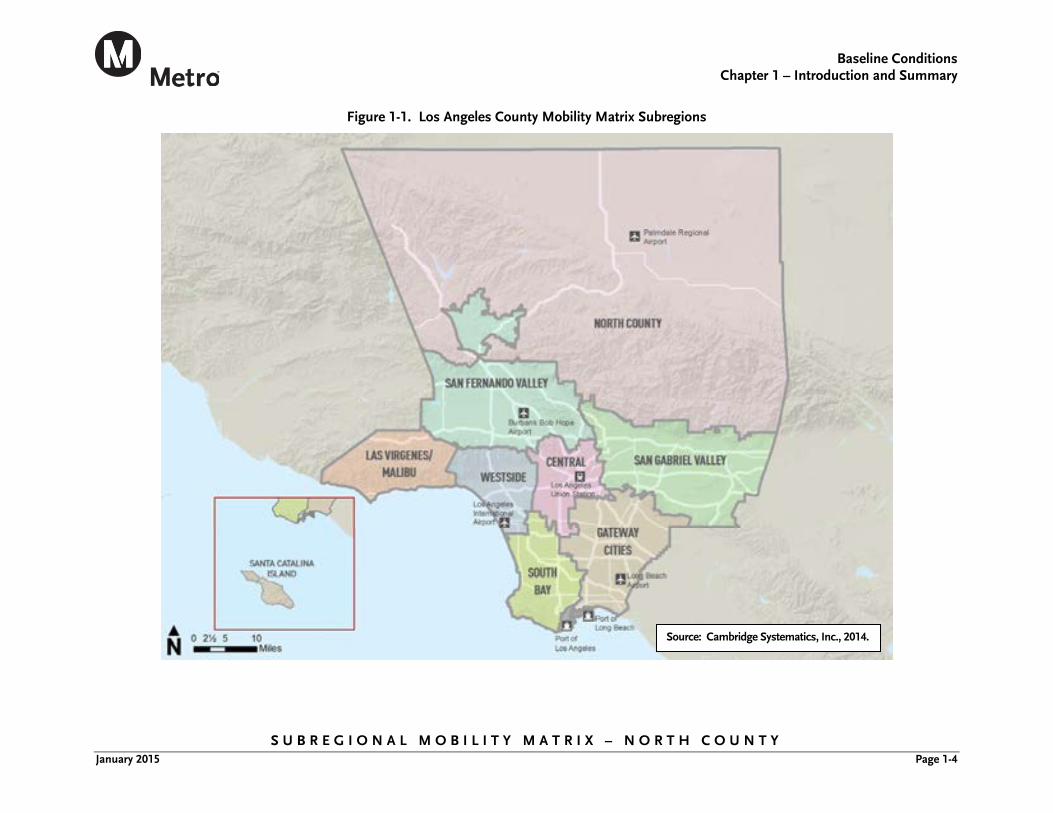
Baseline Conditions
Chapter 1 – Introduction and Summary
S U B R E G I O N A L M O B I L I T Y M A T R I X – N O R T H C O U N T Y January 2015 Page 1-4
Figure 1-1. Los Angeles County Mobility Matrix Subregions
Source: Cambridge Systematics, Inc., 2014.
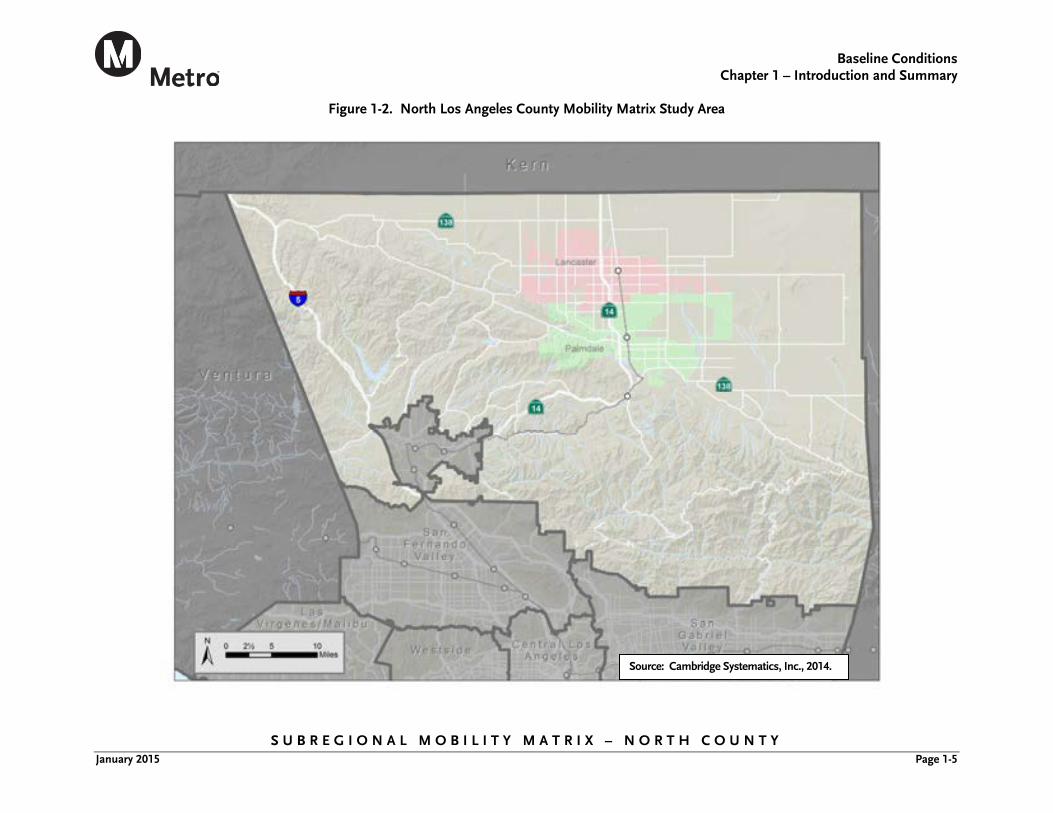
Baseline Conditions
Chapter 1 – Introduction and Summary
S U B R E G I O N A L M O B I L I T Y M A T R I X – N O R T H C O U N T Y January 2015 Page 1-5
Figure 1-2. North Los Angeles County Mobility Matrix Study Area
Source: Cambridge Systematics, Inc., 2014.
Baseline Conditions
Chapter 1 – Introduction and Summary
S U B R E G I O N A L M O B I L I T Y M A T R I X – N O R T H C O U N T Y January 2015 Page 1-6
1.4.2 Transit and Passenger Rail
Section 6.0 provides an overview of subregional transit and passenger rail opportunities. North Los Angeles County includes the following critical transit and commuter infrastructure:
Metrolink. Commuter rail connecting the Antelope Valley with the Los Angeles Basin
Antelope Valley Transit Authority (AVTA). Subregional bus service operating a network of 12 bus routes, 2 supplemental routes, 3 commuter services to the Los Angeles Basin, and dial-a-ride services.
1.4.3 Active Transportation
The study area is home to a limited, but growing network of bicycle facilities. Section 7.0 addresses active transportation facilities and performance in the subregion, with a focus on safety.
Baseline Conditions
Chapter 2 – Existing Projects and Studies
S U B R E G I O N A L M O B I L I T Y M A T R I X – N O R T H C O U N T Y January 2015 Page 2-1
2.0 EXISTING PROJECTS AND STUDIES
Through a detailed literature review and targeted outreach to stakeholder jurisdictions in late 2014, the consultant team has identified hundreds of North County projects and programs to evaluate in the mobility matrix.
The initial set of projects consisted of Metro’s December 2013 subregional project lists, which included: unfunded Long Range Transportation Plan (LRTP) projects; unfunded Measure R scope elements; and subregional needs submitted in response to a request by Directors Dubois and Antonovich.
Through the stakeholder outreach process a number of projects on the initial project list were removed because they were identified as completed, in construction, fully funded, redundant with another project in the subregion, or no longer desired by the subregion. Table 2-1 contains a list of projects from the initial list that were removed because they are funded, in construction, or completed.
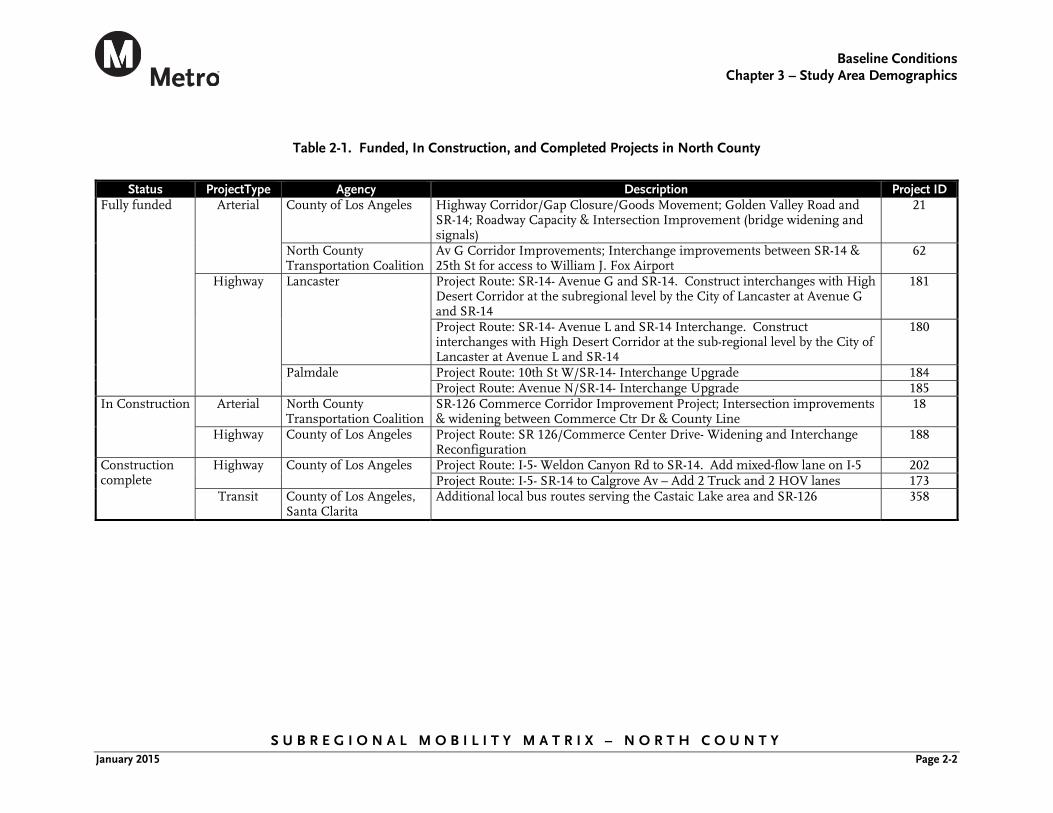
Baseline Conditions
Chapter 3 – Study Area Demographics
S U B R E G I O N A L M O B I L I T Y M A T R I X – N O R T H C O U N T Y January 2015 Page 2-2
Table 2-1. Funded, In Construction, and Completed Projects in North County
and Other Multimodal Projects Status ProjectType Agency Description Project ID
Fully funded Arterial County of Los Angeles Highway Corridor/Gap Closure/Goods Movement; Golden Valley Road and SR-14; Roadway Capacity & Intersection Improvement (bridge widening and signals)
21
North County Transportation Coalition
Av G Corridor Improvements; Interchange improvements between SR-14 & 25th St for access to William J. Fox Airport
62
Highway Lancaster Project Route: SR-14- Avenue G and SR-14. Construct interchanges with High Desert Corridor at the subregional level by the City of Lancaster at Avenue G and SR-14
181
Project Route: SR-14- Avenue L and SR-14 Interchange. Construct interchanges with High Desert Corridor at the sub-regional level by the City of Lancaster at Avenue L and SR-14
180
Palmdale Project Route: 10th St W/SR-14- Interchange Upgrade 184 Project Route: Avenue N/SR-14- Interchange Upgrade 185
In Construction Arterial North County Transportation Coalition
SR-126 Commerce Corridor Improvement Project; Intersection improvements & widening between Commerce Ctr Dr & County Line
18
Highway County of Los Angeles Project Route: SR 126/Commerce Center Drive- Widening and Interchange Reconfiguration
188
Construction complete
Highway County of Los Angeles Project Route: I-5- Weldon Canyon Rd to SR-14. Add mixed-flow lane on I-5 202 Project Route: I-5- SR-14 to Calgrove Av – Add 2 Truck and 2 HOV lanes 173
Transit County of Los Angeles, Santa Clarita
Additional local bus routes serving the Castaic Lake area and SR-126 358
Baseline Conditions
Chapter 3 – Study Area Demographics
S U B R E G I O N A L M O B I L I T Y M A T R I X – N O R T H C O U N T Y January 2015 Page 3-3
3.0 STUDY AREA DEMOGRAPHICS
3.1 Land Use Figure 3-1 indicates estimated land use throughout North County according to 2008 SCAG figures. The study area features the largest concentration of rural and undeveloped land in Los Angeles County. The majority of the region is zoned residential, while the SR-14 corridor through the Cities of Lancaster and Palmdale features pockets of commercial and industrial activity.
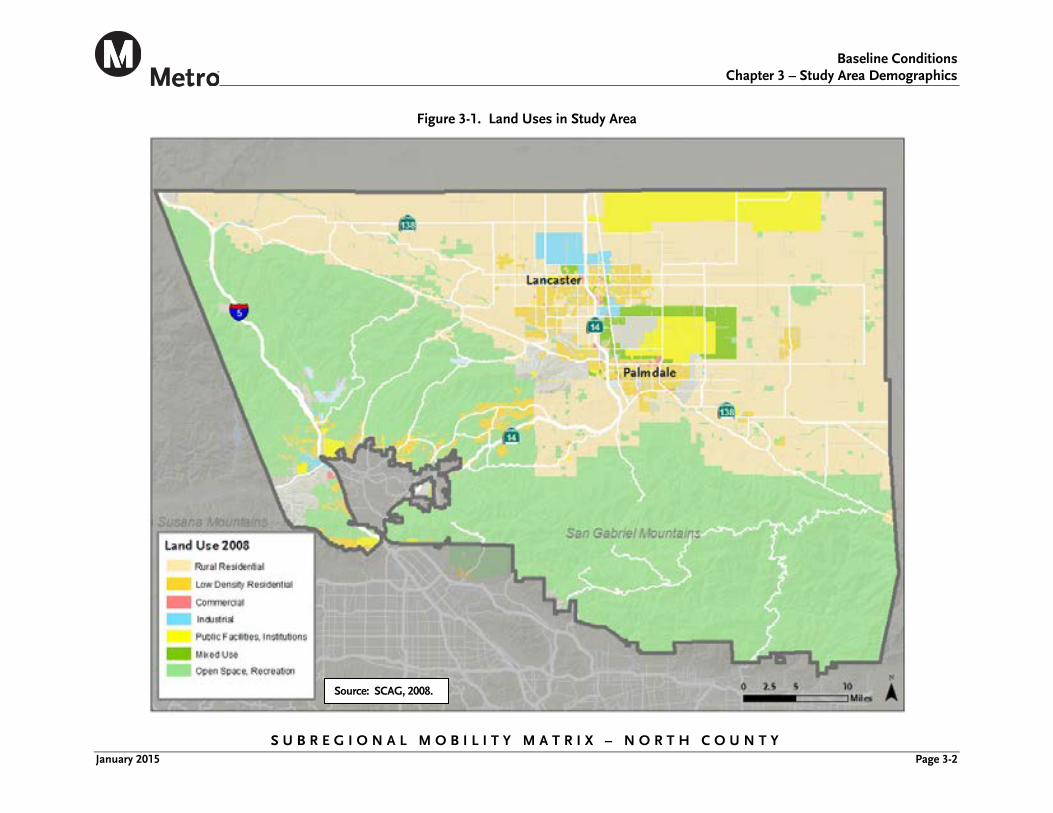
Baseline Conditions
Chapter 3 – Study Area Demographics
S U B R E G I O N A L M O B I L I T Y M A T R I X – N O R T H C O U N T Y January 2015 Page 3-2
Figure 3-1. Land Uses in Study Area
Source: SCAG, 2008.
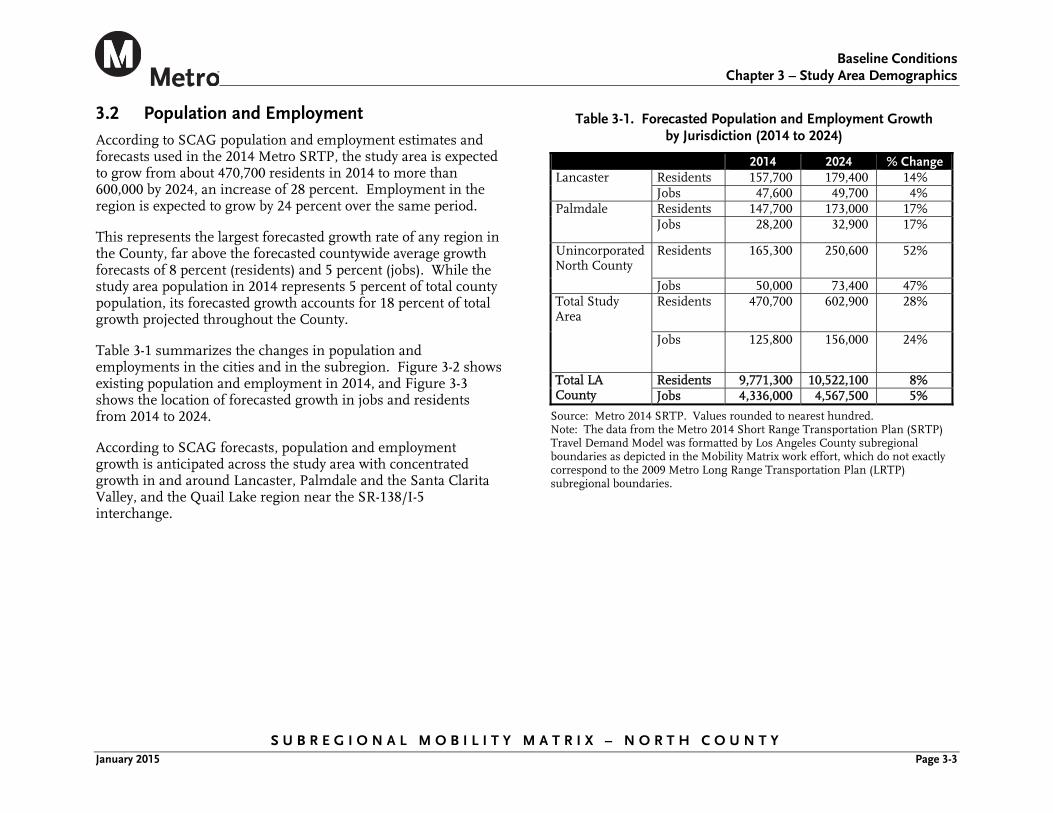
Baseline Conditions
Chapter 3 – Study Area Demographics
S U B R E G I O N A L M O B I L I T Y M A T R I X – N O R T H C O U N T Y January 2015 Page 3-3
3.2 Population and Employment According to SCAG population and employment estimates and forecasts used in the 2014 Metro SRTP, the study area is expected to grow from about 470,700 residents in 2014 to more than 600,000 by 2024, an increase of 28 percent. Employment in the region is expected to grow by 24 percent over the same period.
This represents the largest forecasted growth rate of any region in the County, far above the forecasted countywide average growth forecasts of 8 percent (residents) and 5 percent (jobs). While the study area population in 2014 represents 5 percent of total county population, its forecasted growth accounts for 18 percent of total growth projected throughout the County.
Table 3-1 summarizes the changes in population and employments in the cities and in the subregion. Figure 3-2 shows existing population and employment in 2014, and Figure 3-3 shows the location of forecasted growth in jobs and residents from 2014 to 2024.
According to SCAG forecasts, population and employment growth is anticipated across the study area with concentrated growth in and around Lancaster, Palmdale and the Santa Clarita Valley, and the Quail Lake region near the SR-138/I-5 interchange.
Table 3-1. Forecasted Population and Employment Growth by Jurisdiction (2014 to 2024)
2014 2024 % Change Lancaster Residents 157,700 179,400 14%
Jobs 47,600 49,700 4% Palmdale Residents 147,700 173,000 17%
Jobs 28,200 32,900 17%
Unincorporated North County
Residents 165,300 250,600 52%
Jobs 50,000 73,400 47% Total Study Area
Residents 470,700 602,900 28%
Jobs 125,800 156,000 24%
Total LA County
Residents 9,771,300 10,522,100 8% Jobs 4,336,000 4,567,500 5%
Source: Metro 2014 SRTP. Values rounded to nearest hundred. Note: The data from the Metro 2014 Short Range Transportation Plan (SRTP) Travel Demand Model was formatted by Los Angeles County subregional boundaries as depicted in the Mobility Matrix work effort, which do not exactly correspond to the 2009 Metro Long Range Transportation Plan (LRTP) subregional boundaries.
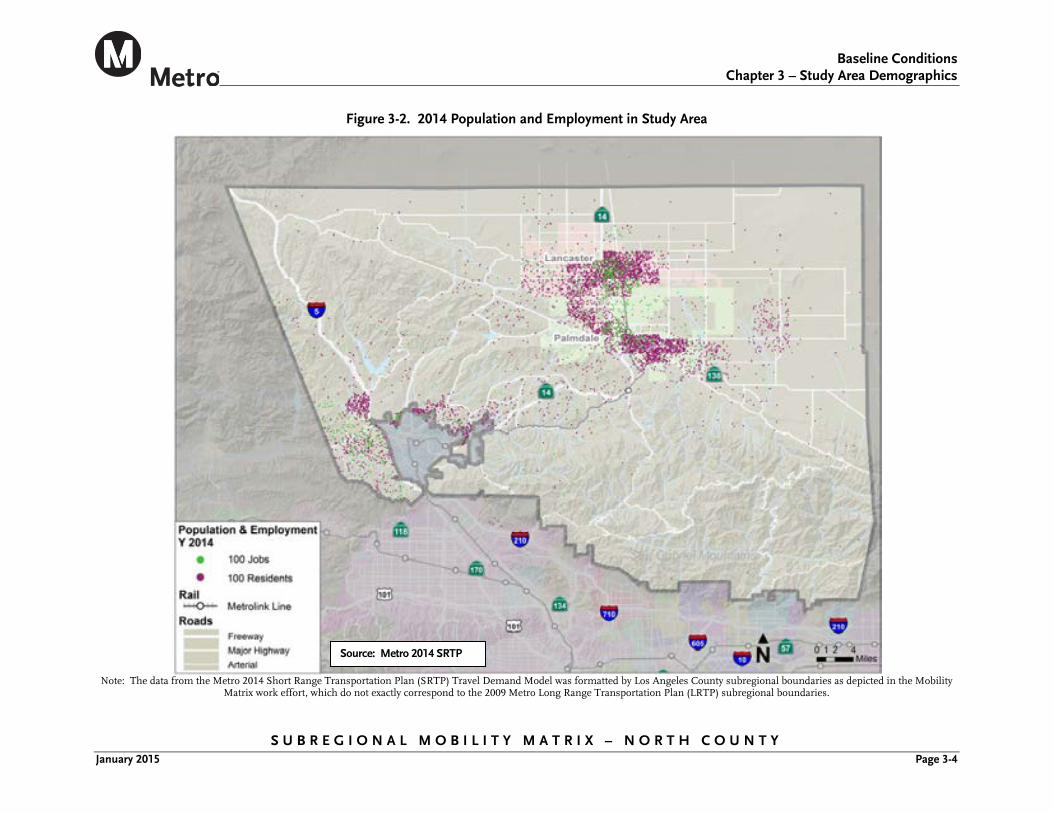
Baseline Conditions
Chapter 3 – Study Area Demographics
S U B R E G I O N A L M O B I L I T Y M A T R I X – N O R T H C O U N T Y January 2015 Page 3-4
Figure 3-2. 2014 Population and Employment in Study Area
Note: The data from the Metro 2014 Short Range Transportation Plan (SRTP) Travel Demand Model was formatted by Los Angeles County subregional boundaries as depicted in the Mobility
Matrix work effort, which do not exactly correspond to the 2009 Metro Long Range Transportation Plan (LRTP) subregional boundaries.
Source: Metro 2014 SRTP
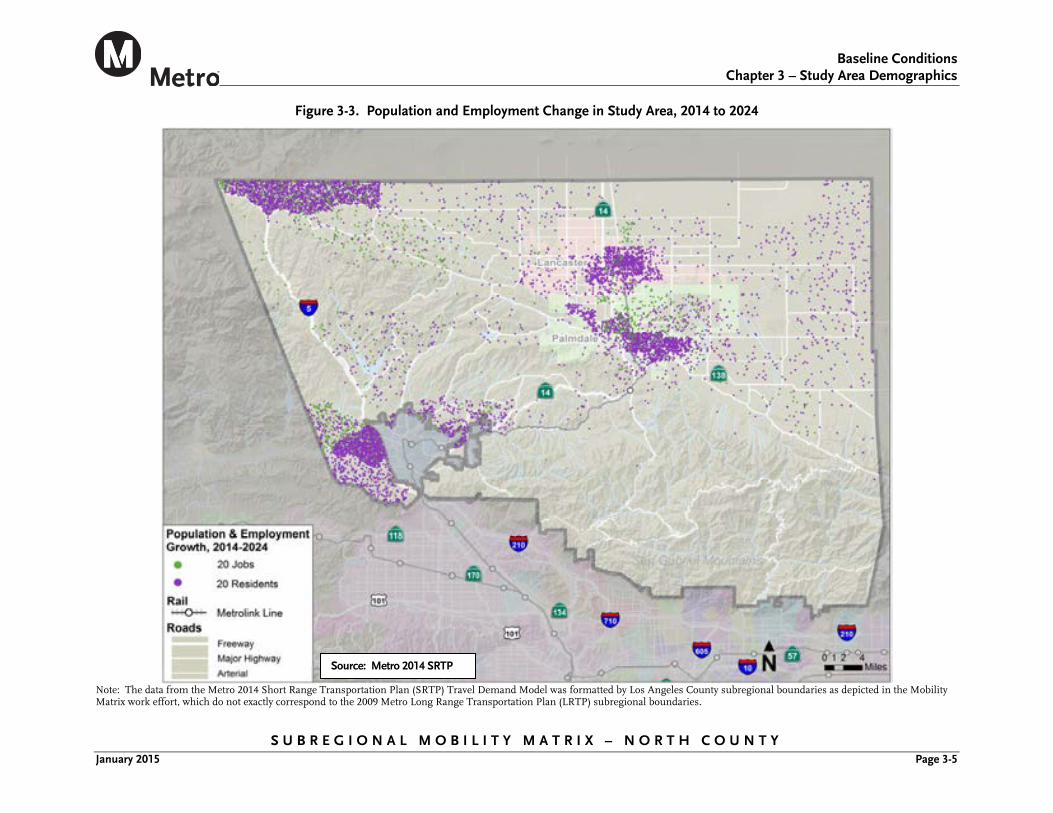
Baseline Conditions
Chapter 3 – Study Area Demographics
S U B R E G I O N A L M O B I L I T Y M A T R I X – N O R T H C O U N T Y January 2015 Page 3-5
Figure 3-3. Population and Employment Change in Study Area, 2014 to 2024
Note: The data from the Metro 2014 Short Range Transportation Plan (SRTP) Travel Demand Model was formatted by Los Angeles County subregional boundaries as depicted in the Mobility Matrix work effort, which do not exactly correspond to the 2009 Metro Long Range Transportation Plan (LRTP) subregional boundaries.
Source: Metro 2014 SRTP
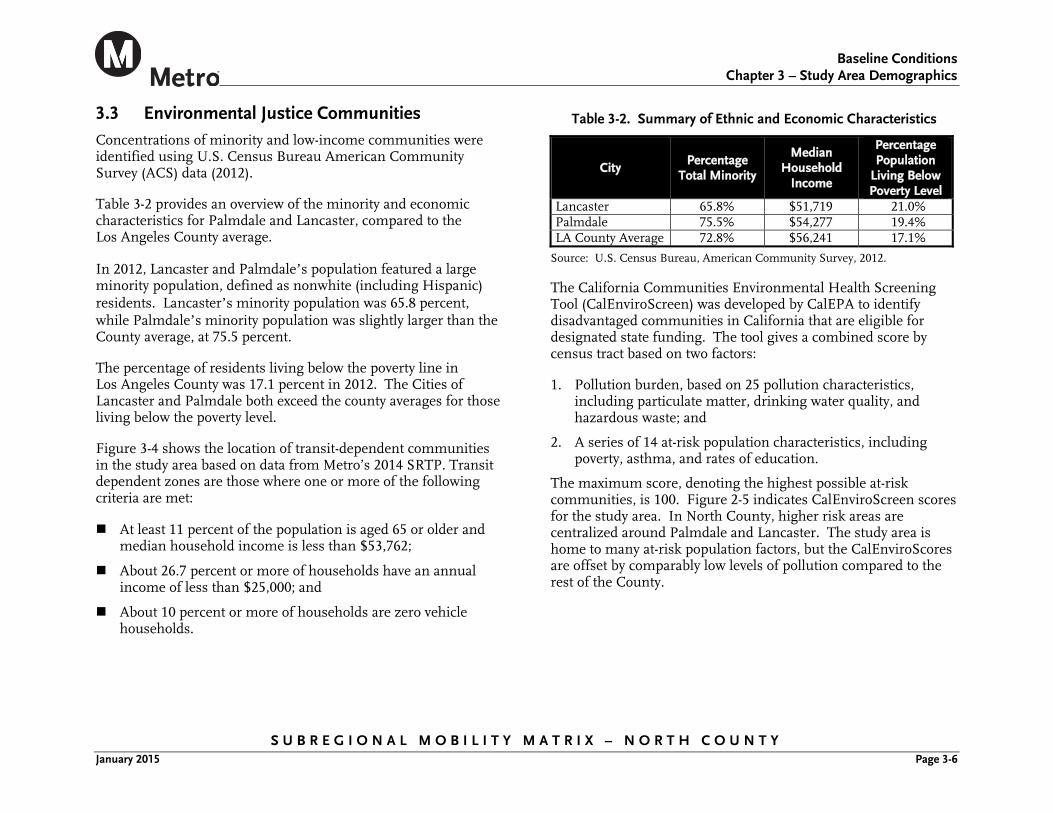
Baseline Conditions
Chapter 3 – Study Area Demographics
S U B R E G I O N A L M O B I L I T Y M A T R I X – N O R T H C O U N T Y January 2015 Page 3-6
3.3 Environmental Justice Communities Concentrations of minority and low-income communities were identified using U.S. Census Bureau American Community Survey (ACS) data (2012).
Table 3-2 provides an overview of the minority and economic characteristics for Palmdale and Lancaster, compared to the Los Angeles County average.
In 2012, Lancaster and Palmdale’s population featured a large minority population, defined as nonwhite (including Hispanic) residents. Lancaster’s minority population was 65.8 percent, while Palmdale’s minority population was slightly larger than the County average, at 75.5 percent.
The percentage of residents living below the poverty line in Los Angeles County was 17.1 percent in 2012. The Cities of Lancaster and Palmdale both exceed the county averages for those living below the poverty level.
Figure 3-4 shows the location of transit-dependent communities in the study area based on data from Metro’s 2014 SRTP. Transit dependent zones are those where one or more of the following criteria are met:
At least 11 percent of the population is aged 65 or older and median household income is less than $53,762;
About 26.7 percent or more of households have an annual income of less than $25,000; and
About 10 percent or more of households are zero vehicle households.
Table 3-2. Summary of Ethnic and Economic Characteristics
City Percentage
Total Minority
Median Household
Income
Percentage Population
Living Below Poverty Level
Lancaster 65.8% $51,719 21.0% Palmdale 75.5% $54,277 19.4% LA County Average 72.8% $56,241 17.1%
Source: U.S. Census Bureau, American Community Survey, 2012.
The California Communities Environmental Health Screening Tool (CalEnviroScreen) was developed by CalEPA to identify disadvantaged communities in California that are eligible for designated state funding. The tool gives a combined score by census tract based on two factors:
1. Pollution burden, based on 25 pollution characteristics, including particulate matter, drinking water quality, and hazardous waste; and
2. A series of 14 at-risk population characteristics, including poverty, asthma, and rates of education.
The maximum score, denoting the highest possible at-risk communities, is 100. Figure 2-5 indicates CalEnviroScreen scores for the study area. In North County, higher risk areas are centralized around Palmdale and Lancaster. The study area is home to many at-risk population factors, but the CalEnviroScores are offset by comparably low levels of pollution compared to the rest of the County.
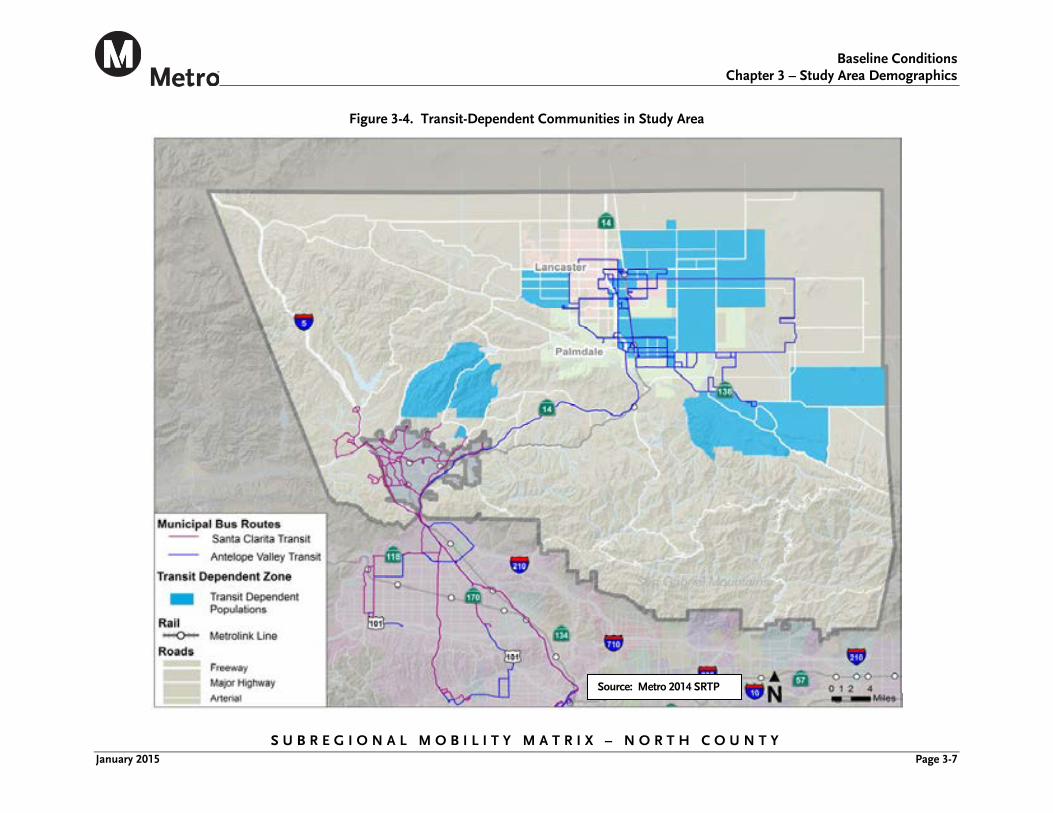
Baseline Conditions
Chapter 3 – Study Area Demographics
S U B R E G I O N A L M O B I L I T Y M A T R I X – N O R T H C O U N T Y January 2015 Page 3-7
Figure 3-4. Transit-Dependent Communities in Study Area
Source: Metro 2014 SRTP
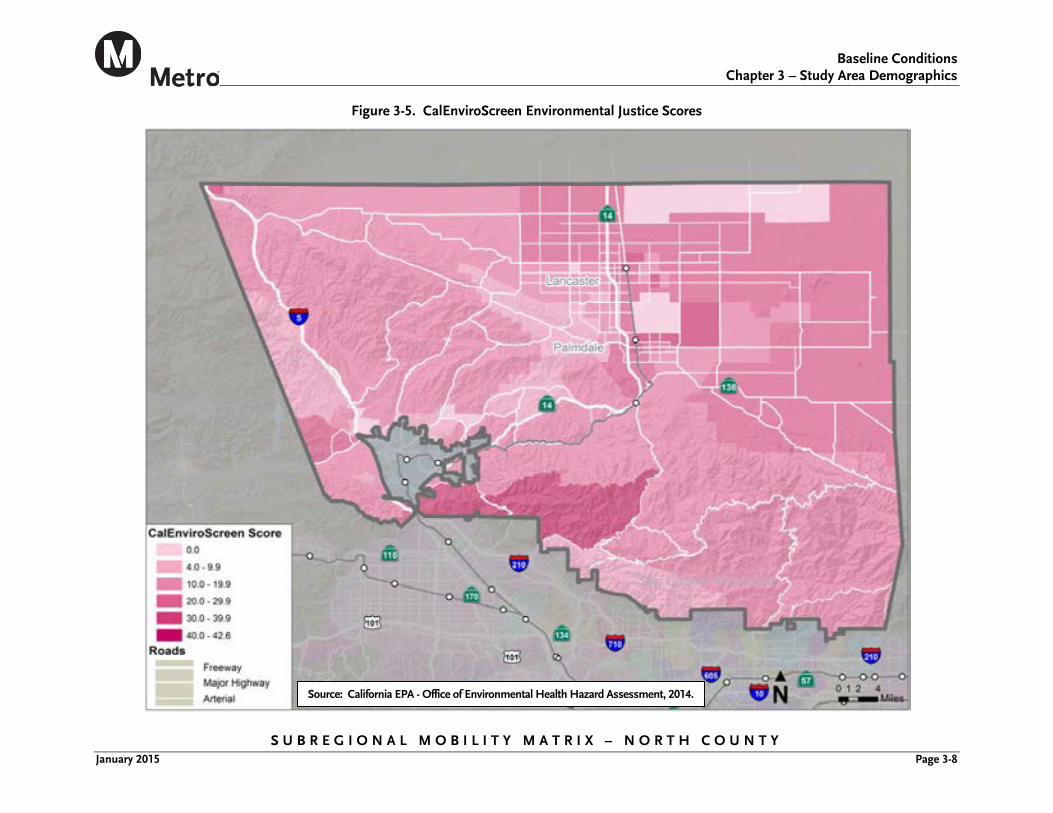
Baseline Conditions
Chapter 3 – Study Area Demographics
S U B R E G I O N A L M O B I L I T Y M A T R I X – N O R T H C O U N T Y January 2015 Page 3-8
Figure 3-5. CalEnviroScreen Environmental Justice Scores
Source: California EPA - Office of Environmental Health Hazard Assessment, 2014.
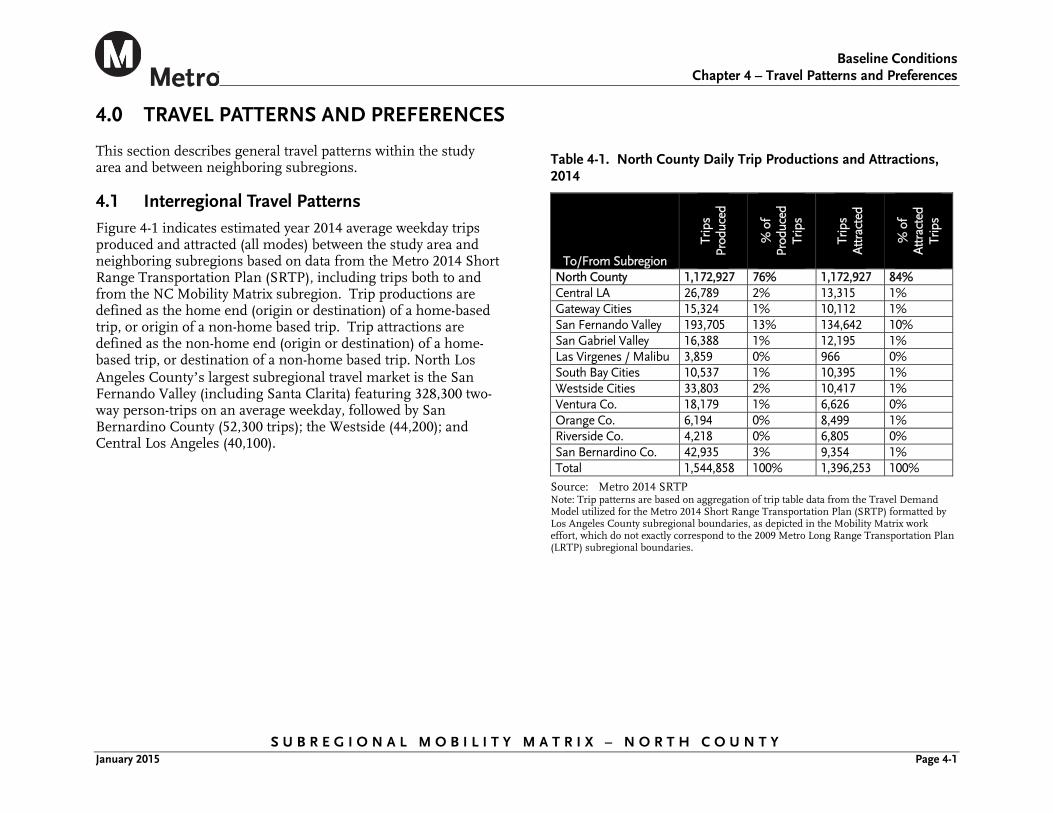
Baseline Conditions
Chapter 4 – Travel Patterns and Preferences
S U B R E G I O N A L M O B I L I T Y M A T R I X – N O R T H C O U N T Y January 2015 Page 4-1
4.0 TRAVEL PATTERNS AND PREFERENCES
This section describes general travel patterns within the study area and between neighboring subregions.
4.1 Interregional Travel Patterns Figure 4-1 indicates estimated year 2014 average weekday trips produced and attracted (all modes) between the study area and neighboring subregions based on data from the Metro 2014 Short Range Transportation Plan (SRTP), including trips both to and from the NC Mobility Matrix subregion. Trip productions are defined as the home end (origin or destination) of a home-based trip, or origin of a non-home based trip. Trip attractions are defined as the non-home end (origin or destination) of a home-based trip, or destination of a non-home based trip. North Los Angeles County’s largest subregional travel market is the San Fernando Valley (including Santa Clarita) featuring 328,300 two-way person-trips on an average weekday, followed by San Bernardino County (52,300 trips); the Westside (44,200); and Central Los Angeles (40,100).
Table 4-1. North County Daily Trip Productions and Attractions, 2014
To/From Subregion
Trip
s Pr
oduc
ed
% o
f Pr
oduc
ed
Trip
s
Trip
s A
ttra
cted
% o
f A
ttra
cted
Tr
ips
North County 1,172,927 76% 1,172,927 84% Central LA 26,789 2% 13,315 1% Gateway Cities 15,324 1% 10,112 1% San Fernando Valley 193,705 13% 134,642 10% San Gabriel Valley 16,388 1% 12,195 1% Las Virgenes / Malibu 3,859 0% 966 0% South Bay Cities 10,537 1% 10,395 1% Westside Cities 33,803 2% 10,417 1% Ventura Co. 18,179 1% 6,626 0% Orange Co. 6,194 0% 8,499 1% Riverside Co. 4,218 0% 6,805 0% San Bernardino Co. 42,935 3% 9,354 1% Total 1,544,858 100% 1,396,253 100%
Source: Metro 2014 SRTP Note: Trip patterns are based on aggregation of trip table data from the Travel Demand Model utilized for the Metro 2014 Short Range Transportation Plan (SRTP) formatted by Los Angeles County subregional boundaries, as depicted in the Mobility Matrix work effort, which do not exactly correspond to the 2009 Metro Long Range Transportation Plan (LRTP) subregional boundaries.
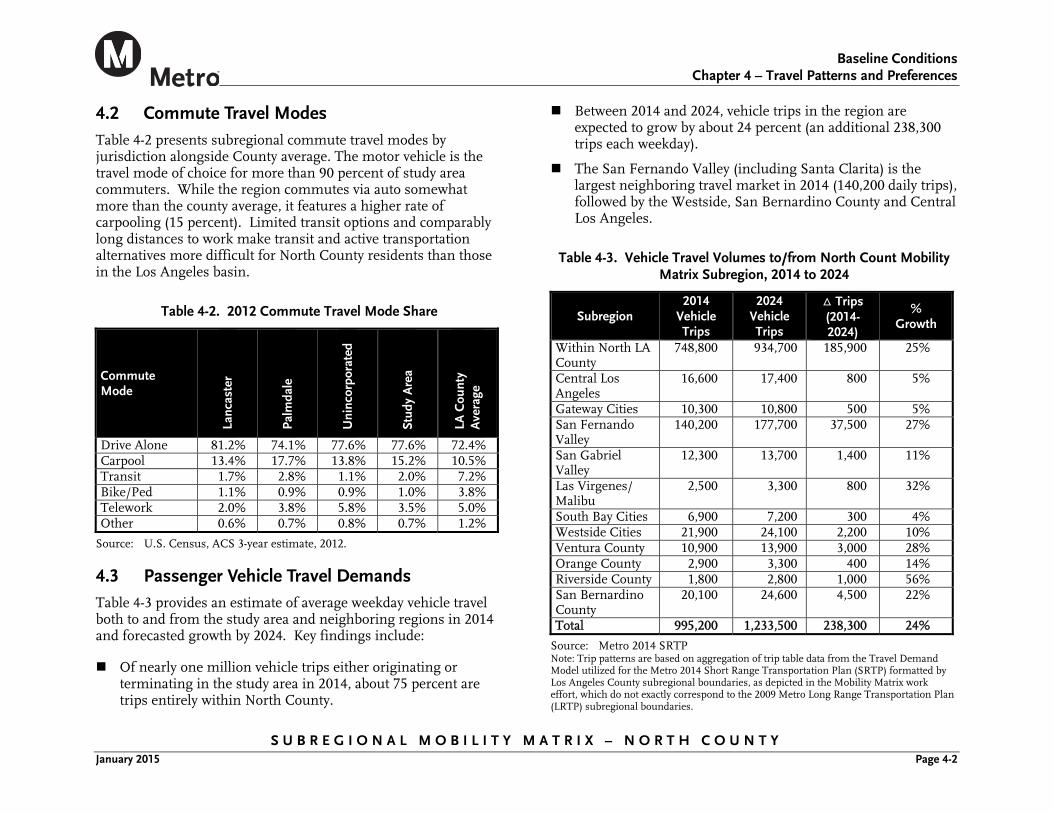
Baseline Conditions
Chapter 4 – Travel Patterns and Preferences
S U B R E G I O N A L M O B I L I T Y M A T R I X – N O R T H C O U N T Y January 2015 Page 4-2
4.2 Commute Travel Modes Table 4-2 presents subregional commute travel modes by jurisdiction alongside County average. The motor vehicle is the travel mode of choice for more than 90 percent of study area commuters. While the region commutes via auto somewhat more than the county average, it features a higher rate of carpooling (15 percent). Limited transit options and comparably long distances to work make transit and active transportation alternatives more difficult for North County residents than those in the Los Angeles basin.
Table 4-2. 2012 Commute Travel Mode Share
Commute Mode
Lanc
aste
r
Palm
dale
Uni
ncor
pora
ted
Stud
y A
rea
LA C
ount
y A
vera
ge
Drive Alone 81.2% 74.1% 77.6% 77.6% 72.4% Carpool 13.4% 17.7% 13.8% 15.2% 10.5% Transit 1.7% 2.8% 1.1% 2.0% 7.2% Bike/Ped 1.1% 0.9% 0.9% 1.0% 3.8% Telework 2.0% 3.8% 5.8% 3.5% 5.0% Other 0.6% 0.7% 0.8% 0.7% 1.2%
Source: U.S. Census, ACS 3-year estimate, 2012.
4.3 Passenger Vehicle Travel Demands Table 4-3 provides an estimate of average weekday vehicle travel both to and from the study area and neighboring regions in 2014 and forecasted growth by 2024. Key findings include:
Of nearly one million vehicle trips either originating or terminating in the study area in 2014, about 75 percent are trips entirely within North County.
Between 2014 and 2024, vehicle trips in the region are expected to grow by about 24 percent (an additional 238,300 trips each weekday).
The San Fernando Valley (including Santa Clarita) is the largest neighboring travel market in 2014 (140,200 daily trips), followed by the Westside, San Bernardino County and Central Los Angeles.
Table 4-3. Vehicle Travel Volumes to/from North Count Mobility Matrix Subregion, 2014 to 2024
Subregion 2014
Vehicle Trips
2024 Vehicle Trips
Trips (2014-2024)
% Growth
Within North LA County
748,800 934,700 185,900 25%
Central Los Angeles
16,600 17,400 800 5%
Gateway Cities 10,300 10,800 500 5% San Fernando Valley
140,200 177,700 37,500 27%
San Gabriel Valley
12,300 13,700 1,400 11%
Las Virgenes/Malibu
2,500 3,300 800 32%
South Bay Cities 6,900 7,200 300 4% Westside Cities 21,900 24,100 2,200 10% Ventura County 10,900 13,900 3,000 28% Orange County 2,900 3,300 400 14% Riverside County 1,800 2,800 1,000 56% San Bernardino County
20,100 24,600 4,500 22%
Total 995,200 1,233,500 238,300 24%
Source: Metro 2014 SRTP Note: Trip patterns are based on aggregation of trip table data from the Travel Demand Model utilized for the Metro 2014 Short Range Transportation Plan (SRTP) formatted by Los Angeles County subregional boundaries, as depicted in the Mobility Matrix work effort, which do not exactly correspond to the 2009 Metro Long Range Transportation Plan (LRTP) subregional boundaries.
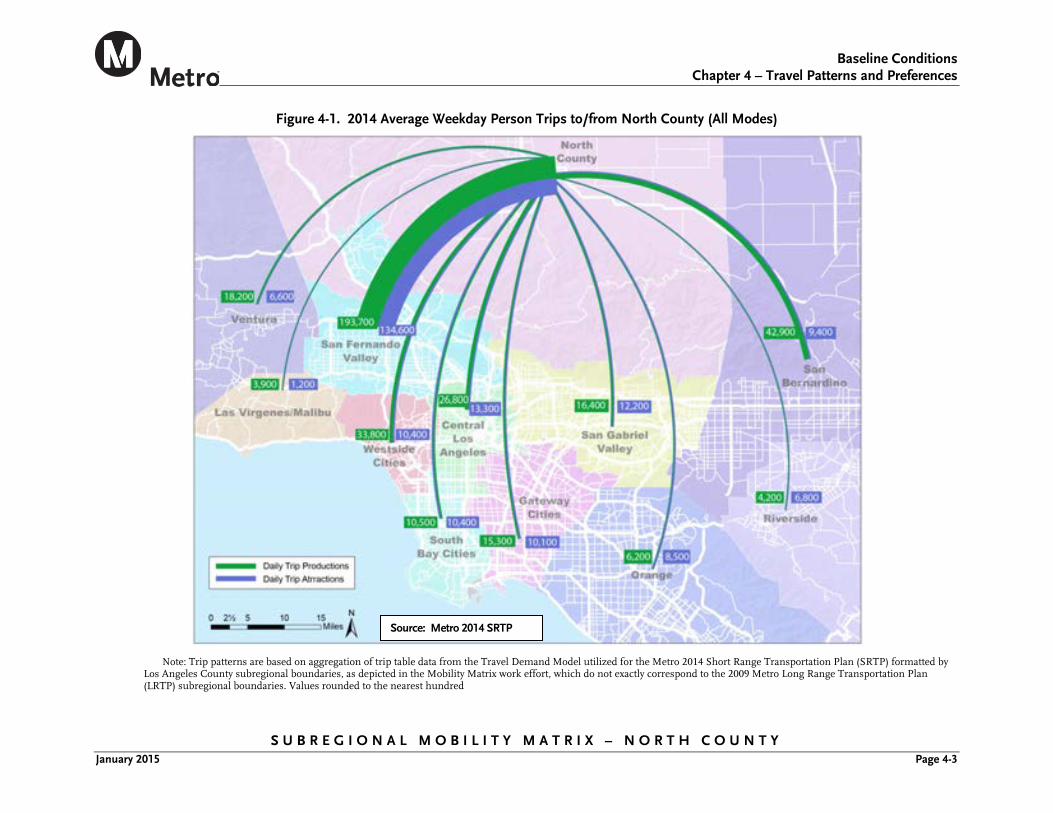
Baseline Conditions
Chapter 4 – Travel Patterns and Preferences
S U B R E G I O N A L M O B I L I T Y M A T R I X – N O R T H C O U N T Y January 2015 Page 4-3
Figure 4-1. 2014 Average Weekday Person Trips to/from North County (All Modes)
Note: Trip patterns are based on aggregation of trip table data from the Travel Demand Model utilized for the Metro 2014 Short Range Transportation Plan (SRTP) formatted by Los Angeles County subregional boundaries, as depicted in the Mobility Matrix work effort, which do not exactly correspond to the 2009 Metro Long Range Transportation Plan (LRTP) subregional boundaries. Values rounded to the nearest hundred
Source: Metro 2014 SRTP
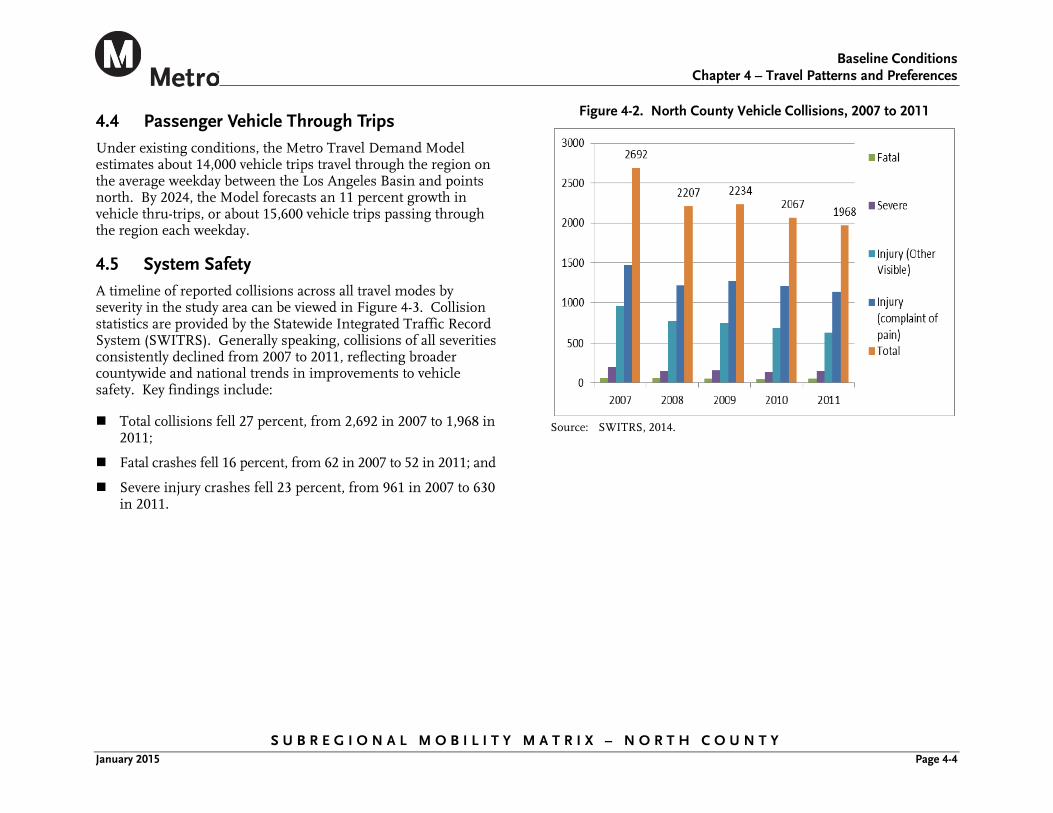
Baseline Conditions
Chapter 4 – Travel Patterns and Preferences
S U B R E G I O N A L M O B I L I T Y M A T R I X – N O R T H C O U N T Y January 2015 Page 4-4
4.4 Passenger Vehicle Through Trips Under existing conditions, the Metro Travel Demand Model estimates about 14,000 vehicle trips travel through the region on the average weekday between the Los Angeles Basin and points north. By 2024, the Model forecasts an 11 percent growth in vehicle thru-trips, or about 15,600 vehicle trips passing through the region each weekday.
4.5 System Safety A timeline of reported collisions across all travel modes by severity in the study area can be viewed in Figure 4-3. Collision statistics are provided by the Statewide Integrated Traffic Record System (SWITRS). Generally speaking, collisions of all severities consistently declined from 2007 to 2011, reflecting broader countywide and national trends in improvements to vehicle safety. Key findings include:
Total collisions fell 27 percent, from 2,692 in 2007 to 1,968 in 2011;
Fatal crashes fell 16 percent, from 62 in 2007 to 52 in 2011; and
Severe injury crashes fell 23 percent, from 961 in 2007 to 630 in 2011.
Figure 4-2. North County Vehicle Collisions, 2007 to 2011
Source: SWITRS, 2014.
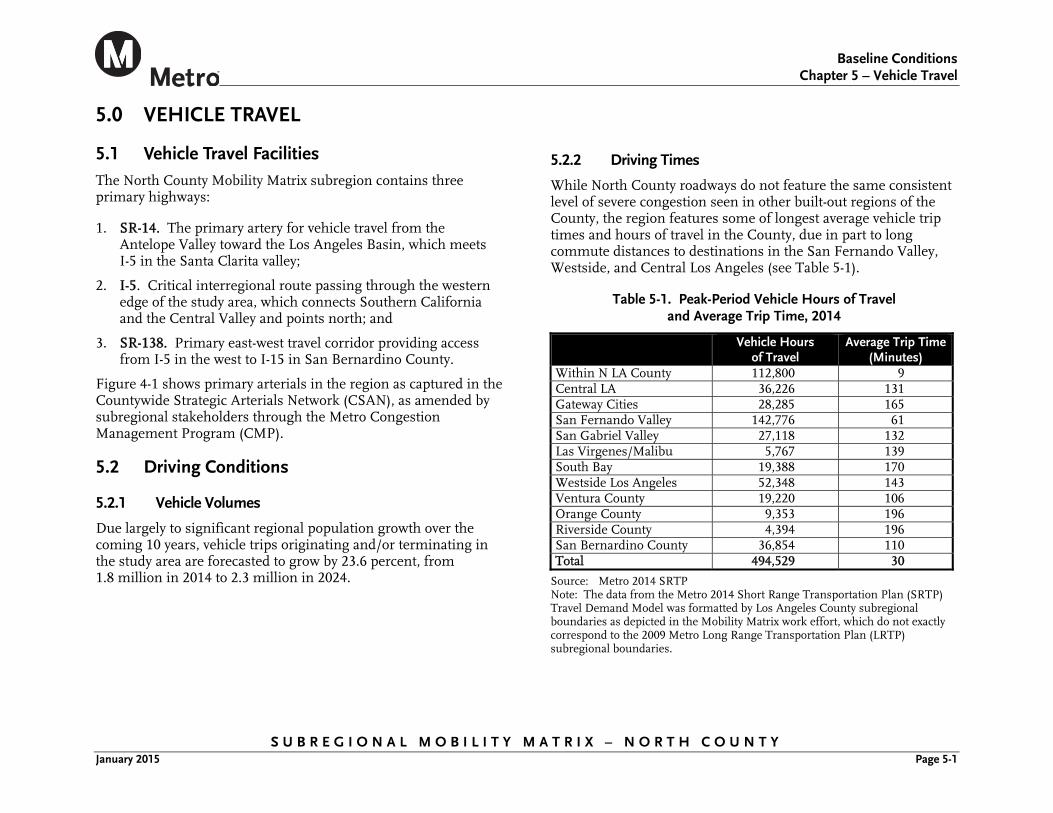
Baseline Conditions
Chapter 5 – Vehicle Travel
S U B R E G I O N A L M O B I L I T Y M A T R I X – N O R T H C O U N T Y January 2015 Page 5-1
5.0 VEHICLE TRAVEL
5.1 Vehicle Travel Facilities The North County Mobility Matrix subregion contains three primary highways:
1. SR-14. The primary artery for vehicle travel from the Antelope Valley toward the Los Angeles Basin, which meets I-5 in the Santa Clarita valley;
2. I-5. Critical interregional route passing through the western edge of the study area, which connects Southern California and the Central Valley and points north; and
3. SR-138. Primary east-west travel corridor providing access from I-5 in the west to I-15 in San Bernardino County.
Figure 4-1 shows primary arterials in the region as captured in the Countywide Strategic Arterials Network (CSAN), as amended by subregional stakeholders through the Metro Congestion Management Program (CMP).
5.2 Driving Conditions
5.2.1 Vehicle Volumes
Due largely to significant regional population growth over the coming 10 years, vehicle trips originating and/or terminating in the study area are forecasted to grow by 23.6 percent, from 1.8 million in 2014 to 2.3 million in 2024.
5.2.2 Driving Times
While North County roadways do not feature the same consistent level of severe congestion seen in other built-out regions of the County, the region features some of longest average vehicle trip times and hours of travel in the County, due in part to long commute distances to destinations in the San Fernando Valley, Westside, and Central Los Angeles (see Table 5-1).
Table 5-1. Peak-Period Vehicle Hours of Travel and Average Trip Time, 2014
Vehicle Hours
of Travel Average Trip Time
(Minutes) Within N LA County 112,800 9 Central LA 36,226 131 Gateway Cities 28,285 165 San Fernando Valley 142,776 61 San Gabriel Valley 27,118 132 Las Virgenes/Malibu 5,767 139 South Bay 19,388 170 Westside Los Angeles 52,348 143 Ventura County 19,220 106 Orange County 9,353 196 Riverside County 4,394 196 San Bernardino County 36,854 110 Total 494,529 30
Source: Metro 2014 SRTP Note: The data from the Metro 2014 Short Range Transportation Plan (SRTP) Travel Demand Model was formatted by Los Angeles County subregional boundaries as depicted in the Mobility Matrix work effort, which do not exactly correspond to the 2009 Metro Long Range Transportation Plan (LRTP) subregional boundaries.
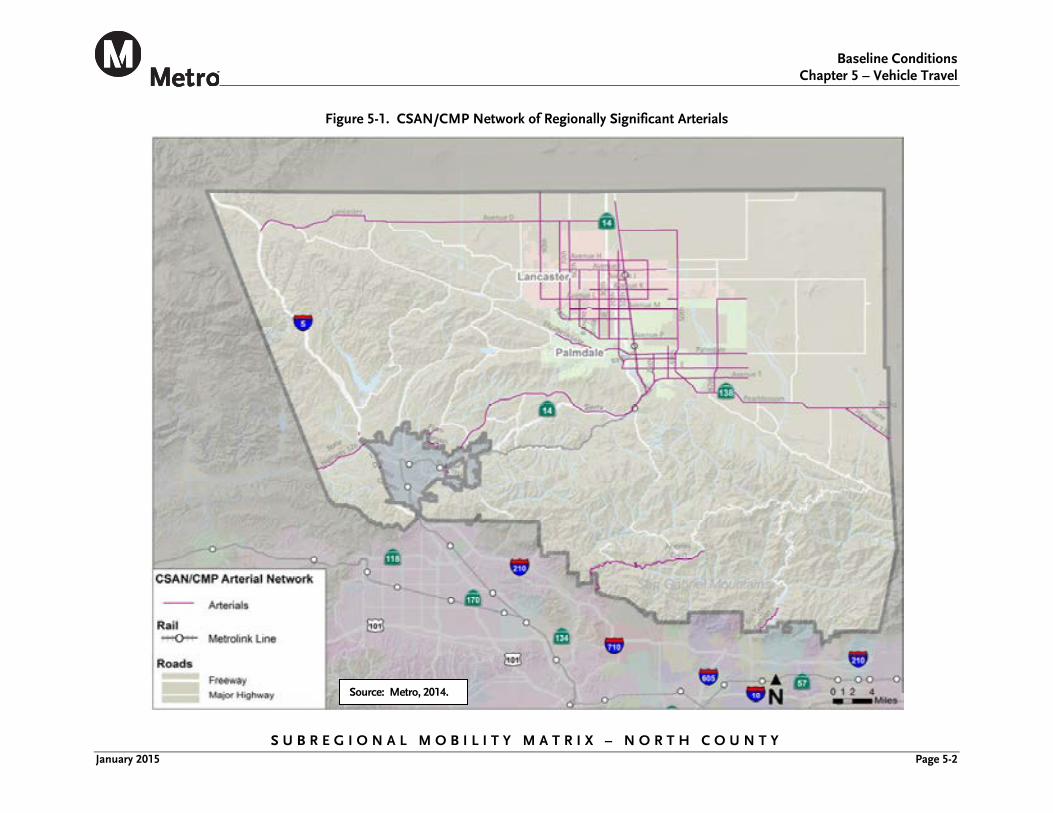
Baseline Conditions
Chapter 5 – Vehicle Travel
S U B R E G I O N A L M O B I L I T Y M A T R I X – N O R T H C O U N T Y January 2015 Page 5-2
Figure 5-1. CSAN/CMP Network of Regionally Significant Arterials
Source: Metro, 2014.
Baseline Conditions
Chapter 5 – Vehicle Travel
S U B R E G I O N A L M O B I L I T Y M A T R I X – N O R T H C O U N T Y January 2015 Page 5-3
5.3 Goods Movement Vehicle Travel The study area contains several routes of critical importance to regional goods movement, as designated by jurisdictions and identified through the draft Countywide Strategic Truck Arterial Network (CSTAN). Figure 5-2 indicates the draft CSTAN truck route network in the North County study area.
5.4 Vehicle Safety
5.4.1 Motor Vehicle Collisions
Figure 5-3 shows the density of location of motor vehicle collisions in the study area from 2009 to 2011.
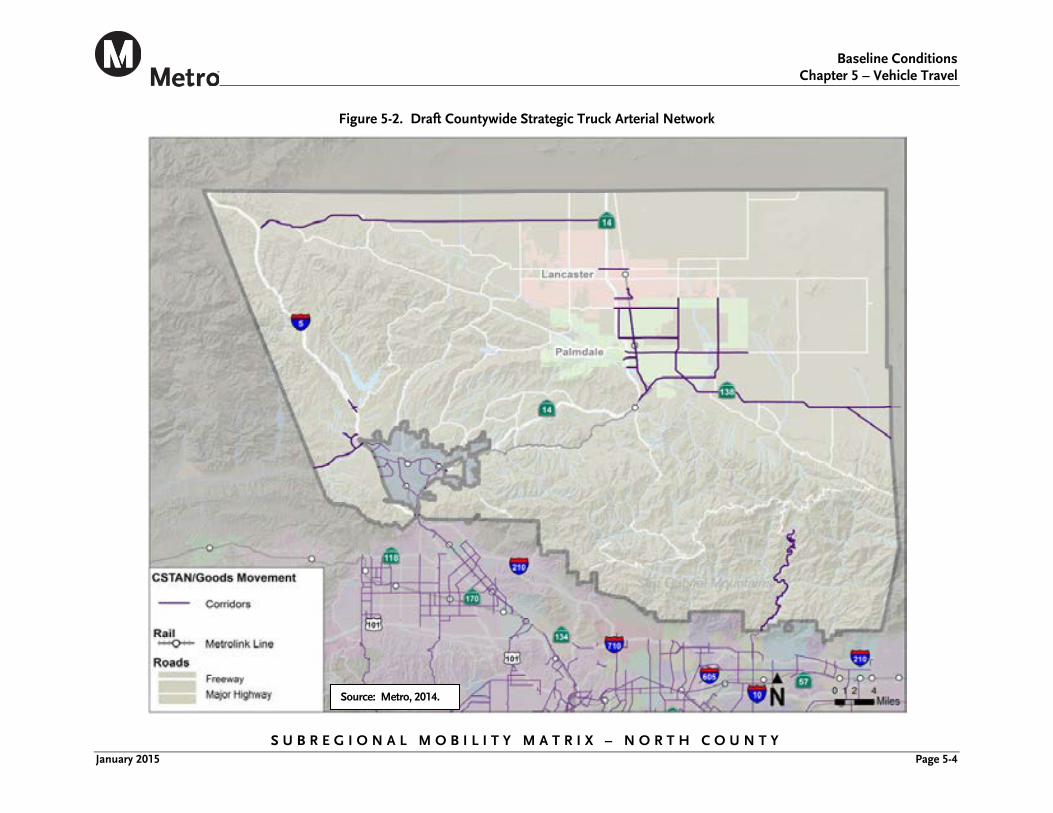
Baseline Conditions
Chapter 5 – Vehicle Travel
S U B R E G I O N A L M O B I L I T Y M A T R I X – N O R T H C O U N T Y January 2015 Page 5-4
Figure 5-2. Draft Countywide Strategic Truck Arterial Network
Source: Metro, 2014.
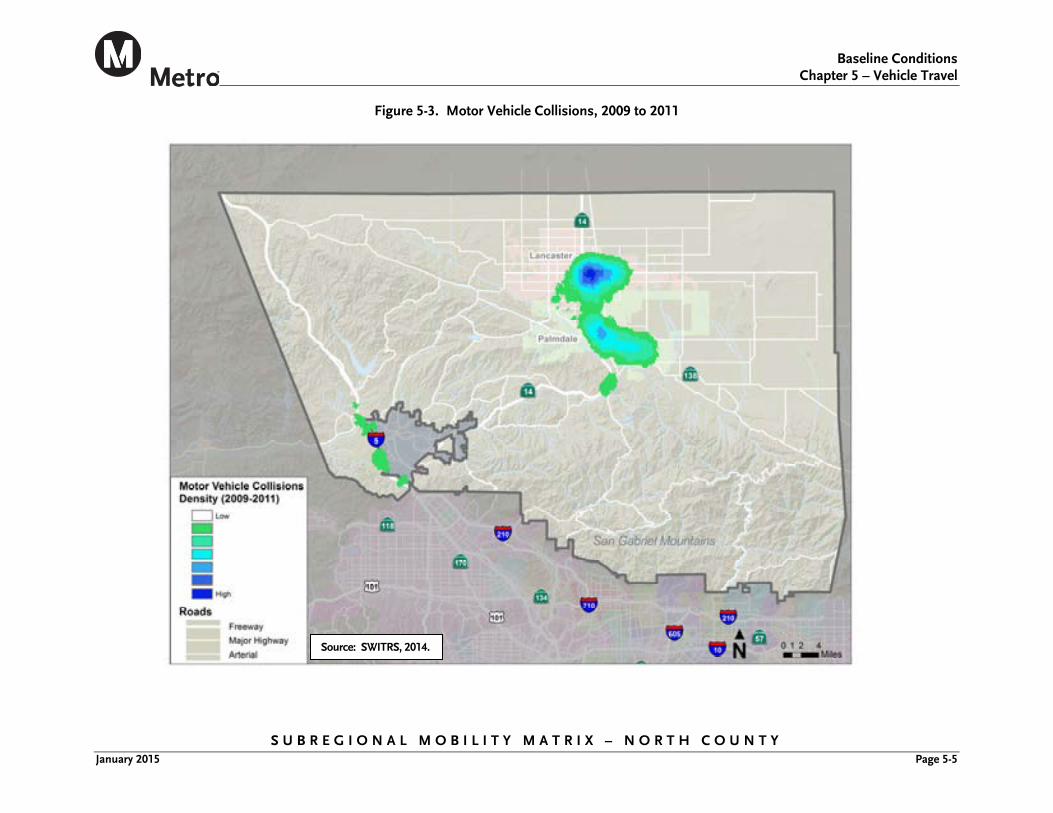
Baseline Conditions
Chapter 5 – Vehicle Travel
S U B R E G I O N A L M O B I L I T Y M A T R I X – N O R T H C O U N T Y January 2015 Page 5-5
Figure 5-3. Motor Vehicle Collisions, 2009 to 2011
Source: SWITRS, 2014.
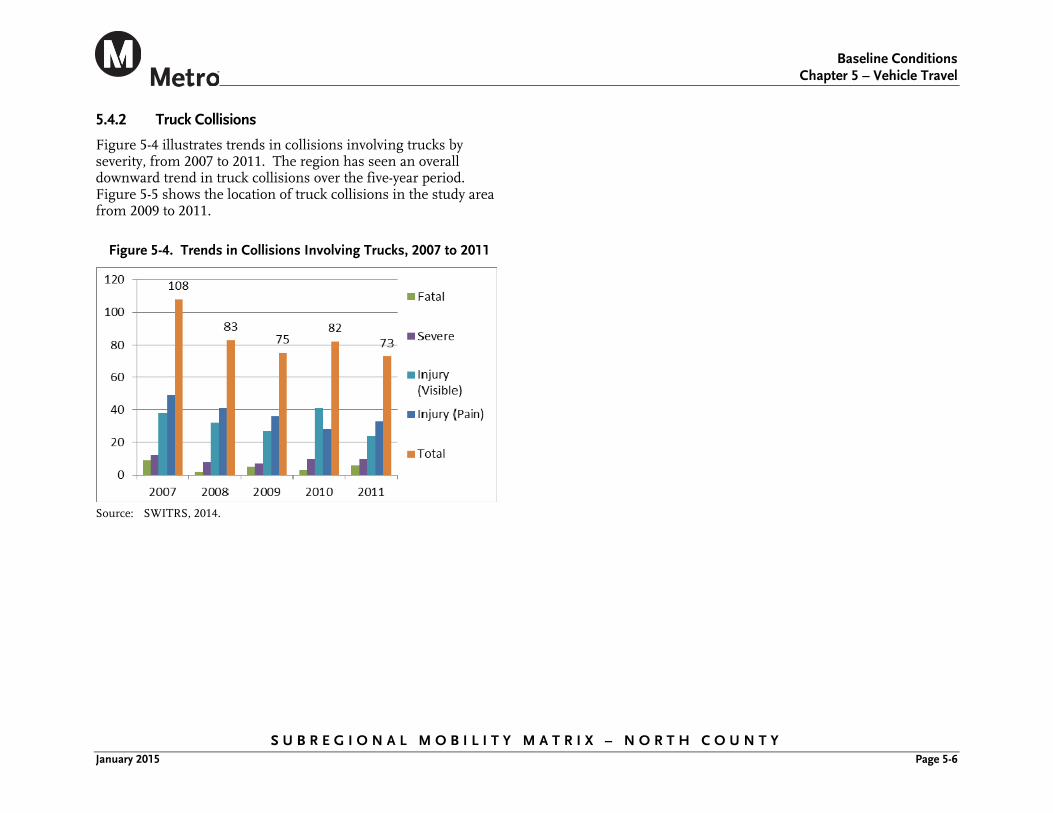
Baseline Conditions
Chapter 5 – Vehicle Travel
S U B R E G I O N A L M O B I L I T Y M A T R I X – N O R T H C O U N T Y January 2015 Page 5-6
5.4.2 Truck Collisions
Figure 5-4 illustrates trends in collisions involving trucks by severity, from 2007 to 2011. The region has seen an overall downward trend in truck collisions over the five-year period. Figure 5-5 shows the location of truck collisions in the study area from 2009 to 2011.
Figure 5-4. Trends in Collisions Involving Trucks, 2007 to 2011
Source: SWITRS, 2014.
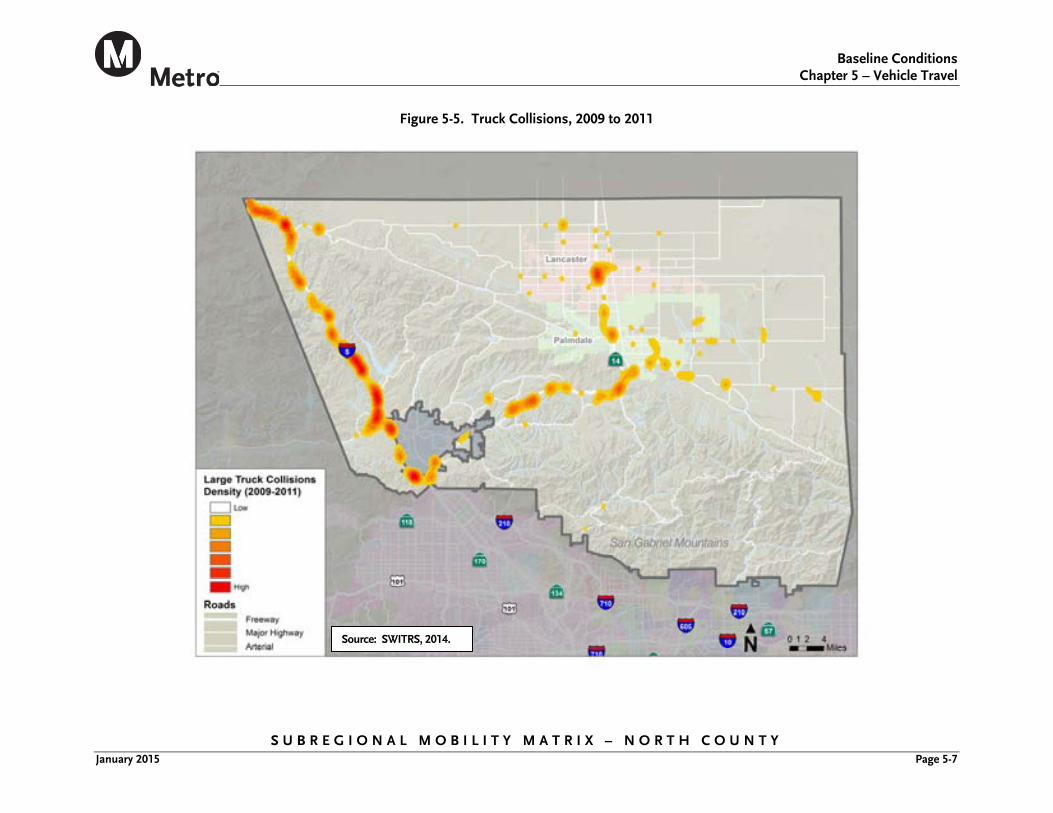
Baseline Conditions
Chapter 5 – Vehicle Travel
S U B R E G I O N A L M O B I L I T Y M A T R I X – N O R T H C O U N T Y January 2015 Page 5-7
Figure 5-5. Truck Collisions, 2009 to 2011
Source: SWITRS, 2014.
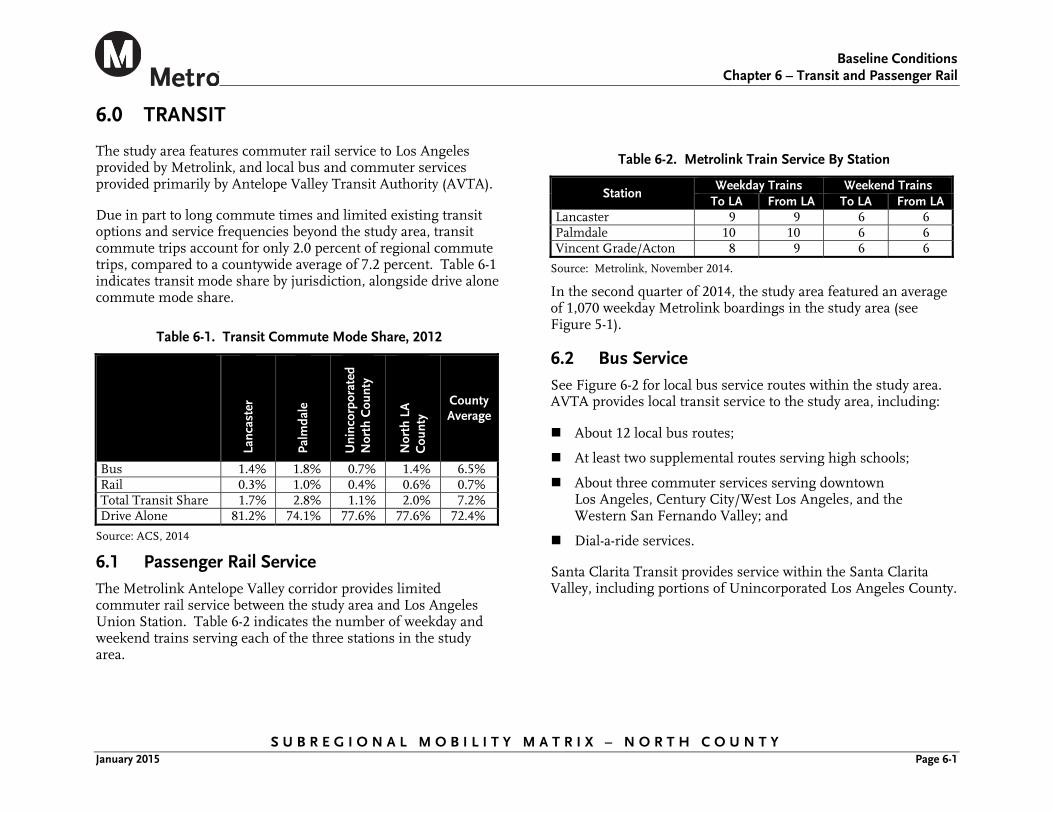
Baseline Conditions
Chapter 6 – Transit and Passenger Rail
S U B R E G I O N A L M O B I L I T Y M A T R I X – N O R T H C O U N T Y January 2015 Page 6-1
6.0 TRANSIT
The study area features commuter rail service to Los Angeles provided by Metrolink, and local bus and commuter services provided primarily by Antelope Valley Transit Authority (AVTA).
Due in part to long commute times and limited existing transit options and service frequencies beyond the study area, transit commute trips account for only 2.0 percent of regional commute trips, compared to a countywide average of 7.2 percent. Table 6-1 indicates transit mode share by jurisdiction, alongside drive alone commute mode share.
Table 6-1. Transit Commute Mode Share, 2012
Lanc
aste
r
Palm
dale
Uni
ncor
pora
ted
Nor
th C
ount
y
Nor
th L
A
Cou
nty
County Average
Bus 1.4% 1.8% 0.7% 1.4% 6.5% Rail 0.3% 1.0% 0.4% 0.6% 0.7% Total Transit Share 1.7% 2.8% 1.1% 2.0% 7.2% Drive Alone 81.2% 74.1% 77.6% 77.6% 72.4%
Source: ACS, 2014
6.1 Passenger Rail Service The Metrolink Antelope Valley corridor provides limited commuter rail service between the study area and Los Angeles Union Station. Table 6-2 indicates the number of weekday and weekend trains serving each of the three stations in the study area.
Table 6-2. Metrolink Train Service By Station
Station Weekday Trains Weekend Trains
To LA From LA To LA From LA Lancaster 9 9 6 6 Palmdale 10 10 6 6 Vincent Grade/Acton 8 9 6 6
Source: Metrolink, November 2014.
In the second quarter of 2014, the study area featured an average of 1,070 weekday Metrolink boardings in the study area (see Figure 5-1).
6.2 Bus Service See Figure 6-2 for local bus service routes within the study area. AVTA provides local transit service to the study area, including:
About 12 local bus routes;
At least two supplemental routes serving high schools;
About three commuter services serving downtown Los Angeles, Century City/West Los Angeles, and the Western San Fernando Valley; and
Dial-a-ride services.
Santa Clarita Transit provides service within the Santa Clarita Valley, including portions of Unincorporated Los Angeles County.
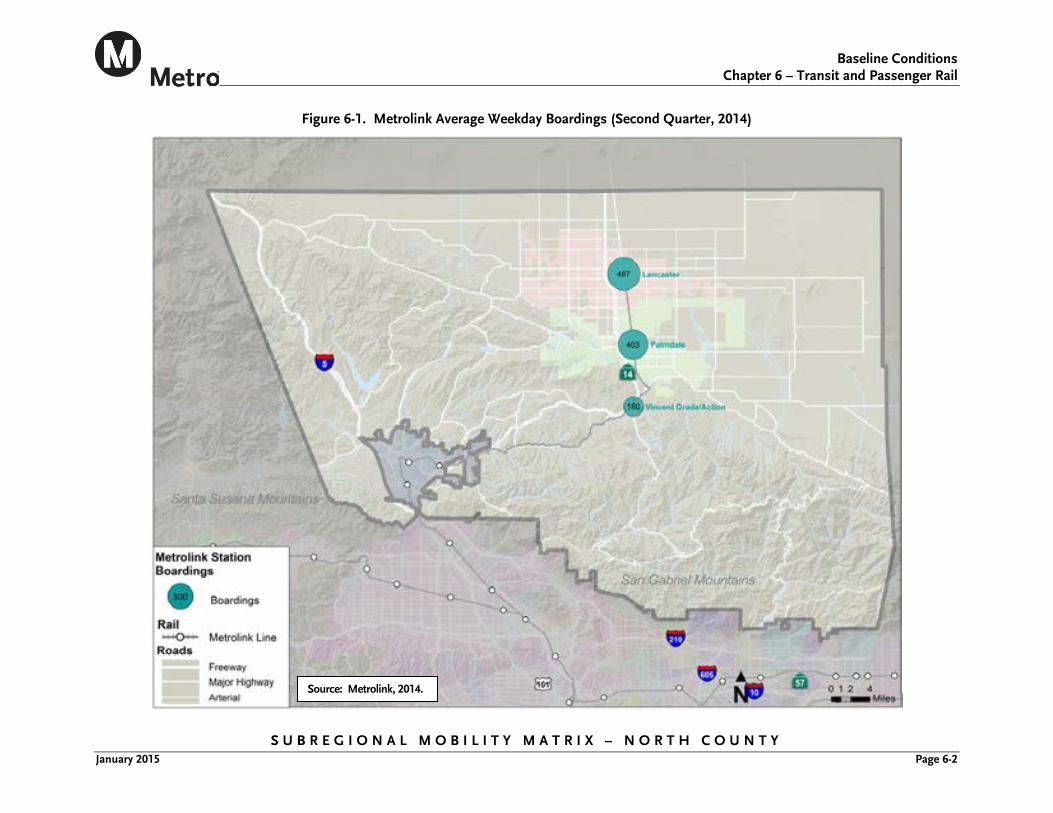
Baseline Conditions
Chapter 6 – Transit and Passenger Rail
S U B R E G I O N A L M O B I L I T Y M A T R I X – N O R T H C O U N T Y January 2015 Page 6-2
Figure 6-1. Metrolink Average Weekday Boardings (Second Quarter, 2014)
Source: Metrolink, 2014.
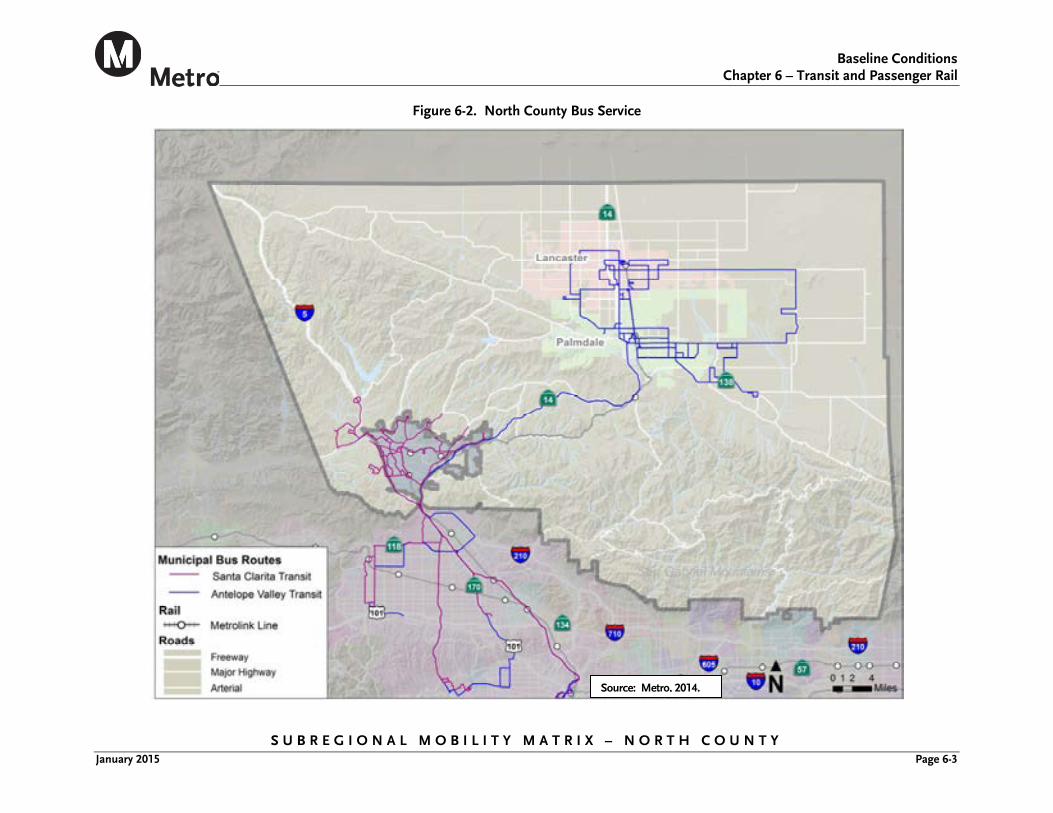
Baseline Conditions
Chapter 6 – Transit and Passenger Rail
S U B R E G I O N A L M O B I L I T Y M A T R I X – N O R T H C O U N T Y January 2015 Page 6-3
Figure 6-2. North County Bus Service
Source: Metro, 2014.
Baseline Conditions
Chapter 6 – Active Transportation
S U B R E G I O N A L M O B I L I T Y M A T R I X – N O R T H C O U N T Y January 2015 Page 7-1
7.0 ACTIVE TRANSPORTATION
Though its existing active transportation network is relatively limited, with the exception of central Lancaster, members of the North County Mobility Matrix subregion has expressed a goal of expanding the subregional bicycle network, as indicated in local circulation elements, and bicycle plans such as the City of Lancaster Master Plan of Trails and Bikeways (2012) and Los Angeles County Bicycle Master Plan (2012). The subregion shares a common vision of completing system gaps and improving access to transit and activity centers for nonmotorized modes, with the goal of increasing the number of travelers who choose to walk, bike, or take transit rather than driving.
7.1 Commute Mode Share Together, bicycling and walking currently represent approximately 1.0 percent of all commute trips in the study area. More than three-quarters of North County commuters drive alone to work.
Table 7-1. Commute Mode Share in Study Area
Mode Mode Share Bicycling 0.1% Walking 0.9% Drive Alone 77.6%
Source: ACS, 2012 (three-year estimate).
7.2 Bicycle Facilities Existing bicycle facilities in the study area are concentrated in the central cities of Lancaster and Palmdale (see Figure 7–1).
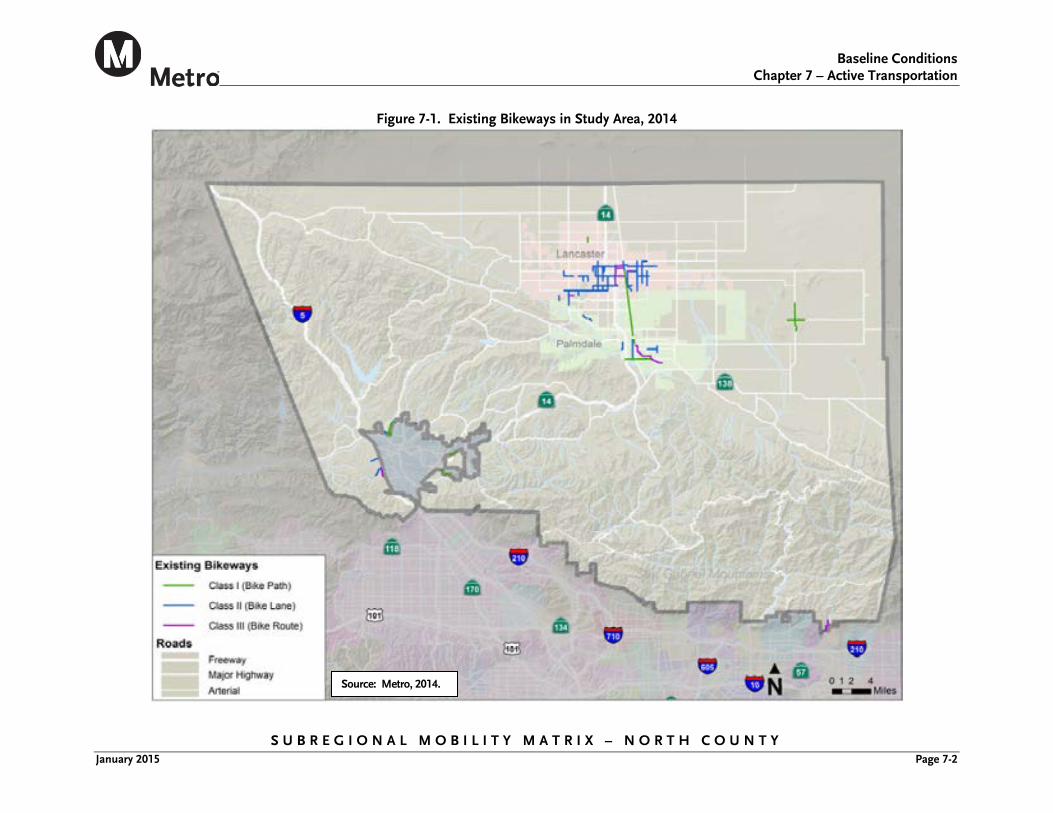
Baseline Conditions
Chapter 7 – Active Transportation
S U B R E G I O N A L M O B I L I T Y M A T R I X – N O R T H C O U N T Y January 2015 Page 7-2
Figure 7-1. Existing Bikeways in Study Area, 2014
Source: Metro, 2014.
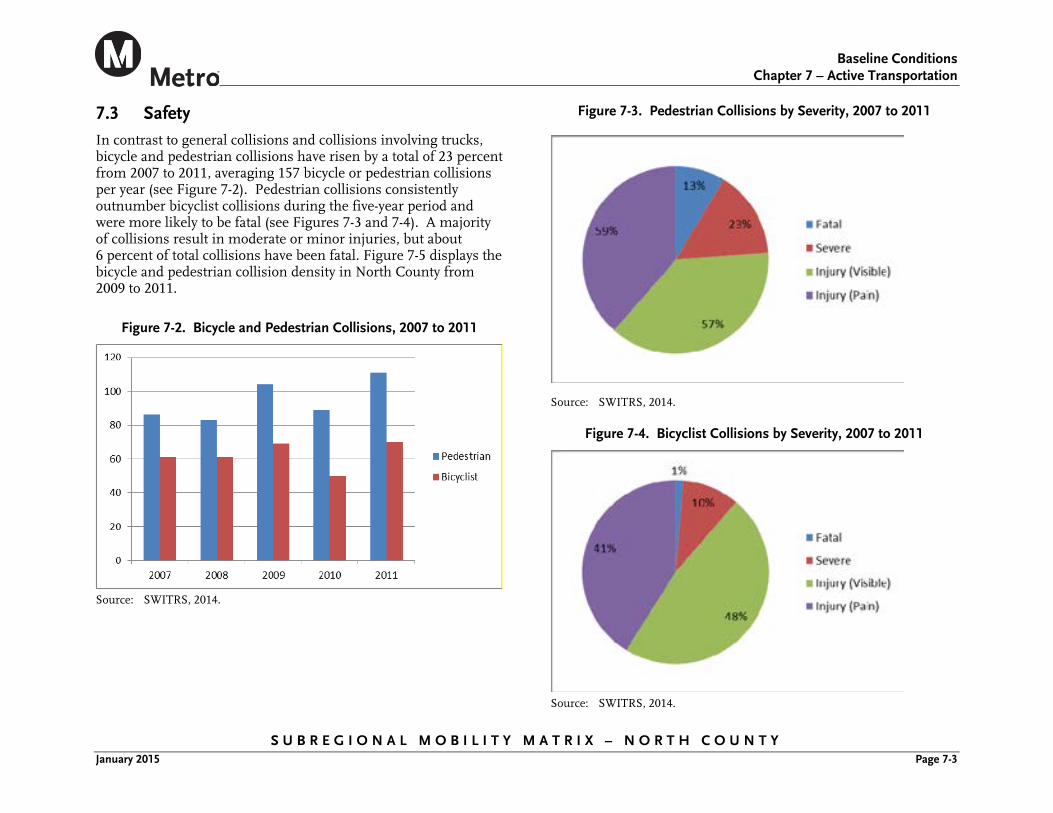
Baseline Conditions
Chapter 7 – Active Transportation
S U B R E G I O N A L M O B I L I T Y M A T R I X – N O R T H C O U N T Y January 2015 Page 7-3
7.3 Safety In contrast to general collisions and collisions involving trucks, bicycle and pedestrian collisions have risen by a total of 23 percent from 2007 to 2011, averaging 157 bicycle or pedestrian collisions per year (see Figure 7-2). Pedestrian collisions consistently outnumber bicyclist collisions during the five-year period and were more likely to be fatal (see Figures 7-3 and 7-4). A majority of collisions result in moderate or minor injuries, but about 6 percent of total collisions have been fatal. Figure 7-5 displays the bicycle and pedestrian collision density in North County from 2009 to 2011.
Figure 7-2. Bicycle and Pedestrian Collisions, 2007 to 2011
Source: SWITRS, 2014.
Figure 7-3. Pedestrian Collisions by Severity, 2007 to 2011
Source: SWITRS, 2014.
Figure 7-4. Bicyclist Collisions by Severity, 2007 to 2011
Source: SWITRS, 2014.
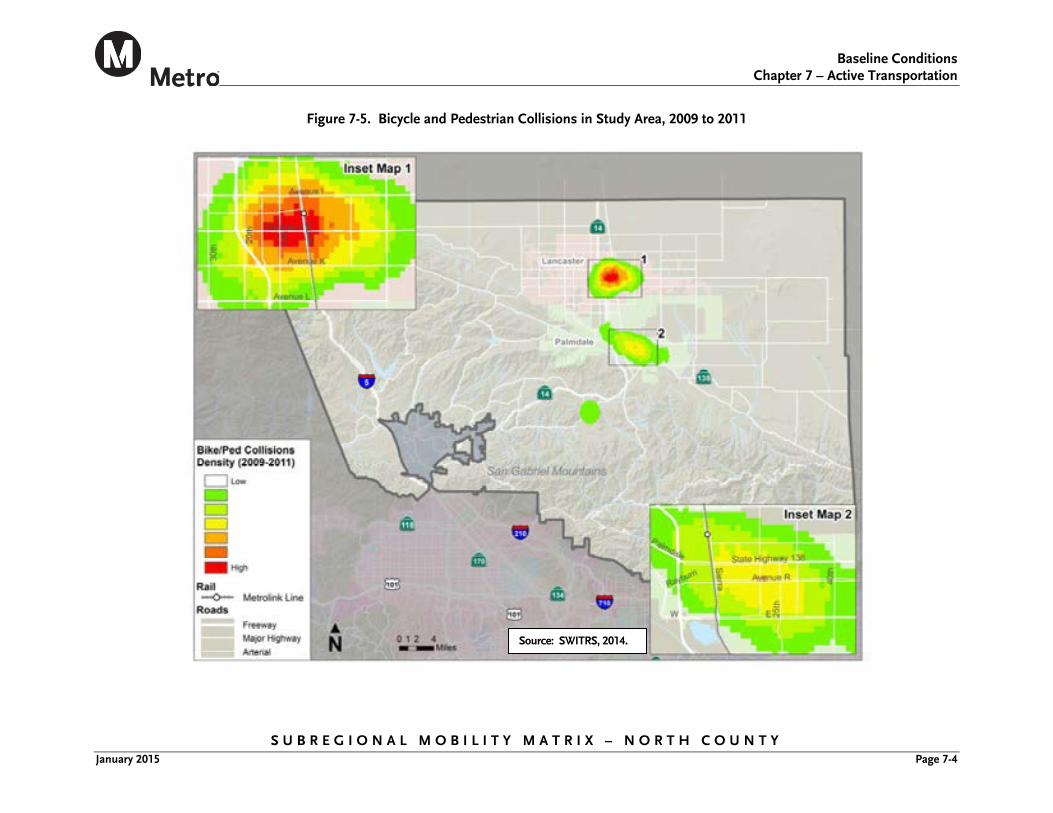
Baseline Conditions
Chapter 7 – Active Transportation
S U B R E G I O N A L M O B I L I T Y M A T R I X – N O R T H C O U N T Y January 2015 Page 7-4
Figure 7-5. Bicycle and Pedestrian Collisions in Study Area, 2009 to 2011
Source: SWITRS, 2014.
Baseline Conditions
Chapter 8 – Next Steps
S U B R E G I O N A L M O B I L I T Y M A T R I X – N O R T H C O U N T Y January 2015 Page 8-1
8.0 CONCLUSIONS AND NEXT STEPS
This report identifies several key findings regarding existing transportation system, including but not limited to:
Very high rates of expected growth are expected in North County, which will place greater burdens on multimodal system. North County believes actual growth in population and employment will outpace SCAG projections.
The region features a larger population of at-risk residents but better air quality than the County average.
Residents face long commute travel times with few alternatives to driving other than infrequent Metrolink trains and commuter express shuttles operated by AVTA.
While overall vehicle collisions have steadily decreased over the last several years, collisions involving pedestrians and bicyclists are gradually rising.
The final subregional mobility matrix report, expected in February 2015, will include high-level evaluation of the projects and programs proposed in Section 7.0 of this document. This effort is intended to serve as critical input for the Metro Long Range Transportation Plan process.