Embed Size (px)
Citation preview
March 14, 2012
Initiating Coverage
ICICI Securities Ltd | Retail Equity Research
Banking on integrated CRAMS model… Jubilant Life Sciences (JLS) is an integrated mid-sized pharmaceutical company that has a presence across the value chain from basic life science chemicals to generic formulations including speciality pharmaceuticals like radio pharmaceuticals. It is the largest Indian company in the CRAMS space. The demerger of its agri and polymer products business augurs well for concentrating on pharmaceuticals and catering to incremental CRAMS demand. With the unique USP of being vertically integrated, it is well placed to maintain margins and profitability despite volatility in pricing. We expect JLS’ revenues, EBIDTA and PAT to grow at a CAGR of 16.8%, 26.5% and 24.4% to | 5152.6 crore, | 1130.1 crore and | 521.1 crore, respectively in FY11-14E. We are initiating coverage on the stock with a BUY rating. CRAMS revival to improve leverage position After a lull in FY10, the fortunes of Indian CRAMS players are slowly but surely coming back to normal. JLS, being the largest Indian CRAMS player, is riding on the revival in CRAMS fortunes and the recent order inflow of ~US$270 million (most of them are ‘take or pay’) in the last 8 to 12 months vindicates the revival. This, we believe, will improve the cash flows and already stretched balance sheet, a major stumbling block for valuation multiples. Life science products to provide multiple growth drivers The life science products business (~78% of overall sales), which comprises seven business verticals, is expected to grow at a CAGR of ~17% in FY11-14E on the back of new capacity additions and new product launches in various geographies. We believe pricing pressure in the life science ingredients (LSI) sub-category will be made good by strong traction from the generic sub-category.
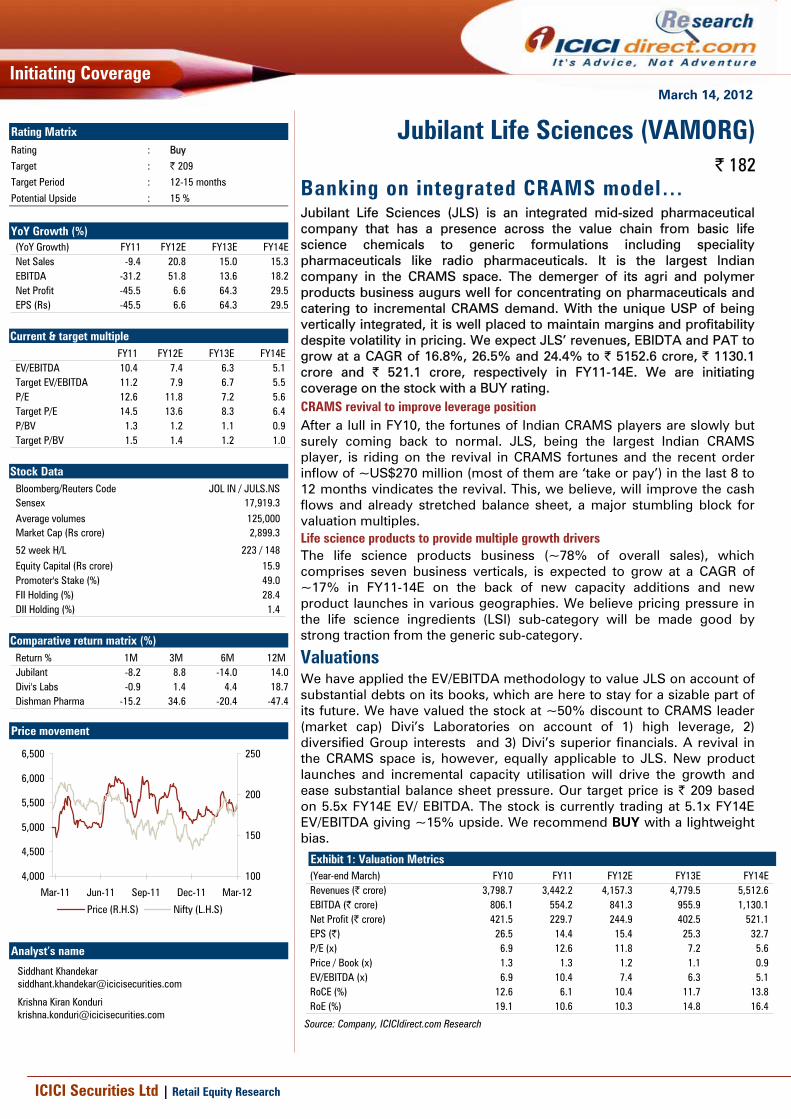
Valuations We have applied the EV/EBITDA methodology to value JLS on account of substantial debts on its books, which are here to stay for a sizable part of its future. We have valued the stock at ~50% discount to CRAMS leader (market cap) Divi’s Laboratories on account of 1) high leverage, 2) diversified Group interests and 3) Divi’s superior financials. A revival in the CRAMS space is, however, equally applicable to JLS. New product launches and incremental capacity utilisation will drive the growth and ease substantial balance sheet pressure. Our target price is | 209 based on 5.5x FY14E EV/ EBITDA. The stock is currently trading at 5.1x FY14E EV/EBITDA giving ~15% upside. We recommend BUY with a lightweight bias.
Exhibit 1: Valuation Metrics (Year-end March) FY10 FY11 FY12E FY13E FY14ERevenues (| crore) 3,798.7 3,442.2 4,157.3 4,779.5 5,512.6 EBITDA (| crore) 806.1 554.2 841.3 955.9 1,130.1 Net Profit (| crore) 421.5 229.7 244.9 402.5 521.1 EPS (|) 26.5 14.4 15.4 25.3 32.7 P/E (x) 6.9 12.6 11.8 7.2 5.6 Price / Book (x) 1.3 1.3 1.2 1.1 0.9 EV/EBITDA (x) 6.9 10.4 7.4 6.3 5.1 RoCE (%) 12.6 6.1 10.4 11.7 13.8 RoE (%) 19.1 10.6 10.3 14.8 16.4
Source: Company, ICICIdirect.com Research
Jubilant Life Sciences (VAMORG) | 182
Rating Matrix Rating : Buy
Target : | 209
Target Period : 12-15 months
Potential Upside : 15 %
YoY Growth (%) (YoY Growth) FY11 FY12E FY13E FY14ENet Sales -9.4 20.8 15.0 15.3EBITDA -31.2 51.8 13.6 18.2Net Profit -45.5 6.6 64.3 29.5EPS (Rs) -45.5 6.6 64.3 29.5
Current & target multiple FY11 FY12E FY13E FY14E
EV/EBITDA 10.4 7.4 6.3 5.1 Target EV/EBITDA 11.2 7.9 6.7 5.5 P/E 12.6 11.8 7.2 5.6 Target P/E 14.5 13.6 8.3 6.4 P/BV 1.3 1.2 1.1 0.9 Target P/BV 1.5 1.4 1.2 1.0
Stock Data Bloomberg/Reuters Code JOL IN / JULS.NSSensex 17,919.3 Average volumes 125,000 Market Cap (Rs crore) 2,899.3
52 week H/L 223 / 148Equity Capital (Rs crore) 15.9 Promoter's Stake (%) 49.0 FII Holding (%) 28.4 DII Holding (%) 1.4
Comparative return matrix (%) Return % 1M 3M 6M 12MJubilant -8.2 8.8 -14.0 14.0Divi's Labs -0.9 1.4 4.4 18.7Dishman Pharma -15.2 34.6 -20.4 -47.4
Price movement
100
150
200
250
Mar-12Dec-11Sep-11Jun-11Mar-11
4,000
4,500
5,000
5,500
6,000
6,500
Price (R.H.S) Nifty (L.H.S)
Analyst’s name
Siddhant Khandekar [email protected]
Krishna Kiran Konduri [email protected]

Page 2ICICI Securities Ltd | Retail Equity Research
Company background Incorporated in 1978, Jubilant Life Sciences (JLS; formerly Jubilant Organosys), is a mid-sized integrated chemicals turned pharmaceuticals player. It started as a full fledged chemical company by entering the vinyl acetate monomer (VAM) business in 1983. Broadly, the company operates through two business segments — life science products & life science services, which contribute ~78% and ~22% of total sales respectively (FY11). JLS is has a strong presence across the pharmaceutical value chain: drug discovery, R&D services and commercial manufacturing of advance intermediates (AIs), active pharmaceutical ingredients (APIs) and other generic drugs. It is also a global leader in 14 advance intermediates including Pyridine. JLS also manufactures life science chemicals (acetyls & specialty gases) and nutrition ingredients for human and animal feed consumption (Niacin, Niacinamide & Choline Chloride). Further, with two operational hospitals in West Bengal, JLS has a small presence in the healthcare business. In FY03-09, JLS expanded its presence into new segments and geographies primarily through the inorganic route. It forayed into supplying generic dosage forms by acquiring Cadista Holdings (US) and PSI Inc (EU). It also entered the Contract Manufacturing Organisation (CMO) business, radiopharmaceuticals and allergenic extracts business by acquiring companies in the US and Canada. The company has so far filed 44 ANDAs with the USFDA, of which 19 have been approved and 11 have been launched. JLS has also filed 54 DMFs in the US, 29 in Europe, 27 in Canada and 6 in Japan. JLS is a part of the Jubilant Bhartia Group headquartered in Noida. Other than pharma, the group has a presence in sectors like food and retail, oil & gas, agri & performance polymers and consulting services in the aerospace and oilfield industries. JLS has 6200 employees including more than 1300 employees in R&D. The company markets its products in more than 75 countries including advanced markets like the US, EU and Japan. Around 69% of total sales come from international markets. It owns 7 manufacturing facilities in India and 3 in North America. In Q4FY11, the company demerged its agri-products and performance polymer segment into a separate entity and listed the same under the name Jubilant Industries.
Exhibit 2: Revenues grow at CAGR of ~39% in FY07-11
895
1530
29723386 3433
0
500
1000
1500
2000
2500
3000
3500
4000
FY07 FY08 FY09 FY10 FY11
(| c
rore
)
Source: Company, ICICIdirect.com Research
Exhibit 3: Revenue break-up for FY11
India31%
Emerging Markets
7% China9%
Europe 16%
North America 37%
Source: Company, ICICIdirect.com Research
Share holding pattern (Q3FY12)
Shareholder Holding (%)Promoters 49.0Institutional Investors 29.8Other Investors 8.3Public 12.9
FII & DII holding trend (%)
47.2 47.2 47.2 48.9 49.0
32.2 32.4 32.0 32.2 29.8
0.0
10.0
20.0
30.0
40.0
50.0
60.0
Q3FY11 Q4FY11 Q1FY12 Q2FY12 Q3FY12
(%)
Promoters FIIs & MFs
Page 3ICICI Securities Ltd | Retail Equity Research
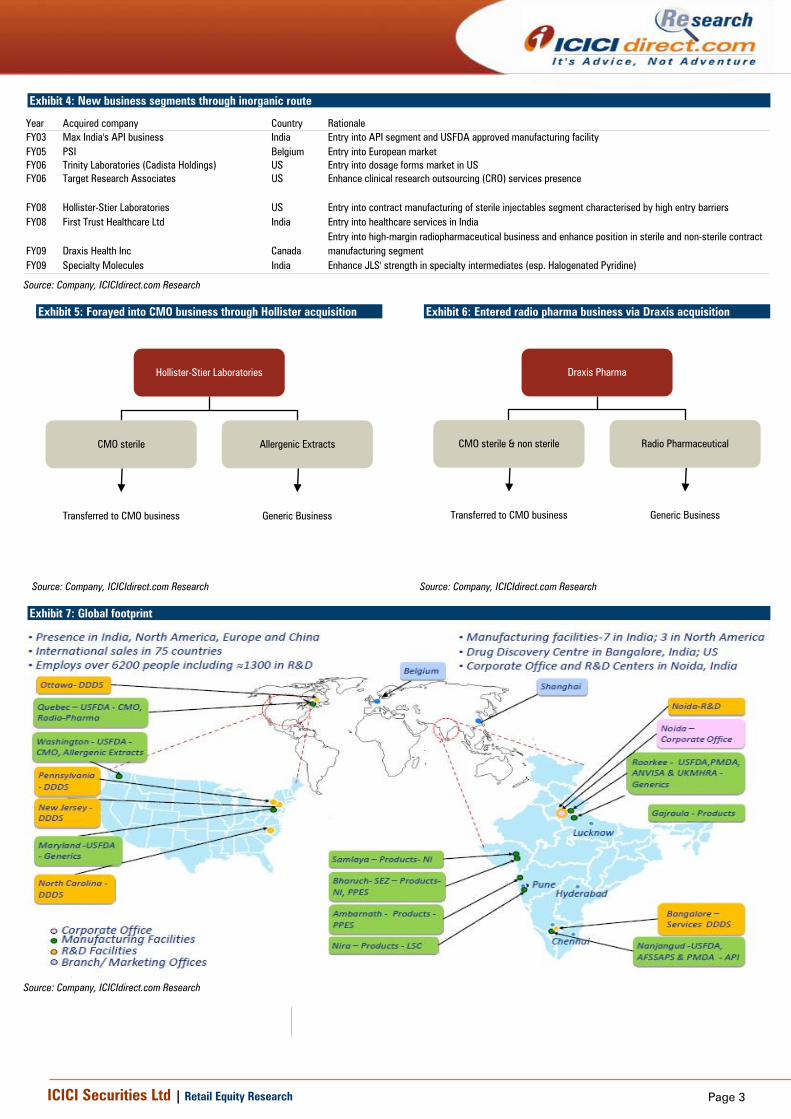
Exhibit 4: New business segments through inorganic route
Year Acquired company Country RationaleFY03 Max India's API business India Entry into API segment and USFDA approved manufacturing facilityFY05 PSI Belgium Entry into European marketFY06 Trinity Laboratories (Cadista Holdings) US Entry into dosage forms market in USFY06 Target Research Associates US Enhance clinical research outsourcing (CRO) services presence
FY08 Hollister-Stier Laboratories US Entry into contract manufacturing of sterile injectables segment characterised by high entry barriersFY08 First Trust Healthcare Ltd India Entry into healthcare services in India
FY09 Draxis Health Inc CanadaEntry into high-margin radiopharmaceutical business and enhance position in sterile and non-sterile contract manufacturing segment
FY09 Specialty Molecules India Enhance JLS' strength in specialty intermediates (esp. Halogenated Pyridine)
Source: Company, ICICIdirect.com Research
Exhibit 5: Forayed into CMO business through Hollister acquisition
Hollister-Stier Laboratories
CMO sterile Allergenic Extracts
Transferred to CMO business Generic Business
Source: Company, ICICIdirect.com Research
Exhibit 6: Entered radio pharma business via Draxis acquisition
Draxis Pharma
CMO sterile & non sterile Radio Pharmaceutical
Transferred to CMO business Generic Business
Source: Company, ICICIdirect.com Research
Exhibit 7: Global footprint
[
Source: Company, ICICIdirect.com Research
ICICIdirect.com | Equity Research Page 4
4 Error! Reference source not found.
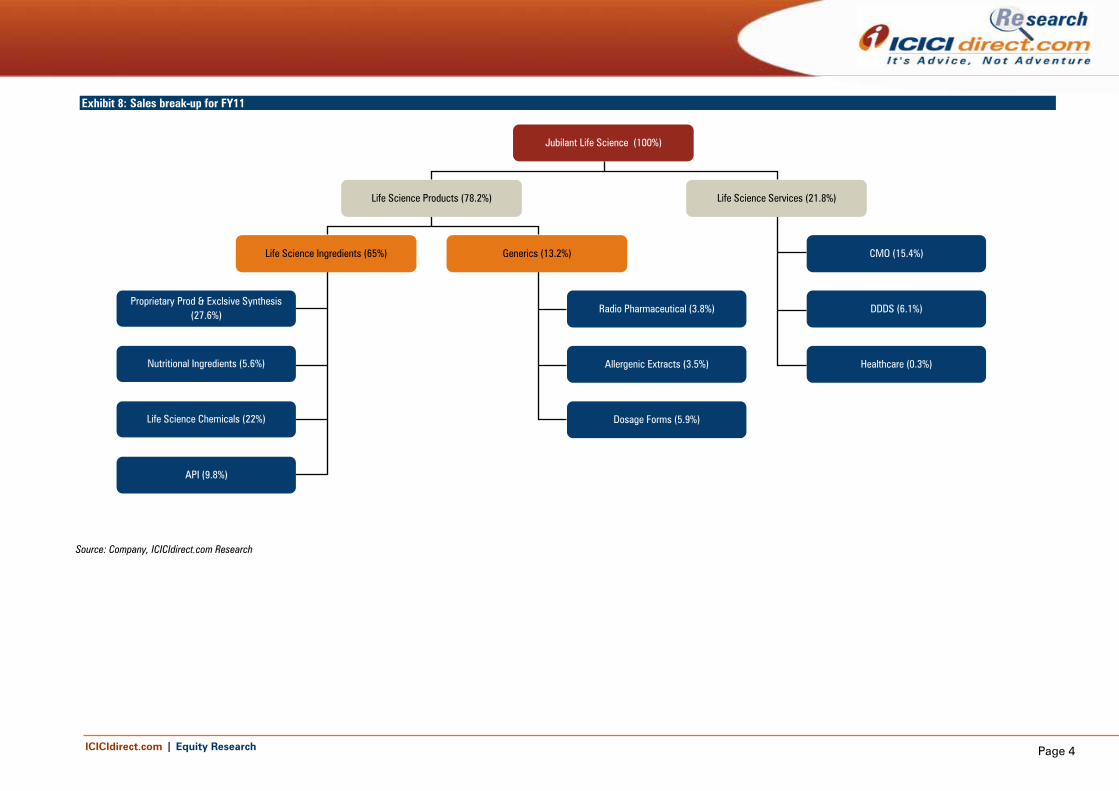
Exhibit 8: Sales break-up for FY11
Jubilant Life Science (100%)
Life Science Products (78.2%) Life Science Services (21.8%)
Life Science Ingredients (65%) Generics (13.2%) CMO (15.4%)
DDDS (6.1%)
Healthcare (0.3%)
Proprietary Prod & Exclsive Synthesis (27.6%)
Nutritional Ingredients (5.6%)
Life Science Chemicals (22%)
API (9.8%)
Radio Pharmaceutical (3.8%)
Allergenic Extracts (3.5%)
Dosage Forms (5.9%)
Source: Company, ICICIdirect.com Research

ICICI Securities Ltd | Retail Equity Research
Exhibit 9: Manufacturing facilities Manufacturing facility Type Business segmentRoorkee, Uttarakhand Formulations GenericGajraula, UP Advance intermediates PPES, Life Sciences ChemicalsNanjangud, Karnataka APIs APINira, Maharashtra Chemicals Life Sciences ChemicalsAmbarnath, Maharashtra Fince Chemicals PPESBharuch, Gujarat Vitamins Nutritional ingredients, PPESSamlaya, Gujarat Animal nutrition Nutritional ingredientsSalisbury, US Formulations Solid Dosage FormSpokane, US Formulations CMO & allergenic extractsKirkland, Canada Formulations CMO & radiopharmaceuticals
Source: Company, ICICIdirect.com Research
Exhibit 10: Presence across value chain
1 2 3
Products segment
Advance intermediates & nutritional products (PPES)
Fine chemicals (PPES)
Active pharmaceutical ingredients
Dosage forms
Radio pharmaceuticals
Allergenic extracts
Services segment
Drug discovery & development
Discovery informatics
Discovery research
Drug development services
Clinical research
Custom research & manufacturing services
Process development & process optimisation
Analytical development services
Small scale exclusive custom synthesis
Large scale custom manufacturing
Commercial Manufacturing
Clinical Phase
Discovery Pre Clinical Phase
Source: Company, ICICIdirect.com Research

Page 6ICICI Securities Ltd | Retail Equity Research
Investment Rationale JLS is the largest Indian CRAMS player with ~50% of sales coming from CRAMS spread among various business verticals. It caters mostly to advanced markets such as the US, Canada, Japan and EU. The company provides solutions at all stages - right from molecule identification to generic commercial manufacturing of formulations. A global revival in CRAMS can be seen as a positive development for the company as it owns huge manufacturing facilities for almost all types of requirements of big pharma players. Higher utilisation rate will improve the leverage/balance sheet ratios, which have been seen as legacy concerns for the company. We expect revenue growth to be driven mainly by its products (ingredients & generics business) and to some extent by services business. New product launches and incremental capacity utilisation of the recently commissioned Sartan facility in APIs, timely execution of PPES order book and commissioning of symtet manufacturing facility would drive the growth in the life science ingredients (LSI) segment. We expect the LSI segment to grow at a CAGR of 14.6% of to | 3373 crore in FY11-14E. The successful launch of RubyFill and Magnevist in the radio pharmaceutical segment and other dosage form launches across advanced markets will boost sales in the generic business. We expect sales from the generic business to grow at a CAGR of 29.8% to | 997 crore in FY11-14E. The overall products business sales are expected to grow at a CAGR of 17.4% to | 4370 crore in FY11-14E. On the services business front, shortage of sterile capacities and current Good Manufacturing practises (cGMP) issues at some of the large players end in the US may be a major booster for the CMO business by virtue of its locations in the US and Canada. We expect more CMO contracts in the sterile business, which would drive overall services business growth. We expect sales from the services business to grow at a CAGR of 14.7% to | 1134 crore in FY11-14E.
Exhibit 11: Sales break-up trend
2234.92466.9 2684.9
3292.23788.6
4370.3
736.6 919.0 748.5 856.0 982.9 1134.2
0500
100015002000250030003500400045005000
FY09 FY10 FY11 FY12E FY13E FY14E
(| c
rore
)
Products Services
Source: Company, ICICIdirect.com Research
Life science products to drive overall growth via new launches
The life science products (LSP) segment constitutes just over three-fourth of the overall sales. It comprises two broad sub-segments - life science ingredients (65% of overall sales) and generics (~13% of overall sales). In
Vertical integration helps JLS to maintain EBITDA margins
Large contracts signed in last 15 months Date Business Worth time period Sales starts from 2012 CMO 90 million 5 years Q2FY132011 CMO 70 million 4 years Q2FY122011 PPES 80 million 3 years Q2FY13

Page 7ICICI Securities Ltd | Retail Equity Research
spite of being under considerable pricing pressure on account of the commodity nature of some of its verticals, the LSP segment remains a high EBITDA generator on account of its vertically integrated business model. As more and more capacities go on stream in the near future from this segment, new product launches and incremental capacity utilisation will drive the overall growth for the company. We expect LSP to grow at a CAGR of 17.4% to | 4370 crore in FY11-14E.
Exhibit 12: Life science products to grow at a CAGR of 17.4% between FY11-14E
2234.92466.9
2684.9
3292.23788.6
4370.3
0500
100015002000250030003500400045005000
FY09 FY10 FY11 FY12E FY13E FY14E
(| c
rore
)
Life Science Products
Source: Company, ICICIdirect.com Research
APIs, proprietary products to accelerate LSI growth The life science ingredients (LSI) segment comprises four verticals - proprietary products and exclusive synthesis (PPES), nutritional ingredients, life science chemicals and APIs. This segment will see major capacity additions in verticals such as PPES, nutritional ingredients and APIs. We expect new launches and order execution to counter some of the legacy pricing pressure in this segment. Further, JLS’ own expertise in Pyridine and Acetyl chemistry will also play a major role in LSI growth. We expect LSI to grow at a CAGR of 14.6% to | 3373 crore in FY11-14E.
Exhibit 13: Life science ingredients grow at a CAGR of 14.6% in FY11-14E
1929 2084 2232.72509.2
2913.0
3373.3
0
500
1000
1500
2000
2500
3000
3500
4000
FY09 FY10 FY11 FY12E FY13E FY14E
(| c
rore
)
Life Science Ingredients
Source: Company, ICICIdirect.com Research
Symtet contract, new launches to fine tune PPES growth Proprietary product & exclusive synthesis (PPES) accounts for ~27% of overall sales. It constitutes two different sub-segments - proprietary products (PP) and exclusive synthesis (ES). Through the PP segment, JLS monetises its expertise in Pyridine chemistry. Pyridine is a basic organic chemical. It is a versatile building block used as a precursor to
New launches and order execution will counter some of
the legacy pricing pressure issues in life science
ingredients segment
JLS has a portfolio of 150 proprietary products

Page 8ICICI Securities Ltd | Retail Equity Research
agrochemicals and pharmaceuticals and is also an important solvent and reagent. The company set up the Pyridine facility way back in 1990. Over the years, it ventured into various derivatives of Pyridine used in pharmaceuticals and agrochemicals industries. The proprietary products portfolio includes products such as Pyridine, Picolines, Piperidines, Cyanopyridines, Aminopyridines, Chloro and Bromopyridines, etc. JLS has a portfolio of 150 proprietary products, which form the building blocks for 110 APIs and 22 agro-chemicals. These products are categorised under various business units such as advanced intermediates, fine chemicals and crop sciences. JLS enjoys global leadership position in Pyridine In exclusive synthesis (ES), the company works with the innovator companies from the early stage of development to offer intermediates and APIs throughout the value chain by altering production requirements as per the client’s needs. JLS has 17 projects of exclusive synthesis in various phases of development. The PP business is prone to pricing pressure, which was visible in the last few quarters. This is more of a volume driven business. JLS’ growth strategy for this segment is to augment existing facility and introduce new products. In this regard, it plans to start production for two new agrochemicals actives and some new launches in fine chemicals and intermediates. The new manufacturing facility at the Bharuch SEZ is expected to further boost sales from the PP segment. JLS plans to exploit its expertise in Pyridine to manufacture Symtet (2, 3, 5, 6-Tetrachloropyridine), a derivative of Pyridine, used by agrochemicals producers. Symtet production on a larger scale has been earmarked for a particular customer. At its full capacity (24000 MTPA), the plant will have a revenue potential of ~US$90 million. We expect sales from the PPES segment to grow at a CAGR of 15.8% to | 1481 crore in FY11-14E, driven by new capacities going on stream in the PP sub-segment.
Exhibit 14: PPES to grow at a CAGR of 15.8% b/w FY11-14E
912.4 945.2 949.21091.6
1288.1
1481.3
0
200
400
600
800
1000
1200
1400
1600
FY09 FY10 FY11 FY12E FY13E FY14E
(| c
rore
)
PPES
Source: Company, ICICIdirect.com Research
New Niacinamide facility to fast track nutritional Ingredients growth Nutritional ingredients constitute ~6% of overall sales. JLS manufactures and markets a wide range of nutritional ingredients and formulations for application across pharmaceuticals, food, personal care and animal feed. The company offers four types of nutritional Ingredients- 1) vitamin B3/B4, 2) enzymes, 3) premixes and 4) specialty and other ingredients.
JLS enjoys global leadership position in Pyridine

Page 9ICICI Securities Ltd | Retail Equity Research
The nutrition products portfolio includes Niacin and Niacinamide (Vitamin B3). JLS has developed various grades of Niacin and Niacinamide suitable for human, pharmacological and personal care use. JLS is currently ranked among the top three manufacturers of Niacin and Niacinamide worldwide. It is also the largest producer of Beta Picoline globally, an important raw material for the manufacture of Vitamin B3. JLS is the largest manufacturer of Choline Chloride (Vitamin B4) in India, which is used in different forms for animal feed application. JLS also manufactures various premixes based on various vitamins and minerals. The company has recently started commercial production of Niacinamide at a new facility in Bharuch SEZ, which has a capacity of 10,000 MTPA Niacinamide and 3-Cyanopyridine. The revenue potential for the said facility has been estimated at around US$75 million. Although revenues from this sub-segment have remained stagnant, the management expects better traction, going ahead, with new launches via new capacity and newly derived applications in cholesterol lowering market for Vitamin B3. We estimate sales from nutritional Ingredients will grow at a CAGR of 12.5% to | 274.2 crore during FY11-14E.
Exhibit 15: Nutritional Ingredients to grow at a CAGR 12.5% b/w FY11-14E
165.3196.6 191.7
207.3238.4
274.2
0.0
50.0
100.0
150.0
200.0
250.0
300.0
FY09 FY10 FY11 FY12E FY13E FY14E
(| c
rore
)
Nutrition Ingredients
Source: Company, ICICIdirect.com Research
Growth in Life Science Chemicals to bank upon European push Life science chemicals (LSC) constitute ~22% of overall sales. Through this division, JLS produces various organic intermediates. The company is a leading manufacturer of acetyls in India. It is present across the acetyls value chain based on downstream products of Acetic Acid and ethyl alcohol. These are precursors to downstream products such as pharmaceuticals, beverages, crop protection, aromatics, adhesives, textiles and other solvents. JLS has the capability to produce acetyls from molasses and alcohol. The company owns two distilleries at Gajraula (UP) and Nira (Maharashtra). These facilities are located in the sugar bastions to facilitate supplies of molasses. The company has long-term contracts with the sugar mills to meet alcohol requirements. The product range under this category includes acetic acid, acetic anhydride, ethyl acetate, mono chloro acetic acid and vinyl acetate monomer. The company is contemplating a greater marketing push for these products especially in the South-East Asia and Europe. Besides acetyl, JLS also sells specialty gases such as ethylene oxide mixtures (ETO) and liquid carbon dioxide (CO2), which emerge as by-products of acetylic process. The ETO mixtures are used for a wide spectrum of applications including sterilisation of medical equipment, treatment of foodstuffs, raw material for cosmetics and preservation of
JLS has a presence across the acetyls value chain
JLS also sells specialty gases like ethylene oxide mixtures
and liquid carbon dioxide

Page 10ICICI Securities Ltd | Retail Equity Research
paper products. The liquid CO2 is used in the following applications- 1) carbonation of beer and soft drinks for freshness of taste, 2) preservation of meat during the mincing process, 3) As dry ice for pharmaceuticals and food industry. 4) Use in fire extinguishers and 5) green houses for enhanced growth and yields. With a wider product offering, the LSC segment derives sales from various geographies such as India, Japan, Europe and other emerging markets. As per the strategy to strengthen the reach in European markets, JLS has appointed a leading Swedish firm as sales and marketing agent for two key life science chemicals. We expect LSC to grow at a CAGR of 12% to | 1059.4 crore during FY11-14E on account of capacity de-bottlenecking.
Exhibit 16: LSC segment to grow at a CAGR of 12% in FY11-14E
596.4658.7
754.6822.5
921.2
1059.4
0
200
400
600
800
1000
1200
FY09 FY10 FY11 FY12E FY13E FY14E
(| c
rore
)
Life Sciences Chemicals
Source: Company, ICICIdirect.com Research
New Sartan launches to push APIs growth– APIs constitute ~10% of overall sales. The focus areas are central nervous system (CNS), cardiovascular (CVS), anti-infectives, anti-ulcerants, analgesics and anti-osteoporotic. JLS derives ~50% of API revenues from US and Europe. The company enjoys global market leadership in some of the APIs such as Carbamazepine (CNS, Rank 1), Oxcarbazepine (CNS, Rank 1), Lamotrigine (CNS, Rank 1), Pinaverium Bromide (GI, Rank 1), Citalopram (CNS, Rank 2) and Risperidone (CNS, Rank 2). In order to shore up CVS API sales, JLS has set up a new block for Sartans (APIs used for anti-hypertensive formulations) at its Nanjangud (Karnataka) facility in March 2011. The company has identified incremental growth opportunities from products such as Valsartan, Irbesartan and Losartan as these products are on the verge of patent expiry. The company has tied up with most of the players who have filed ANDAs in respective categories.
The Sartans block has a revenue potential of ~US$50-60 million at 100% capacity utilisation. JLS has already launched Valsartan and Irbesartan in Europe, Canada and parts of emerging markets. Going ahead, we believe a ramp up at the Sartan block will lead the overall API growth. JLS plans to launch around 50 products in the next three years mainly from the CNS and CVS category. Most of these launches are earmarked for the US and Europe. These launches together have a market potential of ~US$1 billion. As on date, JLS has filed 54 DMFs in the US, 29 in Europe, 27 in Canada and six in Japan. We estimate sales from APIs will grow at a CAGR of 18% to | 558 crore during FY11-14E.
JLS enjoys global leadership in APIs like Valsartan,
Carbamazepine, Oxcarbazepine, Lamotrigine and
Pinaverium Bromide
Plans to launch 50 DMFs in the next three years

Page 11ICICI Securities Ltd | Retail Equity Research
Exhibit 17: Potential for API growth
API Brand Name Innovator Patent expiry Therapy US Market valueEscitalopram Oxalate Lexapro Forest Labs Mar-12 CNS US$ 2.7 billionAripiprazole Abilify Otsuka Apr-15 CNS US$ 1.7 billionIrbesartan Avapro Sanofi Mar-12 CVS US$ 1.2 billionRisedronate Sodium Actonel Warner Chilcott Jun-14 Osteoporosis US$ 1.1 billionZoledronic acid Zometa Novartis Sep-12 CVS US$ 775 millionEsomeprazole magnesium Nexium AstraZeneca May-14 CNS US$ 6.3 billionRabeprazole sodium Aciphex Eisai Jun-13 GI US$1.2 billionPaliperidone Invega J & J Apr-12 CNS US$ 350 millionClopidogrel Bisulfate usp Plavix Sanofi May-12 CVS US$ 5.9 billionSolifenacin Succinate Vesicare Astellas Dec-15 Antimuscarinic US$ 1 billionQuetiapine Fumarate Seroqel AstraZeneca Mar-12 CNS US$ 3.75 billionZiprasidone Hydrochloride usp Geodon Pfizer Mar-12 CNS US$ 1.3 billionOlanzapine Zyprexa Eli Lilly Off Patent- CNS US$ 2.8 billionAtorvastatin Calcium Lipitor Pfizer Off patent/MayCVS US$ 7 billion
Source: Company, ICICIdirect.com Research
Exhibit 18: DMF pipeline
1724
3236
51 54
0
10
20
30
40
50
60
FY07 FY08 FY09 FY10 FY11 9MFY12
US DMFs Pipeline
Source: Company, ICICIdirect.com Research
Exhibit 19: APIs to grow at a CAGR of 18% in FY11-14E
254.9 283.5337.2
387.8465.3
558.4
0.0
100.0
200.0
300.0
400.0
500.0
600.0
FY09 FY10 FY11 FY12E FY13E FY14E
(| c
rore
)
APIs
Source: Company, ICICIdirect.com Research
Dosage form segment remain key for Generic business The generics business accounts for ~13% of total sales. Under this segment, the company operates in three verticals i.e. (i) radio pharmaceuticals (3.8% of total sales) (ii) allergenic extracts (3.5% of sales) and (iii) solid dosage forms (5.9% of sales). Both radio pharma and allergenic extracts are called speciality pharma products. The generic business has grown at a CAGR of 61% between FY07 and FY11 mainly on the back of inorganic expansions. In the last three years, JLS has improved product filing in dosage forms, which is expected to bring incremental revenues over the next three or four years. Currently it is planning to increase its reach across all these segments. Over the next three years, it is looking to launch two products in the radio pharma space in the US and Canada. Overall in the generic business, we expect at least three or four new product launches (every year) in the US markets. Overall, we expect the total generic business to grow at a CAGR of 29.8% to | 997 crore between FY11 and FY14E.

Page 12ICICI Securities Ltd | Retail Equity Research
Exhibit 20: Generic business to grow at a CAGR of 29.8% in FY11-14E
305.9382.9
452.2
783.0875.6
997.1
0
200
400
600
800
1000
1200
FY09 FY10 FY11 FY12E FY13E FY14E
(| c
rore
)Total Generics
Source: Company, ICICIdirect.com Research
Momentum in radiopharma segment via new product launches JLS forayed into the radiopharmaceuticals segment by acquiring Draxis Pharma in FY09 for US$253 million. Draxis Pharma operates in the contract manufacturing business (both sterile and non-sterile) and radiopharmaceuticals (through its subsidiary Draximage). Radiopharmaceuticals are used for both therapeutic and diagnostic molecular imaging applications. The radiopharma segment is a niche, high entry barrier business. Draximage primarily supplies radiopharma products to radio pharmacies that provide therapeutic and diagnostic solutions to end customers comprising hospitals, imaging centres and cardiology/oncology clinics. Sodium Iodide I-131 is the main contributor of revenue to this segment. JLS is the leading manufacturer of I-131 in the US. I-131 is used to treat hyperthyroidism. Currently, radiopharma products are marketed in the US, Canada, UK, France, Germany, etc. Recently, it has also received approval from the Atomic Energy Research Board (AERB) to set up a radio pharmacy in India. The successful setting up of the pharmacy would help the company to enter its radio pharmaceutical business in India. Beside India, it also plans to expand its business in the Middle East. The business was impacted in FY10 and H1FY11 due to shortage of raw materials i.e. isotopes. However, with the re-commissioning of nuclear reactors in September 2010 in Canada, raw materials issues have been more or less addressed. To avoid supply issues, it has also tied up with nuclear reactors based in other continents. The successful launch of nuclear medicine imaging agent Sestamibi has improved sales in FY11 over FY10. JLS is planning to launch other products like RubyFill, Magnevist and MolyFill in FY13-15, which would drive sales and profitability. The market size for RubyFill in the US and Canada is around US$60-80 million. It has received approval for RubyFill from the Canadian regulatory authority and also expects USFDA approval in the first half of FY13. We expect sales of the radiopharmaceutical division to grow at a CAGR of ~21% in FY11-14E to | 232 crore.
Acquisition of Draxis Pharma led the foray into the
radiopharma business
Sodium Iodide I-131 is a major contributor for Radio
Pharma Segment
Raw-materials concerns eased

Page 13ICICI Securities Ltd | Retail Equity Research
Exhibit 21: RubyFill and Magnevist launches to drive growth
87.3109.8
129.5
168.4
202.0
232.3
0
50
100
150
200
250
FY09 FY10 FY11 FY12E FY13E FY14E
(| c
rore
)RadioPharmaceuticals
Source: Company, ICICIdirect.com Research
Muted growth to continue in Allergenic extracts JLS entered Allergenic extracts in North America through the acquisition of Hollister-Stier for US$122.5 million. Hollister-Stier operates in two businesses i.e. Allergenic extracts and contract manufacturing for sterile products. Allergenic extracts are widely used to diagnose and treat allergic diseases. These extracts are usually aqueous solutions prepared from a wide variety of such substances as pollen, mould, animal dander, food dust and insects. In the US, more than 1500 substances have been extracted and marketed as allergenic extracts. JLS has a dominant position in more than 200 different allergens and standard mixes of allergy vaccines. Revenues from this business account for 3.5% of total sales. Sales from the segment witnessed marginal growth of 7% in FY09-11. This was, however, higher than the industry growth rate of 2-3%. Currently, the company has a presence in limited parts of the US. It is looking to expand its geographic presence across the US.
Exhibit 22: Sales to grow at a CAGR of 8% between FY11 and FY14E
105.2121.2 119.9
130.0140.4
151.6
0
20
40
60
80
100
120
140
160
FY09 FY10 FY11 FY12E FY13E FY14E
(| c
rore
)
Allergenic Extracts
Source: Company, ICICIdirect.com Research
Despite being a US leader in the allergic extracts business and expanding footprints in the US, we expect the company to clock only a high single digit growth in the allergic extract business as it is a low margins
Hollister acquisition led JLS’ entry into the allergenic
extracts businesses
Allergic extracts industry is growing at 2-3% in the US

Page 14ICICI Securities Ltd | Retail Equity Research
business. We expect sales from this segment to grow at a CAGR of 8% in FY11-14E to | 152 crore. Strong pipeline in advanced markets to hold key for dosage forms Solid dosage formulations contribute ~6% of total sales. Around 90% of JLS’ solid dosage sales come from the US market. JLS supplies generic dosage forms directly to the US Federal Government and also markets its own products in the US market through the distribution network of its subsidiary, Jubilant Cadista. JLS holds around 83% stake in Jubilant Cadista. For the nine months ended December 2011, Cadista posted robust growth of 128% to US$64.6 million on the back of an increase in both price and volume of existing products. The profit increased by 270% to US$22.7 million. The company has so far filed 44 ANDAs with the USFDA, of which 19 have been approved and 11 have been launched. JLS enjoys a leadership position in drugs such as Terazosin (CVS) and Methylprednisolone (anti-inflammatory). Other products that are in the top three are Cyclobenzprine (anti-inflammatory), Hydrochlorothiazide (CVS), Lamotrigine (CNS) and Meclizine (CNS). We expect the company to launch three to four products in the US market over the next two-three years. The company also established its presence in the EU, where it follows a partnership model: JLS develops and licences dossiers to European generic pharmaceutical companies and also undertakes the supply of dosage forms once necessary approvals are obtained. It caters to the US and EU markets from the facilities located at Salisbury, US and Roorkee, India. The Roorkee facility recently got USFDA approval. The capacity utilisation is expected to go up in the near future on the back of higher product approvals from advanced countries like the US, EU and Japan. It has filed 35 dossiers in the EU market, received approval for 30 and launched eight products. In the RoW markets, it has made 160 filings and received approval for 28 products. JLS plans to file 18 ANDAs in the US, 10 in Canada, more than 15 dossiers in EU and more than 100 product filings across RoW markets in the next three years. With more product launches and a sustainable growth model in the US, we expect sales from the solid dosage form to grow at a CAGR of 44% in FY11-14E to | 613 crore.
Exhibit 23: ANDA pipeline
1519
29
37
44
05
101520253035404550
FY08 FY09 FY10 FY11 9MFY12
ANDAs pipeline
Source: Company, ICICIdirect.com Research
Profitability of Jubilant Cadista grew by 270% in 9MFY12
on the back of both price and volume growth
Currently, it markets 11 products in the US market
Plans to file 18 ANDAs in the next three years
Plans to build strong pipeline for the US market

Page 15ICICI Securities Ltd | Retail Equity Research
Exhibit 24: Solid dosage forms to grow at a CAGR of 44% in FY11-14E
113.4151.9
202.8
484.7533.2
613.1
0
100
200
300
400
500
600
700
FY09 FY10 FY11 FY12E FY13E FY14E
(| c
rore
)Solid Dosage Forms
Source: Company, ICICIdirect.com Research
Recovery in CRAMS to drive life science services ahead The life science services (LSS) business contributed around ~22% of total sales in FY11 and 21% in 9MFY12. The company operates in three verticals i.e. (i) contract manufacturing for both sterile and non-sterile business (15.4% of total sales) (ii) drug development and discovery services (6.1% of total sales) and (iii) hospitals business (0.3% of total sales). Sales from LSS witnessed flat growth in the last three years due to a downturn in the global CRAMS industry on account of inventory rationalisation and the global economic slowdown. With the recent tie-ups in the DDDS segment and five agreements worth US$160 million in the CMO business, we believe JLS has overcome a rough patch. The recovery in the global economic condition coupled with re-stocking at the client’s end is expected to improve the prospects of the LSS segment. We expect sales to grow at a CAGR of ~15% in FY11-14E to | 1134 crore.
Exhibit 25: Services segment backed by CMO business
736.6
919.0
748.5856.0
982.9
1134.2
0.0
200.0
400.0
600.0
800.0
1000.0
1200.0
FY09 FY10 FY11 FY12E FY13E FY14E
(| c
rore
)
Life Science Services
Source: Company, ICICIdirect.com Research
Timely execution of contracts to hold key for CMO JLS entered the contract manufacturing (CMO business) of sterile injectables and non-sterile products through the acquisitions of Hollister Stier and Draxis Pharma, in North America in FY08 and FY09, respectively. Through these acquisitions, the company got hold of two manufacturing facilities; one in the US (from Hollister Stier) and the other in Canada (from Draxis Pharma), which are used for the CMO business.
New product launches and increase in volume of existing
products will boost the growth in the solid dosage forms
business
JLS performance mirrored the downtrend in CRAMS
industry in FY10
Over the last six months, JLS signed two contracts worth
US$160 million
Entered the CMO business in FY08

Page 16ICICI Securities Ltd | Retail Equity Research
The manufacturing facility of Hollister Stier is used for sterile while the Draxis facility is used for both sterile and non sterile products. The CMO business contributes around 15% to total sales. Post completion of the Hollister Stier acquisition, JLS expanded the sterile capacity of this facility to 120 million vials per year from 48 million vials per year at an investment of US$43 million. The Draxis manufacturing facility has a current capacity of 60 million vials per year, taking the total capacity to 180 million vials per year. The company serves most of the top global pharmaceutical companies in the CMO business. The current capacity utilisation is around ~65% for 9MFY12, which improved by almost 10% over FY11 capacity utilisation. For the non-sterile product business, the company had signed a contract worth US$120 million for five years with Johnson & Johnson (J&J) for contract manufacturing of ointments, creams and liquids, which has started from January 2009. In FY11, revenues from this contract were impacted due to the restructuring at J&J, which resulted in renegotiation of prices. The CMO business went through a rough patch in FY10, in line with the overall global CRAMS trend. Had it not been for the execution of the H1N1 order worth | 158 crore for GSK, the CMO sales would have actually de-grown in FY10. As we see a revival in the CRAMS business on account of customer re-stocking, the CMO segment will be the beneficiary of the measure. There are certain other issues such as acute shortages in some of the steriles in the US and cGMP related issues at eight out of the top 10 US sterile companies. By virtue of its CMO facilities in the US and Canada, we believe JLS is well placed to tap these opportunities. The addition of new contracts worth US$160 million over the last six months vindicates the potential. We expect sales from CMO to grow at a CAGR of ~17% to | 838 crore in FY11-14E.
Exhibit 26: Newly signed contract to improve segment sales
489.5
661.6
526.5611.0
713.4
837.7
0
100
200
300
400
500
600
700
800
900
FY09 FY10 FY11 FY12E FY13E FY14E
(| c
rore
)
CMO
Sharp increase due to H1N1 contract excecution for GSK
Source: Company, ICICIdirect.com Research
Expanded capacity at Hollister facility to meet customer
demand
Capacity utilisation have increased by 10% in 9MFY12 over
FY11
cGMP issues at big Pharma will boost outsourcing in
sterile products

Page 17ICICI Securities Ltd | Retail Equity Research
Shrinking R&D pipeline, patent vacuum to stimulate DDDS Drug discovery and development solutions (DDDS) constitute 6% of total sales. JLS provides DDDS to R&D teams of large global pharmaceutical companies through its subsidiaries: Jubilant Biosys, Jubilant Chemsys and Jubilant Clinsys (India & US). Biosys and Chemsys provide drug discovery services while Clinsys provides drug development services. These subsidiaries partner with pharma and biotech companies to provide a wide range of services starting from the initial stage of identifying the candidate up to the clinical trials stage. The company provides services in both full service model (FSM) and full time equipment model (FTEM). Under FSM, the company will get both monthly research fee and milestones if any, once the molecule reaches key stage. Beside these, JLS is also eligible to get royalties if any of these molecules reach the market after the grant of patent. Majority of the contracts that JLS is currently executing are FSM. Under FTEM, the innovator companies outsource the job of developing the facility, offices and human resources to a service provider, who could be a CRO with the understanding of the clinical trial data management and biostatistics business. The innovator will only provide software, hardware and arrange for their installation and training.
Exhibit 27: Contract signed over the period Company Year Type of contractEli Lilly 2005 Molecule identification and development till Phase II of clinical trialsAmgen 2008 Molecule identificationBioLeap 2009 Molecule identificationOrion 2009 Collaborative agreement for molecule identificationAstraZeneca 2009 Molecule identificationEndo Pharma 2009 Molecule identification for oncology therapic areasDuke University 2009 Partnership for research and drug discovery Eli Lilly 2009 Extension of 2005 agreement for five more yearsJanssen 2011 Collaborative agreement for molecule identificationNorgine 2011 Collaborative agreement for molecule identificationMnemosyne 2012 Molecule identification in CNS segment
Source: Company, ICICIdirect.com Research
Exhibit 28: DDDS business to grow at a CAGR of 10% in FY11-14E
241.5 249.3
210.1231.7
254.9280.4
0.0
50.0
100.0
150.0
200.0
250.0
300.0
FY09 FY10 FY11 FY12E FY13E FY14E
(| c
rore
)
DDDS
Source: Company, ICICIdirect.com Research
JLS moved from mere functional services i.e. data mining and bio & chemo informatics services to 12 collaborative programmes in the last four or five years. DDDS segment revenues have grown at a CAGR of 26% in FY07-10. However, as a result of the global meltdown, the CRO industry suffered badly due to severe funding issues. Its US subsidiary Jubilant Clinsys was severely impacted and registered a 16% fall in FY11
Recovery seen in CRO business after FY08-11 slowdown
JLS operates in DDDS business through three subsidiaries

Page 18ICICI Securities Ltd | Retail Equity Research
sales. This business, however, is now slowly crawling back to normal. Over the last six months, it has signed two contracts. The company started FY12 with 17 developing programmes and expects to close the year by adding 5-6 programmes. We expect a slow but steady revenue stream from this segment. At the same time, we expect the recovery in Clinsys to be slower and turn profitable only in FY14. We forecast segment revenues will grow at a CAGR of 10% in FY11-14E to | 280 crore.
No expansion plans in near term JLS currently operate two hospitals in West Bengal. The total bed capacity of these two hospitals is 170. The company ventured into the hospital services business in FY08 acquiring a hospital at Berhampore, which has 50 beds. Later in 2009, it opened 120 bed hospitals at Barasat, West Bengal. JLS is not looking to expand its hospital business in the near term. Still at a nascent stage, the healthcare segment contributed ~ | 12 crore to total revenues in FY11. We expect sales to grow at a CAGR of 10% in FY11-14E to | 16 crore.
Exhibit 29: Hospital business to grow at a CAGR of 10% in FY11-14E
6
8
1213
1516
0
2
4
6
8
10
12
14
16
18
FY09 FY10 FY11 FY12E FY13E FY14E
(| c
rore
)
Hospitals
Source: Company, ICICIdirect.com Research
Demerger of APP business a strategic move Effective November 15, 2010, erstwhile Jubilant Organosys demerged its APP segment to form a separate business entity christened as Jubilant Industries Ltd (JIL). Given the difference in the inherent economics and business models of the two businesses, we believe this move will strategically benefit both entities (JLS and JIL) by enabling them to focus on pursuing growth opportunities in their respective industries. The demerger of agri and polymer products (APP) has improved margins and return ratios as the APP business is a 100% commodity business with legacy issues such as low margins (5-12%) and volatility. We believe the demerger will improve overall EBITDA margins and return ratios.
JLS has a bed capacity of 170 beds in two hospitals

Page 19ICICI Securities Ltd | Retail Equity Research
Financials Revenues to grow at a CAGR of ~17% in FY11-14E We expect revenues to grow at a CAGR of 16.8% to | 5513 crore between FY11 and FY14E, driven by growth in life science products (LSP) on the back of capacity additions and new product launches. LSP, which constitutes ~78% of revenues, is expected to grow at a CAGR of 17.4% to | 4370 crore during the same period. On the other hand, we expect life science services (LSS) to grow at a CAGR of 14.7% to | 1134 crore during FY11-14E.
Exhibit 30: Revenues to grow at a CAGR of ~17% in FY11-14E
3542.3 3798.73442.2
4157.34779.5
5512.6
0.0
1000.0
2000.0
3000.0
4000.0
5000.0
6000.0
FY09 FY10 FY11 FY12E FY13E FY14E
(| c
rore
0
Revenues
Source: Company, ICICIdirect.com Research
EBITDA margins to stabilise around 20% We expect EBIDTA margins to remain in the range of 20-21% in FY12, FY13E and FY14E despite some visible pricing pressure in PPES and LSC segments. This, we believe, will be on account of 1) incremental new capacity utilisation, 2) vertically integrated model and 3) growing contribution from generics. EBITDA margins for FY11 (16%) were compressed on account of re-negotiation of J&J contract under the CMO segment and, hence, were not strictly comparable. EBIDTA, in value terms, is expected to grow at a CAGR of 26.5% to | 1130 crore in FY11-14E.
Exhibit 31: EBITDA to grow at a CAGR of ~26% b/w FY11-FY14E
596.6
806.1
554.2
841.3955.9
1130.1
0.0
200.0
400.0
600.0
800.0
1000.0
1200.0
FY09 FY10 FY11 FY12E FY13E FY14E
(| c
rore
)
0.0
5.0
10.0
15.0
20.0
25.0(%
)
EBITDA EBITDA Margins (%)
Source: Company, ICICIdirect.com Research

Page 20ICICI Securities Ltd | Retail Equity Research
Adjusted PAT to grow at CAGR of ~24% in FY11-14E We expect adjusted PAT (after weeding out notional forex impact) to grow at a CAGR of 24.4% to | 521 crore in FY11-14E on the back of higher EBIDTA growth although higher depreciation growth and tax provision will restrict the PAT growth vis-à-vis EBIDTA growth.
Exhibit 32: Adjusted PAT (Net of forex) to grow at a CAGR of 24.4% in FY11-14E
326.8
448.2
268.8332.2
402.5
521.1
0.0
100.0
200.0
300.0
400.0
500.0
600.0
FY09 FY10 FY11 FY12E FY13E FY14E
(| c
rore
)
0.0
2.0
4.0
6.0
8.0
10.0
12.0
14.0
(%)
PAT PAT Margins (%)
Source: Company, ICICIdirect.com Research
Return ratios to set to improve With improved profitability, falling leverage and improvement in asset turnover, we expect a marked improvement in return ratios. We expect RoNW, RoIC and RoCE to improve from 10.6%, 6.7% and 6.1% in FY11 to 16.4%, 11.1% and 13.8%, respectively, by FY14E.
Exhibit 33: Return ratios to improve from current levels
18.4 19.1
10.6
14.816.4
7.9
12.6
6.1
11.713.8
8.0
10.9
6.79.1 9.8
11.110.310.4
0.0
5.0
10.0
15.0
20.0
25.0
FY09 FY10 FY11 FY12E FY13E FY14E
(%)
RoNW (%) ROCE(%) ROIC (%)
Source: Company, ICICIdirect.com Research

Page 21ICICI Securities Ltd | Retail Equity Research
Risk & concerns
Debt remains a key concern The company has a net debt of | 3685 crore as on December 31, 2011. Of this, rupee debt is | 1602 crore while foreign currency debt is US$458 million. The debt-equity ratio for FY11 stood at ~1.8x.
Price erosion/increase in competition in Methylprednisolone tablets may hurt dosage forms sales For the nine months ended December 2011, around 50% of generic solid dosage forms sales were derived from Methylprednisolone tablets. Beside JLS, four generic players are marketing the drug in the US market. Any price erosion or new generic player entrant can affect sales and profitability of the generic business.
Stringent regulatory requirements may impact cost competitiveness With the compliance and regulatory policies becoming more stringent globally in recent years (particularly in the regulated markets of the US and EU), JLS’ profitability could be adversely impacted due to higher testing and assessment related costs. Any unanticipated amendments to the regulatory norms may even necessitate withdrawal of existing products from the market.
High exposure to exchange rate fluctuations The company derives a large part of its revenues through exports and operations outside India (69% of total revenues in FY11). As per the management, the movement of | 1 vs. the dollar can impact the EBITDA by around | 15 crore on an annualised basis.
Persistent pricing pressure in leading segments Almost 50-55% of JLS’ sales (~50% from PPES and ~5% from LSC) are prone to pricing pressure on account of competitive scenario. Whatever steady margins JLS reports are only due to vertical integration. Delay in approvals for customer products to impact profitability Around 50% of revenues come from the CRAMS business. Any delay in regulatory approvals for its clients would impact our projections. Consolidation at client end may hamper future orders In the last two or three years, there have been heightened M&A activities across the globe in the pharma space. Consolidation at the client’s end may hamper future order flow if the acquirer has different priorities.

Page 22ICICI Securities Ltd | Retail Equity Research
Valuation JLS has transformed itself from a pure chemical player to a one-stop pharma solution provider over a span of ~30 years. This ride, of late, has become bumpier on account of huge debts and worsened CRAMS fortune in FY10 and part of FY11. CRAMS constitutes ~50% of overall sales. With revival of CRAMS as is visible from the last few quarter’s performances, for JLS and other CRAMS players, we expect a substantial improvement in debt\equity, debt\EBITDA, interest coverage and asset turnover ratios as no major capex is planed for the next two or three years. The new launches and capacity additions will further strengthen the cash flow position. With multiple revenue points, the company will leverage on its ability to monetise opportunities in the entire Pyridine value chain. We expect JLS’ revenues, EBIDTA and PAT to grow at a CAGR of 16.8%, 26.5% and 24.4%, respectively. We have applied the EV/EBITDA methodology to value JLS on account of substantial debts on its books, which are here to stay for a sizable future. We have valued the stock at 5.5x FY14E EV/EBIDTA, which works out to ~50% discount to sector leader (on the basis of market cap) Divi’s Laboratories on account of 1) high leverage, 2) diversified Group interests and 3) Divi’s superior financials. Revival in the CRAMS space is, however, equally applicable to JLS. New product launches and incremental capacity utilisation will drive the growth and ease substantial balance sheet pressure. Our target price is | 209 based on 5.5x FY14E EV/ EBITDA. The STOCK is currently trading at 5.1 x FY14E EV/EBITDA giving ~15% upside. We recommend BUY with a lightweight bias.
Exhibit 34: Premium/discount vis-à-vis Divi’s Laboratories of 1-year forward EV/EBITDA
-70.0
-60.0
-50.0
-40.0
-30.0
-20.0
-10.0
0.0
10.0
20.0
Mar-07 Nov-07 Jul-08 Mar-09 Nov-09 Jul-10 Mar-11 Nov-11
(%)
Premium/Discount Average Discount
Average discount vs. Divi's: 40%
Source: Company, ICICIdirect.com Research
Exhibit 35: Peer comparison
FY12E FY13E FY14E FY12E FY13E FY14E FY12E FY13E FY14E FY12E FY13E FY14E FY12E FY13E FY14EJubilant Life Sciences 2948 1.5 1.3 1.0 7.4 6.3 5.1 1.2 1.1 0.9 10.3 14.8 16.4 10.4 11.7 13.8Divi's Labs 9827 5.5 4.4 3.6 15.2 11.9 9.6 4.6 3.9 3.3 23.2 23.4 23.0 25.2 26.3 27.2Dishman Pharma 407 1.2 1.1 1.0 6.1 5.6 4.6 0.4 0.4 0.4 8.14 8.5 10.5 6.0 7.3 7.8
EV/EBITDA P/BV RoNW (%) RoCE (%)EV/Revenues
Mcap (| cr)
Source: Company, ICICIdirect.com Research

Page 23ICICI Securities Ltd | Retail Equity Research
Exhibit 36: One year forward EV/EBITDA graph
0.0
2000.0
4000.0
6000.0
8000.0
10000.0
12000.0
14000.0
16000.0
Mar-06 Oct-06 May-07 Dec-07 Jul-08 Feb-09 Sep-09 Apr-10 Nov-10 Jun-11 Jan-12
(| c
rore
)EV 14.5x 12.8x 9.3x 8.1x 5.8x
Source: Company, ICICIdirect.com Research
Exhibit 37: One year forward PE graph
0.0
100.0
200.0
300.0
400.0
500.0
600.0
Mar-06 Oct-06 May-07 Dec-07 Jul-08 Feb-09 Sep-09 Apr-10 Nov-10 Jun-11 Jan-12
(|)
Price 17.4x 15.2x 11.9x 8.6x 6.4x
Source: Company, ICICIdirect.com Research
Exhibit 38: Discount vis-à-vis BSE Healthcare Index 1-year forward PE
0.0
10.0
20.0
30.0
40.0
50.0
60.0
70.0
80.0
Mar-06 Oct-06 May-07 Dec-07 Jul-08 Feb-09 Sep-09 Apr-10 Nov-10 Jun-11 Jan-12
Discount Average Disount
Source: Company, ICICIdirect.com Research

Page 24ICICI Securities Ltd | Retail Equity Research
Exhibit 39: Profit & loss account (| Crore) FY10 FY11 FY12E FY13E FY14ERevenues 3,798.7 3,442.2 4,157.3 4,779.5 5,512.6Growth (%) 7.2 -9.4 20.8 15.0 15.3Raw Material Expenses 1,471.9 1,330.7 1,522.0 1,720.6 1,984.5Employee Expenses 745.3 718.4 848.7 1,003.7 1,157.6Marketing Expenses 245.0 333.3 346.8 406.3 468.6Administrative Expenses 237.2 211.9 231.9 262.9 303.2Manufacturing exp 73.3 69.7 95.9 119.5 137.8Power cost 220.0 224.0 270.6 310.7 330.8Total Operating Expenditure 2,992.6 2,888.0 3,315.9 3,823.6 4,382.5EBITDA 806.1 554.2 841.3 955.9 1,130.1Growth (%) 35.1 -31.2 51.8 13.6 18.2Depreciation 124.7 180.1 210.6 236.1 253.8Interest 150.5 105.1 203.8 198.3 180.3Other Income 19.9 13.0 13.6 12.0 12.0PBT before Exceptional Items 550.7 282.0 440.6 533.5 708.0Less: Exceptional Items 32.9 41.4 102.3 0.0 0.0PBT 517.9 240.6 338.3 533.5 708.0Total Tax 95.9 13.4 49.5 96.0 141.6PAT before MI 421.9 227.2 288.8 437.5 566.4Minority Interest 0.5 -2.5 43.9 35.0 45.3PAT 421.5 229.7 244.9 402.5 521.1Growth (%) 48.8 -45.5 6.6 64.3 29.5Adjusted PAT 448.2 268.8 332.2 402.5 521.1EPS 26.5 14.4 15.4 25.3 32.7EPS (Adjusted) 28.1 16.9 20.9 25.3 32.7
Source: Company, ICICIdirect.com Research
Exhibit 40: Balance sheet
(| Crore) FY10 FY11 FY12E FY13E FY14EEquity Capital 15.9 15.9 15.9 15.9 15.9 Reserve and Surplus 2,185.5 2,156.4 2,354.7 2,701.2 3,157.1 Total Shareholders funds 2,201.4 2,172.3 2,370.6 2,717.2 3,173.0 Debt 3,172.9 3,924.5 3,604.5 3,304.5 3,004.5 Deferred Tax Liability 234.9 210.7 180.7 180.7 180.7 Minority Interest 37.9 41.8 85.7 120.7 166.0 Source of Funds 5,647.1 6,349.3 6,241.6 6,323.1 6,524.3 Gross Block 3,110.4 3,372.6 4,050.3 4,400.3 4,750.3 Acc. Depreciation 943.8 1,059.1 1,236.7 1,438.9 1,657.9 Net Block 2,166.6 2,313.4 2,813.6 2,961.4 3,092.4 CWIP 505.6 677.8 450.0 350.0 200.0 Total Fixed Assets 2,672.2 2,991.2 3,263.6 3,311.4 3,292.4 Net Intangible Assets 1,652.3 1,677.6 1,694.6 1,710.7 1,725.9 Other Investments 256.4 32.8 102.8 152.8 202.8 Inventory 691.0 691.3 1,013.3 1,078.3 1,334.6 Debtors 518.6 520.4 659.1 784.4 904.9 Loans and Advances 518.3 565.4 679.0 657.1 774.1 Cash 503.9 1,045.7 271.9 227.3 120.5 Total Current Assets 2,231.7 2,822.8 2,623.2 2,747.1 3,134.1 Creditors 753.5 786.1 965.9 1,045.8 1,206.5 Provisions 466.6 428.4 531.3 627.5 723.9 Total Current Liabilities 1,220.1 1,214.6 1,497.2 1,673.3 1,930.4 Net Current Assets 1,011.6 1,608.2 1,126.1 1,073.8 1,203.7 Deffered Tax Assets 42.5 39.5 54.5 74.5 99.5 FCMITDA 12.1 - - - - Application of Funds 5,647.1 6,349.3 6,241.5 6,323.1 6,524.3
Source: Company, ICICIdirect.com Research

Page 25ICICI Securities Ltd | Retail Equity Research
Exhibit 41: Cash flow
(| Crore) FY10 FY11 FY12E FY13E FY14EProfit after Tax 421.5 229.7 244.9 402.5 521.1Depreciation 124.7 180.1 210.6 236.1 253.8(Inc)/Dec in current assets -142.3 -49.3 -574.2 -168.5 -493.8Inc/(Dec) in current liabilities 25.8 -5.6 282.6 176.1 257.1
CF from Operations 429.6 355.0 163.9 646.3 538.1Other Investments 14.9 223.7 -70.0 -50.0 -50.0(Purchase)/Sale of Fixed Assets -201.1 -524.4 -500.0 -300.0 -250.0Deferred Tax Liability 119.9 -24.2 -30.0 0.0 0.0Minority Interest 6.0 3.9 43.9 35.0 45.3Deferred Tax Assets -42.5 3.0 -15.0 -20.0 -25.0FCMITDA 263.0 12.1 0.0 0.0 0.0CF from Investing 160.5 -306.0 -571.1 -335.0 -279.7Inc / (Dec) in Equity Capital 1.1 0.0 0.0 0.0 0.0Inc / (Dec) in Sec Loan Funds -741.6 729.1 -300.0 -270.0 -270.0Inc / (Dec) in Unsec. Loan Funds 36.4 22.5 -20.0 -30.0 -30.0Dividend & Dividend tax -37.0 -37.0 -46.6 -55.9 -65.2Inc/(dec) in Sec Pre Account 346.7 -115.4 0.0 0.0 0.0Exchange Rate Fluctuation -73.5 63.1 0.0 0.0 0.0Adjustment in P & L 0.0 -105.2 0.0 0.0 0.0CF from Financing activities -468.0 492.8 -366.6 -355.9 -365.2Net Cash Flow 122.2 541.8 -773.8 -44.6 -106.8Opening Cash 381.7 503.9 1,045.7 271.9 227.3Cash 503.9 1,045.7 271.9 227.3 120.5
Source: Company, ICICIdirect.com Research
Exhibit 42: DuPont analysis
(%)
FY10 FY11 FY12E FY13E FY14EPAT/PBT 81.4 95.5 72.4 75.4 73.6 PBT/EBIT 76.0 64.3 53.6 74.1 80.8 EBIT/Sales 18.0 10.9 15.2 15.1 15.9 Sales/Asset 67.0 54.1 66.5 75.5 84.4 Asset/Equity 256.5 292.3 263.3 232.7 205.6 ROE 19.1 10.6 10.3 14.8 16.4
Source: Company, ICICIdirect.com Research
Exhibit 43: Free cash flow (| Crore) FY10 FY11 FY12E FY13E FY14ENet Profit 421.5 229.7 244.9 402.5 521.1Depreciation 124.7 180.1 210.6 236.1 253.8Change in Working Capital -116.5 -54.8 -291.6 7.7 -236.8Capex -201.1 -524.4 -500.0 -300.0 -250.0Free Cash Flow 228.5 -169.4 -336.1 346.3 288.1
Source: Company, ICICIdirect.com Research

Page 26ICICI Securities Ltd | Retail Equity Research
Exhibit 44: Key ratios (Year-end March) FY10 FY11 FY12E FY13E FY14EPer Share Data (|)EPS 26.5 14.4 15.4 25.3 32.7 Cash EPS 34.3 25.7 28.6 40.1 48.6 BV 138.2 136.4 148.8 170.6 199.2 DPS 2.0 2.0 2.5 3.0 3.5 Cash per Share 31.6 65.6 17.1 14.3 7.6 Operating RatiosEBITDA/Revenues 21.2 16.1 20.2 20.0 20.5 PBT/Revenues 13.6 7.0 8.1 11.2 12.8 PAT/Revenues 11.1 6.7 5.9 8.4 9.5 Return RatiosRoNW 19.1 10.6 10.3 14.8 16.4 RoCE 12.6 6.1 10.4 11.7 13.8 RoIC 10.9 6.7 9.1 9.8 11.1
FY10 FY11 FY12E FY13E FY14EValuation Ratios (x times)P/E 6.9 12.6 11.8 7.2 5.6 EV / EBITDA 6.9 10.4 7.4 6.3 5.1 EV / Revenues 1.5 1.7 1.5 1.3 1.0 Revenues / Equity 1.7 1.6 1.8 1.8 1.7 Market Cap / Revenues 0.8 0.8 0.7 0.6 0.5 Price to Book Value 1.3 1.3 1.2 1.1 0.9 Dividend Yield 1.1 1.1 1.4 1.6 1.9 Turnover Ratios (x times)Inventory Turnover 5.9 5.0 4.9 4.6 4.6 Debtors Turnover Ratio 7.3 6.6 6.3 6.1 6.1
Creditors Turnover Ratio 5.0 4.4 4.3 4.6 4.6 Asset Turnover ratio 0.7 0.6 0.7 0.8 0.9 Solvency Ratios (x times)Debt / Equity 1.4 1.8 1.5 1.2 0.9 Debt / EBITDA 3.9 7.1 4.3 3.5 2.7 Current Ratio 1.8 2.3 1.8 1.6 1.6 Quick Ratio 1.4 1.5 1.6 1.5 1.6
Source: Company, ICICIdirect.com Research

Page 27ICICI Securities Ltd | Retail Equity Research
CRAMS Industry dynamics Contract research and manufacturing services (CRAMS) is the term used for outsourcing of either research services or manufacturing activities (intermediates, APIs or formulations) to third party for cost plus mark-up. In case of formulations deal there may be some royalty sharing agreement. Contract manufacturing requires upfront investments for building up requisite facilities and is capital intensive in nature, thereby, requiring long term assured supply contracts in order to recoup investments. The global CRAMS market is estimated to be around ~US$75 billion in 2011. Contract manufacturing (CMO) consists of ~65% of the CRAMS market while the rest consists of contract research (CRO), which includes drug discovery, clinical trials (preclinical and clinical) and custom synthesis (CS). The Indian CRAMS market is estimated to be around ~US$4 billion, ~60% of which consists of CRM while the rest is CRO. Countries in Eastern Europe and Latin America have been the traditional markets for major part of outsourcing. For the last seven or eight years, the trend is gradually shifting to Asia and particularly countries like India, China, Taiwan and Singapore. Higher employee costs, drain of talented scientists and graduates, geo-political turmoil and environmental issues are some of the reasons for gradual shifting of CRAMS base out of these regions. Another reason cited by industry players is the shift of focus by established CRAMS players of the past such as BASF, Degussa (Evonik-Degussa), Lonza, etc. These companies started focusing on more lucrative businesses such as speciality chemicals, performance polymers, engineering thermoplastics, etc. On account of their size they earned better bargaining powers vis-à-vis the innovator. Consider the case of BASF, whose turnover for CY10 stood at ~US$90 billion, higher than any Tier 1 Pharma MNC. Although the potential for Indian CRAMS players remain positive, they faced tough times during FY10 and the first half of FY11. The financial meltdown in 2008-09 took a toll on global pharma MNCs as well and they started inventory rationalisation by aggressive de-stocking, the effect of which was felt in FY10. Industry players have indicated that the de-stocking exercise of their clients is more or less over, the effect of which was visible in the last two quarters. Going ahead, we expect most of the MNC clients to remain confined to JIT inventory procurement. This move, on the one hand, will facilitate better inventory management. On the other hand, only players with established deep rooted relationships with clients will survive in the long run. This, in fact, will create high entry barriers. The global pharma outsourcing market grew at ~14% CAGR from US$44 billion in FY07 to US$75 billion in FY11. Fuelled by the mounting healthcare costs in developed economies and decreasing profitability of pharma companies (due to patent expiry of several blockbuster drugs), the outsourcing trend is likely to continue if we take into account drugs worth US$97 billion are expected to go off patent in 2011-15 in the US compared to USS$73 billion during 2006-10 forcing innovators to look for various alternatives such as, cost control and introduction of generics to their portfolio.

Page 28ICICI Securities Ltd | Retail Equity Research
Most of the innovators are also bracing for 2015-2020 in which they are planning aggressive product launches to make good for the lost market during the patent meltdown. Innovator companies are likely to outsource more as they focus on their core competencies of molecular R&D and brand building. Pressure due to declining R&D productivity, increased generic competition, patent expiries, increasing cost of drug development and fewer blockbuster drugs is likely to force them to outsource more in the coming years. A large portion of this outsourcing business is likely to be sourced from Asia (mainly India and China). India especially is fast gaining a reputation as a preferred destination for outsourcing pharmaceutical product manufacturing and R&D services due to factors such as 1) highest number of USFDA approved facilities out side US, 2) lower setting up costs for a regulatory compliant plant (40-50% of setting up cost in the west), 3) vast talent pool of chemistry/pharmacy graduates and doctorates, 4) labour cost arbitrage as these qualified technocrats cost just 50-60% of the cost structure in advanced markets, 5) higher share of regulatory filing (DMFs as well as ANDAs) and lastly 6) improved adherence to the IP regime post signing the TRIPS agreement. In spite of all these favourable factors, India’s share in the global outsourcing market remains low at ~5% in FY11 although it has improved from 2.5% in FY07.
Dynamics of CRO industry The CRO business is slowly picking up as MNC innovators are bracing themselves for the post patent 2015-2020 scenario by which time they are planning new molecule launches. India and China are emerging as major destinations for high quality-low cost R&D services. Generally, the innovators outsource from lead identification stage to Phase IIb stage of drug discovery process. Post Phase IIb stage, they try to develop the molecules on there own. In recent years, big players have preferred to source services from contract research organisations on a full services basis for their clinical development needs. Many of them are looking at a functional outsourcing approach under which they contract with a single provider to deliver single or limited services in support of all their clinical trials. Generally, the sponsor companies outsource full service to CROs when they lack adequate internal resources for the proper conduct of the clinical trials. Functional services are generally outsourced to niche service provider in case of non-clinical studies when they lack in-house staff.

Page 29ICICI Securities Ltd | Retail Equity Research
Glossary Pyridine, a basic organic chemical, is a versatile building block and a solvent in agrochemical, pharmaceutical and other industries. It is completely soluble in water, alcohol, ether and benzene. It acts as a scavenger and can catalyse reactions. Initially Pyridines were isolated from coal tars from coking operations. Currently, synthetic processes account for the majority of world production of pyridines. The most common synthetic processes for production of pyridines involve vapour-phase fluid bed reactions of acetaldehyde and ammonia, with or without formaldehyde. Producers can use the same equipment and catalysts to produce the mix of pyridine/beta-picoline or alpha-picoline /gamma-picoline mixtures by selecting raw materials. Changing catalysts and reaction conditions influences the ratio of products formed. The pyridine ring occurs in many important compounds, including azines and the vitamins niacin and pyridoxal. Pyridine is used as a precursor to agrochemicals and pharmaceuticals and is also an important solvent and reagent. Pyridine is added to ethanol to make it unsuitable for drinking. It is used in the in vitro synthesis of DNA, in the synthesis of sulfapyridine (a drug against bacterial and viral infections), antihistaminic drugs tripelennamine and mepyramine, as well as water repellents, bactericides and herbicides. Some chemical compounds, although not synthesised from pyridine, contain its ring structure. They include B Vitamins niacin and pyridoxal, an anti-tuberculosis drug isoniazid, nicotine and other nitrogen-containing plant products. Acetyl is a functional group that contains a methyl group single-bonded to a carbonyl. The carbonyl centre of an acyl radical has one non-bonded electron with which it forms a chemical bond to the remainder R of the molecule. Acetylated organic molecules exhibit increased ability to cross the blood-brain barrier. Acetylation helps a given drug reach the brain more quickly, making the drug's effects more intense and increasing the effectiveness of a given dose. The acetyl group in acetylsalicylic acid (aspirin) enhances its effectiveness relative to the natural anti-inflammatant salicylic acid. In similar manner, acetylation converts the natural painkiller morphine into the far more potent heroin. Vinyl acetate is an organic compound. A colourless liquid with a pungent odour, it is the precursor to polyvinyl acetate, an important polymer in industry. Vitamin B3 (Niacin) is a derivative of Pyridine.

Page 30ICICI Securities Ltd | Retail Equity Research
RATING RATIONALE ICICIdirect.com endeavours to provide objective opinions and recommendations. ICICIdirect.com assigns ratings to its stocks according to their notional target price vs. current market price and then categorises them as Strong Buy, Buy, Hold and Sell. The performance horizon is two years unless specified and the notional target price is defined as the analysts' valuation for a stock. Strong Buy: >15%/20% for large caps/midcaps, respectively, with high conviction; Buy: > 10%/ 15% for large caps/midcaps, respectively; Hold: Up to +/-10%; Sell: -10% or more;
Pankaj Pandey Head – Research [email protected]
ICICIdirect.com Research Desk, ICICI Securities Limited, 1st Floor, Akruti Trade Centre, Road No. 7, MIDC, Andheri (East) Mumbai – 400 093
ANALYST CERTIFICATION We /I, Siddhant Khandekar CA INTER Krishna Kiran Konduri MBA FINANCE research analysts, authors and the names subscribed to this report, hereby certify that all of the views expressed in this research report accurately reflect our personal views about any and all of the subject issuer(s) or securities. We also certify that no part of our compensation was, is, or will be directly or indirectly related to the specific recommendation(s) or view(s) in this report. Analysts aren't registered as research analysts by FINRA and might not be an associated person of the ICICI Securities Inc.
Disclosures: ICICI Securities Limited (ICICI Securities) and its affiliates are a full-service, integrated investment banking, investment management and brokerage and financing group. We along with affiliates are leading underwriter of securities and participate in virtually all securities trading markets in India. We and our affiliates have investment banking and other business relationship with a significant percentage of companies covered by our Investment Research Department. Our research professionals provide important input into our investment banking and other business selection processes. ICICI Securities generally prohibits its analysts, persons reporting to analysts and their dependent family members from maintaining a financial interest in the securities or derivatives of any companies that the analysts cover.
The information and opinions in this report have been prepared by ICICI Securities and are subject to change without any notice. The report and information contained herein is strictly confidential and meant solely for the selected recipient and may not be altered in any way, transmitted to, copied or distributed, in part or in whole, to any other person or to the media or reproduced in any form, without prior written consent of ICICI Securities. While we would endeavour to update the information herein on reasonable basis, ICICI Securities, its subsidiaries and associated companies, their directors and employees (“ICICI Securities and affiliates”) are under no obligation to update or keep the information current. Also, there may be regulatory, compliance or other reasons that may prevent ICICI Securities from doing so. Non-rated securities indicate that rating on a particular security has been suspended temporarily and such suspension is in compliance with applicable regulations and/or ICICI Securities policies, in circumstances where ICICI Securities is acting in an advisory capacity to this company, or in certain other circumstances.
This report is based on information obtained from public sources and sources believed to be reliable, but no independent verification has been made nor is its accuracy or completeness guaranteed. This report and information herein is solely for informational purpose and may not be used or considered as an offer document or solicitation of offer to buy or sell or subscribe for securities or other financial instruments. Though disseminated to all the customers simultaneously, not all customers may receive this report at the same time. ICICI Securities will not treat recipients as customers by virtue of their receiving this report. Nothing in this report constitutes investment, legal, accounting and tax advice or a representation that any investment or strategy is suitable or appropriate to your specific circumstances. The securities discussed and opinions expressed in this report may not be suitable for all investors, who must make their own investment decisions, based on their own investment objectives, financial positions and needs of specific recipient. This may not be taken in substitution for the exercise of independent judgment by any recipient. The recipient should independently evaluate the investment risks. The value and return of investment may vary because of changes in interest rates, foreign exchange rates or any other reason. ICICI Securities and affiliates accept no liabilities for any loss or damage of any kind arising out of the use of this report. Past performance is not necessarily a guide to future performance. Investors are advised to see Risk Disclosure Document to understand the risks associated before investing in the securities markets. Actual results may differ materially from those set forth in projections. Forward-looking statements are not predictions and may be subject to change without notice.
ICICI Securities and its affiliates might have managed or co-managed a public offering for the subject company in the preceding twelve months. ICICI Securities and affiliates might have received compensation from the companies mentioned in the report during the period preceding twelve months from the date of this report for services in respect of public offerings, corporate finance, investment banking or other advisory services in a merger or specific transaction. It is confirmed that Siddhant Khandekar CA Krishna Kiran Konduri MBA FINANCE research analysts and the authors of this report have not received any compensation from the companies mentioned in the report in the preceding twelve months. Our research professionals are paid in part based on the profitability of ICICI Securities, which include earnings from Investment Banking and other business.
ICICI Securities or its subsidiaries collectively do not own 1% or more of the equity securities of the Company mentioned in the report as of the last day of the month preceding the publication of the research report.
It is confirmed that Siddhant Khandekar CA Krishna Kiran Konduri MBA FINANCE research analysts and the authors of this report or any of their family members does not serve as an officer, director or advisory board member of the companies mentioned in the report.
ICICI Securities may have issued other reports that are inconsistent with and reach different conclusion from the information presented in this report. ICICI Securities and affiliates may act upon or make use of information contained in the report prior to the publication thereof.
This report is not directed or intended for distribution to, or use by, any person or entity who is a citizen or resident of or located in any locality, state, country or other jurisdiction, where such distribution, publication, availability or use would be contrary to law, regulation or which would subject ICICI Securities and affiliates to any registration or licensing requirement within such jurisdiction. The securities described herein may or may not be eligible for sale in all jurisdictions or to certain category of investors. Persons in whose possession this document may come are required to inform themselves of and to observe such restriction.