Embed Size (px)
Citation preview
1 3
DOI 10.1007/s15010-016-0948-1Infection (2017) 45:93–102
ORIGINAL PAPER
Mapping Zika virus disease incidence in Valle del Cauca
Alfonso J. Rodriguez‑Morales1,2,3 · Maria Leonor Galindo‑Marquez1 · Carlos Julian García‑Loaiza1 · Juan Alejandro Sabogal‑Roman1 · Santiago Marin‑Loaiza1 · Andrés F. Ayala1 · Guillermo J. Lagos‑Grisales1 · Carlos O. Lozada‑Riascos4 · Esteban Parra‑Valencia3,5 · Jorge H. Rojas‑Palacios6 · Eduardo López3,7,8 · Pío López3,7,8 · Martin P. Grobusch3,9
Received: 21 June 2016 / Accepted: 22 September 2016 / Published online: 14 October 2016 © Springer-Verlag Berlin Heidelberg 2016
used was Kosmo Desktop 3.0RC1®. Three thematic inci-dence rate maps were developed.Results Up to April 2, 2016, 9,825 cases of ZIKV were reported (15.15 % of the country cases). The burden of ZIKV infection has been concentrated in the North of the department. Valle del Cauca borders with other depart-ments with incidence of ZIKV infection, such as Quindío (173 cases) and Risaralda (687 cases). Eleven municipali-ties of Valle del Cauca had cases in the range between 250 and 499 cases/100,000, all in the North and East of the department. Cali, the capital concentrates more than a third of the reported cases of ZIKV in Valle del Cauca.Conclusions Use of GIS-based epidemiological maps allows to guide decision-making for prevention and con-trol of diseases that constitute significant public health problems in the region and the country, such as exempli-fied by the emergence of ZIKV infection, particularly in departments such as Valle del Cauca with a high disease incidence.
Keywords Zika · Epidemiology · Public health · Travelers · Colombia · Latin America
Introduction
Zika virus (ZIKV) epidemics have significantly affected territories or countries in the Americas (46 as of Septem-ber 2016) [1]. Although Colombia is not the country with the highest number of cases, which is Brazil, its cumula-tive incidence rate is higher (around 210 cases/100,000 in Colombia and 130 cases/100,000 in Brazil).
Some areas of Colombia are burdened with a high num-ber of cases and incidence rates; particularly those less developed, in warmer areas, where previous epidemics
Abstract Objective Geographical information systems (GIS) use for development of epidemiological maps in tropical diseases is increasingly frequently utilized. Here, we apply this technique to map the current Zika virus (ZIKV) outbreak in Colombia.Methods Surveillance cases data of the ongoing epidemic of ZIKV in Valle del Cauca department and its capital, Cali (2015–2016), were used to estimate cumulated incidence rates (cases/100,000 population) to develop the first maps in the department and it municipalities. The GIS software
* Alfonso J. Rodriguez-Morales [email protected]
1 Public Health and Infection Research Group, Faculty of Health Sciences, Universidad Tecnologica de Pereira, Pereira, Risaralda, Colombia
2 Organización Latinoamericana para el Fomento de la Investigación en Salud (OLFIS), Riohacha, La Guajira, Colombia
3 Colombian Collaborative Network of Zika (RECOLZIKA), Pereira, Risaralda, Colombia
4 Regional Information System, Universidad Tecnológica de Pereira, Pereira, Risaralda, Colombia
5 Facultad de Medicina, Universidad Católica de la Santísima Concepción, Concepción, Chile
6 Secretary of Health of Cali, Cali, Valle del Cauca, Colombia7 Centro de Estudios en Infectología Pediátrica, Cali, Valle del
Cauca, Colombia8 Department of Pediatrics, Universidad del Valle, Cali, Valle
del Cauca, Colombia9 Center of Tropical Medicine and Travel Medicine,
Department of Infectious Diseases, Division of Internal Medicine, University of Amsterdam, Amsterdam, The Netherlands
94 A. J. Rodriguez-Morales et al.
1 3
Valle del Cauca
COLOMBIA
2015-2016Zika
200.00-499.99
≥ 1000.00
500.00-999.99
0.001-199.990.00-0.0009
Valle del Cauca
Toro (1014.70)
Roldanillo (1049.18)
Zarzal (1125.19)
Vijes (1417.42)
Cali (Capital)
Tolima
Cauca
Rates (cases/100,000pop.)(based on all notified cases)
La Victoria (1541.73)
Pacific Ocean
Valle del Cauca
COLOMBIA
2015-2016Zika
Valle del Cauca
Toro (1014.70)
Roldanillo (1049.18)
Zarzal (112519)
Vijes (1417.42)
Cali (Capital)
Tolima
Cauca
Rates (cases/100,000pop.)(based on clinical syndromicsurveillance)
150.00-599.99
≥ 1000.00
600.00-999.99
0.001-149.990.00-0.0009
Pacific Ocean
95Mapping Zika virus disease incidence in Valle del Cauca
1 3
of dengue and chikungunya (CHIKV) have occurred, and from where concomitant co-circulation of those arboviruses may occur [2, 3]. Nevertheless, it is important to notice that there is not epidemic of dengue and chikungunya during the current epidemic of Zika in Colombia.
Timely updated and location-specific epidemiological information of high resolution is most relevant, even for the definition of clinical sites in the future scenario of vac-cine trials design. Epidemiological tools now include geo-graphical information systems (GIS)-based mapping that allows to estimate the incidence rates and risk of infection by population per area. This enables to make recommenda-tions related to prioritize interventions in population living in those areas as well as in visitors to, or people returning from visiting specific places [4, 5]. We have previously developed epidemiological maps for ZIKV in Colombia using geographical information systems (GIS) at high inci-dence departments, such as La Guajira and Sucre (Carib-bean region), Tolima (Central area), Santander and Norte de Santander (Northeastern area) [6–9]. We have also previously provided GIS-based epidemiological maps for CHIKV in other areas of the country [5].
Methods
Scientific publications using GIS for development of epide-miological maps in ZIKV are still lacking in Latin America. Valle del Cauca is one of the significantly affected territo-ries by the 2015–2016 outbreak. This is a department (first administrative territory level) surrounded by the Pacific Ocean and five other departments (one in the North, three in the West and one in the South of the country). It is con-stituted by 42 municipalities (second administrative terri-tory level) (for a total population of 4,660,438 habitants for 2016, according to the national statistics department, www.dane.gov.co). Its capital, Santiago de Cali (or just simply Cali) municipality, includes 51.4 % of the population of the whole department. Cali is constituted by 23 communes (third administrative territory level).
Surveillance cases data (2015–2016) (officially reported to the National Institute of Health, Colombia) [10] were used to estimate the cumulative incidence rates using reference population data (2016), on ZIKV infections (cases/100,000) and to develop the first maps in the munic-ipalities of Valle del Cauca and its capital, Cali, by com-munes. Data processed for this study stemmed from 42
primary notification units, one per municipality, and were later grouped and consolidated at the department level. In the case of the Cali municipality, data were collected from healthcare institutions of the 23 communes, and later consolidated at the municipality level. Determination of ZIKV infection includes either laboratory and syndromic surveillance (clinical definition of fever, rash, conjunctivi-tis and arthralgias in a municipality with previously ZIKV circulation, at least one case confirmed by RT-PCR). The clinical definition has been recommended by World Health Organization, Pan American Health Organization as well the US Centers for Disease Control and Prevention.
Total number of cases also included those in which clini-cal diagnostic criteria, i.e. the case definition was met, but which were reported in a municipality without RT-PCR confirmation. After one case is confirmed by RT-PCR in a municipality, patients not classified as risk groups (preg-nant women, children <1 year old, people >60 year old and patients with comorbidity), can be diagnosed by clinical definition.
The software Microsoft Access® was the platform to design the spatial database used, to import incidence rates by municipalities in Valle del Cauca and communes at Cali to the GIS software. The Client GIS software open source used was Kosmo Desktop 3.0 RC1® (SAIG S.L., Spain). For the access to geographic data required and sharing results with institutions, support was provided by the spa-tial data infrastructure for the department by the Regional Information System of the Coffee-Triangle ecoregion. The shapefiles of municipalities and communes (.shp) were linked to a data table database through spatial joined oper-ation, in order to produce digital maps of the incidence rates.
Results
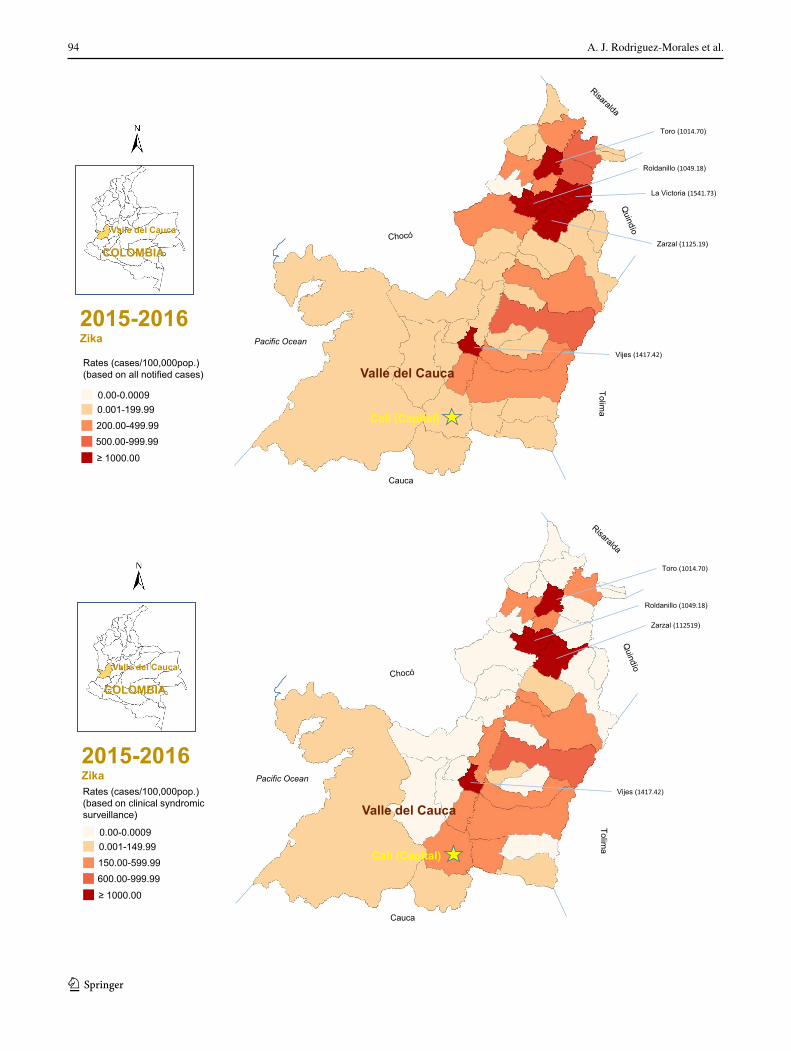
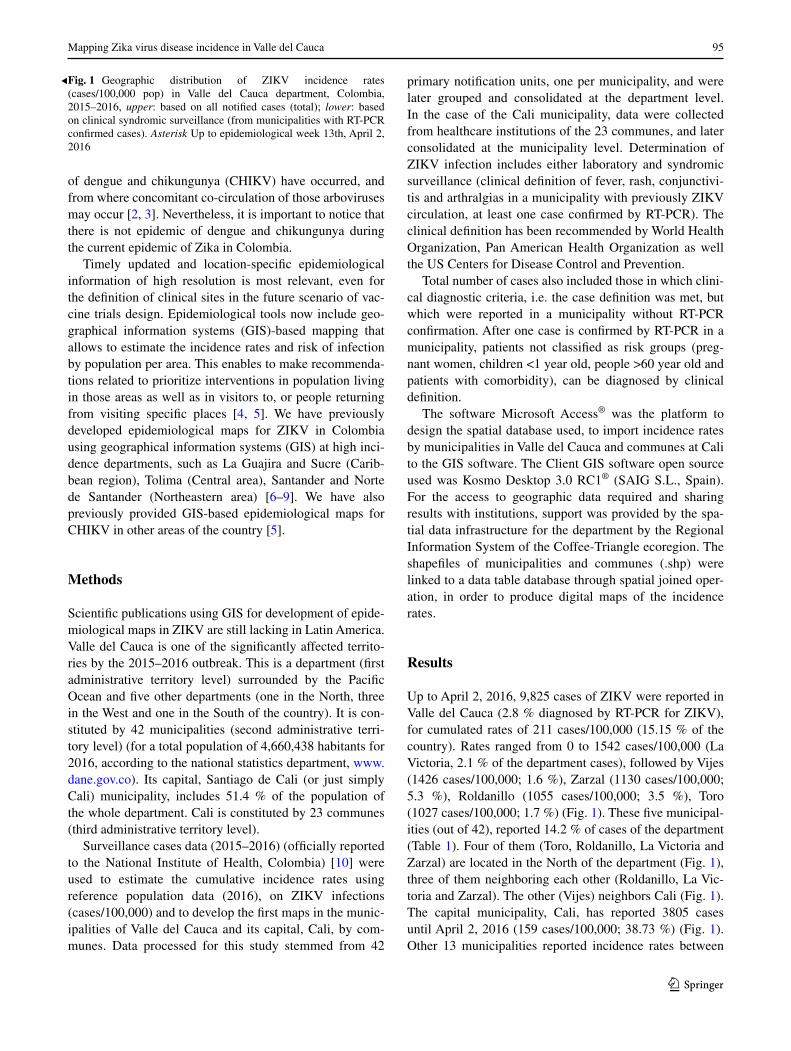
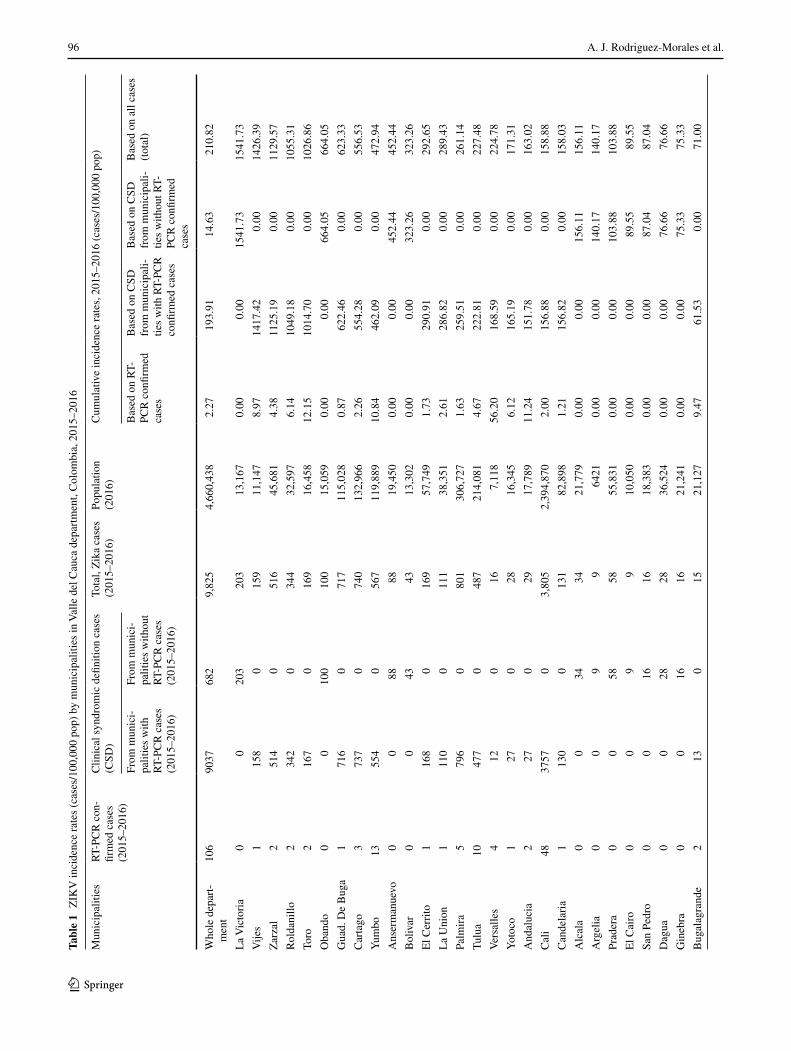
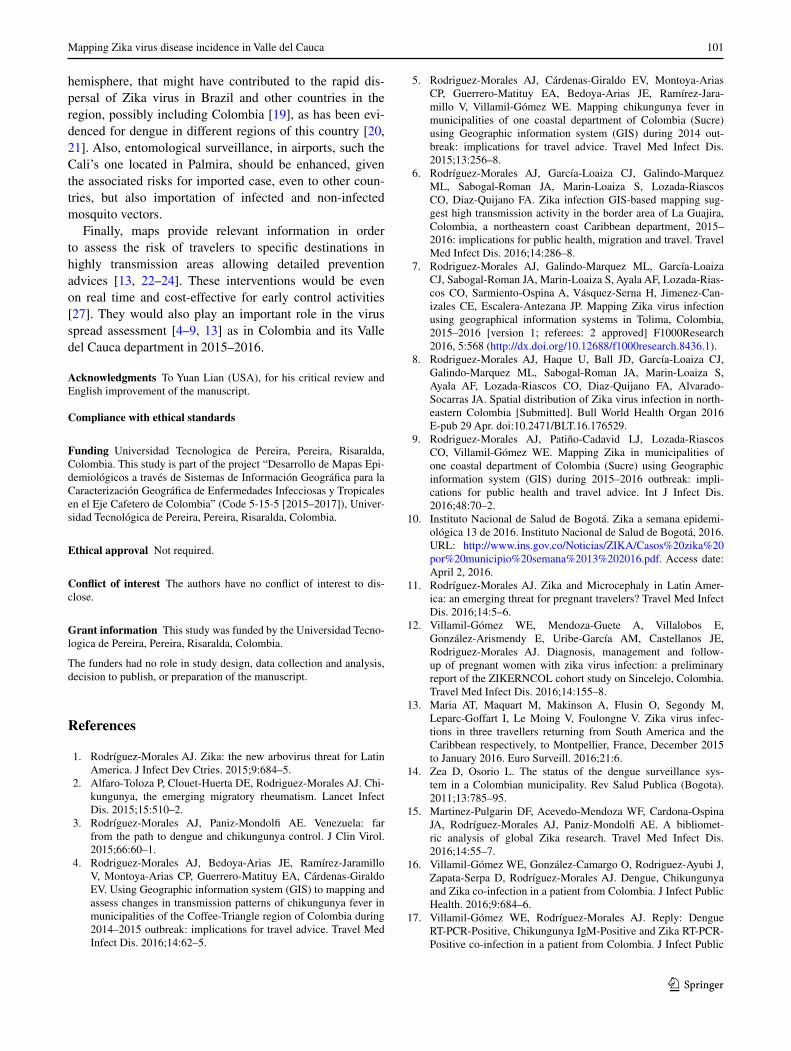
Up to April 2, 2016, 9,825 cases of ZIKV were reported in Valle del Cauca (2.8 % diagnosed by RT-PCR for ZIKV), for cumulated rates of 211 cases/100,000 (15.15 % of the country). Rates ranged from 0 to 1542 cases/100,000 (La Victoria, 2.1 % of the department cases), followed by Vijes (1426 cases/100,000; 1.6 %), Zarzal (1130 cases/100,000; 5.3 %), Roldanillo (1055 cases/100,000; 3.5 %), Toro (1027 cases/100,000; 1.7 %) (Fig. 1). These five municipal-ities (out of 42), reported 14.2 % of cases of the department (Table 1). Four of them (Toro, Roldanillo, La Victoria and Zarzal) are located in the North of the department (Fig. 1), three of them neighboring each other (Roldanillo, La Vic-toria and Zarzal). The other (Vijes) neighbors Cali (Fig. 1). The capital municipality, Cali, has reported 3805 cases until April 2, 2016 (159 cases/100,000; 38.73 %) (Fig. 1). Other 13 municipalities reported incidence rates between
Fig. 1 Geographic distribution of ZIKV incidence rates (cases/100,000 pop) in Valle del Cauca department, Colombia, 2015–2016, upper: based on all notified cases (total); lower: based on clinical syndromic surveillance (from municipalities with RT-PCR confirmed cases). Asterisk Up to epidemiological week 13th, April 2, 2016
◂
96 A. J. Rodriguez-Morales et al.
1 3
Tabl
e 1
ZIK
V in
cide
nce
rate
s (c
ases
/100
,000
pop
) by
mun
icip
aliti
es in
Val
le d
el C
auca
dep
artm
ent,
Col
ombi
a, 2
015–
2016
Mun
icip
aliti
esR
T-PC
R c
on-
firm
ed c
ases
(2
015–
2016
)
Clin
ical
syn
drom
ic d
efini
tion
case
s (C
SD)
Tota
l, Z
ika
case
s (2
015–
2016
)Po
pula
tion
(201
6)C
umul
ativ
e in
cide
nce
rate
s, 2
015–
2016
(ca
ses/
100,
000
pop)
From
mun
ici-
palit
ies
with
R
T-PC
R c
ases
(2
015–
2016
)
From
mun
ici-
palit
ies
with
out
RT-
PCR
cas
es
(201
5–20
16)
Bas
ed o
n R
T-PC
R c
onfir
med
ca
ses
Bas
ed o
n C
SD
from
mun
icip
ali-
ties
with
RT-
PCR
co
nfirm
ed c
ases
Bas
ed o
n C
SD
from
mun
icip
ali-
ties
with
out R
T-PC
R c
onfir
med
ca
ses
Bas
ed o
n al
l cas
es
(tot
al)
Who
le d
epar
t-m
ent
106
9037
682
9,82
54,
660,
438
2.27
193.
9114
.63
210.
82
La
Vic
tori
a0
020
320
313
,167
0.00
0.00
1541
.73
1541
.73
Vije
s1
158
015
911
,147
8.97
1417
.42
0.00
1426
.39
Zar
zal
251
40
516
45,6
814.
3811
25.1
90.
0011
29.5
7
Rol
dani
llo2
342
034
432
,597
6.14
1049
.18
0.00
1055
.31
Toro
216
70
169
16,4
5812
.15
1014
.70
0.00
1026
.86
Oba
ndo
00
100
100
15,0
590.
000.
0066
4.05
664.
05
Gua
d. D
e B
uga
171
60
717
115,
028
0.87
622.
460.
0062
3.33
Car
tago
373
70
740
132,
966
2.26
554.
280.
0055
6.53
Yum
bo13
554
056
711
9,88
910
.84
462.
090.
0047
2.94
Ans
erm
anue
vo0
088
8819
,450
0.00
0.00
452.
4445
2.44
Bol
ivar
00
4343
13,3
020.
000.
0032
3.26
323.
26
El C
erri
to1
168
016
957
,749
1.73
290.
910.
0029
2.65
La
Uni
on1
110
011
138
,351
2.61
286.
820.
0028
9.43
Palm
ira
579
60
801
306,
727
1.63
259.
510.
0026
1.14
Tul
ua10
477
048
721
4,08
14.
6722
2.81
0.00
227.
48
Ver
salle
s4
120
167,
118
56.2
016
8.59
0.00
224.
78
Yot
oco
127
028
16,3
456.
1216
5.19
0.00
171.
31
And
aluc
ia2
270
2917
,789
11.2
415
1.78
0.00
163.
02
Cal
i48
3757
03,
805
2,39
4,87
02.
0015
6.88
0.00
158.
88
Can
dela
ria
113
00
131
82,8
981.
2115
6.82
0.00
158.
03
Alc
ala
00
3434
21,7
790.
000.
0015
6.11
156.
11
Arg
elia
00
99
6421
0.00
0.00
140.
1714
0.17
Prad
era
00
5858
55,8
310.
000.
0010
3.88
103.
88
El C
airo
00
99
10,0
500.
000.
0089
.55
89.5
5
San
Pedr
o0
016
1618
,383
0.00
0.00
87.0
487
.04
Dag
ua0
028
2836
,524
0.00
0.00
76.6
676
.66
Gin
ebra
00
1616
21,2
410.
000.
0075
.33
75.3
3
Bug
alag
rand
e2
130
1521
,127
9.47
61.5
30.
0071
.00
97Mapping Zika virus disease incidence in Valle del Cauca
1 3
Up
to e
pide
mio
logi
cal w
eek
13th
, Apr
il 2,
201
6
Tabl
e 1
con
tinue
d
Mun
icip
aliti
esR
T-PC
R c
on-
firm
ed c
ases
(2
015–
2016
)
Clin
ical
syn
drom
ic d
efini
tion
case
s (C
SD)
Tota
l, Z
ika
case
s (2
015–
2016
)Po
pula
tion
(201
6)C
umul
ativ
e in
cide
nce
rate
s, 2
015–
2016
(ca
ses/
100,
000
pop)
From
mun
ici-
palit
ies
with
R
T-PC
R c
ases
(2
015–
2016
)
From
mun
ici-
palit
ies
with
out
RT-
PCR
cas
es
(201
5–20
16)
Bas
ed o
n R
T-PC
R c
onfir
med
ca
ses
Bas
ed o
n C
SD
from
mun
icip
ali-
ties
with
RT-
PCR
co
nfirm
ed c
ases
Bas
ed o
n C
SD
from
mun
icip
ali-
ties
with
out R
T-PC
R c
onfir
med
ca
ses
Bas
ed o
n al
l cas
es
(tot
al)
Rio
frio
00
1010
14,4
890.
000.
0069
.02
69.0
2
Res
trep
o0
011
1116
,272
0.00
0.00
67.6
067
.60
Tru
jillo
00
1212
18,0
410.
000.
0066
.52
66.5
2
Bue
nave
ntur
a2
262
026
440
7,53
90.
4964
.29
0.00
64.7
8
Cai
cedo
nia
00
1818
29,7
260.
000.
0060
.55
60.5
5
El A
guila
00
66
11,1
150.
000.
0053
.98
53.9
8
Gua
cari
116
017
34,7
962.
8745
.98
0.00
48.8
6
Ullo
a0
02
25,
421
0.00
0.00
36.8
936
.89
Flor
ida
119
020
58,3
421.
7132
.57
0.00
34.2
8
Jam
undi
235
037
122,
030
1.64
28.6
80.
0030
.32
La
Cum
bre
00
33
11,5
620.
000.
0025
.95
25.9
5
Cal
ima
00
44
15,7
940.
000.
0025
.33
25.3
3
Sevi
lla0
06
644
,876
0.00
0.00
13.3
713
.37
El D
ovio
00
00
8407
0.00
0.00
0.00
0.00
Unk
now
n1
06
7–
––
––
98 A. J. Rodriguez-Morales et al.
1 3
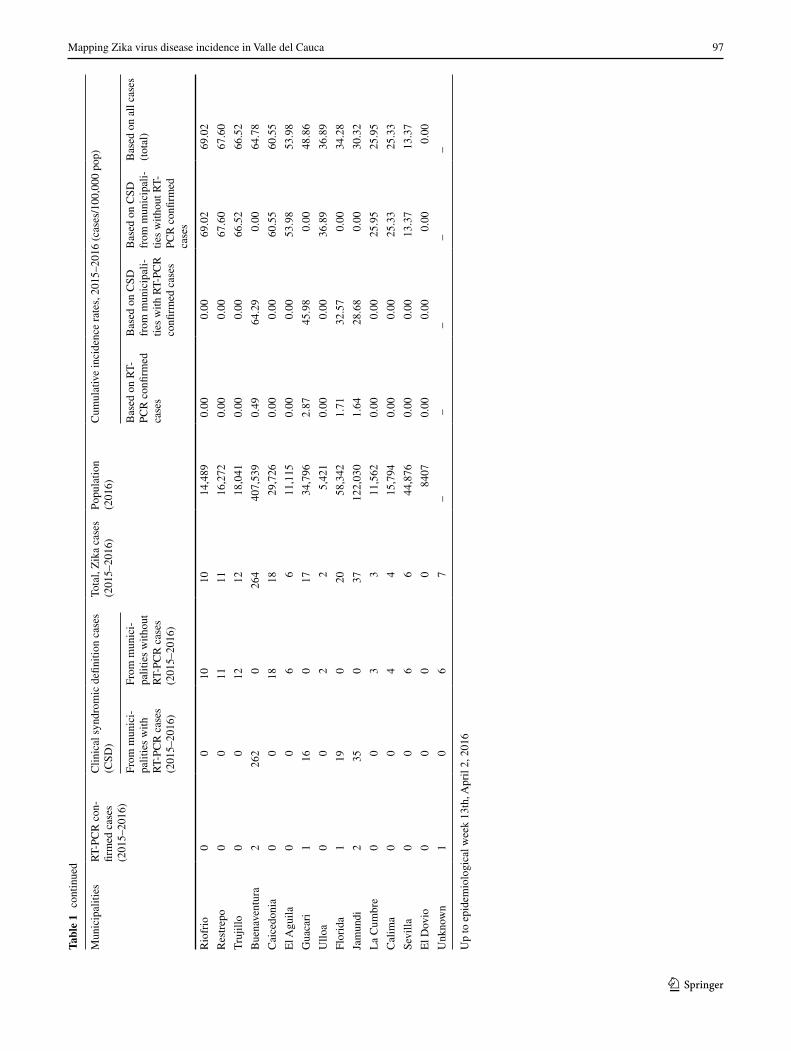
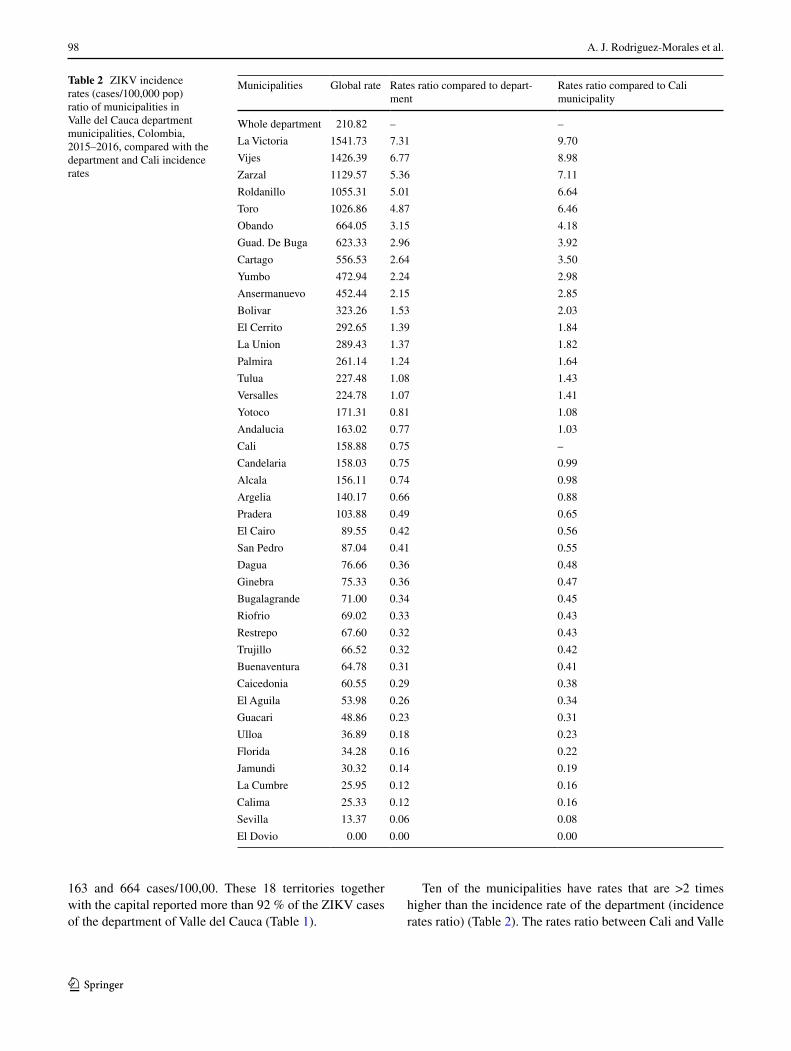
163 and 664 cases/100,00. These 18 territories together with the capital reported more than 92 % of the ZIKV cases of the department of Valle del Cauca (Table 1).
Ten of the municipalities have rates that are >2 times higher than the incidence rate of the department (incidence rates ratio) (Table 2). The rates ratio between Cali and Valle
Table 2 ZIKV incidence rates (cases/100,000 pop) ratio of municipalities in Valle del Cauca department municipalities, Colombia, 2015–2016, compared with the department and Cali incidence rates
Municipalities Global rate Rates ratio compared to depart-ment
Rates ratio compared to Cali municipality
Whole department 210.82 – –
La Victoria 1541.73 7.31 9.70
Vijes 1426.39 6.77 8.98
Zarzal 1129.57 5.36 7.11
Roldanillo 1055.31 5.01 6.64
Toro 1026.86 4.87 6.46
Obando 664.05 3.15 4.18
Guad. De Buga 623.33 2.96 3.92
Cartago 556.53 2.64 3.50
Yumbo 472.94 2.24 2.98
Ansermanuevo 452.44 2.15 2.85
Bolivar 323.26 1.53 2.03
El Cerrito 292.65 1.39 1.84
La Union 289.43 1.37 1.82
Palmira 261.14 1.24 1.64
Tulua 227.48 1.08 1.43
Versalles 224.78 1.07 1.41
Yotoco 171.31 0.81 1.08
Andalucia 163.02 0.77 1.03
Cali 158.88 0.75 –
Candelaria 158.03 0.75 0.99
Alcala 156.11 0.74 0.98
Argelia 140.17 0.66 0.88
Pradera 103.88 0.49 0.65
El Cairo 89.55 0.42 0.56
San Pedro 87.04 0.41 0.55
Dagua 76.66 0.36 0.48
Ginebra 75.33 0.36 0.47
Bugalagrande 71.00 0.34 0.45
Riofrio 69.02 0.33 0.43
Restrepo 67.60 0.32 0.43
Trujillo 66.52 0.32 0.42
Buenaventura 64.78 0.31 0.41
Caicedonia 60.55 0.29 0.38
El Aguila 53.98 0.26 0.34
Guacari 48.86 0.23 0.31
Ulloa 36.89 0.18 0.23
Florida 34.28 0.16 0.22
Jamundi 30.32 0.14 0.19
La Cumbre 25.95 0.12 0.16
Calima 25.33 0.12 0.16
Sevilla 13.37 0.06 0.08
El Dovio 0.00 0.00 0.00
99Mapping Zika virus disease incidence in Valle del Cauca
1 3
del Cauca is 0.75. Eleven of the municipalities have rates that are >2 times higher than the incidence rate of Cali (Table 2).
Colombia officially has reported a total of 64,839 cases (up to the 13th epidemiological week of 2016); more than 15 % from Valle del Cauca (9825). Burden of ZIKV infection has been concentrated in its Northern area, were municipalities have reported >1000 cases/100,000pop (1 %). One of them borders with the department of Quindío (173 cases), also they are close to Risaralda (687 cases), with much lower incidence of ZIKV infection (Fig. 1). Eleven municipalities ranged 250–499.99 cases/100,000, in the north and east of the department. Cali, the capital con-centrates more than a third of the reported cases of ZIKV in Valle del Cauca (38.7 %).
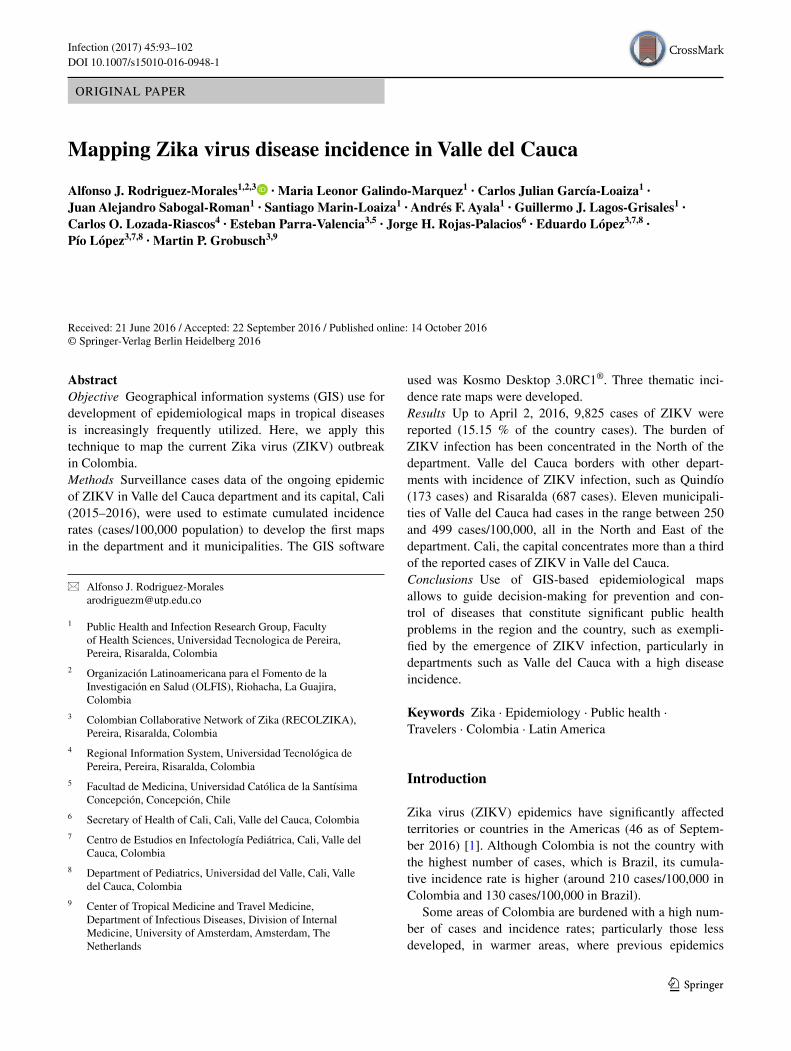
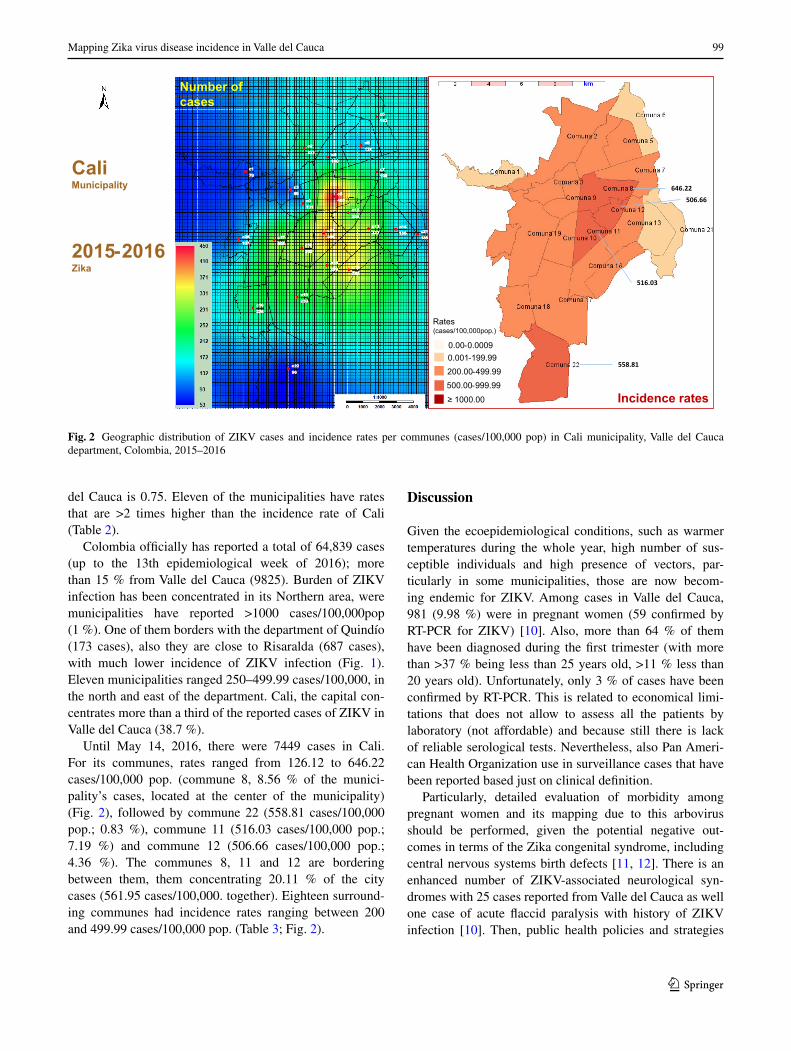
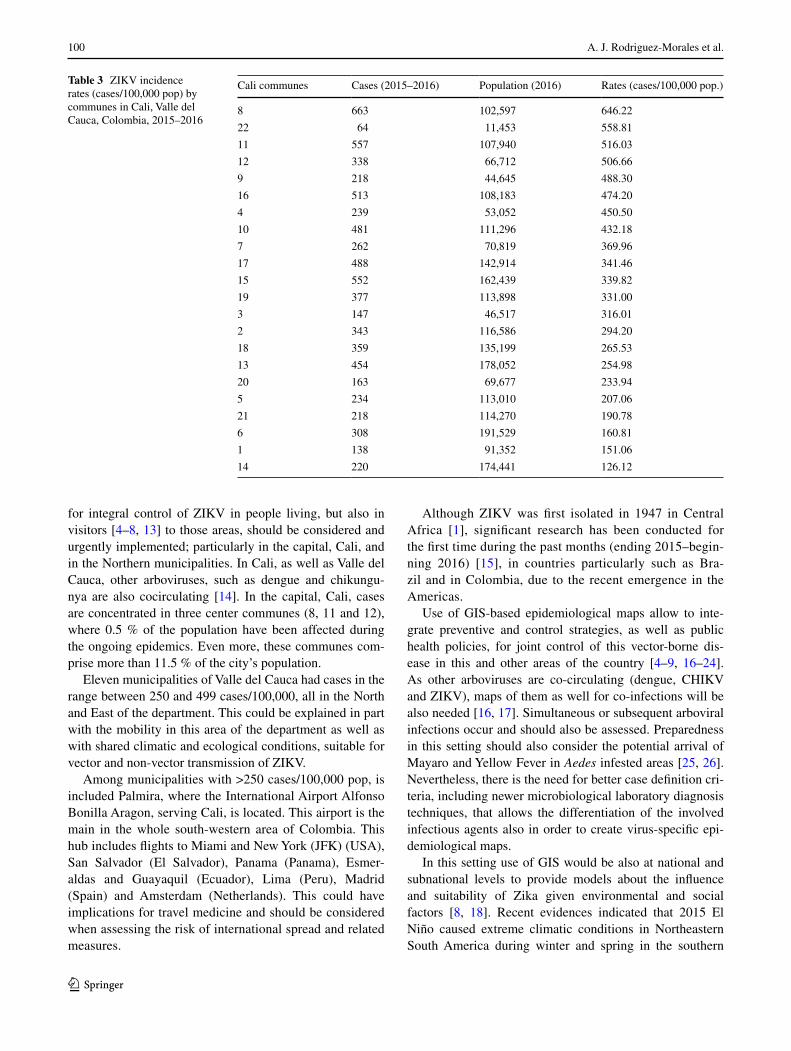
Until May 14, 2016, there were 7449 cases in Cali. For its communes, rates ranged from 126.12 to 646.22 cases/100,000 pop. (commune 8, 8.56 % of the munici-pality’s cases, located at the center of the municipality) (Fig. 2), followed by commune 22 (558.81 cases/100,000 pop.; 0.83 %), commune 11 (516.03 cases/100,000 pop.; 7.19 %) and commune 12 (506.66 cases/100,000 pop.; 4.36 %). The communes 8, 11 and 12 are bordering between them, them concentrating 20.11 % of the city cases (561.95 cases/100,000. together). Eighteen surround-ing communes had incidence rates ranging between 200 and 499.99 cases/100,000 pop. (Table 3; Fig. 2).
Discussion
Given the ecoepidemiological conditions, such as warmer temperatures during the whole year, high number of sus-ceptible individuals and high presence of vectors, par-ticularly in some municipalities, those are now becom-ing endemic for ZIKV. Among cases in Valle del Cauca, 981 (9.98 %) were in pregnant women (59 confirmed by RT-PCR for ZIKV) [10]. Also, more than 64 % of them have been diagnosed during the first trimester (with more than >37 % being less than 25 years old, >11 % less than 20 years old). Unfortunately, only 3 % of cases have been confirmed by RT-PCR. This is related to economical limi-tations that does not allow to assess all the patients by laboratory (not affordable) and because still there is lack of reliable serological tests. Nevertheless, also Pan Ameri-can Health Organization use in surveillance cases that have been reported based just on clinical definition.
Particularly, detailed evaluation of morbidity among pregnant women and its mapping due to this arbovirus should be performed, given the potential negative out-comes in terms of the Zika congenital syndrome, including central nervous systems birth defects [11, 12]. There is an enhanced number of ZIKV-associated neurological syn-dromes with 25 cases reported from Valle del Cauca as well one case of acute flaccid paralysis with history of ZIKV infection [10]. Then, public health policies and strategies
2015-2016Zika
CaliMunicipality
Number of cases
646.22
558.81
516.03
506.66
Incidence rates
200.00-499.99
≥ 1000.00
500.00-999.99
0.001-199.990.00-0.0009
Rates(cases/100,000pop.)
Fig. 2 Geographic distribution of ZIKV cases and incidence rates per communes (cases/100,000 pop) in Cali municipality, Valle del Cauca department, Colombia, 2015–2016
100 A. J. Rodriguez-Morales et al.
1 3
for integral control of ZIKV in people living, but also in visitors [4–8, 13] to those areas, should be considered and urgently implemented; particularly in the capital, Cali, and in the Northern municipalities. In Cali, as well as Valle del Cauca, other arboviruses, such as dengue and chikungu-nya are also cocirculating [14]. In the capital, Cali, cases are concentrated in three center communes (8, 11 and 12), where 0.5 % of the population have been affected during the ongoing epidemics. Even more, these communes com-prise more than 11.5 % of the city’s population.
Eleven municipalities of Valle del Cauca had cases in the range between 250 and 499 cases/100,000, all in the North and East of the department. This could be explained in part with the mobility in this area of the department as well as with shared climatic and ecological conditions, suitable for vector and non-vector transmission of ZIKV.
Among municipalities with >250 cases/100,000 pop, is included Palmira, where the International Airport Alfonso Bonilla Aragon, serving Cali, is located. This airport is the main in the whole south-western area of Colombia. This hub includes flights to Miami and New York (JFK) (USA), San Salvador (El Salvador), Panama (Panama), Esmer-aldas and Guayaquil (Ecuador), Lima (Peru), Madrid (Spain) and Amsterdam (Netherlands). This could have implications for travel medicine and should be considered when assessing the risk of international spread and related measures.
Although ZIKV was first isolated in 1947 in Central Africa [1], significant research has been conducted for the first time during the past months (ending 2015–begin-ning 2016) [15], in countries particularly such as Bra-zil and in Colombia, due to the recent emergence in the Americas.
Use of GIS-based epidemiological maps allow to inte-grate preventive and control strategies, as well as public health policies, for joint control of this vector-borne dis-ease in this and other areas of the country [4–9, 16–24]. As other arboviruses are co-circulating (dengue, CHIKV and ZIKV), maps of them as well for co-infections will be also needed [16, 17]. Simultaneous or subsequent arboviral infections occur and should also be assessed. Preparedness in this setting should also consider the potential arrival of Mayaro and Yellow Fever in Aedes infested areas [25, 26]. Nevertheless, there is the need for better case definition cri-teria, including newer microbiological laboratory diagnosis techniques, that allows the differentiation of the involved infectious agents also in order to create virus-specific epi-demiological maps.
In this setting use of GIS would be also at national and subnational levels to provide models about the influence and suitability of Zika given environmental and social factors [8, 18]. Recent evidences indicated that 2015 El Niño caused extreme climatic conditions in Northeastern South America during winter and spring in the southern
Table 3 ZIKV incidence rates (cases/100,000 pop) by communes in Cali, Valle del Cauca, Colombia, 2015–2016
Cali communes Cases (2015–2016) Population (2016) Rates (cases/100,000 pop.)
8 663 102,597 646.22
22 64 11,453 558.81
11 557 107,940 516.03
12 338 66,712 506.66
9 218 44,645 488.30
16 513 108,183 474.20
4 239 53,052 450.50
10 481 111,296 432.18
7 262 70,819 369.96
17 488 142,914 341.46
15 552 162,439 339.82
19 377 113,898 331.00
3 147 46,517 316.01
2 343 116,586 294.20
18 359 135,199 265.53
13 454 178,052 254.98
20 163 69,677 233.94
5 234 113,010 207.06
21 218 114,270 190.78
6 308 191,529 160.81
1 138 91,352 151.06
14 220 174,441 126.12
101Mapping Zika virus disease incidence in Valle del Cauca
1 3
hemisphere, that might have contributed to the rapid dis-persal of Zika virus in Brazil and other countries in the region, possibly including Colombia [19], as has been evi-denced for dengue in different regions of this country [20, 21]. Also, entomological surveillance, in airports, such the Cali’s one located in Palmira, should be enhanced, given the associated risks for imported case, even to other coun-tries, but also importation of infected and non-infected mosquito vectors.
Finally, maps provide relevant information in order to assess the risk of travelers to specific destinations in highly transmission areas allowing detailed prevention advices [13, 22–24]. These interventions would be even on real time and cost-effective for early control activities [27]. They would also play an important role in the virus spread assessment [4–9, 13] as in Colombia and its Valle del Cauca department in 2015–2016.
Acknowledgments To Yuan Lian (USA), for his critical review and English improvement of the manuscript.
Compliance with ethical standards
Funding Universidad Tecnologica de Pereira, Pereira, Risaralda, Colombia. This study is part of the project “Desarrollo de Mapas Epi-demiológicos a través de Sistemas de Información Geográfica para la Caracterización Geográfica de Enfermedades Infecciosas y Tropicales en el Eje Cafetero de Colombia” (Code 5-15-5 [2015–2017]), Univer-sidad Tecnológica de Pereira, Pereira, Risaralda, Colombia.
Ethical approval Not required.
Conflict of interest The authors have no conflict of interest to dis-close.
Grant information This study was funded by the Universidad Tecno-logica de Pereira, Pereira, Risaralda, Colombia.
The funders had no role in study design, data collection and analysis, decision to publish, or preparation of the manuscript.
References
1. Rodríguez-Morales AJ. Zika: the new arbovirus threat for Latin America. J Infect Dev Ctries. 2015;9:684–5.
2. Alfaro-Toloza P, Clouet-Huerta DE, Rodriguez-Morales AJ. Chi-kungunya, the emerging migratory rheumatism. Lancet Infect Dis. 2015;15:510–2.
3. Rodríguez-Morales AJ, Paniz-Mondolfi AE. Venezuela: far from the path to dengue and chikungunya control. J Clin Virol. 2015;66:60–1.
4. Rodriguez-Morales AJ, Bedoya-Arias JE, Ramírez-Jaramillo V, Montoya-Arias CP, Guerrero-Matituy EA, Cárdenas-Giraldo EV. Using Geographic information system (GIS) to mapping and assess changes in transmission patterns of chikungunya fever in municipalities of the Coffee-Triangle region of Colombia during 2014–2015 outbreak: implications for travel advice. Travel Med Infect Dis. 2016;14:62–5.
5. Rodriguez-Morales AJ, Cárdenas-Giraldo EV, Montoya-Arias CP, Guerrero-Matituy EA, Bedoya-Arias JE, Ramírez-Jara-millo V, Villamil-Gómez WE. Mapping chikungunya fever in municipalities of one coastal department of Colombia (Sucre) using Geographic information system (GIS) during 2014 out-break: implications for travel advice. Travel Med Infect Dis. 2015;13:256–8.
6. Rodríguez-Morales AJ, García-Loaiza CJ, Galindo-Marquez ML, Sabogal-Roman JA, Marin-Loaiza S, Lozada-Riascos CO, Diaz-Quijano FA. Zika infection GIS-based mapping sug-gest high transmission activity in the border area of La Guajira, Colombia, a northeastern coast Caribbean department, 2015–2016: implications for public health, migration and travel. Travel Med Infect Dis. 2016;14:286–8.
7. Rodriguez-Morales AJ, Galindo-Marquez ML, García-Loaiza CJ, Sabogal-Roman JA, Marin-Loaiza S, Ayala AF, Lozada-Rias-cos CO, Sarmiento-Ospina A, Vásquez-Serna H, Jimenez-Can-izales CE, Escalera-Antezana JP. Mapping Zika virus infection using geographical information systems in Tolima, Colombia, 2015–2016 [version 1; referees: 2 approved] F1000Research 2016, 5:568 (http://dx.doi.org/10.12688/f1000research.8436.1).
8. Rodriguez-Morales AJ, Haque U, Ball JD, García-Loaiza CJ, Galindo-Marquez ML, Sabogal-Roman JA, Marin-Loaiza S, Ayala AF, Lozada-Riascos CO, Diaz-Quijano FA, Alvarado-Socarras JA. Spatial distribution of Zika virus infection in north-eastern Colombia [Submitted]. Bull World Health Organ 2016 E-pub 29 Apr. doi:10.2471/BLT.16.176529.
9. Rodriguez-Morales AJ, Patiño-Cadavid LJ, Lozada-Riascos CO, Villamil-Gómez WE. Mapping Zika in municipalities of one coastal department of Colombia (Sucre) using Geographic information system (GIS) during 2015–2016 outbreak: impli-cations for public health and travel advice. Int J Infect Dis. 2016;48:70–2.
10. Instituto Nacional de Salud de Bogotá. Zika a semana epidemi-ológica 13 de 2016. Instituto Nacional de Salud de Bogotá, 2016. URL: http://www.ins.gov.co/Noticias/ZIKA/Casos%20zika%20por%20municipio%20semana%2013%202016.pdf. Access date: April 2, 2016.
11. Rodríguez-Morales AJ. Zika and Microcephaly in Latin Amer-ica: an emerging threat for pregnant travelers? Travel Med Infect Dis. 2016;14:5–6.
12. Villamil-Gómez WE, Mendoza-Guete A, Villalobos E, González-Arismendy E, Uribe-García AM, Castellanos JE, Rodriguez-Morales AJ. Diagnosis, management and follow-up of pregnant women with zika virus infection: a preliminary report of the ZIKERNCOL cohort study on Sincelejo, Colombia. Travel Med Infect Dis. 2016;14:155–8.
13. Maria AT, Maquart M, Makinson A, Flusin O, Segondy M, Leparc-Goffart I, Le Moing V, Foulongne V. Zika virus infec-tions in three travellers returning from South America and the Caribbean respectively, to Montpellier, France, December 2015 to January 2016. Euro Surveill. 2016;21:6.
14. Zea D, Osorio L. The status of the dengue surveillance sys-tem in a Colombian municipality. Rev Salud Publica (Bogota). 2011;13:785–95.
15. Martinez-Pulgarin DF, Acevedo-Mendoza WF, Cardona-Ospina JA, Rodríguez-Morales AJ, Paniz-Mondolfi AE. A bibliomet-ric analysis of global Zika research. Travel Med Infect Dis. 2016;14:55–7.
16. Villamil-Gómez WE, González-Camargo O, Rodriguez-Ayubi J, Zapata-Serpa D, Rodríguez-Morales AJ. Dengue, Chikungunya and Zika co-infection in a patient from Colombia. J Infect Public Health. 2016;9:684–6.
17. Villamil-Gómez WE, Rodríguez-Morales AJ. Reply: Dengue RT-PCR-Positive, Chikungunya IgM-Positive and Zika RT-PCR-Positive co-infection in a patient from Colombia. J Infect Public
102 A. J. Rodriguez-Morales et al.
1 3
Health 2016 Epub Ahead Mar 10; available online: http://www.sciencedirect.com/science/article/pii/S1876034116000393.
18. Messina JP, Kraemer MU, Brady OJ, Pigott DM, Shearer FM, Weiss DJ, Golding N, Ruktanonchai CW, Gething PW, Cohn E, Brownstein JS, Khan K, Tatem AJ, Jaenisch T, Mur-ray CJ, Marinho F, Scott TW, Hay SI. Mapping global envi-ronmental suitability for Zika virus. Elife. 2016;. doi:10.7554/eLife.15272.
19. Paz S, Semenza JC. El Niño and climate change—contributing factors in the dispersal of Zika virus in the Americas? Lancet. 2016;387:745. doi:10.1016/S0140-6736(16)00256-7.
20. Mattar S, Morales V, Cassab A, Rodríguez-Morales AJ. Effect of climate variables on dengue incidence in a tropical Caribbean municipality of Colombia, Cerete, 2003–2008. Int J Infect Dis. 2013;17:e358–9.
21. Quintero-Herrera LL, Ramírez-Jaramillo V, Bernal-Gutiérrez S, Cárdenas-Giraldo EV, Guerrero-Matituy EA, Molina-Delgado AH, Montoya-Arias CP, Rico-Gallego JA, Herrera-Giraldo AC, Botero-Franco S, Rodríguez-Morales AJ. Potential impact of climatic variability on the epidemiology of dengue in Risaralda, Colombia, 2010–2011. J Infect Public Health. 2015;8:291–7.
22. Tami A, Grillet ME, Grobusch MP. Applying geographical infor-mation systems (GIS) to arboviral disease surveillance and con-trol: a powerful tool. Travel Med Infect Dis. 2016;14:9–10.
23. von Eije KJ, Schinkel J, van den Kerkhof JH, Schreuder I, de Jong MD, Grobusch MP, Goorhuis A. Imported Zika virus infec-tion in the Netherlands. Ned Tijdschr Geneeskd. 2015;160:D153.
24. Goorhuis A, von Eije KJ, Douma RA, Rijnberg N, van Vugt M, Stijnis C, Grobusch MP. Zika virus and the risk of imported infection in returned travelers: implications for clinical care. Travel Med Infect Dis. 2016;14:13–5.
25. Serra OP, Cardoso BF, Ribeiro AL, Santos FA, Slhessarenko RD. Mayaro virus and dengue virus 1 and 4 natural infection in culicids from Cuiabá, state of Mato Grosso, Brazil. Mem Inst Oswaldo Cruz. 2016;111:20–9.
26. Woodall JP, Yuill TM. Why is the yellow fever outbreak in Angola a ‘threat to the entire world’? Int J Infect Dis. 2016;48:96–7. doi:10.1016/j.ijid.2016.05.001.
27. Shih YC, Pan IW, Tsai YW. Information technology facilitates cost-effectiveness analysis in developing countries: an observa-tional study of breast cancer chemotherapy in Taiwan. Pharma-coeconomics. 2009;27:947–61.