Embed Size (px)
Citation preview
Sustainable Water Improves Tomorrow’s Cities’ Health SWITCH Project
Urban Water Management for the City of Cali Diagnosis report
Study Case: Cali, Colombia
3. Water Resources
Cali, January, 2008
Chapter 3 Water Resources SWITCH Project
Urban Water Management for the City of Cali - Diagnosis Report ii
TABLE OF CONTENT 3 WATER RESOURCES ............................................................................................................ 3-1 3.1 GENERAL OVERVIEW.......................................................................................................... 3-1 3.2 GEOGRAPHICAL VALLEY OF THE CAUCA RIVER........................................................ 3-2
3.2.1 Land uses .............................................................................................................................3-7 3.2.2 Water uses............................................................................................................................3-8 3.2.3 Cauca river water quantity .................................................................................................3-10 3.2.4 Water quality......................................................................................................................3-10
3.3 RIVERS OF THE CITY OF CALI......................................................................................... 3-17 3.3.1 Cauca River........................................................................................................................3-17 3.3.2 Cañaveralejo River ............................................................................................................3-20 3.3.3 Meléndez River..................................................................................................................3-23 3.3.4 Líli River............................................................................................................................3-26 3.3.5 Cali River...........................................................................................................................3-27 3.3.6 Aguacatal River .................................................................................................................3-28 3.3.7 Pance River ........................................................................................................................3-30
3.4 GROUND WATER IN THE CITY OF CALI........................................................................ 3-31 3.5 BIBLIOGRAPHY................................................................................................................... 3-33 ANNEXES ANNEXES LIST
ANNEX 3.1 CAUCA RIVER: WATER QUALITY MONITORINGS
ANNEX 3.2 WATER QUALITY INDEXES
Chapter 3 Water Resources SWITCH Project
Urban Water Management for the City of Cali - Diagnosis Report iii
INDEX OF FIGURES Figure 3.1. Urban area of the municipality of Cali and its seven rivers........................................... 3-1 Figure 3.2 Cauca River general location, including its total river basin, geographical drainage
valley with its monitoring stations. ..................................................................................... 3-2 Figure 3.3 Cauca river basin general classification.......................................................................... 3-3 Figure 3.4 Main tributaries, industrial discharges and municipalities along Cauca’s river
geographic Valley. Section: Salvajina– Hormiguero .......................................................... 3-4 Figure 3.5 Main tributaries, industrial discharges and municipalities along Cauca’s river
geographic Valley. Section: Hormiguero – Mediacanoa..................................................... 3-5 Figure 3.6 Main tributaries, industrial discharges and municipalities along Cauca’s river
geographic Valley. Section: Mediacanoa – La Virginia...................................................... 3-6 Figure 3.7 Water use of the Cauca river basin in the Valle del Cauca department .......................... 3-8 Figure 3.8 Historic Flow profile in Cauca River. Periods 1993 – 1997, 1998 – 2002 and
2003 Section: Salvajina – La Virginia. Conditions: Winter – Transition – Summer ........ 3-9 Figure 3.9 Historic DO profile in Cauca River. . Periods 1993 – 1997, 1998 – 2002 and 2003
Section: Salvajina – La Virginia. Conditions: Winter – Transition – Summer ................ 3-11 Figure 3.10 Water quality in Cauca River according to ICAUCA index. Period 1993 – 1997
and 1998 – 2002. Winter, transition and summer season. ............................................ 3-12 Figure 3.11 Salvajina dam.............................................................................................................. 3-13 Figure 3.12 BOD load discharged to Cauca river. Section: Salvajina – La Virginia. .................... 3-15 Figure 3.13 BOD load discharges in the Cauca river basin by the different commercial,
industrial and domestic sectors in the Cauca department.................................................. 3-16 Figure 3.14 BOD load discharges to Cauca river basin in the Valle del Cauca department in
year 2006 ........................................................................................................................... 3-17 Figure 3.15 Boxes diagram presenting concentration of hazardous substance in the Cauca
river: lead and Mercury in the period July 11-15, 2006 .................................................... 3-19 Figure 3.16 BOD load discharges along Cañaveralejo river........................................................ 3-21 Figure 3.17 TSS load discharges along Cañaveralejo river. ......................................................... 3-21 Figure 3.18 Dissolved oxygen in the Cañaveralejo river as result of polluting BOD and TSS
discharges. ......................................................................................................................... 3-22 Figure 3.19 Map of the quality of water of the Cañaveralejo river based on ICA-NSF index. ..... 3-22 Figure 3.20 Dissolved oxygen along Meléndez river.................................................................... 3-24 Figure 3.21 BOD load discharges along Meléndez river. ............................................................. 3-24 Figure 3.22 TSS load discharges along Meléndez river................................................................. 3-25 Figure 3.23 Map showing the quality of water of the Meléndez river based on ICA-NSF
index. ................................................................................................................................. 3-25 Figure 3.24 Map showing the quality of water of the Cali river based on ICA-NSF index........... 3-29 Figure 3.25 Map showing the quality of water of Aguacatal river based on ICA-NSF index. ..... 3-30
Chapter 3 Water Resources SWITCH Project
Urban Water Management for the City of Cali - Diagnosis Report iv
INDEX OF TABLES Table 3.1 Land uses in the geographical river basin in the Valle del Cauca department................. 3-7 Table 3.2 Soil erosion levels in the Cauca river basin ..................................................................... 3-8 Table 3.3 Flow ranges measured in the Cauca river. Periods 1993-2003 ...................................... 3-10 Table 3.4 General characteristics of the dam ................................................................................. 3-13 Table 3.5 Minimum, maximum and average phenols concentration in three stations of Cauca
river and the tributaries before intake Pto. Mallarino........................................................ 3-19 Table 3.6 Land uses in Meléndez river basin, year 2000 .............................................................. 3-23 Table 3.7 Land uses in Líli river basin, year 2000 ......................................................................... 3-26 Table 3.8 Land uses in Cali river basin, year 2000 ........................................................................ 3-27 Table 3.9 Characteristics of the groundwater in the eight sub-river basins in the urban area of
Cali. ................................................................................................................................... 3-31
Chapter 3 Water Resources SWITCH Project
Urban Water Management for the City of Cali - Diagnosis Report 3-1
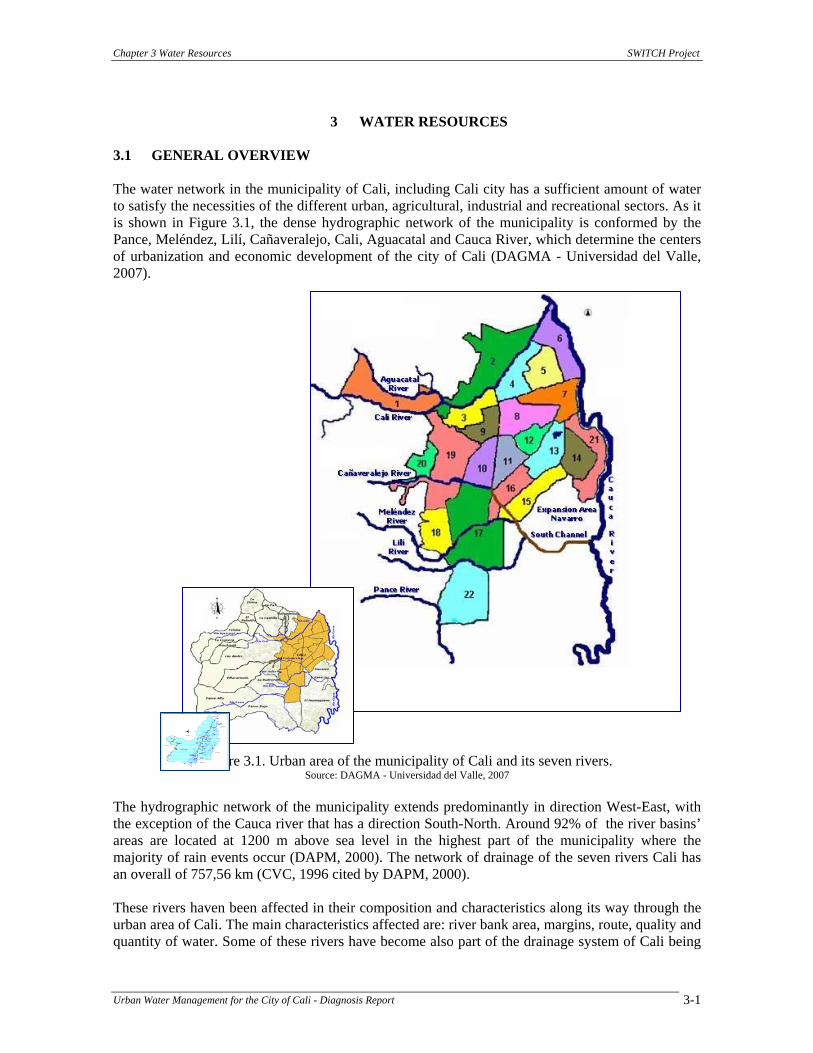
3 WATER RESOURCES 3.1 GENERAL OVERVIEW The water network in the municipality of Cali, including Cali city has a sufficient amount of water to satisfy the necessities of the different urban, agricultural, industrial and recreational sectors. As it is shown in Figure 3.1, the dense hydrographic network of the municipality is conformed by the Pance, Meléndez, Lilí, Cañaveralejo, Cali, Aguacatal and Cauca River, which determine the centers of urbanization and economic development of the city of Cali (DAGMA - Universidad del Valle, 2007).
Figure 3.1. Urban area of the municipality of Cali and its seven rivers. Source: DAGMA - Universidad del Valle, 2007
The hydrographic network of the municipality extends predominantly in direction West-East, with the exception of the Cauca river that has a direction South-North. Around 92% of the river basins’ areas are located at 1200 m above sea level in the highest part of the municipality where the majority of rain events occur (DAPM, 2000). The network of drainage of the seven rivers Cali has an overall of 757,56 km (CVC, 1996 cited by DAPM, 2000). These rivers haven been affected in their composition and characteristics along its way through the urban area of Cali. The main characteristics affected are: river bank area, margins, route, quality and quantity of water. Some of these rivers have become also part of the drainage system of Cali being
Chapter 3 Water Resources SWITCH Project
Urban Water Management for the City of Cali - Diagnosis Report 3-2
receptors of the domestic and industrial wastewater produced in the city: 1) Cañaveralejo, Meléndez and Líli rivers discharge to the South Channel in the south drainage area of Cali; 2) Aguacatal river meets Cali river, which finally discharges to Cauca river after collecting wastewater discharges from the Collector Margen izquierdo in the North-west drainage area
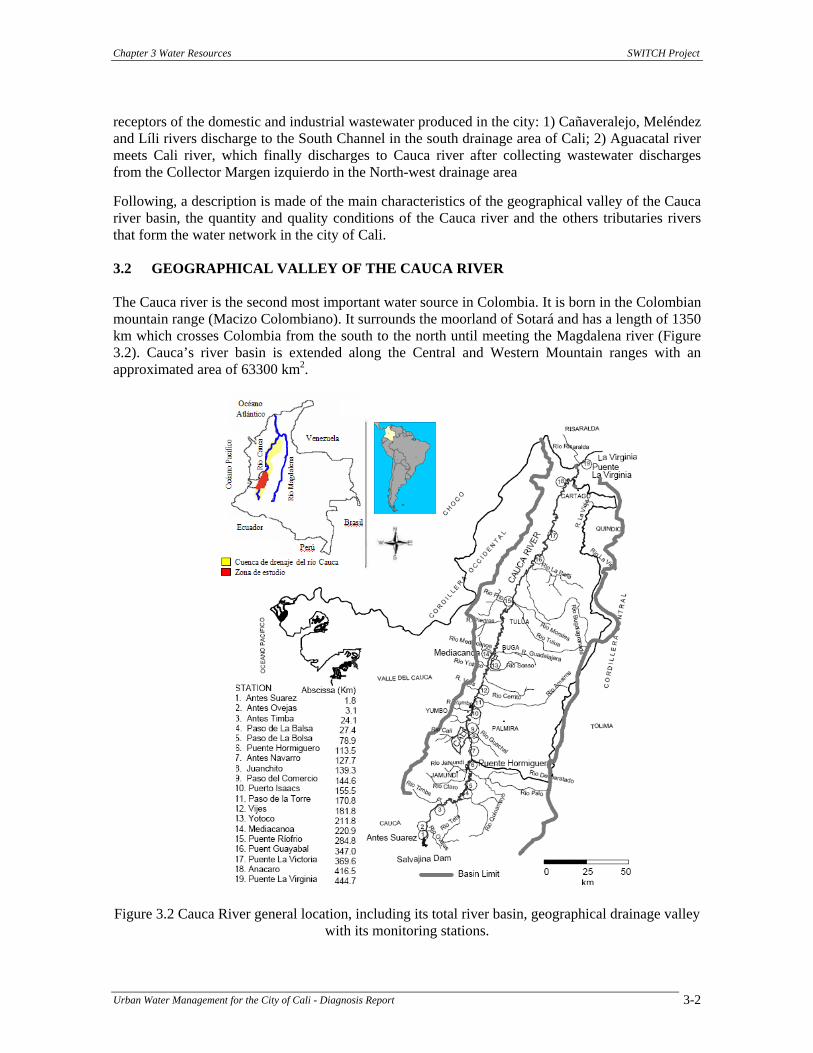
Following, a description is made of the main characteristics of the geographical valley of the Cauca river basin, the quantity and quality conditions of the Cauca river and the others tributaries rivers that form the water network in the city of Cali. 3.2 GEOGRAPHICAL VALLEY OF THE CAUCA RIVER The Cauca river is the second most important water source in Colombia. It is born in the Colombian mountain range (Macizo Colombiano). It surrounds the moorland of Sotará and has a length of 1350 km which crosses Colombia from the south to the north until meeting the Magdalena river (Figure 3.2). Cauca’s river basin is extended along the Central and Western Mountain ranges with an approximated area of 63300 km2.
Figure 3.2 Cauca River general location, including its total river basin, geographical drainage valley with its monitoring stations.
Chapter 3 Water Resources SWITCH Project
Urban Water Management for the City of Cali - Diagnosis Report 3-3
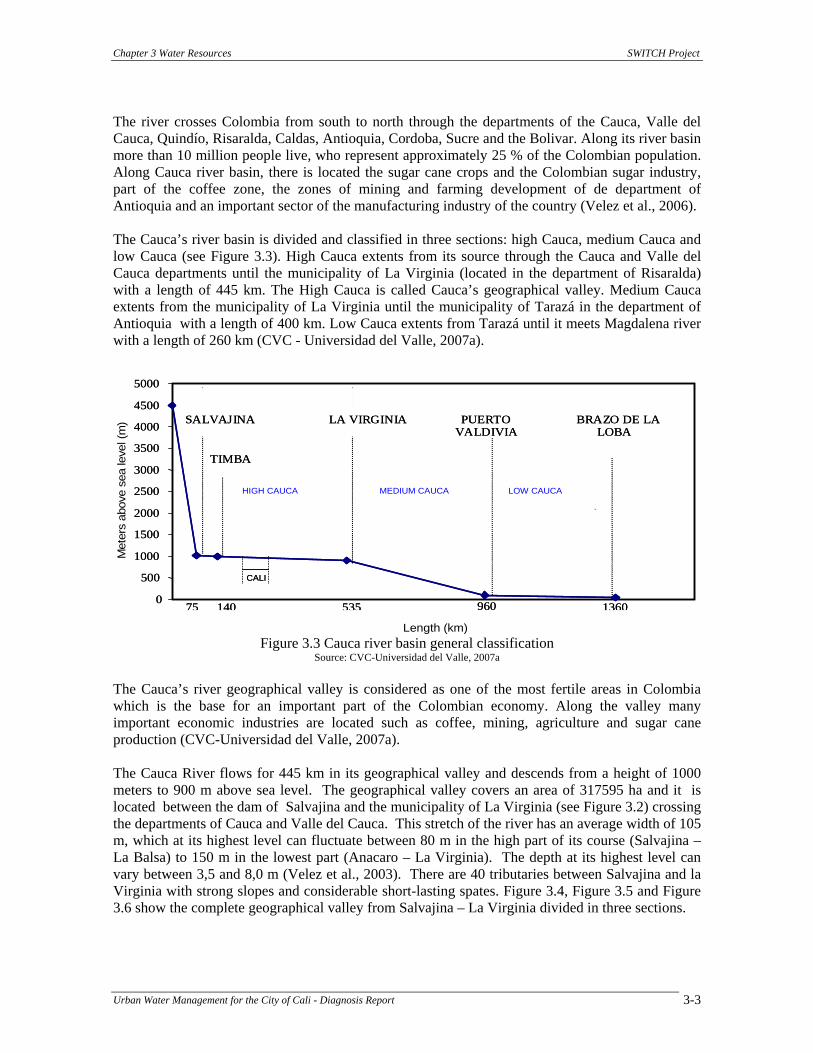
The river crosses Colombia from south to north through the departments of the Cauca, Valle del Cauca, Quindío, Risaralda, Caldas, Antioquia, Cordoba, Sucre and the Bolivar. Along its river basin more than 10 million people live, who represent approximately 25 % of the Colombian population. Along Cauca river basin, there is located the sugar cane crops and the Colombian sugar industry, part of the coffee zone, the zones of mining and farming development of de department of Antioquia and an important sector of the manufacturing industry of the country (Velez et al., 2006). The Cauca’s river basin is divided and classified in three sections: high Cauca, medium Cauca and low Cauca (see Figure 3.3). High Cauca extents from its source through the Cauca and Valle del Cauca departments until the municipality of La Virginia (located in the department of Risaralda) with a length of 445 km. The High Cauca is called Cauca’s geographical valley. Medium Cauca extents from the municipality of La Virginia until the municipality of Tarazá in the department of Antioquia with a length of 400 km. Low Cauca extents from Tarazá until it meets Magdalena river with a length of 260 km (CVC - Universidad del Valle, 2007a).
Figure 3.3 Cauca river basin general classification Source: CVC-Universidad del Valle, 2007a
The Cauca’s river geographical valley is considered as one of the most fertile areas in Colombia which is the base for an important part of the Colombian economy. Along the valley many important economic industries are located such as coffee, mining, agriculture and sugar cane production (CVC-Universidad del Valle, 2007a). The Cauca River flows for 445 km in its geographical valley and descends from a height of 1000 meters to 900 m above sea level. The geographical valley covers an area of 317595 ha and it is located between the dam of Salvajina and the municipality of La Virginia (see Figure 3.2) crossing the departments of Cauca and Valle del Cauca. This stretch of the river has an average width of 105 m, which at its highest level can fluctuate between 80 m in the high part of its course (Salvajina – La Balsa) to 150 m in the lowest part (Anacaro – La Virginia). The depth at its highest level can vary between 3,5 and 8,0 m (Velez et al., 2003). There are 40 tributaries between Salvajina and la Virginia with strong slopes and considerable short-lasting spates. Figure 3.4, Figure 3.5 and Figure 3.6 show the complete geographical valley from Salvajina – La Virginia divided in three sections.
0 500
1000 1500 2000 2500 3000 3500
4500 5000
140
SALVAJINA
75 535 960 1360
TIMBA
LA VIRGINIA PUERTO BRAZO DE LA
ALTO CAUCA
Longitud (Km)
ZONA DE ESTUDIO
CAUCA MEDIO BAJO CAUCA
Altu
ra so
bre
el n
ivel
del
mar
(m)
4000 VALDIVIA LOBA
CALI
Met
ers
abov
e se
a le
vel (
m)
HIGH CAUCA MEDIUM CAUCA LOW CAUCA
Length (km)
Chapter 3 Water Resources SWITCH Project
Urban Water Management for the City of Cali - Diagnosis Report 3-4
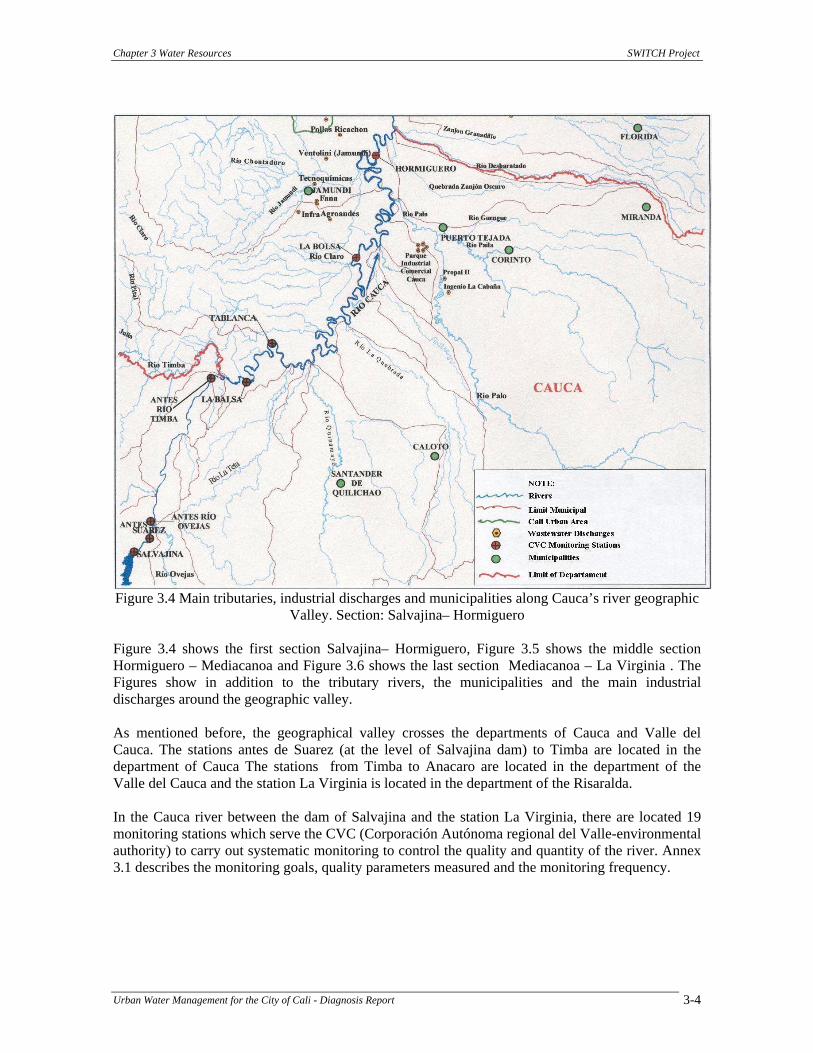
Figure 3.4 Main tributaries, industrial discharges and municipalities along Cauca’s river geographic
Valley. Section: Salvajina– Hormiguero Figure 3.4 shows the first section Salvajina– Hormiguero, Figure 3.5 shows the middle section Hormiguero – Mediacanoa and Figure 3.6 shows the last section Mediacanoa – La Virginia . The Figures show in addition to the tributary rivers, the municipalities and the main industrial discharges around the geographic valley. As mentioned before, the geographical valley crosses the departments of Cauca and Valle del Cauca. The stations antes de Suarez (at the level of Salvajina dam) to Timba are located in the department of Cauca The stations from Timba to Anacaro are located in the department of the Valle del Cauca and the station La Virginia is located in the department of the Risaralda. In the Cauca river between the dam of Salvajina and the station La Virginia, there are located 19 monitoring stations which serve the CVC (Corporación Autónoma regional del Valle-environmental authority) to carry out systematic monitoring to control the quality and quantity of the river. Annex 3.1 describes the monitoring goals, quality parameters measured and the monitoring frequency.
Chapter 3 Water Resources SWITCH Project
Urban Water Management for the City of Cali - Diagnosis Report 3-5
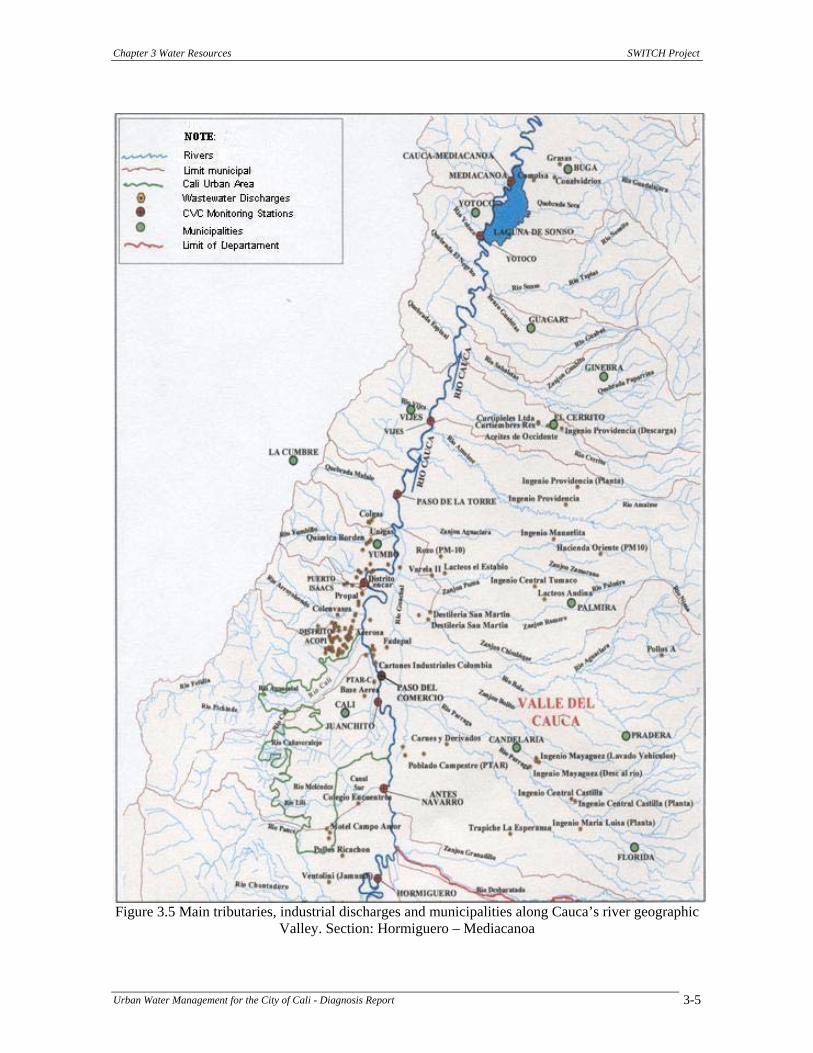
Figure 3.5 Main tributaries, industrial discharges and municipalities along Cauca’s river geographic
Valley. Section: Hormiguero – Mediacanoa
Chapter 3 Water Resources SWITCH Project
Urban Water Management for the City of Cali - Diagnosis Report 3-6
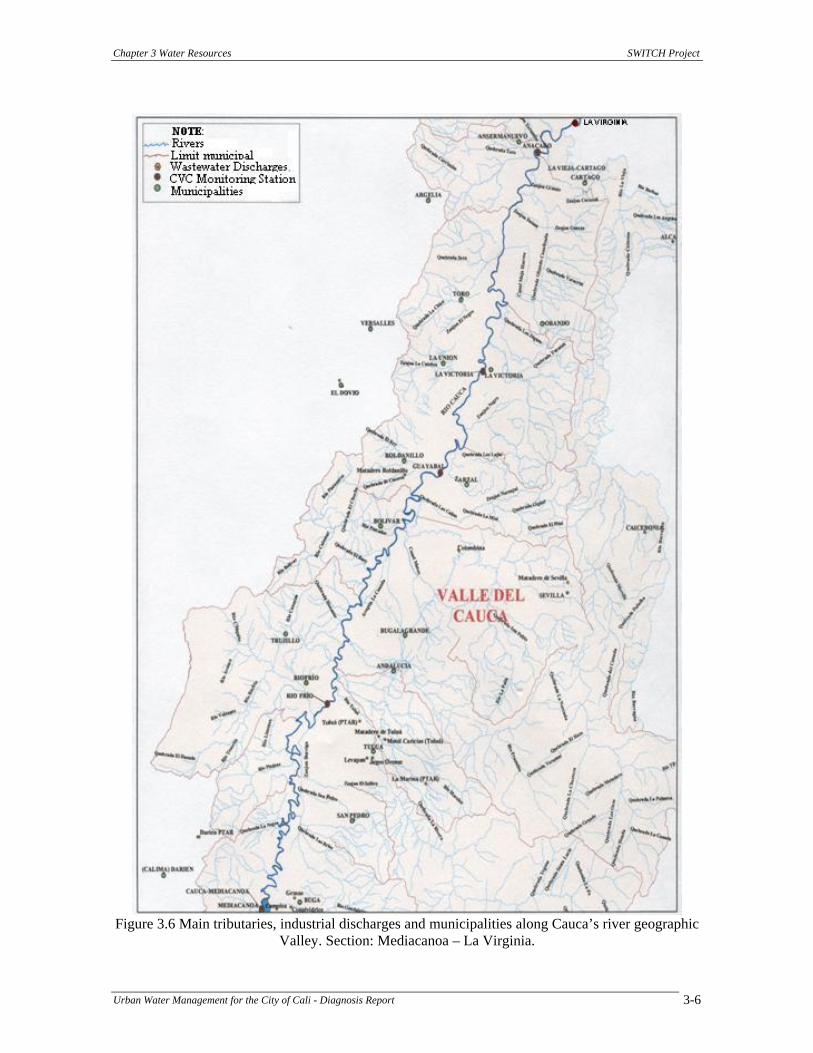
Figure 3.6 Main tributaries, industrial discharges and municipalities along Cauca’s river geographic
Valley. Section: Mediacanoa – La Virginia.
Chapter 3 Water Resources SWITCH Project
Urban Water Management for the City of Cali - Diagnosis Report 3-7
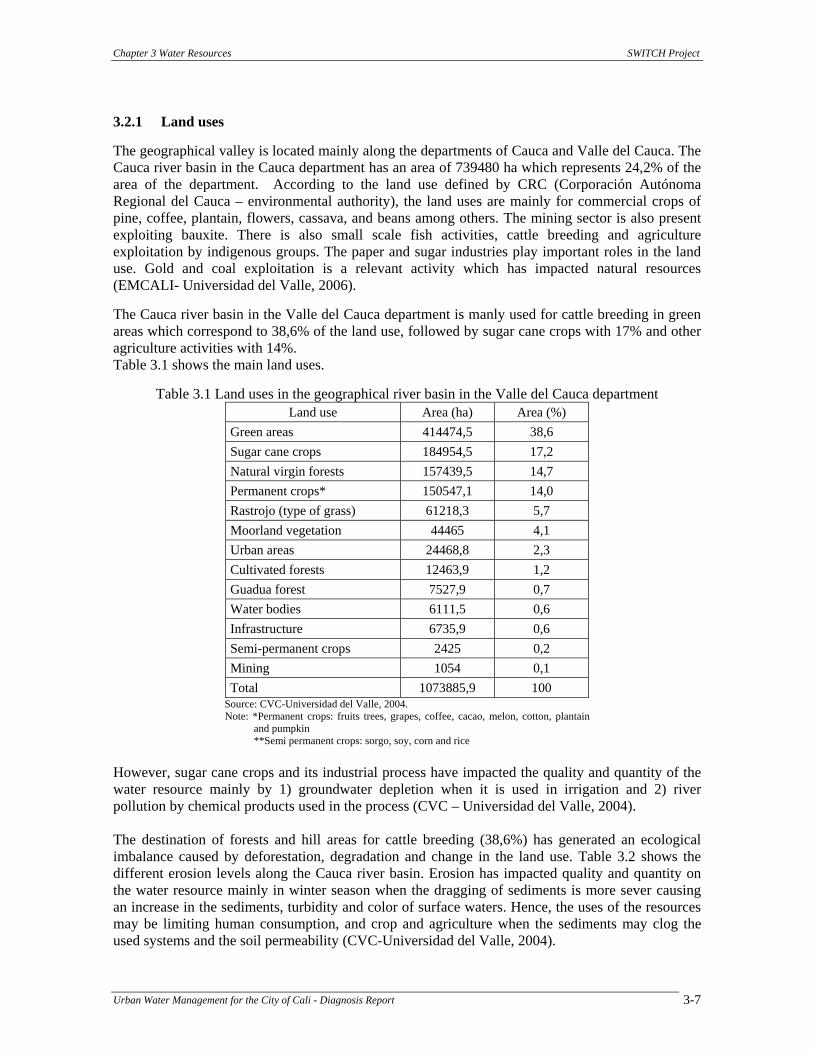
3.2.1 Land uses The geographical valley is located mainly along the departments of Cauca and Valle del Cauca. The Cauca river basin in the Cauca department has an area of 739480 ha which represents 24,2% of the area of the department. According to the land use defined by CRC (Corporación Autónoma Regional del Cauca – environmental authority), the land uses are mainly for commercial crops of pine, coffee, plantain, flowers, cassava, and beans among others. The mining sector is also present exploiting bauxite. There is also small scale fish activities, cattle breeding and agriculture exploitation by indigenous groups. The paper and sugar industries play important roles in the land use. Gold and coal exploitation is a relevant activity which has impacted natural resources (EMCALI- Universidad del Valle, 2006). The Cauca river basin in the Valle del Cauca department is manly used for cattle breeding in green areas which correspond to 38,6% of the land use, followed by sugar cane crops with 17% and other agriculture activities with 14%. Table 3.1 shows the main land uses.
Table 3.1 Land uses in the geographical river basin in the Valle del Cauca department Land use Area (ha) Area (%)
Green areas 414474,5 38,6 Sugar cane crops 184954,5 17,2 Natural virgin forests 157439,5 14,7 Permanent crops* 150547,1 14,0 Rastrojo (type of grass) 61218,3 5,7 Moorland vegetation 44465 4,1 Urban areas 24468,8 2,3 Cultivated forests 12463,9 1,2 Guadua forest 7527,9 0,7 Water bodies 6111,5 0,6 Infrastructure 6735,9 0,6 Semi-permanent crops 2425 0,2 Mining 1054 0,1 Total 1073885,9 100
Source: CVC-Universidad del Valle, 2004. Note: *Permanent crops: fruits trees, grapes, coffee, cacao, melon, cotton, plantain
and pumpkin **Semi permanent crops: sorgo, soy, corn and rice
However, sugar cane crops and its industrial process have impacted the quality and quantity of the water resource mainly by 1) groundwater depletion when it is used in irrigation and 2) river pollution by chemical products used in the process (CVC – Universidad del Valle, 2004). The destination of forests and hill areas for cattle breeding (38,6%) has generated an ecological imbalance caused by deforestation, degradation and change in the land use. Table 3.2 shows the different erosion levels along the Cauca river basin. Erosion has impacted quality and quantity on the water resource mainly in winter season when the dragging of sediments is more sever causing an increase in the sediments, turbidity and color of surface waters. Hence, the uses of the resources may be limiting human consumption, and crop and agriculture when the sediments may clog the used systems and the soil permeability (CVC-Universidad del Valle, 2004).
Chapter 3 Water Resources SWITCH Project
Urban Water Management for the City of Cali - Diagnosis Report 3-8
Table 3.2 Soil erosion levels in the Cauca river basin
AreaLevel (ha) (%)Highly severe 29323,9 2,7Severe 151387 14,1Moderated 331711,4 31Low 65296,3 6,1Natural** 139199,7 13Not studied* 20200,9 1,9Flat area 333416,6 31,2Total 1070535,8 100
Source: CVC – Universidad del Valle, 2004 Note: *high zones in Riofrío, Piedras, Pescador, Jamundí, Claro
and Timba river **Forests without and apparent lost in land use
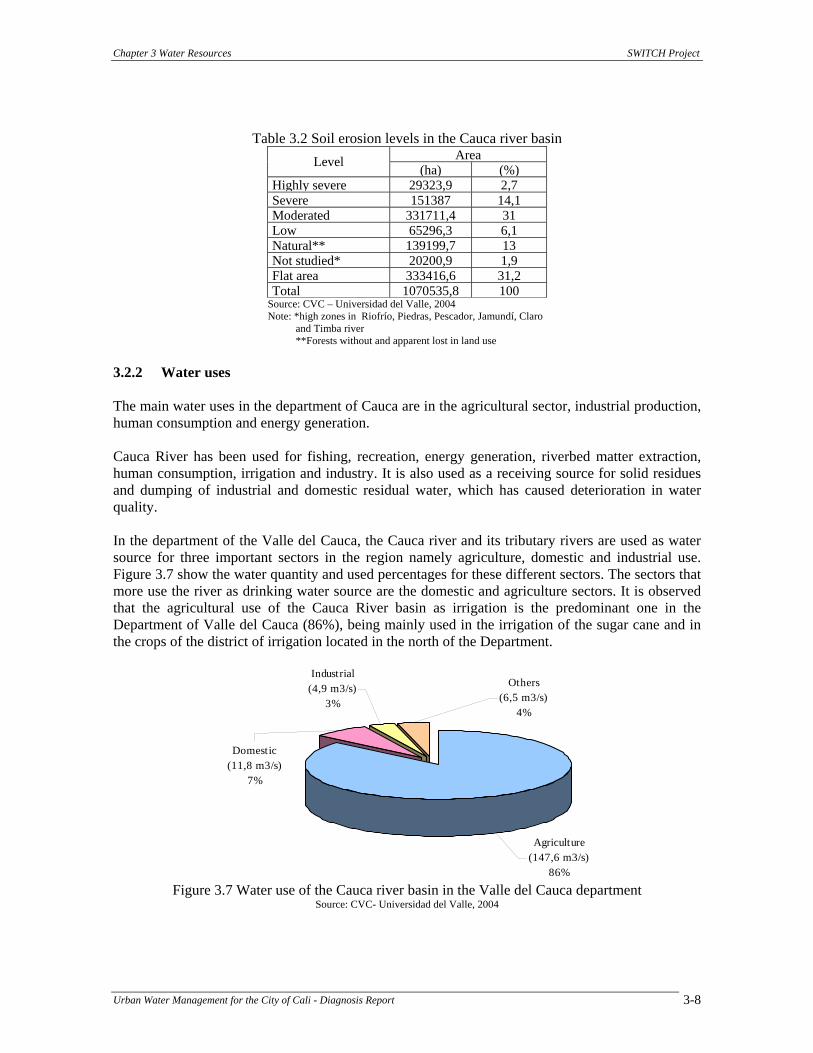
3.2.2 Water uses The main water uses in the department of Cauca are in the agricultural sector, industrial production, human consumption and energy generation. Cauca River has been used for fishing, recreation, energy generation, riverbed matter extraction, human consumption, irrigation and industry. It is also used as a receiving source for solid residues and dumping of industrial and domestic residual water, which has caused deterioration in water quality. In the department of the Valle del Cauca, the Cauca river and its tributary rivers are used as water source for three important sectors in the region namely agriculture, domestic and industrial use. Figure 3.7 show the water quantity and used percentages for these different sectors. The sectors that more use the river as drinking water source are the domestic and agriculture sectors. It is observed that the agricultural use of the Cauca River basin as irrigation is the predominant one in the Department of Valle del Cauca (86%), being mainly used in the irrigation of the sugar cane and in the crops of the district of irrigation located in the north of the Department.
Agriculture (147,6 m3/s)
86%
Industrial (4,9 m3/s)
3%
Domestic (11,8 m3/s)
7%
Others (6,5 m3/s)
4%
Figure 3.7 Water use of the Cauca river basin in the Valle del Cauca department
Source: CVC- Universidad del Valle, 2004
Chapter 3 Water Resources SWITCH Project
Urban Water Management for the City of Cali - Diagnosis Report 3-9
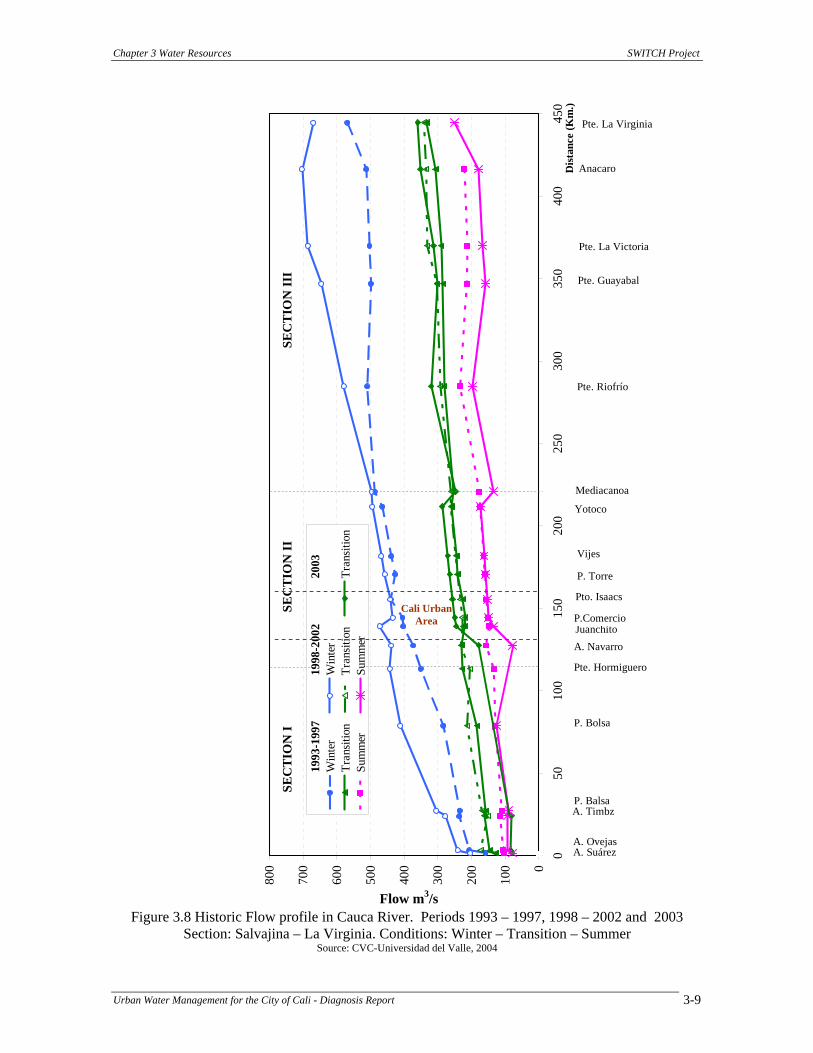
Figure 3.8 Historic Flow profile in Cauca River. Periods 1993 – 1997, 1998 – 2002 and 2003 Section: Salvajina – La Virginia. Conditions: Winter – Transition – Summer
Source: CVC-Universidad del Valle, 2004
Cali urban area
0
100
200
300
400
500
600
700
800
050
100
150
200
250
300
350
400
450
Dis
tanc
e (K
m.)
Flow (m3/s)
1993
-199
719
98-2
002
2003
Win
ter
Win
ter
Serie
9Tr
ansit
ion
Tran
sitio
nTr
ansit
ion
Sum
mer
Sum
mer
SEC
TIO
N II
ISE
CT
ION
IISE
CT
ION
I
A. SuárezA. Ovejas
A. TimbzP. Balsa
P. Bolsa
Pte. Hormiguero
A. Navarro Juanchito P.Comercio
Pto. Isaacs
P. Torre
Vijes
Yotoco
Mediacanoa
Pte. Riofrío
Pte. La Victoria
Pte. Guayabal
Anacaro
Pte. La Virginia
Flow m3/s
Cali UrbanArea
Chapter 3 Water Resources SWITCH Project
Urban Water Management for the City of Cali - Diagnosis Report 3-10
3.2.3 Cauca river water quantity Figure 3.8 shows the average flows of Cauca River during the periods 1993-1997, 1998-2002 and year 2003 during summer, winter and transition season (between summer and winter); between the Suárez and La Virginia stations. Period 1998-2002 and 1993-1997 present the biggest flows during winter-transition season and summer season respectively. Also, an increasing flow trend is seen in this sector. Table 3.3 shows the resume of the flow ranges registered in the mentioned seasons.
Table 3.3 Flow ranges measured in the Cauca river. Periods 1993-2003 Period Winter (m3/s) Transition (m3/s) Summer (m3/s)
1993-1997 158-548 129-334 103-251 1998-2002 204-670 140-341 97-234
2003 81-360 80-251 Source: CVC-Universidad del Valle, 2004
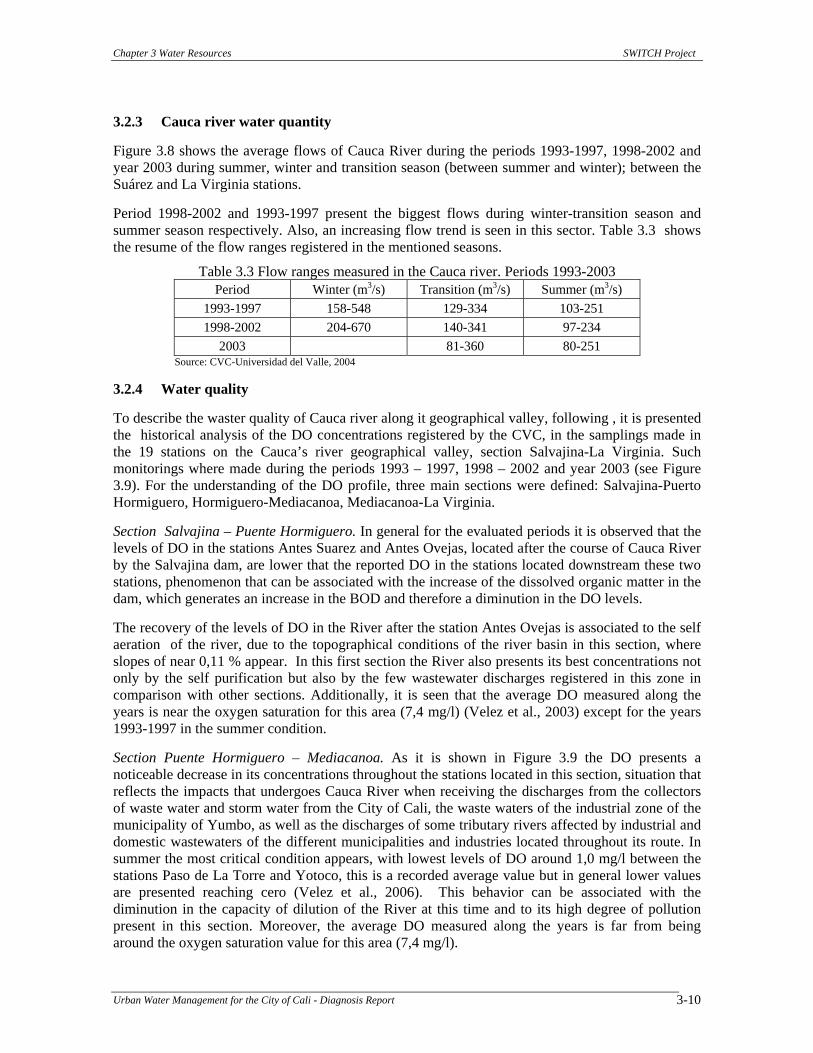
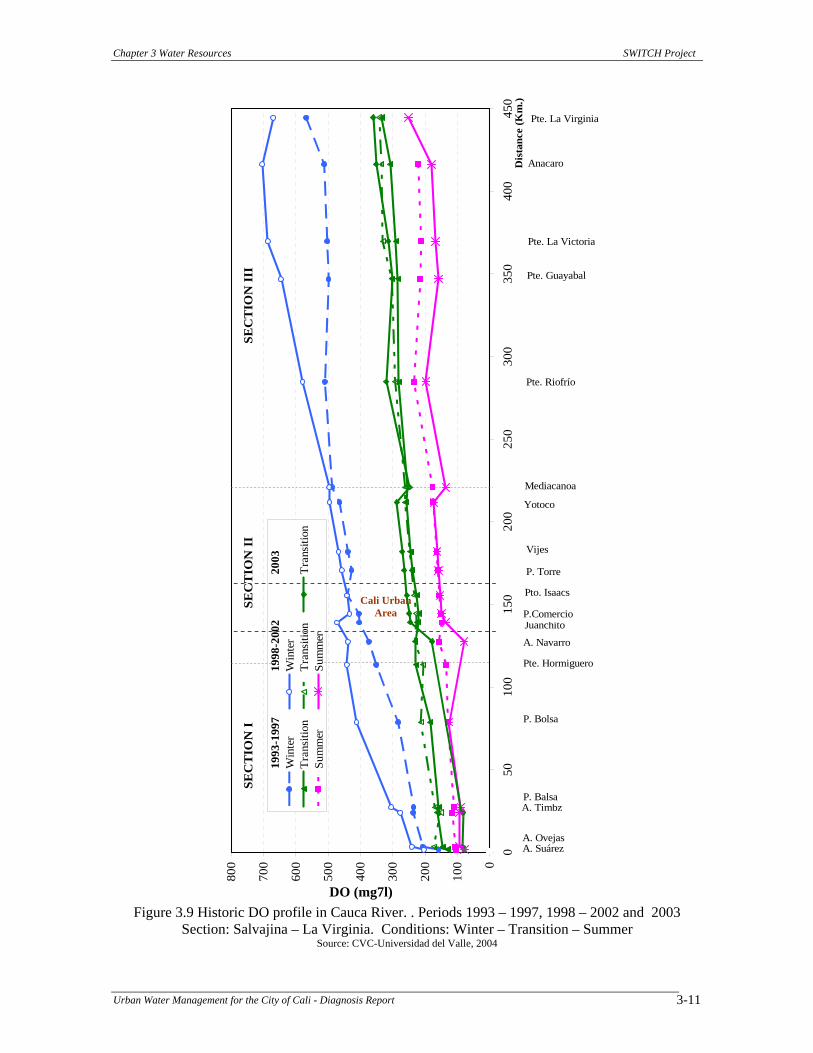
3.2.4 Water quality To describe the waster quality of Cauca river along it geographical valley, following , it is presented the historical analysis of the DO concentrations registered by the CVC, in the samplings made in the 19 stations on the Cauca’s river geographical valley, section Salvajina-La Virginia. Such monitorings where made during the periods 1993 – 1997, 1998 – 2002 and year 2003 (see Figure 3.9). For the understanding of the DO profile, three main sections were defined: Salvajina-Puerto Hormiguero, Hormiguero-Mediacanoa, Mediacanoa-La Virginia. Section Salvajina – Puente Hormiguero. In general for the evaluated periods it is observed that the levels of DO in the stations Antes Suarez and Antes Ovejas, located after the course of Cauca River by the Salvajina dam, are lower that the reported DO in the stations located downstream these two stations, phenomenon that can be associated with the increase of the dissolved organic matter in the dam, which generates an increase in the BOD and therefore a diminution in the DO levels. The recovery of the levels of DO in the River after the station Antes Ovejas is associated to the self aeration of the river, due to the topographical conditions of the river basin in this section, where slopes of near 0,11 % appear. In this first section the River also presents its best concentrations not only by the self purification but also by the few wastewater discharges registered in this zone in comparison with other sections. Additionally, it is seen that the average DO measured along the years is near the oxygen saturation for this area (7,4 mg/l) (Velez et al., 2003) except for the years 1993-1997 in the summer condition. Section Puente Hormiguero – Mediacanoa. As it is shown in Figure 3.9 the DO presents a noticeable decrease in its concentrations throughout the stations located in this section, situation that reflects the impacts that undergoes Cauca River when receiving the discharges from the collectors of waste water and storm water from the City of Cali, the waste waters of the industrial zone of the municipality of Yumbo, as well as the discharges of some tributary rivers affected by industrial and domestic wastewaters of the different municipalities and industries located throughout its route. In summer the most critical condition appears, with lowest levels of DO around 1,0 mg/l between the stations Paso de La Torre and Yotoco, this is a recorded average value but in general lower values are presented reaching cero (Velez et al., 2006). This behavior can be associated with the diminution in the capacity of dilution of the River at this time and to its high degree of pollution present in this section. Moreover, the average DO measured along the years is far from being around the oxygen saturation value for this area (7,4 mg/l).
Chapter 3 Water Resources SWITCH Project
Urban Water Management for the City of Cali - Diagnosis Report 3-11
Figure 3.9 Historic DO profile in Cauca River. . Periods 1993 – 1997, 1998 – 2002 and 2003 Section: Salvajina – La Virginia. Conditions: Winter – Transition – Summer
Source: CVC-Universidad del Valle, 2004
0
100
200
300
400
500
600
700
800
050
100
150
200
250
300
350
400
450
Dis
tanc
e (K
m.)
Flow (m3/s)
1993
-199
719
98-2
002
2003
Win
ter
Win
ter
Serie
9T
rans
ition
Tra
nsiti
onT
rans
ition
Sum
mer
Sum
mer
SEC
TIO
N I
IISE
CT
ION
II
SEC
TIO
N I
A. SuárezA. Ovejas
A. TimbzP. Balsa
P. Bolsa
Pte. Hormiguero
A. Navarro
Juanchito P.Comercio
Pto. Isaacs
P. Torre
Vijes
Yotoco
Mediacanoa
Pte. Riofrío
Pte. La Victoria
Pte. Guayabal
Anacaro
Pte. La Virginia
DO (mg7l)
Cali UrbanArea
Chapter 3 Water Resources SWITCH Project
Urban Water Management for the City of Cali - Diagnosis Report 3-12
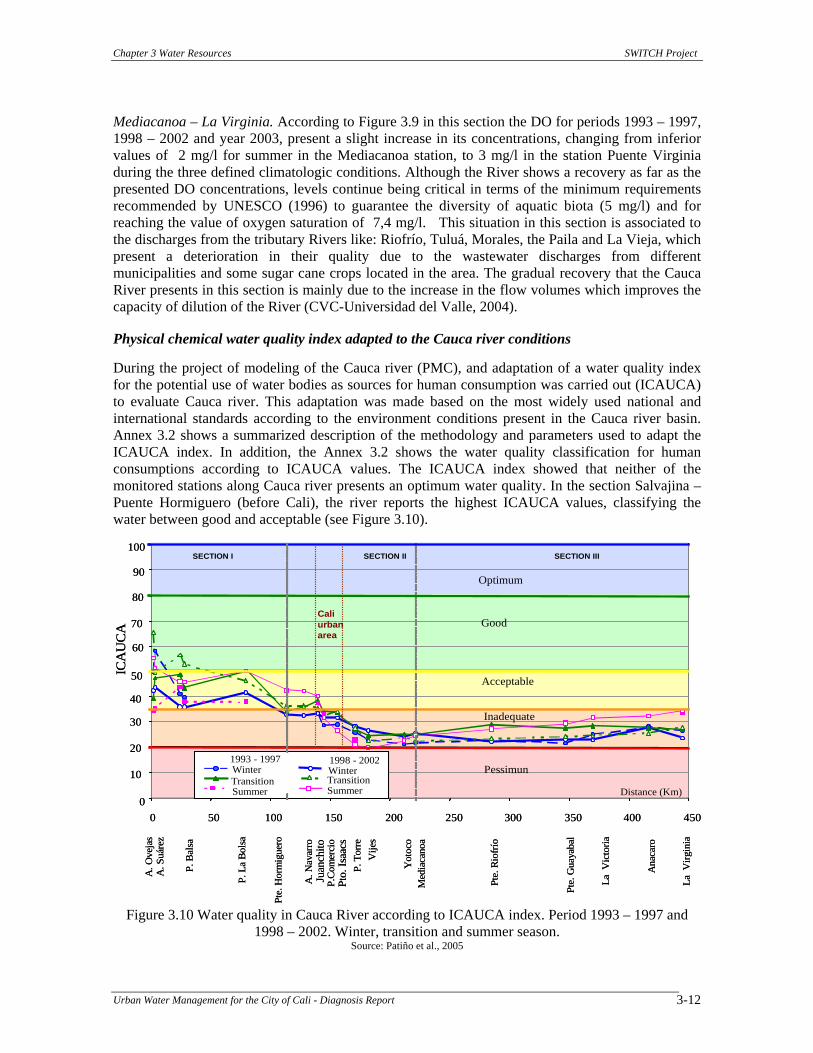
Mediacanoa – La Virginia. According to Figure 3.9 in this section the DO for periods 1993 – 1997, 1998 – 2002 and year 2003, present a slight increase in its concentrations, changing from inferior values of 2 mg/l for summer in the Mediacanoa station, to 3 mg/l in the station Puente Virginia during the three defined climatologic conditions. Although the River shows a recovery as far as the presented DO concentrations, levels continue being critical in terms of the minimum requirements recommended by UNESCO (1996) to guarantee the diversity of aquatic biota (5 mg/l) and for reaching the value of oxygen saturation of 7,4 mg/l. This situation in this section is associated to the discharges from the tributary Rivers like: Riofrío, Tuluá, Morales, the Paila and La Vieja, which present a deterioration in their quality due to the wastewater discharges from different municipalities and some sugar cane crops located in the area. The gradual recovery that the Cauca River presents in this section is mainly due to the increase in the flow volumes which improves the capacity of dilution of the River (CVC-Universidad del Valle, 2004). Physical chemical water quality index adapted to the Cauca river conditions During the project of modeling of the Cauca river (PMC), and adaptation of a water quality index for the potential use of water bodies as sources for human consumption was carried out (ICAUCA) to evaluate Cauca river. This adaptation was made based on the most widely used national and international standards according to the environment conditions present in the Cauca river basin. Annex 3.2 shows a summarized description of the methodology and parameters used to adapt the ICAUCA index. In addition, the Annex 3.2 shows the water quality classification for human consumptions according to ICAUCA values. The ICAUCA index showed that neither of the monitored stations along Cauca river presents an optimum water quality. In the section Salvajina – Puente Hormiguero (before Cali), the river reports the highest ICAUCA values, classifying the water between good and acceptable (see Figure 3.10).
Figure 3.10 Water quality in Cauca River according to ICAUCA index. Period 1993 – 1997 and 1998 – 2002. Winter, transition and summer season.
Source: Patiño et al., 2005
Cali urban area
SECTION I SECTION IIISECTION II
P. B
alsa
A. N
avar
ro
P.C
omer
cio
A. S
uáre
z
Juan
chito
Pto.
Isaa
cs
P. T
orre
V
ijes
Yot
oco
Med
iaca
noa
Pte.
Rio
frío
Pte.
Gua
yaba
l
Ana
caro
La V
irgin
ia
Pte.
Hor
mig
uero
0
10
20
30
40
50
60
70
80
90
100
0 50 100 150 200 250 300 350 400 450
Distance (Km)
ICA
UC
A
1993 - 1997 1998 - 2002Winter WinterTransition TransitionSummer Summer
Optimum
Pessimun
Inadequate
Acceptable
Good
P. L
a B
olsa
La V
icto
ria
A. O
veja
s
SECTION I SECTION IIISECTION II
Cali urban area
Cali urban area
Cali urban area
SECTION I SECTION IIISECTION IISECTION I SECTION IIISECTION II
P. B
alsa
A. N
avar
ro
P.C
omer
cio
A. S
uáre
z
Juan
chito
Pto.
Isaa
cs
P. T
orre
V
ijes
Yot
oco
Med
iaca
noa
Pte.
Rio
frío
Pte.
Gua
yaba
l
Ana
caro
La V
irgin
ia
Pte.
Hor
mig
uero
0
10
20
30
40
50
60
70
80
90
100
0 50 100 150 200 250 300 350 400 450
Distance (Km)
ICA
UC
A
1993 - 1997 1998 - 2002Winter WinterTransition TransitionSummer Summer
Optimum
Pessimun
Inadequate
Acceptable
Good
P. L
a B
olsa
La V
icto
ria
A. O
veja
s
SECTION I SECTION IIISECTION II
Cali urban area
Chapter 3 Water Resources SWITCH Project
Urban Water Management for the City of Cali - Diagnosis Report 3-13
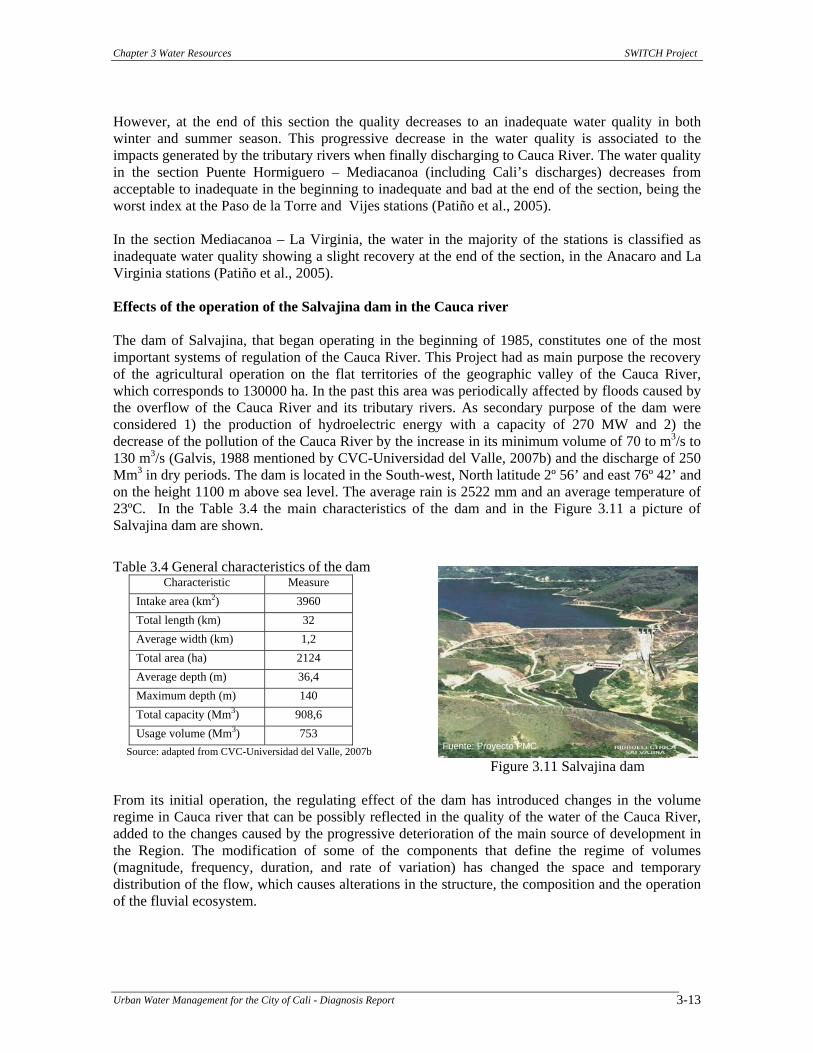
However, at the end of this section the quality decreases to an inadequate water quality in both winter and summer season. This progressive decrease in the water quality is associated to the impacts generated by the tributary rivers when finally discharging to Cauca River. The water quality in the section Puente Hormiguero – Mediacanoa (including Cali’s discharges) decreases from acceptable to inadequate in the beginning to inadequate and bad at the end of the section, being the worst index at the Paso de la Torre and Vijes stations (Patiño et al., 2005). In the section Mediacanoa – La Virginia, the water in the majority of the stations is classified as inadequate water quality showing a slight recovery at the end of the section, in the Anacaro and La Virginia stations (Patiño et al., 2005). Effects of the operation of the Salvajina dam in the Cauca river The dam of Salvajina, that began operating in the beginning of 1985, constitutes one of the most important systems of regulation of the Cauca River. This Project had as main purpose the recovery of the agricultural operation on the flat territories of the geographic valley of the Cauca River, which corresponds to 130000 ha. In the past this area was periodically affected by floods caused by the overflow of the Cauca River and its tributary rivers. As secondary purpose of the dam were considered 1) the production of hydroelectric energy with a capacity of 270 MW and 2) the decrease of the pollution of the Cauca River by the increase in its minimum volume of 70 to m3/s to 130 m3/s (Galvis, 1988 mentioned by CVC-Universidad del Valle, 2007b) and the discharge of 250 Mm3 in dry periods. The dam is located in the South-west, North latitude 2º 56’ and east 76º 42’ and on the height 1100 m above sea level. The average rain is 2522 mm and an average temperature of 23ºC. In the Table 3.4 the main characteristics of the dam and in the Figure 3.11 a picture of Salvajina dam are shown. Table 3.4 General characteristics of the dam
Characteristic Measure Intake area (km2) 3960 Total length (km) 32 Average width (km) 1,2 Total area (ha) 2124 Average depth (m) 36,4 Maximum depth (m) 140 Total capacity (Mm3) 908,6 Usage volume (Mm3) 753
Source: adapted from CVC-Universidad del Valle, 2007b Figure 3.11 Salvajina dam
From its initial operation, the regulating effect of the dam has introduced changes in the volume regime in Cauca river that can be possibly reflected in the quality of the water of the Cauca River, added to the changes caused by the progressive deterioration of the main source of development in the Region. The modification of some of the components that define the regime of volumes (magnitude, frequency, duration, and rate of variation) has changed the space and temporary distribution of the flow, which causes alterations in the structure, the composition and the operation of the fluvial ecosystem.
Fuente: Proyecto PMC
Chapter 3 Water Resources SWITCH Project
Urban Water Management for the City of Cali - Diagnosis Report 3-14
With relation to the hydrologic regime the changes were as expected: an increase in the volumes during the Post-Salvajina period (1985-2005), during the condition of summer and a decrease in the flow during the condition of winter. As far as the quality of the water, the levels of DO registered for the condition of summer do not present significant differences between the periods Pre-Salvajina (1980 – 1984), and Post-Salvajina (1985 – 2005). The hourly volume variability originated by the operation of the dam of Salvajina causes hourly variations in the quality of water that cannot be visualized and be quantified base on the daily information. Following, the DO trend measured in years 2003 and 2005 in the stations La Balsa and Hormiguero is shown which better reflect the hourly changes in the quality of Cauca’s river water caused by the operation of the Salvajina dam, considering the climatic conditions of winter and summer. In the station Balsa certain tendencies are observed that can be related to some of the following processes: The maximum levels of DO appear at noon (12:00 h) when the solar brightness and the
temperature are maximum whereas the minimum concentrations happen at midnight (00:00 h) when the solar brightness is null and the temperature is minimum. This variation in DO can be associated with the photosynthetic activity in the sector of Balsa caused by the presence of seaweed of the dam of Salvajina (CVC – Universidad de Valle, 2007b).
The dilution of the polluting load as a result of the volume increase takes place, which generates an increase in the dissolved oxygen levels. This effect is seen in the curve’s changes in the hours following the release of the volumes in Salvajina.
The fast release of the bigger water volumes from the dam can produce a reduction in the dissolved oxygen levels due to the increase in the speeds of the flow that produce the dragging of materials on the bed of the river and the settlement of sediments “phenomenon of washing of the river basin” (CVC – Universidad de Valle, 2007b).
The capacity of self-recovery of the river diminishes, since the concentration of DO in the water coming from Salvajina is lower than the one in Cauca River in this section until La balsa station
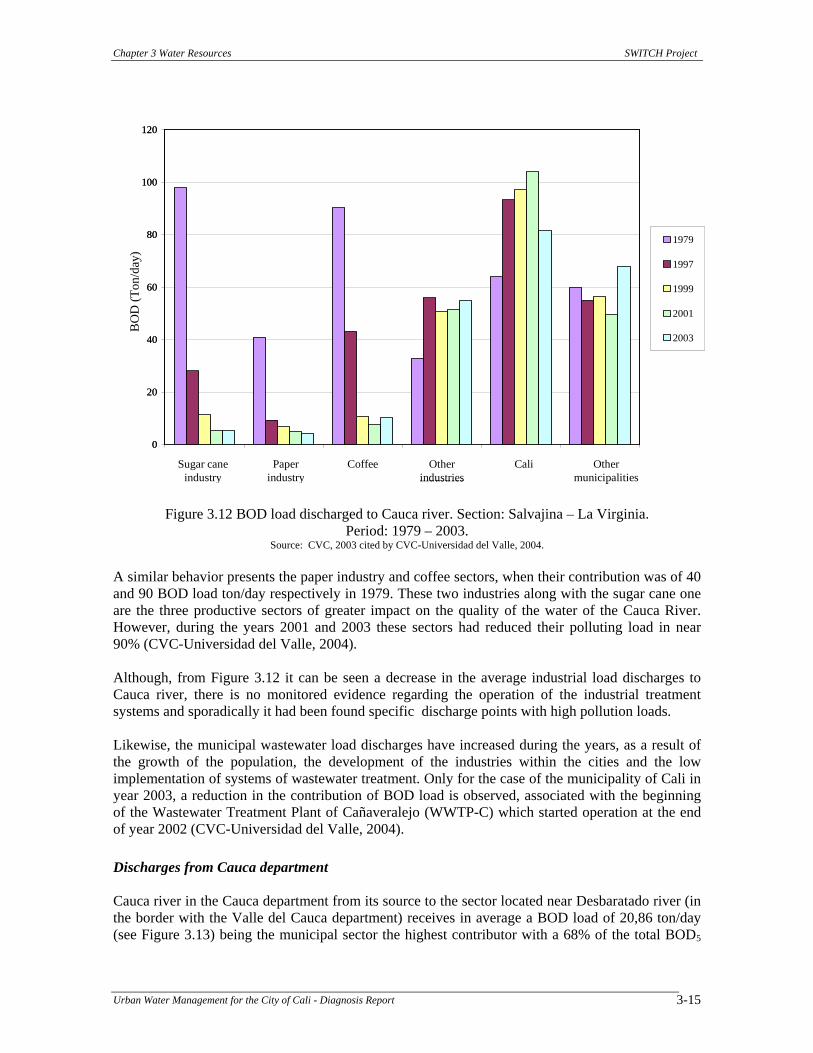
Wastewater discharges There are 40 tributaries between Salvajina and La Virginia, with a strong slope and considerable short-lasting spates. From the total organic discharges to the Cauca River, 59% is discharged by means of these tributaries (145 ton/day BOD in 1999). The most critical tributary rivers in terms of BOD load discharge are: Tuluá, Guachal, La Paila, La Vieja, Palo and Cali (Velez et al., 2003). Regarding wastewater discharges to the river, the CVC has been periodically controlling and monitoring the wastewater discharges from around 200 industries located in the geographical river basin, whose wastewaters are discharged to the Cauca River and its tributaries. Figure 3.12 shows the BOD loads discharged to the Cauca river basin in the section Salvajina –La Virginia during 1979 to 2003. Figure 3.12 shows that sectors like the sugar cane production, paper industry and coffee production have reduced their polluting contribution to the Cauca River. In year 1979 the sugar production industry spilled near 100 ton/day of BOD load to the river causing great impacts in the quality of the water resource and affecting the aquatic ecosystems. Nevertheless for the years 2001 and 2003, this same production sector reduced its polluting load to approximately 5 BOD ton/day.
Chapter 3 Water Resources SWITCH Project
Urban Water Management for the City of Cali - Diagnosis Report 3-15
Figure 3.12 BOD load discharged to Cauca river. Section: Salvajina – La Virginia.
Period: 1979 – 2003. Source: CVC, 2003 cited by CVC-Universidad del Valle, 2004.
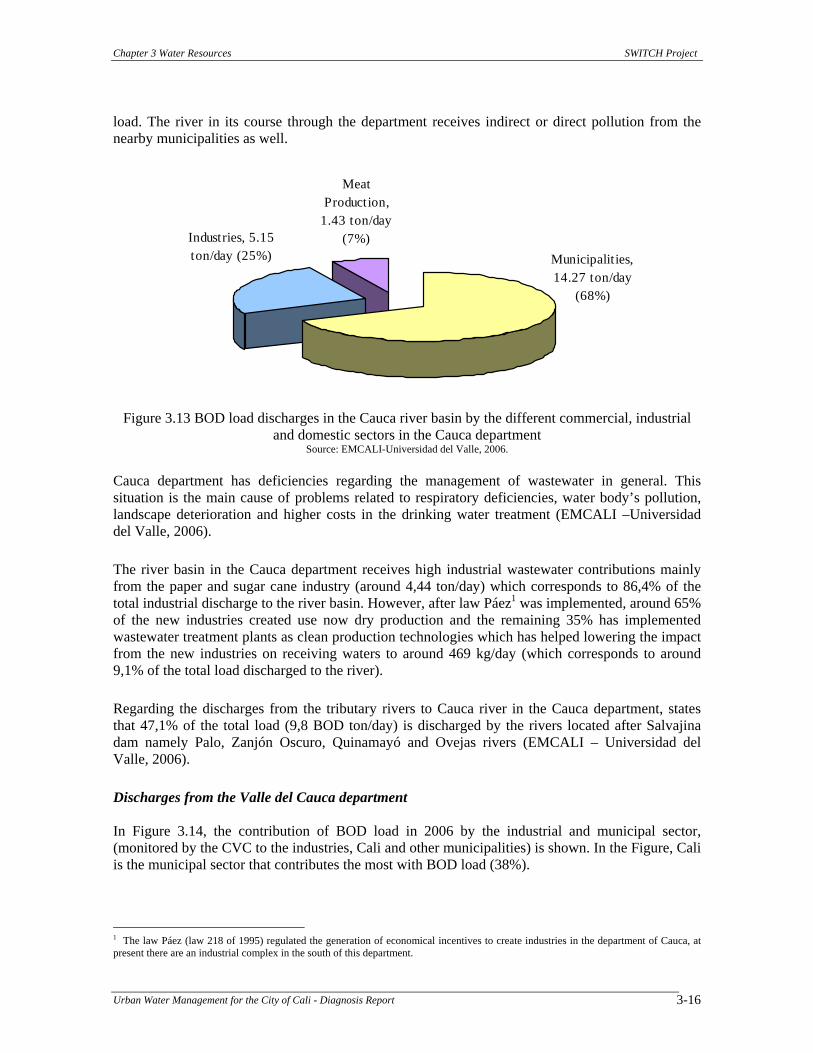
A similar behavior presents the paper industry and coffee sectors, when their contribution was of 40 and 90 BOD load ton/day respectively in 1979. These two industries along with the sugar cane one are the three productive sectors of greater impact on the quality of the water of the Cauca River. However, during the years 2001 and 2003 these sectors had reduced their polluting load in near 90% (CVC-Universidad del Valle, 2004). Although, from Figure 3.12 it can be seen a decrease in the average industrial load discharges to Cauca river, there is no monitored evidence regarding the operation of the industrial treatment systems and sporadically it had been found specific discharge points with high pollution loads. Likewise, the municipal wastewater load discharges have increased during the years, as a result of the growth of the population, the development of the industries within the cities and the low implementation of systems of wastewater treatment. Only for the case of the municipality of Cali in year 2003, a reduction in the contribution of BOD load is observed, associated with the beginning of the Wastewater Treatment Plant of Cañaveralejo (WWTP-C) which started operation at the end of year 2002 (CVC-Universidad del Valle, 2004). Discharges from Cauca department Cauca river in the Cauca department from its source to the sector located near Desbaratado river (in the border with the Valle del Cauca department) receives in average a BOD load of 20,86 ton/day (see Figure 3.13) being the municipal sector the highest contributor with a 68% of the total BOD5
0
20
40
60
80
100
120
IngeniosAzucareros
Papeleras Café Otras Industrias Municipio de Cali Otros Municpios
DB
O5
(Ton
/día
)
1979
1997
1999
2001
2003
BO
D (T
on/d
ay)
Sugar cane industry
Paper industry
Coffee Other industries
Cali Other municipalities
0
20
40
60
80
100
120
IngeniosAzucareros
Papeleras Café Otras Industrias Municipio de Cali Otros Municpios
DB
O5
(Ton
/día
)
1979
1997
1999
2001
2003
BO
D (T
on/d
ay)
Sugar cane industry
Paper industry
Coffee Other industries
Cali Other municipalities
Sugar cane industry
Paper industry
Coffee Other industries
Cali Other municipalities
Chapter 3 Water Resources SWITCH Project
Urban Water Management for the City of Cali - Diagnosis Report 3-16
load. The river in its course through the department receives indirect or direct pollution from the nearby municipalities as well.
Meat Production,
1.43 ton/day (7%)Industries, 5.15
ton/day (25%) Municipalit ies, 14.27 ton/day
(68%)
Figure 3.13 BOD load discharges in the Cauca river basin by the different commercial, industrial and domestic sectors in the Cauca department
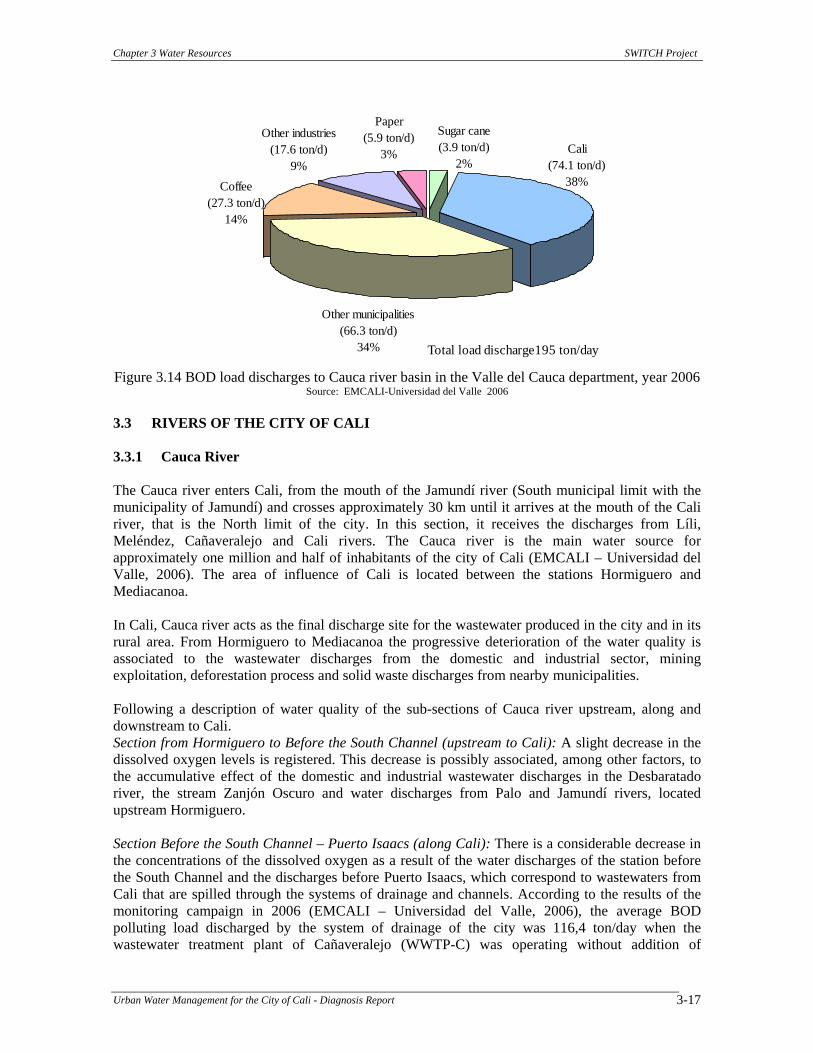
Source: EMCALI-Universidad del Valle, 2006. Cauca department has deficiencies regarding the management of wastewater in general. This situation is the main cause of problems related to respiratory deficiencies, water body’s pollution, landscape deterioration and higher costs in the drinking water treatment (EMCALI –Universidad del Valle, 2006). The river basin in the Cauca department receives high industrial wastewater contributions mainly from the paper and sugar cane industry (around 4,44 ton/day) which corresponds to 86,4% of the total industrial discharge to the river basin. However, after law Páez1 was implemented, around 65% of the new industries created use now dry production and the remaining 35% has implemented wastewater treatment plants as clean production technologies which has helped lowering the impact from the new industries on receiving waters to around 469 kg/day (which corresponds to around 9,1% of the total load discharged to the river). Regarding the discharges from the tributary rivers to Cauca river in the Cauca department, states that 47,1% of the total load (9,8 BOD ton/day) is discharged by the rivers located after Salvajina dam namely Palo, Zanjón Oscuro, Quinamayó and Ovejas rivers (EMCALI – Universidad del Valle, 2006). Discharges from the Valle del Cauca department In Figure 3.14, the contribution of BOD load in 2006 by the industrial and municipal sector, (monitored by the CVC to the industries, Cali and other municipalities) is shown. In the Figure, Cali is the municipal sector that contributes the most with BOD load (38%).
1 The law Páez (law 218 of 1995) regulated the generation of economical incentives to create industries in the department of Cauca, at present there are an industrial complex in the south of this department.
Chapter 3 Water Resources SWITCH Project
Urban Water Management for the City of Cali - Diagnosis Report 3-17
Sugar cane (3.9 ton/d)
2%
Other industries (17.6 ton/d)
9%Coffee
(27.3 ton/d)14%
Other municipalities (66.3 ton/d)
34%
Cali (74.1 ton/d)
38%
Paper (5.9 ton/d)
3%
Total load discharge195 ton/day
Figure 3.14 BOD load discharges to Cauca river basin in the Valle del Cauca department, year 2006 Source: EMCALI-Universidad del Valle 2006
3.3 RIVERS OF THE CITY OF CALI
3.3.1 Cauca River The Cauca river enters Cali, from the mouth of the Jamundí river (South municipal limit with the municipality of Jamundí) and crosses approximately 30 km until it arrives at the mouth of the Cali river, that is the North limit of the city. In this section, it receives the discharges from Líli, Meléndez, Cañaveralejo and Cali rivers. The Cauca river is the main water source for approximately one million and half of inhabitants of the city of Cali (EMCALI – Universidad del Valle, 2006). The area of influence of Cali is located between the stations Hormiguero and Mediacanoa. In Cali, Cauca river acts as the final discharge site for the wastewater produced in the city and in its rural area. From Hormiguero to Mediacanoa the progressive deterioration of the water quality is associated to the wastewater discharges from the domestic and industrial sector, mining exploitation, deforestation process and solid waste discharges from nearby municipalities. Following a description of water quality of the sub-sections of Cauca river upstream, along and downstream to Cali. Section from Hormiguero to Before the South Channel (upstream to Cali): A slight decrease in the dissolved oxygen levels is registered. This decrease is possibly associated, among other factors, to the accumulative effect of the domestic and industrial wastewater discharges in the Desbaratado river, the stream Zanjón Oscuro and water discharges from Palo and Jamundí rivers, located upstream Hormiguero. Section Before the South Channel – Puerto Isaacs (along Cali): There is a considerable decrease in the concentrations of the dissolved oxygen as a result of the water discharges of the station before the South Channel and the discharges before Puerto Isaacs, which correspond to wastewaters from Cali that are spilled through the systems of drainage and channels. According to the results of the monitoring campaign in 2006 (EMCALI – Universidad del Valle, 2006), the average BOD polluting load discharged by the system of drainage of the city was 116,4 ton/day when the wastewater treatment plant of Cañaveralejo (WWTP-C) was operating without addition of
Chapter 3 Water Resources SWITCH Project
Urban Water Management for the City of Cali - Diagnosis Report 3-18
chemicals (Ferric chloride). The greatest contribution of BOD and COD load was the WWTP-C effluent with a percentage around 46%. In addition to the wastewater discharges of the drainage system of Cali, in this section the Cauca river receives industrial wastewaters discharges as well such as the paper industry and oil industry. In this section, the south drainage system of the city discharges its wastewater to Cauca river which is contaminated by leachate coming from Navarro disposal site. This discharge occurs 4 kilometers upstream the water intake of drinking plants of Puerto Mallarino and Rio Cauca which deliver approximately 77% of the total drinking water to the city of Cali. The polluted discharges from the south drainage system threaten the treatment and delivery of drinking water to the city. According to the records of operation from the plants from year 2000 to 2007 the number of shutdowns in the plants has increased as follows: from 10 to 28 shutdowns per year in Puerto Mallarino and from 10 to 24 shutdowns per year in Rio Cauca plant (EMCALI, 2007b). In the Section between Puerto Isaacs – Mediacanoa (downstream to Cali): The most critical point in the river appears in the Station Paso de la Torre, which presented anaerobic conditions, which are seen by the changes that take place in the water, such as the deterioration of the aesthetic aspect, dark coloration, floating substances and bad odors by the H2S liberated. This condition appears as a cumulative response of the river influenced by the wastewater discharges of Cali, added to the domestic and industrial wastewater discharges of the municipalities of Palmira and Yumbo through the rivers Yumbo and Guachal. Although in this section the lowest DO concentration was recorded, after the station Paso de la Torre there was observed a recovery tendency, registering a slight increase in the DO concentrations. The total load discharged to the Cauca river in the section Hormiguero- Mediacanoa during the four days of monitoring campaign in 2006 was 197,8 BOD ton/day; 404,2 COD ton/day and 228,4 TSS ton/day discharged by tributary rivers and the sewage system Cali. Regarding the origin of these discharges 40% arrive through the four tributary rivers and the other 60% was contributed by the city of Cali (EMCALI-Universidad del Valle, 2006). Presence of hazardous substances. In the section Hormiguero-Mediacanoa there has been also found a potential risk of pollution in the water due to presence of hazardous substances such as high concentrations of phenolic compounds, some metals and organic matter (EMCALI- Universidad del Valle, 2006). Figure 3.15 the diagram of boxes show the variation in the lead concentration which is similar in the stations Hormiguero and Before South Channel, the mean value for both stations is over the value recommended in Decree 1594 of 1984 (0.05 mg/l) (criteria of water quality for human consumption after conventional treatment). At the level of water intake in the station before Puerto Mallarino, the lead concentrations stay below the permissible limits. In Table 3.5 the minimums, maximums and averages values of the concentrations of phenol compounds are shown (EMCALI-Universidad del Valle, 2006). In this Table it is possible to observe that the average total concentrations of phenols are above the limit established in Decree 1594 of 1984 of the Ministry of Health (that is of 2,0 µg/l). This means that there is a risk of by product formation from the disinfection with chlorine in the case of using the water as source for drinking water production.
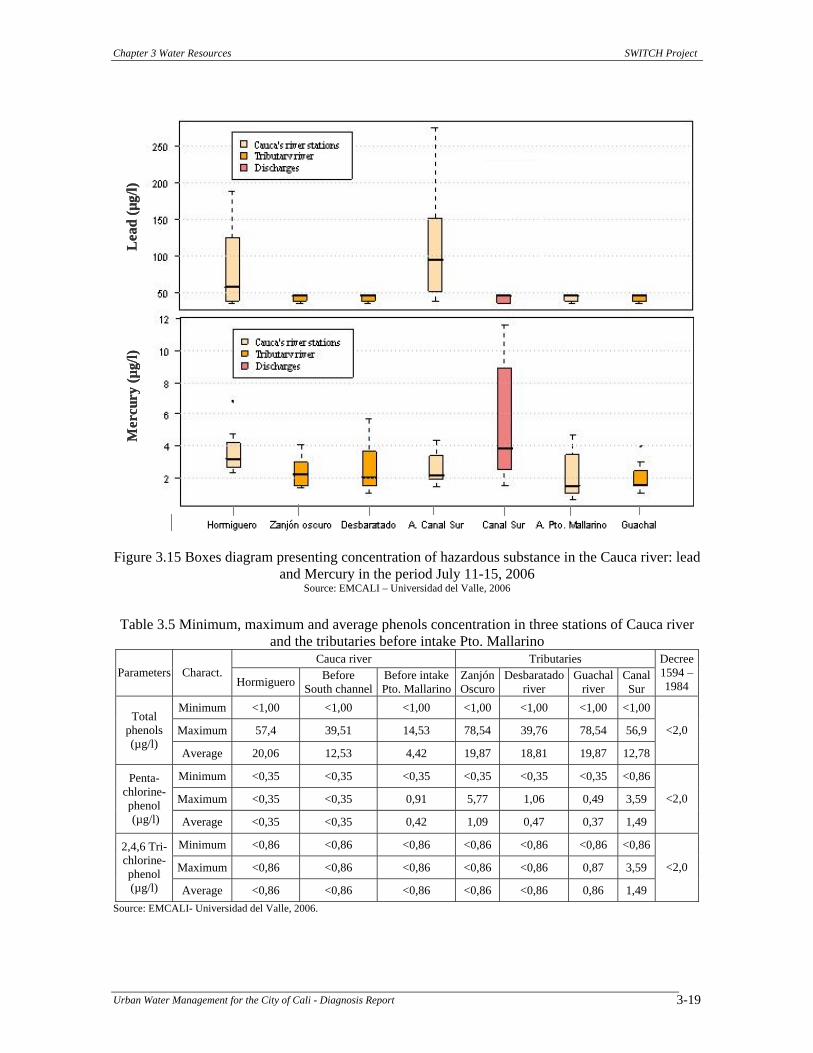
Chapter 3 Water Resources SWITCH Project
Urban Water Management for the City of Cali - Diagnosis Report 3-19
Lea
d(µ
g/l)
Mer
cury
(µg/
l)L
ead
(µg/
l)M
ercu
ry(µ
g/l)
Figure 3.15 Boxes diagram presenting concentration of hazardous substance in the Cauca river: lead
and Mercury in the period July 11-15, 2006 Source: EMCALI – Universidad del Valle, 2006
Table 3.5 Minimum, maximum and average phenols concentration in three stations of Cauca river
and the tributaries before intake Pto. Mallarino Cauca river Tributaries
Parameters Charact. Hormiguero Before
South channelBefore intake Pto. Mallarino
ZanjónOscuro
Desbaratadoriver
Guachal river
Canal Sur
Decree 1594 – 1984
Minimum <1,00 <1,00 <1,00 <1,00 <1,00 <1,00 <1,00
Maximum 57,4 39,51 14,53 78,54 39,76 78,54 56,9 Total
phenols (µg/l)
Average 20,06 12,53 4,42 19,87 18,81 19,87 12,78
<2,0
Minimum <0,35 <0,35 <0,35 <0,35 <0,35 <0,35 <0,86
Maximum <0,35 <0,35 0,91 5,77 1,06 0,49 3,59
Penta-chlorine-phenol (µg/l) Average <0,35 <0,35 0,42 1,09 0,47 0,37 1,49
<2,0
Minimum <0,86 <0,86 <0,86 <0,86 <0,86 <0,86 <0,86
Maximum <0,86 <0,86 <0,86 <0,86 <0,86 0,87 3,59
2,4,6 Tri-chlorine-phenol (µg/l) Average <0,86 <0,86 <0,86 <0,86 <0,86 0,86 1,49
<2,0
Source: EMCALI- Universidad del Valle, 2006.
Chapter 3 Water Resources SWITCH Project
Urban Water Management for the City of Cali - Diagnosis Report 3-20
3.3.2 Cañaveralejo River
The Cañaveralejo river is born in the slope of The Farallones of Cali at 1800 meters above sea level. The Farallones are the tallest rock formations in the West mountain range. The river limits the Northwest with the hydrographic river basin of the Cali river, on the South west with the Meléndez river basin on the east with the urban border. The Cañaveralejo river basin has an estimated area of 2882 ha and it is divided in three geomorphologic units: high, medium and low river basin, that go from the level 1800 above sea level (in the countryside of Cali) to the discharge in the South Channel, crossing an approximated length of 9 km. Land use. The high part of the river basin (river source 1880 above sea level- La Sirena sector 1005 m.a.s.l) is characterized by the presence of forest areas with natural vegetation. This part has presence of small scale crops, low level of deforestation and cattle breeding activities. The middle part of the river basin (La Sirena sector 1005 m.a.s.l- Cañaveralejo dam 988 m.a.s.l) is characterized by a displacement of the vegetation cover due to construction activities that is located in the protection area of the river basin. This area has been highly affected by charcoal mining activities, deforestation, cattle activities and uncontrolled urbanization activities. The low part of the river basin (Cañaveralejo dam 988 m.a.s.l – South channel discharge 955 m.a.s.l) is characterized by being completely urbanized with a shortage of green areas (DAGMA-Universidad del Valle, 2004). Water use. In the urban zone of Cali the only water use directly from the river is for gardening as irrigation for aesthetic purposes (DAGMA, Universidad del Valle, 2004). The river, in addition, is used as waste water receiver. In the urban section it gathers the discharges from drainage channels and water from nearby streams, which present a high degree of pollution. Water quality The Cañaveralejo River receives high domestic waste water volumes present in the storm water channels. It also presents changes in the hydraulic conditions of its river bed, which are reflected in the low slope (0,5%) and in the canalization of the river until its river mouth in the South Channel. These conditions make difficult the recovery of the river (DAGMA-Universidad del Valle, 2004). Around the urban periphery of Cali, the Dissolved Oxygen concentrations existing in the river limit the life of the aquatic species (UNESCO, 1996), besides to inhibit their use for the agricultural preservation of the flora and fauna, recreation, activities and for human consumption, as it is established in Decree 1594 of 1984 (DAGMA-Universidad del Valle, 2004).
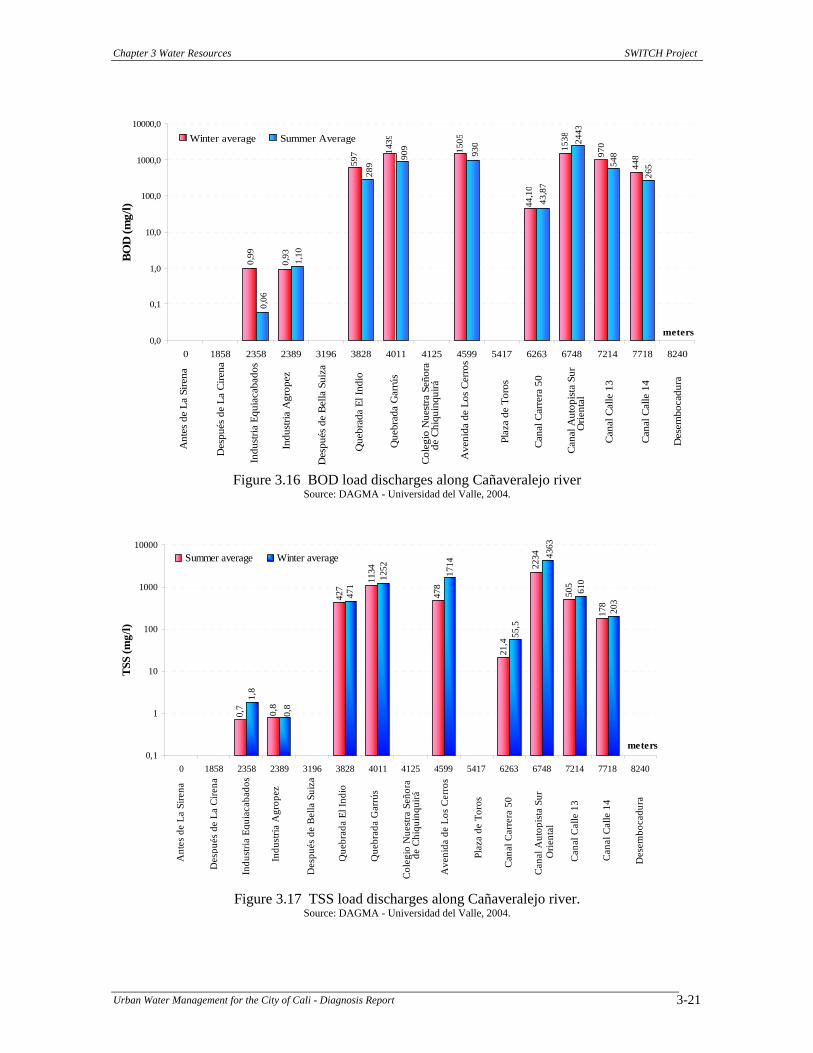
Along its course the river receives high polluting discharges from tributary rivers and adjacent towns so that when the river discharges to the South channel the DO oscillates around 1.0 mg/l in both summer and winter season Figure 3.16, Figure 3.17, and Figure 3.18 show the BOD and TSS discharges measured in different monitoring points and their direct relation to DO, respectively.
Chapter 3 Water Resources SWITCH Project
Urban Water Management for the City of Cali - Diagnosis Report 3-21
970
448
1538
44,1
0
1505
1439
597
0,93
0,9 9
548
265
244 3
43,8
7
930
909
289
1,10
0,06
0,0
0,1
1,0
10,0
100,0
1000,0
10000,0
0 1858 2358 2389 3196 3828 4011 4125 4599 5417 6263 6748 7214 7718 8240
meters
BOD
(mg/
l) Winter average Summer Average
Indu
stria
Equ
iaca
bado
s
Indu
stria
Agr
opez
Que
brad
a El
Indi
o
Que
brad
a G
arrú
s
Ave
nida
de
Los
Cer
ros
Can
al C
arre
ra 5
0
Can
al A
utop
ista
Sur
Can
al C
alle
13
Can
al C
alle
14
Ant
es d
e La
Sire
na
Des
pués
de
La C
irena
Des
pués
de
Bel
la S
uiza
Col
egio
Nue
stra
Señ
ora
Des
embo
cadu
ra
Plaz
a de
Tor
os
Orie
ntal
de C
hiqu
inqu
irá
Figure 3.16 BOD load discharges along Cañaveralejo river
Source: DAGMA - Universidad del Valle, 2004.
0,7 0,8
427
1134
478
21,4
2234
505
178
1,8
0,8
471
1252 1714
55,5
4363
610
203
0,1
1
10
100
1000
10000
0 1858 2358 2389 3196 3828 4011 4125 4599 5417 6263 6748 7214 7718 8240
meters
TSS
(mg/
l)
Summer average Winter average
Indu
stria
Equ
iaca
bado
s
Indu
stria
Agr
opez
Que
brad
a El
Indi
o
Que
brad
a G
arrú
s
Ave
nida
de
Los
Cer
ros
Can
al C
arre
ra 5
0
Can
al A
uto p
ista
Sur
Can
al C
alle
13
Can
al C
alle
14
Ant
es d
e La
Sire
na
Des
pués
de
La C
irena
Des
pués
de
Bel
la S
uiza
Col
egio
Nue
stra
Señ
ora
Des
embo
cadu
ra
Plaz
a de
Tor
os
de C
hiqu
inqu
irá
Orie
ntal
Figure 3.17 TSS load discharges along Cañaveralejo river.
Source: DAGMA - Universidad del Valle, 2004.
Chapter 3 Water Resources SWITCH Project
Urban Water Management for the City of Cali - Diagnosis Report 3-22
0
1
2
3
4
5
6
7
8
0 1000 2000 3000 4000 5000 6000 7000 8000 9000 meters
DO
(mg/
l)Winter average Summer average
Col
egio
Nue
stra
Señ
ora
Indu
stria
Equ
iaca
bado
s
Que
brad
a El
Indi
o
Ant
es d
e La
Sire
na
Des
pués
de
La C
irena
Des
pués
de
Bel
la S
uiza
Des
embo
cadu
ra
Indu
stria
Agr
opez
Que
brad
a G
arrú
s
Ave
nida
de
Los
Cer
ros
Can
al C
arre
ra 5
0
Can
al A
utop
ista
Sur
Can
al C
alle
13
Can
al C
alle
14
Plaz
a de
Tor
os
de C
hiqu
inqu
irá
Orie
ntal
Figure 3.18 Dissolved oxygen in the Cañaveralejo river as result of polluting BOD and TSS
discharges. Source: DAGMA - Universidad del Valle, 2004.
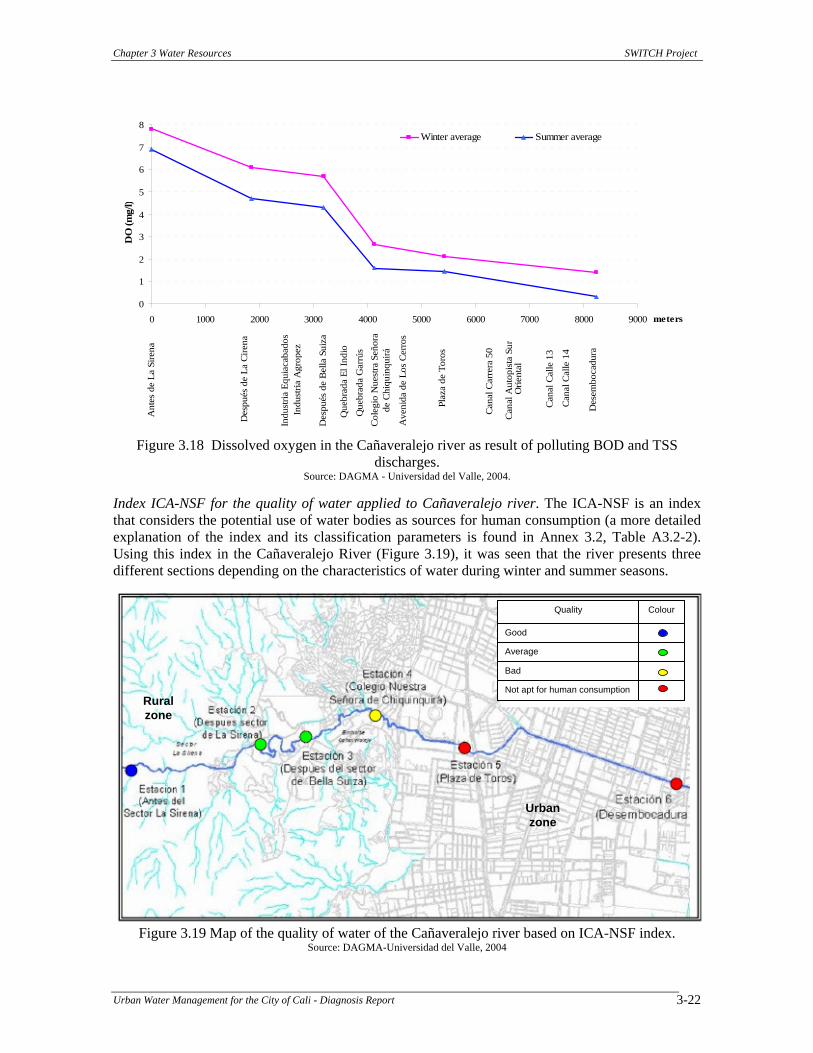
Index ICA-NSF for the quality of water applied to Cañaveralejo river. The ICA-NSF is an index that considers the potential use of water bodies as sources for human consumption (a more detailed explanation of the index and its classification parameters is found in Annex 3.2, Table A3.2-2). Using this index in the Cañaveralejo River (Figure 3.19), it was seen that the river presents three different sections depending on the characteristics of water during winter and summer seasons.
Figure 3.19 Map of the quality of water of the Cañaveralejo river based on ICA-NSF index.
Source: DAGMA-Universidad del Valle, 2004
Not apt for human consumption
Bad
Average
Good
ColourQuality
Not apt for human consumption
Bad
Average
Good
ColourQuality
Urban zone
Rural zone
Chapter 3 Water Resources SWITCH Project
Urban Water Management for the City of Cali - Diagnosis Report 3-23
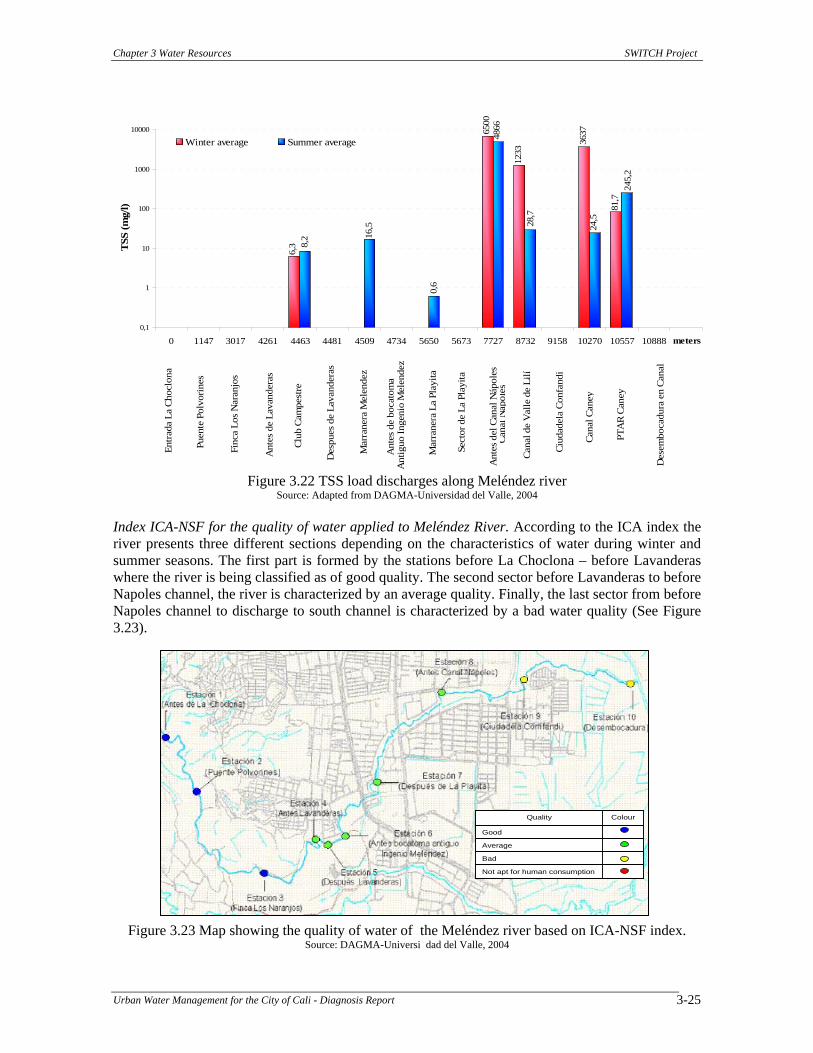
The first part (before La Sirena – after Bella Suiza) the river is classified as of good quality to end up as of average quality. The second sector (after Bella Suiza to Colegio Nuestra Señora del Chiquinquirá), the river is characterized by an average quality ending up as of bad quality. Finally, the last sector from Colegio Nuestra Señora del Chiquinquirá to Desembocadura (discharge to south channel) is characterized by the high decline in quality so that is not considered as for human consumption (DAGMA - Universidad del Valle, 2004). 3.3.3 Meléndez River The Meléndez river is born in the Western Mountain range at a level of 2800 meters above sea level inside the Natural National Park the Farallones of Cali. It has an approximated length of 25 km and it is located between the river basins of the rivers Cañaveralejo and Líli. The river basin has an estimated area of 3832 ha. Water use. The river supplies water to the drinking water system “La Reforma” which provides water by gravity to the zones in the slope of the mountain. Also, the river has been used like irrigation and recreation source. In addition, it is part of the relevant landscaping component of the city (DAGMA - Universidad del Valle, 2004). Land use. The main land uses in the river basin of Meléndez river are described in Table 3.6.
Table 3.6 Land uses in Meléndez river basin, year 2000 Use Area (ha) %
Natural virgin forests 2325,6 63,3 Cultivated forest 28,8 0,8 Mining 20,4 0,6 Natural grass 894,4 24,4 Rastrojo (type of grass) 264,4 7,2 Infrastructure 63,2 1,7 Suburban area 29,6 0,8 Urban area 46,2 1,3 Total 3672,7 100
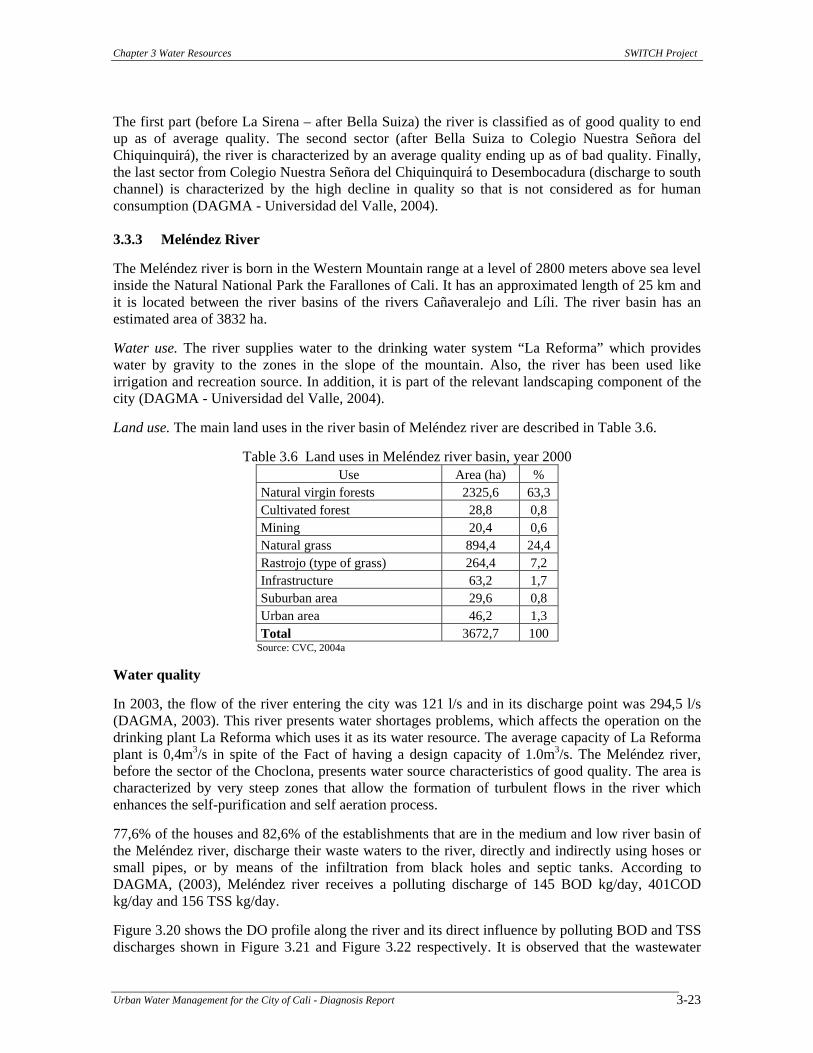
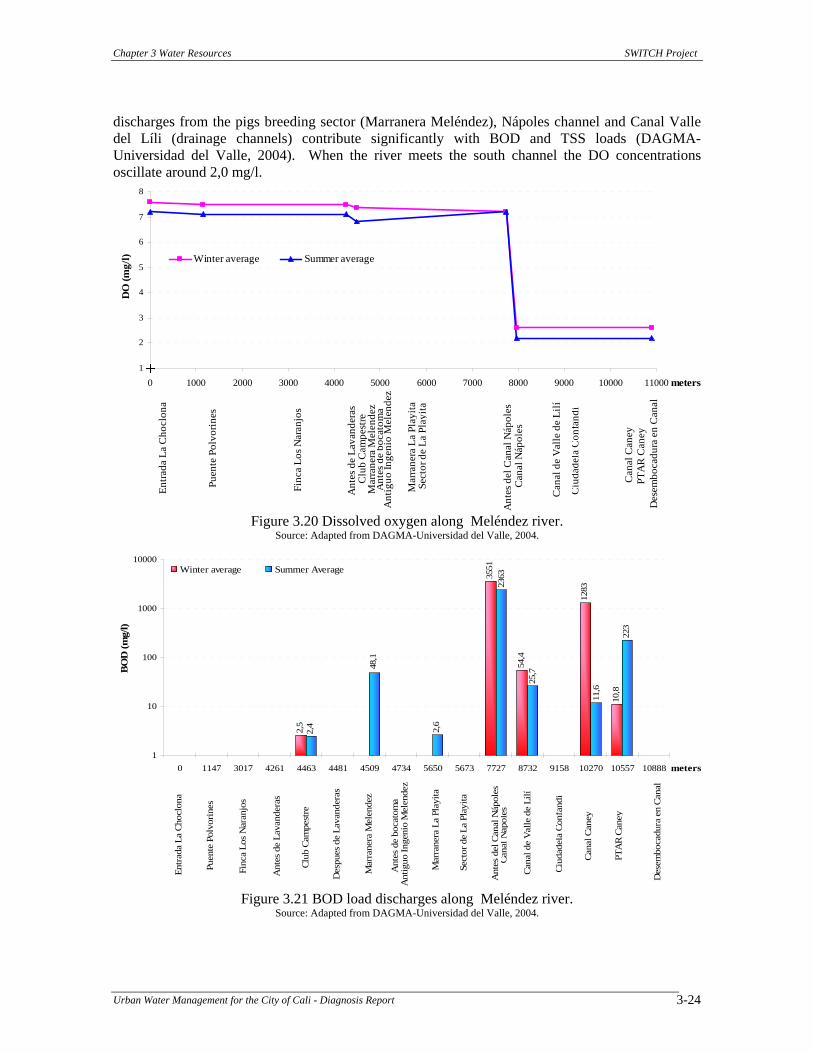
Source: CVC, 2004a Water quality In 2003, the flow of the river entering the city was 121 l/s and in its discharge point was 294,5 l/s (DAGMA, 2003). This river presents water shortages problems, which affects the operation on the drinking plant La Reforma which uses it as its water resource. The average capacity of La Reforma plant is 0,4m3/s in spite of the Fact of having a design capacity of 1.0m3/s. The Meléndez river, before the sector of the Choclona, presents water source characteristics of good quality. The area is characterized by very steep zones that allow the formation of turbulent flows in the river which enhances the self-purification and self aeration process. 77,6% of the houses and 82,6% of the establishments that are in the medium and low river basin of the Meléndez river, discharge their waste waters to the river, directly and indirectly using hoses or small pipes, or by means of the infiltration from black holes and septic tanks. According to DAGMA, (2003), Meléndez river receives a polluting discharge of 145 BOD kg/day, 401COD kg/day and 156 TSS kg/day. Figure 3.20 shows the DO profile along the river and its direct influence by polluting BOD and TSS discharges shown in Figure 3.21 and Figure 3.22 respectively. It is observed that the wastewater
Chapter 3 Water Resources SWITCH Project
Urban Water Management for the City of Cali - Diagnosis Report 3-24
discharges from the pigs breeding sector (Marranera Meléndez), Nápoles channel and Canal Valle del Líli (drainage channels) contribute significantly with BOD and TSS loads (DAGMA-Universidad del Valle, 2004). When the river meets the south channel the DO concentrations oscillate around 2,0 mg/l.
1
2
3
4
5
6
7
8
0 1000 2000 3000 4000 5000 6000 7000 8000 9000 10000 11000 meters
DO
(mg/
l) Winter average Summer average
Ant
es d
e bo
cato
ma
Entra
da L
a C
hocl
ona
Puen
te P
olvo
rines
Finc
a Lo
s Nar
anjo
s
Ant
es d
e La
vand
eras
Clu
b C
ampe
stre
M
arra
nera
Mel
ende
z
Mar
rane
ra L
a P l
ayita
Sect
or d
e La
Pla
yita
Ant
es d
el C
anal
Náp
oles
Can
al N
ápol
es
Can
al d
e V
alle
de
Lilí
Ciu
dade
la C
onfa
ndi
Can
al C
aney
PTA
R C
aney
Des
embo
cadu
ra e
n C
anal
Ant
iguo
Inge
nio
Mel
ende
z
Figure 3.20 Dissolved oxygen along Meléndez river.
Source: Adapted from DAGMA-Universidad del Valle, 2004.
2,5
54,4
10,8
2,4 2,6
223
3551
128323
63
48,1
25,7
11,6
1
10
100
1000
10000
0 1147 3017 4261 4463 4481 4509 4734 5650 5673 7727 8732 9158 10270 10557 10888 meters
BO
D (m
g/l)
Winter average Summer Average
Ant
es d
e La
vand
eras
Ant
es d
e bo
cato
ma
Entra
da L
a Ch
oclo
na
Des
pues
de
Lava
nder
as
Puen
te P
olvo
rines
Finc
a Lo
s Nar
anjo
s
Club
Cam
pest
re
Mar
rane
ra M
elen
dez
Mar
rane
ra L
a P l
ayita
Sect
or d
e La
Pla
yita
Ant
es d
el C
anal
Náp
oles
Cana
l Náp
oles
Cana
l de
Val
le d
e Li
lí
Ciud
adel
a Co
nfan
di
Cana
l Can
ey
PTA
R Ca
ney
Des
embo
cadu
ra e
n Ca
nal
Ant
iguo
Inge
nio
Mel
ende
z
Figure 3.21 BOD load discharges along Meléndez river.
Source: Adapted from DAGMA-Universidad del Valle, 2004.
Chapter 3 Water Resources SWITCH Project
Urban Water Management for the City of Cali - Diagnosis Report 3-25
3637
24,5
6500
81,7
1233
6,3
4866
245,
2
28,7
0,6
16,5
8,2
0,1
1
10
100
1000
10000
0 1147 3017 4261 4463 4481 4509 4734 5650 5673 7727 8732 9158 10270 10557 10888 meters
TSS
(mg/
l)
Winter average Summer average
Ant
es d
e La
vand
eras
Ant
es d
e bo
cato
ma
Entra
da L
a Ch
oclo
na
Des
pues
de
Lava
nder
as
Puen
te P
olvo
rines
Finc
a Lo
s Nar
anjo
s
Club
Cam
pest
re
Mar
rane
ra M
elen
dez
Mar
rane
ra L
a Pl
ayita
Sect
or d
e La
Pla
yita
Ant
es d
el C
anal
Náp
oles
Cana
l Náp
oles
Cana
l de
Val
le d
e Li
lí
Ciud
adel
a Co
nfan
di
Cana
l Can
ey
PTA
R Ca
ney
Des
embo
cadu
ra e
n Ca
nal
Ant
iguo
Inge
nio
Mel
ende
z
Figure 3.22 TSS load discharges along Meléndez river
Source: Adapted from DAGMA-Universidad del Valle, 2004 Index ICA-NSF for the quality of water applied to Meléndez River. According to the ICA index the river presents three different sections depending on the characteristics of water during winter and summer seasons. The first part is formed by the stations before La Choclona – before Lavanderas where the river is being classified as of good quality. The second sector before Lavanderas to before Napoles channel, the river is characterized by an average quality. Finally, the last sector from before Napoles channel to discharge to south channel is characterized by a bad water quality (See Figure 3.23).
Figure 3.23 Map showing the quality of water of the Meléndez river based on ICA-NSF index. Source: DAGMA-Universi dad del Valle, 2004
Not apt for human consumption
Bad
Average
Good
ColourQuality
Not apt for human consumption
Bad
Average
Good
ColourQuality
Chapter 3 Water Resources SWITCH Project
Urban Water Management for the City of Cali - Diagnosis Report 3-26
3.3.4 Líli River
It has a length of 15 km and a river basin of 1667 ha of extension. Its natural course was altered and deviated to the South channel, where its condition of river disappears to be replaced by a wastewater / storm water channel. Land use. The majority of Líli river basin (34%) consists of natural grass out of which 30% is located between the urban and sub-urban area. The basin is influenced by mining activities and sugar cane crops located around the area (CVC, 2004b). Table 3.7 shows the land uses in the river basin.
Table 3.7 Land uses in Líli river basin, year 2000 Land use Area (ha) %
Forests 466,5 19 Sugar cane crops 84,3 3 Infrastructure 70,4 3 Natural grass 864,3 34 Mining 92,4 4 Rastrojos (type of grass) 177,9 7 Suburban area 48,6 2 Urban area 702,6 28 Total 2506,9 100
Source: CVC, 2004b Water use. It is used for human consumption before the city. The highest consumption is by the town La Buitrera. It is also used for the sugar cane crops as irrigation and for the feeding of cattle (DAGMA, 1997). Water Quality According to DAGMA (2003), the Líli river present an average flow of 597 l/s in its discharge point to the south channel. The Líli river basin has been divided in three parts: high, medium and low. Next, the characteristics of each one of them are described (DAGMA, 1997): In its highest part where the river is born there are affected sectors in the river by the mining
operation. Severe erosion is detected by the presence of 11 coalmines. In the medium part the river undergoes polluting effects by the disposal of rubbish dragged and
deposited during the crescents and by the wastewaters generated in the houses bordering the river basin. Nevertheless, the factor of greater incidence in the deterioration of its waters constitutes the original discharges from the mines that present a pH acid.
The low part of the river basin until the South Channel is affected by slums that produce wastewater discharges and pollution. In this sector the river is transformed into a channel without any possibility of vegetation that can provide support and feeding to the aquatic organisms.
Biological diversity index (IDB) and the quality index (ICA) for the quality of water applied to Líli River. For the evaluation of the quality of the Líli river the IDB and ICA-NSF were used. A more detailed description of the index is found in Annex 3.2. In its course the river presented a IDB value of 1,7 which indicates that the water is average polluted whereas the ICA-NSF value was 52 which indicates a medium water quality. In the discharge point to the south channel, the IDB was 0,1 and ICA-NSF was 48, classifying the water as very polluted and of bad quality (DAPM, 2000)
Chapter 3 Water Resources SWITCH Project
Urban Water Management for the City of Cali - Diagnosis Report 3-27
3.3.5 Cali River The river basin is located in the Northwest part of the municipality. The river is born in the Western Mountain range in the National Park Natural The Farallones, approximately at the 4000 m level above sea level. The river basin has a surface of 12352 ha. The Cali River crosses the city of Cali in the West east sense crossing 16 km (DAGMA - Universidad del Valle, 2007). Land use. Around 69% of the total river basin area consists of natural forests which are reflected in the fact that more than 50% of the area is located inside the National Natural Park The Farallones (CVC, 2004c). Table 3.8 shows the land uses in Cali’s river basin.
Table 3.8 Land uses in Cali river basin, year 2000 Use Area (ha) %
Natural forest 8175,2 68,6 Cultivated forest 52 0,4 Permanent crops* 184,6 1,5 Transitory crops** 234,1 2 Green grass 1980 16,6 Infrastructure 103,9 0,9 Rastrojos 744 6,2 Moor vegetation 141,6 1,2 Sub-urban area 3,5 0,03 Urban area 301,4 2,5 Total 11920 100 *coffee, plantain ** vegetables and corn Source: CVC, 2004c.
Water use. The waters of the river are used mainly for the water supply of the city of Cali, by means of the drinking Plant Cali River, whose maximum capacity of production is 2,5 m3/s. At the moment the water intake is done from the bottom of the plant with an average volume of 1,8 m3/s (CVC, 2004c). Additionally, the Cali river is used for energy generation (Cidral-EPSA Plant), animal consumption (zoo of Cali), landscaping and like receiver of liquid and solid waste discharges (DAGMA, Universidad del Valle, 2007). In the last years, the shores of the river had been recovered and marginal collectors have been constructed to avoid the pollution of the source and to deviate waste waters towards the treatment plant before being discharged to the Cauca River (CVC- Universidad del Valle, 2004). Water Quality In 2003, the flow of the river entering the city was 3900 l/s (winter season) and in its discharge point to Cauca river was 6700 l/s (DAGMA, 2003). During summer time the flow can decrease to around 10 l/s (DAGMA, 1997). The parameters of BOD and COD quality in winter and summer, showed an increasing trend throughout the route of the river due to the wastewater discharges from the domestic areas in the urban zone of Cali. In the last section of the river until its discharge to Cauca river the concentrations are increased by the discharges of the industrial sector from the municipality of Yumbo), the Collector Margen Izquierdo (domestic wastewater from Cali). Around Cali river basin, activities of deforestation, erosion are present mainly in the high part of the river basin. Such has contributed to a decrease in the natural section of the river, changes in the natural river course which added to the lack of maintenance of the drainage structure in the city and accumulation of sediments in the drainage networks has caused overflow of the river. A direct
Chapter 3 Water Resources SWITCH Project
Urban Water Management for the City of Cali - Diagnosis Report 3-28
critical consequence has been the increase in flood events along the river basin of Cali river. (Delgado et al., 2005).
In summer, it is observed that after the Intercontinental Hotel discharge the DO diminishes reaching lower values up to 1 mgO2/l. The high polluting loads discharged to the river mainly in their last section, generate anoxic conditions producing anaerobic reactions that trigger bad odors. Before its discharge to the Cauca river, the Cali river (in dry periods) does not fulfill the minimum level of DO (4 mgO2/l) established in Decree 1594 of 1984 for the destination of the water body to the conservation of flora and fauna
The loads of BOD and COD present little variation with respect to the climatic condition. On the contrary, the TSS load is greater in winter than in summer, which would be associated to the storm water contribution that produces the dragging of particulate material. According to the monitoring campaign made in August of 2006 during summer, the highest contribution of load in terms of BOD and TSS was the collector Margen Izquierdo (urban wastewater from Cali) which presented values of 15759,4 kg/day and 14025,4 kg/day, respectively.
The high discharge from this collector is directly related to its great tributary area of 1109,55 ha, corresponding to its own area of 965,62 ha and to the one of the Collector Margen derecha of 143,93 ha. Other important discharges in terms of load to the river are the industrial wastewater from the municipality of Yumbo, the Aguacatal river, the different domestic waste water discharges along the river (DAGMA-Universidad del Valle, 2007).
Index ICA-NSF for the quality of water applied to Cali River. The ICA-NSF presented medium quality when the river enters the urban area, possibly caused by the wastewater discharges of the settlements located in the high part of the river bank. After that, the quality of the water along the urban area is of bad quality.
During the summer conditions, in the river mouth, the water reaches a very poor quality classification, indicating the effect caused by slums areas located around its margins and the industrial wastewater discharges from the industries in Yumbo municipality located 800 m upstream the final discharge of Cali river to Cauca river (CVC - Universidad del Valle, 2004) (See Figure 3.24, in which the blue color means good quality, green average quality, yellow bad quality and red is not apt for human consumption). 3.3.6 Aguacatal River During its course it receives the contribution of several water streams, wastewater discharges from nearby quarries, coalmines and most of the waste waters of the nearby municipalities. The Aguacatal River after crossing the urban area of Cali for approximately 6 km meets the Cali River. The Aguacatal river basin has an approximate area of 6179 ha.
Land uses. The high part of the river basin (Alto Aguacatal –La Playita Sector) is characterized by farm dwellings with pigs breeding fed by the river water. In the Playita sector there are located to the right margin dwellings under high risk of landslide.
The middle part of the river basin (La Playita Sector– El Choclo creek’s mouth) is characterized by an area of forests which is protected but that is under risk of extinction due to the high level on uncontrolled urbanization to the right margin of the river. The vegetation green layer is poor with presence only of rastrojo (type of grass) at the banks of the river. The low part of the river basin (El choclo creek’s mouth –Aguacatal river mouth) is characterized by a forest protected zone at both sides of the river bank and presence of buildings for residential use. The land uses were described according to (DAGMA, 1997).
Chapter 3 Water Resources SWITCH Project
Urban Water Management for the City of Cali - Diagnosis Report 3-29
Figure 3.24 Map showing the quality of water of the Cali river based on ICA-NSF index.
Source: DAGMA-Universidad del Valle, 2007 Water use. In the Cali urban zone, the Aguacatal river is used for clothes washing, for aesthetic and landscape aims (lake of the club "the Shore"), for extraction of construction material (rocks) and as wastewater disposal and solid waste. Water quality According to DAGMA, Universidad del Valle (2007) the Aguacatal river basin has the lowest flow of all seven river basins with an average flow of 0,59 m3/s. The river in the urban zone, presents also slums that generate as much deterioration in the slope as in the water quality, due to the wastewater discharges (DAPM. 2000 mentioned by EMCALI, 2007a). According to the monitoring campaign made in August of 2006 during summer, the highest contribution of load in terms of BOD and TSS was the Chocho river, which presented values of 83.95 kg/day and 772.9 kg/day, respectively (DAGMA-Universidad del Valle, 2007). Index ICA-NSF for the quality of water applied to Aguacatal River. The ICA-NSF index showed that when the river enters the urban area is of medium quality, possibly caused by the wastewater discharges of the settlements located in the high part of the river bank. Following, the water finally reaches “bad quality” in its discharge point to Cali River (DAGMA - Universidad del Valle, 2007) (see Figure 3.25, in which the blue color means good quality, green average quality, yellow bad quality and red is not apt for human consumption).
Chapter 3 Water Resources SWITCH Project
Urban Water Management for the City of Cali - Diagnosis Report 3-30
Figure 3.25 Map showing the quality of water of Aguacatal river based on ICA-NSF index.
Source: DAGMA - Universidad del Valle, 2007
3.3.7 Pance River The river basin is located in the South-west mountainous area of Cali with an area of 8975 ha. It is born in the Pance mountain, at level of the national natural park The Farallones at 4200 m above sea level. It crosses the municipalities of Pance and la Voragine and finally discharges in Jamundí river (EMCALI, 2007a).
Land use. The high part of the river basin (the river source- La Vorágine sector) is characterized by agriculture crops. There is land dedicated the extensive cattle breeding. At small scale there are also corn, beans, coffee and plantain crops. The middle part of the river basin (La Vorágine sector – Soccer Club Deportivo Cali) is characterized by the biggest concentration of agriculture activities and commercial activities focused on tourism. Around the populated areas there are fish and forest activities. The low part of the river basin (Club del Deportivo Cali–river mouth) is characterized by construction of lots and educational centers. There is also extensive cattle breeding activities. This are corresponds to the expansion urban area of the city of Cali (DMP, 2004). Water use. Pance river is the last natural source for recreational purposes of the inhabitants of the municipality of Cali. Hence, its social function is extremely important.
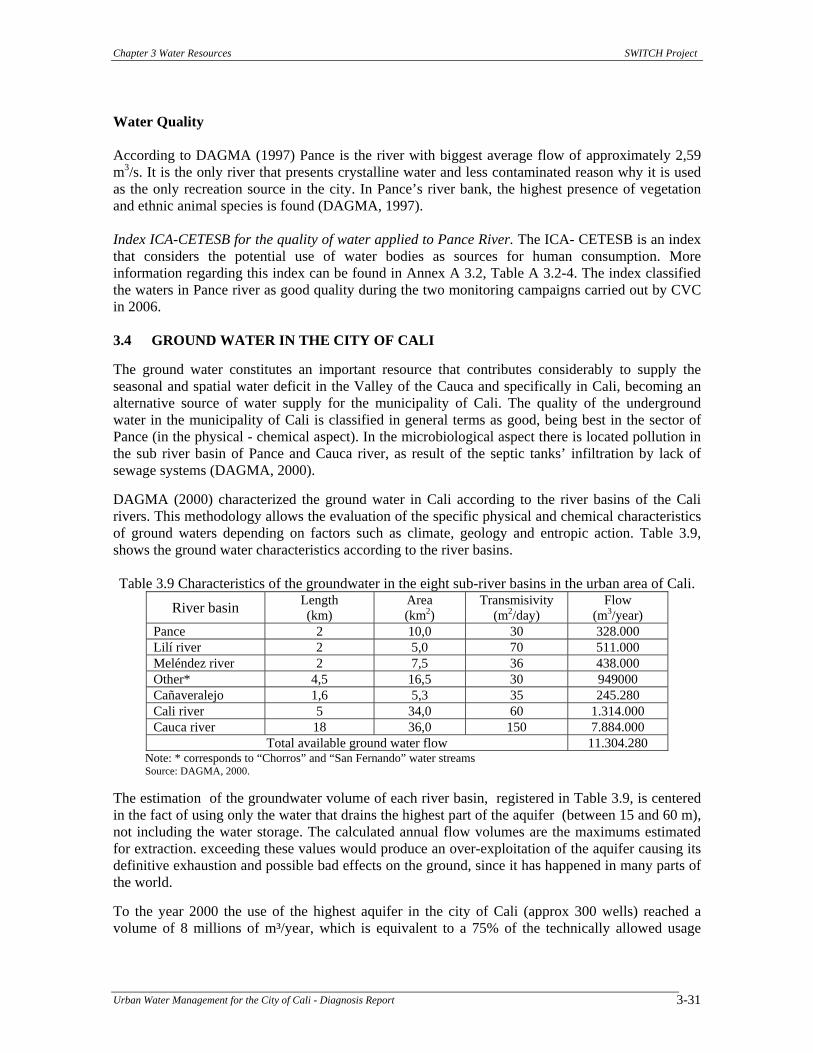
Chapter 3 Water Resources SWITCH Project
Urban Water Management for the City of Cali - Diagnosis Report 3-31
Water Quality According to DAGMA (1997) Pance is the river with biggest average flow of approximately 2,59 m3/s. It is the only river that presents crystalline water and less contaminated reason why it is used as the only recreation source in the city. In Pance’s river bank, the highest presence of vegetation and ethnic animal species is found (DAGMA, 1997). Index ICA-CETESB for the quality of water applied to Pance River. The ICA- CETESB is an index that considers the potential use of water bodies as sources for human consumption. More information regarding this index can be found in Annex A 3.2, Table A 3.2-4. The index classified the waters in Pance river as good quality during the two monitoring campaigns carried out by CVC in 2006. 3.4 GROUND WATER IN THE CITY OF CALI The ground water constitutes an important resource that contributes considerably to supply the seasonal and spatial water deficit in the Valley of the Cauca and specifically in Cali, becoming an alternative source of water supply for the municipality of Cali. The quality of the underground water in the municipality of Cali is classified in general terms as good, being best in the sector of Pance (in the physical - chemical aspect). In the microbiological aspect there is located pollution in the sub river basin of Pance and Cauca river, as result of the septic tanks’ infiltration by lack of sewage systems (DAGMA, 2000). DAGMA (2000) characterized the ground water in Cali according to the river basins of the Cali rivers. This methodology allows the evaluation of the specific physical and chemical characteristics of ground waters depending on factors such as climate, geology and entropic action. Table 3.9, shows the ground water characteristics according to the river basins. Table 3.9 Characteristics of the groundwater in the eight sub-river basins in the urban area of Cali.
River basin Length (km)
Area (km2)
Transmisivity (m2/day)
Flow (m3/year)
Pance 2 10,0 30 328.000 Lilí river 2 5,0 70 511.000 Meléndez river 2 7,5 36 438.000 Other* 4,5 16,5 30 949000 Cañaveralejo 1,6 5,3 35 245.280 Cali river 5 34,0 60 1.314.000 Cauca river 18 36,0 150 7.884.000
Total available ground water flow 11.304.280 Note: * corresponds to “Chorros” and “San Fernando” water streams Source: DAGMA, 2000.
The estimation of the groundwater volume of each river basin, registered in Table 3.9, is centered in the fact of using only the water that drains the highest part of the aquifer (between 15 and 60 m), not including the water storage. The calculated annual flow volumes are the maximums estimated for extraction. exceeding these values would produce an over-exploitation of the aquifer causing its definitive exhaustion and possible bad effects on the ground, since it has happened in many parts of the world. To the year 2000 the use of the highest aquifer in the city of Cali (approx 300 wells) reached a volume of 8 millions of m³/year, which is equivalent to a 75% of the technically allowed usage
Chapter 3 Water Resources SWITCH Project
Urban Water Management for the City of Cali - Diagnosis Report 3-32
volume without interfering with the water storage. This means that still it can be counted on an additional volume of 25% within the volumes technically available.
According to the group for underground water from DAGMA, at August 2007 there has been identified 475 underground wells in the city of Cali out of which 44 are used by the industry, 235 are used for car washing by the gas stations, 59 are used for irrigation, 9 are used for human consumption among other uses.
Chapter 3 Water Resources SWITCH Project
Urban Water Management for the City of Cali - Diagnosis Report 3-33
3.5 BIBLIOGRAPHY
Corporación Autónoma Regional del Valle del Cauca – CVC., Universidad del Valle. 2001. Aproximación al Plan de Muestreo de la Calidad del Agua del Río Cauca y sus Tributarios. Volumen IX. Proyecto de Modelación del Río Cauca - PMC Fase 1.
Corporación Autónoma Regional del Valle del Cauca – CVC., Universidad del Valle. 2004. Caracterización Río Cauca. Identificación de Parámetros Críticos en el Río Cauca y sus Principales Ríos Tributarios Tramo Salvajina – La Virginia. Volumen IX. Proyecto de Modelación del Río Cauca - PMC. Fase II.
Corporación Autónoma Regional del Valle del Cauca – CVC., Universidad del Valle. 2007a. Modelación de Escenarios para Definir los Planes de Control de Contaminación en la Cuenca del Río.
Corporación Autónoma Regional del Valle del Cauca – CVC., Universidad del Valle. 2007b. Evaluación de la Incidencia de la Operación del Embalse Salvajina en la Calidad del Agua del Río Cauca. Proyecto de Modelación del Río Cauca - PMC. Fase III.
Corporación Autónoma Regional del Valle del Cauca - CVC 2004a. Resolución No. 594 de 2004. “Por la cual se reglamenta en forma general el uso del agua del río Meléndez cuyas aguas discurren en jurisdicción del Municipio de Cali en el Departamento del Valle del Cauca”.
Corporación Autónoma Regional del Valle del Cauca - CVC 2004b. Resolución No. 592 de 2004. “Por la cual se reglamenta en forma general el uso del agua del río Líli cuyas aguas discurren en jurisdicción del Municipio de Cali en el Departamento del Valle del Cauca”.
Corporación Autónoma Regional del Valle del Cauca - CVC. 2004c. Resolución No. 596 de 2004. “Por la cual se reglamenta en forma general el uso del agua del río Cali cuyas aguas discurren en jurisdicción del Municipio de Cali en el Departamento del Valle del Cauca”.
Decreto 1594, 1984. Usos del Agua y Residuos Líquidos.
Delgado, A., Pulido, S. 2005. Modelación Hidrodinámica del Sistema de Drenaje Urbano de la Ciudad de Cali en el Área de Influencia del Río Cali.
Departamento Administrativo de Gestión del Medio Ambiente – DAGMA. 1997. Cali: La Ciudad de los Siete Ríos.
Departamento Administrativo de Gestión del Medio Ambiente – DAGMA. 2000. Estudio Cantidad y Calidad de Acuíferos en el Área Urbana de Santiago de Cali.
Departamento Administrativo de Gestión del Medio Ambiente - DAGMA. 2003. Unidad Básica de Monitoreo Ambiental “UBMA”. Diagnóstico Ambiental de la Calidad del Agua en los Río de Santiago de Cali.
Departamento Administrativo de Gestión del Medio Ambiente – DAGMA., Universidad del Valle. 2004. Identificación de Vertimientos Puntuales y Tomas de Agua en los Cauces de los Ríos Meléndez, Cañaveralejo y Quebradas Afluentes en el Perímetro Urbano del Municipio de Santiago de Cali.
Departamento Administrativo de Gestión del Medio Ambiente - DAGMA., Universidad del Valle. 2007. Identificación de la Situación Ambiental de la Cuenca Hidrográfica del Río Cali, Zona Urbana de Santiago de Cali.
Chapter 3 Water Resources SWITCH Project
Urban Water Management for the City of Cali - Diagnosis Report 3-34
Departamento Administrativo de Planeación Municipal - DAPM. 2000. Plan de Ordenamiento Territorial de la Ciudad de Santiago de Cali. Alcaldía Municipal, Cali.
Departamento Municipal de Planeación - DMP. 2004. Plan de Desarrollo Estratégico Corregimiento de Pance 2004-2008.
Empresas Municipales de Cali – EMCALI. 2007a. Plan de Saneamiento y Manejo de Vertimientos 2007-2016, Cali.
Empresas Municipales de Cali – EMCALI. 2007b. Operation reports provided directly by drinking plants of Puerto Mallarino and Rio Cauca.
Empresas Municipales de Cali - EMCALI. Universidad del Valle. 2006. Informe de Campaña de Monitoreo y Caracterización de los Vertimientos de la Ciudad de Cali y de la Calidad del Agua del Río Cauca en el Tramo Hormiguero – Mediacanoa.
Galvis A., Sabogal L.,Vélez C., Ramírez C. 2001. Caracterización de la Calidad del Agua del Río Cauca y sus Tributarios. Estrategias para el Uso Sostenible de los Recursos Hídricos.
Patiño, P., Holguín, J., Barba Ho, L., Cruz, C. Ramírez, C., Duque, A., Baena, L. 2005. Metodología para la Adaptación de un Índice de Calidad del Agua a las Condiciones Medioambientales del Río Cauca en Tramo Salvajina-La Virginia. Publicación en Seminario Internacional: Visión Integral en el Mejoramiento de la Calidad del Agua.
Vélez, C., Galvis, A. Ramírez, C., Baena, L. 2006. Cauca River Water Quality Model Hydroinformatics, Application in a Developing Country. 7th International Conference on Hydro-informatics HIC 2006, Nice, FRANCE.
Vélez, C., Galvis, A., Duque, A. and Restrepo, G. 2003. Mathematical Modelling in Cauca River Water Quality Study. Background and Perspectives. International Seminar Hydro-informatics in Integrated Water Resources Management.
Sustainable Water Improves Tomorrow’s Cities’ Health SWITCH Project
Urban Water Management for the City of Cali Diagnosis report
Study Case: Cali, Colombia
ANNEXES Cauca River: Water Quality
January, 2008
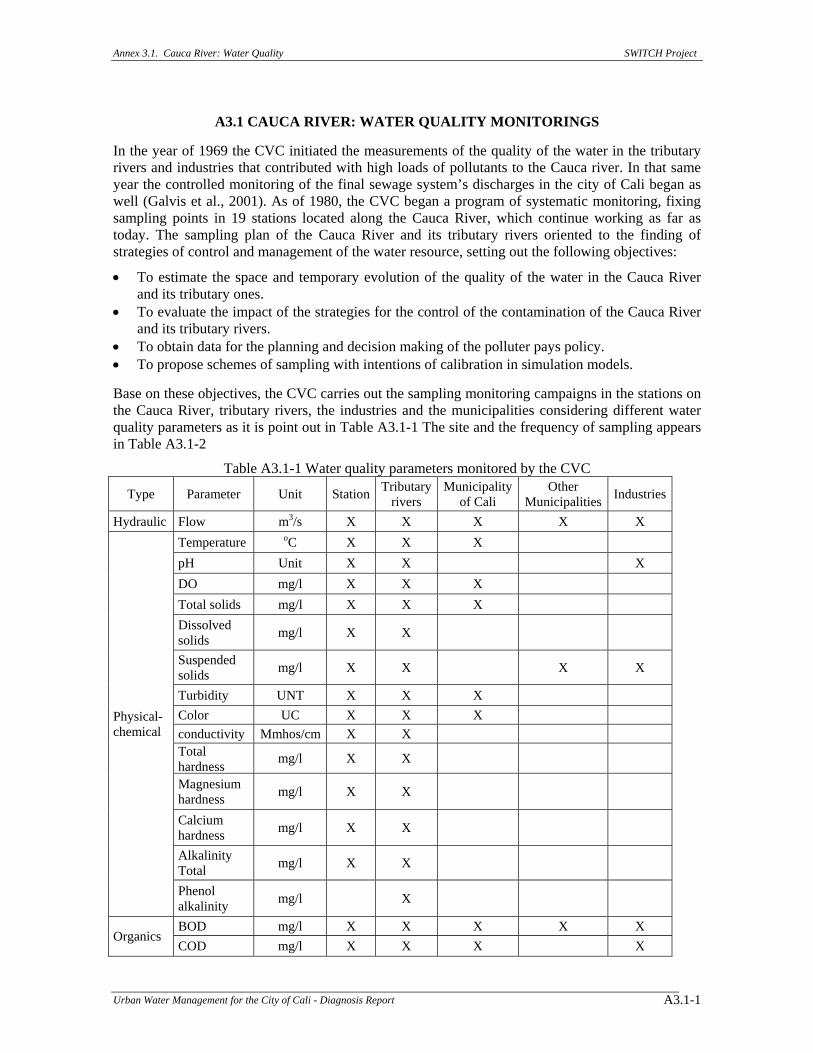
Annex 3.1. Cauca River: Water Quality SWITCH Project
Urban Water Management for the City of Cali - Diagnosis Report A3.1-1
A3.1 CAUCA RIVER: WATER QUALITY MONITORINGS In the year of 1969 the CVC initiated the measurements of the quality of the water in the tributary rivers and industries that contributed with high loads of pollutants to the Cauca river. In that same year the controlled monitoring of the final sewage system’s discharges in the city of Cali began as well (Galvis et al., 2001). As of 1980, the CVC began a program of systematic monitoring, fixing sampling points in 19 stations located along the Cauca River, which continue working as far as today. The sampling plan of the Cauca River and its tributary rivers oriented to the finding of strategies of control and management of the water resource, setting out the following objectives:
• To estimate the space and temporary evolution of the quality of the water in the Cauca River and its tributary ones.
• To evaluate the impact of the strategies for the control of the contamination of the Cauca River and its tributary rivers.
• To obtain data for the planning and decision making of the polluter pays policy. • To propose schemes of sampling with intentions of calibration in simulation models. Base on these objectives, the CVC carries out the sampling monitoring campaigns in the stations on the Cauca River, tributary rivers, the industries and the municipalities considering different water quality parameters as it is point out in Table A3.1-1 The site and the frequency of sampling appears in Table A3.1-2
Table A3.1-1 Water quality parameters monitored by the CVC
Type Parameter Unit Station Tributary rivers
Municipality of Cali
Other Municipalities Industries
Hydraulic Flow m3/s X X X X X Temperature oC X X X pH Unit X X X DO mg/l X X X Total solids mg/l X X X Dissolved solids mg/l X X
Suspended solids mg/l X X X X
Turbidity UNT X X X Color UC X X X conductivity Mmhos/cm X X Total hardness mg/l X X
Magnesium hardness mg/l X X
Calcium hardness mg/l X X
Alkalinity Total mg/l X X
Physical-chemical
Phenol alkalinity mg/l X
BOD mg/l X X X X X Organics
COD mg/l X X X X
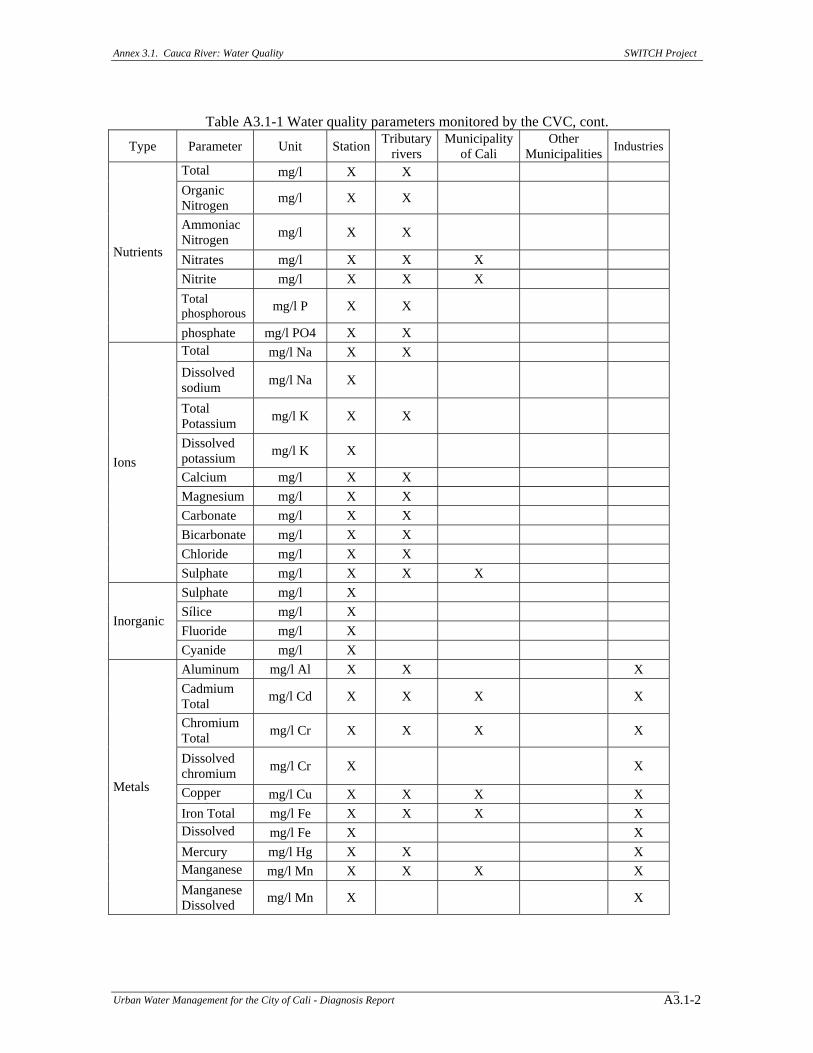
Annex 3.1. Cauca River: Water Quality SWITCH Project
Urban Water Management for the City of Cali - Diagnosis Report A3.1-2
Table A3.1-1 Water quality parameters monitored by the CVC, cont.
Type Parameter Unit Station Tributary rivers
Municipality of Cali
Other Municipalities Industries
Total i
mg/l X X Organic Nitrogen mg/l X X
Ammoniac Nitrogen mg/l X X
Nitrates mg/l X X X Nitrite mg/l X X X Total phosphorous mg/l P X X
Nutrients
phosphate mg/l PO4 X X Total
dimg/l Na X X
Dissolved sodium mg/l Na X
Total Potassium mg/l K X X
Dissolved potassium mg/l K X
Calcium mg/l X X Magnesium mg/l X X Carbonate mg/l X X Bicarbonate mg/l X X Chloride mg/l X X
Ions
Sulphate mg/l X X X Sulphate mg/l X Sílice mg/l X Fluoride mg/l X
Inorganic
Cyanide mg/l X Aluminum mg/l Al X X X Cadmium Total mg/l Cd X X X X
Chromium Total mg/l Cr X X X X
Dissolved chromium mg/l Cr X X
Copper l
mg/l Cu X X X X Iron Total mg/l Fe X X X X Dissolved i
mg/l Fe X X Mercury mg/l Hg X X X Manganese
lmg/l Mn X X X X
Metals
Manganese Dissolved mg/l Mn X X
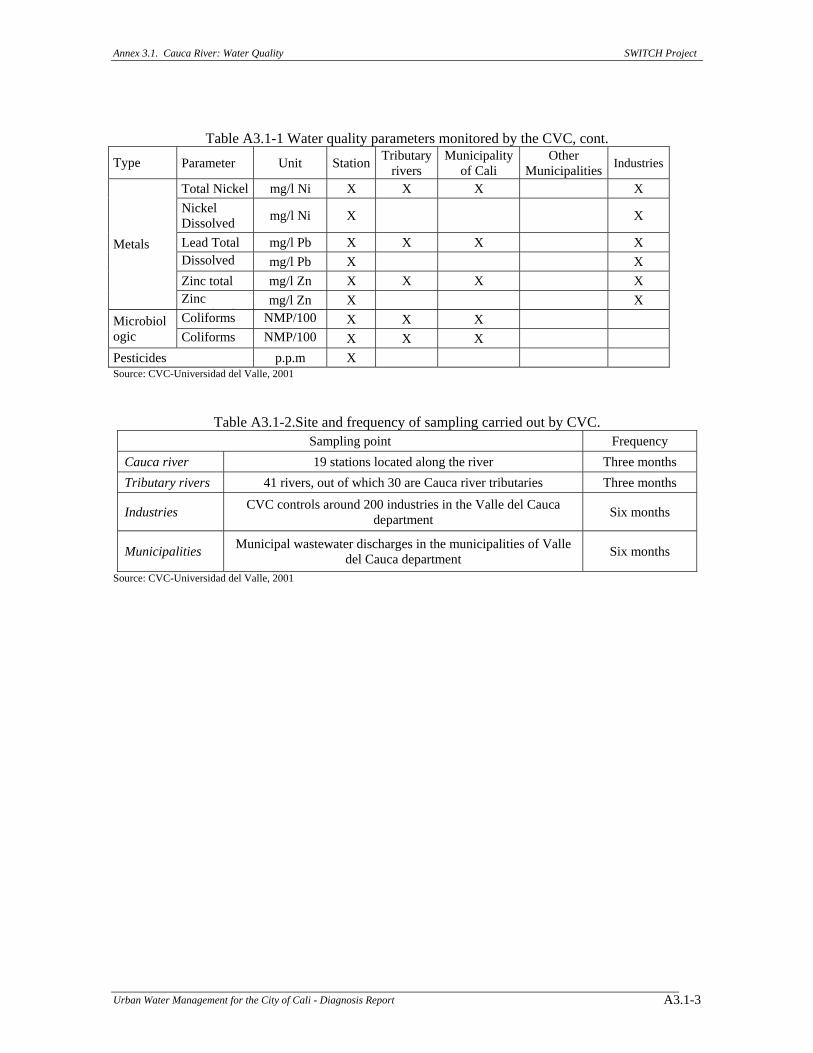
Annex 3.1. Cauca River: Water Quality SWITCH Project
Urban Water Management for the City of Cali - Diagnosis Report A3.1-3
Table A3.1-1 Water quality parameters monitored by the CVC, cont.
Type Parameter Unit Station Tributary rivers
Municipality of Cali
Other Municipalities Industries
Total Nickel mg/l Ni X X X X Nickel Dissolved mg/l Ni X X
Lead Total mg/l Pb X X X X Dissolved l d
mg/l Pb X X Zinc total mg/l Zn X X X X
Metals
Zinc i l d
mg/l Zn X X Coliforms
lNMP/100
lX X X Microbiol
ogic Coliforms l
NMP/100 l
X X X Pesticides p.p.m X Source: CVC-Universidad del Valle, 2001
Table A3.1-2.Site and frequency of sampling carried out by CVC. Sampling point Frequency
Cauca river 19 stations located along the river Three months Tributary rivers 41 rivers, out of which 30 are Cauca river tributaries Three months
Industries CVC controls around 200 industries in the Valle del Cauca department Six months
Municipalities Municipal wastewater discharges in the municipalities of Valle del Cauca department Six months
Source: CVC-Universidad del Valle, 2001
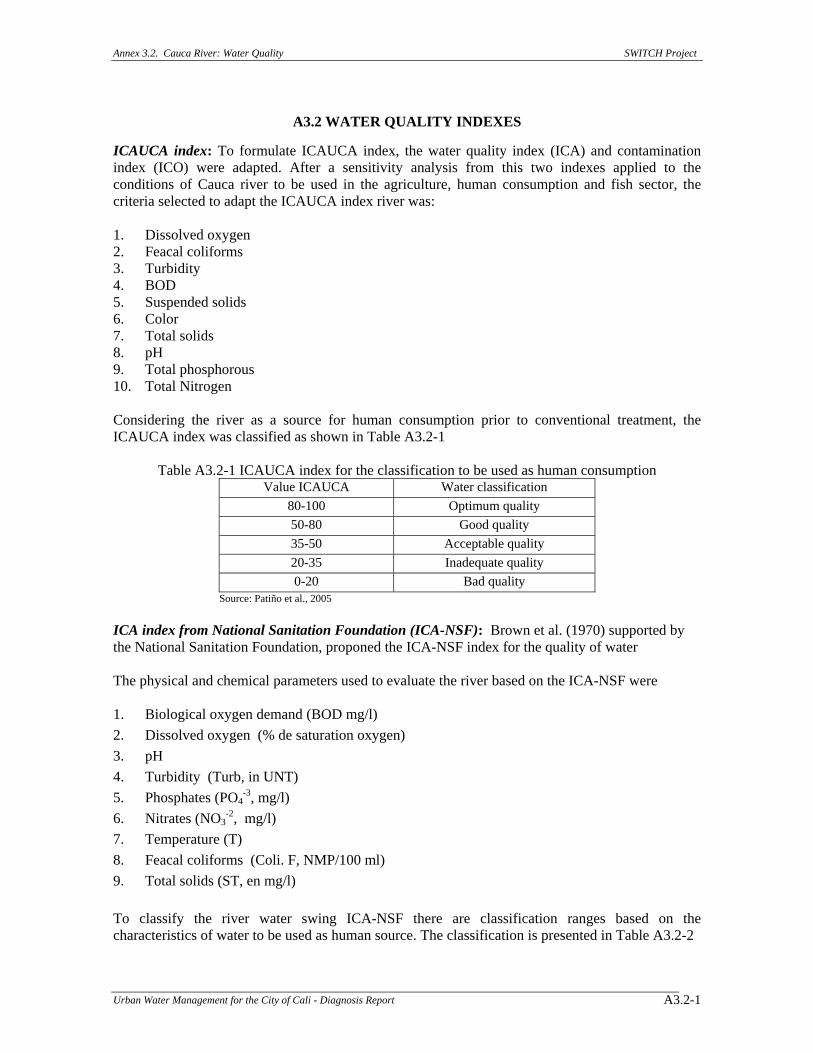
Annex 3.2. Cauca River: Water Quality SWITCH Project
Urban Water Management for the City of Cali - Diagnosis Report A3.2-1
A3.2 WATER QUALITY INDEXES
ICAUCA index: To formulate ICAUCA index, the water quality index (ICA) and contamination index (ICO) were adapted. After a sensitivity analysis from this two indexes applied to the conditions of Cauca river to be used in the agriculture, human consumption and fish sector, the criteria selected to adapt the ICAUCA index river was: 1. Dissolved oxygen 2. Feacal coliforms 3. Turbidity 4. BOD 5. Suspended solids 6. Color 7. Total solids 8. pH 9. Total phosphorous 10. Total Nitrogen Considering the river as a source for human consumption prior to conventional treatment, the ICAUCA index was classified as shown in Table A3.2-1
Table A3.2-1 ICAUCA index for the classification to be used as human consumption Value ICAUCA Water classification
80-100 Optimum quality 50-80 Good quality 35-50 Acceptable quality 20-35 Inadequate quality 0-20 Bad quality
Source: Patiño et al., 2005
ICA index from National Sanitation Foundation (ICA-NSF): Brown et al. (1970) supported by the National Sanitation Foundation, proponed the ICA-NSF index for the quality of water The physical and chemical parameters used to evaluate the river based on the ICA-NSF were 1. Biological oxygen demand (BOD mg/l) 2. Dissolved oxygen (% de saturation oxygen) 3. pH 4. Turbidity (Turb, in UNT) 5. Phosphates (PO4
-3, mg/l) 6. Nitrates (NO3
-2, mg/l) 7. Temperature (T) 8. Feacal coliforms (Coli. F, NMP/100 ml) 9. Total solids (ST, en mg/l) To classify the river water swing ICA-NSF there are classification ranges based on the characteristics of water to be used as human source. The classification is presented in Table A3.2-2
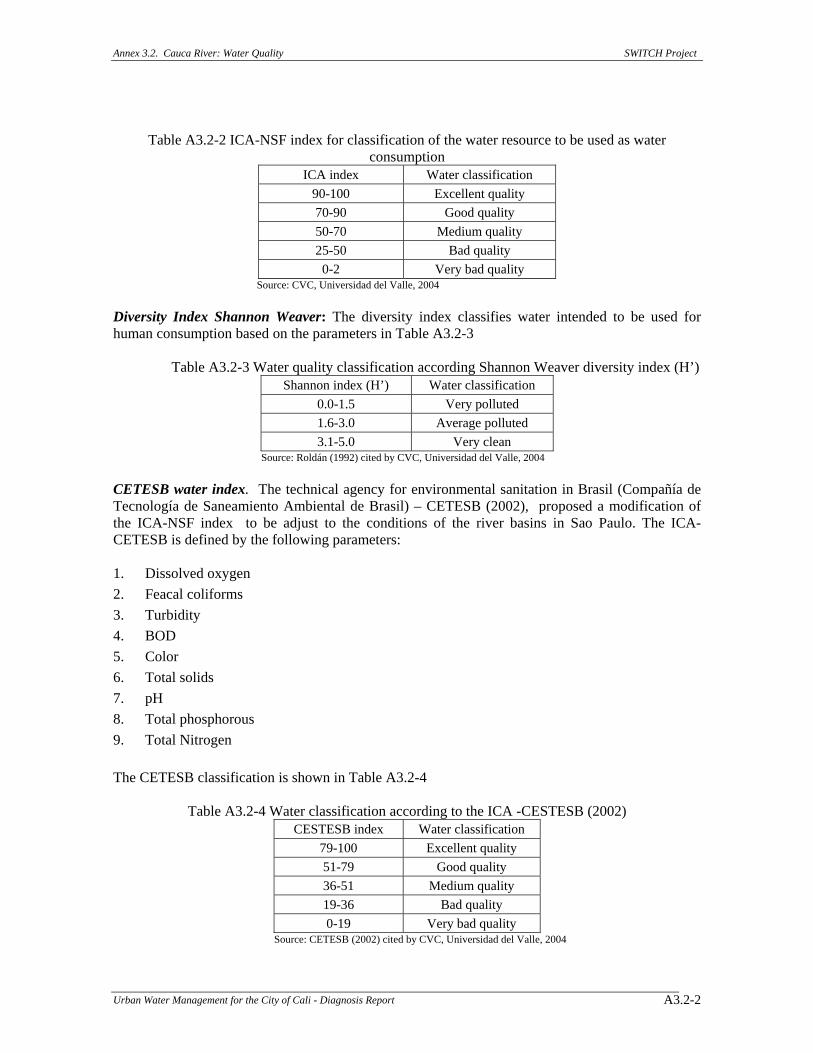
Annex 3.2. Cauca River: Water Quality SWITCH Project
Urban Water Management for the City of Cali - Diagnosis Report A3.2-2
Table A3.2-2 ICA-NSF index for classification of the water resource to be used as water
consumption ICA index Water classification
90-100 Excellent quality 70-90 Good quality 50-70 Medium quality 25-50 Bad quality 0-2 Very bad quality
Source: CVC, Universidad del Valle, 2004 Diversity Index Shannon Weaver: The diversity index classifies water intended to be used for human consumption based on the parameters in Table A3.2-3
Table A3.2-3 Water quality classification according Shannon Weaver diversity index (H’)
Shannon index (H’) Water classification 0.0-1.5 Very polluted 1.6-3.0 Average polluted 3.1-5.0 Very clean
Source: Roldán (1992) cited by CVC, Universidad del Valle, 2004 CETESB water index. The technical agency for environmental sanitation in Brasil (Compañía de Tecnología de Saneamiento Ambiental de Brasil) – CETESB (2002), proposed a modification of the ICA-NSF index to be adjust to the conditions of the river basins in Sao Paulo. The ICA-CETESB is defined by the following parameters: 1. Dissolved oxygen 2. Feacal coliforms 3. Turbidity 4. BOD 5. Color 6. Total solids 7. pH 8. Total phosphorous 9. Total Nitrogen The CETESB classification is shown in Table A3.2-4
Table A3.2-4 Water classification according to the ICA -CESTESB (2002) CESTESB index Water classification
79-100 Excellent quality 51-79 Good quality 36-51 Medium quality 19-36 Bad quality 0-19 Very bad quality
Source: CETESB (2002) cited by CVC, Universidad del Valle, 2004